© 2010 Nature America, Inc. All rights reserved. ARTICLES NATURE MEDICINE ADVANCE ONLINE PUBLICATION Clearance of viral infections requires potent T cell responses. However, in HIV and other chronic viral infections, viral persistence 1,2 leads to the decay of CD4 + T cells and their function. This has a negative impact on CD8 + T cell responses to viral antigens 1,2 . During HIV infection, amounts of microbial products and inflammatory cytokines are increased in the blood 3–9 , which, in addition to high viral load, is associated with systemic immune activation 3–9 and induces T cell dysfunction. During chronic viral infections, such as lymphocytic choriomenin- gitis virus (LCMV) and HIV, PD-1 is upregulated on T cells, leading to their exhaustion (dysfunction) 10–13 . Blocking the PD-1–PD-L1 inter- action restores T cell function in LCMV, simian immunodeficiency virus and HIV infections and results in clearance of LCMV 10–14 . IL-10 production by antigen-presenting cells (APCs) in persistent LCMV infection also leads to the impairment of T cell responses 15,16 . Additionally, T cell function is restored by blocking the binding of IL-10R by IL-10 and this also leads to viral clearance 15,16 . Of note, HIV-infected individuals with elevated blood concentrations of IL-10 and high IL-10 to IL-2 ratios show accelerated disease progression 17–19 . Moreover, HIV-specific CD4 + T cell activation is restored by blocking binding of IL-10-R by IL-10 (ref. 20). Although monocytes are most likely to be the major IL-10 producers during HIV infection 21,22 , the mechanisms leading to IL-10 production remain unknown. As blocking of PD-1–PD-L1 and IL-10–IL-10R interactions results in the restoration of T cell responses and viral clearance 10–16 , we tested the possibility that these events are interrelated and may synergize in mediating their immunomodulatory function. Furthermore, Toll-like receptor (TLR) ligands of microbial origin have been shown to induce PD-L1 and PD-1 upregulation 13,23,24 ; however, the impact of this upregulation on T cell function has not been defined. Here we show that the influx of microbial products and the increased amounts of inflammatory cytokines in the blood of HIV- infected individuals induce the upregulation of PD-1 on monocytes. Furthermore, the subsequent interaction of PD-1 with PD-L1 results in IL-10 production and reversible CD4 + T cell dysfunction during HIV infection. RESULTS Upregulation of PD-1 on monocytes during HIV infection Monocytes express PD-1 on their surface 25,26 and produce IL-10 during HIV infection 21,22 . Monocytes are divided into classic Programmed death-1–induced interleukin-10 production by monocytes impairs CD4 + T cell activation during HIV infection Elias A Said 1–3 , Franck P Dupuy 1–3,10 , Lydie Trautmann 1–4,10 , Yuwei Zhang 1–3 , Yu Shi 1–3 , Mohamed El-Far 1–3 , Brenna J Hill 5 , Alessandra Noto 1–3 , Petronela Ancuta 1–3 , Yoav Peretz 1–3 , Simone G Fonseca 1–3 , Julien Van Grevenynghe 1–3 , Mohamed R Boulassel 6 , Julie Bruneau 1,7 , Naglaa H Shoukry 1,8 , Jean-Pierre Routy 3,6 , Daniel C Douek 5 , Elias K Haddad 1–3,9 & Rafick-Pierre Sekaly 1–4,9 Viral replication and microbial translocation from the gut to the blood during HIV infection lead to hyperimmune activation, which contributes to the decline in CD4 + T cell numbers during HIV infection. Programmed death-1 (PD-1) and interleukin-10 (IL-10) are both upregulated during HIV infection. Blocking interactions between PD-1 and programmed death ligand-1 (PD-L1) and between IL-10 and IL-10 receptor (IL-10R) results in viral clearance and improves T cell function in animal models of chronic viral infections. Here we show that high amounts of microbial products and inflammatory cytokines in the plasma of HIV-infected subjects lead to upregulation of PD-1 expression on monocytes that correlates with high plasma concentrations of IL-10. Triggering of PD-1 expressed on monocytes by PD-L1 expressed on various cell types induced IL-10 production and led to reversible CD4 + T cell dysfunction. We describe a new function for PD-1 whereby microbial products inhibit T cell expansion and function by upregulating PD-1 levels and IL-10 production by monocytes after binding of PD-1 by PD-L1. 1 Centre de Recherche du Centre hospitalier de l’Université de Montréal (CRCHUM), Hôpital St.-Luc, Montréal, Québec, Canada. 2 Laboratoire d’Immunologie, Département de Microbiologie et d’Immunologie, Université de Montréal, Québec, Canada. 3 Institute Nationale de la Santé et de la Recherche Médicale U743, CRCHUM, Université de Montréal, Montréal, Québec, Canada. 4 Vaccine & Gene Therapy Institute Florida, Port St. Lucie, Florida, USA. 5 Human Immunology Section, Vaccine Research Center, National Institute of Allergy and Infectious Diseases, US National Institutes of Health, Bethesda, Maryland, USA. 6 Immunodeficiency Service and Division of Hematology, Royal Victoria Hospital, McGill University Health Centre, McGill University, Montréal, Québec, Canada. 7 Département de Médecine Familiale and 8 Département de Médecine, Université de Montréal, Montréal, Québec, Canada. 9 Department of Microbiology and Immunology, McGill University, Montréal, Québec, Canada. 10 These authors contributed equally to this work. Correspondence should be addressed to R.-P.S. ([email protected]). Received 7 April 2009; accepted 22 January 2010; published online 7 March 2010; doi:10.1038/nm.2106

Welcome message from author
This document is posted to help you gain knowledge. Please leave a comment to let me know what you think about it! Share it to your friends and learn new things together.
Transcript
©20
10 N
atu
re A
mer
ica,
Inc.
All
rig
hts
res
erve
d.
a r t i c l e s
nature medicine advance online publication �
Clearance of viral infections requires potent T cell responses. However, in HIV and other chronic viral infections, viral persistence1,2 leads to the decay of CD4+ T cells and their function. This has a negative impact on CD8+ T cell responses to viral antigens1,2. During HIV infection, amounts of microbial products and inflammatory cytokines are increased in the blood3–9, which, in addition to high viral load, is associated with systemic immune activation3–9 and induces T cell dysfunction.
During chronic viral infections, such as lymphocytic choriomenin-gitis virus (LCMV) and HIV, PD-1 is upregulated on T cells, leading to their exhaustion (dysfunction)10–13. Blocking the PD-1–PD-L1 inter-action restores T cell function in LCMV, simian immunodeficiency virus and HIV infections and results in clearance of LCMV10–14. IL-10 production by antigen-presenting cells (APCs) in persistent LCMV infection also leads to the impairment of T cell responses15,16. Additionally, T cell function is restored by blocking the binding of IL-10R by IL-10 and this also leads to viral clearance15,16. Of note, HIV-infected individuals with elevated blood concentrations of IL-10 and high IL-10 to IL-2 ratios show accelerated disease progression17–19. Moreover, HIV-specific CD4+ T cell activation is restored by blocking binding of IL-10-R by IL-10 (ref. 20). Although monocytes are most
likely to be the major IL-10 producers during HIV infection21,22, the mechanisms leading to IL-10 production remain unknown. As blocking of PD-1–PD-L1 and IL-10–IL-10R interactions results in the restoration of T cell responses and viral clearance10–16, we tested the possibility that these events are interrelated and may synergize in mediating their immunomodulatory function. Furthermore, Toll-like receptor (TLR) ligands of microbial origin have been shown to induce PD-L1 and PD-1 upregulation13,23,24; however, the impact of this upregulation on T cell function has not been defined.
Here we show that the influx of microbial products and the increased amounts of inflammatory cytokines in the blood of HIV-infected individuals induce the upregulation of PD-1 on monocytes. Furthermore, the subsequent interaction of PD-1 with PD-L1 results in IL-10 production and reversible CD4+ T cell dysfunction during HIV infection.
RESULTSUpregulation of PD-1 on monocytes during HIV infection Monocytes express PD-1 on their surface25,26 and produce IL-10 during HIV infection21,22. Monocytes are divided into classic
Programmed death-1–induced interleukin-10 production by monocytes impairs CD4+ T cell activation during HIV infectionElias A Said1–3, Franck P Dupuy1–3,10, Lydie Trautmann1–4,10, Yuwei Zhang1–3, Yu Shi1–3, Mohamed El-Far1–3, Brenna J Hill5, Alessandra Noto1–3, Petronela Ancuta1–3, Yoav Peretz1–3, Simone G Fonseca1–3, Julien Van Grevenynghe1–3, Mohamed R Boulassel6, Julie Bruneau1,7, Naglaa H Shoukry1,8, Jean-Pierre Routy3,6, Daniel C Douek5, Elias K Haddad1–3,9 & Rafick-Pierre Sekaly1–4,9
Viral replication and microbial translocation from the gut to the blood during HIV infection lead to hyperimmune activation, which contributes to the decline in CD4+ T cell numbers during HIV infection. Programmed death-1 (PD-1) and interleukin-10 (IL-10) are both upregulated during HIV infection. Blocking interactions between PD-1 and programmed death ligand-1 (PD-L1) and between IL-10 and IL-10 receptor (IL-10R) results in viral clearance and improves T cell function in animal models of chronic viral infections. Here we show that high amounts of microbial products and inflammatory cytokines in the plasma of HIV-infected subjects lead to upregulation of PD-1 expression on monocytes that correlates with high plasma concentrations of IL-10. Triggering of PD-1 expressed on monocytes by PD-L1 expressed on various cell types induced IL-10 production and led to reversible CD4+ T cell dysfunction. We describe a new function for PD-1 whereby microbial products inhibit T cell expansion and function by upregulating PD-1 levels and IL-10 production by monocytes after binding of PD-1 by PD-L1.
1Centre de Recherche du Centre hospitalier de l’Université de Montréal (CRCHUM), Hôpital St.-Luc, Montréal, Québec, Canada. 2Laboratoire d’Immunologie, Département de Microbiologie et d’Immunologie, Université de Montréal, Québec, Canada. 3Institute Nationale de la Santé et de la Recherche Médicale U743, CRCHUM, Université de Montréal, Montréal, Québec, Canada. 4Vaccine & Gene Therapy Institute Florida, Port St. Lucie, Florida, USA. 5Human Immunology Section, Vaccine Research Center, National Institute of Allergy and Infectious Diseases, US National Institutes of Health, Bethesda, Maryland, USA. 6Immunodeficiency Service and Division of Hematology, Royal Victoria Hospital, McGill University Health Centre, McGill University, Montréal, Québec, Canada. 7Département de Médecine Familiale and 8Département de Médecine, Université de Montréal, Montréal, Québec, Canada. 9Department of Microbiology and Immunology, McGill University, Montréal, Québec, Canada. 10These authors contributed equally to this work. Correspondence should be addressed to R.-P.S. ([email protected]).
Received 7 April 2009; accepted 22 January 2010; published online 7 March 2010; doi:10.1038/nm.2106
©20
10 N
atu
re A
mer
ica,
Inc.
All
rig
hts
res
erve
d.
a r t i c l e s
� advance online publication nature medicine
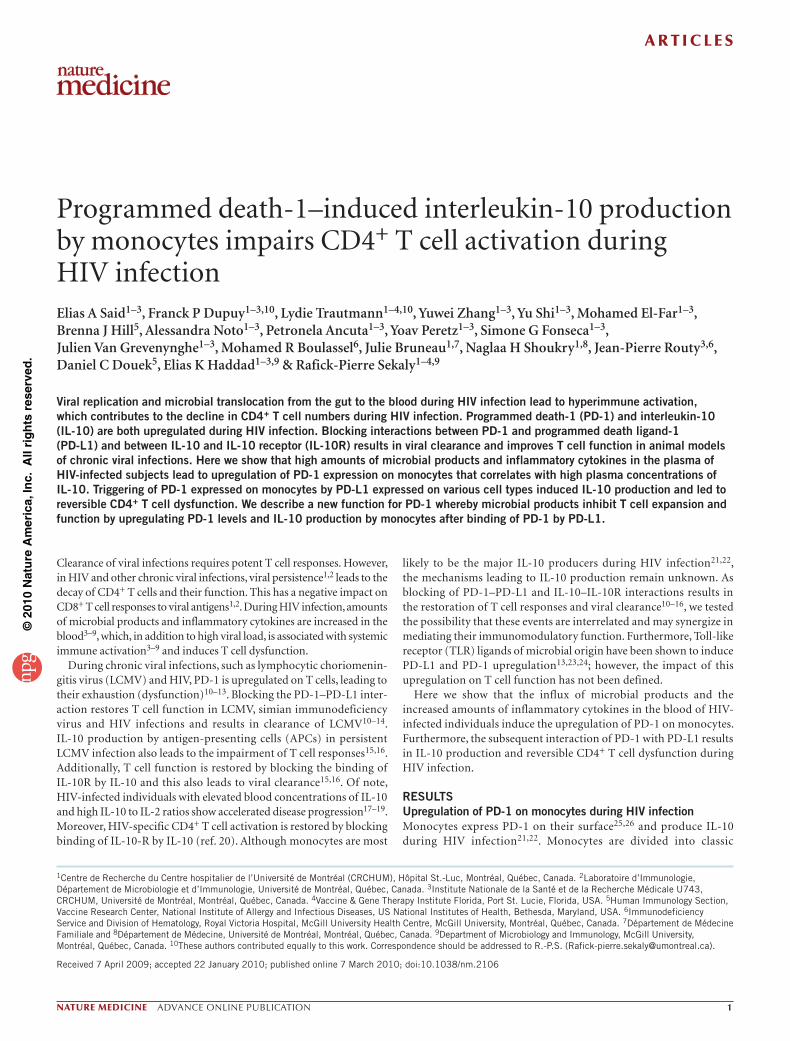
monocytes (CD14+CD16−) and activated (CD14+CD16+) monocytes27. We investi-gated PD-1 expression on monocyte sub-sets in untreated HIV-infected (viremic), highly active antiretroviral therapy (HAART)-treated HIV-infected (aviremic) (Supplementary Fig. 1a,b) and healthy subjects. PD-1 expression was higher (~1.5-fold increase) on total, CD16− and CD16+ monocytes in viremic subjects than in aviremic subjects (P = 0.0003, 0.0001 and 0.01 for each of the monocytes subsets, respectively) and healthy subjects (P = 0.00003, 0.000002 and 0.04; Fig. 1a). PD-1 expression on CD16+ monocytes were two-fold higher (P = 0.00000008, 0.0000005 and 0.0001 for viremic, aviremic and healthy subjects, respectively) than those expressed
by CD16− monocytes (Fig. 1a). Of note, we did not detect PD-1 on the surface of myeloid dendritic cells (DCs) or plasmacytoid DCs in any donor (data not shown). Moreover, PD-1 expression in all monocyte subsets did not show any correlation with viral load (Fig. 1b). These results indicate that all monocyte subsets expressed high amounts of PD-1 on their surface during HIV infection through an unknown mechanism.
a
b
2,000 ** ***
1,000
0Viremic
PD
-1 e
xpre
ssio
n on
tota
lm
onoc
ytes
(M
FI)
PD
-1 e
xpre
ssio
n on
tota
lm
onoc
ytes
(M
FI)
Aviremic
Total monocytes
PD-1 APC
Healthy
Healthy
2,000
1,500
02 3 4 5 6
Log viral load
1,000
500
PD
-1 e
xpre
ssio
n on
CD
16–
mon
ocyt
es (
MF
I)
1,500R2 = –0.02 R
2 = – 0.01
02 3 4 5 6
Log viral load
1,000
500
PD
-1 e
xpre
ssio
n on
CD
16+
mon
ocyt
es (
MF
I)
4,000 R2 = – 0.07
02 3 4 5 6
Log viral load
1,000
2,000
3,000
AviremicViremic
1,500** ***
1,000
0Viremic
PD
-1 e
xpre
ssio
n on
CD
16–
mon
ocyt
es (
MF
I)
Aviremic
CD16–
monocytes
PD-1 APC
Healthy
500
4,000 * *
1,000
0ViremicP
D-1
exp
ress
ion
on C
D16
+
mon
ocyt
es (
MF
I)
Aviremic
CD16+
monocytes
PD-1 APC
Healthy
2,000
3,000
Figure 1 PD-1 expression is upregulated in CD16− and CD16+ monocyte subsets during HIV infection. (a) MFI of PD-1 expression on total monocytes (CD14+ cells), CD14+CD16− monocytes and CD14+CD16+ monocytes in PBMCs from viremic (n = 23), aviremic (n = 13) and healthy (n = 14) subjects analyzed ex vivo by flow cytometry. Representative flow cytometry histograms of each category of donors are shown in this panel. APC, allophycocyanin. (b) PD-1 MFI (as measured in a) in relation to viral load in viremic subjects. *P < 0.05, **P < 0.001 and ***P < 0.0001.
a b c2.5
2.0
1.5
1.0
0.5
0
2.5
2.0
1.5
1.0
0.5
0
0
0 0
0
0.4
0.8
1.2
1.6
2.0
0.4
0.8
1.2
1.6
3.0
2.5
2.0
1.5
1.0
0.5
0Healthy
PD
-1 o
n C
D16
– m
onoc
ytes
(fol
d ov
er m
ediu
m tr
eate
d)
3.0
2.5
2.0
1.5
1.0
0.5
0
PD
-1 o
n C
D16
+ m
onoc
ytes
(fol
d ov
er m
ediu
m tr
eate
d)
Viremic
Healthy Viremic
0.20.40.60.81.01.21.41.6
0.51.01.52.02.53.03.5
(pg ml–1)
(µg ml–1)
(µg ml–1)
(µM)
LPS (TLR4)
LTA (TLR2)
CpG DNA (TLR9)
Fol
d ex
pres
sion
to u
nstim
ulat
ed
ssRNA (TLR7 and TLR8)
*
*
00
0.5 1 2 5 10
00 1 5
7.5 10 (ng ml–1)
(pg ml–1)
(pg ml–1)
(pg ml–1)
00 5 10 20 50 100
500
1,00
02,
000
0
00
0 500 1,000
PD-1 on total monocytes(MFI)
1,500 2,000
0 500 1,000
PD-1 on CD16– monocytes(MFI)
1,500 2,000
0 1,000 2,000
PD-1 on CD16+ monocytes(MFI)
3,000 4,000
10
20IL
-10
(pg
ml–1
) 30
40
0
10
20
IL-1
0 (p
g m
l–1) 30
40
0
10
20
IL-1
0 (p
g m
l–1) 30
40
P = 0.04ρ = 0.33
P = 0.033ρ = 0.34
P = 0.041ρ = 0.33
0.51.01.52.02.53.03.5
PD-1 on CD16– monocytes PD-1 on CD16+ monocytes
0.5
1.0
1.5
2.0
2.5
0 5 10 20 50 100
500
1,00
02,
000
0 5 10 20 50 100
500
1,00
02,
000
5 50 500
HIV
IL-6
IL-1β
TNF-α
1 5 10
50 100
200
400
800
1,50
0
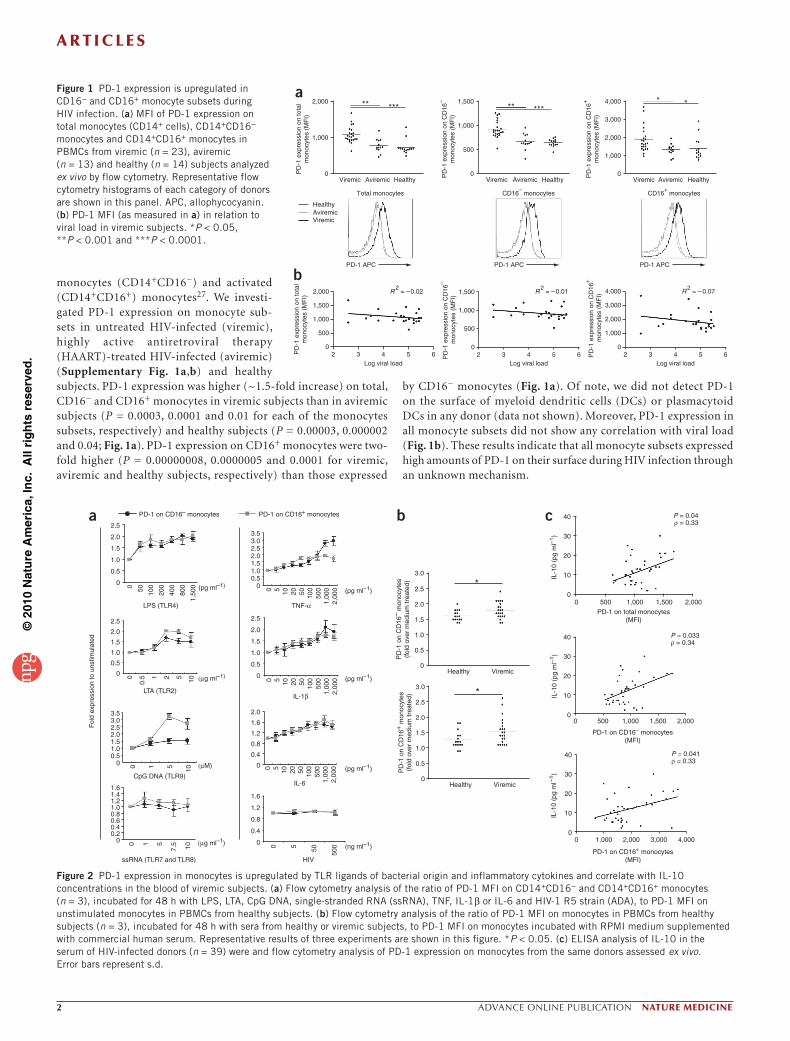
Figure 2 PD-1 expression in monocytes is upregulated by TLR ligands of bacterial origin and inflammatory cytokines and correlate with IL-10 concentrations in the blood of viremic subjects. (a) Flow cytometry analysis of the ratio of PD-1 MFI on CD14+CD16− and CD14+CD16+ monocytes (n = 3), incubated for 48 h with LPS, LTA, CpG DNA, single-stranded RNA (ssRNA), TNF, IL-1β or IL-6 and HIV-1 R5 strain (ADA), to PD-1 MFI on unstimulated monocytes in PBMCs from healthy subjects. (b) Flow cytometry analysis of the ratio of PD-1 MFI on monocytes in PBMCs from healthy subjects (n = 3), incubated for 48 h with sera from healthy or viremic subjects, to PD-1 MFI on monocytes incubated with RPMI medium supplemented with commercial human serum. Representative results of three experiments are shown in this figure. *P < 0.05. (c) ELISA analysis of IL-10 in the serum of HIV-infected donors (n = 39) were and flow cytometry analysis of PD-1 expression on monocytes from the same donors assessed ex vivo. Error bars represent s.d.
©20
10 N
atu
re A
mer
ica,
Inc.
All
rig
hts
res
erve
d.
a r t i c l e s
nature medicine advance online publication �
Factors that modulate PD-1 expression on monocytes. We investigated the impact of the bacterial TLR ligands3 (Supplementary Fig. 2 a,b) lipopolysaccharide (LPS) (a TLR4 ligand; representing Gram− bacteria), lipoteichoic acid (LTA) (a TLR2 ligand; representing Gram+ bacteria) and CpG DNA (a TLR9 ligand; representing bacterial DNA) on PD-1 expression in monocytes. These ligands induced a dose-dependent increase in PD-1 expression (Fig. 2a), whereas HIV single-stranded RNA (RNA40)28, R5 HIV (Ba-L) or X4 HIV (NL4.3) (data not
shown) failed to augment PD-1 expression on monocytes (Fig. 2a). Of note, the circulating inflammatory cytokines such as tumor necrosis factor-α (TNF-α), IL-1β and IL-6, whose expression is elevated dur-ing HIV infection4–9 (Supplementary Fig. 2c–e), also induced a dose-dependent increase in PD-1 expression on monocytes (Fig. 2a). These results prompted the notion that elevated levels of microbial products and inflammatory cytokines in the blood of HIV-infected subjects could be responsible for the upregulation of PD-1 on monocytes.
i
a10,000
1,000
IL-1
0 (p
g m
l–1)
100
10
1No
antibodyAnti–PD-1 Total
goat lgG
Anti–PD-1(0.5 µg ml–1)
LPSAnti–PD-1
b 900
800
IL-1
0 (p
g m
l–1)
500
200
0NS Anti–PD-1
(10 µg ml–1)Anti–HLA-DR(10 µg ml–1)
Anti–HLA-I(10 µg ml–1)
100
700
600
300
400
NS LPS75 pg ml–1
e 450
IL-1
0 (p
g m
l–1)
300
150
00 h 3 h 6 h 24 h 48 h
10050
400350
200250
* *450
IL-1
0 (p
g m
l–1)
300
150
0
10050
400350
200
250
c800
IL-1
0 (p
g m
l–1)
500
200
0NS 1 10 100
No polymyxin BPolymyxin B (5 µg ml–1)Polymyxin B (10 µg ml–1)
10
Anti–PD-1(µg ml–1)
LPS (pg ml–1)
100
700
600
300
400
0.8%
0.2%
IL-10-PE
24-h
stim
ulat
ion
CD
14-P
B
6-h
stim
ulat
ion
4.4%
2.9% 2.4%
d
No antibody Anti–PD-1 LPS
0.4% 0.4% 8%
0.2% 0.3% 5%
IL-10-PE
CD
14-P
BC
D16
-Ale
xa70
0
Anti–PD-1Total goat lgGg
NS
0.7% 3.2% 1.1% 1%
IL-10-PE
CD
14-P
B
h
Cos-Mock Cos–PD-L1 Cos–PD-L1+ anti–PD-L1
Cos–PD-L2
f
(µg ml–1)
1,000
IL-1
0 (p
g m
l–1)
1
0.10 0.10.01 10.5 105 15
100
10
Cos-Mock Cos–PD-L1
Cos–PD-L1+ anti–PD-L1
Cos–PD-L2
* *3.5
Fol
d in
crea
se o
ver
Cos
-Moc
k
2.0
0.5
0
3.0
2.5
1.0
1.5
900
800
IL-1
0 (p
g m
l–1)
500
200
0NS IgG
CD16– CD16+α-PD-1 NS IgG α-PD-1
100
700
600
300
400
*
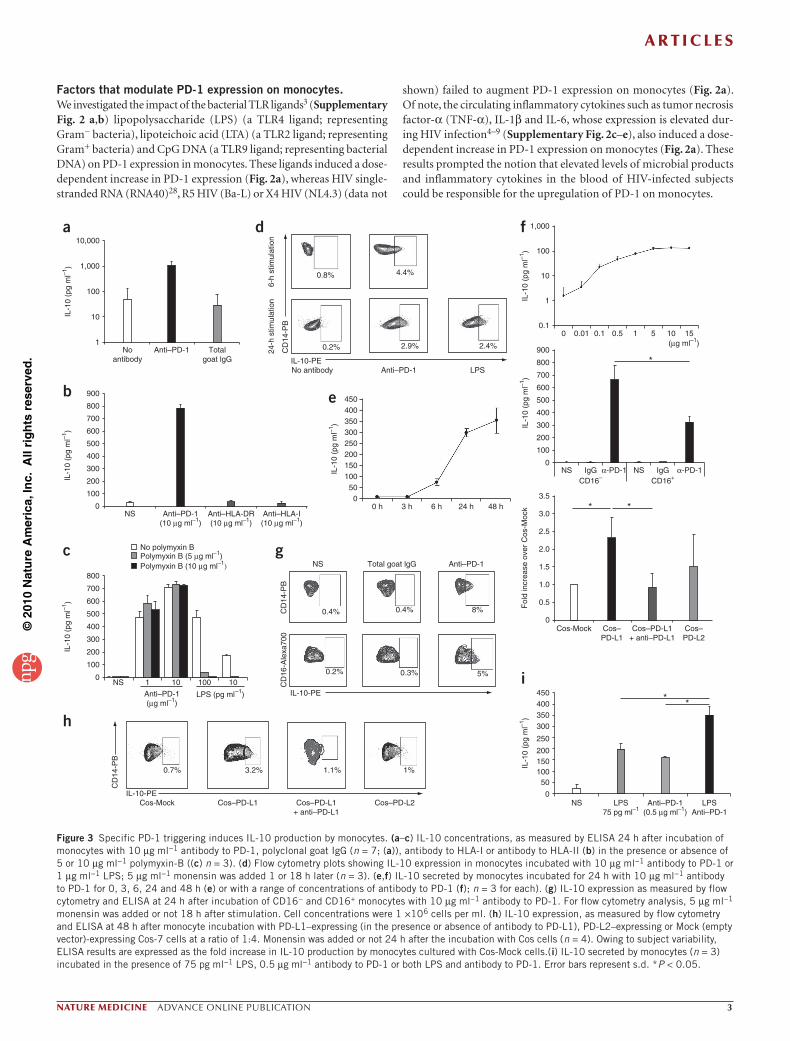
Figure 3 Specific PD-1 triggering induces IL-10 production by monocytes. (a–c) IL-10 concentrations, as measured by ELISA 24 h after incubation of monocytes with 10 µg ml−1 antibody to PD-1, polyclonal goat IgG (n = 7; (a)), antibody to HLA-I or antibody to HLA-II (b) in the presence or absence of 5 or 10 µg ml−1 polymyxin-B ((c) n = 3). (d) Flow cytometry plots showing IL-10 expression in monocytes incubated with 10 µg ml−1 antibody to PD-1 or 1 µg ml−1 LPS; 5 µg ml−1 monensin was added 1 or 18 h later (n = 3). (e,f) IL-10 secreted by monocytes incubated for 24 h with 10 µg ml−1 antibody to PD-1 for 0, 3, 6, 24 and 48 h (e) or with a range of concentrations of antibody to PD-1 (f); n = 3 for each). (g) IL-10 expression as measured by flow cytometry and ELISA at 24 h after incubation of CD16− and CD16+ monocytes with 10 µg ml−1 antibody to PD-1. For flow cytometry analysis, 5 µg ml−1 monensin was added or not 18 h after stimulation. Cell concentrations were 1 ×10⁶ cells per ml. (h) IL-10 expression, as measured by flow cytometry and ELISA at 48 h after monocyte incubation with PD-L1–expressing (in the presence or absence of antibody to PD-L1), PD-L2–expressing or Mock (empty vector)-expressing Cos-7 cells at a ratio of 1:4. Monensin was added or not 24 h after the incubation with Cos cells (n = 4). Owing to subject variability, ELISA results are expressed as the fold increase in IL-10 production by monocytes cultured with Cos-Mock cells.(i) IL-10 secreted by monocytes (n = 3) incubated in the presence of 75 pg ml−1 LPS, 0.5 µg ml−1 antibody to PD-1 or both LPS and antibody to PD-1. Error bars represent s.d. *P < 0.05.
©20
10 N
atu
re A
mer
ica,
Inc.
All
rig
hts
res
erve
d.
a r t i c l e s
� advance online publication nature medicine
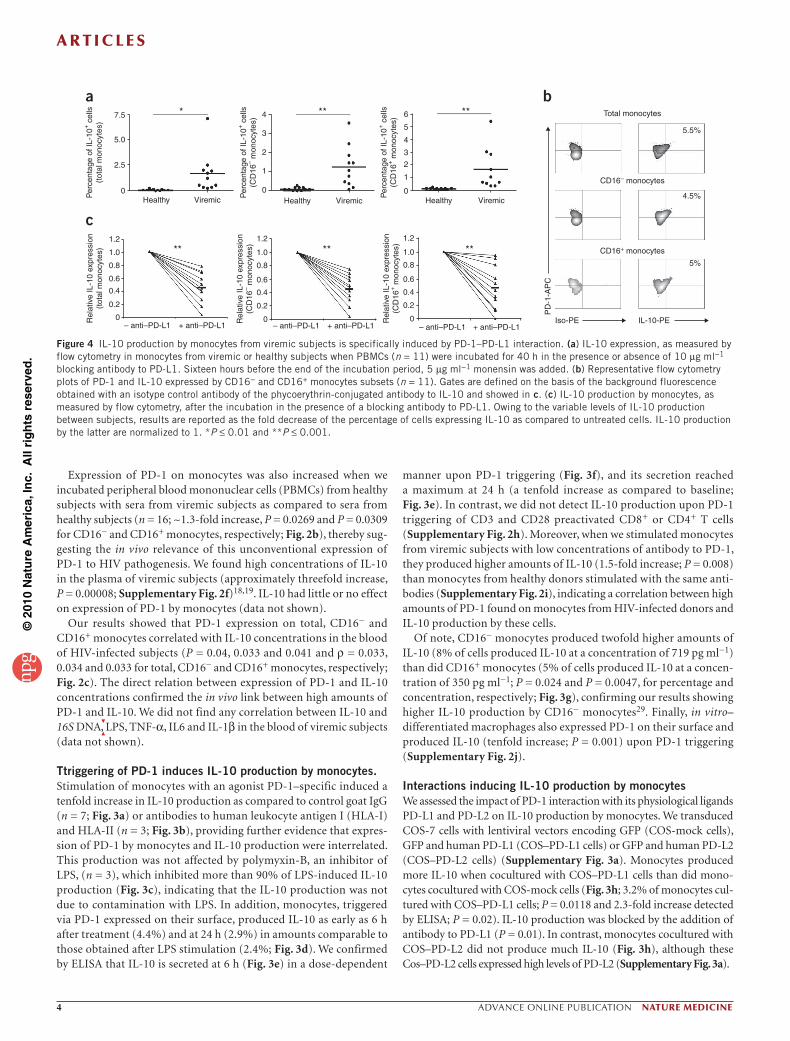
Expression of PD-1 on monocytes was also increased when we incubated peripheral blood mononuclear cells (PBMCs) from healthy subjects with sera from viremic subjects as compared to sera from healthy subjects (n = 16; ~1.3-fold increase, P = 0.0269 and P = 0.0309 for CD16− and CD16+ monocytes, respectively; Fig. 2b), thereby sug-gesting the in vivo relevance of this unconventional expression of PD-1 to HIV pathogenesis. We found high concentrations of IL-10 in the plasma of viremic subjects (approximately threefold increase, P = 0.00008; Supplementary Fig. 2f)18,19. IL-10 had little or no effect on expression of PD-1 by monocytes (data not shown).
Our results showed that PD-1 expression on total, CD16− and CD16+ monocytes correlated with IL-10 concentrations in the blood of HIV-infected subjects (P = 0.04, 0.033 and 0.041 and ρ = 0.033, 0.034 and 0.033 for total, CD16− and CD16+ monocytes, respectively; Fig. 2c). The direct relation between expression of PD-1 and IL-10 concentrations confirmed the in vivo link between high amounts of PD-1 and IL-10. We did not find any correlation between IL-10 and 16S DNA
, LPS, TNF-α, IL6 and IL-1β in the blood of viremic subjects
(data not shown).
Ttriggering of PD-1 induces IL-10 production by monocytes.Stimulation of monocytes with an agonist PD-1–specific induced a tenfold increase in IL-10 production as compared to control goat IgG (n = 7; Fig. 3a) or antibodies to human leukocyte antigen I (HLA-I) and HLA-II (n = 3; Fig. 3b), providing further evidence that expres-sion of PD-1 by monocytes and IL-10 production were interrelated. This production was not affected by polymyxin-B, an inhibitor of LPS, (n = 3), which inhibited more than 90% of LPS-induced IL-10 production (Fig. 3c), indicating that the IL-10 production was not due to contamination with LPS. In addition, monocytes, triggered via PD-1 expressed on their surface, produced IL-10 as early as 6 h after treatment (4.4%) and at 24 h (2.9%) in amounts comparable to those obtained after LPS stimulation (2.4%; Fig. 3d). We confirmed by ELISA that IL-10 is secreted at 6 h (Fig. 3e) in a dose-dependent
manner upon PD-1 triggering (Fig. 3f), and its secretion reached a maximum at 24 h (a tenfold increase as compared to baseline; Fig. 3e). In contrast, we did not detect IL-10 production upon PD-1 triggering of CD3 and CD28 preactivated CD8+ or CD4+ T cells (Supplementary Fig. 2h). Moreover, when we stimulated monocytes from viremic subjects with low concentrations of antibody to PD-1, they produced higher amounts of IL-10 (1.5-fold increase; P = 0.008) than monocytes from healthy donors stimulated with the same anti-bodies (Supplementary Fig. 2i), indicating a correlation between high amounts of PD-1 found on monocytes from HIV-infected donors and IL-10 production by these cells.
Of note, CD16− monocytes produced twofold higher amounts of IL-10 (8% of cells produced IL-10 at a concentration of 719 pg ml−1) than did CD16+ monocytes (5% of cells produced IL-10 at a concen-tration of 350 pg ml−1; P = 0.024 and P = 0.0047, for percentage and concentration, respectively; Fig. 3g), confirming our results showing higher IL-10 production by CD16− monocytes29. Finally, in vitro– differentiated macrophages also expressed PD-1 on their surface and produced IL-10 (tenfold increase; P = 0.001) upon PD-1 triggering (Supplementary Fig. 2j).
Interactions inducing IL-10 production by monocytesWe assessed the impact of PD-1 interaction with its physiological ligands PD-L1 and PD-L2 on IL-10 production by monocytes. We transduced COS-7 cells with lentiviral vectors encoding GFP (COS-mock cells), GFP and human PD-L1 (COS–PD-L1 cells) or GFP and human PD-L2 (COS–PD-L2 cells) (Supplementary Fig. 3a). Monocytes produced more IL-10 when cocultured with COS–PD-L1 cells than did mono-cytes cocultured with COS-mock cells (Fig. 3h; 3.2% of monocytes cul-tured with COS–PD-L1 cells; P = 0.0118 and 2.3-fold increase detected by ELISA; P = 0.02). IL-10 production was blocked by the addition of antibody to PD-L1 (P = 0.01). In contrast, monocytes cocultured with COS–PD-L2 did not produce much IL-10 (Fig. 3h), although these Cos–PD-L2 cells expressed high levels of PD-L2 (Supplementary Fig. 3a).
7.5
a
c
b* **
** ** **
**
1.2
0.8
0.6
0.4
0.2
0
1.0
1.2
0.8
0.6
0.4
0.2
1.2
0.8
PD
-1-A
PC0.6
0.4
0.2
0 0
1.0 1.0
4 6 Total monocytes
CD16– monocytes
5.5%
4.5%
5%
CD16+ monocytes
Iso-PE IL-10-PE
5
4
3
2
1
0
3
2
1
0
5.0
Per
cent
age
of IL
-10+
cel
ls(t
otal
mon
ocyt
es)
Rel
ativ
e IL
-10
expr
essi
on(t
otal
mon
ocyt
es)
Per
cent
age
of IL
-10+
cel
ls(C
D16
– mon
ocyt
es)
Rel
ativ
e IL
-10
expr
essi
on(C
D16
– mon
ocyt
es)
Rel
ativ
e IL
-10
expr
essi
on(C
D16
+ m
onoc
ytes
)
Per
cent
age
of IL
-10+
cel
ls(C
D16
+ m
onoc
ytes
)
2.5
Healthy
– anti–PD-L1 + anti–PD-L1 – anti–PD-L1 + anti–PD-L1 – anti–PD-L1 + anti–PD-L1
Viremic Healthy Viremic Healthy Viremic0
Figure 4 IL-10 production by monocytes from viremic subjects is specifically induced by PD-1–PD-L1 interaction. (a) IL-10 expression, as measured by flow cytometry in monocytes from viremic or healthy subjects when PBMCs (n = 11) were incubated for 40 h in the presence or absence of 10 µg ml−1 blocking antibody to PD-L1. Sixteen hours before the end of the incubation period, 5 µg ml−1 monensin was added. (b) Representative flow cytometry plots of PD-1 and IL-10 expressed by CD16− and CD16+ monocytes subsets (n = 11). Gates are defined on the basis of the background fluorescence obtained with an isotype control antibody of the phycoerythrin-conjugated antibody to IL-10 and showed in c. (c) IL-10 production by monocytes, as measured by flow cytometry, after the incubation in the presence of a blocking antibody to PD-L1. Owing to the variable levels of IL-10 production between subjects, results are reported as the fold decrease of the percentage of cells expressing IL-10 as compared to untreated cells. IL-10 production by the latter are normalized to 1. *P ≤ 0.01 and **P ≤ 0.001.
©20
10 N
atu
re A
mer
ica,
Inc.
All
rig
hts
res
erve
d.
a r t i c l e s
nature medicine advance online publication �
LPS, a molecule known to trigger IL-10 production29, and PD-1 (at suboptimal levels) acted synergistically to induce twofold increased production of IL-10 by monocytes (Fig. 3i) as compared to the stimu-lation of monocytes with LPS or antibody to PD-1 alone (P = 0.02 and P = 0.01, respectively). Altogether, these results confirm the role of the PD-1–PD-L1 interaction in inducing IL-10 production.
Monocytes produce IL-10 upon PD-1–PD-L1 interactionWe next investigated the role of the PD-1–PD-L1 interaction in IL-10 production by monocytes during HIV infection. CD16− and CD16+ monocytes from viremic subjects spontaneously produced IL-10, in contrast to monocytes from healthy subjects22 (1.5- to twofold increase, P = 0.001 and P = 0.006, respectively; Fig. 4a). In viremic subjects, IL-10 production was restricted to PD-1hi monocytes (Fig. 4b) and was inhibited (an average decrease to 45% of the original production; P = 0.00001, P = 0.000008 and P = 0.0002 for total, CD16− and CD16+ monocytes, respectively) by the addition of antibody to PD-L1 (Fig. 4c), as also shown by ELISA (Supplementary Fig. 3b). IL-10 production by monocytes was dependent on PD-L1 on cells interacting
with PD-1+ monocytes, as both ELISA (Supplementary Fig. 3c) and flow cytometry (data not shown) showed a dose-dependent inhibition of IL-10 production by antibody to PD-L1. These results confirmed the key role of the PD-1 –PDL-1 interaction in the induction of IL-10 production by monocytes in HIV -1 disease pathogenesis.
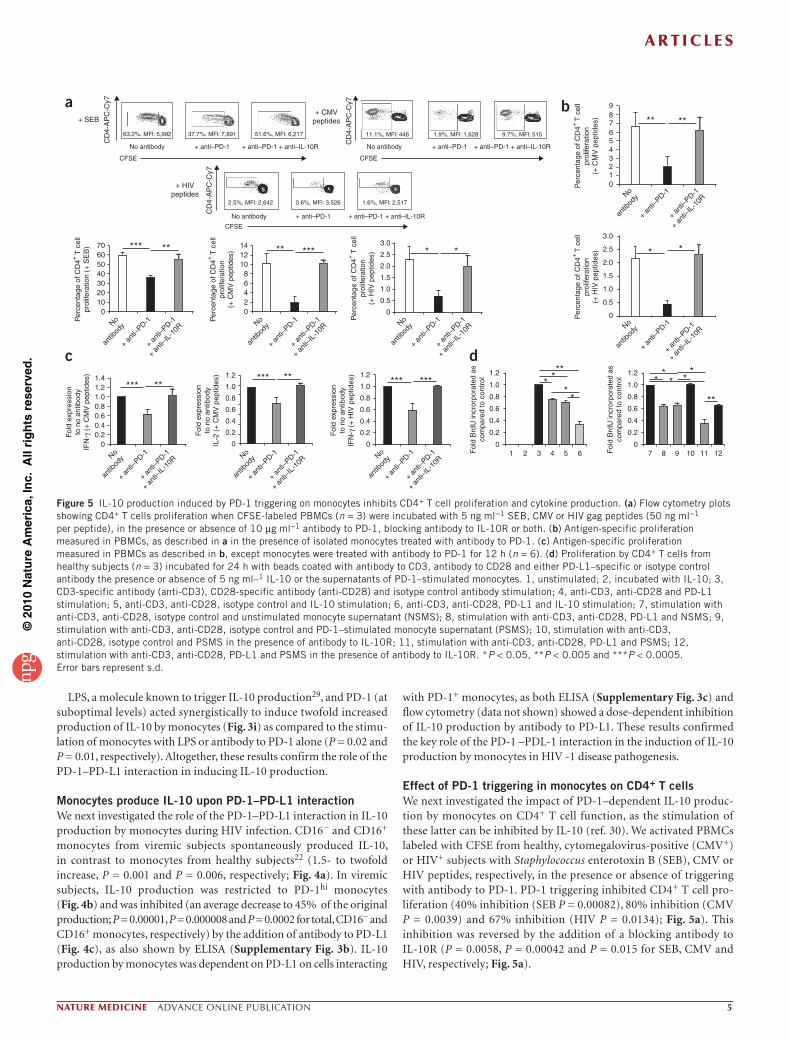
Effect of PD-1 triggering in monocytes on CD4+ T cellsWe next investigated the impact of PD-1–dependent IL-10 produc-tion by monocytes on CD4+ T cell function, as the stimulation of these latter can be inhibited by IL-10 (ref. 30). We activated PBMCs labeled with CFSE from healthy, cytomegalovirus-positive (CMV+) or HIV+ subjects with Staphylococcus enterotoxin B (SEB), CMV or HIV peptides, respectively, in the presence or absence of triggering with antibody to PD-1. PD-1 triggering inhibited CD4+ T cell pro-liferation (40% inhibition (SEB P = 0.00082), 80% inhibition (CMV P = 0.0039) and 67% inhibition (HIV P = 0.0134); Fig. 5a). This inhibition was reversed by the addition of a blocking antibody to IL-10R (P = 0.0058, P = 0.00042 and P = 0.015 for SEB, CMV and HIV, respectively; Fig. 5a).
+ SEB
70 14 3.0
2.5
2.0
1.5
1.0
0.5
0
121086420
*** *** * ***
**
*******
** ** * *
*
**
**
**
*** ******
**
* ***60
Per
cent
age
of C
D4+
T c
ell
prol
ifera
tion
(+ S
EB
)
Per
cent
age
of C
D4+
T c
ell
prol
ifera
tion
(+ C
MV
pep
tides
)
Per
cent
age
of C
D4+
T c
ell
prol
ifera
tion
(+ C
MV
pep
tides
)
Fol
d ex
pres
sion
to n
o an
tibod
yIF
N-γ
(+
CM
V p
eptid
es)
Fol
d ex
pres
sion
to n
o an
tibod
yIL
-2 (
+ C
MV
pep
tides
)
Fol
d ex
pres
sion
to n
o an
tibod
yIF
N-γ
(+ H
IV p
eptid
es)
Fol
d B
rdU
incr
orpo
rate
d as
com
pare
d to
con
trol
Fol
d B
rdU
incr
orpo
rate
d as
com
pare
d to
con
trol
Per
cent
age
of C
D4+
T c
ell
prol
ifera
tion
(+ H
IV p
eptid
es)
Per
cent
age
of C
D4+
T c
ell
prol
ifera
tion
(+ H
IV p
eptid
es)
5040
No
antib
ody
No
antib
ody
No
antib
ody No
antib
ody No
antib
ody
No
antib
ody No
antib
ody No
antib
ody
3020
9876543210
1.41.2
1.2
1.0
0.8
0.6
0.4
0.2
0
1.2
1.0
0.8
0.6
0.4
0.2
0
1.00.80.60.40.2
0
100
+ CMVpeptides
+ HIVpeptides
63.2%, MFl: 5,992 37.7%, MFl: 7,891 11.1%, MFl: 446 1.9%, MFl: 1,628 9.7%, MFl: 515
No antibody
CFSE
51.6%, MFl: 6,217
2.5%, MFl: 2,642 0.6%, MFl: 3,526 1.6%, MFl: 2,517
No antibody
No antibody
+ anti–PD-1
+ anti–PD-1
+ an
ti–PD-1
+ an
ti–PD-1
+ an
ti–PD-1
+ an
ti–PD-1
+ an
ti–PD-1
+ an
ti–PD-1
+ an
ti–PD-1
+ an
ti–PD-1
+ anti–PD-1 + anti–IL-10R
+ anti–PD-1 + anti–IL-10R
+ an
ti–PD-1
+ an
ti–IL
-10R
+ an
ti–PD-1
+ an
ti–IL
-10R
+ an
ti–PD-1
+ an
ti–IL
-10R
+ an
ti–PD-1
+ an
ti–IL
-10R
+ an
ti–PD-1
+ an
ti–IL
-10R
+ an
ti–PD-1
+ an
ti–IL
-10R
+ an
ti–PD-1
+ an
ti–IL
-10R
+ an
ti–PD-1
+ an
ti–IL
-10R
+ anti–PD-1 + anti–PD-1 + anti–IL-10R
CFSE
CFSE
CD
4-A
PC
-Cy7
CD
4-A
PC
-Cy7
CD
4-A
PC
-Cy7
3.0
2.5
2.0
1.5
1.0
0.5
0
1.2
1.0
0.8
0.6
0.4
0.2
0
1.2
1.0
0.8
0.6
0.4
0.2
07 8 9 10 11 12
a b
c d
1 2 3 4 5 6
Figure 5 IL-10 production induced by PD-1 triggering on monocytes inhibits CD4+ T cell proliferation and cytokine production. (a) Flow cytometry plots showing CD4+ T cells proliferation when CFSE-labeled PBMCs (n = 3) were incubated with 5 ng ml−1 SEB, CMV or HIV gag peptides (50 ng ml−1 per peptide), in the presence or absence of 10 µg ml−1 antibody to PD-1, blocking antibody to IL-10R or both. (b) Antigen-specific proliferation measured in PBMCs, as described in a in the presence of isolated monocytes treated with antibody to PD-1. (c) Antigen-specific proliferation measured in PBMCs as described in b, except monocytes were treated with antibody to PD-1 for 12 h (n = 6). (d) Proliferation by CD4+ T cells from healthy subjects (n = 3) incubated for 24 h with beads coated with antibody to CD3, antibody to CD28 and either PD-L1–specific or isotype control antibody the presence or absence of 5 ng ml–1 IL-10 or the supernatants of PD-1–stimulated monocytes. 1, unstimulated; 2, incubated with IL-10; 3, CD3-specific antibody (anti-CD3), CD28-specific antibody (anti-CD28) and isotype control antibody stimulation; 4, anti-CD3, anti-CD28 and PD-L1 stimulation; 5, anti-CD3, anti-CD28, isotype control and IL-10 stimulation; 6, anti-CD3, anti-CD28, PD-L1 and IL-10 stimulation; 7, stimulation with anti-CD3, anti-CD28, isotype control and unstimulated monocyte supernatant (NSMS); 8, stimulation with anti-CD3, anti-CD28, PD-L1 and NSMS; 9, stimulation with anti-CD3, anti-CD28, isotype control and PD-1–stimulated monocyte supernatant (PSMS); 10, stimulation with anti-CD3, anti-CD28, isotype control and PSMS in the presence of antibody to IL-10R; 11, stimulation with anti-CD3, anti-CD28, PD-L1 and PSMS; 12, stimulation with anti-CD3, anti-CD28, PD-L1 and PSMS in the presence of antibody to IL-10R. *P < 0.05, **P < 0.005 and ***P < 0.0005. Error bars represent s.d.
©20
10 N
atu
re A
mer
ica,
Inc.
All
rig
hts
res
erve
d.
a r t i c l e s
� advance online publication nature medicine
To confirm that this inhibition was caused by monocyte-produced IL-10, we pretreated monocytes from CMV+ or HIV+ subjects with antibody specific for PD-1 and then added them to CFSE-labeled PBMCs (depleted of monocytes by positive selection) pulsed with CMV peptides (for CMV+ subjects) or HIV peptides (for HIV+ subjects; Supplementary Fig. 4a). PD-1 triggering on monocytes inhibited CD4+ T cell proliferation (an average of a 70% and a 82% decrease in proliferating cells; P = 0.0032 and P = 0.016 for CMV+ and HIV+ subjects, respectively). Treatment with IL-10R–specific antibody rescued CMV-specific (P = 0.0052) and HIV-specific (P = 0.014) CD4+ T cell proliferation, showing the role of IL-10 in this inhibition (Fig. 5b). Of note, the magnitude of inhibition of CD4+ T cell proliferation correlated with increased production of IL-10 by monocytes (Supplementary Fig. 4b). Indeed, CD16− monocytes, which produce higher amounts of IL-10, showed a 1.6- to 1.8-fold higher inhibition of T cell responses to CMV and HIV peptides when compared to CD16+ monocytes (P = 0.002 and P = 0.035, respectively; Supplementary Fig. 4b). Antigen-induced CD4+ T cell division was also decreased after monocyte stimulation with antibody to PD-1, as indicated by the higher mean fluorescence intensity (MFI) of CFSE in CFSElo cells (Fig. 5a; 40% to 80% inhibition, P = 0.01, P = 0.005 and P = 0.01 for SEB, CMV and HIV, respectively).
IL-10 production by monocytes on which PD-1 had been triggered also inhibited interferon-γ (IFN-γ) and IL-2 production by CD4+ T cells (Fig. 5c). Although the frequency of CD4+ T cells secreting IFN-γ (0.9–1.5% and 0.4–1% for cells stimulated with CMV peptides and HIV peptides, respectively) did not change upon addition of mono-cytes treated with PD-1–specific antibody to peptide-stimulated T cell cultures, the magnitude of IFN-γ expression (MFI) was lower when compared to T cells cocultured with untreated monocytes (average of 40% inhibition; P = 0.0002 and P = 0.0001 for CMV and HIV peptides, respectively). IFN-γ expression was rescued by treatment with IL-10R–specific antibody (P = 0.002 and P = 0.0003 for CMV and HIV for IL-2 production by CMV-specific CD4+ T cells (0.3–0.6%). Indeed, the MFI of IL-2 was lower when we incubated CMV-activated CD4+ T cells
with PD-1–triggered monocytes as compared to untreated monocytes (average of 40% inhibition; P = 0.008). IL-2 expression was restored by treatment with IL-10R–specific antibody (P = 0.0001; Fig. 5c and Supplementary Fig. 4c). We could not detect IL-2 production31 in HIV-specific CD4+ T cells from viremic subjects.
PD-1 and IL-10 also acted together to inhibit CD4+ T cell prolifera-tion and cytokine production in vitro. Indeed, addition of IL-10 to T cells triggered with PD-1–specific antibodies increased the inhibi-tory effect of both molecules (70% inhibition of these functions; Fig. 5d and Supplementary Fig. 5a–c; versus 35% inhibition in the presence of either IL-10 or PD-L1). We observed similar results when we added supernatants from PD-1–triggered monocytes to cell cul-tures (Fig. 5d and Supplementary Fig. 5a–c). Moreover, CD4+ T cell functions were restored by treatment with IL-10R–specific antibody (Fig. 5d and Supplementary Fig. 5a–c). Overall, these results showed that PD-1 triggering on monocytes inhibited CD4+ T cell responses by a mechanism that involves IL-10 production and that acts synergisti-cally with the direct effect of PD-1 expressed on T cells.
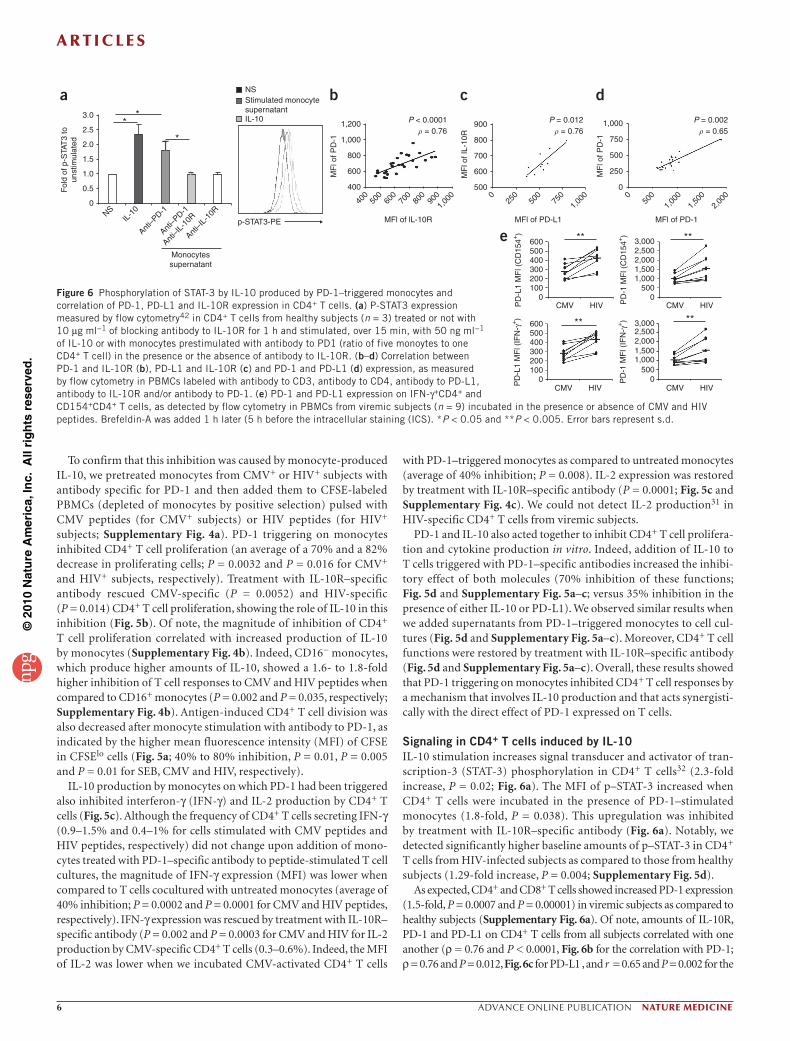
Signaling in CD4+ T cells induced by IL-10 IL-10 stimulation increases signal transducer and activator of tran-scription-3 (STAT-3) phosphorylation in CD4+ T cells32 (2.3-fold increase, P = 0.02; Fig. 6a). The MFI of p–STAT-3 increased when CD4+ T cells were incubated in the presence of PD-1–stimulated monocytes (1.8-fold, P = 0.038). This upregulation was inhibited by treatment with IL-10R–specific antibody (Fig. 6a). Notably, we detected significantly higher baseline amounts of p–STAT-3 in CD4+ T cells from HIV-infected subjects as compared to those from healthy subjects (1.29-fold increase, P = 0.004; Supplementary Fig. 5d).
As expected, CD4+ and CD8+ T cells showed increased PD-1 expression (1.5-fold, P = 0.0007 and P = 0.00001) in viremic subjects as compared to healthy subjects (Supplementary Fig. 6a). Of note, amounts of IL-10R, PD-1 and PD-L1 on CD4+ T cells from all subjects correlated with one another (ρ = 0.76 and P < 0.0001, Fig. 6b for the correlation with PD-1; ρ = 0.76 and P = 0.012, Fig. 6c for PD-L1 , and r = 0.65 and P = 0.002 for the
3.0
NSStimulated monocytesupernatantIL-10
1,200 P < 0.0001� = 0.76
P = 0.012 P = 0.002� = 0.65� = 0.76
1,000
800
900 1,000
750
500
250
600 3,0002,5002,0001,5001,000
5000
3,0002,5002,0001,5001,000
5000
500400300200100
CMV
**
** **
**HIV CMV HIV
CMV HIV CMV HIV
0
600500400300200100
0
0
800
700
600
500
600
400
400
500
600
700
800
9001,
000 0 0
250
500
500
750
1,00
01,
000
1,50
02,
000
p-STAT3-PE
MF
l of P
D-1
MF
l of I
L-10
R
PD
-L1
MF
l (C
D15
4+)
PD
-L1
MF
l (IF
N-γ
+)
PD
-1 M
Fl (
IFN
-γ+)
PD
-1 M
Fl (
CD
154+
)
MF
l of P
D-1
MFl of PD-L1MFl of lL-10R MFl of PD-1NS
IL-1
0
Anti–P
D-1
Anti–P
D-1
Anti–I
L-10
R
Anti–I
L-10
R
2.5
2.0
1.5
1.0
Monocytessupernatant
0.5
0
Fol
d of
p-S
TAT
3 to
unst
imul
ated
**
*
a b c
e
d
Figure 6 Phosphorylation of STAT-3 by IL-10 produced by PD-1–triggered monocytes and correlation of PD-1, PD-L1 and IL-10R expression in CD4+ T cells. (a) P-STAT3 expression measured by flow cytometry42 in CD4+ T cells from healthy subjects (n = 3) treated or not with 10 µg ml−1 of blocking antibody to IL-10R for 1 h and stimulated, over 15 min, with 50 ng ml−1 of IL-10 or with monocytes prestimulated with antibody to PD1 (ratio of five monoytes to one CD4+ T cell) in the presence or the absence of antibody to IL-10R. (b–d) Correlation between PD-1 and IL-10R (b), PD-L1 and IL-10R (c) and PD-1 and PD-L1 (d) expression, as measured by flow cytometry in PBMCs labeled with antibody to CD3, antibody to CD4, antibody to PD-L1, antibody to IL-10R and/or antibody to PD-1. (e) PD-1 and PD-L1 expression on IFN-γ+CD4+ and CD154+CD4+ T cells, as detected by flow cytometry in PBMCs from viremic subjects (n = 9) incubated in the presence or absence of CMV and HIV peptides. Brefeldin-A was added 1 h later (5 h before the intracellular staining (ICS). *P < 0.05 and **P < 0.005. Error bars represent s.d.

©20
10 N
atu
re A
mer
ica,
Inc.
All
rig
hts
res
erve
d.
a r t i c l e s
nature medicine advance online publication �
correlation between PD-1 and PD-L1, Fig. 6d). HIV-specific CD4+ T cells expressed higher PD-L1 and PD-1 amounts as compared to CMV-specific CD4+ T cells (Fig. 6e and Supplementary Fig. 6b; 1.5-fold higher, P = 0.001 and P = 0.004 for PD-L1 and PD-1 expression on CD154+ CD4+ T cells, respectively; P = 0.002 and P = 0.005 for PD-L1 and PD-1 expression on IFN-γ+CD4+ T cells, respectively). As activated CD4+ T cells expressed high amounts of PD-L1 (Fig. 6d), this might result in a more efficient interac-tion of these cells with PD-1+ monocytes that would produce increased concentrations of IL-10, leading to the inhibition of T cell functions.
To explore this possibility, we cultured monocytes from HIV-infected subjects with autologous T cells or B cells expressing high amounts of PD-L1 (ref. 33) (Supplementary Fig. 6c–e). Monocytes produced IL-10 (average of 2% of monocytes produced IL-10; P = 0.0001), and this was inhibited by treatment with PD-L1–specific antibody (P = 0.00008 and P = 0.00005 for T cells and B cells, respec-tively; Supplementary Fig. 7a,b). Furthermore, the incubation of CD4+ T cells from viremic donors stimulated for 12 h with CD3– specific and CD28–specific antibodies (to induce the upregulation of PDL-1 (Supplementary Fig. 8a)) with autologous monocytes trig-gered higher expression of IL-10 by monocytes when compared to incubation with nonactivated CD4+ T cells from the same subjects (1.8-fold, P = 0.02; Supplementary Fig. 8b). This was inhibited in a dose-dependent manner by treatment with PD-L1–specific antibody (Supplementary Fig. 8c). These results show that HIV-specific CD4+ T cells express elevated amounts of PD-L1 and thus are more prone to trigger IL-10 production in PD-1+ monocytes.
DISCUSSIONHere we have shown a direct link between the induction of PD-1 expression by products of microbial translocation or inflammatory cytokines and enhanced production of IL-10 that leads to CD4+ T cell dysfunction in HIV infection. Several results support our conclusions: PD-1 expression is increased on monocytes during HIV infection; PD-1 expression on monocytes is induced by microbial products and inflammatory cytokines present in the blood of viremic subjects; trig-gering of monocytes by PD-L1 induces IL-10 production and inhibits CD4+ T cell function; this inhibition was blocked by IL-10R-specific antibody; and PD-1 expression on monocytes correlated with the con-centration of IL-10 in the blood during HIV infection, whereas IL-10 production by monocytes from HIV-infected subjects was inhibited by blocking the PD-1–PD-L1 interaction.
Binding of PD-1 by PD-L1 triggers IL-10 production during HIV infection. The increased expression of the two components of the PD-1–PD-L1 axis on T cells, B cells and monocytes during HIV infec-tion33 allows for a better likelihood for the engagement of this pathway, that is, that PD-1hi monocytes encounter PD-L1hi cells such as CD4+ T cells. The ensuing production of IL-10 would control T cell activa-tion and avoid hyperimmune activation. However, the prolonged and chronic exposure of immune cells to regulatory factors such as IL-10 and PD-1 during HIV infection results in T cell dysfunction17–19.
PD-1 expression on HIV-specific T cells and its binding by PD-L1 on APCs is a major mechanism that leads to T cell exhaustion during HIV infection10–13. Our results provide a new mechanism by which PD-1–PD-L1 interaction induces immune dysfunction during HIV infection. These two mechanisms could synergize as shown in our in vitro experiments.
Phosphorylated STAT-3 amounts are higher in CD4+ T cells from HIV-infected subjects. This could be due to exposure to elevated IL-10 concentrations, although we cannot exclude the role of other cytokines known to induce STAT-3 phosphorylation, such as IL-6,
IL-12 or IL-21 (refs. 34–36). Of note, IL-10–dependent STAT-3 phosphorylation is responsible for the induction of macrophage tol-erance32. Thus, high amounts of p–STAT-3 in CD4+ T cells from HIV-infected subjects could be responsible for their dysfunction37–39.
Notably, Epstein-Barr virus, human papilloma virus, hepatitis B virus and hepatitis C virus (HCV) infections also show high amounts of IL-1040–44. We could not observe PD-1 upregulation on monocytes in HCV-infected individuals (n = 11; data not shown), although we cannot exclude that in the liver, the privileged site for HCV repli-cation, monocytes or macrophages can be induced to express high amounts of PD-1. Thus, IL-10 production, resulting from PD-1 trig-gering on monocytes, could also modulate the immune response in other chronic viral infections.
The expression of PD-1 on APCs and PD-L1 on T cells has been shown to regulate the immune response. Indeed, PD-1 expressed on splenic DCs in Listeria monocytogenes–infected mice negatively regulates DC function45. This could be explained by IL-10 produc-tion in DCs, although this was never investigated45. HIV has been shown to increase the expression of PD-L1 on CCR5+ T cells46. Of note, the frequency of cells expressing high amounts of PD-L1 in the natural hosts for simian immunodeficiency virus is low47, which may have beneficial effects for the host. This suggests that the absence of PD-1 and PD-L1 on APCs and CD4+ T cells, respectively, improves the immune response by a mechanism that could implicate IL-10. Monocytes or macrophages in humans and mice with sepsis express more PD-1 than do healthy controls48. PD-1 upregulation on mono-cytes or macrophages is associated with the cells’ development of cel-lular dysfunction48. In contrast, PD-1–knockout mice are protected from the lethality of sepsis in a monocyte- or macrophage-depend-ent manner48. Moreover, circulating IL-10 concentrations in PD-1−/− mice are lower than those in wild-type mice during sepsis, and septic PD1−/− macrophages produce markedly lower amounts of IL-10 than do septic WT macrophages48. This corroborates with our results show-ing that microbial products induce PD-1 upregulation on monocytes during HIV infection and that the triggering of monocyte-expressed PD-1 induces IL-10 production leading to CD4+ T cell dysfunction.
Our results point to the crucial role of blocking both IL-10– IL-10R and PD-1–PD-L1 interactions to restore the immune response during HIV infection11,15. Immunotherapies that interfere with the downregulation of PD-1 and IL-10 should be part of the arsenal used to restore immune function in HIV-infected subjects. Of note, treat-ment of HCV-infected subjects with IL-10 leads to the suppression of the immune response and to increased viral load49. We have also shown that TLR ligands and inflammatory cytokines are major con-tributors of the nonspecific damage of the immune system through a mechanism that involves PD-1 induction on monocytes and IL-10 production. PD-1 and IL-10 are two immunoregulatory molecules that inhibit T cell function1,10–13; we show here a direct relationship between these two molecules and their impact on immune function. We demonstrate the immunoregulatory consequences of gut micro-bial product translocation, which provides a further rationale for therapeutic strategies aiming at repairing the gut mucosal damage and preventing microbial translocation and hyperimmune activation in the treatment of HIV-infected subjects.
METHODSMethods and any associated references are available in the online version of the paper at http://www.nature.com/naturemedicine/.
Note: Supplementary information is available on the Nature Medicine website.

©20
10 N
atu
re A
mer
ica,
Inc.
All
rig
hts
res
erve
d.
a r t i c l e s
� advance online publication nature medicine
ACKNowLEDGMENTSWe thank the subjects for their participation in this study. We also thank M. Legault and C. Grignon for their clinical assistance with the recruitment of study subjects. We are grateful to V.A. Evans and J.D. Schatzle for help in manuscript revision. E.A.S., L.T., M.E.-F. and J.V.G. are funded by the Canadian Institutes of Health Research (CIHR). N.H.S. holds a joint New Investigator Award from the Canadian Foundation for Infectious Diseases and CIHR. J.B. and J.-P.R. are clinician-scientists supported by Fonds de la recherche en santé du Québec. R.-P.S. is the Canada Research Chair in Human Immunology. This study was supported by funds from the US National Institutes of Health, the CIHR, the Canadian Foundation for AIDS Research, the Fonds de la recherche en santé du Québec AIDS and Infectious Disease Network (SIDA-MI) and the Canadian Network for Vaccines and Immunotherapeutics. This study was funded in part by the Intramural Program of the US National Institutes of Health. Vectors were generously provided by E. Cohen at the Institut de Recherches Cliniques de Montréal. The lentiviral vector pWPI (empty vector), packaging plasmid psPAX2 and envelope plasmid pMD2G were generously provided by D. Trono (University of Geneva).
AUTHoR CoNTRIBUTIoNSE.A.S. conducted all experiments and wrote the manuscript. F.P.D. participated in performing and planning the experiments in Figure 1b,c and Supplementary Figures 2 and 6a,c–e. L.T. participated in performing and planning the experiments in Figures 1, 3a,d, 4a,c and 5a. Y.Z. prepared the vectors used for the transduction of Cos cells and participated in the experiments in Figures 3i, 5b, 6e and Supplementary Figure 3a. Y.S. participated in the experiments in Figures 6a–c and Supplementary Figure 5d. M.E.-F. participated in the experiments in Figure 5c and Supplementary Figure 5. B.J.H. measured 16S DNA and soluble CD14 levels. A.N. participated in the experiments in Figure 5c. P.A. participated in the experiments in Figure 3. Y.P. participated in the experiments in Figure 6e and Supplementary Figure 6b,c,e. S.G.F. participated in the experiments in Figure 6e and Supplementary Figure 6b,c. J.V.G. participated in the experiments in Figure 1a,b. M.R.B., J.B., N.H.S. and J.-P.R. provided donor samples and data about the viral load and cell counts. D.C.D. performed 16S and soluble CD14 measurement and participated in the manuscript writing. E.K.H. participated in experimental design and in the manuscript writing. R.-P.S. supervised the project.
CoMPETING FINANCIAL INTERESTSThe authors declare no competing financial interests.
Published online at http://www.nature.com/naturemedicine/. Reprints and permissions information is available online at http://npg.nature.com/reprintsandpermissions/.
1. El-Far, M. et al. T-cell exhaustion in HIV infection. Curr. HIV/AIDS Rep. 5, 13–19 (2008).
2. Klenerman, P. & Hill, A. T cells and viral persistence: lessons from diverse infections. Nat. Immunol. 6, 873–879 (2005).
3. Brenchley, J.M. et al. Microbial translocation is a cause of systemic immune activation in chronic HIV infection. Nat. Med. 12, 1365–1371 (2006).
4. Breen, E.C. et al. Infection with HIV is associated with elevated IL-6 levels and production. J. Immunol. 144, 480–484 (1990).
5. Chollet-Martin, S. et al. Comparison of plasma cytokine levels in African patients with HIV-1 and HIV-2 infection. AIDS 8, 879–884 (1994).
6. Ketlinskii, S.A. et al. Tumor necrosis factor-α and interleukin-1β in the blood plasma of patients with HIV infection. Vestn. Ross. Akad. Med. Nauk. 9–10, 36–41 (1992).
7. Norris, P.J. et al. Elevations in IL-10, TNF-α, and IFN-γ from the earliest point of HIV Type 1 infection. AIDS Res. Hum. Retroviruses 22, 757–762 (2006).
8. Salazar-Gonzalez, J.F. et al. Relationship of plasma HIV-RNA levels and levels of TNF-α and immune activation products in HIV infection. Clin. Immunol. Immunopathol. 84, 36–45 (1997).
9. Than, S. et al. Cytokine pattern in relation to disease progression in human immunodeficiency virus–infected children. J. Infect. Dis. 175, 47–56 (1997).
10. Barber, D.L. et al. Restoring function in exhausted CD8+ T cells during chronic viral infection. Nature 439, 682–687 (2006).
11. Day, C.L. et al. PD-1 expression on HIV-specific T cells is associated with T cell exhaustion and disease progression. Nature 443, 350–354 (2006).
12. Trautmann, L. et al. Upregulation of PD-1 expression on HIV-specific CD8+ T cells leads to reversible immune dysfunction. Nat. Med. 12, 1198–1202 (2006).
13. Petrovas, C. et al. PD-1 is a regulator of virus-specific CD8+ T cell survival in HIV infection. J. Exp. Med. 203, 2281–2292 (2006).
14. Velu, V. et al. Enhancing SIV-specific immunity in vivo by PD-1.blockade. Nature 458, 206–210 (2009).
15. Brooks, D.G. et al. Interleukin-10 determines viral clearance or persistence in vivo. Nat. Med. 12, 1301–1309 (2006).
16. Ejrnaes, M. et al. Resolution of a chronic viral infection after interleukin-10 receptor blockade. J. Exp. Med. 203, 2461–2472 (2006).
17. Clerici, M. et al. Human immunodeficiency virus (HIV) phenotype and interleukin-2/ interleukin-10 ratio are associated markers of protection and progression in HIV infection. Blood 88, 574–579 (1996).
18. Stylianou, E., Aukrust, P., Kvale, D., Muller, F. & Froland, S.S. IL-10 in HIV infection: increasing serum IL-10 levels with disease progression–down-regulatory effect of potent anti-retroviral therapy. Clin. Exp. Immunol. 116, 115–120 (1999).
19. Orsilles, M.A., Pieri, E., Cooke, P. & Caula, C. IL-2 and IL-10 serum levels in HIV-1– infected patients with or without active antiretroviral therapy. APMIS 114, 55–60 (2006).
20. Clerici, M. et al. Role of interleukin-10 in T helper cell dysfunction in asymptomatic individuals infected with the human immunodeficiency virus. J. Clin. Invest. 93, 768–775 (1994).
21. Hagiwara, E., Sacks, T., Leitman-Klinman, S.F. & Klinman, D.M. Effect of HIV infection on the frequency of cytokine-secreting cells in human peripheral blood. AIDS Res. Hum. Retroviruses 12, 127–133 (1996).
22. Kumar, A. et al. Differential production of IL-10 by T cells and monocytes of HIV-infected individuals: association of IL-10 production with CD28-mediated immune responsiveness. Clin. Exp. Immunol. 114, 78–86 (1998).
23. Gröschel, S. et al. TLR-mediated induction of negative regulatory ligands on dendritic cells. J. Mol. Med. 86, 443–455 (2008).
24. Meier, A. et al. Upregulation of PD-L1 on monocytes and dendritic cells by HIV-1 derived TLR ligands. AIDS 22, 655–658 (2008).
25. Keir, M.E., Butte, M.J., Freeman, G.J. & Sharpe, A.H. PD-1 and its ligands in tolerance and immunity. Annu. Rev. Immunol. 26, 677–704 (2008).
26. Lin, D.Y. et al. The PD-1/PD-L1 complex resembles the antigen-binding Fv domains of antibodies and T cell receptors. Proc. Natl. Acad. Sci. USA 105, 3011–3016 (2008).
27. Gordon, S. et al. Monocyte and macrophage heterogeneity. Nat. Rev. Immunol. 5, 953–964 (2005).
28. Heil, F. et al. Species-specific recognition of single-stranded RNA via Toll-like receptor 7 and 8. Science 303, 1526–1529 (2004).
29. Frankenberger, M., Sternsdorf, T., Pechumer, H., Pforte, A. & Ziegler-Heitbrock, H.W. Differential cytokine expression in human blood monocyte subpopulations: a polymerase chain reaction analysis. Blood 87, 373–377 (1996).
30. de Waal Malefyt, R. et al. Interleukin 10 (IL-10) and viral IL-10 strongly reduce antigen-specific human T cell proliferation by diminishing the antigen-presenting capacity of monocytes via downregulation of class II major histocompatibility complex expression. J. Exp. Med. 174, 915–924 (1991).
31. Younes, S.A. et al. HIV-1 viremia prevents the establishment of interleukin 2–producing HIV-specific memory CD4 T cells endowed with proliferative capacity. J. Exp. Med. 198, 1909–1922 (2003).
32. Niemand, C. et al. Activation of STAT3 by IL-6 and IL-10 in primary human macrophages is differentially modulated by suppressor of cytokine signaling 3. J. Immunol. 170, 3263–3272 (2003).
33. Trabattoni, D. et al. B7–H1 is up-regulated in HIV infection and is a novel surrogate marker of disease progression. Blood 101, 2514–2520 (2003).
34. Zhong, Z. et al. Stat3: a STAT family member activated by tyrosine phosphorylation in response to epidermal growth factor and interleukin-6. Science 264, 95–98 (1994).
35. Bright, J.J. et al. TGF-β inhibits IL-12–induced activation of Jak-STAT pathway in T lymphocytes. J. Immunol. 161, 1772–1777 (1998).
36. Huber, M. et al. IRF4 is essential for IL-21–mediated induction, amplification and stabilization of the TH17 phenotype. Proc. Natl. Acad. Sci. USA 105, 20846–20851 (2008).
37. El Kasmi, K.C. et al. General nature of the STAT3-activated anti-inflammatory response. J. Immunol. 177, 7880–7888 (2006).
38. Williams, L. et al. Signal transducer and activator of transcription 3 is the dominant mediator of the anti-inflammatory effects of IL-10 in human macrophages. J. Immunol. 172, 567–576 (2004).
39. Berlato, C. et al. Involvement of suppressor of cytokine signaling-3 as a mediator of the inhibitory effects of IL-10 on lipopolysaccharide-induced macrophage activation. J. Immunol. 168, 6404–6411 (2002).
40. Urbani, S. et al. PD-1 expression in acute hepatitis C virus (HCV) infection is associated with HCV-specific CD8 exhaustion. J. Virol. 80, 11398–11403 (2006).
41. Geng, L. et al. B7–H1 expression is upregulated in peripheral blood CD14+ monocytes of patients with chronic hepatitis B virus infection, which correlates with higher serum IL-10 levels. J. Viral Hepat. 13, 725–733 (2006).
42. Shrestha, S. et al. Interleukin-10 gene (IL-10) polymorphisms and human papillomavirus clearance among immunosuppressed adolescents. Cancer Epidemiol. Biomarkers Prev. 16, 1626–1632 (2007).
43. Swaminathan, S. Molecular biology of Epstein-Barr virus and Kaposi’s sarcoma–associated herpesvirus. Semin. Hematol. 40, 107–115 (2003).
44. Accapezzato, D. et al. Hepatic expansion of a virus-specific regulatory CD8+ T cell population in chronic hepatitis C virus infection. J. Clin. Invest. 113, 963–972 (2004).
45. Yao, S. et al. PD-1 on dendritic cells impedes innate immunity against bacterial infection. Blood 113, 5811–5818 (2009).
46. Boasso, A. et al. PDL-1 upregulation on monocytes and T cells by HIV via type I interferon: restricted expression of type I interferon receptor by CCR5-expressing leukocytes. Clin. Immunol. 129, 132–144 (2008).
47. Pandrea, I. et al. Paucity of CD4+CCR5+ T cells is a typical feature of natural SIV hosts. Blood 109, 1069–1076 (2007).
48. Huang, X. et al. PD-1 expression by macrophages plays a pathologic role in altering microbial clearance and the innate inflammatory response to sepsis. Proc. Natl. Acad. Sci. USA 106, 6303–6308 (2009).
49. Nelson, D.R. et al. Long-term interleukin 10 therapy in chronic hepatitis C patients has a proviral and anti-inflammatory effect. Hepatology 38, 859–868 (2003).
©20
10 N
atu
re A
mer
ica,
Inc.
All
rig
hts
res
erve
d.
nature medicinedoi:10.1038/nm.2106
ONLINE METHODSSubjects. Viremic, aviremic and healthy subjects signed informed con-sent approved by the Royal Victoria Hospital and the CRCHUM Hospital Institutional Review Boards (Supplementary Fig. 1). We measured plasma viral load with the Amplicor HIV-1 Monitor Ultrasensitive Method (Roche). We screened subjects for detectable levels of HIV-specific CD4+ T cell pro-liferation31.
Reagents, antibodies and viruses. We purchased TNF-α, IL-1β and IL-6 from Biosource. Antibody to PD-1 (goat human-specific AF1086) and total goat IgGs from R&D Systems. We purchased RNA40, LTA and CpG DNA from InvivoGen. We purchased LPS and polymyxin-B from Sigma. We purchased blocking anti-body to IL-10R (CD210) from Biolegend. We purchased blocking antibody to PD-L1 and allophycocyanin (APC)-conjugated antibody to PD-1 from eBio-science. We purchased the IL-10 ELISA kit, phycoerythrin (PE)-conjugated anti-body to IL-10R and FITC-conjugated antibody to BrdU from BD Bioscience. We produced R5 HIV-1 (ADA) and X4 HIV-1 (NL4.3) by transfection of 293T cells; vectors were generously provided by E. Cohen50. CMV pp56 pool (containing 133 peptides) was generously provided by BD Bioscience; we obtained the HIV peptides ‘consensus B gag peptides complete set’ (123 peptides) from the US National Institutes of Health AIDS Reagent Repertory.
Tetramers. We obtained peptides and peptide-loaded major histocompat-ibility complex monomers from the Canadian Network for Vaccines and Immunotherapeutics core facility12. The various peptides used to analyze the HIV-specific CD8+ T cell responses are as follows: TPGPGVRYPL (B7NEF), SLYNTVATL (A2p17) and FLGKIWPSYK (A2p15).
Phenotypic analysis. Unless otherwise indicated, we resuspended 1 × 10⁶ PBMCs in RPMI containing 8% human serum in 100 µl. We incubated cells with antibodies to cell surface markers at 4 °C for 20 min. The antibodies used to identify monocytes (CD14+) were human-specific antibodies to CD14 (con-jugated to Pacific Blue (PB)) and CD16 (conjugated to Alexa700). To identify CD4+ and CD8 T cells, we used human-specific antibodies to CD3 (conjugated to Alexa700), CD4 (conjugated to APC-Cy7) or CD4 (conjugated to PB) and CD8 (conjugated to ECD). For staining of PD-1 and its ligands, we used anti-bodies to PD-1 (conjugated to APC), PD-L1 (conjugated to PE-Cy7) and PD-L2 (conjugated to PE-Cy5.5). To identify the phosphorylated form of STAT-3, we used PE-conjugated antibody to STAT-3 phosphorylated on Ser727. We pur-chased all of these antibodies from BD Biosciences, except for CD8-ECD and CD16-Alexa700 (Cedarlane (Biolegend)). We gated live cells by forward and side scatter. We acquired 1 × 10⁶ events for each sample with the BD LSRII flow cytometer (BD Biosciences) and analyzed data using the DIVA (BD Biosciences) or FlowJo (Tree Star Inc.) software.
Cell sorting and T cell activation. To obtain purified CD14+ monocytes ,we iso-lated CD4+ or CD8+ T cells by negative selection. We isolated CD16+ monocytes by positive selection from CD14+ monocytes. For the depletion of monocytes from PBMCs, we used CD14+ positive selection kits. We performed all selections
with AutoMACS or MACS Separation Columns and kits from Miltenyi. Purity as measured by flow cytometry was ≥95%. For CD3 and CD28 stimulation, we preactivated cells with 1 µg ml–1 of antibody specific for CD3 (coated on wells) and 1 µg ml−1 of antibody specific for CD28 for 24 h.
Plasma and serum preparation. We collected blood in tubes (BD) either con-taining EDTA (for plasma preparation) or not (for serum preparation). We prepared plasma by centrifugation. We isolated sera by centrifugation of blood supernatant after incubation for 30 min at 20 °C.
Intracellular cytokine staining assays. We stimulated cells under various condi-tions and then added 5 µg ml−1 of monensin (Sigma-Aldrich) to cultures. We then stained the cells as described previously12.
Carboxyfluorescein succinimidyl ester proliferation assay. We performed CFSE-based proliferation assays as previously described12.
Plasmids and production of recombinant lentivirus. The lentiviral vector pWPI (empty vector), packaging plasmid psPAX2 and envelope plasmid pMD2G were generously provided by D. Trono. We cloned PD-L1 and PD-L2 individu-ally into pWPI into a PmeI restriction site. We produced recombinant virion particles by transient polyethylenimine transfection of 293T cells.
Quantitative PCR. We extracted DNA from plasma preparations with a DNeasy blood and tissue kit (Qiagen). We performed real-time PCR with the following primers: 5′-AGAGTTTGATCCTGGCTCAG-3′, 5′-CTGCTGCCTCCCGTAGG AGT-3′ and the TaqMan Probe FAM-5′-GCAGGCCTAACACATGCAAG TC-3′-BHQ1. We made the 16S DNA standard of PCR products amplified from Escherichia coli and ligated it into a pGEM Teasy vector system. We ran tem-plate standards alongside the DNA purified from plasma samples to obtain an absolute quantification of 16S rDNA in each plasma sample. Quantitative PCR conditions were as follows: 95 °C for 5 min, followed by 45 cycles at 95 °C for 15 s and 60 °C for 1 min each.
Multiplex cytometric bead assay. We used the BD CBA assay (BD Biosciences) to measure plasma concentrations of IL-10, IL-1β, IL-6 and TNF-α12.
Statistics. We performed statistical analyses with Microsoft Excel and Prism software. To assess differences and to obtain first-order-approximate P values for rejecting null effect hypotheses, we used straightforward, established con-servative standard statistical tests appropriate for relatively small numbers of samples. Thus, we used an unpaired t test assuming independent samples and equal variances for the underlying populations.
We applied paired t tests to determine the statistical significance of fold decreases or increases when the measured concentrations spanned many orders of magnitude. We used the Pearson and Spearman correlation tests to assess correlation significance.
50. Xiao, Y. et al. Cell-surface processing of extracellular human immunodeficiency virus type 1 Vpr by proprotein convertases. Virology 372, 384–397 (2008).
Related Documents