Program and Budget Fiscal Years 2018-2019 Includes Adjusted Fiscal Year 2017 Governor Terry E. Branstad Lt. Governor Kim Reynolds

Welcome message from author
This document is posted to help you gain knowledge. Please leave a comment to let me know what you think about it! Share it to your friends and learn new things together.
Transcript

Program and Budget
Fiscal Years 2018-2019
Includes Adjusted Fiscal Year 2017
Governor Terry E. Branstad
Lt. Governor Kim Reynolds


Table of Contents
I. Program Initiatives
Growing Iowa’s Economy 19
Committed to Transformational Education Reform 26
Supporting Strong and Healthy Families 29
Feeding the World and Protecting Our Resources 33
Safety and Efficiency for Iowa’s Drivers and Roads 35
Open Government 38
II. Economic Review
National Economic Conditions 41
Iowa Economic Conditions 43
III. State Financial Policies
Budgeting Policies 47
General Fund Revenues 52
Capital Budgeting 55
Bond Summary 57
IV. Financial Summaries 67
V. Graphs & Support Documents-Education 153
VI. Graphs & Support Documents-Human Services 161
VII. Graphs & Support Documents-Corrections 183
VIII. Graphs & Support Documents-Other 187

Prepared by Iowa Department of Management
This document is available at https://dom.iowa.gov/
January 10, 2017

Branstad/Reynolds Administration’s Goals
“While I am pleased with this progress and optimistic about Iowa’s future, I believe there is more
work to be done. We must seize the opportunities before us. This new General Assembly brings
new dynamics, new expectations and new opportunities to deliver positive results for Iowans.”
Excerpt from Governor Branstad’s 2017 Condition of the State Address to the Iowa General Assembly.
~~~~~~~~~~~~~~~~~~~~~~~~~~~~~~~~~~~~~~~~~~~~~~~~~~~~~~~~~~~~
From the day they took office on January 14, 2011, Governor Branstad and Lt. Governor
Reynolds have focused the work of their administration on the accomplishment of four key
goals:
200,000 New Jobs for Iowans,
15% Reduction in the Cost of Government,
25% Increase in Family Incomes,
1st Schools in the Nation.
The Budget and Program for Fiscal Years 2018 and 2019 is designed to continue making
progress toward achievement of these ambitious goals. The initiatives outlined in this document
provide the framework to help foster Iowa’s greatest economic expansion and quality of life
enhancement of the last half-century.

THIS PAGE INTENTIONALLY LEFT BLANK
i
Governor Branstad’s Condition of the State Before the Iowa
General Assembly January 10, 2017
Madam Lieutenant Governor Mr. President Madam Speaker Legislative leaders, legislators, justices and judges, elected officials, distinguished guests, family, friends and fellow Iowans. I’m honored and humbled to once again address a joint session of the General Assembly delivering the Condition of the State for the final time as your governor. For 22 years, I have addressed this body as governor and today I want to especially welcome the 22 new legislators with us—from both sides of the aisle— who were elected in November. Your constituents sent you to work hard, to work for them, and help make Iowa a better place. I hope you are filled with the same sense of excitement and eagerness that I had when I first served in the Legislature in 1973. Lt. Gov. Reynolds and I look forward to working with each of you and listening to your ideas on how to make our state an even better place for families to live, work and grow. In that spirit, I am today extending an invitation to each legislator to meet with me personally during this legislative session. We also gather again with shared sadness, returning to do our work without our friend, Sen. Joe Seng of Davenport. Joe was a devout Catholic and a true statesman. We enjoyed his contagious and positive personality and working with him. As I look back on my years of public service, I am thankful for those Iowans who have stepped forward to serve their fellow citizens. In particular, please join me in applauding those Iowans who have helped make our state and nation safer by serving in the military, law enforcement or as first responders.
ii
Since taking office in 2011, we have made the necessary changes to strengthen our economy and improve the quality of life across our state. We’ve made tough decisions to give Iowans a smaller and smarter government. We have stayed the course with an unwavering commitment to create jobs, increase family incomes, reduce the size of government, and give Iowa students a globally competitive education. We have provided significant tax relief for Iowans the past five years, especially for commercial property taxpayers. And last month, Lt. Gov. Reynolds and leaders from the Economic Development Authority and Department of Transportation unveiled Iowa’s most comprehensive Energy Plan. The plan was developed after collaboration with the private sector, public sector, educators, non-profits and utilities. Iowa is already a leader in low-cost and renewable energy. The comprehensive new energy plan will help build on our past energy successes and reaffirms our commitment to maintaining Iowa’s energy leadership in the future. I’m proud that we have made government smaller and smarter. We’ve seen unemployment in our state drop from 6.2 percent to 3.8 percent. The state has helped attract more than 13 and a half billion in private-sector capital investment, which has translated into great-paying jobs across Iowa. And more Iowans have been employed these past few years than at any other period in our state’s history. We have also made the tough decisions to ensure government lives within its means like Iowa families must do. We have accomplished this with a relentless focus on fiscal discipline, demanding budget predictability, fully restoring Iowa’s reserve accounts and reducing the state’s debt liability. Together we have made progress toward our goal of restoring Iowa’s schools to best in the nation through a series of landmark reforms and innovative policies.

iii
To improve Iowa’s education standing, we needed to make sure our hardworking teachers had all the tools necessary to succeed given higher expectations for all students. So, we created a new Teacher Leadership System that better utilizes the expertise of top teachers to improve education, instruction and foster greater collaboration. I’m proud to say that every public school in Iowa today is participating in our Teacher Leadership System. To ensure that our children are prepared for a 21st century economy we advanced a nationally recognized STEM initiative that gives students the confidence and skills for rewarding careers. The STEM initiative is led by Lt. Gov. Kim Reynolds and Kemin Industries President & CEO Dr. Chris Nelson and has seen outstanding growth and success. Sustaining these measures over time is critical to get the right results for our students and our state. The ability of Iowans to overcome challenges bolsters my optimism for our state's future. When faced with challenges, Iowans consistently seek opportunities. Some of the challenges we have overcome--like the Farm Crisis of the 1980s--tore at the very fabric of our communities. In the 1980s, Bloomfield, Ia.--a community in Davis County in southeast Iowa--struggled like many communities across the state. An uninsured bank in Bloomfield closed in 1983 and caused great losses for area families and businesses. And area farmers were straddled with debt and limited market opportunities for their crops. However, through a persistent focus on economic diversification and an entrepreneurial spirit to rebuild its community, Bloomfield now has new manufacturers that are growing alongside innovative startups. And, to continue their effort to stay on the cutting edge community leaders are instituting aggressive strategies to become Iowa’s first energy independent community by 2030.

iv
I visited Bloomfield last year and was impressed with the Main Street revitalization, a new hardware store and the M3 Fabrication manufacturing plant. And Woodbine, Ia., is another example of a community that took its future into its own hands. The community showed how an integrated approach to community revitalization that focuses on historic preservation and community sustainability can redefine a struggling, small rural community. Woodbine also had a bank closure in the 1980s, but the community turned its challenges into future growth and diversification. Lt. Gov. Reynolds and I visited Woodbine and were impressed with the success of their Main Street program. And Waterloo, Ia., after experiencing economic challenges throughout the previous three decades embraced the challenge of reshaping its industrial heritage to succeed in modern times. Cedar Valley Tech Works has made Waterloo a nationally recognized leader for manufacturing innovation. And John Deere continues to be a leading manufacturer and innovator in Waterloo. In the balcony, we have leaders from Bloomfield, Woodbine and Waterloo. Please join me in congratulating their accomplishments and supporting their future success. Iowa’s industries are increasingly high tech, including advanced manufacturing. In total, Iowa has over 6,100 manufacturers that contribute more than $31 billion to Iowa’s economy and employ over 200,000 Iowans. Over the next year, the Iowa Economic Development Authority will work with Iowa’s manufacturers to advance a “Year of Manufacturing” in Iowa to help grow this important part of the Iowa economy. We should also be proud that Iowa remains an agricultural powerhouse that feeds and fuels the world thanks to the hard work and innovation of Iowa’s farmers and agricultural producers. We just set an all-time record for ethanol production, set a new record for biodiesel production by an additional 55 million gallons and lead the nation in percentage of electricity generated by wind.

v
We now generate over 35 percent of our electricity from wind and expect this number to exceed 40 percent by 2020. Over the past 30 years, we’ve significantly added value to our agricultural commodities. We’ve also diversified the Iowa economy by expanding exports and supporting growth in biofuels, wind energy, data centers, fertilizer plants, bio-renewable chemicals, advanced manufacturing, insurance and financial services. These newer industries employ hundreds of thousands of Iowans in rewarding careers. And while I am pleased with this progress and optimistic about Iowa’s future, I believe there is more work to be done. We must seize the opportunities before us. This new General Assembly brings new dynamics, new expectations and new opportunities to deliver positive results for Iowans. Our state is in an admirable position. Many states are strapped with crushing debt, poor credit ratings and a bleak economic outlook. But Iowa is a shining example of what hard work and smart, tough choices can do for growing businesses and nurturing families. While the December Revenue Estimate is lower than previous projections the estimate still shows a modest increase in state revenues. Although we have faced a headwind out of Washington, D.C., that is stifling our agricultural economy, we still have positive state revenue growth. But we must proceed with caution and not repeat the mistakes of the past. With that prudence in mind, I present my proposed adjustments to the current fiscal year budget to you today. These adjustments are required by law. My proposal does not include across-the-board cuts, does not reduce funding for K through 12 education, does not reduce property tax credits and does not include furloughs for state employees. The budget reductions I am recommending for this fiscal year are difficult.
vi
But they maintain funding for our mutual priorities. I am committed to working with legislative leaders to implement these adjustments. For the coming biennium, I am presenting a complete two-year budget that is balanced each year and meets our five-year projections for a sustainable future. This budget is based on the principles laid out by the Iowa Taxpayers Association. It prioritizes education, health care, economic development and public safety. And it redirects family planning money to organizations that focus on providing health care for women and eliminates taxpayer funding for organizations that perform abortions. On my first trip to China in 1984, I learned that the Chinese word for danger and opportunity is one in the same. Today, America and Iowa exist in a challenging world. But we must seize the opportunity to make it a better place. In 2010, Lt. Gov. Reynolds and I promised to reduce the size and scope of government. I’m proud to report that we have a smaller, smarter government with a steady focus on improving services for our citizens in a more timely and efficient manner. Yet, while the size of government is smaller, benefits for public employees at the state and local level have increased. Unfortunately, the cost of these benefits has grown dramatically because of our antiquated collective bargaining system that has led to over 500 health-care plans, many of which are inefficient and way too costly for public employees and Iowa taxpayers. Under our present system, a few adverse health outcomes will destroy the budget of a city, county or school district. By replacing this system with one comprehensive statewide health-care contract we can spread the risk and dramatically reduce costs. Using a uniform health-care benefit system similar to the IPERS program for retirement we can provide quality health care at a significantly lower cost

vii
and give local governments more flexibility to provide better wages and meet other needs. The statewide health-care contract also needs to reward employees who take ownership of their own health by conducting health risk assessments and taking actions to improve their own health. We have made a commitment to examine every dollar of revenue and expenditure in order to maximize efficiency and respect hardworking taxpayers. We are committed to a smaller, smarter government that seeks innovative ways to provide services rather than blind adherence to the way things have always been done. I’m asking the General Assembly to take a comprehensive review of all of our state’s boards and commissions to address unnecessary barriers that prevent competition and raise costs. I encourage you to ask the tough questions that challenge the status quo. In Iowa, 90 percent of our general fund budget is spent on three items; K through 12 education, Medicaid and employee wages and benefits. The state has significantly increased funding for education since 2011, amounting to over 654 million additional dollars. Education and job training are the foundation for our future economic growth. Growing our state’s talent pipeline needs to be a top priority. Even with our modest revenue growth my recommendation includes an increase of $78.8 million for K-12 education for fiscal year 2018 and an additional $63.5 million for fiscal year 2019 which equates to roughly 2 percent growth each year. So this year, let’s show Iowans we can make these decisions early and meet the legal requirements of setting supplemental state aid for fiscal year 2018 and fiscal year 2019 in the first 30 days. The second largest driver of our state budget is health and human services spending. Together, we have transformed our mental health system to a community-based model, we obtained a federal waiver for our Iowa Health and Wellness Plan which has reduced charity care for hospitals and, like 39 other states, we have modernized our Medicaid program.

viii
As a result, we have created a new system where more Iowans have access to mental health services closer to home than ever before; more Iowans are covered with health insurance than ever before; and more than 80 new value-added services are now being offered under our modernized Medicaid program. We’ve also replaced the old Medicaid system with a coordinated team of health-care professionals to ensure patients see the right provider at the right time. As a result of these reforms and innovation, we have improved the focus on health outcomes and saved the taxpayers $110 million. Our increase in education funding last year was made possible because of our modernized Medicaid efforts. Without these vital reforms, the budget choices before us today would be twice as hard. In order to grow Iowa, we must also look at policies and reforms that will continue growing family incomes. One way to do this is to close the skills gap which in many ways is the biggest challenge our state faces over the next decade. That is why Lt. Governor Reynolds and I set the Future Ready Iowa goal that 70 percent of Iowans in the workforce should have education or training beyond high school by 2025. Today, less than half of our workforce does. Accomplishing this ambitious goal will create unprecedented opportunities for Iowans and better position our state to compete in an increasingly knowledge-based, digital economy. That is why we established the Future Ready Iowa Alliance, co-chaired by Lt. Governor Reynolds and Dan Houston of Principal, which will make recommendations by Oct. 31, 2017, to assure more Iowans have the careers they deserve and employers can hire the skilled workers they need to grow and innovate. Even with a tight budget, we should continue to prioritize initiatives that will grow the state’s talent pipeline like the STEM initiative, registered apprenticeships and work-based learning for Iowa’s students. Please help me recognize the students here with us today from Jackson Elementary School in Des Moines, Bondurant-Farrar Middle School and Waukee High School, which has one of the premier work-based learning programs in our state.
ix
The students in the gallery represent children across Iowa who are counting on all of us to modernize schools for the 21st century. That’s why Lt. Governor Reynolds and I are launching a comprehensive computer science initiative. We are encouraging every high school to offer at least one high-quality computer science course, every middle school to provide exploratory computer science, and every elementary school to include an introduction to computer science. All students need to learn how computers operate because it is fundamental to life and work today. Computer science will provide students a chance to join one of the fastest-growing and best-paying fields. No student should miss out on this opportunity because of where they live. This is another step to better align education and training with essential workforce needs. We all care deeply for the safety of our families, our friends, and our neighbors. However, a troubling trend has begun to emerge that threatens Iowans’ safety on our roads. Traffic deaths went from 315 in 2015 to 402 in 2016. This is unacceptable. Earlier this year, I called on the Department of Public Safety and the Governor’s Traffic Safety Bureau to lead a working group to study this disturbing trend. The group, with the support of key stakeholders, including law enforcement, made recommendations worth your consideration. I am asking you to take a hard look at these recommendations and evaluate which can be put into law to make our roads safer. Unfortunately, too many innocent bicyclists, motorcyclists, pedestrians and passengers have lost their lives on our roads. Last year, I received a handwritten note from Christine and Darrel Harken, parents of Grace Harken, who live near Riceville.

x
They wrote “our daughter Gracie’s life was so sadly ended July 29, 2015, by someone who was driving and texting.” Grace was biking safely and lawfully during a morning bike ride, when a driver who was texting struck and killed her. They went on to write, “Grace would have forgiven the driver and moved forward. “That is what we have chosen to do. But we miss her so.” Grace Harken’s life was tragically ended way too early. Modern technologies should come with new responsibilities. I ask that all Iowans join the Iowa law-enforcement community, first responders, the League of Cities, all the major cell-phone carriers, the insurance industry, and the medical community in demanding real change in the laws for distracted and impaired drivers. Last year, I called on the Legislature to send me a water-quality improvement bill. I was pleased to see bipartisan progress made on this front with the House passing House File 2541 last session. This bill was approved by the Agriculture, Ways and Means and Appropriations Committees and passed the House with 65 votes. This bill provided for a long-term, dedicated and growing source of revenue to help implement projects to improve habitat and water quality directed by the Iowa Nutrient Reduction Strategy. The bill also provided funding for community conservation practices and improvements to wastewater and drinking water facilities. By leading on this issue, together we have the opportunity to modernize Iowa’s agricultural infrastructure, create jobs in rural Iowa and promote collaboration between urban and rural communities. I believe our discussions should begin with the House-passed bill from last session. I hope we can work together to perfect and improve the legislation that will provide a long-term, dedicated and growing source of revenue for water-quality improvements. I’ve been so blessed to serve as your governor, leading the state I love, for 22 years.

xi
I am confident Iowa will continue to move forward because Iowans care deeply about their neighbors, their communities and creating an even better future. And I’m extremely thankful for perhaps the most patient person in the state -- my wife, Chris -- as she has also served Iowa as first lady with grace. She has welcomed Iowans and visitors from around the world to Terrace Hill and she has volunteered to help in many ways, including reading with Jackson Elementary students. To Chris and my entire family, thank you for your sacrifice during my time in public service. I am also thankful for the friendships we have made in all 99 counties – friendships that we will always cherish. And I am grateful for the prayers from Iowans who have encouraged me along the way. There is no better job in the world than being the governor of the state that you love. But sometimes we are called to serve in ways we had never imagined. As I approach the U.S. Senate confirmation process my main priority is to continue serving the people of Iowa with the same energy and passion that I have brought to this office each and every day. Thank you. God Bless you and all the people of Iowa.

THIS PAGE INTENTIONALLY LEFT BLANK

Growing Iowa’s Economy
Since taking office in 2011, Governor
Branstad and Lt. Governor Reynolds made
it a priority to get Iowans working again.
Both the Governor and Lt. Governor knew
that in order to truly stimulate strong growth,
Iowa needed to create 200,000 new jobs
over the upcoming five-year period. Thanks
to sound budgeting practices, tax reform
and innovative economic growth policies,
Iowa has seen a significant comeback in job
growth.
2017: The Year of Manufacturing
Iowa’s advanced manufacturing
businesses produce $31.7 billion of
products annually, three times more than
what is generated from the farming industry.
Manufacturing is the state’s single largest
business sector. Iowa ranks eighth in the
nation in the percentage of our gross
domestic product (GDP) stemming from
manufacturing. While other states have
seen declines in their manufacturing
sectors, Iowa has experienced growth. The
Branstad-Reynolds administration will work
with the Iowa Economic Development
Authority, Iowa’s manufacturers and other
stakeholders to ensure continued growth
and expansion in this sector to benefit
Iowa’s working families.
Changing Workforce Needs and a
Persistent Skills Gap
Every state in the nation is challenged
by a persistent skills gap—a challenge
confirmed during travel by the Governor and
Lt. Governor throughout all of Iowa’s 99
counties. Policy leaders within Iowa and
across the nation are exploring avenues to
strengthen the talent pipeline. The goal is
to ensure students and workers have the
career opportunities they need and Iowa
employers have the skilled employees they
desire to grow and innovate. Policy
discussions are driven by a global,
knowledge-based economy that rewards
higher levels of education and training.
Fifty years ago, nearly 80% of jobs
required only a high school diploma or less,
and most paid a good wage. Today, only
35% of jobs are available to high school
graduates or dropouts, and more than two-
thirds of those jobs pay less than $25,000.
In short, the careers of today and tomorrow
increasingly require advanced knowledge
and skill levels. Even as the numbers of
mid-level and high-skilled jobs grow in Iowa,
the availability of a skilled workforce is a
major constraint for Iowa businesses and
overall economic development. A recent
Georgetown University report states that in
1973, 28% of U.S. jobs required education
beyond a high school diploma, while by
2025, nearly 66% of jobs in the nation (and
68% of Iowa jobs) will require education or
training beyond high school.
Growing Iowa’s Talent Pipeline
To better match employers with a skilled
workforce, the Governor and Lt. Governor
have supported a number of programs and
Agri-Industrial Plastics
19

continue to look for innovative approaches
to strengthen Iowa’s workforce. Initiatives
must include comprehensive strategies that
align education, workforce and economic
development efforts.
Future Ready Iowa: Preparing our
Workforce
Closing the skills gap is the biggest
workforce challenge Iowa faces over the
next decade. This is why Governor
Branstad and Lt. Governor Reynolds have
set an ambitious goal of 70% of Iowa’s
workforce, ages 25 to 64, having education
or training beyond high school by the year
2025. Nearly half of the workforce
population meets this goal now according to
an analysis by the Lumina Foundation.
Accomplishing the 70% goal will provide
more Iowans with the career opportunities
they deserve and give employers the skilled
workforce they need to help their
businesses flourish.
To help set the pieces in place to
achieve the 70% goal, Governor Branstad
issued Executive Order 88 establishing the
Future Ready Iowa Alliance. The charge of
the Alliance is to develop recommendations
by October 31, 2017, for how to achieve the
goal.
Lt. Governor Reynolds co-chairs the
group, which is comprised of a broad cross-
section of Iowans representing business
and industry, labor, education, non-profits,
community advocates, students and state
agencies, among others. The Alliance is
seeking to build on existing efforts to better
align education, workforce training and
economic development initiatives. Five work
groups have been created to study policies
and other strategies to reach the 2025 goal:
Get Iowans Ready focuses on better
preparing students from preschool
through high school,
Get Iowans Credentialed focuses on
increasing post-secondary enrollment
and attainment,
Upskilling Iowans focuses on
unemployed and underemployed
Iowans,
Demand Driven focuses on filling high-
demand jobs, and
Communications and Outreach
focuses on getting the message to key
stakeholders.
One of the near-term milestones for the
Alliance will be to launch the Future Ready
Iowa website in early 2017. The website
will be a one-stop shop for Iowans to learn
about education and training pathways tied
to high-demand careers.
With 2025 just eight years away, the
Future Ready Iowa Alliance will work to
develop concrete, cost-effective
recommendations. These recommendations
will work to create more opportunity for
students and adults in partnership with
business and industry. This initiative
promises to grow family incomes,
accelerate economic vitality and improve
the quality of life for Iowans.
Governor Branstad signing Executive Order 88,
establishing Future Ready Iowa Alliance
20

Iowa Apprenticeship and Job Training
Program
Registered Apprenticeships
The Registered Apprenticeship system
provides a proven pathway to preparing
workers for in-demand jobs and meets the
needs of businesses for a highly skilled
workforce. The Iowa Apprenticeship
Program, created by the Iowa
Apprenticeship Act in 2014, has helped to
increase the number of registered
apprentices in Iowa by providing training
grants to eligible apprenticeship programs.
The program is administered by the Iowa
Economic Development Authority in
coordination with the United States
Department of Labor (DOL) Office of
Apprenticeship (OA).
As a result of the robust state, federal
and private sector partnership, Iowa has
been one of the fastest growing Registered
Apprenticeship states in the nation and is
recognized as a national leader in
supporting apprenticeships. As of
November 2016, more than 8,200
employees were working in Registered
Apprenticeship programs statewide. Iowa is
also showing a dramatic increase in the
number of new programs joining Registered
Apprenticeship. In the last four years, Iowa
added over 100 Registered Apprenticeship
programs each year and is on track to meet
a federal five-year goal of doubling its
registered apprentices by 2019.
High Quality Pre-Apprenticeship Programs
High quality pre-apprenticeship
programs contribute to the development of a
diverse and skilled workforce by preparing
participants to meet the basic qualifications
for entry into one or more Registered
Apprenticeship programs. High quality pre-
apprenticeship programs also provide the
opportunity for participants to explore and
learn more about the different career
opportunities offered by Registered
Apprenticeship programs. Employers with
the Registered Apprenticeship program can
work with a pre-apprenticeship program to
determine the curriculum and training pre-
apprentices receive. These programs also
set quality standards and competency
goals, helping to streamline the recruitment
process for Registered Apprenticeships.
Like Registered Apprenticeship
programs, the pre-apprenticeship program
design is flexible. Programs can be
adapted to meet the needs of differing
populations being trained, the various
employers and sponsors they serve, and
specific opportunities within the local labor
market.
The Des Moines Public School’s Central
Campus and Lincoln High School recently
established the first Quality Pre-
Apprenticeship programs in Iowa. These
programs offer students on-site instructional
and quality training in specific skilled
occupation areas. Students also have an
opportunity to meet with Registered
Apprenticeship sponsors and explore and
pursue potential careers with employers.
These programs have become a model for
other high schools and public and private
collaborators interested in creating similar
programs in Iowa.
STEM Internship Program
The Science, Technology, Engineering
and Mathematics (STEM) Student
Internship Program, administered through
the Iowa Economic Development Authority,
provides grants to small and medium-sized
companies in the advanced manufacturing,
biosciences and information technology
21

industries to help support internship
programs. The goal of the program is to
transition the interns to full-time employment
in Iowa upon graduation.
Home Base Iowa
On Memorial Day 2014, Governor
Branstad signed the landmark Home Base
Iowa Act into law. Home Base Iowa (HBI)
has paved the way for current and future
military veterans to receive the thanks they
deserve for their service. Program efforts
are currently underway to finalize the launch
of a searchable database of veterans for
HBI businesses to access. The database
will automatically send resumes to HBI
businesses, Workforce Development One-
Stop shops, and HBI communities when a
veteran’s data matches criteria for a
position.
The program continues to garner
support from additional HBI businesses and
communities and CHAMPs (Certified Higher
Academic Military Partners) across the
state. The number of HBI communities has
grown to 44 and there are well over 1,400
HBI businesses. Additionally, there are 21
CHAMPs institutions with the highest
commitment to veterans, including all
Regents universities, numerous private
colleges and 23 community colleges. The
Iowa Business Council reports that more
than 2,750 veterans have been hired since
the program began, vastly outpacing the
2,500 goal set for 2018. Home Base Iowa
is generating results for veterans and for the
State of Iowa.
State Energy Plan and Energy Careers
As we look to future economic growth in
Iowa, discussions need to include a
strategic approach as part of our state’s
energy plan. Governor Branstad has been
a strong supporter of renewable energy
since the 1970s. In 1983, Governor
Branstad signed the nation’s first renewable
electricity standard. At that time, Iowa was
heavily dependent on coal for electricity and
imported oil for motor fuel. Today, Iowa
produces far more ethanol than we
consume in gasoline. We are also the
leading producer of biodiesel and wind
energy, producing over 31% of our
electricity from wind in 2015. Companies
that have invested in Iowa have cited our
low cost of energy as a major reason for
locating here.
The American Wind Energy Association
reported that Iowa could meet 40% of our
energy needs from wind power by 2020 and
still export excess energy to other states.
Part of these successes can be attributed to
thoughtful planning. To that end, ongoing
strategic planning will enable Iowa to remain
a leader in this field.
University of Iowa Lab
22

On December 21, 2016, Lt. Governor
Reynolds announced the Iowa State Energy
Plan along with the Iowa Economic
Development Authority, the Iowa
Department of Transportation, and the Iowa
Partnership for Economic Progress (IPEP)
Board. One of the Plan’s objectives is to
increase the local talent pool for energy-
related careers while promoting
employment and training opportunities in
the energy sector. Iowa stakeholders will
identify high-demand energy sector
occupational needs and determine ways to
clearly communicate those needs to
education and training providers.
As plan implementation moves forward,
state agencies and industry leaders will
continue to support Iowa’s existing training
and trade apprenticeship programs. Efforts
will also identify additional opportunities for
building career pathways in the energy
sector.
Smaller and Smarter Government
through Regulatory and Licensing
Reform
Regulatory and licensing reforms
continue to be priorities of the Branstad-
Reynolds Administration. Government
regulation and licensing are necessary only
when protecting the public safety and
welfare of Iowans.
State agencies should achieve statutory
goals as effectively and efficiently as
possible without imposing unnecessary
burdens that reduce jobs and hurt job
growth. All rules are cleared by the
Governor’s Office to ensure Iowa’s
employers are not adversely affected. The
following efforts are in support of a smaller
and smarter government.
Professional Licensing Reform
In 2013, Governor Branstad vetoed
legislation mandating licensing for four new
professions. At the end of the 2016
Source: American Wind Energy Association
23

legislative session, Governor Branstad item-
vetoed licensing requirements for natural
hair braiding and ended licensing for natural
hair braiding in Iowa. The Branstad-
Reynolds Administration will work with the
Iowa legislature to continue finding other
common-sense solutions and reduce the
number of unnecessary regulatory burdens
and licensing fees on hardworking Iowans.
Boards and Commissions
The Branstad-Reynolds Administration
proposes reviewing the existing boards and
commissions to determine which boards
can be merged or reduced to eliminate
unnecessary or redundant ones.
New Rules-filing System Using Existing
State Resources
In November of 2016, the Branstad-
Reynolds Administration, in collaboration
with Legislative Services Agency, launched
a new administrative rules filing system.
This new system was incorporated into the
already existing bill filing system.
Coordination between the two branches of
government resulted in an easy-to-use filing
system for state agencies that maximized
the use of state resources.
Award-Winning Administrative Rules
Website
On May 18, 2015, Governor Branstad
announced the launch of a new website that
made the administrative rules process more
open and transparent to the public. The
site, Rules.Iowa.Gov, creates a one-stop
shop allowing Iowans to view administrative
rules that are open for comment, comment
on rules online, find contact information for
each specific rule, learn how much longer
the comment period is open and inquire
about the administrative rules process.
On July 21, 2015, the Administrative
Rules Organization of the National
Association of Secretaries of State (NASS)
honored the Iowa Office of the Chief
Information Officer with the 2015 Colborn
Award for the development of
Rules.Iowa.Gov. The Colborn Award
“annually recognizes a state program that
demonstrates creativity and innovation in
providing public access to, or management
of, administrative rules. The award also
highlights improved efficiency and delivery
of services to citizens, businesses and other
governmental entities.”
Jobs Impact Statement for New Administrative Rules
Since March 2011, Governor Branstad
and Lt. Governor Reynolds have required
that a Jobs Impact Statement accompany
every proposed administrative rule. The
Jobs Impact Statement requires regulators
to create policies that protect the health and
safety of individuals and families while
maximizing job growth and reducing
adverse impacts on small businesses in
Iowa.
Stakeholder Groups Involve Iowans in the
Rulemaking Process
The Governor signed Executive Order
80 in August 2012 which established
stakeholder rulemaking groups for the
purpose of preventing unnecessary burdens
on the public, increasing public input, and
encouraging efficiency and economic
growth. Stakeholder groups encourage
information-sharing between agencies and
varying interests in the community. They
also help to encourage more public
participation, especially from those
individuals and groups that will be affected
by new rules. Public participation in the
formulation of administrative rules helps our
state to reform burdensome rules and
24
prevent overregulation or red tape,
encouraging efficiency, economic growth
and job creation.
Rolling Sunset of Existing Rules
Governor Branstad and Lt. Governor
Reynolds continue to require all state
agencies to review existing administrative
rules to identify those regulations that
adversely and unnecessarily impact job
creation in Iowa. State agencies are
required to complete their five-year review
by July 2017.
25
Committed to Transformational Education Reform
Preparing Iowa students to succeed in a
knowledge-based, high-tech economy is
one of Governor Branstad’s and Lt.
Governor Reynolds’ top priorities. The
Branstad-Reynolds administration remains
committed to sustaining and building upon
the major education reforms they
recommended and signed into law in recent
years. To further this effort, they are
proposing legislation requiring all
elementary, middle and high school
students to have access to high-quality
computer science programs by the year
2019. Specifics include:
Offering at least one high-quality
computer science course in every high
school,
Providing exploratory computer science
curriculum in every middle school, and
Including an introduction to computer
science basics in every elementary
school.
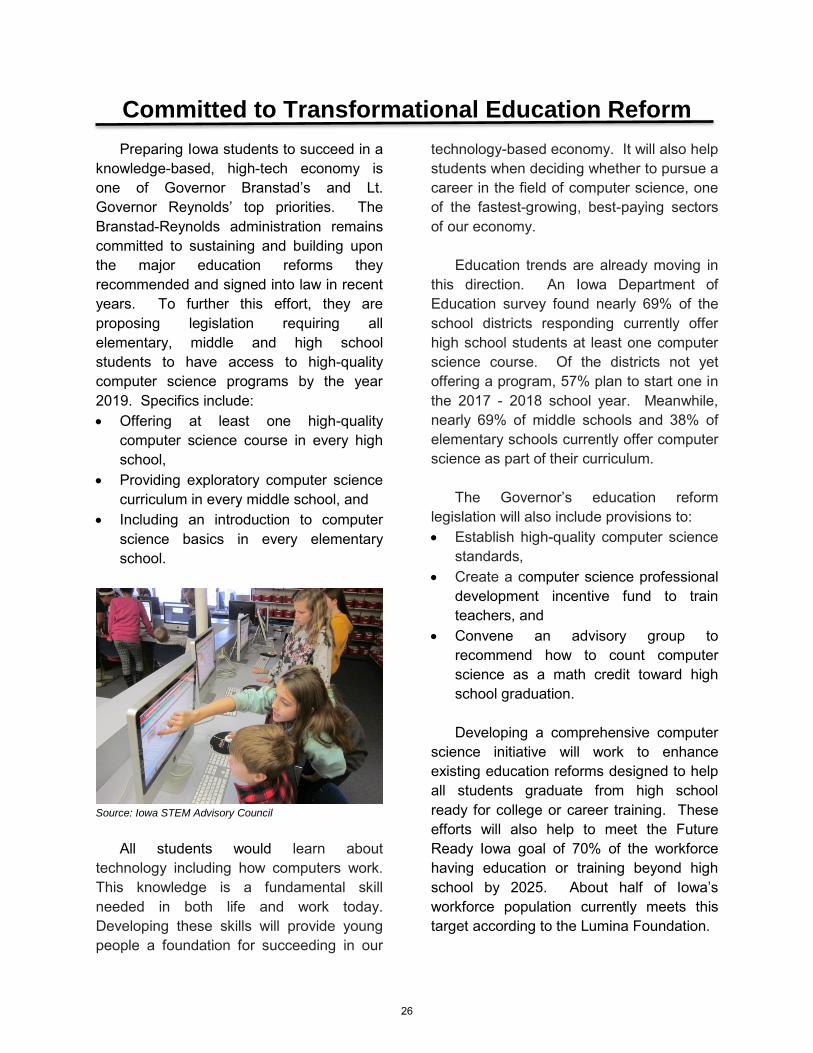
Source: Iowa STEM Advisory Council
All students would learn about
technology including how computers work.
This knowledge is a fundamental skill
needed in both life and work today.
Developing these skills will provide young
people a foundation for succeeding in our
technology-based economy. It will also help
students when deciding whether to pursue a
career in the field of computer science, one
of the fastest-growing, best-paying sectors
of our economy.
Education trends are already moving in
this direction. An Iowa Department of
Education survey found nearly 69% of the
school districts responding currently offer
high school students at least one computer
science course. Of the districts not yet
offering a program, 57% plan to start one in
the 2017 - 2018 school year. Meanwhile,
nearly 69% of middle schools and 38% of
elementary schools currently offer computer
science as part of their curriculum.
The Governor’s education reform
legislation will also include provisions to:
Establish high-quality computer science
standards,
Create a computer science professional
development incentive fund to train
teachers, and
Convene an advisory group to
recommend how to count computer
science as a math credit toward high
school graduation.
Developing a comprehensive computer
science initiative will work to enhance
existing education reforms designed to help
all students graduate from high school
ready for college or career training. These
efforts will also help to meet the Future
Ready Iowa goal of 70% of the workforce
having education or training beyond high
school by 2025. About half of Iowa’s
workforce population currently meets this
target according to the Lumina Foundation.
26

Some of the reforms now in place to
improve education include:
Iowa’s Teacher Leadership and
Compensation System,
Iowa’s Early Literacy initiative to assure
children read by the end of third grade,
and
The Governor’s STEM Advisory Council,
which delivers high-quality science,
technology, engineering, and math
programs to nearly every Iowa school
district.
Iowa’s 2013 landmark Teacher
Leadership and Compensation System—
the most extensive teacher leadership
system in the nation—was phased in over
three years starting in 2014-15. Beginning
in the 2016 - 2017 school year, the system
is now in place in all 333 school districts
with about 25% of Iowa teachers serving in
leadership roles including instructional
coaches and mentors. An American
Institutes for Research interim report found
a positive impact on classroom instruction
and professional climate in the 115 school
districts that implemented the system during
the first two years of the roll-out.
Iowa’s 2012 Early Literacy initiative
requires school districts to identify struggling
readers beginning in kindergarten and
provide intensive assistance to help them
read proficiently by the end of third grade.
An early identification and progress
monitoring system is now in place across
the state. Unfortunately, third-grade reading
results on state tests have been stagnant so
improving instruction is critical. Therefore,
Governor Branstad and Lt. Governor
Reynolds recommend $3.5 million to launch
a three-year project to develop an early
literacy standard of care. This standard will
better support teachers and accelerate
student progress in reading.
The Governor’s STEM Advisory Council,
established in 2011, continues to gain
momentum. The Council delivered high-
quality STEM education programs to more
than 100,000 students from preschool
through high school in 2015-16. Programs
offered include:
Curriculum for Agricultural Science
Education,
Engineering is Elementary,
Project Lead the Way, and
Introduction to Computer Science and
Engineering.
In the National Percentile Rank,
students who participated in these programs
scored an average of 7% higher in math,
6% higher in science and 4% higher in
reading. The Council has promoted STEM-
related teaching endorsements and teacher
externships. Since launching the STEM
BEST (Businesses Engaging Students and
Teachers) program in 2014-15, this public-
private partnership providing students real-
world, hands-on learning experiences, now
includes 18 projects involving dozens of
schools and hundreds of businesses
throughout the state. With the STEM
Council’s operations team located at the
Lt. Governor Reynolds, Governor Branstad, Education Director
Ryan Wise with 2017 Teacher of the Year Shelly Vroegh
27
University of Northern Iowa, UNI’s budget
request includes $500,000 to expand STEM
BEST in 2017-18.
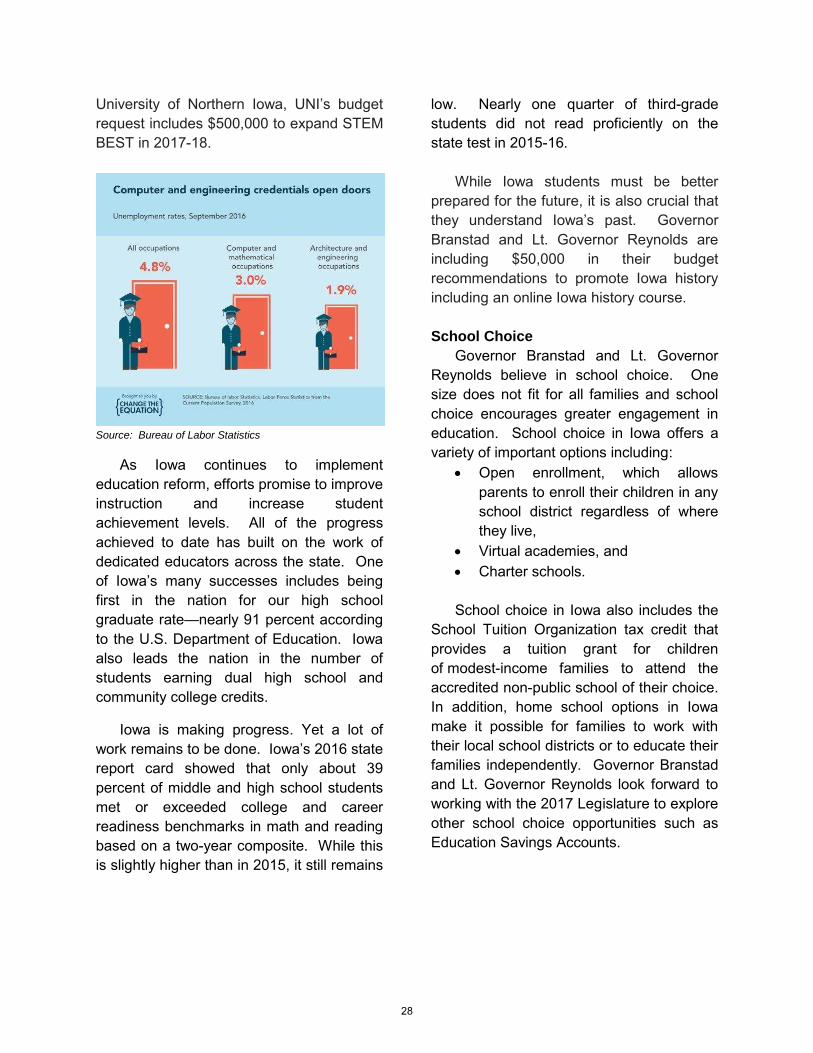
Source: Bureau of Labor Statistics
As Iowa continues to implement
education reform, efforts promise to improve
instruction and increase student
achievement levels. All of the progress
achieved to date has built on the work of
dedicated educators across the state. One
of Iowa’s many successes includes being
first in the nation for our high school
graduate rate—nearly 91 percent according
to the U.S. Department of Education. Iowa
also leads the nation in the number of
students earning dual high school and
community college credits.
Iowa is making progress. Yet a lot of
work remains to be done. Iowa’s 2016 state
report card showed that only about 39
percent of middle and high school students
met or exceeded college and career
readiness benchmarks in math and reading
based on a two-year composite. While this
is slightly higher than in 2015, it still remains
low. Nearly one quarter of third-grade
students did not read proficiently on the
state test in 2015-16.
While Iowa students must be better
prepared for the future, it is also crucial that
they understand Iowa’s past. Governor
Branstad and Lt. Governor Reynolds are
including $50,000 in their budget
recommendations to promote Iowa history
including an online Iowa history course.
School Choice
Governor Branstad and Lt. Governor
Reynolds believe in school choice. One
size does not fit for all families and school
choice encourages greater engagement in
education. School choice in Iowa offers a
variety of important options including:
Open enrollment, which allows
parents to enroll their children in any
school district regardless of where
they live,
Virtual academies, and
Charter schools.
School choice in Iowa also includes the
School Tuition Organization tax credit that
provides a tuition grant for children
of modest-income families to attend the
accredited non-public school of their choice.
In addition, home school options in Iowa
make it possible for families to work with
their local school districts or to educate their
families independently. Governor Branstad
and Lt. Governor Reynolds look forward to
working with the 2017 Legislature to explore
other school choice opportunities such as
Education Savings Accounts.
28

Supporting Strong and Healthy Families
Healthiest State in the Nation
Iowa continues to lead the nation in
improving the health and well-being of its
citizens. National organizations such as the
Gallup-Healthways Well-Being Index,
Mental Health America, and Annie E. Casey
Foundation rank Iowa as a top state for
health. America’s Health Ranking listed
Iowa as the most improved state rising five
spots from 22nd in 2015 to 17th in 2016. The
state’s rise is due in part to improvements in
the percentage of children ages 19 to 35
months and adolescents ages 13 to 17
years receiving recommended
immunizations.
The Healthiest State Initiative, a public-
private partnership launched in 2011,
contributed to our state’s success this year.
Iowa moved from the rank of 19th in the
country to 14th in the Gallup-Healthways
Well-Being Index, improving at twice the
national average.
The Healthiest State Walk continues to
attract thousands of Iowans annually. More
than 1.5 million Iowans have participated in
the walk since June 2011. This year’s walk
once again featured participation in all 99
Iowa counties with over 850 walks being
held statewide. Iowans young and old are
taking more ownership for improving their
own health and well-being.
Source: Iowa Department of Public Health
Health Care Reform
Iowans deserve health care reform that
improves care, lowers costs and, most of
all, results in healthier people. These
principles guide Governor Branstad and Lt.
Governor Reynolds in addressing all health
care issues.
Medicaid Modernization
In April 2016, Iowa modernized its
Medicaid Program to a proactive, patient-
centered approach. This approach included
moving from a volume- to a value-based
system focused on health outcomes.
Patients now have more choice than ever
before in receiving services that meet their
individual needs including improved access
to doctors and nurses. The program also
incorporates real accountability for
improving the health of more than 500,000
Iowans.
Nationally, over 52 million Medicaid
patients in 39 states and Washington, D.C.
are enrolled in comprehensive Medicaid
managed care health plans. Prior to April
2016, Iowa already had significant
experience with Medicaid managed care
when the state first began serving Medicaid
29
patients in managed care plans in the
1980s. Iowa expanded use of this approach
with the Medicaid behavioral health
population in the 1990s and with Iowa’s
HAWK-I Program. For years, Iowa has
entrusted the care of its state employees to
private insurance companies.
Medicaid Modernization has delivered
unprecedented transparency and results in
Iowa’s Medicaid Program. Governor
Branstad signed every Medicaid
Modernization oversight item into law from
the 2015 and 2016 legislative sessions. As
a result, the state is now able to track nearly
1,000 measurable health outcomes. In the
first six months
Over 145,000 patients voluntarily
selected their own health plan,
Over 40,000 value-added services were
utilized. The health plans offer
numerous value-added services that go
above and beyond what traditional
Medicaid benefits offer. Examples of
value-added services include health
incentives, tobacco cessation and
wellness programs,
Over 230,000 patient health risk
assessments and outreach efforts were
conducted in the identified health risk
factors to help patients live longer,
healthier lives, and
More than 25,000 adults and children
with high-risk behavioral health
conditions now have a health care
coordinator. The coordinator works with
individuals to ensure integration of their
medical, physical and behavioral health
care needs.
Improving our mental health system and
ensuring coordinated care is a cornerstone
of Medicaid Modernization.
The modernizing of Medicaid through
managed care has also ensured the
sustainability of the program. Before
moving to managed care, state Medicaid
expenditures had increased an average of
10% each year over the past 10 years.
Medicaid spending in Iowa had grown from
$2.6 billion in State Fiscal Year 2007 to an
estimated nearly $5 billion in Fiscal Year
2017. This unsustainable rate of
expenditure growth had become the fastest
growing state General Fund budget driver.
In the first fiscal year of modernization,
Iowa’s Medicaid budget is saving taxpayers
$110 million. Savings were achieved by
increasing the availability of preventive
services, reducing the number of
emergency room visits, hospitalizations and
surgeries, and eliminating unnecessary or
duplicative services.
Medicaid Modernization has brought
fiscal accountability to the forefront.
National data from the Centers for Medicare
& Medicaid Services (CMS) found that
Iowa’s previous Medicaid fee-for-service
program had an improper payment rate of
12% or $318.5 million annually. Medicaid
would pay providers and ask questions
later. In comparison, CMS data shows that
managed care Medicaid programs have an
improper payment rate of 0%. Health plans
use sophisticated, 21st century computer
systems to verify payment on the front side,
ensuring accuracy and preventing fraud,
waste and abuse. This enhanced program
integrity is another cornerstone of managed
care.
Medicaid Modernization utilizes
nationally experienced health plans to
coordinate care in a way that meets
individual health care needs and results in
30

healthier patients. Iowans are getting the
right care, at the right time, in the right
setting.
Modernizing our Mental Health Care
System
Iowa’s mental health system is serving
more Iowans with better services in an even
greater number of local settings. Since
2014, nearly 150,000 more Iowans now
have access to mental health insurance
coverage through the Iowa Health and
Wellness Plan. The Plan offers mental
health services to patients in their local
community as well as in their home.
Doctors, advocates and mental health
professionals agree that modern mental
health care is best delivered at the
community level.
In 2013, Iowa successfully moved from
a 99-county delivery system to 15
regionalized state-local partnerships to
provide quality, mental health services.
Since that time, state and local government
investment in mental health care in Iowa
has increased by 40% to $2.1 billion over
five years (Fiscal Years 2013 - 2017). In
the previous five years, mental health care
spending by state and local governments in
Iowa was $1.5 billion (Fiscal Years 2008 -
2012).
Iowa’s 15 mental health regions now
offer locally administered, evidence-based
services. No matter where you live, Iowans
can now receive the same core mental
health services. Regions have the flexibility
to expand into more intensive services in
specific communities to address crisis
needs. Since the redesign, regions have
added 53 residential crisis beds (up to 83
total beds). There has also been a 240%
increase in the number of counties offering
mobile crisis services, 10 regions provide
24-hour crisis lines, and 60 counties offer
jail diversion programs. The successful
redesign has resulted in more Iowans
receiving modernized and improved mental
health services at the local level.
Inpatient Psychiatric Bed Tracking
System
Iowa is tracking inpatient, psychiatric
bed availability using a new modern bed
tracking system. In 2015, the Iowa
Department of Human Services (DHS)
launched a real-time, statewide bed tracking
system which allows health care providers
to determine the availability of mental health
beds quickly and to locate services when
hospitalization is needed.
Most Iowans who seek mental health
care services will never need hospitalization
and are best served in home- and
community-based settings. For Iowans that
require inpatient psychiatric care there are
more than 700 public and private inpatient
beds located at 29 hospitals across the
state. Data from the bed tracking system
shows that Iowa has between 60 and 100
mental health beds available daily.
Stakeholders from local government, our
law enforcement community, and medical
professionals continue working with DHS to
improve on this bed tracking tool.
Helping Keep Doctors in Iowa
Governor Branstad and Lt. Governor
Reynolds are committed to ensuring a
sustainable health care system that includes
a sufficient health care workforce. Iowa is
home to two medical schools and more than
1,500 medical students. Healthcare
professionals play an important role in
helping Iowa communities stay vibrant.
Public investment helps address the
31

physician shortage in the state to better
meet the health care needs of Iowans. By
making investments in residency programs,
we can attract more physicians, particularly
in specialty areas such as psychiatry, to
come to and remain in Iowa after
completing their residency.
In 2015, Governor Branstad signed into
law provisions to reduce the barriers to
medical residency programs and increase
the opportunities for significant investments
to be made into the more costly residency
programs like psychiatry. In November
2015, the Department of Public Health
awarded $4 million to three new psychiatric
medical residency programs. The residency
programs are located in Des Moines at
Broadlawns Medical Center, UnityPoint
Health, and Mercy Medical Center. It is
expected that the three residency programs
will train up to ten residents per year.
Governor Branstad also continues to
support efforts to reform medical
malpractice litigation including a Certificate
of Merit and a cap on non-economic
damages in medical malpractice lawsuits.
While president of Des Moines University,
Governor Branstad learned that keeping
doctors in Iowa meant making a
commitment to helping them in stay Iowa.
Other states have enacted similar reforms
and had success in reducing the cost of
care and retaining physicians.
Promoting Pro-Life Policies and
Maintaining High-Quality, Accessible
Health Care
Governor Branstad and Lt. Governor
Reynolds have led Iowa’s most pro-life
administration in history. During the past
four years, Iowa taxpayers have not paid
one dollar toward reimbursing a Medicaid
abortion procedure or abortion-related
service. Today, no state dollars from state
programs are paid to abortion providers.
Governor Branstad is proud of his
record of signing pro-life legislation.
Governor Branstad signed into law the
requirement for parental notification for any
minor seeking an abortion and the
requirement that a sonogram be provided
as an option before an abortion. Governor
Branstad and Lt. Governor Reynolds are
committed to working with the General
Assembly to enact pro-life initiatives and
policies.
Governor Branstad and Lt. Governor
Reynolds are committed to creating a state-
run family planning program that increases
options for women seeking family planning
services while ending taxpayer funding of
abortion providers. The state-run family
planning program will disallow abortion
providers from reimbursement. There are
over 210 health care providers across Iowa
including federally qualified health clinics
and rural health clinics that can provide high
quality health care to women (Source: CMS,
HRSA). Governor Branstad and Lt.
Governor Reynolds remain dedicated to
ensuring no state taxpayer funds reimburse
abortion providers while maintaining high
quality, accessible health care services.
32
Feeding the World and Protecting Our Resources
Modernize Iowa’s Agriculture
Infrastructure
Governor Branstad and Lt. Governor
Reynolds recognize the important role
agriculture plays, not only in our economy
but also in terms of our proud Iowa heritage.
In order to continue to feed the world and at
the same time promote protection of our rich
soil and waterways we must modernize
Iowa’s agricultural infrastructure. To
accomplish this, the Governor and Lt.
Governor believe it is critical to find a long-
term, dedicated, growing source of revenue
to implement the Iowa Nutrient Reduction
Strategy.
Through a broad coalition of more than
100 organizations, Iowa has implemented a
science-based approach to improving water
quality which identifies projects that reduce
the amount of nutrients entering our
waterways. These efforts include working
with landowners in both rural and urban
settings and partnering with farmers,
municipalities, academia and businesses in
a collaborative fashion to promote a culture
of conservation.
Last session, the House passed House
File 2451, which provided for long-term,
dedicated sources of revenue for
implementation of projects outlined in the
Nutrient Reduction Strategy through the
year 2029. This year, the Governor and Lt.
Governor are proposing a similar version of
House File 2451 as a means to modernize
Iowa’s agriculture and promote cleaner
water.
Adopting this strategy will mean more
jobs for rural Iowa, a modernized
agricultural infrastructure in the 21st
century, and additional resources for
municipalities to improve drinking water.
The overall result will be cleaner water for
all Iowans.
Trade
With an abundance of rich soil and 30.8
million acres of farmland, the world looks to
Iowa as the leader in feeding the global
population. International markets depend
on safe and reliable agricultural products
from Iowa farmers and businesses.
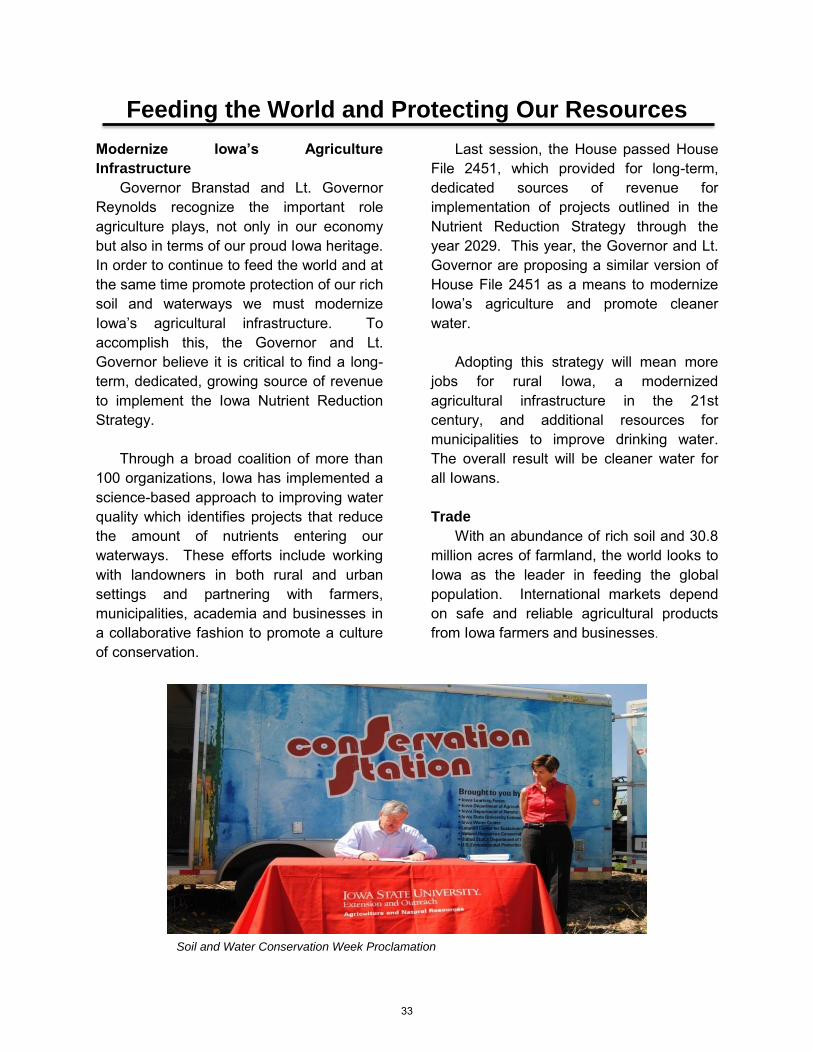
Soil and Water Conservation Week Proclamation
33

With these facts in mind, Governor Branstad
and Lt. Governor Reynolds recognize how
critically important it is to remain pro-active
in seeking to expand trade opportunities.
According to the U.S. International
Trade Administration, 107,000 Iowa jobs are
supported by exports. According to Iowa
Farm Bureau, each Iowa farmer produces
enough food to feed about 168 people
worldwide. To put that number in
perspective, in 1970, that same farmer
produced enough food for about 73 people.
Iowa’s soybean exports to China also help
tell the story of Iowa’s leadership role in
agriculture, with almost one in every three
rows of Iowa soybeans being shipped there.
To build upon these successes,
Governor Branstad and Lt. Governor
Reynolds remain committed to promoting
Iowa’s agricultural products around the
world.
Supporting a Robust Renewable Fuels
Standard
Governor Branstad and Lt. Governor
Reynolds will continue to call for a strong
and robust Renewable Fuels Standard
(RFS). The Governor and Lt. Governor
believe this energy policy is critical for
injecting competition and choice for
consumers in the transportation fuels
market. The RFS has laid a foundation to
diversify our nation’s energy portfolio,
reduce transportation emissions, create
rewarding careers and offer lower cost
choices for consumers.
In addition to their ongoing commitment
for a robust RFS, the Governor and Lt.
Governor will again be recommending $3
million in Fiscal Year 2018 funding for the
Renewable Fuels Infrastructure Program
(RFIP) from the Rebuild Iowa Infrastructure
Fund. The RFIP is a successful program
assisting retail operators in their conversion
of equipment to allow for the expanded use
of renewable fuels.
34

Safety and Efficiency for Iowa’s Drivers and Roads
After several years of progress toward
the goal of making Iowa roads safer, the
state experienced a troubling spike in the
number of road accidents and fatalities in
2016. There was a 27% increase in the
number of deaths on Iowa’s roads
compared to 2015.
Highway safety is a top priority of
Governor Branstad and Lt. Governor
Reynolds. In February 2016, the Governor
called upon the Department of Public Safety
(DPS) to assemble a task force to examine
the issues of impaired as well as distracted
drivers on Iowa's roadways. This group,
comprised of dedicated law enforcement
and criminal justice professionals and
stakeholders from around the state, met to
develop recommendations. These
recommendations include adopting best
practices and new legislation to significantly
decrease the number of deaths and
accidents that occur on Iowa’s roads.
Governor Branstad recommends
legislation to drastically reduce the amount
of driver distractions on Iowa’s roadways.
When drivers have their attention diverted
by text messages, e-mails or the Internet
they are significantly more dangerous to
themselves, their passengers and to other
motorists on the road.
It is time for Iowa’s laws to catch up with
the proliferation of mobile devices in
vehicles and to send the message to drivers
in Iowa: Eyes on the road when behind the
wheel. Restricting the use of mobile devices
while driving will result in fewer distractions
and more motorists making it home safely.
Source: ATT’s It Can Wait Survey
Additional steps can be taken to
increase the safety of Iowans on the roads.
One of these steps includes instituting more
appropriate penalties for those that choose
to put the lives and safety of others at risk
when they drive.
The state can also implement programs
to curb the number of repeat OWI offenders,
provide better protections for bicyclists on
Iowa roads, and update penalties for
dangerous driving behaviors. In addition to
these actions, Iowa will continue to remind
drivers that “zero fatalities” should be the
goal of every motorist when they get behind
the wheel. This is being accomplished
through the “Zero Fatalities” public
awareness efforts of the DPS, including the
Governor’s Traffic Safety Bureau, and the
Department of Transportation (DOT).
35
The combination of these strategies
provides the opportunity to make Iowa
roads safer for the traveling public.
A Radio System for All of Iowa’s First
Responders
Since 2004, Iowa has lagged behind
other states in providing public safety
responders a radio system that can deliver
adequate communication coverage and
reliability, known as interoperability. This
system is designed to provide critical
communication coverage during disasters
and planned events where multiple
agencies are responding. In Fiscal Year
2015, the Iowa Legislature appropriated $4
million to begin construction of the statewide
system that will be the backbone for
interoperable and operable emergency
radios in Iowa. In Fiscal Year 2016, the
legislature approved important language
allowing the state to enter into a long-term
contract for the system. The Iowa
Statewide Interoperable Communications
System (ISICS) holds the promise of
delivering seamless and reliable
communications for all of Iowa’s law
enforcement personnel and first responders.
Tower construction is expected to be
completed in calendar year 2017 with the
networking buildout concluding in mid-2018.
Completion of this network will allow public
safety personnel to contact, by radio, first
responders anywhere in the state.
Construction of the ISICS will benefit
first responders using radio communication
for daily duties, planned events and
responding to emergencies. This network
will also result in millions of dollars of
savings for local taxpayers whose elected
officials recognize the economies of scale
that the statewide system offers. Because
the radio system will be available in every
Iowa county for mobile coverage at no cost,
there are major savings available to
counties that choose to use the ISICS to
meet their first responders’ communication
needs. Building out the remainder of the
platform will work to ensure the safety of
Iowans.
Transportation: Moving Forward
The strategic mission of the Iowa
Department of Transportation is safe
mobility: “Getting you there safely,
efficiently, and conveniently.” This mission
is delivered through strategies that align
with the goal of being smarter, simpler and
customer driven. In the past six years, DOT
has made major strides towards its mission
and vision through various achievements in
road safety engineering, cost-saving
measures and citizen convenience features.
Moving forward, DOT will continue to be
36

diligent stewards of the road use tax fund.
They will also continue to work with local
governments as well as private contractors
to develop a transportation system to move
Iowa into the future.
DOT continues to leverage emerging
technologies to achieve both innovations
and cost savings. Examples include:
Renewal of drivers’ licenses via Internet-
connected devices,
Electronic vehicle registrations,
“Smart” weigh stations,
Online voter registration through
partnership with the Secretary of State’s
Office, and
High definition mapping for future
autonomous vehicle technology.
In 2017 and beyond, DOT will work with
the Transportation Commission to invest
road use dollars in projects that will result in
safer roads. DOT will also continue to
prioritize efficient management of its
physical footprint throughout the state by
streamlining services, consolidating
resources and continuously improving
operations.
37

Open Government
Governor Branstad and Lt. Governor
Reynolds are committed to honest and open
government. Their desire for transparency
supports the enactment of several initiatives
to ensure that Iowa government is truly
open.
Governor Branstad and Lt. Governor
Reynolds continue to hold a weekly news
conference that provides members of the
media unprecedented access and a regular
opportunity to ask questions on any subject.
They also hold annual budget hearings
open to the public and the media in order to
ensure Iowans know how their government
operates. Additionally, since taking office in
2011, both the Governor and Lt. Governor
have made annual visits to all 99 Iowa
counties, and Lt. Governor Reynolds will do
so again in 2017.
Shortly after the Branstad-Reynolds
Administration took office in 2011, the Office
of the Governor launched a transparency
website. All open records requests are
posted on the website in the Open Records
Transparency section at the beginning of
each month. The transparency website
posts all open records requests received by
the Governor’s Office and includes the
information requested, the number of days it
took to complete the request, and the cost
to the requestor, if any. From January 2011
to December 2016, 242 open records
requests were made and responded to by
the Office of the Governor.
In June of this past year, Governor
Branstad appointed Keith Luchtel, the
former executive director of the Iowa Public
Information Board and recipient of the Iowa
Newspaper Association’s Distinguished
Service Award, as special advisor for
government transparency. The role of
special advisor had been held by Bill
Monroe, who served from February 2011
until his retirement last June. Meetings
between the Governor and special advisor
occur monthly to discuss ongoing issues
and ensure that the administration remains
on the cutting edge of open government
initiatives.
Transparently Provide the Rationale
Regarding Discharged Employees
In 2014, the Iowa House passed, with
bipartisan support, House File 2463 which
would make public the explanation of why a
public employee was discharged. To
encourage even greater transparency at all
levels of government, Governor Branstad
and Lt. Governor Reynolds will introduce
legislation that will make the documented
reasons and rationale for the discharge,
resignation in lieu of termination or
demotion a public record.
Continued Support of the Iowa Public
Information Board
In 2012, Governor Branstad signed one
of his priorities into law, Senate File 430,
October 31, 2016 Weekly Press Conference
38

creating the Iowa Public Information Board.
This agency is given the authority to enforce
Iowa’s open records and open meetings
laws. The agency will continue to work to
identify areas in these laws that need to be
addressed. The board serves as a one-stop
shop where Iowans, local government
officials and media can go to get quick,
reliable answers.
Transparency Training for Keepers of
Public Records
Many open meetings and open records
violations occur due to a lack of knowledge
and inadequate training of elected officials
and government employees. For that
reason, Governor Branstad and Lt.
Governor Reynolds propose that the Iowa
Public Information Board partner with key
stakeholders to provide training for public
officials and employees in all levels of
government.
Fiscal Transparency and Open Data
Under the leadership of Governor
Branstad and Lt. Governor Reynolds, Iowa
state government continues to expand and
improve transparency for budget, financial,
tax and performance data. The Department
of Management maintains and continuously
improves the data.iowa.gov website, which
provides public access to comprehensive
information in these areas. The amount of
information available on the website
increased over 94% from last year. The
data.iowa.gov website has also seen a
nearly 42% increase in the number of
individuals accessing it from last year.
The data.iowa.gov website remains one
of the leading state government financial
transparency websites in the nation in 2016
as rated by the U.S. Public Information
Research Group (PIRG). PIRG’s “Following
the Money 2016” report gave Iowa an A-,
94.5 out of 100. It is complemented by
checkbook.iowa.gov, launched in 2015,
which provides citizens an easy way to drill
into over 6.22 million financial transactions
recorded in the state’s central accounting
system from July 1, 2013 through the
current month.
Top 10 States in Providing Online Access to Government Spending Data
State Grade Score Ohio A+ 100 Michigan A+ 100 Indiana A+ 100 Oregon A+ 100 Connecticut A+ 99 Wisconsin A 97 Louisiana A 96 Florida A 96 Massachusetts A 95.5 Iowa A- 94.5
Source: U.S. Public Interest Research Group, Following the Money 2016
http://www.uspirg.org/reports/usp/following-money-2016-0
39

THIS PAGE INTENTIONALLY LEFT BLANK
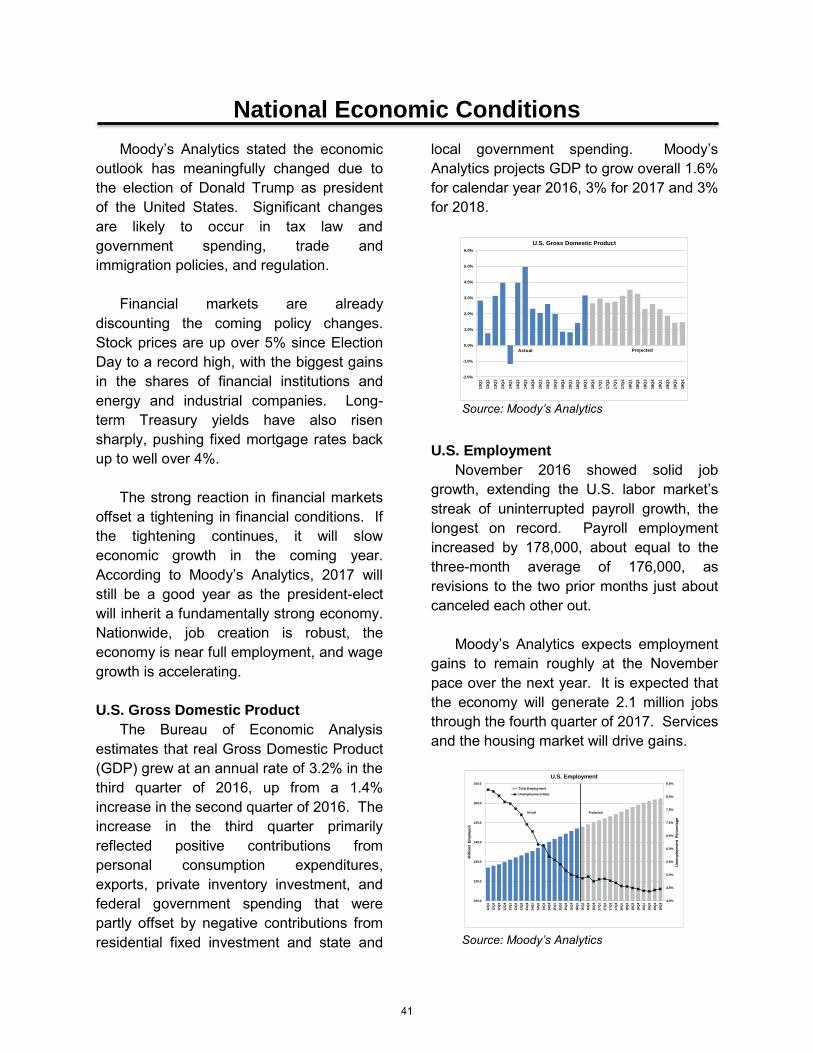
National Economic Conditions
Moody’s Analytics stated the economic
outlook has meaningfully changed due to
the election of Donald Trump as president
of the United States. Significant changes
are likely to occur in tax law and
government spending, trade and
immigration policies, and regulation.
Financial markets are already
discounting the coming policy changes.
Stock prices are up over 5% since Election
Day to a record high, with the biggest gains
in the shares of financial institutions and
energy and industrial companies. Long-
term Treasury yields have also risen
sharply, pushing fixed mortgage rates back
up to well over 4%.
The strong reaction in financial markets
offset a tightening in financial conditions. If
the tightening continues, it will slow
economic growth in the coming year.
According to Moody’s Analytics, 2017 will
still be a good year as the president-elect
will inherit a fundamentally strong economy.
Nationwide, job creation is robust, the
economy is near full employment, and wage
growth is accelerating.
U.S. Gross Domestic Product
The Bureau of Economic Analysis
estimates that real Gross Domestic Product
(GDP) grew at an annual rate of 3.2% in the
third quarter of 2016, up from a 1.4%
increase in the second quarter of 2016. The
increase in the third quarter primarily
reflected positive contributions from
personal consumption expenditures,
exports, private inventory investment, and
federal government spending that were
partly offset by negative contributions from
residential fixed investment and state and
local government spending. Moody’s
Analytics projects GDP to grow overall 1.6%
for calendar year 2016, 3% for 2017 and 3%
for 2018.
U.S. Employment
November 2016 showed solid job
growth, extending the U.S. labor market’s
streak of uninterrupted payroll growth, the
longest on record. Payroll employment
increased by 178,000, about equal to the
three-month average of 176,000, as
revisions to the two prior months just about
canceled each other out.
Moody’s Analytics expects employment
gains to remain roughly at the November
pace over the next year. It is expected that
the economy will generate 2.1 million jobs
through the fourth quarter of 2017. Services
and the housing market will drive gains.
-2.0%
-1.0%
0.0%
1.0%
2.0%
3.0%
4.0%
5.0%
6.0%
13Q
1
13Q
2
13Q
3
13Q
4
14Q
1
14Q
2
14Q
3
14Q
4
15Q
1
15Q
2
15Q
3
15Q
4
16Q
1
16Q
2
16Q
3
16Q
4
17Q
1
17Q
2
17Q
3
17Q
4
18Q
1
18Q
2
18Q
3
18Q
4
19Q
1
19Q
2
19Q
3
19Q
4
U.S. Gross Domestic Product
Actual Projected
4.0%
4.5%
5.0%
5.5%
6.0%
6.5%
7.0%
7.5%
8.0%
8.5%
125.0
130.0
135.0
140.0
145.0
150.0
155.0
12
Q1
12
Q2
12
Q3
12
Q4
13
Q1
13
Q2
13
Q3
13
Q4
14
Q1
14
Q2
14
Q3
14
Q4
15
Q1
15
Q2
15
Q3
15
Q4
16
Q1
16
Q2
16
Q3
16
Q4
17
Q1
17
Q2
17
Q3
17
Q4
18
Q1
18
Q2
18
Q3
18
Q4
19
Q1
19
Q2
19
Q3
19
Q4
Un
em
plo
ym
en
t P
erc
en
tag
e
Millio
ns E
mp
loyed
U.S. Employment
Total Employment
Unemployment Rate
Actual Projected
Source: Moody’s Analytics
Source: Moody’s Analytics
41
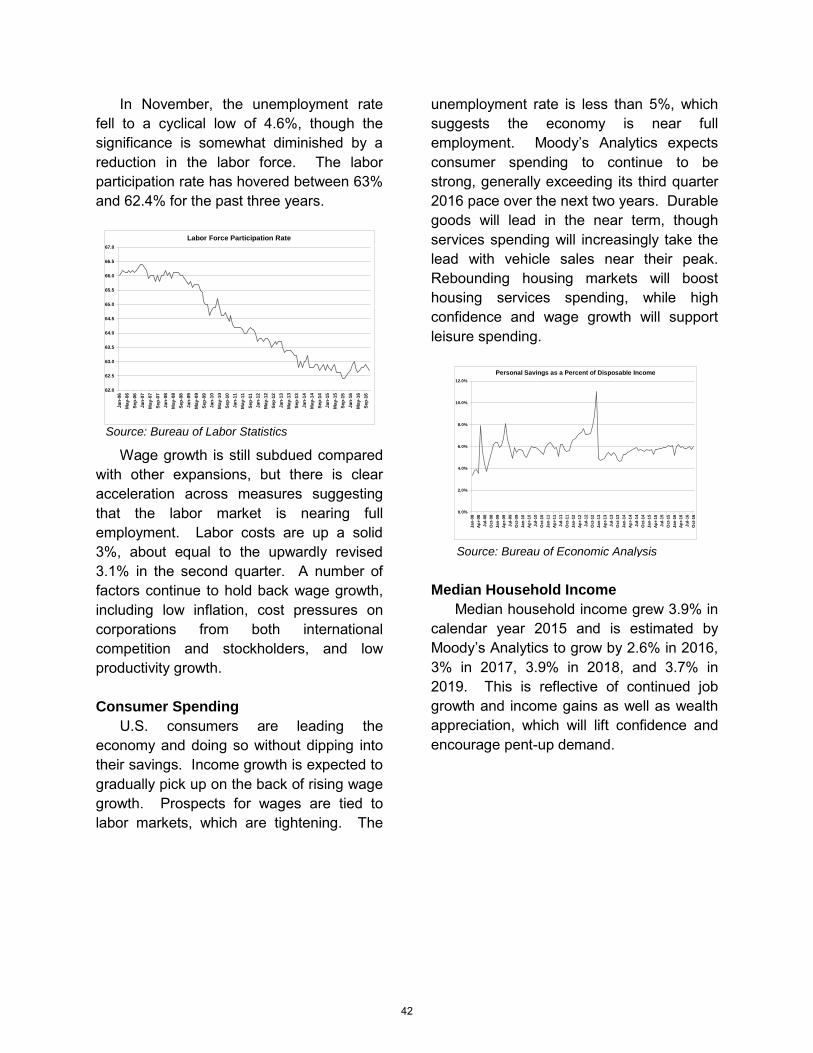
In November, the unemployment rate
fell to a cyclical low of 4.6%, though the
significance is somewhat diminished by a
reduction in the labor force. The labor
participation rate has hovered between 63%
and 62.4% for the past three years.
Wage growth is still subdued compared
with other expansions, but there is clear
acceleration across measures suggesting
that the labor market is nearing full
employment. Labor costs are up a solid
3%, about equal to the upwardly revised
3.1% in the second quarter. A number of
factors continue to hold back wage growth,
including low inflation, cost pressures on
corporations from both international
competition and stockholders, and low
productivity growth.
Consumer Spending
U.S. consumers are leading the
economy and doing so without dipping into
their savings. Income growth is expected to
gradually pick up on the back of rising wage
growth. Prospects for wages are tied to
labor markets, which are tightening. The
unemployment rate is less than 5%, which
suggests the economy is near full
employment. Moody’s Analytics expects
consumer spending to continue to be
strong, generally exceeding its third quarter
2016 pace over the next two years. Durable
goods will lead in the near term, though
services spending will increasingly take the
lead with vehicle sales near their peak.
Rebounding housing markets will boost
housing services spending, while high
confidence and wage growth will support
leisure spending.
Median Household Income
Median household income grew 3.9% in
calendar year 2015 and is estimated by
Moody’s Analytics to grow by 2.6% in 2016,
3% in 2017, 3.9% in 2018, and 3.7% in
2019. This is reflective of continued job
growth and income gains as well as wealth
appreciation, which will lift confidence and
encourage pent-up demand.
62.0
62.5
63.0
63.5
64.0
64.5
65.0
65.5
66.0
66.5
67.0
Jan
-06
May-0
6
Sep
-06
Jan
-07
May-0
7
Sep
-07
Jan
-08
May-0
8
Sep
-08
Jan
-09
May-0
9
Sep
-09
Jan
-10
May-1
0
Sep
-10
Jan
-11
May-1
1
Sep
-11
Jan
-12
May-1
2
Sep
-12
Jan
-13
May-1
3
Sep
-13
Jan
-14
May-1
4
Sep
-14
Jan
-15
May-1
5
Sep
-15
Jan
-16
May-1
6
Sep
-16
Labor Force Participation Rate
0.0%
2.0%
4.0%
6.0%
8.0%
10.0%
12.0%
Jan
-08
Ap
r-08
Ju
l-08
Oct-
08
Jan
-09
Ap
r-09
Ju
l-09
Oct-
09
Jan
-10
Ap
r-10
Ju
l-10
Oct-
10
Jan
-11
Ap
r-11
Ju
l-11
Oct-
11
Jan
-12
Ap
r-12
Ju
l-12
Oct-
12
Jan
-13
Ap
r-13
Ju
l-13
Oct-
13
Jan
-14
Ap
r-14
Ju
l-14
Oct-
14
Jan
-15
Ap
r-15
Ju
l-15
Oct-
15
Jan
-16
Ap
r-16
Ju
l-16
Oct-
16
Personal Savings as a Percent of Disposable Income
Source: Bureau of Economic Analysis
Source: Bureau of Labor Statistics
42

Iowa Economic Conditions
Iowa’s labor market performance has
been mixed. Iowa’s unemployment rate fell
to 3.8% in November 2016, down from 4.1%
in October but higher than the 3.5% from
one year ago. The number of unemployed
Iowans decreased to 65,000 in November
from 70,400 in October, but the current
number is 5.3% higher than the level one
year ago. However, while the number of
working Iowans decreased in November
from October by 200, it is 10,600 higher
than one year ago.
Iowa’s economy is supported by a
diverse mixture of industry, agriculture and
services. This past year, agriculture
continued to be at the top of the news with
low commodity prices but record crop
yields.
Iowa Gross Domestic Product
For 2015, Gross Domestic Product
(GDP) for Iowa increased 0.8%, down from
a revised 2.8% for 2014. The United States’
average growth for 2015 was 2.4%. In
2015, 21.8% of the state’s GDP was in
finance and insurance, down from 23.1% in
2005. Manufacturing was 18.9%, down
from 19.7%. With the growth in renewable
fuels processing and higher grain
production, agriculture’s share of GDP has
grown from 3.9% in 2005 to 5.4% in 2015.
Personal Income
Revised personal income for the nation,
as reported by the Bureau of Economic
Analysis, increased 4.5% during 2015.
Iowa’s personal income rose 3.8%, which
ranked Iowa 30th in growth nationwide. For
the third quarter 2016, Iowa’s personal
income rose 1.1%, which ranked Iowa 20th
in the nation for growth.
-1.5% -1.0% -0.5% 0.0% 0.5% 1.0% 1.5%
Finance, insurance, real estate, etc.
Information
Manufacturing
Retail Trade
Utilities
Transportion and warehousing
Other Services
Mining
Government
Arts, entertainment, etc.
Construction
Educational services, etc.
Wholesale Trade
Professional and business services
Agriculture
Change in Share of State GDP 2005 to 2015
Agriculture, 5.4%
Mining, 0.2%
Utilities, 1.5%
Construction, 4.5%
Manufacturing,
18.9%
Wholesale Trade,
5.8%
Retail Trade, 5.4%
Transportion and
warehousing, 3.4%Information, 2.4%
Finance,
insurance, real estate, etc., 21.8%
Professional and
business services,
6.5%
Educational
services, etc., 7.7%
Arts,
entertainment, etc.,
2.9%
Other Services,
2.1%
Government,
11.6%
Share of Iowa GDP 2015
Source: Bureau of Economic Analysis
Source: Bureau of Economic Analysis
43

Employment
Iowa’s unemployment rate has
historically been below the national average
by up to 3.6%. As the national average has
dropped, the difference between the two
rates has narrowed, especially over the past
year. As of November 2016, the state
unemployment rate stood at 3.8% and the
national unemployment rate was 4.6%.
Agriculture
The Federal Reserve Bank of Chicago,
in its November 2016 public release,
reported that farmland values for the
Seventh Federal Reserve District (Chicago)
decreased by 3%. Farmland values in Iowa
decreased 5% for the period October 1,
2015 to October 1, 2016. A majority of the
survey respondents projected a drop in the
District’s farmland values in the final quarter
of 2016 while only 1% anticipated an
increase. Additionally, respondents
forecasted weaker demand to acquire
farmland this fall and winter compared with
a year ago, particularly among farmers but
also among nonfarm investors. Yet, a lack
of available properties for sale may be
playing a role in keeping farmland values
from dropping faster since only 16% of
responding bankers predicted an increase
in the volume of farmland transfers relative
to the fall and winter a year ago and 42%
predicted a decrease.
The November 2016 update from the
United States Department of Agriculture
(USDA) found that, if realized, both corn
and soybean crops are forecast to be a
record high. The national corn yield was
raised to 175.3 bushels per acre, up 1.9
bushels from October and up 6.9 bushels
from 2015. Total forecast for corn
production for 2016 is at 15.2 billion
bushels, up 1% from October and up 12%
from last year. The national soybean yield
forecast in November was raised to 52.5
bushels per acre, up 1.1 bushels from
October and 4.5 bushels from 2015. Total
forecast for soybean production for 2016 is
at 4.36 billion bushels, up 2% from October
and 11% from last year.
For Iowa, the corn production is forecast
at 2.69 billion bushels in November. If
realized, production would be a record high,
surpassing last year’s record of 2.51 billion
bushels. Corn yield is expected to average
199 bushels per acre, up 1 bushel from
October and 7 bushels per acre higher than
last year. If realized, yield would set a new
record high for a second consecutive year.
As reported by the USDA, the average
price received by farmers in Iowa for corn
$20
$40
$60
$80
$100
$120
$140In
Bil
lio
ns
Iowa Personal Income
3.0%
4.0%
5.0%
6.0%
7.0%
8.0%
9.0%
10.0%
Ja
n-1
0
Mar-
10
May-1
0
Ju
l-10
Sep
-10
No
v-1
0
Ja
n-1
1
Mar-
11
May-1
1
Ju
l-11
Sep
-11
No
v-1
1
Ja
n-1
2
Mar-
12
May-1
2
Ju
l-12
Sep
-12
No
v-1
2
Ja
n-1
3
Mar-
13
May-1
3
Ju
l-13
Sep
-13
No
v-1
3
Ja
n-1
4
Mar-
14
May-1
4
Ju
l-14
Sep
-14
No
v-1
4
Ja
n-1
5
Mar-
15
May-1
5
Ju
l-15
Sep
-15
No
v-1
5
Ja
n-1
6
Mar-
16
May-1
6
Ju
l-16
Sep
-16
No
v-1
6
Unemployment Rates
U.S.
Iowa
Source: Bureau of Economic Analysis
Source: Iowa Workforce Development, Bureau of
Labor Analysis
44

during October 2016 was $3.30 per bushel.
This was up $0.24 from the September
price but $0.28 below October 2015.
Soybean production is forecast at 561
million bushels for Iowa. If realized, this will
be the largest crop on record, 6.8 million
bushels above last year’s record high. The
November yield forecast is a record-high
59.0 bushels per acre, 2.5 bushels more
than the previous record set last year.
The average price received by farmers
in Iowa for soybeans was $9.22 per bushel.
This was $0.26 less than the September
price but $0.53 above the October 2015
price.
Iowa Leading Indicators
The Iowa Department of Revenue
produces a monthly index based on
economic indicators. The Iowa Leading
Indicators Index (ILII) was created as a tool
to predict turn points in Iowa employment.
The ILII is derived from seven Iowa-specific
economic indicators and one national
indicator. The Department designed the ILII
to forecast the likely future direction of
economic activity in Iowa. The techniques
used to build the ILII follow those used by
The Conference Board to construct the
national leading indicators index.
Movement in the ILII for only one month
does not produce a clear signal; rather it is
necessary to consider the direction of the
index over several consecutive months.
1,700
1,900
2,100
2,300
2,500
2,700
2,900
2005
2006
2007
2008
2009
2010
2011
2012
2013
2014
2015
2016
Millio
n b
us
he
ls
Iowa Corn Production
300
350
400
450
500
550
600
2005
2006
2007
2008
2009
2010
2011
2012
2013
2014
2015
2016
Millio
n b
us
he
ls
Iowa Soybean Production
$0.00
$1.00
$2.00
$3.00
$4.00
$5.00
$6.00
$7.00
$8.00
$9.00
Jan
-06
May-0
6
Sep
-06
Jan
-07
May-0
7
Sep
-07
Jan
-08
May-0
8
Sep
-08
Jan
-09
May-0
9
Sep
-09
Jan
-10
May-1
0
Sep
-10
Jan
-11
May-1
1
Sep
-11
Jan
-12
May-1
2
Sep
-12
Jan
-13
May-1
3
Sep
-13
Jan
-14
May-1
4
Sep
-14
Jan
-15
May-1
5
Sep
-15
Jan
-16
May-1
6
Sep
-16
Monthly Iowa Corn PricesAverage Dollars per Bushel
$0.00
$2.00
$4.00
$6.00
$8.00
$10.00
$12.00
$14.00
$16.00
$18.00
Jan
-06
May-0
6
Sep
-06
Jan
-07
May-0
7
Sep
-07
Jan
-08
May-0
8
Sep
-08
Jan
-09
May-0
9
Sep
-09
Jan
-10
May-1
0
Sep
-10
Jan
-11
May-1
1
Sep
-11
Jan
-12
May-1
2
Sep
-12
Jan
-13
May-1
3
Sep
-13
Jan
-14
May-1
4
Sep
-14
Jan
-15
May-1
5
Sep
-15
Jan
-16
May-1
6
Sep
-16
Monthly Iowa Soybean PricesAverage Dollars per Bushel
Source: United States Department of Agriculture
Source: United States Department of Agriculture
Source: United States Department of Agriculture
Source: United States Department of Agriculture
45

The ILII increased to 105.6 in October
2016 (100=1999), up from 105.4 in
September. The Iowa non-farm employment
coincident index recorded a 0.09% rise in
October, which extends the streak of
employment gains into the sixth consecutive
year.
During the six-month span through
October, the ILII increased 0.3% (an
annualized rate of 0.5%). The six-month
diffusion index increased to 50, caused by
the agriculture futures profit index
experiencing an increase of greater than
0.05% over the last half of the year.
In October, five of the eight ILII
components contributed positively. The
positive contributors were diesel fuel
consumption, residential building permits,
the national yield spread, average weekly
unemployment claims (inverted), and the
agriculture futures profit index. Average
manufacturing hours, the Iowa stock market
index, and the new orders index were the
three components that contributed to the
index negatively.
46

Budgeting Policies
Basis of Budgeting Iowa’s budget is prepared on a modified
cash basis that is used to establish and
ensure compliance with enacted budgets
according to applicable statutes and
administrative procedures. For each fund,
except for the General Fund, the total
amount appropriated or budgeted to be
spent may not exceed the fiscal year’s
estimated revenues available plus the
unappropriated surplus fund balance (or
less a deficit) of the preceding year. The
fiscal year begins July 1 and ends on June
30.
For budgeting purposes, with the
modified cash basis of budgeting, tax
receipts are recorded at the time of deposit
during the fiscal year. During the accrual
period tax receipts are determined when
earned and adjusted back to the appropriate
fiscal year. All other receipts are deposited
to the appropriate fiscal year in which the
revenues were earned if received within 60
days after the end of the fiscal year; if
received after those 60 days, they are
recorded in the fiscal year received. For
expenditures, statute requires that no
payment for goods or services may be
charged subsequent to the last day of the
fiscal year unless the goods or services are
received on or before the last day of the
fiscal year. The only exceptions allowed are
repair projects, purchases of specialized
equipment and furnishings, and other
contracts for services and capital
expenditures for the purchase of land, or
erection of buildings or new construction or
remodeling which were committed and in
progress prior to the end of the fiscal year.
In other words, except for the previously
mentioned exceptions, the State must have
received the goods or services on or before
June 30, creating an actual liability.
Relationship to the Generally Accepted Accounting Principles (GAAP)
Under GAAP, the General Fund is used
to account for all financial resources except
those required to be accounted for in
another fund. This differs materially from
the Budget Basis General Fund, which is
defined primarily by legislation. As a result,
approximately 400 funds are classified as
part of the General Fund under GAAP; only
one is included in the Budget Basis General
Fund. Further information on the
measurement focus and basis of accounting
for funds reported in the State’s
Comprehensive Financial Report is
discussed in Note 1 to the Financial
Statements of that report.
Budget Control The annual budget process serves as
the foundation for the State’s financial
planning and control. Each year
departments are required to submit budget
requests to the Department of Management
(DOM) by October 1 for the subsequent
fiscal year. The State’s budget is prepared
by DOM for the Governor, along with the
proposed appropriation bills for the
subsequent fiscal year, and is required to be
submitted to the General Assembly by
February 1. The General Assembly
approves the appropriation bills which
establish spending authority for the
upcoming year. The Governor has the
authority to approve, veto or line-item veto
appropriation bills as they are presented to
him.
Departments may request revisions to
allotments, appropriation transfers, or
47

supplemental appropriations. The DOM
approves revised allotments within an
appropriation, subject to the Governor’s
review. The Governor and the Department
of Management approve all appropriation
transfers. The Governor and the General
Assembly act on supplemental
appropriation bills in a manner similar to
original appropriations. Appropriations
lapse at fiscal year-end, and unobligated
balances revert to the state treasury unless
otherwise provided.
All claims presented for payment must
be approved by the appropriate department.
The expenditure must be for a purpose
intended by law, and a sufficient existing
and unexpended appropriation balance
must be available. Budgetary controls are
incorporated into state accounting systems.
The annual budget of the State is
established through separate appropriations
to individual departments for specific
purposes, special outlays and/or operating
expenditures. Budget control is essentially
maintained at the department level except
for certain grant and aid programs where
control is maintained at the program level.
General Fund For budgetary purposes, the General
Fund of the State receives those revenues
of the State not required to be deposited in
other funds. General Fund revenues are
obtained from the payment of state taxes
and from federal and non-tax revenue
sources. Major tax revenues to the General
Fund include the individual income tax,
corporate income tax, sales/use tax, and
certain other taxes and revenue.
For budgetary purposes, the State has
classified General Fund revenues as either
“appropriable” or “appropriated.”
Appropriable revenues consist of all
General Fund revenues other than
appropriated revenues. Appropriated
revenues consist of fees and charges
together with support payments and
reimbursements (including federal funds).
Because these revenues are routinely
credited to the General Fund appropriation
for the operation of the applicable
department rather than being appropriable
for other General Fund expenditures, they
are referred to as “appropriated.”
General Fund Expenditure Limitation The Code of Iowa, section 8.54,
establishes a State General Fund
expenditure limitation of 99% of the
adjusted appropriable revenue estimate.
The adjusted revenue estimate is the
appropriable revenue estimate for the
General Fund following fiscal year, as
determined by the Revenue Estimating
Conference. Adjustments may be made by
adding any new revenues which may be
considered to be eligible for deposit into the
General Fund subtracted by any revenues
which are considered not eligible for deposit
into the General Fund that are determined
to happen after the Revenue Estimating
Conference meets. “New revenues” means
moneys which are estimated to be received
by the State due to increased tax rates or
changes in tax structures and increased or
newly created fees. For expenditure
limitation purposes, only 95% of the new
revenues may be added. Reductions to the
General Fund estimate due to tax rate or
structure changes and reduced or
eliminated fees are reduced at 100% of the
amount.
Reserve Funds The Economic Emergency Fund was
created in Iowa Code section 8.55. The
Economic Emergency Fund is separate
from the General Fund of the State and the
48

balance in this fund is not considered part of
the General Fund. The moneys in the
Economic Emergency Fund do not revert to
the General Fund, unless and to the extent
that it exceeds the maximum balance. The
maximum balance of the Economic
Emergency Fund is the amount equal to
2.5% of the adjusted revenue estimate for
the fiscal year. If the amount of moneys in
the Economic Emergency Fund is greater
than the maximum balance, the excess is
required to be transferred to the General
Fund. The moneys in this fund may be
appropriated by the General Assembly for
emergency expenditures. However, starting
in Fiscal Year 2012, there was a standing
appropriation from the Economic
Emergency Fund to the Executive Council
to pay for performance of duty claims
approved by the Executive Council. The
balance in the Economic Emergency Fund
may be used in determining the cash
position of the General Fund of the State for
payment of state obligations. Interest or
earnings on moneys deposited in the fund
are credited to the Rebuild Iowa
Infrastructure Fund.
The Cash Reserve Fund was created in
Iowa Code section 8.56. This fund is
separate from the General Fund of the State
and the balance in the fund is not
considered part of the General Fund. The
moneys in the Cash Reserve Fund cannot
be transferred, used, obligated,
appropriated or otherwise encumbered
except as provided under Iowa Code
section 8.56. Interest or earnings on
moneys deposited in the Cash Reserve
Fund are credited to the Rebuild Iowa
Infrastructure Fund. The balance in the
Cash Reserve Fund may be used in
determining the cash position of the General
Fund of the State for payment of state
obligations. The maximum balance of the
fund is the amount equal to 7.5% of the
adjusted revenue estimate for the fiscal
year. If the amount of moneys in the Cash
Reserve Fund is greater than the maximum
balance, the excess is required to be
transferred first to the GAAP Retirement
Account and, if not needed in this account,
then transferred to the Economic
Emergency Fund.
Significant Budget Policies When Governor Branstad entered office
in 2011, he was faced with an
unprecedented budget gap. According to
the Auditor of State, over $638 million of
spending in Fiscal Year 2011 was from one-
time funding sources. Governor Branstad
made it a priority to stop these practices and
to bring stability to the budget process,
rectifying the damage done to the State’s
finances. Starting with his budget
recommendations for Fiscal Years 2012 and
2013, and working with the Legislature
during the 2011 session, much was
accomplished. The Auditor reported only
$53 million of spending coming from one-
time funding sources in the Fiscal Year
2012 budget.
Governor Branstad is committed to
strong budget and financial policies, making
the budget not only balanced but
sustainable for the long term. These policies
include the following:
Maintaining the Reserve Funds and Keeping them Full
Having reserve funds and keeping them
full is crucial in bringing the budget into
fiscal sustainability. That does not mean
the funds should never be used; they are
clearly in place for emergencies. However,
a balanced approach in using the reserves
is important because full depletion of
reserves in one year without other budget
49
adjustments just recreates the structural
gap that was rectified.
Using One-Time Funding for One-time Purposes
As we have seen, using one-time
funding for ongoing operations creates a
structural gap in the budget. It is important
that one-time funds be identified and used
only for one-time purposes.
Biennial Budgeting Governor Branstad believes strongly
that biennial budgeting is needed to remove
the incremental cost increases that creep
into base budgets simply due to the fact that
the budget is created annually. Biennial
budgeting will also provide additional
funding stability to those entities dependent
on state resources and will help smooth the
highs and lows that can occur with annual
budgeting.
Long-Term Planning A five-year financial plan for state
government allows the Governor and
Legislature to better track the long-term
impacts that taxing and spending decisions
in the subsequent year have on the ability of
the State to balance its budget, meet critical
future needs and avoid budget cliffs for
years. Past practices tended to focus on a
year-to-year approach to balancing the
budget. As a result, little regard was given
to how current decisions impacted future
budgets, created new burdens for taxpayers
or hindered our ability to meet critical future
needs. Governor Branstad is committed to
a forward-looking approach to budgeting to
prevent the pitfalls of a year-to-year
approach.
Budget Process Preparation of the Governor’s budget for
the State of Iowa is the responsibility of the
DOM. Preparation, deliberation and
execution of the budget is a continual
process throughout the year. This process
regularly involves the Legislative and
Executive branches, with occasional
counsel from the Judicial Branch.
The budget process starts when DOM
sends out budget instructions in June/July.
State agencies are required by statute to
submit their budget requests for the
upcoming fiscal year by October 1. From
October through December, DOM works
with other departments’ staff and the
Governor’s Office to review and analyze
department requests. During
November/December, the Governor holds
public budget hearings for departments to
present their budget requests formally to
him. The Governor also holds at least one
public hearing for citizens to voice their
opinions on the upcoming budget.
The Governor is required by law to
submit his budget recommendations to the
Legislature by February 1, along with
appropriation bills. The Legislature passes
appropriation bills during the session (with
most bills being passed during the last week
of the session, usually in April/May) and
sends them to the Governor for signature.
The Governor has the options of signing,
vetoing or item vetoing the bill.
During May/June, departments enter
their spending plans based upon the
enacted appropriations bills. The spending
plans are transferred to the accounting
system and spending is tracked through the
accounting system during the fiscal year. At
the end of the fiscal year, remaining
appropriation balances after the payment of
all appropriate expenditures are reverted to
the original fund.
50

51

General Fund Revenues
The General Fund is primarily
comprised of the state’s major tax revenues
and includes Personal Income Tax, Sales
and Use Tax, and Corporate Income Tax.
For Fiscal Year 2018, these taxes are
estimated to make up approximately 94
percent of gross General Fund revenues.
The remaining 6 percent comes from a
combination of lesser taxes including
Inheritance Tax, Insurance Premium Tax,
and Franchise Tax, along with fees and
other revenue sources. Transfers from
other funds to the General Fund also occur.
Major Revenue Sources
A general description of the three major
sources of General Fund revenues are as
follows:
Personal Income Tax. This tax was
enacted in 1934 and imposed on Iowa
taxable income of individuals and estates
and trusts Taxpayers under 65 years of age
with a net income of less than $9,000
($13,500 married) are generally not required
to pay Iowa income tax or file a tax return.
Taxpayers who are at least 65 years of age
are generally subject to the tax if their
income exceeds $24,000 ($32,000 married).
Social Security benefits and all military
retirement pay are exempt from taxation.
Iowa has a progressive tax structure of 9
rates on individual tax. For tax year 2016,
the tax rate starts at 0.36 percent on the first
$1,554 of taxable income and goes to 8.98
percent on taxable income over $69,930.
Due to the allowance of deduction of federal
taxes, (federal deductibility), most taxpayers
do not pay the top percentage.
Sales and Use Tax. This tax was
enacted in 1934 and imposed on the gross
receipts from the purchase of tangible
personal property and payment for
performing enumerated services sold.
Major exemptions from this tax include food
for home consumption, prescription drugs
and medical devices, motor fuel and motor
vehicles (subject to a special excise/use tax
which is deposited in the Road Use Tax
Fund). Also, machinery and equipment
used on processing and personal property
used in agricultural production and farm
machinery and equipment are exempt from
this tax. A rate of 6 percent is imposed on
taxable transaction. One-sixth of this
amount is transferred from the General
Fund to the Secure an Advanced Vision for
Education (SAVE) fund for distribution to
local school districts for school infrastructure
projects.
Diversion of General Fund Revenues
Over the years, diversion of General
Fund revenues has occurred. This is done
a variety of ways, either through the
allowance of tax credits for specific
purposes or from a direct diversion of
revenue before they are deposited into the
General Fund.
Expected State Tax Credit Claims
Fiscal Years 2017 and 2018 General
Fund revenues, as established by the
Revenue Estimating Conference on
December 12, 2016, include estimates
provided by the Department of Revenue for
numerous tax credits available to taxpayers.
The table below shows the tax credits that
are expected to be claimed against the
State. In some cases, any person or
corporation meeting the eligibility criteria
can claim the credit. In other cases, tax
credits are awarded to individuals or
corporations which meet specific criteria set
52

out in the tax credit. Where there is a “cap”
on the credit, there is a maximum that may
be claimed either in one year, or over a
period of year.
Tax Credit Program FY2016 FY2017 FY2018
Capped Program
DED Awarded Sales Tax Refund (17.0) (18.7) (15.6)
Accelerated Career Education Tax Credit (4.2) (3.9) (3.9)
Agricultural Assets Transfer Tax Credit (3.4) (4.6) (5.0)
Custom Farming Contract Tax Credit - (0.1) (0.2)
Endow Iowa Tax Credit (5.4) (5.1) (5.1)
Enterprise Zone Program (7.5) (4.9) (3.5)
Enterprise Zone Program-Housing Component (9.6) (13.3) (10.1)
High Quality Job Program (24.8) (24.0) (38.6)
Historic Preservation and Cultural and Entertainment District Tax Credit (35.3) (58.1) (56.2)
Redevelopment Tax Credit (2.6) (6.8) (6.9)
Renewable Chemical Proeduction Tax Credit - - -
Renewable Energy Tax Credit (5.3) (9.0) (13.0)
School Tuition Organization Tax Credit (10.9) (11.3) (11.4)
Solar Energy System Tax Credit (3.2) (3.7) (3.9)
Venture Capital Tax Credit-Innovation Fund (2.0) (0.9) (1.9)
Venture Capital Tax Credit-Iowa Fund of Funds (0.9) (1.2) -
Venture Capital Tax Credit-Qualified Bus. or Comm-Seed Capital Fund (1.0) (1.8) (2.1)
Wind Energy Production Tax Credit (0.8) (2.2) (1.7)
Workforce Housing Tax Incentive Program - (6.0) (9.2)
Total Capped Programs (133.9) (175.6) (188.3)
Uncapped Programs
Adoption Tax Credit (0.4) (0.5) (0.9)
Biodiesel Blended Fuel Tax Credit (15.4) (17.8) (17.0)
Charitable Conservation Contribution Tax Credit (0.4) (0.7) (0.7)
Child and Dependent Care Tax Credit (5.7) (6.7) (6.5)
E15 Gasoline Promotion Tax Credit (0.1) (0.4) (0.4)
E85 Gasoline Promotion Tax Credit (1.9) (2.2) (2.5)
Early Childhood Development Tax Credit (0.7) (0.7) (0.7)
Earned Income tax Credit (71.8) (70.9) (71.8)
Ethanol Promotion Tax Credit (1.8) (1.4) (1.1)
Farm to Food Donation Tax Credit - - -
Geothermal Heat Pump Tax Credit (1.6) (2.4) (0.4)
Geothermal Tax Credit - - (1.5)
Iowa Industrial New Job Training Program (260E) (37.5) (42.5) (43.8)
New Capital Investment Program Investment Tax Credit - - -
New Jobs and Income Program Investment Tax Credit - - -
Research Activities Tax Credit (53.8) (56.8) (63.8)
Supplemental Research Activities Tax Credit (7.0) (4.0) (5.6)
Targeted Jobs Tax Credit from Withholding (5.0) (4.9) (5.2)
Tuition and Textbook Tax Credit (15.4) (15.2) (15.3)
Volunteer Firefighter and EMS Tax Credit (1.4) (1.3) (1.3)
Total Uncapped Programs (219.9) (228.4) (238.5)
Tax Credit Program Total (353.8) (404.0) (426.8)
Note: These estimates are based on the Tax Credit Expected Claims Projection published by the Department of Revenue in
December 2016. The table above reflects the tax credits that are likely to be claimed in a given fiscal year based on
previous experience. The projected claims are incorporated in the FY2017 and FY2018 REC estimates.
State Tax Credit Expected Claims Projection($ in millions)
Source: Iowa Department of Revenue
53

Other Revenue Diversions
Programs have been established over
the years which receive a specific diversion
of revenue before they are deposited into
the General Fund. These programs include:
Flood Mitigation Program. Established
in 2012, the program provides funding to
certain governmental entities for flood
mitigation projects. It is estimated that $30
million will go to the fund in FY2017 and
FY2018.
Reinvestment Districts. Established in
2013, the program allows municipalities to
establish reinvestment districts and receive
specified amounts of state sales tax
revenues collected in those districts for use
in undertaking projects in the districts. It is
estimated that $0.6 million in Fiscal Year
2018.
Health Care Trust Fund. Starting in
Fiscal Year 2014, all cigarette and tobacco
taxes are deposited into the Health Care
Trust Fund. This fund is used exclusively
for the Medical Assistance (Medicaid)
program. It is estimated that $219.8 million
in Fiscal Year 2017 and $221.9 million in
Fiscal Year 2018.
Gaming Revenues. As discussed in
another section, gaming revenues are all
diverted for specific purposes and beginning
in Fiscal Year 2014, no gaming revenues
are deposited into the General Fund.
Judicial Revenues. As discussed in
another section, $14.9 million of judicial
revenues are diverted to pay for prison
construction bonds.
Real Estate Transfer Tax. Thirty
percent, up to $3 million, of real estate
transfer tax is deposited into the State
Housing Trust Fund, with 5 percent of the
real estate transfer tax transferred to the
Shelter Assistance Fund. It is estimated
that $3 million in FY2017 will be deposited
into the State Housing Trust Fund and $0.9
million into the Shelter Assistance Fund,
and in Fiscal Year 2018 $3 million to the
State Housing Trust Fund and $0.9 million
to the Shelter Assistance Fund.
54

Capital Budgeting
A capital project is defined by statute as
specific activities which involve construction
of either new facilities or significant, long-
term renewal improvements to existing
facilities. Capital projects may also include
funding for major or routine maintenance or
for equipment or software over $250,000.
Capital projects do not include highway and
right of way projects or airport capital
projects funded by non-state grants, gifts, or
contracts obtained at or through state
universities, if the projects do not require a
commitment of additional state resources
for maintenance, operations or staffing. A
capital project shall not be divided into small
projects in such a manner as to thwart the
intent of this section to provide for the
evaluation of a capital project whose cost
cumulatively equals or exceeds $250,000.
The capital budget presented in this
document, itemized by department, is for
Fiscal Years 2018 and 2019 of the
Governor’s recommendations.
Department of Administrative Services
Major Maintenance-
$4 million in Fiscal Year 2018 and $12.5
million in Fiscal Year 2019 from the
Rebuild Iowa Infrastructure Fund (RIIF)
for major maintenance projects on state
properties. The Governor is also
recommending that the remaining
balance in the Revenue Bonds Capitals
Fund of approximately $3,080,991 be
used by the department for major
maintenance projects starting in Fiscal
Year 2018.
Department of Cultural Affairs
State Historical Building Renovations-
$5 million in both Fiscal Years 2018 and
2019 from RIIF to start the process of
renovating the State Historical Building.
Department of Natural Resources
State Park Infrastructure Renovation-
$3 million in both Fiscal Years 2018 and
2019 from RIIF for State Park major
maintenance projects in the State Park
system.
Lake Dredging and Water Quality-
$9.6 million in both Fiscal Years 2018
and 2019 from RIIF for lake restoration,
dredging, and water quality projects.
Iowa Law Enforcement Academy
New Building-
$5 million in FY2019 from RIIF for
planning, design and construction of
a new building for the Academy.
Department of Public Defense
Facility and Armory Maintenance-
$2 million in both Fiscal Years 2018 and
2019 from RIIF for facility and armory
major maintenance around Iowa.
$2 million in both Fiscal Years 2018 and
2019 from RIIF for armory upgrades
throughout Iowa.
$0.5 million in both Fiscal Years 2018
and 2019 from RIIF for upgrades at
Camp Dodge.
Iowa State Fair
Construction and Remodeling Projects-
$0.5 million in Fiscal Year 2018 and
$4.5 million in Fiscal Year 2019 from
RIIF for construction and remodeling the
northwest events area.
55

Board of Regents
University of Iowa Pharmacy Building
Replacement and Improvements-
$23.3 million in Fiscal Year 2018 and $5
million in Fiscal Year 2019 from RIIF to
complete the replacement and
improvements of the Pharmacy Building.
The total state appropriations will be
$64,300,000 over 5 years, with the
overall cost of the project estimated to
be $96.3 million and the remaining
amount to come from private gifts and
College/University earnings.
Iowa State University Construction of
Biosciences Facilities-
$20.5 million in Fiscal Year 2018 and $3
million in Fiscal Year 2019 from RIIF to
complete the construction and
renovation of facilities used by the
biosciences at ISU. The total state
appropriations will be $50 million over 5
years, with the overall cost of the project
estimated to be $80 million and the
remaining amount to come from private
gifts.
Iowa State University Construction of the
Student Innovation Center-
$7 million in Fiscal Year 2018 and $12
million in Fiscal Year 2019 from RIIF for
the construction of the Student
Innovation Center at ISU. The total
state appropriations will be $40 million
over 5 years, with the overall cost of the
project estimated to be $80 million and
the remaining amount to come from
private gifts.
Department of Transportation
Dubuque Garage Replacement-
$10.8 million in Fiscal Year 2018 from
the Primary Road Fund (PRF) and Road
Use Tax Fund (RUTF) for construction
of a new highway maintenance garage.
Adair Garage Renovations-
$1.478 million in Fiscal Year 2018 from
the PRF for the renovation of the Adair
maintenance garage.
Waterloo Garage Renovations-
$1.79 million in Fiscal Year 2019 from
the PRF for the renovation of the
Waterloo maintenance garage.
56

Bond Summary
Bonds
The Treasurer of State, multiple
authorities, and the Board of Regents have
authority to issue debt. The governor has
specific responsibility to monitor debt of the
state. In order to meet this responsibility,
the Governor has established debt
management goals for the state. The goals
include:
Maintain debt affordability standards
and limit capital borrowing and funds,
Borrow at the lowest possible cost of
funds and adapt to investor demand,
Monitor the state’s outstanding
indebtedness for possible refunding
opportunities, and
Maintain ongoing relationships with
rating agencies to obtain the highest
ratings possible.
Under Iowa’s Constitution, general
obligation bonds over $250,000 cannot be
issued without approval by the voters. The
state does not have any outstanding
general obligation bonds. Debt that is
issued is paid from dedicated revenue
sources and does not constitute a liability
against the state.
Outstanding Bonds
Shown at the end of this section are the
outstanding bonds that have been issued by
the State of Iowa, or related components.
The outstanding principal on the debt at the
end of Fiscal Year 2016 is $5.2 billion.
Outstanding Bonds Supported by State
Revenues
The outstanding debt discussed in this
section includes bonds that the General
Assembly and Governor have authorized
and committed specific revenue sources to
for paying the debt service. The debt
service on the revenue bonds is paid from
these specific, dedicated revenue sources
that would otherwise be available for
appropriation by the General Assembly.
Gaming Revenues
The state has dedicated future gaming
revenues from the taxes and certain fees
collected at the riverboats and casinos to be
deposited into various debt service funds to
repay debt issued for the Vision Iowa and I-
JOBS Programs. Vision Iowa bonds were
issued in 2001 to provide grants or loans to
communities to enhance local recreational,
cultural and entertainment opportunities. I-
JOBS bonds were issued in July 2009 and
October 2010 to finance certain
infrastructure projects and certain grant and
loan programs of the state.
The current allocation of gaming
revenues is as follows:
As seen in the following chart, the
diversion of gaming revenues has grown
since Fiscal Year 2002, impacting the
amount of funds available to go to the
Rebuild Iowa Infrastructure Fund.
Gaming Revenue Overall Allocaton
(in millions)
IJOBS Debt Service 55.0
Federal Subsidy Holdback Fund 3.8
Vision Iowa Debt Service 15.0
Iowa Skilled Worker and Job Creation Fund 66.0
Total Specific Allocations 139.8
(Remaining amounts to Rebuild Iowa Infrastructure Fund.
For FY2018, this is estimated at $152.1 million)
57

Also, out of the Rebuild Iowa
Infrastructure Fund, an annual appropriation
is now being made to the Board of Regents
to help repay Academic Revenue Bonds
issued by the Board for capital projects on
the three main campuses.
This appropriation, known as Tuition
Replacement, is currently $28.3 million for
Fiscal Year 2018 and is projected to grow to
32.6 million in Fiscal Year 2019. Fiscal
Year 2018 amount is lower after taking into
account carryforward balances from prior
fiscal years for savings realized from
refunding issues in past years. The bonds
issued are not projected to be paid off until
Fiscal Year 2035.
In looking at gaming revenues as a
whole, of the total estimate amount for
Fiscal Year 2018 of $291.8 million, $102.0
million, or 35%, is set aside for debt service
on bonds.
Judicial Revenues
For Fiscal Year 2018, the first $14.9
million of court fines and fees due to the
State General Fund is diverted to pay for
Prison Construction Bonds. These bonds
were issued July 2010 for the construction
of a new maximum security prison at Fort
Madison in the amount of $135,050,000.
The final maturity on these bonds is 2027.
Utilities Assessments
For Fiscal Year 2018, the Utilities Board
and the Consumer Advocate will pay
$1,063,760 in Fiscal Year 2018 for debt
service on the bonds issued for the building
of the Iowa Utilities Board and Consumer
Advocate State Building. The payment of
debt will come from billings the Utilities
Board and Consumer Advocate charge to
the various industries they regulate. The
original issuance on the bonds was
$12,640,000, with the final maturity on the
bonds in 2029.
Tobacco Master Settlement Agreement
Revenues
For Fiscal Year 2018, an estimated
$40,616,794 (78%) of the total amounts
payable to the state under the Tobacco
Master Settlement Agreement (MSA) is
pledged as security for bonds issued by the
Tobacco Settlement Authority. The original
and advance refunding bond proceeds
provided funding for various capital projects.
The original bonds were issued in 2001,
with an advance refunding done in 2005.
Total issuance was $1.365 billion over the
two issuances with the bonds’ final maturity
in 2046. The remaining 22% of amounts
$0
$50,000,000
$100,000,000
$150,000,000
$200,000,000
$250,000,000
$300,000,000
Allocation of Gaming Revenues
General Fund Vision Iowa Debt ServiceSchool Infrastructure Debt Service Endowment FundI-JOBS Debt Service Federal Subsidy HoldbackTechnology Reinvestment Fund Iowa Skilled Worker and Job Creation FundRebuild Iowa Infrastructure Fund
DebtService
$3
2.4
$2
8.3
$32.6
$3
0.2
$29
.8
$2
9.8
$29
.8
$2
9.6
$27.3
$2
7.4
$27
.8
$2
2.5
$21
.8
$2
1.6
$15
.0
$1
7.4
$17
.3
$1
3.5
$14.6
$0
$5
$10
$15
$20
$25
$30
$35F
Y2
017
FY
2018
FY
2019
FY
2020
FY
2021
FY
2022
FY
2023
FY
2024
FY
2025
FY
2026
FY
2027
FY
2028
FY
2029
FY
2030
FY
2031
FY
2032
FY
2033
FY
2034
FY
2035
In M
illi
on
s
Projected Tuition Replacement Obligations by Fiscal Year
Source: Iowa Department of Management
Source: Iowa Board of Regents
58
payable under the MSA are deposited into
the Rebuild Iowa Infrastructure Fund.
Outstanding Bonds Supported by Other
Funding Sources
Universities
Academic Revenue Bonds
The Legislature periodically authorizes
the Board of Regents to issue Academic
Revenue Bonds for construction,
reconstruction, and renovation of facilities at
the three state universities. The revenue
repayment of the bonds is derived from
student tuition and fees. As described
previously, the Governor recommends and
the Legislature appropriates annually funds
(Tuition Replacement) in order to reimburse
the universities for tuition and fees used to
pay the debt service on the bonds. As of
June 30, 2016, the universities had original
issuance amount of $461,495,081 for
outstanding bonds, with outstanding
principal of $400,858,080. In Fiscal Year
2018, the Governor’s recommended tuition
replacement appropriation from the Rebuild
Iowa Infrastructure Fund is $28.3 million.
Self-Supporting Bonds
The Board of Regents is authorized
under various Iowa Code sections to issue
bonds which are repaid from self-supporting
units at each of the three universities.
Examples of self-supporting units are
dormitory systems, athletic facilities, student
health facilities, and University of Iowa
Hospitals and Clinics. As of June 30, 2016,
the universities had an original issuance
amount of $1,717,241,677 for bonds, with
outstanding principal of $1,496,720,122.
Iowa Finance Authority
The Iowa Finance Authority (IFA) is
authorized and has issued bonds to provide
affordable mortgage financing and to meet
the 20% match required for federal
capitalization grants which are used to
provide loans for construction of wastewater
and drinking water facilities. The bonds are
payable principally from repayments of such
loans. The bonds are secured, as
described in applicable bond resolution, by
the revenues, moneys, investments, loans,
and other assets in the funds and accounts
established by the respective bond
resolutions. As of June 30, 2016, IFA had
original issuance of outstanding bonds of
$1,448,301,000 with outstanding principal of
$1,258,847,000. It is estimated that for
Fiscal Year 2017, $103,733,000 will be paid
in debt service.
Universities Foundations
Iowa State University (ISU) Foundation
in prior years issued $3,850,000 in bonds to
purchase and remodel the Foundation
Advancement Center building. The bonds
are collateralized with a mortgage on the
building and other real estate owned by the
Foundation. In March 2010, the bonds were
refinanced under an amended agreement.
The refinanced bonds have varying
maturities through 2020 and have an
interest rate of 2.4%. Outstanding principal
on June 30, 2016 was $2,199,999, and debt
service for Fiscal Year 2017 is $136,716.
59

Co
rrecti
on
s2%
I-JO
BS
12%
To
bacco
24%
Reg
en
ts37%F
inan
ce A
uth
ori
ty23%
Oth
er
2%
Bo
nd
ing
Ob
lig
ati
on
s
Pri
nc
ipa
l$
5.2
B
Inte
res
t$
2.4
B
TO
TA
L$
7.6
B
So
urc
e:
Iow
a D
ep
art
me
nt
of
Ma
na
ge
men
t
60

To
tal O
uts
tan
din
g B
on
ds
as o
f Ju
ne 3
0,
2016
Issu
eO
rig
inal
Inte
rest
Matu
rity
7/1
/2015
6/3
0/2
016
Date
sIs
su
an
ce
Rate
sD
ate
sB
ala
nce
Ad
dit
ion
sD
ele
tio
ns
Bala
nce
Bo
nd
s
Sta
te o
f Io
wa
Vis
ion I
ow
aN
ove
mber-
01
196,3
75,0
00
2.2
5-5
.50%
2002-2
021
80,3
50,0
00
-
11,6
45,0
00
68,7
05,0
00
Tobacco S
ett
lem
ent
Auth
ority
Nove
mber-
05
1,3
65,4
35,0
00
5.3
75-7
.125%
2006-2
046
1,2
52,1
30,0
00
-
14,4
15,0
00
1,2
37,7
15,0
00
I-JO
BS
7/0
9 -
10/1
0777,9
65,0
00
2.5
0-6
.75%
2011-2
038
664,9
15,0
00
-
20,6
00,0
00
644,3
15,0
00
Iow
a U
tilit
ies B
uild
ing
August-
09
12,6
40,0
00
5.0
4%
2011-2
029
10,4
95,0
00
-
535,0
00
9,9
60,0
00
Prison I
nfr
astr
uctu
reJuly
-10
135,0
50,0
00
2.0
-5.0
%2012-2
027
131,0
70,0
00
-
5,8
55,0
00
125,2
15,0
00
Iow
a F
inance A
uth
ority
1978-2
016
1,4
48,3
01,0
00
Variable
2011-2
047
1,2
58,8
47,0
00
182,7
10,0
00
224,0
63,0
00
1,2
17,4
94,0
00
Univ
ers
itie
s
Iow
a S
tate
Univ
ers
ity
2006-2
016
587,6
25,0
00
1.0
0-5
.25%
2008-2
041
516,8
85,0
00
42,0
95,0
00
34,5
75,0
00
524,4
05,0
00
Univ
ers
ity o
f N
ort
hern
Iow
a2005-2
016
186,6
17,0
00
1.0
0-6
.20%
2006-2
037
129,8
00,4
24
41,3
41,1
03
14,0
16,3
25
157,1
25,2
02
Univ
ers
ity o
f Io
wa
2005-2
016
1,4
04,4
95,0
00
0.3
0-5
.00%
2006-2
041
1,2
26,6
05,0
00
208,5
15,0
00
219,3
45,0
00
1,2
15,7
75,0
00
Univ
ers
itie
s F
oundations (
ISU
)2002
3,8
50,0
00
2.4
0%
2003-2
020
2,3
33,3
22
-
133,3
23
2,1
99,9
99
6,1
18,3
53,0
00
5,2
73,4
30,7
46
474,6
61,1
03
545,1
82,6
48
5,2
02,9
09,2
01
Corr
ections
125,2
15,0
00
I-JO
BS
644,3
15,0
00
Tobacco
1,2
37,7
15,0
00
Regents
1,8
99,5
05,2
01
Fin
ance A
uth
ority
1,2
17,4
94,0
00
Oth
er
78,6
65,0
00
Inte
rest
2,4
13,6
10,0
00
To
tal
7,6
16,5
19,2
01
Ou
tsta
nd
ing
Pri
ncip
al
Ou
tsta
nd
ing
Deb
t
So
urc
e:
Iow
a D
ep
art
me
nt
of
Ma
na
ge
men
t
61

Ed
ucati
on
56%
He
alt
h &
Hu
man
S
erv
ice
s25%
Ju
sti
ce
/Ju
dic
ial
Bra
nch
9%
Pro
pe
rty
R
ep
lace
me
nt/
Tax
C
red
its
7%
Oth
er
3%
Gen
eral
Fu
nd
Ap
pro
pri
atio
ns
Fisc
al Y
ear
2018
Education
$4,1
76,1
23,6
96
Health &
Hum
an S
erv
ices
$1,8
62,6
04,1
08
Justice/J
udic
ial
Bra
nch
$ 6
88,6
10,3
57
Pro
pert
y R
epla
cem
ent/T
ax
Cre
dits
$
47
9,5
99
,572
Oth
er
$250,0
06,6
95
To
tal
$7,4
56,9
44,4
28
So
urc
e:
Iow
a D
ep
art
me
nt
of
Ma
na
ge
men
t
62

Pe
rso
na
l In
co
me
Ta
x54%
Sa
les
/Us
e T
ax
33%
Co
rpo
rate
In
co
me
Ta
x6%
Oth
er
Ta
xe
s3%
Oth
er
Re
ce
ipts
3%
General Fund R
evenues (C
ash B
asis)
FY
2018 (E
stim
ate)
(In
Mil
lio
ns
)P
ers
on
alIn
co
me
T
ax
$ 4
,85
4.2
Sa
les/U
se
Ta
x$
2,9
89
.8C
orp
ora
te I
nco
me
Ta
x$
54
6.4
Oth
er
Ta
xes
$
2
71
.9O
the
r R
ece
ipts
$
2
90
.2T
ota
l$
8,9
52
.5
So
urc
e:
Iow
a D
ep
art
me
nt
of
Ma
na
ge
men
t
63

$5,5
00
$6,0
00
$6,5
00
$7,0
00
$7,5
00
$8,0
00
$8,5
00
$9,0
00
$9,5
00
$10,0
00
FY
2011
FY
2012
FY
2013
FY
2014
FY
2015
FY
2016
FY
2017
est
FY
2018
est
FY
2019
est
FY
2020
est
FY
2021
est
FY
2022
est
Exp
end
itu
re L
imit
atio
ns
vs. P
roje
cted
Ap
pro
pri
atio
ns
Exp
enditure
Lim
itation (
inclu
de
s r
ese
rve
su
rplu
se
s)
App
rop
riations
So
urc
e:
Iow
a D
ep
art
me
nt
of
Ma
na
ge
men
t
64

$5,5
00
$6,0
00
$6,5
00
$7,0
00
$7,5
00
$8,0
00
$8,5
00
$9,0
00
$9,5
00
$10,0
00
$10,5
00
$11,0
00
FY
2012
FY
2013
FY
2014
FY
2015
FY
2016
FY
2017
est
FY
2018
est
FY
2019
est
FY
2020
est
FY
2021
est
FY
2022
est
Bu
sin
es
s a
s U
su
al
Bu
sin
ess
as U
sual
Pro
ject
ed A
ppro
pria
tio
ns
Pro
ject
ed A
pop
rop
riat
ion
s le
ss P
rop
erty
Tax
Ref
orm
So
urc
e:
Iow
a D
ep
art
me
nt
of
Ma
na
ge
men
t
65

So
urc
e:
Iow
a D
ep
art
me
nt
of
Ma
na
ge
men
t
66

State of IowaEstimated Condition of the General Fund
Financial Summary($ in Millions)
Governor's Governor's
Actual Estimate Recommendation Recommendation
FY2016 FY2017 FY2018 FY2019
Estimated Funds Available:
Total Gross Receipts 8,262.7$ 8,560.0$ 8,952.5$
Net Accruals 14.2 36.6 10.7
Refunds (1,018.3) (1,013.0) (1,018.0)
School Infrastructure Transfer from General Fund (466.9) (470.6) (490.8)
General Fund Transfers 129.4 98.9 101.9
Total Net General Fund Receipts 6,921.1 7,211.9 7,556.3 7,858.6
Revenue Adjustments - 3.3 (20.2) (23.0)
Excess from Reserve Funds 367.3 18.2 - 32.6
Total Funds Available 7,288.4 7,233.4 7,536.1 7,868.2
Expenditure Limitation 7,460.6$ 7,789.6$
Estimated Appropriations:
Executive Branch 7,030.8 7,137.6 7,233.5 7,399.6
Judicial Branch 181.8 181.8 186.6 187.0
Legislative Branch 34.0 32.9 36.8 36.8
Adjustment to Standings 8.2 (4.5) - -
Recommended Appropriation Adjustments - (110.1) - -
Total Appropriations 7,254.8 7,237.7 7,456.9 7,623.4
Reversions-operations (8.8) (5.0) (5.0) (5.0)
Reversions-Item Vetoes (1.7) - -
Net Appropriations 7,244.3 7,232.7 7,451.9 7,618.4
Ending Balance 44.1$ 0.7$ 84.2$ 249.8$
Distribution of Ending Balance
Reserve Funds (44.1) (0.7) (84.2) (249.8)
Total -$ -$ -$ -$
67
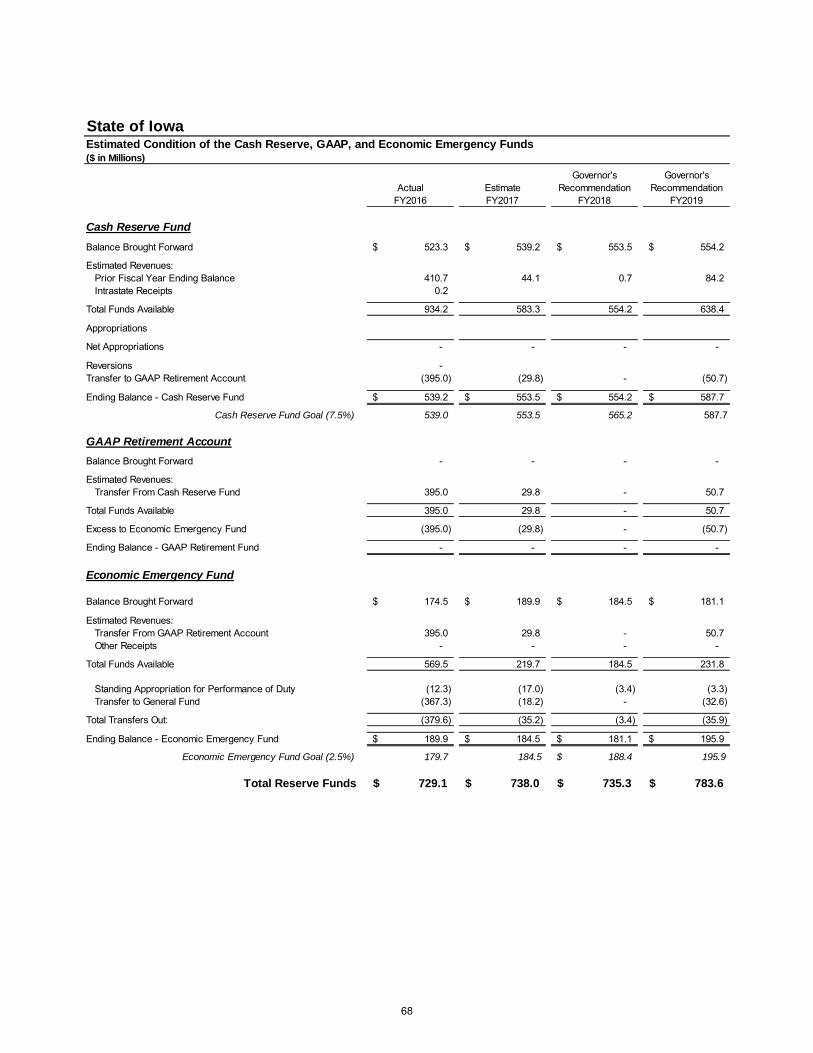
State of IowaEstimated Condition of the Cash Reserve, GAAP, and Economic Emergency Funds($ in Millions)
Governor's Governor's
Actual Estimate Recommendation Recommendation
FY2016 FY2017 FY2018 FY2019
Cash Reserve Fund
Balance Brought Forward 523.3$ 539.2$ 553.5$ 554.2$
Estimated Revenues:
Prior Fiscal Year Ending Balance 410.7 44.1 0.7 84.2
Intrastate Receipts 0.2
Total Funds Available 934.2 583.3 554.2 638.4
Appropriations
Net Appropriations - - - -
Reversions -
Transfer to GAAP Retirement Account (395.0) (29.8) - (50.7)
Ending Balance - Cash Reserve Fund 539.2$ 553.5$ 554.2$ 587.7$
Cash Reserve Fund Goal (7.5%) 539.0 553.5 565.2 587.7
GAAP Retirement Account
Balance Brought Forward - - - -
Estimated Revenues:
Transfer From Cash Reserve Fund 395.0 29.8 - 50.7
Total Funds Available 395.0 29.8 - 50.7
Excess to Economic Emergency Fund (395.0) (29.8) - (50.7)
Ending Balance - GAAP Retirement Fund - - - -
Economic Emergency Fund
Balance Brought Forward 174.5$ 189.9$ 184.5$ 181.1$
Estimated Revenues:
Transfer From GAAP Retirement Account 395.0 29.8 - 50.7
Other Receipts - - - -
Total Funds Available 569.5 219.7 184.5 231.8
Standing Appropriation for Performance of Duty (12.3) (17.0) (3.4) (3.3)
Transfer to General Fund (367.3) (18.2) - (32.6)
Total Transfers Out: (379.6) (35.2) (3.4) (35.9)
Ending Balance - Economic Emergency Fund 189.9$ 184.5$ 181.1$ 195.9$
Economic Emergency Fund Goal (2.5%) 179.7 184.5 188.4$ 195.9
Total Reserve Funds 729.1$ 738.0$ 735.3$ 783.6$
68

State of IowaEstimated Condition of the Taxpayer Trust Fund/Taxpayer Trust Fund Tax Credit Fund($ in Millions)
Actual Estimate Estimate
FY2016 FY2017 FY2018
Taxpayer Trust Fund
Beginning Balance 35.5$ 8.2$ -$
Revenues:
Transfer from Economic Emergency Fund -
Reversion from Taxpayer Trust Fund Tax Credit Fund 8.1
Interest 0.1
Total Funds Available 43.7 8.2 -
Expenditures
Transfer to Taxpayer Trust Fund Tax Credit Fund (35.5) -
Governor's recommended transfer to General Fund (8.2)
Ending Balance - Taxpayer Trust Fund 8.2$ -$ -$
Taxpayer Trust Fund Tax Credit Fund
Beginning Balance -$ -$ -$
Revenues:
Transfer from Taxpayer Trust Fund 35.5 - -
Interest -
Total Revenues Available 35.5 - -
Expenditures
Transfer to General Fund (reimbursement for payment of tax credits) (27.4) - -
Reversion to the Taxpayer Trust Fund (8.1) - -
Total Expenditures (35.5) - -
Ending Balance - Taxpayer Trust Fund Tax Credit Fund -$ -$ -$
FY2015 Calculation
Actual FY14 Net General Fund Revenues 6,489.0
FY2014 Adjusted Revenue (6,496.6)
Amount Estimated to be Availabile to the Taxpayer Trust Fund (7.6)$
Limit to the Taxpayer Trust Fund -$
FY2016 Calculation
FY2015 December 2014 REC Estimate 6,819.7
FY2015 Adjusted Revenue (7,186.7)
Amount Estimated to be Availabile to the Taxpayer Trust Fund (367.0)$
Limit to the Taxpayer Trust Fund -$
FY2017 Calculation
FY2016 December 2015 REC Estimate 7,045.6
FY2016 Adjusted Revenue (7,380.0)
Amount Estimated to be Availabile to the Taxpayer Trust Fund (334.4)
Limit to the Taxpayer Trust Fund -$
69

State of IowaGeneral Fund Revenue (Appropriable Revenues)Cash Basis
($ in Millions)
Actual Estimated Estimated
FY2016 FY2017 FY2018
Tax Receipts
Personal Income Tax 4,355.5 4,608.1 4,854.2
Use Tax 2,810.5 2,864.7 2,989.8
Corporate Income Tax 520.5 531.4 546.4
Inheritance Tax 91.8 82.1 86.3
Insurance Premium Tax 119.7 118.7 120.0
Cigarette Tax - - -
Tobacco Tax - - -
Beer Tax 14.1 14.1 14.1
Franchise Tax 52.1 48.9 50.0
Miscellaneous Tax 1.5 1.5 1.5
Total Tax Receipts 7,965.7 8,269.5 8,662.3
Other Receipts
Institutional Payments 12.1 6.8 6.8
Liquor Profits 112.3 111.5 111.5
Interest 4.1 4.2 4.3
Fees 28.1 27.0 26.3
Judicial Revenue 97.7 97.7 97.7
Miscellaneous Revenues 42.7 43.3 43.6
Racing and Gaming Revenues - - -
Total Other Receipts 297.0 290.5 290.2
Total Tax & Other Receipts 8,262.7 8,560.0 8,952.5
2.1% 3.6% 4.6%
70

State of IowaGeneral Fund Accrued Revenue Changes($ in Millions)
Actual Estimated Estimated
FY2016 FY2017 FY2018
Tax Receipts:
Personal Income Tax 271.4 298.0 296.0
Sales/Use Tax 231.7 232.0 236.0
Corporate Income Tax 25.7 28.0 32.0
Inheritance Tax 13.5 13.5 15.0
Insurance Premium Tax - - -
Cigarette Tax - - -
Tobacco Tax - - -
Beer Tax 1.5 1.5 1.5
Franchise Tax 1.5 2.5 3.5
Miscellaneous Tax - - -
Total Tax Receipts 545.3 575.5 584.0
Other Receipts:
Institutional Payments 2.1 2.1 2.0
Liquor Profits 11.1 12.0 13.5
Interest 0.3 1.2 1.5
Fees (0.8) 1.5 1.5
Judicial Revenue 5.0 7.0 7.5
Miscellaneous Receipts 5.2 5.5 5.5
Racing and Gaming - - -
Total Other Receipts 22.9 29.3 31.5
Total Receipts and Transfers 568.2 604.8 615.5
Net Change 14.2 36.6 10.7
71

State of IowaGeneral Fund Refunds/School Infrastructure Transfers/Transfers($ in Millions)
Actual Estimated Estimated
FY2016 FY2017 FY2018
Refunds:
Personal Income Tax (828.4) (814.0) (809.0)
Sales/Use Tax (41.1) (41.0) (49.0)
Corporate Income Tax (136.4) (140.5) (144.5)
Inheritance Tax (2.4) (4.5) (4.5)
Cigarette Tax (0.6) (0.5) (0.5)
Franchise Tax (9.6) (12.0) (10.0)
Other (3.4) (3.5) (3.5)
Total Gross Refunds (1,021.9) (1,016.0) (1,021.0)
Less: Reimbursements 3.6 3.0 3.0
Total Net Refunds (1,018.3) (1,013.0) (1,018.0)
School Infrastructure Transfers (466.9) (470.6) (490.8)
Transfers:
Lottery 85.5 78.0 81.0
Taxpayer Trust Fund Tax Credit Fund Transfer - - -
Other 43.9 20.9 20.9
Total Transfers 129.4 98.9 101.9
72

State of IowaGeneral Fund Revenue
Governor's Recommended Revenue Adjustments($ in Millions)
FY2017 FY2018 FY2019
Revenue Adjustments:
Transfer from Other Funds:
Taxpayer Trust Fund 8.2
Cultural Trust Fund 6.0
Strategic Investment Fund 1.0
Innovation & Commercialization Fund 2.0
Economic Development Energy Projects Fund 2.0
Grow Iowa Values Fund 12.0
Federal Economic Stimulus and Jobs Holding Fund 2.0
Coupling with all tax provisions except Section 179 (29.9) (20.2) (23.0)
Total Revenue Adjustments 3.3$ (20.2)$ (23.0)$
73

State of IowaGovernor's Recommended Appropriation Adjustments
General Fund
FY2017
Amount
Departments
Department of Administrative Services (318,910)
Auditor of State (39,935)
Department of Commerce (65,053)
Executive Council (3,825)
Governor's Office (62,640)
Governor's Office of Drug Control Policy (10,195)
Department of Human Rights (106,501)
Department of Inspections and Appeals (516,180)
State Public Defender (720,011)
Department of Management (151,470)
Department of Revenue (1,000,000)
Secretary of State (122,476)
Treasurer of State (45,849)
Department of Agriculture & Land Stewardship (952,837)
Department of Natural Resources (650,773)
Department of Cultural Affairs (256,560)
Department of Economic Development (706,287)
Iowa Workforce Development (749,086)
Public Employment Relations Board (57,054)
Department of Blind (63,205)
College Aid Commission (475,498)
Department of Education (5,505,905)
Community Colleges (8,703,601)
Vocational Rehabilitation (265,036)
Iowa Public Television (343,138)
Board of Regents (25,562,429)
Department of Aging (591,829)
Department of Public Health (2,523,282)
Department of Human Services (20,296,531)
Department of Veterans Affairs (199,348)
Iowa Veterans Home (322,787)
Attorney General (727,783)
Department of Corrections (15,017,157)
Law Enforcement Academy (42,637)
Board of Parole (36,137)
Department of Public Defense (293,212)
Department of Homeland Security (94,759)
Department of Public Safety (3,813,122)
Judicial Branch (7,725,931)
Legislative Branch (1,396,125)
Department of Human Services-Medical Assistance (13,855,709)
Department of Inspections and Appeals/State Public Defender-Indigent Defense 4,300,000
Total Adjustments (110,090,803)
74

State of IowaCalculation of Statutory Expenditure Limit
Fiscal Year 2018/Fiscal Year 2019($ in Millions)
Proposed FY18 Expenditure
FY2018 % Calculation Limitation
Fiscal Year 2018
December 2016 REC Estimate
Total Gross Receipts 8,952.5$ 99% 8,863.0$
Accruals 10.7 99% 10.6
Refunds (1,018.0) 99% (1,007.8)
School Infrastructure Transfer (490.8) 99% (485.9)
Transfers 101.9 99% 100.9
Total Revenue Estimating Conference 7,556.3 7,480.8
Transfer/Revenue Adjustments:
Coupling with all tax provisions except Section 179 (20.2) 100% (20.2)
Total Revenue Adjustments (20.2) (20.2)
Transfer from Economic Emergency Fund -
FY2018 Expenditure Limitation 7,460.6$
Proposed FY19 Expenditure
FY2019 % Calculation Limitation
Fiscal Year 2019
Governor's Estimate 7,858.6$ 99% 7,780.0$
Total Governor's Estimate 7,858.6$ 7,780.0$
Transfer/Revenue Adjustments:
Coupling with all tax provisions except Section 179 (23.0) 100% (23.0)
Total Transfer/Revenue Adjustments (23.0) (23.0)
Transfer from Economic Emergency Fund 32.6
FY2019 Expenditure Limitation 7,789.6$
Governor's Recommendation
Governor's Recommendation
75

State of IowaCalculation of Cash Reserve Fund and Economic Emergency Fund Percentage Goals
Fiscal Year 2016/Fiscal Year 2017/Fiscal Year 2018/Fiscal Year 2019($ in Millions)
Fiscal Year 2016
March 2015 Revenue Estimating Conference Net Receipts Estimate 7,175.5$
2015 Session Revenue Adjustments for FY2016 11.2
Total 7,186.7$
Cash Reserve Fund 7.5% Goal 539.0$
Economic Emergency Fund 2.5% Goal 179.7$
Fiscal Year 2017
March 2016 Revenue Estimating Conference Net Receipts Estimate 7,357.4$
2016 Revenue Adjustments for FY2017 22.6
Total 7,380.0$
Cash Reserve Fund 7.5% Goal 553.5$
Economic Emergency Fund 2.5% Goal 184.5$
Governor's Recommendation Fiscal Year 2018
December 2016 Revenue Estimating Conference Net Receipts Estimate 7,556.3$
2017 Session Governor's Proposed Revenue Adjustments for FY2018 (20.2)
Total 7,536.1$
Cash Reserve Fund 7.5% Goal 565.2$
Economic Emergency Fund 2.5% Goal 188.4$
Governor's Recommendation Fiscal Year 2019
Governor's Estimate for FY2019 7,858.6$
2017 Session Governor's Proposed Revenue Adjustments for FY2019 (23.0)
Total 7,835.6$
Cash Reserve Fund 7.5% Goal 587.7$
Economic Emergency Fund 2.5% Goal 195.9$
76

State of IowaEstimated Condition of the Rebuild Iowa Infrastructure Fund
Financial Summary
Governor's Governor's
Actual Estimate Recommendation Recommendation
FY2016 FY2017 FY2018 FY2019
Resources
Beginning Balance 21,598,538 7,828,282 (1,020,978) 66,431
Revenues:
Wagering Tax and Fees 148,482,696 150,550,000 152,055,500 153,576,055
Licensing Fees 5,000,000 5,000,000 1,000,000 -
Revenue Bond Debt Service Fund Transfer 2,965,000 6,000,000 6,000,000 6,000,000
Federal Subsidy Holdback fund Transfer 3,766,307 3,750,000 3,750,000 3,750,000
Transfer from TRF (DHS Technology Project) 2,997,182 - - -
Interest 4,528,695 4,500,000 4,500,000 4,500,000
MSA Tobacco Payment Transfers 16,860,588 16,632,983 13,656,019 13,512,097
Total Revenues 184,600,468 186,432,983 180,961,519 181,338,152
Total Resources Available 206,199,006 194,261,265 179,940,541 181,404,583
Appropriations
DAS Major Maintenance 9,974,856 9,489,237 4,000,000 12,500,000
DALS Water Quality Initiative 5,200,000 5,200,000 9,500,000 9,500,000
DALS Ag Drainage Wells 1,920,000 1,920,000 1,875,000 1,875,000
DALS Renewable Fuels - - 3,000,000 3,000,000
Blind Elevator Improvements - - 150,000 -
Corr CBC District 5 Infrastructure 500,000 - - -
Corr CBC District 3 Infrastructure - 150,000 - -
DCA Great Places Infrastructure Grants 1,000,000 1,000,000 1,000,000 1,000,000
DCA State Historical Building Renovation - - 5,000,000 5,000,000
DCA USS Iowa Battleship - 250,000 250,000 -
DCA Strengthening Communities Grants 500,000 500,000 - -
DCA Civil Ware Monument-Littleton Brothers/Louisa Co. 150,000 - - -
DCA Veterans Memorial-Drakesville/Davis Co 12,000 - - -
EDA Community Attraction & Tourism Grants 5,000,000 5,000,000 5,000,000 5,000,000
EDA Regional Sport Authorities 500,000 500,000 500,000 500,000
EDA World Food Prize Borlaug/Ruan Scholar Progra, 300,000 300,000 300,000 300,000
EDA Lewis & Clark Water System - - 3,500,000 3,500,000
EDA Easter Seals/Swimming Pool - - 500,000 -
EDA Ft. Des Moines Museum Restoration 150,000 - - -
IFA State Housing Trust Fund 3,000,000 3,000,000 3,000,000 3,000,000
ILEA Planning for new facility - - - 5,000,000
DHS Nursing Home Facility Improvements 728,818 500,000 - -
DHS Broadlawns Mental Health Facilities 2,000,000 - - -
DHS Brain Injury Rehabilitation Facility-On With Life 500,000 - - -
DHS Polk County Youth Emergency Shelter 500,000 - - -
DHS Vocatoinal Services Facility 500,000 - - -
DHS The Homestead Autism Facilities - 485,000 - -
DOM Environment First Appropriation 42,000,000 42,000,000 42,000,000 42,000,000
DNR State Park Infrastructure 5,000,000 3,000,000 3,000,000 3,000,000
DNR Lakes Restoration & Water Quality 9,600,000 9,600,000 9,600,000 9,600,000
DNR Water Trails and Low Head Dam Safety Grants 1,750,000 1,000,000 1,000,000 1,000,000
DPD Facility/Armory Maintenance 2,000,000 2,000,000 2,000,000 2,000,000
DPD Construction Improvements Statewide 2,000,000 1,500,000 2,000,000 2,000,000
DPD Camp Dodge Infrastructure Upgrades 500,000 300,000 500,000 500,000
DPS Fire Training Mobile Units 100,000 - - -
Regents Tuition Replacement 30,237,549 32,447,187 16,072,923 32,624,618
Regents SUI Pharmacy Building 13,000,000 23,000,000 23,300,000 5,000,000
Regents ISU Biosciences Facilities 11,000,000 15,500,000 20,500,000 3,000,000
Regents UNI Schindler Education Center Renovation 15,000,000 15,900,000 - -
Regents ISU Student Innovation Center - 1,000,000 7,000,000 12,000,000
StateFair Youth Inn Renovation and Improvements 2,325,000 - - -
StateFair Construction and Remodel of NW Events Area - 500,000 500,000 4,500,000
(continued)
77

State of IowaEstimated Condition of the Rebuild Iowa Infrastructure Fund
Financial Summary
Governor's Governor's
Actual Estimate Recommendation Recommendation
FY2016 FY2017 FY2018 FY2019
(continued)
DPS Network Contract - - 4,143,687 4,143,687
DPS Crime Scene Equipment/Tazers - - 1,122,500 -
DOT Recreational Trails 3,400,000 2,500,000 2,500,000 2,500,000
DOT Public Transit Infrastructure 1,500,000 1,500,000 1,500,000 1,500,000
DOT Commercial Air Service Airports 1,500,000 1,440,000 1,500,000 1,500,000
DOT General Aviation Airport Grants 750,000 - 750,000 750,000
DOT Rail Assistance 2,000,000 1,500,000 2,000,000 2,000,000
TOS County Fairs Infrastructure 1,060,000 1,060,000 1,060,000 1,060,000
Vets Capital Upgrades 10,800,000 2,500,000
Technology
DCA Sullivan Brothers Musuem - 250,000 250,000 -
Educ Statewide Education Data Warehouse 600,000 363,839 - -
Educ ICN Part III & Maintenance & Leases 2,727,000 2,727,000 - -
Educ IPTV Equipment Replacement 1,256,200 1,017,000 - -
ICN ICN Equipment Replacement 2,248,653 1,150,000 - -
DHR Integrating Justice Data Systems 1,300,000 1,345,000 - -
DHR Justice Datewarehouse 159,474 117,980 - -
DOM Transparency Project 45,000 45,000 - -
DOM Grants Management System 50,000 50,000 - -
DPH M&CH Database Integration 500,000 500,000 - -
DPH Iowa Prescription Drug Safety Net - 75,000 - -
HomelandEMS Mass Messaging System 400,000 400,000 - -
Regents ISU - Vet Lab Cancer Equipment 330,000 - - -
Regents IPR - Radio Transmitter 100,000 - - -
DPD Gold Star Musuem - 250,000 - -
DPS DCI Lab-DNA Marker Software - 150,000 - -
SecState Voting Equipment 450,000 - - -
SecState Voter Registration System 234,000 300,000 - -
TOS Iowa ABLE Savings Plan Trust 50,000 - - -
Total Appropriations/Expenditures 198,408,550 195,282,243 179,874,110 180,853,305
Reversions (37,826) - - -
Net Appropriations 198,370,724 195,282,243 179,874,110 180,853,305
Net Available Balance Forward 7,828,282 (1,020,978) 66,431 551,278
78

Governor's Governor's
Actual Estimate Recommendation Recommendation
FY2016 FY2017 FY2018 FY2019
Resources
Beginning Balance 236,162 315,616 79,455 81,396
Revenues:
General Fund Appropriation - - 17,500,000 17,500,000
Total Revenues - - 17,500,000 17,500,000
Total Resources Available 236,162 315,616 17,579,455 17,581,396
Appropriations
OCIO Technology Projects/Consolidation - - 3,000,000 7,650,000
Educ ICN Part III & Maintenance & Leases - - 2,727,000 2,727,000
Educ Statewide Education Data Warehouse - 236,161 600,000 600,000
Educ IPTV Equipment Replacement - - 1,007,200 1,007,200
HomelandEMS Mass Messaging System 400,000 400,000
ICN ICN Equipment Replacement - - 1,150,000 1,150,000
DHR Integrating Justice Data Systems - - 1,400,000 1,400,000
DHR Justice Datewarehouse - - 157,980 157,980
DHS Technology - - 2,992,416 -
DIA State Public Defender online non Attorney billings - - 66,463 -
ILEA Technology Projects 35,000
DOM Transparency Project - - 45,000 45,000
DOM Grants Management System - - 50,000 70,000
DOM Local Government Budget & Property Tax upgrade 600,000
DPH Technology Consolidation - - 250,000 250,000
DPH Equipment-State Medical Examiner - - 1,037,000 -
DPS Radio Upgrades - - 1,980,000 -
SecState Technolog Projects - - - 1,750,000
Total Appropriations - 236,161 17,498,059 17,207,180
Reversions (79,454) - -
Net Appropriations (79,454) 236,161 17,498,059 17,207,180
Net Available Balance Forward 315,616 79,455 81,396 374,216
State of IowaEstimated Financial Condition of the Technology Reinvestment Fund
Financial Summary
79

ST
AT
E O
F I
OW
A
FU
ND
ING
EL
EM
EN
TA
RY
AN
D S
EC
ON
DA
RY
ED
UC
AT
ION
Genera
l O
pera
ting F
und O
nly
(In
Mil
lio
ns)
Do
llars
Percen
tD
oll
ars
Percen
tD
oll
ars
Percen
tD
oll
ars
Percen
tD
oll
ars
Percen
tD
oll
ars
Percen
t
Unif
orm
Pro
pert
y T
axes
54
3.7
14
.25
70
.61
4.1
58
4.1
13
.76
18
.31
3.4
64
8.4
14
.76
76
.81
4.0
Addit
ional
Pro
pert
y T
axes
50
9.2
13
.35
21
.51
2.9
53
6.8
12
.65
61
.51
2.2
57
5.6
13
.05
73
.41
1.8
ISL
Pro
pert
y T
axes
79
.42
.18
3.6
2.1
89
.22
.19
1.2
2.0
95
.92
.29
8.8
2.0
Sta
te F
oundat
ion A
id1
,96
3.9
51
.32
,04
8.3
50
.82
,14
5.6
50
.22
,15
1.1
46
.52
,14
6.5
48
.52
,47
6.6
51
.1
Oth
er
Sta
te A
id2
03
.85
.32
53
.56
.33
38
.17
.94
14
.79
.06
3.7
1.4
70
.71
.5
Inco
me S
urt
axes
58
.01
.56
4.8
1.6
70
.21
.67
6.4
1.7
81
.91
.98
4.5
1.7
Federa
l/O
ther
Mis
cell
aneo
us
47
3.2
12
.44
93
.61
2.2
50
7.6
11
.97
08
.91
5.3
81
4.9
18
.48
68
.01
7.9
To
tal
Fu
nd
s3
,83
1.2
10
0.0
4,0
35
.91
00
.04
,27
1.6
10
0.0
4,6
22
.11
00
.04
,42
6.9
10
0.0
4,8
48
.81
00
.0
Fo
rmula
(W
eig
hte
d)
Enro
llm
ent
56
0,2
59
56
1,0
16
56
0,4
90
54
8,8
44
55
3,0
16
55
0,5
10
Actu
al F
all
Enro
llm
ent
48
3,1
05
48
2,5
84
48
0,6
09
47
7,0
19
47
4,2
27
47
3,4
93
Do
llars
Percen
tD
oll
ars
Percen
tD
oll
ars
Percen
tD
oll
ars
Percen
tD
oll
ars
Percen
tD
oll
ars
Percen
t
Unif
orm
Pro
pert
y T
axes
70
3.6
14
.67
29
.71
5.2
75
9.3
15
.27
74
.21
5.0
79
2.4
14
.98
27
.81
5.0
Addit
ional
Pro
pert
y T
axes
61
1.0
12
.75
81
.11
2.1
57
8.6
11
.65
75
.11
1.1
58
7.9
11
.15
93
.51
0.8
ISL
Pro
pert
y T
axes
10
0.9
2.1
10
4.8
2.2
11
5.0
2.3
12
0.0
2.3
12
8.6
2.4
13
4.7
2.5
Sta
te F
oundat
ion A
id2
,63
1.2
54
.62
,66
1.1
55
.42
,72
5.6
54
.62
,87
3.8
55
.62
,95
9.2
55
.73
,09
9.1
56
.3
Oth
er
Sta
te A
id4
0.4
0.8
40
.40
.81
18
.12
.41
23
.32
.41
45
.72
.71
42
.82
.6
Inco
me S
urt
axes
85
.41
.88
5.9
1.8
85
.71
.79
2.2
1.8
89
.21
.79
0.4
1.6
Federa
l/O
ther
Mis
cell
aneo
us
64
3.2
13
.45
98
.91
2.5
60
6.1
12
.26
14
.61
1.9
61
4.6
11
.66
14
.61
1.2
To
tal
Fu
nd
s4
,81
5.7
10
0.0
4,8
01
.91
00
.04
,98
8.4
10
0.0
5,1
73
.21
00
.05
,31
7.6
10
0.0
5,5
02
.91
00
.0
Fo
rmula
(W
eig
hte
d)
Enro
llm
ent
55
1,1
07
54
9,1
57
55
0,4
66
55
3,1
60
55
4,9
74
55
9,5
35
Actu
al F
all
Enro
llm
ent
47
3,5
04
47
6,2
45
47
8,9
21
48
0,7
72
48
3,4
51
Actu
al
10
/11
Actu
al
11
/12
Actu
al
12
/13
Actu
al
13
/14
Actu
al
14
/15
Est
imate
d 1
5/1
6E
stim
ate
d 1
6/1
7
Actu
al
05
/06
Actu
al
06
/07
Actu
al
07
/08
Actu
al
08
/09
Actu
al
09
/10
So
urc
e:
Iow
a D
ep
art
me
nt
of
Ma
na
ge
men
t
80

2007
2008
2009
2010
2011
2012
2013
2014
2015
2016
SP
EC
IAL
TA
XE
S:
Pers
onal I
ncom
e T
ax
3,0
85,9
33
3,3
59,6
66
3,3
30,6
64
3,2
35,9
29
3,4
61,7
34
3,6
34,2
81
4,0
83,9
03
3,9
74,8
38
4,2
07,2
50
4,3
55,4
35
Sale
s/U
se T
ax
1,9
10,0
47
2,0
00,2
46
2,3
27,4
43
2,2
93,0
32
2,3
81,3
95
2,5
05,2
99
2,5
47,6
03
2,6
42,3
32
2,7
53,0
80
2,8
10,6
61
Corp
ora
tion I
ncom
e T
ax
424,6
16
483,7
93
416,4
67
389,3
37
394,5
12
520,7
19
555,2
89
549,5
81
576,2
79
520,5
32
Inheri
tance T
ax
76,0
33
78,4
35
75,4
46
67,4
26
66,3
95
77,6
45
86,8
09
91,0
34
86,9
77
91,7
80
Insura
nce P
rem
ium
Tax
105,2
23
111,6
53
90,0
28
88,5
71
97,0
98
101,4
06
104,8
85
105,5
32
109,6
33
119,6
75
Cig
are
tte &
Tobacco T
axe
s134,0
99
250,7
04
238,8
01
232,0
73
227,3
05
119,4
32
121,3
97
1,4
10
(5)
4
Beer
& L
iquor
Taxe
s14,2
99
14,5
09
14,6
63
14,4
05
14,3
40
14,2
36
14,5
22
14,1
27
14,4
60
14,1
00
Fra
nchis
e T
ax
33,2
95
37,5
83
33,6
44
31,6
23
36,3
23
41,4
86
42,9
04
42,9
18
46,9
49
52,0
36
Mis
cella
neous T
axe
s957
958
2,4
26
(431)
1,0
46
1,0
85
1,1
46
1,2
25
1,3
95
1,4
67
TO
TA
L S
PE
CIA
L T
AX
ES
5,7
84,5
02
6,3
37,5
47
6,5
29,5
82
6,3
51,9
65
6,6
80,1
48
7,0
15,5
89
7,5
58,4
58
7,4
22,9
97
7,7
96,0
18
7,9
65,6
90
P
erc
enta
ge I
ncre
ase
6.6
%9.6
%3.0
%-2
.7%
5.2
%5.0
%7.7
%-1
.8%
5.0
%2.2
%
OT
HE
R
RE
CE
IPT
S
Institu
tional P
aym
ents
12,9
40
14,9
46
15,4
41
14,8
24
9,9
63
12,9
84
14,3
25
12,7
74
15,5
06
12,0
88
Liq
uor
Tra
nsfe
rs64,7
62
72,4
27
85,5
20
80,3
35
89,3
18
94,6
01
96,0
49
96,6
30
108,3
97
112,2
73
Inte
rest
28,6
98
25,2
94
14,5
75
4,0
29
2,9
90
2,4
49
2,6
27
3,3
76
3,6
56
4,1
25
Fees
84,7
20
82,0
64
77,7
34
47,8
25
30,1
33
29,1
29
29,1
21
28,8
43
27,7
72
28,0
48
Judic
ial R
eve
nue
66,9
00
89,9
87
98,8
39
108,6
28
101,5
49
113,8
30
107,9
88
103,9
72
99,8
83
97,6
83
Mis
cella
neous R
eceip
ts35,7
32
36,0
62
39,8
04
37,8
11
38,3
96
37,7
30
39,8
55
43,3
68
39,6
89
42,7
32
Racin
g &
Gam
ing R
eceip
ts60,0
00
60,0
00
60,0
00
66,0
00
66,0
00
66,0
00
40,0
00
-
-
-
TO
TA
L
OT
HE
R
R
EC
EIP
TS
353,7
52
380,7
80
391,9
13
359,4
52
338,3
49
356,7
23
329,9
65
288,9
63
294,9
03
296,9
49
3.1
%7.6
%2.9
%-8
.3%
-5.9
%5.4
%-7
.5%
-12.4
%2.1
%0.7
%
Accru
als
35,9
38
(22,6
95)
16,9
09
13,0
51
15,0
40
61,2
66
13,0
42
(1
6,1
64)
19,5
88
14,2
34
Refu
nd
s(5
97,8
90)
(674,7
83)
(803,9
47)
(859,1
29)
(825,9
92)
(820,5
95)
(830,5
04)
(955,2
55)
(967,8
88)
(1,0
18,2
86)
Sch
oo
l In
frastr
uctu
re T
ran
sfe
r-
-
(3
85,5
17)
(372,5
25)
(394,0
93)
(410,5
96)
(419,1
69)
(440,4
22)
(450,5
32)
(466,8
91)
Tra
nsfe
rs70,0
08
63,6
59
185,0
02
140,9
33
85,6
14
108,7
40
116,9
45
188,9
50
127,6
38
129,4
43
TO
TA
L
NE
T A
PP
RO
PR
IAB
LE
R
EC
EIP
TS
5,6
46,3
10
6,0
84,5
08
5,9
33,9
42
5,6
33,7
47
5,8
99,0
66
6,3
11,1
27
6,7
68,7
37
6,4
89,0
69
6,8
19,7
27
6,9
21,1
39
P
erc
enta
ge I
ncre
ase
4.9
%7.8
%-2
.5%
-5.1
%4.7
%7.0
%7.3
%-4
.1%
5.1
%1.5
%
ST
AT
E O
F IO
WA
HIS
TO
RY
OF
AP
PR
OP
RIA
BL
E R
EC
EIP
TS
(IN
$ T
HO
US
AN
DS
)
So
urc
e:
Iow
a D
ep
art
ment
of
Ma
na
ge
men
t
81

Stat
e of
Iow
aG
ener
al F
und
App
ropr
iatio
nsFY
201
8 an
d 20
19 G
over
nor's
Rec
omm
enda
tions
Adm
inis
tratio
n an
d R
egul
atio
n57
3,28
7,14
358
9,51
2,64
661
7,17
8,60
061
1,03
7,23
861
7,30
5,95
561
2,72
0,29
5
Agric
ultu
re a
nd N
atur
al R
esou
rces
37,7
86,9
9537
,886
,995
45,4
61,9
9539
,983
,385
45,4
61,9
9547
,483
,385
Econ
omic
Dev
elop
men
t43
,744
,465
42,9
93,7
0243
,193
,702
41,7
31,7
6943
,193
,702
51,7
31,7
69
Educ
atio
n3,
970,
934,
416
4,11
3,46
4,71
34,
159,
165,
134
4,17
6,12
3,69
64,
143,
152,
636
4,26
2,22
5,60
8
Hum
an S
ervi
ces
1,90
0,44
3,62
11,
836,
873,
531
1,88
2,32
4,73
01,
862,
604,
108
1,93
3,12
9,39
61,
923,
377,
064
Just
ice
Syst
em51
1,21
6,78
851
2,45
8,06
751
5,80
4,12
850
2,03
1,54
851
5,87
4,47
250
2,03
1,54
8
Judi
cial
Bra
nch
181,
786,
612
181,
786,
612
194,
304,
740
186,
578,
809
194,
704,
740
186,
978,
809
Legi
slat
ive
Bran
ch35
,647
,716
32,8
60,0
0038
,250
,000
36,8
53,8
7538
,250
,000
36,8
53,8
75
Tota
l Gen
eral
Fun
d A
ppro
pria
tion
7,25
4,84
7,75
57,
347,
836,
266
7,49
5,68
3,02
97,
456,
944,
428
7,53
1,07
2,89
67,
623,
402,
353
DES
CR
IPTI
ON
FY 2
016
FY 2
017
FY 2
018
FY 2
018
FY 2
019
FY 2
019
Act
ual
Bud
get
Estim
ate
Dep
artm
ent
Req
uest
Gov
erno
r'sR
ecom
men
ded
Dep
artm
ent
Req
uest
Gov
erno
r'sR
ecom
men
ded
82
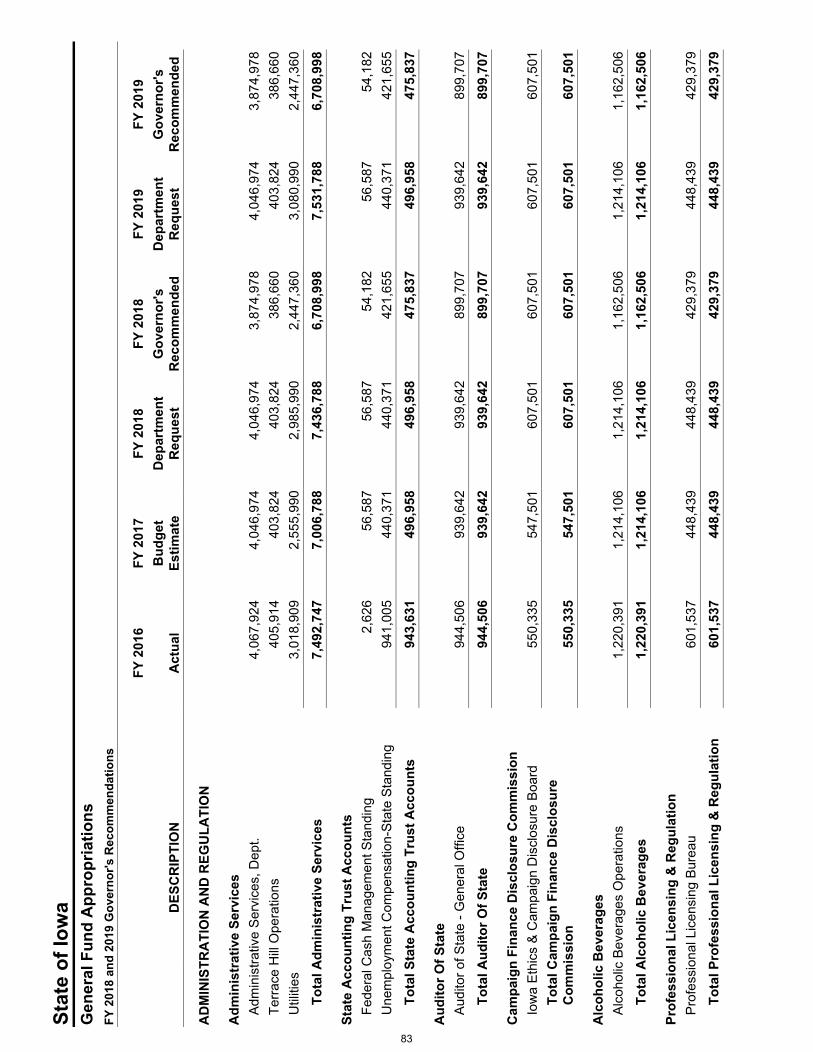
Stat
e of
Iow
aG
ener
al F
und
App
ropr
iatio
nsFY
201
8 an
d 20
19 G
over
nor's
Rec
omm
enda
tions
DES
CR
IPTI
ON
FY 2
016
FY 2
017
FY 2
018
FY 2
018
FY 2
019
FY 2
019
Act
ual
Bud
get
Estim
ate
Dep
artm
ent
Req
uest
Gov
erno
r'sR
ecom
men
ded
Dep
artm
ent
Req
uest
Gov
erno
r'sR
ecom
men
ded
AD
MIN
ISTR
ATI
ON
AN
D R
EGU
LATI
ON
Adm
inis
trat
ive
Serv
ices
Adm
inis
trativ
e Se
rvic
es, D
ept.
4,06
7,92
44,
046,
974
4,04
6,97
43,
874,
978
4,04
6,97
43,
874,
978
Terra
ce H
ill O
pera
tions
405,
914
403,
824
403,
824
386,
660
403,
824
386,
660
Util
ities
3,01
8,90
92,
555,
990
2,98
5,99
02,
447,
360
3,08
0,99
02,
447,
360
Tota
l Adm
inis
trat
ive
Serv
ices
7,49
2,74
77,
006,
788
7,43
6,78
86,
708,
998
7,53
1,78
86,
708,
998
Stat
e A
ccou
ntin
g Tr
ust A
ccou
nts
Fede
ral C
ash
Man
agem
ent S
tand
ing
2,62
656
,587
56,5
8754
,182
56,5
8754
,182
Une
mpl
oym
ent C
ompe
nsat
ion-
Stat
e St
andi
ng94
1,00
544
0,37
144
0,37
142
1,65
544
0,37
142
1,65
5
Tota
l Sta
te A
ccou
ntin
g Tr
ust A
ccou
nts
943,
631
496,
958
496,
958
475,
837
496,
958
475,
837
Aud
itor O
f Sta
teAu
dito
r of S
tate
- G
ener
al O
ffice
944,
506
939,
642
939,
642
899,
707
939,
642
899,
707
Tota
l Aud
itor O
f Sta
te94
4,50
693
9,64
293
9,64
289
9,70
793
9,64
289
9,70
7
Cam
paig
n Fi
nanc
e D
iscl
osur
e C
omm
issi
onIo
wa
Ethi
cs &
Cam
paig
n D
iscl
osur
e Bo
ard
550,
335
547,
501
607,
501
607,
501
607,
501
607,
501
Tota
l Cam
paig
n Fi
nanc
e D
iscl
osur
eC
omm
issi
on55
0,33
554
7,50
160
7,50
160
7,50
160
7,50
160
7,50
1
Alc
ohol
ic B
ever
ages
Alco
holic
Bev
erag
es O
pera
tions
1,22
0,39
11,
214,
106
1,21
4,10
61,
162,
506
1,21
4,10
61,
162,
506
Tota
l Alc
ohol
ic B
ever
ages
1,22
0,39
11,
214,
106
1,21
4,10
61,
162,
506
1,21
4,10
61,
162,
506
Prof
essi
onal
Lic
ensi
ng &
Reg
ulat
ion
Prof
essi
onal
Lic
ensi
ng B
urea
u60
1,53
744
8,43
944
8,43
942
9,37
944
8,43
942
9,37
9
Tota
l Pro
fess
iona
l Lic
ensi
ng &
Reg
ulat
ion
601,
537
448,
439
448,
439
429,
379
448,
439
429,
379
83

Stat
e of
Iow
aG
ener
al F
und
App
ropr
iatio
nsFY
201
8 an
d 20
19 G
over
nor's
Rec
omm
enda
tions
DES
CR
IPTI
ON
FY 2
016
FY 2
017
FY 2
018
FY 2
018
FY 2
019
FY 2
019
Act
ual
Bud
get
Estim
ate
Dep
artm
ent
Req
uest
Gov
erno
r'sR
ecom
men
ded
Dep
artm
ent
Req
uest
Gov
erno
r'sR
ecom
men
ded
Exec
utiv
e C
ounc
ilC
ourt
Cos
ts17
0,65
759
,772
59,7
7257
,232
59,7
7257
,232
Dra
inag
e As
sess
men
t12
5,79
220
,227
20,2
2719
,367
20,2
2719
,367
Publ
ic Im
prov
emen
ts-
10,0
0010
,000
9,57
510
,000
9,57
5
Tota
l Exe
cutiv
e C
ounc
il29
6,45
089
,999
89,9
9986
,174
89,9
9986
,174
Gov
erno
r's O
ffice
Gov
erno
r/Lt.
Gov
erno
r's O
ffice
2,19
6,45
52,
185,
143
2,18
5,14
32,
185,
143
2,18
5,14
32,
185,
143
Pres
iden
tial E
lect
ors
-1,
000
--
--
Terra
ce H
ill Q
uarte
rs93
,111
92,6
3192
,631
92,6
3192
,631
92,6
31
Tota
l Gov
erno
r's O
ffice
2,28
9,56
62,
278,
774
2,27
7,77
42,
277,
774
2,27
7,77
42,
277,
774
Offi
ce o
f Dru
g C
ontr
ol P
olic
yD
rug
Polic
y C
oord
inat
or24
1,13
423
9,89
223
9,89
222
9,69
723
9,89
222
9,69
7
Tota
l Offi
ce o
f Dru
g C
ontr
ol P
olic
y24
1,13
423
9,89
223
9,89
222
9,69
723
9,89
222
9,69
7
Hum
an R
ight
s, D
epar
tmen
t of
Com
mun
ity A
dvoc
acy
and
Serv
ices
1,02
8,07
71,
022,
782
1,02
2,78
297
9,31
41,
022,
782
979,
314
Crim
inal
& J
uven
ile J
ustic
e1,
260,
105
1,26
0,10
51,
260,
105
1,20
6,55
11,
260,
105
1,20
6,55
1H
uman
Rig
hts
Adm
inis
tratio
n22
4,18
422
3,02
922
3,02
921
3,55
022
3,02
921
3,55
0
Tota
l Hum
an R
ight
s, D
epar
tmen
t of
2,51
2,36
62,
505,
916
2,50
5,91
62,
399,
415
2,50
5,91
62,
399,
415
84

Stat
e of
Iow
aG
ener
al F
und
App
ropr
iatio
nsFY
201
8 an
d 20
19 G
over
nor's
Rec
omm
enda
tions
DES
CR
IPTI
ON
FY 2
016
FY 2
017
FY 2
018
FY 2
018
FY 2
019
FY 2
019
Act
ual
Bud
get
Estim
ate
Dep
artm
ent
Req
uest
Gov
erno
r'sR
ecom
men
ded
Dep
artm
ent
Req
uest
Gov
erno
r'sR
ecom
men
ded
Insp
ectio
ns &
App
eals
, Dep
artm
ent o
fAd
min
istra
tion
Div
isio
n54
5,24
254
2,43
454
2,43
451
9,38
154
2,43
451
9,38
1Ad
min
istra
tive
Hea
rings
Div
.67
8,94
267
5,44
567
5,44
564
6,73
967
5,44
564
6,73
9C
hild
Adv
ocac
y Bo
ard
2,68
0,29
02,
666,
487
2,66
6,48
72,
553,
161
2,66
6,48
72,
553,
161
Empl
oym
ent A
ppea
l Boa
rd42
,215
41,9
9841
,998
40,2
1341
,998
40,2
13Fo
od a
nd C
onsu
mer
Saf
ety
1,27
9,33
159
3,41
159
3,41
156
8,19
159
3,41
156
8,19
1H
ealth
Fac
ilitie
s D
ivis
ion
5,09
2,03
35,
065,
809
5,06
5,80
94,
850,
512
5,06
5,80
94,
850,
512
Inve
stig
atio
ns D
ivis
ion
2,57
3,08
92,
559,
838
2,55
9,83
82,
451,
045
2,55
9,83
82,
451,
045
Tota
l Ins
pect
ions
& A
ppea
ls, D
epar
tmen
t of
12,8
91,1
4212
,145
,422
12,1
45,4
2211
,629
,242
12,1
45,4
2211
,629
,242
Publ
ic D
efen
der
Indi
gent
Def
ense
App
ropr
iatio
n32
,751
,929
29,6
01,9
2933
,901
,929
33,9
01,9
2933
,901
,929
33,9
01,9
29Pu
blic
Def
ende
r26
,032
,243
26,1
82,2
4326
,182
,243
26,1
82,2
4326
,182
,243
26,1
82,2
43
Tota
l Pub
lic D
efen
der
58,7
84,1
7255
,784
,172
60,0
84,1
7260
,084
,172
60,0
84,1
7260
,084
,172
Man
agem
ent,
Dep
artm
ent o
fAp
peal
Boa
rd C
laim
s7,
134,
300
3,00
0,00
03,
000,
000
3,00
0,00
03,
000,
000
3,00
0,00
0D
epar
tmen
t of M
anag
emen
t Ope
ratio
ns2,
550,
220
2,53
7,08
62,
537,
086
2,53
7,08
62,
537,
086
2,53
7,08
6Sp
ecia
l Oly
mpi
cs F
und
100,
000
100,
000
100,
000
100,
000
100,
000
100,
000
Tech
nolo
gy R
einv
estm
ent F
und
Appr
opria
tion
--
17,5
00,0
0017
,500
,000
17,5
00,0
0017
,500
,000
Tota
l Man
agem
ent,
Dep
artm
ent o
f9,
784,
520
5,63
7,08
623
,137
,086
23,1
37,0
8623
,137
,086
23,1
37,0
86
Publ
ic In
form
atio
n B
oard
Iow
a Pu
blic
Info
rmat
ion
Boar
d35
0,00
034
8,19
834
8,19
834
8,19
834
8,19
834
8,19
8
Tota
l Pub
lic In
form
atio
n B
oard
350,
000
348,
198
348,
198
348,
198
348,
198
348,
198
85

Stat
e of
Iow
aG
ener
al F
und
App
ropr
iatio
nsFY
201
8 an
d 20
19 G
over
nor's
Rec
omm
enda
tions
DES
CR
IPTI
ON
FY 2
016
FY 2
017
FY 2
018
FY 2
018
FY 2
019
FY 2
019
Act
ual
Bud
get
Estim
ate
Dep
artm
ent
Req
uest
Gov
erno
r'sR
ecom
men
ded
Dep
artm
ent
Req
uest
Gov
erno
r'sR
ecom
men
ded
Rev
enue
, Dep
artm
ent o
fAg
Lan
d Ta
x C
redi
t39
,100
,000
39,1
00,0
0039
,100
,000
39,1
00,0
0039
,100
,000
39,1
00,0
00Bu
sine
ss P
rope
rty T
ax C
redi
t10
0,00
0,00
012
5,00
0,00
012
5,00
0,00
012
5,00
0,00
012
5,00
0,00
012
5,00
0,00
0C
omm
erci
al a
nd In
dust
rial P
rope
rty T
axR
epla
cem
ent
151,
263,
388
152,
114,
544
154,
636,
698
152,
114,
544
154,
636,
698
152,
114,
544
Elde
rly &
Dis
able
d Pr
oper
ty T
ax C
redi
t24
,693
,208
24,6
90,0
2826
,100
,000
25,0
60,3
7826
,100
,000
25,4
36,2
84H
omes
tead
Tax
Cre
dit A
id13
5,36
7,16
513
5,07
1,53
813
5,50
0,00
013
6,42
2,25
313
5,50
0,00
013
7,78
6,47
6M
ilitar
y Se
rvic
e Ta
x R
efun
ds1,
962,
031
1,96
1,23
42,
100,
000
1,90
2,39
72,
100,
000
1,84
5,32
5Pr
intin
g C
igar
ette
Sta
mps
118,
509
124,
652
124,
652
119,
354
124,
652
119,
354
Ref
und
Inco
me
Cor
p &
Fran
chis
e Sa
le0
--
--
-R
even
ue, D
epar
tmen
t of
17,8
80,8
3917
,788
,753
17,7
88,7
5317
,032
,731
17,7
88,7
5317
,032
,731
Scho
ol In
frast
ruct
ure
Tran
sfer
0-
--
--
Toba
cco
Prod
ucts
Tax
Ref
und
0-
--
--
Toba
cco
Rep
ortin
g R
equi
rem
ents
18,4
1618
,416
18,4
1617
,632
18,4
1617
,632
Tota
l Rev
enue
, Dep
artm
ent o
f47
0,40
3,55
649
5,86
9,16
550
0,36
8,51
949
6,76
9,28
950
0,36
8,51
949
8,45
2,34
6
Secr
etar
y of
Sta
teEl
ectio
ns/V
oter
Reg
-1,
440,
890
2,01
5,89
01,
379,
652
2,01
5,89
01,
379,
652
Secr
etar
y of
Sta
te-B
usin
ess
Serv
ices
2,89
6,69
91,
440,
891
1,74
3,49
11,
379,
653
1,77
5,84
61,
379,
653
Tota
l Sec
reta
ry o
f Sta
te2,
896,
699
2,88
1,78
13,
759,
381
2,75
9,30
53,
791,
736
2,75
9,30
5
Trea
sure
r of S
tate
Trea
sure
r - G
ener
al O
ffice
1,08
4,39
21,
078,
807
1,07
8,80
71,
032,
958
1,07
8,80
71,
032,
958
Tota
l Tre
asur
er o
f Sta
te1,
084,
392
1,07
8,80
71,
078,
807
1,03
2,95
81,
078,
807
1,03
2,95
8
TOTA
L A
DM
INIS
TRA
TIO
N A
ND
REG
ULA
TIO
N57
3,28
7,14
458
9,51
2,64
661
7,17
8,60
061
1,03
7,23
861
7,30
5,95
561
2,72
0,29
5
86

Stat
e of
Iow
aG
ener
al F
und
App
ropr
iatio
nsFY
201
8 an
d 20
19 G
over
nor's
Rec
omm
enda
tions
DES
CR
IPTI
ON
FY 2
016
FY 2
017
FY 2
018
FY 2
018
FY 2
019
FY 2
019
Act
ual
Bud
get
Estim
ate
Dep
artm
ent
Req
uest
Gov
erno
r'sR
ecom
men
ded
Dep
artm
ent
Req
uest
Gov
erno
r'sR
ecom
men
ded
AG
RIC
ULT
UR
E A
ND
NA
TUR
AL
RES
OU
RC
ES
Agr
icul
ture
and
Lan
d St
ewar
dshi
pAg
ricul
tura
l Edu
catio
n25
,000
25,0
0025
,000
25,0
0025
,000
25,0
00Fa
rmer
s w
ith D
isab
ilitie
s13
0,00
013
0,00
013
0,00
013
0,00
013
0,00
013
0,00
0G
F-Ad
min
istra
tive
Div
isio
n17
,655
,492
17,6
55,4
9218
,155
,492
16,7
02,6
5518
,155
,492
16,7
02,6
55G
F-Ag
Dra
inag
e W
ells
--
1,87
5,00
0-
1,87
5,00
0-
Iow
a Em
erge
ncy
Food
Pur
chas
e Pr
ogra
m-
100,
000
100,
000
100,
000
100,
000
100,
000
Loca
l Foo
d an
d Fa
rm75
,000
75,0
0075
,000
75,0
0075
,000
75,0
00M
ilk In
spec
tions
189,
196
189,
196
189,
196
189,
196
189,
196
189,
196
Wat
er Q
ualit
y In
itiat
ive
4,40
0,00
04,
400,
000
9,60
0,00
08,
100,
000
9,60
0,00
015
,600
,000
Tota
l Agr
icul
ture
and
Lan
d St
ewar
dshi
p22
,474
,688
22,5
74,6
8830
,149
,688
25,3
21,8
5130
,149
,688
32,8
21,8
51
Nat
ural
Res
ourc
esFl
oodp
lain
Man
agem
ent P
rogr
am1,
950,
000
1,95
0,00
01,
950,
000
1,95
0,00
01,
950,
000
1,95
0,00
0Fo
rest
ry H
ealth
Man
agem
ent
GF
500,
000
500,
000
500,
000
500,
000
500,
000
500,
000
GF-
Nat
ural
Res
ourc
es O
pera
tions
12,8
62,3
0712
,862
,307
12,8
62,3
0712
,211
,534
12,8
62,3
0712
,211
,534
Tota
l Nat
ural
Res
ourc
es15
,312
,307
15,3
12,3
0715
,312
,307
14,6
61,5
3415
,312
,307
14,6
61,5
34
TOTA
L A
GR
ICU
LTU
RE
AN
D N
ATU
RA
L R
ESO
UR
C37
,786
,995
37,8
86,9
9545
,461
,995
39,9
83,3
8545
,461
,995
47,4
83,3
85
87

Stat
e of
Iow
aG
ener
al F
und
App
ropr
iatio
nsFY
201
8 an
d 20
19 G
over
nor's
Rec
omm
enda
tions
DES
CR
IPTI
ON
FY 2
016
FY 2
017
FY 2
018
FY 2
018
FY 2
019
FY 2
019
Act
ual
Bud
get
Estim
ate
Dep
artm
ent
Req
uest
Gov
erno
r'sR
ecom
men
ded
Dep
artm
ent
Req
uest
Gov
erno
r'sR
ecom
men
ded
ECO
NO
MIC
DEV
ELO
PMEN
T
Cul
tura
l Affa
irs, D
epar
tmen
t of
Adm
inis
trativ
e D
ivis
ion
- Cul
tura
l Affa
irs17
6,88
217
6,88
217
6,88
216
8,87
817
6,88
216
8,87
8Ar
chiv
ing
Form
er G
over
nor's
Pap
ers
65,9
3365
,933
65,9
3365
,933
65,9
3365
,933
Arts
Cou
ncil
1,23
3,76
41,
233,
764
1,23
3,76
41,
200,
000
1,23
3,76
41,
200,
000
Battl
e Fl
ag S
tabi
lizat
ion
94,0
00-
--
--
Cou
nty
Endo
wm
ent F
undi
ng -
DC
A G
rant
s41
6,70
241
6,70
241
6,70
241
6,70
241
6,70
241
6,70
2C
ultu
ral G
rant
s17
2,09
017
2,09
017
2,09
017
2,09
017
2,09
017
2,09
0G
reat
Pla
ces
GF
150,
000
150,
000
150,
000
150,
000
150,
000
150,
000
His
toric
al S
ocie
ty3,
167,
701
3,16
7,70
13,
167,
701
2,95
2,90
93,
167,
701
2,95
2,90
9H
isto
ric S
ites
426,
398
426,
398
426,
398
426,
398
426,
398
426,
398
Rec
ords
Cen
ter R
ent -
GF
227,
243
227,
243
227,
243
227,
243
227,
243
227,
243
Tota
l Cul
tura
l Affa
irs, D
epar
tmen
t of
6,13
0,71
36,
036,
713
6,03
6,71
35,
780,
153
6,03
6,71
35,
780,
153
Econ
omic
Dev
elop
men
t Aut
horit
yC
ounc
ils o
f Gov
ernm
ents
(CO
Gs)
Ass
ista
nce
200,
000
200,
000
200,
000
190,
000
200,
000
190,
000
Econ
omic
Dev
elop
men
t App
rop
15,5
16,3
7215
,116
,372
15,1
16,3
7214
,485
,192
15,1
16,3
7214
,485
,192
Hom
e Ba
se Io
wa
Mar
ketin
g-
--
250,
000
-25
0,00
0IC
VS-P
rom
ise
178,
133
178,
133
178,
133
169,
226
178,
133
169,
226
Tour
ism
mar
ketin
g - A
djus
ted
Gro
ss R
ecei
pts
1,17
8,00
01,
124,
000
1,12
4,00
01,
067,
800
1,12
4,00
01,
067,
800
Wor
ld F
ood
Priz
e71
2,50
071
2,50
071
2,50
071
2,50
071
2,50
071
2,50
0
Tota
l Eco
nom
ic D
evel
opm
ent A
utho
rity
17,7
85,0
0517
,331
,005
17,3
31,0
0516
,874
,718
17,3
31,0
0516
,874
,718
Iow
a Fi
nanc
e A
utho
rity
Ren
t Sub
sidy
Pro
gram
658,
000
658,
000
858,
000
658,
000
858,
000
658,
000
Tota
l Iow
a Fi
nanc
e A
utho
rity
658,
000
658,
000
858,
000
658,
000
858,
000
658,
000
88

Stat
e of
Iow
aG
ener
al F
und
App
ropr
iatio
nsFY
201
8 an
d 20
19 G
over
nor's
Rec
omm
enda
tions
DES
CR
IPTI
ON
FY 2
016
FY 2
017
FY 2
018
FY 2
018
FY 2
019
FY 2
019
Act
ual
Bud
get
Estim
ate
Dep
artm
ent
Req
uest
Gov
erno
r'sR
ecom
men
ded
Dep
artm
ent
Req
uest
Gov
erno
r'sR
ecom
men
ded
Iow
a W
orkf
orce
Dev
elop
men
tEm
ploy
ee M
iscl
assi
ficat
ion
451,
458
451,
458
451,
458
432,
250
451,
458
432,
250
Futu
re R
eady
Iow
a Al
lianc
e-
--
--
10,0
00,0
00I3
Sta
te A
ccou
ntin
g Sy
stem
-27
4,81
927
4,81
927
4,81
927
4,81
927
4,81
9IW
D G
ener
al F
und
- Ope
ratio
ns4,
579,
916
4,30
5,09
74,
305,
097
3,79
8,46
94,
305,
097
3,79
8,46
9IW
D W
orke
rs C
omp
Ope
ratio
ns (G
F)3,
259,
044
3,25
9,04
43,
259,
044
3,45
9,04
43,
259,
044
3,45
9,04
4O
ffend
er R
eent
ry P
rogr
am35
8,46
435
8,46
435
8,46
428
8,90
935
8,46
428
8,90
9W
orkf
orce
Dev
elop
men
t Fie
ld O
ffice
s9,
179,
413
8,97
6,65
08,
976,
650
8,82
2,95
58,
976,
650
8,82
2,95
5
Tota
l Iow
a W
orkf
orce
Dev
elop
men
t17
,828
,295
17,6
25,5
3217
,625
,532
17,0
76,4
4617
,625
,532
27,0
76,4
46
Publ
ic E
mpl
oym
ent R
elat
ions
Boa
rdPE
R B
oard
- G
ener
al O
ffice
1,34
2,45
21,
342,
452
1,34
2,45
21,
342,
452
1,34
2,45
21,
342,
452
Tota
l Pub
lic E
mpl
oym
ent R
elat
ions
Boa
rd1,
342,
452
1,34
2,45
21,
342,
452
1,34
2,45
21,
342,
452
1,34
2,45
2
TOTA
L EC
ON
OM
IC D
EVEL
OPM
ENT
43,7
44,4
6542
,993
,702
43,1
93,7
0241
,731
,769
43,1
93,7
0251
,731
,769
89

Stat
e of
Iow
aG
ener
al F
und
App
ropr
iatio
nsFY
201
8 an
d 20
19 G
over
nor's
Rec
omm
enda
tions
DES
CR
IPTI
ON
FY 2
016
FY 2
017
FY 2
018
FY 2
018
FY 2
019
FY 2
019
Act
ual
Bud
get
Estim
ate
Dep
artm
ent
Req
uest
Gov
erno
r'sR
ecom
men
ded
Dep
artm
ent
Req
uest
Gov
erno
r'sR
ecom
men
ded
EDU
CA
TIO
N
Blin
d, D
epar
tmen
t of
Audi
o In
form
atio
n Se
rvic
es52
,000
52,0
0052
,000
52,0
0052
,000
52,0
00D
epar
tmen
t for
the
Blin
d2,
298,
358
2,29
8,35
82,
298,
358
2,20
0,67
82,
298,
358
2,20
0,67
8
Tota
l Blin
d, D
epar
tmen
t of
2,35
0,35
82,
350,
358
2,35
0,35
82,
252,
678
2,35
0,35
82,
252,
678
Col
lege
Stu
dent
Aid
Com
mis
sion
All I
owa
Opp
ortu
nity
Fos
ter C
are
Gra
nt P
rogr
am55
4,05
745
4,05
745
4,05
745
4,05
745
4,05
745
4,05
7Al
l Iow
a O
ppor
tuni
ty S
chol
arsh
ips
2,74
0,85
42,
840,
854
2,84
0,85
42,
840,
854
2,84
0,85
42,
840,
854
Barb
er a
nd C
osm
etol
ogy
Arts
& S
cien
ces
Tuiti
onG
rant
Pro
gram
36,9
3836
,938
36,9
3836
,938
36,9
3836
,938
Col
lege
Aid
Com
mis
sion
431,
896
431,
896
431,
896
431,
896
431,
896
431,
896
Des
Moi
nes
Uni
vers
ity P
rogr
ams
400,
973
400,
973
400,
973
400,
973
400,
973
400,
973
Nat
iona
l Gua
rd B
enef
its P
rogr
am5,
100,
233
2,10
0,00
05,
117,
760
5,11
7,76
05,
117,
760
5,11
7,76
0R
egis
tere
d N
urse
and
Nur
se E
duca
tor L
oan
Forg
iven
ess
Prog
ram
80,8
5280
,852
80,8
5280
,852
80,8
5280
,852
Rur
al Io
wa
Prim
ary
Car
e Lo
an R
epay
men
tPr
ogra
m1,
600,
000
1,60
0,00
01,
600,
000
1,12
4,50
21,
600,
000
1,12
4,50
2R
ural
Nur
se/P
A Lo
an P
rogr
am40
0,00
020
0,00
020
0,00
020
0,00
020
0,00
020
0,00
0Te
ache
r Sho
rtage
Loa
n Fo
rgiv
enes
s Pr
ogra
m39
2,45
239
2,45
239
2,45
239
2,45
239
2,45
239
2,45
2Te
ach
Iow
a Sc
hola
rs40
0,00
040
0,00
040
0,00
040
0,00
040
0,00
040
0,00
0Tu
ition
Gra
nt -
For-P
rofit
1,97
5,00
01,
975,
000
1,97
5,00
02,
014,
500
1,97
5,00
02,
054,
790
Tuiti
on G
rant
Pro
gram
-Sta
ndin
g48
,413
,448
48,9
39,6
8148
,939
,681
49,9
18,4
7548
,939
,681
50,9
16,8
45Vo
catio
nal T
echn
ical
Tui
tion
Gra
nt2,
250,
185
2,25
0,18
52,
250,
185
2,25
0,18
52,
250,
185
2,25
0,18
5
Tota
l Col
lege
Stu
dent
Aid
Com
mis
sion
64,7
76,8
8862
,102
,888
65,1
20,6
4865
,663
,444
65,1
20,6
4866
,702
,104
Educ
atio
n, D
epar
tmen
t of
Adm
inis
tratio
n6,
304,
047
6,05
4,04
76,
554,
047
6,08
9,04
76,
554,
047
6,08
9,04
7Ad
min
istra
tor M
ento
ring/
Coa
chin
g an
d Su
ppor
tSy
stem
1,00
0,00
01,
000,
000
1,00
0,00
050
0,00
01,
000,
000
500,
000
Area
Edu
catio
n Ag
ency
Dis
tribu
tion
1,00
0,00
01,
000,
000
1,00
0,00
0-
1,00
0,00
0-
90

Stat
e of
Iow
aG
ener
al F
und
App
ropr
iatio
nsFY
201
8 an
d 20
19 G
over
nor's
Rec
omm
enda
tions
DES
CR
IPTI
ON
FY 2
016
FY 2
017
FY 2
018
FY 2
018
FY 2
019
FY 2
019
Act
ual
Bud
get
Estim
ate
Dep
artm
ent
Req
uest
Gov
erno
r'sR
ecom
men
ded
Dep
artm
ent
Req
uest
Gov
erno
r'sR
ecom
men
ded
Area
Edu
catio
n Ag
ency
Sup
port
Syst
em1,
000,
000
1,00
0,00
01,
000,
000
957,
500
1,00
0,00
095
7,50
0At
tend
ance
Cen
ter P
erfo
rman
ce/W
ebsi
te &
Dat
aSy
stem
Sup
port
250,
000
250,
000
500,
000
237,
500
500,
000
237,
500
Chi
ld D
evel
opm
ent
12,6
06,1
9612
,606
,196
12,6
06,1
9612
,070
,433
12,6
06,1
9612
,070
,433
Com
m C
olle
ge S
alar
ies
500,
000
500,
000
500,
000
478,
750
500,
000
478,
750
Com
pete
ncy-
Base
d Ed
ucat
ion
425,
000
425,
000
425,
000
-42
5,00
0-
Com
pute
r Sci
ence
Pro
fess
iona
l Dev
elop
men
tIn
cent
ive
Fund
--
--
-50
0,00
0Ea
rly C
hild
hood
Iow
a Fa
mily
Sup
port
and
Pare
ntEd
ucat
ion
12,3
64,4
3412
,364
,434
12,3
64,4
3411
,838
,946
12,3
64,4
3411
,838
,946
Early
Chi
ldho
od Io
wa
Pres
choo
l Tui
tion
Assi
stan
ce5,
428,
877
5,42
8,87
75,
428,
877
5,19
8,15
05,
428,
877
5,19
8,15
0Ea
rly C
hild
hood
Iow
a - S
choo
l Rea
dy5,
386,
113
5,38
6,11
35,
386,
113
5,15
7,20
35,
386,
113
5,15
7,20
3Ea
rly H
ead
Star
t Pro
ject
s60
0,00
060
0,00
060
0,00
057
4,50
060
0,00
057
4,50
0Ea
rly W
arni
ng S
yste
m fo
r Lite
racy
2,00
0,00
02,
000,
000
3,20
0,00
03,
200,
000
3,20
0,00
03,
200,
000
Engl
ish
Lang
uage
Lite
racy
Gra
nt P
rogr
am50
0,00
050
0,00
050
0,00
047
8,75
050
0,00
047
8,75
0En
rich
Iow
a Li
brar
ies
2,57
4,22
82,
574,
228
2,57
4,22
82,
464,
823
2,57
4,22
82,
464,
823
Fine
Arts
Beg
inni
ng T
each
er M
ento
ring
Prog
ram
-25
,000
25,0
00-
25,0
00-
Iow
a O
n-Li
ne In
itiat
ive
1,50
0,00
0-
750,
000
500,
000
750,
000
500,
000
Iow
a R
eadi
ng R
esea
rch
Cen
ter
1,00
0,00
01,
000,
000
2,00
0,00
095
7,50
02,
000,
000
957,
500
Jobs
For
Am
eric
a's
Gra
ds70
0,00
070
0,00
070
0,00
067
0,25
070
0,00
067
0,25
0LE
A As
sess
men
t-
-10
,000
,000
-10
,000
,000
6,10
0,00
0M
erge
d Ar
ea S
choo
ls-G
en A
id20
1,27
4,64
720
4,29
0,60
520
4,29
0,60
519
9,69
4,06
620
4,29
0,60
520
3,86
1,59
4M
idw
este
rn H
ighe
r Edu
catio
n C
ompa
ct10
0,00
010
0,00
010
0,00
010
0,00
010
0,00
010
0,00
0O
nlin
e St
ate
Job
Post
ing
Syst
em25
0,00
025
0,00
025
0,00
023
0,00
025
0,00
023
0,00
0R
eadi
ng C
oach
ing
and
Prof
essi
onal
Lea
rnin
g-
-5,
500,
000
3,50
0,00
05,
500,
000
3,50
0,00
0R
egio
nal T
elec
omm
unic
atio
ns C
ounc
ils99
2,91
399
2,91
399
2,91
3-
992,
913
-Sa
c an
d Fo
x In
dian
Set
tlem
ent E
duca
tion
100,
000
100,
000
100,
000
95,7
5010
0,00
095
,750
Scho
ol F
ood
Serv
ice
2,17
6,79
72,
176,
797
2,37
6,79
72,
176,
797
2,37
6,79
72,
176,
797
Spec
ial E
duca
tion
Serv
ices
Birt
h to
31,
721,
400
1,72
1,40
01,
721,
400
1,72
1,40
01,
721,
400
1,72
1,40
0
91
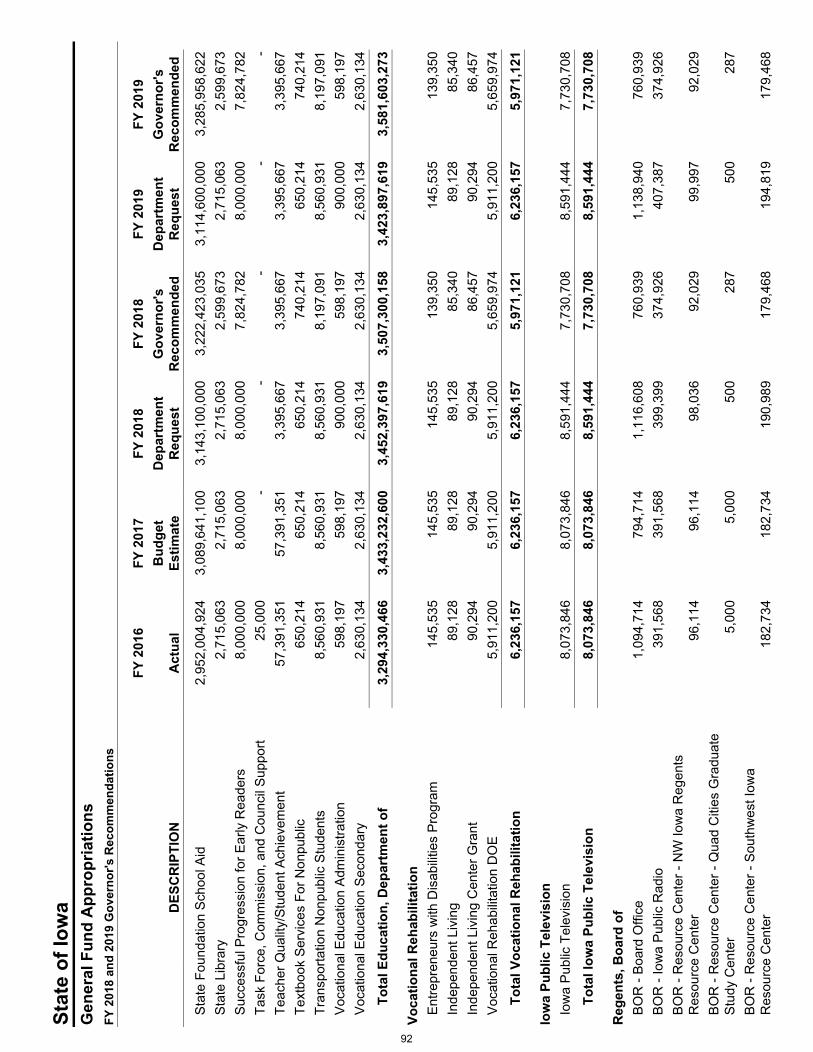
Stat
e of
Iow
aG
ener
al F
und
App
ropr
iatio
nsFY
201
8 an
d 20
19 G
over
nor's
Rec
omm
enda
tions
DES
CR
IPTI
ON
FY 2
016
FY 2
017
FY 2
018
FY 2
018
FY 2
019
FY 2
019
Act
ual
Bud
get
Estim
ate
Dep
artm
ent
Req
uest
Gov
erno
r'sR
ecom
men
ded
Dep
artm
ent
Req
uest
Gov
erno
r'sR
ecom
men
ded
Stat
e Fo
unda
tion
Scho
ol A
id2,
952,
004,
924
3,08
9,64
1,10
03,
143,
100,
000
3,22
2,42
3,03
53,
114,
600,
000
3,28
5,95
8,62
2St
ate
Libr
ary
2,71
5,06
32,
715,
063
2,71
5,06
32,
599,
673
2,71
5,06
32,
599,
673
Succ
essf
ul P
rogr
essi
on fo
r Ear
ly R
eade
rs8,
000,
000
8,00
0,00
08,
000,
000
7,82
4,78
28,
000,
000
7,82
4,78
2Ta
sk F
orce
, Com
mis
sion
, and
Cou
ncil
Supp
ort
25,0
00-
--
--
Teac
her Q
ualit
y/St
uden
t Ach
ieve
men
t57
,391
,351
57,3
91,3
513,
395,
667
3,39
5,66
73,
395,
667
3,39
5,66
7Te
xtbo
ok S
ervi
ces
For N
onpu
blic
650,
214
650,
214
650,
214
740,
214
650,
214
740,
214
Tran
spor
tatio
n N
onpu
blic
Stu
dent
s8,
560,
931
8,56
0,93
18,
560,
931
8,19
7,09
18,
560,
931
8,19
7,09
1Vo
catio
nal E
duca
tion
Adm
inis
tratio
n59
8,19
759
8,19
790
0,00
059
8,19
790
0,00
059
8,19
7Vo
catio
nal E
duca
tion
Seco
ndar
y2,
630,
134
2,63
0,13
42,
630,
134
2,63
0,13
42,
630,
134
2,63
0,13
4
Tota
l Edu
catio
n, D
epar
tmen
t of
3,29
4,33
0,46
63,
433,
232,
600
3,45
2,39
7,61
93,
507,
300,
158
3,42
3,89
7,61
93,
581,
603,
273
Voca
tiona
l Reh
abili
tatio
nEn
trepr
eneu
rs w
ith D
isab
ilitie
s Pr
ogra
m14
5,53
514
5,53
514
5,53
513
9,35
014
5,53
513
9,35
0In
depe
nden
t Liv
ing
89,1
2889
,128
89,1
2885
,340
89,1
2885
,340
Inde
pend
ent L
ivin
g C
ente
r Gra
nt90
,294
90,2
9490
,294
86,4
5790
,294
86,4
57Vo
catio
nal R
ehab
ilitat
ion
DO
E5,
911,
200
5,91
1,20
05,
911,
200
5,65
9,97
45,
911,
200
5,65
9,97
4
Tota
l Voc
atio
nal R
ehab
ilita
tion
6,23
6,15
76,
236,
157
6,23
6,15
75,
971,
121
6,23
6,15
75,
971,
121
Iow
a Pu
blic
Tel
evis
ion
Iow
a Pu
blic
Tel
evis
ion
8,07
3,84
68,
073,
846
8,59
1,44
47,
730,
708
8,59
1,44
47,
730,
708
Tota
l Iow
a Pu
blic
Tel
evis
ion
8,07
3,84
68,
073,
846
8,59
1,44
47,
730,
708
8,59
1,44
47,
730,
708
Reg
ents
, Boa
rd o
fBO
R -
Boar
d O
ffice
1,09
4,71
479
4,71
41,
116,
608
760,
939
1,13
8,94
076
0,93
9BO
R -
Iow
a Pu
blic
Rad
io39
1,56
839
1,56
839
9,39
937
4,92
640
7,38
737
4,92
6BO
R -
Res
ourc
e C
ente
r - N
W Io
wa
Reg
ents
Res
ourc
e C
ente
r96
,114
96,1
1498
,036
92,0
2999
,997
92,0
29BO
R -
Res
ourc
e C
ente
r - Q
uad
Citi
es G
radu
ate
Stud
y C
ente
r5,
000
5,00
050
028
750
028
7BO
R -
Res
ourc
e C
ente
r - S
outh
wes
t Iow
aR
esou
rce
Cen
ter
182,
734
182,
734
190,
989
179,
468
194,
819
179,
468
92

Stat
e of
Iow
aG
ener
al F
und
App
ropr
iatio
nsFY
201
8 an
d 20
19 G
over
nor's
Rec
omm
enda
tions
DES
CR
IPTI
ON
FY 2
016
FY 2
017
FY 2
018
FY 2
018
FY 2
019
FY 2
019
Act
ual
Bud
get
Estim
ate
Dep
artm
ent
Req
uest
Gov
erno
r'sR
ecom
men
ded
Dep
artm
ent
Req
uest
Gov
erno
r'sR
ecom
men
ded
IBS
- Iow
a Br
aille
and
Sig
ht S
avin
g Sc
hool
3,96
4,68
84,
053,
893
4,21
6,04
93,
962,
681
4,30
0,37
04,
045,
380
ISD
/IBS
- Lic
ense
d C
lass
room
Tea
cher
s82
,049
82,0
4982
,049
78,5
6282
,049
78,5
62IS
D/IB
S - R
egio
nal A
cade
my
--
245,
000
-24
9,90
0-
ISD
/IBS
- Tui
tion
and
Tran
spor
tatio
n11
,763
11,7
6311
,763
11,2
6311
,763
11,2
63IS
D -
Iow
a Sc
hool
for t
he D
eaf
9,50
9,25
79,
723,
215
10,1
12,1
449,
504,
442
10,3
14,3
879,
702,
796
ISU
- Ag
ricul
tura
l Exp
erim
ent S
tatio
n29
,886
,877
29,8
86,8
7730
,484
,615
28,6
16,6
8531
,094
,307
28,6
16,6
85IS
U -
Coo
pera
tive
Exte
nsio
n18
,266
,722
18,2
66,7
2218
,632
,056
17,4
90,3
8619
,004
,697
17,4
90,3
86IS
U -
Gen
eral
Uni
vers
ity18
2,18
1,85
218
4,39
9,85
218
8,08
7,84
918
0,25
0,85
519
1,84
9,60
618
4,01
2,61
2IS
U -
Iow
a N
utrie
nt R
esea
rch
Cen
ter
1,32
5,00
01,
325,
000
1,35
1,50
01,
268,
687
1,37
8,53
01,
268,
687
ISU
- Le
opol
d C
ente
r39
7,41
739
7,41
740
5,36
538
0,52
741
3,47
238
0,52
7IS
U -
Live
stoc
k D
isea
se R
esea
rch
172,
844
172,
844
176,
301
165,
498
179,
827
165,
498
ISU
- Sm
all B
usin
ess
Dev
elop
men
t Cen
ters
101,
000
101,
000
103,
020
96,7
0710
5,08
096
,707
ISU
- Ve
terin
ary
Dia
gnos
tic L
abor
ator
y4,
000,
000
4,00
0,00
04,
080,
000
3,83
0,00
04,
161,
600
3,83
0,00
0SU
I - B
ioca
taly
sis
723,
727
723,
727
738,
202
692,
969
752,
966
692,
969
SUI -
Fam
ily P
ract
ice
Prog
ram
1,78
8,26
51,
788,
265
1,82
4,03
01,
712,
264
1,86
0,51
11,
712,
264
SUI -
Gen
eral
Uni
vers
ity23
0,92
3,00
523
2,22
3,00
523
6,86
7,46
522
6,99
7,98
524
1,60
4,81
423
1,73
5,33
4SU
I - H
ygie
nic
Labo
rato
ry4,
402,
615
4,40
2,61
54,
490,
667
4,21
5,50
44,
580,
480
4,21
5,50
4SU
I - Io
wa
Birth
Def
ects
Reg
istry
38,2
8838
,288
39,0
5436
,661
39,8
3536
,661
SUI -
Iow
a Fl
ood
Cen
ter
1,50
0,00
01,
500,
000
1,53
0,00
01,
436,
250
1,56
0,60
01,
436,
250
SUI -
Iow
a N
onpr
ofit
Res
ourc
e C
ente
r16
2,53
916
2,53
916
5,79
015
5,63
116
9,10
615
5,63
1SU
I - Io
wa
Onl
ine
Adva
nced
Pla
cem
ent
Acad
emy
481,
849
481,
849
491,
486
461,
370
501,
316
461,
370
SUI -
Oak
dale
Cam
pus
2,18
6,55
82,
186,
558
2,23
0,28
92,
093,
629
2,27
4,89
52,
093,
629
SUI -
Prim
ary
Hea
lth C
are
648,
930
648,
930
661,
909
621,
350
675,
147
621,
350
SUI -
Spe
cial
ized
Chi
ldre
n H
ealth
Ser
vice
s(S
CH
S)65
9,45
665
9,45
667
2,64
563
1,42
968
6,09
863
1,42
9SU
I - S
tate
of I
owa
Can
cer R
egis
try14
9,05
114
9,05
115
2,03
214
2,71
615
5,07
314
2,71
6SU
I - S
ubst
ance
Abu
se C
onso
rtium
55,5
2955
,529
56,6
4053
,169
57,7
7353
,169
SUI -
UIH
C P
sych
iatry
and
Prim
ary
Car
eEx
pans
ion
--
1,00
0,00
0-
1,02
0,00
0-
93

Stat
e of
Iow
aG
ener
al F
und
App
ropr
iatio
nsFY
201
8 an
d 20
19 G
over
nor's
Rec
omm
enda
tions
DES
CR
IPTI
ON
FY 2
016
FY 2
017
FY 2
018
FY 2
018
FY 2
019
FY 2
019
Act
ual
Bud
get
Estim
ate
Dep
artm
ent
Req
uest
Gov
erno
r'sR
ecom
men
ded
Dep
artm
ent
Req
uest
Gov
erno
r'sR
ecom
men
ded
UIH
C -
Dis
prop
ortio
nate
Sha
re H
ospi
tals
--
6,00
0,00
0-
6,12
0,00
0-
UN
I - C
ente
r for
Vio
lenc
e Pr
even
tion
--
250,
000
250,
000
255,
000
250,
000
UN
I - M
ath
and
Scie
nce
Col
labo
rativ
e5,
200,
000
5,20
0,00
05,
700,
000
5,47
9,00
05,
814,
000
5,47
9,00
0U
NI -
Rea
l Est
ate
Educ
atio
n Pr
ogra
m12
5,30
212
5,30
212
7,80
811
9,97
713
0,36
411
9,97
7U
NI -
Rec
yclin
g an
d R
euse
Cen
ter
175,
256
175,
256
178,
761
167,
808
182,
336
167,
808
UN
I - U
nive
rsity
of N
orth
ern
Iow
a94
,276
,732
97,0
57,7
3210
1,49
8,88
794
,873
,933
103,
528,
865
96,8
53,9
11
Tota
l Reg
ents
, Boa
rd o
f59
5,16
6,70
160
1,46
8,86
462
4,46
8,90
858
7,20
5,58
763
6,95
6,41
059
7,96
5,72
4
TOTA
L ED
UC
ATI
ON
3,97
0,93
4,41
64,
113,
464,
713
4,15
9,16
5,13
44,
176,
123,
696
4,14
3,15
2,63
64,
262,
225,
608
94

Stat
e of
Iow
aG
ener
al F
und
App
ropr
iatio
nsFY
201
8 an
d 20
19 G
over
nor's
Rec
omm
enda
tions
DES
CR
IPTI
ON
FY 2
016
FY 2
017
FY 2
018
FY 2
018
FY 2
019
FY 2
019
Act
ual
Bud
get
Estim
ate
Dep
artm
ent
Req
uest
Gov
erno
r'sR
ecom
men
ded
Dep
artm
ent
Req
uest
Gov
erno
r'sR
ecom
men
ded
HU
MA
N S
ERVI
CES
Iow
a D
epar
tmen
t on
Agi
ngAg
ing
Prog
ram
s11
,399
,732
12,5
48,6
0312
,548
,603
12,0
15,2
8712
,548
,603
12,0
15,2
87O
ffice
of L
ong-
Term
Car
e O
mbu
dsm
an1,
276,
783
1,37
6,78
31,
376,
783
1,31
8,27
01,
376,
783
1,31
8,27
0
Tota
l Iow
a D
epar
tmen
t on
Agi
ng12
,676
,515
13,9
25,3
8613
,925
,386
13,3
33,5
5713
,925
,386
13,3
33,5
57
Publ
ic H
ealth
, Dep
artm
ent o
fAd
dict
ive
Dis
orde
rs27
,263
,690
26,9
88,6
9026
,988
,690
26,1
50,5
6426
,988
,690
26,1
50,5
64C
hron
ic C
ondi
tions
4,95
5,69
25,
080,
692
5,08
0,69
24,
089,
940
5,08
0,69
24,
089,
940
Com
mun
ity C
apac
ity8,
821,
335
7,33
9,13
67,
339,
136
5,17
6,45
27,
339,
136
5,17
6,45
2Es
sent
ial P
ublic
Hea
lth S
ervi
ces
7,29
7,14
27,
297,
142
7,29
7,14
28,
461,
770
7,29
7,14
28,
461,
770
Hea
lthy
Chi
ldre
n an
d Fa
milie
s4,
617,
543
5,69
3,77
45,
693,
774
5,57
2,15
15,
693,
774
5,57
2,15
1In
fect
ious
Dis
ease
s1,
335,
155
1,33
5,15
51,
335,
155
1,88
3,13
71,
335,
155
1,88
3,13
7Io
wa
Reg
istry
for C
onge
nita
l & In
herit
edD
isor
ders
216,
838
232,
500
232,
500
216,
563
232,
500
216,
563
Publ
ic P
rote
ctio
n4,
339,
191
4,39
9,19
14,
399,
191
4,29
2,42
14,
399,
191
4,29
2,42
1R
esou
rce
Man
agem
ent
855,
072
1,00
5,07
21,
005,
072
1,00
5,07
21,
005,
072
1,00
5,07
2
Tota
l Pub
lic H
ealth
, Dep
artm
ent o
f59
,701
,658
59,3
71,3
5259
,371
,352
56,8
48,0
7059
,371
,352
56,8
48,0
70
Hum
an S
ervi
ces
- Gen
eral
Adm
inis
trat
ion
Com
mis
sion
Of I
nqui
ry1,
394
1,39
41,
394
1,39
41,
394
1,39
4D
HS
- Dep
artm
ent W
ide
Dut
ies
-2,
879,
274
2,87
9,27
42,
879,
274
2,87
9,27
42,
879,
274
Gen
eral
Adm
inis
tratio
n14
,898
,198
15,6
73,1
9815
,673
,198
14,0
68,2
9215
,673
,198
14,0
68,2
92N
on R
esid
ent C
omm
itmen
t M.Il
l14
2,80
214
2,80
214
2,80
214
2,80
214
2,80
214
2,80
2N
on R
esid
ents
Tra
nsfe
rs67
--
--
-To
tal H
uman
Ser
vice
s - G
ener
alA
dmin
istr
atio
n15
,042
,461
18,6
96,6
6818
,696
,668
17,0
91,7
6218
,696
,668
17,0
91,7
62
95

Stat
e of
Iow
aG
ener
al F
und
App
ropr
iatio
nsFY
201
8 an
d 20
19 G
over
nor's
Rec
omm
enda
tions
DES
CR
IPTI
ON
FY 2
016
FY 2
017
FY 2
018
FY 2
018
FY 2
019
FY 2
019
Act
ual
Bud
get
Estim
ate
Dep
artm
ent
Req
uest
Gov
erno
r'sR
ecom
men
ded
Dep
artm
ent
Req
uest
Gov
erno
r'sR
ecom
men
ded
Hum
an S
ervi
ces
- Fie
ld O
pera
tions
Chi
ld S
uppo
rt R
ecov
erie
s14
,663
,373
14,6
63,3
7314
,663
,373
15,1
35,9
7014
,663
,373
15,1
35,9
70Fi
eld
Ope
ratio
ns58
,920
,976
54,4
42,8
7758
,920
,976
51,0
65,7
1158
,920
,976
51,0
65,7
11
Tota
l Hum
an S
ervi
ces
- Fie
ld O
pera
tions
73,5
84,3
4969
,106
,250
73,5
84,3
4966
,201
,681
73,5
84,3
4966
,201
,681
Hum
an S
ervi
ces
- Eld
ora
Trai
ning
Sch
ool
Eldo
ra T
rain
ing
Scho
ol12
,233
,420
12,2
33,4
2012
,233
,420
11,3
50,4
4312
,233
,420
11,3
50,4
43To
tal H
uman
Ser
vice
s - E
ldor
a Tr
aini
ngSc
hool
12,2
33,4
2012
,233
,420
12,2
33,4
2011
,350
,443
12,2
33,4
2011
,350
,443
Hum
an S
ervi
ces
- Che
roke
e C
CU
SOC
ivil
Com
mitm
ent U
nit f
or S
exua
l Offe
nder
s9,
893,
079
10,1
93,0
7910
,193
,079
9,46
4,74
710
,193
,079
9,46
4,74
7
Tota
l Hum
an S
ervi
ces
- Che
roke
e C
CU
SO9,
893,
079
10,1
93,0
7910
,193
,079
9,46
4,74
710
,193
,079
9,46
4,74
7
Hum
an S
ervi
ces
- Che
roke
eC
hero
kee
MH
I5,
545,
616
14,6
44,0
4114
,644
,041
13,8
70,2
5414
,644
,041
13,8
70,2
54
Tota
l Hum
an S
ervi
ces
- Che
roke
e5,
545,
616
14,6
44,0
4114
,644
,041
13,8
70,2
5414
,644
,041
13,8
70,2
54
Hum
an S
ervi
ces
- Ind
epen
denc
eIn
depe
nden
ce M
HI
10,3
24,2
0918
,552
,103
18,5
52,1
0317
,513
,621
18,5
52,1
0317
,513
,621
Tota
l Hum
an S
ervi
ces
- Ind
epen
denc
e10
,324
,209
18,5
52,1
0318
,552
,103
17,5
13,6
2118
,552
,103
17,5
13,6
21
Hum
an S
ervi
ces
- Gle
nwoo
dG
lenw
ood
Res
ourc
e C
ente
r21
,524
,482
20,7
19,4
8620
,719
,486
17,8
87,7
8120
,719
,486
17,8
87,7
81
Tota
l Hum
an S
ervi
ces
- Gle
nwoo
d21
,524
,482
20,7
19,4
8620
,719
,486
17,8
87,7
8120
,719
,486
17,8
87,7
81
Hum
an S
ervi
ces
- Woo
dwar
dW
oodw
ard
Res
ourc
e C
ente
r14
,583
,806
14,0
53,0
1114
,053
,011
12,0
77,0
3414
,053
,011
12,0
77,0
34
Tota
l Hum
an S
ervi
ces
- Woo
dwar
d14
,583
,806
14,0
53,0
1114
,053
,011
12,0
77,0
3414
,053
,011
12,0
77,0
34
96

Stat
e of
Iow
aG
ener
al F
und
App
ropr
iatio
nsFY
201
8 an
d 20
19 G
over
nor's
Rec
omm
enda
tions
DES
CR
IPTI
ON
FY 2
016
FY 2
017
FY 2
018
FY 2
018
FY 2
019
FY 2
019
Act
ual
Bud
get
Estim
ate
Dep
artm
ent
Req
uest
Gov
erno
r'sR
ecom
men
ded
Dep
artm
ent
Req
uest
Gov
erno
r'sR
ecom
men
ded
Hum
an S
ervi
ces
- Ass
ista
nce
Adop
tion
Subs
idy
42,9
98,2
8643
,046
,664
43,0
46,6
6442
,077
,910
43,0
46,6
6441
,944
,132
Chi
ld A
buse
Pre
vent
ion
216,
908
232,
570
232,
570
232,
570
232,
570
232,
570
Chi
ld a
nd F
amily
Ser
vice
s85
,341
,938
84,4
82,4
1989
,960
,517
90,1
55,1
1689
,960
,517
90,1
55,1
16C
hild
Car
e As
sist
ance
41,4
08,6
6836
,389
,561
40,2
16,0
4644
,812
,090
40,2
16,0
4645
,270
,211
Chi
ldre
n's
Hea
lth In
sura
nce
20,4
13,8
449,
176,
652
9,17
6,65
28,
518,
452
9,17
6,65
29,
018,
066
Con
ners
Tra
inin
g33
,632
33,6
3233
,632
33,6
3233
,632
33,6
32Fa
mily
Inve
stm
ent P
rogr
am/J
OBS
44,7
73,8
7548
,673
,875
48,6
73,8
7546
,004
,480
48,6
73,8
7546
,004
,480
Fam
ily S
uppo
rt Su
bsid
y1,
073,
932
1,06
9,28
21,
069,
282
1,06
9,28
21,
069,
282
1,06
9,28
2M
edic
al A
ssis
tanc
e1,
385,
191,
564
1,31
8,24
6,44
61,
348,
646,
963
1,35
4,21
4,41
11,
399,
451,
629
1,41
4,21
4,41
1M
edic
al C
ontra
cts
19,6
13,9
6417
,045
,964
18,3
13,9
6417
,626
,464
18,3
13,9
6417
,626
,464
MH
DS
Reg
iona
l Gra
nts
- Pol
k C
ount
y an
dEa
ster
n Io
wa
Reg
ion
-3,
000,
000
3,00
0,00
0-
3,00
0,00
0-
Stat
e Su
pple
men
tary
Ass
ista
nce
11,8
97,1
8711
,611
,442
11,6
11,4
4210
,372
,658
11,6
11,4
4210
,321
,657
Volu
ntee
rs84
,686
84,6
8684
,686
84,6
8684
,686
84,6
86
Tota
l Hum
an S
ervi
ces
- Ass
ista
nce
1,65
3,04
8,48
41,
573,
093,
193
1,61
4,06
6,29
31,
615,
201,
751
1,66
4,87
0,95
91,
675,
974,
707
Vete
rans
Affa
irs, D
epar
tmen
t of
Gen
eral
Adm
inis
tratio
n1,
200,
546
1,20
0,54
61,
200,
546
1,14
9,52
31,
200,
546
1,14
9,52
3Ve
tera
ns C
ount
y G
rant
s99
0,00
099
0,00
099
0,00
094
7,92
599
0,00
094
7,92
5Ve
ts H
ome
Ow
ners
hip
Prog
ram
2,50
0,00
02,
500,
000
2,50
0,00
02,
393,
750
2,50
0,00
02,
393,
750
Tota
l Vet
eran
s A
ffairs
, Dep
artm
ent o
f4,
690,
546
4,69
0,54
64,
690,
546
4,49
1,19
84,
690,
546
4,49
1,19
8
Iow
a Ve
tera
ns H
ome
Iow
a Ve
tera
ns H
ome
7,59
4,99
67,
594,
996
7,59
4,99
67,
272,
209
7,59
4,99
67,
272,
209
Tota
l Iow
a Ve
tera
ns H
ome
7,59
4,99
67,
594,
996
7,59
4,99
67,
272,
209
7,59
4,99
67,
272,
209
TOTA
L H
UM
AN
SER
VIC
ES1,
900,
443,
621
1,83
6,87
3,53
11,
882,
324,
730
1,86
2,60
4,10
81,
933,
129,
396
1,92
3,37
7,06
4
97

Stat
e of
Iow
aG
ener
al F
und
App
ropr
iatio
nsFY
201
8 an
d 20
19 G
over
nor's
Rec
omm
enda
tions
DES
CR
IPTI
ON
FY 2
016
FY 2
017
FY 2
018
FY 2
018
FY 2
019
FY 2
019
Act
ual
Bud
get
Estim
ate
Dep
artm
ent
Req
uest
Gov
erno
r'sR
ecom
men
ded
Dep
artm
ent
Req
uest
Gov
erno
r'sR
ecom
men
ded
JUST
ICE
SYST
EM
Just
ice,
Dep
artm
ent o
fFa
rm M
edia
tion
Serv
ices
--
300,
000
-30
0,00
0-
Gen
eral
Offi
ce A
.G.
7,98
9,90
57,
989,
905
7,98
9,90
57,
650,
334
7,98
9,90
57,
650,
334
Lega
l Ser
vice
s Po
verty
Gra
nts
2,40
0,00
02,
400,
000
2,90
0,00
02,
298,
000
2,90
0,00
02,
298,
000
Vict
im A
ssis
tanc
e G
rant
s6,
734,
400
6,73
4,40
06,
734,
400
6,44
8,18
86,
734,
400
6,44
8,18
8
Tota
l Jus
tice,
Dep
artm
ent o
f17
,124
,305
17,1
24,3
0517
,924
,305
16,3
96,5
2217
,924
,305
16,3
96,5
22
Civ
il R
ight
s C
omm
issi
onC
ivil
Rig
hts
Com
mis
sion
1,16
9,54
01,
169,
540
1,16
9,54
01,
169,
540
1,16
9,54
01,
169,
540
Tota
l Civ
il R
ight
s C
omm
issi
on1,
169,
540
1,16
9,54
01,
169,
540
1,16
9,54
01,
169,
540
1,16
9,54
0
Com
mun
ity B
ased
Cor
rect
ions
Dis
tric
t 1C
BC D
istri
ct I
14,7
87,9
7714
,787
,977
14,9
37,9
7714
,937
,977
14,9
37,9
7714
,937
,977
Tota
l Com
mun
ity B
ased
Cor
rect
ions
Dis
tric
t1
14,7
87,9
7714
,787
,977
14,9
37,9
7714
,937
,977
14,9
37,9
7714
,937
,977
Com
mun
ity B
ased
Cor
rect
ions
Dis
tric
t 2C
BC D
istri
ct II
11,5
00,6
6111
,500
,661
11,5
50,6
6111
,550
,661
11,5
50,6
6111
,550
,661
Tota
l Com
mun
ity B
ased
Cor
rect
ions
Dis
tric
t2
11,5
00,6
6111
,500
,661
11,5
50,6
6111
,550
,661
11,5
50,6
6111
,550
,661
Com
mun
ity B
ased
Cor
rect
ions
Dis
tric
t 3C
BC D
istri
ct II
I7,
241,
257
7,24
1,25
77,
241,
257
7,24
1,25
77,
241,
257
7,24
1,25
7To
tal C
omm
unity
Bas
ed C
orre
ctio
ns D
istr
ict
37,
241,
257
7,24
1,25
77,
241,
257
7,24
1,25
77,
241,
257
7,24
1,25
7
Com
mun
ity B
ased
Cor
rect
ions
Dis
tric
t 4C
BC D
istri
ct IV
5,63
8,00
55,
638,
005
5,73
8,00
55,
738,
005
5,73
8,00
55,
738,
005
Tota
l Com
mun
ity B
ased
Cor
rect
ions
Dis
tric
t4
5,63
8,00
55,
638,
005
5,73
8,00
55,
738,
005
5,73
8,00
55,
738,
005
98

Stat
e of
Iow
aG
ener
al F
und
App
ropr
iatio
nsFY
201
8 an
d 20
19 G
over
nor's
Rec
omm
enda
tions
DES
CR
IPTI
ON
FY 2
016
FY 2
017
FY 2
018
FY 2
018
FY 2
019
FY 2
019
Act
ual
Bud
get
Estim
ate
Dep
artm
ent
Req
uest
Gov
erno
r'sR
ecom
men
ded
Dep
artm
ent
Req
uest
Gov
erno
r'sR
ecom
men
ded
Com
mun
ity B
ased
Cor
rect
ions
Dis
tric
t 5C
BC D
istri
ct V
21,0
78,3
9321
,078
,393
21,7
78,3
9321
,778
,393
21,7
78,3
9321
,778
,393
Tota
l Com
mun
ity B
ased
Cor
rect
ions
Dis
tric
t5
21,0
78,3
9321
,078
,393
21,7
78,3
9321
,778
,393
21,7
78,3
9321
,778
,393
Com
mun
ity B
ased
Cor
rect
ions
Dis
tric
t 6C
BC D
istri
ct V
I14
,863
,623
14,8
63,6
2314
,863
,623
14,8
63,6
2314
,863
,623
14,8
63,6
23To
tal C
omm
unity
Bas
ed C
orre
ctio
ns D
istr
ict
614
,863
,623
14,8
63,6
2314
,863
,623
14,8
63,6
2314
,863
,623
14,8
63,6
23
Com
mun
ity B
ased
Cor
rect
ions
Dis
tric
t 7C
BC D
istri
ct V
II7,
856,
873
7,85
6,87
37,
856,
873
7,85
6,87
37,
856,
873
7,85
6,87
3To
tal C
omm
unity
Bas
ed C
orre
ctio
ns D
istr
ict
77,
856,
873
7,85
6,87
37,
856,
873
7,85
6,87
37,
856,
873
7,85
6,87
3
Com
mun
ity B
ased
Cor
rect
ions
Dis
tric
t 8C
BC D
istri
ct V
III8,
167,
194
8,16
7,19
48,
167,
194
8,16
7,19
48,
167,
194
8,16
7,19
4To
tal C
omm
unity
Bas
ed C
orre
ctio
ns D
istr
ict
88,
167,
194
8,16
7,19
48,
167,
194
8,16
7,19
48,
167,
194
8,16
7,19
4
Cor
rect
ions
-Cen
tral
Offi
ceC
orre
ctio
ns A
dmin
istra
tion
7,17
0,01
05,
270,
010
5,27
0,01
05,
270,
010
5,27
0,01
05,
270,
010
Cor
rect
ions
Edu
catio
n2,
608,
109
2,60
8,10
92,
608,
109
2,60
8,10
92,
608,
109
2,60
8,10
9C
ount
y C
onfin
emen
t1,
075,
092
1,07
5,09
21,
075,
092
1,82
5,09
21,
075,
092
1,82
5,09
2D
OC
- D
epar
tmen
t Wid
e D
utie
s-
3,40
7,80
8-
(10,
014,
503)
-(1
0,01
4,50
3)Fe
dera
l Pris
oner
s/ C
ontra
ctua
l48
4,41
148
4,41
148
4,41
148
4,41
148
4,41
148
4,41
1Io
wa
Cor
rect
ions
Offe
nder
Net
wor
k2,
000,
000
2,00
0,00
02,
000,
000
2,00
0,00
02,
000,
000
2,00
0,00
0M
enta
l Hea
lth/S
ubst
ance
Abu
se -
DO
C w
ide
22,3
1922
,319
22,3
1922
,319
22,3
1922
,319
Stat
e C
ases
Cou
rt C
osts
-10
,000
10,0
0010
,000
10,0
0010
,000
Tota
l Cor
rect
ions
-Cen
tral
Offi
ce13
,359
,941
14,8
77,7
4911
,469
,941
2,20
5,43
811
,469
,941
2,20
5,43
8
99
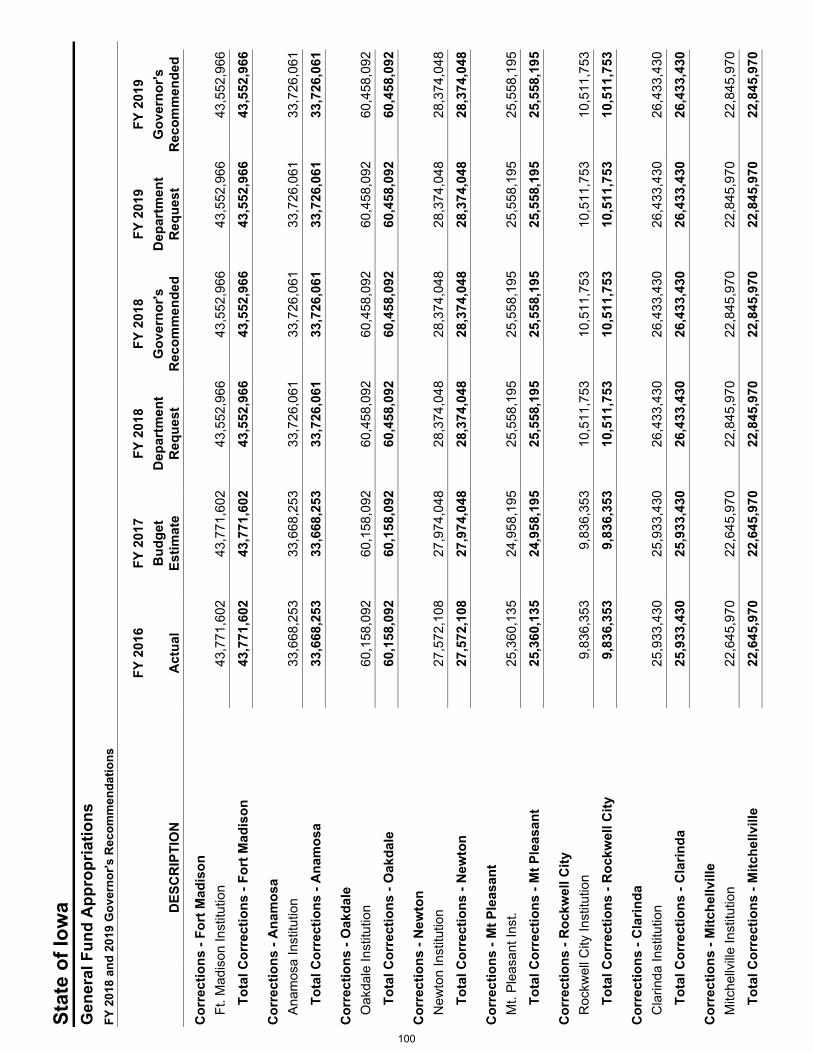
Stat
e of
Iow
aG
ener
al F
und
App
ropr
iatio
nsFY
201
8 an
d 20
19 G
over
nor's
Rec
omm
enda
tions
DES
CR
IPTI
ON
FY 2
016
FY 2
017
FY 2
018
FY 2
018
FY 2
019
FY 2
019
Act
ual
Bud
get
Estim
ate
Dep
artm
ent
Req
uest
Gov
erno
r'sR
ecom
men
ded
Dep
artm
ent
Req
uest
Gov
erno
r'sR
ecom
men
ded
Cor
rect
ions
- Fo
rt M
adis
onFt
. Mad
ison
Inst
itutio
n43
,771
,602
43,7
71,6
0243
,552
,966
43,5
52,9
6643
,552
,966
43,5
52,9
66
Tota
l Cor
rect
ions
- Fo
rt M
adis
on43
,771
,602
43,7
71,6
0243
,552
,966
43,5
52,9
6643
,552
,966
43,5
52,9
66
Cor
rect
ions
- A
nam
osa
Anam
osa
Inst
itutio
n33
,668
,253
33,6
68,2
5333
,726
,061
33,7
26,0
6133
,726
,061
33,7
26,0
61
Tota
l Cor
rect
ions
- A
nam
osa
33,6
68,2
5333
,668
,253
33,7
26,0
6133
,726
,061
33,7
26,0
6133
,726
,061
Cor
rect
ions
- O
akda
leO
akda
le In
stitu
tion
60,1
58,0
9260
,158
,092
60,4
58,0
9260
,458
,092
60,4
58,0
9260
,458
,092
Tota
l Cor
rect
ions
- O
akda
le60
,158
,092
60,1
58,0
9260
,458
,092
60,4
58,0
9260
,458
,092
60,4
58,0
92
Cor
rect
ions
- N
ewto
nN
ewto
n In
stitu
tion
27,5
72,1
0827
,974
,048
28,3
74,0
4828
,374
,048
28,3
74,0
4828
,374
,048
Tota
l Cor
rect
ions
- N
ewto
n27
,572
,108
27,9
74,0
4828
,374
,048
28,3
74,0
4828
,374
,048
28,3
74,0
48
Cor
rect
ions
- M
t Ple
asan
tM
t. Pl
easa
nt In
st.
25,3
60,1
3524
,958
,195
25,5
58,1
9525
,558
,195
25,5
58,1
9525
,558
,195
Tota
l Cor
rect
ions
- M
t Ple
asan
t25
,360
,135
24,9
58,1
9525
,558
,195
25,5
58,1
9525
,558
,195
25,5
58,1
95
Cor
rect
ions
- R
ockw
ell C
ityR
ockw
ell C
ity In
stitu
tion
9,83
6,35
39,
836,
353
10,5
11,7
5310
,511
,753
10,5
11,7
5310
,511
,753
Tota
l Cor
rect
ions
- R
ockw
ell C
ity9,
836,
353
9,83
6,35
310
,511
,753
10,5
11,7
5310
,511
,753
10,5
11,7
53
Cor
rect
ions
- C
larin
daC
larin
da In
stitu
tion
25,9
33,4
3025
,933
,430
26,4
33,4
3026
,433
,430
26,4
33,4
3026
,433
,430
Tota
l Cor
rect
ions
- C
larin
da25
,933
,430
25,9
33,4
3026
,433
,430
26,4
33,4
3026
,433
,430
26,4
33,4
30
Cor
rect
ions
- M
itche
llvill
eM
itche
llville
Inst
itutio
n22
,645
,970
22,6
45,9
7022
,845
,970
22,8
45,9
7022
,845
,970
22,8
45,9
70
Tota
l Cor
rect
ions
- M
itche
llvill
e22
,645
,970
22,6
45,9
7022
,845
,970
22,8
45,9
7022
,845
,970
22,8
45,9
70
100

Stat
e of
Iow
aG
ener
al F
und
App
ropr
iatio
nsFY
201
8 an
d 20
19 G
over
nor's
Rec
omm
enda
tions
DES
CR
IPTI
ON
FY 2
016
FY 2
017
FY 2
018
FY 2
018
FY 2
019
FY 2
019
Act
ual
Bud
get
Estim
ate
Dep
artm
ent
Req
uest
Gov
erno
r'sR
ecom
men
ded
Dep
artm
ent
Req
uest
Gov
erno
r'sR
ecom
men
ded
Cor
rect
ions
- Fo
rt D
odge
Ft. D
odge
Inst
itutio
n30
,097
,648
30,0
97,6
4829
,990
,884
29,9
90,8
8429
,990
,884
29,9
90,8
84
Tota
l Cor
rect
ions
- Fo
rt D
odge
30,0
97,6
4830
,097
,648
29,9
90,8
8429
,990
,884
29,9
90,8
8429
,990
,884
Law
Enf
orce
men
t Aca
dem
yIo
wa
Law
Enf
orce
men
t Aca
dem
y1,
003,
214
1,00
3,21
41,
003,
214
960,
577
1,00
3,21
496
0,57
7
Tota
l Law
Enf
orce
men
t Aca
dem
y1,
003,
214
1,00
3,21
41,
003,
214
960,
577
1,00
3,21
496
0,57
7
Paro
le B
oard
Paro
le B
oard
1,20
4,58
31,
204,
583
1,20
4,58
31,
204,
583
1,20
4,58
31,
204,
583
Tota
l Par
ole
Boa
rd1,
204,
583
1,20
4,58
31,
204,
583
1,20
4,58
31,
204,
583
1,20
4,58
3
Publ
ic D
efen
se, D
epar
tmen
t of
Com
pens
atio
n an
d Ex
pens
e15
6,14
634
4,64
434
4,64
434
4,64
434
4,64
434
4,64
4Pu
blic
Def
ense
, Dep
artm
ent o
f6,
554,
478
6,55
4,47
86,
554,
478
6,26
1,26
66,
554,
478
6,26
1,26
6
Tota
l Pub
lic D
efen
se, D
epar
tmen
t of
6,71
0,62
46,
899,
122
6,89
9,12
26,
605,
910
6,89
9,12
26,
605,
910
Hom
elan
d Se
curit
y an
d Em
erge
ncy
Man
agem
ent
Hom
elan
d Se
curit
y &
Emer
genc
y M
gmt.
Div
isio
n2,
229,
623
2,22
9,62
32,
229,
623
2,13
4,86
42,
229,
623
2,13
4,86
4To
tal H
omel
and
Secu
rity
and
Emer
genc
yM
anag
emen
t2,
229,
623
2,22
9,62
32,
229,
623
2,13
4,86
42,
229,
623
2,13
4,86
4
101

Stat
e of
Iow
aG
ener
al F
und
App
ropr
iatio
nsFY
201
8 an
d 20
19 G
over
nor's
Rec
omm
enda
tions
DES
CR
IPTI
ON
FY 2
016
FY 2
017
FY 2
018
FY 2
018
FY 2
019
FY 2
019
Act
ual
Bud
get
Estim
ate
Dep
artm
ent
Req
uest
Gov
erno
r'sR
ecom
men
ded
Dep
artm
ent
Req
uest
Gov
erno
r'sR
ecom
men
ded
Publ
ic S
afet
y, D
epar
tmen
t of
DC
I - C
rime
Lab
Equi
pmen
t/Tra
inin
g30
2,34
530
2,34
530
2,34
530
2,34
530
2,34
530
2,34
5D
PS F
ire M
arsh
al4,
651,
010
4,65
1,01
04,
758,
714
4,75
8,71
44,
758,
714
4,75
8,71
4D
PS -
Hum
an T
raffi
ckin
g-
200,
000
200,
000
200,
000
200,
000
200,
000
DPS
-PO
R U
nfun
ded
Liab
ilitie
s U
ntil
85 P
erce
nt5,
000,
000
2,50
0,00
05,
000,
000
5,00
0,00
05,
000,
000
5,00
0,00
0D
PS/S
POC
Sic
k Le
ave
Payo
ut27
9,51
727
9,51
727
9,51
727
9,51
727
9,51
727
9,51
7Fi
re F
ight
er T
rain
ing
825,
520
825,
520
825,
520
825,
520
825,
520
825,
520
Iow
a St
ate
Patro
l61
,501
,575
61,5
01,5
7562
,546
,340
62,5
46,3
4062
,546
,340
62,5
46,3
40N
arco
tics
Enfo
rcem
ent
7,39
1,03
97,
391,
039
7,57
3,30
07,
573,
300
7,57
3,30
07,
573,
300
Publ
ic S
afet
y Ad
min
istra
tion
4,22
6,13
14,
226,
131
4,33
7,03
44,
337,
034
4,33
7,03
44,
337,
034
Publ
ic S
afet
y D
CI
13,7
96,5
4413
,796
,544
14,1
85,8
8414
,185
,884
14,1
85,8
8414
,185
,884
Publ
ic S
afet
y - D
epar
tmen
t Wid
e D
utie
s-
1,83
4,97
3-
(2,5
03,6
25)
-(2
,503
,625
)Pu
blic
Saf
ety
Und
erco
ver F
unds
109,
042
109,
042
109,
042
109,
042
109,
042
109,
042
Stat
ewid
e In
tero
pera
ble
Com
mun
icat
ions
Syst
em.
154,
661
154,
661
200,
722
154,
661
271,
066
154,
661
Tota
l Pub
lic S
afet
y, D
epar
tmen
t of
98,2
37,3
8497
,772
,357
100,
318,
418
97,7
68,7
3210
0,38
8,76
297
,768
,732
TOTA
L JU
STIC
E SY
STEM
511,
216,
788
512,
458,
067
515,
804,
128
502,
031,
548
515,
874,
472
502,
031,
548
102
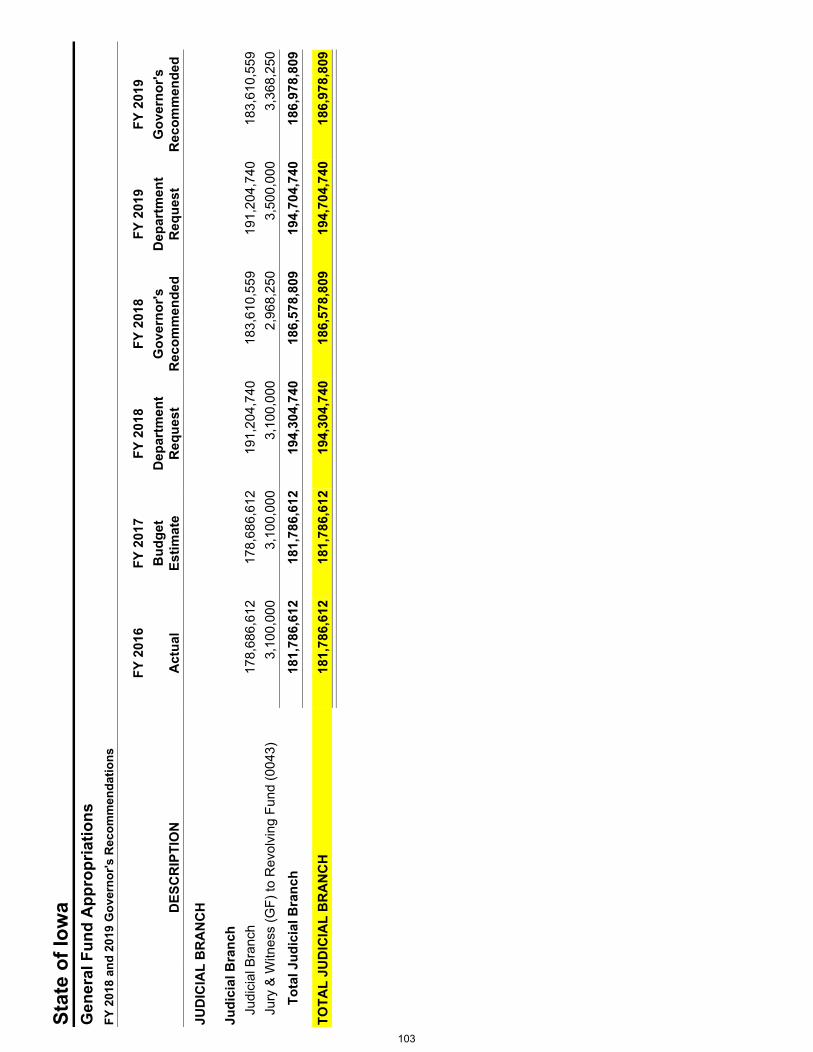
Stat
e of
Iow
aG
ener
al F
und
App
ropr
iatio
nsFY
201
8 an
d 20
19 G
over
nor's
Rec
omm
enda
tions
DES
CR
IPTI
ON
FY 2
016
FY 2
017
FY 2
018
FY 2
018
FY 2
019
FY 2
019
Act
ual
Bud
get
Estim
ate
Dep
artm
ent
Req
uest
Gov
erno
r'sR
ecom
men
ded
Dep
artm
ent
Req
uest
Gov
erno
r'sR
ecom
men
ded
JUD
ICIA
L B
RA
NC
H
Judi
cial
Bra
nch
Judi
cial
Bra
nch
178,
686,
612
178,
686,
612
191,
204,
740
183,
610,
559
191,
204,
740
183,
610,
559
Jury
& W
itnes
s (G
F) to
Rev
olvi
ng F
und
(004
3)3,
100,
000
3,10
0,00
03,
100,
000
2,96
8,25
03,
500,
000
3,36
8,25
0
Tota
l Jud
icia
l Bra
nch
181,
786,
612
181,
786,
612
194,
304,
740
186,
578,
809
194,
704,
740
186,
978,
809
TOTA
L JU
DIC
IAL
BR
AN
CH
181,
786,
612
181,
786,
612
194,
304,
740
186,
578,
809
194,
704,
740
186,
978,
809
103

Stat
e of
Iow
aG
ener
al F
und
App
ropr
iatio
nsFY
201
8 an
d 20
19 G
over
nor's
Rec
omm
enda
tions
DES
CR
IPTI
ON
FY 2
016
FY 2
017
FY 2
018
FY 2
018
FY 2
019
FY 2
019
Act
ual
Bud
get
Estim
ate
Dep
artm
ent
Req
uest
Gov
erno
r'sR
ecom
men
ded
Dep
artm
ent
Req
uest
Gov
erno
r'sR
ecom
men
ded
LEG
ISLA
TIVE
BR
AN
CH
Hou
se o
f Rep
rese
ntat
ives
Hou
se11
,759
,843
10,5
08,7
8612
,236
,258
11,7
89,6
3512
,236
,258
11,7
89,6
35
Tota
l Hou
se o
f Rep
rese
ntat
ives
11,7
59,8
4310
,508
,786
12,2
36,2
5811
,789
,635
12,2
36,2
5811
,789
,635
Sena
teSe
nate
8,98
6,83
57,
464,
625
8,69
1,68
78,
374,
440
8,69
1,68
78,
374,
440
Tota
l Sen
ate
8,98
6,83
57,
464,
625
8,69
1,68
78,
374,
440
8,69
1,68
78,
374,
440
Join
t Exp
ense
s of
Leg
isla
ture
Join
t Leg
isla
tive
Expe
nses
1,25
3,52
089
2,58
11,
039,
307
1,00
1,37
21,
039,
307
1,00
1,37
2
Tota
l Joi
nt E
xpen
ses
of L
egis
latu
re1,
253,
520
892,
581
1,03
9,30
71,
001,
372
1,03
9,30
71,
001,
372
Om
buds
man
, Offi
ce o
fC
itize
ns A
ide
1,71
8,97
41,
491,
724
1,73
6,93
91,
673,
541
1,73
6,93
91,
673,
541
Tota
l Om
buds
man
, Offi
ce o
f1,
718,
974
1,49
1,72
41,
736,
939
1,67
3,54
11,
736,
939
1,67
3,54
1
Legi
slat
ive
Serv
ices
Age
ncy
Inte
rnat
iona
l Rel
atio
ns A
ccou
nt6,
600
10,0
00-
--
-Le
gisl
ativ
e Se
rvic
es A
genc
y11
,921
,944
12,4
92,2
8414
,545
,809
14,0
14,8
8714
,545
,809
14,0
14,8
87
Tota
l Leg
isla
tive
Serv
ices
Age
ncy
11,9
28,5
4412
,502
,284
14,5
45,8
0914
,014
,887
14,5
45,8
0914
,014
,887
TOTA
L LE
GIS
LATI
VE B
RA
NC
H35
,647
,716
32,8
60,0
0038
,250
,000
36,8
53,8
7538
,250
,000
36,8
53,8
75
Tota
l Gen
eral
Fun
d7,
254,
847,
756
7,34
7,83
6,26
67,
495,
683,
029
7,45
6,94
4,42
87,
531,
072,
896
7,62
3,40
2,35
3
104
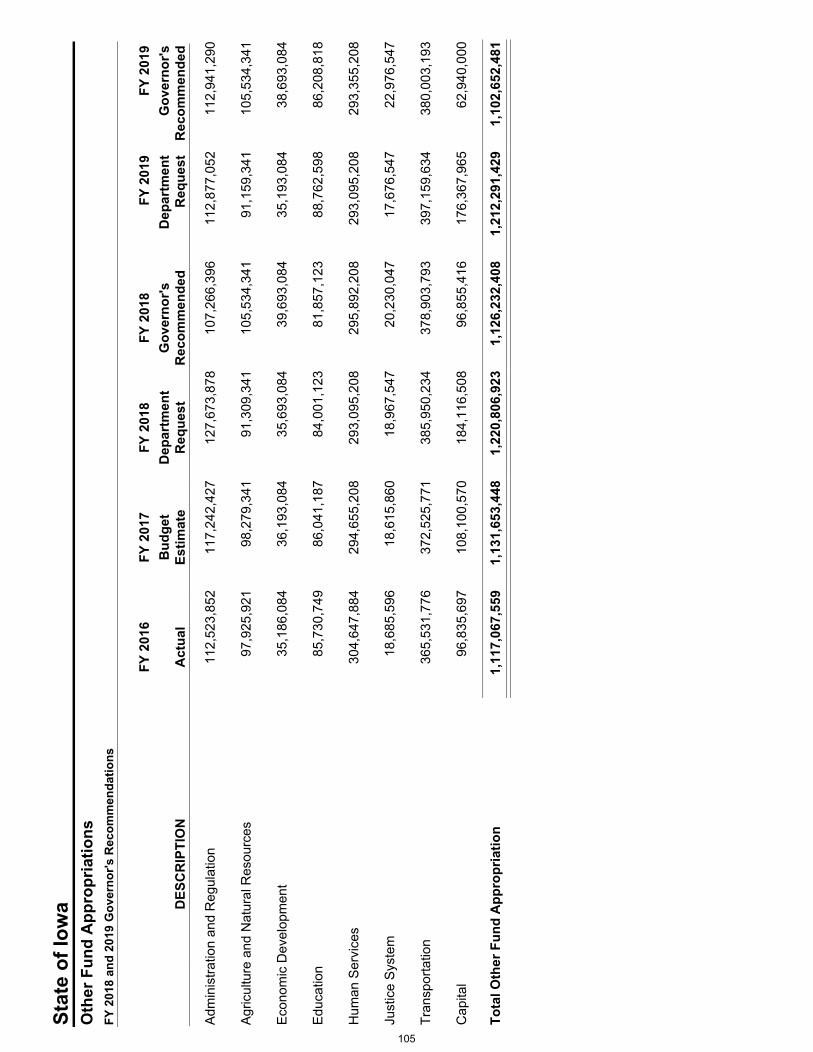
Stat
e of
Iow
aO
ther
Fun
d A
ppro
pria
tions
FY 2
018
and
2019
Gov
erno
r's R
ecom
men
datio
ns
Adm
inis
tratio
n an
d R
egul
atio
n11
2,52
3,85
211
7,24
2,42
712
7,67
3,87
810
7,26
6,39
611
2,87
7,05
211
2,94
1,29
0
Agric
ultu
re a
nd N
atur
al R
esou
rces
97,9
25,9
2198
,279
,341
91,3
09,3
4110
5,53
4,34
191
,159
,341
105,
534,
341
Econ
omic
Dev
elop
men
t35
,186
,084
36,1
93,0
8435
,693
,084
39,6
93,0
8435
,193
,084
38,6
93,0
84
Educ
atio
n85
,730
,749
86,0
41,1
8784
,001
,123
81,8
57,1
2388
,762
,598
86,2
08,8
18
Hum
an S
ervi
ces
304,
647,
884
294,
655,
208
293,
095,
208
295,
892,
208
293,
095,
208
293,
355,
208
Just
ice
Syst
em18
,685
,596
18,6
15,8
6018
,967
,547
20,2
30,0
4717
,676
,547
22,9
76,5
47
Tran
spor
tatio
n36
5,53
1,77
637
2,52
5,77
138
5,95
0,23
437
8,90
3,79
339
7,15
9,63
438
0,00
3,19
3
Cap
ital
96,8
35,6
9710
8,10
0,57
018
4,11
6,50
896
,855
,416
176,
367,
965
62,9
40,0
00
Tota
l Oth
er F
und
App
ropr
iatio
n1,
117,
067,
559
1,13
1,65
3,44
81,
220,
806,
923
1,12
6,23
2,40
81,
212,
291,
429
1,10
2,65
2,48
1
FY 2
016
FY 2
017
FY 2
018
FY 2
018
FY 2
019
FY 2
019
DES
CR
IPTI
ON
Act
ual
Bud
get
Estim
ate
Dep
artm
ent
Req
uest
Gov
erno
r'sR
ecom
men
ded
Dep
artm
ent
Req
uest
Gov
erno
r'sR
ecom
men
ded
105

Stat
e of
Iow
aO
ther
Fun
d A
ppro
pria
tions
FY 2
018
and
2019
Gov
erno
r's R
ecom
men
datio
ns
FY 2
016
FY 2
017
FY 2
018
FY 2
018
FY 2
019
FY 2
019
DES
CR
IPTI
ON
Act
ual
Bud
get
Estim
ate
Dep
artm
ent
Req
uest
Gov
erno
r'sR
ecom
men
ded
Dep
artm
ent
Req
uest
Gov
erno
r'sR
ecom
men
ded
0006
- Io
wa
Skill
ed W
orke
r and
Job
Cre
atio
n Fu
nd
Econ
omic
Dev
elop
men
t Aut
horit
yH
igh
Qua
lity
Job
Cre
atio
n-Fu
nd 0
006
16,9
00,0
0015
,900
,000
15,9
00,0
0015
,900
,000
15,9
00,0
0015
,900
,000
STEM
Sch
olar
ship
s-
1,00
0,00
01,
000,
000
1,00
0,00
01,
000,
000
1,00
0,00
0To
tal E
cono
mic
Dev
elop
men
t Aut
horit
y16
,900
,000
16,9
00,0
0016
,900
,000
16,9
00,0
0016
,900
,000
16,9
00,0
00
Iow
a W
orkf
orce
Dev
elop
men
tAM
OS
A M
id-Io
wa
Org
aniz
ing
Stra
tegy
ISW
JCF
100,
000
100,
000
100,
000
100,
000
100,
000
100,
000
Tota
l Iow
a W
orkf
orce
Dev
elop
men
t10
0,00
010
0,00
010
0,00
010
0,00
010
0,00
010
0,00
0
Tota
l Eco
nom
ic D
evel
opm
ent
17,0
00,0
0017
,000
,000
17,0
00,0
0017
,000
,000
17,0
00,0
0017
,000
,000
Educ
atio
n, D
epar
tmen
t of
ACE
Infra
stru
ctur
e - S
WJC
F6,
000,
000
6,00
0,00
06,
000,
000
6,00
0,00
06,
000,
000
6,00
0,00
0Ad
ult L
itera
cy fo
r the
Wor
kfor
ce -
SWJC
F5,
500,
000
5,50
0,00
05,
500,
000
5,50
0,00
05,
500,
000
5,50
0,00
0G
ap T
uitio
n As
sist
ance
Fun
d - S
WJC
F2,
000,
000
2,00
0,00
02,
000,
000
2,00
0,00
02,
000,
000
2,00
0,00
0PA
CE
and
Reg
iona
l Sec
tors
- SW
JCF
5,00
0,00
05,
000,
000
5,00
0,00
05,
000,
000
5,00
0,00
05,
000,
000
Wor
kbas
ed L
earn
ing
Inte
rmed
iary
Net
wor
k -
SWJC
F1,
500,
000
1,50
0,00
01,
500,
000
1,50
0,00
01,
500,
000
1,50
0,00
0W
orkf
orce
Pre
para
tion
Out
com
e R
epor
ting
Syst
em -
SWJC
F20
0,00
020
0,00
035
0,00
020
0,00
035
0,00
020
0,00
0W
orkf
orce
Tra
inin
g an
d Ec
onom
ic D
evel
opm
ent
Fund
s - S
WJC
F15
,100
,000
15,1
00,0
0015
,100
,000
15,1
00,0
0015
,100
,000
15,1
00,0
00To
tal E
duca
tion,
Dep
artm
ent o
f35
,300
,000
35,3
00,0
0035
,450
,000
35,3
00,0
0035
,450
,000
35,3
00,0
00
Col
lege
Stu
dent
Aid
Com
mis
sion
Skille
d W
orkf
orce
Sho
rtage
Tui
tion
Gra
nt -
SWJC
F5,
000,
000
5,00
0,00
05,
000,
000
5,00
0,00
05,
000,
000
5,00
0,00
0To
tal C
olle
ge S
tude
nt A
id C
omm
issi
on5,
000,
000
5,00
0,00
05,
000,
000
5,00
0,00
05,
000,
000
5,00
0,00
0
106

Stat
e of
Iow
aO
ther
Fun
d A
ppro
pria
tions
FY 2
018
and
2019
Gov
erno
r's R
ecom
men
datio
ns
FY 2
016
FY 2
017
FY 2
018
FY 2
018
FY 2
019
FY 2
019
DES
CR
IPTI
ON
Act
ual
Bud
get
Estim
ate
Dep
artm
ent
Req
uest
Gov
erno
r'sR
ecom
men
ded
Dep
artm
ent
Req
uest
Gov
erno
r'sR
ecom
men
ded
Reg
ents
, Boa
rd o
fIS
U -
Econ
omic
Dev
elop
men
t - S
WJC
F2,
424,
302
2,42
4,30
22,
472,
788
2,42
4,30
22,
522,
244
2,42
4,30
2R
egen
ts In
nova
tion
Fund
- SW
JCF
3,00
0,00
03,
000,
000
3,06
0,00
03,
000,
000
3,12
1,20
03,
000,
000
SUI -
Eco
nom
ic D
evel
opm
ent -
SW
JCF
209,
279
209,
279
213,
465
209,
279
217,
734
209,
279
SUI -
Ent
repr
eneu
rshi
p an
d Ec
onom
ic G
row
th -
SWJC
F2,
000,
000
2,00
0,00
02,
040,
000
2,00
0,00
02,
080,
800
2,00
0,00
0U
NI -
Eco
nom
ic D
evel
opm
ent -
SW
JCF
1,06
6,41
91,
066,
419
1,08
7,74
71,
066,
419
1,10
9,50
21,
066,
419
UN
I - E
ntre
pren
eurs
hip
--
500,
000
-51
0,00
0To
tal R
egen
ts, B
oard
of
8,70
0,00
08,
700,
000
9,37
4,00
08,
700,
000
9,56
1,48
08,
700,
000
Tota
l Edu
catio
n49
,000
,000
49,0
00,0
0049
,824
,000
49,0
00,0
0050
,011
,480
49,0
00,0
00
Tota
l Iow
a Sk
illed
Wor
ker a
nd J
ob C
reat
ion
Fund
66,0
00,0
0066
,000
,000
66,8
24,0
0066
,000
,000
67,0
11,4
8066
,000
,000
107

Stat
e of
Iow
aO
ther
Fun
d A
ppro
pria
tions
FY 2
018
and
2019
Gov
erno
r's R
ecom
men
datio
ns
FY 2
016
FY 2
017
FY 2
018
FY 2
018
FY 2
019
FY 2
019
DES
CR
IPTI
ON
Act
ual
Bud
get
Estim
ate
Dep
artm
ent
Req
uest
Gov
erno
r'sR
ecom
men
ded
Dep
artm
ent
Req
uest
Gov
erno
r'sR
ecom
men
ded
0017
- R
ebui
ld Io
wa
Infr
astr
uctu
re F
und
Iow
a C
omm
unic
atio
ns N
etw
ork
ICN
Equ
ipm
ent R
epla
cem
ent -
RIIF
2,24
8,65
31,
150,
000
--
-To
tal I
owa
Com
mun
icat
ions
Net
wor
k2,
248,
653
1,15
0,00
0-
--
Hum
an R
ight
s, D
epar
tmen
t of
Infra
stru
ctur
e fo
r Int
egra
ting
Just
ice
Dat
aSy
stem
s1,
300,
000
1,34
5,00
0-
--
Just
ice
Dat
a W
areh
ouse
159,
474
117,
980
--
-To
tal H
uman
Rig
hts,
Dep
artm
ent o
f1,
459,
474
1,46
2,98
0-
--
Man
agem
ent,
Dep
artm
ent o
fEn
viro
nmen
t Firs
t Fun
d Ap
prop
riatio
n42
,000
,000
42,0
00,0
0042
,000
,000
42,0
00,0
0042
,000
,000
42,0
00,0
00Io
wa
Gra
nts
Man
agem
ent I
mpl
emen
tatio
n50
,000
50,0
00-
--
Tran
spar
ency
Pro
ject
- R
IIF45
,000
45,0
00-
--
Tota
l Man
agem
ent,
Dep
artm
ent o
f42
,095
,000
42,0
95,0
0042
,000
,000
42,0
00,0
0042
,000
,000
42,0
00,0
00
Secr
etar
y of
Sta
teVo
ter R
egis
tratio
n &
Busi
ness
Ser
vice
s Sy
stem
sU
pdat
ing
450,
000
-2,
600,
000
-1,
400,
000
Vote
r Reg
istra
tion
Lice
nse
File
s M
aint
enan
ce &
Stor
age
234,
000
300,
000
1,00
0,00
0-
1,40
0,00
0To
tal S
ecre
tary
of S
tate
684,
000
300,
000
3,60
0,00
0-
2,80
0,00
0
Trea
sure
r of S
tate
Cou
nty
Fair
Impr
ovem
ents
1,06
0,00
01,
060,
000
-1,
060,
000
-1,
060,
000
Iow
a AB
LE S
avin
gs P
lan
Trus
t50
,000
--
--
Tota
l Tre
asur
er o
f Sta
te1,
110,
000
1,06
0,00
0-
1,06
0,00
0-
1,06
0,00
0
Tota
l Adm
inis
trat
ion
and
Reg
ulat
ion
47,5
97,1
2746
,067
,980
45,6
00,0
0043
,060
,000
44,8
00,0
0043
,060
,000
108

Stat
e of
Iow
aO
ther
Fun
d A
ppro
pria
tions
FY 2
018
and
2019
Gov
erno
r's R
ecom
men
datio
ns
FY 2
016
FY 2
017
FY 2
018
FY 2
018
FY 2
019
FY 2
019
DES
CR
IPTI
ON
Act
ual
Bud
get
Estim
ate
Dep
artm
ent
Req
uest
Gov
erno
r'sR
ecom
men
ded
Dep
artm
ent
Req
uest
Gov
erno
r'sR
ecom
men
ded
Agr
icul
ture
and
Lan
d St
ewar
dshi
pAg
ricul
tura
l Dra
inag
e W
ells
RIIF
1,92
0,00
01,
920,
000
-1,
875,
000
-1,
875,
000
Ren
ewab
le F
uels
Infra
stru
ctur
e Fu
nd-
--
3,00
0,00
0-
3,00
0,00
0W
ater
Qua
lity
Initi
ativ
e R
IIF5,
200,
000
5,20
0,00
0-
9,50
0,00
0-
9,50
0,00
0To
tal A
gric
ultu
re a
nd L
and
Stew
ards
hip
7,12
0,00
07,
120,
000
-14
,375
,000
-14
,375
,000
Nat
ural
Res
ourc
esW
ater
Tra
ils a
nd L
ow H
ead
Dam
Pro
gram
s1,
750,
000
1,00
0,00
01,
000,
000
1,00
0,00
01,
000,
000
1,00
0,00
0To
tal N
atur
al R
esou
rces
1,75
0,00
01,
000,
000
1,00
0,00
01,
000,
000
1,00
0,00
01,
000,
000
Tota
l Agr
icul
ture
and
Nat
ural
Res
ourc
es8,
870,
000
8,12
0,00
01,
000,
000
15,3
75,0
001,
000,
000
15,3
75,0
00
Cul
tura
l Affa
irs, D
epar
tmen
t of
Gre
at P
lace
s R
IIF1,
000,
000
1,00
0,00
01,
000,
000
1,00
0,00
01,
000,
000
1,00
0,00
0Su
llivan
Bro
ther
s M
useu
m-
250,
000
250,
000
250,
000
-U
SS Io
wa
Battl
eshi
p R
IIF-
250,
000
250,
000
250,
000
-YM
CA
Stre
ngth
en C
omm
unity
Gra
nts
-50
0,00
0-
--
Tota
l Cul
tura
l Affa
irs, D
epar
tmen
t of
1,00
0,00
02,
000,
000
1,50
0,00
01,
500,
000
1,00
0,00
01,
000,
000
Econ
omic
Dev
elop
men
t Aut
horit
yC
omm
unity
& T
ouris
m G
rant
App
ropr
iatio
n5,
000,
000
5,00
0,00
05,
000,
000
5,00
0,00
05,
000,
000
5,00
0,00
0Ea
ster
Sea
ls S
wim
min
g Po
ol-
--
500,
000
-Fo
rt D
es M
oine
s M
useu
m R
enov
atio
n an
dR
epai
r15
0,00
0-
--
-Le
wis
& C
lark
Rur
al W
ater
Sys
tem
--
-3,
500,
000
-3,
500,
000
Reg
iona
l Spo
rts A
utho
ritie
s (R
IIF)
500,
000
500,
000
500,
000
500,
000
500,
000
500,
000
Wor
ld F
ood
Priz
e Bo
rlaug
/Rua
n Sc
hola
rPr
ogra
m30
0,00
030
0,00
030
0,00
030
0,00
030
0,00
030
0,00
0To
tal E
cono
mic
Dev
elop
men
t Aut
horit
y5,
950,
000
5,80
0,00
05,
800,
000
9,80
0,00
05,
800,
000
9,30
0,00
0
109
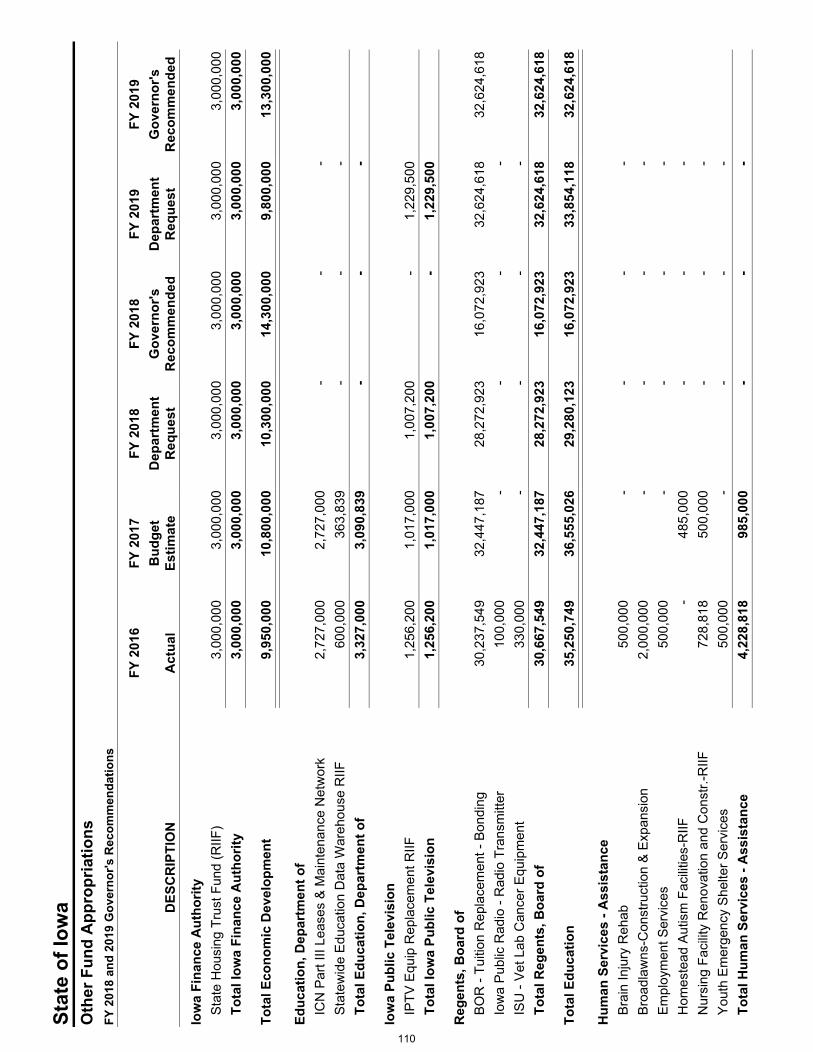
Stat
e of
Iow
aO
ther
Fun
d A
ppro
pria
tions
FY 2
018
and
2019
Gov
erno
r's R
ecom
men
datio
ns
FY 2
016
FY 2
017
FY 2
018
FY 2
018
FY 2
019
FY 2
019
DES
CR
IPTI
ON
Act
ual
Bud
get
Estim
ate
Dep
artm
ent
Req
uest
Gov
erno
r'sR
ecom
men
ded
Dep
artm
ent
Req
uest
Gov
erno
r'sR
ecom
men
ded
Iow
a Fi
nanc
e A
utho
rity
Stat
e H
ousi
ng T
rust
Fun
d (R
IIF)
3,00
0,00
03,
000,
000
3,00
0,00
03,
000,
000
3,00
0,00
03,
000,
000
Tota
l Iow
a Fi
nanc
e A
utho
rity
3,00
0,00
03,
000,
000
3,00
0,00
03,
000,
000
3,00
0,00
03,
000,
000
Tota
l Eco
nom
ic D
evel
opm
ent
9,95
0,00
010
,800
,000
10,3
00,0
0014
,300
,000
9,80
0,00
013
,300
,000
Educ
atio
n, D
epar
tmen
t of
ICN
Par
t III
Leas
es &
Mai
nten
ance
Net
wor
k2,
727,
000
2,72
7,00
0-
--
Stat
ewid
e Ed
ucat
ion
Dat
a W
areh
ouse
RIIF
600,
000
363,
839
--
-To
tal E
duca
tion,
Dep
artm
ent o
f3,
327,
000
3,09
0,83
9-
--
Iow
a Pu
blic
Tel
evis
ion
IPTV
Equ
ip R
epla
cem
ent R
IIF1,
256,
200
1,01
7,00
01,
007,
200
-1,
229,
500
Tota
l Iow
a Pu
blic
Tel
evis
ion
1,25
6,20
01,
017,
000
1,00
7,20
0-
1,22
9,50
0
Reg
ents
, Boa
rd o
fBO
R -
Tuiti
on R
epla
cem
ent -
Bon
ding
30,2
37,5
4932
,447
,187
28,2
72,9
2316
,072
,923
32,6
24,6
1832
,624
,618
Iow
a Pu
blic
Rad
io -
Rad
io T
rans
mitt
er10
0,00
0-
--
-IS
U -
Vet L
ab C
ance
r Equ
ipm
ent
330,
000
--
--
Tota
l Reg
ents
, Boa
rd o
f30
,667
,549
32,4
47,1
8728
,272
,923
16,0
72,9
2332
,624
,618
32,6
24,6
18
Tota
l Edu
catio
n35
,250
,749
36,5
55,0
2629
,280
,123
16,0
72,9
2333
,854
,118
32,6
24,6
18
Hum
an S
ervi
ces
- Ass
ista
nce
Brai
n In
jury
Reh
ab50
0,00
0-
--
-Br
oadl
awns
-Con
stru
ctio
n &
Expa
nsio
n2,
000,
000
--
--
Empl
oym
ent S
ervi
ces
500,
000
--
--
Hom
este
ad A
utis
m F
acilit
ies-
RIIF
-48
5,00
0-
--
Nur
sing
Fac
ility
Ren
ovat
ion
and
Con
str.-
RIIF
728,
818
500,
000
--
-Yo
uth
Emer
genc
y Sh
elte
r Ser
vice
s50
0,00
0-
--
-To
tal H
uman
Ser
vice
s - A
ssis
tanc
e4,
228,
818
985,
000
--
-
110

Stat
e of
Iow
aO
ther
Fun
d A
ppro
pria
tions
FY 2
018
and
2019
Gov
erno
r's R
ecom
men
datio
ns
FY 2
016
FY 2
017
FY 2
018
FY 2
018
FY 2
019
FY 2
019
DES
CR
IPTI
ON
Act
ual
Bud
get
Estim
ate
Dep
artm
ent
Req
uest
Gov
erno
r'sR
ecom
men
ded
Dep
artm
ent
Req
uest
Gov
erno
r'sR
ecom
men
ded
Publ
ic H
ealth
, Dep
artm
ent o
fIo
wa
Pres
crip
tion
Dru
g Sa
fety
Net
-75
,000
--
-M
CH
Dat
a In
tegr
atio
n50
0,00
050
0,00
0-
--
Tota
l Pub
lic H
ealth
, Dep
artm
ent o
f50
0,00
057
5,00
0-
--
Tota
l Hum
an S
ervi
ces
4,72
8,81
81,
560,
000
--
Law
Enf
orce
men
t Aca
dem
yIL
EA -
RIIF
Fun
ds-
--
--
5,00
0,00
0To
tal L
aw E
nfor
cem
ent A
cade
my
--
--
-5,
000,
000
Publ
ic D
efen
se, D
epar
tmen
t of
Gol
d St
ar M
useu
m-
250,
000
--
-To
tal P
ublic
Def
ense
, Dep
artm
ent o
f-
250,
000
--
-
Hom
elan
d Se
curit
y an
d Em
erge
ncy
Man
agem
ent
EMS
Dat
a Sy
stem
RIIF
400,
000
400,
000
400,
000
-40
0,00
0To
tal H
omel
and
Secu
rity
and
Emer
genc
y M
anag
400,
000
400,
000
400,
000
-40
0,00
0
Publ
ic S
afet
y, D
epar
tmen
t of
DPS
Lab
-DN
A M
arke
r Sof
twar
e-R
IIF F
und
-15
0,00
0-
--
DPS
Var
ious
Equ
ipm
ent P
roje
cts
- RIIF
001
7.-
--
1,12
2,50
0-
Iow
a St
atew
ide
Inte
rope
rabl
e C
omm
. Sys
tem
Leas
e Pu
rch.
001
7-
--
4,14
3,68
7-
4,14
3,68
7To
tal P
ublic
Saf
ety,
Dep
artm
ent o
f-
150,
000
-5,
266,
187
-4,
143,
687
Tota
l Jus
tice
Syst
em40
0,00
080
0,00
040
0,00
05,
266,
187
400,
000
9,14
3,68
7
111

Stat
e of
Iow
aO
ther
Fun
d A
ppro
pria
tions
FY 2
018
and
2019
Gov
erno
r's R
ecom
men
datio
ns
FY 2
016
FY 2
017
FY 2
018
FY 2
018
FY 2
019
FY 2
019
DES
CR
IPTI
ON
Act
ual
Bud
get
Estim
ate
Dep
artm
ent
Req
uest
Gov
erno
r'sR
ecom
men
ded
Dep
artm
ent
Req
uest
Gov
erno
r'sR
ecom
men
ded
Tran
spor
tatio
n, D
epar
tmen
t of
Com
mer
cial
Air
Serv
ice
Airp
orts
1,50
0,00
01,
440,
000
1,50
0,00
01,
500,
000
1,50
0,00
01,
500,
000
Gen
eral
Avi
atio
n Ai
rpor
ts75
0,00
0-
750,
000
750,
000
750,
000
750,
000
Publ
ic T
rans
it As
sist
ance
1,50
0,00
01,
500,
000
1,50
0,00
01,
500,
000
1,50
0,00
01,
500,
000
Rai
l Rev
olvi
ng L
oan
& G
rant
Fun
d2,
000,
000
1,50
0,00
02,
000,
000
2,00
0,00
02,
000,
000
2,00
0,00
0R
ecre
atio
nal T
rails
3,40
0,00
02,
500,
000
2,50
0,00
02,
500,
000
2,50
0,00
02,
500,
000
Tota
l Tra
nspo
rtat
ion,
Dep
artm
ent o
f9,
150,
000
6,94
0,00
08,
250,
000
8,25
0,00
08,
250,
000
8,25
0,00
0
Tota
l Tra
nspo
rtat
ion
9,15
0,00
06,
940,
000
8,25
0,00
08,
250,
000
8,25
0,00
08,
250,
000
Stat
e Fa
ir A
utho
rity
Cap
ital
NW
Eve
nts
Area
-50
0,00
050
0,00
050
0,00
04,
500,
000
4,50
0,00
0Yo
uth
Inn
Ren
ovat
ion
& Im
prov
emen
ts2,
325,
000
--
--
Tota
l Sta
te F
air A
utho
rity
Cap
ital
2,32
5,00
050
0,00
050
0,00
050
0,00
04,
500,
000
4,50
0,00
0
Dep
artm
ent F
or T
he B
lind
Cap
itals
Elev
ator
Impr
ovem
ents
--
150,
000
150,
000
-To
tal D
epar
tmen
t For
The
Blin
d C
apita
ls-
-15
0,00
015
0,00
0-
Cor
rect
ions
Cap
ital
DO
C-C
BC 3
rd D
istri
ct M
ajor
Mai
nten
ance
-001
7-
150,
000
--
-D
OC
-CBC
5th
Dis
trict
Maj
or M
aint
enan
ce-0
017
500,
000
--
--
DO
C M
ajor
Mai
nten
ance
Req
uest
--
3,00
0,00
0-
3,00
0,00
0To
tal C
orre
ctio
ns C
apita
l50
0,00
015
0,00
03,
000,
000
-3,
000,
000
Cul
tura
l Affa
irs C
apita
lC
ivil
War
Mem
oria
l15
0,00
0-
--
-H
isto
rical
Bui
ldin
g R
enov
atio
n-
-7,
994,
320
5,00
0,00
027
,732
,543
5,00
0,00
0St
reng
then
Com
mun
ity G
rant
s50
0,00
0-
--
-Ve
t Mem
oria
l Dra
kesv
ille12
,000
--
--
Tota
l Cul
tura
l Affa
irs C
apita
l66
2,00
0-
7,99
4,32
05,
000,
000
27,7
32,5
435,
000,
000
112

Stat
e of
Iow
aO
ther
Fun
d A
ppro
pria
tions
FY 2
018
and
2019
Gov
erno
r's R
ecom
men
datio
ns
FY 2
016
FY 2
017
FY 2
018
FY 2
018
FY 2
019
FY 2
019
DES
CR
IPTI
ON
Act
ual
Bud
get
Estim
ate
Dep
artm
ent
Req
uest
Gov
erno
r'sR
ecom
men
ded
Dep
artm
ent
Req
uest
Gov
erno
r'sR
ecom
men
ded
Adm
inis
trat
ive
Serv
ices
- C
apita
lsSt
atew
ide
Maj
or M
aint
enan
ce R
IIF9,
974,
856
9,48
9,23
7-
4,00
0,00
0-
12,5
00,0
00To
tal A
dmin
istr
ativ
e Se
rvic
es -
Cap
itals
9,97
4,85
69,
489,
237
-4,
000,
000
-12
,500
,000
Hum
an S
ervi
ces
- Cap
ital
ADA
Cap
ital
--
596,
500
--
Hea
lth/S
afet
y/Lo
ss-
-2,
281,
376
-3,
022,
045
Mai
nten
ance
--
400,
000
-1,
960,
064
Maj
or P
roje
cts
--
4,15
3,25
1-
2,13
8,31
3To
tal H
uman
Ser
vice
s - C
apita
l-
-7,
431,
127
-7,
120,
422
Nat
ural
Res
ourc
es C
apita
lD
NR
Lak
es R
esto
ratio
n &
Wat
er Q
ualit
y9,
600,
000
9,60
0,00
09,
600,
000
9,60
0,00
09,
600,
000
9,60
0,00
0St
ate
Park
s In
frast
ruct
ure
Ren
ovat
ions
5,00
0,00
03,
000,
000
3,00
0,00
03,
000,
000
3,00
0,00
03,
000,
000
Tota
l Nat
ural
Res
ourc
es C
apita
l14
,600
,000
12,6
00,0
0012
,600
,000
12,6
00,0
0012
,600
,000
12,6
00,0
00
Publ
ic D
efen
se C
apita
lAr
mor
y C
onst
ruct
ion
Impr
ovem
ent P
roje
cts
(RIIF
)2,
000,
000
1,50
0,00
02,
000,
000
2,00
0,00
02,
000,
000
2,00
0,00
0C
amp
Dod
ge In
frast
ruct
ure
Upg
rade
s50
0,00
030
0,00
050
0,00
050
0,00
050
0,00
050
0,00
0Fa
cilit
y/Ar
mor
y M
aint
enan
ce (R
IIF)
2,00
0,00
02,
000,
000
2,00
0,00
02,
000,
000
2,00
0,00
02,
000,
000
Tota
l Pub
lic D
efen
se C
apita
l4,
500,
000
3,80
0,00
04,
500,
000
4,50
0,00
04,
500,
000
4,50
0,00
0
Publ
ic S
afet
y C
apita
lD
PS-F
STB
Mob
ile E
quip
men
t Gra
nt M
atch
-001
710
0,00
0-
--
-To
tal P
ublic
Saf
ety
Cap
ital
100,
000
--
--
113

Stat
e of
Iow
aO
ther
Fun
d A
ppro
pria
tions
FY 2
018
and
2019
Gov
erno
r's R
ecom
men
datio
ns
FY 2
016
FY 2
017
FY 2
018
FY 2
018
FY 2
019
FY 2
019
DES
CR
IPTI
ON
Act
ual
Bud
get
Estim
ate
Dep
artm
ent
Req
uest
Gov
erno
r'sR
ecom
men
ded
Dep
artm
ent
Req
uest
Gov
erno
r'sR
ecom
men
ded
Reg
ents
Cap
ital
ISD
- Lo
ng H
all R
enov
atio
n-
-4,
600,
000
--
ISU
- Bi
osci
ence
s Fa
cilit
ies
11,0
00,0
0015
,500
,000
23,5
00,0
0020
,500
,000
-3,
000,
000
ISU
- St
uden
t Inn
ovat
ion
Cen
ter
-1,
000,
000
9,00
0,00
07,
000,
000
10,0
00,0
0012
,000
,000
ISU
- Ve
terin
ary
Dia
gnos
tic L
abor
ator
y-
-20
,000
,000
-20
,000
,000
Reg
ents
- Fi
re S
afet
y/D
efer
red
Mai
nten
ance
--
15,0
00,0
00-
20,0
00,0
00SU
I - M
ain
Libr
ary
- Mod
erni
zatio
n-
-15
,000
,000
-25
,000
,000
SUI -
Pha
rmac
y Bu
ildin
g R
epla
cem
ent/
Impr
ovem
ents
13,0
00,0
0023
,000
,000
28,3
00,0
0023
,300
,000
-5,
000,
000
UN
I - R
od L
ibra
ry M
oder
niza
tion
/ Cro
ssro
ads,
Phas
e 1
--
11,3
00,0
00-
27,2
00,0
00U
NI -
Sch
indl
er E
duca
tion
Cen
ter R
enov
atio
n15
,000
,000
15,9
00,0
00-
--
Tota
l Reg
ents
Cap
ital
39,0
00,0
0055
,400
,000
126,
700,
000
50,8
00,0
0010
2,20
0,00
020
,000
,000
Iow
a Ve
tera
ns H
ome
Cap
ital
ADA
Ram
p-Lo
ftus
Build
ing
-50
0,00
0-
--
Air H
andl
er U
nits
- D
ack,
Mal
loy,
She
eler
&Lo
ftus
Build
ings
6,00
0,00
0-
--
-Em
erge
ncy
Fuel
Tan
ks &
Spi
ll C
onta
inm
ent
1,80
0,00
0-
--
-La
undr
y R
enov
atio
n3,
000,
000
--
--
Shee
ler &
Lof
tus
Ren
ovat
ion
-2,
000,
000
--
-To
tal I
owa
Vete
rans
Hom
e C
apita
l10
,800
,000
2,50
0,00
0-
--
Tota
l Cap
ital
82,4
61,8
5684
,439
,237
162,
875,
447
77,5
50,0
0016
1,65
2,96
559
,100
,000
Tota
l Reb
uild
Iow
a In
fras
truc
ture
Fun
d19
8,40
8,55
019
5,28
2,24
325
7,70
5,57
017
9,87
4,11
025
9,75
7,08
318
0,85
3,30
5
114

Stat
e of
Iow
aO
ther
Fun
d A
ppro
pria
tions
FY 2
018
and
2019
Gov
erno
r's R
ecom
men
datio
ns
FY 2
016
FY 2
017
FY 2
018
FY 2
018
FY 2
019
FY 2
019
DES
CR
IPTI
ON
Act
ual
Bud
get
Estim
ate
Dep
artm
ent
Req
uest
Gov
erno
r'sR
ecom
men
ded
Dep
artm
ent
Req
uest
Gov
erno
r'sR
ecom
men
ded
0019
- C
omm
erce
Rev
olvi
ng F
und
Ban
king
Div
isio
nBa
nkin
g D
ivis
ion
Com
mer
ce F
und
9,66
7,23
510
,499
,790
10,9
28,8
7510
,819
,790
11,3
57,9
6010
,819
,790
Tota
l Ban
king
Div
isio
n9,
667,
235
10,4
99,7
9010
,928
,875
10,8
19,7
9011
,357
,960
10,8
19,7
90
Cre
dit U
nion
Div
isio
nC
redi
t Uni
on D
ivis
ion
1,86
9,25
61,
869,
256
1,94
4,25
61,
869,
256
1,94
4,25
61,
869,
256
Tota
l Cre
dit U
nion
Div
isio
n1,
869,
256
1,86
9,25
61,
944,
256
1,86
9,25
61,
944,
256
1,86
9,25
6
Insu
ranc
e D
ivis
ion
Insu
ranc
e D
ivis
ion-
Com
mer
ce R
evol
ving
Fun
d5,
325,
889
5,48
5,88
95,
485,
889
5,48
5,88
95,
485,
889
5,48
5,88
9To
tal I
nsur
ance
Div
isio
n5,
325,
889
5,48
5,88
95,
485,
889
5,48
5,88
95,
485,
889
5,48
5,88
9
Util
ities
Div
isio
nU
tiliti
es D
ivis
ion
8,56
0,40
59,
210,
405
9,04
0,40
59,
040,
405
9,04
0,40
59,
040,
405
Tota
l Util
ities
Div
isio
n8,
560,
405
9,21
0,40
59,
040,
405
9,04
0,40
59,
040,
405
9,04
0,40
5
Tota
l Adm
inis
trat
ion
and
Reg
ulat
ion
25,4
22,7
8527
,065
,340
27,3
99,4
2527
,215
,340
27,8
28,5
1027
,215
,340
Con
sum
er A
dvoc
ate
Con
sum
er A
dvoc
ate
- Fun
d 00
193,
137,
588
3,13
7,58
83,
137,
588
3,13
7,58
83,
137,
588
3,13
7,58
8To
tal C
onsu
mer
Adv
ocat
e3,
137,
588
3,13
7,58
83,
137,
588
3,13
7,58
83,
137,
588
3,13
7,58
8
Tota
l Jus
tice
Syst
em3,
137,
588
3,13
7,58
83,
137,
588
3,13
7,58
83,
137,
588
3,13
7,58
8
Tota
l Com
mer
ce R
evol
ving
Fun
d28
,560
,373
30,2
02,9
2830
,537
,013
30,3
52,9
2830
,966
,098
30,3
52,9
28
115

Stat
e of
Iow
aO
ther
Fun
d A
ppro
pria
tions
FY 2
018
and
2019
Gov
erno
r's R
ecom
men
datio
ns
FY 2
016
FY 2
017
FY 2
018
FY 2
018
FY 2
019
FY 2
019
DES
CR
IPTI
ON
Act
ual
Bud
get
Estim
ate
Dep
artm
ent
Req
uest
Gov
erno
r'sR
ecom
men
ded
Dep
artm
ent
Req
uest
Gov
erno
r'sR
ecom
men
ded
001A
- St
ate
Bon
d R
epay
men
t Fun
d
Reg
ents
, Boa
rd o
fBO
R -
Tuiti
on R
epla
cem
ent -
Sta
te B
ond
Rep
aym
ent F
und
--
-12
,200
,000
-To
tal R
egen
ts, B
oard
of
--
-12
,200
,000
-
Tota
l Edu
catio
n-
--
12,2
00,0
00
Adm
inis
trat
ive
Serv
ices
- C
apita
lsC
apito
l Dom
e M
ajor
Mai
nten
ance
Sta
te B
ond
Rep
ay F
und
-9,
990,
900
--
-To
tal A
dmin
istr
ativ
e Se
rvic
es -
Cap
itals
-9,
990,
900
--
-
Judi
cial
Bra
nch
Cap
ital
Polk
Cou
nty
Just
ice
Cen
ter F
urni
ture
&Eq
uipm
ent (
001A
)-
6,71
8,43
3-
--
Tota
l Jud
icia
l Bra
nch
Cap
ital
-6,
718,
433
--
-
Tota
l Cap
ital
-16
,709
,333
--
Tota
l Sta
te B
ond
Rep
aym
ent F
und
-16
,709
,333
-12
,200
,000
116

Stat
e of
Iow
aO
ther
Fun
d A
ppro
pria
tions
FY 2
018
and
2019
Gov
erno
r's R
ecom
men
datio
ns
FY 2
016
FY 2
017
FY 2
018
FY 2
018
FY 2
019
FY 2
019
DES
CR
IPTI
ON
Act
ual
Bud
get
Estim
ate
Dep
artm
ent
Req
uest
Gov
erno
r'sR
ecom
men
ded
Dep
artm
ent
Req
uest
Gov
erno
r'sR
ecom
men
ded
0030
- D
PS-G
amin
g En
forc
emen
t Rev
olvi
ng F
und
- 003
0
Publ
ic S
afet
y, D
epar
tmen
t of
DPS
Gam
ing
Enfo
rcem
ent -
003
010
,898
,008
9,74
5,27
210
,841
,272
10,8
41,2
729,
745,
272
9,74
5,27
2To
tal P
ublic
Saf
ety,
Dep
artm
ent o
f10
,898
,008
9,74
5,27
210
,841
,272
10,8
41,2
729,
745,
272
9,74
5,27
2
Tota
l Jus
tice
Syst
em10
,898
,008
9,74
5,27
210
,841
,272
10,8
41,2
729,
745,
272
9,74
5,27
2
Tota
l DPS
-Gam
ing
Enfo
rcem
ent R
evol
ving
Fun
d -
10,8
98,0
089,
745,
272
10,8
41,2
7210
,841
,272
9,74
5,27
29,
745,
272
117

Stat
e of
Iow
aO
ther
Fun
d A
ppro
pria
tions
FY 2
018
and
2019
Gov
erno
r's R
ecom
men
datio
ns
FY 2
016
FY 2
017
FY 2
018
FY 2
018
FY 2
019
FY 2
019
DES
CR
IPTI
ON
Act
ual
Bud
get
Estim
ate
Dep
artm
ent
Req
uest
Gov
erno
r'sR
ecom
men
ded
Dep
artm
ent
Req
uest
Gov
erno
r'sR
ecom
men
ded
0035
- R
acin
g an
d G
amin
g R
evol
ving
Fun
d
Rac
ing
Com
mis
sion
Exch
ange
Wag
erin
g St
udy
50,0
00-
--
-R
acin
g an
d G
amin
g R
egul
ator
y R
evol
ving
Fun
d6,
194,
499
6,19
4,49
96,
194,
499
6,19
4,49
96,
194,
499
6,19
4,49
9To
tal R
acin
g C
omm
issi
on6,
244,
499
6,19
4,49
96,
194,
499
6,19
4,49
96,
194,
499
6,19
4,49
9
Tota
l Adm
inis
trat
ion
and
Reg
ulat
ion
6,24
4,49
96,
194,
499
6,19
4,49
96,
194,
499
6,19
4,49
96,
194,
499
Tota
l Rac
ing
and
Gam
ing
Rev
olvi
ng F
und
6,24
4,49
96,
194,
499
6,19
4,49
96,
194,
499
6,19
4,49
96,
194,
499
118

Stat
e of
Iow
aO
ther
Fun
d A
ppro
pria
tions
FY 2
018
and
2019
Gov
erno
r's R
ecom
men
datio
ns
FY 2
016
FY 2
017
FY 2
018
FY 2
018
FY 2
019
FY 2
019
DES
CR
IPTI
ON
Act
ual
Bud
get
Estim
ate
Dep
artm
ent
Req
uest
Gov
erno
r'sR
ecom
men
ded
Dep
artm
ent
Req
uest
Gov
erno
r'sR
ecom
men
ded
0038
- Io
wa
Econ
omic
Em
erge
ncy
Fund
Exec
utiv
e C
ounc
ilPe
rform
ance
Of D
uty
EEF
12,3
36,7
3616
,966
,103
10,3
97,5
583,
378,
609
10,3
97,5
583,
299,
966
Tota
l Exe
cutiv
e C
ounc
il12
,336
,736
16,9
66,1
0310
,397
,558
3,37
8,60
910
,397
,558
3,29
9,96
6
Tota
l Adm
inis
trat
ion
and
Reg
ulat
ion
12,3
36,7
3616
,966
,103
10,3
97,5
583,
378,
609
10,3
97,5
583,
299,
966
Tota
l Iow
a Ec
onom
ic E
mer
genc
y Fu
nd12
,336
,736
16,9
66,1
0310
,397
,558
3,37
8,60
910
,397
,558
3,29
9,96
6
119

Stat
e of
Iow
aO
ther
Fun
d A
ppro
pria
tions
FY 2
018
and
2019
Gov
erno
r's R
ecom
men
datio
ns
FY 2
016
FY 2
017
FY 2
018
FY 2
018
FY 2
019
FY 2
019
DES
CR
IPTI
ON
Act
ual
Bud
get
Estim
ate
Dep
artm
ent
Req
uest
Gov
erno
r'sR
ecom
men
ded
Dep
artm
ent
Req
uest
Gov
erno
r'sR
ecom
men
ded
0046
- W
irele
ss E
911
Surc
harg
e
Hom
elan
d Se
curit
y an
d Em
erge
ncy
Man
agem
ent
E911
Em
erg
Com
m A
dmin
-E91
1 Su
rcha
rge
250,
000
250,
000
250,
000
250,
000
250,
000
250,
000
Rad
io C
omm
Pla
tform
Lea
se-E
911
Surc
harg
e4,
000,
000
--
--
Tota
l Hom
elan
d Se
curit
y an
d Em
erge
ncy
Man
ag4,
250,
000
250,
000
250,
000
250,
000
250,
000
250,
000
Publ
ic S
afet
y, D
epar
tmen
t of
Iow
a St
atew
ide
Inte
rope
rabl
e C
omm
. Sys
tem
Leas
e Pu
rcha
se00
46-
4,38
3,00
04,
143,
687
-4,
143,
687
Tota
l Pub
lic S
afet
y, D
epar
tmen
t of
-4,
383,
000
4,14
3,68
7-
4,14
3,68
7
Tota
l Jus
tice
Syst
em4,
250,
000
4,63
3,00
04,
393,
687
250,
000
4,39
3,68
725
0,00
0
Tota
l Wire
less
E91
1 Su
rcha
rge
4,25
0,00
04,
633,
000
4,39
3,68
725
0,00
04,
393,
687
250,
000
120
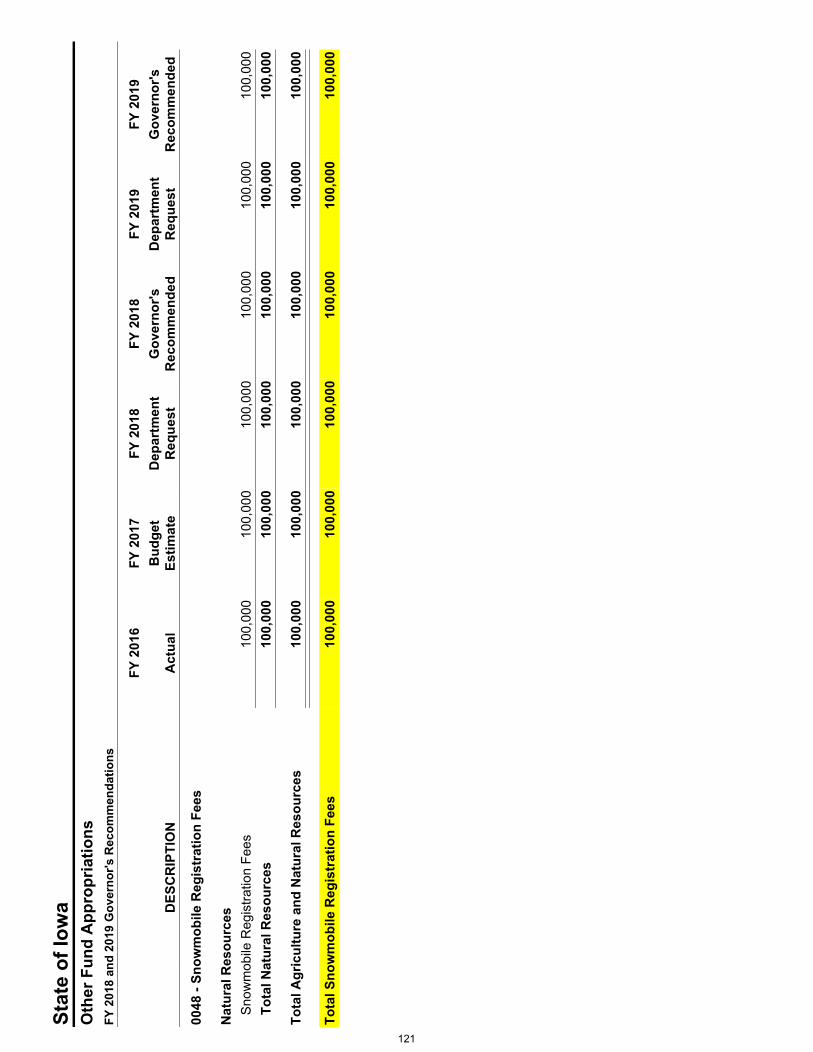
Stat
e of
Iow
aO
ther
Fun
d A
ppro
pria
tions
FY 2
018
and
2019
Gov
erno
r's R
ecom
men
datio
ns
FY 2
016
FY 2
017
FY 2
018
FY 2
018
FY 2
019
FY 2
019
DES
CR
IPTI
ON
Act
ual
Bud
get
Estim
ate
Dep
artm
ent
Req
uest
Gov
erno
r'sR
ecom
men
ded
Dep
artm
ent
Req
uest
Gov
erno
r'sR
ecom
men
ded
0048
- Sn
owm
obile
Reg
istr
atio
n Fe
es
Nat
ural
Res
ourc
esSn
owm
obile
Reg
istra
tion
Fees
100,
000
100,
000
100,
000
100,
000
100,
000
100,
000
Tota
l Nat
ural
Res
ourc
es10
0,00
010
0,00
010
0,00
010
0,00
010
0,00
010
0,00
0
Tota
l Agr
icul
ture
and
Nat
ural
Res
ourc
es10
0,00
010
0,00
010
0,00
010
0,00
010
0,00
010
0,00
0
Tota
l Sno
wm
obile
Reg
istr
atio
n Fe
es10
0,00
010
0,00
010
0,00
010
0,00
010
0,00
010
0,00
0
121

Stat
e of
Iow
aO
ther
Fun
d A
ppro
pria
tions
FY 2
018
and
2019
Gov
erno
r's R
ecom
men
datio
ns
FY 2
016
FY 2
017
FY 2
018
FY 2
018
FY 2
019
FY 2
019
DES
CR
IPTI
ON
Act
ual
Bud
get
Estim
ate
Dep
artm
ent
Req
uest
Gov
erno
r'sR
ecom
men
ded
Dep
artm
ent
Req
uest
Gov
erno
r'sR
ecom
men
ded
0050
- G
roun
dwat
er P
rote
ctio
n Fu
nd
Nat
ural
Res
ourc
esG
WF-
Geo
grap
hic
Info
rmat
ion
Syst
em29
7,50
029
7,50
029
7,50
029
7,50
029
7,50
029
7,50
0G
WF-
Gro
undw
ater
Mon
itorin
g-D
NR
1,68
6,75
11,
686,
751
1,68
6,75
11,
686,
751
1,68
6,75
11,
686,
751
GW
F-H
ouse
hold
Haz
ardo
us W
aste
-DN
R44
7,32
444
7,32
444
7,32
444
7,32
444
7,32
444
7,32
4G
WF-
Land
fill A
ltern
ativ
es-D
NR
618,
993
618,
993
618,
993
618,
993
618,
993
618,
993
GW
F-So
lid W
aste
Aut
horiz
atio
n50
,000
50,0
0050
,000
50,0
0050
,000
50,0
00G
WF-
Stor
age
Tank
s St
udy-
DN
R10
0,30
310
0,30
310
0,30
310
0,30
310
0,30
310
0,30
3G
WF-
Was
te R
educ
tion
and
Assi
stan
ce19
2,50
019
2,50
019
2,50
019
2,50
019
2,50
019
2,50
0G
WF-
Wel
l Tes
ting
Adm
in 2
%-D
NR
62,4
6162
,461
62,4
6162
,461
62,4
6162
,461
Tota
l Nat
ural
Res
ourc
es3,
455,
832
3,45
5,83
23,
455,
832
3,45
5,83
23,
455,
832
3,45
5,83
2
Tota
l Agr
icul
ture
and
Nat
ural
Res
ourc
es3,
455,
832
3,45
5,83
23,
455,
832
3,45
5,83
23,
455,
832
3,45
5,83
2
Reg
ents
, Boa
rd o
fIS
U -
Dat
a C
olle
ctio
n - G
WF
1,23
0,00
0-
--
-To
tal R
egen
ts, B
oard
of
1,23
0,00
0-
--
-
Tota
l Edu
catio
n1,
230,
000
--
-
Tota
l Gro
undw
ater
Pro
tect
ion
Fund
4,68
5,83
23,
455,
832
3,45
5,83
23,
455,
832
3,45
5,83
23,
455,
832
122

Stat
e of
Iow
aO
ther
Fun
d A
ppro
pria
tions
FY 2
018
and
2019
Gov
erno
r's R
ecom
men
datio
ns
FY 2
016
FY 2
017
FY 2
018
FY 2
018
FY 2
019
FY 2
019
DES
CR
IPTI
ON
Act
ual
Bud
get
Estim
ate
Dep
artm
ent
Req
uest
Gov
erno
r'sR
ecom
men
ded
Dep
artm
ent
Req
uest
Gov
erno
r'sR
ecom
men
ded
0052
- Sp
ecia
l Con
tinge
ncy
Fund
Iow
a W
orkf
orce
Dev
elop
men
tP
& I W
orkf
orce
Dev
elop
men
t Fie
ld O
ffice
s1,
766,
084
1,76
6,08
41,
766,
084
1,76
6,08
41,
766,
084
1,76
6,08
4To
tal I
owa
Wor
kfor
ce D
evel
opm
ent
1,76
6,08
41,
766,
084
1,76
6,08
41,
766,
084
1,76
6,08
41,
766,
084
Tota
l Eco
nom
ic D
evel
opm
ent
1,76
6,08
41,
766,
084
1,76
6,08
41,
766,
084
1,76
6,08
41,
766,
084
Tota
l Spe
cial
Con
tinge
ncy
Fund
1,76
6,08
41,
766,
084
1,76
6,08
41,
766,
084
1,76
6,08
41,
766,
084
123

Stat
e of
Iow
aO
ther
Fun
d A
ppro
pria
tions
FY 2
018
and
2019
Gov
erno
r's R
ecom
men
datio
ns
FY 2
016
FY 2
017
FY 2
018
FY 2
018
FY 2
019
FY 2
019
DES
CR
IPTI
ON
Act
ual
Bud
get
Estim
ate
Dep
artm
ent
Req
uest
Gov
erno
r'sR
ecom
men
ded
Dep
artm
ent
Req
uest
Gov
erno
r'sR
ecom
men
ded
006D
- R
even
ue B
onds
Cap
itals
II F
und
Adm
inis
trat
ive
Serv
ices
- C
apita
lsD
AS -
Maj
or M
aint
enan
ce 2
4,64
6,84
1-
--
-To
tal A
dmin
istr
ativ
e Se
rvic
es -
Cap
itals
4,64
6,84
1-
--
-
Tota
l Cap
ital
4,64
6,84
1-
--
Tota
l Rev
enue
Bon
ds C
apita
ls II
Fun
d4,
646,
841
--
-
124

Stat
e of
Iow
aO
ther
Fun
d A
ppro
pria
tions
FY 2
018
and
2019
Gov
erno
r's R
ecom
men
datio
ns
FY 2
016
FY 2
017
FY 2
018
FY 2
018
FY 2
019
FY 2
019
DES
CR
IPTI
ON
Act
ual
Bud
get
Estim
ate
Dep
artm
ent
Req
uest
Gov
erno
r'sR
ecom
men
ded
Dep
artm
ent
Req
uest
Gov
erno
r'sR
ecom
men
ded
006R
- M
edic
aid
Frau
d A
ccou
nt F
und
Hum
an S
ervi
ces
- Ass
ista
nce
Med
icai
d - M
edic
aid
Frau
d Ac
coun
t1,
021,
178
500,
000
500,
000
500,
000
500,
000
500,
000
Tota
l Hum
an S
ervi
ces
- Ass
ista
nce
1,02
1,17
850
0,00
050
0,00
050
0,00
050
0,00
050
0,00
0
Tota
l Hum
an S
ervi
ces
1,02
1,17
850
0,00
050
0,00
050
0,00
050
0,00
050
0,00
0
Tota
l Med
icai
d Fr
aud
Acc
ount
Fun
d1,
021,
178
500,
000
500,
000
500,
000
500,
000
500,
000
125
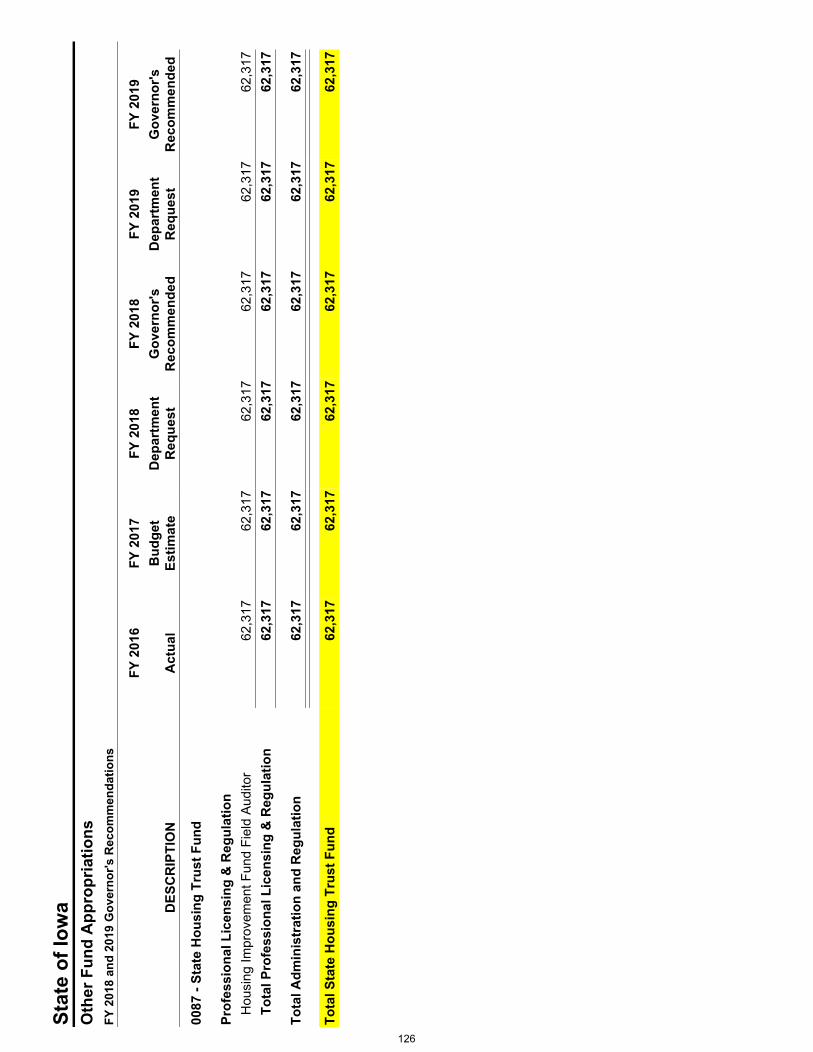
Stat
e of
Iow
aO
ther
Fun
d A
ppro
pria
tions
FY 2
018
and
2019
Gov
erno
r's R
ecom
men
datio
ns
FY 2
016
FY 2
017
FY 2
018
FY 2
018
FY 2
019
FY 2
019
DES
CR
IPTI
ON
Act
ual
Bud
get
Estim
ate
Dep
artm
ent
Req
uest
Gov
erno
r'sR
ecom
men
ded
Dep
artm
ent
Req
uest
Gov
erno
r'sR
ecom
men
ded
0087
- St
ate
Hou
sing
Tru
st F
und
Prof
essi
onal
Lic
ensi
ng &
Reg
ulat
ion
Hou
sing
Impr
ovem
ent F
und
Fiel
d Au
dito
r62
,317
62,3
1762
,317
62,3
1762
,317
62,3
17To
tal P
rofe
ssio
nal L
icen
sing
& R
egul
atio
n62
,317
62,3
1762
,317
62,3
1762
,317
62,3
17
Tota
l Adm
inis
trat
ion
and
Reg
ulat
ion
62,3
1762
,317
62,3
1762
,317
62,3
1762
,317
Tota
l Sta
te H
ousi
ng T
rust
Fun
d62
,317
62,3
1762
,317
62,3
1762
,317
62,3
17
126

Stat
e of
Iow
aO
ther
Fun
d A
ppro
pria
tions
FY 2
018
and
2019
Gov
erno
r's R
ecom
men
datio
ns
FY 2
016
FY 2
017
FY 2
018
FY 2
018
FY 2
019
FY 2
019
DES
CR
IPTI
ON
Act
ual
Bud
get
Estim
ate
Dep
artm
ent
Req
uest
Gov
erno
r'sR
ecom
men
ded
Dep
artm
ent
Req
uest
Gov
erno
r'sR
ecom
men
ded
0088
- C
onsu
mer
Edu
catio
n Fu
nd
Just
ice,
Dep
artm
ent o
fFa
rm M
edia
tion
Serv
ices
- Fd
008
8-
300,
000
-30
0,00
0-
300,
000
Tota
l Jus
tice,
Dep
artm
ent o
f-
300,
000
-30
0,00
0-
300,
000
Tota
l Jus
tice
Syst
em-
300,
000
-30
0,00
030
0,00
0
Tota
l Con
sum
er E
duca
tion
Fund
-30
0,00
0-
300,
000
300,
000
127

Stat
e of
Iow
aO
ther
Fun
d A
ppro
pria
tions
FY 2
018
and
2019
Gov
erno
r's R
ecom
men
datio
ns
FY 2
016
FY 2
017
FY 2
018
FY 2
018
FY 2
019
FY 2
019
DES
CR
IPTI
ON
Act
ual
Bud
get
Estim
ate
Dep
artm
ent
Req
uest
Gov
erno
r'sR
ecom
men
ded
Dep
artm
ent
Req
uest
Gov
erno
r'sR
ecom
men
ded
008J
- A
ddre
ss C
onfid
entia
lity
Prog
ram
Rev
olvi
ng F
und
Secr
etar
y of
Sta
teAd
dres
s C
onfid
entia
lity
Prog
ram
94,6
0012
0,40
012
0,40
012
0,40
012
0,40
012
0,40
0To
tal S
ecre
tary
of S
tate
94,6
0012
0,40
012
0,40
012
0,40
012
0,40
012
0,40
0
Tota
l Adm
inis
trat
ion
and
Reg
ulat
ion
94,6
0012
0,40
012
0,40
012
0,40
012
0,40
012
0,40
0
Tota
l Add
ress
Con
fiden
tialit
y Pr
ogra
m R
evol
ving
94
,600
120,
400
120,
400
120,
400
120,
400
120,
400
128

Stat
e of
Iow
aO
ther
Fun
d A
ppro
pria
tions
FY 2
018
and
2019
Gov
erno
r's R
ecom
men
datio
ns
FY 2
016
FY 2
017
FY 2
018
FY 2
018
FY 2
019
FY 2
019
DES
CR
IPTI
ON
Act
ual
Bud
get
Estim
ate
Dep
artm
ent
Req
uest
Gov
erno
r'sR
ecom
men
ded
Dep
artm
ent
Req
uest
Gov
erno
r'sR
ecom
men
ded
0137
- Pr
imar
y R
oad
Fund
Tran
spor
tatio
n, D
epar
tmen
t of
Fiel
d Fa
cilit
y D
efer
red
Mai
nt.
1,70
0,00
01,
700,
000
1,70
0,00
01,
700,
000
1,70
0,00
01,
700,
000
Gar
age
Fuel
& W
aste
Man
agem
ent
800,
000
800,
000
800,
000
800,
000
800,
000
800,
000
PRF
- Aud
itor o
f Sta
te R
eim
burs
emen
t44
8,49
050
6,88
452
1,41
852
1,41
853
6,38
253
6,38
2PR
F - D
AS U
tility
Ser
vice
s1,
544,
713
1,59
4,44
01,
594,
440
1,59
4,44
01,
594,
440
1,59
4,44
0PR
F-D
OT
Wor
kers
' Com
pens
atio
n3,
443,
221
3,79
0,50
44,
211,
524
4,21
1,52
44,
211,
524
4,21
1,52
4PR
F-H
ighw
ay D
ivis
ion
238,
625,
855
244,
749,
911
249,
288,
911
245,
060,
911
257,
358,
911
245,
970,
911
PRF
- Ind
irect
Cos
t Rec
over
ies
572,
000
660,
000
660,
000
660,
000
660,
000
660,
000
PRF-
Inve
ntor
y &
Equi
pmen
t Rep
lace
men
t5,
366,
000
5,36
6,00
010
,535
,000
10,5
35,0
0010
,465
,000
10,4
65,0
00PR
F-M
otor
Veh
icle
Div
isio
n1,
496,
889
1,50
2,66
51,
538,
305
1,50
0,42
51,
596,
545
1,50
0,42
5PR
F-O
pera
tions
40,2
96,0
4541
,032
,482
41,8
24,5
4241
,158
,042
42,6
93,1
4241
,158
,042
PRF
- Per
form
ance
and
Tec
hnol
ogy
3,12
6,96
03,
155,
710
3,29
5,03
03,
223,
650
3,42
0,59
03,
223,
650
PRF-
Plan
ning
, Pro
gram
min
g &
Mod
al8,
340,
481
8,48
8,98
18,
735,
032
8,54
1,23
19,
056,
132
8,54
1,23
1PR
F-U
nem
ploy
men
t Com
pens
atio
n13
8,00
013
8,00
013
8,00
013
8,00
013
8,00
013
8,00
0R
est A
rea
Faci
lity
Mai
nten
ance
-25
0,00
025
0,00
025
0,00
025
0,00
025
0,00
0Tr
ansp
orta
tion
Map
s-
242,
000
--
242,
000
242,
000
Tota
l Tra
nspo
rtat
ion,
Dep
artm
ent o
f30
5,89
8,65
431
3,97
7,57
732
5,09
2,20
231
9,89
4,64
133
4,72
2,66
632
0,99
1,60
5
Tota
l Tra
nspo
rtat
ion
305,
898,
654
313,
977,
577
325,
092,
202
319,
894,
641
334,
722,
666
320,
991,
605
129
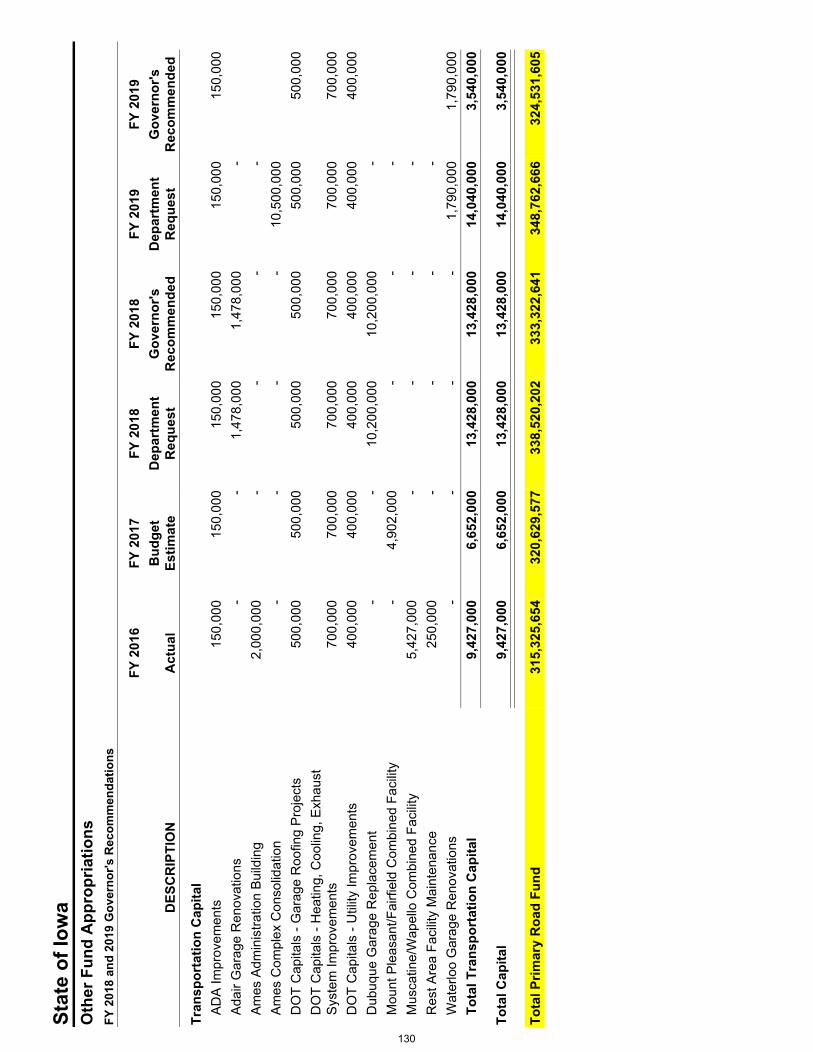
Stat
e of
Iow
aO
ther
Fun
d A
ppro
pria
tions
FY 2
018
and
2019
Gov
erno
r's R
ecom
men
datio
ns
FY 2
016
FY 2
017
FY 2
018
FY 2
018
FY 2
019
FY 2
019
DES
CR
IPTI
ON
Act
ual
Bud
get
Estim
ate
Dep
artm
ent
Req
uest
Gov
erno
r'sR
ecom
men
ded
Dep
artm
ent
Req
uest
Gov
erno
r'sR
ecom
men
ded
Tran
spor
tatio
n C
apita
lAD
A Im
prov
emen
ts15
0,00
015
0,00
015
0,00
015
0,00
015
0,00
015
0,00
0Ad
air G
arag
e R
enov
atio
ns-
-1,
478,
000
1,47
8,00
0-
Ames
Adm
inis
tratio
n Bu
ildin
g2,
000,
000
--
--
Ames
Com
plex
Con
solid
atio
n-
--
-10
,500
,000
DO
T C
apita
ls -
Gar
age
Roo
fing
Proj
ects
500,
000
500,
000
500,
000
500,
000
500,
000
500,
000
DO
T C
apita
ls -
Hea
ting,
Coo
ling,
Exh
aust
Syst
em Im
prov
emen
ts70
0,00
070
0,00
070
0,00
070
0,00
070
0,00
070
0,00
0D
OT
Cap
itals
- U
tility
Impr
ovem
ents
400,
000
400,
000
400,
000
400,
000
400,
000
400,
000
Dub
uque
Gar
age
Rep
lace
men
t-
-10
,200
,000
10,2
00,0
00-
Mou
nt P
leas
ant/F
airfi
eld
Com
bine
d Fa
cilit
y-
4,90
2,00
0-
--
Mus
catin
e/W
apel
lo C
ombi
ned
Faci
lity
5,42
7,00
0-
--
-R
est A
rea
Faci
lity
Mai
nten
ance
250,
000
--
--
Wat
erlo
o G
arag
e R
enov
atio
ns-
--
-1,
790,
000
1,79
0,00
0To
tal T
rans
port
atio
n C
apita
l9,
427,
000
6,65
2,00
013
,428
,000
13,4
28,0
0014
,040
,000
3,54
0,00
0
Tota
l Cap
ital
9,42
7,00
06,
652,
000
13,4
28,0
0013
,428
,000
14,0
40,0
003,
540,
000
Tota
l Prim
ary
Roa
d Fu
nd31
5,32
5,65
432
0,62
9,57
733
8,52
0,20
233
3,32
2,64
134
8,76
2,66
632
4,53
1,60
5
130

Stat
e of
Iow
aO
ther
Fun
d A
ppro
pria
tions
FY 2
018
and
2019
Gov
erno
r's R
ecom
men
datio
ns
FY 2
016
FY 2
017
FY 2
018
FY 2
018
FY 2
019
FY 2
019
DES
CR
IPTI
ON
Act
ual
Bud
get
Estim
ate
Dep
artm
ent
Req
uest
Gov
erno
r'sR
ecom
men
ded
Dep
artm
ent
Req
uest
Gov
erno
r'sR
ecom
men
ded
0170
- W
orkf
orce
Dev
elop
men
t With
hold
ing
Econ
omic
Dev
elop
men
t Aut
horit
yAp
pren
tices
hip
Trai
ning
Pro
gram
3,00
0,00
03,
000,
000
3,00
0,00
03,
000,
000
3,00
0,00
03,
000,
000
Job
Trai
ning
3,00
0,00
03,
000,
000
3,00
0,00
03,
000,
000
3,00
0,00
03,
000,
000
Tota
l Eco
nom
ic D
evel
opm
ent A
utho
rity
6,00
0,00
06,
000,
000
6,00
0,00
06,
000,
000
6,00
0,00
06,
000,
000
Tota
l Eco
nom
ic D
evel
opm
ent
6,00
0,00
06,
000,
000
6,00
0,00
06,
000,
000
6,00
0,00
06,
000,
000
Tota
l Wor
kfor
ce D
evel
opm
ent W
ithho
ldin
g6,
000,
000
6,00
0,00
06,
000,
000
6,00
0,00
06,
000,
000
6,00
0,00
0
131

Stat
e of
Iow
aO
ther
Fun
d A
ppro
pria
tions
FY 2
018
and
2019
Gov
erno
r's R
ecom
men
datio
ns
FY 2
016
FY 2
017
FY 2
018
FY 2
018
FY 2
019
FY 2
019
DES
CR
IPTI
ON
Act
ual
Bud
get
Estim
ate
Dep
artm
ent
Req
uest
Gov
erno
r'sR
ecom
men
ded
Dep
artm
ent
Req
uest
Gov
erno
r'sR
ecom
men
ded
0173
- Ph
arm
aceu
tical
Set
tlem
ent
Hum
an S
ervi
ces
- Ass
ista
nce
Med
ical
Con
tract
s Su
pple
men
t2,
002,
176
1,30
0,00
01,
300,
000
800,
000
1,30
0,00
050
0,00
0To
tal H
uman
Ser
vice
s - A
ssis
tanc
e2,
002,
176
1,30
0,00
01,
300,
000
800,
000
1,30
0,00
050
0,00
0
Tota
l Hum
an S
ervi
ces
2,00
2,17
61,
300,
000
1,30
0,00
080
0,00
01,
300,
000
500,
000
Tota
l Pha
rmac
eutic
al S
ettle
men
t2,
002,
176
1,30
0,00
01,
300,
000
800,
000
1,30
0,00
050
0,00
0
132

Stat
e of
Iow
aO
ther
Fun
d A
ppro
pria
tions
FY 2
018
and
2019
Gov
erno
r's R
ecom
men
datio
ns
FY 2
016
FY 2
017
FY 2
018
FY 2
018
FY 2
019
FY 2
019
DES
CR
IPTI
ON
Act
ual
Bud
get
Estim
ate
Dep
artm
ent
Req
uest
Gov
erno
r'sR
ecom
men
ded
Dep
artm
ent
Req
uest
Gov
erno
r'sR
ecom
men
ded
0211
- W
ine
And
Bee
r Pro
mot
ion
Boa
rd
Reg
ents
, Boa
rd o
fIS
U -
Mid
wes
t Gra
pe a
nd W
ine
Indu
stry
Inst
itute
Stan
ding
250,
000
250,
000
250,
000
250,
000
250,
000
250,
000
Tota
l Reg
ents
, Boa
rd o
f25
0,00
025
0,00
025
0,00
025
0,00
025
0,00
025
0,00
0
Tota
l Edu
catio
n25
0,00
025
0,00
025
0,00
025
0,00
025
0,00
025
0,00
0
Tota
l Win
e A
nd B
eer P
rom
otio
n B
oard
250,
000
250,
000
250,
000
250,
000
250,
000
250,
000
133
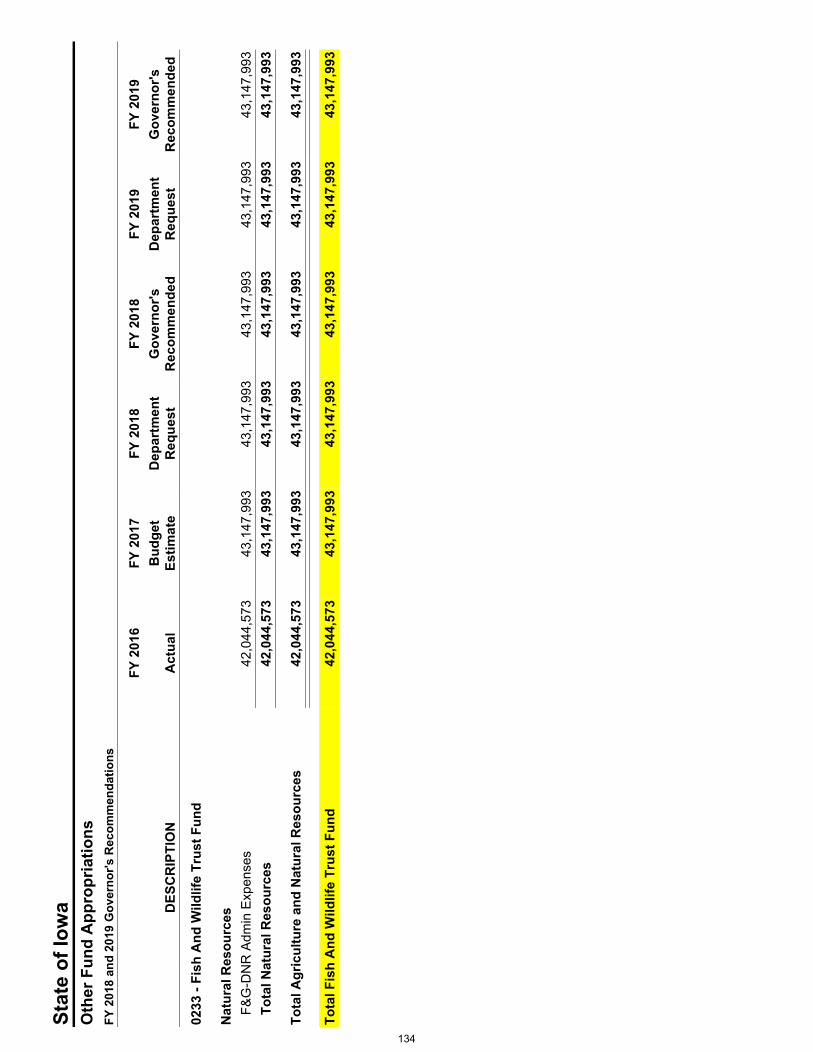
Stat
e of
Iow
aO
ther
Fun
d A
ppro
pria
tions
FY 2
018
and
2019
Gov
erno
r's R
ecom
men
datio
ns
FY 2
016
FY 2
017
FY 2
018
FY 2
018
FY 2
019
FY 2
019
DES
CR
IPTI
ON
Act
ual
Bud
get
Estim
ate
Dep
artm
ent
Req
uest
Gov
erno
r'sR
ecom
men
ded
Dep
artm
ent
Req
uest
Gov
erno
r'sR
ecom
men
ded
0233
- Fi
sh A
nd W
ildlif
e Tr
ust F
und
Nat
ural
Res
ourc
esF&
G-D
NR
Adm
in E
xpen
ses
42,0
44,5
7343
,147
,993
43,1
47,9
9343
,147
,993
43,1
47,9
9343
,147
,993
Tota
l Nat
ural
Res
ourc
es42
,044
,573
43,1
47,9
9343
,147
,993
43,1
47,9
9343
,147
,993
43,1
47,9
93
Tota
l Agr
icul
ture
and
Nat
ural
Res
ourc
es42
,044
,573
43,1
47,9
9343
,147
,993
43,1
47,9
9343
,147
,993
43,1
47,9
93
Tota
l Fis
h A
nd W
ildlif
e Tr
ust F
und
42,0
44,5
7343
,147
,993
43,1
47,9
9343
,147
,993
43,1
47,9
9343
,147
,993
134

Stat
e of
Iow
aO
ther
Fun
d A
ppro
pria
tions
FY 2
018
and
2019
Gov
erno
r's R
ecom
men
datio
ns
FY 2
016
FY 2
017
FY 2
018
FY 2
018
FY 2
019
FY 2
019
DES
CR
IPTI
ON
Act
ual
Bud
get
Estim
ate
Dep
artm
ent
Req
uest
Gov
erno
r'sR
ecom
men
ded
Dep
artm
ent
Req
uest
Gov
erno
r'sR
ecom
men
ded
0295
- En
viro
nmen
t Firs
t Fun
d
Agr
icul
ture
and
Lan
d St
ewar
dshi
pC
onse
rvat
ion
Res
erve
Enh
ance
1,00
0,00
01,
000,
000
1,00
0,00
01,
000,
000
1,00
0,00
01,
000,
000
Con
serv
atio
n R
eser
ve P
rogr
am1,
000,
000
1,00
0,00
01,
000,
000
1,00
0,00
01,
000,
000
1,00
0,00
0C
ost S
hare
6,75
0,00
06,
750,
000
6,75
0,00
06,
750,
000
6,75
0,00
06,
750,
000
Farm
Man
agem
ent D
emon
stra
tion
625,
000
625,
000
625,
000
625,
000
625,
000
625,
000
Soil
& W
ater
Con
serv
atio
n2,
700,
000
2,80
0,00
02,
800,
000
2,80
0,00
02,
800,
000
2,80
0,00
0W
ater
shed
Pro
tect
ion
Fund
900,
000
900,
000
900,
000
900,
000
900,
000
900,
000
Tota
l Agr
icul
ture
and
Lan
d St
ewar
dshi
p12
,975
,000
13,0
75,0
0013
,075
,000
13,0
75,0
0013
,075
,000
13,0
75,0
00
Loes
s H
ills
Dev
elop
men
t & C
onse
rvat
ion
Aut
horit
yLo
ess
Hills
Dev
/Con
s Au
th F
Y02
Envi
ronm
ent
Firs
t Fun
d60
0,00
060
0,00
060
0,00
060
0,00
060
0,00
060
0,00
0To
tal L
oess
Hill
s D
evel
opm
ent &
Con
serv
atio
n A
600,
000
600,
000
600,
000
600,
000
600,
000
600,
000
Nat
ural
Res
ourc
esAm
bien
t Air
Qua
lity
Mon
itorin
g - a
mbi
ent
425,
000
425,
000
425,
000
425,
000
425,
000
425,
000
Anim
al F
eedi
ng O
pera
tions
1,32
0,00
01,
320,
000
1,32
0,00
01,
320,
000
1,32
0,00
01,
320,
000
Geo
logi
cal A
nd W
ater
Sur
vey
200,
000
200,
000
200,
000
200,
000
200,
000
200,
000
GIS
Info
rmat
ion
for W
ater
shed
195,
000
195,
000
195,
000
195,
000
195,
000
195,
000
Keep
Iow
a Be
autif
ul20
0,00
0-
--
-Pa
rk O
pera
tions
& M
aint
enan
ce6,
135,
000
6,23
5,00
06,
235,
000
6,23
5,00
06,
235,
000
6,23
5,00
0R
EAP
16,0
00,0
0016
,000
,000
16,0
00,0
0016
,000
,000
16,0
00,0
0016
,000
,000
Wat
er Q
ualit
y M
onito
ring
2,95
5,00
02,
955,
000
2,95
5,00
02,
955,
000
2,95
5,00
02,
955,
000
Wat
er Q
ualit
y Pr
otec
tion
500,
000
500,
000
500,
000
500,
000
500,
000
500,
000
Wat
er Q
uant
ity49
5,00
049
5,00
049
5,00
049
5,00
049
5,00
049
5,00
0To
tal N
atur
al R
esou
rces
28,4
25,0
0028
,325
,000
28,3
25,0
0028
,325
,000
28,3
25,0
0028
,325
,000
Tota
l Agr
icul
ture
and
Nat
ural
Res
ourc
es42
,000
,000
42,0
00,0
0042
,000
,000
42,0
00,0
0042
,000
,000
42,0
00,0
00
Tota
l Env
ironm
ent F
irst F
und
42,0
00,0
0042
,000
,000
42,0
00,0
0042
,000
,000
42,0
00,0
0042
,000
,000
135

Stat
e of
Iow
aO
ther
Fun
d A
ppro
pria
tions
FY 2
018
and
2019
Gov
erno
r's R
ecom
men
datio
ns
FY 2
016
FY 2
017
FY 2
018
FY 2
018
FY 2
019
FY 2
019
DES
CR
IPTI
ON
Act
ual
Bud
get
Estim
ate
Dep
artm
ent
Req
uest
Gov
erno
r'sR
ecom
men
ded
Dep
artm
ent
Req
uest
Gov
erno
r'sR
ecom
men
ded
0441
- U
ncla
imed
Win
ning
s Fu
nd
Agr
icul
ture
and
Lan
d St
ewar
dshi
pIo
wa
Juni
or A
ngus
Sho
w-
10,0
0010
,000
10,0
0010
,000
10,0
00N
ativ
e H
orse
and
Dog
Pro
gram
305,
516
295,
516
295,
516
295,
516
295,
516
295,
516
Tota
l Agr
icul
ture
and
Lan
d St
ewar
dshi
p30
5,51
630
5,51
630
5,51
630
5,51
630
5,51
630
5,51
6
Tota
l Agr
icul
ture
and
Nat
ural
Res
ourc
es30
5,51
630
5,51
630
5,51
630
5,51
630
5,51
630
5,51
6
Tota
l Unc
laim
ed W
inni
ngs
Fund
305,
516
305,
516
305,
516
305,
516
305,
516
305,
516
136

Stat
e of
Iow
aO
ther
Fun
d A
ppro
pria
tions
FY 2
018
and
2019
Gov
erno
r's R
ecom
men
datio
ns
FY 2
016
FY 2
017
FY 2
018
FY 2
018
FY 2
019
FY 2
019
DES
CR
IPTI
ON
Act
ual
Bud
get
Estim
ate
Dep
artm
ent
Req
uest
Gov
erno
r'sR
ecom
men
ded
Dep
artm
ent
Req
uest
Gov
erno
r'sR
ecom
men
ded
0445
- H
ospi
tal H
ealth
Car
e A
cces
s Tr
ust
Hum
an S
ervi
ces
- Ass
ista
nce
Med
ical
Ass
ista
nce
Supp
lem
enta
l-Hos
pita
l Car
eAc
cess
Tru
st34
,700
,000
34,7
00,0
0034
,700
,000
34,7
00,0
0034
,700
,000
34,7
00,0
00To
tal H
uman
Ser
vice
s - A
ssis
tanc
e34
,700
,000
34,7
00,0
0034
,700
,000
34,7
00,0
0034
,700
,000
34,7
00,0
00
Tota
l Hum
an S
ervi
ces
34,7
00,0
0034
,700
,000
34,7
00,0
0034
,700
,000
34,7
00,0
0034
,700
,000
Tota
l Hos
pita
l Hea
lth C
are
Acc
ess
Trus
t34
,700
,000
34,7
00,0
0034
,700
,000
34,7
00,0
0034
,700
,000
34,7
00,0
00
137

Stat
e of
Iow
aO
ther
Fun
d A
ppro
pria
tions
FY 2
018
and
2019
Gov
erno
r's R
ecom
men
datio
ns
FY 2
016
FY 2
017
FY 2
018
FY 2
018
FY 2
019
FY 2
019
DES
CR
IPTI
ON
Act
ual
Bud
get
Estim
ate
Dep
artm
ent
Req
uest
Gov
erno
r'sR
ecom
men
ded
Dep
artm
ent
Req
uest
Gov
erno
r'sR
ecom
men
ded
0450
- U
ST U
nass
igne
d R
even
ue (N
onbo
nd)
Agr
icul
ture
and
Lan
d St
ewar
dshi
pFu
el In
spec
tion
250,
000
250,
000
250,
000
250,
000
250,
000
250,
000
Tota
l Agr
icul
ture
and
Lan
d St
ewar
dshi
p25
0,00
025
0,00
025
0,00
025
0,00
025
0,00
025
0,00
0
Nat
ural
Res
ourc
esTe
chni
cal T
ank
Rev
iew
200,
000
200,
000
200,
000
200,
000
200,
000
200,
000
UST
Adm
inis
tratio
n M
atch
200,
000
200,
000
200,
000
200,
000
200,
000
200,
000
Tota
l Nat
ural
Res
ourc
es40
0,00
040
0,00
040
0,00
040
0,00
040
0,00
040
0,00
0
Tota
l Agr
icul
ture
and
Nat
ural
Res
ourc
es65
0,00
065
0,00
065
0,00
065
0,00
065
0,00
065
0,00
0
Tota
l UST
Una
ssig
ned
Rev
enue
(Non
bond
)65
0,00
065
0,00
065
0,00
065
0,00
065
0,00
065
0,00
0
138
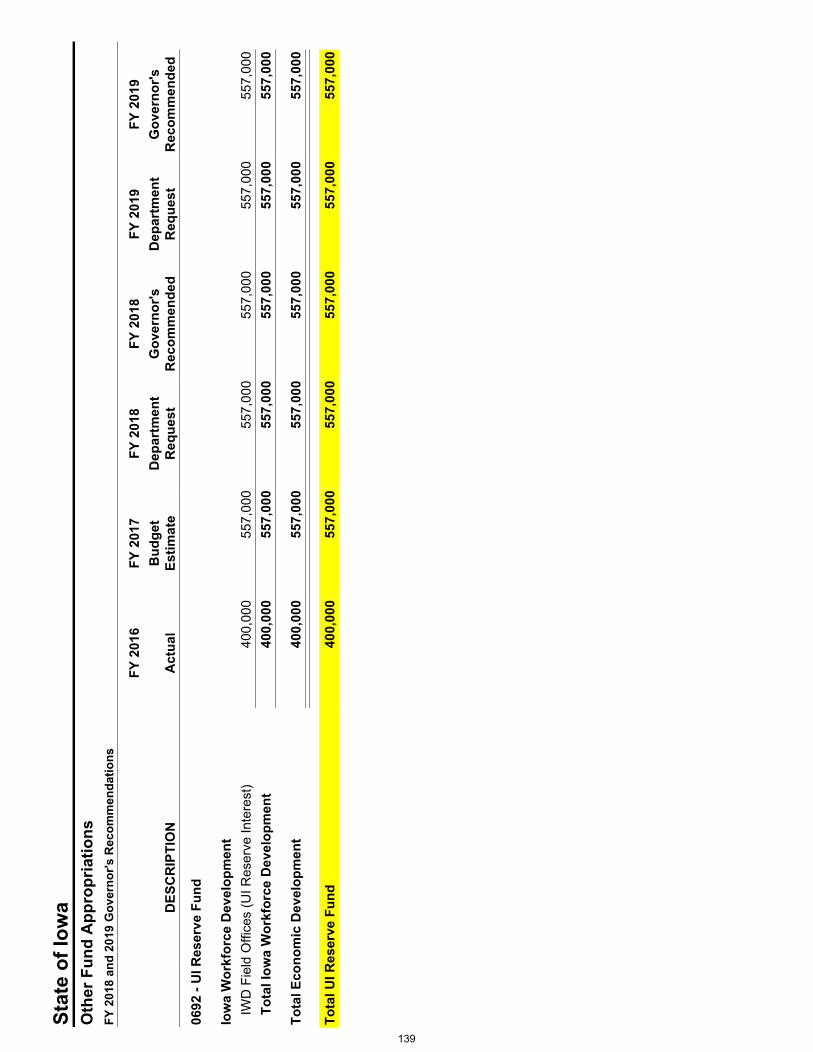
Stat
e of
Iow
aO
ther
Fun
d A
ppro
pria
tions
FY 2
018
and
2019
Gov
erno
r's R
ecom
men
datio
ns
FY 2
016
FY 2
017
FY 2
018
FY 2
018
FY 2
019
FY 2
019
DES
CR
IPTI
ON
Act
ual
Bud
get
Estim
ate
Dep
artm
ent
Req
uest
Gov
erno
r'sR
ecom
men
ded
Dep
artm
ent
Req
uest
Gov
erno
r'sR
ecom
men
ded
0692
- U
I Res
erve
Fun
d
Iow
a W
orkf
orce
Dev
elop
men
tIW
D F
ield
Offi
ces
(UI R
eser
ve In
tere
st)
400,
000
557,
000
557,
000
557,
000
557,
000
557,
000
Tota
l Iow
a W
orkf
orce
Dev
elop
men
t40
0,00
055
7,00
055
7,00
055
7,00
055
7,00
055
7,00
0
Tota
l Eco
nom
ic D
evel
opm
ent
400,
000
557,
000
557,
000
557,
000
557,
000
557,
000
Tota
l UI R
eser
ve F
und
400,
000
557,
000
557,
000
557,
000
557,
000
557,
000
139

Stat
e of
Iow
aO
ther
Fun
d A
ppro
pria
tions
FY 2
018
and
2019
Gov
erno
r's R
ecom
men
datio
ns
FY 2
016
FY 2
017
FY 2
018
FY 2
018
FY 2
019
FY 2
019
DES
CR
IPTI
ON
Act
ual
Bud
get
Estim
ate
Dep
artm
ent
Req
uest
Gov
erno
r'sR
ecom
men
ded
Dep
artm
ent
Req
uest
Gov
erno
r'sR
ecom
men
ded
0791
- IP
ERS
Fund
Iow
a Pu
blic
Em
ploy
ees'
Ret
irem
ent S
yste
m A
dmin
istr
atio
nIP
ERS
Adm
inis
tratio
n17
,686
,968
17,6
86,9
6817
,686
,968
17,6
86,9
6817
,686
,968
17,6
86,9
68To
tal I
owa
Publ
ic E
mpl
oyee
s' R
etire
men
t Sys
te17
,686
,968
17,6
86,9
6817
,686
,968
17,6
86,9
6817
,686
,968
17,6
86,9
68
Tota
l Adm
inis
trat
ion
and
Reg
ulat
ion
17,6
86,9
6817
,686
,968
17,6
86,9
6817
,686
,968
17,6
86,9
6817
,686
,968
Tota
l IPE
RS
Fund
17,6
86,9
6817
,686
,968
17,6
86,9
6817
,686
,968
17,6
86,9
6817
,686
,968
140

Stat
e of
Iow
aO
ther
Fun
d A
ppro
pria
tions
FY 2
018
and
2019
Gov
erno
r's R
ecom
men
datio
ns
FY 2
016
FY 2
017
FY 2
018
FY 2
018
FY 2
019
FY 2
019
DES
CR
IPTI
ON
Act
ual
Bud
get
Estim
ate
Dep
artm
ent
Req
uest
Gov
erno
r'sR
ecom
men
ded
Dep
artm
ent
Req
uest
Gov
erno
r'sR
ecom
men
ded
0810
- R
oad
Use
Tax
Fun
d
Insp
ectio
ns &
App
eals
, Dep
artm
ent o
fD
IA -
Use
Tax
1,62
3,89
71,
623,
897
1,62
3,89
71,
623,
897
1,62
3,89
71,
623,
897
Tota
l Ins
pect
ions
& A
ppea
ls, D
epar
tmen
t of
1,62
3,89
71,
623,
897
1,62
3,89
71,
623,
897
1,62
3,89
71,
623,
897
Man
agem
ent,
Dep
artm
ent o
fD
OM
Roa
d U
se T
ax F
und
Appr
opria
tion
56,0
0056
,000
56,0
0056
,000
56,0
0056
,000
Tota
l Man
agem
ent,
Dep
artm
ent o
f56
,000
56,0
0056
,000
56,0
0056
,000
56,0
00
Trea
sure
r of S
tate
Fund
s fo
r I3
Expe
nses
- R
oad
Use
Tax
93,1
4893
,148
93,1
4893
,148
93,1
4893
,148
Tota
l Tre
asur
er o
f Sta
te93
,148
93,1
4893
,148
93,1
4893
,148
93,1
48
Tota
l Adm
inis
trat
ion
and
Reg
ulat
ion
1,77
3,04
51,
773,
045
1,77
3,04
51,
773,
045
1,77
3,04
51,
773,
045
141

Stat
e of
Iow
aO
ther
Fun
d A
ppro
pria
tions
FY 2
018
and
2019
Gov
erno
r's R
ecom
men
datio
ns
FY 2
016
FY 2
017
FY 2
018
FY 2
018
FY 2
019
FY 2
019
DES
CR
IPTI
ON
Act
ual
Bud
get
Estim
ate
Dep
artm
ent
Req
uest
Gov
erno
r'sR
ecom
men
ded
Dep
artm
ent
Req
uest
Gov
erno
r'sR
ecom
men
ded
Tran
spor
tatio
n, D
epar
tmen
t of
Cou
nty
Trea
sure
r Equ
ipm
ent S
tand
ing
650,
000
650,
000
650,
000
650,
000
650,
000
650,
000
Cou
nty
Trea
sure
rs S
uppo
rt1,
406,
000
1,40
6,00
01,
406,
000
1,40
6,00
01,
406,
000
1,40
6,00
0D
river
s' L
icen
ses
3,87
6,00
03,
876,
000
3,87
6,00
03,
876,
000
3,87
6,00
03,
876,
000
Mis
siss
ippi
Riv
er P
arkw
ay C
omm
issi
on40
,000
40,0
00-
--
Pers
onal
Del
iver
y of
Ser
vice
s D
OT
225,
000
225,
000
225,
000
225,
000
225,
000
225,
000
RU
TF -
Audi
tor o
f Sta
te R
eim
burs
emen
t73
,010
82,5
1684
,882
84,8
8287
,318
87,3
18R
UTF
- D
AS U
tility
Ser
vice
s25
1,46
525
9,56
025
9,56
025
9,56
025
9,56
025
9,56
0R
UTF
- In
dire
ct C
ost R
ecov
erie
s78
,000
90,0
0090
,000
90,0
0090
,000
90,0
00R
UTF
-Mot
or V
ehic
le D
ivis
ion
35,9
25,3
4536
,063
,965
36,9
19,3
2536
,010
,205
38,3
17,0
8536
,010
,205
RU
TF-O
pera
tions
6,55
9,82
16,
679,
706
6,80
8,64
66,
700,
146
6,95
0,04
66,
700,
146
RU
TF -
Perfo
rman
ce a
nd T
echn
olog
y50
9,04
051
3,72
053
6,40
052
5,34
055
6,84
052
5,34
0R
UTF
-Pla
nnin
g, P
rogr
ams
& M
odal
438,
973
446,
789
459,
739
449,
539
476,
639
449,
539
RU
TF-U
nem
ploy
men
t Com
pens
atio
n7,
000
7,00
07,
000
7,00
07,
000
7,00
0R
UTF
-Wor
kers
' Com
pens
atio
n14
3,46
815
7,93
817
5,48
017
5,48
017
5,48
017
5,48
0Tr
aCS/
MAC
H30
0,00
030
0,00
030
0,00
030
0,00
030
0,00
030
0,00
0To
tal T
rans
port
atio
n, D
epar
tmen
t of
50,4
83,1
2250
,798
,194
51,7
98,0
3250
,759
,152
53,3
76,9
6850
,761
,588
Tota
l Tra
nspo
rtat
ion
50,4
83,1
2250
,798
,194
51,7
98,0
3250
,759
,152
53,3
76,9
6850
,761
,588
Tran
spor
tatio
n C
apita
lD
ubuq
ue G
arag
e R
epla
cem
ent
--
600,
000
600,
000
-M
VD F
ield
Fac
ilitie
s M
aint
enan
ce30
0,00
030
0,00
030
0,00
030
0,00
030
0,00
030
0,00
0To
tal T
rans
port
atio
n C
apita
l30
0,00
030
0,00
090
0,00
090
0,00
030
0,00
030
0,00
0
Tota
l Cap
ital
300,
000
300,
000
900,
000
900,
000
300,
000
300,
000
Tota
l Roa
d U
se T
ax F
und
52,5
56,1
6752
,871
,239
54,4
71,0
7753
,432
,197
55,4
50,0
1352
,834
,633
142

Stat
e of
Iow
aO
ther
Fun
d A
ppro
pria
tions
FY 2
018
and
2019
Gov
erno
r's R
ecom
men
datio
ns
FY 2
016
FY 2
017
FY 2
018
FY 2
018
FY 2
019
FY 2
019
DES
CR
IPTI
ON
Act
ual
Bud
get
Estim
ate
Dep
artm
ent
Req
uest
Gov
erno
r'sR
ecom
men
ded
Dep
artm
ent
Req
uest
Gov
erno
r'sR
ecom
men
ded
0828
- C
ount
y En
dow
men
t Fun
d
Econ
omic
Dev
elop
men
t Aut
horit
yEn
dow
Iow
a Ad
min
- C
ount
y En
dow
men
t Fun
d70
,000
70,0
0070
,000
70,0
0070
,000
70,0
00To
tal E
cono
mic
Dev
elop
men
t Aut
horit
y70
,000
70,0
0070
,000
70,0
0070
,000
70,0
00
Tota
l Eco
nom
ic D
evel
opm
ent
70,0
0070
,000
70,0
0070
,000
70,0
0070
,000
Tota
l Cou
nty
Endo
wm
ent F
und
70,0
0070
,000
70,0
0070
,000
70,0
0070
,000
143

Stat
e of
Iow
aO
ther
Fun
d A
ppro
pria
tions
FY 2
018
and
2019
Gov
erno
r's R
ecom
men
datio
ns
FY 2
016
FY 2
017
FY 2
018
FY 2
018
FY 2
019
FY 2
019
DES
CR
IPTI
ON
Act
ual
Bud
get
Estim
ate
Dep
artm
ent
Req
uest
Gov
erno
r'sR
ecom
men
ded
Dep
artm
ent
Req
uest
Gov
erno
r'sR
ecom
men
ded
0867
- M
VFT-
Una
ppor
tione
d
Rev
enue
, Dep
artm
ent o
fM
otor
Veh
Fue
l Tx-
Adm
in A
ppro
p1,
305,
775
1,30
5,77
51,
305,
775
1,30
5,77
51,
305,
775
1,30
5,77
5To
tal R
even
ue, D
epar
tmen
t of
1,30
5,77
51,
305,
775
1,30
5,77
51,
305,
775
1,30
5,77
51,
305,
775
Tota
l Adm
inis
trat
ion
and
Reg
ulat
ion
1,30
5,77
51,
305,
775
1,30
5,77
51,
305,
775
1,30
5,77
51,
305,
775
Tota
l MVF
T-U
napp
ortio
ned
1,30
5,77
51,
305,
775
1,30
5,77
51,
305,
775
1,30
5,77
51,
305,
775
144

Stat
e of
Iow
aO
ther
Fun
d A
ppro
pria
tions
FY 2
018
and
2019
Gov
erno
r's R
ecom
men
datio
ns
FY 2
016
FY 2
017
FY 2
018
FY 2
018
FY 2
019
FY 2
019
DES
CR
IPTI
ON
Act
ual
Bud
get
Estim
ate
Dep
artm
ent
Req
uest
Gov
erno
r'sR
ecom
men
ded
Dep
artm
ent
Req
uest
Gov
erno
r'sR
ecom
men
ded
0943
- Te
chno
logy
Rei
nves
tmen
t Fun
d
Chi
ef In
form
atio
n O
ffice
r, O
ffice
of t
heIT
Con
solid
atio
n - O
CIO
--
13,6
70,0
003,
000,
000
-7,
650,
000
Tota
l Chi
ef In
form
atio
n O
ffice
r, O
ffice
of t
he-
-13
,670
,000
3,00
0,00
0-
7,65
0,00
0
Iow
a C
omm
unic
atio
ns N
etw
ork
ICN
Equ
ipm
ent R
epla
cem
ent -
TR
F-
-1,
150,
000
1,15
0,00
01,
150,
000
1,15
0,00
0To
tal I
owa
Com
mun
icat
ions
Net
wor
k-
-1,
150,
000
1,15
0,00
01,
150,
000
1,15
0,00
0
Hum
an R
ight
s, D
epar
tmen
t of
Infra
stru
ctur
e fo
r Int
egra
ting
Just
ice
Dat
aSy
stem
s-
-1,
345,
000
1,40
0,00
01,
345,
000
1,40
0,00
0Ju
stic
e D
ata
War
ehou
se-
-11
7,98
015
7,98
011
7,98
015
7,98
0To
tal H
uman
Rig
hts,
Dep
artm
ent o
f-
-1,
462,
980
1,55
7,98
01,
462,
980
1,55
7,98
0
Insp
ectio
ns &
App
eals
, Dep
artm
ent o
fEl
ectro
nic
Cas
e M
anag
emen
t Sys
tem
--
89,4
48-
-To
tal I
nspe
ctio
ns &
App
eals
, Dep
artm
ent o
f-
-89
,448
--
Publ
ic D
efen
der
Dev
elop
men
t of o
nlin
e cl
aim
s-no
n At
torn
eybi
llings
-094
3, T
RF
--
66,4
6366
,463
-To
tal P
ublic
Def
ende
r-
-66
,463
66,4
63-
Man
agem
ent,
Dep
artm
ent o
fIo
wa
Gra
nts
Man
agem
ent I
mpl
emen
tatio
n (T
RF)
--
50,0
0050
,000
50,0
0070
,000
Loca
l Gov
ernm
ent B
udge
t & P
rope
rty T
axSy
stem
Upg
rade
/Red
esi
--
600,
000
600,
000
-Tr
ansp
aren
cy P
roje
ct-
-45
,000
45,0
0045
,000
45,0
00To
tal M
anag
emen
t, D
epar
tmen
t of
--
695,
000
695,
000
95,0
0011
5,00
0
145
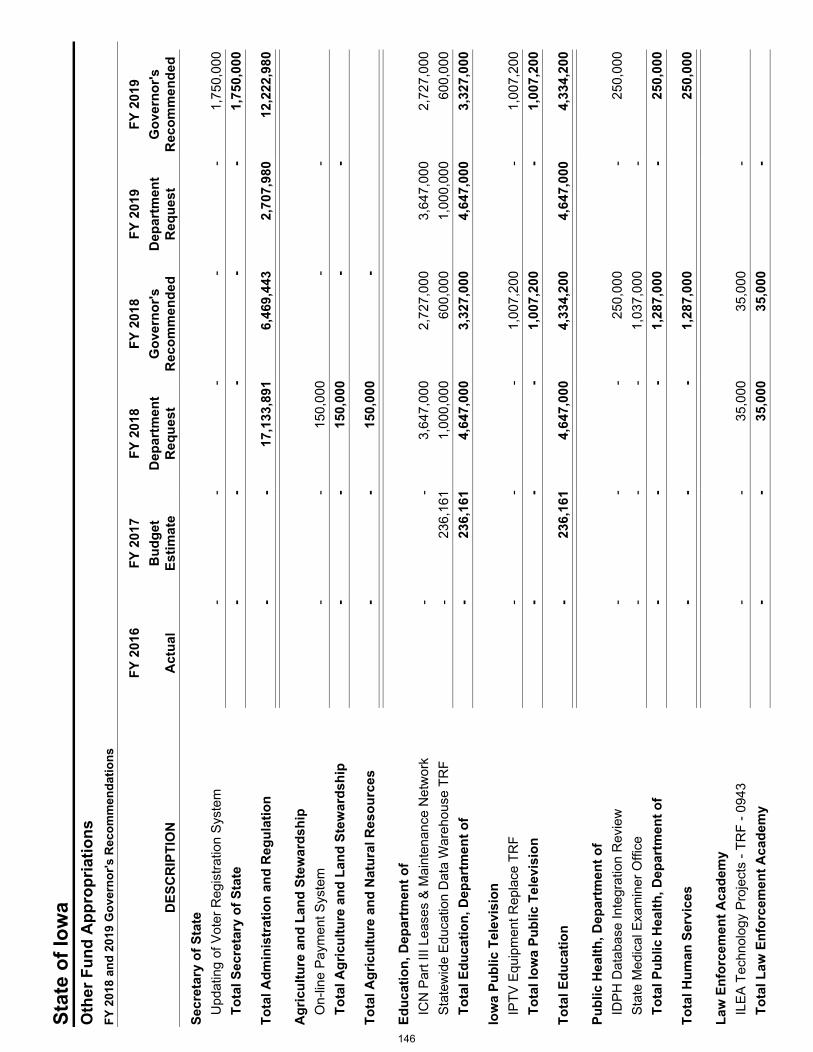
Stat
e of
Iow
aO
ther
Fun
d A
ppro
pria
tions
FY 2
018
and
2019
Gov
erno
r's R
ecom
men
datio
ns
FY 2
016
FY 2
017
FY 2
018
FY 2
018
FY 2
019
FY 2
019
DES
CR
IPTI
ON
Act
ual
Bud
get
Estim
ate
Dep
artm
ent
Req
uest
Gov
erno
r'sR
ecom
men
ded
Dep
artm
ent
Req
uest
Gov
erno
r'sR
ecom
men
ded
Secr
etar
y of
Sta
teU
pdat
ing
of V
oter
Reg
istra
tion
Syst
em-
--
--
1,75
0,00
0To
tal S
ecre
tary
of S
tate
--
--
-1,
750,
000
Tota
l Adm
inis
trat
ion
and
Reg
ulat
ion
--
17,1
33,8
916,
469,
443
2,70
7,98
012
,222
,980
Agr
icul
ture
and
Lan
d St
ewar
dshi
pO
n-lin
e Pa
ymen
t Sys
tem
--
150,
000
--
Tota
l Agr
icul
ture
and
Lan
d St
ewar
dshi
p-
-15
0,00
0-
-
Tota
l Agr
icul
ture
and
Nat
ural
Res
ourc
es-
-15
0,00
0-
Educ
atio
n, D
epar
tmen
t of
ICN
Par
t III
Leas
es &
Mai
nten
ance
Net
wor
k-
-3,
647,
000
2,72
7,00
03,
647,
000
2,72
7,00
0St
atew
ide
Educ
atio
n D
ata
War
ehou
se T
RF
-23
6,16
11,
000,
000
600,
000
1,00
0,00
060
0,00
0To
tal E
duca
tion,
Dep
artm
ent o
f-
236,
161
4,64
7,00
03,
327,
000
4,64
7,00
03,
327,
000
Iow
a Pu
blic
Tel
evis
ion
IPTV
Equ
ipm
ent R
epla
ce T
RF
--
-1,
007,
200
-1,
007,
200
Tota
l Iow
a Pu
blic
Tel
evis
ion
--
-1,
007,
200
-1,
007,
200
Tota
l Edu
catio
n-
236,
161
4,64
7,00
04,
334,
200
4,64
7,00
04,
334,
200
Publ
ic H
ealth
, Dep
artm
ent o
fID
PH D
atab
ase
Inte
grat
ion
Rev
iew
--
-25
0,00
0-
250,
000
Stat
e M
edic
al E
xam
iner
Offi
ce-
--
1,03
7,00
0-
Tota
l Pub
lic H
ealth
, Dep
artm
ent o
f-
--
1,28
7,00
0-
250,
000
Tota
l Hum
an S
ervi
ces
--
-1,
287,
000
250,
000
Law
Enf
orce
men
t Aca
dem
yIL
EA T
echn
olog
y Pr
ojec
ts -
TRF
- 094
3-
-35
,000
35,0
00-
Tota
l Law
Enf
orce
men
t Aca
dem
y-
-35
,000
35,0
00-
146

Stat
e of
Iow
aO
ther
Fun
d A
ppro
pria
tions
FY 2
018
and
2019
Gov
erno
r's R
ecom
men
datio
ns
FY 2
016
FY 2
017
FY 2
018
FY 2
018
FY 2
019
FY 2
019
DES
CR
IPTI
ON
Act
ual
Bud
get
Estim
ate
Dep
artm
ent
Req
uest
Gov
erno
r'sR
ecom
men
ded
Dep
artm
ent
Req
uest
Gov
erno
r'sR
ecom
men
ded
Paro
le B
oard
Paro
le B
oard
Tec
hnol
ogy
Proj
ects
- TR
F 09
43-
-16
0,00
0-
-To
tal P
arol
e B
oard
--
160,
000
--
Hom
elan
d Se
curit
y an
d Em
erge
ncy
Man
agem
ent
EMS
Dat
a Sy
stem
TR
F H
omel
and
Secu
rity
--
-40
0,00
0-
400,
000
Tota
l Hom
elan
d Se
curit
y an
d Em
erge
ncy
Man
ag-
--
400,
000
-40
0,00
0
Tota
l Jus
tice
Syst
em-
-19
5,00
043
5,00
040
0,00
0
Cor
rect
ions
Cap
ital
DO
C T
echn
olog
y R
einv
estm
ent F
und
- 094
3-
-3,
805,
561
-37
5,00
0To
tal C
orre
ctio
ns C
apita
l-
-3,
805,
561
-37
5,00
0
Hum
an S
ervi
ces
- Cap
ital
Med
icai
d Te
chno
logy
--
-2,
992,
416
-To
tal H
uman
Ser
vice
s - C
apita
l-
--
2,99
2,41
6-
Publ
ic S
afet
y C
apita
lD
PS R
adio
Rep
lace
men
t-TR
F-09
43-
-1,
985,
000
1,98
5,00
0-
DPS
Tec
h Pr
ojec
ts -
TRF
0943
--
1,12
2,50
0-
-To
tal P
ublic
Saf
ety
Cap
ital
--
3,10
7,50
01,
985,
000
-
Tota
l Cap
ital
--
6,91
3,06
14,
977,
416
375,
000
Tota
l Tec
hnol
ogy
Rei
nves
tmen
t Fun
d-
236,
161
29,0
38,9
5217
,503
,059
7,72
9,98
017
,207
,180
147

Stat
e of
Iow
aO
ther
Fun
d A
ppro
pria
tions
FY 2
018
and
2019
Gov
erno
r's R
ecom
men
datio
ns
FY 2
016
FY 2
017
FY 2
018
FY 2
018
FY 2
019
FY 2
019
DES
CR
IPTI
ON
Act
ual
Bud
get
Estim
ate
Dep
artm
ent
Req
uest
Gov
erno
r'sR
ecom
men
ded
Dep
artm
ent
Req
uest
Gov
erno
r'sR
ecom
men
ded
0944
- R
enew
able
Fue
l Inf
rast
ruct
ure
Fund
Agr
icul
ture
and
Lan
d St
ewar
dshi
pM
otor
Fue
l Ins
pect
ion
500,
000
500,
000
500,
000
500,
000
500,
000
500,
000
Tota
l Agr
icul
ture
and
Lan
d St
ewar
dshi
p50
0,00
050
0,00
050
0,00
050
0,00
050
0,00
050
0,00
0
Tota
l Agr
icul
ture
and
Nat
ural
Res
ourc
es50
0,00
050
0,00
050
0,00
050
0,00
050
0,00
050
0,00
0
Tota
l Ren
ewab
le F
uel I
nfra
stru
ctur
e Fu
nd50
0,00
050
0,00
050
0,00
050
0,00
050
0,00
050
0,00
0
148

Stat
e of
Iow
aO
ther
Fun
d A
ppro
pria
tions
FY 2
018
and
2019
Gov
erno
r's R
ecom
men
datio
ns
FY 2
016
FY 2
017
FY 2
018
FY 2
018
FY 2
019
FY 2
019
DES
CR
IPTI
ON
Act
ual
Bud
get
Estim
ate
Dep
artm
ent
Req
uest
Gov
erno
r'sR
ecom
men
ded
Dep
artm
ent
Req
uest
Gov
erno
r'sR
ecom
men
ded
0950
- St
ate
Avi
atio
n Fu
nd
Tran
spor
tatio
n, D
epar
tmen
t of
Com
mer
cial
Ser
vice
Avi
atio
n In
frast
ruct
ure
Gra
nts
-60
,000
60,0
00-
60,0
00G
ener
al A
viat
ion
Infra
stru
ctur
e G
rant
s-
750,
000
750,
000
-75
0,00
0To
tal T
rans
port
atio
n, D
epar
tmen
t of
-81
0,00
081
0,00
0-
810,
000
Tota
l Tra
nspo
rtat
ion
-81
0,00
081
0,00
0-
810,
000
Tota
l Sta
te A
viat
ion
Fund
-81
0,00
081
0,00
0-
810,
000
149

Stat
e of
Iow
aO
ther
Fun
d A
ppro
pria
tions
FY 2
018
and
2019
Gov
erno
r's R
ecom
men
datio
ns
FY 2
016
FY 2
017
FY 2
018
FY 2
018
FY 2
019
FY 2
019
DES
CR
IPTI
ON
Act
ual
Bud
get
Estim
ate
Dep
artm
ent
Req
uest
Gov
erno
r'sR
ecom
men
ded
Dep
artm
ent
Req
uest
Gov
erno
r'sR
ecom
men
ded
0955
- H
ealth
Car
e Tr
ust
Hum
an S
ervi
ces
- Ass
ista
nce
Med
ical
Ass
ista
nce
- HC
TF22
4,99
0,50
421
9,89
0,00
021
9,89
0,00
022
1,90
0,00
021
9,89
0,00
022
0,70
0,00
0To
tal H
uman
Ser
vice
s - A
ssis
tanc
e22
4,99
0,50
421
9,89
0,00
021
9,89
0,00
022
1,90
0,00
021
9,89
0,00
022
0,70
0,00
0
Tota
l Hum
an S
ervi
ces
224,
990,
504
219,
890,
000
219,
890,
000
221,
900,
000
219,
890,
000
220,
700,
000
Tota
l Hea
lth C
are
Trus
t 22
4,99
0,50
421
9,89
0,00
021
9,89
0,00
022
1,90
0,00
021
9,89
0,00
022
0,70
0,00
0
150

Stat
e of
Iow
aO
ther
Fun
d A
ppro
pria
tions
FY 2
018
and
2019
Gov
erno
r's R
ecom
men
datio
ns
FY 2
016
FY 2
017
FY 2
018
FY 2
018
FY 2
019
FY 2
019
DES
CR
IPTI
ON
Act
ual
Bud
get
Estim
ate
Dep
artm
ent
Req
uest
Gov
erno
r'sR
ecom
men
ded
Dep
artm
ent
Req
uest
Gov
erno
r'sR
ecom
men
ded
0985
- Q
ualit
y A
ssur
ance
Tru
st F
und
Hum
an S
ervi
ces
- Ass
ista
nce
Med
ical
Ass
ista
nce
Supp
lem
enta
l-Qua
lity
Assu
ranc
e Tr
ust
37,2
05,2
0836
,705
,208
36,7
05,2
0836
,705
,208
36,7
05,2
0836
,705
,208
Tota
l Hum
an S
ervi
ces
- Ass
ista
nce
37,2
05,2
0836
,705
,208
36,7
05,2
0836
,705
,208
36,7
05,2
0836
,705
,208
Tota
l Hum
an S
ervi
ces
37,2
05,2
0836
,705
,208
36,7
05,2
0836
,705
,208
36,7
05,2
0836
,705
,208
Tota
l Qua
lity
Ass
uran
ce T
rust
Fun
d37
,205
,208
36,7
05,2
0836
,705
,208
36,7
05,2
0836
,705
,208
36,7
05,2
08
151

THIS PAGE INTENTIONALLY LEFT BLANK

State Foundation Aid$2,04851%
Uniform Property Taxes$57114%
Additional Property Taxes$52213%
Federal/Other Miscellaneous
$49412%
Other State Aid$2546%
ISL Property Taxes$842% Income Surtaxes
$652%
PK-12 Education General Operating Fund Sources Detail
School Year 2006-2007
(In Millions)
Total Available: $4.036 Billion
State Foundation Aid$3,09956%
Uniform Property Taxes$82815%
Federal/Other Miscellaneous
$61511%
Additional Property Taxes$59411%
Other State Aid$1433%
ISL Property Taxes$1352%
Income Surtaxes$902%
PK-12 Education General Operating Fund Sources Detail
School Year 2016-2017
(In Millions)
Total Available: $5.503 Billion
Source: Iowa Department of Education
Source: Iowa Department of Education
153
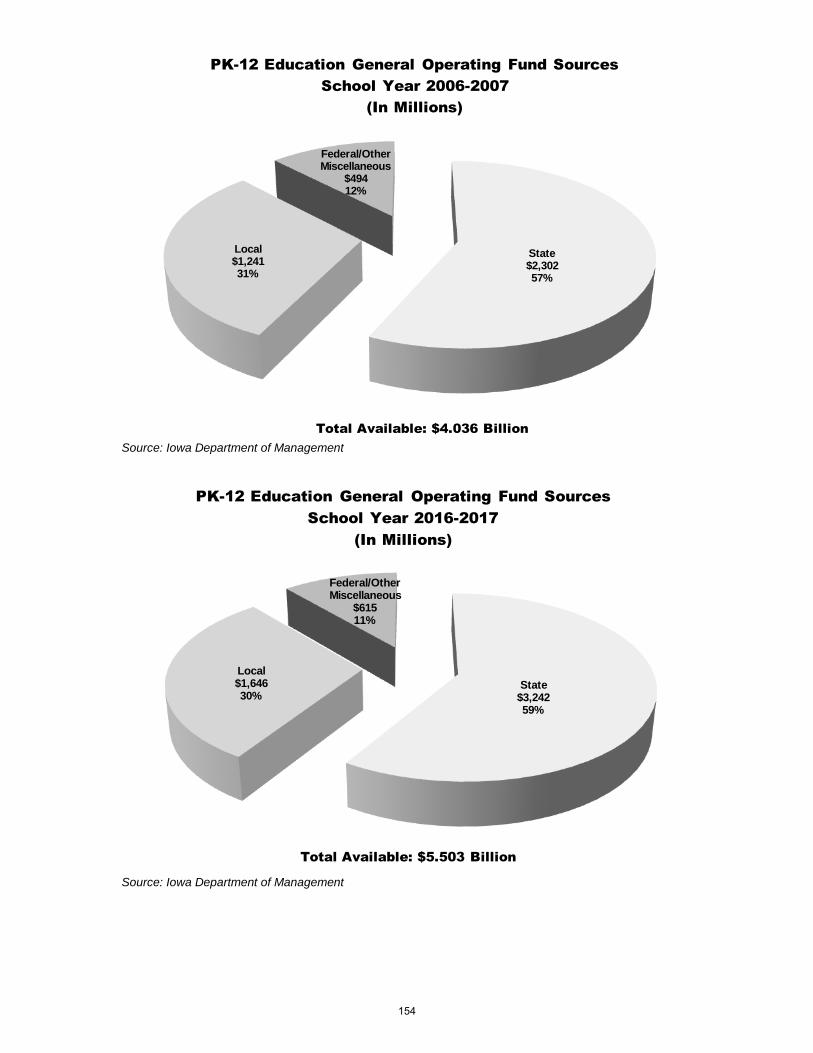
State$2,30257%
Local$1,24131%
Federal/Other Miscellaneous
$49412%
PK-12 Education General Operating Fund Sources
School Year 2006-2007
(In Millions)
Total Available: $4.036 Billion
State$3,24259%
Local$1,64630%
Federal/Other Miscellaneous
$61511%
PK-12 Education General Operating Fund Sources
School Year 2016-2017
(In Millions)
Total Available: $5.503 Billion
Source: Iowa Department of Management
Source: Iowa Department of Management
154

Regular Program$1,59878%
Supplementary Weight$352%
Special Education$31415%
AEA State Aid$834% Property Tax Aid
$191%
State Foundation Aid Distribution
Fiscal Year 2007
(In Millions)
Total Available: $2.048 Billion
Regular Program$1,94163%
Supplementary Weight$772%
Special Education$36112%
AEA State Aid$1164%
Property Tax Aid$843%
4-Year-Old Preschool$762%
Categorical$44314%
State Foundation Aid Distribution
Fiscal Year 2017
(In Millions)
Total Available: $3.099 Billion
Source: Iowa Department of Management
Source: Iowa Department of Management
155

440,000
450,000
460,000
470,000
480,000
490,000
500,000
510,000
520,000
530,000
2004
2005
2006
2007
2008
2009
2010
2011
2012
2013
2014
2015
2016
2017
Est
2018
Est
2019
Est
2020
Est
2021
Est
485,011
483,335
483,105
482,584
480,609
477,019
474,227
473,493
473,504
476,245
478,921
480,772
483,451
483,977
484,510
484,971
486,511
488,009
37,243
36,161
35,250
34,278
34,138
33,897
33,435
33,804
32,744
32,255
31,604
32,687
33,040
32,744
32,509
32,259
32,141
32,088
K-12 Enrollments
Sch
oo
l Y
ea
r
Iow
a's
K-1
2 P
ub
lic a
nd
No
n-P
ub
lic S
cho
ol E
nro
llmen
ts
Public
Non-P
ublic
Sch
oo
l Ye
ars
20
04
-2
02
1
So
urc
e:
Iow
a D
ep
art
me
nt
of
Ed
ucatio
n
156

0
5,000
10,000
15,000
20,000
25,000
30,000
35,000
40,000
45,000
2004
2005
2006
2007
2008
2009
2010
2011
2012
2013
2014
2015
2016
2017
Est
2018
Est
2019
Est
2020
Est
2021
Est
35,295
36,713
37,435
37,592
37,819
38,522
39,053
39,320
39,877
40,908
40,993
40,046
39,355
38,642
38,861
39,243
39,805
39,692
36,834
36,434
37,611
38,448
39,114
38,050
38,562
37,719
37,076
36,451
36,458
36,299
36,645
37,004
37,480
37,000
36,855
37,449
Enrollments by Grade
Iow
a's
Pu
blic
Sch
oo
l En
rollm
ents
Kin
der
gart
en C
om
par
ed t
o 1
2th
Gra
de
Kin
de
rg
arte
n1
2th
G
ra
de
Sch
oo
l Ye
ars
20
04
-2
02
1
So
urc
e:
Iow
a D
ep
art
me
nt
of
Ed
ucatio
n
157

-1,539
279
-176
-856
-1,295
472
491
1,601
2,801
4,457
4,535
3,747
2,710
1,637
1,381
2,243
2,950
2,243
-2,000
-1,0000
1,000
2,000
3,000
4,000
5,000
2004
2005
2006
2007
2008
2009
2010
2011
2012
2013
2014
2015
2016
2017 Est
2018 Est
2019 Est
2020 Est
2021 Est
Kindergarten Minus Grade 12 Enrollment
Iow
a's
Pu
blic
Sch
oo
l En
rollm
ents
Kin
der
gart
en C
om
par
ed t
o 1
2th
Gra
de
Sch
oo
l Yea
rs 2
004
-20
21
So
urc
e: Io
wa D
ep
art
me
nt o
f E
du
catio
n
158
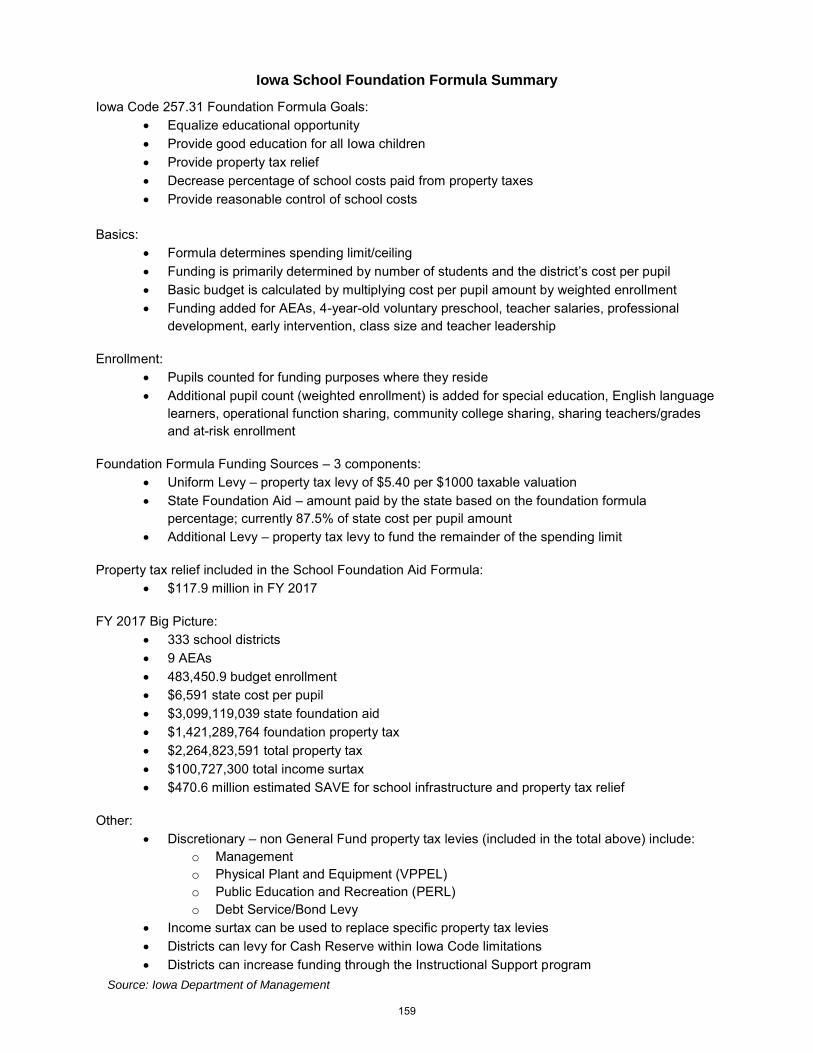
Iowa School Foundation Formula Summary
Iowa Code 257.31 Foundation Formula Goals:
Equalize educational opportunity
Provide good education for all Iowa children
Provide property tax relief
Decrease percentage of school costs paid from property taxes
Provide reasonable control of school costs
Basics:
Formula determines spending limit/ceiling
Funding is primarily determined by number of students and the district’s cost per pupil
Basic budget is calculated by multiplying cost per pupil amount by weighted enrollment
Funding added for AEAs, 4-year-old voluntary preschool, teacher salaries, professional
development, early intervention, class size and teacher leadership
Enrollment:
Pupils counted for funding purposes where they reside
Additional pupil count (weighted enrollment) is added for special education, English language
learners, operational function sharing, community college sharing, sharing teachers/grades
and at-risk enrollment
Foundation Formula Funding Sources – 3 components:
Uniform Levy – property tax levy of $5.40 per $1000 taxable valuation
State Foundation Aid – amount paid by the state based on the foundation formula
percentage; currently 87.5% of state cost per pupil amount
Additional Levy – property tax levy to fund the remainder of the spending limit
Property tax relief included in the School Foundation Aid Formula:
$117.9 million in FY 2017
FY 2017 Big Picture:
333 school districts
9 AEAs
483,450.9 budget enrollment
$6,591 state cost per pupil
$3,099,119,039 state foundation aid
$1,421,289,764 foundation property tax
$2,264,823,591 total property tax
$100,727,300 total income surtax
$470.6 million estimated SAVE for school infrastructure and property tax relief
Other:
Discretionary – non General Fund property tax levies (included in the total above) include:
o Management
o Physical Plant and Equipment (VPPEL)
o Public Education and Recreation (PERL)
o Debt Service/Bond Levy
Income surtax can be used to replace specific property tax levies
Districts can levy for Cash Reserve within Iowa Code limitations
Districts can increase funding through the Instructional Support program
Source: Iowa Department of Management
159

THIS PAGE INTENTIONALLY LEFT BLANK

Pro
gra
mN
um
be
r o
f C
lie
nts
Se
rve
d
SF
Y1
6
Sta
te C
os
t
SF
Y 2
01
6
Fe
de
ral/O
the
r F
un
ds
Co
st
SF
Y 2
01
6
To
tal C
ost
T
ota
l C
ost
Pe
r
Clie
nt
S
tate
Co
st
Pe
r
Clie
nt
Ad
op
tion
Su
bsid
y9,6
23
42,1
93,7
44
$
32,0
27,1
74
$
74,2
20,9
18
$
7,7
13
$
4,3
85
$
Ad
ult M
H/D
D S
erv
ices *
SF
Y15
info
rma
tion
20,2
79
30,5
55,8
23
$
75,7
78,1
00
$
106,3
33,9
23
$
5,2
44
$
1,5
07
$
Child
Care
Assis
tance
^21,1
76
30,8
14,5
27
$
70,7
57,1
02
$
101,5
71,6
29
$
4,7
97
$
1,4
55
$
Child
Sup
po
rt594,3
77
14,8
04,6
15
$
39,4
46,5
43
$
54,2
51,1
58
$
91
$
25
$
Child
Welfa
re6,9
43
42,9
88,8
27
$
49,8
71,8
96
$
92,8
60,7
23
$
13,3
75
$
6,1
92
$
Fam
ily In
vestm
ent
Pro
gra
m^̂
25,9
73
29,2
85,0
19
$
12,0
13,6
07
$
41,2
98,6
26
$
1,5
90
$
1,1
28
$
Haw
k-I (
inclu
des e
xpan
de
d M
ed
ica
id a
nd
den
tal o
nly
)
60,4
88
19,7
45,5
47
$
135,3
20,7
37
$
155,0
66,2
84
$
2,5
64
$
326
$
Med
ica
id**
416,2
85
1,6
69,0
79,0
89
$
2,5
28,8
30,9
17
$
4,1
97,9
10,0
06
$
10,0
84
$
4,0
09
$
Iow
a H
ealth
and
We
llne
ss P
lan**
*146,3
85
24,8
87,1
60
$
937,2
12,8
33
$
962,0
99,9
93
$
6,5
72
$
170
$
Co
st
of
Fac
ilit
ies
Ba
se
d o
n A
ve
rag
e D
ail
y C
en
su
s
Av
era
ge
Dail
yS
FY
16
Fe
de
ral/O
the
rS
FY
16
To
tal C
ost
Sta
te C
os
t
Ce
nsu
s (
AD
C)
Sta
te C
os
tF
un
ds C
ost
To
tal C
ost
Pe
r C
lie
nt
Pe
r C
lie
nt
Ju
ve
nil
e F
ac
ilit
ies
:
Eld
ora
114
12,3
80,6
53
$
2,5
42,8
24
$
14,9
23,4
77
$
130,9
08
$
108,6
02
$
Civ
il C
om
mit
men
t U
nit
fo
r S
exu
al
Off
en
ders
^^
^
103
10,2
51,7
14
$
2,1
00
$
10,2
53,8
14
$
99,5
52
$
99,5
31
$
Men
tal
He
alt
h In
sti
tute
s:
85
34,7
63,3
10
$
2,5
53,8
79
$
37,3
17,1
89
$
888,7
11
$
825,3
99
$
Che
roke
e34
14,5
84,8
47
$
1,3
45,2
91
$
15,9
30,1
38
$
468,5
33
$
428,9
66
$
Inde
pe
nd
en
ce
51
20,1
78,4
63
$
1,2
08,5
88
$
21,3
87,0
51
$
420,1
78
$
396,4
33
$
Sta
te R
es
ou
rce
Ce
nte
rs:
379
48,0
97,2
78
$
81,3
86,1
33
$
129,4
83,4
11
$
695,3
31
$
255,6
62
$
Gle
nw
ood
232
28,6
99,6
07
$
45,7
30,9
47
$
74,4
30,5
54
$
320,8
21
$
123,7
05
$
Woo
dw
ard
147
19,3
97,6
71
$
35,6
55,1
86
$
55,0
52,8
57
$
374,5
09
$
131,9
57
$
Iow
a D
ep
art
me
nt
of
Hu
ma
n S
erv
ice
s
To
tal
Cli
en
ts S
erv
ed
by P
rog
ram
(F
Y 2
01
6)
^Child
Care
Assis
tance
clie
nts
serv
ed
re
pre
se
nts
th
e a
ve
rag
e m
onth
ly n
um
ber
of
child
ren
se
rve
d
^̂F
IP c
lients
se
rve
d r
ep
rese
nts
th
e a
ve
rag
e m
onth
ly n
um
ber
of
recip
ients
.
^̂^C
CU
SO
Ave
rage
Da
ily C
en
sus is t
he
nu
mb
er
serv
ed
in t
he
fa
cili
ty.
***I
ow
a H
ealth
and
We
llne
ss P
lan c
lien
ts s
erv
ed
re
pre
se
nts
ave
rage
mo
nth
ly e
nro
llme
nt
fro
m J
uly
20
15
to
Ju
ne
20
16
.
NO
TE
:
* A
dult M
H/D
D S
erv
ices c
lients
se
rve
d a
nd
do
llars
are
fo
r S
FY
15
. S
FY
16
da
ta is n
ot
yet
ava
ilable
.
**M
edic
aid
clie
nts
serv
ed r
epre
sents
avera
ge m
onth
ly e
nro
llment in
the r
egula
r M
edic
aid
pro
gra
m.
So
urc
e:
Iow
a D
ep
art
me
nt
of
Hu
ma
n S
erv
ices
161

Ad
min
istr
atio
n
$12
<1%
Pre
scri
pti
on
Dru
gs
$18
<1%
Me
dic
are
-Re
late
d P
aym
en
ts
$225
5% ICF/
ID F
acil
itie
s
$208
4%
Me
nta
l He
alth
$241
5%
Fee
-fo
r-Se
rvic
e
$510
11%
Ho
me
& C
om
mu
nit
y B
ase
d
Serv
ice
s$4
9110
%
Nu
rsin
g Fa
cili
tie
s
$523
11%
Ho
spit
als
$623
13%
He
alth
& W
ell
ne
ss P
lan
$857
18%
Man
age
d C
are
$805
17%
Oth
er
$249
5%
Med
icai
d E
xpen
ses
Fisc
al Y
ear
2016
All
Fun
ds
(Act
ual
)(I
n M
illio
ns)
No
tes:
-Th
e a
mo
un
tssh
ow
n h
ere
are
net
of
reb
ate
s a
nd
rec
ove
ries
.-
Med
ica
id s
wit
ched
to M
an
age
d C
are
beg
inn
ing
Ap
ril 1
, 20
16
. En
cou
nte
r d
ata
is n
ot
yet
ava
ilab
le to
bre
ak
ou
t M
CO
co
sts
bet
wee
n e
ach
ca
tego
ry.
Th
eref
ore
, th
is in
form
ati
on
is n
ot a
ll
info
rma
tive
in r
ega
rds
to c
ost
s b
y ca
tego
ry.
So
me
of
the
exp
ense
s b
y ca
tego
ry a
re in
clu
ded
in
the
Ma
na
ged
Ca
re c
ost
s.
Tota
l Exp
en
dit
ure
s:$
4.7
62
Bill
ion
Stat
e Fu
nd
s 3
6%
Fed
eral
/Oth
er F
unds
64%
So
urc
e:
Iow
a D
ep
art
me
nt
of
Hu
ma
n S
erv
ices
162

$2,625,475,978
$2,842,059,524
$3,081,828,314
$3,239,461,396
$3,441,399,687
$3,613,086,280
$3,784,113,511
$4,157,099,253
$4,877,950,895
$5,160,009,999
$4,830,838,021
$5,004,207,604
$5,189,768,351
$0
$5
00
,0
00
,0
00
$1
,0
00
,0
00
,0
00
$1
,5
00
,0
00
,0
00
$2
,0
00
,0
00
,0
00
$2
,5
00
,0
00
,0
00
$3
,0
00
,0
00
,0
00
$3
,5
00
,0
00
,0
00
$4
,0
00
,0
00
,0
00
$4
,5
00
,0
00
,0
00
$5
,0
00
,0
00
,0
00
FY
20
07
FY
20
08
FY
20
09
FY
20
10
FY
20
11
FY
20
12
FY
20
13
FY
20
14
FY
20
15
FY
20
16
FY
20
17
Go
v R
ec
FY
20
18
Go
v R
ec
FY
20
19
Go
v R
ec
Medicaid E
xpenditures (A
ll F
unds)
Fiscal Y
ears 2007 -2019
Note
s:
Tota
ls a
re n
ot
net
of
rebate
s a
nd r
ecove
ries.
Begin
nin
g i
n F
iscal Y
ear
2014,
tota
ls inclu
de e
xpenses f
or
the Iow
a H
ealth
and W
elln
ess P
lan.
Modern
izatio
n of
Medic
aid
began o
n A
pril
1,
2016.
So
urc
e:
Iow
a D
ep
art
ment
of
Hu
ma
n S
erv
ices
163

SF
Y1
3S
FY
14
SF
Y1
5S
FY
16
SF
Y1
7 G
ov
SF
Y1
8 G
ov
SF
Y1
9 G
ov
Wit
ho
ut
Mo
dern
izati
on
$1
,40
7,5
61,9
74
$1
,48
0,3
90,3
35
$1
,61
2,3
63,6
70
$1
,71
6,2
30,1
54
$1
,77
6,9
65,5
22
$1
,88
3,5
83,4
53
$1
,99
6,5
98,4
61
Wit
h M
od
ern
izati
on
$1
,40
7,5
61,9
74
$1
,48
0,3
90,3
35
$1
,61
2,3
63,6
70
$1
,69
3,9
66,2
48
$1
,62
5,2
59,5
60
$1
,64
9,6
19,6
19
$1
,70
8,4
19,6
19
$1,0
00
,000,0
00
$1,2
00
,000,0
00
$1,4
00
,000,0
00
$1,6
00
,000,0
00
$1,8
00
,000,0
00
$2,0
00
,000,0
00
$2,2
00
,000,0
00
State Expenditures
Iow
a D
ep
art
me
nt
of
Hu
ma
n S
erv
ice
sS
tate
Me
dic
al A
ss
ista
nc
e E
xp
en
dit
ure
sS
tate
Fis
ca
l Y
ea
rs 2
01
3 -
20
19
So
urc
e:
Iow
a D
ep
art
me
nt
of
Hu
ma
n S
erv
ices
164
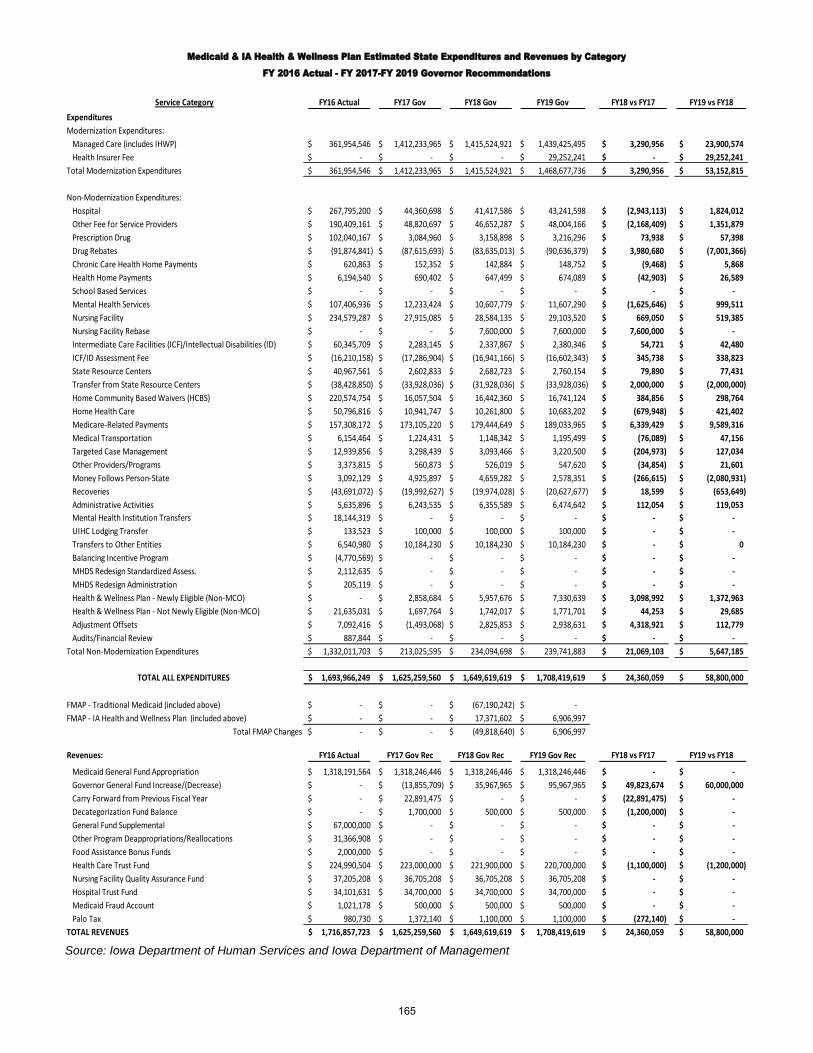
Service Category FY16 Actual FY17 Gov FY18 Gov FY19 Gov FY18 vs FY17 FY19 vs FY18
Expenditures
Modernization Expenditures:
Managed Care (includes IHWP) 361,954,546$ 1,412,233,965$ 1,415,524,921$ 1,439,425,495$ 3,290,956$ 23,900,574$
Health Insurer Fee -$ -$ -$ 29,252,241$ -$ 29,252,241$
Total Modernization Expenditures 361,954,546$ 1,412,233,965$ 1,415,524,921$ 1,468,677,736$ 3,290,956$ 53,152,815$
Non-Modernization Expenditures:
Hospital 267,795,200$ 44,360,698$ 41,417,586$ 43,241,598$ (2,943,113)$ 1,824,012$
Other Fee for Service Providers 190,409,161$ 48,820,697$ 46,652,287$ 48,004,166$ (2,168,409)$ 1,351,879$
Prescription Drug 102,040,167$ 3,084,960$ 3,158,898$ 3,216,296$ 73,938$ 57,398$
Drug Rebates (91,874,841)$ (87,615,693)$ (83,635,013)$ (90,636,379)$ 3,980,680$ (7,001,366)$
Chronic Care Health Home Payments 620,863$ 152,352$ 142,884$ 148,752$ (9,468)$ 5,868$
Health Home Payments 6,194,540$ 690,402$ 647,499$ 674,089$ (42,903)$ 26,589$
School Based Services -$ -$ -$ -$ -$ -$
Mental Health Services 107,406,936$ 12,233,424$ 10,607,779$ 11,607,290$ (1,625,646)$ 999,511$
Nursing Facility 234,579,287$ 27,915,085$ 28,584,135$ 29,103,520$ 669,050$ 519,385$
Nursing Facility Rebase -$ -$ 7,600,000$ 7,600,000$ 7,600,000$ -$
Intermediate Care Facilities (ICF)/Intellectual Disabilities (ID) 60,345,709$ 2,283,145$ 2,337,867$ 2,380,346$ 54,721$ 42,480$
ICF/ID Assessment Fee (16,210,158)$ (17,286,904)$ (16,941,166)$ (16,602,343)$ 345,738$ 338,823$
State Resource Centers 40,967,561$ 2,602,833$ 2,682,723$ 2,760,154$ 79,890$ 77,431$
Transfer from State Resource Centers (38,428,850)$ (33,928,036)$ (31,928,036)$ (33,928,036)$ 2,000,000$ (2,000,000)$
Home Community Based Waivers (HCBS) 220,574,754$ 16,057,504$ 16,442,360$ 16,741,124$ 384,856$ 298,764$
Home Health Care 50,796,816$ 10,941,747$ 10,261,800$ 10,683,202$ (679,948)$ 421,402$
Medicare-Related Payments 157,308,172$ 173,105,220$ 179,444,649$ 189,033,965$ 6,339,429$ 9,589,316$
Medical Transportation 6,154,464$ 1,224,431$ 1,148,342$ 1,195,499$ (76,089)$ 47,156$
Targeted Case Management 12,939,856$ 3,298,439$ 3,093,466$ 3,220,500$ (204,973)$ 127,034$
Other Providers/Programs 3,373,815$ 560,873$ 526,019$ 547,620$ (34,854)$ 21,601$
Money Follows Person-State 3,092,129$ 4,925,897$ 4,659,282$ 2,578,351$ (266,615)$ (2,080,931)$
Recoveries (43,691,072)$ (19,992,627)$ (19,974,028)$ (20,627,677)$ 18,599$ (653,649)$
Administrative Activities 5,635,896$ 6,243,535$ 6,355,589$ 6,474,642$ 112,054$ 119,053$
Mental Health Institution Transfers 18,144,319$ -$ -$ -$ -$ -$
UIHC Lodging Transfer 133,523$ 100,000$ 100,000$ 100,000$ -$ -$
Transfers to Other Entities 6,540,980$ 10,184,230$ 10,184,230$ 10,184,230$ -$ 0$
Balancing Incentive Program (4,770,569)$ -$ -$ -$ -$ -$
MHDS Redesign Standardized Assess. 2,112,635$ -$ -$ -$ -$ -$
MHDS Redesign Administration 205,119$ -$ -$ -$ -$ -$
Health & Wellness Plan - Newly Eligible (Non-MCO) -$ 2,858,684$ 5,957,676$ 7,330,639$ 3,098,992$ 1,372,963$
Health & Wellness Plan - Not Newly Eligible (Non-MCO) 21,635,031$ 1,697,764$ 1,742,017$ 1,771,701$ 44,253$ 29,685$
Adjustment Offsets 7,092,416$ (1,493,068)$ 2,825,853$ 2,938,631$ 4,318,921$ 112,779$
Audits/Financial Review 887,844$ -$ -$ -$ -$ -$
Total Non-Modernization Expenditures 1,332,011,703$ 213,025,595$ 234,094,698$ 239,741,883$ 21,069,103$ 5,647,185$
TOTAL ALL EXPENDITURES 1,693,966,249$ 1,625,259,560$ 1,649,619,619$ 1,708,419,619$ 24,360,059$ 58,800,000$
FMAP - Traditional Medicaid (included above) -$ -$ (67,190,242)$ -$
FMAP - IA Health and Wellness Plan (included above) -$ -$ 17,371,602$ 6,906,997$
Total FMAP Changes -$ -$ (49,818,640)$ 6,906,997$
Revenues: FY16 Actual FY17 Gov Rec FY18 Gov Rec FY19 Gov Rec FY18 vs FY17 FY19 vs FY18
Medicaid General Fund Appropriation 1,318,191,564$ 1,318,246,446$ 1,318,246,446$ 1,318,246,446$ -$ -$
Governor General Fund Increase/(Decrease) -$ (13,855,709)$ 35,967,965$ 95,967,965$ 49,823,674$ 60,000,000$
Carry Forward from Previous Fiscal Year -$ 22,891,475$ -$ -$ (22,891,475)$ -$
Decategorization Fund Balance -$ 1,700,000$ 500,000$ 500,000$ (1,200,000)$ -$
General Fund Supplemental 67,000,000$ -$ -$ -$ -$ -$
Other Program Deappropriations/Reallocations 31,366,908$ -$ -$ -$ -$ -$
Food Assistance Bonus Funds 2,000,000$ -$ -$ -$ -$ -$
Health Care Trust Fund 224,990,504$ 223,000,000$ 221,900,000$ 220,700,000$ (1,100,000)$ (1,200,000)$
Nursing Facility Quality Assurance Fund 37,205,208$ 36,705,208$ 36,705,208$ 36,705,208$ -$ -$
Hospital Trust Fund 34,101,631$ 34,700,000$ 34,700,000$ 34,700,000$ -$ -$
Medicaid Fraud Account 1,021,178$ 500,000$ 500,000$ 500,000$ -$ -$
Palo Tax 980,730$ 1,372,140$ 1,100,000$ 1,100,000$ (272,140)$ -$
TOTAL REVENUES 1,716,857,723$ 1,625,259,560$ 1,649,619,619$ 1,708,419,619$ 24,360,059$ 58,800,000$
Medicaid & IA Health & Wellness Plan Estimated State Expenditures and Revenues by Category
FY 2016 Actual - FY 2017-FY 2019 Governor Recommendations
Source: Iowa Department of Human Services and Iowa Department of Management
165

# Recipients* Total $$ Federal $$ State $$ Other $$
Hospital
Inpatient Hospital 48,514 345,714,321$ 187,017,969$ 158,696,351$ -$
Outpatient Hospital 270,934 221,620,207$ 119,887,892$ 101,732,315$ -$
Hospital Rebase -$ -$ -$ -$
UIHC Additional Reimbursement 9,900,000$ 5,451,683$ -$ 4,448,318$
UIHC Funded DSH 17,544,006$ 9,661,045$ -$ 7,882,961$
Broadlawns Funded DSH 12,018,473$ 6,618,473$ -$ 5,400,000$
Other DSH 16,366,176$ 8,999,643$ 7,366,533$ -$
Subtotal - Hospital 623,163,183$ 337,636,705$ 267,795,200$ 17,731,278$
Other Fee-for-Service Categories
Physician 375,224 162,693,486$ 88,010,833$ 74,682,653$ -$
UIHC Physician UPL
Incl in
Physician Total 95,134,169$ 66,335,811$ -$ 28,798,358$
Clinics 99,406 48,895,731$ 26,450,684$ 22,445,047$ -$
Dental 213,534 61,260,763$ 33,139,684$ 28,121,079$ -$
Other Practitioner 151,577 57,205,224$ 30,945,796$ 26,259,428$ -$
Optometric 99,103 8,216,289$ 4,444,692$ 3,771,597$ -$
Chiropractic 32,121 3,875,364$ 2,096,421$ 1,778,943$ -$
Podiatrist 21,023 2,067,641$ 1,118,513$ 949,128$ -$
Family Planning Services 17,795 2,223,357$ 1,202,749$ 1,020,607$ -$
EPSDT 52,792 16,973,024$ 9,181,744$ 7,791,280$ -$
Medical Supplies/DME 83,450 45,348,647$ 24,531,850$ 20,816,797$ -$
Lab/X-Ray 83,025 6,040,016$ 3,267,413$ 2,772,603$ -$
Subtotal - Other FFS Categories 509,933,710$ 290,726,191$ 190,409,161$ 28,798,358$
Prescription Drugs
Drugs 312,445 222,290,850$ 120,250,683$ 102,040,167$ -$
Drug Rebates (204,224,560)$ (112,349,719)$ (91,874,841)$ -$
Subtotal - Prescription Drugs 18,066,289$ 7,900,964$ 10,165,325$ -$
Health Homes
Chronic Care Health Home 40,890 1,381,777$ 760,914$ 620,863$ -$
Integrated Health Home 26,017,579$ 19,823,040$ 6,194,540$ -$
Subtotal - Health Homes 27,399,356$ 20,583,954$ 6,815,402$ -$
School-Based Services
Local Education Agencies 5,915 82,509,639$ 44,634,498$ -$ 37,875,141$
Infant & Toddler 1,311 179,601$ 97,157$ -$ 82,444$
Subtotal - School-Based Services 82,689,240$ 44,731,655$ -$ 37,957,585$
Mental Health Services
Iowa Plan 582,961 189,022,357$ 104,314,834$ 83,757,523$ 950,000$
Iowa Plan -- TCM ASO 2,849 493,720$ 258,604$ 235,116$ -$
BHIS -- FFS 6,884 10,204,085$ 5,607,405$ 4,596,680$ -$
Habilitation -- FFS 5,305 31,729,670$ 17,281,200$ 14,448,470$ -$
Psychiatric Services 36,272 9,518,029$ 5,148,883$ 4,369,147$ -$
Subtotal - Mental Health Services 240,967,861$ 132,610,925$ 107,406,936$ 950,000$
Nursing Facility
Intermediate Care 21,136 453,338,884$ 250,191,722$ 203,147,162$ -$
Rebase -$ -$ -$ -$
Skilled-Nursing Care 5,426 27,749,472$ 15,267,643$ 12,481,829$ -$
Nursing Facilities for the Mentally Ill 122 4,244,661$ 2,336,233$ 1,908,428$ -$
Iowa Veteran's Home
Incl in Int Care
Total 36,552,874$ 20,110,695$ 16,442,180$ -$
Nurse Aid Training 1,199,377$ 599,689$ 599,689$ -$
Subtotal - Nursing Facility 523,085,268$ 288,505,981$ 234,579,287$ -$
SFY16 Final Expenditures
Iowa Department of Human Services
SFY16 Medical Assistance Detailed Projection
Source: Iowa Department of Human Services
166
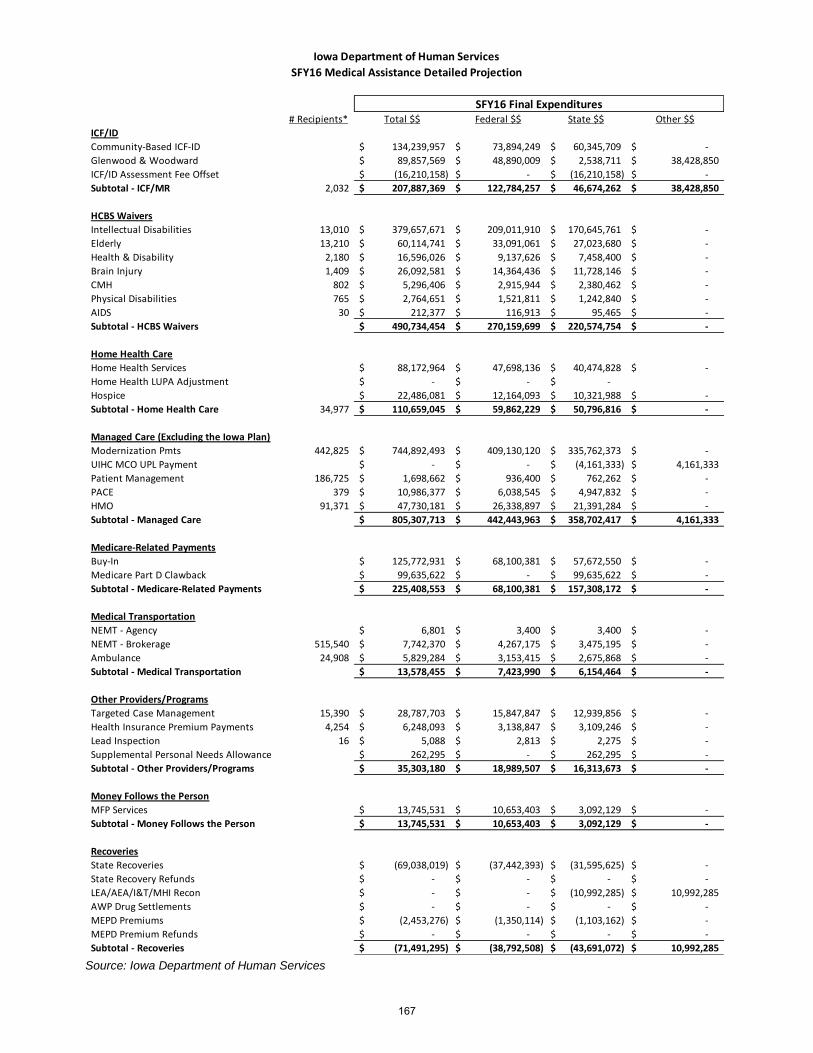
# Recipients* Total $$ Federal $$ State $$ Other $$
ICF/ID
Community-Based ICF-ID 134,239,957$ 73,894,249$ 60,345,709$ -$
Glenwood & Woodward 89,857,569$ 48,890,009$ 2,538,711$ 38,428,850$
ICF/ID Assessment Fee Offset (16,210,158)$ -$ (16,210,158)$ -$
Subtotal - ICF/MR 2,032 207,887,369$ 122,784,257$ 46,674,262$ 38,428,850$
HCBS Waivers
Intellectual Disabilities 13,010 379,657,671$ 209,011,910$ 170,645,761$ -$
Elderly 13,210 60,114,741$ 33,091,061$ 27,023,680$ -$
Health & Disability 2,180 16,596,026$ 9,137,626$ 7,458,400$ -$
Brain Injury 1,409 26,092,581$ 14,364,436$ 11,728,146$ -$
CMH 802 5,296,406$ 2,915,944$ 2,380,462$ -$
Physical Disabilities 765 2,764,651$ 1,521,811$ 1,242,840$ -$
AIDS 30 212,377$ 116,913$ 95,465$ -$
Subtotal - HCBS Waivers 490,734,454$ 270,159,699$ 220,574,754$ -$
Home Health Care
Home Health Services 88,172,964$ 47,698,136$ 40,474,828$ -$
Home Health LUPA Adjustment -$ -$ -$
Hospice 22,486,081$ 12,164,093$ 10,321,988$ -$
Subtotal - Home Health Care 34,977 110,659,045$ 59,862,229$ 50,796,816$ -$
Managed Care (Excluding the Iowa Plan)
Modernization Pmts 442,825 744,892,493$ 409,130,120$ 335,762,373$ -$
UIHC MCO UPL Payment -$ -$ (4,161,333)$ 4,161,333$
Patient Management 186,725 1,698,662$ 936,400$ 762,262$ -$
PACE 379 10,986,377$ 6,038,545$ 4,947,832$ -$
HMO 91,371 47,730,181$ 26,338,897$ 21,391,284$ -$
Subtotal - Managed Care 805,307,713$ 442,443,963$ 358,702,417$ 4,161,333$
Medicare-Related Payments
Buy-In 125,772,931$ 68,100,381$ 57,672,550$ -$
Medicare Part D Clawback 99,635,622$ -$ 99,635,622$ -$
Subtotal - Medicare-Related Payments 225,408,553$ 68,100,381$ 157,308,172$ -$
Medical Transportation
NEMT - Agency 6,801$ 3,400$ 3,400$ -$
NEMT - Brokerage 515,540 7,742,370$ 4,267,175$ 3,475,195$ -$
Ambulance 24,908 5,829,284$ 3,153,415$ 2,675,868$ -$
Subtotal - Medical Transportation 13,578,455$ 7,423,990$ 6,154,464$ -$
Other Providers/Programs
Targeted Case Management 15,390 28,787,703$ 15,847,847$ 12,939,856$ -$
Health Insurance Premium Payments 4,254 6,248,093$ 3,138,847$ 3,109,246$ -$
Lead Inspection 16 5,088$ 2,813$ 2,275$ -$
Supplemental Personal Needs Allowance 262,295$ -$ 262,295$ -$
Subtotal - Other Providers/Programs 35,303,180$ 18,989,507$ 16,313,673$ -$
Money Follows the Person
MFP Services 13,745,531$ 10,653,403$ 3,092,129$ -$
Subtotal - Money Follows the Person 13,745,531$ 10,653,403$ 3,092,129$ -$
Recoveries
State Recoveries (69,038,019)$ (37,442,393)$ (31,595,625)$ -$
State Recovery Refunds -$ -$ -$ -$
LEA/AEA/I&T/MHI Recon -$ -$ (10,992,285)$ 10,992,285$
AWP Drug Settlements -$ -$ -$ -$
MEPD Premiums (2,453,276)$ (1,350,114)$ (1,103,162)$ -$
MEPD Premium Refunds -$ -$ -$ -$
Subtotal - Recoveries (71,491,295)$ (38,792,508)$ (43,691,072)$ 10,992,285$
Iowa Department of Human Services
SFY16 Medical Assistance Detailed Projection
SFY16 Final Expenditures
Source: Iowa Department of Human Services
167

# Recipients* Total $$ Federal $$ State $$ Other $$
Administrative Activities
IDPH Case Management Contract 3,301,432$ 1,650,716$ 1,650,716$ -$
Postage 2,361,015$ 1,185,894$ 1,175,122$ -$
HMS Contract 1,982,899$ 991,450$ 991,450$ -$
Leveraging Activities 2,708,899$ 1,574,981$ 1,133,918$ -$
Translation & Intepreter Services 375,899$ 247,700$ 128,199$ -$
HIPP Admin. 1,064,422$ 542,098$ 522,324$ -$
TPL/AOR Fees 68,333$ 34,167$ 34,167$ -$
Subtotal - Administrative Activities 11,862,900$ 6,227,004$ 5,635,896$ -$
IowaCare Transfers
MHI Transfer 18,144,319$ -$ 18,144,319$ -$
UIHC Lodging Contract 133,523$ -$ 133,523$ -$
Subtotal - IowaCare Transfers 18,277,842$ -$ 18,277,842$ -$
Transfers to Other Appropriations/Entities
Transfer to Field & Admin-Part D 2,974,905$ -$ 2,974,905$ -$
Money Follows the Person Rebalancing 771,387$ -$ 771,387$ -$
Medical Contracts Transfers 2,672,223$ -$ 2,672,223$ -$
Transfer to General Admin 122,465$ -$ 122,465$ -$
Subtotal - Other Transfers 6,540,980$ -$ 6,540,980$ -$
MHDS Redesign Transfers
Standardized Assessments 2,112,635$ -$ 2,112,635$ -$
Implementation/Administration 205,119$ -$ 205,119$ -$
Subtotal - MHDS Redesign 2,317,754$ -$ 2,317,754$ -$
Balancing Incentive Program
BIP Savings -$ 5,325,121$ (5,325,121)$ -$
Community-Based Infrastructure 573,426$ 18,874$ 554,552$ -$
Subtotal - Balancing Incentive Program 573,426$ 5,343,995$ (4,770,569)$ -$
Health and Wellness Plan
Modernization Pmts - Not Newly Eligible 7,212,527$ 3,960,399$ 3,252,129$ -$
Modernization Pmts - Newly Eligible 150,154,948$ 150,154,948$ -$ -$
Not Newly Eligible 48,139,769$ 26,504,738$ 21,635,031$ -$
Newly Eligible 756,592,748$ 756,592,748$ -$ -$
Rebates and Recoveries (105,399,781)$ (105,399,781)$ -$ -$
Subtotal - Health and Wellness Plan 314,503 856,700,212$ 831,813,052$ 24,887,160$ -$
Adjustments/Offsets
Reconcile -$ (726,729)$ -$ 726,729$
County Funds Reserve -$ (143,395)$ 143,395$
FMAP/BCCT/State-Only Adjustment 9,757,690$ 2,808,669$ 6,949,021$ -$
Subtotal - Adjustments/Offsets 9,757,690$ 1,938,545$ 7,092,416$ 726,729$
OIG Audits/CMS Financial Mgmt Reviews
OIG Audits -$ (887,844)$ 887,844$ -$
Subtotal - Audits/FMRs -$ (887,844)$ 887,844$ -$
Total $$ Federal $$ State $$ Other $$
Total 4,762,468,716$ 2,928,756,050$ 1,693,966,248$ 139,746,418$
Plus Rebates and Recoveries & Assmt Fee 5,160,009,999$
* Recipient counts for Mental Health Services, Managed Care, and Medical Transportation are based on a per member, per month basis. The number that actually
utilized services is likely much less.
Iowa Department of Human Services
SFY16 Medical Assistance Detailed Projection
SFY16 Final Expenditures
Source: Iowa Department of Human Services
168

Ma
nd
ato
ry
Se
rvic
es
35
%
Op
tio
na
l S
erv
ice
s
65
%
Fisc
al Y
ear
2016
Ad
ult
Med
icai
d S
ervi
ces
(in
clu
din
g IH
AW
P)
Op
tio
nal
vs.
Man
dat
ory
(A
ll Fu
nd
s)
So
urc
e:
Iow
a D
ep
art
me
nt
of
Hu
ma
n S
erv
ices
169
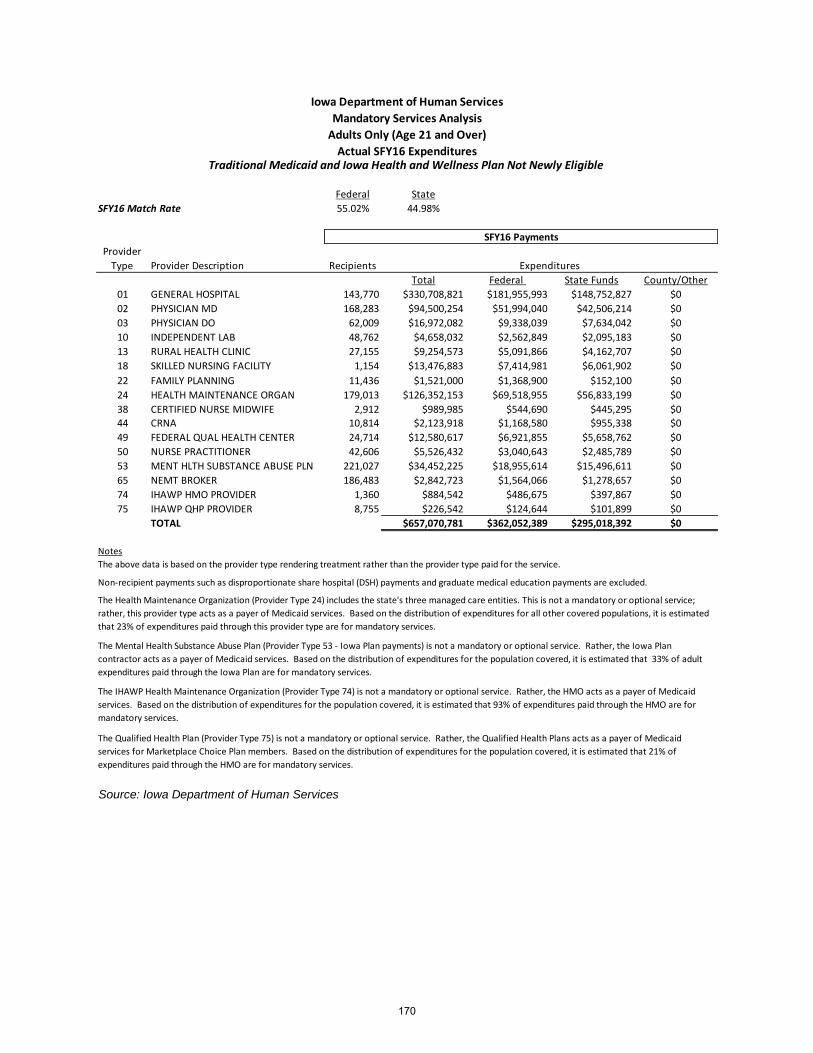
Federal State
SFY16 Match Rate 55.02% 44.98%
Provider
Type Provider Description Recipients
Total Federal State Funds County/Other
01 GENERAL HOSPITAL 143,770 $330,708,821 $181,955,993 $148,752,827 $0
02 PHYSICIAN MD 168,283 $94,500,254 $51,994,040 $42,506,214 $0
03 PHYSICIAN DO 62,009 $16,972,082 $9,338,039 $7,634,042 $0
10 INDEPENDENT LAB 48,762 $4,658,032 $2,562,849 $2,095,183 $0
13 RURAL HEALTH CLINIC 27,155 $9,254,573 $5,091,866 $4,162,707 $0
18 SKILLED NURSING FACILITY 1,154 $13,476,883 $7,414,981 $6,061,902 $0
22 FAMILY PLANNING 11,436 $1,521,000 $1,368,900 $152,100 $0
24 HEALTH MAINTENANCE ORGAN 179,013 $126,352,153 $69,518,955 $56,833,199 $0
38 CERTIFIED NURSE MIDWIFE 2,912 $989,985 $544,690 $445,295 $0
44 CRNA 10,814 $2,123,918 $1,168,580 $955,338 $0
49 FEDERAL QUAL HEALTH CENTER 24,714 $12,580,617 $6,921,855 $5,658,762 $0
50 NURSE PRACTITIONER 42,606 $5,526,432 $3,040,643 $2,485,789 $0
53 MENT HLTH SUBSTANCE ABUSE PLN 221,027 $34,452,225 $18,955,614 $15,496,611 $0
65 NEMT BROKER 186,483 $2,842,723 $1,564,066 $1,278,657 $0
74 IHAWP HMO PROVIDER 1,360 $884,542 $486,675 $397,867 $0
75 IHAWP QHP PROVIDER 8,755 $226,542 $124,644 $101,899 $0
TOTAL $657,070,781 $362,052,389 $295,018,392 $0
Notes
The Qualified Health Plan (Provider Type 75) is not a mandatory or optional service. Rather, the Qualified Health Plans acts as a payer of Medicaid
services for Marketplace Choice Plan members. Based on the distribution of expenditures for the population covered, it is estimated that 21% of
expenditures paid through the HMO are for mandatory services.
The IHAWP Health Maintenance Organization (Provider Type 74) is not a mandatory or optional service. Rather, the HMO acts as a payer of Medicaid
services. Based on the distribution of expenditures for the population covered, it is estimated that 93% of expenditures paid through the HMO are for
mandatory services.
SFY16 Payments
Iowa Department of Human Services
Mandatory Services Analysis
Adults Only (Age 21 and Over)
Actual SFY16 ExpendituresTraditional Medicaid and Iowa Health and Wellness Plan Not Newly Eligible
Expenditures
The above data is based on the provider type rendering treatment rather than the provider type paid for the service.
Non-recipient payments such as disproportionate share hospital (DSH) payments and graduate medical education payments are excluded.
The Health Maintenance Organization (Provider Type 24) includes the state's three managed care entities. This is not a mandatory or optional service;
rather, this provider type acts as a payer of Medicaid services. Based on the distribution of expenditures for all other covered populations, it is estimated
that 23% of expenditures paid through this provider type are for mandatory services.
The Mental Health Substance Abuse Plan (Provider Type 53 - Iowa Plan payments) is not a mandatory or optional service. Rather, the Iowa Plan
contractor acts as a payer of Medicaid services. Based on the distribution of expenditures for the population covered, it is estimated that 33% of adult
expenditures paid through the Iowa Plan are for mandatory services.
Source: Iowa Department of Human Services
170
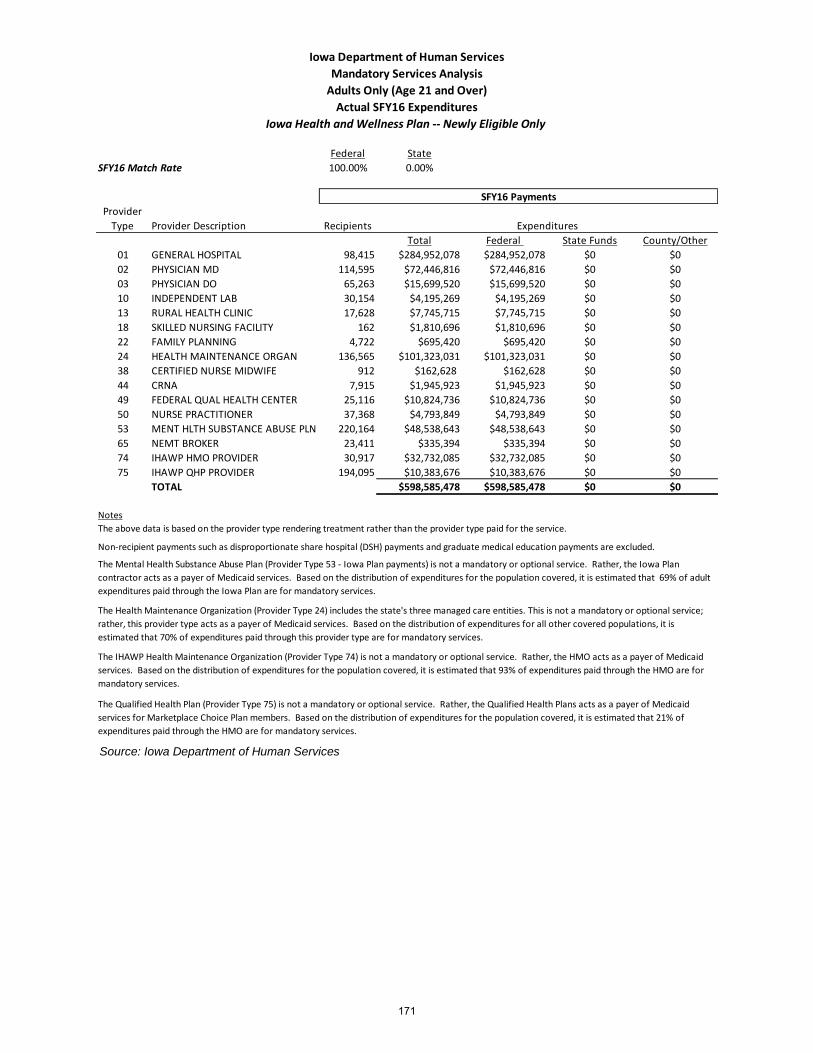
Federal State
SFY16 Match Rate 100.00% 0.00%
Provider
Type Provider Description Recipients
Total Federal State Funds County/Other
01 GENERAL HOSPITAL 98,415 $284,952,078 $284,952,078 $0 $0
02 PHYSICIAN MD 114,595 $72,446,816 $72,446,816 $0 $0
03 PHYSICIAN DO 65,263 $15,699,520 $15,699,520 $0 $0
10 INDEPENDENT LAB 30,154 $4,195,269 $4,195,269 $0 $0
13 RURAL HEALTH CLINIC 17,628 $7,745,715 $7,745,715 $0 $0
18 SKILLED NURSING FACILITY 162 $1,810,696 $1,810,696 $0 $0
22 FAMILY PLANNING 4,722 $695,420 $695,420 $0 $0
24 HEALTH MAINTENANCE ORGAN 136,565 $101,323,031 $101,323,031 $0 $0
38 CERTIFIED NURSE MIDWIFE 912 $162,628 $162,628 $0 $0
44 CRNA 7,915 $1,945,923 $1,945,923 $0 $0
49 FEDERAL QUAL HEALTH CENTER 25,116 $10,824,736 $10,824,736 $0 $0
50 NURSE PRACTITIONER 37,368 $4,793,849 $4,793,849 $0 $0
53 MENT HLTH SUBSTANCE ABUSE PLN 220,164 $48,538,643 $48,538,643 $0 $0
65 NEMT BROKER 23,411 $335,394 $335,394 $0 $0
74 IHAWP HMO PROVIDER 30,917 $32,732,085 $32,732,085 $0 $0
75 IHAWP QHP PROVIDER 194,095 $10,383,676 $10,383,676 $0 $0
TOTAL $598,585,478 $598,585,478 $0 $0
Notes
The IHAWP Health Maintenance Organization (Provider Type 74) is not a mandatory or optional service. Rather, the HMO acts as a payer of Medicaid
services. Based on the distribution of expenditures for the population covered, it is estimated that 93% of expenditures paid through the HMO are for
mandatory services.
The Qualified Health Plan (Provider Type 75) is not a mandatory or optional service. Rather, the Qualified Health Plans acts as a payer of Medicaid
services for Marketplace Choice Plan members. Based on the distribution of expenditures for the population covered, it is estimated that 21% of
expenditures paid through the HMO are for mandatory services.
Iowa Department of Human Services
Mandatory Services Analysis
Adults Only (Age 21 and Over)
Actual SFY16 Expenditures
Iowa Health and Wellness Plan -- Newly Eligible Only
SFY16 Payments
Expenditures
The above data is based on the provider type rendering treatment rather than the provider type paid for the service.
Non-recipient payments such as disproportionate share hospital (DSH) payments and graduate medical education payments are excluded.
The Mental Health Substance Abuse Plan (Provider Type 53 - Iowa Plan payments) is not a mandatory or optional service. Rather, the Iowa Plan
contractor acts as a payer of Medicaid services. Based on the distribution of expenditures for the population covered, it is estimated that 69% of adult
expenditures paid through the Iowa Plan are for mandatory services.
The Health Maintenance Organization (Provider Type 24) includes the state's three managed care entities. This is not a mandatory or optional service;
rather, this provider type acts as a payer of Medicaid services. Based on the distribution of expenditures for all other covered populations, it is
estimated that 70% of expenditures paid through this provider type are for mandatory services.
Source: Iowa Department of Human Services
171

Provider
Type Provider Description Recipients
Total Federal State Funds County/Other
01 GENERAL HOSPITAL 242,185 $615,660,898 $466,908,071 $148,752,827 $0
02 PHYSICIAN MD 282,878 $166,947,070 $124,440,856 $42,506,214 $0
03 PHYSICIAN DO 127,272 $32,671,601 $25,037,559 $7,634,042 $0
10 INDEPENDENT LAB 78,916 $8,853,301 $6,758,118 $2,095,183 $0
13 RURAL HEALTH CLINIC 44,783 $17,000,289 $12,837,582 $4,162,707 $0
18 SKILLED NURSING FACILITY 1,316 $15,287,580 $9,225,678 $6,061,902 $0
22 FAMILY PLANNING 16,158 $2,216,420 $2,064,320 $152,100 $0
24 HEALTH MAINTENANCE ORGAN 315,578 $227,675,184 $170,841,986 $56,833,199 $0
38 CERTIFIED NURSE MIDWIFE 3,824 $1,152,612 $707,317 $445,295 $0
44 CRNA 18,729 $4,069,841 $3,114,502 $955,338 $0
49 FEDERAL QUAL HEALTH CENTER 49,830 $23,405,353 $17,746,591 $5,658,762 $0
50 NURSE PRACTITIONER 79,974 $10,320,281 $7,834,492 $2,485,789 $0
53 MENT HLTH SUBSTANCE ABUSE PLN 441,191 $82,990,868 $67,494,257 $15,496,611 $0
65 NEMT BROKER 32,166 $3,178,116 $460,037 $101,899 $0
74 IHAWP HMO PROVIDER 30,917 $33,616,626 $32,856,728 $101,899 $0
75 IHAWP QHP PROVIDER 194,095 $10,610,218 $10,383,676 $0 $0
TOTAL $1,255,656,259 $958,711,771 $293,443,767 $0
Notes
SFY16 Payments
Iowa Department of Human Services
Mandatory Services Analysis
Adults Only (Age 21 and Over)
Actual SFY16 Expenditures
Traditional Medicaid and Iowa Health and Wellness Plan
The Qualified Health Plan (Provider Type 75) is not a mandatory or optional service. Rather, the Qualified Health Plans acts as a payer of Medicaid
services for Marketplace Choice Plan members. Payments were assigned to the mandatory and optional categories based on the distribution of
expenditures for the population covered.
Expenditures
The above data is based on the provider type rendering treatment rather than the provider type paid for the service.
Non-recipient payments such as disproportionate share hospital (DSH) payments and graduate medical education payments are excluded.
The Mental Health Substance Abuse Plan (Provider Type 53 - Iowa Plan payments) is not a mandatory or optional service. Rather, the Iowa Plan
contractor acts as a payer of Medicaid services. Payments were assigned to the mandatory and optional categories based on the distribution of
expenditures for the population covered.
The Health Maintenance Organization (Provider Type 24) includes the state's three managed care entities. This is not a mandatory or optional service;
rather, this provider type acts as a payer of Medicaid services. Payments were assigned to the mandatory and optional categories based on the
distribution of expenditures for the population covered.
The IHAWP Health Maintenance Organization (Provider Type 74) is not a mandatory or optional service. Rather, the HMO acts as a payer of Medicaid
services. Payments were assigned to the mandatory and optional categories based on the distribution of expenditures for the population covered.
Source: Iowa Department of Human Services
172

Federal State
SFY16 Match Rate 55.02% 44.98%
Provider
Type Provider Description Recipients
Total Federal State Funds County/Other
04 DENTIST 55,706 $23,292,930 $12,815,770 $10,477,160 $0
05 PODIATRIST 19,063 $2,251,146 $1,238,580 $1,012,565 $0
06 OPTOMETRIST 41,124 $3,679,707 $2,024,575 $1,655,132 $0
07 OPTICIAN 8,406 $433,364 $238,437 $194,927 $0
08 PHARMACY 131,745 $144,126,747 $79,298,536 $64,828,211 $0
09 HOME HEALTH AGENCY 15,961 $78,408,429 $43,140,318 $35,268,112 $0
11 AMBULANCE 19,598 $5,328,030 $2,931,482 $2,396,548 $0
12 MEDICAL SUPPLIES 37,431 $31,297,786 $17,220,042 $14,077,744 $0
14 CLINIC 916 $5,051,614 $2,779,398 $2,272,216 $0
15 PHYSICAL THERAPIST 4,546 $1,469,457 $808,495 $660,962 $0
16 CHIROPRACTOR 18,103 $2,663,566 $1,465,494 $1,198,072 $0
17 AUDIOLOGIST 3,953 $1,364,586 $750,795 $613,791 $0
19 REHAB AGENCY 1,162 $742,343 $408,437 $333,906 $0
20 INTERMEDIATE CARE FACILITY 22,710 $527,309,388 $290,125,625 $237,183,763 $0
21 COMMUNITY MH 16,478 $3,960,308 $2,178,961 $1,781,346 $0
24 HEALTH MAINTENANCE ORGAN 179,013 $423,005,035 $232,737,370 $190,267,665 $0
25 ICF MR STATE 384 $100,378,734 $55,228,379 $45,150,354 $0
26 MENTAL HOSPITAL 32 $4,413,877 $2,428,515 $1,985,362 $0
27 COMMUNITY BASED ICF/MR 1,267 $108,130,982 $59,493,667 $48,637,316 $0
29 PSYCHOLOGIST 3,567 $647,434 $356,218 $291,216 $0
30 SCREENING CENTER 108 $7,004 $3,853 $3,150 $0
31 HEARING AID DEALER 933 $479,858 $264,018 $215,840 $0
32 OCCUPATIONAL THERAPIST 183 $40,259 $22,151 $18,109 $0
34 ORTHOPEDIC SHOE DEALER 23 $3,684 $2,027 $1,657 $0
35 MATERNAL HEALTH CENTER 3,713 $770,007 $423,658 $346,349 $0
36 AMBULATORY SURGICAL CENTER 4,600 $1,989,190 $1,094,452 $894,738 $0
41 PSYCH MEDICAL INST CHILDREN 226 $2,128,888 $1,171,314 $957,574 $0
42 MEP CASE MANAGER 10,471 $24,561,502 $13,513,739 $11,047,764 $0
45 HOSPICE 6,291 $24,837,523 $13,665,605 $11,171,918 $0
47 HIPP 787 $1,316,526 $724,353 $592,174 $0
48 CLINICAL SOCIAL WORKER 634 $145,729 $80,180 $65,549 $0
52 NURSING FACILITY - MENTAL ILL 122 $4,539,305 $2,497,525 $2,041,779 $0
53 MENT HLTH SUBSTANCE ABUSE PLN 221,027 $69,948,456 $38,485,641 $31,462,816 $0
58 PACE 379 $10,996,604 $6,050,332 $4,946,273 $0
60 INSTITUTIONAL - GENERAL 0 $0 $0 $0 $0
61 OTHER PRACTITIONER - GENERAL 42 $4,472,325 $2,460,673 $2,011,652 $0
62 BEHAVIORAL HEALTH 7,037 $2,976,450 $1,637,643 $1,338,807 $0
63 REMEDIAL SERVICES 491 $753,037 $414,321 $338,716 $0
64 HABILITATION SERVICES 5,044 $29,593,551 $16,282,372 $13,311,179 $0
67 ASSERTIVE COMMUNITY TREATMENT 56 $205,752 $113,205 $92,547 $0
69 INDEPENDENT SPEECH PATHOLOGIST 27 $19,502 $10,730 $8,772 $0
71 HEALTH HOME PROV 5,928 $1,325,758 $729,432 $596,326 $0
72 PUBLIC HEALTH AGENCIES 532 $24,933 $13,718 $11,215 $0
73 SPMI SED PROVIDER 15,050 $16,104,784 $8,860,852 $7,243,932 $0
74 IHAWP HMO PROVIDER 1,360 $66,578 $36,631 $29,947 $0
75 IHAWP QHP PROVIDER 8,755 $832,066 $457,803 $374,263 $0
76 ACCOUNTABLE CARE ORGANIZATIONS 21,171 $336,285 $185,024 $151,261 $0
99 WAIVER 24,957 $484,431,725 $266,534,335 $217,897,390 $0
TOTAL $2,150,862,744 $1,183,404,682 $967,458,062 $0
Notes
-The Mental Health Substance Abuse Plan (Provider Type 53 - Iowa Plan payments) is not a mandatory or optional service. Rather, the Iowa Plan contractor acts as a payer of Medicaid services. Based on
the distribution of expenditures for the population covered, it is estimated that 67% of adult expenditures paid through the Iowa Plan are for optional services.
Expenditures
-The above data is based on the provider type rendering treatment rather than the provider type paid for the service.
-Non-recipient payments such as disproportionate share hospital (DSH) payments and graduate medical education payments are excluded.
-The State Resource Center appropriations, rather than the Medical Assistance appropriation, fund the majority of the state share of Provider Type 25.
-The State Mental Health Institute appropriations finance a portion of the state share for provider types 41 and 52.
-The Health Maintenance Organization (Provider Type 24) includes the state's three managed care entities. This is not a mandatory or optional service; rather, this provider type acts as a payer of
Medicaid services. Based on the distribution of expenditures for all other covered populations, it is estimated that 77% of expenditures paid through this provider type are for optional services.
-The Qualified Health Plan (Provider Type 75) is not a mandatory or optional service. Rather, the Qualified Health Plans acts as a payer of Medicaid services for Marketplace Choice Plan members. All
Dental Wellness Plan payments were assigned as an optional service. Based on the distribution of expenditures for the population covered, it is estimated that 79% of expenditures paid through the QHP
are for optional services.
SFY16 Payments
Iowa Department of Human ServicesOptional Services Analysis
Adults Only (Age 21 and Over)Actual SFY16 Expenditures
Traditional Medicaid and Iowa Health and Wellness Plan Not Newly Eligible
Source: Iowa Department of Human Services
173

Federal State
SFY16 Match Rate 100.00% 0.00%
Provider
Type Provider Description Recipients
Total Federal State Funds County/Other
04 DENTIST 2,534 $617,359 $617,359 $0 $0
05 PODIATRIST 5,342 $1,476,949 $1,476,949 $0 $0
06 OPTOMETRIST 21,189 $2,083,432 $2,083,432 $0 $0
07 OPTICIAN 1,201 $65,267 $65,267 $0 $0
08 PHARMACY 121,250 $129,141,930 $129,141,930 $0 $0
09 HOME HEALTH AGENCY 1,600 $2,663,198 $2,663,198 $0 $0
11 AMBULANCE 8,966 $2,458,150 $2,458,150 $0 $0
12 MEDICAL SUPPLIES 13,206 $8,569,952 $8,569,952 $0 $0
14 CLINIC 64 $405,145 $405,145 $0 $0
15 PHYSICAL THERAPIST 3,665 $1,925,416 $1,925,416 $0 $0
16 CHIROPRACTOR 14,583 $2,929,678 $2,929,678 $0 $0
17 AUDIOLOGIST 542 $106,751 $106,751 $0 $0
19 REHAB AGENCY 682 $473,087 $473,087 $0 $0
20 INTERMEDIATE CARE FACILITY 399 $1,172,421 $1,172,421 $0 $0
21 COMMUNITY MH 8,384 $2,518,338 $2,518,338 $0 $0
24 HEALTH MAINTENANCE ORGAN 136,565 $43,424,156 $43,424,156 $0 $0
26 MENTAL HOSPITAL 1 $90,380 $90,380 $0 $0
29 PSYCHOLOGIST 692 $190,434 $190,434 $0 $0
30 SCREENING CENTER 24 $724 $724 $0 $0
31 HEARING AID DEALER 24 $22,757 $22,757 $0 $0
32 OCCUPATIONAL THERAPIST 228 $88,123 $88,123 $0 $0
34 ORTHOPEDIC SHOE DEALER 1 ($356) ($356) $0 $0
35 MATERNAL HEALTH CENTER 331 $56,175 $56,175 $0 $0
36 AMBULATORY SURGICAL CENTER 3,349 $2,289,646 $2,289,646 $0 $0
41 PSYCH MEDICAL INST CHILDREN 384 $439,065 $439,065 $0 $0
42 MEP CASE MANAGER 37 $50,829 $50,829 $0 $0
45 HOSPICE 205 $805,551 $805,551 $0 $0
47 HIPP 603 $480,870 $480,870 $0 $0
48 CLINICAL SOCIAL WORKER 169 $55,618 $55,618 $0 $0
53 MENT HLTH SUBSTANCE ABUSE PLN 220,164 $21,807,216 $21,807,216 $0 $0
62 BEHAVIORAL HEALTH 6,496 $3,940,788 $3,940,788 $0 $0
63 REMEDIAL SERVICES 412 $312,486 $312,486 $0 $0
64 HABILITATION SERVICES 466 $1,498,840 $1,498,840 $0 $0
67 ASSERTIVE COMMUNITY TREATMENT 6 $18,140 $18,140 $0 $0
69 INDEPENDENT SPEECH PATHOLOGIST 7 $1,117 $1,117 $0 $0
71 HEALTH HOME PROV 803 $137,009 $137,009 $0 $0
72 PUBLIC HEALTH AGENCIES 454 $22,813 $22,813 $0 $0
73 SPMI SED PROVIDER 3,740 $3,195,671 $3,195,671 $0 $0
74 IHAWP HMO PROVIDER 30,917 $2,463,705 $2,463,705 $0 $0
75 IHAWP QHP PROVIDER 194,095 $38,138,175 $38,138,175 $0 $0
76 ACCOUNTABLE CARE ORGANIZATIONS 40,817 $843,329 $843,329 $0 $0
99 WAIVER 10 $40,825 $40,825 $0 $0
TOTAL $277,021,160 $277,021,160 $0 $0
Notes
-The IHAWP Health Maintenance Organization (Provider Type 74) is not a mandatory or optional service. Rather, the HMO acts as a payer of Medicaid services. Based on the
distribution of expenditures for the population covered, it is estimated that 7% of expenditures paid through the HMO are for optional services.
-The Qualified Health Plan (Provider Type 75) is not a mandatory or optional service. Rather, the Qualified Health Plans acts as a payer of Medicaid services for Marketplace
Choice Plan members. All Dental Wellness Plan payments were assigned as an optional service. Based on the distribution of expenditures for the population covered, it is
estimated that 79% of expenditures paid through the QHP are for optional services.
Iowa Department of Human Services
Optional Services Analysis
Adults Only (Age 21 and Over)
Actual SFY16 Expenditures
Iowa Health and Wellness Plan -- Newly Eligible Only
SFY16 Payments
Expenditures
-The above data is based on the provider type rendering treatment rather than the provider type paid for the service.
-Non-recipient payments such as disproportionate share hospital (DSH) payments and graduate medical education payments are excluded.
-The Mental Health Substance Abuse Plan (Provider Type 53 - Iowa Plan payments) is not a mandatory or optional service. Rather, the Iowa Plan contractor acts as a payer of
Medicaid services. Based on the distribution of expenditures for the population covered, it is estimated that 31% of adult expenditures paid through the Iowa Plan are for
optional services.
-The Health Maintenance Organization (Provider Type 24) includes the state's three managed care entities. This is not a mandatory or optional service; rather, this provider type
acts as a payer of Medicaid services. Based on the distribution of expenditures for all other covered populations, it is estimated that 30% of expenditures paid through this
provider type are for optional services.
Source: Iowa Department of Human Services
174
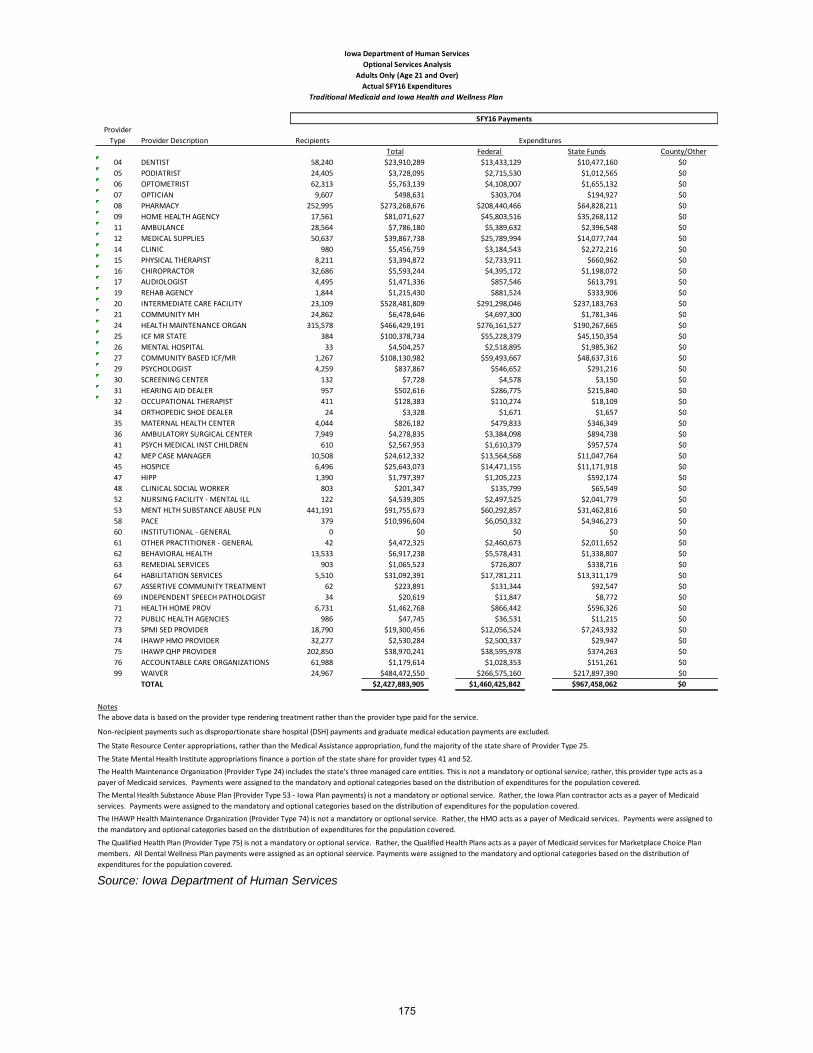
Provider
Type Provider Description Recipients
Total Federal State Funds County/Other
04 DENTIST 58,240 $23,910,289 $13,433,129 $10,477,160 $0
05 PODIATRIST 24,405 $3,728,095 $2,715,530 $1,012,565 $0
06 OPTOMETRIST 62,313 $5,763,139 $4,108,007 $1,655,132 $0
07 OPTICIAN 9,607 $498,631 $303,704 $194,927 $0
08 PHARMACY 252,995 $273,268,676 $208,440,466 $64,828,211 $0
09 HOME HEALTH AGENCY 17,561 $81,071,627 $45,803,516 $35,268,112 $0
11 AMBULANCE 28,564 $7,786,180 $5,389,632 $2,396,548 $0
12 MEDICAL SUPPLIES 50,637 $39,867,738 $25,789,994 $14,077,744 $0
14 CLINIC 980 $5,456,759 $3,184,543 $2,272,216 $0
15 PHYSICAL THERAPIST 8,211 $3,394,872 $2,733,911 $660,962 $0
16 CHIROPRACTOR 32,686 $5,593,244 $4,395,172 $1,198,072 $0
17 AUDIOLOGIST 4,495 $1,471,336 $857,546 $613,791 $0
19 REHAB AGENCY 1,844 $1,215,430 $881,524 $333,906 $0
20 INTERMEDIATE CARE FACILITY 23,109 $528,481,809 $291,298,046 $237,183,763 $0
21 COMMUNITY MH 24,862 $6,478,646 $4,697,300 $1,781,346 $0
24 HEALTH MAINTENANCE ORGAN 315,578 $466,429,191 $276,161,527 $190,267,665 $0
25 ICF MR STATE 384 $100,378,734 $55,228,379 $45,150,354 $0
26 MENTAL HOSPITAL 33 $4,504,257 $2,518,895 $1,985,362 $0
27 COMMUNITY BASED ICF/MR 1,267 $108,130,982 $59,493,667 $48,637,316 $0
29 PSYCHOLOGIST 4,259 $837,867 $546,652 $291,216 $0
30 SCREENING CENTER 132 $7,728 $4,578 $3,150 $0
31 HEARING AID DEALER 957 $502,616 $286,775 $215,840 $0
32 OCCUPATIONAL THERAPIST 411 $128,383 $110,274 $18,109 $0
34 ORTHOPEDIC SHOE DEALER 24 $3,328 $1,671 $1,657 $0
35 MATERNAL HEALTH CENTER 4,044 $826,182 $479,833 $346,349 $0
36 AMBULATORY SURGICAL CENTER 7,949 $4,278,835 $3,384,098 $894,738 $0
41 PSYCH MEDICAL INST CHILDREN 610 $2,567,953 $1,610,379 $957,574 $0
42 MEP CASE MANAGER 10,508 $24,612,332 $13,564,568 $11,047,764 $0
45 HOSPICE 6,496 $25,643,073 $14,471,155 $11,171,918 $0
47 HIPP 1,390 $1,797,397 $1,205,223 $592,174 $0
48 CLINICAL SOCIAL WORKER 803 $201,347 $135,799 $65,549 $0
52 NURSING FACILITY - MENTAL ILL 122 $4,539,305 $2,497,525 $2,041,779 $0
53 MENT HLTH SUBSTANCE ABUSE PLN 441,191 $91,755,673 $60,292,857 $31,462,816 $0
58 PACE 379 $10,996,604 $6,050,332 $4,946,273 $0
60 INSTITUTIONAL - GENERAL 0 $0 $0 $0 $0
61 OTHER PRACTITIONER - GENERAL 42 $4,472,325 $2,460,673 $2,011,652 $0
62 BEHAVIORAL HEALTH 13,533 $6,917,238 $5,578,431 $1,338,807 $0
63 REMEDIAL SERVICES 903 $1,065,523 $726,807 $338,716 $0
64 HABILITATION SERVICES 5,510 $31,092,391 $17,781,211 $13,311,179 $0
67 ASSERTIVE COMMUNITY TREATMENT 62 $223,891 $131,344 $92,547 $0
69 INDEPENDENT SPEECH PATHOLOGIST 34 $20,619 $11,847 $8,772 $0
71 HEALTH HOME PROV 6,731 $1,462,768 $866,442 $596,326 $0
72 PUBLIC HEALTH AGENCIES 986 $47,745 $36,531 $11,215 $0
73 SPMI SED PROVIDER 18,790 $19,300,456 $12,056,524 $7,243,932 $0
74 IHAWP HMO PROVIDER 32,277 $2,530,284 $2,500,337 $29,947 $0
75 IHAWP QHP PROVIDER 202,850 $38,970,241 $38,595,978 $374,263 $0
76 ACCOUNTABLE CARE ORGANIZATIONS 61,988 $1,179,614 $1,028,353 $151,261 $0
99 WAIVER 24,967 $484,472,550 $266,575,160 $217,897,390 $0
TOTAL $2,427,883,905 $1,460,425,842 $967,458,062 $0
Notes
The Qualified Health Plan (Provider Type 75) is not a mandatory or optional service. Rather, the Qualified Health Plans acts as a payer of Medicaid services for Marketplace Choice Plan
members. All Dental Wellness Plan payments were assigned as an optional seervice. Payments were assigned to the mandatory and optional categories based on the distribution of
expenditures for the population covered.
The Mental Health Substance Abuse Plan (Provider Type 53 - Iowa Plan payments) is not a mandatory or optional service. Rather, the Iowa Plan contractor acts as a payer of Medicaid
services. Payments were assigned to the mandatory and optional categories based on the distribution of expenditures for the population covered.
Expenditures
The above data is based on the provider type rendering treatment rather than the provider type paid for the service.
Non-recipient payments such as disproportionate share hospital (DSH) payments and graduate medical education payments are excluded.
The State Resource Center appropriations, rather than the Medical Assistance appropriation, fund the majority of the state share of Provider Type 25.
The State Mental Health Institute appropriations finance a portion of the state share for provider types 41 and 52.
The Health Maintenance Organization (Provider Type 24) includes the state's three managed care entities. This is not a mandatory or optional service; rather, this provider type acts as a
payer of Medicaid services. Payments were assigned to the mandatory and optional categories based on the distribution of expenditures for the population covered.
The IHAWP Health Maintenance Organization (Provider Type 74) is not a mandatory or optional service. Rather, the HMO acts as a payer of Medicaid services. Payments were assigned to
the mandatory and optional categories based on the distribution of expenditures for the population covered.
SFY16 Payments
Iowa Department of Human Services
Optional Services Analysis
Adults Only (Age 21 and Over)
Actual SFY16 Expenditures
Traditional Medicaid and Iowa Health and Wellness Plan
Source: Iowa Department of Human Services
175

286
200
268
186
255
180
252
165
240
154
232
147
0
50
100
150
200
250
300
350Glenwood Woodward
Nu
mb
er o
f Re
sid
en
ts
State Resource CentersNumber of Residents in Facilities
Fiscal Years 2011 - 2016
FISCAL YEAR
2011 2012 2013 2014 2015 2016 2011 2012 2013 2014 2015 2016
$276,0
76
$301,8
94
$288,1
56
$327,5
24
$298,8
76
$335,1
59
$301,7
97
$349,0
93
$313,1
64
$369,7
50
$320,8
21
$374,5
09
$0
$50,000
$100,000
$150,000
$200,000
$250,000
$300,000
$350,000
$400,000Glenwood Woodward
State Resource CentersAnnual Cost per Resident
Fiscal Years 2011 - 2016 (All Funds)
FISCAL YEAR
2011 2012 2013 2014 2015 2016 2011 2012 2013 2014 2015 2016
Source: Iowa Department of Human Services
Source: Iowa Department of Human Services
176

59
142
53
127
51
124
32
122
116
114
-
20
40
60
80
100
120
140
160Toledo Eldora
Nu
mb
er o
f Re
sid
en
ts
Juvenile FacilitiesNumber of Residents in Facilities
Fiscal Years 2011 - 2016
FISCAL YEAR
2011 2012 2013 2014 2011 2012 2013 2014 2015 2016
Note: Toledo began closing its facility during Fiscal Year 2014; therefore, there is no data for Toledo
beginning Fiscal Year 2015.
$144,4
66 $94,6
06
$170,8
20
$105,1
12
$190,1
74
$116,6
31
$175,8
13 $
118,5
08
$130,2
59
$130,9
08
$0
$20,000
$40,000
$60,000
$80,000
$100,000
$120,000
$140,000
$160,000
$180,000
$200,000
Juvenile FacilitiesAnnual Cost per Resident
Fiscal Years 2011 - FY 2016 (All Funds)
FISCAL YEAR
2011 2012 2013 2014 2011 2012 2013 2014 2015 2016
Toledo Eldora
Note: Toledo began closing its facility during fiscal year 2014; therefore, there is no data for Toledo beginning fiscal year 2015.
Source: Iowa Department of Human Services
Source: Iowa Department of Human Services
177
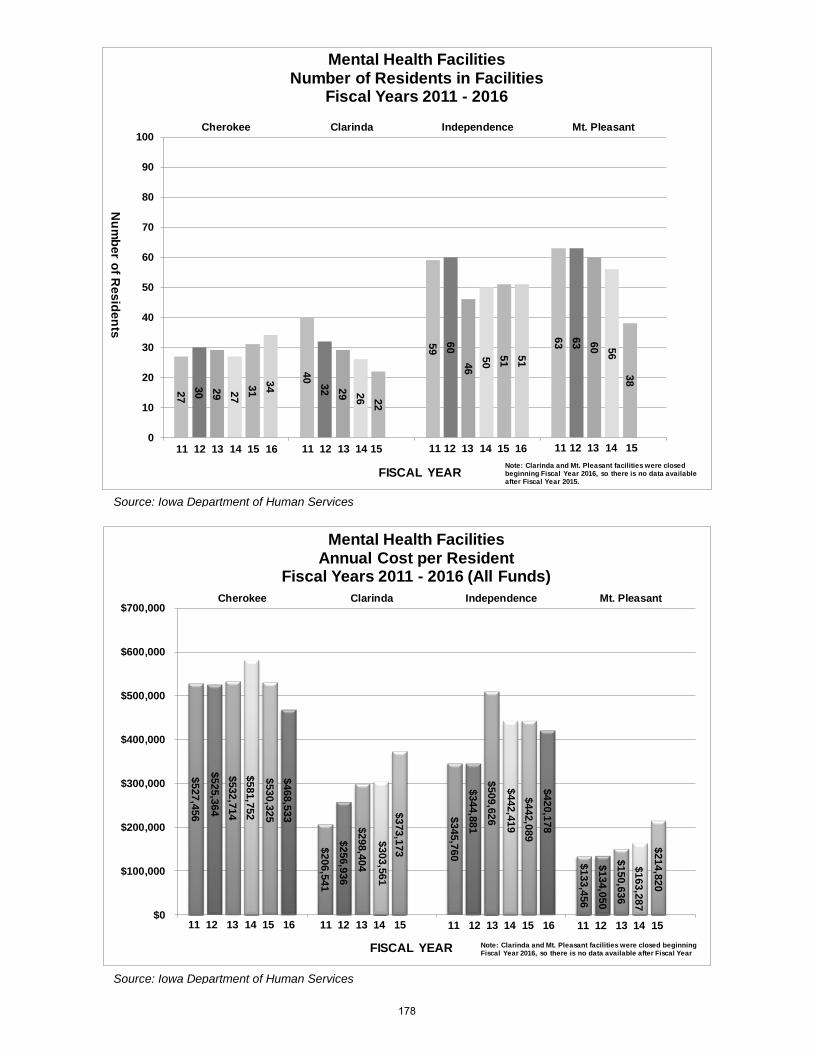
27
40
59
63
30
32
60
63
29
29
46
60
27 26
50
56
31
22
51
383
4
51
0
10
20
30
40
50
60
70
80
90
100Cherokee Clarinda Independence Mt. Pleasant
Nu
mb
er o
f Re
sid
en
ts
Mental Health FacilitiesNumber of Residents in Facilities
Fiscal Years 2011 - 2016
FISCAL YEAR
11 12 13 14 15 16 11 12 13 14 1511 12 13 14 15 1611 12 13 14 15
Note: Clarinda and Mt. Pleasant facilities were closed beginning Fiscal Year 2016, so there is no data available after Fiscal Year 2015.
$527,4
56
$206,5
41
$345,7
60 $
133,4
56
$525,3
64
$256,9
36
$344,8
81
$134,0
50
$532,7
14
$298,4
04
$509,6
26
$150,6
36
$581,7
52
$303,5
61
$442,4
19
$163,2
87
$530,3
25
$373,1
73
$442,0
89
$214,8
20
$468,5
33
$420,1
78
$0
$100,000
$200,000
$300,000
$400,000
$500,000
$600,000
$700,000Cherokee Clarinda Independence Mt. Pleasant
Mental Health FacilitiesAnnual Cost per Resident
Fiscal Years 2011 - 2016 (All Funds)
FISCAL YEAR
11 12 13 14 15 16 11 12 13 14 1511 12 13 14 15 1611 12 13 14 15
Note: Clarinda and Mt. Pleasant facilities were closed beginning Fiscal Year 2016, so there is no data available after Fiscal Year
Source: Iowa Department of Human Services
Source: Iowa Department of Human Services
178

81
91
102
104 98
103
0
20
40
60
80
100
120
Nu
mb
er o
f Re
sid
en
ts
FISCAL YEAR
Civil Commitment Unit for Sexual Offenders (CCUSO)Number of Residents in Facilities
Fiscal Years 2011 - 2016
2011 2012 2013 2014 2015 2016
$89,0
97
$86,8
27
$91,7
35
$90,6
51
$101,2
40
$99,5
52
$75,000
$80,000
$85,000
$90,000
$95,000
$100,000
$105,000
Civil Commitment Unit for Sexual Offenders (CCUSO)Annual Cost per Resident
Fiscal Years 2011 - 2016 (All Funds)
FISCAL YEAR
2011 2012 2013 2014 2015 2016
Source: Iowa Department of Human Services
Source: Iowa Department of Human Services
179

66.14%
63.55%
63.61%
61.98%
61.73%
69.29%
72.55%
68.16%
60.71%
59.59%
57.93%
55.54%
54.91%
56.74%
58.48%
0%
10
%
20
%
30
%
40
%
50
%
60
%
70
%
80
%
20
04*
20
05
20
06
20
07
20
08
20
09**
20
10**
20
11**
20
12
20
13
20
14
20
15
20
16
20
17
20
18
Fe
de
ral M
ed
ica
l A
ss
ista
nc
e P
erc
en
tag
es
(F
MA
P)
for
Me
dic
al A
ss
ista
nc
eb
y F
ed
era
l F
isc
al Y
ea
r
*FF
Y04
inclu
des t
he c
alc
ula
tions p
urs
uant
to t
he J
obs a
nd G
row
th T
ax
Relie
f R
econcili
atio
n A
ct
of 2003.
**F
FY
09-F
FY
11 in
clu
des t
he c
alc
ula
tions p
urs
uant
to t
he A
merican R
ecove
ry a
nd R
ein
vestm
ent
Act
of 2009.
So
urc
e:
Iow
a D
ep
art
ment
of
Hu
ma
n S
erv
ices
180
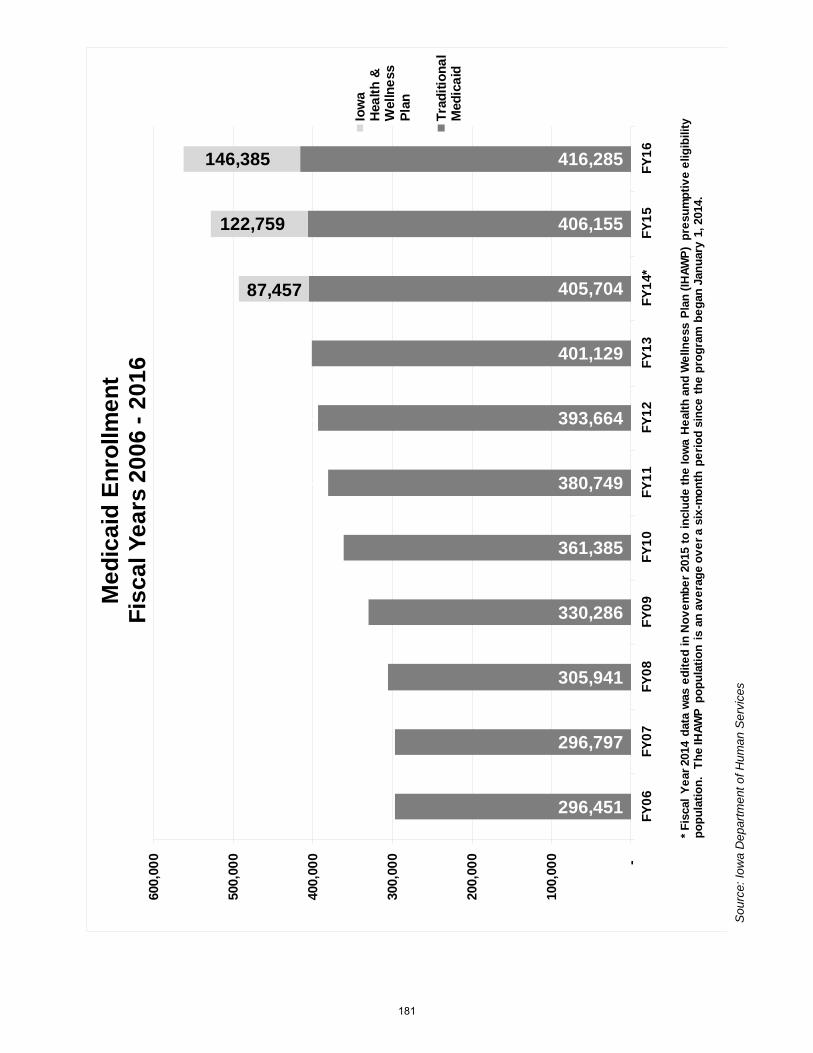
296,451
296,797
305,941
330,286
361,385
380,749
393,664
401,129
405,704
406,155
416,285
-
-
-
-
-
-
-
-
87,457
122,759
146,385
-
100,0
00
200,0
00
300,0
00
400,0
00
500,0
00
600,0
00
FY
06
FY
07
FY
08
FY
09
FY
10
FY
11
FY
12
FY
13
FY
14*
FY
15
FY
16
Me
dic
aid
En
rollm
en
tF
isc
al Y
ea
rs 2
00
6 -
20
16
Iow
aH
ea
lth
&W
elln
ess
Pla
n
Tra
dit
ion
al
Med
ica
id
* F
iscal
Ye
ar
2014 d
ata
was e
dit
ed
in N
ov
em
be
r 2015 t
o i
nclu
de
th
e Io
wa H
ealt
h a
nd
We
lln
ess P
lan
(IH
AW
P)
pre
su
mp
tiv
e e
lig
ibilit
y p
op
ula
tio
n.
Th
e IH
AW
P p
op
ula
tio
n i
s a
n a
ve
rag
e o
ve
r a s
ix-m
on
th p
eri
od
sin
ce
th
e p
rog
ram
be
gan
Jan
uary
1, 2014.
So
urc
e:
Iow
a D
ep
art
me
nt
of
Hu
ma
n S
erv
ices
181

182

Correc
tion
al Institutio
nT
ota
l C
ost
Ave
rag
e D
aily
Pop
ula
tio
nC
ost P
er Y
ear
Iow
a S
tate
Pe
nite
ntia
ry43,9
72,6
46
$
735
59,8
27
$
An
am
osa
33,7
67,5
22
$
1,0
04
33,6
33
$
Oakd
ale
60,4
67,2
58
$
962
62,8
56
$
New
ton
27,6
45,5
33
$
1,1
66
23,7
10
$
Mt
Ple
asa
nt
26,4
23,0
19
$
883
29,9
24
$
Rockw
ell
City
10,2
93,4
74
$
494
20,8
37
$
Cla
rin
da
27,8
68,1
07
$
892
31,2
42
$
Mitche
llvill
e22,8
17,0
66
$
689
33,1
16
$
Fort
Dodge
29,8
98,9
63
$
1,2
69
23,5
61
$
Total
283
,15
3,5
88
$
8,09
43
4,9
83
$
Tota
l co
st p
er y
ear
is a
n A
vera
ge C
ost
Departm
ent of C
orrections
Average C
ost per Y
ear per Inm
ate
Fiscal Y
ear 2016 (A
ctual)
by C
orrectional Institution
So
urc
e:
Iow
a D
ep
art
me
nt
of
Co
rre
ctio
ns
So
urc
e:
Iow
a D
ep
art
me
nt
of
Co
rre
ctio
ns
183

$0
$10,000
$20,000
$30,000
$40,000
$50,000
$60,000
$70,000
Iowa State Penitentiary
Anamosa
Oakdale
Newton
Mt Pleasant
Rockwell City
Clarinda
Mitchellville
Fort Dodge
$59,827
$33,633
$62,856
$23,710
$29,924
$20,837
$31,242
$33,116
$23,561D
epartm
ent of C
orrections
Average C
ost per Y
ear per Inm
ate B
y Institution
Fiscal Y
ear 2016 (A
ctual)
So
urc
e:
Iow
a D
ep
art
me
nt
of
Co
rre
ctio
ns
184

$0$50
$100
$150
$200
$250
$300
$350
$400
2006
2007
2008
2009
2010
2011
2012
2013
2014
2015
2016
2017
$230
$246
$274
$281
$252
$257
$273
$278
$287
$288
$290
$294
$69
$73
$79
$84
$77
$78
$81
$83
$87
$90
$91
$91
General Fund (In Millions)
Fiscal Y
ear
Departm
ent of C
orrections
General Fund O
perating B
udgets
Fiscal Y
ears 2006 -2017 (E
stim
ate)
Non-C
BC
CB
C
So
urc
e:
Iow
a D
ep
art
me
nt
of
Co
rre
ctio
ns
185
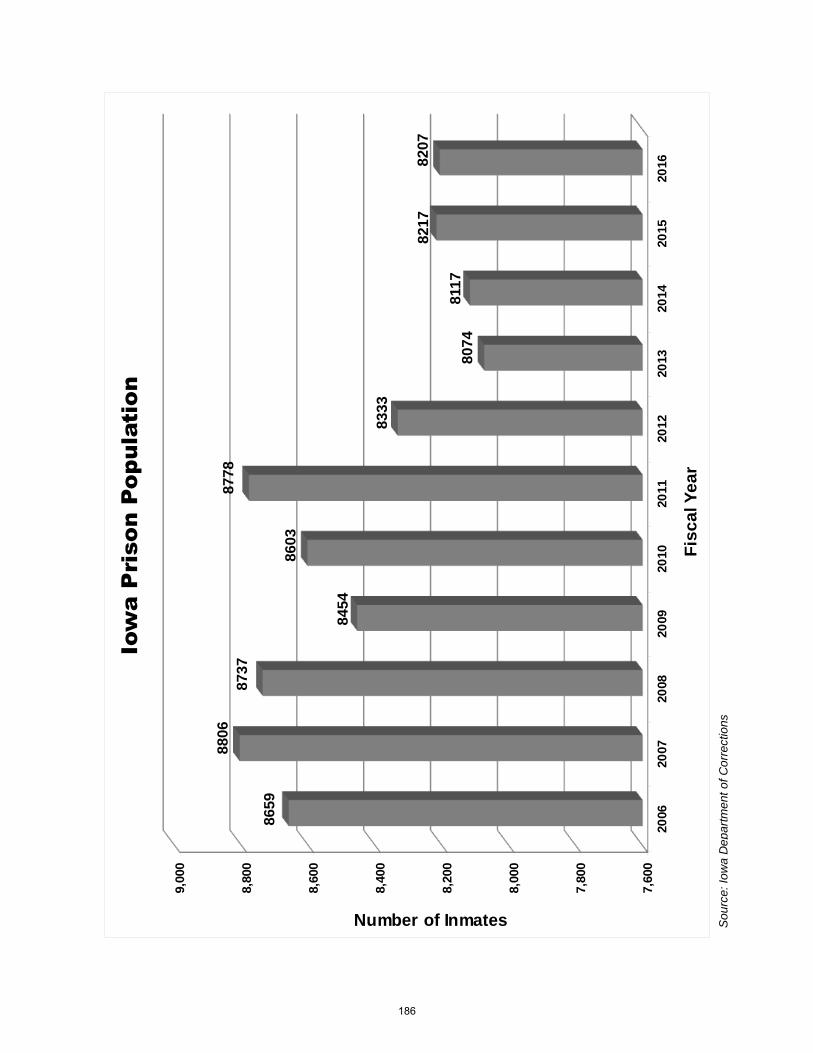
7,6
00
7,8
00
8,0
00
8,2
00
8,4
00
8,6
00
8,8
00
9,0
00
20
06
20
07
20
08
20
09
20
10
20
11
20
12
20
13
20
14
20
15
20
16
8659
8806
8737
8454
8603
8778
8333
8074
8117
8217
8207
Number of Inmates
Fis
ca
l Y
ea
r
Iow
a P
riso
n P
op
ulatio
n
So
urc
e:
Iow
a D
ep
art
me
nt
of
Co
rre
ctio
ns
186

Department FY16 Actual FY17 Estimate FY18 Estimate FY19 Estimate
Administration -$ -$
Aging 17,577,284$ 17,116,709$ 16,350,591$ 16,384,384$
Agriculture and Land Stewardship 10,189,300$ 10,896,077$ 10,123,715$ 10,123,715$
Attorney General/DOJ 14,820,635$ 30,451,557$ 27,843,757$ 27,734,757$
Blind 5,524,856$ 5,718,446$ 5,957,500$ 5,957,500$
Commerce
Insurance Division 959,079$ 988,260$ 901,224$ 901,224$
Utilities Division 1,162,756$ 921,655$ 871,655$ 871,655$
Corrections 719,341$ 1,962,346$ 1,962,346$ 1,962,346$
Cultural Affairs 1,648,820$ 1,628,104 1,628,104 1,628,104
Education 513,111,520$ 538,428,619$ 539,299,824$ 539,891,937$
Homeland Security 202,995,775$ 137,498,160$ 137,653,836$ 137,653,836$
Human Rights 70,410,431$ 74,168,989$ 74,618,531$ 74,618,531$
Human Services 3,987,505,095$ 3,934,808,748$ 3,921,440,479$ 3,998,947,689$
Human Services Capitals 25,959,672$ 39,925,327$ 12,854,674$ -$
Inspections and Appeals 12,230,093$ 12,481,171$ 12,481,171$ 12,481,171$
Iowa Civil Rights Commission 1,285,782$ 1,387,663$ 1,434,266$ 1,458,396$
Iowa College Student Aid Comm 4,630,668$ 7,410,005$ 6,963,180$ 6,963,180$
Iowa Communications Network 15,144$ -$ -$ -$
Iowa Economic Development Auth 90,968,657$ 99,274,809$ 99,034,190$ 99,034,190$
Iowa Finance Authority 39,641,652$ 39,641,652$ 39,641,652$ 39,641,652$
Iowa Law Enforcement Academy -$ -$ -$ -$
Iowa Workforce Development 497,274,308$ 468,728,847$ 465,609,204$ 455,806,306$
Judicial Branch 1,642,162$ 1,914,265$ -$ -$
Management 97,236$ -$ -$ -$
Natural Resources 41,084,501$ 42,099,628$ 43,289,628$ 43,289,628$
Natural Resources Capitals 639,044$ -$ -$ -$
Office of Drug Control Policy 4,830,123$ 1,580,304$ 1,580,304$ 1,580,304$
Public Defense 35,914,689$ 39,451,378$ 39,271,594$ 39,271,594$
Public Health 117,489,225$ 127,273,258$ 126,517,863$ 126,517,863$
Public Safety 10,138,410$ 12,084,070$ 11,570,578$ 11,570,578$
Regents 514,876,812$ 489,437,240$ 489,437,240$ 489,437,240$
Secretary of State 15,000$ (144,999)$ 10,000$ 10,000$
Transportation 537,167,540$ 441,406,816$ 441,406,813$ 441,406,813$
Treasurer of State 661,374$ 650,000$ 670,000$ 670,000$
Veterans Affairs 21,453,609$ 21,021,728$ 21,019,728$ 21,019,728$
Veterans Affairs Capitals 6,043,621$ 12,473,284$ 4,441,317$ 1,235,530$
6,790,684,214$ 6,612,684,116$ 6,555,884,964$ 6,608,069,851$
Federal Funds Report
Source: Iowa Department of Management
187

Edu
cati
on
-K
12
8.1
4%
Re
gen
ts
7.4
0%
Hu
man
Se
rvic
es
60
.11
%
Wo
rkfo
rce
De
velo
pm
en
t7
.09
%
Tran
spo
rtat
ion
6.6
8%Ho
me
lan
d S
ecu
rity
2.0
8%
Oth
er
8.5
1%
Fed
eral
Fu
nd
sP
erc
enta
ge b
y D
ep
artm
ent
Fisc
al Y
ear
20
17
Est
imat
e
91%
of t
he
Fed
eral
Fu
nd
s ar
e p
rovi
ded
to
6 S
tate
De
pa
rtm
en
tsH
uman
Ser
vice
s$
3,97
4,73
4,07
5E
duca
tion
$
538,
428,
619
Re
ge
nts
$
48
9,4
37
,240
Wor
kfor
ce D
eve
lopm
ent
$
4
68,7
28,8
47T
ran
spo
rta
tion
$
44
1,4
06
,816
H
omel
and
Sec
urit
y $
13
7,49
8,16
0
To
tal
$ 6
,61
2,6
84
,116
So
urc
e:
Iow
a D
ep
art
me
nt
of
Ma
na
ge
men
t
188

Ge
ne
ral
Fun
d
22
,05
65
3%
Ro
ad F
un
ds
2,5
22
6%
Fed
era
l Fu
nd
s
2,8
28
7%Oth
er
Fun
ds
14
,24
73
4%
Nu
mb
er o
f S
tate
E
mp
loye
es a
nd C
osts
By F
und
in
g S
ou
rc
e
Fisc
al Ye
ar 2
016
Annual C
osts
Genera
l F
und
$
1,8
17,3
61,9
87
Road F
unds
$
1
65,3
44,0
40
Federa
l F
unds
$
1
84,0
64,9
56
Oth
er
Funds
$
1,3
64,9
61,3
43
To
ta
l $
3
,5
31
,7
32
,3
26
To
tal
nu
mb
er
of
sta
tee
mp
loy
ees
41,6
53
So
urc
e:
Iow
a D
ep
art
me
nt
of
Ma
na
ge
men
t
189

Board of R
egents
51%
Judiciary
4%
Other
17%
Transportation
6%C
orrections
9%
Natural R
esources
2%
Hum
an
Services
11%
Pe
rc
en
ta
ge
o
f S
ta
te E
mp
lo
ye
es
By D
epa
rtm
en
t
As o
f O
cto
be
r 2
016
(A
ll F
un
ds)
Nu
mb
er o
f E
mp
lo
ye
es
Bo
ard
of
Re
gen
ts
21,
210
Hu
man
Se
rvic
es
4,
431
Co
rre
ctio
ns
3
,727
Tr
ansp
ort
atio
n
2,
599
Jud
icia
ry
1,7
87N
atu
ral R
eso
urc
es
859
Oth
er
7,04
0
To
ta
l 4
1,6
53
So
urc
e:
Iow
a D
ep
art
me
nt
of
Ma
na
ge
men
t
190

Iow
a S
kille
d W
ork
er
an
d J
ob
Cre
ati
on
F
un
d32%
To
tal S
pecif
ic
Allo
cati
on
s68%
Ga
min
g R
ev
en
ue
D
istr
ibu
tio
nF
isc
al Y
ea
r 2
01
8
So
urc
e:
Iow
a D
ep
art
me
nt
of
Ma
na
ge
men
t
191

Reg
en
ts B
uild
ing
s,
$66.9
En
vir
on
men
t F
irst
$42.0
Wate
r Q
uality
$22.0
Oth
er
Infr
astr
uctu
re$18.2
DO
T M
ult
i-M
od
al
Pro
gra
ms
$8.3
Oth
er
$22.6
Re
build
Io
wa
In
fra
stru
cture
Fu
nd
(R
IIF
) D
istrib
utio
n
Fisc
al Y
ea
r 2
01
8 (G
ove
rn
or's R
ec
om
me
nd
atio
ns)
(In
M
illio
ns)
To
tal A
vailab
le:
$180 M
illio
nR
egents
Build
ings
$66.9
Envi
ronm
ent
First
$42.0
Wate
r Q
ualit
y$22.0
Oth
er
Infr
astr
uctu
re$18.2
DO
T M
ulti
-Modal
Pro
gra
ms
$
8.3
Oth
er
$22.6
To
tal
$180.0
So
urc
e:
Iow
a D
ep
art
me
nt
of
Ma
na
ge
men
t
192

ENVIRONMENT FIRST FUND (FY2018) (In Millions)
Dept. of Agriculture
$13.732%
Dept. of Natural Resources
$28.368%
Distribution by State Department
Total: $42M
REAP
$16 38%
Soil Conservation
$13 31%
Park Maintenance
$614%
Water Quality
$5
12%
Other
$2
5%
Distribution by Function
Total: $42M
Source: Iowa Department of Management
Source: Iowa Department of Management
193

$32.4
$28.3
$32.6
$30.2
$29.8
$29.8
$29.8
$29.6
$27.3
$27.4
$27.8
$22.5
$21.8
$21.6
$15.0
$17.4
$17.3
$13.5
$14.6
$0
$5
$1
0
$1
5
$2
0
$2
5
$3
0
$3
5
FY2017
FY2018
FY2019
FY2020
FY2021
FY2022
FY2023
FY2024
FY2025
FY2026
FY2027
FY2028
FY2029
FY2030
FY2031
FY2032
FY2033
FY2034
FY2035
In Millions
Pro
jec
ted
Tu
itio
n R
ep
lac
em
en
t O
blig
ati
on
s b
y F
isc
al Y
ea
r
So
urc
e:
Iow
a B
oa
rd o
f R
ege
nts
194

$0
$5
0,0
00,0
00
$1
00,0
00
,00
0
$1
50,0
00
,00
0
$2
00,0
00
,00
0
$2
50,0
00
,00
0
$3
00,0
00
,00
0
Allo
ca
tio
n o
f G
am
ing
Re
ve
nu
es
Gen
era
l F
un
dV
isio
n I
ow
a D
eb
t S
erv
ice
Sc
ho
ol In
fra
str
uctu
re D
eb
t S
erv
ice
En
do
wm
en
t F
un
dI-
JO
BS
De
bt
Serv
ice
Fe
de
ral
Su
bsid
y H
old
ba
ck
Te
ch
no
log
y R
ein
ve
stm
en
t F
un
dIo
wa S
kil
led
Wo
rke
r a
nd
Jo
b C
reati
on
Fu
nd
Re
bu
ild
Io
wa
In
fras
tru
ctu
re F
un
d
De
bt
Se
rvic
e
So
urc
e:
Iow
a D
ep
art
me
nt
of
Ma
na
ge
men
t
195
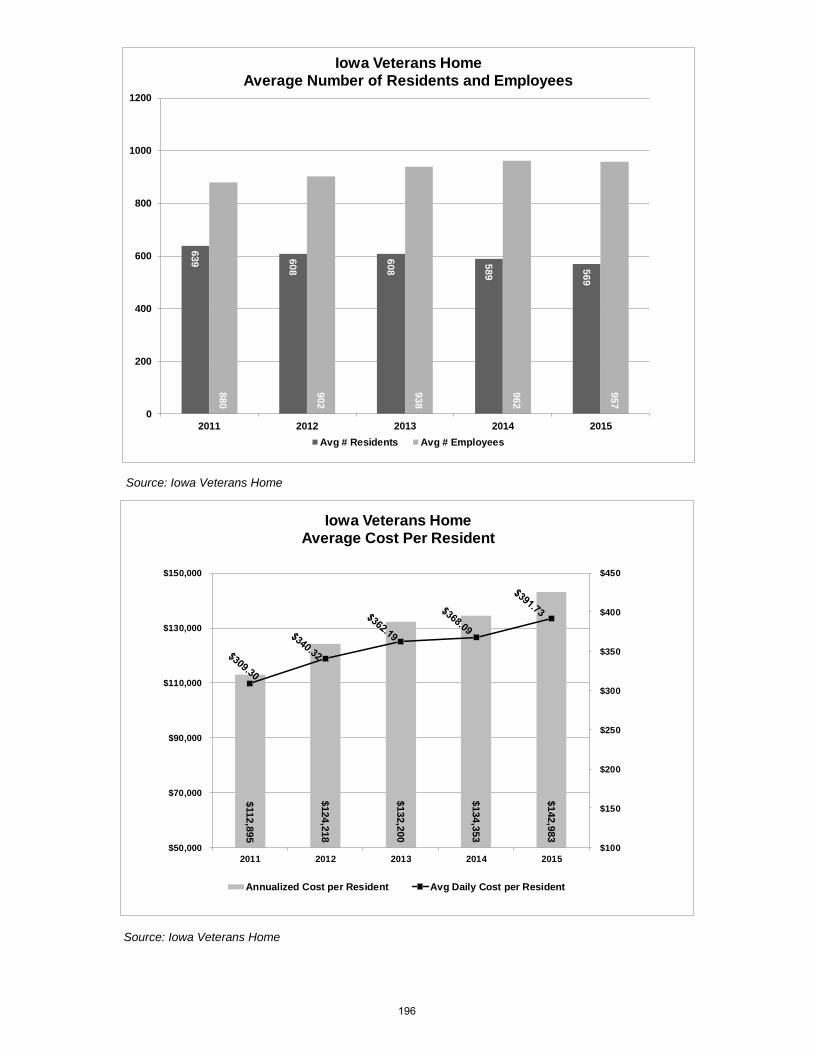
639 608
608
589
569
880
902
938
962
957
0
200
400
600
800
1000
1200
2011 2012 2013 2014 2015
Iowa Veterans HomeAverage Number of Residents and Employees
Avg # Residents Avg # Employees
$112,8
95
$124,2
18
$132,2
00
$134,3
53
$142,9
83
$100
$150
$200
$250
$300
$350
$400
$450
$50,000
$70,000
$90,000
$110,000
$130,000
$150,000
2011 2012 2013 2014 2015
Iowa Veterans HomeAverage Cost Per Resident
Annualized Cost per Resident Avg Daily Cost per Resident
Source: Iowa Veterans Home
Source: Iowa Veterans Home
196
Related Documents