Professor: Lin Gao Associate professor: Sheng Li [email protected]; [email protected] Institute of Engineering Thermophysics, Chinese Academy of Sciences 1 4th Post Combustion Capture Conference 5th-8th September 2017, Brimingham, USA

Welcome message from author
This document is posted to help you gain knowledge. Please leave a comment to let me know what you think about it! Share it to your friends and learn new things together.
Transcript
Professor: Lin Gao
Associate professor: Sheng Li
[email protected]; [email protected]
Institute of Engineering Thermophysics, Chinese Academy of Sciences
1
4th Post Combustion Capture Conference
5th-8th September 2017, Brimingham, USA
1. Progress of CCS demonstration in China
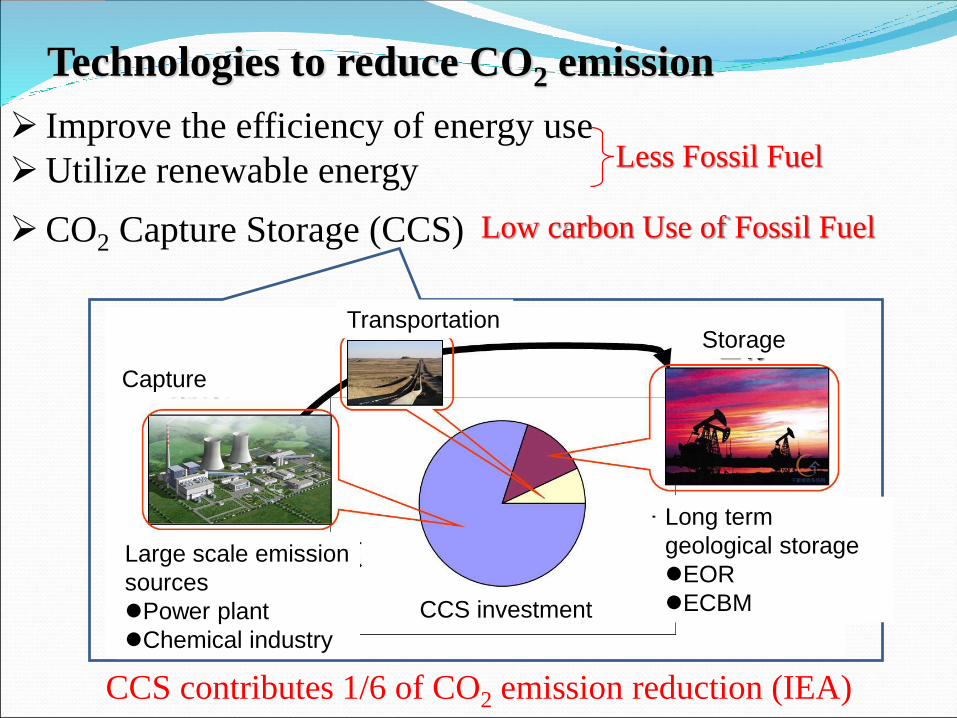
Technologies to reduce CO2 emission
➢ Improve the efficiency of energy use
➢Utilize renewable energy
➢CO2 Capture Storage (CCS)
CCS contributes 1/6 of CO2 emission reduction (IEA)
地质封存咸水层EoR、ECBMCCS 成本构成
Less Fossil Fuel
Low carbon Use of Fossil Fuel
CCS investment
StorageTransportation
Capture
Long term
geological storage
EOR
ECBM
Large scale emission
sources
Power plant
Chemical industry
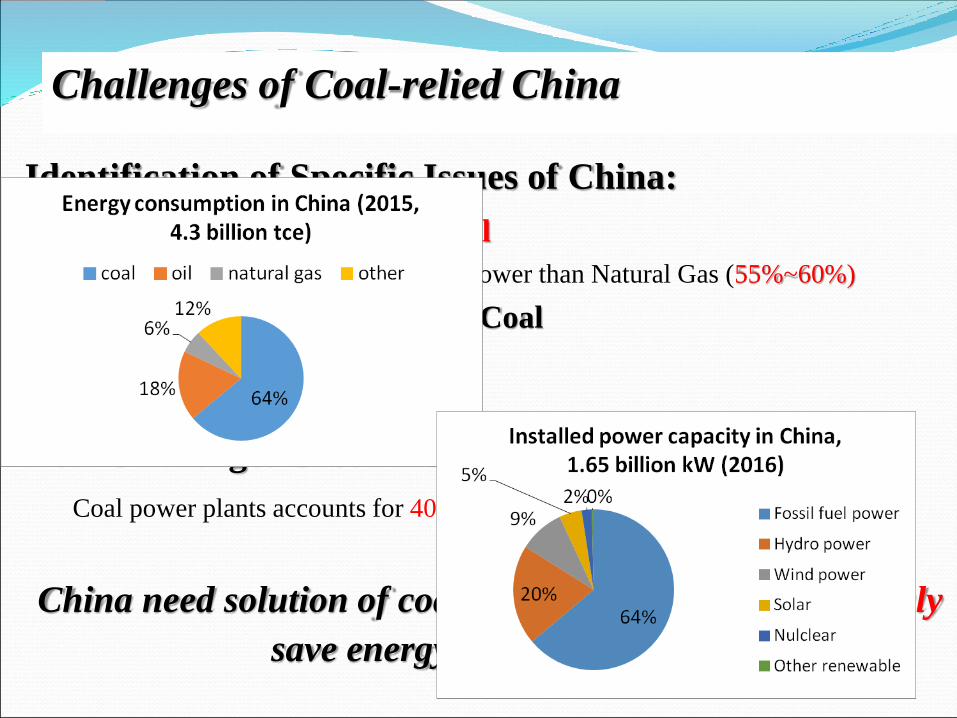
Challenges of Coal-relied China
Identification of Specific Issues of China:
Low Energy Efficiency of Coal
coal power plant (42%~45%) much lower than Natural Gas (55%~60%)
Air Pollutants Emission from Coal
70%~80% SO2,NOX,PM2.5 etc.
GDP Loss:7% (1995), 13% (2020)
New Challenge: Green House Gas (CO2) Control
Coal power plants accounts for 40% of total emission (8 billion tones in 2013).
China need solution of coal technologies to simultaneously
save energy and reduce CO2
5
44%
10%18%
28%
Large scale CCS demonstration
Operating
In Construction
AdvancedDevelopment
EarlyDevelopment
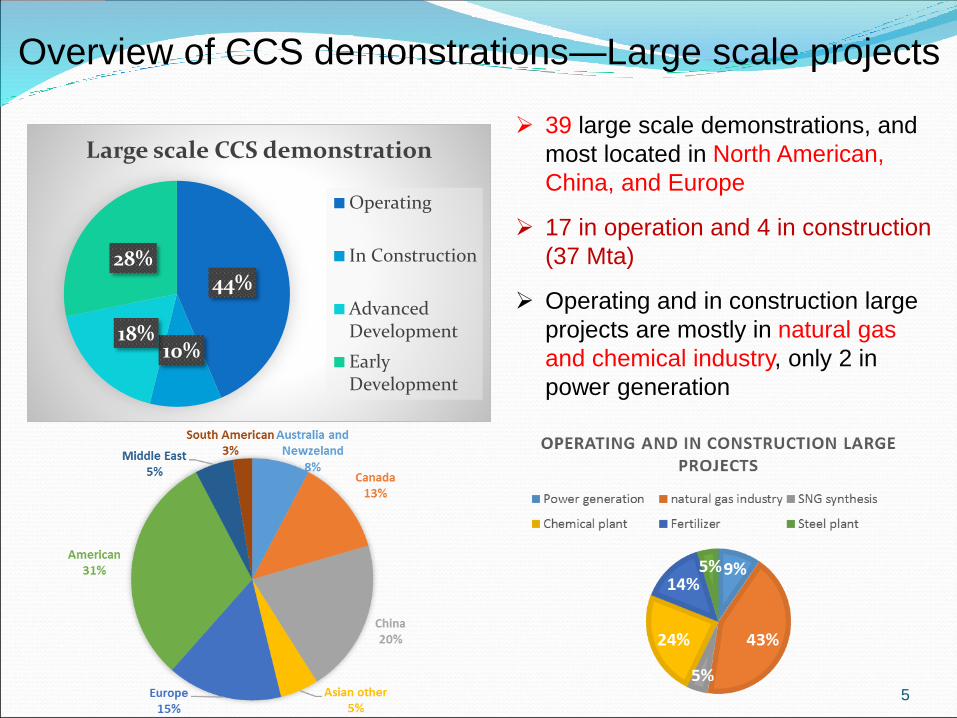
Overview of CCS demonstrations—Large scale projects
➢ 39 large scale demonstrations, and
most located in North American,
China, and Europe
➢ 17 in operation and 4 in construction
(37 Mta)
➢ Operating and in construction large
projects are mostly in natural gas
and chemical industry, only 2 in
power generation

6
Operating, 36%
In Construction,
8%
Advanced Development
, 10%
Completed, 46%
SMALL SCALE DEMONSTRATIONS
➢ 83 small scale demonstrations, and
most located in North American,
Europe and Asian
➢ Most projects are in operation,
construction and completion
➢ 40% of the projects are in power
generation plant
Overview of CCS demonstrations—Small scale projects
➢ Large scale demonstrations are well developing in natural gas processing
and chemical industry due to high CO2 concentration sources and low
capture cost;
➢ In power sector, most projects are still small scale due to high investment
and efficiency penalty, while two large projects, boundary dam and W. A.
Parish, are in operation and encouraging

7
Overview CCS demonstrations in China
Capture: ~120 Mta
Storage: ~120 Mta
Transportation: experiences over
decades
Project name Project stage Location Industry Capture capacity Capture type
Yanchang Integrated Carbon Capture and Storage Demonstration In Construction Shaanxi Province Chemical Production 0.4 Mtpa Industrial Separation
Sinopec Qilu Petrochemical CCSAdvanced Development Shandong Province Chemical Production 0.5 Mtpa Industrial Separation
Sinopec Shengli Power Plant CCSAdvanced Development Dongying City, Shandong Province Power Generation 1 Mtpa Post-combustion capture
Sinopec Eastern China CCSEarly Development Jiangsu Province Fertiliser Production 0.5 Mtpa Industrial Separation
China Resources Power (Haifeng) Integrated Carbon Capture and Sequestration Demonstration
Early Development Shanwei City, Guangdong Province Power Generation 1 Mtpa Post-combustion capture
Huaneng GreenGen IGCC Large-scale System (Phase 3)Early Development
Lingang Industrial Park, Binhai New Area, Tianjin Power Generation 2 Mtpa Pre-combustion capture (gasification)
Shanxi International Energy Group CCUSEarly Development Shanxi Province Power Generation 2 Mtpa Oxy-fuel combustion capture
Shenhua Ningxia CTLEarly Development Ningxia Hui Autonomous Region Coal-to-liquids (CTL) 2 Mtpa Industrial Separation
Daqing Oil Field EOR Demonstration Project Operational Heilongjiang ProvinceVarious, including natural gas processing 200,000 tpa
Pre-combustion capture (for natural gas processing capture component)
Jilin Oil Field EOR Demonstration Project Operational Jilin Province Natural gas processing300,000 –330,000 tpa Pre-combustion capture (natural gas processing)
Karamay Dunhua Oil Technology CCUS EOR Project Operational Karamay city Chemical production 100,000 tpa Industrial separation
Shenhua Group Ordos Carbon Capture and Storage (CCS) Demonstration Project Completed Inner Mongolia Coal-to-liquids (CTL) 100,000 tpa Pre-combustion (cryogenic)
Huaneng GreenGen IGCC Demonstration-scale System (Phase 2) In Construction Tianjin Power generation60,000 - 100,000 tpa Pre-combustion capture (gasification)
Sinopec Shengli Oilfield Carbon Capture Utilization and Storage Pilot Project Operational Shandong Province Power generation
30,000 – 40,000 tpa Post-combustion
Sinopec Zhongyuan Carbon Capture Utilization and Storage Pilot Project Operational Henan Province Chemical production 120,000 tpa Industrial separation
Haifeng Carbon Capture Test Platform In Construction Guangdong Province - 25550 tpa -
Huazhong University of Science and Technology Oxy-fuel Project In Construction Hubei Province - 100,000 tpa Oxy-fuel combustion
Australia-China Post Combustion Capture (PCC) Feasibility Study Project
Advanced Development Jilin Province Power generation 1 Mtpa Post-combustion
China Coalbed Methane Technology Sequestration Project Completed Shanxi Province - - -
Huaneng Shidongkou post combustion Operational Shanghai Power generation 120000 tpa Post-combustion
Huaneng Beijing Thermal power plant Operational Beijing Power generation 3000 tpa Post-combustion
Chongqing Shuanghuai power plant Operational Chongqing Power generation 10000 tpa Post-combustion
Beijing Gaojing NGCC power plantConstruction finished Beijing Power generation 1300~1500 tpa Post-combustion
Capture covers post, pre and oxy combustion;
Storage demonstration are mostly located nearby oil fields and coal beds;
Three pilots in coal power plants are in operation, and one large scale full chain
CCUS is in construction
8
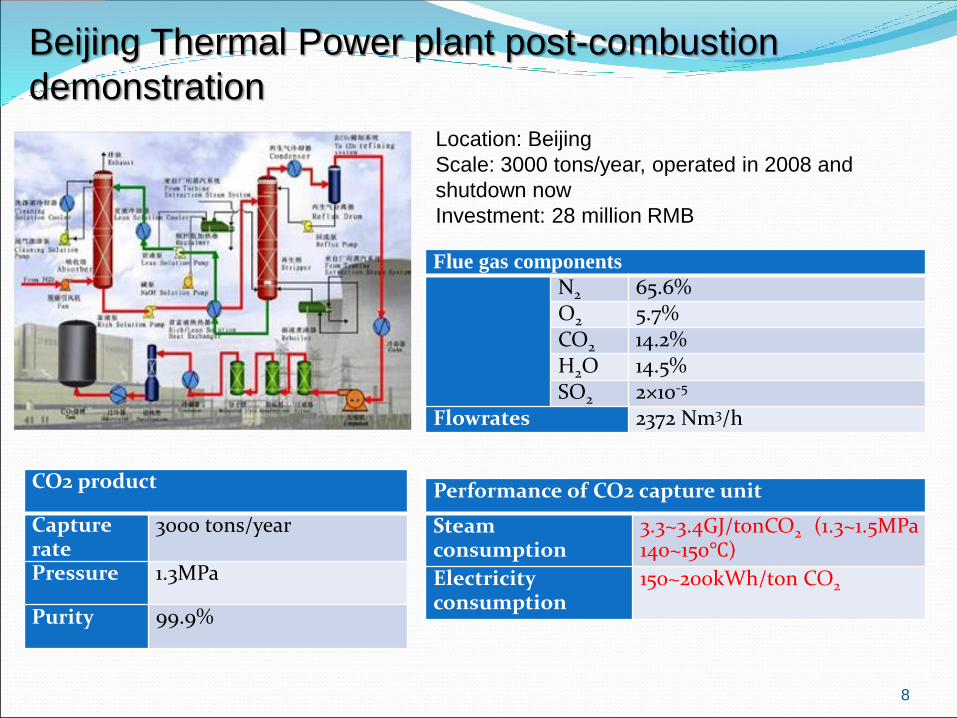
Beijing Thermal Power plant post-combustion
demonstration
Flue gas components
N2 65.6%O2 5.7%CO2 14.2%H2O 14.5%SO2 2×10⁻⁵
Flowrates 2372 Nm3/h
Performance of CO2 capture unit
Steamconsumption
3.3~3.4GJ/tonCO2 (1.3~1.5MPa140~150℃)
Electricityconsumption
150~200kWh/ton CO2
Location: Beijing
Scale: 3000 tons/year, operated in 2008 and
shutdown now
Investment: 28 million RMB
CO2 product
Capturerate
3000 tons/year
Pressure 1.3MPa
Purity 99.9%
9
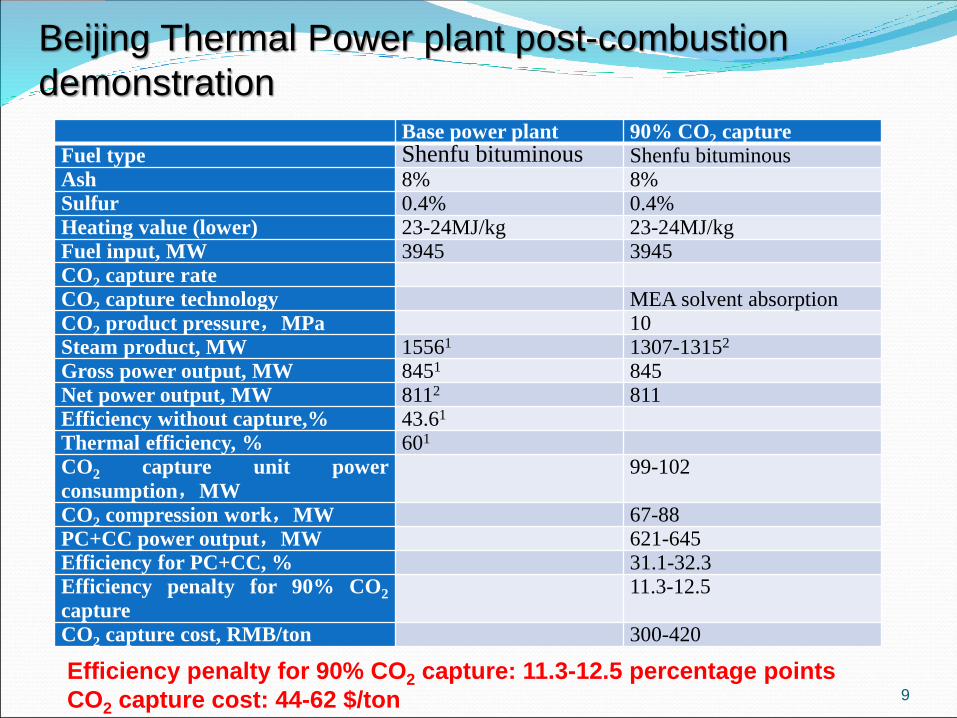
Base power plant 90% CO2 capture
Fuel type Shenfu bituminous Shenfu bituminousAsh 8% 8%Sulfur 0.4% 0.4%Heating value (lower) 23-24MJ/kg 23-24MJ/kgFuel input, MW 3945 3945CO2 capture rate
CO2 capture technology MEA solvent absorptionCO2 product pressure,MPa 10Steam product, MW 15561 1307-13152
Gross power output, MW 8451 845Net power output, MW 8112 811Efficiency without capture,% 43.61
Thermal efficiency, % 601
CO2 capture unit power
consumption,MW
99-102
CO2 compression work,MW 67-88PC+CC power output,MW 621-645Efficiency for PC+CC, % 31.1-32.3Efficiency penalty for 90% CO2
capture
11.3-12.5
CO2 capture cost, RMB/ton 300-420
Beijing Thermal Power plant post-combustion
demonstration
Efficiency penalty for 90% CO2 capture: 11.3-12.5 percentage points
CO2 capture cost: 44-62 $/ton
10
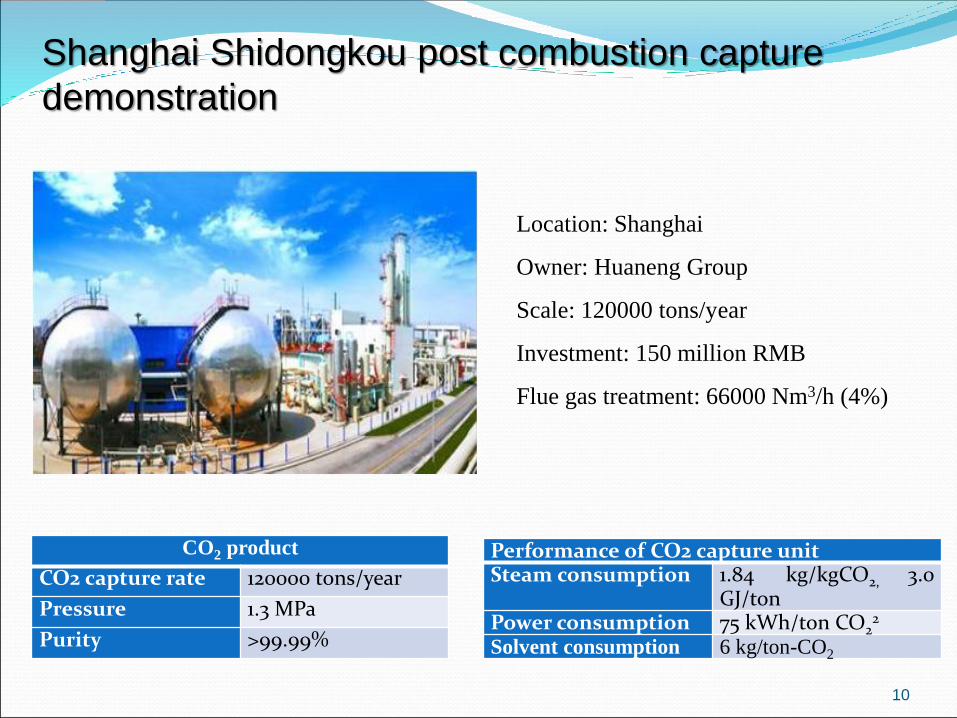
Shanghai Shidongkou post combustion capture
demonstration
Location: Shanghai
Owner: Huaneng Group
Scale: 120000 tons/year
Investment: 150 million RMB
Flue gas treatment: 66000 Nm3/h (4%)
CO2 product
CO2 capture rate 120000 tons/year
Pressure 1.3 MPa
Purity >99.99%
Performance of CO2 capture unitSteam consumption 1.84 kg/kgCO2, 3.0
GJ/tonPower consumption 75 kWh/ton CO2
2
Solvent consumption 6 kg/ton-CO2
11
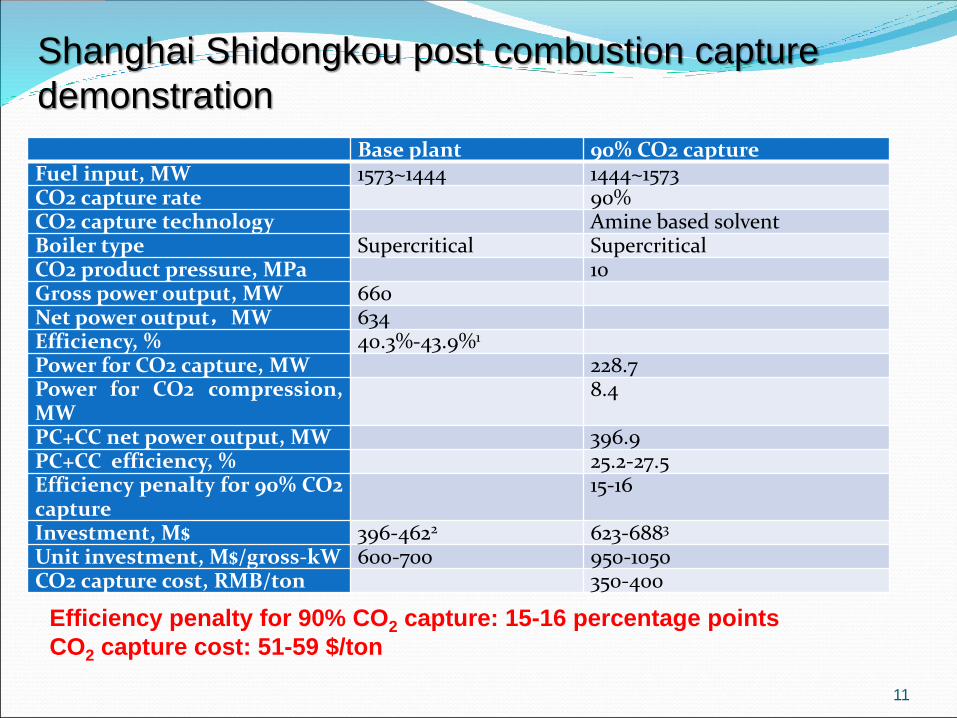
Base plant 90% CO2 captureFuel input, MW 1573~1444 1444~1573CO2 capture rate 90%CO2 capture technology Amine based solventBoiler type Supercritical SupercriticalCO2 product pressure, MPa 10Gross power output, MW 660Net power output,MW 634Efficiency, % 40.3%-43.9%1
Power for CO2 capture, MW 228.7Power for CO2 compression,MW
8.4
PC+CC net power output, MW 396.9PC+CC efficiency, % 25.2-27.5Efficiency penalty for 90% CO2capture
15-16
Investment, M$ 396-4622 623-6883
Unit investment, M$/gross-kW 600-700 950-1050CO2 capture cost, RMB/ton 350-400
Shanghai Shidongkou post combustion capture
demonstration
Efficiency penalty for 90% CO2 capture: 15-16 percentage points
CO2 capture cost: 51-59 $/ton

12
Chongqing Shuanghuai post combustion capture
demonstration
Energy performance of CO2 capture unitSteam consumption 3.9 GJ/ton CO2
Power consumption ~150kWh/ton CO2
CO2 productCapture rate 10000 tons/yearPurity >99.9
Flue gas treatment: 8400 Nm3/h (1%)
Investment: 12.4 million
Location: Chongqing, operated in 2010
Scale: 10000 tons/year
13
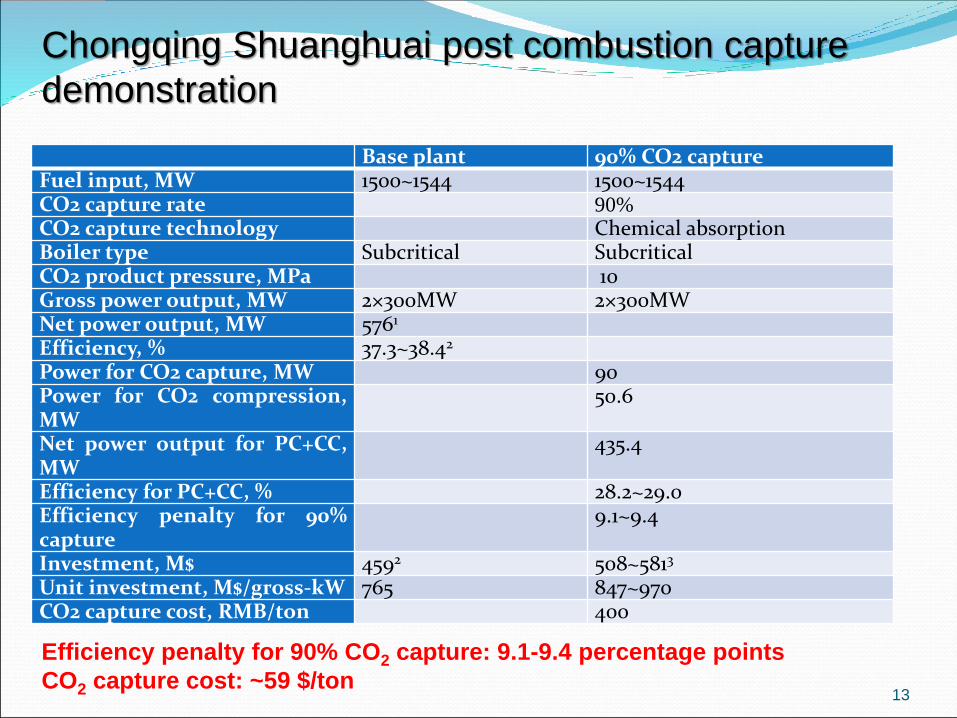
Base plant 90% CO2 captureFuel input, MW 1500~1544 1500~1544CO2 capture rate 90%CO2 capture technology Chemical absorptionBoiler type Subcritical SubcriticalCO2 product pressure, MPa 10Gross power output, MW 2×300MW 2×300MWNet power output, MW 5761
Efficiency, % 37.3~38.42
Power for CO2 capture, MW 90Power for CO2 compression,MW
50.6
Net power output for PC+CC,MW
435.4
Efficiency for PC+CC, % 28.2~29.0Efficiency penalty for 90%capture
9.1~9.4
Investment, M$ 4592 508~5813
Unit investment, M$/gross-kW 765 847~970CO2 capture cost, RMB/ton 400
Chongqing Shuanghuai post combustion capture
demonstration
Efficiency penalty for 90% CO2 capture: 9.1-9.4 percentage points
CO2 capture cost: ~59 $/ton
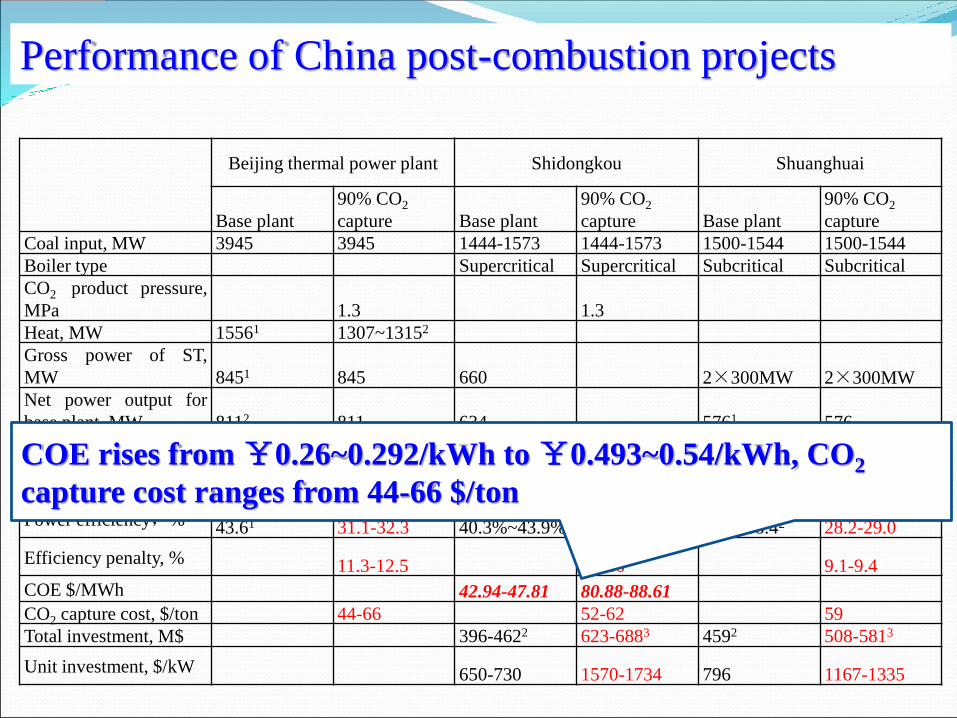
Beijing thermal power plant Shidongkou Shuanghuai
Base plant
90% CO2
capture Base plant
90% CO2
capture Base plant
90% CO2
capture
Coal input, MW 3945 3945 1444-1573 1444-1573 1500-1544 1500-1544
Boiler type Supercritical Supercritical Subcritical Subcritical
CO2 product pressure,
MPa 1.3 1.3
Heat, MW 15561 1307~13152
Gross power of ST,
MW 8451 845 660 2×300MW 2×300MW
Net power output for
base plant, MW 8112 811 634 5761 576
Heat efficiency, % 601
PC+CC net power
output, MW 621~645 396.9 435.4
Power efficiency,% 43.61 31.1-32.3 40.3%~43.9%1 25.2-27.5 37.3~38.42 28.2-29.0
Efficiency penalty, % 11.3-12.5 15-16 9.1-9.4
COE $/MWh 42.94-47.81 80.88-88.61
CO2 capture cost, $/ton 44-66 52-62 59
Total investment, M$ 396-4622 623-6883 4592 508-5813
Unit investment, $/kW 650-730 1570-1734 796 1167-1335
Performance of China post-combustion projects
COE rises from ¥0.26~0.292/kWh to ¥0.493~0.54/kWh, CO2
capture cost ranges from 44-66 $/ton
15
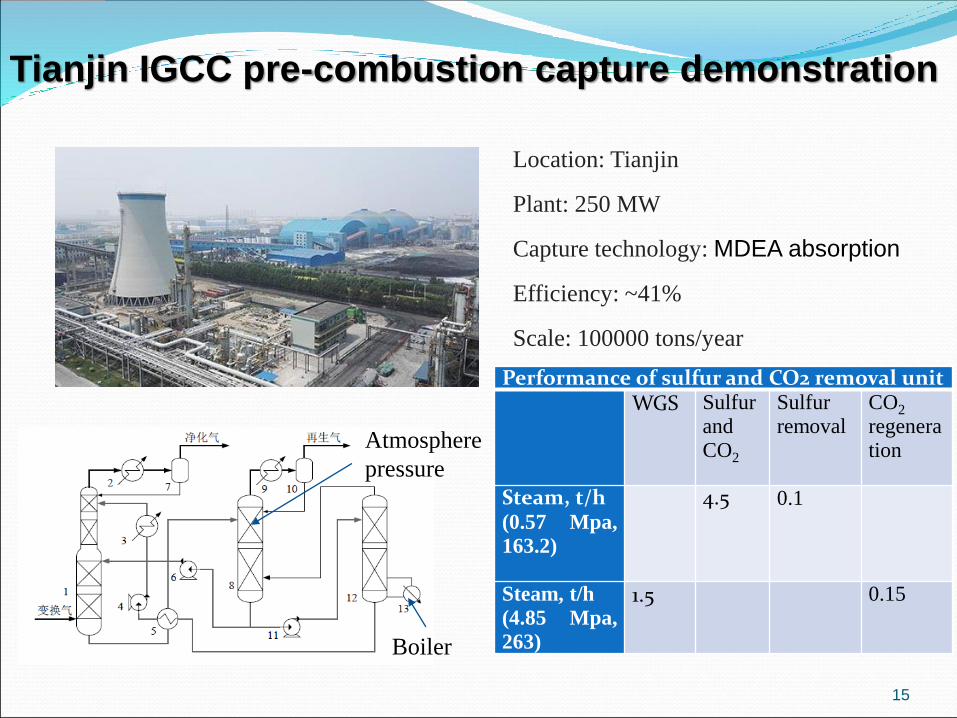
Tianjin IGCC pre-combustion capture demonstration
Location: Tianjin
Plant: 250 MW
Capture technology: MDEA absorption
Efficiency: ~41%
Scale: 100000 tons/year
Atmosphere
pressure
Boiler
Performance of sulfur and CO2 removal unitWGS Sulfur
andCO2
Sulfurremoval
CO2
regeneration
Steam, t/h(0.57 Mpa,
163.2)
4.5 0.1
Steam, t/h
(4.85 Mpa,
263)
1.5 0.15
16
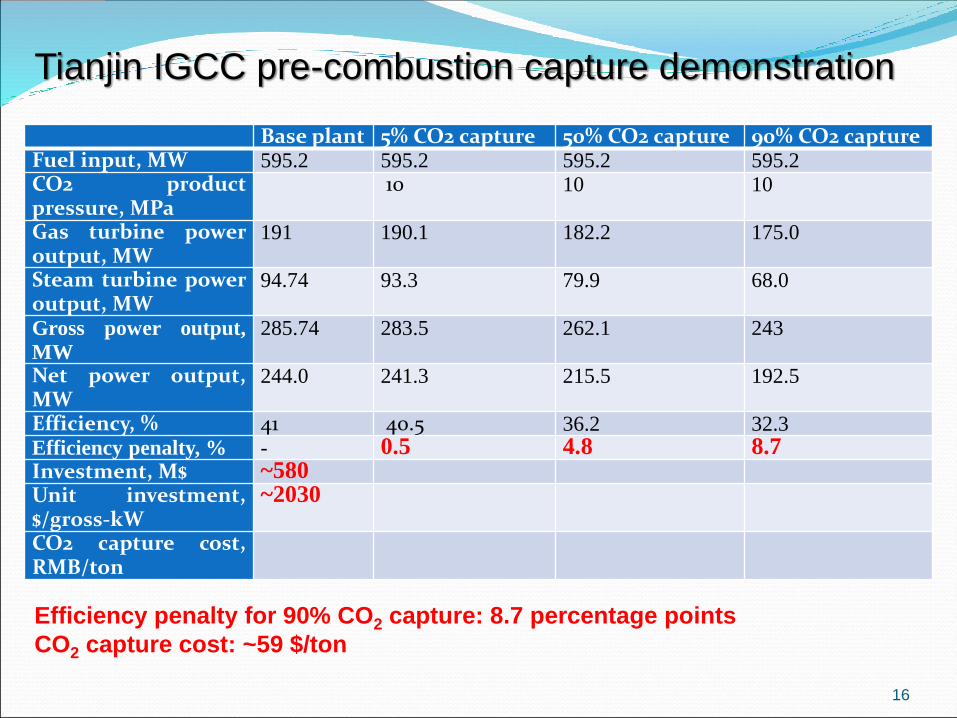
Tianjin IGCC pre-combustion capture demonstration
Base plant 5% CO2 capture 50% CO2 capture 90% CO2 captureFuel input, MW 595.2 595.2 595.2 595.2CO2 productpressure, MPa
10 10 10
Gas turbine poweroutput, MW
191 190.1 182.2 175.0
Steam turbine poweroutput, MW
94.74 93.3 79.9 68.0
Gross power output,
MW
285.74 283.5 262.1 243
Net power output,MW
244.0 241.3 215.5 192.5
Efficiency, % 41 40.5 36.2 32.3Efficiency penalty, % - 0.5 4.8 8.7Investment, M$ ~580Unit investment,$/gross-kW
~2030
CO2 capture cost,RMB/ton
Efficiency penalty for 90% CO2 capture: 8.7 percentage points
CO2 capture cost: ~59 $/ton
17
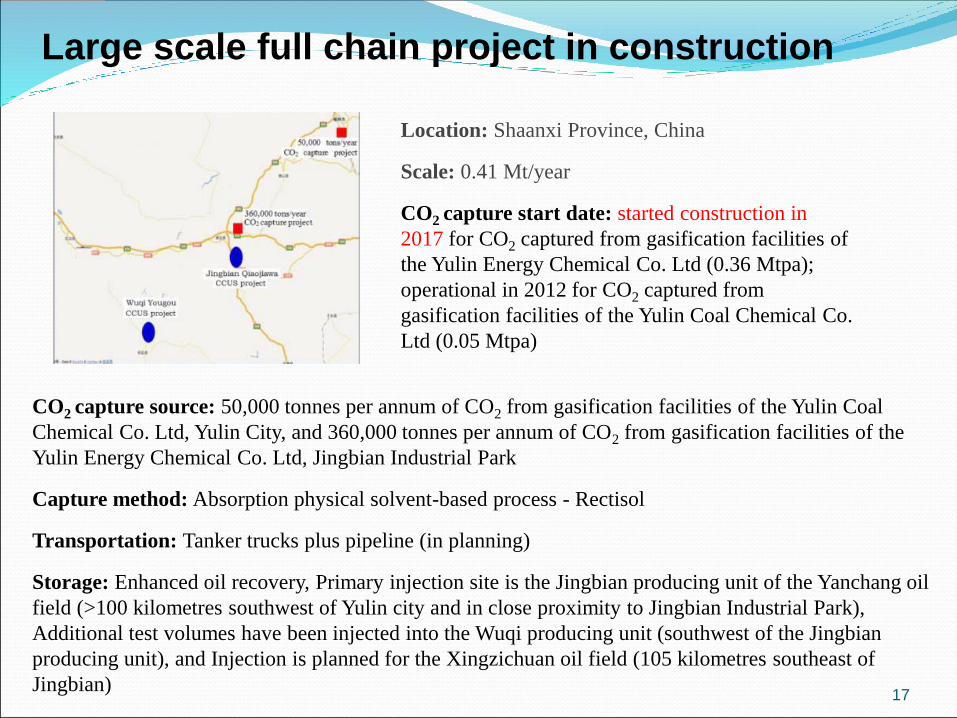
CO2 capture source: 50,000 tonnes per annum of CO2 from gasification facilities of the Yulin Coal
Chemical Co. Ltd, Yulin City, and 360,000 tonnes per annum of CO2 from gasification facilities of the
Yulin Energy Chemical Co. Ltd, Jingbian Industrial Park
Capture method: Absorption physical solvent-based process - Rectisol
Transportation: Tanker trucks plus pipeline (in planning)
Storage: Enhanced oil recovery, Primary injection site is the Jingbian producing unit of the Yanchang oil
field (>100 kilometres southwest of Yulin city and in close proximity to Jingbian Industrial Park),
Additional test volumes have been injected into the Wuqi producing unit (southwest of the Jingbian
producing unit), and Injection is planned for the Xingzichuan oil field (105 kilometres southeast of
Jingbian)
Large scale full chain project in construction
Location: Shaanxi Province, China
Scale: 0.41 Mt/year
CO2 capture start date: started construction in
2017 for CO2 captured from gasification facilities of
the Yulin Energy Chemical Co. Ltd (0.36 Mtpa);
operational in 2012 for CO2 captured from
gasification facilities of the Yulin Coal Chemical Co.
Ltd (0.05 Mtpa)
18
➢ Jilin Oil Field EOR Demonstration has been researching CO2-EOR
operations for a decade and has injected over one million tonnes of
CO2 into the Jilin oil complex.
➢ The Ordos Basin was the subject of a large demonstration scale project
that injected around 300,000 tonnes of CO2 over a three-year period.
➢ The Jingbian Qiaojiawa pilot test started in September 2012 and
as of July 2014, the cumulative injected CO2 reached 17,000 tonnes. After
expansion, the injected CO2 may reach 200,000 tonnes per year, whereas
stored CO2 will reach 120,000 tonnes per year. Furthermore, Yanchang
Petroleum started the second CO2 storage and flooding test area in 2014 in
Wuqi Shaanxi to carry out miscible-phase flooding experiments
CO2 storage activities in China

19
Operation in 2014. 10
Boundary Dam post-combustion CO2 capture project
➢ Location: Boundary Dam
➢ Capacity after retrofit: 160 MW
➢ Capture rate: 1 Mt/year
➢ CO2 utilization: EOR in Weyburn
➢ Final investment: $1.5 billion
Investment share
20
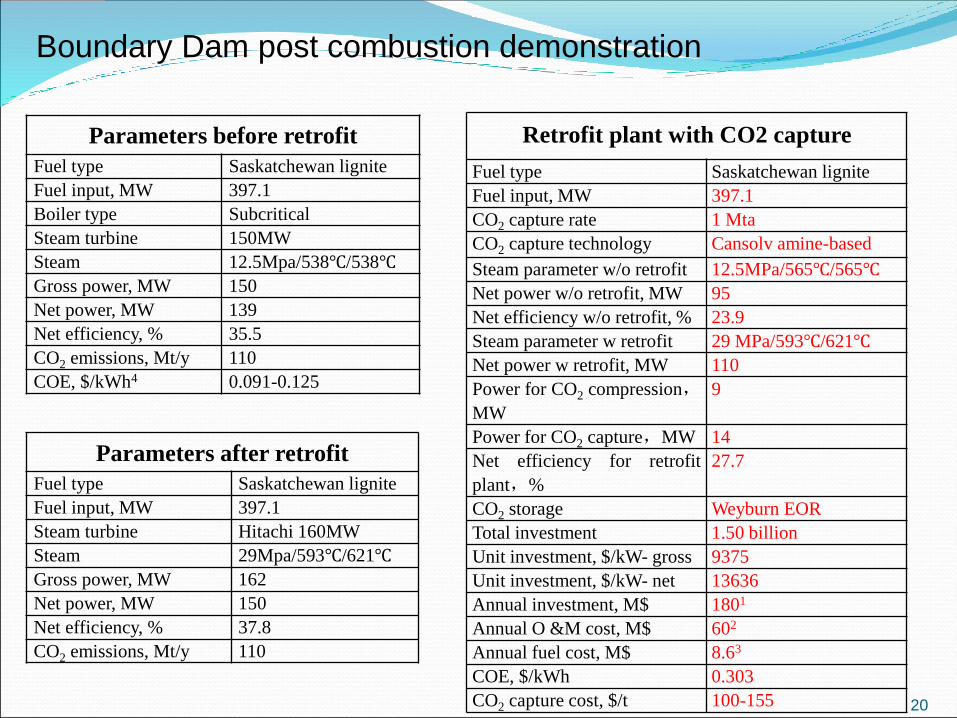
Parameters before retrofit
Fuel type Saskatchewan lignite
Fuel input, MW 397.1
Boiler type Subcritical
Steam turbine 150MW
Steam 12.5Mpa/538℃/538℃
Gross power, MW 150
Net power, MW 139
Net efficiency, % 35.5
CO2 emissions, Mt/y 110
COE, $/kWh4 0.091-0.125
Parameters after retrofit
Fuel type Saskatchewan lignite
Fuel input, MW 397.1
Steam turbine Hitachi 160MW
Steam 29Mpa/593℃/621℃
Gross power, MW 162
Net power, MW 150
Net efficiency, % 37.8
CO2 emissions, Mt/y 110
Retrofit plant with CO2 capture
Fuel type Saskatchewan lignite
Fuel input, MW 397.1
CO2 capture rate 1 Mta
CO2 capture technology Cansolv amine-based
Steam parameter w/o retrofit 12.5MPa/565℃/565℃
Net power w/o retrofit, MW 95
Net efficiency w/o retrofit, % 23.9
Steam parameter w retrofit 29 MPa/593℃/621℃
Net power w retrofit, MW 110
Power for CO2 compression,
MW
9
Power for CO2 capture,MW 14
Net efficiency for retrofit
plant,%
27.7
CO2 storage Weyburn EOR
Total investment 1.50 billion
Unit investment, $/kW- gross 9375
Unit investment, $/kW- net 13636
Annual investment, M$ 1801
Annual O &M cost, M$ 602
Annual fuel cost, M$ 8.63
COE, $/kWh 0.303
CO2 capture cost, $/t 100-155
Boundary Dam post combustion demonstration
21
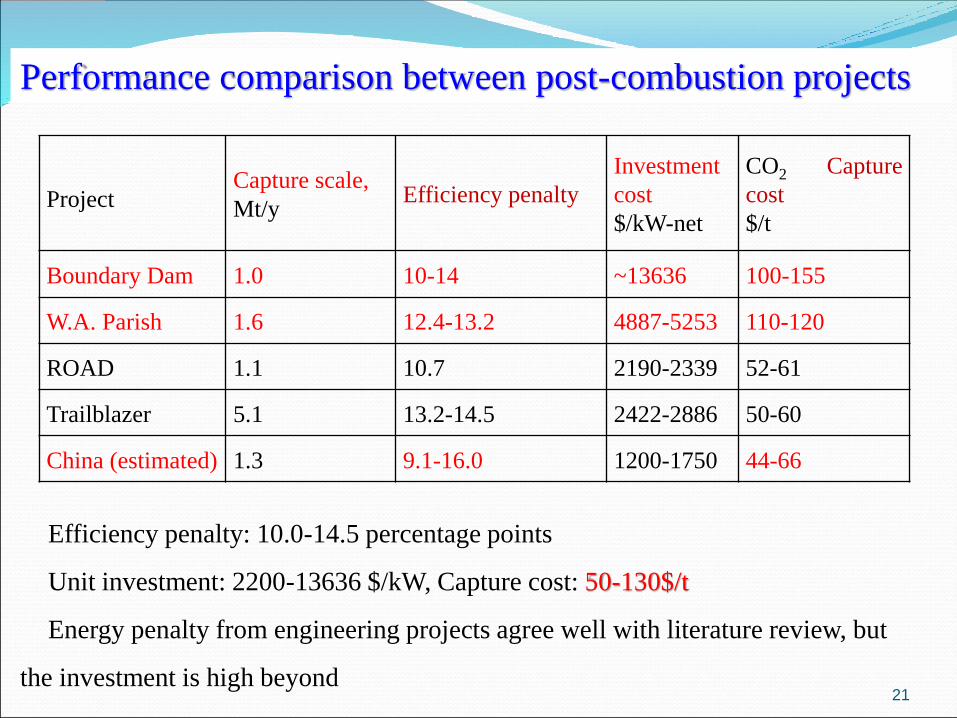
ProjectCapture scale,
Mt/yEfficiency penalty
Investment
cost
$/kW-net
CO2 Capture
cost
$/t
Boundary Dam 1.0 10-14 ~13636 100-155
W.A. Parish 1.6 12.4-13.2 4887-5253 110-120
ROAD 1.1 10.7 2190-2339 52-61
Trailblazer 5.1 13.2-14.5 2422-2886 50-60
China (estimated) 1.3 9.1-16.0 1200-1750 44-66
Efficiency penalty: 10.0-14.5 percentage points
Unit investment: 2200-13636 $/kW, Capture cost: 50-130$/t
Energy penalty from engineering projects agree well with literature review, but
the investment is high beyond
Performance comparison between post-combustion projects
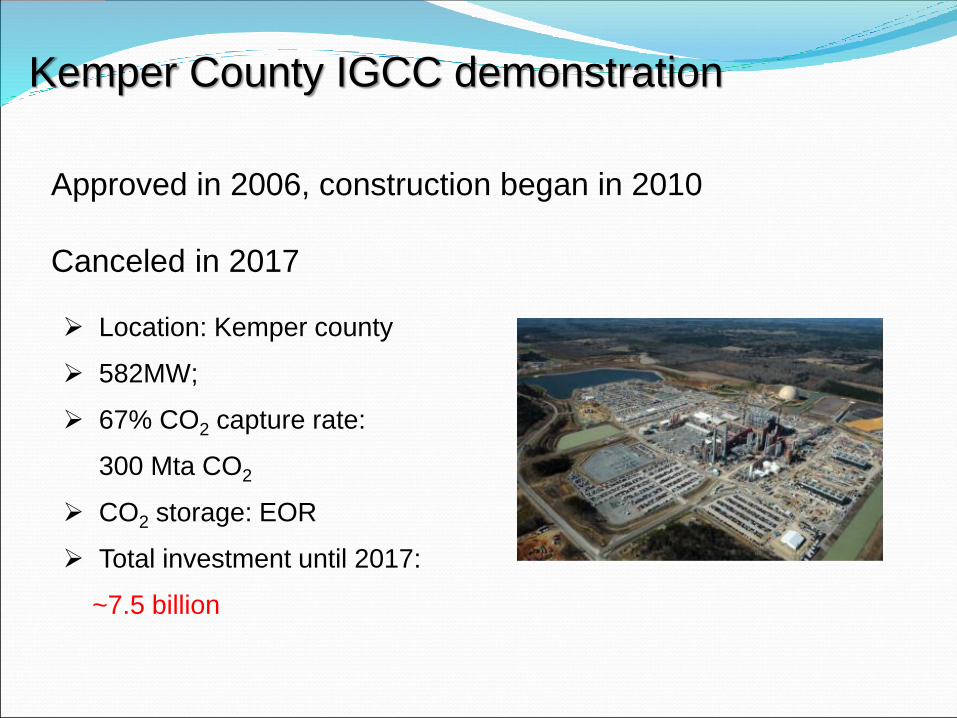
Kemper County IGCC demonstration
➢ Location: Kemper county
➢ 582MW;
➢ 67% CO2 capture rate:
300 Mta CO2
➢ CO2 storage: EOR
➢ Total investment until 2017:
~7.5 billion
Approved in 2006, construction began in 2010
Canceled in 2017
23
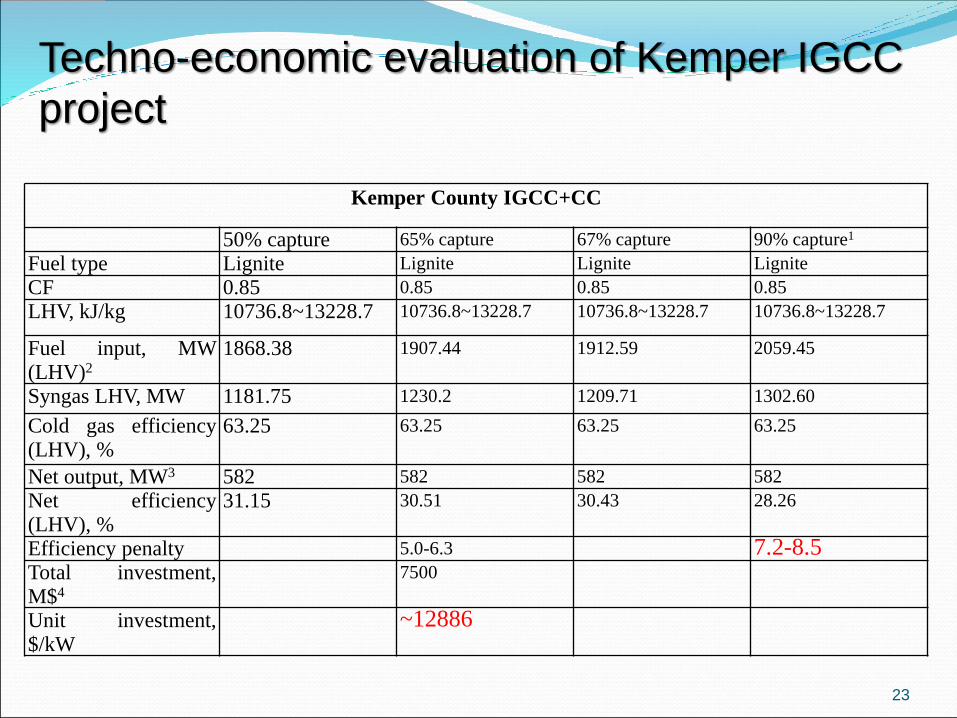
Kemper County IGCC+CC
50% capture 65% capture 67% capture 90% capture1
Fuel type Lignite Lignite Lignite Lignite
CF 0.85 0.85 0.85 0.85
LHV, kJ/kg 10736.8~13228.7 10736.8~13228.7 10736.8~13228.7 10736.8~13228.7
Fuel input, MW(LHV)2
1868.38 1907.44 1912.59 2059.45
Syngas LHV, MW 1181.75 1230.2 1209.71 1302.60
Cold gas efficiency(LHV), %
63.25 63.25 63.25 63.25
Net output, MW3 582 582 582 582
Net efficiency(LHV), %
31.15 30.51 30.43 28.26
Efficiency penalty 5.0-6.3 7.2-8.5Total investment,M$4
7500
Unit investment,$/kW
~12886
Techno-economic evaluation of Kemper IGCC
project

24
Project name Scale, Mt/y Efficiency penalty (90% capture)Investment
$/kW
Kemper County 3.5 7.2-8.5 12886
Huaneng IGCC 2.0 8.7 ~2000 (without CO2 capture)
Technical and economic performance of pre-combustion
capture
Efficiency penalty: 7.2-8.5 for 90% capture, obvious lower than post-combustion
Investment: 12886 $/kW (Tianjin IGCC is around 2000 $/kW without capture)
CO2 capture cost: 75-80 $/t
25
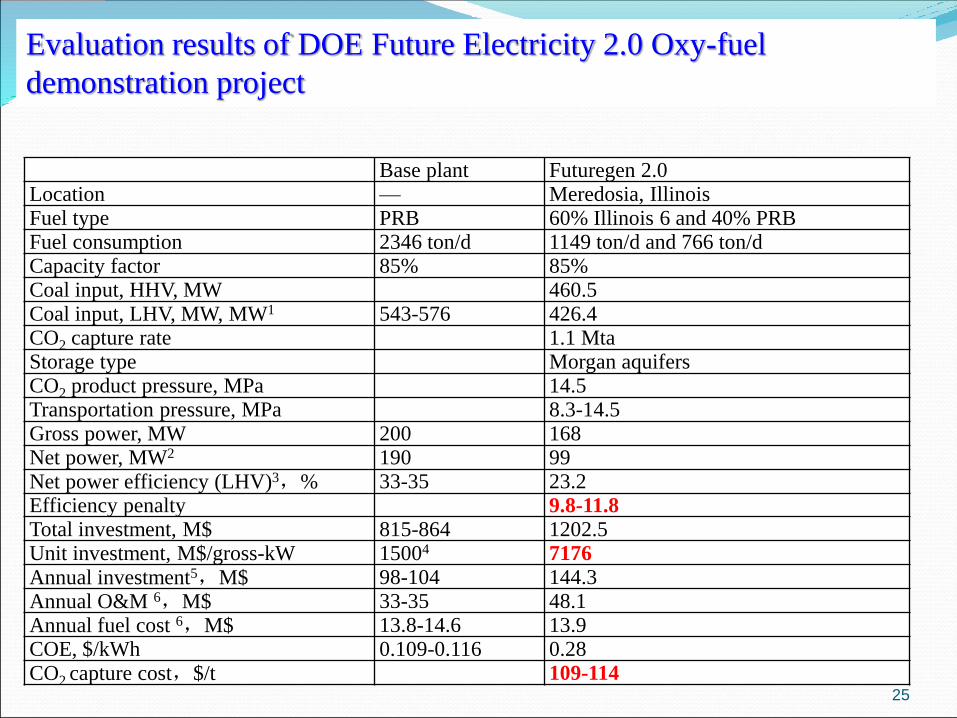
Base plant Futuregen 2.0Location — Meredosia, IllinoisFuel type PRB 60% Illinois 6 and 40% PRBFuel consumption 2346 ton/d 1149 ton/d and 766 ton/dCapacity factor 85% 85%Coal input, HHV, MW 460.5Coal input, LHV, MW, MW1 543-576 426.4CO2 capture rate 1.1 MtaStorage type Morgan aquifersCO2 product pressure, MPa 14.5Transportation pressure, MPa 8.3-14.5Gross power, MW 200 168Net power, MW2 190 99Net power efficiency (LHV)3,% 33-35 23.2Efficiency penalty 9.8-11.8
Total investment, M$ 815-864 1202.5Unit investment, M$/gross-kW 15004 7176
Annual investment5,M$ 98-104 144.3Annual O&M 6,M$ 33-35 48.1Annual fuel cost 6,M$ 13.8-14.6 13.9COE, $/kWh 0.109-0.116 0.28CO2 capture cost,$/t 109-114
Evaluation results of DOE Future Electricity 2.0 Oxy-fuel
demonstration project
26
Project name Capture scale,
Mt/y
Efficiency
penalty for
90% capture
Investment,
$/kW
CO2 capture cost, $/t
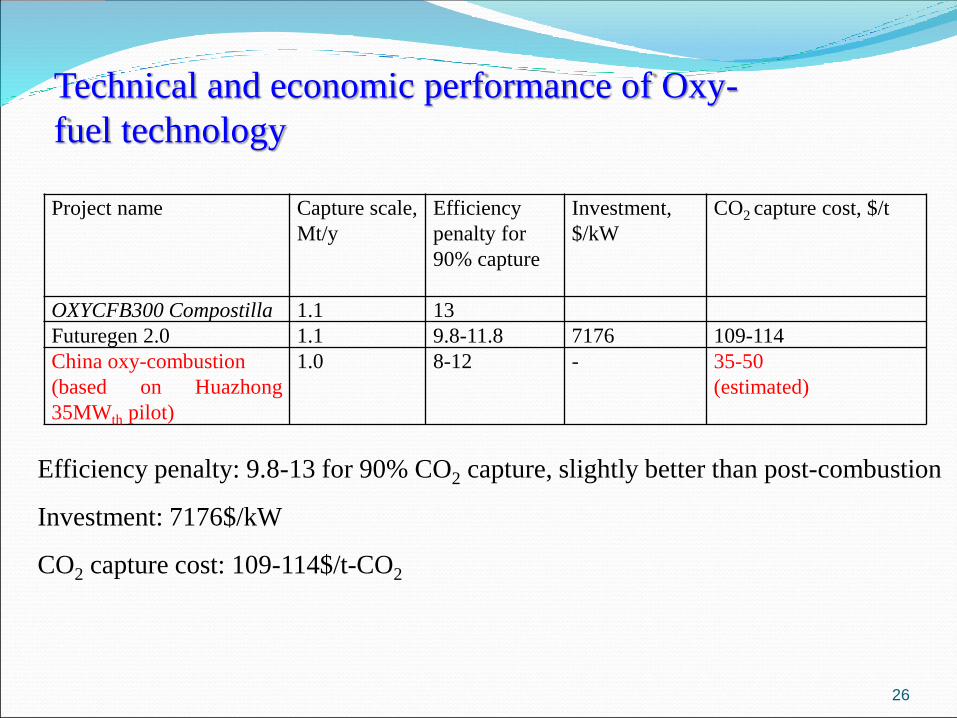
OXYCFB300 Compostilla 1.1 13
Futuregen 2.0 1.1 9.8-11.8 7176 109-114
China oxy-combustion
(based on Huazhong
35MWth pilot)
1.0 8-12 - 35-50
(estimated)
Technical and economic performance of Oxy-
fuel technology
Efficiency penalty: 9.8-13 for 90% CO2 capture, slightly better than post-combustion
Investment: 7176$/kW
CO2 capture cost: 109-114$/t-CO2
2. Problems and lessons of current CCS
demonstration

28
Problems and lessons from early CCS
demonstration
1. For coal-relied China, CCS can make great contribution to CO2
reduction.
2. The deployment of the CCS is behind expectation, and the cost of
demo projects are far beyond the theoretical prediction. Rather high
cost is the main barrier for CCS deployment.
3. The cost of domestic projects are much lower than that of
international projects. Even so, the additional energy consumption
and cost are unacceptable to key stakeholders.
4. To the present, there is no success international demo that China
can follow. China has to find it’s own path.
29
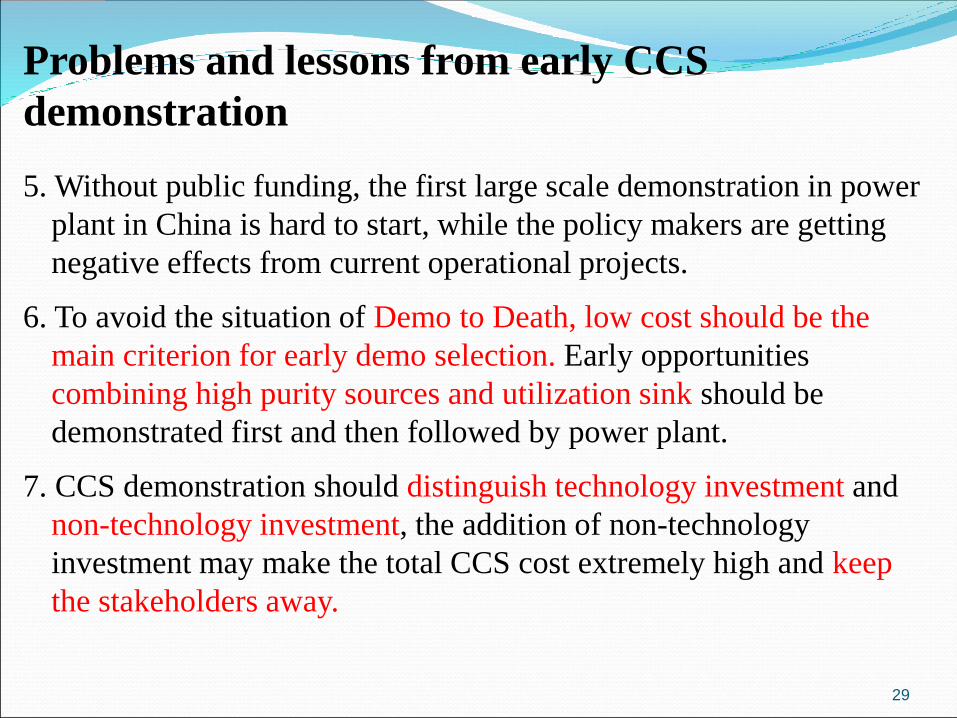
5. Without public funding, the first large scale demonstration in power
plant in China is hard to start, while the policy makers are getting
negative effects from current operational projects.
6. To avoid the situation of Demo to Death, low cost should be the
main criterion for early demo selection. Early opportunities
combining high purity sources and utilization sink should be
demonstrated first and then followed by power plant.
7. CCS demonstration should distinguish technology investment and
non-technology investment, the addition of non-technology
investment may make the total CCS cost extremely high and keep
the stakeholders away.
Problems and lessons from early CCS
demonstration
30
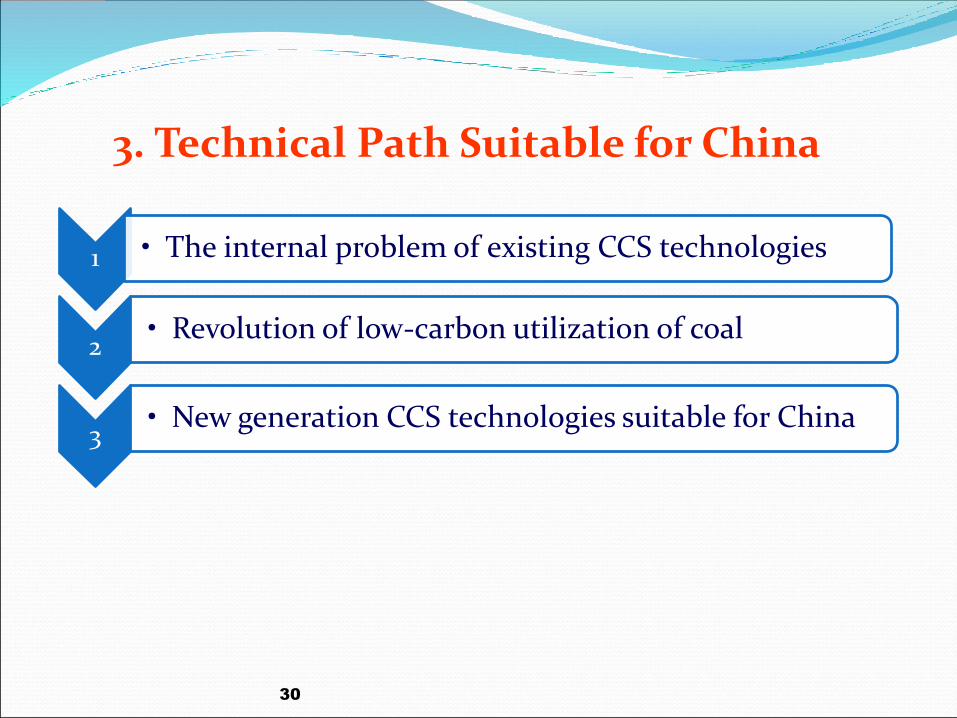
3. Technical Path Suitable for China
1 • The internal problem of existing CCS technologies
2• Revolution of low-carbon utilization of coal
3• New generation CCS technologies suitable for China
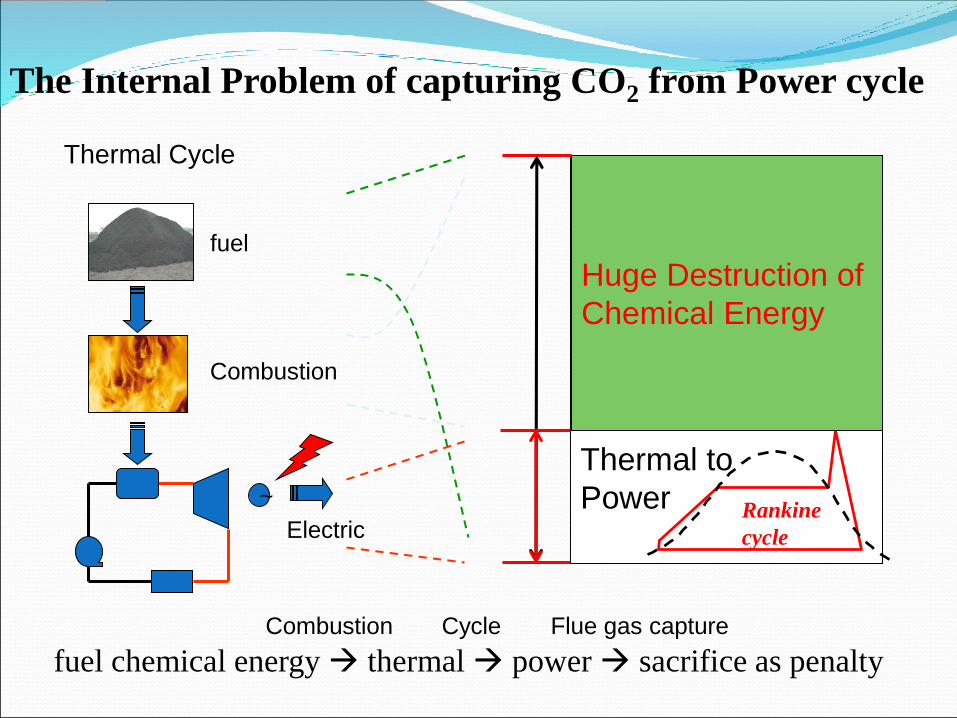
Thermal Cycle
fuel
Fuel
available workCombustion
~
ElectricRankine
cycle
Huge Destruction of
Chemical Energy
Thermal to
Power
fuel chemical energy thermal power sacrifice as penalty
The Internal Problem of capturing CO2 from Power cycle
Combustion Cycle Flue gas capture
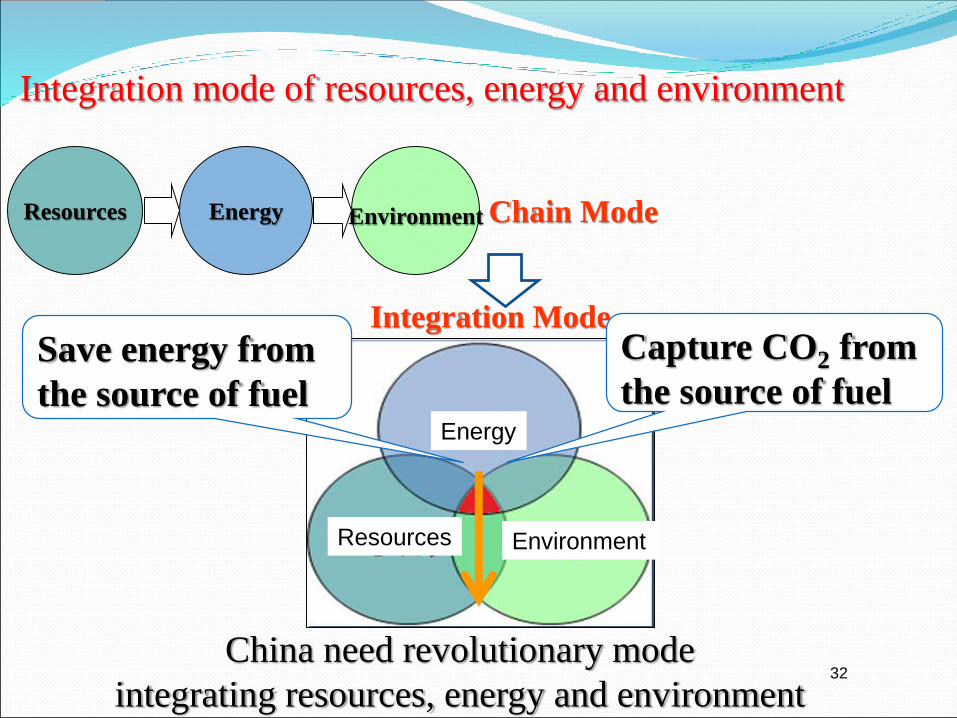
Resources EnvironmentEnergy Chain Mode
Integration ModeCapture CO2 from
the source of fuel
Save energy from
the source of fuel
32China need revolutionary mode
integrating resources, energy and environment
Integration mode of resources, energy and environment
Energy
Resources Environment

33
T
T01
H
H
Fuel Conversion
Chemical Energy
Flue Gas Capture
CO2
Capture CO2 from fuel source with chemical energy as driving forceCapture from Source
Sacrifice the Power Output
Breakthrough
Direction:
Chemical Energy Cascade
Utilization before combustion
Capture CO2 from the fuel source
where COX is concentrated
From Chain mode to Integration mode
from Flue gas to Fuel source
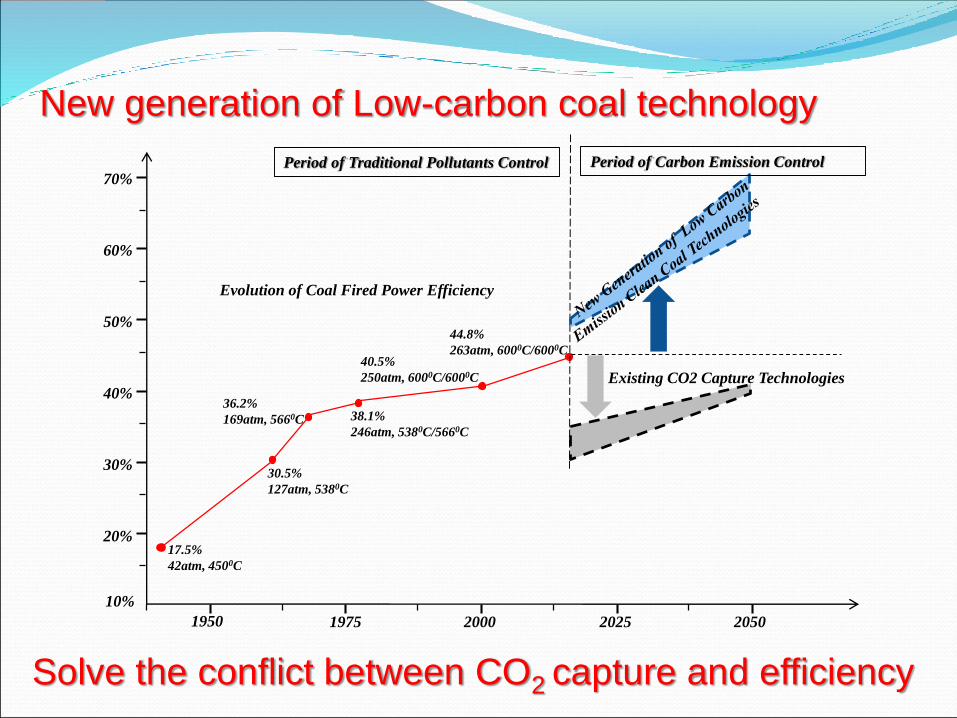
1950 1975 2000 2025 2050
20%
30%
40%
50%
60%
70%
10%
17.5%
42atm, 4500C
30.5%
127atm, 5380C
36.2%
169atm, 5660C 38.1%
246atm, 5380C/5660C
40.5%
250atm, 6000C/6000C
44.8%
263atm, 6000C/6000C
Evolution of Coal Fired Power Efficiency
Existing CO2 Capture Technologies
Period of Traditional Pollutants Control Period of Carbon Emission Control
New generation of Low-carbon coal technology
Solve the conflict between CO2 capture and efficiency
35
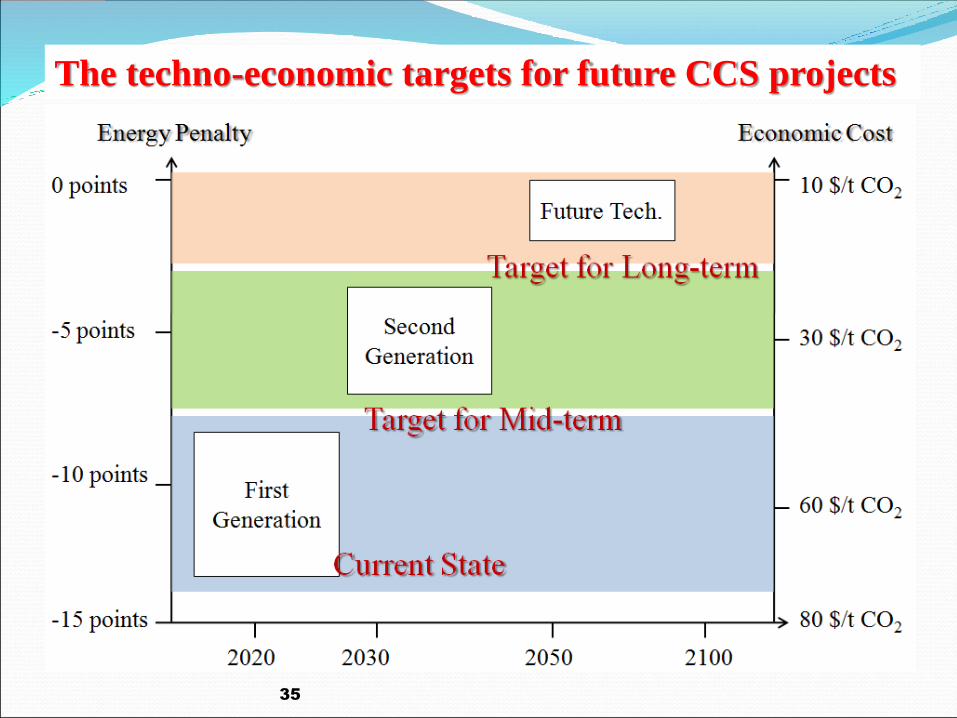
The techno-economic targets for future CCS projects
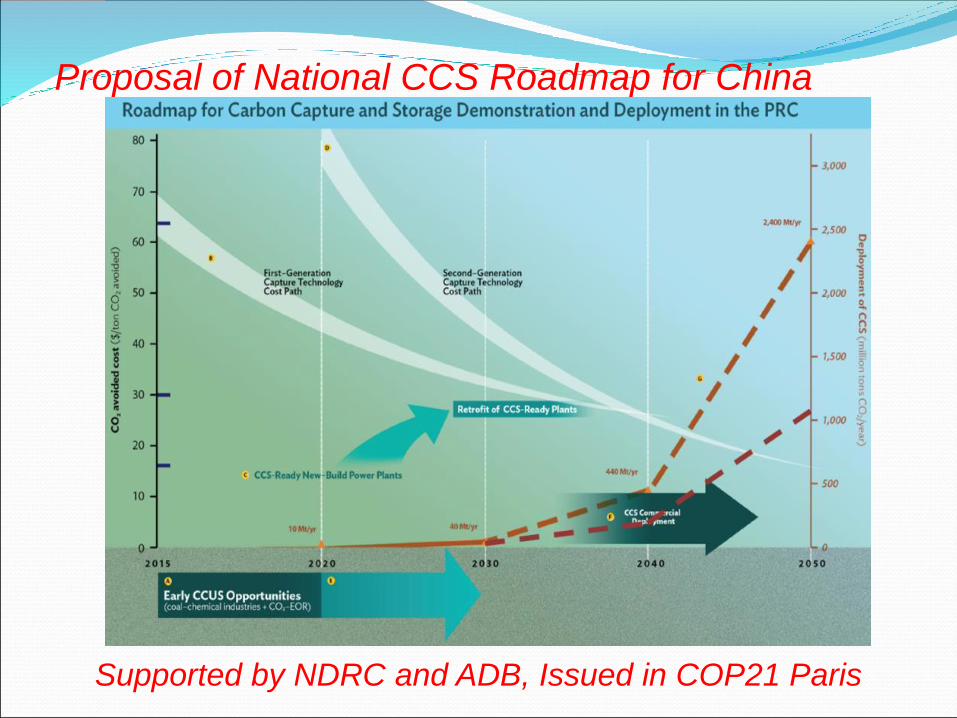
Proposal of National CCS Roadmap for China
Supported by NDRC and ADB, Issued in COP21 Paris
37
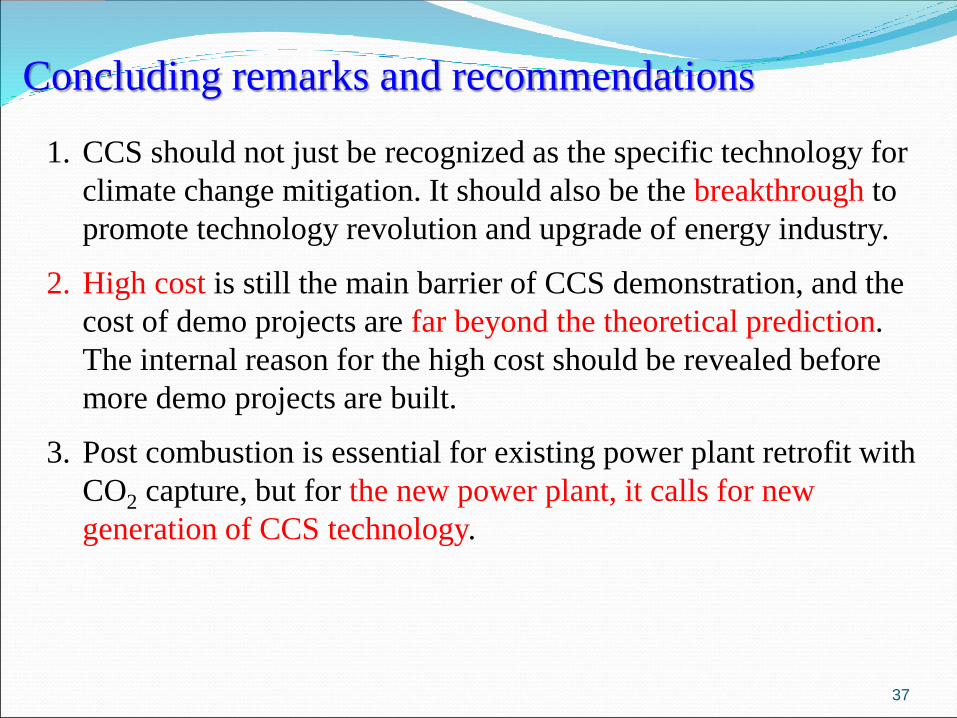
Concluding remarks and recommendations
1. CCS should not just be recognized as the specific technology for
climate change mitigation. It should also be the breakthrough to
promote technology revolution and upgrade of energy industry.
2. High cost is still the main barrier of CCS demonstration, and the
cost of demo projects are far beyond the theoretical prediction.
The internal reason for the high cost should be revealed before
more demo projects are built.
3. Post combustion is essential for existing power plant retrofit with
CO2 capture, but for the new power plant, it calls for new
generation of CCS technology.

38
Near term demonstration projects:
• Build a national data base of current and planned CCS projects.
Develop and publish principles for early demonstration projects
assessment and support.
• Reinforce regulations and support policies. During 2020~2030,
regulations, support policies, and technical standards for CCS projects
and CO2-EOR operations will need further refinement.
• Select and endorse priority regions, including the Ordos Basin, the
Songliao Basin in Northeastern PRC, the Jungar Basin in
Northwestern PRC, and the Tarim Basin.
• Provide fiscal and financial support for first-mover projects, like direct
capital grants, resource tax relief specific for EOR, an electricity price
subsidy and tax relief, government-supported contract-for-difference
(CFD), etc..
• For the 2015~2020 period, the targeted outcomes should therefore be
5~10 CCS demonstration projects in the coal chemical sector and 1~3
projects in the power generation.
Concluding remarks and recommendations
39
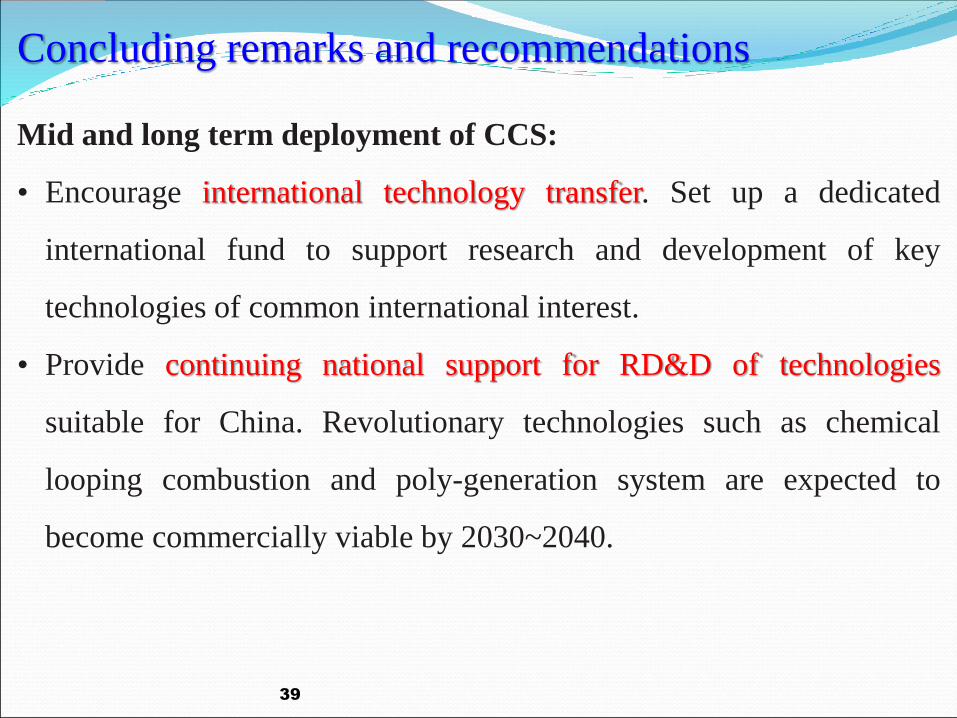
Mid and long term deployment of CCS:
• Encourage international technology transfer. Set up a dedicated
international fund to support research and development of key
technologies of common international interest.
• Provide continuing national support for RD&D of technologies
suitable for China. Revolutionary technologies such as chemical
looping combustion and poly-generation system are expected to
become commercially viable by 2030~2040.
Concluding remarks and recommendations

40
Economic
s
Energy
Environ.
THANKS!
41
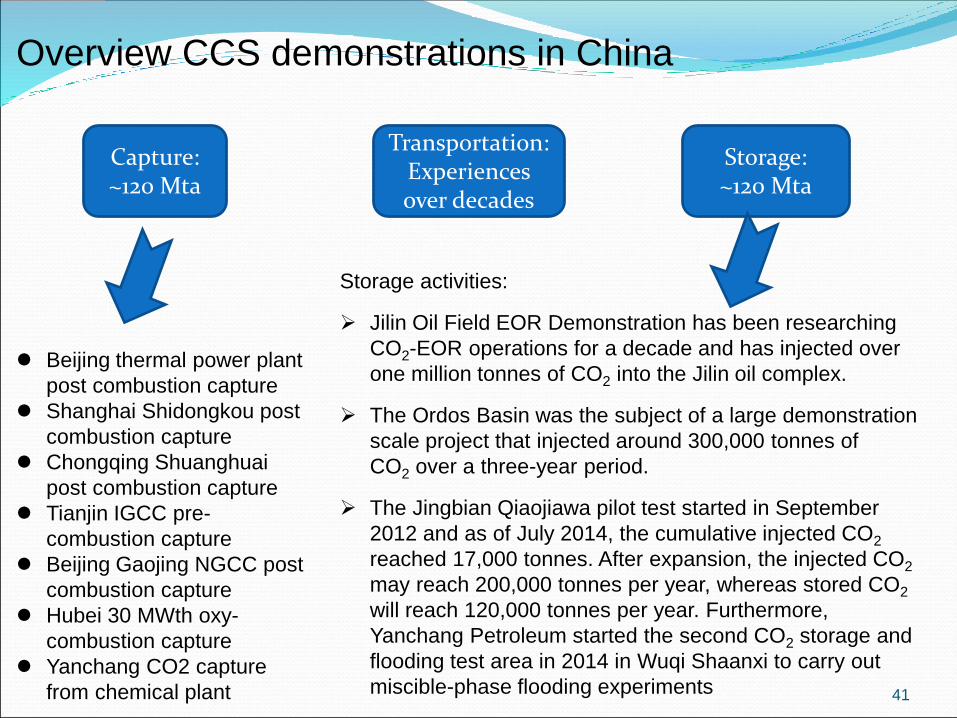
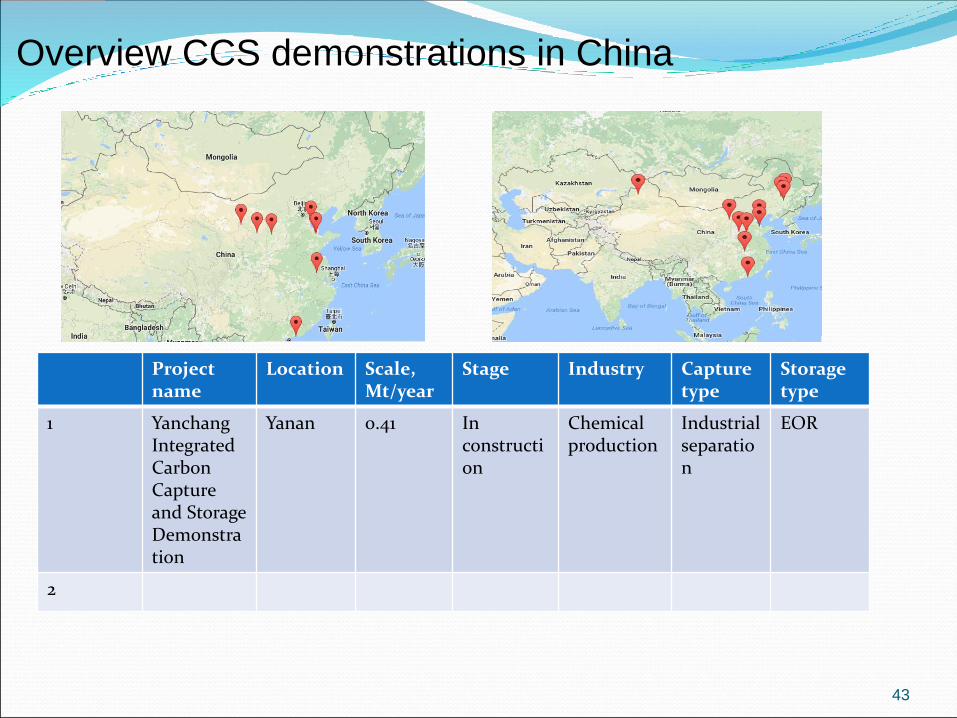
Overview CCS demonstrations in China
Capture: ~120 Mta
Storage: ~120 Mta
Storage activities:
➢ Jilin Oil Field EOR Demonstration has been researching
CO2-EOR operations for a decade and has injected over
one million tonnes of CO2 into the Jilin oil complex.
➢ The Ordos Basin was the subject of a large demonstration
scale project that injected around 300,000 tonnes of
CO2 over a three-year period.
➢ The Jingbian Qiaojiawa pilot test started in September
2012 and as of July 2014, the cumulative injected CO2
reached 17,000 tonnes. After expansion, the injected CO2
may reach 200,000 tonnes per year, whereas stored CO2
will reach 120,000 tonnes per year. Furthermore,
Yanchang Petroleum started the second CO2 storage and
flooding test area in 2014 in Wuqi Shaanxi to carry out
miscible-phase flooding experiments
Beijing thermal power plant
post combustion capture
Shanghai Shidongkou post
combustion capture
Chongqing Shuanghuai
post combustion capture
Tianjin IGCC pre-
combustion capture
Beijing Gaojing NGCC post
combustion capture
Hubei 30 MWth oxy-
combustion capture
Yanchang CO2 capture
from chemical plant
Transportation: Experiences over decades

42
Project name Project stage Location IndustryCapture capacity Capture type
Yanchang Integrated Carbon Capture and Storage Demonstration
In Construction Shaanxi Province Chemical Production 0.4 Mtpa Industrial Separation
Sinopec Qilu Petrochemical CCSAdvanced Development Shandong Province Chemical Production 0.5 Mtpa Industrial Separation
Sinopec Shengli Power Plant CCSAdvanced Development
Dongying City, Shandong Province Power Generation 1 Mtpa Post-combustion capture
Sinopec Eastern China CCSEarly Development Jiangsu Province Fertiliser Production 0.5 Mtpa Industrial Separation
China Resources Power (Haifeng) Integrated Carbon Capture and Sequestration Demonstration
Early Development
Shanwei City, Guangdong Province Power Generation 1 Mtpa Post-combustion capture
Huaneng GreenGen IGCC Large-scale System (Phase 3)Early Development
Lingang Industrial Park, Binhai New Area, Tianjin Power Generation 2 Mtpa Pre-combustion capture (gasification)
Shanxi International Energy Group CCUSEarly Development Shanxi Province Power Generation 2 Mtpa Oxy-fuel combustion capture
Shenhua Ningxia CTLEarly Development
Ningxia Hui Autonomous Region Coal-to-liquids (CTL) 2 Mtpa Industrial Separation
Daqing Oil Field EOR Demonstration Project Operational Heilongjiang ProvinceVarious, including natural gas processing 200,000 tpa
Pre-combustion capture (for natural gas processing capture component)
Jilin Oil Field EOR Demonstration Project Operational Jilin Province Natural gas processing300,000 –330,000 tpa
Pre-combustion capture (natural gas processing)
Karamay Dunhua Oil Technology CCUS EOR Project Operational Karamay city Chemical production 100,000 tpa Industrial separationShenhua Group Ordos Carbon Capture and Storage (CCS) Demonstration Project Completed Inner Mongolia Coal-to-liquids (CTL) 100,000 tpa Pre-combustion (cryogenic)Huaneng GreenGen IGCC Demonstration-scale System (Phase 2)
In Construction Tianjin Power generation
60,000 -100,000 tpa Pre-combustion capture (gasification)
Sinopec Shengli Oilfield Carbon Capture Utilization and Storage Pilot Project Operational Shandong Province Power generation
30,000 –40,000 tpa Post-combustion
Sinopec Zhongyuan Carbon Capture Utilization and Storage Pilot Project Operational Henan Province Chemical production 120,000 tpa Industrial separation
Haifeng Carbon Capture Test PlatformIn Construction Guangdong Province - 25550 tpa -
Huazhong University of Science and Technology Oxy-fuel Project
In Construction Hubei Province - 100,000 tpa Oxy-fuel combustion
Australia-China Post Combustion Capture (PCC) Feasibility Study Project
Advanced Development Jilin Province Power generation 1 Mtpa Post-combustion
China Coalbed Methane Technology Sequestration Project Completed Shanxi Province - - -Huaneng Shidongkou post combustion Operational Shanghai Power generation 120000 tpa Post-combustionHuaneng Beijing Thermal power plant Operational Beijing Power generation 3000 tpa Post-combustionChongqing Shuanghuai power plant Operational Chongqing Power generation 10000 tpa Post-combustion
Beijing Gaojing NGCC power plantConstruction finished Beijing Power generation
1300~1500 tpa Post-combustion
43
Projectname
Location Scale, Mt/year
Stage Industry Capturetype
Storagetype
1 Yanchang Integrated Carbon Capture and Storage Demonstration
Yanan 0.41 In construction
Chemical production
Industrialseparation
EOR
2
Overview CCS demonstrations in China
44
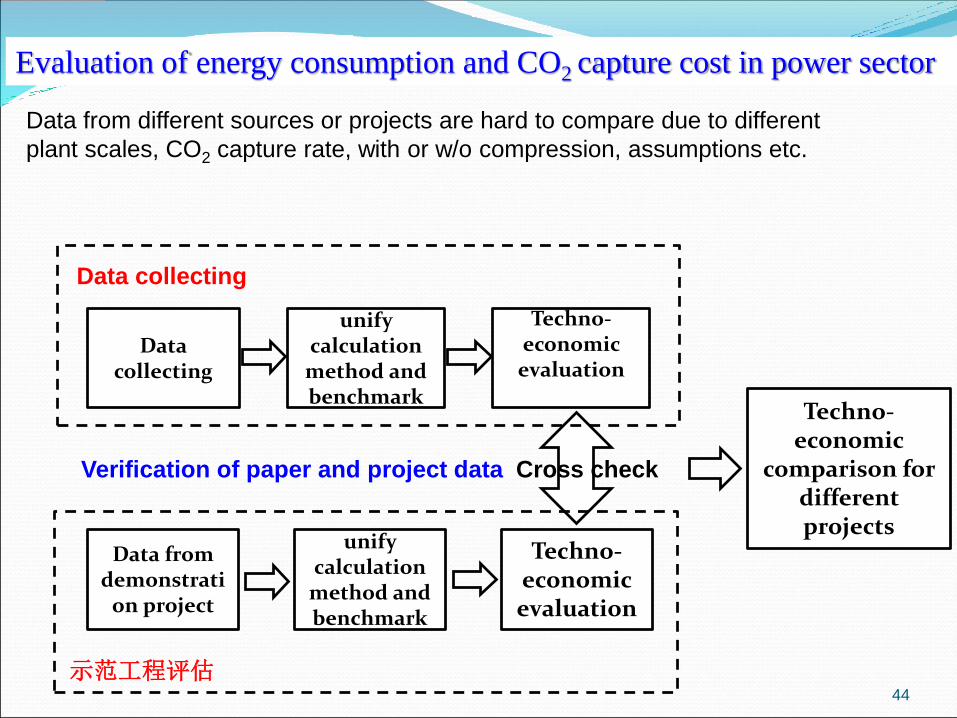
Evaluation of energy consumption and CO2 capture cost in power sector
Data collecting
unify calculation
method and benchmark
Techno-economic evaluation
Techno-economic
comparison for different projects
Data from demonstrati
on project
unify calculation
method and benchmark
Techno-economic evaluation
Verification of paper and project data Cross check
Data collecting
示范工程评估
Data from different sources or projects are hard to compare due to different
plant scales, CO2 capture rate, with or w/o compression, assumptions etc.

45
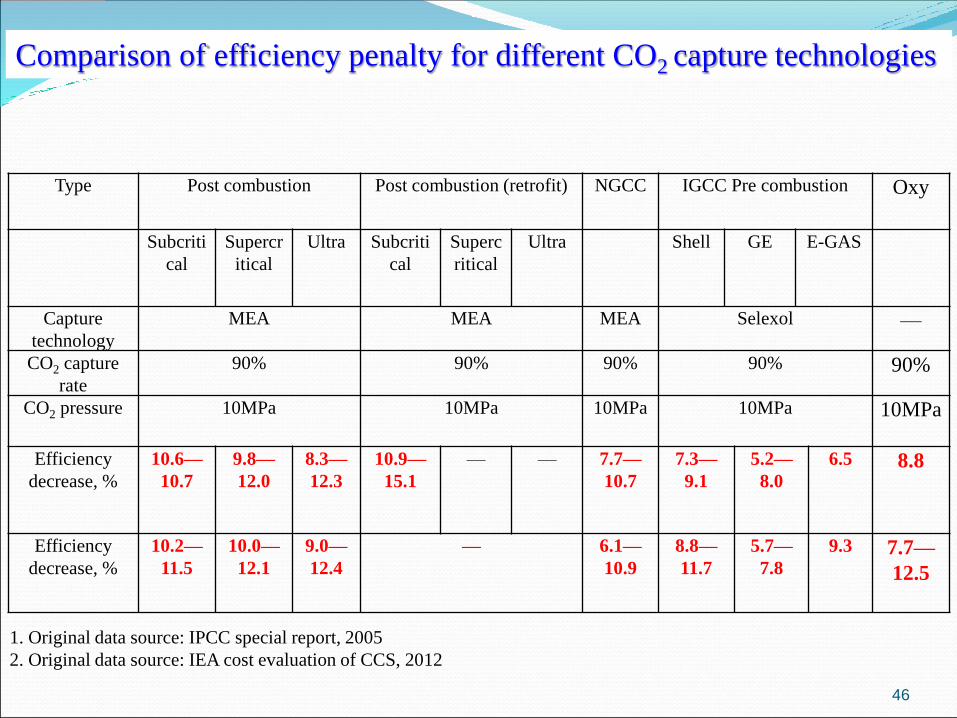
Comparable analysis and Identify of literature data
46
Type Post combustion Post combustion (retrofit) NGCC IGCC Pre combustion Oxy
Subcriti
cal
Supercr
itical
Ultra Subcriti
cal
Superc
ritical
Ultra Shell GE E-GAS
Capture
technology
MEA MEA MEA Selexol —
CO2 capture
rate
90% 90% 90% 90% 90%
CO2 pressure 10MPa 10MPa 10MPa 10MPa 10MPa
Efficiency
decrease, %
10.6—
10.7
9.8—
12.0
8.3—
12.3
10.9—
15.1
— — 7.7—
10.7
7.3—
9.1
5.2—
8.0
6.5 8.8
Efficiency
decrease, %
10.2—
11.5
10.0—
12.1
9.0—
12.4
— 6.1—
10.9
8.8—
11.7
5.7—
7.8
9.3 7.7—
12.5
Comparison of efficiency penalty for different CO2 capture technologies
1. Original data source: IPCC special report, 2005
2. Original data source: IEA cost evaluation of CCS, 2012
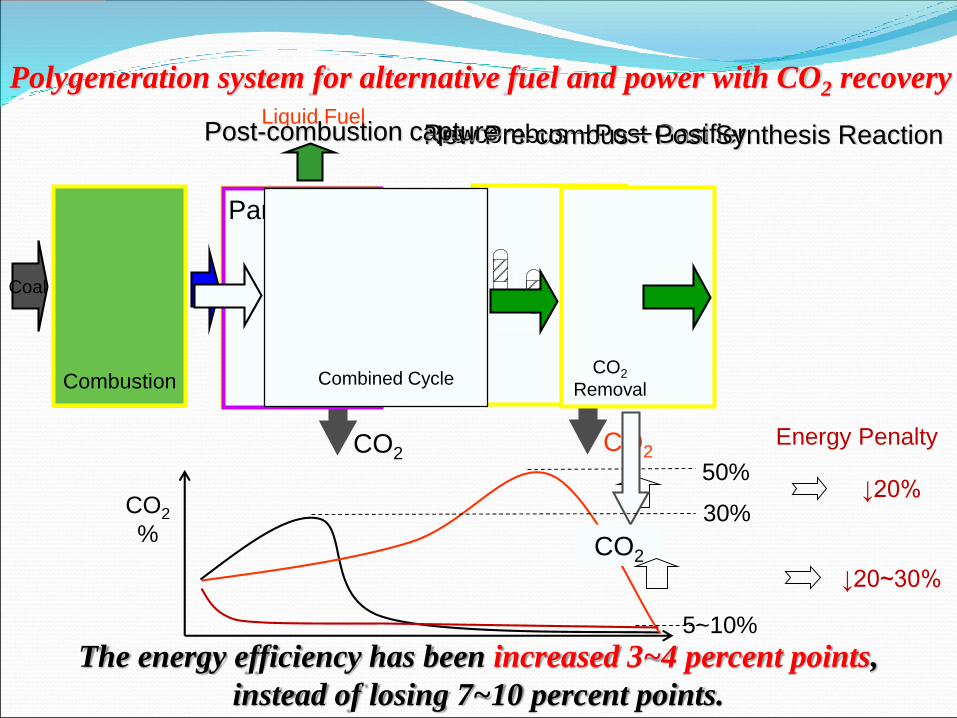
Polygeneration system for alternative fuel and power with CO2 recovery
Coal
CO2
Removal
CO2
Pre-combus-Post Gasifier
CO2
%
Gasification
50% ↓20%
New Pre-combus-Post Synthesis Reaction
Partial Cycle
Liquid Fuel
CO2
5~10%
Combined CycleCombustionCO2
Removal
CO2
30%
↓20~30%
Energy Penalty
Post-combustion capture
The energy efficiency has been increased 3~4 percent points,
instead of losing 7~10 percent points.
48
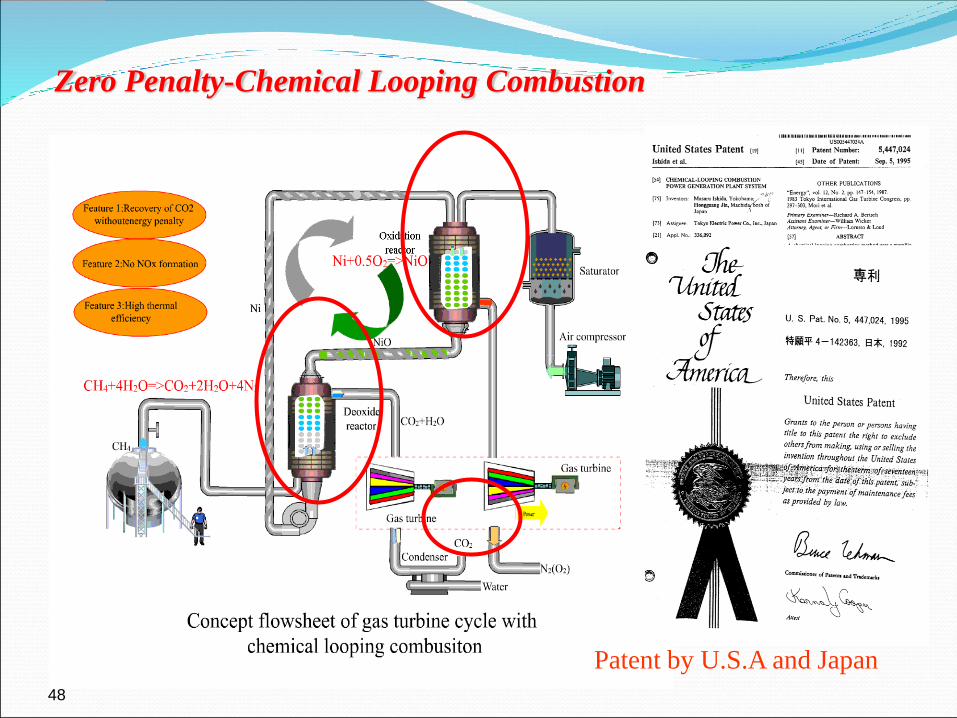
Zero Penalty-Chemical Looping Combustion
Patent by U.S.A and Japan

Revolutionary impact on Energy & Environment of China
Resolve the conflict between energy saving and CCS

50
20% for the sulfur removal unit
investment, estimated
51
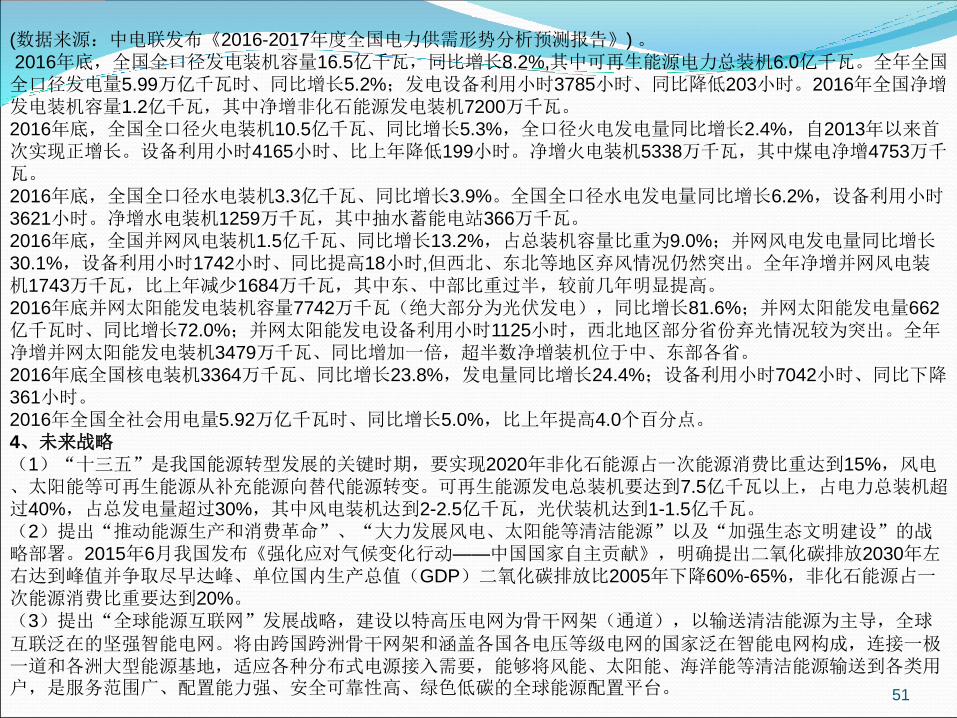
(数据来源:中电联发布《2016-2017年度全国电力供需形势分析预测报告》) 。2016年底,全国全口径发电装机容量16.5亿千瓦,同比增长8.2%,其中可再生能源电力总装机6.0亿千瓦。全年全国全口径发电量5.99万亿千瓦时、同比增长5.2%;发电设备利用小时3785小时、同比降低203小时。2016年全国净增发电装机容量1.2亿千瓦,其中净增非化石能源发电装机7200万千瓦。2016年底,全国全口径火电装机10.5亿千瓦、同比增长5.3%,全口径火电发电量同比增长2.4%,自2013年以来首次实现正增长。设备利用小时4165小时、比上年降低199小时。净增火电装机5338万千瓦,其中煤电净增4753万千瓦。2016年底,全国全口径水电装机3.3亿千瓦、同比增长3.9%。全国全口径水电发电量同比增长6.2%,设备利用小时3621小时。净增水电装机1259万千瓦,其中抽水蓄能电站366万千瓦。2016年底,全国并网风电装机1.5亿千瓦、同比增长13.2%,占总装机容量比重为9.0%;并网风电发电量同比增长30.1%,设备利用小时1742小时、同比提高18小时,但西北、东北等地区弃风情况仍然突出。全年净增并网风电装机1743万千瓦,比上年减少1684万千瓦,其中东、中部比重过半,较前几年明显提高。2016年底并网太阳能发电装机容量7742万千瓦(绝大部分为光伏发电),同比增长81.6%;并网太阳能发电量662
亿千瓦时、同比增长72.0%;并网太阳能发电设备利用小时1125小时,西北地区部分省份弃光情况较为突出。全年净增并网太阳能发电装机3479万千瓦、同比增加一倍,超半数净增装机位于中、东部各省。2016年底全国核电装机3364万千瓦、同比增长23.8%,发电量同比增长24.4%;设备利用小时7042小时、同比下降361小时。2016年全国全社会用电量5.92万亿千瓦时、同比增长5.0%,比上年提高4.0个百分点。4、未来战略(1)“十三五”是我国能源转型发展的关键时期,要实现2020年非化石能源占一次能源消费比重达到15%,风电、太阳能等可再生能源从补充能源向替代能源转变。可再生能源发电总装机要达到7.5亿千瓦以上,占电力总装机超过40%,占总发电量超过30%,其中风电装机达到2-2.5亿千瓦,光伏装机达到1-1.5亿千瓦。(2)提出“推动能源生产和消费革命”、“大力发展风电、太阳能等清洁能源”以及“加强生态文明建设”的战略部署。2015年6月我国发布《强化应对气候变化行动——中国国家自主贡献》,明确提出二氧化碳排放2030年左右达到峰值并争取尽早达峰、单位国内生产总值(GDP)二氧化碳排放比2005年下降60%-65%,非化石能源占一次能源消费比重要达到20%。(3)提出“全球能源互联网”发展战略,建设以特高压电网为骨干网架(通道),以输送清洁能源为主导,全球互联泛在的坚强智能电网。将由跨国跨洲骨干网架和涵盖各国各电压等级电网的国家泛在智能电网构成,连接一极一道和各洲大型能源基地,适应各种分布式电源接入需要,能够将风能、太阳能、海洋能等清洁能源输送到各类用户,是服务范围广、配置能力强、安全可靠性高、绿色低碳的全球能源配置平台。
52
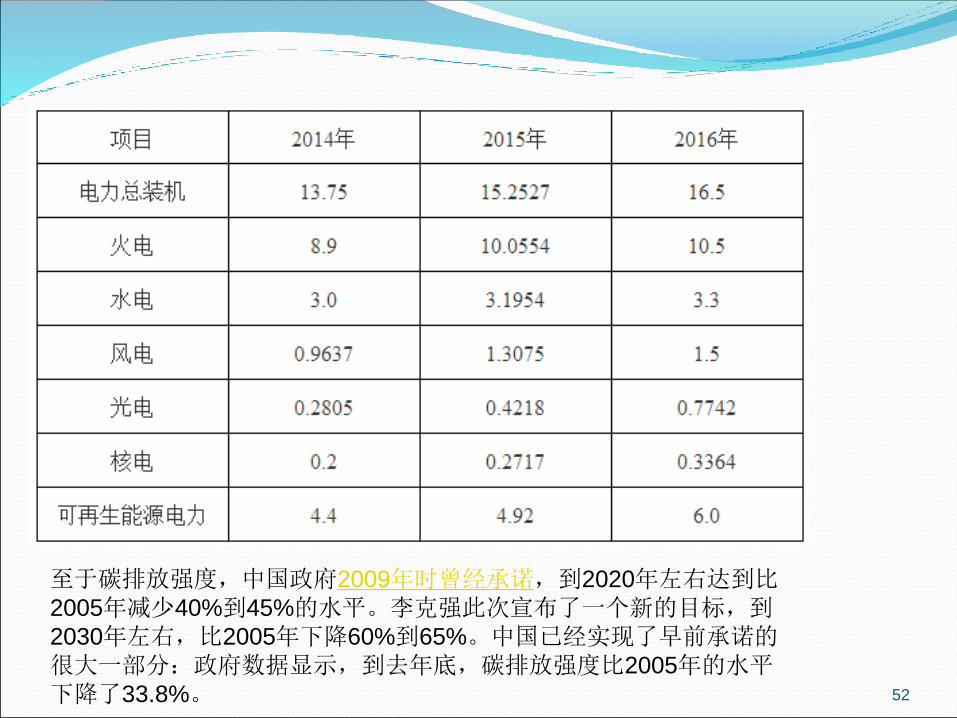
至于碳排放强度,中国政府2009年时曾经承诺,到2020年左右达到比2005年减少40%到45%的水平。李克强此次宣布了一个新的目标,到2030年左右,比2005年下降60%到65%。中国已经实现了早前承诺的很大一部分:政府数据显示,到去年底,碳排放强度比2005年的水平下降了33.8%。

53
Related Documents