ADVANCED HEALTH INFORMATION SHARING WITH WEB-BASED GIS SHENG GAO March 2010 TECHNICAL REPORT NO. 272

Welcome message from author
This document is posted to help you gain knowledge. Please leave a comment to let me know what you think about it! Share it to your friends and learn new things together.
Transcript

ADVANCED HEALTH INFORMATION SHARING WITH
WEB-BASED GIS
SHENG GAO
March 2010
TECHNICAL REPORT NO. 272

ADVANCED HEALTH INFORMATION SHARING WITH WEB-BASED GIS
Sheng Gao
Department of Geodesy and Geomatics Engineering University of New Brunswick
P.O. Box 4400 Fredericton, N.B.
Canada E3B 5A3
March 2010
© Sheng Gao, 2010

PREFACE
This technical report is a reproduction of a dissertation submitted in partial fulfillment
of the requirements for the degree of Doctor of Philosophy in the Department of Geodesy
and Geomatics Engineering, March 2010. The research was supervised by Dr. David
Coleman and Dr. Harold Boley, and funding was provided by the GeoConnections
Secretariat of Natural Resources Canada.
As with any copyrighted material, permission to reprint or quote extensively from this
report must be received from the author. The citation to this work should appear as
follows:
Gao, S. (2010). Advanced Health Information Sharing with Web-Based GIS. Ph.D.
dissertation, Department of Geodesy and Geomatics Engineering, Technical Report No. 272, University of New Brunswick, Fredericton, New Brunswick, Canada, 188 pp.

i
ABSTRACT
Web-based GIS is increasingly utilized in health organizations to share and visualize
georeferenced health data through the Web. In the development of a public information
and disease surveillance network, issues of data publishing and user access are important
concerns. The handling of data heterogeneity, lack of available data and tools, and
methods of health information representation constitute continuing challenges. The
purpose of this research is to address these three problems and provide new solutions for
health information sharing.
Regarding data heterogeneity, a geospatial-enabled RuleML method has been designed
for semantic disease information queries. Geospatial and non-spatial components of
health data are represented through an ontology-based approach. The support for spatial
representation in the proposed method enables the discovery of spatial relations in a
semantic system. This research proposed an improved system, based on ontologies and
rules, addressing both non-spatial and geospatial semantics for the querying of respiratory
disease information.
Furthermore, a new architecture based on open standards and Web Services was designed
to provide better solutions in health information sharing with Web-based GIS. This
architecture overcomes the weakness of a closely coupled design, allows interoperable
data access, and enables dynamic data integration from different providers for decision
making. This architecture has demonstrated its effectiveness in an infectious disease
information mapping application across international borders. In addition to

ii
demonstrating health information sharing, this research provided an initial approach to
designing and implementing Web Processing Services that allow online sharing of health
data processing functionalities.
For the dissemination of health information, a health information representation model
has been designed to facilitate users’ understanding in using health information. This
model covers health information representation in the semantic, geometric, and graphic
dimensions with the purpose of minimizing user misunderstanding. The platform-
independent XML format was utilized in the implementation of this model, and maps can
be generated from this XML format for visualization and analysis.

iii
ACKNOWLEDGEMENTS
I would like to thank my original co-supervisor, Dr. Darka Mioc, for her constant
encouragement and support through most of my PhD studies. I sincerely appreciate my
current co-supervisor, Dr. David Coleman, for his guidance in my research and thesis
writing. Without his illuminating instructions and comments, this dissertation could
hardly reach its present quality. I would also like to express my gratitude to my co-
supervisor, Dr. Harold Boley, for providing me with advice on my research and writing. I
thank Dr. Yun Zhang, Dr. Peter Dare, Dr. Edmund Biden, and Dr. Songnian Li for
reviewing my thesis and providing me valuable comments and suggestions.
I am truly grateful to Mr. Xiaolun Yi, our project partner and colleague from the GGE
department. His inspiration and assistance have walked through my research and
preparation of the papers for publication.
Many thanks also go to the professors and staff at the GGE department, especially David
Fraser, who has instructed and helped me greatly in the past few years. I want to thank all
my friends and colleagues who gave me help both in studies and life.
Last but not least, I deeply appreciate my family for their great love and spiritual support
throughout all my studies.

iv
Table of Contents
ABSTRACT......................................................................................................................... i
ACKNOWLEDGEMENTS............................................................................................... iii
Table of Contents............................................................................................................... iv
List of Tables ..................................................................................................................... ix
List of Figures ..................................................................................................................... x
List of Symbols, Nomenclature or Abbreviations ............................................................ xii
Chapter 1. Introduction ....................................................................................................... 1
1.1 Dissertation Structure............................................................................................ 2
1.2 Background........................................................................................................... 3
1.2.1 GIS Mapping and Analysis........................................................................ 5
1.2.2 Benefits of (Web-based) GIS..................................................................... 7
1.2.3 Health Applications Using (Web-based) GIS.......................................... 10
1.2.4 Emerging Technologies for Health GIS Applications ............................. 14
1.3 Problem Statement .............................................................................................. 22
1.4 Research and Development on Health GIS ........................................................ 25
1.4.1 Data Heterogeneity .................................................................................. 25
1.4.2 Resource Deficiency ................................................................................ 27
1.4.3 Health Information Representation.......................................................... 29
1.5 Objectives ........................................................................................................... 30
1.6 Methodology....................................................................................................... 31
1.6.1 Architecture Design for Health Information Sharing .............................. 32
1.6.2 Usability Analysis and Performance Evaluation of SDIs ........................ 33
1.6.3 Model Development for Health Information Representation .................. 35

v
1.6.4 Geospatial Semantics Exploration for Health Information Sharing ........ 36
1.6.5 Evaluation of the Research ...................................................................... 37
1.7 Overview............................................................................................................. 39
References................................................................................................................. 43
Chapter 2. Online GIS Services for Mapping and Sharing of Disease Information......... 53
Abstract ..................................................................................................................... 53
2.1 Background......................................................................................................... 54
2.1.1 Challenges in Disease Mapping............................................................... 57
2.2 Methods............................................................................................................... 60
2.2.1 Disease Mapping Architecture................................................................. 60
2.2.2 Study Area and Data Description ............................................................ 62
2.2.3 Spatio-temporal Data Model and Data Matching .................................... 63
2.2.4 Statistical Methods for Data Processing .................................................. 65
2.2.5 OGC Services for Disease Mapping ........................................................ 67
2.3 Results................................................................................................................. 67
2.3.1 Web Map Service Support ....................................................................... 68
2.3.2 WMC for Sharing Disease Maps ............................................................. 72
2.4 Discussion ........................................................................................................... 74
2.5 Conclusions......................................................................................................... 76
Acknowledgements................................................................................................... 77
References................................................................................................................. 78
Chapter 3. The Canadian Geospatial Data Infrastructure and Health Mapping ............... 81

vi
Abstract ..................................................................................................................... 81
3.1 Introduction to the Canadian Geospatial Data Infrastructure (CGDI)................ 82
3.2 Health Mapping and Geospatial Aspects............................................................ 83
3.3 Usability Metrics................................................................................................. 85
3.4 Design and Implementation of Health Mapping Applications on the CGDI...... 87
3.4.1 Standards in the CGDI ............................................................................. 87
3.4.2 Architecture Design ................................................................................. 88
3.4.3 Implementation of a Health Application.................................................. 90
3.5 Discussion ........................................................................................................... 96
3.6 Conclusions....................................................................................................... 101
Acknowledgments................................................................................................... 102
References............................................................................................................... 102
Chapter 4. Towards Web-based Representation and Processing of Health Information 106
Abstract ................................................................................................................... 106
4.1 Background....................................................................................................... 108
4.2 Methods............................................................................................................. 112
4.2.1 XML and OGC Web Services ............................................................... 112
4.2.2 HEalth Representation XML (HERXML)............................................. 114
4.2.3 WPS for Health Data Processing with HERXML ................................. 119
4.2.4 Architecture for Health Data Processing and Sharing ........................... 120
4.3 Results............................................................................................................... 122
4.4 Discussion ......................................................................................................... 128
4.5 Conclusions....................................................................................................... 131

vii
Acknowledgements................................................................................................. 132
References............................................................................................................... 132
Chapter 5. Geospatial-Enabled RuleML in a Study on Querying Respiratory Disease
Information ..................................................................................................................... 135
Abstract ................................................................................................................... 135
5.1 Introduction....................................................................................................... 135
5.2 Semantic Web and Geospatial Semantics......................................................... 137
5.3 Framework for Health Information Query and Representation........................ 140
5.3.1 Framework ............................................................................................. 141
5.3.2 Ontologies and Rules in Health Data Fusion......................................... 142
5.4 Design and Implementation .............................................................................. 145
5.4.1 Geospatial Support for RuleML Deduction........................................... 145
5.4.2 Data Sources and Ontology Definition .................................................. 147
5.4.3 Scenarios ................................................................................................ 150
5.5 Discussion and Conclusions ............................................................................. 153
References............................................................................................................... 155
Chapter 6. The Measurement of Geospatial Web Service Quality in SDIs.................... 158
Abstract ................................................................................................................... 158
6.1 Introduction....................................................................................................... 159
6.2 Related Work .................................................................................................... 161
6.3 Proposed Geospatial Web Service Quality Framework.................................... 163
6.3.1 Geospatial Web Service Activities ........................................................ 164

viii
6.3.2 Geospatial Web Service Usage.............................................................. 166
6.4 Geospatial Web Service Evaluation.................................................................. 167
6.4.1 Objective Measurement ......................................................................... 167
6.4.2 Subjective Measurement........................................................................ 170
6.5 Conclusions....................................................................................................... 173
Acknowledgements................................................................................................. 174
References............................................................................................................... 174
Chapter 7. Conclusions ................................................................................................... 176
7.1 Summary of the Research ................................................................................. 176
7.2 Major Achievements of the Research ............................................................... 180
7.3 Recommendations for Further Research........................................................... 182
Appendix A: XML Schema for HERXML..................................................................... 184
Curriculum Vitae

ix
List of Tables
Table 1.1: Requirements for heterogeneous health data integration......................... 38
Table 1.2: Requirements in solving resource deficiency .......................................... 38
Table 1.3: Requirements for health information representation ............................... 39
Table 3.1: Matrix linking usability metrics to the CGDI components ..................... 97

x
List of Figures
Figure 1.1: Dissertation structure................................................................................ 3
Figure 2.1: Disease mapping architecture................................................................. 60
Figure 2.2: Spatio-temporal data model for disease data.......................................... 64
Figure 2.3: Implemented mapping and collaboration framework ............................ 68
Figure 2.4: Crude Morbidity Ratio 2000 .................................................................. 70
Figure 2.5: Crude Morbidity Ratio 2001 .................................................................. 70
Figure 2.6: Web Map Service integration................................................................. 72
Figure 2.7: Discussion forum for decision making................................................... 73
Figure 2.8: Service level sequential diagram for disease data sharing ..................... 74
Figure 3.1: Architecture design................................................................................. 89
Figure 3.2: WPS and WMS integration .................................................................... 95
Figure 3.3: WMS with time tag for simulation on day 20 ........................................ 95
Figure 3.4: WMS with time tag for simulation on day 80 ........................................ 96
Figure 4.1: HERXML schema design process........................................................ 116
Figure 4.2: The HERXML schema......................................................................... 116
Figure 4.3: The mapping data part schema............................................................. 117
Figure 4.4: A WPS for health data processing........................................................ 120
Figure 4.5: Implemented health data processing and sharing architecture............. 121
Figure 4.6: An HERXML document generated from a WPS ................................. 124
Figure 4.7: A map generated from a WPS.............................................................. 125
Figure 4.8: The configuration wizard interface ...................................................... 126
Figure 4.9: Service level sequential diagram for health information access .......... 127
xi
Figure 4.10: The exported HTML viewer............................................................... 127
Figure 4.11: The sharing of HERXML................................................................... 128
Figure 5.1: Metamodel of health concepts.............................................................. 140
Figure 5.2: Health data query and representation framework................................. 142
Figure 5.3: Geometry type designed for RuleML................................................... 146
Figure 5.4: Examples of geometry representation .................................................. 146
Figure 5.5: Fragment of ontology on respiratory diseases...................................... 148
Figure 6.1: Geospatial Web Service quality evaluation framework ....................... 164
Figure 6.2: Objective Geospatial Web Service score ............................................. 168
Figure 6.3: Users of Geospatial Web Services in SDIs .......................................... 171

xii
List of Symbols, Nomenclature or Abbreviations
9IM Nine Intersection Model
AAMR Age-Adjusted Morbidity Ratio
ASMR Age-Specific Morbidity Ratio
CGDI Canadian Geospatial Data Infrastructure
CMR Crude Morbidity Rate
DE-9IM Dimensionally Extended Nine Intersection Model
DL Description Logic
GML Geography Markup Language
HERXML HEalth Representation Extensible Markup Language
HL7 Health Level 7
ICD-9 International Classification of Diseases 9
ISMR Indirect Standardized Morbidity Ratio
ISO/TC 211 International Standards Organization Technical
Committee 211
KVP Key Value Pairs
NMR Normalized Morbidity Ratio
OGC Open Geospatial Consortium
OWL Web Ontology Language
RDF Resource Description Framework
RuleML Rule Markup Language
SDI Spatial Data Infrastructure

xiii
SLD Styled Layer Descriptor
SMR Standardized Morbidity Ratio
SOA Service Oriented Architecture
SOAP Simple Object Access Protocol
SVG Scalable Vector Graphics
WCS Web Coverage Service
WFS Web Feature Service
WMC Web Map Context
WMS Web Map Service
WPS Web Processing Service
XML Extensible Markup Language

1
Chapter 1. Introduction
Presented is the development on health information sharing with the use of Web-based
GIS. This research incorporates Geospatial Web Services, Spatial Data Infrastructure
(SDI), XML, and Semantic Web in health studies. Detailed research objectives are
presented in Section 1.5. The main goal of this work is to provide solutions on
heterogeneous health data sharing architecture and health information representation
model through Web-based GIS. Providing wide access to health information and
minimizing user misunderstanding in its dissemination are essential for public health
safety. To achieve this goal, this dissertation is presented through the following research
papers:
Paper 1 (peer reviewed)
Gao, S., D. Mioc, F. Anton, X. Yi, and D. J. Coleman (2008). “Online GIS services for mapping and sharing disease information.” International Journal of Health Geographics, 8:3. Available at: http://www.ij-healthgeographics.com/content/8/1/3, DOI: 10.1186/1476-072X-8-3.
Paper 2 (peer reviewed)
Gao, S., D. Mioc, X. Yi, F. Anton, E. Oldfield, and D. J. Coleman (2008). “The Canadian Geospatial Data Infrastructure and health mapping.” European Journal of Geography (CyberGeo). Available at: http://www.cybergeo.eu/index21123.html, article 434.
Paper 3 (peer reviewed)
Gao, S., D. Mioc, X. Yi, F. Anton, E. Oldfield, and D. J. Coleman (2009). “Towards Web-based representation and processing of health information.” International Journal of Health Geographics, 7:8. Available at: http://www.ij-healthgeographics.com/content/7/1/8, DOI: 10.1186/1476-072X-7-8.

2
Paper 4 (peer reviewed)
Gao, S., H. Boley, D. Mioc, F. Anton, and X. Yi (2009). “Geospatial-Enabled RuleML in a Study on Querying Respiratory Disease Information.” Lecture Notes in Computer Science, 5858, Springer, pp. 272-281.
Paper 5
Gao, S., D. Mioc, and X. Yi (2009). “The measurement of Geospatial Web Service quality in SDIs.” The 17th International Conference on Geoinformatics, Geoinformatics 2009, Fairfax, VA, USA, August 12-14.
The seven subsections of this chapter will bridge together these five papers by:
a. briefly describing the dissertation structure;
b. introducing the background of health GIS and new emerging technologies;
c. stating the key problems associated with health GIS applications;
d. reviewing recent development related to health GIS applications;
e. presenting the objectives of this research;
f. exploring the methodologies used in this study; and
g. presenting an overview of subsequent chapters in this dissertation.
1.1 Dissertation Structure
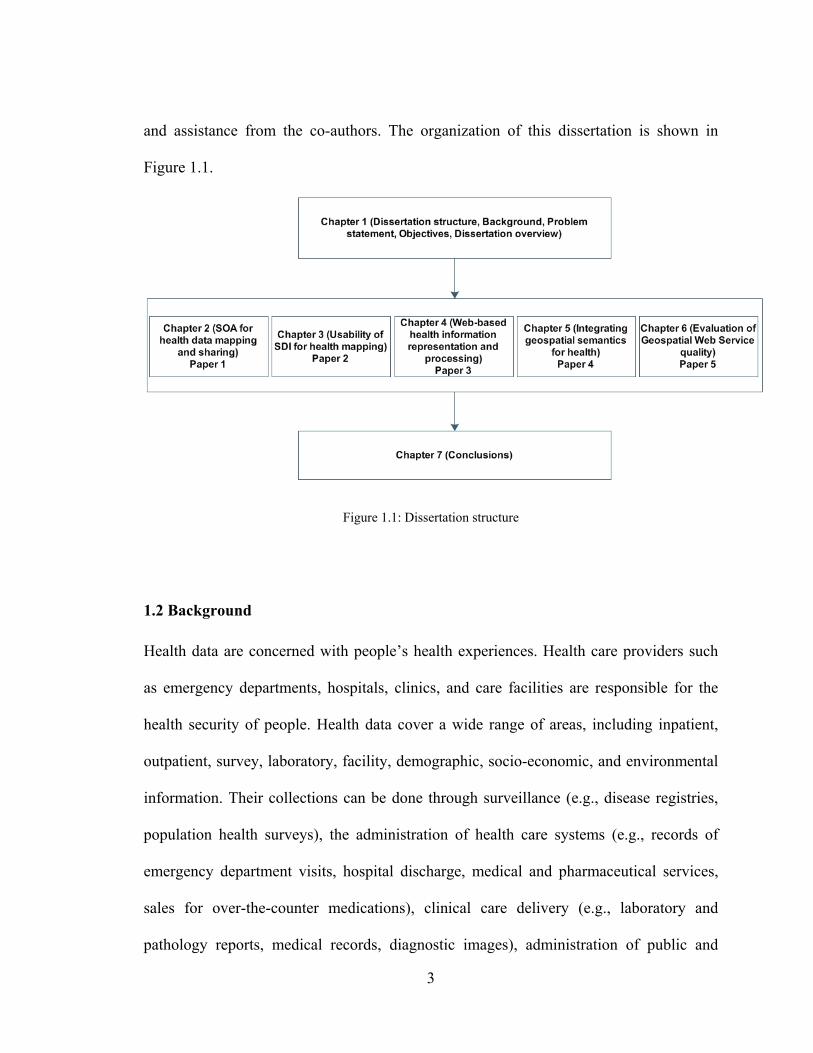
This dissertation includes an introduction, five papers as five body chapters, and a
conclusion. In the five papers, the first author conducted the major research, with input
3
and assistance from the co-authors. The organization of this dissertation is shown in
Figure 1.1.
Figure 1.1: Dissertation structure
1.2 Background
Health data are concerned with people’s health experiences. Health care providers such
as emergency departments, hospitals, clinics, and care facilities are responsible for the
health security of people. Health data cover a wide range of areas, including inpatient,
outpatient, survey, laboratory, facility, demographic, socio-economic, and environmental
information. Their collections can be done through surveillance (e.g., disease registries,
population health surveys), the administration of health care systems (e.g., records of
emergency department visits, hospital discharge, medical and pharmaceutical services,
sales for over-the-counter medications), clinical care delivery (e.g., laboratory and
pathology reports, medical records, diagnostic images), administration of public and

4
private sector services (e.g., census statistics, employment records, motor vehicle license
and accident records, school enrollment lists, work or school absenteeism records),
primary care networks (e.g., patient rosters), environmental monitoring (air pollution
observations, air temperature, water quality), cohort research findings, and questionnaire
surveys.
Since ancient times, people began to realize that diseases in humans and animals are
associated with location. For example, Marco Polo became aware of hoof diseases in
animals that had consumed selenium-accumulating plants and suffered physical
abnormalities, and he believed the cause was the local water supply in given areas
[National Research Council (U.S.), 2007]. In the 19th century, Dr. John Snow discovered
that deaths associated with the major cholera outbreak in London were located around
specific water pumps (subsequently found to be contaminated) by introducing the
locations of disease outbreaks into his analysis. At different locations on the Earth,
variabilities in natural earth processes, environmental quality, ecological issues, and
human activities are likely to affect human health. Throughout history, many
geographical studies on health activities have been explored [Cromley, 2003].
Boulos et al. [2001] divided geographical studies on health activities into geography of
diseases and geography of health care systems based on the two intertwined concepts:
health (individual and community health matters) and health care (clinical issues, service
planning and management issues). The geography of diseases relates to disease outbreaks,
such as detection, modeling, and exploration of disease outbreaks, disease risk factor

5
analysis, and etiology hypothesis. The geography of health care systems records details
and abilities about health care providers, and supports health facility planning,
management, and delivery for balancing needs in health care access.
Geospatial information such as zip codes / postcodes or addresses of patients and health
care facilities is usually recorded in the health data collection. Based on the
georeferenced health data, geographical studies of health can improve the understanding
of disease etiology, control and prevention, and the evaluation of patterns in
environmental health pathogenesis [Hasson et al., 1999; Hakim and Bitto, 2004; Jin et al.,
2005]. The use of spatial location in health studies can also help health care professionals
to focus more on health promotion and illness prevention, with good management, early
identification, and public awareness.
1.2.1 GIS Mapping and Analysis
GIS mapping technologies can generate maps for health in desktop or Web applications.
The mapping technologies can produce interactive interfaces for users, with the support
of GIS basic functions such as zoom in, zoom out, pan, and hyperlink. This thesis
differentiates two types of mapping technology: static mapping and dynamic mapping,
based on whether maps are generated on demand or not.
Static mapping is a passive mapping process. The cartographic representation and
mapping variables are pre-defined. The maps already exist or are rendered. Many Web

6
mapping applications use the static mapping strategy, as it allows quick interaction
between the GIS server and clients. As an example of this static mapping technique, the
World Health Organization's Global Health Atlas platform maintains an electronic library
which provides mapping on public health in the form of publications, statistics, and static
maps categorized by geographical area and topics [World Health Organization, 2010a].
Dynamic mapping is an active mapping process, in which the cartographic representation
and map variables can be set by users interactively. It is often used in both desktop and
Web applications. As an example of a desktop dynamic mapping technique, SIGEpi is a
statistical, analytical, and geographical information system software package developed
by the Pan American Health Organization, a regional office of the World Health
Organization [Pan American Health Organization, 2003]. The SIGEpi software program
is a cooperative project that includes technical support in the development of GIS
applications, analytical methods, and training materials in medical epidemiology and
public health. Scalable Vector Graphics (SVG)-based Web applications can be also
deemed examples of dynamic mapping, since users can do customization on the SVG
maps, such as changing color schemes and mapping attributes.
Besides mapping abilities that provide various map representations, GIS also offers a lot
of spatial analysis functions to be used for health studies, including geocoding functions,
overlay functions, generalization functions, proximity analysis functions, network
analysis functions, geostatistics analysis functions, spatial statistics functions, raster
analysis functions, and so on. In health studies, one or a combination of several analysis

7
functions may be applied to specific applications. Rushton [1998] mentioned two kinds
of analysis that can not be done without GIS: one is to find areas where disease incidence
is statistically significant to perform further investigation; the other is to examine spatial
relations between disease incidence and various georeferenced health data. In addition,
incorporating time information in the analysis can reveal trends over time in order to
reach more robust conclusions.
1.2.2 Benefits of (Web-based) GIS
The dramatic increase in new diseases such as Severe Acute Respiratory Syndrome
(SARS) and the threat of other diseases such as drug-resistant tuberculosis, combined
with increased cross-jurisdiction trade and travel provide opportunities for diseases to
spread across borders at alarming speed. GIS is emerging as a powerful technology for
early disease detection and for appropriate and timely responses to disease outbreaks.
GIS enables the integration of interdependent data from different sources, and supports
mapping and spatial analysis for decision making. GIS, remote sensing, and global
positioning system technologies have all been increasingly applied to health applications.
The use of GIS technology can inform health officials and the public about emerging
health threats, and assist their decision making at all levels. Health information related to
demographics, meteorological conditions, administrative boundaries, distance from
patient to hospitals/clinics, and disease vectors (farm animals, migratory birds, and water
wells) all may be visualized. GIS is highly suitable for analyzing epidemiological data,
8
revealing trends and interrelationships which would be difficult to discover in tabular
formats [World Health Organization, 2010b]. Thus, dependencies and relationships
between variables that may not have been previously considered can be revealed.
GIS has been applied widely in health research, such as chronic respiratory symptoms, air
pollution morbidity/mortality trends, drinking water quality, road transportation planning,
hospital accessibility patterns, disease clusters, health care planning, and climate change
impacts. A large number of health research projects applied GIS to: commuter safety
[Hall and Kaltenecker, 1999], environmental health decisions [Bédard et al., 2003],
health data maps [Buckeridge et al., 2002], maps of health service providers [Fulcher and
Kaukinen, 2005], population growth [Hathout, 2002], disease cluster identification [Koch
and Denike, 2001], geographical access to health care [Scott et al., 1998], and
geographical epidemiology [Yiannakoulias et al., 2003]. These cases illustrated the
advantages of GIS technology for a community-of-practice in response to the growing
demand of geospatial information in the health decision making process for medical,
social, economic, and environmental benefits.
The recent SARS outbreak of 2002-03 demonstrated the need for geographical
applications in health [Boulos, 2004]. During the outbreak, the World Health
Organization, Centers for Disease Control, and Health Canada were proactively engaged
in mapping the viral pandemic, and applying GIS models to global and national health
policy. GIS technology has proven invaluable toward its epidemiological modeling and
eventual control.

9
The key benefits of GIS are identified below [Richards et al., 1999; New Brunswick
Lung Association, 2006].
a. GIS mapping can show disease prevalence across geographical areas, enabling
lobbyists to seek funds and resources for improved health care and manage surge
in demand.
b. GIS benefits health practitioners and the public by increasing awareness of the
spread of communicable diseases (e.g., avian influenza, treatment resistant
tuberculosis), and possible risk factor stratification.
c. Disease surveillance with GIS can help health officials to monitor diseases over
time and plan immunization strategies.
d. GIS can be used to assess health facility and resource distribution, provide
optimal solution for health access, and balance the needs and costs.
e. GIS can illustrate health data at multiple scales, from a very local scale to
provincial, national, and international scales.
f. Implementing GIS in health institutions is cost-effective from both disease
prevention and health promotion points of view.
The emergence of Web-based GIS further pushes GIS functionalities to the Internet.
Web-based GIS combines the power of the World Wide Web with basic desktop GIS
functions (e.g., generating maps, viewing maps, interacting with maps). More advanced
Web-based GIS provides the abilities to perform spatial query and analysis. Via Web-

10
based GIS, information can be reached by users more easily. With all the Web data
access and the necessary functions provided through one browser window, the expensive
process of acquiring proprietary GIS software can be avoided. While GIS technologies
require considerable skills to learn, Web-based GIS can provide information to a wider
audience even with limited GIS knowledge [Kamadjeu and Tolentino, 2006a]. Web-
based GIS in health can increase the number of users and be achieved with minimal costs
[Maclachlan et al., 2007].
Disease detection at early states is important for health officials to take effective counter-
measures to control the spread of disease. Web-based GIS technology can support this by
providing quick access to distributed data for analysis, visualization, planning, and
modeling. Since the response of Web-based GIS is in near real-time, it is effective for
understanding disease phenomena to support decision making. Opportunities for
leveraging health monitoring/surveillance are now being offered via Web-based GIS
applications [Conte et al., 2005; Kamadjeu and Tolentino, 2006b; Wang et al., 2008].
1.2.3 Health Applications Using (Web-based) GIS
GIS can be used to analyze public health care parameters, provide critical information in
a timely manner, support health care policy development, monitor climatic events,
coordinate medical response measures, and educate decision makers and the general
public. The data used in these applications cover the health, environmental, and socio-
economic sources. Common data include hospital and emergency room admissions,

11
ambulance databases, patients' location at the time of incidents, cumulative ambient
concentrations obtained from air-monitoring and weather stations, questionnaire survey
and interview data, hospital staff data, remote sensing images (used to extract land cover),
groundwater-surface water hydrologic fluxes and water quality data, demographic
statistics, and economic vectors. The main categories of health GIS applications are
discussed in the following subsections.
1.2.3.1 Disease Pattern Detection
Disease patterns are important to health practitioners in the investigation of disease
outbreaks over space and time. Mapping the populations at risk is widely used to show
the geographical distribution and variation of illness [Chaput et al., 2002; Richardson et
al., 2004; Beale et al., 2008]. GIS can illustrate health events at multiple scales, from a
community level to regional, provincial, national, and international levels. As disease
phenomena have no boundaries, disease pattern detection should not be constrained to
administrative boundaries. Time information can also be incorporated in GIS to study the
spatial and temporal trends in disease prevalence [AvRuskin et al., 2004]. Using spatial
statistics methods with GIS to detect spatial clusters and spatio-temporal clusters helps
the identification of excess or unusual disease occurrences [Hjalmars et al., 1996; Perez
et al., 2002].

12
1.2.3.2 Disease Monitoring and Surveillance
Health scientists who perform disease monitoring and surveillance need to understand the
effect of disease agents in the cause of diseases. To help describe the presence and
distribution of disease agents (physical, chemical, or biological), GIS has been used to
identify sources of these agents, and subsequently monitor the environment in order to
detect the presence of these agents [Cromley, 2003]. Spatial analysis, together with
univariate analysis, multivariate analysis, logistic regression, and probability models is
commonly used in modeling hazard exposure, risk assessment, disease spread, and health
outcome. GIS can also integrate various georeferenced sources to determine the
association between disease symptoms and air pollution, meteorological variables
(temperature, relative humidity, etc.), water quality, or socio-economic factors. For
example, several studies investigated the relationship between chronic respiratory
symptoms and long-term ambient concentrations of fine particulates, total suspended
particulates, ozone, and sulfur dioxide among residents who are close to major roads or
industrial complexes [Abbey et al., 1995; Garshick et al., 2003].
1.2.3.3 Health Facility Distribution
GIS provides the abilities to describe the spatial organization of health care (numbers,
types, and locations), examine the changing spatial distribution of health care systems,
and explore improvements of health care delivery [Fortney et al., 1999; McLafferty,
2003]. The population (age, gender, income, race), health facility capacities, access cost
(time, distance) have been taken into consideration in health facility planning and

13
distribution evaluation [Haynes et al., 1999; Messina et al., 2006]. GIS can be used to
identify population segments vulnerable to varied geographical access to critical medical
treatment, provide optimal routes for emergency responses, assess resource allocations,
monitor health facility utilization patterns, and plan intervention strategies. For example,
Lwasa [2006] carried out a study to demonstrate the value of GIS technologies in the
provision of information required for the planning of health infrastructure in Uganda,
with the ability to enhance access to the public as well as the understanding of spatial
distribution of facilities. The adoption of GIS in health care applications can assist
stakeholders and policy makers in effectively distributing health care resources to
overcome geographical inequalities in accessing health care among different population
groups.
1.2.3.4 Health Care and Education
GIS and the development of the Internet have brought a new way for the general public to
visualize and analyze health data. They facilitate public access, awareness, and
participation in health decision making. Maps can be disseminated to the general public
for alerting them to the distribution of disease agents. With the utilization of maps, it is
easy to explain the geographical variation of health exposure. People can be informed
about the environmental hazards around themselves and prepare themselves for disease
outbreaks. GIS also supports the public in efficiently locating the nearest health facilities.
In addition, GIS programs or courses are offered in many health-related schools and
health associations.

14
1.2.4 Emerging Technologies for Health GIS Applications
The development of Web-based GIS provides new opportunities for health information
delivery and sharing via the Internet. The following subsections briefly describe key
technologies that can be utilized for health GIS applications.
1.2.4.1 XML, SOA, and OGC Standards
The Internet provides an efficient way for electronic information exchange.
Accommodation of health information exchange is no exception, although privacy and
confidentiality issues need to be taken into consideration. The Extensible Markup
Language (XML) is an open standard for data exchange across multiple media and
platforms over the Internet, which is optimized for machine processing but can be easily
transformed to human-readable presentation syntaxes. For example, the Health Level 7
(HL7) standards, accredited by the non-profit American National Standards Institute,
allow clinical and administrative data exchange across health care information systems
[HL7, 2010]. The HL7 standards suite incorporates a new approach to clinical
information exchange, constructed around the HL7 Reference Information Model, which
utilizes methodology to integrate health care information (messages, data types, datasets,
and terminologies) via XML syntax. The Geography Markup Language (GML) is
designed as a standard for geospatial data sharing. It is an XML standard which is able to
model, transport, and store geospatial information as well as non-spatial information
[Lake, 1999; OGC, 2004].
15
To overcome the disadvantages of tightly coupled systems and improve their reusability,
the concept of Service Oriented Architecture (SOA) has become widespread. Commonly
there are three types of actors in this architecture: service providers, service requestors,
and service brokers. Service providers are responsible for providing functions as services
to requestors and for registering function descriptions with service brokers. For the
discovery of services, the service broker serves as the bridge in linking the service
providers and requestors. The development of SOA provides a new solution for
application development and integration. Web Services -- a common implementation of
service oriented architectures -- are based on SOA to support machine-to-machine
functionality sharing over the Internet. To support inter-communication, Web Services
provide functionalities through clearly defined interfaces, independent of hardware and
system platforms, network protocols, and development languages. They provide a loosely
coupled architecture for building Web applications.
To facilitate geospatial information sharing, the Open Geospatial Consortium (OGC)
concentrates on the development of interoperable geospatial standards that are
independent of industrial vendors. It initiated the Open Web Service (OWS) program
based on SOA and Web Services, and has proposed several geospatial specifications to
support geospatial data sharing and interoperability. The framework of OWS contains
five main categories of services: client services, registry services, processing-workflow
services, portrayal services, and data services [OGC, 2003]. Dozens of Geospatial Web
Service specifications have been proposed or adopted by OGC, such as Web Map Service
(WMS), Styled Layer Descriptor (SLD), Web Map Context (WMC), Geography Markup

16
Language (GML), Web Feature Service (WFS), Web Coverage Service (WCS), Keyhole
Markup Language (KML), and Web Processing Service (WPS).
1.2.4.2 Development of Spatial Data Infrastructure
A Spatial Data Infrastructure (SDI) consists of relevant base collections of technologies,
policies, and institutional arrangements which can facilitate discovery, evaluation, and
access to spatial data [Nebert, 2004]. It aims to serve all levels of government, industries,
non-profit organizations, academia, and the general public for their social and economic
activities. The principle in guiding the SDI development is that once it is built, many
applications can get benefits out of this. Groot [1997] pointed out two essential purposes
in building SDIs. One purpose is to save time, effort, and money in geospatial data access,
and facilitate users in determining how fit the geospatial data are for their applications.
The other purpose is to promote data sharing through harmonization and standardization
to avoid unnecessary geospatial data duplication. SDIs mainly deal with the interaction
between people and geospatial data. The main components of an SDI include data
providers, databases and metadata, data network, technologies, institutional arrangements,
policies and standards, and end-users [Coleman and Nebert, 1998]. According to the
stakeholders and organization structure of SDIs, hierarchies in global SDIs, regional SDIs,
national SDIs, provincial SDIs, and local SDIs can be observed.
The development of SDIs began in the early 1990s, and their developments are
influenced by the needs of stakeholders and new information technologies. Three kinds

17
of changes can be seen in system architectures, information exchange, and application
development solutions. The system architecture in geospatial data sharing went through
client-server architecture and multi-tier architecture (with a client, Web server,
application server, and database), and SOA has gained popularity recently. At the early
stage of the geospatial information exchange, data are usually obtained through storage
devices (e.g., CDs) or file downloading from HTTP/FTP servers. The data downloaded
still need post processing before they can be used for applications. Nowadays, geospatial
data exchange tends toward the provision of value-added information, which can be
served for user applications directly instead of raw data downloading. Current Web 2.0
technologies revolutionize the Web to further facilitate data sharing and collaboration
between users. In particular, Web 2.0 mashups allow the combination of multiple data
sources and services over the Web. The mashup technology changes the standalone
application development pattern, supports fast application development, and lowers the
programming skills in the development for the general public.
The initial SDI movement was carried out through national funding and efforts, and
significant developments have taken place with the U.S. National Spatial Data
Infrastructure (NSDI)1, the Canadian Geospatial Data Infrastructure (CGDI)2, and the
1 http://www.fgdc.gov/nsdi/nsdi.html
2 http://www.geoconnections.org/en/aboutcgdi.html

18
Australian Spatial Data Infrastructure (ASDI)1. With the development of national SDIs,
provincial SDIs also emerged such as GeoNova: Nova Scotia’s SDI2, GeoBC: British
Columbia’s SDI3, and GeoNB: New Brunswick’s SDI4 in Canada. Local governments are
playing a key role in SDI development nowadays, as they provide fundamental data
sources for higher level SDIs. Local governments and the private sector will play an
increasingly important role in future SDI development [Rajabifard et al., 2006; Harvey
and Tulloch, 2006].
SDIs provide a framework for collecting, accessing, and disseminating of geospatial data,
and can enhance decision making for current problems relying on spatial data. SDIs have
been served for GIS applications in different fields, such as public health, agriculture,
transportation, forestry, and environment. Providing public health information in SDI is
very useful and public health data will be an essential component of SDI. Croner [2003]
pointed out the dynamic system of public health readiness requires the development of
geospatial infrastructure via the Internet. In Canada, one of four priority areas in the
CGDI is public health, and the CGDI endeavors to share geospatial information for
tracking and monitoring population health [CGDI, 2010]. Since 2005, more than 20
1 http://www.ga.gov.au/nmd/asdi/
2 http://www.gov.ns.ca/geonova/home/default.asp
3 http://www.geobc.gov.bc.ca/
4 http://www.snb.ca/gdam-igec/e/2900e_1.asp

19
projects have been funded by CGDI for public health at the federal, provincial, local, and
enterprise levels1.
1.2.4.3 Semantic Data Integration
"The Semantic Web is an extension of the current Web in which information is given
well-defined meaning, better enabling computers and people to work in cooperation"
[Berners-Lee et al., 2001]. There are three sources of heterogeneity -- syntactic,
schematic, and semantic -- that need to be considered during geospatial data integration
[Bishr, 1998]. Syntactic heterogeneity deals with different data structures and formats.
Schematic heterogeneity is due to database schemas organized with different properties
and structures. Semantic heterogeneity is caused by different interpretations of data and
metadata, hampering the unambiguous distributed access to information sources. Two
types of semantic heterogeneity are distinguished [Lutz et al., 2003]: one is cognitive
heterogeneity that arises when two disciplines have different conceptualizations of real
world facts; the other is naming heterogeneity which refers to different names for
identical concepts of real world facts. Resolving semantic heterogeneity would greatly
enhance the handling of syntactic heterogeneity and schematic heterogeneity [Bishr et al.,
1999]. Formal ontologies constitute an important notion of the Semantic Web, and have
been characterized as formal specifications of conceptualizations [Gruber, 1993]. With
1 http://www.geoconnexions.org/en/communities/publichealth/projects

20
well-designed ontologies, the semantics of distributed data can be unambiguously defined,
semantic heterogeneity can be resolved, and therefore data sharing and integration can be
enabled.
Considerable research has been done on conceptual frameworks for the semantic
comparison between different geospatial concepts. To compare the meaning of concepts
underlying given data, background knowledge can be utilized to perform similarity
analysis. The similarity of concepts can be evaluated based on their name, description,
properties, and attributes [Kokla and Kavouras, 2001; Mostafavi, 2006]. Uitermark et al.
[1999] located semantic similarity at the object instance level (e.g., related, relevant,
incompatible) based on their class-level relationships and computational geometry
(spatial overlay). Raubal [2004] defined conceptual vector spaces (sets of quality
dimensions) to measure the semantic distance between instances of concepts. Rodriguez
and Egenhofer [2004] determined the semantic similarity of spatial entity classes by
taking their characteristics (parts, functions, and attributes) and semantic interrelations
into account. Zhou [2005] pointed out a strong connection with reality, ontology,
meaning, and representation in geospatial data semantics, and implemented a semantic
integration method by employing implicit spatial neighborhood information in evaluating
semantic similarities. Brodeur et al. [2005] introduced a conceptual framework for
geospatial data interoperability through geosemantic proximity comparison between
geospatial concepts, with the use of intrinsic properties (identification, attributes, attribute
values, geometries, temporalities, and domains) and extrinsic properties (semantic, spatial,
and temporal relations). In this framework, geospatial concepts are defined using XML

21
Schema, and the interoperability among different geospatial data is handled through
geosemantic proximity comparison.
The above methodologies provide frameworks to compare semantic similarity among
heterogeneous data, but the question of how to represent these geospatial concepts
through Semantic Web techniques (such as ontologies and rules) in a manner that allows
automatic machine reasoning and deduction is still open. Ontology-based approaches
have been used to query geospatial information; for example, different application
ontologies have been connected through shared domain ontologies [Klien et al., 2006;
Lutz and Klien, 2006]. The relationship between different concepts can be deduced
through shared concepts. Ontologies are usually expressed through the standard Web
Ontology Language (OWL). Description Logic (DL) [Baader and ebrary, 2003], which
strives for decidability and usually for tractability, constitutes the formal underpinning for
OWL deductive reasoning. DL represents knowledge through a TBox (terminology of
concepts and properties) and an ABox (assertion of instances using the terminology).
Rules, with Horn Logic as their formal underpinning, complement DL to express other
kinds of knowledge in the Semantic Web [Grosof et al., 2003]. Rules represent 'if then'
knowledge which allows machine deduction avoiding explicitly enumerating all possible
instance facts as used by (extensional) databases. Lutz and Kolas [2007] presented a
methodology that applies a set of domain rules and schema mapping rules for available
data to support the discovery process in SDIs.

22
With the proper data representation in the Semantic Web, the query of heterogeneous
data sources can both respect the meaning of data and deduce new knowledge from
existing ontologies and rules. The Semantic Web approach has great potential for health
GIS applications. For example, Boulos [2005a] proposed to construct a foundation
evidence base and ontology-based framework of modular reusable models for more
informed health planning and better outcome using GIS.
1.3 Problem Statement
Applying (Web-based) GIS in health information sharing requires the consideration of
data sources, analysis functionalities, and dissemination approaches. Although
considerable research has already been done for health GIS applications, three challenges
still need to be addressed.
Data Heterogeneity
Public health data tend to be divided into silos: hospitals, physicians, financial
management, etc. This data fragmentation is partially due to federal budgets that allocate
separate funding blocks for different providers and services. Although many provinces
now utilize an integrated health care delivery model, the organization of public health
data remains fragmented [New Brunswick Lung Association, 2006]. The data collection
process varies amongst different health organizations with different tools and methods.
The integration of health data across service systems is a challenge [McLafferty, 2003].
The heterogeneity problems of health data come from different input formats, different

23
spatial levels (e.g, point, postcode, county), different ways in describing a concept,
different naming conventions, different terminologies, different information models, and
different data transmission standards. For example, no central repository of health data
exists in the United States and there is considerable variation in the formats and location
requirements of the data that are reported [National Research Council (U.S.), 2007]. The
variability in the implementation of health standards (e.g., Health Level 7 standards) also
makes it difficult to combine data from multiple health care delivery systems [Lober et al.,
2002]. The sharing of health data across states or regions is uncommon, as
inconsistencies across states regarding their use of geocoding references, statistical and
mapping software limit the possibilities to integrate data for multi-state studies [Gregorio
et al., 2006].
Resource Deficiency
Health data are primarily collected from hospitalization services such as documentation
on current patient and client health records. These data, even anonymized statistical data,
are absent from many other areas of public health, such as preventive services,
intervention strategies and patient outcomes, private health care providers, impact of
health care policies or services, and policy development and health program evaluation
[New Brunswick Lung Association, 2006]. This kind of data deficiency causes the
inability to access multiple georeferenced data for decision making related to public
health. The data deficiency is also of concern since many cases are never reported, and
the responsibility of government entities to protect patient confidentiality makes the
location of incident cases difficult to obtain [National Research Council (U.S.), 2007].

24
Ultimately, this results in a lack of available data for decision making in health GIS
applications.
Although increasing numbers of Web-based GIS systems are being developed for health
information dissemination, Zeng et al. [2005] pointed out disease information systems
are not fully interoperable because they are often developed in isolation from one another.
As barriers still exist in the current systems, non-automated approaches such as email
attachments and manual data reentry are usually needed when disease control agencies
need to share information across systems [Zeng et al., 2005]. Furthermore, many health
applications using Web-based GIS allow the dynamic generation of maps, but the user-
demand analysis functions in these applications are still very limited.
Health Information Representation
Privacy and confidentiality issues have been given a lot of attention in health studies.
Privacy is to protect personal information not to be disclosed and distributed. The privacy
rules consider the rights of privacy in doctor-patient relationships and personal health
information from the perspective of public access; confidentiality is the responsibility of
health practitioners to hold confidential the patient’s information [Ölvingson et al., 2002].
Therefore, the representation of health information needs to capture health information
distribution while minimizing individual identification potential.
As health activities are social events that are related to spatial locations, GIS mapping is
usually applied in representing these data. But considerable information is missing from

25
such maps, such as methods used and data source metadata. As the representation of
information is essential for appropriate interpretation, consideration needs to be given on
the use of GIS in interpreting health data. A good health information representation
model could facilitate information delivery and overcome confusion.
1.4 Research and Development on Health GIS
1.4.1 Data Heterogeneity
To support health decision making, health GIS systems need to integrate a wide range of
georeferenced data from various organizations and sources. The successfully
implemented health GIS applications require standardized methodology, appropriate
tools for data collection, and accurate data integration over time [Wiafe and Davenhall,
2005]. There are many advantages of data integration from multiple health systems, such
as monitoring and understanding health status on a regional or national level, comparing
contemporaneous data from similar regions, and validating detection algorithms [Lober et
al., 2002].
Two kinds of approaches are commonly applied in data integration: schema-based and
semantics-based (usually, ontology-based). The schema-based approach matches data
sources from different database schemas into uniform database storage. A common
schema needs to be designed before data integration. Buckeridge et al. [2002] pointed out
that the development of a data model which explicitly defines how concepts within data
26
sources relate to each other in health systems could allow the integration of a wide range
of georeferenced data for health decision making.
The ontology-based approach requires the definition of ontologies (e.g., domain
ontologies designed by experts) and the semantic description of concepts. The description
of data semantics can be represented in Resource Definition Framework (Schema),
RDF(S), or OWL. Thus, ambiguities in data are removed with the explicit description.
Many health standards, such as HL7 and Health Insurance Portability and Accountability
Act (HIPAA) can serve as ontologies in the exchange and integration of health data.
Schuurman and Leszczynski [2008] defined ontology-based metadata through interviews
with health professionals, and utilized description logic to map near-identical concepts
between the perinatal databases of two jurisdictions. Considerable research has been
conducted concerning the mapping and integration between different health ontologies
[Lee et al., 2006; Rey et al., 2006; Ryan, 2006].
However, previous research handled spatial locations as text-based information (e.g., the
name of a city) and defined their relations using ontologies (e.g., a city is inside a
province) in health data integration. To relieve the efforts to explicitly define all spatial
relationships between spatial objects in health data integration, the consideration of
geospatial semantics still needs to be explored.

27
1.4.2 Resource Deficiency
The control of health resource access needs to prevent the unauthorized disclosure of
patient privacy information, protect the integrity of health care data, and ensure the
availability of health data for authorized persons [Barrows and Clayton, 1996]. Several
kinds of technologies can be used for access control such as multi-level and role-based
access model, and public key encryption.
Web-based interfaces are popular for data management and access [Scotch et al., 2006].
The use of Web technologies can facilitate the distribution of health resources. The
development of Web-based GIS enables the generation of user-requested maps online.
Depending on the requirements of applications, Web-based GIS thin-client or thick-client
solutions have been used for sharing health information through maps [Inoue et al., 2003;
Qian et al., 2004; Blanton et al., 2006; Kamadjeu and Tolentino, 2006a].
Web-based GIS allows health agencies to export their data and maps to accessible Web
portals. Toubiana et al. [2005] coupled a data warehouse with Web-based GIS to support
communicable disease monitoring. Tsui et al. [2003] described a real-time public health
surveillance system, in which clinical data collected by health care providers are
transferred to a database in the real-time outbreak and disease surveillance system
through HL7 messages. In this system, detection systems and GIS are used to analyze the
database and publish results through the Web. Zeng et al. [2004] showed a case study of a
bioportal system, which gathers data from different departments through HL7 messages,
and then integrates them into the bioportal data store for Web-based GIS.

28
Along with the rapid development proprietary software (e.g., ESRI ArcGIS server,
MapInfo and MapXtreme), widely-used free software (e.g., Google maps, Yahoo maps)
and open source software (e.g, GeoServer, MapServer) for Web-based GIS, different
Web-based GIS solutions for health applications emerged. Boulos and Honda [2006]
proposed to publish health maps through open source Web-based GIS software. Currently,
most proprietary and open source Web-based GIS solutions provide support for OGC
standards.
While many health systems are implemented using Web-based GIS for the distribution of
health information through Web maps, differences in operating systems, network
protocols, and data models still cause problems in health information access and
exchange. Meanwhile, these health systems using Web-based GIS usually only offer
mapping abilities, and the provision of spatial processing functionalities is limited. The
methods in distributing health resources still need to be explored to solve the resource
deficiency problem. The development of SDIs can benefit health GIS applications, while
current health GIS applications have limited SDI-like arrangement [Boulos, 2004]. The
building of global and jurisdictional data sharing infrastructures will be one future trend
in health GIS [Yan et al., 2006].

29
1.4.3 Health Information Representation
Access to databases (or data warehouses) is deemed the greatest obstacle to health GIS
studies. At the heart of the problem is the associated issues related to individual privacy
rights, national security, data confidentiality, and copyright management [Boulos, 2005b].
As geospatial technologies progress and become more readily available, interrelated
issues of confidentiality, privacy rights, and security have been recognized in health GIS
applications. To protect individual spatial information, Kwan et al. [2004] mentioned
three statistical methods: aggregation, affine transformation, and random perturbation.
Aggregation is the most common method to group data, and the spatial resolution reduces
in this process. Affine transformation translates, rotates, and scales the point pattern.
Random perturbation introduces errors in the original data during the randomization
process. These statistical methods serve as geographical masks for representing
confidential data on maps.
It is generally agreed that there is consistent trade-off between spatial analysis accuracy
and privacy rules [Kwan et al., 2004; Sherman and Fetters, 2007]. For example, the
frequently used aggregation methods may hide some details within the data. With the
data aggregation in different spatial levels and different divisions of areas, it is likely to
get different spatial patterns and correlation coefficients. This is referred to the literature
as the “Modifiable Areal Unit Problem (MAUP)” [Openshaw and Taylor, 1981;
Openshaw and Alvandies, 1999]. The ideal solution to overcome this problem is to use
more detailed data. Some studies showed the results in some aggregate level analysis
(e.g., census tract and block group) are comparable, and seeking data finer than census
30
tract may not be compelling [Krieger et al., 2002; Gregorio et al., 2005]. Various studies
were carried out with the use of statistical methods for geospatial privacy issues. Leitner
and Curtis [2004] did an empirical study on the use of different geographical masks
(global and local) for representing confidential point data. Cassa et al. [2006] applied a
population density based Gaussian spatial skew to generate random noise to anonymize
spatial surveillance data.
The privacy and confidentiality issues require the consideration of data representation in
health applications using Web-based GIS. Cromley [2003] discussed the need of
implementing disease surveillance systems which can be utilized for distributing
information of meaningful spatial aggregates to meet the needs of large research
communities and the general public. Web maps are usually provided to users in health
applications using Web-based GIS. However, maps can easily mislead [Hanchette, 1998],
and poorly designed maps can inadvertently mis-communicate information [Monmonier,
1991]. The complex nature of the data, and the heterogeneity in user skill and knowledge
both demand consideration when a data depiction is to be designed for facilitating
appropriate interpretation [Buckeridge et al., 2002].
1.5 Objectives
The main objective of this research is to develop a health GIS information sharing
architecture and representation model to allow the wide access and limit the
misunderstanding of health information. This research focuses on solving the identified

31
three problems to advance health information sharing. To achieve this objective, the
following sub-objectives are identified:
a. Design an architecture by using SOA and SDI for health data mapping and
sharing.
b. Develop performance evaluation metrics to measure SDI effectiveness and build
trust of SDIs for health applications.
c. Build a health information representation model to share and exchange essential
health statistical information.
d. Build a health GIS ontology framework enabling both geospatial and non-spatial
reasoning in health data integration and query.
This research will create a loosely coupled and interoperable health information sharing
architecture, analyze the effectiveness of SDI related to health studies, generate a health
information representation model, and incorporate the geospatial semantics in rule
reasoning in the Semantic Web.
1.6 Methodology
This research concentrates on the design and implementation of new methods and
architectures for advancing health GIS information sharing. It is carried out through a
literature review followed by model design, prototyping, and result validation stages. The

32
proposed methodology for achieving the objectives is described in the following
subsections.
1.6.1 Architecture Design for Health Information Sharing
A common way to share health information is through Web maps in health GIS
applications. Heterogeneous health data can be integrated by location and represented in
a homogeneous form with maps. The goal of this methodology is to support the following
requirements in health information sharing:
a. Allow heterogeneous health data integration and sharing.
b. Achieve interoperability in health data access without the need to consider
platforms and languages in the application development.
c. Support scalability, allowing various health organizations to publish their data
through the Web.
d. Consider privacy issues of health data while providing important information to
users.
e. Support the use of geospatial processing functionalities for health information
analysis via the Web.
This methodology considers the tiers in the architecture design, approaches, and
interoperable standards for health information sharing. The SOA and SDI based
architecture is used to publish health information through Geospatial Web Services. The

33
appeal of SOA is that it facilitates health information sharing and integration with loosely
coupled design. Four common tiers -- the data storage tier, ontology engine tier, standard
health service tier, and map and animation tier -- are explored in the architecture design.
Four interoperable OGC Geospatial Web Service standards (WMS, SLD, WMC, WPS,)
are adopted for health information processing, mapping and sharing. WMS (with the
support of the time tag) is used to assist health organizations publish their data through
Web maps. Access control makes sure that users with different privileges can access
different levels of detailed health information generated from spatial aggregation. The
SLD-enabled WMS strategy allows the maps achieved from different WMS services to
have the same cartographic style for visualization purposes. The WMC supports health
organization collaboration with the sharing of current view of users (e.g., Web-based
maps from several WMS services) in an XML format in which WMS service connection
parameters are stored. WPS empowers health departments to access geospatial tools and
functionalities through the Web. Successfully designed, this methodology will help build
geospatially enabled infrastructure for health.
1.6.2 Usability Analysis and Performance Evaluation of SDIs
Current SDI developments enable users to access data through Geospatial Web Services.
The attractiveness of SDIs is that they can enable horizontal integration of data across
sectors (e.g., health, environment, safety, communities) and vertical data integration (e.g.,
local, provincial, national) to provide value-added services for decision making. Studies

34
on SDI usability were mainly concentrated on geospatial data usability, and the usability
of SDI for health is still a challenge.
The proposed methodology provides a systematic approach on how to evaluate the
usability of SDIs for health mapping. It combines determined usability metrics to
evaluate the effectiveness of SDI (such as CGDI) components for health mapping. To
evaluate SDIs in health mapping, this methodology designs health applications that cover
the basic geographical functionalities for health within an SDI. The study of usability is
based on developed health applications with two kinds of users: developers and end-users.
Additionally, this methodology provides basics for further investigation of SDI for health
applications. From the usability study, the limitations of the CGDI for health mapping are
also identified, such as health information representation, semantic interoperability issues,
and trust of services.
The rapid development of the SDI would lead to a large number of Geospatial Web
Services. To improve their effectiveness and efficiency for health GIS applications, this
methodology further designs a technical framework to evaluate the Geospatial Web
Service quality in SDIs through the activities happening during their consumption.
Objective and subjective evaluation of Geospatial Web Service quality are proposed. The
objective evaluation score considers the response (e.g., content, speed) of the interaction
between the applications and those Geospatial Web Services. The subjective evaluation
score considers the attitudes of users towards the Geospatial Web Services through
questionnaire surveys.

35
1.6.3 Model Development for Health Information Representation
To facilitate health information exchange between various users via the Web, the
following issues need to be considered in the health information representation model
design:
a. the content of health information representation;
b. the metadata of health information sources;
c. the privacy issues of health information; and
d. the consistency in health information representation, independent of environment
and platforms.
The proposed methodology develops an XML schema to share the statistical results of
various health activities, such as public health surveillance, outbreak investigation, direct
health services, and public health research. The design of this XML schema follows a
cyclic model: requirement analysis, conceptual design, implementation, and application
validation. The content of the XML file includes semantic, geometric, and cartographic
representation of health information. The metadata of health sources in the XML file
ensures the understandability and quality of health information. The privacy issues are
considered by using statistical results, and detailed health information can be required
with the support from the metadata. The use of XML in health information representation

36
allows cross platform information exchange, and the development of a parser allows the
interpretation of these XML-based files into maps.
1.6.4 Geospatial Semantics Exploration for Health Information Sharing
Geospatial semantics describes the underlying meaning of geospatial objects and their
spatial relationships corresponding to the real world. This methodology works on the
semantic heterogeneity for health using both non-spatial semantics and geospatial
semantics. In order to incorporate geospatial semantics into the current Semantic Web,
the following issues are still challenges:
a. geospatial data representation in the Semantic Web languages;
b. geospatial relation discovery and deduction with the utilization of spatial
operations and topological functionalities in the Semantic Web; and
c. cartographic considerations to represent health information.
The incorporation of geospatial semantics into the Semantic Web would allow the
integration of ontologies and rules for heterogeneous information reasoning and
deduction, which are helpful for health studies. Successfully implemented, this
methodology would be able to represent health concept hierarchies, spatial operations,
topological operators, cartographic representation styles, and people’s knowledge with
ontologies and rules, and thus allow automated health information query, reasoning, and
mapping.

37
1.6.5 Evaluation of the Research
This research addresses the three identified problems: data heterogeneity, resource
deficiency, and health information representation in georeferenced health information
sharing environments. The following criteria are proposed to quantify the extent to which
this research actually meets the objective and "improves" the use of Web-based GIS in
selected health-related applications. If all the criteria are met, then in that sense the
objective is achieved.
For heterogeneous health data integration, the data sources can be retrieved from the data
level through files or databases. With the popularity of Web Services, the data could also
be accessed from the service level through (Geospatial) Web Services. Meanwhile, as
georeferenced health data include a spatial component, the integration and query of
health data should not only be able to support non-spatial semantic matching (e.g., using
taxonomies, concept relations), but also need to handle geospatial semantic matching
with spatial relations and operations. The requirements of heterogeneous health data
integration call for a framework to support the handling of both non-spatial semantics and
geospatial semantics from the data level and service level, as shown in Table 1.1.

38
Table 1.1: Requirements for heterogeneous health data integration
Non-spatial semantics Geospatial semantics
Data level • •
Service level • •
For the resource deficiency problem, georeferenced health maps and functionalities need
to be accessed by users. The use of these resources requires the consideration of
accessibility, interoperability, trust, and privacy issues. In the context of this research,
Accessibility refers to that the resources are able to be readily accessed by users.
Interoperability allows the exchange of the resources through standard interfaces. Trust
refers to the resources’ dependability and the quality in the interaction with those
resources. Privacy provides solutions for access control and privacy management in
health information dissemination. To overcome the deficiency in health information
sharing, consideration needs to be taken on the accessibility, interoperability, trust, and
privacy issues of resources as shown in Table 1.2.
Table 1.2: Requirements in solving resource deficiency
Accessibility Interoperability Trust Privacy
Georeferenced health
data/maps • • • •
Geospatial processing
functionalities • • • •

39
For the online representation of health information, the representation model needs to be
exchangeable and cover essential health information. In order to define more completely
the content requirements of online health information representation, many factors must
be considered, including mapping variables, representation dimensions, and privacy
issues, as shown in Table 1.3. The mapping variables should provide the vital information
for user visualization purposes. The representation dimensions need to include
information related to the interpretation of health data including semantic, geometric, and
graphic representation. Privacy issues also need consideration in the distribution of health
information representation.
Table 1.3: Requirements for health information representation
Representation dimensions Exchangea-
bility
Mapping
variables Semantic Geometric Graphic
Privacy
Online
representation • • • • • •
1.7 Overview
Each of the following five chapters addresses different aspects of the data heterogeneity,
resource deficiency, and health information representation problems discussed in this
chapter. Chapter 2 works on the health architecture design to share data from different
health organizations with the consideration of the sensitive issues. Chapter 3 explores the
use of CGDI for health, and points out the weakness of CGDI in health information
representation. Chapter 4 enriches the health data sharing architecture to support the

40
sharing of health processing functionalities, and designs a health information
representation model to facilitate the dissemination and understanding of health
information. Chapter 5 uses ontologies and rules to enable the query of heterogeneous
data from files or Web Services, considering non-spatial and geospatial semantics.
Chapter 6 details the methods on how to evaluate Geospatial Web Services for building
trust of SDI for health applications.
The paper that forms Chapter 2 presents a solution to the first objective of this research:
designing an architecture by using SOA and SDI for health data mapping and sharing. An
architecture was designed and a case study of infectious diseases was carried out across
the New Brunswick and Maine border based on this architecture. Through data matching,
the heterogeneity problem was handled by integrating data from both sides to a common
data schema, and representing them as maps in the user interfaces. The reusability and
interoperability were handled by the use of open-standard Geospatial Web Services, such
as WMS, SLD, and WMC. As people usually prefer to use the spatial boundaries with
which they are familiar to convey health information (such as administrative boundaries),
online health information representation was addressed by statistical calculation, thematic
mapping, and access control with levels of detail.
The paper constituting Chapter 3 presents a response to the second objective of this
research: developing performance evaluation metrics to measure the SDI effectiveness
and build trust of SDIs for health applications. Metrics in evaluating the usability of
CGDI components in health mapping were selected, including: cost, accessibility,

41
response time, data quality, reliability, exchangeability, interoperability, cartographic
representation, and security. CGDI enabled health applications that support basic
geospatial functions, such as thematic mapping, spatio-temporal processing, spatio-
temporal trend representation, and health facility distribution, were developed for the
evaluation study. Based on the opinions of developers and users about the developed
applications, a matrix that links the usability metrics and CGDI components was
determined. Meanwhile, the limitations found in CGDI for health include the handling of
semantic heterogeneity, cartographic representation of Web-based GIS applications, trust
of Geospatial Web Services, and security issues.
The paper in Chapter 4 responds to the third objective: building a health information
representation model to share and exchange essential health statistical information. A
HEalth Representation XML (HERXML) was designed to share the semantic, geometric,
and graphic representation of health information regardless of platform or system via the
Web. Its design regards several issues such as metadata, statistical methods,
comprehensiveness, platform-independent representation, and semantic interpretation.
Meanwhile, this chapter enriches the first objective with the use of OGC WPS to support
online processing of health data. WPS allows users to input their raw data and get the
processing results which can be represented in maps or HERXML. This extension can
enhance the development of geospatial public health infrastructure that makes data and
functionalities to be more available to users while keeping affordable cost for health
organizations.

42
The paper that forms Chapter 5 addresses the fourth objective: building a health GIS
ontology framework enabling both geospatial and non-spatial reasoning in health data
integration and query. The geospatial information representation was incorporated in
RuleML, a standard rule language in the Semantic Web. The ontology and rule
framework designed in this research facilitates heterogeneous health information query
and reasoning. Ontologies define the relationships between different concepts in
semantics, geometries and graphics, such as the respiratory disease ontologies in this
study. The rules, including reasoning rules and cartographic rules, were used to integrate
various data sources into a homogenous representation. With the implementation of
geospatial and non-spatial semantics in the proposed system, four case scenarios were
used to demonstrate respiratory disease information query and reasoning with semantic,
geometric, and graphic requirements.
The paper in Chapter 6 further explores the second objective: developing performance
evaluation metrics to measure the SDI effectiveness and build trust of SDIs for health
applications. A quality evaluation framework on how to evaluate the Geospatial Web
Services in SDIs is presented. The framework was developed based on service activities
and service usage. Service activities include the details on service commitment, service
description, service process, and service outcome following the process of service
consumption. With the criteria that need to be fulfilled in this Geospatial Web Service
evaluation framework, objective and subjective evaluation were explored. Objective
measurement quantifies the test results to scores based on the fulfillment of the
evaluation framework. Subjective measurement can be implemented through

43
questionnaires related to service activities and service usage, based on the level of
satisfaction (e.g., strongly disagree, neutral) of developers and end-users.
Finally, Chapter 7 summarizes the overall work of this research, and gives
recommendations about further research on Web-based GIS for health information
sharing.
References
Abbey, D. E., B. E. Ostro, F. Petersen, and R. J. Burchette (1995). "Chronic respiratory symptoms associated with estimated long-term ambient concentrations of fine particulates less than 2.5 microns in aerodynamic diameter (PM2.5) and other air pollutants." Journal of Exposure Analysis and Environmental Epidemiology, 5(2), pp. 137-159.
AvRuskin, G. A., G. M. Jacquez, J. R. Meliker, M. J. Slotnick, A. M. Kaufmann, and J. O. Nriagu (2004). "Visualization and exploratory analysis of epidemiologic data using a novel space time information system." International Journal of Health Geographics, 3:26. Available at: http://www.ij-healthgeographics.com/content/3/1/26, DOI: 10.1186/1476-072X-3-26.
Baader, F., and I. ebrary (2003). The description logic handbook. Cambridge University Press, Cambridge, UK, New York.
Barrows, R. C., and P. D. Clayton (1996). "Privacy, confidentiality, and electronic medical records." Journal of the American Medical Informatics Association : JAMIA, 3(2), pp.139-148.
Beale, L., J. J. Abellan, S. Hodgson, and L. Jarup (2008). "Methodologic issues and approaches to spatial epidemiology." Environmental Health Perspectives, 116(8), pp. 1105-1110.
Bédard, Y., P. Gosselin, S. Rivest, M. Proulx, M. Nadeau, G. Lebel, and M. Gagnon (2003). "Integrating GIS components with knowledge discovery technology for environmental health decision support." International Journal of Medical Informatics, 70(1), pp. 79-94.

44
Berners-Lee, T., J. Hendler, and O. Lassila (2001). "The Semantic Web." Scientific American.
Bishr, Y. (1998). "Overcoming the semantic and other barriers to GIS interoperability." International Journal of Geographical Information Science, 12(4), pp. 299-314.
Bishr, Y. A., H. Pundt, and C. Ruther (1999). "Proceeding on the road of semantic interoperability-design of a semantic mapper based on a case study from transportation." Proceedings of Proceedings of INTEROPP'99: 2nd International Conference on Interoperating Geographic Information Systems, March 10-12, 1999. Springer-Verlag, Zurich, Switzerland, pp. 203-215.
Blanton, J. D., A. Manangan, J. Manangan, C. A. Hanlon, D. Slate, and C. E. Rupprecht (2006). "Development of a GIS-based, real-time Internet mapping tool for rabies surveillance." International Journal of Health Geographics, 5:47. Available at: http://www.ij-healthgeographics.com/content/5/1/47, DOI: 10.1186/1476-072X-5-47.
Boulos, M. N., A. V. Roudsari, and E. R. Carson (2001). "Health geomatics: An enabling suite of technologies in health and healthcare." Journal of Biomedical Informatics, 34(3), pp. 195-219.
Boulos, M. N. (2004). "Towards evidence-based, GIS-driven national spatial health information infrastructure and surveillance services in United Kingdom." International Journal of Health Geographics, 3:1. Available at: http://www.ij-healthgeographics.com/content/3/1/1, DOI: 10.1186/1476-072X-3-1.
Boulos, M. N. (2005a). "Research protocol: EB-GIS4HEALTH UK - Foundation evidence base and ontology-based framework of modular, reusable models for UK/NHS health and healthcare GIS applications." International Journal of Health Geographics, 4:2. Available at: http://www.ij-healthgeographics.com/content/4/1/2, DOI: 10.1186/1476-072X-4-2.
Boulos, M. N. (2005b). "Web GIS in practice III: Creating a simple interactive map of England's Strategic Health Authorities using Google Maps API, Google Earth KML, and MSN Virtual Earth Map Control." International Journal of Health Geographics, 4:22. Available at: http://www.ij-healthgeographics.com/content/4/1/22, DOI: 10.1186/1476-072X-4-22
Boulos, M. N., and K. Honda (2006). "Web GIS in practice IV: Publishing your health maps and connecting to remote WMS sources using the Open Source UMN MapServer and DM Solutions MapLab." International Journal of Health Geographics, 5:6. Available at: http://www.ij-healthgeographics.com/content/5/1/6, DOI: 10.1186/1476-072X-5-6.

45
Brodeur, J., Y. Bédard, and B. Moulin (2005). "A geosemantic proximity-based prototype for the interoperability of geospatial data." Computers, Environment and Urban Systems, 29(6 SPEC. ISS.), pp. 669-698.
Buckeridge, D. L., R. Mason, A. Robertson, J. Frank, R. Glazier, L. Purdon, C. G. Amrhein, N. Chaudhuri, E. Fuller-Thomson, P. Gozdyra, D. Hulchanski, B. Moldofsky, M. Thompson, and R. Wright (2002). "Making health data maps: A case study of a community/university research collaboration." Social Science and Medicine, 55(7), pp. 1189-1206.
Cassa, C. A., S. J. Grannis, J. M. Overhage, and K. D. Mandl (2006). "A context-sensitive approach to anonymizing spatial surveillance data: Impact on outbreak detection." Journal of the American Medical Informatics Association, 13(2), pp. 160-165.
CGDI (2010). "About CGDI." [On-line] February 21, 2010. http://www.geoconnections.org/en/aboutcgdi.html.
Chaput, E. K., J. I. Meek, and R. Heimer (2002). "Spatial analysis of human granulocytic ehrlichiosis near Lyme, Connecticut." Emerging Infectious Diseases, 8(9), pp. 943-948.
Coleman, D. J., and D. D. Nebert (1998). "Building a North American Spatial Data Infrastructure." Cartography and Geographic Information Science, 25(3), pp. 151-160.
Conte, A., P. Colangeli, C. Ippoliti, C. Paladini, M. Ambrosini, L. Savini, F. Dall'Acqua, and P. Calistri (2005). "The use of a Web-based interactive Geographical Information System for the surveillance of bluetongue in Italy." OIE Revue Scientifique Et Technique, 24(3), pp. 857-868.
Cromley, E. K. (2003). "GIS and disease." Annual Review of Public Health, 24(1), pp. 7-24.
Croner, C. M. (2003). "Public health, GIS, and the internet." Annual Review of Public Health, 24(1), pp. 57-82.
Fortney, J., K. Rost, M. Zhang, and J. Warren (1999). "The impact of geographic accessibility on the intensity and quality of depression treatment." Medical Care, 37(9), pp. 884-893.
Fulcher, C., and C. Kaukinen (2005). "Mapping and visualizing the location HIV service providers: An exploratory spatial analysis of Toronto neighborhoods." AIDS Care - Psychological and Socio-Medical Aspects of AIDS/HIV, 17(3), pp. 386-396.

46
Garshick, E., F. Laden, J. Hart, and A. Caron (2003). "Residence near a major road and respiratory symptoms in United States Veterans." Epidemiology, 14, pp. 730-738.
Gregorio, D. I., L. M. DeChello, H. Samociuk, and M. Kulldorff (2005). "Lumping or splitting: Seeking the preferred areal unit for health geography studies." International Journal of Health Geographics, 4:6. Available at: http://www.ij-healthgeographics.com/content/4/1/6, DOI: 10.1186/1476-072X-4-6.
Gregorio, D. I., H. Samociuk, L. DeChello, and H. Swede (2006). "Effects of study area size on geographic characterizations of health events: Prostate cancer incidence in Southern New England, USA, 1994-1998." International Journal of Health Geographics, 5:8. Available at: http://www.ij-healthgeographics.com/content/5/1/8, DOI: 10.1186/1476-072X-5-8.
Groot, R. (1997). "Spatial data infrastrucutre (SDI) for sustainable land management." ITC Journal, 3, pp. 287-294.
Grosof, B. N., I. Horrocks, R. Volz, and S. Decker (2003). "Description logic programs: Combining logic programs with description logic." Twelfth International World Wide Web Conference (WWW 2003), pp. 48-57.
Gruber, T. R. (1993). "A Translation Approach to Portable Ontology Specifications." Knowledge Acquisition, 5(2), pp. 199-220.
Hakim, J. A., and A. C. Bitto (2004). "Comprehensive surveillance, prevention, and control measures for West Nile Virus in Monroe County, Pennsylvania." Environmental Practice, 6(1), pp. 36-49.
Hall, L., and M. G. Kaltenecker (1999). "Toronto bicycle commuter safety rates." Accident Analysis and Prevention, 31(6), pp. 675-686.
Hanchette, C. (1998). "GIS implementation of 1997 CDC guidelines for childhood lead screening in North Carolina." Proceedings of The Third National Conference on GIS in Public Health, San Diego, CA.
Harvey, F., and D. Tulloch (2006). "Local-government data sharing: Evaluating the foundations of spatial data infrastructures." International Journal of Geographical Information Science, 20(7), pp. 743-768.
Hasson, K. W., D. V. Lightner, J. Mari, J. Bonami, B. T. Poulos, L. L. Mohney, R. M. Redman, and J. A. Brock (1999). "The geographic distribution of Taura Syndrome Virus (TSV) in the Americas: Determination by histopathology and in situ hybridization using TSV-specific cDNA probes." Aquaculture, 171(1-2), pp. 13-26.

47
Hathout, S. (2002). "The use of GIS for monitoring and predicting urban growth in East and West St Paul, Winnipeg, Manitoba, Canada." Journal of Environmental Management, 66(3), pp. 229-238.
Haynes, R., G. Bentham, A. Lovett, and S. Gale (1999). "Effects of distances to hospital and GP surgery on hospital inpatient episodes, controlling for needs and provision." Social Science and Medicine, 49(3), pp. 425-433.
Hjalmars, U., M. Kulldorff, G. Gustafsson, and N. Nagarwalla (1996). "Childhood leukaemia in Sweden: Using GIS and a spatial scan statistic for cluster detection." Statistics in Medicine, 15(7-9), pp. 707-715.
HL7 (2010). "Health Level 7." [On-line] February 21, 2010. http://www.hl7.org/.
Inoue, M., S. Hasegawa, A. Suyama, and S. Meshitsuka (2003). "Automated graphic image generation system for effective representation of infectious disease surveillance data." Computer Methods and Programs in Biomedicine, 72(3), pp. 251-256.
Jin, Y., Z. Zhou, G. He, H. Wei, J. Liu, F. Liu, N. Tang, B. Ying, Y. Liu, G. Hu, H. Wang, K. Balakrishnan, K. Watson, E. Baris, and M. Ezzati (2005). "Geographical, spatial, and temporal distributions of multiple indoor air pollutants in four Chinese provinces." Environmental Science and Technology, 39(24), pp. 9431-9439.
Kamadjeu, R., and H. Tolentino (2006a). "Web-based public health geographic information systems for resources-constrained environment using scalable vector graphics technology: A proof of concept applied to the expanded program on immunization data." International Journal of Health Geographics, 5:24. Available at: http://www.ij-healthgeographics.com/content/5/1/24, DOI: 10.1186/1476-072X-5-24
Kamadjeu, R., and H. Tolentino (2006b). "Open source Scalable Vector Graphics components for enabling GIS in web-based public health surveillance systems." AMIA Annual Symposium Proceedings / AMIA Symposium, pp. 973.
Klien, E., M. Lutz, and W. Kuhn (2006). "Ontology-based discovery of geographic information services - An application in disaster management." Computers, Environment and Urban Systems, 30(1), pp. 102-123.
Koch, T., and K. Denike (2001). "GIS approaches to the problem of disease clusters: A brief commentary." Social Science and Medicine, 52(11), pp. 1751-1754.
Kokla, M., and M. Kavouras (2001). "Fusion of top-level and geographical domain ontologies based on context formation and complementarity." International Journal of Geographical Information Science, 15(7), pp. 679-687.

48
Krieger, N., J. T. Chen, P. D. Waterman, M. Soobader, S. V. Subramanian, and R. Carson (2002). "Geocoding and monitoring of US socioeconomic inequalities in mortality and cancer incidence: Does the choice of area-based measure and geographic level matter? The public health disparities geocoding project." American Journal of Epidemiology, 156(5), pp. 471-482.
Kwan, M., I. Casas, and B. C. Schmitz (2004). "Protection of geoprivacy and accuracy of spatial information: How effective are geographical masks?" Cartographica, 39(2), pp. 15-28.
Lake,R.(1999). "Introduction to GML Geography Markup Language." [On-line] February 21, 2010. http://www.w3.org/Mobile/posdep/GMLIntroduction.html.
Lee, Y., K. Supekar, and J. Geller (2006). "Ontology integration: Experience with medical terminologies." Computers in Biology and Medicine, 36(7-8), pp. 893-919.
Leitner, M., and A. Curtis (2004). "Cartographic guidelines for geographically masking the locations of confidential point data." Cartographic Perspectives, 49, pp. 22-39.
Lober, W. B., B. T. Karras, M. M. Wagner, J. M. Overhage, A. J. Davidson, H. Fraser, L. J. Trigg, K. D. Mandl, J. U. Espino, and F. Tsui (2002). "Roundtable on bioterrorism detection: Information system-based surveillance." Journal of the American Medical Informatics Association, 9(2), pp. 105-115.
Lutz, M., and E. Klien (2006). "Ontology-based retrieval of geographic information." International Journal of Geographical Information Science, 20(3), pp. 233-260.
Lutz, M., and D. Kolas (2007). "Rule-based discovery in spatial data infrastructure." Transactions in GIS, 11(3), pp. 317-336.
Lutz, M., C. Riedemann, and F. Probst (2003). "A classification framework for approaches to achieving semantic interoperability between GI web services." Spatial Information Theory, Proceedings, 2825, pp. 186-203.
Lwasa, S. (2006). "Planning for Health Infrastructure in Uganda: Where is the need?" GIS Development.
Maclachlan, J. C., M. Jerrett, T. Abernathy, M. Sears, and M. J. Bunch (2007). "Mapping health on the Internet: A new tool for environmental justice and public health research." Health and Place, 13(1), pp. 72-86.
McLafferty, S. L. (2003). "GIS and health care." Annual Review of Public Health, 24(1), pp. 25-42.

49
Messina, J. P., A. M. Shortridge, R. E. Groop, P. Varnakovida, and M. J. Finn (2006). "Evaluating Michigan's community hospital access: Spatial methods for decision support." International Journal of Health Geographics, 5:42. Available at: http://www.ij-healthgeographics.com/content/5/1/42, DOI: 10.1186/1476-072X-5-42.
Monmonier, M. S. (1991). How to lie with maps. University of Chicago Press, Chicago.
Mostafavi, M. A. (2006). "Semantic similarity assessment in support of spatial data integration." Proceedings of 7th International Symposium on Spatial Accuracy Assessment in Natural Resources and Environmental Sciences, Lisbon, Portugal, July 5-7.
National Research Council (U.S.), Committee on Research Priorities for Earth Science and Public Health (2007). Earth Materials and Health: Research Priorities for Earth Science and Public Health. pp. 188. National Academies Press.
Nebert, D. D. (2004). "GSDI Cook Book Version 2.0." pp. 171. [On-line] February 21, 2010. http://www.gsdi.org/docs2004/Cookbook/cookbookV2.0.pdf.
New Brunswick Lung Association (NBLA). (2006). "Assessing Gaps and Opportunities for Development of CGDI-nested Public Health Infrastructure and Applications."
OGC (2004). "Geography Markup Language (GML) Implementation Specification." Available at: http://portal.opengeospatial.org/files/?artifact_id=4700.
OGC (2003). "OpenGIS Web Services Architecture." Available at: http://portal.opengeospatial.org/files/?artifact_id=1320.
Ölvingson, C., J. Hallberg, T. Timpka, and K. Lindqvist (2002). "Ethical issues in public health informatics: Implications for system design when sharing geographic information." Journal of Biomedical Informatics, 35(3), pp. 178-185.
Openshaw, S., and Alvandies, S. (1999). Applying geocomputing to the analysis of spatial distribution. John Wiley and Sons, Inc, New York.
Openshaw, S., and P. J. Taylor (1981). "The modifiable areal unit problem." Quantitative Geography: A British View, pp. 60-69.
Pan American Health Organization (2003). "Application and development of Geographic Information Systems in Public Health and Epidemiology." [On-line] February 21, 2010. http://www.paho.org/English/DD/AIS/sigepi_web2003en.htm.

50
Perez, A. M., M. P. Ward, P. Torres, and V. Ritacco (2002). "Use of spatial statistics and monitoring data to identify clustering of bovine tuberculosis in Argentina." Preventive Veterinary Medicine, 56(1), pp. 63-74.
Qian, Z., L. Zhang, J. Yang, and C. Yang (2004). "Global SARS information WebGIS design and development." International Geoscience and Remote Sensing Symposium (IGARSS), 5, pp. 2861-2863.
Rajabifard, A., A. Binns, I. Masser, and I. Williamson (2006). "The role of sub-national government and the private sector in future spatial data infrastructures." International Journal of Geographical Information Science, 20(7), pp. 727-741.
Raubal, M. (2004). "Formalizing conceptual spaces." Proceedings of Proceedings of the Third International Conference (FOIS2004), Frontiers in Artificial Intelligence and Applications, Amsterdam, Netherlands, November 4-6. pp. 153-164.
Rey, D., V. Maojo, M. García-Remesal, R. Alonso-Calvo, H. Billhardt, F. Martin-Sánchez, and A. Sousa (2006). "ONTOFUSION: Ontology-based integration of genomic and clinical databases." Computers in Biology and Medicine, 36(7-8), pp. 712-730.
Richards, T. B., C. M. Croner, G. Rushton, C. K. Brown, and L. Fowler (1999). "Geographic information systems and public health: Mapping the future." Public Health Reports, 114(4), pp. 359-373.
Richardson, S., A. Thomson, N. Best, and P. Elliott (2004). "Interpreting posterior relative risk estimates in disease-mapping studies." Environmental Health Perspectives, 112(9), pp. 1016-1025.
Rodriguez, M. A., and M. J. Egenhofer (2004). "Comparing geospatial entity classes: An asymmetric and context-dependent similarity measure." International Journal of Geographical Information Science, 18(3), pp. 229-256.
Rushton, G. (1998). "Improving the geographic basis of health surveillance using GIS." GIS and Health, pp. 63-79.
Ryan, A. (2006). "Towards semantic interoperability in healthcare: ontology mapping from SNOMED-CT to HL7 version 3." Proceedings of Proceedings of the second Australasian workshop on Advances in ontologies, Hobart, Australia, December 5.
Schuurman, N., and A. Leszczynski (2008). "A method to map heterogeneity between near but non-equivalent semantic attributes in multiple health data registries." Health Informatics Journal, 14(1), pp. 39-57.

51
Scotch, M., B. Parmanto, C. S. Gadd, and R. K. Sharma (2006). "Exploring the role of GIS during community health assessment problem solving: Experiences of public health professionals." International Journal of Health Geographics, 5:39. Available at: http://www.ij-healthgeographics.com/content/5/1/39, DOI: 10.1186/1476-072X-5-39.
Scott, P. A., C. J. Temovsky, K. Lawrence, E. Gudaitis, and M. J. Lowell (1998). "Analysis of Canadian population with potential geographic access to intravenous thrombolysis for acute ischemic stroke." Stroke, 29(11), pp. 2304-2310.
Sherman, J. E., and T. L. Fetters (2007). "Confidentiality concerns with mapping survey data in reproductive health research." Studies in Family Planning, 38(4), pp. 309-321.
Toubiana, L., S. Moreau, and G. Bonnard (2005). "MetaSurv: Web-Platform Generator for the Monitoring of Health Indicators and Interactive Geographical Information System." Connecting Medical Informatics and Bio-Informatics: Proceedings of MIE2005 - the XIXth International Congress of the European Federation for Medical Informatics.
Tsui, F., J. U. Espino, V. M. Dato, P. H. Gesteland, J. Hutman, and M. M. Wagner (2003). "Technical description of RODS: A real-time public health surveillance system." Journal of the American Medical Informatics Association, 10(5), pp. 399-408.
Uitermark, H. T., P. J. M. van Oosterom, N. J. I. Mars, and M. Molenaar (1999). "Ontology-based geographic data set integration." Proceedings of International Workshop STDBM'99 Proceedings, 10-11 Sept. 1999. Springer-Verlag, Edinburgh, UK, pp. 60-78.
Wang, Y., Z. Tao, P. K. Cross, L. H. Le, P. M. Steen, G. D. Babcock, C. M. Druschel, and S. Hwang (2008). "Development of a web-based integrated birth defects surveillance system in New York State." Journal of Public Health Management and Practice, 14(6), pp. E1-E10.
World Health Organization (2010a). "WHO | Global Health Atlas." [On-line] February 21, 2010. http://apps.who.int/globalatlas/.
World Health Organization (2010b). "GIS and public health mapping." [On-line] February 21, 2010. http://www.who.int/health_mapping/gisandphm/en/index.html.
Wiafe,S., and B. Davenhall (2005). "Extending Disease Surveillance with GIS." [On-line] February 21, 2010. http://www.esri.com/news/arcuser/0405/disease_surveil1of2.html.

52
Yan, P., D. Zeng, and H. Chen (2006). "A review of public health syndromic surveillance systems." Lecture Notes in Computer Science (Including Subseries Lecture Notes in Artificial Intelligence and Lecture Notes in Bioinformatics), 3975, pp. 249-260.
Yiannakoulias, N., L. W. Svenson, M. D. Hill, D. P. Schopflocher, R. C. James, A. T. Wielgosz, and T. W. Noseworthy (2003). "Regional comparisons of inpatient and outpatient patterns of cerebrovascular disease diagnosis in the province of Alberta." Chronic Diseases in Canada, 24(1), pp. 9-16.
Zeng, D., Chen, H., Lynch2, C., Eidson, M., and Gotham, I. (2005). "Infectious Disease Informatics and Outbreak Detection." Medical Informatics, Spriger, pp.359-395.
Zeng, D., H. Chen, C. Tseng, C. A. Larson, M. Eidson, I. Gotham, C. Lynch, and M. Ascher (2004). "Towards a national infectious disease information infrastructure: a case study in West Nile virus and botulism." Proceedings of Proceedings of the 2004 annual national conference on Digital government research Seattle, Washington.
Zhou, N. J. (2005). Mereotopology for geospatial semantic integration. PhD Dissertation, the University of Wisconsin - Madison, United States.
53
Chapter 2. Online GIS Services for Mapping and Sharing of Disease
Information♣
Abstract
Disease data sharing is important for the collaborative preparation, response, and
recovery stages of disease control. Disease phenomena are strongly associated with
spatial and temporal factors. Web-based Geographical Information Systems provide a
real-time and dynamic way to represent disease information on maps. However, data
heterogeneity, integration, interoperability, and cartographic representation are still major
challenges in the health geographical fields. These challenges cause barriers in
extensively sharing health data and restrain the effectiveness in understanding and
responding to disease outbreaks. To overcome these challenges in disease data mapping
and sharing, the senior authors have designed an interoperable service oriented
architecture based on Open Geospatial Consortium specifications to share spatio-
temporal disease information.
A case study of infectious disease mapping across New Brunswick (Canada) and Maine
(USA) was carried out to evaluate the proposed architecture, which uses standard Web
Map Service, Styled Layer Descriptor, and Web Map Context specifications. The case
♣ Originally published as: Gao, S., D. Mioc, F. Anton, X. Yi, and D.J. Coleman (2008). “Online GIS services for mapping and sharing disease information.” International Journal of Health Geographics, 7:8. Available at: http://www.ij-healthgeographics.com/content/7/1/8, DOI: 10.1186/1476-072X-7-8.

54
study shows the effectiveness of an infectious disease surveillance system and enables
cross-border visualization, analysis, and sharing of infectious disease information through
interactive maps and/or animation in collaboration with multiple partners via a distributed
network. It enables data sharing and users’ collaboration in an open and interactive
manner.
In this project, the senior authors developed a service oriented architecture for online
disease mapping that is distributed, loosely coupled, and interoperable. An
implementation of this architecture has been applied to the New Brunswick and Maine
infectious disease studies. This study has shown that the development of standard health
services and spatial data infrastructure could enhance the efficiency and effectiveness of
public health surveillance.
2.1 Background
Currently, such factors as booming population, environmental pollution, rapid
urbanization, and global warming all influence the conditions for disease outbreaks.
Disease studies have revealed strong spatial aspects, including disease case location and
disease diffusion. Thus, mapping spatial aspects of diseases could help people understand
some puzzles of disease outbreak. The development of disease mapping was traced by
Tom Koch from a map of plague outbreaks at Bari, Italy in 1694 to a map of Acquired
Immunodeficiency Syndrome (AIDS) for the entire earth in the present-day [Koch, 2005].
Unlike the raw disease data, disease maps offer a visual means of identifying cause and

55
effect relationships existing between humans and their environment. Disease maps can
enable health practitioners and the general public to visually communicate about disease
distribution.
Geographical Information System (GIS) provides an effective way of managing, storing,
analyzing, and mapping disease information. GIS has strong capabilities in mapping and
analyzing not only spatial data, but also non-spatial data, and can integrate many kinds of
data to greatly enhance disease surveillance. It can render disease data along with other
kinds of data like demographic and environmental data, representing the differences with
various cartographic styles. Gupta and Shriram [2004] identified many useful functions
of GIS such as network analysis, buffer analysis, and statistical analysis in the area of
disease surveillance. When a disease appears, GIS could represent disease information
rapidly and analyze the disease's spread dynamically. [Boulos, 2004] emphasized that the
GIS technologies and services that are able to function proactively in real-time are
extremely and critically important to creating a "spatial health information infrastructure".
Meanwhile, the rapid development of the Internet influences the popularity of Web-based
GIS, which itself shows great potential for the sharing of disease information through
distributed networks. Distributing and sharing disease maps via the Web could help
decision makers across health jurisdictions and authorities collaborate in preventing,
controlling, and responding to a specific disease outbreak.

56
Documented applications are already making health information accessible through the
Web [Benneyan et al., 2000; Edberg, 2005]. Custom online interactive health maps could
be implemented using Google Maps API, Google Earth KML, or MSN Virtual Earth
Map Control [Boulos, 2005]. The maturity of Web-based GIS enables the generation of
thematic maps dynamically and efficiently, with a thin/thick client or hybrid architectures.
For example, Inoue et al. [2003] developed a thin client, Web-based GIS application to
dynamically generate and display infectious disease surveillance data through maps and
charts. Blanton et al. [2006] integrated federal, state and local data and developed map
tools for rabies surveillance with a Web-based GIS thin client architecture.
Other applications have employed thick client, Web-based GIS approaches to visualize
health information through Java Applets and Scalable Vector Graphics (SVG). Qian et al.
[2004] provided a thick client, Web-based GIS approach to visualize global SARS
information using a Java Applet. Kamadjeu and Tolentino [2006] implemented a Web-
based public health information system to generate district-level country immunization
coverage maps and graphs with SVG. As the response performance of Web-based GIS is
in near real-time, it is effective for understanding the disease phenomena to support
decision making.
Time is an important factor in analyzing disease outbreak. Foody [2006] highlighted the
spatio-temporal characteristic as an important feature in recent health studies. By
comparing thematic maps at different time intervals, the spatial-temporal change of the
disease could be projected, including temporal cluster shift, vector transmission rates, and

57
mobility of susceptible populations. Greene et al. [2005] analyzed the spatial, temporal,
and spatio-temporal patterns of viral meningitis to aid the identification of risk factors.
Greiling et al. [2005] developed a desktop application with a time bar for exploring
spatio-temporal patterns of colon cancer mortality rates.
2.1.1 Challenges in Disease Mapping
The experience of disease outbreak has demonstrated the importance of applying
statistical models and mapping tools in making health policies. Despite the continual
development of disease mapping technologies, four major challenges still exist.
1. Disease data heterogeneity. Disease data are collected by different health
organizations in various ways, which creates a barrier to data sharing. These data may be
stored and distributed in different places through files or databases. Commonly, there are
three sources of heterogeneity: semantic, schematic, and syntactic heterogeneities that
need to be considered during data integration [Bishr, 1998]. Techniques that can facilitate
the sharing and integration of disease data are highly valuable. Semantic heterogeneity
arises from the cognitive differences and naming convention variations among various
disciplines. Schematic heterogeneity deals with the different methods of describing the
facts of the world, including hierarchies, properties, and relationships. Syntactic
heterogeneity refers to diversity in representations or storage models. The schema
integration approach and ontology-based approach could be used to overcome these
heterogeneities and thus facilitate data sharing.

58
2. Difficulties in integration and reusability. Integrating and reusing the current
health applications is constrained to a large extent. Zeng et al. [2004] pointed out that the
isolation of existing stand-alone disease management systems leads to a data sharing
problem. Most health information systems have a closed architecture – even the ones that
use Web-based technology are difficult to integrate. Typically, users can only access
maps from such a health application, and it is difficult to integrate datasets from these
applications. A service oriented architecture with loosely coupled services could link
distributed health data and support reuse of services.
3. Lack of interoperability between different disease services. Interoperability
makes it easy to communicate, execute programs, or transfer data among various systems
in a unified manner. For disease studies, it is important to utilize distributed disease
information and share the data through standard interfaces. In analyzing disease
information and the health decision making process, it is helpful to integrate many kinds
of spatial and non-spatial data, including roads, hospitals, available medical resources, etc.
To address spatial data sharing and interoperability, many international organizations
such as Open Geospatial Consortium (OGC), and the International Standards
Organization Technical Committee 211 (ISO/TC211) are attempting to address standards
and application specifications. Since spatial representation makes disease phenomena
more understandable, integrating these open geospatial standards for the development of
Web-based disease tracking and analysis systems represents a great opportunity to
improve health data sharing, interoperability, and visualization. Boulos and Honda [2006]

59
proposed to publish health maps through Open Source Web GIS software that usually
supports OGC specifications.
4. Concerns over appropriate cartographic representation and sensitive
dissemination of disease data. Cartographic representation deals the data representation
using graphics. It greatly influences the understanding of disease phenomena. Many
health practitioners are eager to map disease data to certain district boundaries, which
could show the patterns of disease distribution and support their decision making.
Disease data contain private information, and sharing of such data may cause
considerable concern. For example, if the disease information shows one area with high
disease rates, people would possibly avoid both the area and its inhabitants. Bell et al.
[2006] listed four kinds of methods to protect the confidentiality of disease data: (a) the
aggregation of data in spatial and temporal dimensions; (b) removal of the geographical
identifiers from the original data; (c) relocation of individual records randomly on a small
scale; and (d) limitation of access to the data through a user- and/or function-restricted
computer environment. When compared with original data, the aggregated results would
have some differences. Leitner and Curtis [2006] identified geographical masking
methods used to preserve individual confidentiality and measured the similarity of the
aggregated data through different cell sizes with the original point pattern. Meanwhile,
such factors as population density, racial tendency, environmental pollution, and cultural
difference all affect disease studies. Considering those factors in the mapping process
will improve the cartographic representation of disease information.

60
2.2 Methods
2.2.1 Disease Mapping Architecture
To overcome in particular the heterogeneous data integration and service interoperability
challenges to disease mapping, the senior authors proposed a disease mapping
architecture illustrated in Figure 2.1. The architecture contains four tiers: a data storage
tier, an ontology engine tier, a standard health services tier, and a maps and animation
tier.
Figure 2.1: Disease mapping architecture
(This architecture includes a data storage tier, an ontology engine tier, a standard health services tier, and a maps and animation tier.)
Data storage tier. Health data could be collected by different health organizations and
stored in files or databases. They can be accessed through the Internet or Intranet for data
sharing.

61
Ontology engine tier. The ontology engine is designed to overcome the heterogeneity
existing in the distributed health data. It provides a uniform way for the standard health
services to retrieve data. Health data matching and transformation tasks are processed by
the ontology engine.
Standard health services tier. Explicit standards are proposed to be used in this tier for
the interoperability of the disease mapping systems. OGC provides many specifications
in sharing spatial related data, which is possible to support disease data sharing.
Generally, there would be three kinds of services:
Health data processing services are responsible for analyzing the disease from spatial
and temporal aspects. Many statistical methods are used in the analysis of the disease.
Most common ones are crude morbidity ratio, and standardized morbidity ratio. Other
methods use spatial autocorrelation indicators like Moran’s I and Local G* in
detecting disease clusters [Greiling et al., 2005].
Health mapping services could serve the cartographic representation of health data to
the clients. Providing disease information through dynamically generated maps could
control privacy issues more effectively than the SVG or Java Applet technologies
which transfer the disease data to the client side.
Health registry services act as the service brokers in the service oriented architecture.
With the health registry services, all description information about health processing

62
services, and health mapping services could be published and discovered
conveniently through uniform interfaces.
Maps and animation tier. It provides the spatio-temporal maps for the health
practitioners and public in their decision making process. Ogao [2006] categorized three
types of animation methods from "low" to "high" according to the respective levels of
interactivity and complementary domain knowledge that each of them offers to the user:
passive, interactive, and inference-based animations. Through visualization tools like
maps and animation, people could generate hypotheses in disease studies and seek the
explanatory factors, which is important in decision making. The ability to share maps or
animations in a distributed environment could also provide a collaborative mechanism in
preparation, response, and recovery stages of disease control.
2.2.2 Study Area and Data Description
The province of New Brunswick, Canada and the state of Maine, U.S.A. are the study
areas. They share a common, highly travelled territorial border. There are significant
volumes of goods and people travelling across this international border and infectious
agents are easily carried across both sides. To assure the privacy of the health data,
different health organizations or users have different rights in accessing detailed levels of
health data. There will be different levels of privilege in dealing with visualizing and
tracking the levels of health data.
63
In this study, six levels of administrative/census areas that cover the entire territory of
both sides were chosen. New Brunswick is organized into "Province", "Health Region",
"Census Division", "Census Subdivision", "Forward Sortation Area", and "Dissemination
Area" geo-layers. In Maine, the corresponding levels are "State", "Health Service Area",
"County", "County Subdivision", "Zip Code", and "Census Block Group" respectively.
The data for infectious disease mapping used in this study includes disease data,
population data, and six levels of geometric boundary data. The infectious disease data
for New Brunswick are represented by the hospital discharge data recorded for the New
Brunswick Department of Health between 1997 and 2002. The corresponding Maine data
were collected through the research partners at the University of Southern Maine. The six
levels of geometric boundary data for New Brunswick were obtained from Service New
Brunswick, Statistics Canada, and Canadian Geospatial Data Infrastructure (CGDI) portal.
The six levels of geometric boundary data for Maine were obtained from the American
National Spatial Data Infrastructure (NSDI) portal. The population data of New
Brunswick and Maine were acquired from Statistics Canada and the U.S. Census Bureau
respectively.
2.2.3 Spatio-temporal Data Model and Data Matching
The spatio-temporal object-oriented data model can provide a uniform way to manage
spatio-temporal data and support better data management and analysis. The spatio-
temporal object-oriented data model used in this study is shown in Figure 2.2. The

64
Disease class, which describes the disease characteristics, could be extended to its
subcategories of disease such as Infectious disease and Respiratory disease. By
comparison, a Disease event is a spatio-temporal object that relates to a certain kind of
disease. It is the activity that associates with a certain kind of disease, such as a hospital
observation, training and education service to patients. It includes the patient and the time
information. Time could be an instant or interval. Patient is related to the disease case
location. Location could be an administrative area or geo-coding point. Administrative
area could be national level, provincial level, county level, etc.
Figure 2.2: Spatio-temporal data model for disease data
(This data model is an object-oriented model and used for the data integration.)
We integrated the data from New Brunswick and Maine mainly through a common
schema integration approach. All the attributes in describing disease, disease event,
patient, time, and the six administrative geographical levels of both sides were specified.
For instance, in constructing the jurisdiction of Health Region, common attributes such as

65
name, spatial boundary, state/province code, and vaccine stock are described. Moreover,
a data dictionary was built to match the similar world facts with different definitions to
the common schema. For example, the postal code attribute used in New Brunswick and
zip code attribute used in Maine were matched to the postcode attribute in the common
schema. Through the data matching, the Maine data and New Brunswick data would then
be handled in the same way.
2.2.4 Statistical Methods for Data Processing
This study concentrated on the spatial, temporal, and demographic factors and their
influence on the infectious disease outbreak, which could show the disease distribution
with spatial, temporal, age, and gender differences. The statistical methods used are basic
statistical calculations of disease rates, as more complex methods would delay the
response time in the online mapping process. These statistical methods are the following:
Crude Morbidity Rate (CMR), Normalized Morbidity Ratio (NMR), Age-Specific
Morbidity Ratio (ASMR), Age-Adjusted Morbidity Ratio (AAMR), and Standardized
Morbidity Ratio (SMR) (See Section 3.4.3.2 for details on these).
The purpose of these statistical methods is to provide a standardized legend (pattern
/color) for data representation across temporal, spatial, and jurisdictional layers. The
disease data used are in point patterns, which were generated through geo-coding process
with the postal code and/or geo-coded civic addresses. Since the name of the postal code
may change over time, considerations the spatial location of postal code and/or geo-

66
coded civic addresses were taken to ensure the geo-coding quality. With the "point-in-
polygon" spatial operation, it is easy to roll up data and calculate disease cases in relation
to certain administrative boundaries. The above five statistical methods were used to
calculate the statistical values of disease rates. These statistical values could be expressed
through disease mapping variables related to time (e.g., annual, seasonal, monthly,
weekly, daily), gender (e.g., male, female, both), age group (e.g., 0-4, …, 85+, total),
geographical level (e.g., Dissemination Areas / Census Block Group, Census Divisions /
County, etc.), and/or disease type (e.g., influenza). In the classification maps or charts,
the generated thematic maps were based on the above multiple disease mapping variables.
Processing time is also an important factor for online infectious disease mapping, as it
takes time to calculate the statistical values. Taking this into account, two flexible
interfaces have been developed for obtaining the statistical results. For pre-computed
cases, the system could respond in real-time. In such a case, the statistical values of the
pre-defined conditions (spatial level, age group, etc) have already been calculated. The
other situation is more flexible and is processed in real-time. Users can define the
parameters (certain time interval, specific age group, etc) according to their requirements.
In addition, a cache mechanism was developed to maintain calculated statistical values.
Data warehousing can be used as an alternative approach to improve the processing
performance.

67
2.2.5 OGC Services for Disease Mapping
The OGC Web Map Service (WMS), Styled Layer Descriptor (SLD), and Web Map
Context (WMC) were implemented for the disease mapping and sharing in this study.
WMS publishes its ability to produce maps rather than its ability to access specific data
holdings, and generates spatially referenced maps dynamically [OGC, 2001]. SLD allows
user-defined symbolization in producing maps [OGC, 2005a], which makes it possible to
integrate maps from different WMS in the same style. WMC uses Extensible Markup
Language (XML) based context documents including information about the servers
providing layers in the overall map, the bounding box, and map projection shared by all
the maps, and these provide sufficient operational metadata for clients to reproduce the
maps [OGC, 2005b].
2.3 Results
This study dealt with the visualization of infectious disease spatio-temporal outbreaks
and propagation across New Brunswick and Maine in different resolutions, through the
implementation of a service oriented online infectious disease mapping and sharing
system. The implemented framework is shown in Figure 2.3. All the WMS services could
be registered in the health portal for user access. Through the health portal, users could
obtain disease maps from the desired WMS that distributes over the Internet, and share
the acquired WMS maps with others through WMC.

68
Figure 2.3: Implemented mapping and collaboration framework
(The framework contains client side, health portal and application server.)
2.3.1 Web Map Service Support
The most important operation in the Web Map Service is GetMap. It supports the
parameters for getting images in certain spatial extent, time, coordinate reference system,
style, image height, image width, and image format. To maintain the flexibility of
showing the maps in different styles, SLD supports user-defined symbolization in
representing the data in maps. For instance, multiple disease maps accessed from
different WMS Services can be represented using the same cartographic style.
In the infectious disease mapping process, several mapping variables, including age
group, statistical method, and gender need to be considered. However, the standard Web
Map Service could not support parameters such as disease type, gender, and statistical
method, among others. For the integration of Web Map Services in the disease mapping,
a convention was developed to name map layers. As to different combinations of gender,

69
age, geographical level, disease type and statistical method variables, a distinct WMS
layer name is assigned to each of them through customized encoding rules. The Web
Map Service parses the infectious disease mapping parameters from the layer name. As
the service is compatible with WMS, thematic disease maps could be accessed by a
health portal or any OGC compatible clients. Figure 2.4 shows the classification map
retrieved from a Web Map Service which describes Crude Morbidity Ratio distribution of
all the cells with the parameters (Dissemination Area / Census Block Group level, year
2000, Crude Morbidity Ratio, all age group, influenza). Figure 2.5 shows the Crude
Morbidity Ratio distribution of year 2001 with the same parameters. By comparing
different mapping variables at different times and geographical levels, users can visualize
the pattern and movement of the infectious disease.

70
Figure 2.4: Crude Morbidity Ratio 2000
(It represents Crude Morbidity Ratio (population constant is equal to 1) distribution of all the cells with the parameters (Dissemination Area / Census Block Group level, year 2000, all age group, influenza).)
Figure 2.5: Crude Morbidity Ratio 2001
(It represents Crude Morbidity Ratio (population constant is equal to 1) distribution of all the cells with the parameters (Dissemination Area / Census Block Group level, year 2001, all age group, influenza).)

71
In addition, simulated influenza outbreak data (including the influenza cases, other data
such as grocery retail, grocery supply, fuel retail, fuel supply, school, pharmacy and
hospital beds occupation) based on influenza statistics from 1968 (approximately 35%
infection rate) were generated and published through WMS. Hosted by the Emergency
Measures Organization of the Province of New Brunswick, Exercise "High Tide" enlisted
many participants to test this real-time decision making environment in the simulation of
a disease outbreak. This environment simulates the diffusion of the disease at different
days using animated mapping. The animation was achieved by using the time tag in
WMS services. Users can select a start date and map switch interval to view the disease
map animation, or choose a certain day to show the disease map. In the generation of the
disease maps, this environment supports data aggregation and representation to certain
levels, such as Maine/NB and Health Region, in different days. With the specified user
request, mapping values in the database temporal tables (which stores the geometry data
and mapping attribute values) will be updated synchronously with a lock mechanism and
disease maps will be created. Meanwhile, the maps of facilities like grocery stores and
ambulance locations could be obtained from a WMS. Figure 2.6 shows the school
absenteeism chart obtained from a Web Map Service on top of the thematic disease map,
and the background image was also retrieved from a WMS provided by Demis, a
European company. The convenient disease map access and integration could be
achieved by using the standard WMS.

72
Figure 2.6: Web Map Service integration
(It is integrated from three WMS services that produce school absenteeism charts, thematic disease maps, and world boundary maps.)
2.3.2 WMC for Sharing Disease Maps
Collaboration is very important in disease decision-making. The sharing of disease maps
allows users to discuss readily how to prepare for and respond to disease outbreaks.
Following the previous work of developing an online GIS discussion forum for public
participation [Tang et al., 2005; Zhao and Coleman, 2006], the senior authors integrated a
discussion forum with CARIS Spatial Fusion Enterprise in a health portal, which can
access and distribute disease maps from WMS. Compared with pure text, maps are more
attractive in sharing certain types of ideas with others. The portal allows users to
exchange ideas with text as well as maps (see Figure 2.7). The Spatial Fusion Enterprise
is used for accessing disease maps from different WMS services. In addition to the

73
ordinary forum functions, this forum provides the capacity to view disease maps and
attach the current map view of Spatial Fusion Enterprise to a user’s topic.
Figure 2.7: Discussion forum for decision making
(After users click the “launch forum” button, they could log into the forum and share maps and text with others.)
The service level sequential diagram of this system is shown in Figure 2.8. After the
users log into the health portal, they can request the disease maps that they need in their
application. The health portal will invoke the appropriate WMS and show disease maps
to the users. If users want to share the maps, they can launch the discussion forum and
attach the disease maps to a posted topic. The health portal would generate a unique ID to
the shared disease maps and save the parameters rather than the maps in obtaining the
disease maps through WMC. WMC stores the parameters in XML with general element

74
for layer-independent context and a sequential layer list for specific details about each
shared layer. Afterwards, when other people visit the forum and click the map button in a
certain topic, the health portal will parse the corresponding WMC document, obtain the
disease maps, and show them in the viewer.
Figure 2.8: Service level sequential diagram for disease data sharing
(After users log into the forum, they can obtain disease maps and share them with others. Each shared map is given a unique identification.)
2.4 Discussion
With the implementation of the standard service oriented disease mapping architecture,
sharing disease data through the distributed network can achieve high flexibility and
interoperability. The health services could be defined in fine granularity and composed

75
into service chains for satisfying the requirements of different applications. In disease
studies, health organizations could generate their own disease mapping and processing
services compatible with OGC specifications and register them in a common catalogue.
In this way, the cost of disease data collection and analysis can be shared. At the same
time, the ability and options for collaboration have been greatly improved.
Using the statistical methods for data processing, disease data can be aggregated to
certain levels to be mapped. The thematic maps and map animation are used to show the
disease information and protect the confidentiality of disease data. Disease information
cartographic representation was generated in this project based on health users’ needs.
By proposing an OGC-compliant architecture to implement Web-based health services,
the issues of reusability, integration and interoperability of services were well handled in
this project. Moreover, the services could be enriched based on the continuous
development of OGC specifications. Other OGC standard services -- for example, Web
Processing Service (WPS) for processing functions and Web Catalogue Service (WCAS)
-- will be implemented in future health applications.
Data heterogeneity problems always occur in the data collection processes of different
health organizations. This case study accomplished a low-level integration by converting
the data from both sides to a common schema. It solved schematic and syntactical
heterogeneity issues, but did little to address semantic heterogeneity. Building a standard
ontology for the spatio-temporal disease data would enable the concept-based sharing of

76
disease data, solving the semantic heterogeneity problems (cognition and naming
differences).
The senior authors are currently integrating a health model with the OGC geospatial data
model in generating standard ontology to support better sharing and integration of disease
data. The heterogeneous data integration process will be implemented in two phrases.
After considering the semantic issues of the text information, spatial pattern and topology
will then be incorporated into the integration.
2.5 Conclusions
Recent disease outbreaks have demonstrated the need for GIS- and mapping-related
applications in public health. The World Health Organization, American Centers for
Disease Control, and Health Canada are all proactively engaged in mapping viral
pandemics and applying GIS models to global and national health policy. This research
designed and implemented a service oriented online disease mapping architecture which
is loosely coupled and interoperable. This architecture supports reusability of health
disease data mapping and analysis functions to lower the cost of building huge
independent disease surveillance systems. It also enables cross-border map visualization,
analysis, and sharing disease information through interactive maps or animation in a
collaborative manner with multiple partners (public health officials, researchers, policy-
makers and the public) via a distributed network. If a real disease outbreak occurs, this
distributed disease mapping architecture can support public education, disease

77
surveillance, health care planning, emergency coordination, spatial epidemiology,
vaccine distribution, and policy initiatives at different administrative levels. If the disease
data can be updated frequently, health practitioners could obtain real-time disease maps
processed in accordance with different statistical methods and under different spatio-
temporal conditions in order to understand both the current situation and the movement
of disease. More effective collaboration with the support of disease maps over the
Internet can secure a faster response to emergency situations. A case study of infectious
disease mapping across New Brunswick and Maine has been implemented on the
proposed architecture to cope with the disease data sharing, integration and representation
challenges. More extensive implementation of standards-based Spatial Data infrastructure
(SDI) in each country could enable effective collaborative decision making and policy
planning. The development of SDI would further support this online disease mapping
architecture for decision and policy making. To improve the effectiveness and efficiency
of this architecture for disease applications, future research will concentrate on
development of geospatial disease ontology to facilitate data integration and the
construction of interoperable distributed disease services.
Acknowledgements
This research work has received financial support from GeoConnections Secretariat of
Natural Resources Canada and the United States Geological Survey for a project titled
“Mapping infectious diseases across the New Brunswick-Maine border.” Authors also
thank for the project partners: New Brunswick Lung association, New Brunswick

78
Emergency Measures Organization, and University of Southern Maine for their
contributions to this paper.
References
Bell, B. S., R. E. Hoskins, L. W. Pickle, and D. Wartenberg (2006). "Current practices in spatial analysis of cancer data: Mapping health statistics to inform policymakers and the public." International Journal of Health Geographics, 5:49. Available at: http://www.ij-healthgeographics.com/content/5/1/49, DOI: 10.1186/1476-072X-5-49.
Benneyan, J. C., D. Satz, and S. H. Flowers (2000). "Development of a web-based multifacility healthcare surveillance information system." Journal of Healthcare Information Management : JHIM, 14(3), pp. 19-26.
Bishr, Y. (1998). "Overcoming the semantic and other barriers to GIS interoperability." International Journal of Geographical Information Science, 12(4), pp. 299-314.
Blanton, J. D., A. Manangan, J. Manangan, C. A. Hanlon, D. Slate, and C. E. Rupprecht (2006). "Development of a GIS-based, real-time Internet mapping tool for rabies surveillance." International Journal of Health Geographics, 5:47. Available at: http://www.ij-healthgeographics.com/content/5/1/47, DOI: 10.1186/1476-072X-5-47.
Boulos, M. N. (2004). "Towards evidence-based, GIS-driven national spatial health information infrastructure and surveillance services in United Kingdom." International Journal of Health Geographics, 3:1. Available at: http://www.ij-healthgeographics.com/content/3/1/1, DOI: 10.1186/1476-072X-3-1.
Boulos, M. N. (2005). "Web GIS in practice III: Creating a simple interactive map of England's Strategic Health Authorities using Google Maps API, Google Earth KML, and MSN Virtual Earth Map Control." International Journal of Health Geographics, 4:22. Available at: http://www.ij-healthgeographics.com/content/4/1/22, DOI: 10.1186/1476-072X-4-22.
Boulos, M. N., and K. Honda (2006). "Web GIS in practice IV: Publishing your health maps and connecting to remote WMS sources using the Open Source UMN MapServer and DM Solutions MapLab." International Journal of Health Geographics, 5:6. Available at: http://www.ij-healthgeographics.com/content/5/1/6, DOI: 10.1186/1476-072X-5-6.

79
Edberg, S. C. (2005). "Global Infectious Diseases and Epidemiology Network (GIDEON): a world wide Web-based program for diagnosis and informatics in infectious diseases." Clinical Infectious Diseases : An Official Publication of the Infectious Diseases Society of America, 40(1), pp. 123-126.
Foody, G. M. (2006). "GIS: Health applications." Progress in Physical Geography, 30(5), pp. 691-695.
Greene, S. K., M. A. Schmidt, M. G. Stobierski, and M. L. Wilson (2005). "Spatio-temporal pattern of viral meningitis in Michigan, 1993-2001." Journal of Geographical Systems, 7(1), pp. 85-99.
Greiling, D. A., G. M. Jacquez, A. M. Kaufmann, and R. G. Rommel (2005). "Space-time visualization and analysis in the Cancer Atlas Viewer." Journal of Geographical Systems, 7(1), pp. 67-84.
Gupta, R., and R. Shriram (2004). "DISEASE SURVEILLANCE AND MONITORING USING GIS." Proceedings of 7th annual international conference Map India 2004, New Delhi, India, January 28-30.
Inoue, M., S. Hasegawa, A. Suyama, and S. Meshitsuka (2003). "Automated graphic image generation system for effective representation of infectious disease surveillance data." Computer Methods and Programs in Biomedicine, 72(3), pp. 251-256.
Kamadjeu, R., and H. Tolentino (2006). "Web-based public health geographic information systems for resources-constrained environment using scalable vector graphics technology: A proof of concept applied to the expanded program on immunization data." International Journal of Health Geographics, 5:24. Available at: http://www.ij-healthgeographics.com/content/5/1/24, DOI: 10.1186/1476-072X-5-24.
Koch, T. (2005). Cartographies of disease : maps, mapping, and medicine. 1st ed., ESRI Press, Redlands, Calif.
Leitner, M., and A. Curtis (2006). "A first step towards a framework for presenting the location of confidential point data on maps-results of an empirical perceptual study." International Journal of Geographical Information Science, 20(7), pp. 813-822.
Ogao, P. J. (2006). "A tool for exploring space-time patterns: An animation user research." International Journal of Health Geographics, 5:35. Available at: http://www.ij-healthgeographics.com/content/5/1/35, DOI: 10.1186/1476-072X-5-35.
80
OGC (2001). "Web Map Service Implementation Specification." Available at: http://portal.opengeospatial.org/files/?artifact_id=1058.
OGC (2005a). "Styled Layer Descriptor Application Profile of the Web Map Service: Draft Implementation Specification." Available at: http://portal.opengeospatial.org/files/?artifact_id=12637.
OGC (2005b). "Web Map Context Documents." Available at: http://portal.opengeospatial.org/files/?artifact_id=8618.
Qian, Z., L. Zhang, J. Yang, and C. Yang (2004). "Global SARS information WebGIS design and development." International Geoscience and Remote Sensing Symposium (IGARSS), 5, pp. 2861-2863.
Tang, T., J. Zhao, and D. J. Coleman (2005). "Design of a GIS-enabled Online Discussion Forum for Participatory Planning." Proceedings of Proceedings of the 4th Annual Public Participation GIS Conference, Cleveland State University, Cleveland, Ohio, USA, July 31 - August 2.
Zeng, D., H. Chen, C. Tseng, C. A. Larson, M. Eidson, I. Gotham, C. Lynch, and M. Ascher (2004). "Towards a national infectious disease information infrastructure: a case study in West Nile virus and botulism." Proceedings of Proceedings of the 2004 annual national conference on Digital government research, Seattle, Washington, USA.
Zhao, J., and D. J. Coleman (2006). "GeoDF: Towards a SDI-based PPGIS application for E-Governance." Proceedings of Proceedings of the GSDI 9 Conference, Santiago, Chile, November 6-10.

81
Chapter 3. The Canadian Geospatial Data Infrastructure and Health
Mapping♣
Abstract
Due to the recent outbreak of SARS and the danger of the pandemic Bird Flu, the ability
to strengthen health surveillance and disease control is a growing need among
governments. The development of the Canadian Geospatial Data Infrastructure (CGDI)
has shown great potential in many industries such as emergency management, public
health, disaster relief, environmental impact assessment, transportation, and land
information systems. In this research, the aims are to use the CGDI and to identify its
usability in supporting online health mapping. To identify the usability of the CGDI for
health mapping, nine usability metrics were employed. The senior authors also designed
an architecture based on the CGDI to support the basic functions for health mapping, and
implemented an infectious disease simulation for New Brunswick and Maine. Within the
CGDI framework, this research enabled cross-border visualization, integration, sharing,
and exploring of an infectious disease outbreak through thematic maps. Based on the
experience of the developers and the feedback from users, an evaluation of the usability
matrix with the CGDI components (technical standards, national framework data,
enabling technologies, and common data policies) was explored using this cross-border
health mapping application. The use of the CGDI in health applications has great
♣ Originally published as: Gao, S., D. Mioc, X. Yi, F. Anton, E. Oldfield, and D.J. Coleman (2008). “The Canadian Geospatial Data Infrastructure and health mapping.” European Journal of Geography (CyberGeo), 17 pp. Available at: http://www.cybergeo.eu/index21123.html, article 434.
82
potential in supporting effective and secure health data sharing and integration.
Enrichment of the CGDI would further facilitate the data sharing and improve decision
making efficiency and effectiveness.
3.1 Introduction to the Canadian Geospatial Data Infrastructure (CGDI)
Spatial data have a reference to geographical locations in space, which helps in the
understanding of the “where” problem, i.e., the spatial location and area of some features,
and the spatial distribution and correlation of some phenomena. According to the United
States General Accounting Office, almost 80 percent of all government information has a
geospatial context [GAO, 2003]. Analyzing government information with spatial data has
shown great prospects in many areas such as emergency management, human health and
environment, disaster relief, transportation, land information systems, etc. Thus, it could
be quite useful to integrate spatial data for decision making processes in public health
practice.
The complexity of spatial data, the diversity and heterogeneity of spatial data sources and
spatial data formats create barriers for users of the CGDI in the public health domain.
With the rapid development of geospatial science and Web-based technology, it is now
possible to share geospatial information through a distributed network. The CGDI is a
framework that facilitates the sharing of Canada’s spatial data through the Internet. Since
spatial data are collected by different levels of government and organizations, housing all
the spatial data in a central data warehouse would be too costly and risky. The CGDI
does not host all the spatial information in a central data warehouse, but attempts to

83
create an interoperable infrastructure that allows various communities to share geospatial
information. The CGDI is composed of four key components: technical standards,
national framework data, enabling technologies, and common data policies
[GeoConnections, 2006a]. Technical standards guide the sharing of location based
information in an interoperable way. National framework data is the base component of
the CGDI, and it is integrated from different providers. Enabling technologies are used to
develop online applications based on the endorsed standards. Common data policies are
agreed by various agencies to reduce data duplication and support data sharing. The
vision of the CGDI is “to enable access to authoritative and comprehensive sources of
Canadian geospatial information to support decision making” [GeoConnections, 2005a].
3.2 Health Mapping and Geospatial Aspects
Since Dr. John Snow combined geospatial information to analyze cholera deaths about
150 years ago [McLeod, 2000], integrating disease studies with the geographical aspect
has received great attention. Cliff and Haggett [1988] illustrated atlas of disease
distribution (such as respiratory tuberculosis, malaria, and measles) in analyzing the
epidemiological data. The geographical understanding and exploring of diseases are very
useful with recent outbreaks of Human Immunodeficiency Virus (HIV) / AIDS and
SARS [Gould, 1993; Banos and Lacasa, 2007]. Geographical studies in health can deal
with many factors such as determining the disease distribution, spatial and temporal
clustering, spatial and temporal trends, spatio-temporal disease modeling, and analyzing
health facility capacity.

84
1) Disease mapping can represent disease incidences using locations, classify disease
information into different levels, or display disease distribution information with charts.
Choropleth maps are usually used to depict patterns of disease rates, and spatial
continuity is assumed to generate smooth maps [Boulos, 2004].
2) The excess of cases in space (a geographical cluster), in time (a temporal cluster), or in
both space and time is called a cluster [Boulos, 2004]. Spatial clustering helps in the
detection of prevalence regions of the disease. Many spatial clustering algorithms have
been implemented so far, such as the Geographical Analysis Machine method [Openshaw
et al., 1987] and the spatial scan statistic method [Kulldorff, 1997], while others are for
aerial data like the cluster detection based on Geary’s c and Moran’s I methods.
Temporal clustering aids in understanding how the disease emerges in time. Spatio-
temporal clustering is a challenge as it integrates the space dimension with the time
dimension, and many knowledge discovery and data mining methods have been applied
to it [Neill et al., 2005].
3) Analyzing spatio-temporal trends can explain how the peak of a disease moves from
one region to another through time. Generally, two methods are used in visualizing the
spatio-temporal trend of a disease [Cromley and McLafferty, 2002]. One is to use map
sequences, a series of maps showing the disease distribution at different time points. The
other way uses animation technology, with visualized maps of a disease as it passes
through a certain time interval. Ogao [2006] mentioned three types of animation methods:

85
passive, interactive, and inference-based animations according to the levels of
interactivity and complementary domain knowledge that each of them offers to the user.
4) Spatio-temporal modeling can be used to predict disease outbreaks and the diffusion of
a disease. The approaches used in spatio-temporal modeling include stochastic modeling
methods, logistic regression methods, Bayesian methods, etc [Kleinn et al., 1999; Yang et
al., 2005; Yu and Christakos, 2006]. Moreover, some recent studies use artificial
intelligence techniques in disease simulation [Yergens et al., 2006]. Various kinds of
factors can be examined in the disease modeling process, such as Normalized Difference
Vegetation Index (NDVI), air pollution, temperature, race, and income.
5) Health facility capacity analysis includes applications such as mapping health service
locations and needs, identifying new sites for health facilities, and finding the nearest
clinic location [Cromley and McLafferty, 2002].
3.3 Usability Metrics
According to the ISO-9241-11 standard, system usability is measured by “the extent to
which the intended goals of use are achieved, the resources that have to be expended to
achieve the intended goals and the extent to which the user finds the use of the product
acceptable” [ISO, 1998]. Hunter et al. [2003] introduced approximately 40 elements
about spatial data usability. Considering the geospatial aspects in health mapping, the
important goal is to achieve effective and secure health data sharing. Taking this goal into
86
account, the following nine elements were designed in evaluating the usability of the
CGDI (including technical standards, national framework data, enabling technologies,
and common data policies) in health mapping.
1. Cost. Cost means the users’ expenses for their applications and plays an important
role in the factors of usability. A flexible data sharing network could increase the
reuse of data and service, which can reduce the cost of data collection. The relatively
low cost of data access is very attractive to users.
2. Accessibility. Accessibility means the quality of accessing the standards, data, and
services. Accessibility determines how users are likely to use the information.
Common interfaces and well maintained metadata would facilitate the discovery and
access of the required data and services.
3. Response time. In emergencies, timely access to data has received great attention.
Processing time and transmission time are the two primary concerns in data
dissemination. The increase in computer processing power and the development of
optimal algorithms will improve the processing time. The transmission time depends
on the network topology, data compression methods, and progressive transmission.
4. Data quality. Data are likely to be collected by different authorities or organizations,
with different levels of resolution. According to ISO 19113 principles [ISO/TC 211,
2002], the quality elements of spatial data include completeness, logical accuracy,
positional accuracy, temporal accuracy, and thematic accuracy. High resolution data
are essential in the modeling and statistical analysis of geospatial health applications.
5. Reliability. The trust and quality of the data and service access are considered in
many applications. Highly availability of the data and services is important in the use

87
of them.
6. Exchangeability. Exchangeability deals with the quality of the capacity to exchange
information. Standards are useful in the exchange of information.
7. Interoperability. Interoperability is the ability to communicate, execute programs, or
transfer data among various functional units, even though the user has little or no
knowledge of the unique characteristics of those units [ISO, 1993]. Good
interoperability ensures that the contents are understandable.
8. Cartographic Representation. The representations of spatially related information
in two to three dimensional maps or graphics can give a vivid way to understand the
information.
9. Security. Security is used to protect the privacy and confidentiality of data and
services, and it is a fundamental principle for most applications. While considering
the security factor, the efficiency of data access should not be greatly affected.
3.4 Design and Implementation of Health Mapping Applications on the CGDI
3.4.1 Standards in the CGDI
To address spatial data sharing and interoperability, international organizations such as
the Open Geospatial Consortium (OGC) and ISO/TC 211 are working on the construction
of basic standards and application specifications. The ISO/TC 211 group works more on
abstract standards, while OGC concentrates on the implementation specifications
[GeoConnections, 2005b]. The main standards that the CGDI adopts are from the ISO/TC
211 and OGC.

88
The CGDI-endorsed specifications fall into the following categories.
1. Data representation. Web Map Service (WMS) provides standard interfaces for
producing maps [OGC, 2006a]. Styled Layer Descriptor (SLD) enables named or
user-defined styles in symbolizing geospatial features [OGC, 2005a].
2. Data access. Web Feature Service (WFS) supports feature level geospatial data
operation [OGC, 2005b]. Web Coverage Service (WCS) provides access to coverage
data such as remote sensing images and digital elevation data [OGC, 2006b].
3. Data manipulation. Web Processing Service (WPS) supports spatially related data
processing through the Web [OGC, 2007].
4. Data discovery. Geodata discovery service and catalog service are used for retrieving
geospatial data and services. The Federal Geographic Data Committee (FGDC)
Content Standard for Digital Geospatial Metadata (CSDGM) [FGDC, 1998] and ISO
19115 [ISO/TC 211, 2003] are used as metadata standards.
3.4.2 Architecture Design
Since disease outbreaks are usually spatially distributed, using the geographical
information framework for the development of Web-based health systems could improve
health data sharing, outbreak detection, and disease control. Based on the above
mentioned metrics, the purpose of this research is to design an application to evaluate the
usability of the CGDI in health mapping. The architecture design uses CGDI-endorsed
standards for health data sharing and supporting health decision making. This architecture
provides the basic functions for geospatial health applications including thematic

89
mapping, spatio-temporal processing, spatio-temporal trend representation, and health
facility distribution.
Figure 3.1: Architecture design
Figure 3.1 shows the architecture designed by the senior authors. Spatially related data
can be accessed from the Web Services provided in the CGDI. In health applications,
new Web Services such as WMS, WFS, WPS, and WCS can be created. These services
can be registered to the CGDI. The health portal is used for service integration and map
visualization.

90
3.4.3 Implementation of a Health Application
3.4.3.1 Study Sites and Data Description
Experience with infectious disease outbreaks, especially the recent SARS outbreak, has
demonstrated the increasing concern with infectious diseases, which needs an
international strategy [Fidler, 2003]. The Province of New Brunswick (Canada) and the
State of Maine (USA) are the study sites, which share a common, highly traveled
international border. Since people are more likely to visualize information based on
jurisdiction regions, the administrative areas were used as the infectious disease mapping
boundaries. Different health organizations or users require different levels of details of
health data. Meanwhile, considering the privacy of health data, certain different health
organizations or users can only access and track certain levels of health data. Thus, six
level administrative/census areas that cover the entire territory of both sides of the border
were chosen. The six levels of New Brunswick are Province, Health Region, Census
Division, Census Subdivision, Forward Sortation Area, and Dissemination Area. In
Maine, the corresponding levels are State, Health Service Area, County, County
Subdivision, Zip Code, and Census Block Group. The province or state is the top level.
The health region / health service area level is the location of the patient’s hospital in the
classification system. The census division / county level is the joint group of neighboring
municipalities merged together for the purpose of regional planning and managing
common services (such as police or ambulance service). The census subdivision/county
subdivision level is the municipalities or areas treated as municipal equivalents for
statistical purposes. The Forward Sortation Area /Zip Code is assigned to one or more
postal zones. The dissemination area / census block group level is the relatively stable
91
geographical unit composed of one or more blocks (the smallest geographical areas for
which population and dwelling counts are disseminated).
The data used in both sides include spatial data, census data and patient data of New
Brunswick and Maine. These data were acquired from different health departments and
Web Services from the CGDI and the American National Spatial Data Infrastructure
(NSDI). In addition, simulated influenza outbreak data for 120 days (including the
influenza cases, other data such as grocery retail, grocery supply, fuel retail, fuel supply,
school, pharmacy, and hospital bed occupation) based on influenza statistics from 1968
(approximately 35% infection rate) were generated for the spatio-temporal analysis. For
health mapping, the essential task is the geo-coding process, which locates patient data
from the recorded streets or postcodes. After the geo-coding, it is possible to roll-up the
patient data or other data sets through the bottom-up choice using spatial operations to
analyze spatial adjacency relationships such as point in polygon, polygon in polygon, etc.
This also helps to protect confidential data sets by aggregating patient data to a health
region or polygon.
3.4.3.2 Mapping Variables for Health Data Processing
The first step towards the understanding and explanation of any geographical
phenomenon is thematic mapping [Benenson and Omer, 2003]. For decision making on
disease outbreaks, there are many factors that would influence the mapping results, such
as identifying population density, health inequalities, racial tendency, environmental
pollution, social recognition, economic development, and cultural differences. In this

92
research, the senior authors mainly concentrated on demographic factors and their
influence on the disease outbreak. Other factors were not currently integrated, as low
frequency values would negatively impact classification methods.
The following established statistical methods were employed in the analysis:
a) Crude Morbidity Rate (CMR): the total number of incidents relative to the total
population in their population group (Equation 3.1). I is the sum of patients for
each geo-cell, riskP is the population-at-risk total for each geo-cell, and constρ is the
Population Constant (e.g., 1, 1000).
risk
const
PICMR ρ×
= (3.1)
b) Normalized Morbidity Ratio (NMR): the Z-Score of the Crude Morbidity Rate
(Equation 3.2), with the value of the CMR geo-cell value minus the arithmetic
mean of X (the total CMR geo-cell distribution), divided by the standard deviation
(of the total geo-cell distribution).
( )⎟⎠⎞
⎜⎝⎛ −
=σμχNMR (3.2)
c) Age-Specific Morbidity Ratio (ASMR): the number of incidents ( iC ) in age
interval i, divided by the midyear population ( iP ) in age interval i (Equation 3.3).
i
i
PCASMR = (3.3)
d) Age-Adjusted Morbidity Ratio (AAMR): weighted average of the Age-Specific
Morbidity Ratio (Equation 3.4) where the Age-Specific Weights (Equation 3.5)
represent the relative age distribution of the standard population.

93
∑ ⋅=i
si ASMRWAAMR (3.4)
∑
=sii
sisi P
PW (3.5)
e) Indirect Standardized Morbidity Ratio (ISMR): the crude ratio of the standard
population ( sR ) multiplied by the total number of influenza cases ( C ) in the
observed population, divided by the age-specific morbidity ratio in age interval i
in the standard population times the population ( iP ) of age interval i in the
observed population (Equation 3.6).
∑ ⋅
⋅=
ii
s
PASMRCRISMR (3.6)
f) Standardized Morbidity Ratio (SMR): the ratio of observed infectious cases to
expected cases (Equation 3.7).
∑ ⋅
=ii PASMR
CSMR (3.7)
g) Six kinds of univariate methods: the Summation, Mean, Standard Deviation,
Variance, Skewness, and Kurtosis of the infectious disease cases.
The purpose of these statistical methods, which were suggested by the project partner, the
New Brunswick Lung Association, is to provide a processing capacity for data
representation that is consistent across jurisdictional and temporal layers. The above
twelve statistical values are calculated. These values may be expressed by multi-
dimensional vectors: temporal dimensions (e.g., 5-years, annual, seasonal, monthly,
weekly, daily), data use dimensions (e.g., America or Canada separate data for
standardization or both), gender divisions (e.g., male, female, both), age group (e.g., 0-

94
4, … 65+, total), geographical divisions (e.g., Dissemination Areas / Census Block Group,
Census Divisions / County, State/Province, etc.), and disease types (e.g., influenza). The
calculated values can be used to create thematic maps. A thematic map from selecting
one value of each dimension, such as the parameters (Census Division / County level,
Year 2002 week 1, age group 65+, Indirect Standardized Morbidity Ratio, male,
influenza, and both data used – Maine and New Brunswick), can be generated. The
calculated values can also be used to generate pie charts or bar charts, for instance, the
three age group distribution of the parameters (Census Division / County level, Year
2002 week 1, Indirect Standardized Morbidity Ratio, male, influenza, and both data used).
3.4.3.3 Health Mapping Results
With the health facility data published by WMS, WFS, or WCS, and the statistical
processing functions provided by WPS, health data could be accessed via the Internet.
Moreover, the services can be integrated to support health surveillance. Figure 3.2 shows
a map viewer integrating two WMS (hospital distribution) and a WPS (SMR rate at the
health region level in 1999). Also, the time tag in the service could be used to achieve
animated maps. Figure 3.3 shows the time tags included in WMS maps of simulated data
on day 20 of the disease risk level and the hospital bed information. Figure 3.4 shows the
WMS maps of the same data on Day 80.

95
Figure 3.2: WPS and WMS integration
Figure 3.3: WMS with time tag for simulation on day 20

96
Figure 3.4: WMS with time tag for simulation on day 80
3.5 Discussion
Hosted by the Emergency Measures of the Province of New Brunswick, an exercise of
“High Tide” enlisted many participants to test the decision making environment within
the framework of the CGDI. With the experience from the developers in this health
mapping application and the feedback from the users participating in the “High Tide”
exercise, the senior authors developed a matrix that links usability metrics to the four key
components of the CGDI in health mapping, as shown in Table 3.1.

97
Table 3.1: Matrix linking usability metrics to the CGDI components
CGDI Metrics
Technical standards
National framework data
Enabling technologies
Common data policies
Cost (to users) Low Low Low Medium Accessibility High High High High Response time N/A N/A Medium N/A Data quality N/A Medium N/A N/A Reliability High Low High Medium Exchangeability High High High High Interoperability Medium Medium Medium N/A Cartographic representation
Medium Medium Medium N/A
Security Low High High Medium
In terms of technical standards, the CGDI adopted many international standards in
describing, publishing, visualizing, accessing, and manipulating geospatial resources. The
standards are highly accessible through the Internet. Meanwhile, the standards are
developed version by version with good reliability. In health mapping, sharing the data
through the standard interfaces is convenient for data access. CGDI-endorsed standards
have been successfully applied to health data mapping as described in this study. As a
result, it is possible to keep low the development cost of standards-based health mapping
applications within the CGDI framework. With these standards, access to health data
could be achieved through standard interfaces which make the information exchange very
easy between different organizations. However, these standards mainly solve the
problems of syntactical heterogeneity, i.e., different data structures and formats in various
systems. To achieve semantic interoperability in health fields still requires the
development of geospatial health ontologies. As to cartographic representation, CGDI-
endorsed standards support various representation formats, such as JPG, GIF, PNG,
GeoTiff, so the cartographic representation of health data can be done without difficulty.

98
However, thematic mapping support is relatively weak in CGDI-endorsed standards. The
SLD standard only supports classification maps, and gives no standard way in generating
chart styles. Meanwhile, it is better to develop some thematic mapping standard for
health mapping, such as defining some standard symbologies or color ramps in
describing specific kinds of health information. Moreover, the development of multi-
media standards including sound can support better understanding of social phenomena.
In regard to security, currently there are few related standards under the CGDI.
The national data framework is the core of the CGDI. One principle of the CGDI is to
“collect data once, share many times” [GeoConnections, 2006a]. It is estimated that up to
80 percent of the cost of geospatial applications is spent on the spatial data collection
process. The spatial data collection cost used in health data mapping can be shared with
many other departments who use these data, such as forestry departments, agricultural
departments, emergency departments, etc. With the shared cost and less redundant work,
the data collection cost is relatively low.
Through the GeoConnections Discovery Portal1, geospatial data and services can be
discovered using keywords, location, and/or theme. The CGDI encourages organizations
that are closest to the source to provide the data. This encouragement could provide users
with the data in good quality and precision, and eliminate duplication and overlap
problems. Accurate spatial data is important for analyzing health information. Geo-
1 http://geodiscover.cgdi.ca/gdp/

99
coding is often used to map health records to their geographical locations. Spatial data are
kept updating in the CGDI, and the feasibility to obtain data accurately and timely from it
can be beneficial to health decision making. Sometimes, different versions of spatial data
exist in the CGDI, and the update frequency is also a problem. Both difficulties lead to
the reliability problem of data quality. As different laws govern access and use of public
health information, the CGDI is not so comprehensive in providing health data. There are
also some reliability problems with the CGDI. Although there are lots of geospatial data
and services existing in the CGDI, the availability and performance of the data access are
unknown.
In the health field, the current standards and rules for dealing with spatially visualizing
confidential information are seriously limited [Leitner and Curtis, 2006]. This study used
the statistical and geographical mask with data aggregations to certain levels for
visualization to maintain the privacy of health information. When compared with original
data, the aggregated results expressed to different levels of spatial resolution might show
some differences. With the CGDI-endorsed standards (WMS, SLD, WFS, WPS, and
WCS), health data could also be easily shared with different planning or health
departments. Health data in the CGDI are exchangeable as shown in the cross border
application, since the WMS service is compatible with the American NSDI as shown in
the case study. The cartographic representation of the data, which conforms to the
technical standards, is satisfactory for visualization. The SLD standard can solve the
possible style problems with data access from different services. In the CGDI, data are

100
stored in a distributed environment rather than a central database, so the security is
greatly enhanced to overcome a central database crash.
Presently, the enabling technologies in the CGDI use the distributed service oriented
architecture. The Web Service technology is mature and is easy to implement. These
technologies are highly accessible and reliable in Web environments. Most geospatial
health information systems have used thin client or thick client architectures, and it is
usually difficult to reuse and integrate them. With the adoption of the service oriented
architecture, reusability and integration can be greatly improved. However, the response
time of Web Services is not so satisfactory due to their platform neutral implementation.
The semantic based service and data integration is not mature yet; thus, the semantic
interoperability still needs development. The use of Web-based technology is acceptable
for representation and visualization, but it is not quite suitable for cartography, e.g.,
printing high quality maps. Cartographic consideration is often overlooked in many Web-
based mapping applications. Since the enabling technologies protect security through
Web secure services, good security could be achieved.
The common policies harmonize the access and use of geospatial information in the
CGDI, and they have good accessibility for people to participate and use the CGDI. The
policy making process in the CGDI considers the extensibility of the policies and the
exchangeability of the policies among other countries as well. Different jurisdictions have
different laws governing access and use of public health information, so specific policies
need to be developed for cooperative mechanisms in preventing, tracking, and responding

101
to the disease outbreak. Some policies still need to deal with reliability problems, such as
whether the services are running or not and whether the data are updated or not. As to
security issues, the policies do not mention at which level or type, geospatial data should
be kept secure. The policies for public health data representation are highly valuable
because of the confidentiality issues.
3.6 Conclusions
Recent disease outbreaks have demonstrated the need for geographical applications in
public health. Public health is one of four priority applications at GeoConnections in the
development of the CGDI [GeoConnections, 2006b]. In this research, health data sharing
applications were implemented based on the CGDI framework to evaluate the usability of
the CGDI in health mapping. This research will foster the use of the CGDI in health
studies and the implementation of new Web Services for public health within the CGDI
for online data sharing and access. The information provided by the CGDI will be more
comprehensive with the enrichment of health data. Currently, few studies concentrate on
the usability of Spatial Data Infrastructure (SDI), and this study might bring a novel
approach by using the feedback of developers and users in the evaluation process. The
CGDI usability metrics were measured mainly based on the applications. In the future
usability evaluation of SDI, more comprehensive and in-depth metrics and methodologies
should be considered for better evaluation.
The health mapping application based on the CGDI can lower the cost of data sharing,
use the standard for data access, and provide real-time map visualization to users. This

102
study shows the high usability of the CGDI in supporting disease management and
decision making to local, provincial/state, and national officials, and the public. The
quality of the cartographic representation in this application is limited by the capabilities
of Web-based GIS, and it still has to be improved to enhance the understanding of disease
phenomena by health practitioners and the general public. The future work will be
devoted to advancing the usability of the CGDI in health applications for data sharing.
Acknowledgments
This research work has received the financial support from the GeoConnections
Secretariat of Natural Resources Canada and the United States Geological Survey for a
project titled “Mapping infectious diseases across the New Brunswick-Maine border”.
References
Banos, A., and J. Lacasa (2007). "Spatio-temporal exploration of SARS epidemic." European Journal of Geography (CyberGeo). Available at: http://www.cybergeo.eu/index12803.html, article 408.
Benenson, I., and I. Omer (2003). "High-resolution census data: a simple way to make them useful." Data Science Journal, 2(26), pp. 117-127.
Cliff, A., and P. Haggett (1988). Atlas of Disease Distributions: Analytical Approaches to Epidemiological Data. Blackwell, Oxford.
Cromley, E. K., and S. McLafferty (2002). GIS and public health. Guilford Press, New York.
FGDC. (1998). "Content Standard for Digital Geospatial Metadata." Rep. No. FGDC-STD-001-1998.
103
Fidler, D. P. (2003). "Emerging trends in international law concerning global infectious disease control." Emerging Infectious Diseases, 9(3), pp. 285-290.
General Accounting Office (GAO). (2003). "GEOGRAPHIC INFORMATION SYSTEMS: Challenges to Effective Data Sharing." [On-line] February 21, 2010. http://www.gao.gov/new.items/d03874t.pdf.
GeoConnections (2005a). "The Canadian geospatial data infrastructure: better knowledge for better decisions." [On-line] December 20, 2006. http://www.geoconnections.org/publications/tvip/Vision_E/CG.
GeoConnections (2005b). "The Canadian geospatial data infrastructure: Architecture Description Version 2.0." [On-line] February 21, 2010. http://www.geoconnections.org/publications/tvip/arch_E/CGDI_Architecture_final_E.html.
GeoConnections (2006a). "The CGDI: Canada's GeoAdvantage." [On-line] December 20, 2006. http://www.geoconnections.org/CGDI.cfm/fuseaction/cgdiServices.whatisCGDI/gcs.cfm.
GeoConnections (2006b). "GeoConnections(2005-2010): Evolving the CGDI to meet user’ needs." [On-line] December 20, 2006. http://www.geoconnections.org/CGDI.cfm/fuseaction/aboutGcs.welcome/gcs.cfm.
Gould, P. (1993). The Slow Pleague: A Geography of the AIDS Pandemic. Blackwell, Oxford.
Hunter, G. J., M. Wachowicz, and K. Bregt (2003). "Understanding Spatial Data Usability." Data Science Journal, 2(26), pp. 79-89.
International Organization for Standardization (ISO) (1998). "Ergonomic requirements for office work with visual display terminals (VDTs) -Part 11: Guidance on usability." Avilable at : http://www.idemployee.id.tue.nl/g.w.m.rauterberg/lecturenotes/ISO9241part11.pdf.
International Organization for Standardization (ISO) (1993). "Information Technology – Vocabulary – Part 1: Fundamental terms."
ISO/TC 211. (2002) "Geographic information – quality principles." Rep. No. ISO 19113:2002.
ISO/TC 211. (2003) "Geographic Information - Metadata." Rep. No. ISO 19115:2003.
Boulos, M. N. (2004). "Towards evidence-based, GIS-driven national spatial health information infrastructure and surveillance services in United Kingdom."

104
International Journal of Health Geographics, 3:1. Available at: http://www.ij-healthgeographics.com/content/3/1/1, DOI: 10.1186/1476-072X-3-1.
Kleinn, C., J. Jovel, and L. Hilje (1999). "A model for assessing the effect of distance on disease spread in crop fields." Crop Protection, 18(9), pp. 609-617.
Kulldorff, M. (1997). "A spatial scan statistic." Communications in Statistics - Theory and Methods, 26(6), pp. 1481-1496.
Leitner, M., and A. Curtis (2006). "A first step towards a framework for presenting the location of confidential point data on maps-results of an empirical perceptual study." International Journal of Geographical Information Science, 20(7), pp. 813-822.
McLeod, K. S. (2000). "Our sense of Snow: The myth of John Snow in medical geography." Social Science and Medicine, 50(7-8), pp. 923-935.
Neill, D. B., A. W. Moore, M. Sabhnani, and K. Daniel (2005). "Detection of emerging space-time clusters." Proceedings of the ACM SIGKDD International Conference on Knowledge Discovery and Data Mining, pp. 218-227.
Ogao, P. J. (2006). "A tool for exploring space-time patterns: An animation user research." International Journal of Health Geographics, 5:35. Available at: http://www.ij-healthgeographics.com/content/5/1/35, DOI: 10.1186/1476-072X-5-35.
OGC (2005a). "Styled Layer Descriptor Application Profile of the Web Map Service: Draft Implementation Specification." Available at: http://portal.opengeospatial.org/files/?artifact_id=12637.
OGC (2005b). "Web Feature Service Implementation Specification." Available at: http://portal.opengeospatial.org/files/?artifact_id=8339.
OGC (2006a). "Web Map Server Implementation Specification." Available at: http://portal.opengeospatial.org/files/?artifact_id=14416.
OGC (2006b). "Web Coverage Service (WCS) Implementation Specification." Available at: https://portal.opengeospatial.org/files/?artifact_id=18153.
OGC (2007). "OpenGIS Web Processing Service." Available at: http://portal.opengeospatial.org/files/?artifact_id=24151.
Openshaw, S., M. Charlton, C. Wymer, and A. Craft (1987). "A mark 1 geographical analysis machine for the automated analysis of point data sets." International Journal of Geographical Information Systems, 1(4), pp. 335-358.

105
Yang, G. J., P. Vounatsou, X. N. Zhou, M. Tanner, and J. Utzinger (2005). "A Bayesian-based approach for spatio-temporal modeling of county level prevalence of Schistosoma japonicum infection in Jiangsu province, China." International Journal for Parasitology, 35(2), pp. 155-162.
Yergens, D., J. Hiner, J. Denzinger, and T. Noseworthy (2006). "Multi Agent Simulation System for Rapidly Developing Infectious Disease Models in Developing Countries." International Transactions on Systems Science and Applications, 1(1), pp. 51-58.
Yu, H. L., and G. Christakos (2006). "Spatiotemporal modelling and mapping of the bubonic plague epidemic in India." International Journal of Health Geographics, 5:12. Available at: http://www.ij-healthgeographics.com/content/5/1/12, DOI: 10.1186/1476-072X-5-12.

106
Chapter 4. Towards Web-based Representation and Processing of
Health Information♣
Abstract
There is great concern within health surveillance on how to grapple with environmental
degradation, rapid urbanization, population mobility and growth. The Internet has
emerged as an efficient way to share health information, enabling users to access and
understand data at their fingertips. Increasingly complex problems in the health field
require increasingly sophisticated computer software, distributed computing power, and
standardized data sharing. To address this need, Web-based mapping is now emerging as
an important tool to enable health practitioners, policy makers, and the public to
understand spatial health risks, population health trends and vulnerabilities. Today
several Web-based health applications generate dynamic maps; however, for people to
fully interpret the maps they need data source description and the method used in the data
analysis or statistical modeling. For the representation of health information through
Web-mapping applications, there is still no standard format to accommodate all fixed
(such as location) and variable (such as age, gender, health outcome, etc) indicators in the
representation of health information. Furthermore, net-centric computing has not been
adequately applied to support flexible health data processing and mapping online.
♣ Originally published as: Gao, S., D. Mioc, X. Yi, F. Anton, E. Oldfield, and D.J. Coleman (2009). “Towards Web-based representation and processing of health information.” International Journal of Health Geographics, 8:3. Available at: http://www.ij-healthgeographics.com/content/8/1/3, DOI: 10.1186/1476-072X-8-3.

107
The authors of this study designed a HEalth Representation XML (HERXML) schema
that consists of the semantic (e.g., health activity description, the data sources description,
the statistical methodology used for analysis), geometric, and cartographic
representations of health data. A case study has been carried on the development of Web
application and services within the Canadian Geospatial Data Infrastructure (CGDI)
framework for community health programs of the New Brunswick Lung Association.
This study facilitated the online processing, mapping, and sharing of health information,
with the use of HERXML and Open Geospatial Consortium (OGC) services. It brought a
new solution in better health data representation and initial exploration of the Web-based
processing of health information.
The designed HERXML has been proven to be an appropriate solution in supporting the
Web representation of health information. It can be used by health practitioners, policy
makers, and the public in disease etiology, health planning, health resource management,
health promotion, and health education. The utilization of Web-based processing services
in this study provides a flexible way for users to select and use certain processing
functions for health data processing and mapping via the Web. This research provides
easy access to geospatial and health data in understanding the trends of diseases, and
promotes the growth and enrichment of the CGDI in the public health sector.

108
4.1 Background
Population growth, rapid urbanization, environmental degradation, and the misuse of
antimicrobials have disrupted the equilibrium of the microbial world, causing the rise of
new emerging diseases [WHO, 2007]. Health information is very useful in helping people
to understand health phenomena, mitigate disease outbreaks, and analyze disease etiology.
However, most public health departments typically collect data as needed and maintain it
locally, and this unavoidably limits the access to important public health data for health
researchers and the public [Wu et al., 2005]. The World Health Organization [2007]
pointed out that keeping disease outbreaks secret is no longer feasible and sharing
essential health information is one of the most feasible routes to global public health
security. Sharing health information through the Web provides flexible and real-time data
access, and assists people to discover and use this information. Currently, many health
departments have begun to provide public access to their health statistics via the Internet,
and this promotes interest in user involvement and data-set exploration [Bell et al., 2006].
Some health information like morbidity and mortality indicators has become obtainable
to health professionals and the public by means of the Internet [Toubiana et al., 2005].
With the new updated health cases collected from hospitals or surveys, the Web can
distribute this information to users in real-time. Distributing and sharing health
information via the Web can assist authorities and decision makers across health
jurisdictions to collaborate in preventing, controlling, and responding to a specific disease
outbreak at both the local and national levels. Current Web 2.0 technologies can further
facilitate data sharing and collaboration between users, and the Web 2.0 mashups allow
the combination of multiple third-party services over the Web [Boulos et al., 2008;

109
Cheung et al., 2008]. An example of a mashup is the combination of bird flu case data
with Google maps to visualize the distribution of disease for health surveillance.
Health information is collected through two kinds of georeferences. One kind is the point
data which record the coordinates of disease case location. The other kind is regional data
which are collected as a summary for a geographical area. To represent health
information, especially over the Web, privacy and confidentiality concerns are given
considerable thought. Laws governing use and distribution of public health information
should be respected in each jurisdiction, and yet the need for information to support
critical decision making on public health threats like Tuberculosis, Avian Flu, and
Influenza must be met. To keep the privacy of health information while maintaining
highly informative data, health data should be represented at the aggregate level, with
high privileges to see more detailed data.
Maps are powerful tools to classify, visualize, communicate, and navigate space and/or
spatial relations in the data which would be hard to explore otherwise [Boulos, 2003].
With maps, it is easy to discover adjacent neighborhood similarities as well as spatial
patterns that are hidden in health data. Two kinds of Web-based maps exist: view-only
maps and interactive maps [Kraak and Brown, 2000]. The view-only maps are the
cartographic representation of data in images such as GIF, PNG or JPEG format.
Interactive maps can respond to some mouse actions on the map, with the technologies
such as Scale Vector Graphics (SVG,) Extensible 3D (X3D) Graphics, and Virtual
Reality Markup Language (VRML). Kamadjeu and Tolentino [2006] discussed the

110
advantages of use the SVG in Web cartographic representation, such as smaller and more
compressible files, pure XML, human readability, scalability, and support from major
industries.
From the previous study for health mapping, the senior authors found that the quality of
health data representation in Web-based GIS applications was still limited [Gao et al.,
2008a]. Even though many Web-based health applications can dynamically generate
view-only maps or interactive maps, certain information is missing for people to fully
interpret the map such as the data source description and the method used in the data
aggregation process. Consideration of the source and quality of the health data can help
health practitioners, the general public, and policy makers to evaluate the trustworthiness
of spatial analysis results [Bell et al., 2006]. In addition, scientific users want to know
details about the methodology when evaluating representations. For the representation of
health information to users, the following issues should be considered:
1) The metadata of the health information. The description of health data is important in
understanding data sources and quality.
2) The statistical methodologies used. The description of the statistical methods for
representing health data can be used to determine the quality of the results.
3) The comprehensiveness of the representation. The representation which can combine
many kinds of representations (text, maps, graphics, etc.) will assist people in exploring
the health phenomena with less misinterpretation.

111
4) The consistency of the cartographic representation. Health information should be
mapped in the same pattern regardless of platform or system.
5) The semantic meaning. Shared vocabularies or styles can eliminate different
interpretations.
Thus, a health data representation format needs to be developed to fulfill these five
requirements and enhance the sharing of health information via the Web. In the health
decision-making process, usually health data from heterogeneous sources need to be
integrated. With a suitable health information representation model that catches all the
aspects of health data, health information can be more easily understood by people and
integrated from different sources.
Meanwhile, Web-based processing could take advantage of net-centric and collaborative
computing and let users select the processing tools flexibly [Tao, 2001]. In the case that
local health departments are not familiar with statistical methodologies in health data
processing, it may inevitably take a steep learning curve to apply the processing
methodologies [Elliott and Wartenberg, 2004]. In addition, it is hard to build a system
that includes every complex function. Web-based processing allows users to select the
cost-effective processing and mapping tools to accomplish a task, without the need to
purchase advanced hardware or software. However, to date Web-based processing has
not been adequately utilized for flexible processing of health data.
112
4.2 Methods
4.2.1 XML and OGC Web Services
The sharing of health information is critical for preventing diseases, responding to
emergencies, and educating the public and policy makers. However, many health
professionals and authorities do not have tools to map health information in some cases
they cannot visualize health information to make time-sensitive decisions, since they do
not have the time, money, or skills to statistically analyze vast amounts of distributed data
and render aggregated results into a geographical interface for interpretation. XML, Web
Services, and related standards have matured, yet confidence in such technology to
visualize or share health information is only beginning to emerge.
XML, as a platform independent language, can support information interchange and
representation through the Web. XML has many advantages, such as platform and
application independence, extensibility, user-driven development, and an open standard
for data interchange via the Internet [Yu et al., 2008]. Health Level 7 (HL7) standards
promote health care information exchange through XML [HL7, 2010]. HL7 Clinical
Document Architecture (CDA) is an XML standard used to exchange clinical documents.
For example, an XML document can record the information of a patient’s allergy to
certain medicines. However, the primary domain of HL7 standards is clinical and
administrative data, and explicit spatial information and health data mapping are not
considered. Therefore, a standard format for sharing the representation of health
information in time and space is needed.

113
To overcome the disadvantages of tightly coupled systems and improve their reusability,
the concept of Service Oriented Architecture (SOA) has gained popularity recently. SOA
provides a flexible way to share data as well as processing functions over the Internet to
reduce costs of building complex systems. SOA has many benefits, such as better return
on investment, better maintainability, higher availability, flexible service assembly, more
security, and support for multiple client types [Stevens, 2010].
The Open Geospatial Consortium (OGC) initiated the Open Web Service (OWS)
program based on service oriented architectures and Web Services (a common
implementation of service oriented architectures), and has proposed several geospatial
specifications to support geospatial data sharing and interoperability, such as Web Map
Service (WMS), Web Feature Service (WFS), and Web Processing Service (WPS). WMS
publishes its ability to produce maps rather than its ability to access specific data holdings,
and generates spatially referenced maps dynamically [OGC, 2001]. WFS defines the
interfaces for the access and manipulation of geographical features and elements through
Geography Markup Language (GML) [OGC, 2005]. WPS provides standardized
interfaces to facilitate publishing, discovering, and binding geospatial services that enable
spatial processing functions across a network [OGC, 2007]. It regulates the connection
rules of input request and output response that govern the geospatial processing event.
The interfaces (GetCapabilities, DescribeProcess, and Execute) define how the client and
server can cooperate in the execution of a process and generate the processing results.
The data used in the WPS can be stored at the server side or acquired from a network.

114
Accessing health information through standard interfaces is important to achieve data
accessing and interoperability. Using the standard geospatial service interfaces, the wide
access of health information can improve the ability to intervene in health issues, inform
the public of the availability of resources, strengthen the cooperation between different
health organizations, and therefore reduce costs to the health care system.
4.2.2 HEalth Representation XML (HERXML)
The HEalth Representation XML (HERXML) schema is designed for the sharing of
health data cartographic representation, data source description, and statistical
methodologies used via the Web. There are different kinds of health activities, such as
hospital observation, laboratory tests and results, health care and medication services, and
training and education for patients. Since these activities are related to spatial location,
the proper way to support mapping of these activities is a foremost concern in
geographical health applications. In the mapping of health-related activities, statistical
methods can be used to connect health-related activities with maps. The methods to
generate maps from health-related activities need to be considered. The following
statistical methods are applied in this research: Crude Morbidity Rate (CMR),
Normalized Morbidity Ratio (NMR), Age-Specific Morbidity Ratio (ASMR), Age-
Adjusted Morbidity Ratio (AAMR), and Standardized Morbidity Ratio (SMR),
Summation, Mean, Standard Deviation, Variance, Skewness and Kurtosis. These
statistical methods consider spatial, temporal, and demographic factors and their
influence on health-related activities, which can show the health information distribution

115
with spatial, temporal, age, and gender differences. Other statistical methods can be
introduced to analyze other influential factors.
The intention is to make the HERXML schema able to support the Web-based
representation of health information for users to interpret the statistical results. Three
dimensions of representation are related with spatial data: semantic, geometric, and
graphical [Bedard and Bernier, 2002]. Therefore, these three kinds of representations
were included in the HERXML schema. Semantic representation describes the health-
related activities, data sources, and the statistical methods used. Geometric dimension
shows what type of geometry (point, line, or polygon) is used to represent these health
data. Graphic representation defines what styles or symbols are used to generate health
maps.
The design of the HERXML follows an iterative process, as shown in Figure 4.1. It starts
with user requirement collection and analysis, such as the content of health information,
related influential factors, and ways of representation. With the consideration of policy,
privacy, and security issues, the main concepts used in the representation of health
information are determined. Next, an XML design software tool, Altova XMLSpy
[Altova, 2010] is used to encode the HERXML schema. After that, the HERXML
schema is tested in application to validate user requirements. The iteration continues with
a new version of HERXML schema until the end-users are satisfied. With the above
cyclic development process, the preliminary HERXML schema used in this project was
defined (refer to Appendix A).

116
Figure 4.1: HERXML schema design process
(The HERXML schema design process follows a cyclic development. The steps include user requirement collection and analysis, conceptual design, schema implementation, and schema validation in applications.)
As shown in Figure 4.2, the designed HERXML schema includes three parts: health,
mapping data, and representation.
Figure 4.2: The HERXML schema
(The HERXML includes a “Health” part, a “MappingData” part, and a “Representation” part.)

117
The health part includes the basic information of the health-related activities, with the
name, title, description, and keyword list elements, and a type attribute. HealthType is an
abstract complex type. It can be extended to support disease observation or other
activities.
The mapping data part mainly records the data used for mapping. As shown in Figure 4.3,
it includes the bounding box of the data, the spatial data, the relation between spatial data
and mapping values, and the mapping values.
Figure 4.3: The mapping data part schema
(The “mapping data” part schema includes a “BoundingBox” component, a “SpatialData” component, a “Relation” component and a “MappingValues” component.)

118
“BoundingBox” represents the spatial range of the mapping data.
“SpatialData” could be GML from WFS services, GML records, or Xlink to GML
databases. The data source item is used to show the metadata of the spatial data. The
health data are statistical values and are linked with the spatial data through the
joining attribute.
“Relation” records the linking attributes and the matching ID values of both spatial
data and mapping values.
“Mapping values” includes the health data source description, the statistical method
used and the mapping value lists. The statistical method part describes the name, title,
description, and statistical parameters of the statistical method used. The data source
description shows metadata of health information, such as the source of the data, the
time range of data, and the contact information. Statistical methods are used to
generate classification maps and charts for health-related activities. Some parameters
are predefined from the spatial, temporal, and demographic aspects for public health,
such as AgeFrom, AgeTo, and StartTime, which can show health distributions with
spatial, temporal, age, and gender differences. Users can add additional parameters in
the parameter group to support advanced statistical methods.
The Representation part defines the style used to represent health maps. It describes the
default representation bounding box and style description. Depending on the kind of
representation, the StyleType is extended to ChartStyleType, PointStyleType,
LineStyleType, and PolygonStyleType. For instance, the PolygonStyleType includes the

119
border and fill elements. The type of filling in a polygon can be gradient fill or range-
based fill. For the range-based fill, the fill method can use color, pattern, and texture. The
border element contains the color, line style, and line weight of the border.
4.2.3 WPS for Health Data Processing with HERXML
The procedure of WPS design is shown in Figure 4.4. The input includes health data and
parameters. The health data for the Web-based processing could be stored in the server
(in databases or files) or acquired through remote access (through Web Services or
remote transfers). The parameters can be encoded by Key/Value pairs or XML, including
the disease type, gender, age group, statistical method, time interval, spatial layer, and
thematic mapping variables. The output of the processing could be either in the raster
data format (JPEG, PNG, GIF) or in the vector data format (HERXML). The use of
HERXML in processing can enhance people’s understanding of the resulting health
information mapped. In the configuration of the WPS, the access of WPS can be limited
to certain domains or IP addresses. The WPS can be further divide into fine granularity,
with one processing service for the statistical calculation and the other processing service
for the thematic mapping.
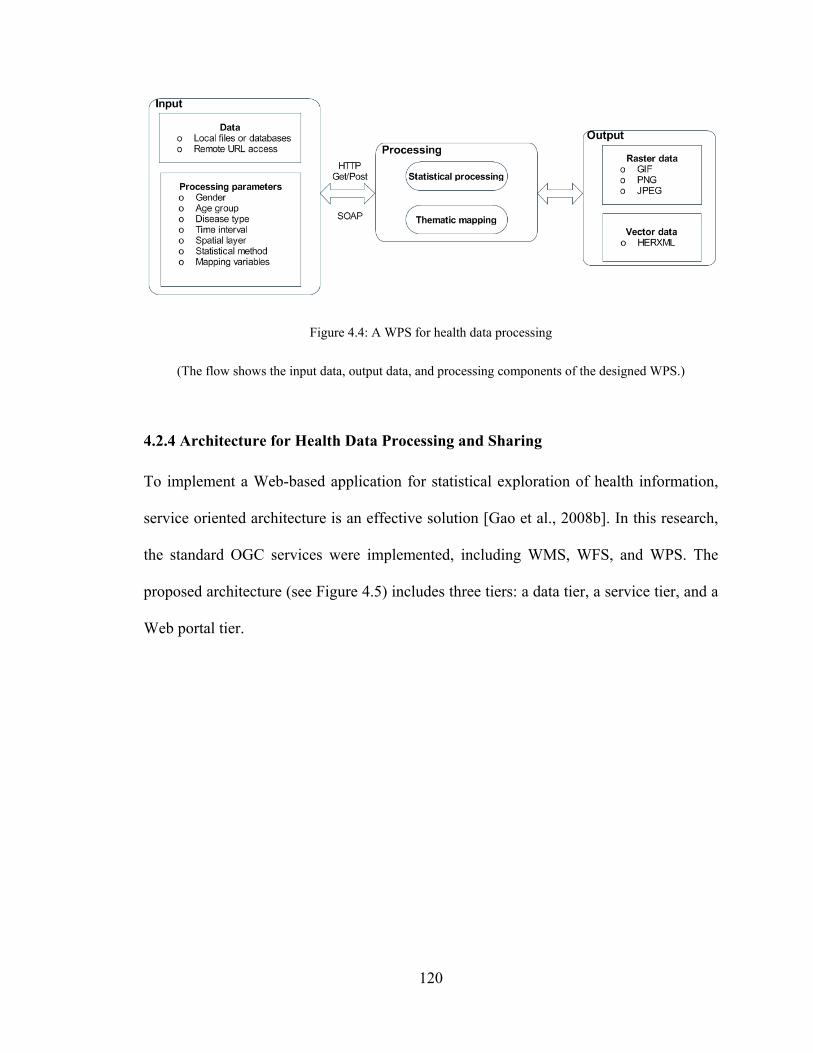
120
Figure 4.4: A WPS for health data processing
(The flow shows the input data, output data, and processing components of the designed WPS.)
4.2.4 Architecture for Health Data Processing and Sharing
To implement a Web-based application for statistical exploration of health information,
service oriented architecture is an effective solution [Gao et al., 2008b]. In this research,
the standard OGC services were implemented, including WMS, WFS, and WPS. The
proposed architecture (see Figure 4.5) includes three tiers: a data tier, a service tier, and a
Web portal tier.

121
Figure 4.5: Implemented health data processing and sharing architecture
(The architecture contains a data tier, a service tier, and a Web portal tier.)
The data tier stores all the health data and related data for health studies. These data could
be available from databases or Web Services.
The service tier implements WMS, WFS, and WPS for health studies.
WMS provides standard interfaces to generate maps and charts for visualization of
health information. It utilizes the health mapping module to generate maps to show
event or facility distribution. The input data could be obtained from HERXML, GML,
WFS, WPS, databases, or files.

122
WFS uses the GML transformation module to share spatial data through GML. It can
be linked with the mapping values (part of HERXML) to create thematic health maps.
WPS is used to analyze spatio-temporal health data. The health data analysis
supports data rolling up from a low spatial level to a high spatial level. WPS uses the
health mapping module and statistical procedures. The input data of WPS could be
obtained through WFS, GML, databases, or files.
The Web portal tier is a client for the visualization of disease data and maps. It can bring
together different facets of health information into one location to improve health
promotion, health care research, education, and policy making.
4.3 Results
A case study has been carried on the development of Web application and services within
the Canadian Geospatial Data Infrastructure (CGDI) framework for community health
programs of the New Brunswick Lung Association. The Canadian Geospatial Data
Infrastructure (CGDI) aims to support online access to location-based information which
can efficiently help people in their decision making [CGDI, 2010]. One priority area of
CGDI is to share location-based information for analyzing and monitoring public health.
Sharing of health information in the CGDI will improve the ability to intervene on health
issues, and inform the public of the availability of resources.

123
The health data used in this study include four kinds of respiratory disease data (Asthma,
COPD, Influenza, and Cancer) collected by the New Brunswick Lung Association. The
disease data are geo-coded to spatial position through the use of postal codes. The spatial
data used include the six levels of spatial boundary data that cover the entire territory of
New Brunswick. The six levels are "Province," "Health Region," "Census Division,"
"Census Subdivision, " "Forward Sortation Area," and "Dissemination Area" geo-layers.
All the health data and geometrical boundary data are stored in an Oracle database. Low
counts (i.e., less than five observations) or false counts are not represented to further
ensure privacy and accuracy. WMS services are used to publish the health facility
distribution maps. WFS services distribute the different levels of spatial boundary data. In
this study, new Web Processing Services were provided in the CGDI to enable statistical
representation of health information. The WPS services support the statistical calculation
as well as mapping of the health data. Figure 4.6 shows an example of an HERXML
document generated by a WPS, and Figure 4.7 presents a map representation generated
from a WPS.
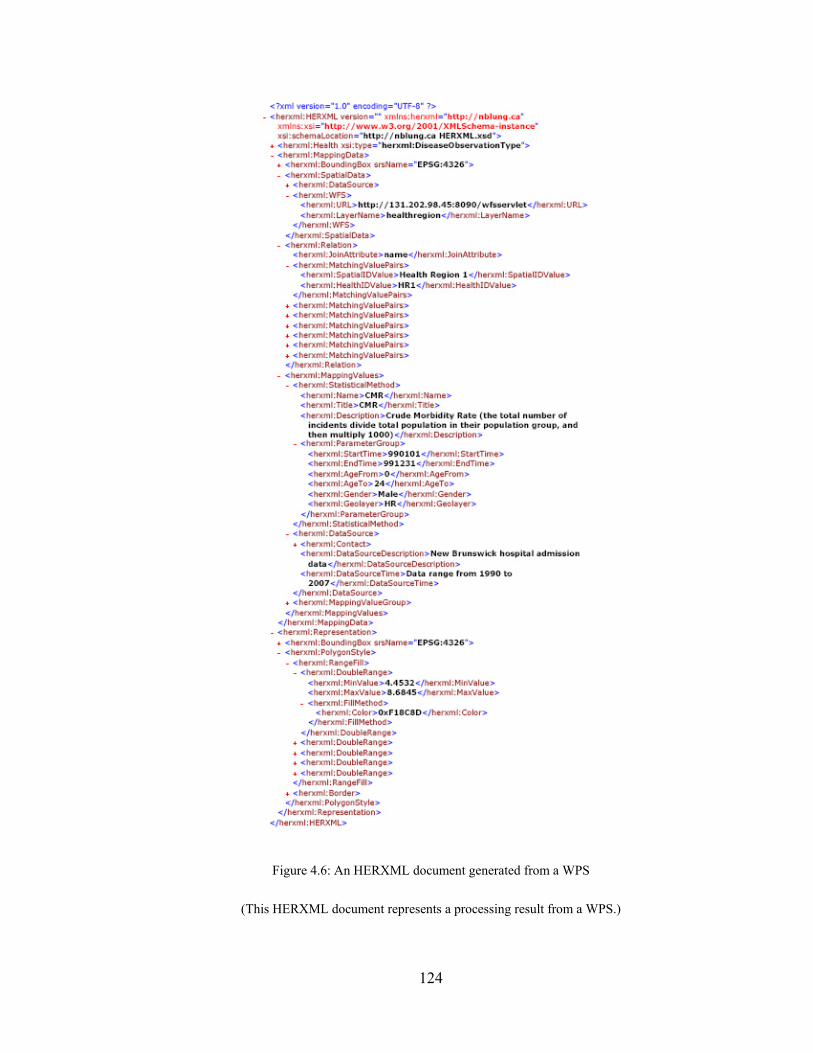
124
Figure 4.6: An HERXML document generated from a WPS
(This HERXML document represents a processing result from a WPS.)
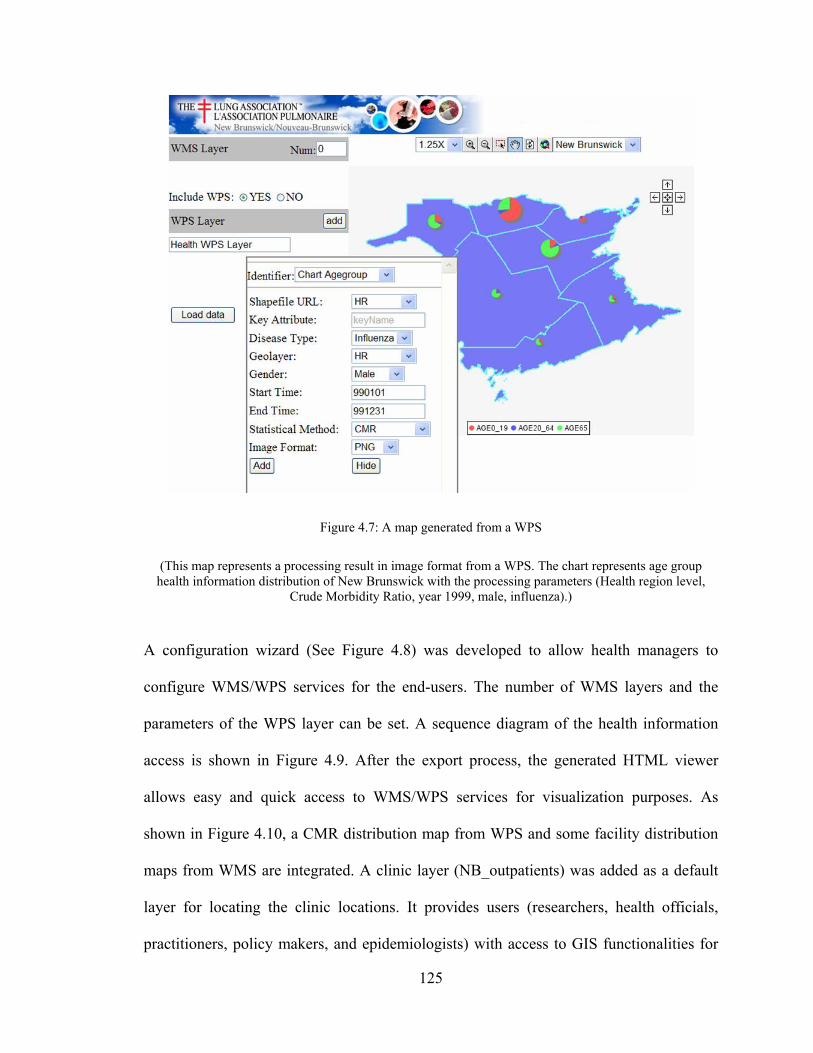
125
Figure 4.7: A map generated from a WPS
(This map represents a processing result in image format from a WPS. The chart represents age group health information distribution of New Brunswick with the processing parameters (Health region level,
Crude Morbidity Ratio, year 1999, male, influenza).)
A configuration wizard (See Figure 4.8) was developed to allow health managers to
configure WMS/WPS services for the end-users. The number of WMS layers and the
parameters of the WPS layer can be set. A sequence diagram of the health information
access is shown in Figure 4.9. After the export process, the generated HTML viewer
allows easy and quick access to WMS/WPS services for visualization purposes. As
shown in Figure 4.10, a CMR distribution map from WPS and some facility distribution
maps from WMS are integrated. A clinic layer (NB_outpatients) was added as a default
layer for locating the clinic locations. It provides users (researchers, health officials,
practitioners, policy makers, and epidemiologists) with access to GIS functionalities for

126
visualizing health data, and evidence-based decision making on disease outbreaks. The
HTML viewer can be saved and used anywhere through the Web, as the JavaScript
functions (Zoom in, Pan, etc), WMS services, and WPS services are accessed online.
Figure 4.8: The configuration wizard interface
(The configuration wizard manages the WMS layers and the parameters for the WPS. The WPS layer represents health distribution of New Brunswick with the processing parameters (Health region level, Crude Morbidity Ratio, year 1999, male, age 0-24, influenza, equal-interval classification methods, 3
classes, color ramp from yellow-green-blue).)

127
Figure 4.9: Service level sequential diagram for health information access
(The Web client invokes the WMS and WPS for health information access. WMS and WPS obtain the raw data from WFS, DBMS, or files, and then perform the mapping and processing operations.)
Figure 4.10: The exported HTML viewer
(This viewer provides quick access to WMS/WPS services for visualization purposes. The WMS layers provide the maps of clinics, hospitals, and highways in New Brunswick)

128
4.4 Discussion
The HERXML can be used to share the cartographic representation of health information
(able to consider a variety of health activities), and describe health data sources and
statistical methods. The implemented HERXML parser can utilize the representation
styles in HERXML documents to generate health maps. The HERXML can be shared by
users through the Web in many ways such as email, Web sites, Web forums, and Web
Services regardless of platform or system (See Figure 4.11). Thus, health information can
be easily represented and shared while keeping the secret of raw health information. If
the users are interested in the detailed health information, they can contact the data source
manager.
Figure 4.11: The sharing of HERXML
(HERXML can be shared via Internet by Web forums, Web sites, Web Services, emails, etc.)

129
Similar to GML and SVG, HERXML is pure XML (using ASCII file) and in a vector
format. The ASCII file format makes it easy for humans to read, search, and edit.
Although ASCII file format is much larger than the binary format, a number of XML
compression techniques methods, namely gZip, XMill, XGrind, Xpress, and XComp,
have been developed to improve the performance of transferring XML over the Web
[Nair, 2010]. The vector format enables scalability and resolution independence. A file in
raster format usually would be much larger in volume than a file in vector format at the
same resolution [Chen and Lee, 2000]. The HERXML documents can be interpreted as
view-only maps (e.g., JPEG) or interactive maps (e.g., SVG) with the attributes and
defined representation style in them. Thus, the cartographic representation will be the
same in any platform or system.
SVG is designed for computer graphics, and it lacks point feature representation elements
and uses inverted y-axis coordinate system, making it unsuited for Web-based
cartography [Dunfey et al., 2006]. In addition, SVG uses the graphical coordinate, and
this leads to some problems in integrating data from different sources together if they do
not have the same coordinates. Meanwhile, GML is able to model, transport, and store
spatial information, but it can not provide the cartographic representation of spatial
information. HERXML utilizes GML in modeling geospatial features and provide point,
line, polygon, and chart styles, making it satisfactory in Web-based cartography.
Moreover, HERXML integrates many kinds of attribute information together in a well-
formatted structure, with the ability to be represented as text, maps and graphics.

130
Taking advantage of XML, HERXML is extensible, with the potential to add more health
information tags to the representation in defining new health parameters or methods.
HERXML is simple and well-structured, and the comprehensive description of health
data representation will need more extensions. Meanwhile, to improve the semantic
meaning in understanding the health information representation, a well defined ontology
should be generated to represent shared vocabularies. The development of XML
databases, which facilitates the efficient management of XML, will support the storage
and manipulation of HERXML documents.
The WPS standard can support both synchronous and asynchronous requests in the
execution process. An asynchronous request is very flexible for users in health data
processing, especially when the process is computation expensive. During processing, the
dynamically updated execute response document enables users to know the processing
status. The results of WPS could use direct data output or a URL which points to the
processing results in the server. For health data processing, it is possible for national
health organizations to host some processing functions as well as some basic data (e.g.,
census data) in their server. If a local health organization wants to use the processing
and/or mapping power, they only have to purchase it and make its data accessible to
processing servers, and then they can get the processing results conveniently. To reduce
the hardware or software investment costs at every local organization, it would be
feasible to build a public health infrastructure to support processing power on the Web. In
this way, users can flexibly choose the required processing services and assemble them

131
based on their needs. However, regarding the data used in the processing services, the
standard method of accessing health data and related data (e.g., temperature data) for
Web processing still needed to be explored.
4.5 Conclusions
This research developed a HERXML schema to support Web-based representation of
health information based on XML specifications, with consideration of semantic,
geometric, and graphical aspects of health information. HERXML has been used by the
New Brunswick Lung Association in the sharing of health representation information. It
provides a suitable way to represent health information for sharing with other users
through the Web. The HERXML can be utilized by health practitioners, policy makers,
and the public in many areas such as disease etiology, health planning, health resource
management, health promotion, and health education. The concept definitions and the
richness of the vocabularies under the three categories of semantic, geometric, and
cartographic still need to be improved to meet the requirements from the growing users.
New applications and services have been implemented in CGDI for health surveillance,
with many standard WMS, WFS, and WPS services. WPS provides a solution for
publishing the health processing and mapping tools online. This case study enabled
online heath data processing and sharing, as well as the reusability and interoperability of
health services. The implemented application and services facilitate access to maps and
visualization of disease prevalence, mortalities, and determinants of health, transmission
patterns, and components of health care response. This research brought a new solution in
better health data representation and initial exploration of the Web-based processing of

132
health information, and will further promote the growth and enrichment of the CGDI in
the public health sector. The future work will be on the improvement of
comprehensiveness of HERXML in health information representation and investigation
of data transmission for WPS services.
Acknowledgements
This research work has received the financial support from GeoConnections secretariat of
Natural Resources Canada for a project titled “Development of Web Application and
Services within the CGDI framework for Community Health Programs of the New
Brunswick Lung Association”. Authors also thank for the project partners: New
Brunswick Emergency Measures Organization, Faculty of Computer Science (UNB), and
CARIS for their contributions to this research.
References
Altova (2010). "XMLSpy - XML Editor for Modeling, Editing, Transforming, & Debugging XML Technologies." [On-line] February 21, 2010. http://www.altova.com/xml-editor/.
Bedard, Y., and E. Bernier (2002). "Supporting multiple representations with spatial view management and the concept of "VUEL"." Proceedings of Joint Workshop on Multi-Scale Representations of Spatial Data, ISPRS WG IV/3, ICA Commission on Map Generalisation, Ottawa, Canada, July 7-8.
Bell, B. S., R. E. Hoskins, L. W. Pickle, and D. Wartenberg (2006). "Current practices in spatial analysis of cancer data: Mapping health statistics to inform policymakers and the public." International Journal of Health Geographics, 5:49. Available at: http://www.ij-healthgeographics.com/content/5/1/49, DOI: 10.1186/1476-072X-5-49.

133
Boulos, M. N. (2003). "The use of interactive graphical maps for browsing medical/health Internet information resources." International Journal of Health Geographics, 2:1. Available at: http://www.ij-healthgeographics.com/content/2/1/1, DOI: 10.1186/1476-072X-2-1.
Boulos, M. N., M. Scotch, K. Cheung, and D. Burden (2008). "Web GIS in practice VI: A demo playlist of geo-mashups for public health neogeographers." International Journal of Health Geographics, 7:38. Available at: http://www.ij-healthgeographics.com/content/7/1/38, DOI: 10.1186/1476-072X-7-38.
CGDI (2010). "About CGDI." [On-line] February 21, 2010. http://www.geoconnections.org/en/aboutcgdi.html.
Chen, Y. Q., and Y. C. Lee (2000). Geographical data acquisition. Springer, New York.
Cheung, K., K. Y. Yip, J. P. Townsend, and M. Scotch (2008). "HCLS 2.0/3.0: Health care and life sciences data mashup using Web 2.0/3.0." Journal of Biomedical Informatics , 41(5), pp. 694-705.
Dunfey, R. I., B. M. Gittings, and J. K. Batcheller (2006). "Towards an open architecture for vector GIS." Computers and Geosciences, 32(10), pp. 1720-1732.
Elliott, P., and D. Wartenberg (2004). "Spatial epidemiology: Current approaches and future challenges." Environmental Health Perspectives, 112(9), pp. 998-1006.
Gao, S., D. Mioc, X. Yi, F. Anton, E. Oldfield, and D. J. Coleman (2008a). "The Canadian Geospatial Data Infrastructure and health mapping." European Journal of Geography (CyberGeo), http://www.cybergeo.eu/index21123.html, article 434.
Gao, S., D. Mioc, F. Anton, X. Yi, and D. J. Coleman (2008b). "Online GIS services for mapping and sharing disease information." International Journal of Health Geographics, 7:8. Available at: http://www.ij-healthgeographics.com/content/7/1/8, DOI: 10.1186/1476-072X-7-8.
HL7 (2010). "What is HL7?" [On-line] February 21, 2010. http://www.hl7.org/.
Kamadjeu, R., and H. Tolentino (2006). "Web-based public health geographic information systems for resources-constrained environment using scalable vector graphics technology: A proof of concept applied to the expanded program on immunization data." International Journal of Health Geographics, 5:24. Available at: http://www.ij-healthgeographics.com/content/5/1/24, DOI: 10.1186/1476-072X-5-24.
Kraak, M. J., and A. Brown (2000). Web Cartography: Developments and Prospects.

134
Nair,S. S. (2010)."XML Compression Techniques: A Survey." [On-line] February 21, 2010. http://people.ok.ubc.ca/rlawrenc/research/Students/SN_04_XMLCompress.pdf.
OGC (2001). "Web Map Service Implementation Specification." Available at: http://portal.opengeospatial.org/files/?artifact_id=1058.
OGC (2005). "Web Feature Service Implementation Specification." Available at: http://portal.opengeospatial.org/files/?artifact_id=8339.
OGC (2007). "OpenGIS Web Processing Service." Available at: http://portal.opengeospatial.org/files/?artifact_id=24151.
Stevens, M. (2010) "The Benefits of a Service-Oriented Architecture." [On-line] February 21, 2010. http://www.developer.com/tech/article.php/1041191.
Tao, C. V. (2001). "Online GIServices." Journal of Geospatial Engineering, 3(2), pp. 135-143.
Toubiana, L., Moreau, S., and Bonnard, G. (2005). "MetaSurv: Web-Platform Generator for the Monitoring of Health Indicators and Interactive Geographical Information System." Connecting Medical Informatics and Bio-Informatics: Proceedings of MIE2005 - The XIXth International Congress of the European Federation for Medical Informatics, IOS Press.
World Health Organization (WHO) (2007). "The world health report 2007: a safer future: global public health security in the 21st century." [On-line] February 21, 2010. http://www.who.int/whr/2007/whr07_en.pdf.
Wu, M., T. Zhao, and C. Wu (2005). "Public health data collection and sharing using HIPAA messages." Journal of Medical Systems, 29(4), pp. 303-316.
Yu, D. L., S. Q. Xie, X. L. Wei, Z. S. Zheng, and K. J. Wang (2008). "A XML-based remote EMI sharing system conformable to Dicom." Proceedings of Proceedings of the 5th International Conference on Information Technology and Application in Biomedicine, in conjunction with The 2nd International Symposium & Summer School on Biomedical and Health Engineering Shenzhen, China, May 30-31.

135
Chapter 5. Geospatial-Enabled RuleML in a Study on Querying
Respiratory Disease Information ♠
Abstract
A spatial component for health data can support spatial analysis and visualization in the
investigation of health phenomena. Therefore, the utilization of spatial information in a
Semantic Web environment will enhance the ability to query and to represent health data.
In this research, a semantic health data query and representation framework was proposed
through the formalization of spatial information. The geometric representation is included
in Rule Markup Language (RuleML) deduction. Ontologies and rules were applied for
querying and representing health information. Corresponding geospatial built-ins were
implemented as an extension to OO jDREW. Case studies were carried out using
geospatial-enabled RuleML queries for respiratory disease information. The research thus
demonstrates the use of RuleML for geospatial-semantic querying and representing of
health information.
5.1 Introduction
Geospatial location provides a solution to link multiple sources in the same area. The
spatial component of health data can show the geographical distribution of disease
♠ Originally published as: Gao, S., H. Boley, D. Mioc, F. Anton, and X. Yi (2009). “Geospatial-Enabled RuleML in a Study on Querying Respiratory Disease Information.” Lecture Notes in Computer Science, 5858, Springer, pp. 272-281.

136
outbreaks, hospitals, air quality, and census. Basic geometric information of location is
recorded in spatial data collections, using spatial reference and coordinate arrays.
Utilizing spatial information allows the spatial analysis and visualization of health data.
For example, with the geometric information of the Georges L. Dumont Hospital in
Moncton and the New Brunswick Route 15, the neighboring spatial relationship between
them can be deduced. The Semantic Web aims to improve machine understanding of
Web-based information and its effective management. By employing Semantic Web (e.g.,
Web rule) techniques, part of the meaning of the information can be captured by
machines, thus enabling more precise information queries and interoperation. To enhance
the ability to query health information, its spatial component can also be represented and
deduced by rules.
The Semantic Web environment, in which data are given well-defined meaning, can
facilitate health data query and knowledge discovery. Similar to the non-spatial attributes
of data, the spatial attributes can also be represented in the Semantic Web. The use of
spatial information in the Semantic Web can support dynamic spatial relation discovery
for health data, and furthermore, new concepts and new instances can be generated. For
example, from the locations of infectious disease outbreaks, sensitive areas that are
within a certain distance from the disease outbreak locations can be determined. Because
of the advantages in supporting the representation of a spatial component, this research
endeavored to include spatial information in the Semantic Web environment to enhance
the ability to query and to represent health data. This research built on and extended the

137
eHealthGeo results in Gao et al. [2008], and included the geometric representation in
RuleML to enhance information reasoning and inference.
5.2 Semantic Web and Geospatial Semantics
Semantics-level interoperability among heterogeneous information sources and systems
can be achieved by the Semantic Web. According to Sheth and Ramakrishnan [2003],
three kinds of important applications of the Semantic Web are (1) semantic integration, (2)
semantic search and contextual browsing, and (3) semantic analytics and knowledge
discovery. Ontologies, as shared specifications of conceptualizations [Gruber, 1993],
constitute an important notion in the Semantic Web. Many XML-based languages, such
as RDF(S) and OWL, have been developed for the representation of ontologies.
Description Logic (DL) is usually used for ontology reasoning. When concepts are
defined using ontologies, three types of relations can be distinguished: taxonomic,
functional, and partonomic (part-of) [Luscher et al., 2007]. With the meaning and
relations of concepts defined by ontologies, semantic data classification, integration, and
deduction can be implemented. One limitation of DL is that it is impossible to represent
relations between a composite property and another (possibly composite) property in the
ontology representation; however, the use of rules can establish more complex relations
between properties [Antoniou et al., 2005]. Rules encode machine-interpretable
conditional knowledge (“if … then …”) for automatic reasoning [Boley, 2007]. Rules can
describe concepts by using the relation of instances through different property paths.
Many different kinds of approaches in combining ontologies and rules have been

138
surveyed (see Bruijn [2009]). RuleML [The Rule Markup Initiative, 2010] is the de facto
open-language standard for Web rules.
Spatial relationships can exist between two spatial objects (concepts or instances), and
exploring them can advance information query and discovery. Three types of major
spatial relationships between spatial objects are topological, direction, and metrical
relationships [Rashid et al., 1998]. Topological relationships formalize the notion of
neighborhood; directional relationships require the existence of a vector space; and
metric relationships are measuring distances. Topological relationships are invariant
under continuous transformations while directional and metric relationships may change
during these transformations. A well-known method by which to formalize topological
relations between spatial objects in two-dimensional space is the Nine Intersection Model
(9IM), developed by Egenhofer [1991], that considers boundaries, interiors, and
complements intersection of two spatial objects. The further improved model, the
Dimensionally Extended Nine Intersection Model (DE-9IM), considers the 9IM of two
spatial objects with the dimensions of -1 (no intersection), 0, 1, or 2 [Clementini and
Felice, 1994; Clementini and Felice, 1996]. The commonly known topological predicates
described by the DE-9IM include overlaps, touches, within, contains, crosses, intersects,
equals, and disjoint.
With possible spatial relationships existing in the data, several studies have been done on
the capture of geospatial semantics for facilitating data integration, query, and discovery.
Kieler [2008] discussed the feasibility of identifying semantic relationships between

139
different ontologies by exploring the geometric characteristics of instances. To represent
spatial relationships, the explicit storage or dynamic computation of spatial relationships
is possible. Explicating all the possible spatial relationships between every two spatial
objects is usually not necessary and may not be feasible. While the weakness of dynamic
computation is that it is time-consuming, the weakness of explicit storage requires
significant storage space and involves reliability issues because of the imprecise nature of
relationships [Jones et al., 2003]. Klien and Lutz [2005] illustrated the definition of
geospatial concepts based on spatial relations and automatic annotation of geospatial data
using a reference dataset. The annotation process uses DL in reasoning and focuses on
the concept level. Smart et al. [2007] distinguished multi-representations, implicit spatial
relations, and spatial integrity of geospatial data, claiming that rule expression for geo-
ontologies needs to consider spatial reasoning rules and spatial integrity rules.
Kammersell and Dean [2006] proposed GeoSWRL, which is a set of geospatial Semantic
Web Rule Language (SWRL) built-ins. GeoSWRL allows users to include spatial relation
operators in queries; however, spatial data representation and processing abilities are not
fully integrated in the GeoSWRL system.
In addition, spatial operations can generate new spatial objects from existing spatial
objects, such as spatial intersection and spatial union. Because rules are able to describe
relations through complex property paths, it would be feasible to represent spatial
operations and spatial relations of geospatial objects as rules in knowledge deduction.
Cartographic principles can also be applied as rules in the deduction. This research not
only enabled geometric representation support for RuleML reasoning, but also applied

140
ontologies and rules in health information reasoning, query, and representation. The
respiratory disease information queries were used as examples.
5.3 Framework for Health Information Query and Representation
Health concepts can be described with semantic, geometric, and (carto)graphic
components, as shown in Figure 5.1. The semantic component deals with the definition of
the concepts. The geometric component provides shapes to locate the concepts. The
cartographic component solves the issues of how to represent these concepts through
maps. For example, in the case of a hospital, the semantic component can describe its
name and attributes, the geometric component can describe its polygon shape, and the
cartographic component can describe its map style. Moreover, relations, including non-
spatial and spatial relations, exist between health concepts.
Figure 5.1: Metamodel of health concepts

141
5.3.1 Framework
Semantic health data queries need to find data with corresponding semantic and
geometric attributes. Cartographic representation of the query results allows users to
visualize health information. Figure 5.2 describes the framework for semantic health
information query and representation, including a data tier, a fusion tier, and a
presentation tier. (1) Data tier. The health data could be obtained from various
organizations through files, databases, or (Geospatial) Web Services. Following the
ontology implementation, data can be extracted to the knowledge base as facts. (2)
Fusion tier. The fusion tier contains ontologies, facts, and rules. It queries and fuses
semantic, spatial, and cartographic information for representing health data
homogeneously. The ontologies are the representation of health concepts and their
relationships in the semantic, geometric, and cartographic dimensions. Facts are
generated from various health data and existing knowledge about health. Rules,
supported by ontologies and facts, deduce health information and present the information
to users. Two types of rules are considered: reasoning rules and cartographic
representation rules. (3) Presentation tier. The user interface allows the input of semantic,
geometric, and graphic criteria to retrieve health information.

142
Figure 5.2: Health data query and representation framework
5.3.2 Ontologies and Rules in Health Data Fusion
A. Ontologies
Ontologies can be utilized to connect various concepts (e.g., subconcepts and
superconcepts). Depending on the requirements, different application ontologies exist in
health applications. To facilitate health data exchange and query, a global ontology could
improve interoperability. Three types of ontologies are important in querying and
representing health data: health domain ontologies, geometric ontologies, and
cartographic ontologies.
Health domain ontologies are used for the definition of health information models,
concepts, and terminologies. Many standards exist in this field, such as Health Level 7
(HL7), Systematized Nomenclature of Medicine-Clinical Terms (SNOMED-CT), and

143
International Classification of Diseases (ICD-9). Geometric ontologies should be able to
describe basic geometry types, such as point and polygon. The European Petroleum
Survey Group (EPSG, http://www.epsg.org/) coordinate system codes are widely used in
the exchange of geospatial data over the Internet. Cartographic ontologies deal with the
styles in representing information. For instance, the symbol of hospitals can be
represented as point graphics to show the location of hospitals. With the existence of
health domain ontologies, geometric ontologies, and cartographic ontologies, the
application ontology definition can easily link to these semantic, geometric, and
cartographic elements.
B. Rules
Based on the ontologies and facts, rules can define and deduce new information. Besides
non-spatial attribute rules, spatial rules can also be applied in this framework. Although
the definition of geometric ontologies follows the same methodology for non-spatial
ontologies, the inference of spatial relations is different. The utilization of geometries can
incorporate the spatial analysis and cartographic representation abilities in rules. Two
types of rules are distinguished: reasoning rules and cartographic representation rules.
Reasoning rules cover semantic matching, spatial relation operators, spatial operations,
and cartographic comparison of data. (1) Semantic matching rules deal with the domain
knowledge for understanding health data. For instance, the manifestation of several
symptoms could determine that a patient may have caught a disease. (2) Spatial relation
rules are used to determine the topological, directional, and metric relations between

144
geospatial components. For instance, rules can be used to evaluate the direction and
distance from the location of an emergency to hospitals. (3) Spatial operation rules can
generate new concepts and instances from existing health data. For example, spatial
union can combine data from neighboring regions to assist in the comparison of disease
outbreaks. (4) Cartographic comparison rules are able to fuse different cartographic
representations into a homogeneous form.
Cartographic representation rules focus on the distribution of information to users more
efficiently and effectively. Map scale is of great significance in the spatial representation
of a concept. For example, a hospital will be shown as a polygon in large scale
representation and as a point in small scale representation. Cartographic rules include
concept-based rules, attribute-based rules, scale-based rules, priority-based rules, and
cartographic generalization rules. (1) Concept-based rules determine graphic styles based
on the health concept semantics. For example, standard symbols exist in representing the
concepts in national or provincial cartographic design. (2) Attribute-based rules classify
health concepts based on their attributes. For example, pie charts can show the age
distribution of people in each health region. (3) Scale-based rules are essential in
determining what information is represented based on scales. A concept can be stored
with multi-representation in the data, and scale can be used to select the optimal
representation. (4) Priority-based rules emphasize high priority information. (5)
Cartographic generalization (simplification, exaggeration, and displacement) rules allow
the dynamic generalization of spatial information.

145
5.4 Design and Implementation
5.4.1 Geospatial Support for RuleML Deduction
OO jDREW is an open source RuleML engine which was used in this study because it
supports RuleML’s Naf Hornlog sublanguage and backward/forward reasoning [OO
jDREW, 2010]. RuleML’s Positional-Slotted Language (POSL) presentation syntax is
employed in the following. To use spatial information in the reasoning process, the
representation of spatial information in the RuleML engine is needed. Therefore, a
geometric ontology was designed to support basic geometry types: point, linestring,
polygon, multipoint, multilinestring, multipolygon, and multimix, as shown in Figure 5.3.
A polygon can have an out boundary and many inner holes (inner boundaries). Multipoint,
multilinestring, and mulitpolygon can have one or more points, linestrings, and polygons,
respectively. Multimix contains collections of points, linestrings, and polygons. Figure
5.4 lists examples of how to represent each geometry type. Coordinate reference systems
are specified with EPSG codes, and coordinates are recorded in the order of
(x1,y1,x2,y2,…). With the specification of geometries, the spatial operation (union,
buffer, convexhull, difference, distance, intersection) and spatial relation operators
(touches, contains, within, crosses, equals, overlaps, intersects, covers, coveredby,
disjoint, iswithindistance) can be incorporated into rules.

146
Figure 5.3: Geometry type designed for RuleML
Figure 5.4: Examples of geometry representation
Based on this design, a geometry type was added and a parser was implemented for
parsing geometries in OO jDREW. For the spatial operations and spatial relation
operations, the JTS Topology Suite was used in this study. The JTS is an open source
147
Java API for two-dimensional spatial predicates and functions, using the DE-9IM model
[Vivid solutions, 2010]. Several geospatial built-ins, such as the gpred_intersects,
gpred_within, and gfunc_intersection built-ins, were created using the JTS library. The
gpred_intersects built-in checks whether two geometries intersect or not; the
gpred_within built-in checks whether a geometry is inside another geometry; the
gfunc_intersection built-in computes the intersection of two geometries.
5.4.2 Data Sources and Ontology Definition
The health data used in this study were collected from different organizations, such as
New Brunswick Lung Association, Service New Brunswick, Statistics Canada census,
and Statistics Canada community health survey. Respiratory disease data were used as
examples in this study. Following the disease taxonomy of respiratory diseases in the
International Classification of Diseases (ICD-9), an ontology for respiratory diseases was
created. A portion of the respiratory disease ontology is shown in Figure 5.5. Respiratory
disease data are from hospital patient incidents, which record the time, postcode, disease
diagnosis category, age, and gender. Different data could be collected in various spatial
boundaries. Taking this study as an example, the disease rate data from the Statistics
Canada community health survey were collected at Health region and the income data
from Statistics Canada census were collected at Census division. From these data, the
application ontologies of this case study were generated. Entities, such as Health event,
Hospital, Health region, Census division, Postcode, Disease rate, and Income were also
created.
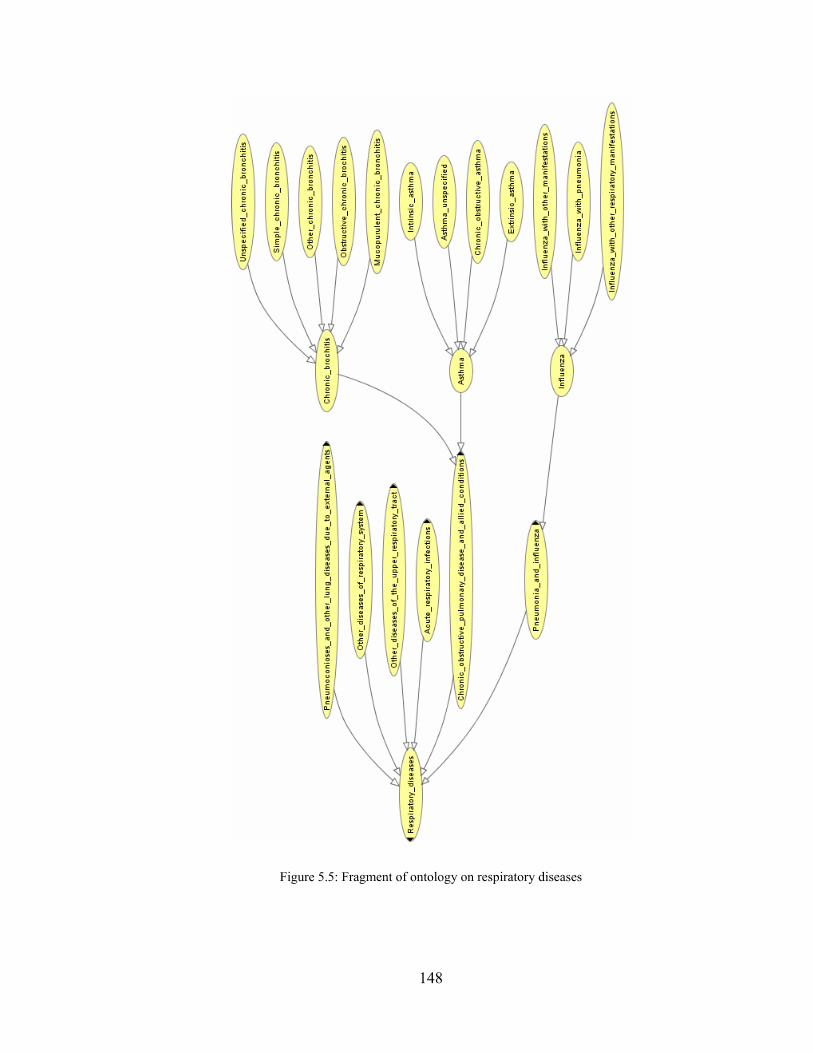
148
Figure 5.5: Fragment of ontology on respiratory diseases
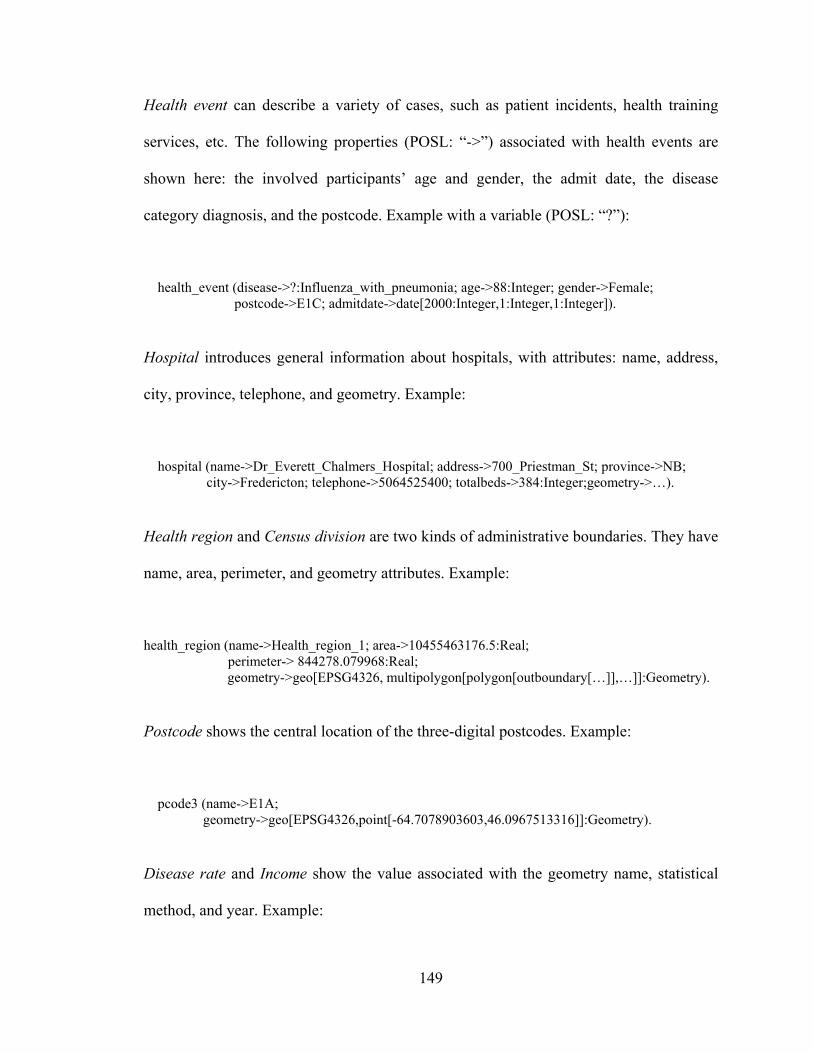
149
Health event can describe a variety of cases, such as patient incidents, health training
services, etc. The following properties (POSL: “->”) associated with health events are
shown here: the involved participants’ age and gender, the admit date, the disease
category diagnosis, and the postcode. Example with a variable (POSL: “?”):
health_event (disease->?:Influenza_with_pneumonia; age->88:Integer; gender->Female; postcode->E1C; admitdate->date[2000:Integer,1:Integer,1:Integer]).
Hospital introduces general information about hospitals, with attributes: name, address,
city, province, telephone, and geometry. Example:
hospital (name->Dr_Everett_Chalmers_Hospital; address->700_Priestman_St; province->NB; city->Fredericton; telephone->5064525400; totalbeds->384:Integer;geometry->…).
Health region and Census division are two kinds of administrative boundaries. They have
name, area, perimeter, and geometry attributes. Example:
health_region (name->Health_region_1; area->10455463176.5:Real; perimeter-> 844278.079968:Real; geometry->geo[EPSG4326, multipolygon[polygon[outboundary[…]],…]]:Geometry).
Postcode shows the central location of the three-digital postcodes. Example:
pcode3 (name->E1A; geometry->geo[EPSG4326,point[-64.7078903603,46.0967513316]]:Geometry).
Disease rate and Income show the value associated with the geometry name, statistical
method, and year. Example:

150
disease_rate (disease->?:Asthma; geometryname->Health_region_1; statistics->average; year->2003:Integer; rate->0.104:Real).
income (geometryname->Saint_John_County; statistics->average; year->2003:Integer; incomevalue->32748.56028:Real).
5.4.3 Scenarios
Case 1. With the collected health events, it is possible to find disease cases fulfilling
semantic and geometric requirements. Since disease cases include outbreak locations
using postcodes, geospatial semantic query of diseases can discover whether the location
of a postcode is inside any spatial boundary. The following disease_locator rule queries a
patient’s age, gender, and postcode within a certain health region, disease category, age
type, and period:
disease_locator (healthregionname->?name; disease->?disease:Respiratory_diseases; startdate->?startdate; enddate->?enddate; agetype->?agetype; age->?age:Integer; gender->?gender; postcode->?postcode) :-
health_event (disease->?disease:Respiratory_diseases; age->?age:Integer;gender->?gender; postcode->?postcode; admitdate->?date), age (agetype->?agetype; age->?age:Integer), earlier (?date, ?enddate), later (?date, ?startdate), health_region (name->?name; geometry->?hrgeometry:Geometry!?), pcode3 (name->?postcode; geometry->?pcgeometry:Geometry!?), gpred_within (?pcgeometry:Geometry, ?hrgeometry:Geometry).
The disease_locator rule conjoins several subqueries for the semantic query of disease
cases. The earlier and later queries search disease cases in which the admit date is
between the start date and end date. The age query is used to determine to which age
group a certain age belongs. The gpred_within built-in query is used to locate postcodes
in health regions.

151
Case 2. Since data collected from different organizations may use different kinds of
spatial boundaries, the ability to integrate those data is useful. New concepts and
instances will be generated in the integration process. The below
disease_income_correlator rule figures out the intersection between disease rate and
income. For example, a user would like to know those spatial areas where the asthma
disease rate is higher than 0.1 and the average income is above $30,000 in 2008.
disease_income_correlator (disease->?disease:Respiratory_diseases; year->?year:Integer; minincome->?minincome:Real; minrate->?minrate:Real; geometry->?geometry:Geometry):-
disease_rate(disease->?disease:Respiratory_diseases; year->?year:Integer; geometryname->?dgeometryname; rate->?rate:Real!?),
income (geometryname->?igeometryname; year->?year:Integer; incomevalue->?incomevalue:Real!?),
health_region (name->?dgeometryname;geometry->?hrgeometry:Geometry!?), census_division (name->?igeometryname;geometry->?cdgeometry:Geometry!?), greaterThan (?rate:Real,?minrate:Real), greaterThan (?incomevalue:Real,?minincome:Real), gfunc_intersection (?geometry:Geometry,?hrgeometry:Geometry,?cdgeometry:Geometry).
Case 3. To provide better representation of the information to users in the query process,
it is beneficial to allow users to define queries with semantic, geometric, and graphic
requirements. For example, a user wants to get the asthma rate in 2008 (semantic) in a
spatial boundary geometry1 (geometric) with a graduated color ramp1 (graphic). Firstly,
the user can define geometric and graphic requirements. The graphics here use graduated
color with two categories. One category ranges from 0.0 to 0.2 in green; the other
category ranges from 0.2 to 1 in red:
geometries (geometryname->geometry1; geometry-> geo[EPSG4326, polygon[outboundary[…]]]:Geometry).
graduated_colors (name->ramp1; startvalue->0.0:Real; endvalue->0.2:Real; color->0x00FF00). graduated_colors (name->ramp1; startvalue->0.2:Real; endvalue->1:Real; color->0xFF0000).

152
Then, the user can use the disease_rate_finder rule to query disease rates. This rule
deduces the graphics for disease rate instances within specified geospatial boundaries.
disease_rate_finder (disease->?disease:Respiratory_diseases; geometryname->?geometryname; rampname->?rampname; year->?year:Integer; geometryname->?healthregionname; color->?color):-
disease_rate (disease->?disease:Respiratory_diseases; geometryname->?healthregionname; year->?year:Integer; rate->?rate:Real!?),
health_region (name->?healthregionname; geometry->?hrgeometry:Geometry!?), geometries (geometryname->?geometryname; geometry->?geometry:Geometry), graduated_colors (name->? rampname;startvalue->?startvalue:Real; endvalue->?endvalue:Real;
color->?color), greaterThanOrEqual (?rate:Real,?startvalue:Real), lessThan (?rate:Real,?endvalue:Real), gpred_intersects (?geometry:Geometry,?hrgeometry:Geometry).
Case 4. Depending on the scale of representation, the cartographic information
represented to users could be different. For example, between the scale of 1:1,000 to 1:1,
hospitals are shown as polygons. Between the scale of 1:1,000,000 and 1:1,000, hospitals
are shown as points. With the scale smaller than 1:1,000,000, hospitals disappear. In this
case, a minimum scale and maximum scale can be added to the hospital entity for the
cartographic representation purpose. The following sample fact shows one geometric
representation for the multi-representations of a hospital:
hospital (name->Dr_Everett_Chalmers_Hospital;address->700_Priestman_St;city->Fredericton; province->NB; telephone->5064525400; totalbeds->384:Integer; minscale->0.001:Real; maxscale->1:Real; geometry->geo[EPSG4326, polygon[outboundary[66.65654990041024,
45.93896756130009,…]]]:Geometry). With a scale input by users, this rule finds the optimal representation of hospitals:
hospital_locator (name->?name; scale->?scale:Real; geometry->?geometry:Geometry; totalbeds->?totalbeds:Integer):-
hospital (name->?name; geometry->?geomery:Geometry; minscale->?minscale:Real; maxscale->?maxscale:Real; totalbeds->?totalbeds:Integer!?),

153
lessThan (?scale:Real,?maxscale:Real), greaterThanOrEqual (?scale:Real,?minscale:Real).
Complex queries can then be supported by combining the available predicates
exemplified in the above cases. For example, users can define the spatial area of interest
(using customized geometries of Case 3). Then they may like to know where high disease
rate and low income values exist within the area of interest (using the
disease_income_correlator of Case 2). After that, users can get the information about
hospitals within the previously determined high disease rate and low income areas in a
certain map scale (using the hospital_locator of Case 4 and gpred_within of Case 1). All
these steps can be chained into complex rules to formalize user queries.
5.5 Discussion and Conclusions
This health data query and representation framework provides a solution for health
experts to express knowledge as ontologies and rules (regarding semantic, geometric, and
graphic dimensions) in health information integration and representation. The use of rule
techniques enables health experts to exchange reasoning and representation rules on the
Web. Much research has been done on semantic health information integration and query
using non-geospatial information in the reasoning. However, fewer investigations utilize
geometric information for dynamic spatial reasoning in this process. This research built
an integrated system that supports geospatial-enabled semantic health information
retrieval. A basic geometric ontology is designed for the spatial component representation.
Spatial operations and spatial relations are expressed in RuleML for knowledge
representation and deduction. Basic geometries, spatial operations, and spatial relation
154
operators for RuleML are enabled through the extension of the OO jDREW engine. This
implementation thus facilitates semantic health data integration and query with the use of
both non-spatial and spatial operations and relations. Complex queries and reasoning
processes can be implemented to allow the use of semantic, geometric, and graphic
dimensions.
The current system implementation uses the interface of OO jDREW in the query process.
More customized user interfaces in the presentation tier will be implemented to facilitate
health information query and representation. Moreover, as dynamic spatial reasoning and
computation has demanding time and memory requirements, the balance between
caching computed results and dynamic spatial computation need to be optimized for
efficient health information querying. In addition, the ontologies designed in this study
were based on the data collected. Their implementation supports the transformation of
various health data to facts in the knowledge base. To further improve data integration
and query, upper-level or domain-level ontologies need to be investigated. Various health
and geospatial standards can be taken into consideration, such as the HL7 ontology and
Open Geospatial Consortium (OGC) standards.
With the rapid growth of health data, the semantic query of health data becomes
increasingly important for health practitioners in understanding health phenomena. The
support of spatial operation and relation operators by rule systems is useful for health
data integration, query, and representation. In this study, an integrated semantic system
has been built to support geospatial-enabled query and reasoning of health information.

155
With the use of RuleML, this research has enabled geometry types, spatial operation rules,
and spatial relation rules for health information query. The case scenarios in this study
demonstrate the benefits of including a geospatial component in semantic health data
query, permitting the fusion of various kinds of data in the semantic, geometric, and
graphic dimensions. This research fosters the use of ontologies and rules in representing
these dimensions of public health information. It facilitates the deduction of information
collected by different health organizations. The future work will be devoted to the
exploration of ontologies and rules for further semantic integration, query, and
representation of health information.
References
Antoniou, G., V. C. Damásio, B. Grosof, I. Horrocks, M. Kifer, J. Maluszynski, and F. P. Patel-Schneider (2005). "Combining rules and ontologies. A survey." REWERSE Deliverables, I3-D3, [On-line] February 21, 2010. http://rewerse.net/deliverables/m12/i3-d3.pdf.
Boley, H. (2007). "Are your rules online? Four Web rule essentials." Lecture Notes in Computer Science (Including Subseries Lecture Notes in Artificial Intelligence and Lecture Notes in Bioinformatics), 4824, Springer, pp. 7-24.
Bruijn, J. D. (2009). "ONTORULE: ONTOlogies meet business RULEs, State-of-the-art survey of issues." Available at: http://ontorule-project.eu/deliverables-and-resources?func=fileinfo&id=1.
Clementini, E., and P. Felice (1996). "A model for representing topological relationships between complex geometric features in spatial databases." Information Sciences, 90(1-4), pp. 121-136.
Clementini, E., and P. Felice (1994). "A comparison of methods for representing topological relationships." Information Sciences, 80(3), pp. 1-34.
Egenhofer, M. J. (1991). "Reasoning about binary topological relations." Lecture Notes in Computer Science, 525, Springer, pp. 143-160.

156
Gao, S., D. Mioc, H. Boley, F. Anton, and X. Yi (2008). "A RuleML study on integrating geographical and health information." Lecture Notes in Computer Science (Including Subseries Lecture Notes in Artificial Intelligence and Lecture Notes in Bioinformatics), 5321, Springer, pp. 174-181.
Gruber, T. R. (1993). "A Translation Approach to Portable Ontology Specifications." Knowledge Acquisition, 5(2), pp. 199-220.
Jones, C. B., A. I. Abdelmoty, and G. Fu (2003). "Maintaining ontologies for geographical information retrieval on the web." Lecture Notes in Computer Science (Including Subseries Lecture Notes in Artificial Intelligence and Lecture Notes in Bioinformatics), 2888, Springer, pp. 934-951.
Kammersell, W., and M. Dean (2006). "Conceptual Search: Incorporating Geospatial Data into Semantic Queries." Terra Cognita - Directions to the Geospatial Semantic Web.
Kieler, B. (2008). "Derivation of Semantic Relationships between Different Ontologies with the Help of Geometry." Proceedings of Workshop "Semantic Web meets Geospatial Applications", held in conjunction with AGILE 2008, Girona, Spain, May 5.
Klien, E., and M. Lutz (2005). "The role of spatial relations in automating the semantic annotation of geodata." Lecture Notes in Computer Science (Including Subseries Lecture Notes in Artificial Intelligence and Lecture Notes in Bioinformatics), 3693, Springer, pp. 133-148.
Luscher, P., D. Burghardt, and R. Weibel (2007). "Ontology-driven Enrichment of Spatial Databases." Proceedings of 10th ICA Workshop on Generalisation and Multiple Representation, Moscow, August 2-3.
OO jDREW (2010). "OO jDREW - Home." [On-line] February 21, 2010. http://www.jdrew.org/oojdrew/.
Rashid, A., B. M. Shariff, M. J. Egenhofer, and D. M. Mark (1998). "Natural-language spatial relations between linear and areal objects: the topology and metric of English-language terms." International Journal of Geographical Information Science, 12(3), pp. 215-245.
Sheth, A. P., and C. Ramakrishnan (2003). "Semantic (Web) Technology In Action: Ontology Driven Information Systems for Search, Integration and Analysis." IEEE Data Engineering Bulletin, 26(4), pp. 40-48.
Smart, P. D., A. I. Abdelmoty, B. A. El-Geresy, and C. B. Jones (2007). "A framework for combining rules and geo-ontologies." Proceedings of First International

157
Conference, RR 2007, 7-8 June 2007. Springer-Verlag, Innsbruck, Austria, pp. 133-147.
The Rule Markup Initiative (2010). " RuleML Homepage." [On-line] February 21, 2010. http://ruleml.org/.
Vivid solutions (2010). "JTS Topology Suite." [On-line] February 21, 2010. http://www.vividsolutions.com/jts/jtshome.htm.

158
Chapter 6. The Measurement of Geospatial Web Service Quality in
SDIs♠
Abstract
Currently, increasingly large numbers of Geospatial Web Services are being built in
Spatial Data Infrastructures (SDIs). Although services make it easy for users to access
desired information, the quality of Geospatial Web Services will greatly affect the
willingness of users in access of these services. Therefore, in order to improve the use of
service oriented architecture for distributed geospatial data sharing, proper measurement
of the Geospatial Web Service quality is highly valuable. In this research, the senior
authors proposed to evaluate Geospatial Web Service quality from Geospatial Web
Service activities and Geospatial Web Service usage. The Geospatial Web Service
activities contain four layers: Geospatial Web Service commitment, Geospatial Web
Service description, Geospatial Web Service process, and Geospatial Web Service
outcome layers. To determine the Geospatial Web Service Quality Score, both objective
measurement and subjective measurement were considered. Objective measurement can
be generated from the comparison of actual service performance with application
requirements. Subjective measurement determines users’ attitudes towards the
consumption of services. In conclusion, this study brought new perspective in evaluating
♠ Originally published as: Gao, S., D. Mioc, and X. Yi (2009). “The measurement of Geospatial Web Service quality in SDIs.” The 17th International Conference on Geoinformatics, Geoinformatics 2009, Fairfax, USA, August 12-14.

159
Geospatial Web Services in SDIs. It provided a solution to calculate the Geospatial Web
Service quality score from both objective and subjective measurement.
6.1 Introduction
The purpose of building a Spatial Data Infrastructure (SDI) is to avoid unnecessary
duplication in harmonizing and standardizing geospatial datasets by promoting geospatial
data sharing, and thus time, money, and effort can be saved in accessing geospatial data
[Groot, 1997]. Geospatial data, which are useful for decision making in various fields of
socio-economic developments (e.g., environment, transportation, public health), are
substantial components of an SDI. Since the initial SDI development in some developed
countries from mid-1980s, SDIs have been evolved from the product-based generation to
the process-based (user-oriented) generation [Rajabifard et al., 2006].
The vision of building an SDI goes beyond geospatial data collection and sharing to the
consideration of how to better enhance people in decision making. To answer various
requests from users in different fields, SDIs need to be more driven by the ideas of
sharing functionality encapsulated in services, which enable easy access and combination
of functionalities offered by different providers [Bernard and Craglia, 2005]. The use of
Geospatial Web Services makes the download of large irrelevant data no longer
necessary, and enables users to obtain exact and value-added information. Currently,
many Geospatial Web Services have already been built in SDIs. For example, the most
popular standard Web Map Service (WMS), which is fostered by Open Geospatial
Consortium (OGC) and International Organization for Standardization (ISO), has many

160
instances in SDIs. More and more Geospatial Web Services will be created with the
continuous growth of earth observation and user requirements.
While the number of Geospatial Web Services grows in SDIs, the quality is an important
issue in the use of Geospatial Web Services. As services in SDIs are likely to be
consumed by various users in their decision making, the quality of services is extremely
important, especially in critical situations. Currently, while many Geospatial Web
Services exist in SDIs, users do not know some essential details such as whether a service
is running or not, and whether the results from a service are accurate or not. Therefore,
the trust of service is low from the user’s perspective. Many geospatial data providers
claim that they publish data through Geospatial Web Services. However, as many
uncertainties exist in the access of Geospatial Web Services, most users usually would
rather obtain geospatial data directly from data providers than access them through
Geospatial Web Services. Only a few of the Geospatial Web Services in SDIs are being
used by many applications or users, and these Geospatial Web Services usually just serve
as background images. Thus, in order to improve the distributed geospatial data sharing,
reliable measurement of the Geospatial Web Services is highly valuable. A proper service
quality evaluation framework can give users confidence in accessing the services that
meet their requirements. At the same time, service providers can improve their service
quality to attract more users.

161
6.2 Related Work
In the measurement of quality which is subjective in nature, there are subjective and
objective quality issues [Nokia, 2008]. Subjective quality issues depends on users’
perceptions, while objective quality issues can be determined independent of users, such
as the response time of an application. The widely used multi-item scale for measuring
service (SERVQUAL model) defines service quality as a discrepancy between a
customer’s expectations of services and his perceptions of services offered by a firm
[Parasuraman et al., 1988]. It is focused on the subjective quality from users after they
consume services. As the SERVQUAL model is a general method in evaluating user
perceptions of services, it can be used for different services, such as banking services and
car repairing services. However, the objective measurement of service quality needs to
consider specific application requirements.
With the development of Web technologies, the research of service quality began to
evaluate Web Services. The evaluation of Web Services generally uses the objective
measurements, from both functional and non-functional view. The non-functional
characteristics are concerned about the dynamic performance of Web Services. The
functional characteristics are related to the quality of the information that Web Services
provide. From a non-functional view of Web Services quality, Mani and Nagarajan [2002]
listed seven major requirements, which are availability, accessibility, integrity,
performance, reliability, regulatory, and security. All of these factors are related to
dynamic transactions of Web Services in e-business vision. However, some of them are
not very important or different in Geospatial Web Services, such as integrity and

162
regulatory. Ran [2003] combined both functional and non-functional requirements in
service quality and proposed four kinds of quality of services: runtime related service
quality, transaction support related service quality, configuration management and cost
related service quality, and security related service quality. The functional and non-
functional requirements are mixed in the four categories, and the evaluation metrics still
need to be established to quantify each service quality.
With the growing number of the Geospatial Web Services, Peng and Tsou [2003] focused
their Geospatial Web Service quality on non-functional characteristics: performance and
reliability. In SDIs, some work began to monitor Geospatial Web Service availability and
other non-functional quality characteristics [Simonis and Sliwinski, 2005; Scheu and
Rose, 2006]. In the access of Geospatial Web Services, the quality of geospatial data is
also a great concern. Subbiah et al. [2007] proposed to incorporate a set of four geospatial
attributes (accuracy, resolution, completeness, and data types) to describe geospatial
service quality besides regular Web Service quality characteristics.
While the research mentioned considered the dynamic monitoring of the availability or
performance of the Geospatial Web Services, these efforts have generally not considered
the service activities during service consumption in evaluating Geospatial Web Services.
In addition, subjective measurement of Geospatial Web Services quality still needs to be
explored.

163
6.3 Proposed Geospatial Web Service Quality Framework
During service consumption, users/applications need to interact with the services. Five
layered activities (from top to bottom: service commitment, service presentation, service
acquisition, service process, and service value exchange) happen in a service event, and
the occurring of a certain layer requires the existence of a higher layer [Ferrario and
Guarino, 2008]. In Geospatial Web Services, similar service activities can be found.
Because the service acquisition is triggered from the user side, this study didn’t count it
in the Geospatial Web Services activities.
In this research, the coverage of Geospatial Web Service activities is related to Geospatial
Web Services themselves, including the Geospatial Web Service commitment, Geospatial
Web Service description, Geospatial Web Service process, and Geospatial Web Service
outcome layers, as shown in Figure 6.1. When a Geospatial Web Service activity
happened in each layer, the content obtained from the service reflects service quality.
Geospatial Web Service quality can be improved by service providers to enhance the
interaction of each layer with users/applications. Besides service activities, the external
view of service usage (how many people/applications use the service) can also mirror
Geospatial Web Service quality. Thus, in this study, the senior authors proposed to
combine the Geospatial Web Service activities and Geospatial Web Service usage in
evaluating the quality of Geospatial Web Services.

164
Figure 6.1: Geospatial Web Service quality evaluation framework
6.3.1 Geospatial Web Service Activities
The quality measures on Geospatial Web Service activities are related to Geospatial Web
Service commitment, Geospatial Web Service description, Geospatial Web Service
process, and Geospatial Web Service outcome layers. At different layers of Geospatial
Web Service activities, different factors need to be considered.
Geospatial Web Service commitment guarantees the type of service that can be consumed
by users at a certain time. The key issues in the service commitment are the hours that
service is available, categories of services (e.g., map service), invocation address, access
restriction, and characteristics in service value exchange. If a user wants to use a
Geospatial Web Service, the service commitment information will be used at first to filter
services that he can use. As Geospatial Web Services in SDIs will be used by people
from different fields, the service commitment should be provided by services.

165
Geospatial Web Service description is important to let users/applications discover
services, negotiate with services, and invocate services. One of the important
characteristics of Web Services is the self-description ability. The service description
information should give service interfaces, service content, service contact information,
and cost. Service interface information describes all the service interfaces and their
supporting parameters. Service content shows the existing geospatial data or processing
functions in Geospatial Web Services. Service contact information enables users to
contact the service provider when necessary. Cost is also a valuable issue before users
start to consume Geospatial Web Services.
Geospatial Web Service process is the period that service is invocated by
users/applications. During this time, the performance of services is an important concern.
Commonly, the performance of the service processing can be evaluated through
availability, time latency, reliability, error tolerance, and security. Availability shows that
whether the service is able to be consumed by users/applications. Time latency is the time
delay between a request and a response, including the transmission time and processing
time. Reliability is to measure the failure times of services during a time period. In failure
cases, while the services are running, the results are not correct. High error tolerance
abilities make the service robust in handling service requests. Security in the service
process deals with the abilities to support authorized access and encryption in message
transmission.

166
Geospatial Web Service outcome is the results of service process. As the outcome is
associated with geospatial data, the geospatial data quality is a significant issue.
According to ISO 19113, the identified five criteria for geospatial data quality are
positional accuracy, temporal accuracy, logical accuracy, thematic accuracy, and
completeness [ISO/TC 211, 2002]. Positional accuracy covers the absolute accuracy and
relative accuracy between the data and reality. Temporal accuracy depends on the
currency of data collection and the rate of data change. Logic accuracy deals with the
topological consistency, format consistency, and semantic consistency. Thematic
accuracy relies on the correctness of the classification, qualitative attributes and
quantitative attributes. Completeness indicates the possibility of omission and
commission in the data. When a service meets some problems in processing, the error
hints (such as wrong input parameters, and the reason of failure) in the outcome would be
helpful.
6.3.2 Geospatial Web Service Usage
The service acquisition from users is the trigger of Geospatial Web Service process and
Geospatial Web Service outcome. The service acquisition is users’ responsibility and it
reflects the willingness of users to use the service. Therefore, Geospatial Web Service
usage is an empirical evaluation of the quality of a service. It considers how the service is
consumed by users. A Geospatial Web Service can have good marks on service activities,
but it may only be used by one application. From how many people/applications use the
service and the general feeling about the service, it is possible to mirror the service
quality. A service that has not been used by any application lacks value, and therefore its

167
quality would be poor. Service usage can be evaluated from the summation of
people/applications which use the service, the number of the service transactions, and the
amount of exchanged information.
6.4 Geospatial Web Service Evaluation
To evaluate Geospatial Web Services from service activities and service usage, there are
two ways. One is through objective measurement. In this case, the requirements of
services are pre-defined, so the service quality can be verified by actual service
performance. The other is through subjective measurement. Users are asked to express
their attitudes towards using the service.
6.4.1 Objective Measurement
In the objective measurement of Geospatial Web Service quality, depending on the
requirements of specific applications, the scoring items of Geospatial Web Service
activities and Geospatial Web Service usage can be defined, as shown in Figure 6.2.

168
Figure 6.2: Objective Geospatial Web Service score
The items in different level of Geospatial Web Service quality framework need to be
quantified based on the application. For example, the service content item under
Geospatial Web Service description is set to be mandatory. For the item of time latency
under Geospatial Service process, the acceptable value may have to be less than 10s in an
application. The determination of scoring items as well as their quantification process can
be done through experts and user questionnaires.
After that, comparing the actual service performance with the above quantification can
assign a score to each scoring item. In this process, a deterministic model or a fuzzy
model can be designed for each scoring item.
The Geospatial Service commitment and Geospatial Web Service description can be
validated through simple checking. For example, the requirement of Geospatial Web

169
Service description should include service interfaces, service content, and service contact
information. With such requirements, if the service content information is not provided
by the service, the score of service content item under Geospatial Web Service
description would be zero.
Three commonly-used methods to invoke Geospatial Web Services are: Key Value Pairs
(KVP), Simple Object Access Protocol (SOAP), and REpresentational State Transfer
(REST). KVP encoding uses key value pairs to send service requests. SOAP encoding
uses the HTTP POST to send service requests. REST manipulates service resources using
standard HTTP requests. Based on the enabled service invocation methods, dynamic
monitoring can be applied. Machines can be used to evaluate service process by
simulating lots of requests at different times and comparing the responses from services.
The test of service process should cover all the service interfaces and service content that
a service supports. The test results can record information such as the service connection
time, transmission time, response or not, response code, response data volume, response
data. By aggregating the above information, availability, throughput, reliability, and time
latency of the service performance can be obtained.
The assessment of the service outcome needs the contribution of GIS experts. They can
determine the geospatial data quality (positional, temporal, logical, thematic, and
completeness) through field survey, investigation, and quantitative analysis.

170
The evaluation of Geospatial Web Service usage can be done by monitoring the service
access and service data exchange for a time period. The more the access times and data
exchange size are, the higher the Geospatial Web Service usage score will be. Usage
implies the importance of a service to users/applications. In addition, Geospatial Web
Service usage score is a general score for a service, as it is not application specific.
From the scores that assigned to each scoring items, the objective Geospatial Web
Service quality score can be calculated. Usually, the weighted average method is applied,
calculating the scores from the child level to its parent level. The weights can be
determined by experts, user questionnaires, or fuzzy-based models. For instance, the
Geospatial Web Service commitment score is computed based on the scores of the
scoring items under it. For Geospatial Web Service activities, Geospatial Web Service
commitment layer, Geospatial Web Service description layer, Geospatial Web Service
process layer, and Geospatial Web Service outcome layer form a chain. If one layer
doesn’t work well, it will affect the use of the next layer. Therefore, selecting the
minimum score of the four layers as the Geospatial Web Service activity score is one
solution.
6.4.2 Subjective Measurement
The subjective measurement of service quality considers the perceived quality of users in
the consumption of services. Two kinds of users exist in SDIs in using Geospatial Web
Services: developers and end-users, as shown in Figure 6.3. As Geospatial Web Services
are application to application communication, they don’t need to have graphic interfaces.

171
Therefore, the evaluation of Geospatial Web Services depends on the applications
implemented on services by developers. The applications will be finally consumed by
developers and end-users to see the quality of services. To get their perceptions of
services, the senior authors design separate questionnaires for developers and end-users
with the consideration of Geospatial Web Service activities and Geospatial Web Service
usage. As end-users only consume the service-based applications, the Geospatial Web
Service commitment and Geospatial Web Service description are not applicable to them.
The purpose of the questionnaire is to know the gap between users’ expectations and the
actual service abilities. Following the questionnaire designed in the literature
[Parasuraman et al., 1988; Brooke, 1996; Li et al., 2002], the questionnaires were
designed with five-point scale (strongly disagree, slightly disagree, neutral, slightly agree,
strongly agree), with some positive and negatives questions to limiting the bias from
users without thinking about them.
Figure 6.3: Users of Geospatial Web Services in SDIs

172
Questionnaires for developers.
Geospatial Web Service activities - Geospatial Web Service commitment
Q1 I think the available hours for this service are limited.
Q2 I found it is easy to find this service.
Geospatial Web Service activities - Geospatial Web Service description
Q3 It is hard for me to find what I need from this service capability description.
Q4 I imagine the content of this service would be used by many applications.
Geospatial Web Service activities - Geospatial Web Service process
Q5 I think the response speed from this service is slow.
Q6 I think I am confident to use this service.
Q7 I found the service had strict rules for inputs.
Geospatial Web Service activities - Geospatial Web Service outcome
Q8 I found the geospatial data quality from this service is bad.
Q9 I found the error messages from this service are helpful.
Geospatial Web Service usage
Q10 I found the use of this service is complex.
Q11 Overall, I am satisfied with this service.
Q12 I think I would like to use this service often.

173
Questionnaires for end-users.
Geospatial Web Service activities - Geospatial Web Service process
Q1 I found this service is always available when I use it.
Q2 I think the response speed from this service is slow.
Q3 I think I am confident to use this service.
Geospatial Web Service activities - Geospatial Web Service outcome
Q4 I think the geospatial data or function from this service hardly meet my
requirements.
Q5 I found the results from this service are precise and accurate.
Geospatial Web Service usage
Q6 Overall, I am satisfied with this service.
Q7 I doubt this service is useful to other people.
Q8 I think I would like to use this service often.
In the questions, the senior authors assigned the score from zero to four for the positive
questions and the score from four to zero for negative questions. The subjective
Geospatial Web Service score can be calculated by averaging scores of all the questions
from participating users.
6.5 Conclusions
In conclusion, this study provided a framework to evaluate Geospatial Web Services in
SDIs from Geospatial Web Service activities and Geospatial Web Service usage. The

174
objective measurement and subjective measurement were proposed in the evaluation of
Geospatial Web Service quality. The measurement of Geospatial Web Service quality in
SDIs will push Geospatial Web Service providers to improve their service quality. In
addition, the quality information of Geospatial Web Services is also useful in service
discovery and service matching. The ongoing work is to apply this framework to evaluate
the New Brunswick provincial SDI.
Acknowledgements
This research has received the financial support from Service New Brunswick, the Crown
Corporation owned by the Province of New Brunswick, Canada. The objective of this
research is to study the usability of an SDI and build the Best Practices of using an SDI
(New Brunswick SDI). Sincere gratitude goes out to Service New Brunswick for their
support.
References
Bernard, L., and M. Craglia (2005). "SDI - From Spatial Data Infrastructure to Service Driven Infrastructure." Workshop on Cross-Learning between Spatial Data Infrastructures, and Information Infrastructures.
Brooke, J. (1996). "SUS: A quick and dirty usability scale." Usability Evaluation in Industry, pp. 189-194.
Ferrario, R., and N. Guarino (2008). "Towards an ontological foundation for service science." Proceedings of FOIS2008, the 5th international conference on formal ontology in information systems, Saarbrucken, Germany, October 31 - November 3.
Groot, R. (1997). "Spatial data infrastrucutre (SDI) for sustainable land management." ITC Journal, 3, pp. 287-294.

175
ISO/TC 211 (2002). "Geographic information – quality principles." Rep. No. ISO 19113:2002.
Li, Y. N., K. C. Tan, and M. Xie (2002). "Measuring web-based service quality." Total Quality Management, 13(5), pp. 685-700.
Mani,A., and A. Nagarajan (2002). "Understanidng quality of service for Web Services." [On-line] February 21, 2010. http://www.ibm.com/developerworks/library/ws-quality.html.
Nokia (2008). "Measuring quality – objective and subjective." [On-line] June 28, 2009. http://www.forum.nokia.com/document/S60_Platform_Development_and_QA_Process_Guideline/?content=GUID-A049606C-08BA-468E-B743-8D9985E9887C.html.
Parasuraman, A., V. A. Zeithaml, and L. L. Berry (1988). "A conceptual model of service quality and its implications for future research." Journal of Marketing, 49, pp. 41-50.
Peng, Z. R., and M. H. Tsou (2003). Internet GIS : distributed geographic information services for the internet and wireless networks. Wiley, Hoboken, N.J.
Rajabifard, A., A. Binns, I. Masser, and I. Williamson (2006). "The role of sub-national government and the private sector in future spatial data infrastructures." International Journal of Geographical Information Science, 20(7), pp. 727-741.
Ran, S. (2003). "A model for web services discovery with QoS." ACM SIGecom Exchanges, 4(1), pp. 1-10.
Scheu, M., and A. Rose (2006). "Monitoring of Spaital Data Infrastructure (SDI)." Proceedings of XXIII FIG Congress, Munich, Germany, October 8-13.
Simonis, I., and A. Sliwinski (2005). "Quality of Service in a Global SDI." FIG Working Week 2005 and GSDI 8 Conference, Cairo, Egypt, April.
Subbiah, G., A. Alam, L. Khan, and B. M. Thuraisingham (2007). "Geospaital data qualities as Web Services performance metrics." Proceedings of 15th ACM International Symposium on Geographic Information Systems, ACM-GIS 2007, Seattle, Washington, USA, November 7-9.

176
Chapter 7. Conclusions
7.1 Summary of the Research
This research has designed and developed methods to resolve the problems encountered
in health information sharing using Web-based GIS. Three problems in health
information sharing have been studied: data heterogeneity, resource deficiency, and
health information representation.
Data Heterogeneity
Regarding health data heterogeneity, most of the current research focuses on the non-
spatial semantics of health data, using ontologies and rules. However, the geospatial
component in health data is not as widely examined. Machine understanding of spatial
information can support the interpretation of health data semantics. Therefore, a
geospatial-enabled approach has been proposed in this study for semantic health
information retrieval. The research proposes a framework that uses ontologies, facts, and
rules in health information reasoning and deduction from both geospatial and non-spatial
aspects. Cases scenarios for respiratory disease information retrieval have been used to
demonstrate this approach. Ontologies on the semantic, geometric, and graphic
dimensions have been explored for the basic representation of health data resources from
files, databases, or Geospatial Web Services. Topological relations and spatial operations
were also enabled in a RuleML engine for the representation of spatial knowledge in the
Semantic Web.

177
Resource Deficiency
The weaknesses of current geospatial health information systems are related to their
separated and independent development and closely coupled architecture. Therefore, it is
difficult to integrate the data from different providers. In addition, the abilities of these
systems are mainly concentrated on the visualization of health data. Health data
processing abilities and representation styles are not available to users or can not be
easily utilized by users. The accessibility, interoperability, trust, and privacy issues of
health resource access were explored in this research.
To allow the access of health maps and processing functionalities, Geospatial Web
Services were proposed to enable a loosely coupled architecture design for cross-platform
health data and function sharing. If the access URLs and interfaces of the Geospatial Web
Services are known, resources can be accessed no matter what underlying platforms and
development environment are used.
To support interoperability between different geospatial health applications, OGC
standards were proposed to be utilized for health data processing and sharing. Therefore,
these open-standard Geospatial Web Services which provide health data and processing
functions can be easily accessed through Web browsers, OGC-compliant clients, or user
customized applications. WMS allows the generation of disease maps with different
parameters, including the time tag. SLD enables a user-defined style representation of
maps. A Web portal was implemented for the access of various WMS from different
service providers. Users can visualize the spatio-temporal pattern of disease data through

178
maps or animations in the designed Website, which interacts with the WMS services.
WMC eases disease maps sharing and user collaboration by recording the access
parameters to Geospatial Web Services in XML. This study integrated a discussion forum
within a map portal to support both text and map sharing for user collaboration. WPS
supports the online processing of health information with the input of the health data,
geospatial data, processing parameters, and cartographic styles from users. A
configuration wizard was designed for health managers to customize the WMS and WPS
for end-users. After the export process from the wizard, a generated HTML viewer,
which can be saved and used anywhere through the Web, allows the access to WMS and
WPS for visualization purposes with basic GIS functions.
To promote SDI and open-standard Geospatial Web Services in health, a study has been
carried out to evaluate the CGDI for health. CGDI has adopted the standards mentioned
above. Health applications can be easily built on top of CGDI, and the overall evaluation
of CGDI for health is positive. Moreover, the development of SDI will lead to a great
many Geospatial Web services. For the trust issues in health service access, a Geospatial
Web Service quality measurement framework was developed. This framework provides a
systematic analysis on the service activities that happened during the service
consumption. A list of factors was discussed for the measurement of Geospatial Web
Services. To evaluate the score of the Geospatial Web Services, methods of both
objective measurement and subjective measurement were explored by comparing the
service performance with the requirements and conducting user questionnaire surveys.

179
The privacy issues in health resource access were handled through several methods, such
as applying statistical calculation on health data (using CMR, AAMR, etc.), thematic
mapping of health information (using classification, charts, etc.), and showing health
information at different spatial levels of detail with the consideration of privileges. These
methods compromise the sensitive issues in health data and allow the distribution of
health information to health practitioners and the public.
Health Information Representation
Most of the geospatial health applications rely on maps for the information sharing.
Without proper map design and map description, maps can easily mislead people. To
allow the exchange of georeferenced health information, an XML-based health
information representation, HERXML, which can be parsed as maps, was proposed for
information sharing. The platform-neutral characteristic of XML allows the easy
exchange of HERXML through the Web. The statistical results of many health activities
(e.g., disease outbreaks, hospital observations) can be shared with the consideration of
many variables, including time and demographics. The use of statistics relieves the
privacy issues in health information sharing. In addition, users can get detailed
information by contacting the data source providers which are described in HERXML.
The coverage of HERXML includes the semantic, geometric, and graphic dimensions.
The semantic dimension considers health-related activities, statistical methods used,
mapping variables, mapping values, and data source metadata; the geometric dimension
is about the spatial data in which health statistical results are to be represented; the
graphic dimension handles the cartographic styles including the classification schemes.

180
7.2 Major Achievements of the Research
Five contributions have been achieved in this research:
1) This research has proposed a semantic health information query and representation
framework. This framework allows the consideration of both geospatial semantics and
non-spatial semantics in health information integration and retrieval. Ontologies, rules
and facts in this framework are used to support several functionalities, such as extracting
health information from various sources, matching the data with the same semantics,
reasoning in the spatial dimension with spatial relations and spatial operations, and fusing
the information representation homogeneously. The RuleML engine OO jDREW has
been customized to support all these functionalities in health information retrieval.
Geospatial semantics was fully integrated into OO jDREW for semantic health
information retrieval.
2) This research has designed and implemented an interoperable health information
mapping and sharing architecture to overcome the difficulties in current health system
integration and reusability for real-world applications. This architecture covers essential
tiers: data tier, ontology tier, service tier, and map/animation tier for health information
sharing. OGC Geospatial Web Services were proposed and implemented in this
framework to allow interoperability in the sharing of health data and processing
functionalities. Moreover, this research firstly introduced Web Processing Services to
offer geospatial processing functionalities for health data via the Internet. This

181
architecture supports health data mapping and processing, and organization/user
collaboration by sharing maps and text. It can be applied to real disease outbreaks if
practical difficulties (especially the laws governing the access and the use of health
information) in obtaining data from various health organizations are resolved.
3) This research has designed and implemented a health information representation
model, HERXML, for the exchange and sharing of health information representation in
semantic, geometric, and graphic dimensions to minimize the misunderstanding of the
Web maps which are generated from current health applications using Web-based GIS.
HERXML enables the representation of statistical results for various health activities and
provides essential information for users in interpreting health maps.
4) This research has proposed a new framework for evaluating service quality from all
the service activities that happen in their consumption. The framework provides a
systematic consideration of the factors that would affect Geospatial Web Service quality.
Based on this framework, a methodology on how to implement both objective service
quality scores and subjective service quality scores was designed.
5) This research has implemented several user interfaces/portals for accessing health data
and processing functionalities, such as the WMS portal to visualize the spatio-temporal
disease information across the New Brunswick and Maine border, the Web portal that
integrates a WMS client and a discussion forum for user collaboration, and the Web

182
portal which allows the customization of health processing parameters and data retrieval
from WMS and WPS.
7.3 Recommendations for Further Research
Based on this research, recommendations for further research are given below.
For health data heterogeneity, suggestions include the improvement of the ontologies on
the semantics, geometries, and graphics of health data, and the enrichment of human
knowledge by rules for health data reasoning and deduction. The ontology- and rule-
based health information integration and retrieval framework provides the basics on how
to utilize both non-spatial and geospatial semantics for health, and the implementation
steps in case studies demonstrate how a complete system could work. If the knowledge
base can incorporate more ontologies and rules, it will make such a system ready for real
health applications.
For resource deficiency, suggestions include the utilization of all available data for
decision making and quality control in data sharing. With the recent rapid deployment of
sensors, including human body sensors, air pollution sensors, climate sensors, and
satellite sensors, huge health data sets could be available in real-time from Geospatial
Web Services. This research has proposed the use of standard Geospatial Web Services in
sharing health data and processing functionalities. Future efforts can be placed on the
development of geospatial Web applications using all historical and real-time data to
extract new knowledge and support real-time decision making for health professionals.

183
Moreover, the development of a Quality-of-Service tool that is running continuously for
Geospatial Web Service monitoring would be beneficial.
For health information representation, suggestions include the generation of a standard
vocabulary for HERXML and questionnaire surveying of the comprehensiveness of
HERXML. A predefined vocabulary for HERXML could facilitate users in the sharing
and understanding of health information representation. Carrying out a questionnaire
survey for HERXML can prioritize information content and possibly incorporate new
essential information.

184
Appendix A: XML Schema for HERXML
1 <?xml version=''1.0'' encoding="UTF-8"?> 2 <!-3 By Sheng Gao. April2008 4 5 Submitted as additional material for the IJHG article 6 7 This doaJment is our preliminary HERXML schema. desi;Jned using A~ova XMLSpy. This XML schema covers the semantic. geometric and graphic representations
of health information. 8 -->
9 10 <xs:schema xmlns:herxml="http://nblunq.ca" xmlns xs="http:ffwww. w3.orqf2001 (XMLSchema" xmlns:qml="http:ffwww .openqis.neVqml" xmlns:xlink="
http://www.w3.orq/1999/xlink'' tarqetNamespace="http://nblunq.ca" elementformDefault="qualifiecf' attributeformDefault="unqualified"> 11 <xs:import namespace="http://www.openqis.net/qml" schemalocation="schema/qml/3.1 .1/base/feature.xsd"/> 12 <xs:element name="HERXML "> 13 <xs:annotation> 14 <xs:documentation>herxml schema root element</Xs:documentation> 15 </xs:annotation> 16 <xs:complexType> 17 <xs:sequence> 18 <xs:element name="Health" type="herxmi:HealthType"/> 19 <xs:element name="MappingData"> 20 <xs:oomplexType> 21 <xs:sequence> 22 <xs:element ref="herxmi:BoundingBox"{> 23 <xs:element name="SpatiaiData"> 24 <xs:oomplexType> 25 <xs:sequence> 26 <xs:element ref="herxmi:DataSource"/> 27 <xs:choice> 28 <xs:element name="WFS"> 29 <xs:complexType> 30 <xs:sequence> 31 <xs:element name='!URL"/> 32 <xs:element name="LayerName"/> 33 </xs:sequence> 34 <xs:attribute name='"version"/> 35 <:fxs:oomplex Type> 36 <:fxs:element> 37 <xs:element name::"'Geometries"> 38 <xs:complexType> 39 <xs:sequence> 40 <xs:element name=''Geometry'' type=•gmi:AbstractGeometricPrimitive Type" maxOccurs="unbounded"/> 41 </xs:sequence> 42 <:/xs:oomplexType> 43 <:fxs:element> 44 <xs:element name= .. Remotel i nk"> 45 <xs:complexType> 46 <xs:attribute name="type" form="unqualified"l> 47 <xs:attribute name=11href '/> 48 <:fxs:oomplexType> 49 </xs:element> 50 </xs:choice> 51 </xs:sequence> 52 <:fxs:oomplex Type> 53 </xs:element> 54 <xs:element name="Relation"> 55 <xs:oomplexType> 56 <xs:sequence> 57 <xs:element name="JoinAttribute" type=•xs:strinq"/> 58 <xs:element name="MatchinqValuePairs" maxOccurs: •unbounded"> 59 <xs:complexType> 60 <xs:sequence> 61 <xs:element name~"SpatiaiiDValue" type="xs:string"/> 62 <xs:element name~"HealthiOValue" type=''xs:string"/> 63 <:fxs:sequence> 64 <:/xs:oomplexType> 65 </xs:element> 66 </xs:sequence> 67 <:fxs:oomplex Type> 68 </xs:element> 69 <xs:element name="MappingValues"> 70 <xs:oomplexType> 71 <xs:sequence> 72 <xs:element name="StatisticaiMethod"> 73 <xs:complex Type> 74 <xs:sequence>

185
75 <xs:element ref="herxmi:Nome"/> 76 <xs:element ref="herxmiT itle"/> 77 <xs:element ref="herxmi:Description"/> 78 <xs:element name="ParameterGroup'' maxOccurs="'unbounded"> 79 <xs:oomplex Type> 80 <xs:sequence> 81 <xs:element ref="herxml:parameter'' maxOccurs="unbounded"/> 82 </xs:sequence> 83 </xs:complex Type> 84 </xs:element> 85 </xs:sequence> 86 </xs:complexType> 87 </xs:element> 88 <xs:element ref="herxrni:OataSource"/> 89 <xs:element name="MappinqValueGroup" m6x0ccurs="unbounded"> 90 <xs:complex Type> 91 <xs:sequence> 92 <xs:element name="MappinqValue" maxOccurs="unbounded"> 93 <xs:oomplexType> 94 <xs:simpleContent> 95 <xs:extension base="xs:double"> 96 <xs:attribute name="healthiDValue"/> 97 </xs:extension> 98 </xs:simpleContent> 99 <jxs:complexType>
1 00 </xs:element> 101 </xs:sequence> 102 <xs attribute name="groupAttr"/> 103 <jxs:complexType> 104 </Xs:element> 105 </xs:sequence> 106 <xs:attribute name="attrName"/> 1 07 <jxs:complex Type> 108 </xs:element> 109 </xs:sequence> 110 </xs:complexType> 111 </xs:element> 112 <xs:element name="Representation"> 113 <xs:complexType> 114 <xs:sequence> 115 <xs:element ref="herxmi:BoundingBox"/> 116 <xs:element ref="herxmi:Style"/> 117 </xs:sequence> 118 </xs:complexType> 119 </xs:element> 120 </xs:sequence> 121 <xs:attribute name:::::'\oersion" use:::::"required"/> 122 </xs:complexType> 123 </xs:element> 124 <xs:element narne:::::"Name" type=''xs:string"/> 125 <xs:element narne="Title" type="xs:strinq"/> 126 <xs:element narne="Oescription" type="xs:strinq"/> 127 <xs:element narne="Keywordlist''> 128 <xs:complex Type> 129 <xs:sequence> 130 <xs:element name=" Keyword" type=''xs:strinq• maxOccurs=''unbounded"/> 131 </xs:sequence> 132 <jxs:complex Type> 133 </xs:element> 134 <xs:element narne="BoundinqBox" type="herxmi:BoundinqBoxType"/> 135 <xs:complex Type name=MBoundingBoxlype"> 136 <xs:sequence> 137 <xs:element name="Minx" type="xs:double"/> 138 <xs:element name="MinY'' type="xs:double"/> 139 <xs:element name="MaxX• type='"xs:double"/> 140 <xs:element name="MaxY" type="xs:double"/> 141 </xs:sequence> 142 <xs:attribute name="srsName" type="xs:string" use="'required"/> 143 </xs:complexType> 144 <xs:element narne="parameter'' type="xs:string" abstract="true'"> 145 <xs:annotation> 146 <xs:docume-ntation>abstract pe~rameter element. used for the definition of health infulential factors</xs:documentation> 147 </xs:annotation> 148 </xs:element> 149 <xs:element narne="Geolayer'' type="xs:strinq" substitutionGroup="herxml:parameter-/> 150 <xs:element narne: " Age From" type: "xs:string" substitutionGroup='~herxml:parameter"/>
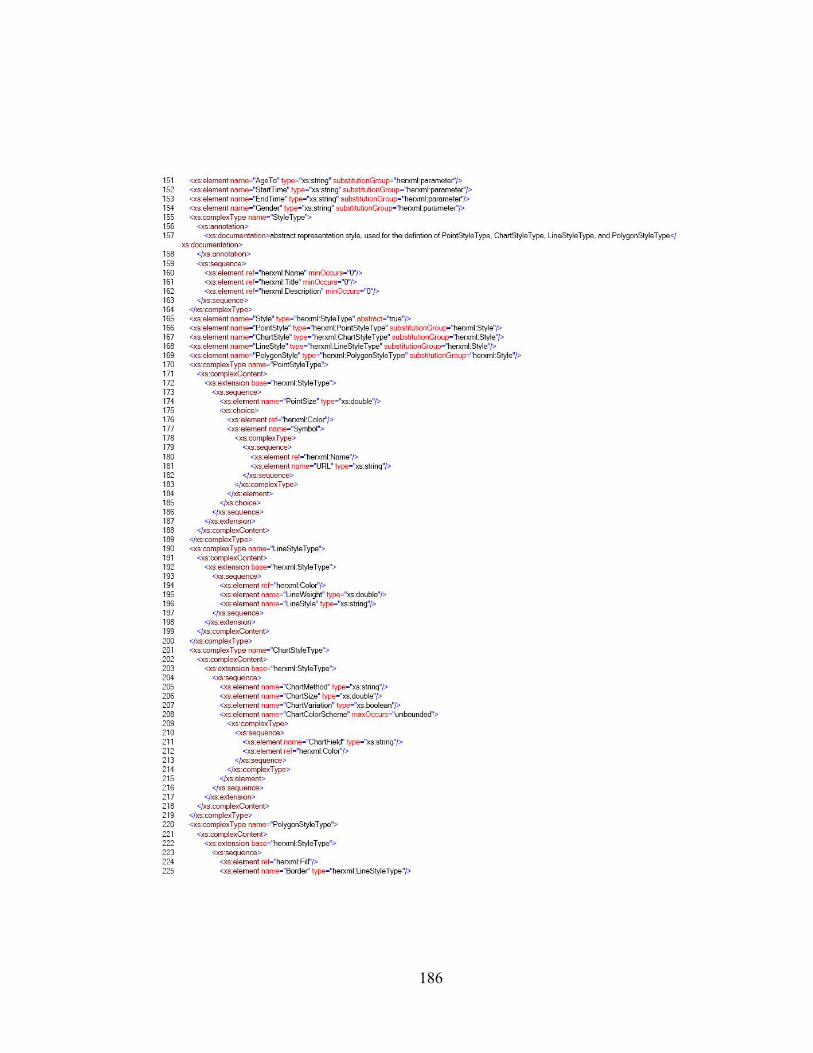
186
151 <xs:element narne="Age To" type="xs:string11 substitutionGroup=11herxml:parameter-/> 152 <xs:element name="StartTime" type="xs:string• substitutionGroup="herxml:parameter"/> 153 <xs:element narne="EndTime" type="xs:string" substitutionGroup="herxml:parameter"/> 154 <xs:element narne="Gender'' type="xs:string" substitutionGroup="'herxml:parameter-/> 155 <xs:complexType nome=' StyleType"> 156 <xs:annotation> 157 <xs:documentation>abstract representation style. used for the defintion of PointStyle Type. ChartStyle Type. LineStyle Type. and PolygonStyle Type</
xs:documentation> 158 </xs:annotation> 159 <xs:sequence> 160 <xs:element ref="herxmi:Name" minOccurs="O''/> 161 <xs:element ref=11herxmi:Title" minOccurs="O"/> 162 <xs:element ref="herxmi:Description" minOccurs="O"/> 163 <fxs:sequenoe> 164 </xs:complexType> 165 <xs:element narne="Style" type="herxmi:Style Type" abstract=l!true"/> 166 <xs:element name="PointStyle' type="herxmi:PointStyle Type" sul>stitutionGroup=' herxmi:Style"/> 167 <xs:element name="ChartStyle' type="herxmi:ChartStyleType" substitutionGroup="herxmi:Style"/> 168 <xs:element name="LineStyle" type="herxmi:LineStyle Type" substitutionGroup="herxmi:Style"/> 169 <xs:element name="PolygonStyle" type="herxmi:PolygonStyle Type" substitutionGroup="herxmi:Style"/> 170 <xs:complexType name=' PointStyleType' > 171 <xs:complexContent> 172 <xs:extension base="herxmi:StyleType"> 173 <xs:sequence> 174 <xs:element name="PointSize" type="xs:double'/> 175 <xs:choice> 176 <xs:element ref="herxmi:Color"/> 177 <xs:element name=' Symbol"> 178 <xs:complexType> 179 <xs:sequence> 180 <xs:element ref="herxmi:Name"/> 181 <xs:element name="URL" type="xs:strinq"/> 182 <fxs:sequence> 183 </xs:complexType> 184 </xs:element> 185 </xs:choice> 186 </xs:sequence> 187 </xs:extension> 188 </xs:complexContent> 189 </xs:complexType> 190 <xs:complexType name=' LineStyleType"> 191 <xs:complexContent> 192 <xs:extension base="herxmi:Style Type'> 193 <xs:sequence> 194 <xs:element ref="herxmi:Color"/> 195 <xs:element name='!L ineWeight" type="xs:double"/> 196 <xs:element name="LineStyle" type="xs:string"/> 197 </xs:sequence> 198 </xs:extension> 199 </xs:complexContent> 200 </xs:complexType> 201 <xs:complexType name=' ChartStyleType'> 202 <xs:complexContent> 203 <xs:extension base="herxmi:Style Type' > 204 <xs:sequence> 205 <xs:element name="ChartMethod" type="xs:strinq"/> 206 <xs:element name="ChartSize'' type="xs:double"/> 207 <xs:element name="ChartVariation" type="xs:boolean"/> 208 <xs:element name="ChartColorScheme" maxOca.Jrs="unbounded"> 209 <xs:complex Type> 210 <xs:sequence> 211 <xs:element name="ChartField" type="xs:string"/> 212 <xs:element ref="herxmi:Colo~'/>
213 </xs:sequence> 214 </xs:complexType> 215 </xs:element> 216 </xs:sequence> 217 </xs:extension> 218 <jxs:complexContent> 219 </xs:complexType> 220 <xs:complexType name=' PolygonStyleType"> 221 <xs:cornplexContent> 222 <xs:extension base="herxmi:Style Type' > 223 <xs:sequence> 224 <xs:element ref="herxmi:Fill"/> 225 <xs:element name="Border" type="herxmi:LineStyle Type"/>

187
226 </xs:sequence> 227 </xs:ex1ension> 228 </xs:oomplexContent> 229 </xs:oomplexType> 230 <xs:complexType name="FiiiType"> 231 <xs:sequence> 232 <>cs:element ref="herxmi:Description" minOccurs="O"/> 233 </xs:sequence> 234 </xs:oomplexType> 235 <xs:element name="f ilr' type="herxmi:Filll ype"/> 236 <xs:element name="RanqeFilr' type-="herxmi:RonqeFilllype" substitutionGroup="herxmi:Fill"/> 237 <xs:element name="Gradientf ilr' type="herxmi:Gradientf iiiType" substitutionGroup=' herxmi:Fill"/> 238 <xs:complex Type name="GradientfiiiT ype"> 239 <xs:complexContent> 240 <xs:extension base="herxmi:Filllype•> 241 <xs:sequence> 242 <xs:element name="FromColor" type="xs:strinq"/> 243 <xs:element name="T oColor" type="xs:strinq"J> 244 <xs:element name="NumOfCiasses" type="xs:int"/> 245 </xs:sequence> 246 </xs:extension> 247 </xs:oomplexContent> 248 </xs:oomplexType> 249 <xs:complexType name="RangefiiiType"> 250 <xs:complexContent> 251 <xs:extension base="herxmi:Filllype•> 252 <xs choice> 253 <xs:element name="SingleRange" maxOccurs="'unbounded"> 254 <xs:oomplexType> 255 <xs:sequence> 256 <xs:element name="RanqeValue"' type="xs:double"/> 257 <xs:element ref="herxmi:FiiiMethod'/> 258 </xs:sequence> 259 </xs:complexlype> 260 </xs element> 261 <xs:element name=="DoubleRanqe"' maxOccurs::"unbounded"> 262 <xs:oomplex Type> 263 <xs:sequence> 264 <xs:element name="MinValue" type="xs:double"/> 265 <xs:element name="MaxValue" type="xs:double"/> 266 <xs:element ref="herxmi:FiiiMethod'/> 267 </xs:sequence> 268 </xs:complexType> 269 </xs:element> 270 </xs:choice> 271 </xs:extension> 272 </xs:oomplexContent> 273 </xs:oomplexType> 274 <xs:element name="Color" type="xs:string"> 275 <xs:annotation> 276 <xs:documentation>e.q., Ox######</xs:documentation> 277 <Jxs:annotation> 278 </xs:element> 279 <xs:element name="T exure"/> 280 <xs:element name="Pattem"/> 281 <xs:complexl ype name="FiiiMethodType"> 282 <xs:choice> 283 <xs:element ref="herxmi:Color11/> 284 <xs:element ref="herxmi:T exure"/> 285 <xs:element ref="herxmi:Pattem"/> 286 </xs:choice> 287 </xs:oomplexType> 288 <xs:element name="FiiiMethod' type="herxmi:FiiiMethodType"/> 289 <xs:complexType name="DataSourceType"> 290 <xs:sequence> 291 <xs:element name="Contacr> 292 <xs:oomplexType> 293 <xs:sequence> 294 <xs:element name="ContactName" type="xs:string"/> 295 <xs:element name=" Address" type="'xs:string"/> 296 <xs:element name="Phone" type=''xs:sbing"/> 297 </xs:sequence> 298 </xs:complexType> 299 <fxs:element> 300 <xs:element name="OataSourceDescription" type="xs:strinq"/> 301 <xs:element name="OataSource Time• type="xs:string"/>

188
302 </xs:sequence> 303 </xs:complex Type> 304 <xs:element name="DataSource" type="he"'mi:DataSourceType"/> 305 <xs:complexType name="HealthType" abstract="true"> 306 <xs:sequence> 307 <J<S:element ref="he"'mi:Name"/> 308 <xs:element ref="he"'mi:Totle"/> 309 <xs:element ref="he"'mi:Description"/> 310 <xs:element ref="herxmi:Keyv.rordlist"' minOccurs="O"/> 311 </xs:sequence> 312 <xs:attribute name=''type"' type="xs:strinq" use="optional"/> 313 </xs:complexType> 314 <xs:complexType name="'DiseaseObservationType'"> 315 <xs:complexContent> 316 <xs:extension base="he"'mi:Healthlype"> 317 <xs:sequence> 318 <xs:element name="Code" type= .. xs:strinq"/> 319 </xs:sequence> 320 </xs:extension> 321 <jxs:oomplexContent> 322 </xs:complexType> 323 </xs:schema> 324

Curriculum Vitae
Candidate’s full name: Sheng Gao Universities attended:
2006-2010 University of New Brunswick, Canada Studying for PhD degree 2006-2007 University of New Brunswick, Canada University Teaching Diploma 2004-2006 Wuhan University, China Master of Science in Engineering 2000-2004 Wuhan University, China Bachelor of Science in Engineering
Publications:
Gao, S., H. Boley, D. Mioc, F. Anton, and X. Yi (2009). “Geospatial-Enabled RuleML in a Study on Querying Respiratory Disease Information.” Lecture Notes in Computer Science, 5858, Springer, pp. 272-281. Gao, S., E. Oldfield, D. Mioc, X. Yi, and F. Anton (2009). “Geospatial Web Services and applications for infectious disease surveillance.” Disaster Management and Human Health Risk: Reducing Risk, Improving Outcomes, WIT Press, pp. 13-19. Gao, S., D. Mioc, and X. Yi (2009). “The measurement of Geospatial Web Service quality in SDIs.” The 17th International Conference on Geoinformatics, Geoinformatics 2009, Fairfax, USA, August 12-14. Gao, S., D. Mioc, X. Yi, F. Anton, E. Oldfield, and D.J. Coleman (2009). “Towards Web-based representation and processing of health information.” International Journal of Health Geographics, 8:3. Available at: http://www.ij-healthgeographics.com/content/8/1/3, DOI: 10.1186/1476-072X-8-3. Gao, S., D. Mioc, X. Yi, F. Anton, E. Oldfield, and D.J. Coleman (2008). “The Canadian Geospatial Data Infrastructure and health mapping.” European Journal of Geography (CyberGeo). Available at: http://www.cybergeo.eu/index21123.html, article 434.
Gao, S., D. Mioc, H. Boley, F. Anton, and X. Yi (2008). “A RuleML Study on Integrating Geographical and Health Information.” Lecture Notes in Computer Science, 5321, Springer, pp. 174-181. Gao, S., D. Mioc, H. Boley, F. Anton, and X. Yi (2008). “Ontology-based querying and visualization of geo-referenced health information.” Joint ISCRAM-CHINA and Gi4DM Conference, Harbin, China, August 4-6. Gao, S., D. Mioc, X. Yi, F. Anton, and E. Oldfield (2008). “Geospatial services for decision support on public health.” ISPRS conference, Beijing, China, July 3-11. Gao, S., D. Mioc, F. Anton, X. Yi, and D.J. Coleman (2008). “Online GIS services for mapping and sharing disease information.” International Journal of Health Geographics, 7:8. Available at: http://www.ij-healthgeographics.com/content/7/1/8, DOI: 10.1186/1476-072X-7-8. Gao, S., D. Mioc, X. Yi, F. Anton, D.J. Coleman, B. MacKinnon, and E. Oldfield (2007). “Online mapping of Infectious disease.” Joint CIG/ISPRS Conference on Geomatics for Disaster and Risk Management, May 23-25.
Conference Presentations:
Gao, S., D. Mioc, and X. Yi (2009). “The measurement of Geospatial Web Service quality in SDIs.” The 17th International Conference on Geoinformatics, Geoinformatics 2009, Fairfax, USA, August 12-14. Gao, S., D. Mioc, H. Boley, F. Anton, and X. Yi (2008). “Ontology-based querying and visualization of geo-referenced health information.” Joint ISCRAM-CHINA and Gi4DM Conference, Harbin, China, August 4-6. Gao, S., D. Mioc, X. Yi, F. Anton, and E. Oldfield (2008). “Geospatial services for decision support on public health.” ISPRS conference, Beijing, China, July 3-11. Gao, S. and D. Mioc (2008). “Semantic search for geo-referenced health data.” The 15th Annual Atlantic Institute Student Research Conference (AISRC), Quebec City, Canada, May 14-16. Gao, S. and D. Mioc (2007). “Cross-Border Infectious Disease Mapping.” The GIScience & Geomatics Graduate Research Seminar, Schoodic Peninsula, Acadia National Park, Maine, USA, June 13-15. Gao, S., D. Mioc, X. Yi, F. Anton, D.J. Coleman, B. MacKinnon, and E. Oldfield (2007). “Online mapping of Infectious disease.” Joint CIG/ISPRS Conference on Geomatics for Disaster and Risk Management, May 23-25.
Related Documents


