Product Validation Report - PVR-14 (Product H14 – SM-DAS-2) Doc.No: SAF/HSAF/PVR-14 Issue/Revision Index: 1.1 Date: 31/05/2012 Page: 1/45 EUMETSAT Satellite Application Facility on Support to Operational Hydrology and Water Management Product Validation Report (PVR-14) for product H14 (SM-DAS-2) Soil Moisture Profile Index in the roots region by surface wetness scatterometer assimilation method Reference Number: SAF/HSAF/PVR-14 Issue/Revision Index: 1.1 Last Change: 31 May 2012 About this document This Document has been prepared by the Product Validation Cluster Leader, with the support of the Project Management Team and of the Validation and Development Teams of the Soil Moisture Cluster

Welcome message from author
This document is posted to help you gain knowledge. Please leave a comment to let me know what you think about it! Share it to your friends and learn new things together.
Transcript

Product Validation Report - PVR-14
(Product H14 – SM-DAS-2)
Doc.No: SAF/HSAF/PVR-14
Issue/Revision Index: 1.1
Date: 31/05/2012
Page: 1/45
EUMETSAT Satellite Application Facility on Support to Operational Hydrology and Water Management
Product Validation Report (PVR-14) for product H14 (SM-DAS-2)
Soil Moisture Profile Index in the roots region
by surface wetness scatterometer assimilation method
Reference Number: SAF/HSAF/PVR-14
Issue/Revision Index: 1.1
Last Change: 31 May 2012
About this document This Document has been prepared by the Product Validation Cluster Leader, with the support of the Project Management Team and of the Validation and Development Teams of the Soil Moisture Cluster

Product Validation Report - PVR-14
(Product H14 – SM-DAS-2)
Doc.No: SAF/HSAF/PVR-14
Issue/Revision Index: 1.1
Date: 31/05/2012
Page: 2/45
DOCUMENT CHANGE RECORD
Issue / Revision Date Description
1.0 20/02/2012 Baseline version prepared for ORR1 Part 3.
1.1 31/05/2012
Updated release for CDOP2 ORR1 Part3 Close-out:
Correction of editorial errors (RID12) and adjustments (RID13)
Correction of the reported number of stations (RID14)
Update of the acronym list (RID15)
Correction of references to product requirements (RID 2)

Product Validation Report - PVR-14
(Product H14 – SM-DAS-2)
Doc.No: SAF/HSAF/PVR-14
Issue/Revision Index: 1.1
Date: 31/05/2012
Page: 3/45
Index 1 The EUMETSAT Satellite Application Facilities and H-SAF ........................................................................ 5 2 Introduction to product SM-DAS-2 ........................................................................................................... 7
2.1 Sensing principle ................................................................................................................................ 7 2.2 Algorithm principle ............................................................................................................................ 8 2.3 Main operational characteristics ....................................................................................................... 9
2.3.1 Horizontal resolution and sampling ........................................................................................ 10 2.3.2 Vertical resolution if applicable ............................................................................................... 10 2.3.3 Observing cycle and time sampling ......................................................................................... 10 2.3.4 Timeliness ................................................................................................................................ 11
3 Validation strategy, methods and tools .................................................................................................. 12 3.1 Validation team and work plan ....................................................................................................... 12 3.2 Validation objects and problems ..................................................................................................... 13 3.3 Validation methodology .................................................................................................................. 13
4 Data used for validation activities ........................................................................................................... 15 4.1 Observation (in situ) data ................................................................................................................ 15 4.2 Validation at ECMWF ....................................................................................................................... 15 4.3 SMOSMANIA, SMOSMANIA-E ......................................................................................................... 17 4.4 ISMN soil moisture: REMEDHUS, UDC-SMOS, UMSUOL, PERUGIA, Maws ..................................... 17 4.5 Grand Morin .................................................................................................................................... 18 4.6 CDF-Umbria ..................................................................................................................................... 18 4.7 HOBE network ................................................................................................................................. 18 4.8 Data in Luxembourg ........................................................................................................................ 18 4.9 AMMA .............................................................................................................................................. 19 4.10 OZNET .............................................................................................................................................. 19 4.11 NRS-SCAN ........................................................................................................................................ 19
5 Validation results: case study analysis .................................................................................................... 20 5.1 Introduction ..................................................................................................................................... 20 5.2 Case study analysis in Belgium at IRM............................................................................................. 20
5.2.1 References of this sub-section ................................................................................................ 22 5.3 Validation In Italy at NCR ................................................................................................................. 23
5.3.1 Validation against in situ data ................................................................................................. 23 5.3.2 Validation against modelled data ............................................................................................ 23 5.3.3 References of this subsection .................................................................................................. 25
6 Validation results: long statistic analysis................................................................................................. 26 6.1 Introduction ..................................................................................................................................... 26 6.2 Data comparison method and statistical scores evaluation ........................................................... 26 6.3 Synopsis of validation results and Product requirement compliance ............................................. 28
6.3.1 Comparison of the normalised time series ............................................................................. 28 6.3.2 Comparison of the anomaly time-series ................................................................................. 32
6.4 Some conclusions ............................................................................................................................ 35 6.5 References of this sub-section ........................................................................................................ 35
7 Conclusions ............................................................................................................................................. 37 7.1 Summary conclusions on product validation .................................................................................. 37
Annex 1. Validation methodology for H14/SM-DAS-2 ............................................................................... 39 Annex 2. Acronyms ..................................................................................................................................... 43

Product Validation Report - PVR-14
(Product H14 – SM-DAS-2)
Doc.No: SAF/HSAF/PVR-14
Issue/Revision Index: 1.1
Date: 31/05/2012
Page: 4/45
List of tables Table 1 H-SAF Product List ................................................................................................................................. 6 Table 2 Accuracy requirements for product SM-DAS-2 [RMSD] ..................................................................... 10 Table 3 Validation team for soil moisture products ........................................................................................ 12 Table 4 Presentation of the different soil moisture data sets used in this report .......................................... 17 Table 5 Accuracy requirements for product SM-DAS-2 [RMSD] ..................................................................... 26 Table 6 Comparisons of normalised soil moisture between in situ observations and SM-DAS-2 for 2010. ... 29 Table 7 Statistical scores for the comparison between SM-DAS-2 per seasons ............................................. 31 Table 8 Comparisons of anomaly time-series of soil moisture between in situ observations and SM-DAS-2 for 2010 ........................................................................................................................................................... 33 Table 9 Comparisons of anomaly time-series of soil moisture between in situ observations and SM-DAS-2 for 2010 (per seasons) ..................................................................................................................................... 35
List of figures Figure 1 Conceptual scheme of the EUMETSAT application ground segment .................................................. 5 Figure 2 Current composition of the EUMETSAT SAF network (in order of establishment) ............................. 5 Figure 3 SM-DAS-2 production chain based on ASCAT surface soil moisture data assimilation in the ECMWF Land Data Assimilation System.......................................................................................................................... 7 Figure 4 Hydrology Tiled ECMWF Scheme for Surface Exchanges over Land ................................................... 8 Figure 5 Flow chart of the liquid root zone soil moisture ................................................................................. 9 Figure 6 Structure of the soil moisture products validation team ................................................................. 12 Figure 7 Location of the different in situ soil moisture stations used in this study ........................................ 16 Figure 8 Map of Belgium with the watershed of the Demer at Diest ............................................................. 21 Figure 9 Saturation percentage of the SM-DAS-2 first soil layer (green) and of the SCHEME upper layer (blue) for the Demer (January – December 2010) .......................................................................................... 22 Figure 10 Saturation percentage of the SM-DAS-2 first three layers (green, respectively continuous, mixed and dashed lines), of the SCHEME lower layer (blue), and weighted average of the values of the three first SM-DAS-2 layers (red) ..................................................................................................................................... 22 Figure 11 SM-DAS-2 (blue line) versus in situ soil moisture in Luxembourg (green line) ............................... 23 Figure 12 SM-DAS-2 (blue line) versus modelled soil moisture (green line) for the Valescure catchment .... 24 Figure 13 Comparison between an estimate of the root zone soil moisture over the meter of soil from SM-DAS-2 (rescaled to the model climatology using [i] a simple regression, [ii] a CDF matching) and the second layer of soil of the MISDc-2L model (green line) for the Lower Valescure catchment (top) and the Assino catchment at Serrapartucci (bottom) .............................................................................................................. 25 Figure 14 Illustration of soil moisture products time series used in this reports, red dots are for in situ data, black line for H14 / SM-DAS-2 ......................................................................................................................... 28 Figure 15 Illustration of anomaly time series used in this reports, red dots are for in situ data, black line for H14 / SM-DAS-2. Stations belong to the SMOSMANIA network, in southwestern France. Correlation coefficient is reported; ~0.61 .......................................................................................................................... 32

Product Validation Report - PVR-14
(Product H14 – SM-DAS-2)
Doc.No: SAF/HSAF/PVR-14
Issue/Revision Index: 1.1
Date: 31/05/2012
Page: 5/45
1 The EUMETSAT Satellite Application Facilities and H-SAF
The “EUMETSAT Satellite Application Facility on Support to Operational Hydrology and Water Management (H-SAF)” is part of the distributed application ground segment of the “European Organisation for the Exploitation of Meteorological Satellites (EUMETSAT)”. The application ground segment consists of a “Central Application Facility (CAF)” and a network of eight “Satellite Application Facilities (SAFs)” dedicated to development and operational activities to provide satellite-derived data to support specific user communities. See next figure.
Figure 1 Conceptual scheme of the EUMETSAT application ground segment
Next figure reminds the current composition of the EUMETSAT SAF network (in order of establishment).
Nowcasting & Very
Short Range Forecasting Ocean and Sea Ice Ozone & Atmospheric Chemistry Monitoring Climate Monitoring Numerical Weather
Prediction GRAS Meteorology Land Surface Analysis Operational Hydrology
& Water Management Figure 2 Current composition of the EUMETSAT SAF network (in order of establishment)
The H-SAF was established by the EUMETSAT Council on 3 July 2005; its Development Phase started on 1st September 2005 and ended on 31 August 2010. The SAF is now in its first Continuous Development and Operations Phase (CDOP) which started on 28 September 2010 and will end on 28 February 2012 The list of H-SAF products is shown in the next table.
Acronym Identifier Name
Decentralised processing
and generation of products
EUM Geostationary
Systems
Systems of the EUM/NOAA
Cooperation
Centralised processing
and generation of products
Data Acquisition and Control
Data Processing EUMETSAT HQ
Meteorological Products Extraction
EUMETSAT HQ
Archive & Retrieval Facility (Data Centre)
EUMETSAT HQ
USERS
Application Ground Segment
other data sources
Satellite Application
Facilities (SAFs)

Product Validation Report - PVR-14
(Product H14 – SM-DAS-2)
Doc.No: SAF/HSAF/PVR-14
Issue/Revision Index: 1.1
Date: 31/05/2012
Page: 6/45
Acronym Identifier Name
PR-OBS-1 H-01 Precipitation rate at ground by MW conical scanners (with indication of phase)
PR-OBS-2 H-02 Precipitation rate at ground by MW cross-track scanners (with indication of phase)
PR-OBS-3 H-03 Precipitation rate at ground by GEO/IR supported by LEO/MW
PR-OBS-4 H-04 Precipitation rate at ground by LEO/MW supported by GEO/IR (with flag for phase)
PR-OBS-5 H-05 Accumulated precipitation at ground by blended MW and IR
PR-OBS-6 H-15 Blended SEVIRI Convection area/ LEO MW Convective Precipitation
PR-ASS-1 H-06 Instantaneous and accumulated precipitation at ground computed by a NWP model
SM-OBS-2 H-08 Small-scale surface soil moisture by radar scatterometer
SM-OBS-3 H-16 Large-scale surface soil moisture by radar scatterometer
SM-DAS-2 H-14 Soil Moisture Profile Index in the roots region retrieved by scatterometer assimilation method
SN-OBS-1 H-10 Snow detection (snow mask) by VIS/IR radiometry
SN-OBS-2 H-11 Snow status (dry/wet) by MW radiometry
SN-OBS-3 H-12 Effective snow cover by VIS/IR radiometry
SN-OBS-4 H-13 Snow water equivalent by MW radiometry
Table 1 H-SAF Product List

Product Validation Report - PVR-14
(Product H14 – SM-DAS-2)
Doc.No: SAF/HSAF/PVR-14
Issue/Revision Index: 1.1
Date: 31/05/2012
Page: 7/45
2 Introduction to product SM-DAS-2
2.1 Sensing principle
Product SM-DAS-2 (Liquid root zone soil moisture by scatterometer data assimilation) results from assimilating the SM-OBS-1 product distributed by the EUMETSAT CAF. Product SM-OBS-1 is based on the radar scatterometer ASCAT embarked on MetOp satellites. The instrument scans the scene in a push-broom mode by six side-looking antennas, three left-hand, three right-hand. On each side, the three antennas, looking aside, + 45 degrees and - 45 degrees respectively, provide three views of each earth location under different viewing angles measuring three backscattering coefficients at slightly different time. Each antenna triplet provides a side swath of 550 km. The two swaths leave a gap (close to the sub-satellite track) of ~ 670 km. Global coverage over Europe is achieved in ~ 1.5 days. The basic instrument sampling distance is 12.5 km. The primary ASCAT observation, sea-surface wind, is processed at 50 km resolution. For soil moisture, processing is performed at 50 km (operational) and 25 km (research) resolution. For the purpose of SM-DAS-2, the 25-km resolution SM-OBS-1 product is assimilated in the ECMWF Land Data Assimilation System (LDAS), as shown in Figure 3 :
Figure 3 SM-DAS-2 production chain based on ASCAT surface soil moisture data assimilation in the ECMWF Land
Data Assimilation System

Product Validation Report - PVR-14
(Product H14 – SM-DAS-2)
Doc.No: SAF/HSAF/PVR-14
Issue/Revision Index: 1.1
Date: 31/05/2012
Page: 8/45
Figure 4 Hydrology Tiled ECMWF Scheme for Surface Exchanges over Land
The advanced land surface data assimilation system is in continuous developement at ECMWF to retrieve root zone soil moisture profile index from ASCAT surface soil moisture index (CAF product). The SM-DAS-2 product inherits from the previous volumetric product of the development phase, SM-ASS-1. In contrast to SM-ASS-1, SM-DAS-2 is produced by a specific production chain which is being developed by ECMWF for H-SAF. Its production is based on a Simplified Extended Kalman Filter (EKF). ECMWF generates SM-DAS-2 (Liquid Root zone soil moisture), thereafter ZAMG disseminates the products. In the soil moisture assimilation system, the surface observation from ASCAT is propagated towards the roots region down to 2.89 m below surface, providing estimates for 4 layers (thicknesses 0.07, 0.21, 0.72 and 1.89 m). The ECMWF model generates soil moisture profile information according to the Hydrology Tiled ECMWF Scheme for Surface Exchanges over Land (HTESSEL) (see Figure 4). The assimilation scheme constrains the first guess forecast of soil moisture on any point of the Gaussian grid to be as close as possible to all observations. In the soil moisture assimilation system, the surface observation from ASCAT is propagated towards the roots region down to 2.89 m below surface, providing estimates for 4 layers (thicknesses 0.07, 0.21, 0.72 and 1.89 m). The Land Data Assimilation System generates soil moisture profile information according to the Hydrology Tiled ECMWF Scheme for Surface Exchanges over Land (HTESSEL). SM-DAS-2 is available at a 24-hour time step, with a global daily coverage at 00:00 UTC. SM-DAS-2 is produced in a continuous way in order to ensure the time series consistency of the product (and also to provide values when there is no satellite data, from the model propagation). The SM-DAS-2 product is the first global product of consistent surface and root zone soil moisture available NRT for the NWP, climate and hydrological communities.
2.2 Algorithm principle
The baseline algorithm for SM-DAS-2 processing is described in ATBD-14. Only essential elements are highlighted here.
Product Validation Report - PVR-14
(Product H14 – SM-DAS-2)
Doc.No: SAF/HSAF/PVR-14
Issue/Revision Index: 1.1
Date: 31/05/2012
Page: 9/45
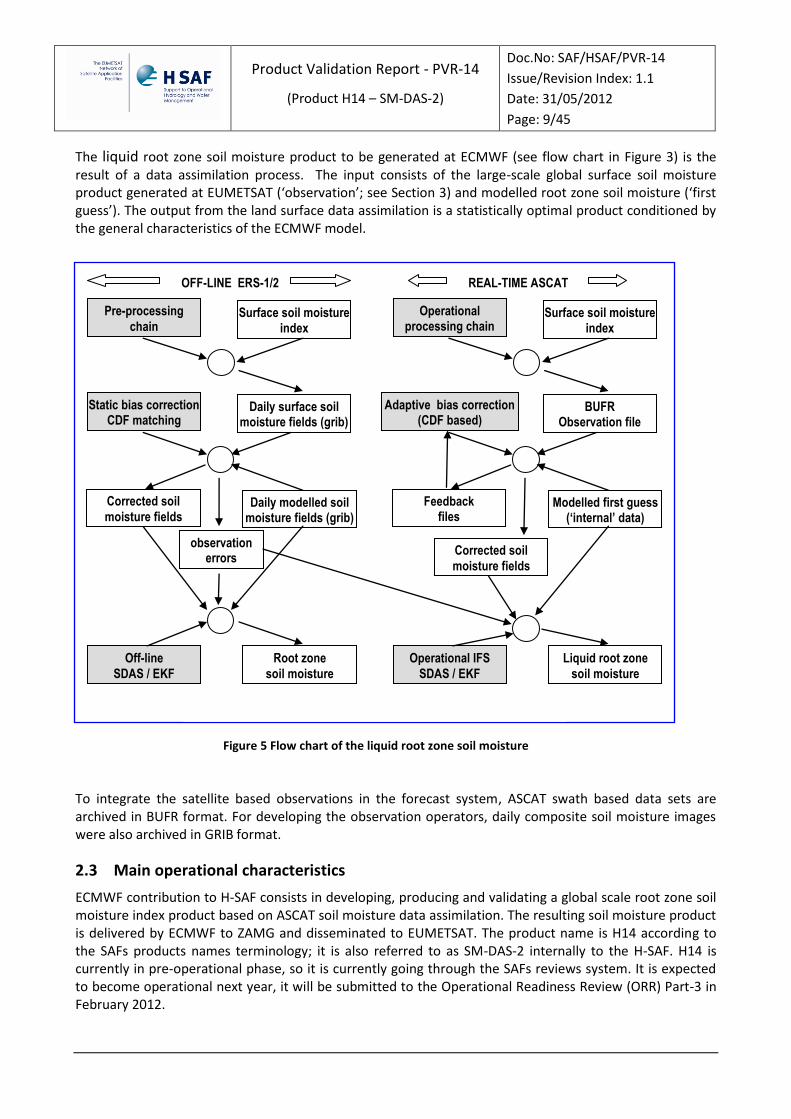
The liquid root zone soil moisture product to be generated at ECMWF (see flow chart in Figure 3) is the result of a data assimilation process. The input consists of the large-scale global surface soil moisture product generated at EUMETSAT (‘observation’; see Section 3) and modelled root zone soil moisture (‘first guess’). The output from the land surface data assimilation is a statistically optimal product conditioned by the general characteristics of the ECMWF model.
To integrate the satellite based observations in the forecast system, ASCAT swath based data sets are archived in BUFR format. For developing the observation operators, daily composite soil moisture images were also archived in GRIB format.
2.3 Main operational characteristics
ECMWF contribution to H-SAF consists in developing, producing and validating a global scale root zone soil moisture index product based on ASCAT soil moisture data assimilation. The resulting soil moisture product is delivered by ECMWF to ZAMG and disseminated to EUMETSAT. The product name is H14 according to the SAFs products names terminology; it is also referred to as SM-DAS-2 internally to the H-SAF. H14 is currently in pre-operational phase, so it is currently going through the SAFs reviews system. It is expected to become operational next year, it will be submitted to the Operational Readiness Review (ORR) Part-3 in February 2012.
OFF-LINE ERS-1/2 REAL-TIME ASCAT
Surface soil moisture index
Daily surface soil moisture fields (grib)
Corrected soil
moisture fields
Root zone
soil moisture
Pre-processing
chain
Static bias correction CDF matching
Off-line
SDAS / EKF
Daily modelled soil moisture fields (grib)
observation errors
Surface soil moisture index
BUFR Observation file
Corrected soil
moisture fields
Liquid root zone
soil moisture
Operational processing chain
chain
Adaptive bias correction (CDF based)
Operational IFS
SDAS / EKF
Modelled first guess (‘internal’ data)
Feedback files
Figure 5 Flow chart of the liquid root zone soil moisture

Product Validation Report - PVR-14
(Product H14 – SM-DAS-2)
Doc.No: SAF/HSAF/PVR-14
Issue/Revision Index: 1.1
Date: 31/05/2012
Page: 10/45
This Chapter collects the results of the validation experiments for product H14 / SM-DAS-2. The Product requirements are recorded in next table:
Unit threshold target optimal
m3 *m -3 0.10 0.06 0.04 Table 2 Accuracy requirements for product SM-DAS-2 [RMSD]
This implies that the main score to be evaluated is the Root Mean Square Difference. Supportive scores are: the Mean Error (or bias, ME), the Standard Deviation (SD) and the Correlation Coefficient (CC). They should be applied to normalised time-series (H14 is an index) as well as to monthly anomalies time series. Cases with significant level of correlations (pvalue < 0.05) are considered only. More information about statistical scores and data preparation can be found in the product validation methodology for H14 / SM-DAS-2 as well as in section 4.2.2
Concerning H14 / SM-DAS-2, we have had two versions of the algorithm:
v1 (December 2010), soil moisture index in the root zone, combine ASCAT and SYNOP data, i.e. air temperature and relative humidity at 2 meters, with the surface analysis code version 36r3 (more information: http://www.ecmwf.int/research/ifsdocs/), produced for January 2009 to August 2010.
v2 (June 2011), liquid soil moisture index in the root zone, with surface analysis code 36r4, with major improvements in the snow analysis, accounting for soil freezing in the soil moisture index computation and with improved soil moisture range in dry areas. Produced for January to December 2010.
While section 4.2. Validation at ECMWF and 4.3 Validation in Belgium are referring to the latest version (v2), section 4.4 Validation at NRC is referring to H14 / SM-DAS-2 v1.
2.3.1 Horizontal resolution and sampling
The horizontal resolution (Δx). The effective resolution is driven by SM-DAS-2 production chain resolution which is ~ 25 km. For land surfaces processes are resolved on a discret grid which determines the effective soil moisture product resolution. The discret grid is a Gaussian reduced grid at T799. Conclusion:
• horizontal resolution: Δx ~ 25 km. The accuracy is completed by temporal correlation against ground measurements which validates the accuracy of the product in terms of temporal variability. SM-DAS-2 is evaluated a-posteriori by means of the validation activity. See section 5 “Examples of SM-DAS-2 product”.
2.3.2 Vertical resolution if applicable
The soil moisture profile is computed for four layers: surface to 7 cm, 7 cm to 28 cm, 28 cm to 100 cm, and 100 cm to 289 cm.
2.3.3 Observing cycle and time sampling
The SM-DAS-2 product is produced daily at 00UTC, based on assimilation of the global CAF surface soil moisture index product (SM-OBS-1) in the ECMWF H-TESSEL Land Surface Model. Although the ASCAT CAF product observing cycle over European latitudes is ~ 36 h, the assimilation process leading to the SM-DAS-2 product has its own time evolution. The product is outputted at 24-hour intervals, thus:

Product Validation Report - PVR-14
(Product H14 – SM-DAS-2)
Doc.No: SAF/HSAF/PVR-14
Issue/Revision Index: 1.1
Date: 31/05/2012
Page: 11/45
• observing cycle: Δt ~ 24 h
2.3.4 Timeliness
For a continuous assimilation process it is difficult to identify the time lag between the observation and the product output. By considering the time needed by the model to “digest” soil moisture observation, the SM-DAS-2 timeliness will be: • timeliness Δ ~ 36 h.

Product Validation Report - PVR-14
(Product H14 – SM-DAS-2)
Doc.No: SAF/HSAF/PVR-14
Issue/Revision Index: 1.1
Date: 31/05/2012
Page: 12/45
3 Validation strategy, methods and tools
3.1 Validation team and work plan
To evaluate the accuracy of the H-SAF Soil Moisture (SM) products a Validation Group has been established by the beginning of the project Validation Phase. The Soil Moisture Product Validation team is composed of experts from the National Meteorological and Hydrological Institutes of Austria, Belgium, Bulgaria, France, Italy, Turkey and ECMWF (Figure 1). Hydrologists, meteorologists, and soil moisture data experts, coming from these countries are involved in the SM product validation activities. SM-DAS-2 has been submitted to validation in several countries following the common validation methodology here described. The obtained results are presented in sections 5 and 6.
Soil Moisture Products Validation Group Coordination:
Italy (DPC)
Austria TU-Wien
Belgium IRM
Bulgaria NIMH-BAS
UK ECMWF
France Météo France
Turkey ITU TSMS
Figure 6 Structure of the soil moisture products validation team
Reference person Institute Country Email address
Silvia Puca Dipartimento Protezione Civile (DPC) Italy [email protected]
Wolfgang Wagner Technische Universität Wien (TU-Wien) Austria [email protected]
Stefan Hasenauer Technische Universität Wien (TU-Wien) Austria [email protected]
Emmanuel Roulin Institut Royal Météorologique (IRM) Belgium [email protected]
Veska Georgieva National Institute of Meteorology and Hydrology (NIMH) Bulgaria [email protected]
Eram Artinyan National Institute of Meteorology and Hydrology (NIMH) Bulgaria [email protected]
Valentin Kazandjiev National Institute of Meteorology and Hydrology (NIMH) Bulgaria [email protected]
Gergana Kozinarova National Institute of Meteorology and Hydrology (NIMH) Bulgaria [email protected]
Patricia de Rosnay European Centre for Medium-Range Weather Forecasts (ECMWF) UK
Clement Albergel European Centre for Medium-Range Weather Forecasts (ECMWF) UK [email protected]
Jean-Christophe Calvet Météo-France France
Mehrez Zribi LATMOS France
Ibrahim Sonmez Turkish State Meteorological Service (TSMS) Turkey [email protected]
Table 3 Validation team for soil moisture products

Product Validation Report - PVR-14
(Product H14 – SM-DAS-2)
Doc.No: SAF/HSAF/PVR-14
Issue/Revision Index: 1.1
Date: 31/05/2012
Page: 13/45
The Soil Moisture products validation programme was started during the development phase of the project and was finalised during the last H-SAF Products and Hydro Validation Workshop hosted by Italian Civil Protection in Rome, 29 of November - 2 of December 2011. Experts of several European Institutes as University of Wien, ECMWF, University of Rome ‘La Sapienza’, ESA- ESRIN, National Research Council, Research Institute for Geo-Hydrological Protection etc. attended the validation workshop and participated in defining the common validation methodology here reported.
3.2 Validation objects and problems
The products validation activity inside the H-SAF project has to serve multiple purposes:
to provide input to the product developers for improving quality of baseline products, and for guidance in the development of more advanced products;
to characterise the product error structure in order to enable the Hydrological validation programme to appropriately use the data;
to provide information on product error to accompany the product distribution in an open environment, after the initial phase of distribution limited to the so-called “beta users”.
Validation is obviously a hard work in the case of soil moisture, both because the sensing principle from space is indirect, and because of the sparseness of in situ measurements.
It is known that an absolute ‘ground truth’ does not exist. In the H-SAF project the validation is based on comparisons of satellite products with reference data sets, which can be in situ data or hydrological model parameters.
3.3 Validation methodology
From the beginning of the project it was clear the importance to define a common validation procedure in order to make the results obtained by several institutes comparable and to better understand their meanings. The main steps of this methodology have been identified during the last H-SAF Products and Hydro Validation Workshop, Rome 29 of November - 2 of December 2011, on the base of validation report provided by ECMWF (Annex 1). In this document the guidelines to validate the SM-DAS-2 product inside the H-SAF are described. The document was shared and agreed by all the SMPVG (Soil Moisture Product Validation Group) members. The common validation methodology is based on in situ data comparisons to produce large statistic and case study analysis. Both components (large statistic and case study analysis) are considered complementary in assessing the accuracy of the implemented algorithms. Large statistics helps in identifying the possible existence of a pathological behaviour, selected case studies are useful in identifying the roots of such behaviour, when present.
Each Institute, in addition to the large statistic verification produces a case study analysis based on the knowledge and experience of the Institute itself. Each institute decides whether to use ancillary data or evaluate specific error analysis. The main steps of the validation procedure are:
in situ and SM-DAS-2 data series consistency check,
comparison between in situ data and the SM-DAS-2,

Product Validation Report - PVR-14
(Product H14 – SM-DAS-2)
Doc.No: SAF/HSAF/PVR-14
Issue/Revision Index: 1.1
Date: 31/05/2012
Page: 14/45
statistical scores evaluation (seasonal analysis),
case study analysis.

Product Validation Report - PVR-14
(Product H14 – SM-DAS-2)
Doc.No: SAF/HSAF/PVR-14
Issue/Revision Index: 1.1
Date: 31/05/2012
Page: 15/45
4 Data used for validation activities
4.1 Observation (in situ) data
The minimum fields that datasets must have to be used in this validation activity are: date and time of the measurement, location, soil moisture value and unit, either gravimetric (e.g. kg³/kg³) or volumetric (e.g. m³/m³), quality information. To perform the validation results here presented for the year 2010, in situ soil moisture from 295 stations was gathered, as follow :
93 within the HSAF area in Europe [23 in France (SMOSMANIA, SMOSMANIA-E networks, Grand Morin), 21 in Spain (REMEDHUS), 9 in Germany (UDC-SMOS network), 7 in Italy (UMSUOL, CDR-Umbria, Perugia), 30 in Denmark (HOBE), 1 in Luxembourg (BIB), 1 in Finland (Maws / FMI) and 1 in Poland (SWEX POLAND)];
38 in Australia (OZNET network);
154 within the United States (NCRS-SCAN network);
10 in Western Africa (AMMA network) are available, also. A detailed description of the in situ data is reported this section.
4.2 Validation at ECMWF
In situ soil moisture data from 295 stations located in: Europe, Africa, Australia and the United States are used to determine the reliability of SM-DAS-2 to represent soil moisture; 93 stations are within the HSAF area. A description of the different soil moisture data set used to validate SM-DAS-2 is here reported. In situ soil moisture observations are needed to evaluate soil moisture products derived from NWP analyses. In this report in situ data from 15 networks across four continents were gathered. Some of them were freely available on the Internet such as data from NCRS-SCAN (Natural Resources Conservation Service - Soil Climate Analysis Network) in the United States (Schaefer and Paetzold 2000, http://www.wcc.nrcs.usda.gov/scan/) or the OZNET hydrological monitoring network in Australia (Young et al., 2008, http://www.oznet.org.au/). The International Soil Moisture Network (ISMN, Dorigo et al., 2011, http://www.ipf.tuwien.ac.at/), a new data hosting centre where globally available ground based soil moisture measurements are collected, harmonized and made available to users, was also used for the validation. Others data sets were obtained by request from the concerned organisations such as Météo-France (SMOSMANIA), LATMOS (Grand Morin), LTHE (AMMA), the Technical University of Denmark (HOBE), NRC (CDR-UMBRIA). The different soil moisture data sets used in this report are presented in Table 2 and presented in Figure 1. The in situ soil moisture data base collected in this report represents a fully independent source of evaluation representing different biome and climate conditions. For the year 2010, in situ soil moisture from 295 stations was gathered, as follow : 93 within the HSAF area in Europe [23 in France (SMOSMANIA, SMOSMANIA-E networks, Grand Morin), 21 in Spain (REMEDHUS), 9 in Germany (UDC-SMOS network), 7 in Italy (UMSUOL, CDR-Umbria, Perugia), 30 in Denmark (HOBE), 1 in Luxembourg (BIB), 1 in Finland (Maws / FMI) and 1 in Poland (SWEX POLAND)], 38 in Australia (OZNET network), 154 within the United States (NCRS-SCAN network) and 10 in Western Africa (AMMA network) are available, also.

Product Validation Report - PVR-14
(Product H14 – SM-DAS-2)
Doc.No: SAF/HSAF/PVR-14
Issue/Revision Index: 1.1
Date: 31/05/2012
Page: 16/45
Figure 7 Location of the different in situ soil moisture stations used in this study
In the figure above 93 locations are shows within the HSAF area in Europe; 23 in France (SMOSMANIA, SMOSMANIA-E networks, Grand Morin), 21 in Spain (REMEDHUS), 9 in Germany (UDC-SMOS network), 7 in Italy (UMSUOL, CDR-Umbria, Perugia), 30 in Denmark (HOBE), 1 in Luxembourg (BIB), 1 in Finland (Maws / FMI) and 1 in Poland (SWEX POLAND). 38 in Australia (OZNET network), 154 within the United States (NCRS-SCAN network) and 10 in Western Africa (AMMA network) are available, also. 13 countries are represented, 8 within the HSAF area. As SM-DAS-2 is a global product, it is of interest to present validation in countries outside of the HSAF area, also.
Soil Moisture data set Type Soil layer
depth (cm) Spatial resolution
Number of stations
H14 / SM-DAS-2 NWP analysis 0-7 ~25 km (T799) Global product
SMOSMANIA (France)
In situ observations 5, 10, 20, 30 Local scale 12 stations
SMOSMANIA-E (France)
In situ observations 5, 10, 20, 30 Local scale 9 stations
Grand Morin (France)
In situ observations 5 Local scale 9 stations
REMEDHUS (Spain)
In situ observations 5 Local scale 21 stations
UMSUOL (Italy)
In situ observations 10 Local scale 1 station
CDF-UMBRIA (Italy)
In situ observations 5 or 10 Local scale 5 stations
PERUGIA (Italy)
In situ observations 5 Local scale 1 station
Product Validation Report - PVR-14
(Product H14 – SM-DAS-2)
Doc.No: SAF/HSAF/PVR-14
Issue/Revision Index: 1.1
Date: 31/05/2012
Page: 17/45
UDC-SMOS (Germany)
In situ observations 5 Local scale 9 stations
HOBE (Denmark)
In situ observations 5-6 Local scale 30 stations
BIB (Luxembourg)
In situ observations 4-7 Local scale 1 station
SWEXPOLAND (Poland)
In situ observations 10 Local scale 1 station
Maws (Finland)
In situ observations 10 Local scale 1 station
OZNET (Australia)
In situ observations 0-5 or 0-8 and 0-30
Local scale 38 stations
NCRS-SCAN (US)
In situ observations ~5, ~20 Local scale 154 stations
AMMA (West Africa)
In situ observations 5 Local scale 10 stations
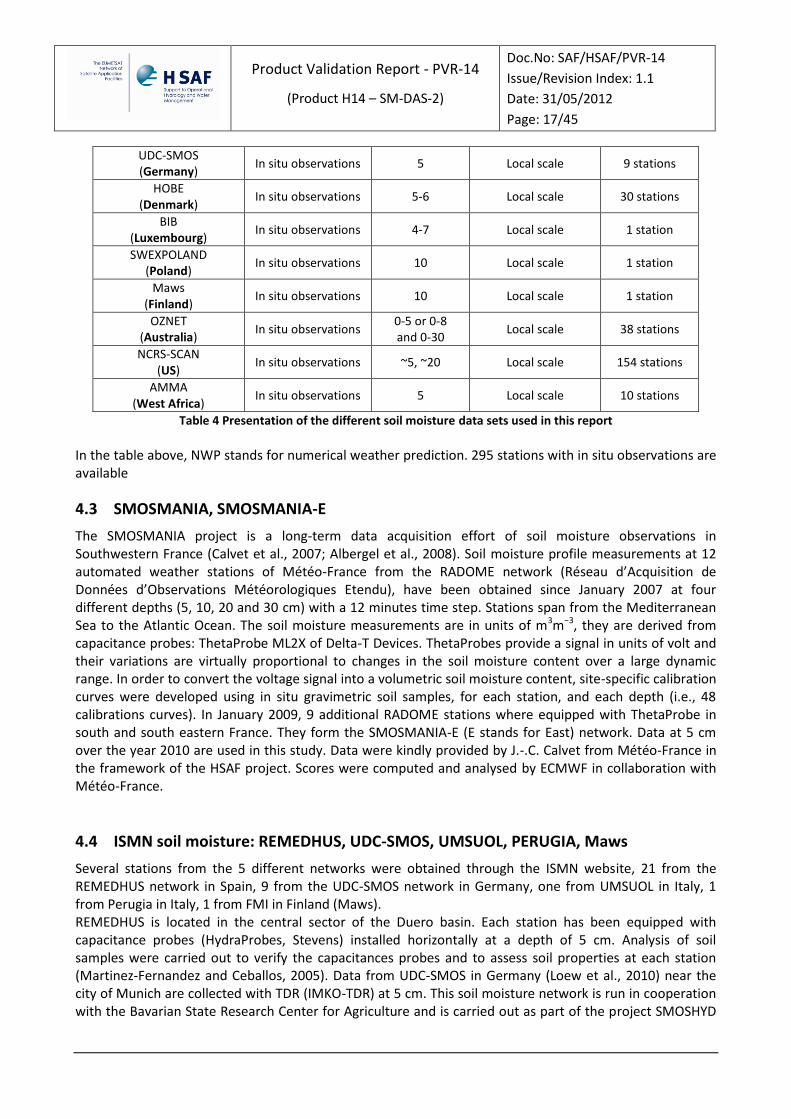
Table 4 Presentation of the different soil moisture data sets used in this report
In the table above, NWP stands for numerical weather prediction. 295 stations with in situ observations are available
4.3 SMOSMANIA, SMOSMANIA-E
The SMOSMANIA project is a long-term data acquisition effort of soil moisture observations in Southwestern France (Calvet et al., 2007; Albergel et al., 2008). Soil moisture profile measurements at 12 automated weather stations of Météo-France from the RADOME network (Réseau d’Acquisition de Données d’Observations Météorologiques Etendu), have been obtained since January 2007 at four different depths (5, 10, 20 and 30 cm) with a 12 minutes time step. Stations span from the Mediterranean Sea to the Atlantic Ocean. The soil moisture measurements are in units of m3m−3, they are derived from capacitance probes: ThetaProbe ML2X of Delta-T Devices. ThetaProbes provide a signal in units of volt and their variations are virtually proportional to changes in the soil moisture content over a large dynamic range. In order to convert the voltage signal into a volumetric soil moisture content, site-specific calibration curves were developed using in situ gravimetric soil samples, for each station, and each depth (i.e., 48 calibrations curves). In January 2009, 9 additional RADOME stations where equipped with ThetaProbe in south and south eastern France. They form the SMOSMANIA-E (E stands for East) network. Data at 5 cm over the year 2010 are used in this study. Data were kindly provided by J.-.C. Calvet from Météo-France in the framework of the HSAF project. Scores were computed and analysed by ECMWF in collaboration with Météo-France.
4.4 ISMN soil moisture: REMEDHUS, UDC-SMOS, UMSUOL, PERUGIA, Maws
Several stations from the 5 different networks were obtained through the ISMN website, 21 from the REMEDHUS network in Spain, 9 from the UDC-SMOS network in Germany, one from UMSUOL in Italy, 1 from Perugia in Italy, 1 from FMI in Finland (Maws). REMEDHUS is located in the central sector of the Duero basin. Each station has been equipped with capacitance probes (HydraProbes, Stevens) installed horizontally at a depth of 5 cm. Analysis of soil samples were carried out to verify the capacitances probes and to assess soil properties at each station (Martinez-Fernandez and Ceballos, 2005). Data from UDC-SMOS in Germany (Loew et al., 2010) near the city of Munich are collected with TDR (IMKO-TDR) at 5 cm. This soil moisture network is run in cooperation with the Bavarian State Research Center for Agriculture and is carried out as part of the project SMOSHYD

Product Validation Report - PVR-14
(Product H14 – SM-DAS-2)
Doc.No: SAF/HSAF/PVR-14
Issue/Revision Index: 1.1
Date: 31/05/2012
Page: 18/45
(FKZ 50EE0731) funded by the German Aerospace Centre (DLR). Finally, the San Pietro Capofiume station (Brocca et al., 2011) belonging to the UMSUOL network located in northern Italy it used. It was installed by the Service of Hydrology, Meteorology and Climate of the regional Agency for Environmental Protection in Emilia-Romagna (ARPA-SIMC, http://www.arpa.emr.it/sim/). Data are collected at 10 cm with TDR (TDR100, Campbell Scientific Inc). The Trzebieszow station from the SWEXPOLAND network in western Poland was used, also, data are collected by the mean of a TDR technology based (EasyTest, D-LOG/mpts) at 10 cm depth. The Perugia station belongs to the HYDROL-NET_PERUGIA network, it is located in an inland region of central Italy and equipped with TDR. Data at 5 cm over the year 2010 are used. The Arctic Research Centre of the Finnish Meteorological Institute (ARC-FMI) monitors soil moisture at Sodankyla. It contains multiple soil moisture measurements at 2 cm and 10 cm with ThetaProbes. Data at 10 cm are used.
4.5 Grand Morin
The hydrological observatory of Grand Morin watershed is monitored since 1963 by the Cemagref research institute. In situ measurements of volumetric soil moisture are available: three automatic TDR (time domain reflectometry) recorders and three ThetaProbe sensors. TDR probes and ThetaProbe sensors were installed at different depths by constructing a trench (16 probes for TDR to the depth of 1m and 2 probes for ThetaProbe at 5 and 20 cm depth) (Paris Anguela et al., 2008). 2 stations with data at 5 cm are used in this report, Chevru (equipped with Theta Probe) and Boissy (equipped with TDR). Data were kindly provided by LATMOS.
4.6 CDF-Umbria
Ground based surface soil moisture measurements, used for this study, were carried out in five sites located in an inland region of central Italy (Umbria region, latitude 42°15'-43°45' N, longitude 11°45'-13°00' E): the Assignano, Cerbara and Petrelle, Mcastello_Vibio and UNIPG sites. Data at 10 cm are used. The area is characterized by a Mediterranean semi-humid climate with average annual precipitation ranging between 900 and 1200 mm (mainly depending on elevation) and mean annual temperature of ~13 °C. Data were kindly provided by L. Brocca from NRC in the framework of his HSAF associated activity (Brocca et al., 2011).
4.7 HOBE network
In the framework of the Hydrological Observatory (HOBE, www.hobe.dk, Jensen and Illangasekare, 2011), a soil moisture and temperature network with 30 stations was installed in fall 2009 in Denmark in the Skjern River Catchment. It is situated in Western Denmark and covers an area of approximately 2500 km2. The climate in the region is temperate-maritime with winter and summer mean temperatures of around 2 and 16 cm, respectively, and an approximate annual precipitation between 800 to 900 mm. A total of 30 Decagon ECH2O data loggers (Decagon Devices, 2002) were installed, each holding three ECH2O 5TE capacitance sensors measuring soil moisture, temperature, and electrical conductivity (Decagon Devices, 2008). The 5TE sensors 20 were considered to be a cost-effective solution for large network applications. They are well-suited for measurements in the near-surface layer and they provide integrated measurements over approximately 5–6 cm when installed horizontally.
4.8 Data in Luxembourg
The experimental Bibeschbach catchment (10.8 km2), BIB, is located in the southern part of the Alzette River basin, Luxembourg. Elevations range between 268 and 350 m a.s.l. with a mean slope of 6.4%. Two rain gauges and one thermometer are operating in the vicinity of the basin which is characterized by a typical humid temperate climate with a mean annual rainfall of about 860 mm. The site is mainly

Product Validation Report - PVR-14
(Product H14 – SM-DAS-2)
Doc.No: SAF/HSAF/PVR-14
Issue/Revision Index: 1.1
Date: 31/05/2012
Page: 19/45
characterized by forest and agriculture (i.e. cropland and pasture) on loamy soils. Since 2005, the basin has been equipped with a set of 40 ECH2O DecagonTM SM sensors over several sites measuring the volumetric
soil water content of the topsoil layer at a depth of 4 to 7 cm.
4.9 AMMA
In the framework of the AMMA (African Monsoon Multidisciplinary Analysis) project dedicated to improve our understanding and our modelling capabilities of the effect of land surface processes on monsoon intensity, variability and predictability (Redelsperger et al., 2006), West Africa has been extensively instrumented. Three meso-scale sites were implemented in Mali (de Rosnay et al., 2009), Niger (Pellarin et al., 2009a) and Benin (Pellarin et al., 2009b), providing information along the North–South gradient between Sahelian and Soudanian regions. Soil moisture and other data are collected at different stations within the three meso-scale sites. The same installation protocol is used for all the soil moisture stations, where Time Domain Reflectometry sensors are used (Campbell CS616). TDR measurements are based on the relationship between the dielectric properties of soils and their moisture content, also. When they were not suitable (e.g. due to soil texture), Delta-T Theta Probes were used. Three stations in Niger, 3 in Benin and 4 stations in Mali are available for this study. Data are collected at 5 cm.
4.10 OZNET
The OZNET network (Young et al., 2008, http://www.oznet.org.au) is located within the Murrumbidgee experimental catchment in southern New South Wales, Australia. Each soil moisture site of the Murrumbidgee monitoring network (38 sites) measures the soil moisture between 0-5 cm with soil dielectric sensor (Stevens Hydraprobe®) or 0-8 cm, 0-30 cm, 30-60 cm and 60-90 cm with water content reflectometers (Campbell Scientific). Hydraprobes are soil dielectric sensor operating at 50 MHz. At each measurement point, a volumetric soil moisture value is inferred from the real component of the measured relative dielectric constant and the conductivity from the imaginary component. Reflectometers measure the travel time of an output pulse to estimate changes in the bulk soil dielectric constant. Measurement is converted to volumetric water content with a calibration equation parameterised with soil type and soil temperature. As the sensor response to soil moisture may vary with soil characteristics such as salinity, density, soil type and temperature, soil moisture sensor calibration was undertaken using both laboratory and field measurements. Reflectometer measurements were compared with both field gravimetric samples and Time-Domain Reflectometry (TDR) measurements. Surface soil moisture observations are used in this report (either 0-5 cm or 0-8 cm).
4.11 NRS-SCAN
The SCAN network (http://www.wcc.nrcs.usda.gov/scan/) is a comprehensive, nationwide soil moisture and climate information system designed to provide data to support natural resource assessments and conservation activities. Administered by the United States Department (USDA) of Agriculture Natural Resources Conservation Service (NRCS) through the National Water and Climate Center (NWCC), in cooperation with the NRCS National Soil Survey Centre, the system focuses on agricultural areas of the U.S. monitoring soil temperature and soil moisture content at several depths, soil water level, air temperature, relative humidity, solar radiation, wind, precipitation, barometric pressure, among others. SCAN data are used for various studies from global climate modelling to agricultural studies. Data are collected by a dielectric constant measuring device, typical measurements at 2 inches (about 5 cm) are used. In this report, all the stations of the NCRS-SCAN network presenting data in 2010 network are used (154 stations).

Product Validation Report - PVR-14
(Product H14 – SM-DAS-2)
Doc.No: SAF/HSAF/PVR-14
Issue/Revision Index: 1.1
Date: 31/05/2012
Page: 20/45
5 Validation results: case study analysis
5.1 Introduction
As reported in previous sections the common validation methodology is composed of large statistic and case study analysis. Both components (large statistic and case study analysis) are considered complementary in assessing the accuracy of the implemented algorithms. The selected case studies are useful in identifying the roots of such behaviour, when present. This Chapter collects the case study analysis performed by SMPVG on SM-DAS-2 for the year 2010. The Chapter is structured by Country / Team, one section each. The analysis has been conducted to provide information to the User of the product on the variability of the performances with climatological and morphological conditions, as well as with seasonal effects. It is highlight that while large statistic analysis (Chapter 6) and the case study performed by Belgium are referring to the latest version (v2) of SM-DAS 2, the case study, here proposed, by NCR is referring to SM-DAS-2 v1.
5.2 Case study analysis in Belgium at IRM
The IRM validation activity relative to the product SM-DAS-2 consists in its comparison with the soil moisture content of the two soil reservoirs in the SCHEME hydrological model. This is therefore a comparison from model to model even if both are using different information and the validation is indirectly achieved with the comparison of the streamflow simulated by the SCHEME hydrological model with the streamflow measured at the corresponding gauge station during the reference period. The SCHEME hydrological model (for SCHEldt and MEuse) is a semi-distributed version of the conceptual model developed by Bultot and Dupriez (1976a,b). Evapotranspiration is estimated by depleting the content of conceptual reservoirs for water intercepted by vegetation and for two soil layers, in comparison with a potential value given by a Penmann formulation. As this model is aimed at simulating the hydrograph, the saturation threshold of the upper layer of the soil is optimized for the surface runoff during rainy periods in a calibration dataset whereas the saturation threshold of the zone of aeration is obtained by comparing the cumulated evapotranspiration and the deficit of flow over the reference period. The latter parameter is a function of the cover (seven vegetated covers are defined) and of the month. In the
SCHEME model, the same design is applied within each cell of 7 km 7 km. The saturation threshold of the upper layer – like another tenth of model parameters – is optimized on a set of gauged sub-catchments and the values are afterwards regionalized over the entire Meuse and Scheldt basins using empirical relationships with geographical indices. The soil moisture of the upper layer has been shown to compare well with gravimetric data from a field survey (Roulin, 2002).

Product Validation Report - PVR-14
(Product H14 – SM-DAS-2)
Doc.No: SAF/HSAF/PVR-14
Issue/Revision Index: 1.1
Date: 31/05/2012
Page: 21/45
Figure 8 Map of Belgium with the watershed of the Demer at Diest
In the figure above it is shown a grid of the SCHEME hydrological over the Scheldt basin (upstream Antwerp, in blue), and 10 grid cells of SM-DAS-2 intersecting with the Demer catchment (in green). In this report, the SM-DAS-2 product is compared with the water content of the two soil layers. These preliminary results have been obtained for the Demer catchment in the Scheldt basin (Fig. 4). The Demer catchment is considered at the gauged station at Diest (1775 km2). It is characterized by a fairly flat topography, loamy soils in the upstream part and humid sandy-loamy soils more downstream, and it is mainly covered with crops and pasture. The spatial resolution of SM-DAS-2 and SCHEME differ both in area and with depth. For this reason, the SM-DAS-2 values have been averaged over three grid cells that have an intersection greater than 50% with the catchment. The SCHEME data have been averaged over the vegetation covers and over the catchment. The upper layer of SCHEME has been compared with the first layer of SM-DAS-2. Soil moisture has been expressed in saturation percentage. For SCHEME, the water depth of the conceptual reservoir has been divided with the saturation threshold. For SM-DAS-2, soil moisture index, S, has been further rescaled according to:
where i refers to the considered layer and j is the day. The lower layer of SCHEME corresponds to a zone comprising a fraction of the first layer of SM-DAS-2, the second layer and a fraction of the third layer. Therefore, it has been averaged over the three layers using weights defined on the base of the estimated capacity of these three layers and the capacity of the two SCHEME soil reservoirs. Since the capacity of the reservoir corresponding to the aeration zone varies with the month, so do the weights.
The results are shown on next two figures as time-series of the percentage of saturation. The upper soil layer of the hydrological model reaches saturation at several occasions (particularly during winter) whereas SM-DAS-2 does not. The capacity of the upper layer of the SCHEME model is ~10 mm over the Demer catchment whereas the capacity of the first layer of SM-DAS-2 is estimated ~18 mm. Most of the events are detected in both series. The time evolution of the saturation of the lower layer of the SCHEME model and the weighted average of the saturation over the SM-DAS-2 soil profile are similar despite the different modelling approaches and the various approximations involved in the comparison. A squared correlation

Product Validation Report - PVR-14
(Product H14 – SM-DAS-2)
Doc.No: SAF/HSAF/PVR-14
Issue/Revision Index: 1.1
Date: 31/05/2012
Page: 22/45
coefficient of 0.552 (CC ~0.74) is obtained between the first layer of SM-DAS-2 and the upper layer of the SCHEME model. A squared correlation coefficient of 0.755 (CC ~0.87) is found between the lower layer of the SCHEME model and a weighted average of the values of the three first SM-DAS-2 layers.
Figure 9 Saturation percentage of the SM-DAS-2 first soil layer (green) and of the SCHEME upper layer (blue) for the
Demer (January – December 2010)
Figure 10 Saturation percentage of the SM-DAS-2 first three layers (green, respectively continuous, mixed and
dashed lines), of the SCHEME lower layer (blue), and weighted average of the values of the three first SM-DAS-2 layers (red)
In the figure above the scores are computed between the blue and red curves (January – December 2010). The streamflow was simulated using the SCHEME model for the Demer at Diest during 2010 and it compared with the measured streamflow with a CC of 0.86 and an efficiency coefficient (Nash coefficient) of 0.66. It must be noted that the SCHEME model doesn’t take management actions into account and that during 2010, these actions reflect on the hydrograms, in particular for the high flow event of mid-November (see the steep rise of soil moisture). The hydrograms may be found in the reports of the “hydro-validation” program of the same project.
5.2.1 References of this sub-section
Bultot, F. & G.L. Dupriez (1976a). Conceptual hydrological model for an average-sized catchment area, I. Concepts and relationships. J. Hydrol., 29, 251-272. Bultot, F. & G.L. Dupriez (1976b). Conceptual hydrological model for an average-sized catchment area, II. Estimate of parameters, validity of model, applications. J. Hydrol., 29, 273-292. Roulin, E. (2002). Statistical correction applied to a water-balance model for the Meuse. In E.E. van Loon, and P.A. Troch (eds.), Final Report of the DAUFIN project. Wageningen University, The Netherlands, pp 113-129.
Product Validation Report - PVR-14
(Product H14 – SM-DAS-2)
Doc.No: SAF/HSAF/PVR-14
Issue/Revision Index: 1.1
Date: 31/05/2012
Page: 23/45
5.3 Validation In Italy at NCR
Results reported here were performed by Luca Brocca from NRC (National Research Council, Research Institute for Geo-Hydrological Protection) in the context if its H-SAF as visiting scientist. The first version of SM-DAS-2 was used in this subsection. L. Brocca also participated to this report by providing soil moisture data in central Italy . Different studies were performed by Luca Brocca, validation against in situ soil moisture data (mainly in Europe) as well as against modelled soil moisture data in Italy. Preliminary case study where SM-DAS-2 is assimilated in a hydrological model (MISDc) for flood forecasting is undergoing, also.
5.3.1 Validation against in situ data
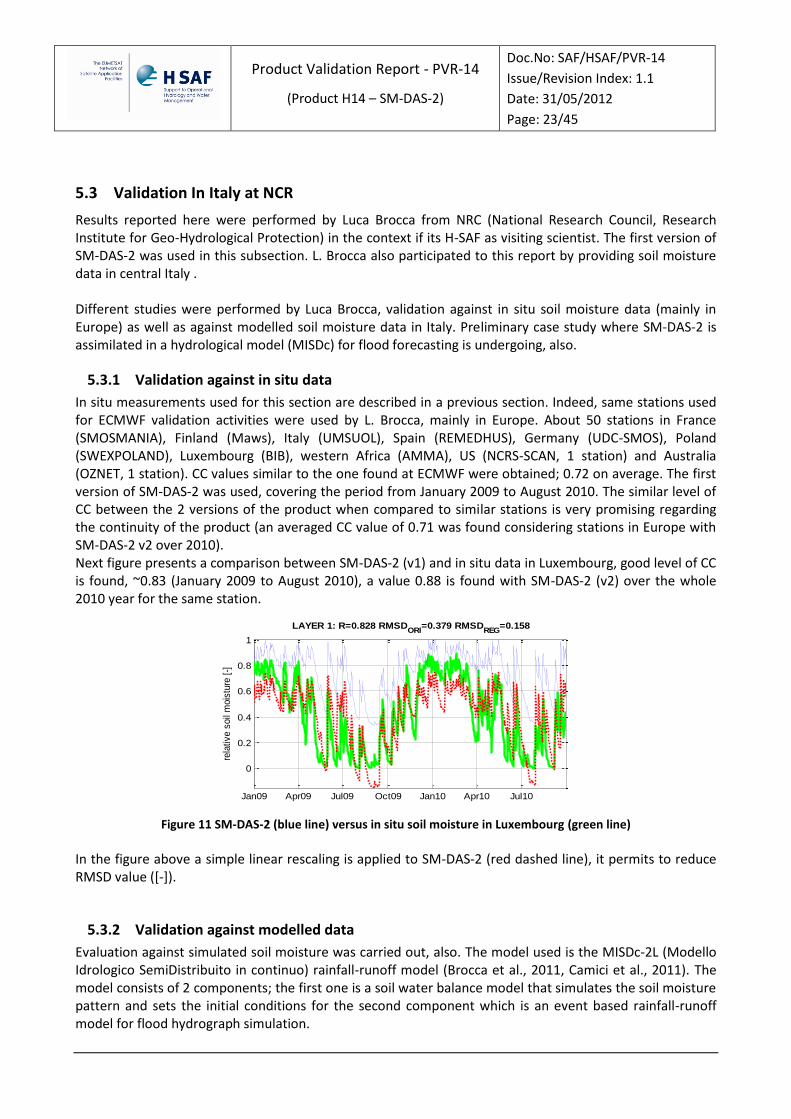
In situ measurements used for this section are described in a previous section. Indeed, same stations used for ECMWF validation activities were used by L. Brocca, mainly in Europe. About 50 stations in France (SMOSMANIA), Finland (Maws), Italy (UMSUOL), Spain (REMEDHUS), Germany (UDC-SMOS), Poland (SWEXPOLAND), Luxembourg (BIB), western Africa (AMMA), US (NCRS-SCAN, 1 station) and Australia (OZNET, 1 station). CC values similar to the one found at ECMWF were obtained; 0.72 on average. The first version of SM-DAS-2 was used, covering the period from January 2009 to August 2010. The similar level of CC between the 2 versions of the product when compared to similar stations is very promising regarding the continuity of the product (an averaged CC value of 0.71 was found considering stations in Europe with SM-DAS-2 v2 over 2010). Next figure presents a comparison between SM-DAS-2 (v1) and in situ data in Luxembourg, good level of CC is found, ~0.83 (January 2009 to August 2010), a value 0.88 is found with SM-DAS-2 (v2) over the whole 2010 year for the same station.
Jan09 Apr09 Jul09 Oct09 Jan10 Apr10 Jul10
0
0.2
0.4
0.6
0.8
1
LAYER 1: R=0.828 RMSDORI
=0.379 RMSDREG
=0.158
rela
tive s
oil
mois
ture
[-]
Jan09 Apr09 Jul09 Oct09 Jan10 Apr10 Jul10
0
0.2
0.4
0.6
0.8
LAYER 2: R=0.801 RMSDORI
=0.385 RMSDREG
=0.169re
lative s
oil
mois
ture
[-]
Jan09 Apr09 Jul09 Oct09 Jan10 Apr10 Jul10
0.2
0.4
0.6
0.8
LAYER 3: R=0.638 RMSDORI
=0.391 RMSDREG
=0.218
rela
tive s
oil
mois
ture
[-]
Jan09 Apr09 Jul09 Oct09 Jan10 Apr10 Jul10
0.2
0.4
0.6
0.8
LAYER 4: R=-0.062 RMSDORI
=0.498 RMSDREG
=0.282
rela
tive s
oil
mois
ture
[-]
GROUND DATA
SM-DAS-2
SM-DAS-2-REG
Figure 11 SM-DAS-2 (blue line) versus in situ soil moisture in Luxembourg (green line)
In the figure above a simple linear rescaling is applied to SM-DAS-2 (red dashed line), it permits to reduce RMSD value ([-]).
5.3.2 Validation against modelled data
Evaluation against simulated soil moisture was carried out, also. The model used is the MISDc-2L (Modello Idrologico SemiDistribuito in continuo) rainfall-runoff model (Brocca et al., 2011, Camici et al., 2011). The model consists of 2 components; the first one is a soil water balance model that simulates the soil moisture pattern and sets the initial conditions for the second component which is an event based rainfall-runoff model for flood hydrograph simulation.

Product Validation Report - PVR-14
(Product H14 – SM-DAS-2)
Doc.No: SAF/HSAF/PVR-14
Issue/Revision Index: 1.1
Date: 31/05/2012
Page: 24/45
The first layer of soil of SM-DAS-2 was compared to simulated surface soil moisture of the MISDc-2L, result of the comparison is presented on next figure for the Valescure catchment (LAT= 43.79N, LON= 4.35E). Good level of CC is found between SM-DAS-2 and the modelled surface soil moisture of the MISDc-2L model; ~0.82. If RMSD (unitless) is high, a simple linear regression permits to reduce its value.
Jan09 Apr09 Jul09 Oct09 Jan10 Apr10
0
0.2
0.4
0.6
0.8
LAYER 1: R=0.819 RMSDORI
=0.337 RMSDREG
=0.149
rela
tive s
oil m
ois
ture
[-]
Jan09 Apr09 Jul09 Oct09 Jan10 Apr10
0
0.2
0.4
0.6
0.8
LAYER 2: R=0.937 RMSDORI
=0.313 RMSDREG
=0.090
rela
tive s
oil m
ois
ture
[-]
Jan09 Apr09 Jul09 Oct09 Jan10 Apr10
0.2
0.4
0.6
0.8
LAYER 3: R=0.809 RMSDORI
=0.298 RMSDREG
=0.152
rela
tive s
oil m
ois
ture
[-]
Jan09 Apr09 Jul09 Oct09 Jan10 Apr10
0.2
0.4
0.6
0.8
LAYER 4: R=0.155 RMSDORI
=0.344 RMSDREG
=0.256
rela
tive s
oil m
ois
ture
[-]
GROUND DATA
SM-DAS-2
SM-DAS-2-REG
Figure 12 SM-DAS-2 (blue line) versus modelled soil moisture (green line) for the Valescure catchment
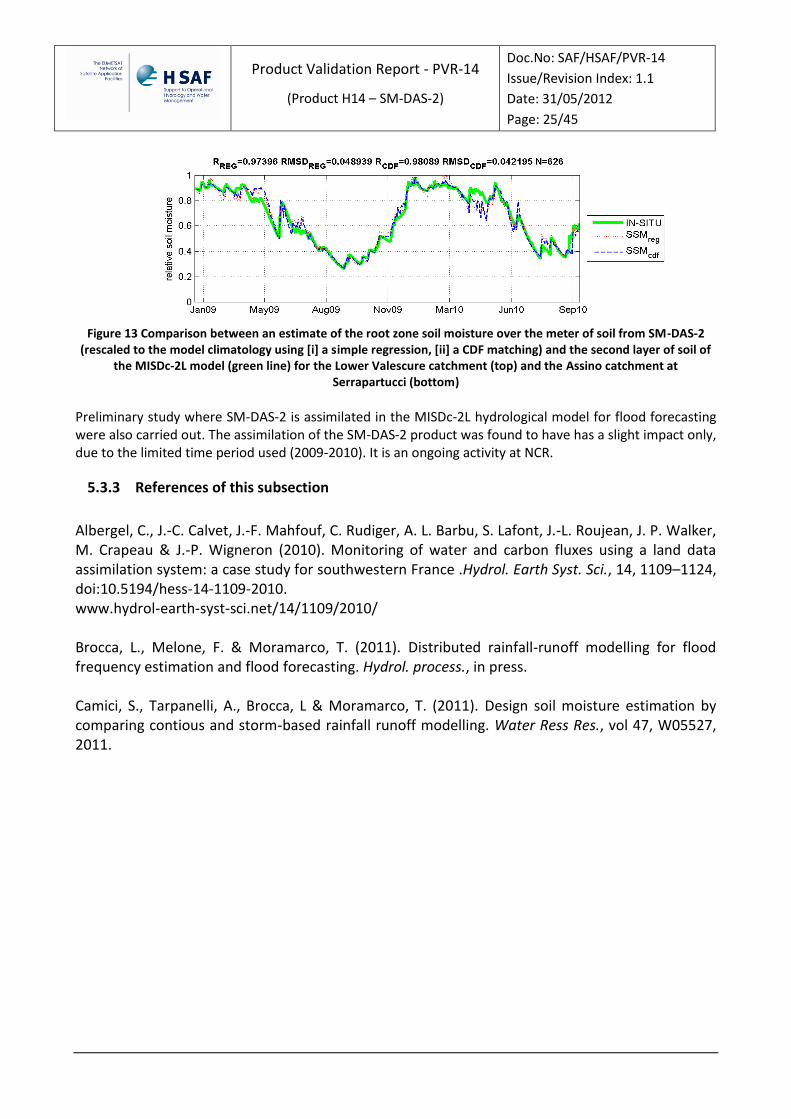
In the figure above a simple linear rescaling is applied to SM-DAS-2 (red dashed line), it permits to reduce RMSD value ([-]). An estimate of the root zone soil moisture using the three first layer of soil of the analysis is evaluated also. This estimate was obtained using weighted average of the first three layers of SM-DAS-2 (0-7 cm, 7-28 cm and 28-100 cm). The resulting root zone soil moisture was compared to the lower layer of soil of the MISDc-2L model, results for two catchments are presented by Figure 9 for the Lower Valescure catchment (top) and the Assino catchment at Serrapartucci (bottom). SM-DAS-2 was rescaled to the model climatology using two different technics, a simple regression equation and a cumulative distribution function (CDF) matching. For the latter, the two soil moisture data sets (observed and modelled) are ranked and the differences between the corresponding elements of the two ranked data sets are computed (Albergel et al., 2010b). Then a polynomial fit (of third order) is used to remove the systematic differences between the two data sets. The rationnal for this rescaling is that this work is the first step before assimilation of SM-DAS-2 into the MISDc-2L; data assimilation techniques are based on the used of unbiased data, they aims to correct random errors in the model. Results are very good with CC values above 0.95, scores after rescaling of SM-DAS-2 product are reported on next figure.
Product Validation Report - PVR-14
(Product H14 – SM-DAS-2)
Doc.No: SAF/HSAF/PVR-14
Issue/Revision Index: 1.1
Date: 31/05/2012
Page: 25/45
Figure 13 Comparison between an estimate of the root zone soil moisture over the meter of soil from SM-DAS-2
(rescaled to the model climatology using [i] a simple regression, [ii] a CDF matching) and the second layer of soil of the MISDc-2L model (green line) for the Lower Valescure catchment (top) and the Assino catchment at
Serrapartucci (bottom)
Preliminary study where SM-DAS-2 is assimilated in the MISDc-2L hydrological model for flood forecasting were also carried out. The assimilation of the SM-DAS-2 product was found to have has a slight impact only, due to the limited time period used (2009-2010). It is an ongoing activity at NCR.
5.3.3 References of this subsection
Albergel, C., J.-C. Calvet, J.-F. Mahfouf, C. Rudiger, A. L. Barbu, S. Lafont, J.-L. Roujean, J. P. Walker, M. Crapeau & J.-P. Wigneron (2010). Monitoring of water and carbon fluxes using a land data assimilation system: a case study for southwestern France .Hydrol. Earth Syst. Sci., 14, 1109–1124, doi:10.5194/hess-14-1109-2010. www.hydrol-earth-syst-sci.net/14/1109/2010/ Brocca, L., Melone, F. & Moramarco, T. (2011). Distributed rainfall-runoff modelling for flood frequency estimation and flood forecasting. Hydrol. process., in press. Camici, S., Tarpanelli, A., Brocca, L & Moramarco, T. (2011). Design soil moisture estimation by comparing contious and storm-based rainfall runoff modelling. Water Ress Res., vol 47, W05527, 2011.

Product Validation Report - PVR-14
(Product H14 – SM-DAS-2)
Doc.No: SAF/HSAF/PVR-14
Issue/Revision Index: 1.1
Date: 31/05/2012
Page: 26/45
6 Validation results: long statistic analysis
6.1 Introduction
In this Chapter the validation results of the SM-DAS-2 long statistic analysis are reported for the period (1.1.2010 – 31.12.2010). The validation has been performed on the product release currently in force at the time of writing (v2).
The analysis here presented has been provided by ECMWF following the common validation methodology described in Section 3.
For product SM-DAS-2 the Product requirements are recorded in next table.
Unit threshold target optimal m3 ٠m -3 0.10 0.06 0.04
Table 5 Accuracy requirements for product SM-DAS-2 [RMSD]
This implies that the main score to be evaluated is the Root Mean Square Difference. Supportive scores are: the Mean Error (or bias, ME), the Standard Deviation (SD) and the Correlation Coefficient (CC). They have been evaluated to normalised time-series (H14 is an index) as well as to monthly anomalies time series. Cases with significant level of correlations (pvalue < 0.05) are considered only. It is important to remind that SM-DAS-2 provides an index between 0 and 1, while in situ measurements of soil moisture are expressed in m3m-3. To enable a fair comparison, it has been then necessary to rescale the data as described in chapter 3. It has been also assumed that SM-DAS-2 data set do not have such outliers problem and has been rescaled using the maximum and the minimum values of each individual times series considering the whole 2010 period.
6.2 Data comparison method and statistical scores evaluation
SM-DAS-2 is an index between 0 and 1 while in situ measurements of soil moisture are most often that not in m3m-3. To enable a fair comparison, it is then necessary to rescale the data. The 90% confidence interval is chosen to define the upper and lower values to exclude any abnormal outliers due to instrument noise using the following equations (Albergel et al., 2010):
Where Int+ and int- are the upper and lower 90% limits of the confidence interval. Then a new in situ soil moisture data set is obtained using:
It is assumed that H14/SM-DAS-2 data set do not have such outliers problem and is rescaled using the maximum and the minimum values of each individual times series considering the whole 2010 period.

Product Validation Report - PVR-14
(Product H14 – SM-DAS-2)
Doc.No: SAF/HSAF/PVR-14
Issue/Revision Index: 1.1
Date: 31/05/2012
Page: 27/45
The comparison between the observation data and the H14/SM-DAS-2 product are performed, gaining the following statistical scores:
Mean Error (ME) or Bias
Standard Deviation (SD)
Correlation Coefficient (CC)
With and
Root Mean Square Difference (RMSD) considered as ‘true’ soil moisture. This is underlined here by using the RMS Difference terminology instead of RMS Error.
p-value, a measure of the correlation significance is calculated as well. It indicates the significance of the test, the 95% confidence interval is used; configurations where the p-value is below 0.05 (i.e. the correlation is not a coincidence) is retained.
SM stands for Soil Moisture. The RMSD represents the relative error of the soil moisture dynamical range, as SM-DAS-2 is an index, it has no units. Hence it is possible to obtain an estimate of the error of the liquid root zone soil moisture retrieval in m3m−3 by multiplication between the RMSD and the observed dynamical range (obs_max-min_max). Additionally, in order to avoid seasonal effects, correlations (CC) of the monthly anomaly time-series (Albergel et al., 2009, 2011) are calculated. The difference to the mean are calculated for a sliding window of five weeks (if there are at least five measurements in this period), and the difference are scaled to the standard deviation. For each SM estimate at day (i), a period F is defined, with F=[i-17, i+17] (corresponding to a 5-week window). If at least five measurements are available in this period of time, the average SM value and the standard deviation are calculated. The Anomaly (Ano), dimensionless is evaluated as follow:
Product Validation Report - PVR-14
(Product H14 – SM-DAS-2)
Doc.No: SAF/HSAF/PVR-14
Issue/Revision Index: 1.1
Date: 31/05/2012
Page: 28/45
Soil moisture can be measured along with soil temperature. In this case a threshold of +3° degrees is considered and soil moisture measurements below this threshold are rejected. Statistical scores are computed for the whole period (e.g. 2010) as well as for seasons defined as follow:
December-January-February, March-April-May, June-July-August, September-October-November.
Most often than not, soil moisture is measured along with soil temperature. If available a threshold of +3° degrees should be considered and soil moisture measurements below this threshold should be rejected.
6.3 Synopsis of validation results and Product requirement compliance
6.3.1 Comparison of the normalised time series
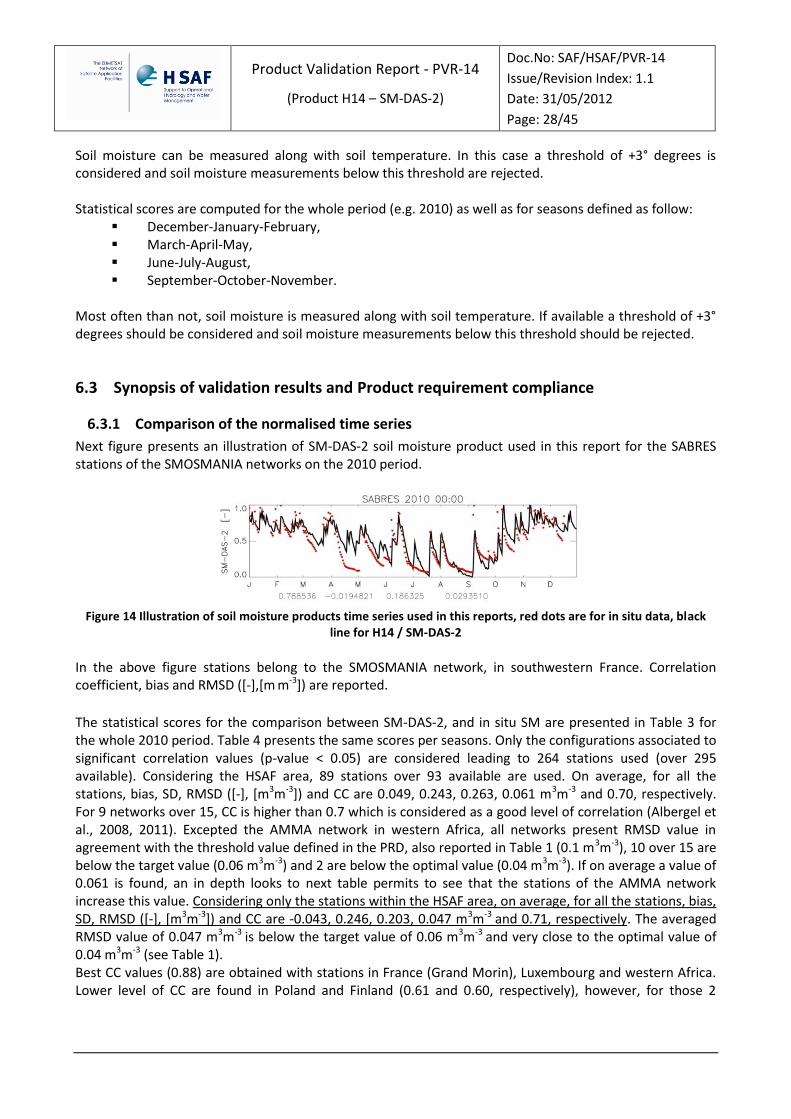
Next figure presents an illustration of SM-DAS-2 soil moisture product used in this report for the SABRES stations of the SMOSMANIA networks on the 2010 period.
Figure 14 Illustration of soil moisture products time series used in this reports, red dots are for in situ data, black
line for H14 / SM-DAS-2 In the above figure stations belong to the SMOSMANIA network, in southwestern France. Correlation coefficient, bias and RMSD ([-],[m m-3]) are reported.
The statistical scores for the comparison between SM-DAS-2, and in situ SM are presented in Table 3 for the whole 2010 period. Table 4 presents the same scores per seasons. Only the configurations associated to significant correlation values (p-value < 0.05) are considered leading to 264 stations used (over 295 available). Considering the HSAF area, 89 stations over 93 available are used. On average, for all the stations, bias, SD, RMSD ([-], [m3m-3]) and CC are 0.049, 0.243, 0.263, 0.061 m3m-3 and 0.70, respectively. For 9 networks over 15, CC is higher than 0.7 which is considered as a good level of correlation (Albergel et al., 2008, 2011). Excepted the AMMA network in western Africa, all networks present RMSD value in agreement with the threshold value defined in the PRD, also reported in Table 1 (0.1 m3m-3), 10 over 15 are below the target value (0.06 m3m-3) and 2 are below the optimal value (0.04 m3m-3). If on average a value of 0.061 is found, an in depth looks to next table permits to see that the stations of the AMMA network increase this value. Considering only the stations within the HSAF area, on average, for all the stations, bias, SD, RMSD ([-], [m3m-3]) and CC are -0.043, 0.246, 0.203, 0.047 m3m-3 and 0.71, respectively. The averaged RMSD value of 0.047 m3m-3 is below the target value of 0.06 m3m-3 and very close to the optimal value of 0.04 m3m-3 (see Table 1). Best CC values (0.88) are obtained with stations in France (Grand Morin), Luxembourg and western Africa. Lower level of CC are found in Poland and Finland (0.61 and 0.60, respectively), however, for those 2

Product Validation Report - PVR-14
(Product H14 – SM-DAS-2)
Doc.No: SAF/HSAF/PVR-14
Issue/Revision Index: 1.1
Date: 31/05/2012
Page: 29/45
stations, winter and late summer data are filtered due to temperature below +3°. On average, biases of -0.043 (in situ minus SM products, dimensionless) are observed for Europe.
Country Region
(Network*) Product acronym
Period Bias (-) Standard deviation
(-)
RMSD (-)/[m
3m
-3]
CC
France SMOSMANIA (12 stations)
H14 2010 -0.060 0.259 0.210 / 0.056 0.79
France SMOSMANIA-E
(9 stations) H14 2010 -0.093 0.295 0.232 / 0.071 0.76
France Grand Morin (2 stations)
H14 2010 -0.130 0.235 0.197 /0.053 0.88
Spain REMEDHUS (18
stations) H14 2010 0.021 0.313 0.218 / 0.048 0.74
Italy UMSUOL
(1 station) H14 2010 -0.150 0.233 0.247 / 0.046 0.76
Italy PERUGIA
(1 station) H14 2010 -0.154 0.257 0.229 / 0.048 0.83
Italy Central Italy (5 stations)
H14 2010 -0.179 0. 210 0.266 / 0.067 0.77
Germany UDC SMOS (9 stations)
H14 2010 -0.095 0.167 0.275 / 0.053 0.55
Denmark HOBE
(29 stations) H14 2010 -0.005 0.217 0.225 / 0.030 0.67
Finland Maws
(1 station) H14 2010 0.038 0.153 0.249 / 0.026 0.60
Poland SWEX-Poland
(1 station) H14 2010 -0.026 0.187 0.240 / 0.076 0.61
Luxembourg BIB
(1 station) H14 2010 -0.187 0.210 0.242 / 0.037 0.88
Australia OZNET
(36 stations) H14 2010 0.108 0.252 0.215 / 0.052 0.83
USA NCRS-SCAN
(137 stations) H14 2010 0.103 0.236 0.292 / 0.069 0.67
Western Africa
AMMA (5 stations)
H14 2010 -0.368 0.362 0.481 / 0.340 0.88
EUROPE 89 H14 2010 -0.043 0.246 0.230 / 0.047 0.71
ALL 264 H14 2010 0.049 0.243 0.263 / 0.061 0.70
Table 6 Comparisons of normalised soil moisture between in situ observations and SM-DAS-2 for 2010.
In the table above mean bias (in situ minus products), correlation, standard deviation and root mean square difference (RMSD, [-] and [m3m-3]) are given for each network and for each product. Scores are presented for significant correlations with p-values < 0.05 * Cases with pvalue <0.05 are considered, only.
Product Validation Report - PVR-14
(Product H14 – SM-DAS-2)
Doc.No: SAF/HSAF/PVR-14
Issue/Revision Index: 1.1
Date: 31/05/2012
Page: 30/45
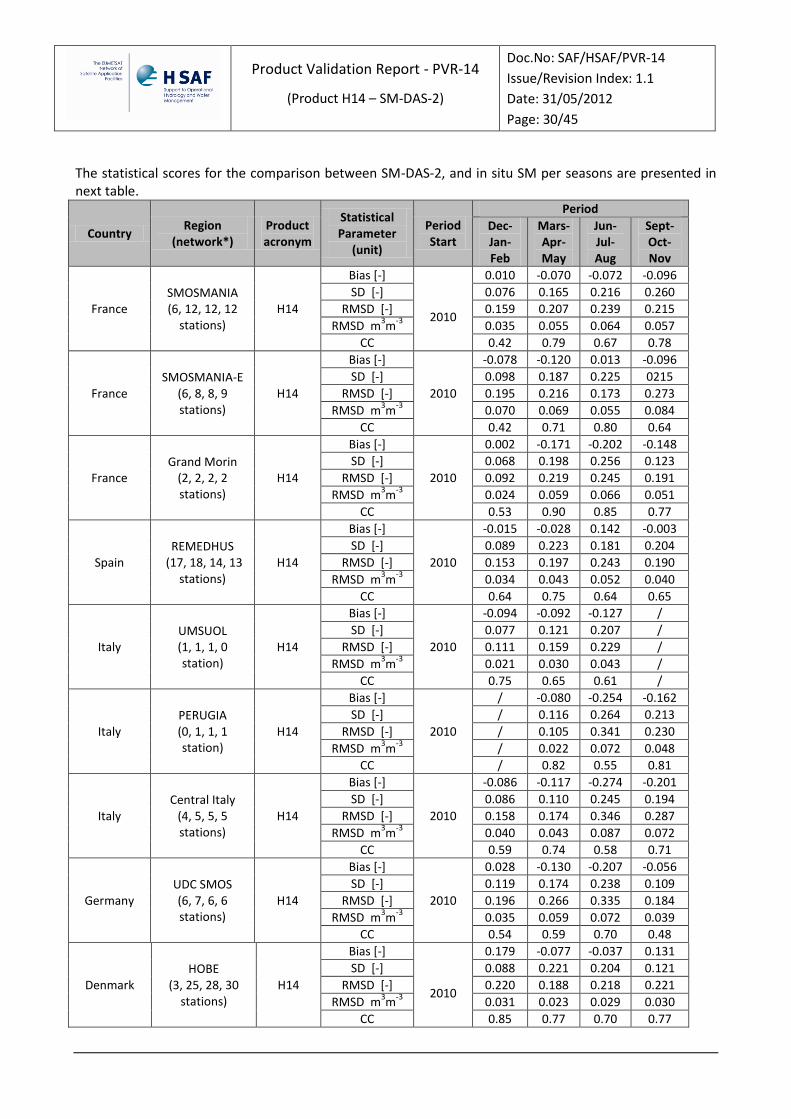
The statistical scores for the comparison between SM-DAS-2, and in situ SM per seasons are presented in next table.
Country Region
(network*) Product acronym
Statistical Parameter
(unit)
Period Start
Period
Dec-Jan-Feb
Mars-Apr-May
Jun-Jul-Aug
Sept-Oct-Nov
France SMOSMANIA (6, 12, 12, 12
stations) H14
Bias [-]
2010
0.010 -0.070 -0.072 -0.096
SD [-] 0.076 0.165 0.216 0.260
RMSD [-] 0.159 0.207 0.239 0.215
RMSD m3m
-3 0.035 0.055 0.064 0.057
CC 0.42 0.79 0.67 0.78
France SMOSMANIA-E
(6, 8, 8, 9 stations)
H14
Bias [-]
2010
-0.078 -0.120 0.013 -0.096
SD [-] 0.098 0.187 0.225 0215
RMSD [-] 0.195 0.216 0.173 0.273
RMSD m3m
-3 0.070 0.069 0.055 0.084
CC 0.42 0.71 0.80 0.64
France Grand Morin
(2, 2, 2, 2 stations)
H14
Bias [-]
2010
0.002 -0.171 -0.202 -0.148
SD [-] 0.068 0.198 0.256 0.123
RMSD [-] 0.092 0.219 0.245 0.191
RMSD m3m
-3 0.024 0.059 0.066 0.051
CC 0.53 0.90 0.85 0.77
Spain REMEDHUS
(17, 18, 14, 13 stations)
H14
Bias [-]
2010
-0.015 -0.028 0.142 -0.003
SD [-] 0.089 0.223 0.181 0.204
RMSD [-] 0.153 0.197 0.243 0.190
RMSD m3m
-3 0.034 0.043 0.052 0.040
CC 0.64 0.75 0.64 0.65
Italy UMSUOL (1, 1, 1, 0 station)
H14
Bias [-]
2010
-0.094 -0.092 -0.127 /
SD [-] 0.077 0.121 0.207 /
RMSD [-] 0.111 0.159 0.229 /
RMSD m3m
-3 0.021 0.030 0.043 /
CC 0.75 0.65 0.61 /
Italy PERUGIA (0, 1, 1, 1 station)
H14
Bias [-]
2010
/ -0.080 -0.254 -0.162
SD [-] / 0.116 0.264 0.213
RMSD [-] / 0.105 0.341 0.230
RMSD m3m
-3 / 0.022 0.072 0.048
CC / 0.82 0.55 0.81
Italy Central Italy
(4, 5, 5, 5 stations)
H14
Bias [-]
2010
-0.086 -0.117 -0.274 -0.201
SD [-] 0.086 0.110 0.245 0.194
RMSD [-] 0.158 0.174 0.346 0.287
RMSD m3m
-3 0.040 0.043 0.087 0.072
CC 0.59 0.74 0.58 0.71
Germany UDC SMOS (6, 7, 6, 6 stations)
H14
Bias [-]
2010
0.028 -0.130 -0.207 -0.056
SD [-] 0.119 0.174 0.238 0.109
RMSD [-] 0.196 0.266 0.335 0.184
RMSD m3m
-3 0.035 0.059 0.072 0.039
CC 0.54 0.59 0.70 0.48
Denmark HOBE
(3, 25, 28, 30 stations)
H14
Bias [-]
2010
0.179 -0.077 -0.037 0.131
SD [-] 0.088 0.221 0.204 0.121
RMSD [-] 0.220 0.188 0.218 0.221
RMSD m3m
-3 0.031 0.023 0.029 0.030
CC 0.85 0.77 0.70 0.77

Product Validation Report - PVR-14
(Product H14 – SM-DAS-2)
Doc.No: SAF/HSAF/PVR-14
Issue/Revision Index: 1.1
Date: 31/05/2012
Page: 31/45
Finland Maws
(0, 1, 1,1 station)
H14
Bias [-]
2010
/ 0.433 -0.061 0.084
SD [-] / 0.173 0.164 0.113
RMSD [-] / 0.443 0.224 0.159
RMSD m3m
-3 / 0.046 0.023 0.016
CC / 0.90 0.64 0.65
Poland SWEX-Poland
(1, 1, 1, 0 station)
H14
Bias [-]
2010
0.134 0.213 -0.202 /
SD [-] 0.110 0.144 0.211 /
RMSD [-] 0.162 0.251 0.245 /
RMSD m3m
-3 0.051 0.079 0.066 /
CC 0.54 0.39 0.61 /
Luxembourg BIB
(1, 1, 1, 1 station)
H14
Bias [-]
2010
-0.110 -0.142 -0.353 -0.140
SD [-] 0.071 0.138 0.266 0.106
RMSD [-] 0.139 0.201 0.378 0.176
RMSD m3m
-3 0.021 0.031 0.058 0.027
CC 0.68 0.74 0.88 0.65
Australia OZNET
(34, 32, 31, 0 stations)
H14
Bias [-]
2010
0.064 0.054 0.153 /
SD [-] 0.227 0.186 0.124 /
RMSD [-] 0.216 0.191 0.198 /
RMSD m3m
-3 0.067 0.046 0.062 /
CC 0.70 0.70 0.77 /
USA NCRS-SCAN
(96, 116, 106, 125 stations)
H14
Bias [-]
2010
0.102 0.168 0.064 0.076
SD [-] 0.148 0.194 0.199 0.216
RMSD [-] 0.218 0.314 0.293 0.245
RMSD m3m
-3 0.053 0.078 0.071 0.057
CC 0.72 0.66 0.57 0.76
Western Africa
AMMA (0, 4, 5, 2 stations)
H14
Bias [-]
2010
/ -0.147 -0.487 -0.549
SD [-] / 0.193 0.176 0.294
RMSD [-] / 0.221 0.529 0.603
RMSD m3m
-3 / 0.124 0.265 0.486
CC / 0.68 0.51 0.83
EUROPE 47, 82, 80, 80 H14
Bias [-]
2010
-0.008 -0.068 -0.048 -0.007
SD [-] 0.091 0.193 0.212 0.170
RMSD [-] 0.164 0.205 0.264 0.220
RMSD m3m
-3 0.038 0.043 0.050 0.045
CC 0.58 0.75 0.69 0.71
ALL 180, 233, 220,
207 H14
Bias [-]
2010
0.058 0.062 0.030 0.038
SD [-] 0.152 0.195 0.195 0.199
RMSD [-] 0.208 0.261 0.264 0.239
RMSD m3m
-3 0.054 0.062 0.065 0.054
CC 0.68 0.70 0.65 0.74
Table 7 Statistical scores for the comparison between SM-DAS-2 per seasons
*Cases with pvalue <0.05 are considered, only. Results presented per seasons in previous table are in line with results over the global period. If RMSD are around the target value of 0.06 m3m-3 at a global scale, 0.054, 0.062, 0.065 and 0.054 m3m-3 for winter, spring, summer and autumn, respectively, scores are weighted by the stations of the AMMA network. If we consider stations within the HSAF area (EUROPE in the table), RMSD are below the target value and much closer to the optimal value; 0.038, 0.043, 0.050 and 0.045 m3m-3 for winter, spring, summer and autumn, respectively. Averaged values of correlation coefficient are 0.58, 0.75, 0.69 and 0.79 for winter, spring,

Product Validation Report - PVR-14
(Product H14 – SM-DAS-2)
Doc.No: SAF/HSAF/PVR-14
Issue/Revision Index: 1.1
Date: 31/05/2012
Page: 32/45
summer and autumn, respectively. As expected in Europe, RMSD are smaller in winter and autumn, where soil moisture reservoir are closer to their maximum capacity, than in summer where a higher difference can be observed between in situ observations and SM-DAS-2.
6.3.2 Comparison of the anomaly time-series
Results presented above give an overview of the product comparison at the annual scale. They are driven to a large extent by the seasonal cycle. To address the ability of the product to capture the short term scale soil moisture variations, anomaly time-series were computed (sect 4.2.2) and statistics (only CC are reported) are computed on the anomaly time-series. Figure 3 presents an illustration of H14 / SM-DAS-2 anomaly time-series used in this report for the SABRES stations of the SMOSMANIA networks on the 2010 period. Most peaks and troughs are well represented. However, in summer H14 / SM-DAS-2 (Fig 3) represents one peak (first days of July) that is not presented in the observations. Representativeness of local rainfall (the main driver of soil moisture temporal pattern) locally observed could induce discrepancies when compared to coarse resolution products, particularly in summer where local storm events may occur in southwestern France.
Figure 15 Illustration of anomaly time series used in this reports, red dots are for in situ data, black line for H14 / SM-DAS-2. Stations belong to the SMOSMANIA network, in southwestern France. Correlation coefficient is reported; ~0.61
The statistical score (CC) for the comparison between SM-DAS-2, and in situ SM anomaly time-series are presented in Table 5 for the whole 2010 period and in Table 6 per seasons. On average, CC for stations in Europe is 0.59 and global CC for all the stations is 0.57. Evaluation of normalised time-series presents better scores than anomaly time series; it means that CC of normalised time-series are driven by the seasonal cycle. It is particularly true for stations in western Africa where a CC of 0.88 was found for the normalised time-series while it is only of 0.32 for the anomaly time-series. For some stations however, CC are rather similar for both normalised and anomaly time series. For instance CC values 0.67 are found in both cases with the stations of the HOBE network in Denmark where the annual cycle is less marked. In such case, the correlation is not controlled by the annual cycle.
Similar results are found per seasons (see next table), as highlighted above, CC values are smaller in summer than in the other periods. They are on average 0.69, 0.65, 0.53 and 0.63 for winter, spring, summer and winter respectively. Considering Europe, they are 0.66, 0.65, 0.53 and 0.6263 for winter, spring, summer and winter respectively.
In the table, correlations (CC) are given for each network and for each product. Scores are presented for significant correlations with p-values < 0.05
Country Region
(Network*) Product acronym Period CC
France SMOSMANIA (12 stations)
H14 2010 0.48
France SMOSMANIA-E H14 2010 0.44

Product Validation Report - PVR-14
(Product H14 – SM-DAS-2)
Doc.No: SAF/HSAF/PVR-14
Issue/Revision Index: 1.1
Date: 31/05/2012
Page: 33/45
(8 stations)
France Grand Morin (2 stations)
H14 2010 0.74
Spain REMEDHUS
(18 stations) H14 2010 0.53
Italy UMSUOL
(1 station) H14 2010 0.41
Italy PERUGIA
(1 station) H14 2010 0.67
Italy Central Italy (5 station)
H14 2010 0.61
Germany UDC SMOS (9 station)
H14 2010 0.60
Denmark HOBE
(29 station) H14 2010 0.67
Finland Maws
(1 station) H14 2010 0.65
Poland SWEX-Poland
(1 station) H14 2010 0.50
Luxembourg BIB
(1 station) H14 2010 0.84
Australia OZNET
(36 stations) H14 2010 0.73
USA NCRS-SCAN
(137 stations) H14 2010 0.53
Western Africa
AMMA (4 stations)
H14 2010 0.32
EUROPE 89 H14 2010 0.59
ALL 262 H14 2010 0.57
Table 8 Comparisons of anomaly time-series of soil moisture between in situ observations and SM-DAS-2 for 2010
* Cases with pvalue <0.05 are considered, only.
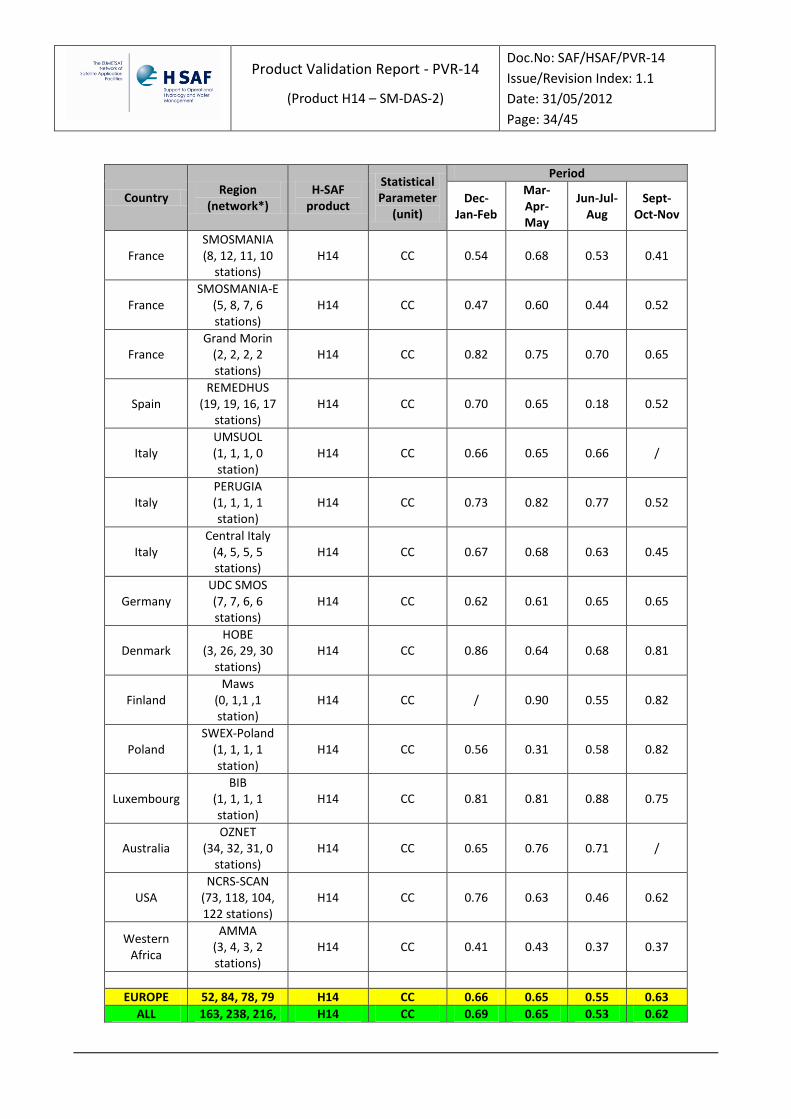
Product Validation Report - PVR-14
(Product H14 – SM-DAS-2)
Doc.No: SAF/HSAF/PVR-14
Issue/Revision Index: 1.1
Date: 31/05/2012
Page: 34/45
Country Region
(network*) H-SAF
product
Statistical Parameter
(unit)
Period
Dec-Jan-Feb
Mar-Apr-May
Jun-Jul-Aug
Sept-Oct-Nov
France SMOSMANIA (8, 12, 11, 10
stations) H14 CC 0.54 0.68 0.53 0.41
France SMOSMANIA-E
(5, 8, 7, 6 stations)
H14 CC 0.47 0.60 0.44 0.52
France Grand Morin
(2, 2, 2, 2 stations)
H14 CC 0.82 0.75 0.70 0.65
Spain REMEDHUS
(19, 19, 16, 17 stations)
H14 CC 0.70 0.65 0.18 0.52
Italy UMSUOL (1, 1, 1, 0 station)
H14 CC 0.66 0.65 0.66 /
Italy PERUGIA (1, 1, 1, 1 station)
H14 CC 0.73 0.82 0.77 0.52
Italy Central Italy
(4, 5, 5, 5 stations)
H14 CC 0.67 0.68 0.63 0.45
Germany UDC SMOS (7, 7, 6, 6 stations)
H14 CC 0.62 0.61 0.65 0.65
Denmark HOBE
(3, 26, 29, 30 stations)
H14 CC 0.86 0.64 0.68 0.81
Finland Maws
(0, 1,1 ,1 station)
H14 CC / 0.90 0.55 0.82
Poland SWEX-Poland
(1, 1, 1, 1 station)
H14 CC 0.56 0.31 0.58 0.82
Luxembourg BIB
(1, 1, 1, 1 station)
H14 CC 0.81 0.81 0.88 0.75
Australia OZNET
(34, 32, 31, 0 stations)
H14 CC 0.65 0.76 0.71 /
USA NCRS-SCAN
(73, 118, 104, 122 stations)
H14 CC 0.76 0.63 0.46 0.62
Western Africa
AMMA (3, 4, 3, 2 stations)
H14 CC 0.41 0.43 0.37 0.37
EUROPE 52, 84, 78, 79 H14 CC 0.66 0.65 0.55 0.63
ALL 163, 238, 216, H14 CC 0.69 0.65 0.53 0.62

Product Validation Report - PVR-14
(Product H14 – SM-DAS-2)
Doc.No: SAF/HSAF/PVR-14
Issue/Revision Index: 1.1
Date: 31/05/2012
Page: 35/45
203
Table 9 Comparisons of anomaly time-series of soil moisture between in situ observations and SM-DAS-2 for 2010 (per seasons)
* Cases with pvalue <0.05 are considered, only.
6.4 Some conclusions
In general results show good performances of SM-DAS-2 to capture surface soil moisture annual cycle as well as short term variability. Correlation values (CC) between the data sets are very satisfactory over most of the investigated sites located in contrasted biomes and climate conditions with averaged values of 0.71 over Europe and 0.70 if data over the US, Australia and western Africa are added. SM-DAS-2 soil moisture analyses performances were found rather similar across the different studied sites. However if good level of correlation are found in western Africa on normalized time-series, the lower scores obtained with the anomaly time-series suggest that correlations are mainly driven by the soil moisture annual cycle in this area. Finally, the Root Mean Square Difference, defined as the main score to be evaluated, is on average below the target value of 0.06 m3m-3; 0.047 m3m-3 if we consider data in Europe (within the HSAF area) and 0.061 if stations over the US, Australia and western Africa are added. The weight of the AMMA stations in western Africa is strong and affects the RMSD. When they are not considered, a RMSD value of 0.047 m3m-3 is found, below the target value (0.06 m3m-3) and close to the optimal value (0.04 m3m-3).
6.5 References of this sub-section
Albergel, C., Rüdiger, C., Pellarin, T., Calvet, J.-C., Fritz, N., Froissard, F., Suquia, D., Petitpa, D., Piguet, B. & Martin E. (2008). From near-surface to root-zone soil moisture using an exponential filter: an assessment of the method based on in situ observations and model simulations, Hydrol. Earth Syst. Sci., 12, 1323–1337, doi:10.5194/hess-12-1323-2008.
Albergel, C., Rüdiger, C., Carrer, D., Calvet, J.-C., Fritz, N., Naeimi, V., Bartalis, Z., & Hasenauer, S. (2009). An evaluation of ASCAT surface soil moisture products with in situ observations in Southwestern France, Hydrol. Earth Syst. Sci., 13, 115–124, doi:10.5194/hess-13-115-2009.
Albergel, C., Calvet, J.-C., de Rosnay, P., Balsamo, G., Wagner, W., Hasenauer, S., Naemi, V., Martin, E., Bazile, E., Bouyssel, F. & Mahfouf, J.-F. (2010). Cross-evaluation of modelled and remotely sensed surface soil moisture with in situ data in southwestern France, Hydrol. Earth Syst. Sci., 14, 2177-2191, doi:10.5194/hess-14-2177-2010.
Albergel, C., P. de Rosnay, G. Balsamo, L. Isaksen & J. Muñoz-Sabater (2011). Soil moisture analyses at ECMWF: evaluation using global ground-based in situ observations. Accepted RSE, doi10.1016/j.rse.2011.11.017. Brocca, L., Hasenauer, S., Lacava, T., Melone, F., Moramarco, T., Wagner, W., Dorigo, W. , Matgen, P., Martínez-Fernández, J., Llorens, P., Latron, J., Martin, C., Bittelli, M. (2011). Soil moisture estimation through ASCAT and AMSR-E: An intercomparison and validation study across Europe. Remote Sensing of Environment, doi: 10.1016/j.rse.2011.08.003
Calvet, J.-C., N. Fritz, F. Froissard, D. Suquia, A. Petitpa & B. Piguet (2007). in situ soil moisture observations for the CAL/VAL of SMOS: the SMOSMANIA network, International Geoscience and Remote Sensing Symposium, IGARSS, Barcelona, Spain, doi:10.1109/IGARSS.2007.4423019.
de Rosnay, P., Gruhier, C., Timouk, F., Baup, F., Mougin, E., Hiernaux, P., Kergoat, L. & V. LeDantec, (2009). Multi-scale soil moisture measurements at the Gourma meso-scale site in Mali. 375, 241–252, doi:10.1016/j.jhydrol.2009.01.015.
Dorigo, W.A., Wagner, W., Hohensinn, R., Hahn, S., Paulik, C., Drusch, M., Mecklenburg, S., van Oevelen, P., Robock, A. and & Jackson, T. (2011). The International Soil Moisture Network: a data hosting facility for global in situ soil moisture measurements, Hydrol. Earth Syst. Sci., 15, 1675-1698, doi:10.5194/hess-15-1675-2011. Jensen, K. & Illangasekare, T.: HOBE (2011). A Hydrological Observatory, Vadose Zone J., 10, 1-7, 9964, 9966.

Product Validation Report - PVR-14
(Product H14 – SM-DAS-2)
Doc.No: SAF/HSAF/PVR-14
Issue/Revision Index: 1.1
Date: 31/05/2012
Page: 36/45
Loew, A., J. T. Dall'Amico, F. Schlenz & W. Mauser, (2009). The Upper Danube soil moisture validation site: measurements and activities, paper presented at Earth Observation and Water Cycle conference, Frascati (Rome), 18-20 November 2009, ESA Special Publication SP-674.
Martínez-Fernández, J. & Ceballos, A. (2005). Mean soil moisture estimation using temporal stability analysis, J. Hydrol., 312 (1-4), 28–38, doi :10.1016/j.jhydrol.2005.02.007.
Paris Anguela, T., Zribi, M., Hasenauer, S., Habets, F. & Loumagne, C. (2008). Analysis of surface and root-zone soil moisture dynamics with ERS scatterometer and the hydrometeorological model SAFRAN-ISBA-MODCOU at Grand Morin watershed (France), Hydrol. Earth Syst. Sci., 12, 1415-1424, doi:10.5194/hess-12-1415-2008.
Pellarin T., Laurent, J.P., Cappelaere, B., Decharme, B., Descroix L. & Ramier, D. (2009a). Hydrological modelling and associated microwave emission of a semi-arid region in South-western Niger, J. Hydrol., 375, 1-2, 262-272.
Pellarin T., Tran, T., Cohard, J.-M., Galle, S., Laurent, J.-P., de Rosnay, P. & Vischel, T. (2009b). Soil moisture mapping over West Africa with a 30-min temporal resolution using AMSR-E observations and a satellite-based rainfall product, Hydrol. Earth Syst. Sci., 13, 1887–1896.
Redelsperger, J.-L., Thorncroft, C., Diedhiou, A., Lebel, T., Parker, D. & Polcher, J. (2006). African monsoon multidisciplinary analysis (AMMA): an international research project and field campaign., Bull. Am. Meteorol. Soc., 87 (12), 1739–1746. Schaefer, G.L. & Paetzold, R.F. (2000). SNOTEL (SNOwpack TELemetry) and SCAN (Soil Climate Analysis Network) Presented at the Automated Weather Station (AWS) workshop. March 6-10. Lincoln, NE.
Young, R., Walker, J.P., Yeoh, N., Smith, A., Ellett, K., Merlin O. & Western, A. (2008) Soil Moisture and Meteorological Observations From the Murrumbidgee Catchment, Department of Civil and Environmental Engineering, The University of Melbourne. (http://www.oznet.org.au/mdbdata/document.html, last access, 10/05/2011).

Product Validation Report - PVR-14
(Product H14 – SM-DAS-2)
Doc.No: SAF/HSAF/PVR-14
Issue/Revision Index: 1.1
Date: 31/05/2012
Page: 37/45
7 Conclusions
7.1 Summary conclusions on product validation
The SM-DAS-2 product has been validated by the SMPVG on one year of data (2010) using as reference data set, in situ SM measurements of several countries and using SM parameters deduced by Belgian and Italian hydrological models. In situ soil moisture data from 295 stations located in: Europe, Africa, Australia and the United States are used to determine the reliability of SM-DAS-2 to represent soil moisture; 93 stations are within the HSAF area. The statistical scores presented (chapter 6) have been evaluated following a common validation methodology (chapter 3) agreed and shared by all the SMPVG. The case study analysis here presented are based on comparison between the SM-DAS-2 and SM derived by Belgian and Italian hydrological models. The case studies proposed have showed very good performance for SM-DAS-2 with correlation coefficient reaching values of 0.74 and 0.95 (chapter 5). In Chapter 6 validation results of SM-DAS-2 (large statistic analysis obtained for the year 2010) have been presented. To assess the degree of compliance of the product with product requirements, 295 stations, of which 93 located within the HSAF area, have been used. In general results show good performances of SM-DAS-2 to capture surface soil moisture annual cycle as well as short term variability. Correlation values and Root Mean Square Difference between SM-DAS-2 and in situ measurements have been evaluated with averaged values respectively of 0.71 and 0.047 m3m-3 over Europe, and 0.70 and 0.061 m3m-3 if stations over the US, Australia and western Africa are added. The statistical scores evaluated by the SMPVG reach the thresholds stated in the Product requirements. The results of the SM validation activities here presented are available in the validation section of the H-SAF web page. This validation web section will be continuously updated with the last validation results and studies coming from the SMPVG.
References:
Albergel, C., Rüdiger, C., Pellarin, T., Calvet, J.-C., Fritz, N., Froissard, F., Suquia, D., Petitpa, D., Piguet, B. & Martin E. (2008). From near-surface to root-zone soil moisture using an exponential filter: an assessment of the method based on in situ observations and model simulations, Hydrol. Earth Syst. Sci., 12, 1323–1337, doi:10.5194/hess-12-1323-2008.
Albergel, C., Rüdiger, C., Carrer, D., Calvet, J.-C., Fritz, N., Naeimi, V., Bartalis, Z., & Hasenauer, S. (2009). An evaluation of ASCAT surface soil moisture products with in situ observations in Southwestern France, Hydrol. Earth Syst. Sci., 13, 115–124, doi:10.5194/hess-13-115-2009.
Albergel, C., Calvet, J.-C., de Rosnay, P., Balsamo, G., Wagner, W., Hasenauer, S., Naemi, V., Martin, E., Bazile, E., Bouyssel, F. & Mahfouf, J.-F. (2010). Cross-evaluation of modelled and remotely sensed surface soil moisture with in situ data in southwestern France, Hydrol. Earth Syst. Sci., 14, 2177-2191, doi:10.5194/hess-14-2177-2010.
Albergel, C., P. de Rosnay, G. Balsamo, L. Isaksen & J. Muñoz-Sabater (2011). Soil moisture analyses at ECMWF: evaluation using global ground-based in situ observations. Accepted RSE, doi10.1016/j.rse.2011.11.017. Brocca, L., Hasenauer, S., Lacava, T., Melone, F., Moramarco, T., Wagner, W., Dorigo, W. , Matgen, P., Martínez-Fernández, J., Llorens, P., Latron, J., Martin, C., Bittelli, M. (2011). Soil moisture estimation through ASCAT and AMSR-E: An intercomparison and validation study across Europe. Remote Sensing of Environment, doi: 10.1016/j.rse.2011.08.003

Product Validation Report - PVR-14
(Product H14 – SM-DAS-2)
Doc.No: SAF/HSAF/PVR-14
Issue/Revision Index: 1.1
Date: 31/05/2012
Page: 38/45
Calvet, J.-C., N. Fritz, F. Froissard, D. Suquia, A. Petitpa & B. Piguet (2007). in situ soil moisture observations for the CAL/VAL of SMOS: the SMOSMANIA network, International Geoscience and Remote Sensing Symposium, IGARSS, Barcelona, Spain, doi:10.1109/IGARSS.2007.4423019.
de Rosnay, P., Gruhier, C., Timouk, F., Baup, F., Mougin, E., Hiernaux, P., Kergoat, L. & V. LeDantec, (2009). Multi-scale soil moisture measurements at the Gourma meso-scale site in Mali. 375, 241–252, doi:10.1016/j.jhydrol.2009.01.015.
Dorigo, W.A., Wagner, W., Hohensinn, R., Hahn, S., Paulik, C., Drusch, M., Mecklenburg, S., van Oevelen, P., Robock, A. and & Jackson, T. (2011). The International Soil Moisture Network: a data hosting facility for global in situ soil moisture measurements, Hydrol. Earth Syst. Sci., 15, 1675-1698, doi:10.5194/hess-15-1675-2011. Jensen, K. & Illangasekare, T.: HOBE (2011). A Hydrological Observatory, Vadose Zone J., 10, 1-7, 9964, 9966.
Loew, A., J. T. Dall'Amico, F. Schlenz & W. Mauser, (2009). The Upper Danube soil moisture validation site: measurements and activities, paper presented at Earth Observation and Water Cycle conference, Frascati (Rome), 18-20 November 2009, ESA Special Publication SP-674.
Martínez-Fernández, J. & Ceballos, A. (2005). Mean soil moisture estimation using temporal stability analysis, J. Hydrol., 312 (1-4), 28–38, doi :10.1016/j.jhydrol.2005.02.007.
Paris Anguela, T., Zribi, M., Hasenauer, S., Habets, F. & Loumagne, C. (2008). Analysis of surface and root-zone soil moisture dynamics with ERS scatterometer and the hydrometeorological model SAFRAN-ISBA-MODCOU at Grand Morin watershed (France), Hydrol. Earth Syst. Sci., 12, 1415-1424, doi:10.5194/hess-12-1415-2008.
Pellarin T., Laurent, J.P., Cappelaere, B., Decharme, B., Descroix L. & Ramier, D. (2009a). Hydrological modelling and associated microwave emission of a semi-arid region in South-western Niger, J. Hydrol., 375, 1-2, 262-272.
Pellarin T., Tran, T., Cohard, J.-M., Galle, S., Laurent, J.-P., de Rosnay, P. & Vischel, T. (2009b). Soil moisture mapping over West Africa with a 30-min temporal resolution using AMSR-E observations and a satellite-based rainfall product, Hydrol. Earth Syst. Sci., 13, 1887–1896.
Redelsperger, J.-L., Thorncroft, C., Diedhiou, A., Lebel, T., Parker, D. & Polcher, J. (2006). African monsoon multidisciplinary analysis (AMMA): an international research project and field campaign., Bull. Am. Meteorol. Soc., 87 (12), 1739–1746. Schaefer, G.L. & Paetzold, R.F. (2000). SNOTEL (SNOwpack TELemetry) and SCAN (Soil Climate Analysis Network) Presented at the Automated Weather Station (AWS) workshop. March 6-10. Lincoln, NE.
Young, R., Walker, J.P., Yeoh, N., Smith, A., Ellett, K., Merlin O. & Western, A. (2008) Soil Moisture and Meteorological Observations From the Murrumbidgee Catchment, Department of Civil and Environmental Engineering, The University of Melbourne. (http://www.oznet.org.au/mdbdata/document.html, last access, 10/05/2011).
Albergel, C., J.-C. Calvet, J.-F. Mahfouf, C. Rudiger, A. L. Barbu, S. Lafont, J.-L. Roujean, J. P. Walker, M. Crapeau & J.-P. Wigneron (2010). Monitoring of water and carbon fluxes using a land data assimilation system: a case study for southwestern France .Hydrol. Earth Syst. Sci., 14, 1109–1124, doi:10.5194/hess-14-1109-2010. www.hydrol-earth-syst-sci.net/14/1109/2010/ Brocca, L., Melone, F. & Moramarco, T. (2011). Distributed rainfall-runoff modelling for flood frequency estimation and flood forecasting. Hydrol. process., in press. Camici, S., Tarpanelli, A., Brocca, L & Moramarco, T. (2011). Design soil moisture estimation by comparing contious and storm-based rainfall runoff modelling. Water Ress Res., vol 47, W05527, 2011. Bultot, F. & G.L. Dupriez (1976a). Conceptual hydrological model for an average-sized catchment area, I. Concepts and relationships. J. Hydrol., 29, 251-272. Bultot, F. & G.L. Dupriez (1976b). Conceptual hydrological model for an average-sized catchment area, II. Estimate of parameters, validity of model, applications. J. Hydrol., 29, 273-292.

Product Validation Report - PVR-14
(Product H14 – SM-DAS-2)
Doc.No: SAF/HSAF/PVR-14
Issue/Revision Index: 1.1
Date: 31/05/2012
Page: 39/45
Roulin, E. (2002). Statistical correction applied to a water-balance model for the Meuse. In E.E. van Loon, and P.A. Troch (eds.), Final Report of the DAUFIN project. Wageningen University, The Netherlands, pp 113-129.
Annex 1. Validation methodology for H14/SM-DAS-2
Clément Albergel, [email protected] Latest update: December 6, 2011
This document describes the methodology applied when validating the product H-SAF H14/SM-DASS-2. A) Validation procedure To properly validate the product, the following steps have to be taken:
Observation data containing soil moisture measurements have to be gathered. H14/SM-DAS-2 needs to be acquired. Both observation and H14/SM-DAS-2 data series need to be checked for consistency. Comparison between the observation data and the product has to be performed. Results of the comparison need to be presented.
Observation (in situ) data Make sure to collect soil moisture datasets within the reference season (January to December 2010) or longer. The minimum fields that datasets should contain are:
Date and time of the measurement,
Location,
Soil moisture value and unit, either gravimetric (e.g. kg³/kg³) or volumetric (e.g. m³/m³),
Quality information. If you do not have access to observation data you may have a look at the International Soil Moisture Network, where in-situ soil moisture datasets can be downloaded freely for a number of sites, constantly growing: http://www.ipf.tuwien.ac.at/insitu/ Soil moisture data over the United States are also freely available at: http://www.wcc.nrcs.usda.gov/scan/ H14/SM-DAS-2 H-SAF H14 product will be available at the Meteoam FTP server: • URL: ftp://ftp.meteoam.it • Username: hsaf • Password: (ask to Help-Desk) • directory: /products/h14 (latest month) or /from_archive/h14 (archive)

Product Validation Report - PVR-14
(Product H14 – SM-DAS-2)
Doc.No: SAF/HSAF/PVR-14
Issue/Revision Index: 1.1
Date: 31/05/2012
Page: 40/45
URL: ftp://ftp.meteoam.it username: hsaf directory: products
Product identifier: h14. Folders under h14:
h14_cur_mon_grib digital data of current months
h14_cur_mon_png Images of current months
Files description of current month:
h14_yyyymmddhh.grib.gz digital data
h14_yyyymmddhh.png image data
yyyymmddhh: year, month, day, hour (00)
A demonstration data set of H14 covering the period form January to December 2010 is available: http://www.ecmwf.int/research/EUMETSAT_projects/SAF/HSAF/ecmwf-hsaf/SM-DAS-2/h14_demodata_2010.tar.gz Coverage: Global product Cycle: 24 hours regular: daily at 0000 UTC. Resolution : Horizontal: ~25 km (T799) Vertical (below surface): 4 layers: 0-7 cm, 7-28 cm, 28-100 cm, 100-289 cm An ftp client (e.g. FileZilla, WinSCP) is required to log in and retrieve the product. The SM-DAS-2 product is provided in GRIB format, on a Gaussian grid at the resolution T799 (~25 km). There are several tools available to read grib files. We recommend using the GRIB API software to read grib files. GRIB API can be downloaded from the ECMWF GRIB API web page: http://www.ecmwf.int/products/data/software/grib_api.html It needs to be used under Linux or UNIX systems. For example if your SM-DAS-2 grib file is named h14_2009122700.grib, the command to extract data from the four nearest grid points from latitude YLAT and longitude XLON is: grib_ls -p step,shortName -l XLAT,XLON h14_2009122700.grib Metview is also recommended to be used to extract data from grib files, to plot and map data as well as to compute statistics. Metview can be downloaded and installed on Linux and Unix systems from the ECMWF Metview web page: http://www.ecmwf.int/publications/manuals/metview/index.html Comparison between the observation data and the product SM-DAS-2 is an index between 0 and 1 while in situ measurements of soil moisture are most often that not in m3m-3. To enable a fair comparison, it is then necessary to rescale the data. The 90% confidence interval was chosen to define the upper and lower values to exclude any abnormal outliers due to instrument noise using the following equations (Albergel et al., 2010):

Product Validation Report - PVR-14
(Product H14 – SM-DAS-2)
Doc.No: SAF/HSAF/PVR-14
Issue/Revision Index: 1.1
Date: 31/05/2012
Page: 41/45
Where Int+ and int- are the upper and lower 90% limits of the confidence interval. Then a new in situ soil moisture data set is obtained using:
It is assumed that H14/SM-DAS-2 data set do not have such outliers problem and is rescaled usig the maximum and the minimum values of each individual times series considering the whole 2010 period. The comparison between the observation data and the H14/SM-DAS-2 product needs to be performed, gaining the following statistical scores:
Mean Error (ME) or Bias
Standard Deviation (SD)
Correlation Coefficient (CC)
Root Mean Square Difference (RMSD), In situ data contain errors (instrumental and representativeness), so they are not considered as ‘true’ soil moisture. This is underlined here by using the RMS Difference terminology instead of RMS Error.
p-value, a measure of the correlation significance should be calculated as well. It indicates the significance of the test, the 95% confidence interval should be used; configurations where the p-value is below 0.05 (i.e. the correlation is not a coincidence) have to be retained.
with and ;
SM stands for Soil Moisture. The RMSD represents the relative error of the soil moisture dynamical range, as SM-DAS-2 is an index, it has no units. Hence it is possible to obtain an estimate of the error of the liquid
Product Validation Report - PVR-14
(Product H14 – SM-DAS-2)
Doc.No: SAF/HSAF/PVR-14
Issue/Revision Index: 1.1
Date: 31/05/2012
Page: 42/45
root zone soil moisture retrieval in m3m−3 by multiplication between the RMSD and the observed dynamical range (obs_max-min_max). Additionally, in order to avoid seasonal effects, correlations (CC) of the monthly anomaly time-series should also be calculated (Albergel et al., 2009, 2011). The difference to the mean is calculated for a sliding window of five weeks (if there are at least five measurements in this period), and the difference is scaled to the standard deviation. For each SSM estimate at day (i), a period F is defined, with F=[i-17, i+17] (corresponding to a 5-week window). If at least five measurements are available in this period of time, the average SSM value and the standard deviation are calculated. The Anomaly (Ano), dimensionless is then given by:
Most often than not, soil moisture is measured along with soil temperature. If available a threshold of +3° degrees should be considered and soil moisture measurements below this threshold should be rejected. Statistical scores should be computed for the whole period (e.g. 2010) as well as for seasons defined as follow:
December-January-February,
March-April-May,
June-July-August,
September-October-November. Results of the comparison Results should be presented in the form of contingency tables, formats can be found in the excel document entitled H14-SM-DAS-2_tables.xls. An example is given below using 12 stations of the SMOSMANIA network in southwestern France. Main statistics, normalised time-series:
Country Region
(Network) Product acronym
Period Bias (-) Standard deviation
(-)
RMSD (-)/[m
3m
-3]
CC
France SMOSMANIA (12 stations)
H14 2010 -0.06 0.259 0.210 / 0.056 0.79
CC, monthly anomaly time-series:
Country Region (Network) Product acronym Period CC
France SMOSMANIA (12
stations) H14 2010 0.48
…
Statistics should also be presented per seasons, please see document H14-SM-DAS-2_tables.xls.

Product Validation Report - PVR-14
(Product H14 – SM-DAS-2)
Doc.No: SAF/HSAF/PVR-14
Issue/Revision Index: 1.1
Date: 31/05/2012
Page: 43/45
Main statistics per seasons, normalised time-series:
Country Region (network)
Product acronym
Statistical Parameter (unit)
Period Start
Period
Dec-Jan-Feb
Mar-Apr-May
Jun-Jul-Aug
Sept-Oct-Nov
France SMOSMANIA (12 stations)
H14
Bias [-]
2010
0.010 -0.070 -0.072 -0.096
SD [-] 0.076 0.165 0.216 0.260
RMSD [-] 0.159 0.207 0.239 0.215
RMSD m3m-3
0.035 0.055 0.064 0.057
CC 0.42 0.79 0.67 0.78
CC per seasons, monthly anomaly time-series:
Country Region (network)
H-SAF product
Statistical Parameter (unit)
Period
Dec-Jan-Feb
Mar-Apr-May
Jun-Jul-Aug
Sept-Oct-Nov
France SMOSMANIA (12 stations)
SM-DAS-2 CC 0.54 0.68 0.53 0.41
More information about soil moisture validation studies can be found at : Albergel, C., Rüdiger, C., Carrer, D., Calvet, J.-C., Fritz, N., Naeimi, V., Bartalis, Z., and Hasenauer, S.: An evaluation of ASCAT surface soil moisture products with in-situ observations in southwestern France. Hydrol. Earth Syst. Sci., 13, 115-124, doi:10.5194/hess-13-115-2009, 2009. http://www.hydrol-earth-syst-sci.net/13/115/2009/hess-13-115-2009.html Albergel, C., J.-C. Calvet, P. de Rosnay, G. Balsamo, W. Wagner, S. Hasenauer, V. Naemi, E. Martin, E. Bazile F. Bouyssel, and Mahfouf, J.-F.: Cross-evaluation of modelled and remotely sensed surface soil moisture with in situ data in southwestern France, Hydrol. Earth Syst. Sci., 14, 2177-2191, doi:10.5194/hess-14-2177-2010, 2010. http://www.hydrol-earth-syst-sci.net/14/2177/2010/hess-14-2177-2010.pdf More information on SM-DAS-2 / H14 as well as a global evaluation against in situ data can be found at : Albergel, C., P. de Rosnay, C. Gruhier, J. Muñoz-Sabater, S., Hasenauer, L. Isaksen, Y. Kerr, W. Wagner: Evaluation of remotely sensed and modelled soil moisture products using global ground-based in situ observations, Technical Memorandum No. 652, October 2011. [Accepted RSE] http://www.ecmwf.int/publications/library/do/references/show?id=90275
Annex 2. Acronyms AMSU Advanced Microwave Sounding Unit (on NOAA and MetOp)
Product Validation Report - PVR-14
(Product H14 – SM-DAS-2)
Doc.No: SAF/HSAF/PVR-14
Issue/Revision Index: 1.1
Date: 31/05/2012
Page: 44/45
AMSU-A Advanced Microwave Sounding Unit - A (on NOAA and MetOp)
AMSU-B Advanced Microwave Sounding Unit - B (on NOAA up to 17)
ATDD Algorithms Theoretical Definition Document
AU Anadolu University (in Turkey)
BfG Bundesanstalt für Gewässerkunde (in Germany)
CAF Central Application Facility (of EUMETSAT)
CDOP Continuous Development-Operations Phase
CESBIO Centre d'Etudes Spatiales de la BIOsphere (of CNRS, in France)
CM-SAF SAF on Climate Monitoring
CNMCA Centro Nazionale di Meteorologia e Climatologia Aeronautica (in Italy)
CNR Consiglio Nazionale delle Ricerche (of Italy)
CNRS Centre Nationale de la Recherche Scientifique (of France)
DMSP Defense Meteorological Satellite Program
DPC Dipartimento Protezione Civile (of Italy)
EARS EUMETSAT Advanced Retransmission Service
ECMWF European Centre for Medium-range Weather Forecasts
EDC EUMETSAT Data Centre, previously known as U-MARF
EUM Short for EUMETSAT
EUMETCast EUMETSAT’s Broadcast System for Environmental Data
EUMETSAT European Organisation for the Exploitation of Meteorological Satellites
FMI Finnish Meteorological Institute
FTP File Transfer Protocol
GEO Geostationary Earth Orbit
GRAS-SAF SAF on GRAS Meteorology
HDF Hierarchical Data Format
HRV High Resolution Visible (one SEVIRI channel)
H-SAF SAF on Support to Operational Hydrology and Water Management
IDL©
Interactive Data Language
IFOV Instantaneous Field Of View
IMWM Institute of Meteorology and Water Management (in Poland)
IPF Institut für Photogrammetrie und Fernerkundung (of TU-Wien, in Austria)
IPWG International Precipitation Working Group
IR Infra Red
IRM Institut Royal Météorologique (of Belgium) (alternative of RMI)
ISAC Istituto di Scienze dell’Atmosfera e del Clima (of CNR, Italy)
ITU İstanbul Technical University (in Turkey)
LATMOS Laboratoire Atmosphères, Milieux, Observations Spatiales (of CNRS, in France)
LEO Low Earth Orbit
LSA-SAF SAF on Land Surface Analysis
Météo France National Meteorological Service of France
METU Middle East Technical University (in Turkey)
MHS Microwave Humidity Sounder (on NOAA 18 and 19, and on MetOp)
MSG Meteosat Second Generation (Meteosat 8, 9, 10, 11)
MVIRI Meteosat Visible and Infra Red Imager (on Meteosat up to 7)
MW Micro Wave
NESDIS National Environmental Satellite, Data and Information Services
NMA National Meteorological Administration (of Romania)
NOAA National Oceanic and Atmospheric Administration (Agency and satellite)
NWC-SAF SAF in support to Nowcasting & Very Short Range Forecasting
NWP Numerical Weather Prediction
NWP-SAF SAF on Numerical Weather Prediction
O3M-SAF SAF on Ozone and Atmospheric Chemistry Monitoring
OMSZ Hungarian Meteorological Service
ORR Operations Readiness Review
OSI-SAF SAF on Ocean and Sea Ice
PDF Probability Density Function
PEHRPP Pilot Evaluation of High Resolution Precipitation Products
Pixel Picture element

Product Validation Report - PVR-14
(Product H14 – SM-DAS-2)
Doc.No: SAF/HSAF/PVR-14
Issue/Revision Index: 1.1
Date: 31/05/2012
Page: 45/45
PMW Passive Micro-Wave
PP Project Plan
PR Precipitation Radar (on TRMM)
PUM Product User Manual
PVR Product Validation Report
RMI Royal Meteorological Institute (of Belgium) (alternative of IRM)
RR Rain Rate
RU Rapid Update
SAF Satellite Application Facility
SEVIRI Spinning Enhanced Visible and Infra-Red Imager (on Meteosat from 8 onwards)
SHMÚ Slovak Hydro-Meteorological Institute
SMPVG Soil Moisture Product Validation Group (sometimes also “SMVG”, Soil Moisture Validation Group)
SSM/I Special Sensor Microwave / Imager (on DMSP up to F-15)
SSMIS Special Sensor Microwave Imager/Sounder (on DMSP starting with S-16)
SYKE Suomen ympäristökeskus (Finnish Environment Institute)
TBB Equivalent Blackbody Temperature (used for IR)
TDR Time-Domain Reflectometer
TKK Teknillinen korkeakoulu (Helsinki University of Technology)
TMI TRMM Microwave Imager (on TRMM)
TRMM Tropical Rainfall Measuring Mission UKMO
TSMS Turkish State Meteorological Service
TU-Wien Technische Universität Wien (in Austria)
U-MARF Unified Meteorological Archive and Retrieval Facility
UniFe University of Ferrara (in Italy)
URD User Requirements Document
UTC Universal Coordinated Time
VIS Visible
ZAMG Zentralanstalt für Meteorologie und Geodynamik (of Austria)
Related Documents