W&M ScholarWorks W&M ScholarWorks Dissertations, Theses, and Masters Projects Theses, Dissertations, & Master Projects 2010 Processing and Conversion of Algae to Bioethanol Processing and Conversion of Algae to Bioethanol Sara Katherine Kampfe College of William & Mary - Arts & Sciences Follow this and additional works at: https://scholarworks.wm.edu/etd Part of the Chemical Engineering Commons, Chemistry Commons, and the Power and Energy Commons Recommended Citation Recommended Citation Kampfe, Sara Katherine, "Processing and Conversion of Algae to Bioethanol" (2010). Dissertations, Theses, and Masters Projects. Paper 1539626902. https://dx.doi.org/doi:10.21220/s2-wevj-vb05 This Thesis is brought to you for free and open access by the Theses, Dissertations, & Master Projects at W&M ScholarWorks. It has been accepted for inclusion in Dissertations, Theses, and Masters Projects by an authorized administrator of W&M ScholarWorks. For more information, please contact [email protected].

Welcome message from author
This document is posted to help you gain knowledge. Please leave a comment to let me know what you think about it! Share it to your friends and learn new things together.
Transcript
W&M ScholarWorks W&M ScholarWorks
Dissertations, Theses, and Masters Projects Theses, Dissertations, & Master Projects
2010
Processing and Conversion of Algae to Bioethanol Processing and Conversion of Algae to Bioethanol
Sara Katherine Kampfe College of William & Mary - Arts & Sciences
Follow this and additional works at: https://scholarworks.wm.edu/etd
Part of the Chemical Engineering Commons, Chemistry Commons, and the Power and Energy
Commons
Recommended Citation Recommended Citation Kampfe, Sara Katherine, "Processing and Conversion of Algae to Bioethanol" (2010). Dissertations, Theses, and Masters Projects. Paper 1539626902. https://dx.doi.org/doi:10.21220/s2-wevj-vb05
This Thesis is brought to you for free and open access by the Theses, Dissertations, & Master Projects at W&M ScholarWorks. It has been accepted for inclusion in Dissertations, Theses, and Masters Projects by an authorized administrator of W&M ScholarWorks. For more information, please contact [email protected].
Processing and Conversion of Algae to Bioethanol
Sara Katherine Kampfe
Celina, Ohio
Bachelor of Science, Bowling Green State University, 2006
A Thesis presented to the Graduate Faculty of the College of William and Mary in Candidacy for the Degree of
Master of Science
Department of Chemistry
The College of William and Mary May, 2010
APPROVAL PAGE
This Thesis is submitted in partial fulfillment of the requirements for the degree of
Master of Science
fo t fa I U m JLSara Katherine Kampfe
Approved by the Committee, April, 2010
L)mmittee Chair
Associate Professor Robert Hinkle, Chemistry The College of William and Mary
yProfessor Deborah Bebout, Chemistry
The College of William and Mary
j \ - ,
Prof0s$br Elizabeth Canuel, Marine Science Virginia Institute of Marine Science
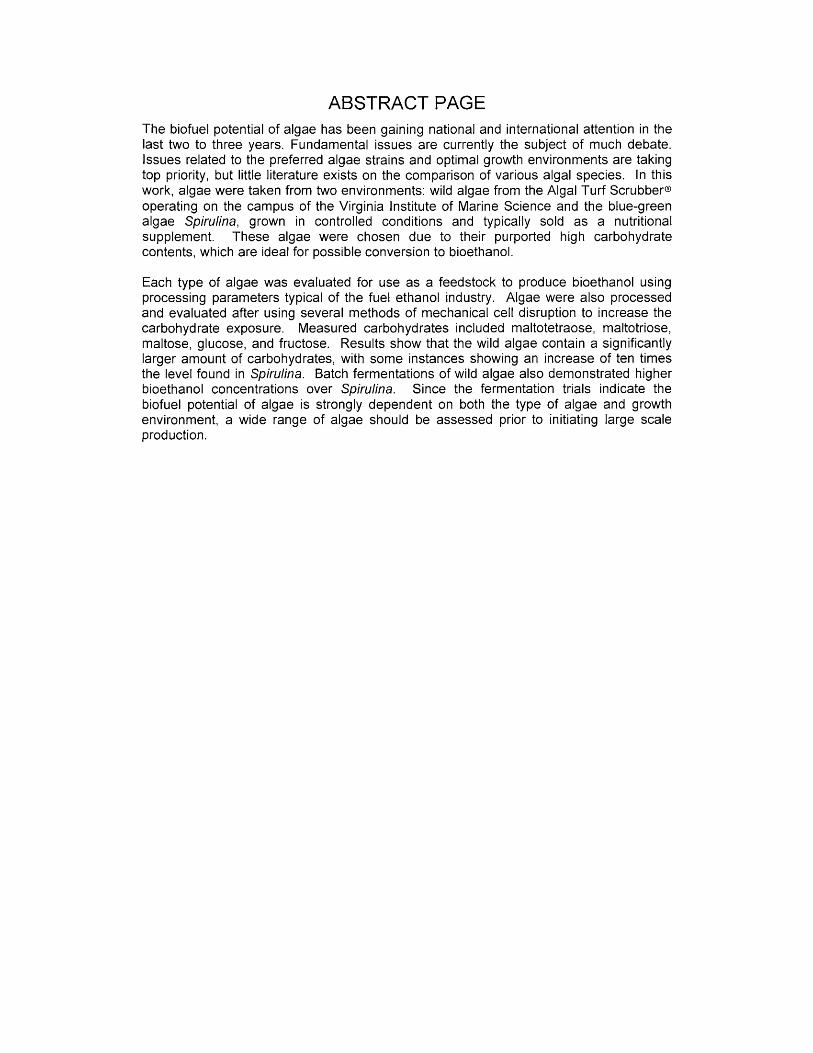
ABSTRACT PAGEThe biofuel potential of algae has been gaining national and international attention in the last two to three years. Fundamental issues are currently the subject of much debate. Issues related to the preferred algae strains and optimal growth environments are taking top priority, but little literature exists on the comparison of various algal species. In this work, algae were taken from two environments: wild algae from the Algal Turf Scrubber® operating on the campus of the Virginia Institute of Marine Science and the blue-green algae Spirulina, grown in controlled conditions and typically sold as a nutritional supplement. These algae were chosen due to their purported high carbohydrate contents, which are ideal for possible conversion to bioethanol.
Each type of algae was evaluated for use as a feedstock to produce bioethanol using processing parameters typical of the fuel ethanol industry. Algae were also processed and evaluated after using several methods of mechanical cell disruption to increase the carbohydrate exposure. Measured carbohydrates included maltotetraose, maltotriose, maltose, glucose, and fructose. Results show that the wild algae contain a significantly larger amount of carbohydrates, with some instances showing an increase of ten times the level found in Spirulina. Batch fermentations of wild algae also demonstrated higher bioethanol concentrations over Spirulina. Since the fermentation trials indicate the biofuel potential of algae is strongly dependent on both the type of algae and growth environment, a wide range of algae should be assessed prior to initiating large scale production.
TABLE OF CONTENTS
List of Figures................................................................................................................................iv
List of Tables................................................................................................................................vii
Dedication....................................................................................................................................viii
Acknowledgements....................................................................................................................... ix
Chapter 1: Introduction ............................................................................................................ 1
Chapter 1 References ............................................................................................................... 4
Chapter 2: Background.............................................................................................................. 6
2.1. Transportation Fuel .........................................................................................................6
2.1.1. Ethanol as a Renewable Transportation Fuel..................................................... 6
2.2. Brief History of Ethanol Integration ............................................................................ 8
2.3. Achieving the Goals of the Renewable Fuels Standard ...........................................11
2.3.1. First Generation Biofuels................................................................................... 11
2.3.1.1. The Dry Mill Ethanol Production Process ....................................14
2.3.1.2. The Wet Mill Ethanol Production Process....................................18
2.3.1.3. Current Ethanol Production from First Generation Facilities 19
2.3.2. Second Generation Biofuels ............................................................................ 20
2.3.2.1. Biomass Pretreatment .......................................................................21
2.3.2.1.1. Cellulose, Hemicellulose, and L ig n in ............................22
2.3.2.2. Enzymatic Hydrolysis of Cellulose and Hemicellulose............. 25
2.3.2.3. Glucose and Pentose Ferm entation............................................... 26
2.3.2.4. Current Cellulosic Ethanol Production Facilities ....................... 27
2.3.3. Third Generation Biofuels ............................................................................... 27
2.3.3.1. Algal Biofuels ...................................................................................28
2.3.3.1.1. Wild Algae and the Algal Turf Scrubber®...................30
2.3.3.1.2. Melosira nummuloides..................................................... 31
2.3.3.1.3. Spirulina ............................................................................. 33
2.4. Mechanical Processing as a Method for Yield Improvement ................................. 35
2.4.1. Homogenization................................................................................................ 35
2.4.2. Hydrodynamic C avitation...............................................................................37
2.4.3. U ltrasonication..................................................................................................38
2.5. Summary .........................................................................................................................39
Chapter 2 References .............................................................................................................40
C hapter 3: M aterials and M ethods ..................................................................................... 47
3.1. Sample Collection and Procurement .......................................................................... 47
3.1.1. Wild Algae Collection ..................................................................................... 47
3.1.2. Spirulina Procurement ..................................................................................... 48
3.2. Compositional A nalyses...............................................................................................49
3.3. Sample Pre-Processing.................................................................................................50
3.3.1. Mechanical Pre-Processing.............................................................................50
3.3.2. Thermal Pre-Processing ................................................................................... 54
3.4. Fermentation and Saccharification Processing......................................................... 55
3.4.1. Fermentation Processing using Cellulase ......................................................58
3.5. Processing, Fermentation, and Saccharification A nalyses......................................58
Chapter 3 References .............................................................................................................60
C hapter 4: Results and D iscussion....................................................................................... 61
4.1. Compositional A nalyses...............................................................................................61
4.1.1. Wild A lg a e .........................................................................................................61
4.1.2. Spirulina ............................................................................................................. 66
4.2. Cell Disruption ...............................................................................................................67
4.2.1. Wild Algae Cell Disruption .............................................................................67
4.2.2. Spirulina Cell D isruption.................................................................................75
4.3. Carbohydrate P rofiles................................................................................................... 79
4.3.1. Wild Algae Carbohydrates.............................................................................. 80
4.3.2. Spirulina Carbohydrates .................................................................................. 86
4.3.3. Yellow Dent Corn Carbohydrates.................................................................. 90
4.4. Ethanol Production........................................................................................................91
4.4.1. Wild Algae Ethanol Y ie ld ................................................................................ 92
4.4.2. Spirulina Ethanol Yield ....................................................................................94
4.4.3. Yellow Dent Corn Ethanol Y ie ld .................................................................... 96
4.5. Effects o f Cellulase ........................................................................................................97
4.6. Effects o f the Warm Water Wash Technique.............................................................98
4.7. Sample Uncertainty ......................................................................................................100
Chapter 4 References .......................................................................................................... 102
Chapter 5: Conclusions.......................................................................................................... 104
5.1. Wild Algae Potential as a Feedstock for Ethanol Production .................................104
5.2. Spirulina Potential as a Feedstock for Ethanol Production..................................... 105
5.3. Mechanical Processing Results ................................................................................... 106
5.4. Future Work ...................................................................................................................108
Chapter 5 References .......................................................................................................... 109
Appendices
Appendix A: Additional Figures of Wild Algae and Spirulina ...................................... 111
Appendix B: FIPLC Data Sheets of Representative Samples ........................................ 121
Appendix C: Raw Data Spreadsheets for Wild Algae and Spirulina ............................ 145
Appendix D: Midwest Laboratories Data S hee ts ............................................................. 165
Vita................................................................................................................................................173
iii
LIST OF FIGURES
Chapter 1: Introduction
Figure 1.1. Total and renewable energy distribution by component type. (Figure credit:Energy Information Administration.)....................................................................1
Chapter 2: Background
Figure 2.1. U.S. fuel ethanol consumption, 1981- 2008. (Figure credit: U.S. EnergyInformation Administration.) .................................................................................8
Figure 2.2. Components o f a kernel o f yellow dent com. (Figure credit: BeallDegerminator C o .) ................................................................................................. 12
Figure 2.3. Structures of amylose and amylopectin that form starch. (Figure credit:Power.) .................................................. 13
Figure 2.4. Dry mill ethanol production process. (Figure credit: The Renewable FuelsA ssociation.)........................................................................................................... 14
Figure 2.5. Modes o f operation for alpha amylase (a-amylase) and glucoamylase in the reduction of starch to dextrins and fermentable sugars. (Figure credit:Power.) .................................................................................................................... 16
Figure 2.6. The wet mill ethanol production process. (Figure credit: E lander.)............... 19
Figure 2.7. Locations of fuel ethanol production facilities in the United States as ofMarch 2, 2010. (Figure credit: The Renewable Fuels Association.).............20
Figure 2.8. Ethanol production process from second generation biofuels. (Figure credit: U.S. Department of E nergy .)............................................................................... 21
Figure 2.9. Pretreatment effect on cellulose, hemicellulose, and lignin. (Figure credit:Mosier, et a l .) ..........................................................................................................22
Figure 2.10. Structure of cellulose showing the cleavage points for cellulase enzymes.(Figure credit: Abbas.) ........................................................................................ 23
Figure 2.11. Structure o f hemicellulose showing the cleavage points for hemicellulaseenzymes. (Figure credit: Abbas.) ..................................................................... 24
Figure 2.12. Structure of a potential lignin polymer. (Figure credit: Gregory.) .............. 25
Figure 2.13. Cell growth pattern for Melosira nummuloides.(Figure credit: Crawford.) ..................................................................................32
Figure 2.14. Set up o f a simple homogenizer flow path. (Figure credit: Diels.) ............ 36
Figure 2.15. Typical arrangement of an ultrasonic probe device.........................................39
Chapter 3: Materials and Methods
Figure 3.1. Algal Turf Scrubber® on the campus of VIMS.................................................. 47
Figure 3.2. Diagram of the Micro fluidizer processor. (Diagram credit: Micro fluidics,In c .) .......................................................................................................................... 52
Figure 3.3. Shockwave Power Reactor from Hydro Dynamics, Inc. (Photo credit: Hydro Dynamics, Inc.) ..................................................................................................... 54
Chapter 4: Results and Discussion
Figure 4.1. Dark wild algae from VIMS floway.....................................................................68
Figure 4.2. Wild algae from VIMS floway............................................................................. 68
Figure 4.3. Wild algae after processing with Waring® blender............................................69
Figure 4.4. Cellular disruption by homogenization during Trial 2, processed inJuly 2009...................................................................................................................71
Figure 4.5. Cellular disruption by homogenization during Trial 7, processed inJuly 2009...................................................................................................................72
Figure 4.6. Cellular disruption by cavitation during Trial 1, processed inAugust 2009............................................................................................................. 73
Figure 4.7. Cellular disruption by cavitation during Trial 2, processed inSeptember 2009....................................................................................................... 74
Figure 4.8. Cellular disruption by cavitation during Trial 3, processed inOctober 2009............................................................................................................75
Figure 4.9. Rehydrated Spirulina donated by Don Cain........................................................76
v
Figure 4.10. Rehydrated Spirulina purchased from Puritan’s Pride vitamincompany.................................................................................................................. 77
Figure 4.11. Spirulina processed by homogenization...........................................................78
Figure 4.12. Spirulina processed by cavitation......................................................................79
vi
LIST OF TABLES
Chapter 3: Materials and Methods
Table 3.1. Processing parameters for Micro fluidizer® trials.................................................53
Table 3.2. Enzymes used for Mixing, Liquefaction, Fermentation, andSaccharification.........................................................................................................56
Chapter 4: Results and Discussion
Table 4.1. Compositional Analyses of Wild Algae................................................................62
Table 4.2. Mineral Analyses of Wild Algae............................................................................65
Table 4.3. Compositional and Mineral Analyses o f Spirulina............................................. 66
Table 4.4. Carbohydrate Profile - Wild Algae Initial Fermentation Trials........................ 81
Table 4.5. Carbohydrate Profile - Wild Algae Mixing-Liquefaction Trials...................... 82
Table 4.6. Carbohydrate Profile - Wild Algae Fermentation Trials....................................84
Table 4.7. Carbohydrate Profile - Wild Algae Saccharification Trials...............................85
Table 4.8. Carbohydrate Profile - Spirulina Mixing-Liquefaction Trials.......................... 87
Table 4.9. Carbohydrate Profile - Spirulina Fermentation Trials........................................88
Table 4.10. Carbohydrate Profile - Spirulina Saccharification Trials................................ 89
Table 4.11. Carbohydrate Profile for Corn in Fermentation.................................................90
Table 4.12. Fermentation and Saccharification Ethanol Yield - Wild Algae.................... 93
Table 4.13. Fermentation and Saccharification Ethanol Yield - Spirulina........................ 95
Table 4.14. Ethanol Yield of Yellow Dent Corn.................................................................... 96
Table 4.15. Effects of Accellerase 1500 on Wild Algae Glucose and Ethanol Yield 98
Table 4.16. Warm Water Wash Extraction Results for Wild Algae.................................... 99
DEDICATION
I dedicate this thesis to Jonathan, my patient husband.
Thank you for making dinner, keeping our lives in order, and, most importantly, for
believing in me.
ACKNOWLEDGEMENTS
Deep gratitude is owed to many people who assisted in the successful completion of this
Master’s thesis.
I would like to first thank the generous people at VIMS: Dr. Elizabeth Canuel, Dr.
Emmett Duffy, Paul Richardson, and Erin Ferer. It is because of their kindness and their
willingness to share algae that this project could be completed.
Many thanks go to the professors of the Chemistry Department at the College of William
and Mary, especially Dr. Robert Hinkle and Dr. Deborah Bebout for their guidance and
skillful review of items relating to this thesis. Acknowledgement also goes to Dr. Chris
Abelt and Dr. Elizabeth Harbron for their advice at various stages in this process.
I would also like to thank my colleagues at Applied Process Technology International
and the former Delta-T Corporation for the encouragement to pursue this degree and the
flexibility to do so while also working full time. Appreciation especially goes to Mark
Shmorhun, for his skillful review and assistance in editing, and also to Carolyn Kotsol,
for her encouragement.
A big thank you also to Scott Moore for his assistance in processing the algae samples
while with Delta-T. Appreciation is also due to Sid Mundkur, for encouraging me to
pursue my Masters.

My family deserves special thanks for encouragement, support, love, and understanding.
Thank you also to my good friends who have been patient and understanding in this
process. I would also like to specifically thank Brooklynd Saar and Jennifer Inman for
their much-needed encouragement during the writing process.
Words are not enough to express my appreciation for my husband Jonathan. Your
patience, commitment, and love ensured that I did not have to cook dinner for the past
two years!
Finally, acknowledgement is due to the Lord, who is giving me a path for my ambition.
x

PROCESSING AND CONVERSION OF ALGAE TO BIOETHANOL
Chapter 1: Introduction
“We know the country that harnesses the power of clean, renewable energy will lead the
21st century...To truly transform our economy, protect our security, and save our planet
from the ravages of climate change, we need to ultimately make clean, renewable energy
the profitable kind of energy.” - President Barack Obama addressing the Joint Session of
Congress on February 24, 2009.1
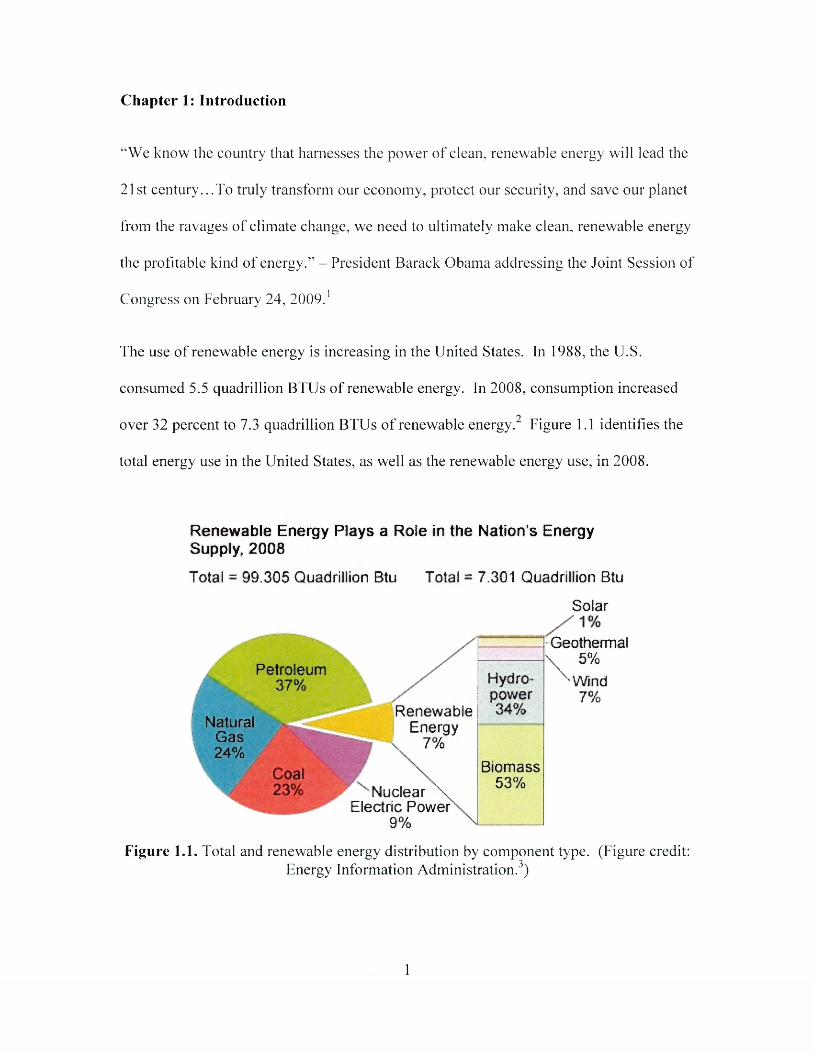
The use o f renewable energy is increasing in the United States. In 1988, the U.S.
consumed 5.5 quadrillion BTUs of renewable energy. In 2008, consumption increased
over 32 percent to 7.3 quadrillion BTUs of renewable energy. Figure 1.1 identifies the
total energy use in the United States, as well as the renewable energy use, in 2008.
Renewable Energy Plays a Role in the Nation’s Energy Supply, 2008
Total = 99.305 Quadrillion Btu Total = 7.301 Quadrillion Btu
Solar
Geothermal\ 5%
X -Wind 7%
Figure 1.1. Total and renewable energy distribution by component type. (Figure credit:Energy Information Administration.3)
Petroleum37% Hydro
power34%Renewable
Energy v 7%
NaturalGas24%
Biomass53%Nuclear \
Electric Power 9%
1
Consumption of biofuels has dramatically increased in the previous two decades, from
127 trillion BTUs in 1988 to 1.4 quadrillion BTUs in 2008.2 As renewable fuel usage has
increased, so has the idea of using new, non-edible feedstocks for fuel production. The
use of algae as a feedstock in particular has been gaining national and international
attention in the past three to four years. Much of this attention has been focused on the
conversion of algae to biodiesel, algae strain development, or algae growth conditions.
Over 150 industrial companies are on a quest for algae commercialization. Companies
such as Solazyme, Solix Biofuels, Sapphire Energy, and OriginOil are only a few o f the
numerous companies that have taken over the spotlight in the race to bring algae-to-fuel
processes into the commercial market.4 Even petroleum companies who once publicly
mocked biofuels are investing heavily in the algae arena. In July of 2009, for instance,
ExxonMobil committed $600 million to biotechnology company Synthetic Genomics in
an effort to speed up the development of algae-based fuels.5
The United States Department of Energy (DOE) provided much of the groundwork for
the research, pilot, and demonstration projects that are being implemented today. From
1978 to 1996 the DOE funded the Aquatic Species Program, which devoted its primary
efforts to the collection, study, and manipulation of oil-rich algae for the purpose of
converting these algae into biodiesel. Even as the program was brought to a close
between 1996 and 1998, the researchers believed that the information acquired through
the program would eventually resurface when the time was right for commercialization of
algae biofuels.6
2

In an effort to stimulate innovation, the federal government has been funding more
projects related to algae in recent months. In January 2010, $80 million from the
American Recovery and Reinvestment Act went to funding two advanced biofuels
• 7projects. The National Alliance for Advanced Biofuels and Bioproducts (NAABB)
received over half of that money to commercialize and create the necessary infrastructure
for algal biofuels to become a reality in the United States.
A search on the conversion of algae to bioethanol brings up far fewer commercial
prospects. The most notable is Florida-based Algenol, which uses closed bioreactors to
cause the algae to release gaseous ethanol into the headspace of the bioreactors where it
o
can be collected. Several patent applications also exist that aim to produce bioethanol
from starch-rich algae strains such as Chlorella vulgaris?
In this research, two environmentally different algae were studied for conversion to
bioethanol: wild algae from the Algal Turf Scrubber® (ATS™) unit operating on the
campus of the Virginia Institute of Marine Science, and the blue-green algae Spirulina,
grown in controlled conditions and typically sold as a nutritional supplement. This
research aims to achieve several goals regarding the production of bioethanol from algae.
These goals include:
1. Evaluate the feasibility of using wild algae grown on the ATS™ as a feedstock
for ethanol production.
2. Evaluate the feasibility of using the blue-green algae Spirulina as a feedstock for
ethanol production.
3
3. Compare the two algal feedstocks in carbohydrate content and ethanol yield using
treatment methods of a corn ethanol facility.
4. Determine if pre-processing techniques will enhance carbohydrate release from
each substrate, thereby increasing the potential for each algae to be used as a
feedstock for ethanol production.
Comparisons between algae strains are of keen interest. Many researchers believe that
only a few algae are suitable for commercial fuel production. Spirulina was chosen due
to its purported high carbohydrate content, a trait which is favorable for a bioethanol
feedstock. Comparisons with the wild algae will provide important insight regarding
feedstock selection.
Chapter 1 References:
1 Remarks of President Barack Obama - As Prepared for Delivery Address to Joint Session of Congress, February 24, 2009 [Online]. The White House. http://www.whitehouse.gov/the_press_office/remarks-of-president-barack-obama- address-to-joint-session-of-congress/ (accessed Mar 26, 2010).
2 Renewable Energy Production and Consumption by Primary Energy Source, 1949- 2008. Annual Energy Review: Renewable Energy, June 26, 2009. Energy Information Administration, http://www.eia.doe.gov/emeu/aer/pdf/pages/secl0_3.pdf (accessed Mar 27, 2010).
3 How much renewable energy do we use? Energy in b r ie f- What everyone should know about energy. Energy Information Administration. 2009.http://tonto.eia.doe.gov/energy_in_brief/renewable_energy.cfm (accessed Mar 6, 2010).
4 Studt, T. Algae Promises Biofuel Solutions. Laboratory Equipment [Online], March 15, 2010. http://www.laboratoryequipment.com/article-cov-Algae-Promises-Biofuel- Solutions-0310.aspx (accessed Mar 16, 2010).
4
5 Mouowad, J. Exxon to Invest Millions to Make Fuel From Algae. The New York Times [Online], July 13, 2009. http://www.nytimes.com/2009/07/14/business/energy- environment/14fuel.html?_r=l (accessed Jul 14, 2009).
6 Sheehan, J.; Dunahay, T.; Benemann, J.; Roessler, P. A Look Back at the U.S. Department o f Energy’s Aquatic Species Program - Biodiesel from Algae. The National Renewable Energy Laboratory. NREL/TP-580-24190. U.S. Department o f Energy. July 1998.n
Lombardi, C. DOE shows interest in algae fuels. Green Tech CNET News. [Online], January 14, 2010. http://news.cnet.com/8301-11128_3-10434830-54.html (accessed Jan 15,2010).
8 Ghelfi, C. Turning algae into ethanol, and gold. Cleantech Group LLC, [Online], June 11, 2008. Web. http://cleantech.com/news/2961/algal-biofuels-algenol-ethanol-solazyme- sonora-mexico (accessed Nov 11, 2009).
9 Ogaki, M., et al. Method of Producing Bio-ethanol. United States Patent Application 20090075353. March 19, 2009.
5
Chapter 2: Background
2.1. Transportation Fuel
The United States is heavily dependent on transportation vehicles. In 2007, the number
o f registered highway vehicles was just over 254 million.1 Using the population estimate
today of 309 million people,2 that is an average of 1.22 people for every vehicle in the
country. The increasing accessibility of personalized transportation is likely to continue
to cause the average person-to-vehicle ratio to decrease.
As the number of vehicles in the United States increases, so too will the demand for
transportation fuel. In 2008, 28 percent of all energy used in the U.S. went to the
transportation sector.3 During this same year, the U.S. consumed approximately 137
billion gallons of gasoline, which equates to approximately 375 million gallons per day.4
In order to fulfill this large demand, the U.S. imports about 57 percent of its total
petroleum from various countries around the world, including Canada, Saudi Arabia,
Mexico, Venezuela, and Nigeria.5
2.1.1. Ethanol as a Renewable Transportation Fuel
In the past 10 years, the biofuel ethanol has re-emerged as an acceptable replacement
fuel. Unlike gasoline from petroleum, ethanol is a renewable fuel produced from
biomass materials. The most common feedstocks for ethanol production today are
carbohydrate- and grain-based, such as corn, sorghum, sugar cane, and sugar beets.6
6
The use of ethanol as a transportation fuel offers many advantages. Studies have found
that greenhouse gas (GHG) emissions are significantly reduced through the use of
ethanol-blended gasoline. In California, New York, and Connecticut, the number of days
that exceeded acceptable smog levels decreased by at least 22 percent since the use of
ethanol/gasoline blends was implemented.7
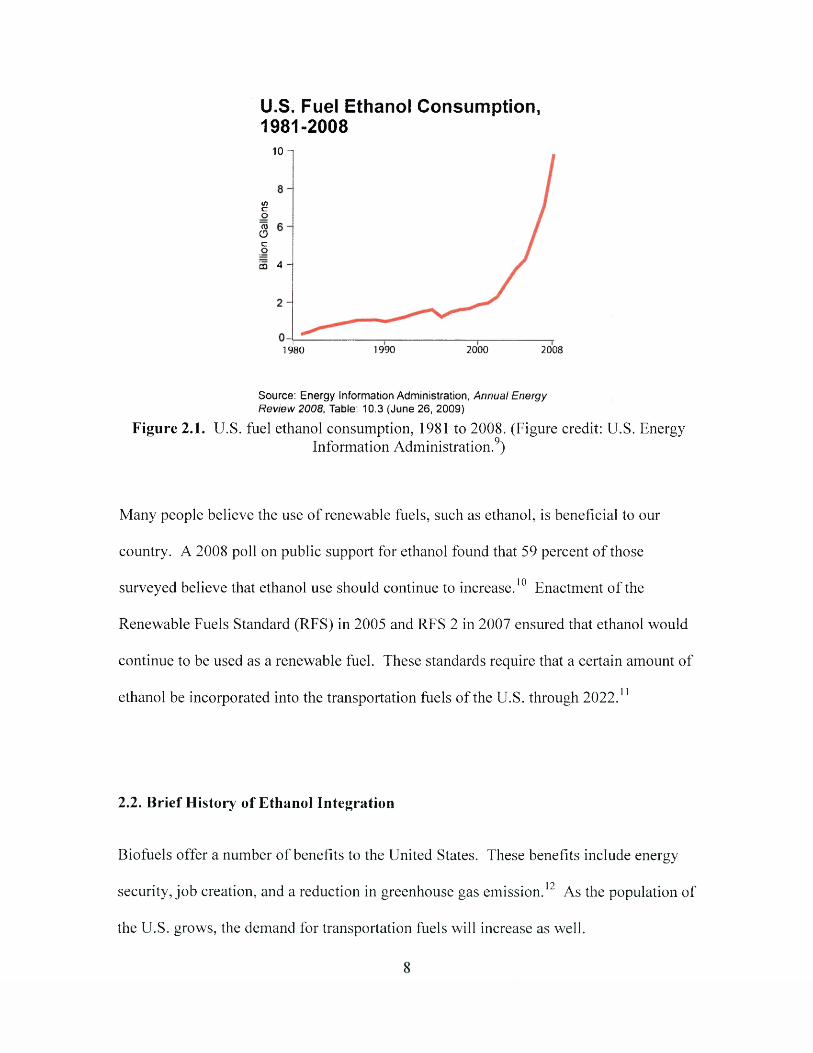
Ethanol has also reduced the U.S. dependence on oil imported from foreign nations.
According to the U.S. Energy Information Administration, fuel ethanol production in
2009 averaged 700,000 barrels per day and is expected to increase to 800,000 barrels per
day in 2010.8 At 700,000 barrels per day, the U.S. produced approximately 255 million
barrels of fuel ethanol in 2009; this is equivalent to 10.7 billion gallons of ethanol, which
is nearly eight percent o f the total transportation gasoline production. Figure 2.1 shows
how fuel ethanol consumption has increased dramatically in the United States since 1981.
7
U.S. Fuel Ethanol Consumption, 1981-2008
10-1
</>coro0coCQ 4 -
20001990 20081980
Source: Energy Information Administration, Annual Energy Review 2008, Table: 10.3 (June 26, 2009)
Figure 2.1. U.S. fuel ethanol consumption, 1981 to 2008. (Figure credit: U.S. EnergyInformation Administration.9)
Many people believe the use of renewable fuels, such as ethanol, is beneficial to our
country. A 2008 poll on public support for ethanol found that 59 percent of those
surveyed believe that ethanol use should continue to increase.10 Enactment o f the
Renewable Fuels Standard (RFS) in 2005 and RFS 2 in 2007 ensured that ethanol would
continue to be used as a renewable fuel. These standards require that a certain amount of
ethanol be incorporated into the transportation fuels of the U.S. through 2022.11
2.2. Brief History of Ethanol Integration
Biofuels offer a number o f benefits to the United States. These benefits include energy
security, job creation, and a reduction in greenhouse gas emission.12 As the population of
the U.S. grows, the demand for transportation fuels will increase as well.
The use of ethanol as fuel began as early as 1826 with the development of an engine that
ran on turpentine and ethanol. Large-scale production of ethanol did not occur until the
early 1900’s with the development of the Model T automobile by Henry Ford. Demand
for fuel during World Wars I and II dramatically increased the amount of ethanol
produced. However, by the 1940’s, oil was less expensive than ethanol, fuel demand
1 Tplummeted, and most production of ethanol ceased.
In the mid-1970’s, the U.S. began to require a reduction in the use of lead in gasoline.
Methyl tert-butyl ether (MTBE), an additive which boosted the octane level o f gasoline
by oxygenation, was used to replace lead. Ethanol was also becoming more widespread
because of its ability to be used as an oxygenate.14
The Clean Air Act Amendments of 1990 required that 39 areas around the country use
oxygenated fuel, which increased the demand for MTBE and ethanol. The Energy Policy
Act followed shortly after in 1992, providing additional ethanol blend options and
requiring that certain vehicle fleets have alternative fuel vehicles. This Act defined
alternative vehicles as those which operated on at least 85 percent alternative fuel, such
as ethanol, created from biomass sources. The benefits of ethanol over MTBE were
becoming more noticeable as well, after studies found that MTBE was contaminating
sources of drinking water. By 1999, a ban on MTBE was imposed in several states and
now most states have banned its use.13,14
The Energy Policy Act of 2005 set up the first Renewable Fuels Standard (RFS) as a way
to ensure that ethanol was used in domestic transportation fuel. This first RFS called for
renewable fuels to constitute 4 billion gallons of fuel in 2006, with the amount increasing
9
to 7.5 billion gallons in 2012. A requirement that 250 million gallons of cellulosic
ethanol be produced by 2013 was also included in the standard. Grant and loan programs
were created specifically for cellulosic and sugar ethanol to spur the development o f new
technologies.15
In 2007, amendments were made to the RFS based on the newly signed Energy
Independence and Security Act. The goal of this Act was to increase domestic
production of transportation fuels to reduce the dependence of the United States on
foreign oil imports. The amendments of the 2007 RFS 2 resulted in a doubling in the
amount o f ethanol produced, to a total of 15.2 billion gallons by 2012 and 36 billion
gallons by 2022.16
The 2007 RFS 2 delineated that a certain portion of ethanol be produced from advanced
biofuels. According to the definition in Section 201 of the Act, advanced biofuels are
those that are not derived from corn starch but from renewable biomass which reduces
greenhouse gas emissions by 50 percent.16 Of the 36 billion gallons of ethanol required in
2022, 15 billion gallons are able to be derived from corn starch and 21 billion gallons
must be derived from advanced biofuels.16
For 2010, 950 million gallons of advanced biofuel are required with 100 million gallons
of that as cellulosic biofuel.16 However, economic conditions and technology banders
have prevented cellulosic ethanol plants from fulfilling this requirement. As of February
2010, only 6.5 million gallons were in production, and with no promising commercial -
scale plants slated for the remainder o f the year, the EPA waived the remaining 93.5
million gallon requirement.17
10
2.3. Achieving the Goals of the Renewable Fuels Standard
By 2022, the RFS requires that 36 billion gallons of renewable fuels be used throughout
the United States.16 How will the U.S. reach this goal?
For several years now, biofuels have been categorized as being part of certain
“generations.” First generation biofuels are considered to be those that are produced
from food crops such as grains, sugar beets, sugar cane, and oil seeds, while second
generation biofuels are those produced from ligno-cellulosic biomass which cannot be
1 ftused as food, such as wood residues, straws, and grasses. Algal biofuels, green
gasoline, green diesel, and green jet fuel have been identified as third generation
biofuels.19
2.3.1. First Generation Biofuels
Corn has been the dominant feedstock for the production of first generation biofuels in
the U.S, and the primary biofuel has been ethanol. Many varieties of com exist, but the
variety used most often in the ethanol industry is yellow dent corn. As this corn kernel
dries, a dent in the top face of the corn appears as a result o f evaporation of water within
the kernel. Research on this variety gives the average kernel composition as 71.7 percent
starch, 9.5 percent protein, 4.3 percent fat, and 9.5 percent fiber on a dry basis. Moisture
accounts for an average of 16 percent o f the kernel weight.20
11
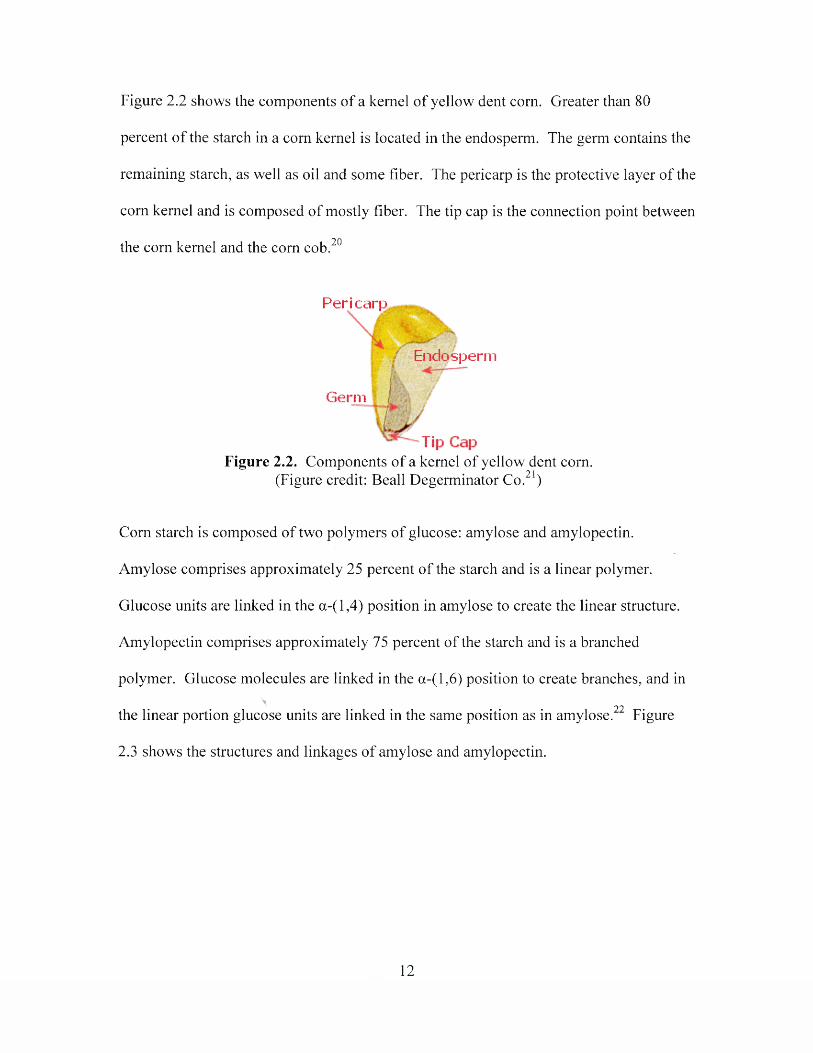
Figure 2.2 shows the components of a kernel of yellow dent com. Greater than 80
percent of the starch in a corn kernel is located in the endosperm. The germ contains the
remaining starch, as well as oil and some fiber. The pericarp is the protective layer of the
com kernel and is composed of mostly fiber. The tip cap is the connection point between
the corn kernel and the com cob.20
Peri carp
Endosperm
Germ
Figure 2.2. Components of a kernel of yellow dent com.• • • 91(Figure credit: Beall Degerminator Co 7 )
Com starch is composed of two polymers of glucose: amylose and amylopectin.
Amylose comprises approximately 25 percent of the starch and is a linear polymer.
Glucose units are linked in the a-(l,4) position in amylose to create the linear structure.
Amylopectin comprises approximately 75 percent of the starch and is a branched
polymer. Glucose molecules are linked in the a-(l,6) position to create branches, and iny
• • 99the linear portion glucose units are linked in the same position as in amylose. Figure
2.3 shows the structures and linkages of amylose and amylopectin.
12
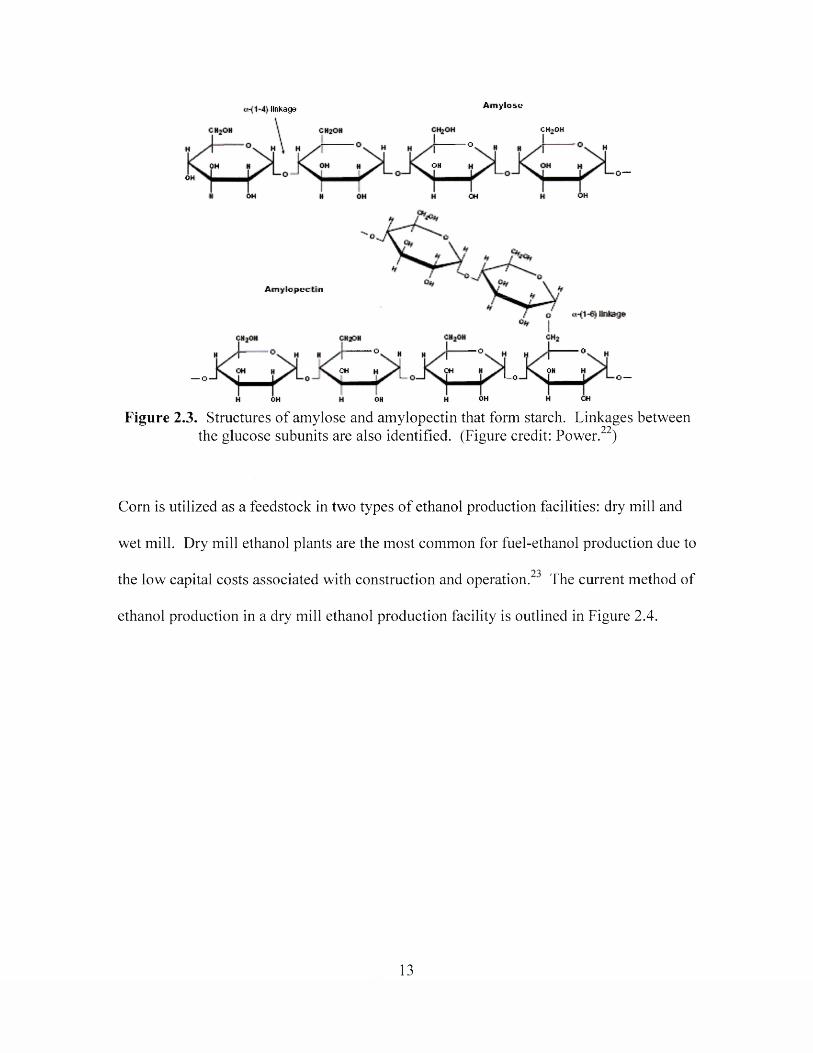
linkage AmyloseCH>OH
— OOHOH
o—OH
OHOH OH
A m y lo p e c tin
o 0o
CH CH OHl_0 O —— OOH CHOH OH
Figure 2.3. Structures of amylose and amylopectin that form starch. Linkages between the glucose subunits are also identified. (Figure credit: Power.22)
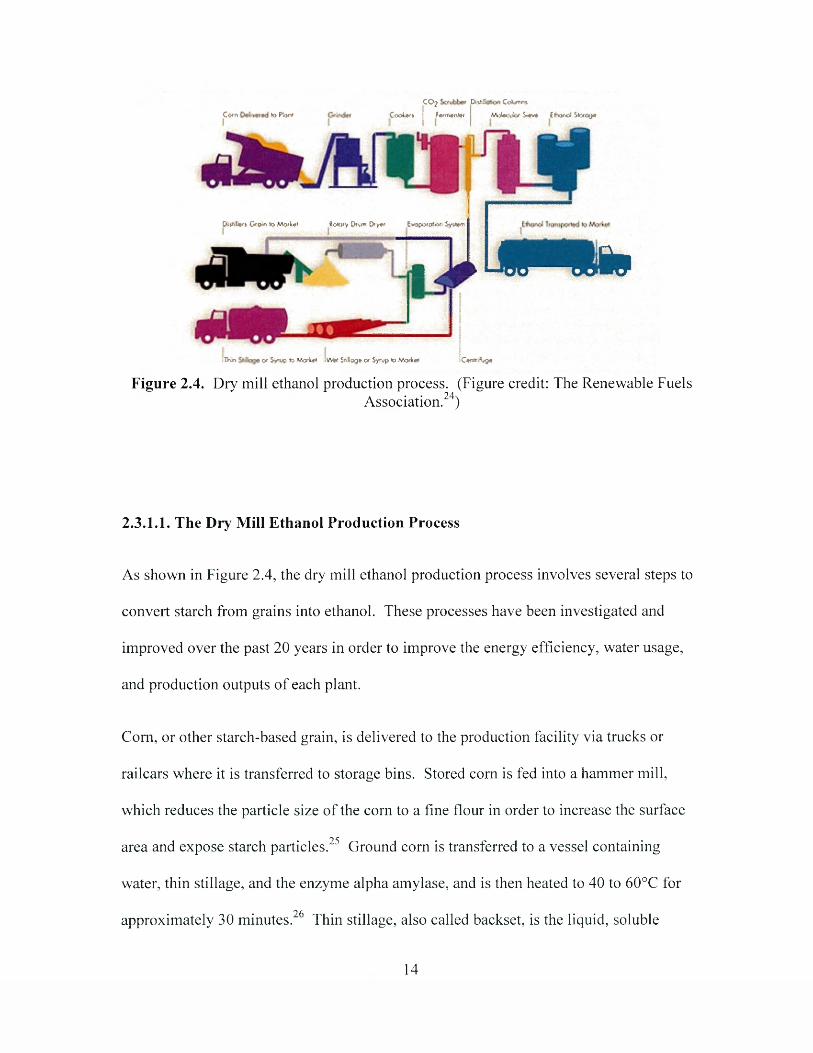
Corn is utilized as a feedstock in two types of ethanol production facilities: dry mill and
wet mill. Dry mill ethanol plants are the most common for fuel-ethanol production due to
the low capital costs associated with construction and operation. The current method of
ethanol production in a dry mill ethanol production facility is outlined in Figure 2.4.
13
gc>2 &t*&3C4M«>»C««> to P4w» C o o W i ] f«or«*nl*< /.■••>.: . . iv S~twv Efcoftol S ttfo g*
0 i|hl#fj Gr<x* to M?»M ScAiiy Ch*m &>*» tMjpo>o**>n Antoni
tljpmp/ I “ OU w w
iTKn o> Sirop to «o<4#« iWW S«tag» e» Sy.p to Morfu* C*«r*' g*
Figure 2.4. Dry mill ethanol production process. (Figure credit: The Renewable FuelsAssociation.24)
2.3.1.1. The Dry Mill Ethanol Production Process
As shown in Figure 2.4, the dry mill ethanol production process involves several steps to
convert starch from grains into ethanol. These processes have been investigated and
improved over the past 2 0 years in order to improve the energy efficiency, water usage,
and production outputs of each plant.
Corn, or other starch-based grain, is delivered to the production facility via trucks or
railcars where it is transferred to storage bins. Stored corn is fed into a hammer mill,
which reduces the particle size of the corn to a fine flour in order to increase the surface
area and expose starch particles.25 Ground com is transferred to a vessel containing
water, thin stillage, and the enzyme alpha amylase, and is then heated to 40 to 60°C for
9A • • •approximately 30 minutes. Thin stillage, also called backset, is the liquid, soluble
14
portion of the distillation column bottoms produced after centrifugation from further
downstream in the process. The thin stillage provides a portion of nutrients and a
significant amount of heat to the mixture. Alpha amylase is used to reduce the viscosity
by cleaving starch molecules into short-chain dextrins. This step is called mashing or
• 9 Smixing, and the resultant mixture o f water, corn, and backset is called mash.
After mixing, the water and corn mixture will pass through a jet cooker which uses steam
to ensure that starch molecules have been completely gelatinized and exposed for
hydrolysis by the alpha amylase. Jet cooking can raise the temperature of the mash to as
high as 120°C. After cooking, the mash is transferred to another vessel for the
liquefaction step, which operates at temperatures of 85 to 90°C for 90 to 120 minutes.
This step continues the process of cleaving starch molecules into dextrins in order to
prepare the mash for fermentation. Additional alpha amylase is added in this step
because the temperature of the jet cooker denatures the enzyme, rendering it ineffective.26
After liquefaction is complete, the mash is cooled to 60 to 65 °C and transferred to a
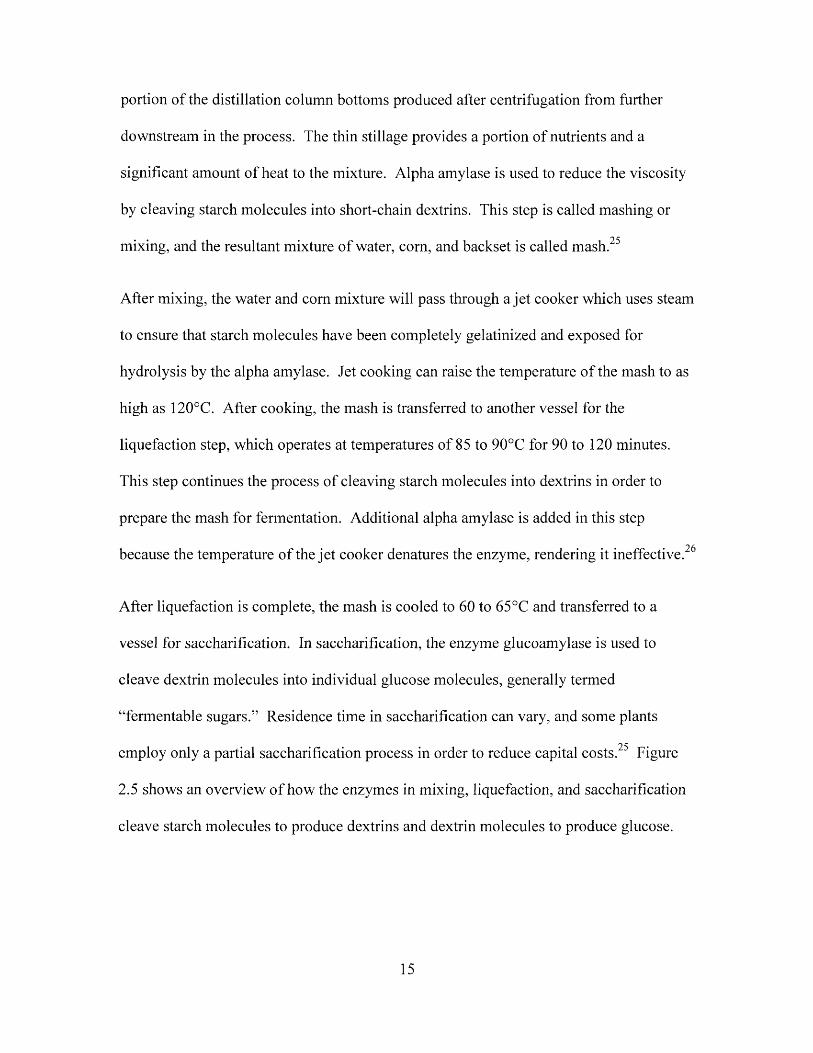
vessel for saccharification. In saccharification, the enzyme glucoamylase is used to
cleave dextrin molecules into individual glucose molecules, generally termed
“fermentable sugars.” Residence time in saccharification can vary, and some plants
Cemploy only a partial saccharification process in order to reduce capital costs. Figure
2.5 shows an overview o f how the enzymes in mixing, liquefaction, and saccharification
cleave starch molecules to produce dextrins and dextrin molecules to produce glucose.
15
STARCHa m y lo s e ♦ a m y lo p e c tin
GELATINIZATIONHeat anti moisture solubilize slarch
AMYLOSE
I 1 SlunyCooking
niLust r )
rt-xnvtoisa *
LIQUEFACTIONProduction of dextinrs and a-limit dsxtiins Dy ti -a m y ia s a
AMYLOPECTIN
DEXTRINS
or-am ylaseendoenzymehydrolyzes random a (1-4) bonds
n -LIM IT DEXTRINS
Glucomyldse q _ o o O - O O Pullularme O >cK: 5>0Idobmching) ) rS )
Giucoamytosea(l-4), a(1-6) bonds
Figure 2.5. Modes of operation for alpha amylase (a-amylase) and glucoamylase in the reduction of starch to dextrins and fermentable sugars. (Figure credit: Power.22)
Saccharified mash is cooled to 35°C and transferred to a fermentation vessel.
Fermentations are generally run as batches for 48 to 72 hours. The yeast Saccharomyces
cerevisiae is the most commonly used strain for production of ethanol from glucose in
fermentation.25 Nutrients such as urea, zinc, and magnesium are often added to provide
the yeast with the proper nitrogen and mineral balance to maintain cell growth and
health.27
Ethanol is produced from glucose in the molar ratio shown in Equation 1. Carbon
dioxide produced is collected and cleaned by scrubbing with water. The cleaning process
16
removes ethanol vapors that may have escaped with the gas. Clean carbon dioxide is
either sold or vented to the atmosphere.25
C6Hi20 6 -> 2 C2H5OH + 2 C 0 2 [Equation l ]22
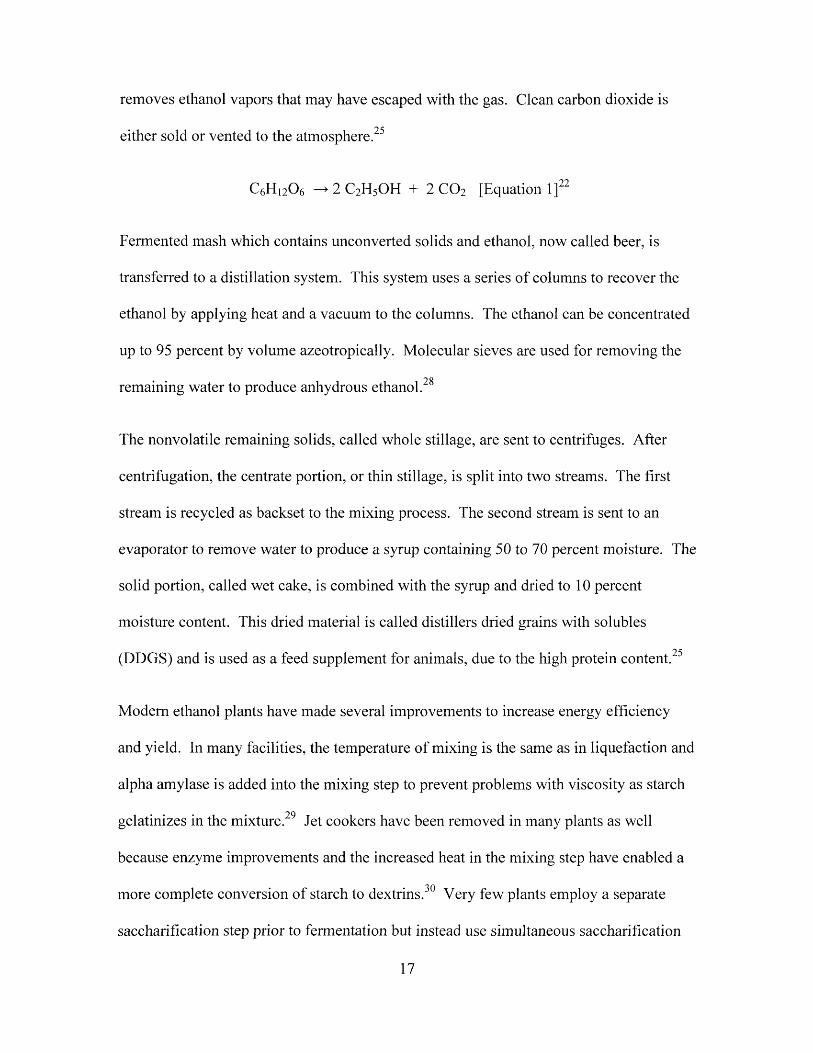
Fermented mash which contains unconverted solids and ethanol, now called beer, is
transferred to a distillation system. This system uses a series of columns to recover the
ethanol by applying heat and a vacuum to the columns. The ethanol can be concentrated
up to 95 percent by volume azeotropically. Molecular sieves are used for removing the
• 9 Rremaining water to produce anhydrous ethanol.
The nonvolatile remaining solids, called whole stillage, are sent to centrifuges. After
centrifugation, the centrate portion, or thin stillage, is split into two streams. The first
stream is recycled as backset to the mixing process. The second stream is sent to an
evaporator to remove water to produce a syrup containing 50 to 70 percent moisture. The
solid portion, called wet cake, is combined with the syrup and dried to 10 percent
moisture content. This dried material is called distillers dried grains with solubles
9 (DDGS) and is used as a feed supplement for animals, due to the high protein content.
Modem ethanol plants have made several improvements to increase energy efficiency
and yield. In many facilities, the temperature of mixing is the same as in liquefaction and
alpha amylase is added into the mixing step to prevent problems with viscosity as starch
• • • • 90gelatinizes in the mixture. Jet cookers have been removed in many plants as well
because enzyme improvements and the increased heat in the mixing step have enabled a
more complete conversion of starch to dextrins. Very few plants employ a separate
saccharification step prior to fermentation but instead use simultaneous saccharification
17
and fermentation (SSF), which occurs at a temperature between 31 and 34°C. Cleavage
of glucose molecules is steadier in SSF and as a result the yeast is able to use the
molecules more efficiently for conversion to ethanol. Fewer unwanted fermentation by
products such as glycerol and acetaldehyde are produced, and inhibition of the
glucoamylase from high glucose formation is reduced.25,26
2.3.I.2. The Wet Mill Ethanol Production Process
Wet milling is generally used to extract more of the individual components of corn from
each kernel. These components are often sold as individual products to various markets.
25Such products include: gluten feed, gluten meal, corn steep liquor (CSL), germ, and oil.
A flow diagram of the wet milling process is shown in Figure 2.6. The wet milling
process begins by steeping the com kernels in water and sulfur dioxide (0.1 - 0 .2 percent)
at 50°C for 22 to 50 hours. Sugar coming in with the corn kernels is converted to lactic
acid by bacteria, and the lactic acid and sulfur dioxide soften the corn kernel. The
moisture content of the kernel increases to approximately 45 percent during this process
as well, which aids in the softening process.25
18
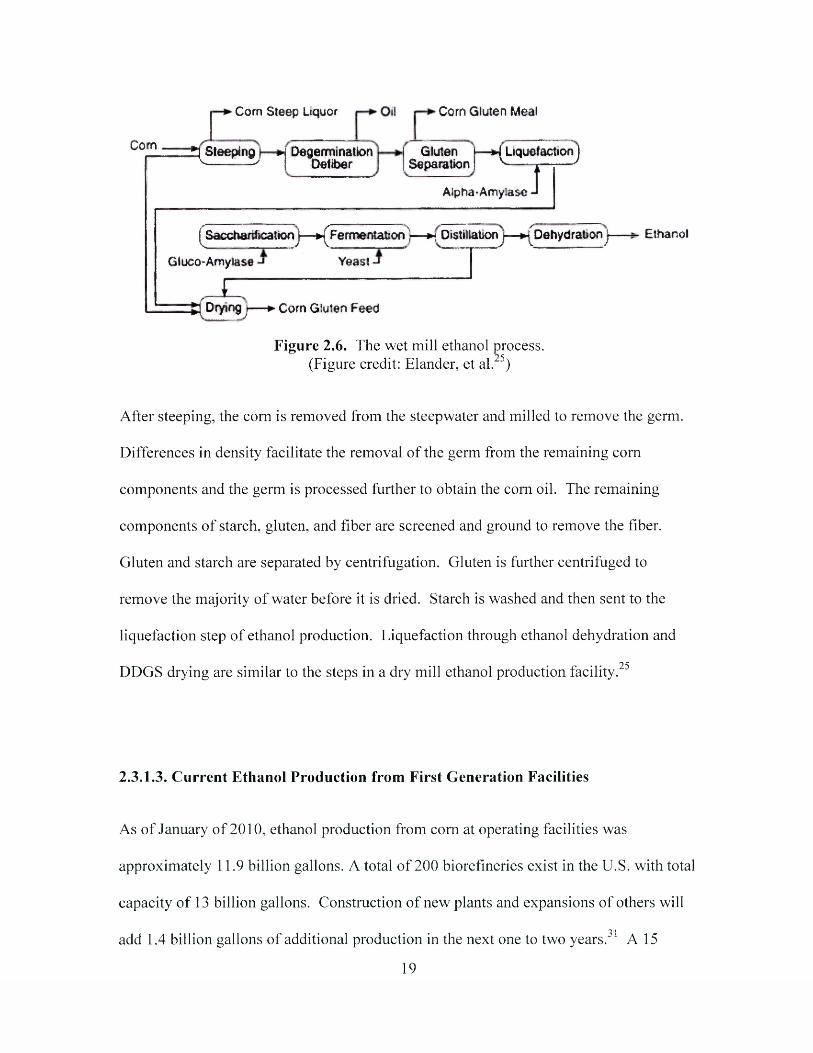
Com
Com Steep Liquor
3 Steeping |— ►> Degermination v ' Oefiber
Corn Gluten Meal
Gluten — *4 Liquefaction JSeparation v r JTAipha-Amyiaso
( Saccharifkationj- ^F e rm e n ta tio n )— ^'D istilla tion j— ^Dehydration j -
Gluco-Amylase ^ Yeast j
I
Ethanol
^ D ryingj— ► Corn Gluten Feed
Figure 2.6. The wet mill ethanol process. (Figure credit: Elander, et al. 5)
After steeping, the com is removed from the steepwater and milled to remove the germ.
Differences in density facilitate the removal of the germ from the remaining corn
components and the germ is processed further to obtain the com oil. The remaining
components of starch, gluten, and fiber are screened and ground to remove the fiber.
Gluten and starch are separated by centrifugation. Gluten is further centrifuged to
remove the majority of water before it is dried. Starch is washed and then sent to the
liquefaction step of ethanol production. Liquefaction through ethanol dehydration and
DDGS drying are similar to the steps in a dry mill ethanol production facility. 25
2.3.I.3. Current Ethanol Production from First Generation Facilities
As of January o f 2010, ethanol production from com at operating facilities was
approximately 11.9 billion gallons. A total of 200 biorefineries exist in the U.S. with total
capacity of 13 billion gallons. Construction of new plants and expansions of others will
T 1add 1.4 billion gallons of additional production in the next one to two years. A 15
19
billion gallon goal for ethanol production from starch was set for 2015. With the
potential production capacity available now, however, it appears that the designated 15
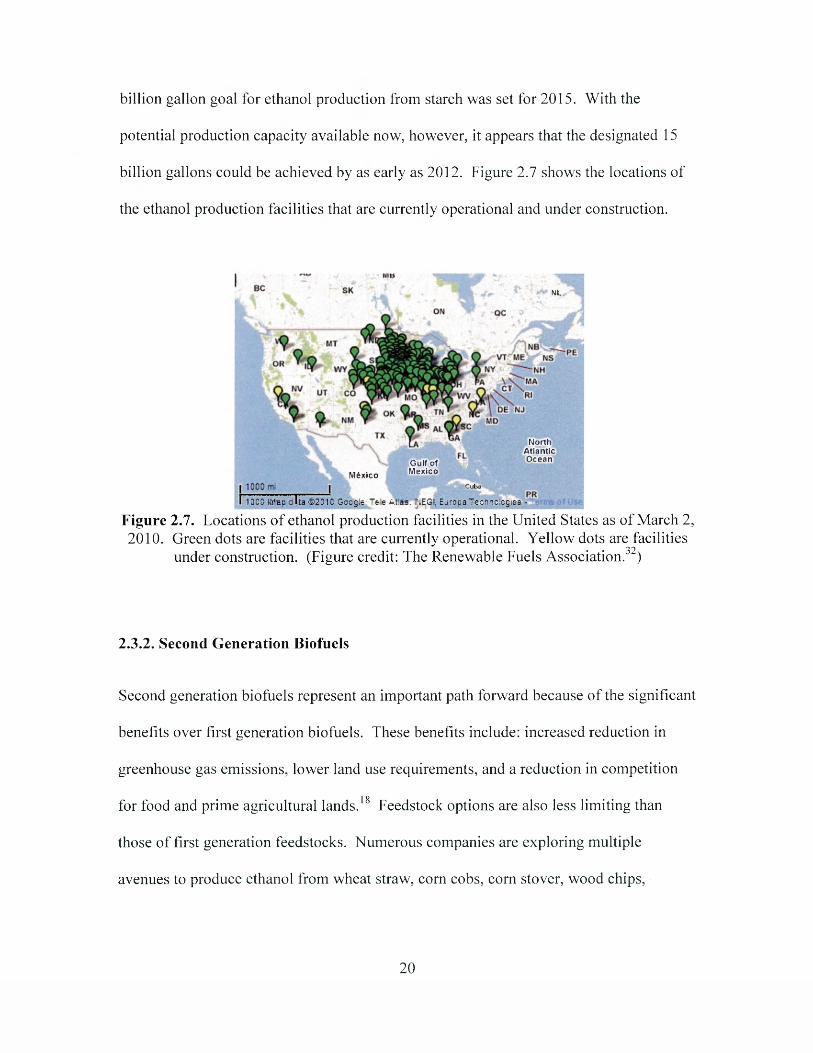
billion gallons could be achieved by as early as 2012. Figure 2.7 shows the locations of
the ethanol production facilities that are currently operational and under construction.
Gulf of M exicoM ex ico
Cuba
M
NorthA tla n ticO cean
1 CCD Hitap dIta ©2 CIO Gcog.e, e e Atlas. ItiEGI, EurcpaTechnologies -
Figure 2.7. Locations of ethanol production facilities in the United States as of March 2, 2010. Green dots are facilities that are currently operational. Yellow dots are facilities
under construction. (Figure credit: The Renewable Fuels Association.32)
2.3.2. Second Generation Biofuels
Second generation biofuels represent an important path forward because of the significant
benefits over first generation biofuels. These benefits include: increased reduction in
greenhouse gas emissions, lower land use requirements, and a reduction in competition
for food and prime agricultural lands. 18 Feedstock options are also less limiting than
those of first generation feedstocks. Numerous companies are exploring multiple
avenues to produce ethanol from wheat straw, corn cobs, corn stover, wood chips,
20
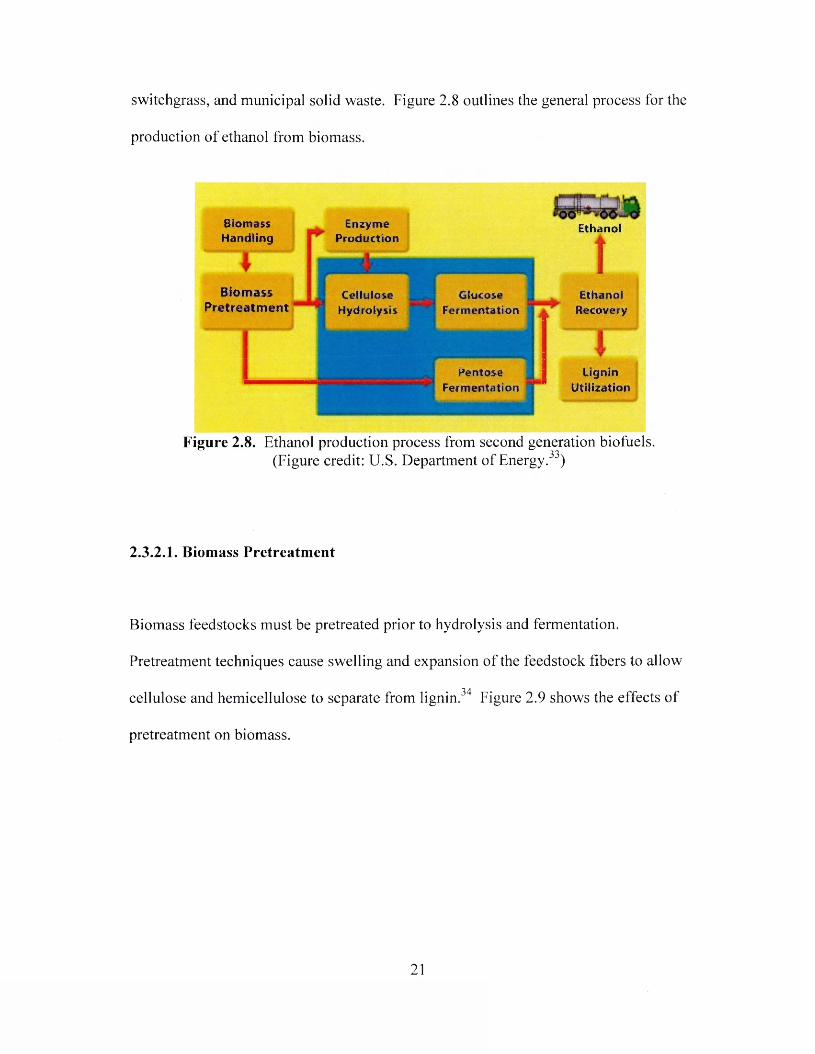
switchgrass, and municipal solid waste. Figure 2.8 outlines the general process for the
production of ethanol from biomass.
Ethanol
Biomass Pretreatment
CelluloseHydrolysis
GlucoseFermentation
E th a n o lR e co v e r y
PentoseFermentation
UgninUtilization
BiomassHandling
EnzymeProduction
Figure 2.8. Ethanol production process from second generation biofuels. (Figure credit: U.S. Department of Energy.33)
2.3.2.1. Biomass Pretreatment
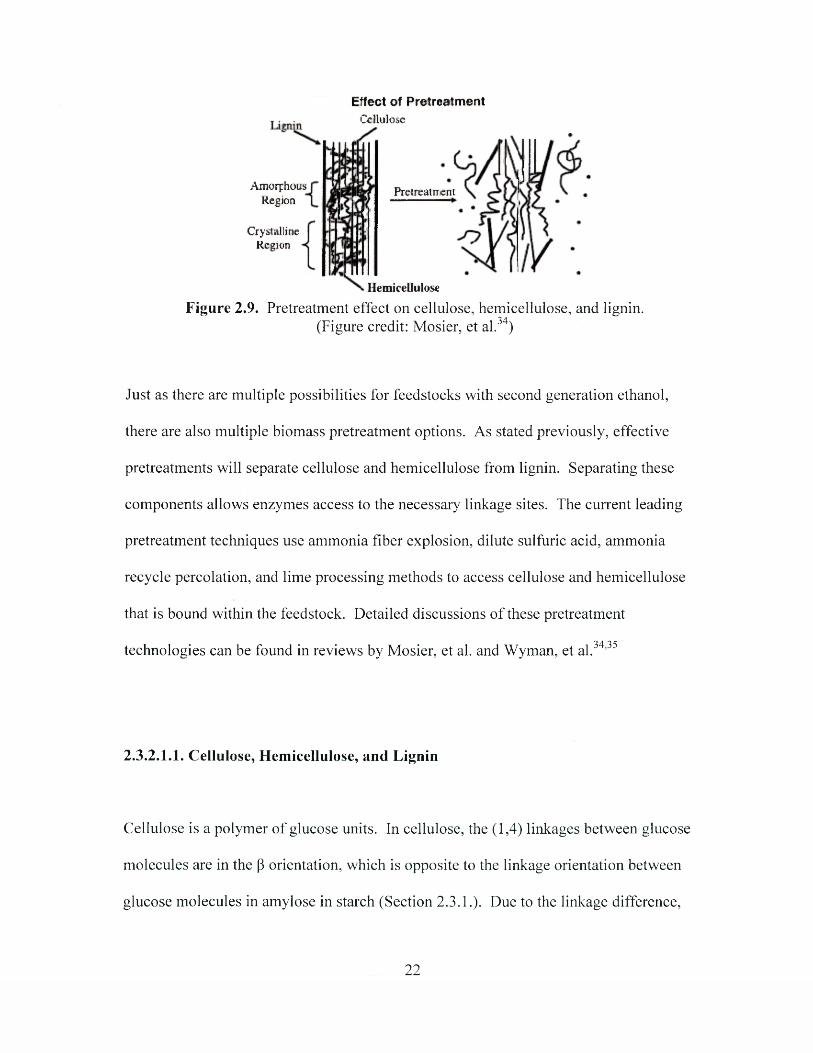
Biomass feedstocks must be pretreated prior to hydrolysis and fermentation.
Pretreatment techniques cause swelling and expansion of the feedstock fibers to allow
cellulose and hemicellulose to separate from lignin.34 Figure 2.9 shows the effects of
pretreatment on biomass.
21
Effect of PretreatmentCellulose
AmorphousRegion
Pretreaiment
CrystallineR eg ion
HemiceUuloseFigure 2.9. Pretreatment effect on cellulose, hemicellulose, and lignin.
(Figure credit: Mosier, et al.34)
Just as there are multiple possibilities for feedstocks with second generation ethanol,
there are also multiple biomass pretreatment options. As stated previously, effective
pretreatments will separate cellulose and hemicellulose from lignin. Separating these
components allows enzymes access to the necessary linkage sites. The current leading
pretreatment techniques use ammonia fiber explosion, dilute sulfuric acid, ammonia
recycle percolation, and lime processing methods to access cellulose and hemicellulose
that is bound within the feedstock. Detailed discussions of these pretreatment
technologies can be found in reviews by Mosier, et al. and Wyman, et al.34,35
2.3.2.I.I. Cellulose, Hemicellulose, and Lignin
Cellulose is a polymer of glucose units. In cellulose, the (1,4) linkages between glucose
molecules are in the j3 orientation, which is opposite to the linkage orientation between
glucose molecules in amylose in starch (Section 2.3.1.). Due to the linkage difference,
22
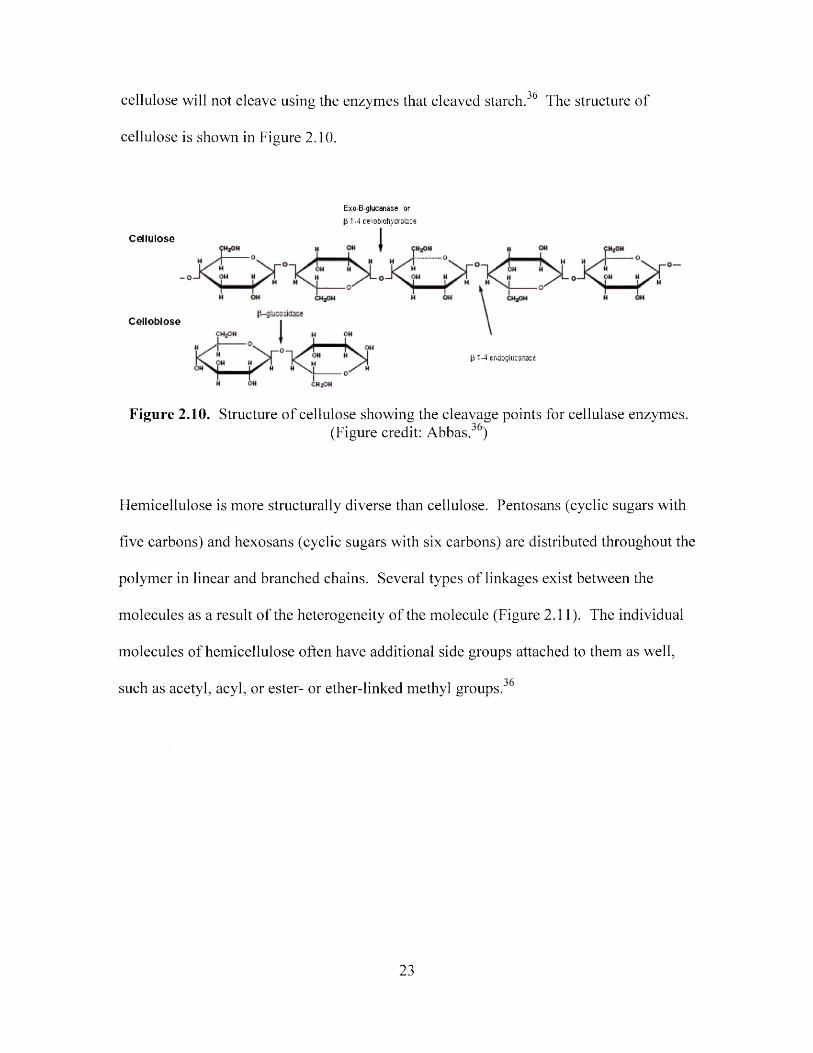
cellulose will not cleave using the enzymes that cleaved starch.36 The structure of
cellulose is shown in Figure 2.10.
Cellulose
Celioblose
Figure 2.10. Structure o f cellulose showing the cleavage points for cellulase enzymes.(Figure credit: Abbas. )
Hemicellulose is more structurally diverse than cellulose. Pentosans (cyclic sugars with
five carbons) and hexosans (cyclic sugars with six carbons) are distributed throughout the
polymer in linear and branched chains. Several types o f linkages exist between the
molecules as a result of the heterogeneity of the molecule (Figure 2.11). The individual
molecules of hemicellulose often have additional side groups attached to them as well,
such as acetyl, acyl, or ester- or ether-linked methyl groups.
E x o -B -g lu c a n a se o rp 1 -4 celQbiohydrotae
o
(3 1 -4 e n d o g lu c a 'a ie
23
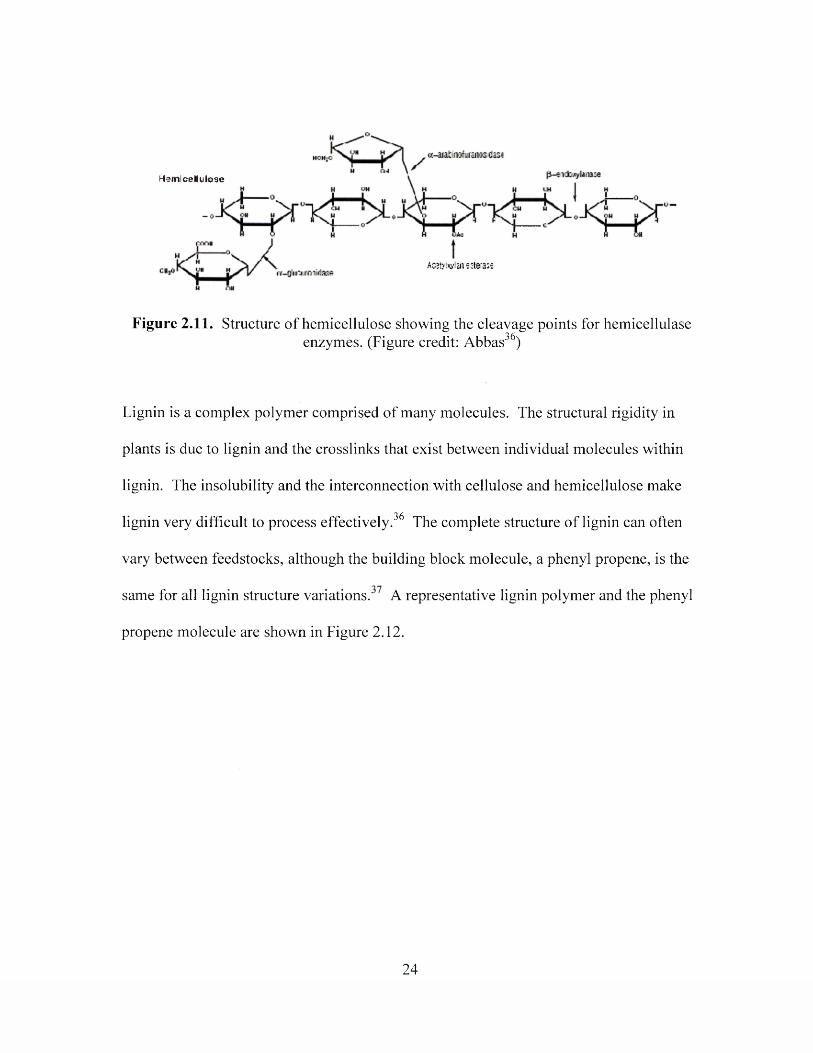
H a m ! c e l l u l o s e
A ratylw lsn e :te 'a s e
Figure 2.11. Structure of hemicellulose showing the cleavage points for hemicellulaseenzymes. (Figure credit: Abbas36)
Lignin is a complex polymer comprised of many molecules. The structural rigidity in
plants is due to lignin and the crosslinks that exist between individual molecules within
lignin. The insolubility and the interconnection with cellulose and hemicellulose make
lignin very difficult to process effectively.36 The complete structure o f lignin can often
vary between feedstocks, although the building block molecule, a phenyl propene, is the
same for all lignin structure variations. A representative lignin polymer and the phenyl
propene molecule are shown in Figure 2.12.
24
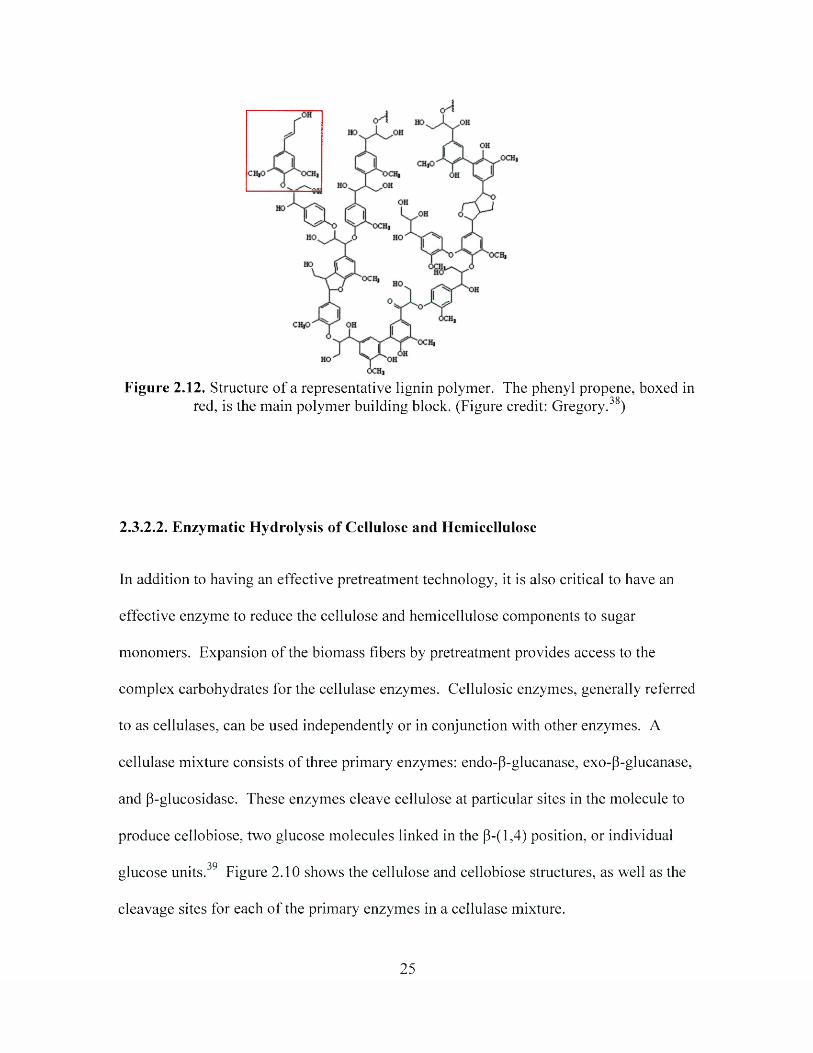
Figure 2.12. Structure of a representative lignin polymer. The phenyl propene, boxed in red, is the main polymer building block. (Figure credit: Gregory.38)
2.3.2.2. Enzymatic Hydrolysis of Cellulose and Hemicellulose
In addition to having an effective pretreatment technology, it is also critical to have an
effective enzyme to reduce the cellulose and hemicellulose components to sugar
monomers. Expansion of the biomass fibers by pretreatment provides access to the
complex carbohydrates for the cellulase enzymes. Cellulosic enzymes, generally referred
to as cellulases, can be used independently or in conjunction with other enzymes. A
cellulase mixture consists of three primary enzymes: endo-p-glucanase, exo-{3-glucanase,
and p-glucosidase. These enzymes cleave cellulose at particular sites in the molecule to
produce cellobiose, two glucose molecules linked in the p-(l ,4) position, or individual
QQglucose units. Figure 2.10 shows the cellulose and cellobiose structures, as well as the
cleavage sites for each of the primary enzymes in a cellulase mixture.
25
Hemicellulose enzymes, generally referred to as hemicellulases, also contain a mixture of
enzymes. A larger number o f different enzymes are needed for hemicellulases because of
the increased heterogeneity of the molecule. The substituent enzymes include a-
arabinofuranosidase, P-endoxylanase, acetylxylanase esterase, and a-glucuronidase. The
cleavage points for each of these enzymes are dependent on the molecules in the
hemicellulose and the side groups attached to the respective sugar molecules.36 In the
structure of hemicellulose in Figure 2.11, the cleavage points for the various
hemicellulase enzymes are shown.
2.3.2.3. Glucose and Pentose Fermentation
Production o f ethanol from glucose by the yeast Saccharomyces cerevisiae, or brewer’s
yeast, has been known for hundreds of years. Once cellulose is degraded to glucose S.
cerevisiae becomes a candidate fermentative yeast for converting cellulose to ethanol.36
Ethanol production from pentose, sugar molecules with five carbons, has been a greater
challenge. Much research has been completed in the past 10 years to find organisms
which can efficiently produce ethanol by utilizing pentoses such as xylose. Genetic
engineering of bacteria strains, such as Escherichia coli and Klebsiella oxytoca, for this
purpose has succeeded. Bacterial strains that can utilize numerous sugars are especially
attractive to the ethanol market.40 Fermentation of glucose and pentoses in one reaction
vessel would provide a substantial cost and time savings relative to many proposed
methods in which glucose fermentation and pentose fermentation are separate processes.
26
2.3.2.4. Current Cellulosic Ethanol Production Facilities
In 2009, thirteen companies had construction plans for pilot- or commercial-scale
cellulosic ethanol plants. The feedstocks choices varied depending on the location of the
facility. The specialty of each company determined the pretreatment technology. The
companies Mascoma, Blue-Fire Ethanol, and Range Fuels are converting woody biomass
and forest residues to ethanol. Abengoa and Pacific Ethanol are using barley and wheat
straws, as well as switchgrass. Fulcrum Bioenergy is converting municipal solid waste,
and corn cobs are the feedstock of choice for Poet.41 Many of these plants are still in the
evaluation stage, trying to reduce their operation costs and increase yield.
2.3.3. Third Generation Biofuels
Third generation biofuels encompass many alternate forms of fuels, as noted from the
previous definition in section 2.3, but algae biofuels have received the most publicity in
recent years. Biodiesel research,42 genetic engineering and strain development,43 and
optimal growth environments44 are all being discussed and debated in conferences,
universities, and news articles around the globe.
27
2.3.3.I. Algal Biofuels
Consideration o f algae as a potential fuel source is not a new idea. The seemingly recent
interest in biofuels from algae traces its roots back to the 1970’s. When the oil crises in
the early and mid-1970’s hit the United States, then-president Jimmy Carter’s
Administration initiated a new federal laboratory in Colorado dedicated to energy. This
laboratory was designed to research various forms of solar energy, including that from
plant life, with the purpose of developing domestic transportation fuels. It is out of this
laboratory that the Aquatic Species Program (ASP) arose.45
For nearly 20 years, the ASP devoted teams of skilled scientists to the collection,
isolation, and characterization of algae strains. Algae were selected for various purposes:
high oil content, ability to survive harsh climates such as high pH or salinity, and
temperature tolerance. Out of nearly 3000 organisms collected, 300 were selected to
analyze the internal enzymes, genetic codes, mass-production practices, and production
costs.45
The focus of the program shifted in 1982, from hydrogen fuel production to biodiesel
production. As a result, much of the more recent research has stemmed from this early
endeavor into using algal oils for biodiesel. Funding was cut for the program in 1996,
and most of the research was abandoned for the more economical research into ethanol
from corn and biomass. The remaining algae were moved to the University of Hawaii,
and many are still available to researchers today 45
For many companies today, research on algae includes work on improving the oil content
and altering the algae to produce as much oil as possible in a shorter amount of time. A
28
few companies have started to study the carbohydrate profiles of algae. Algenol,
mentioned briefly in Chapter 1, is one company in particular that recognizes the
importance of using algal carbohydrates. Starting with a natural strain of algae, scientists
genetically refined the algae to tolerate high temperature and high salinity environments.
Algae then use internal enzymes to convert carbohydrates to ethanol in adverse
46environments.
Several recent patent applications exist on biofuel production using algae. Many include
methods to extract the carbohydrates from the algae, such as alkali and acid soaking,
extreme heating, or freezing.47,48 Most of these patents and applications also identify
preferred strains for biofuel production as those which are high in carbohydrates, such as
the strain Chlorella vulgaris49 or genetically modified cyanobacteria.50
Some scientists are worried about the potential effects of a genetically modified algae
strain accidentally being released into the environment and the subsequent effects on the
surrounding ecosystem .51 Discussions about naturally-occurring, or wild, algae have
been sparse. However, if wild algae could be used successfully as an alternative ethanol
feedstock, many of the fears of conservationists, ecologists, and the easily-swayed citizen
could be alleviated.
29
2.3.3.1.1. Wild Algae and the Algal Turf Scrubber®
Natural growth o f algae for the purpose of water remediation has been extensively
studied by numerous individuals. Much of this research began with the development of
the Algal Turf Scrubber® (ATS™) in the mid-1980’s by Dr. Walter Adey .52
The ATS™ uses filamentous algae to capture nutrients from polluted waters and
essentially “scrub” the water.53 Studies of ATS™ units have been completed on
agricultural and manure effluent sites operating in Maryland and Florida. Results have
shown that the algae are capable o f removing 50 to 90 percent of nitrogen and
phosphorus of the incoming streams.54,55,56 These minerals are utilized by the algal
biomass for growth of cellular components. Routine harvesting of the biomass allows for
fresh algal growth and continued nutrient removal. Recovered biomass can be used as an
addition to soil, a natural fertilizer, a high-protein cattle feed supplement, and potentially
as a feedstock for biofuel production.57
Algal species present on the ATS™ units can vary depending on the water source. Adey
identified several species o f filamentous algae and diatoms in his early ATS™ work.
These included the algae Cladorphora, Spirogyra, Enteromorpha, and Stigeoclonium,
and the diatoms Eunotia and Melosira. 54
As the idea to use algae for biofuels has become more widely known, the uses for the
ATS™ have also increased. Algae grown on the ATS™ can be harvested and used as a
feedstock for biofuels. At least three pilot-scale systems exist on college campuses: one
at the University of Maryland, one at the University of Arkansas, and one at the Virginia
30
Institute of Marine Science. In each case, university researchers and their industry
partners are looking at how they can turn the algae into an alternate fuel source.58,59,60
Wild algae used in the research described herein were collected from the ATS™
operating on the campus of the Virginia Institute of Marine Science (VIMS) in
Gloucester Point, Virginia. This system is located along the York River, a Virginia
tributary of the Chesapeake Bay. Current research efforts by faculty and students of
VIMS, and those of the affiliated College o f William and Mary, focus on harvesting the
algae, extracting oil from the algae, processing the oil, and producing a biofuel.60
2.3.3.1.2. Melosira nummuloides
The algal turf o f the VIMS ATS™ is thus far dominated by the diatom Melosira
nummuloides.61 These filamentous algae of the benthic species have a silica sheath
which surrounds the cell wall. The sheath also serves to protect the cells as they grow by
maintaining a series o f valve locks, which hold the new algae cells together next to older
cells. As a result, when any shearing forces are applied, the algae are more likely to split
into doublets and triplets, rather than individual cells.62 Figure 2.13 shows the cell
multiplication and valve lock.
31
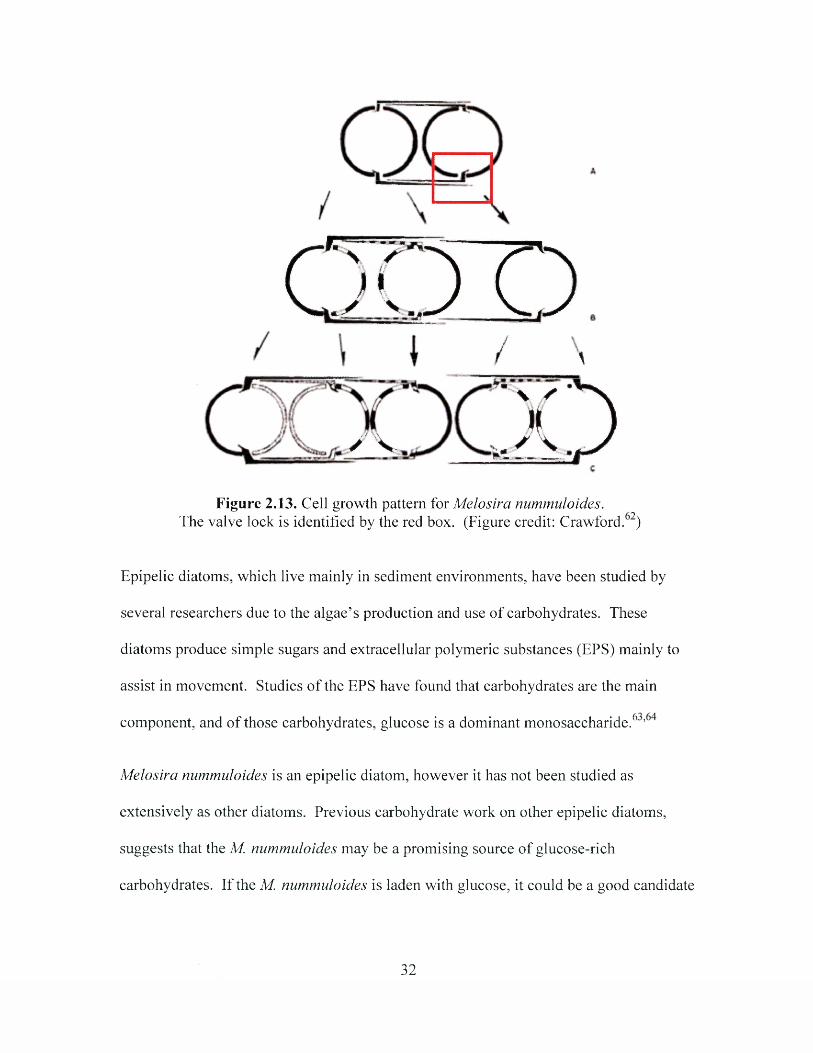
QDX)/ \
X )/ v
Figure 2.13. Cell growth pattern for Melosira nummuloides.9The valve lock is identified by the red box. (Figure credit: Crawford. )
Epipelic diatoms, which live mainly in sediment environments, have been studied by
several researchers due to the algae’s production and use of carbohydrates. These
diatoms produce simple sugars and extracellular polymeric substances (EPS) mainly to
assist in movement. Studies o f the EPS have found that carbohydrates are the main
component, and of those carbohydrates, glucose is a dominant monosaccharide.6 ’
Melosira nummuloides is an epipelic diatom, however it has not been studied as
extensively as other diatoms. Previous carbohydrate work on other epipelic diatoms,
suggests that the M. nummuloides may be a promising source of glucose-rich
carbohydrates. If the M. nummuloides is laden with glucose, it could be a good candidate
32
for ethanol production. The research described in this document will provide a starting
point for such a determination.
2.3.3.1.3. Spirulina
Spirulina are blue-green algae with a long history of research, due primarily to the high
protein content. The cells of these algae lack a nucleus, thus relating Spirulina more
closely to bacteria and giving rise to the alternate name cyanobacteria.65 The unique
spiral shape, which often resembles a helix, give Spirulina its name.66
The first report of the isolation of Spirulina was in 1827, but the algae were not named
until 1844 when found along the coast of Uruguay. The full name, Spirulina jenneri f.
platensis, was given at that time. In 1852, taxonomists renamed Spirulina to Arthrospira
due to the defined separation of cells, helical shape, and its multicellular nature.
Distinction between Spirulina and Arthrospira arose in 1892, and the algae which had a
distinct separation of cells remained with the genus Arthrospira, and those which
appeared to have no cellular separation were designated Spirulina. Between this
classification in 1892 and 1989, the genus names were combined and separated two more
times. Research has been conducted world-wide on this algae using the name Spirulina,
although the algae being referenced actually belongs to the Arthrospira genus,
promulgating the notion that habits are hard to break once confusion has been created.66
Large-scale growth of Spirulina can be easily accomplished using open ponds, as done in
Japan, the U.S., and Africa.66 Controlled growth has also been researched through the
use o f photobioreactors (PBRs), which are closed reactors, often tubular in shape and
33
made of clear plastics. PBRs are believed to harness energy more efficiently and reduce
the number of contaminating species that may arise in open ponds.67,68 Harvesting and
drying techniques depend on the method used for growth. Many nutritional companies
will dewater the algae to a paste which is then sprayed into a drying chamber. Spraying
the Spirulina creates fine algae droplets that are quickly dried under high heat.69
The two most common Spirulina strains, A. platensis and A. maxima, have protein
contents between 46 and 71 percent of the dry matter. This is significantly higher than
other sources of protein, such as soybeans (35 percent), peanuts (25 percent), or grains
(8-10 percent) .39,66 The high protein content makes Spirulina a popular nutritional
supplement among people in the underdeveloped countries o f Central Africa , as well as
developed countries such as the United States and Canada.66 Spirulina is the common
name fox Arthrospira platensis when it is used commercially as a nutritional
supplement.69 Public health authorities have acknowledged only the Arthrospira
platensis strain as being generally regarded as safe (GRAS) for human consumption,
although the U.S. Food and Drug Administration (FDA) does not regulate nutritional
supplements such as Spirulina ,66
Several other uses for Spirulina exist in addition to human nutritional supplements.
Chemical soil fertilizers can be replaced by dried Spirulina for only one-third of the cost,
while also increasing the crop yield. Poultry, livestock, and fish feeds in which a portion
has been replaced by Spirulina have been demonstrated to increase the health of such
animals. Vitamin and mineral supplements are not necessary when Spirulina has been
included in the diet because of the natural occurrence of these components in the algae.66
34
The carbohydrate content of Spirulina ranges between 8 and 20 percent, and includes
simple and complex carbohydrates.39,66 Spirulina may be an excellent candidate for use
as a feedstock for ethanol production because o f these carbohydrates. It is hypothesized
that this algae will also be easily converted to simple carbohydrates because the cell walls
lack cellulose.65 Removal of the carbohydrates could increase the value of Spirulina by
concentrating the amount of protein in each gram of algae.
2.4. Mechanical Processing as a Method for Yield Improvement
Owners of corn ethanol production facilities are constantly looking for ways to improve
yields. Recent work has explored using hydrodynamic cavitation70 and ultrasonics71 to
reduce com particle size in order to access more starch. These techniques have been used
• 79for biological cell lysing for a number of years, along with homogenization methods.
Both of these techniques were used in this research to disrupt the wild algae and
Spirulina cells, facilitating carbohydrate access.
2.4.1. Homogenization
High-pressure homogenization has many applications across a broad spectrum of
industries. Viscosity reduction and the preparation of emulsions are two applications
which are vital in the cosmetic and food industries. The pharmaceutical and chemical
industries also rely on such homogenization devices to enact physical changes in solid
and liquid media.
35
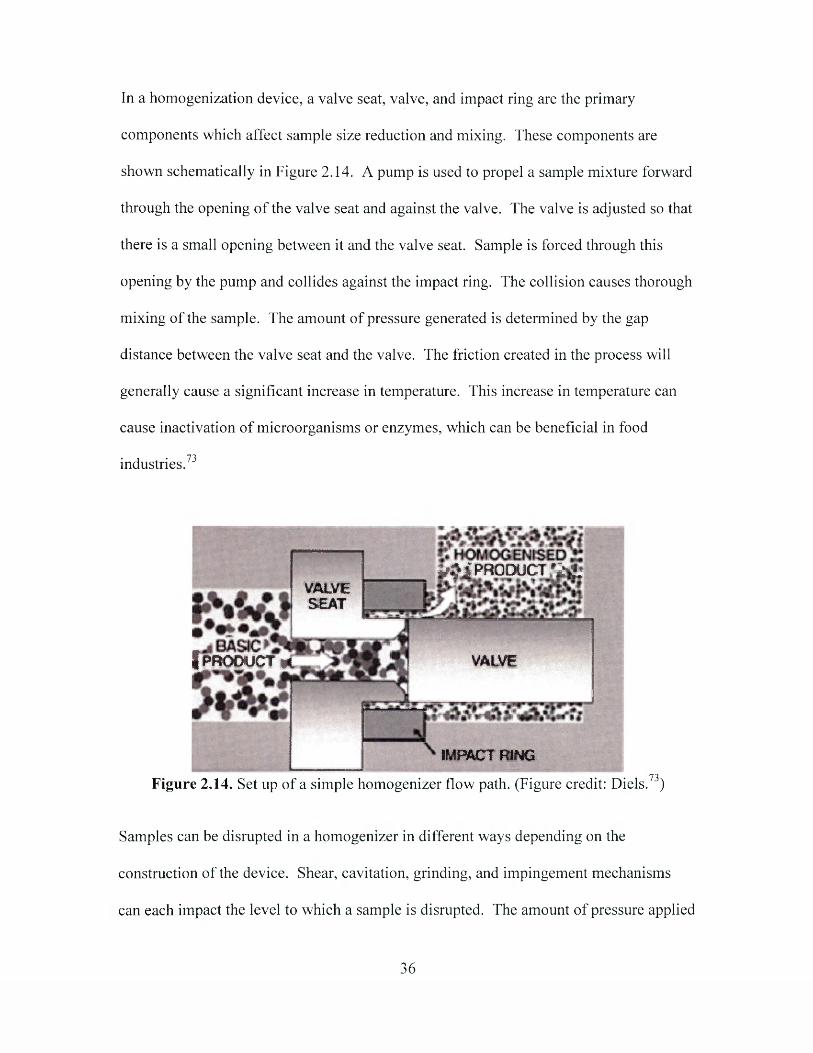
In a homogenization device, a valve seat, valve, and impact ring are the primary
components which affect sample size reduction and mixing. These components are
shown schematically in Figure 2.14. A pump is used to propel a sample mixture forward
through the opening o f the valve seat and against the valve. The valve is adjusted so that
there is a small opening between it and the valve seat. Sample is forced through this
opening by the pump and collides against the impact ring. The collision causes thorough
mixing of the sample. The amount of pressure generated is determined by the gap
distance between the valve seat and the valve. The friction created in the process will
generally cause a significant increase in temperature. This increase in temperature can
cause inactivation of microorganisms or enzymes, which can be beneficial in food
industries.73
i ^ i P R O D u c T ' i g :VALVE SEAT
I PRODUCT * VALVE
IMPACT RING73Figure 2.14. Set up of a simple homogenizer flow path. (Figure credit: Diels. )
Samples can be disrupted in a homogenizer in different ways depending on the
construction of the device. Shear, cavitation, grinding, and impingement mechanisms
can each impact the level to which a sample is disrupted. The amount of pressure applied
36
to propel the sample through the device will determine which of the previous
mechanisms is dominant.72
2.4.2. Hydrodynamic Cavitation
Hydrodynamic cavitation uses high pressure to propel a sample through a restricted
orifice into a chamber at a lower pressure. The sudden drop in pressure vaporizes the
liquid in the sample, which causes tiny bubbles, between 100 nm and 3 mm in size, to
form .74 The pressure surrounding the bubbles remains higher than the pressure within,
which causes the bubbles to collapse. As each bubble collapses, shockwaves are
produced within the medium. The propagating shockwaves causes repetition of the
75process of bubble formation and collapse. This process is what is known as cavitation.
The bubbles contain tremendous amounts o f energy in the form of heat and pressure.
Temperatures within the space of a collapsing bubble can reach up to 5000°C and
pressures up to 14,000 psi.76
In the past, cavitation has often been an unwanted side effect of a production process that
was operating ineffectively. In mechanical pumps, for instance, uncontrolled cavitation
can cause capacity reduction, erosion of the internal metal parts, and deformation of
moving parts .77 Controlling the process will determine whether cavitation is productive
or destructive, and changes in the geometry of the system will affect the pressure that can
n o
be applied, as well as the output velocity.
37
2.4.3. Ultrasonication
Ultrasonication is the use o f sound waves to disrupt a sample. Since sound waves often
cause the same cavitation effects as hydrodynamic cavitation, ultrasonication is also
known as acoustic cavitation. The frequency of vibration for ultrasonication is typically
between 16 kiloHertz (kHz) and 100 megaHertz (MHz), which is above the audible level
for human hearing.78 As sound waves are generated in a sample, the waves compress and
stretch the medium through which the wave is traversing, usually a liquid. Once a
threshold level has been surpassed in the liquid, the energy from the stretching and
compression causes the liquid to explode into millions of bubbles, which each have a
large amount of energy. As in hydrodynamic cavitation, temperatures as high as 5000°C
79and pressures greater than 1 0 ,0 0 0 psi are possible in each bubble.
Ultrasonication has been used effectively for many years to destroy cell walls in order to
release cellular components. Use o f ultrasonic probes (also called horns) for cell
disruption has often been confined to laboratory settings because the intense cavitation
effects are localized.78 The set up for a typical ultrasonic horn is shown in Figure 2.15.
This device is the same as that used in this research, and the specifications of operation
will be described in greater detail in section 3.3.1.
38
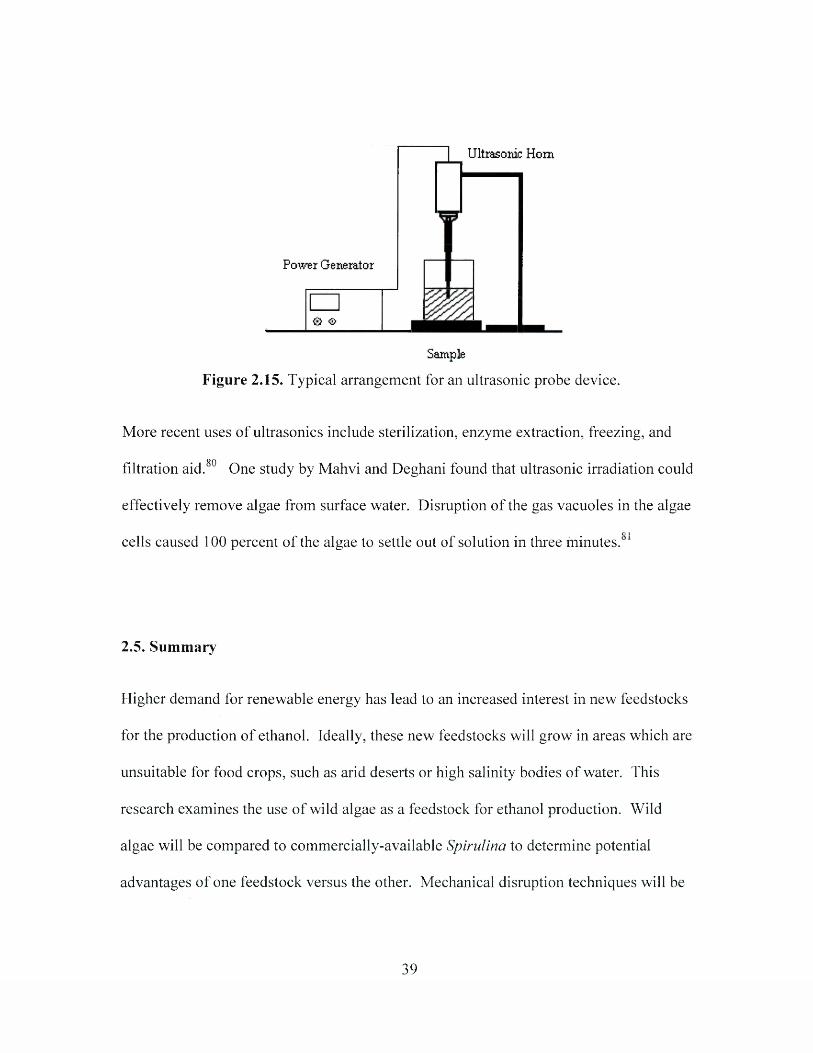
Ultrasonic Horn
Power Generator
□<■> a>
Sample
Figure 2.15. Typical arrangement for an ultrasonic probe device.
More recent uses of ultrasonics include sterilization, enzyme extraction, freezing, and
• ROfiltration aid. One study by Mahvi and Deghani found that ultrasonic irradiation could
effectively remove algae from surface water. Disruption of the gas vacuoles in the algae
o 1cells caused 100 percent of the algae to settle out of solution in three minutes.
2.5. Sum m ary
Higher demand for renewable energy has lead to an increased interest in new feedstocks
for the production of ethanol. Ideally, these new feedstocks will grow in areas which are
unsuitable for food crops, such as arid deserts or high salinity bodies of water. This
research examines the use of wild algae as a feedstock for ethanol production. Wild
algae will be compared to commercially-available Spirulina to determine potential
advantages o f one feedstock versus the other. Mechanical disruption techniques will be
39
evaluated on each algae feedstock as well to determine if such methods increase the
amount of available carbohydrates.
Chapter 2 References:
1 National Transportation Statistics. Table 1-11: Number of U.S. Aircraft, Vehicles, Vessels, and Other Conveyances. U.S. Department of Transportation Research and Innovative Technology Administration, 2009.http://www.bts.gov/publieations/national_transportation_statistics/html/table_0 1 _ 1 1 .html (accessed Mar 20, 2010).
2 US POPClock Projection. U.S. Census Bureau, 2009.http://www.census.gov/population/www/popclockus.html (accessed Mar 20, 2010).
3 Energy Use for Transportation. Use of Energy in the United States Explained. U.S. Energy Information Administration, 2010.http: //tonto. eia. doe. go v/energy explained/index. cfm?page=us_energy_transportation#tab 1 (accessed Mar 21, 2010).
4 Frequently asked questions - Gasoline. U.S. Energy Information Administration, 2009. http://tonto.eia.doe.gov/ask/gasoline_faqs.asp (accessed Mar 1, 2010).
5 Oil Imports and Exports. Oil: Crude and Petroleum Products Explained. U.S. Energy Information Administration, 2010.http://tonto.eia.doe.gov/energyexplained/index.cfm?page=oil_imports (accessed Mar 20, 2010).
6 Basics. Biofuels: Ethanol and Biodiesel Explained. U.S. Energy Information Administration, 2010.http://tonto.eia.doe.gov/energyexplained/index.cfm?page=biofuel_home (accessed Mar 21, 2010).
7 Hulsey, B.; Coleman, B. Clearing the Air with Ethanol: A review of the real world impact from fuels blended with ethanol. Better Environmental Solutions and Renewable Energy Action Project, 2006.http://www.ethanol.org/pdf/contentmgmt/Clearing_the_Air_with_Ethanol_2006.pdf (accessed Mar 20, 2010).
8 Short-Term Energy Outlook. U.S. Energy Information Administration, 2010. http://www.eia.doe.gov/steo (accessed Mar 1, 2010).
40
9 Data and Statistics. Biofuels: Ethanol and Biodiesel Explained. U.S. Energy Information Administration, 2010.http://tonto.eia.doe.gov/energyexplained/index.cfm?page=biofuel_home#tab2 (accessed Mar 1,2010).
10 Greenberg Quinlan Rosner / Public Opinion Strategies. Public Support fo r Ethanol: National Survey Results, July 10, 2008.http://www.ethanol.org/pdf/contentmgmt/Public_support_for_ethanol_RFA_poll_71508. pdf (accessed Mar 21, 2010).
11 Federal Legislation. Renewable Fuels Standard. American Coalition for Ethanol. http://www.ethanol.org/index.php?id=78&parentid=26 (accessed Mar 21, 2010).
12 Demirbas, A. Political, economic and environmental impacts of biofuels: A review. Appl. Energy 2009, 86, S108-S117.
13 EIA Energy Kids. Energy Timelines: Ethanol. U.S. Energy Information Administration, 2008. http://tonto.eia.doe.gov/kids/energy.cfm?page=tl_ethanol (accessed Mar 16, 2010).
14 Ethanol Fuel History. Fuel-Testers, 2009. http://www.fuel- testers.com/ethanol_fuel_history.html (accessed Mar 20, 2010).
15 Federal Regulations: Renewable Fuels Standard. Renewable Fuels Association, 2005. http://www.ethanolrfa.org/policy/regulations/federal/standard/ (accessed Mar 2, 2010).
1 f \ Renewable Fuels Standard. Renewable Fuels Association. http://www.ethanolrfa.org/resource/standard/ (accessed Mar 2, 2010).
17 Union o f Concerned Scientists. New Renewable Fuel Standard, Which Sets First Heat Trapping Emissions Requirements for Biofuels, Gets Favorable Review From UCS.News Center. 2010. http://www.ucsusa.org/news/press_release/new-renewable-fuel- standard-favorable-review-from-UCS-0345.html (accessed Mar 2, 2010).
18 Sims, R.; Taylor, M.; Saddler, J. From 1st- to 2nd- Generation Biofuel Technologies: An Overview o f current industry and RD&D activities. International Energy Agency. Head of Communication and Information Office: France, 2008.
19 Secretary Chu Announces Nearly $800 Million from Recovery Act to Accelerate Biofuels Research and Commercialization. U.S. Department of Energy. Press Release, May 22, 2009. http://www.energy.gov/news2009/7375.htm (accessed Mar 6 , 2010).
20 Watson, S.; Ramstad, P., Eds. Corn: Chemistry and Technology; American Association of Cereal Chemists, Inc.: St. Paul, MN, 1999.
21 Beall Degerminator Company. Dry Milling Process - Introduction, The Raw Material. http://www.bealldeg.com/ (accessed Mar 14, 2010).
41
22 •Power, R. Enzymatic conversion o f starch to fermentable sugars. In The AlcoholTextbook, 4th Ed.; K.A. Jacques, T.P. Lyons, D.R. Kelsall. Nottingham University Press:Nottingham, U.K. 2003. pp 23-32.
23 The U.S. Dry-Mill Ethanol Industry: Biobased Products and Bioenergy Initiative Success Stories. BBI International.http://www.brdisolutions.com/pdfs/drymill_ethanol_industry.pdf (accessed Mar 5, 2010).
24 How Ethanol Is Made. The Ethanol Production Process - Dry Milling. Renewable Fuels Association. 2010. http://www.ethanolrfa.org/resource/made/ (accessed Mar 5, 2010).
25 Elander, R.; Putsche, V. Ethanol from Corn: Technology and Economics. In Handbook on Bioethanol: Production and Utilization; Wyman, C. Ed.; Taylor and Francis: Washington, D.C., 1996; pp 329-349.
26 Kelsall, D.; Lyons, T. Grain Dry Milling and Cooking Procedures. In The Alcohol Textbook, 4th Ed.; K.A. Jacques, T.P. Lyons, D.R. Kelsall. Nottingham University Press: Nottingham, U.K. 2003. pp 9-22.
27 Russell, I. Understanding Yeast Fundamentals. In The Alcohol Textbook, 4th Ed.; K.A. Jacques, T.P. Lyons, D.R. Kelsall. Nottingham University Press: Nottingham, U.K. 2003. pp. 85-119.
28 Madson, P. Ethanol distillation: the fundamentals. In The Alcohol Textbook, 4th Ed.; K.A. Jacques, T.P. Lyons, D.R. Kelsall. Nottingham University Press: Nottingham, U.K. 2003. pp 319-336.
9Q Pine Lake Corn Processors, Steamboat Rock, Iowa. Plant Tour, January, 2007.
Mundkur, S. Director of Technology, Delta-T Corporation, Williamsburg, VA.Personal Communication, September, 2006.
31 Ethanol Facilities: Capacity by State and Plant. Nebraska Energy Statistics. Nebraska Energy Office. 2010. http://www.neo.ne.gov/statshtml/122.htm (accessed Mar 2, 2010).
Biorefinery Locations. Renewable Fuels Association. 2010. http://www.ethanolrfa.org/industry/locations/ (Accessed Mar 2, 2010).
Bioethanol Production Process Diagram. U.S. Department of Energy. Biomass Program. Information Resources. ABC’s of Biofuels, 2009.http://wwwl.eere.energy.gOv/biomass/abcs_biofuels.html#prod (accessed Mar 6 , 2010).
34 Mosier, N.; Wyman, C.; Dale, B.; Elander, R.; Lee, Y.; Holtzapple, M.; Ladisch, M. Features of promising technologies for pretreatment of lignocellulosic biomass.Bioresour. Technol. 2005, 96, 673-686.
42
35 Wyman, C.; Dale, B.; Elander, R.; Holtzapple, M.; Ladisch, M.; Lee, Y. Coordinated development of leading biomass pretreatment technologies. Bioresour. Technol. 2005,96, 1959-1966.
36 Abbas, C. Lignocellulosics to ethanol: meeting ethanol demand in the future. In The Alcohol Textbook, 4th Ed.; K.A. Jacques, T.P. Lyons, D.R. Kelsall. Nottingham University Press: Nottingham, U.K. 2003. pp 41-57.
37 The International Lignin Institute: About Lignin, 2009. http://www.ili- lignin.com/aboutlignin.php (accessed Mar 15, 2010).
38 Gregory, A. Green Energy. Odyssey, University of Kentucky [Online], 2007. http://www.research.uky.edu/odyssey/winter07/green_energy.html (accessed Mar 15, 2010).
39 Miyamoto, K., Ed. Renewable biological systems fo r alternative sustainable energy production. FAO Agricultural Services Bulletin 128. Food and Agricultural Organization o f the United Nations: Rome, 1997.
40 Dien, B.; Cotta, M.; Jeffries, T. Bacteria engineered for fuel ethanol production: current status. Appl. Microbiol. Biotechnol. 2003, 63 (3), 258-266.
41 Decker, J. Going Against the Grain: Ethanol from Lignocellulosics. Renewable Energy World.Com, January 22, 2009.http://www.renewableenergyworld.com/rea/news/article/2009/01/going-against-the- grain-ethanol-from-lignocellulosics-54346 (accessed Mar 5, 2010).
42 *Chisti, Y. Biodiesel from microalgae beats bioethanol. Trends Biotechnol. 2008, 26 (3), 126-131.
43 Rosenberg, J.; Oyler, G.; Wilkinson, L.; Betenbaugh, M. A green light for engineered algae: redirecting metabolism to fuel a biotechnology revolution. Curr. Opin. Biotechnol. 2 0 0 8 ,19, 430-436.
44 LaMonica, M. Race to algae-based biodiesel heats up. Green Tech CNET News. [Online], http://news.cnet.com/8301-l 1128_3-9933355-54.html (accessed Jun 22, 2009).
45 Sheehan, J.; Dunahay, T.; Benemann, J.; Roessler, P. A Look Back at the U.S. Department o f Energy’s Aquatic Species Program - Biodiesel from Algae. The National Renewable Energy Laboratory. NREL/TP-580-24190. U.S. Department of Energy. July 1998.
46 Algenol Biofuels. The Science: The Biology.http://www.algenolbiofuels.com/thescience-biology.html (accessed Mar 19, 2010).
47 Bush, R.; Hall, K. Process for the Production of Ethanol from Algae. International Patent Application PCT/US2007/062835. 7 September 2007.
43
48 •Kim, G. Method of Producing Biofuel Using Sea Algae. International Patent Application PCT/KR2008/001102. 4 September 2008.
49 Ogaki, M., et al. Method of Producing Bio-ethanol. United States Patent Application 20090075353. March 19, 2009.
50 Woods, P., et al. Genetically modified cyanobacteria for the production of ethanol. United States Patent Application 20100068776. March 18, 2010.
51 Waltz, E. Genetically manipulating algae for fuel. Mother Nature Network [Online], April 13, 2009. http://www.mnn.com/earth-matters/energy/stories/genetically- manipulating-algae-for-fuel# (accessed Mar 19, 2010).
52 Adey, W. Information page - Dr. Walter Adey, 2008. Walter H. Adey, Ph.D. http://www.walteradey.com/ (accessed Mar 7, 2010).
53 The Algal Turf Scrubber®, http://www.algalturfscrubber.com/index.htm (accessed Feb 3,2010).
54 Adey, W.; Luckett, C.; Jensen, K. Phosphorus removal from natural waters using controlled algal production. Restor. Ecol. 1993, 1, (1), 29-39.
55 Wilkie, A.; Mulbry, W. Recovery of dairy manure nutrients by benthic freshwater algae. Bioresour. Technol. 2002, 84, 81-91.
56 Mulbry, W.; Kondrad, S.; Pizarro, C.; Kebede-Westhead, E. Treatment of dairy manure effluent using freshwater algae: Algal productivity and recovery of manure nutrients using pilot-scale algal turf scrubbers. Bioresour. Technol. 2008, 99, 8137-8142.
57 ATS™ Frequently Asked Questions. Algal Turf Scrubber®. Hydromentia. http://www.hydromentia.com/Products-Services/Algal-Turf-Scrubber/Product- Documentation/ATS-FAQ.html (accessed May 5, 2009).
58 Goldman, E. River of Opportunity: Innovation for a Cleaner Chesapeake. Chesapeake Quarterly. [Online]. March 2009. Maryland Sea Grant. http://www.mdsg.umd.edu/cq/v08nl/mainl/ (accessed Mar 9, 2010).
59 Interdisciplinary Project Involves Students in Sustainability Research. August 12,2008. Daily Headlines, University of Arkansas, http://dailyheadlines.uark.edu/13245.htm (accessed Jan 15, 2010).
60 McClain, J. Algae initiative aims to produce fuel while helping the environment.W&M News and Events. The College o f William and Mary. September 30, 2009. http://www.wm.edu/news/stories/2009/algae-initiative-aims-to-produce-fuel-while- helping-the-environmentOOl.php (accessed Oct 1, 2009).
44
61 Duffy, E. Biological Sciences, Virginia Institute of Marine Science, Gloucester Point, VA. “Re: Characterization of Algae Species.” Email to the author. 18 Jun 2009.
62 Crawford, R. M. The organic component of the cell wall of the marine diatom Melosira nummuloides (Dillw.) C. Ag, Eur. J. Phycol. 1973, 8: 3, 257-266.
63 Taylor, I.; Paterson, D.; Mehlert, A. The quantitative variability and monosaccharide composition of sediment carbohydrates associated with intertidal diatom assemblages. Biogeochemistry. 1999, 45, 303-327.
64 Staats, N.; De Winder, B.; Stal, L.; Mur, L. Isolation and characterization of extracellular polysaccharides from the epipelic diatoms Sylindrotheca closterium and Navicula salinarum. Eur. J. Phycol. 1999, 34 (2), 161-169.
65 Schooley, J. Introduction to Botany [Online]; Thomson Delnar Learning: Albany,1997; 119-123. http://www.netlibrary.com.proxy.wm.edu/Reader/ [E-Book ISBN: 9780585425207] (accessed Jan 4, 2010).
66 Habib, M. A. B.; Parvin, M.; Huntington, T. C.; Hasan, M. R. A Review on Culture, Production and Use o f Spirulina as Food fo r Humans and Feeds fo r Domestic Animals and Fish. FAO Fisheries and Aquaculture Circular No. 1034. Food and Agricultural Organization of the United Nations: Rome, 2008.
67 Ugwu, C. U.; Aoyagi, H.; Uchiyama, H. Photobioreactors for mass cultivation of algae. Bioresour. Technol. 2008, 99, 4021-4028.
68 Pohl, P.; Kohlhase, M.; Martin, M. Photobioreactors for the axenic mass cultivation of microalgae. International Meeting: 4th, 1987, Villeneuve-d’Ascq, France. Algal Biotechnology. 1988, 2009-217.
69 Gershwin, M. E.; Belay, A., Ed. Spirulina in Human Nutrition and Health [Online]; CRC Press: Boca Raton, 2008.http://lib.myilibrary.com.proxy.wm.edu/Browse/open.asp?ID:=l 13666 (accessed Mar 13, 2010).
70 Kozyuk, O. Apparatus and Method for Increasing Alcohol Yield from Grain. United States Patent 7,667,082. February 23, 2010.
71 Montalbo-Lomboy, M. Ultrasound pretreatment for enhanced sacchariflcation and fermentation of ethanol production from com. Ph D Dissertation, Iowa State University: Ames, 2008.
72 Balasundaram, B.; Pandit, A. Selective release of invertase by hydrodynamic cavitation. Biochem. Eng. J. 2001, 8, 251-256.
73 Diels, A.; Michiels, C. High-Pressure Homogenization as aNon-Thermal Technique for the Inactivation of Microorganisms. Crit. Rev. Microbiol. 2006, 32, 201-216.
45
74 Arisdyne Systems. See How Controlled Flow Cavitation Works, [Video]. Arisdyne Systems Video, 2009. http://www.arisdyne.com/vp/cavitationvideol.htm (accessed Mar 17, 2010).
75 Hydro Dynamics, Inc. Technology, 2010. http://hydrodynamics.com/technology/ (accessed Mar 20, 2010).
76 Controlled Flow Cavitation™ Technology: The Core of Arisdyne Systems. Arisdyne Systems, 2009. http://www.arisdyne.com/vp/cavitation.htm (accessed Mar 20, 2010).
77 Sahdev, M. General Symptoms of Cavitation and its Effects on Pump Performance and Pump Parts. From Centrifugal Pumps: Basic Concepts o f Operation, Maintenance, and Troubleshooting, Part II, 2008, [Online].http://www.cheresources.com/centrifugalpumps3b.shtml (accessed Mar 20, 2010).
78 Gogate, P.; Tayal, R.; Pandit, A. Cavitation: A technology on the horizon. Curr. Sci. 2006, 91 (1), 35-46.
79 SharperTec. How Ultrasonics Work, http://www.sharpertek.com/ul.html (accessed Mar 20, 2010).OA
Mason, T.; Paniwnyk, L.; Lorimer, J. The uses of ultrasound in food technology. Ultrason. Sonochem. 1996, 3 , S253-S260.
81 Mahvi, A.; Dehghani, M. Evaluation o f Ultrasonic Technology in Removal of Algae from Surface Waters. Pak. J. Biol Sci. 2005, 8 (10), 1457-1459.
46
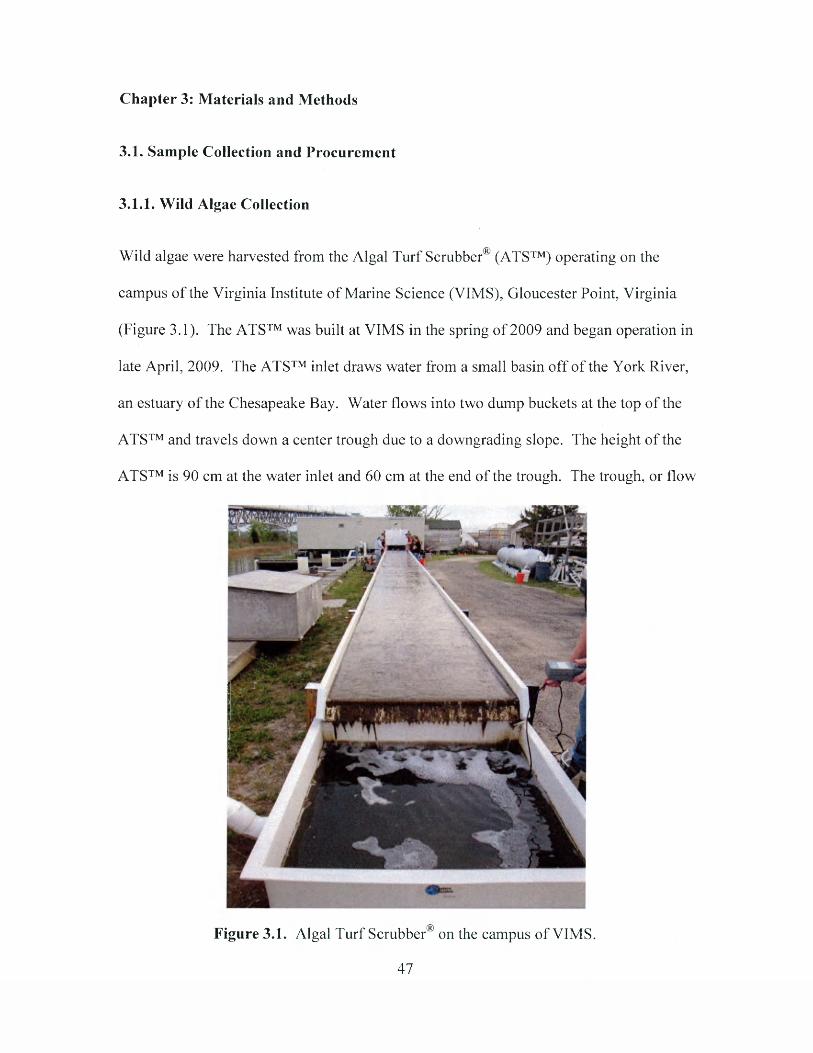
Chapter 3: Materials and Methods
3.1. Sample Collection and Procurement
3.1.1. Wild Algae Collection
Wild algae were harvested from the Algal Turf Scrubber® (ATS™) operating on the
campus o f the Virginia Institute of Marine Science (VIMS), Gloucester Point, Virginia
(Figure 3.1). The ATS™ was built at VIMS in the spring of 2009 and began operation in
late April, 2009. The ATS™ inlet draws water from a small basin off of the York River,
an estuary of the Chesapeake Bay. Water flows into two dump buckets at the top of the
ATS™ and travels down a center trough due to a downgrading slope. The height of the
ATS™ is 90 cm at the water inlet and 60 cm at the end of the trough. The trough, or flow
Figure 3.1. Algal Turf Scrubber® on the campus of VIMS.
47
way, is 114 cm wide and 24.4 m long. A retention box at the bottom of the ATS™
collects the water as it flows off of the trough, and an outlet on the box allows the water
to return to the basin. The flow rate of the water running down the ATS™ can be set as
desired. Flow rates during the start up of the unit were between 16 and 18 gallons per
minute, and the flow rate was adjusted to approximately 30 gallons per minute in later
months.
Along the length of the trough is a mesh screen with openings of 0.36 cm2. As water
passes down the trough and over the mesh screen, algae and other micro-organisms
within the water become attached to the screen. The attached algae use nutrients from the
water to grow until they are harvested.
Algae were harvested on a weekly basis by VIMS staff from May 2009 to October 2009.
Algae were harvested approximately two to three hours after sunrise in order to minimize
drying of the algae by the sun. Harvesting was accomplished using a Shop-Vac® wet
vacuum to clean the screen and collect the algae in a tub. During nine of these harvests,
algae were collected for ethanol conversion studies. The algae harvested for ethanol
conversion studies were stored at - 4°C until they could be processed. Samples were
used within 2 weeks of harvest.
3.1.2. Spirulina Procurement
Pre-dried Spirulina was obtained from three sources for use in processing and
fermentation. A donation of 200 gm of Spirulina, used for initial trials, was made by
48
Don Cain, a colleague at the Delta-T Corporation. Larger quantities of Spirulina needed
for subsequent experiments were purchased from Puritan’s Pride (Oakdale, NY), and
BulkFoods.com (Toledo, OH). Both donated and purchased Spirulina arrived as a dried,
fine powder, which was combined with tap water to achieve a specified total solids
percentage for each trial.
As noted in section 2.4.2, Spirulina is the common name for Arthrospiraplatensis when
it is used commercially. 1 Public health authorities have acknowledged only the Spirulina
(Arthrospira) platensis strain as being generally regarded as safe (GRAS) for human
consumption. Since nutritional information was similar for the three Spirulina products
used, they were assumed to be the same strain.
3.2. Compositional Analyses
Raw algae and Spirulina samples were analyzed for compositional analysis by Midwest
Laboratories, an independent laboratory in Omaha, Nebraska. Tests included mineral
profile, total solids, ash content, fiber, crude protein, fat, lignin, nitrogen, and starch.
Algae samples were gathered from the upper, middle, and lower regions of the ATS™
during one harvest in May and one harvest in June for a total of six analyses. Spirulina
analyses were completed using one sample from the BulkFoods.com batch.
49
3.3. Sample Pre-processing
Wild algae and Spirulina were processed via mechanical and thermal methods. Each
feedstock was processed in order to affect disruption of the algae cells in order to release
cellular components as well as bound carbohydrates. The amount of cell disruption was
then evaluated by viewing the cells under a light microscope (Unico M250 Series, United
Products and Instruments, Inc., Dayton, NJ). This imaging served as a measure of the
effectiveness each method. Cells that appeared to have perforations or were broken were
considered disrupted and the pre-processing technique was considered successful.
Photographs of the cells were taken using a Canon PowerShot camera, model SD1000.
The camera lens was focused into one eyepiece of the microscope to capture images with
good detail and reasonable color quality.
3.3.1. Mechanical Pre-processing
Mechanical shearing o f wild algae and Spirulina was accomplished using a number of
techniques: (a) a blender; (b) an ultrasonic horn; (c) a hydrodynamic cavitation reactor;
and (d) a Microfluidizer® impingement homogenizer. Blending was completed in-house
using a Waring® high-shear blender (Waring Laboratory Science, Torrington, CT). The
Waring® blender operates at a high speed of 27,000 RPM and a low speed of 20,700
RPM.
Access to a Sonic Dismembrator (model 550, Fisher Scientific, Pittsburgh, PA) ultrasonic
horn was provided by Dr. Elizabeth Canuel (VIMS). The horn vibrates at a fixed
50
frequency of 20 kHz in order to produce motion longitudinally that is transmitted to the
tip of the horn in a sample.3 A 0.25 inch flat tip probe was used to produce cavitation
within the sample. In order to process the samples with the ultrasonic probe, it was first
necessary to break down large algae filaments by blending the samples with the Waring®
blender for 2 minutes at high speed. A total of six samples were processed by varying the
parameters o f amplitude, power, and time duration in order to achieve maximum cell
disruption. The amplitude setting ranged from 1 to 8.5 and the power ranged from 20 to
65 percent for each run depending on the amplitude. A magnetic stir bar provided
constant stirring during sample pretreatment.
Impingement homogenization processing was provided courtesy of Microfluidics
(Newton, MA). The Microfluidizer® uses high pressure to propel a sample through
parallel flow tubes, each with a diminishing orifice. At the end of the tubes, the sample
streams collide with each other and the sample particles rupture from the impact. The
amount of pressure applied can be varied depending on the type of material. Interaction
chambers within the unit determine the orifice size.4 Size reduction of longer algae
filaments was necessary before processing with the Microfluidizer®. This reduction was
accomplished by blending with the Waring® blender for 2 minutes at high speed. A
diagram of the Microfluidizer® processor can be found in Figure 3.2.
51
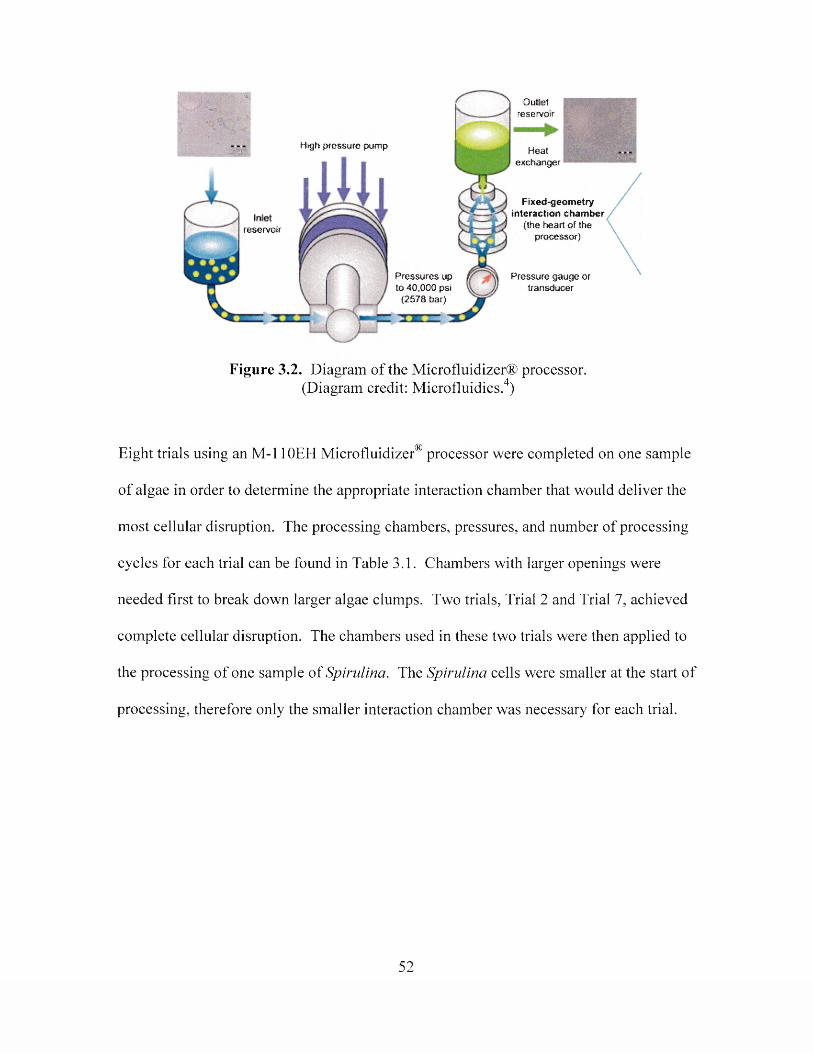
reservoir
Pressures up to 40.000 psi
(2578 bar)
High pressure pump
O u t’c treservoir
Heatexchanger
Fixed-geometry interaction chamber
(the heart of the processor)
Pressure gauge or transducer
Figure 3.2. Diagram of the Microfluidizer® processor.(Diagram credit: Microfluidics.4)
Eight trials using an M -l 10EH Microfluidizer® processor were completed on one sample
of algae in order to determine the appropriate interaction chamber that would deliver the
most cellular disruption. The processing chambers, pressures, and number of processing
cycles for each trial can be found in Table 3.1. Chambers with larger openings were
needed first to break down larger algae clumps. Two trials, Trial 2 and Trial 7, achieved
complete cellular disruption. The chambers used in these two trials were then applied to
the processing of one sample of Spirulina. The Spirulina cells were smaller at the start of
processing, therefore only the smaller interaction chamber was necessary for each trial.
52
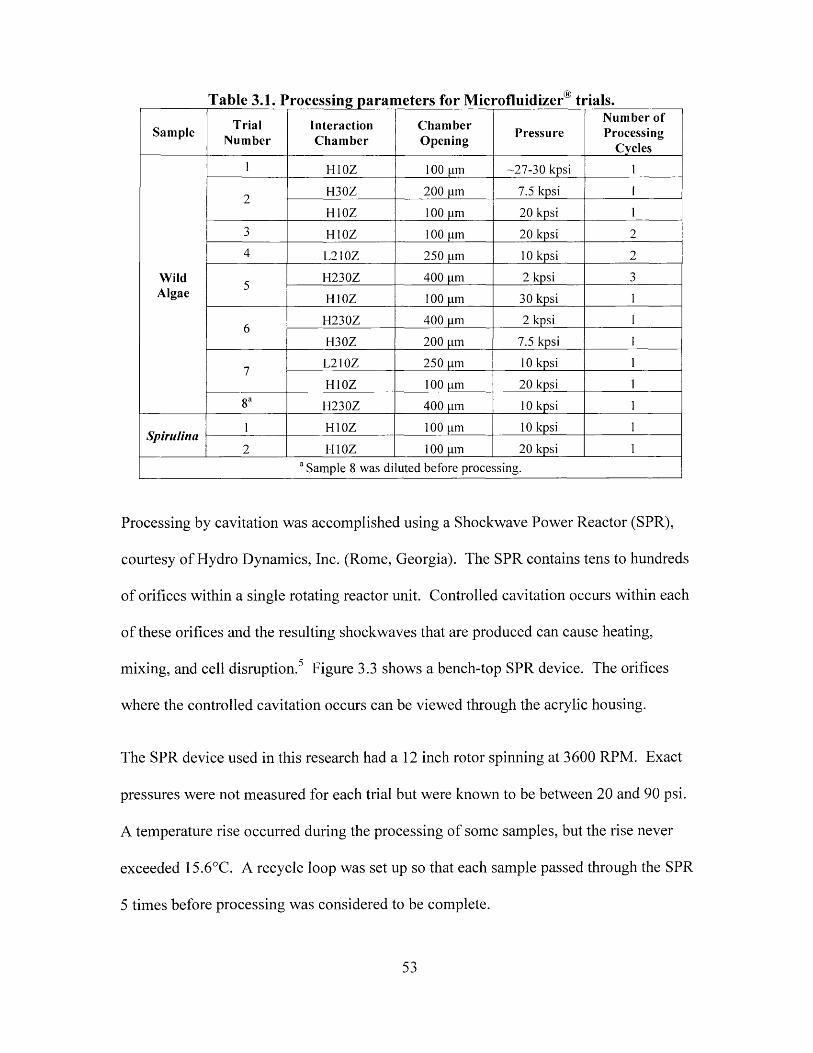
Table 3.1. Processing parameters for Microfluidizer® trials.
Sample TrialNumber
InteractionChamber
ChamberOpening Pressure
Number of Processing
Cycles1 H10Z 100 pm -2 7 -3 0 kpsi 1
2H30Z 200 pm 7.5 kpsi 1
H10Z 100 pm 20 kpsi 1
3 H10Z 100 pm 20 kpsi 2
4 L210Z 250 pm 10 kpsi 2
Wild 5H230Z 400 pm 2 kpsi 3
Algae H10Z 100 pm 30 kpsi 1
6H230Z 400 pm 2 kpsi 1
H30Z 200 pm 7.5 kpsi 1
7L210Z 250 pm 10 kpsi 1
H10Z 100 pm 20 kpsi 1
8a H230Z 400 pm 10 kpsi 1
Spirulina 1 H10Z 100 pm 10 kpsi 1
2 H10Z 100 pm 20 kpsi 1
a Sample 8 was diluted before processing.
Processing by cavitation was accomplished using a Shockwave Power Reactor (SPR),
courtesy of Hydro Dynamics, Inc. (Rome, Georgia). The SPR contains tens to hundreds
o f orifices within a single rotating reactor unit. Controlled cavitation occurs within each
of these orifices and the resulting shockwaves that are produced can cause heating,
mixing, and cell disruption.5 Figure 3.3 shows a bench-top SPR device. The orifices
where the controlled cavitation occurs can be viewed through the acrylic housing.
The SPR device used in this research had a 12 inch rotor spinning at 3600 RPM. Exact
pressures were not measured for each trial but were known to be between 20 and 90 psi.
A temperature rise occurred during the processing of some samples, but the rise never
exceeded 15.6°C. A recycle loop was set up so that each sample passed through the SPR
5 times before processing was considered to be complete.
53
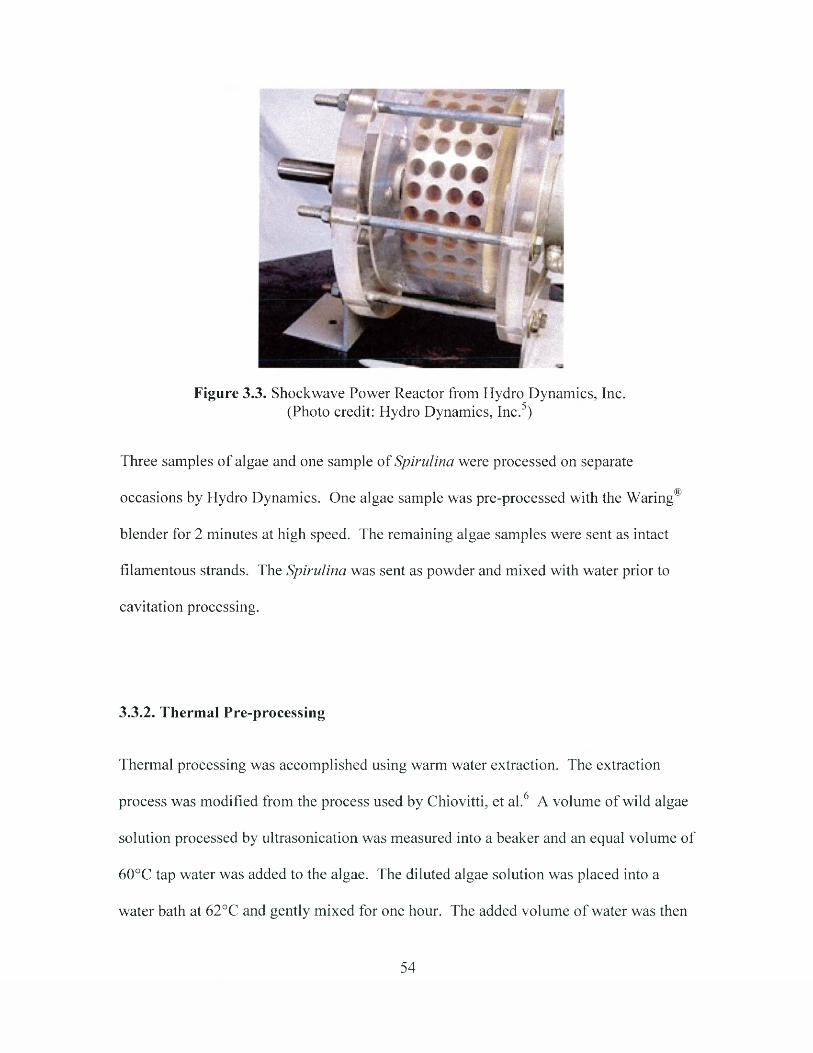
Figure
Three samples o f algae and one sample of Spirulina were processed on separate
occasions by Hydro Dynamics. One algae sample was pre-processed with the Waring®
blender for 2 minutes at high speed. The remaining algae samples were sent as intact
filamentous strands. The Spirulina was sent as powder and mixed with water prior to
cavitation processing.
3.3.2. Thermal Pre-processing
Thermal processing was accomplished using warm water extraction. The extraction
process was modified from the process used by Chiovitti, et al.6 A volume of wild algae
solution processed by ultrasonication was measured into a beaker and an equal volume of
60°C tap water was added to the algae. The diluted algae solution was placed into a
water bath at 62°C and gently mixed for one hour. The added volume o f water was then
3.3. Shockwave Power Reactor from Hydro Dynamics, Inc. (Photo credit: Hydro Dynamics, Inc.5)
54
distilled off using a vacuum distillation system, at approximately 560 mm Hg, with
moderate heating.
3.4. Fermentation and Saccharification Processing
Solutions of algae and water were processed using heat and enzymes. The processing
steps were adapted from those used in a typical fuel ethanol plant which processes com .7
Mixing and liquefaction were completed in 1 L beakers clamped to a hot water bath.
Inverted funnels placed over the beakers minimized evaporation. Overhead mixers, with
stir rods through the funnels, provided constant agitation throughout the treatment steps.
Mixing steps were conducted at 54.4°C for either 30 or 60 minutes. Liquefaction steps
were conducted at 85°C for either 60 or 90 minutes. Mixing and liquefaction steps
together never exceeded 120 minutes. Enzymes were added during the mixing and
liquefaction steps to assist and enhance in the breakdown of starch, polysaccharides, and
non-starch polysaccharides (Table 3.2, lines 1-4). The amounts used in trials were 50 to
350 times the manufacturer’s recommended dosages in order to ensure that enzyme
activity was not a limiting factor in polysaccharide conversion rates. Dosages varied
depending on the amount of biomass used in a trial. Liquid enzyme samples for mixing
and liquefaction were donated by Novozymes (Franklinton, NC).
55
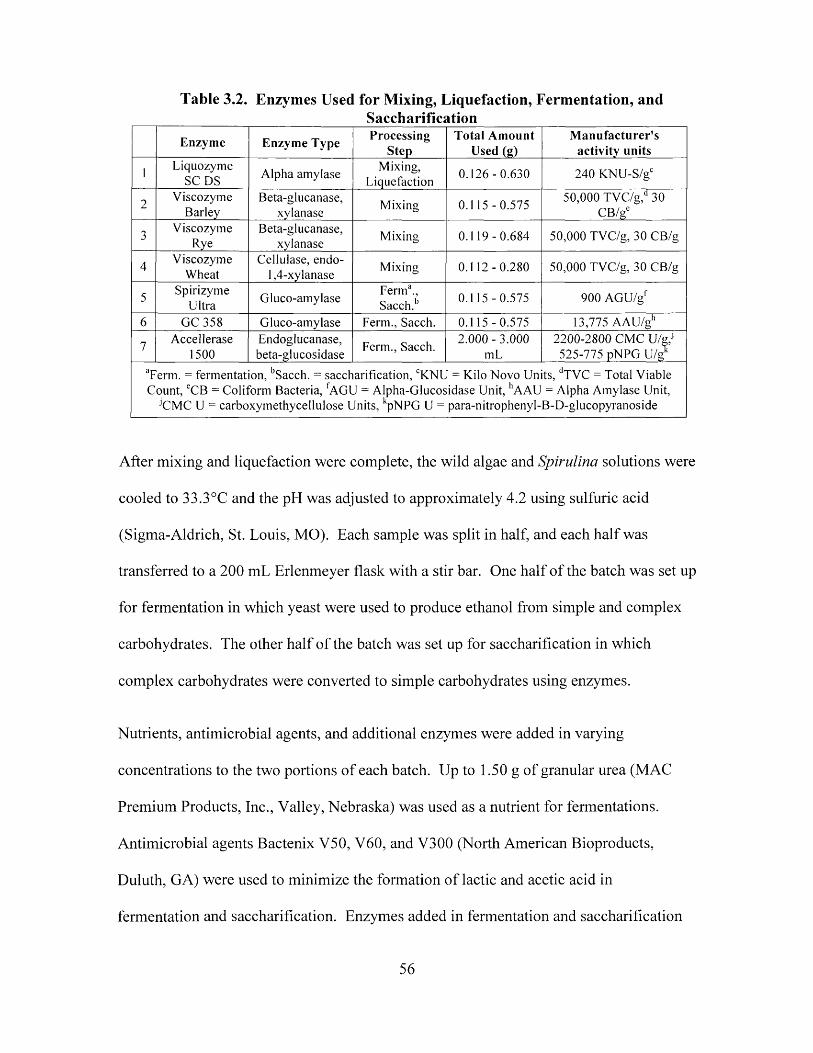
Table 3.2. Enzymes Used for Mixing, Liquefaction, Ferm entation, andSaccharification
Enzyme Enzyme Type ProcessingStep
Total Amount Used (g)
Manufacturer's activity units
1 Liquozyme SC DS Alpha amylase Mixing,
Liquefaction0 .1 2 6 -0 .6 3 0 240 KNU-S/gc
2 Viscozym eBarley
Beta-glucanase,xylanase
Mixing 0 .1 1 5 -0 .5 7 550,000 TVC/g,d 30
CB/ge
3 Viscozym eRye
Beta-glucanase,xylanase
Mixing 0 .1 1 9 -0 .6 8 4 50,000 TVC/g, 30 CB/g
4 Viscozym eWheat
Cellulase, endo- 1,4-xylanase
Mixing 0 .1 1 2 -0 .2 8 0 50,000 TVC/g, 30 CB/g
5 SpirizymeUltra Gluco-amylase
FernT.,Sacch.b
0 .1 1 5 -0 .5 7 5 900 AG U/gf
6 GC 358 Gluco-amylase Ferm., Sacch. 0 .1 1 5 -0 .5 7 5 13,775 AA U/gh
7 Accellerase1500
Endoglucanase,beta-glucosidase
Ferm., Sacch. 2 .0 0 0 -3 .0 0 0mL
2200-2800 CMC U/g,J 525-775 pNPG U/gk
Term . = fermentation, bSacch. = saccharification, CKNU = Kilo Novo Units, dTVC = Total Viable Count, eCB = Coliform Bacteria, fAGU = Alpha-Glucosidase Unit, hAAU = Alpha Amylase Unit,
■’CMC U = carboxymethycellulose Units, kpNPG U = para-nitrophenyl-B-D-glucopyranoside
After mixing and liquefaction were complete, the wild algae and Spirulina solutions were
cooled to 33.3°C and the pH was adjusted to approximately 4.2 using sulfuric acid
(Sigma-Aldrich, St. Louis, MO). Each sample was split in half, and each half was
transferred to a 200 mL Erlenmeyer flask with a stir bar. One half of the batch was set up
for fermentation in which yeast were used to produce ethanol from simple and complex
carbohydrates. The other half o f the batch was set up for saccharification in which
complex carbohydrates were converted to simple carbohydrates using enzymes.
Nutrients, antimicrobial agents, and additional enzymes were added in varying
concentrations to the two portions of each batch. Up to 1.50 g of granular urea (MAC
Premium Products, Inc., Valley, Nebraska) was used as a nutrient for fermentations.
Antimicrobial agents Bactenix V50, V60, and V300 (North American Bioproducts,
Duluth, GA) were used to minimize the formation of lactic and acetic acid in
fermentation and saccharification. Enzymes added in fermentation and saccharification
56
were used to facilitate in the breakdown of dextrins (Table 3.2, lines 5 and 6 ). Enzyme
amounts were varied with the biomass concentration in each sample in order to maintain
a proportionate amount o f enzyme. Liquid samples o f fermentation and saccharification
enzymes were donated by Genencor (Palo Alto, CA) and Novozymes.
Between 0.46 and 1.50 g o f Bioferm Yeast (North American Bioproducts), a commercial
ethanol fermentation yeast, strain Saccharomyces cerevisiae, were added to fermentation
trial flasks. Yeast was not added to saccharification trial flasks.
Fermentation flasks were sealed using a bubbler airlock inserted into a hole in a rubber
stopper. Saccharification flasks were sealed with a solid rubber stopper. Flasks were
placed in a water bath at 33.3°C on a Variomag submersible magnetic stir plate.
Fermentation and saccharification trials were run simultaneously. Most trials ran
between 60 and 120 hours, although some trials ran for up to 168 hours. Trial length was
dependent upon on the analytical results from the first 48 to 6 6 hours. Saccharification
trials were stopped early if the usable carbohydrate content, glucose and maltose,
decreased or if ethanol was produced. Fermentation trials were stopped early if the
usable carbohydrate content increased or if ethanol decreased in two consecutive
analyses. Trials were analyzed at various time intervals for carbohydrate content and
ethanol content.
57
3.4.1. Ferm entation Processing using Cellulase
Accellerase 1500, a cellulase provided by Genencor, was used in six trials to determine if
the enzyme would increase the final ethanol fermentation yield. Four samples of
blended wild algae and two samples of wild algae processed by ultrasonication were
prepared using the same mixing and liquefaction treatment steps described in section 3.4.
Fermentation preparation described in section 3.4 was also the same for each trial, except
that Accellerase 1500 was added in addition to the gluco-amylase enzymes. Dosage
amounts for Accellerase can be found in line 7 of Table 3.2. Saccharification was not
performed on these samples.
Control samples of blended wild algae and ultrasonicated wild algae were prepared in the
same manner as described above, except that Accellerase 1500 was not added. An
equivalent number of control samples were prepared for each processing method. All
samples were analyzed for carbohydrate and ethanol contents.
3.5. Processing, Ferm entation, and Saccharification Analyses
Algae and Spirulina processing, fermentation, and saccharification trials were monitored
and analyzed using high performance liquid chromatography (HPLC). The Waters
HPLC (Waters Corporation, Milford, MA) was equipped with an in-line vacuum
degasser, isocratic pump (model 1515), manual injector (model 1500 series 7725i),
column heater, and refractive index (RI) detector (model 2414). A Waters IC-Pak ion
exclusion chromatographic column (7.8mm x 300mm, 7pm) was connected in series to a
58
Shodex SH-G chromatographic pre-column (6 mm x 50mm) (Showa Denko America,
Inc., New York, NY).
Samples of wild algae and Spirulina were prepared for HPLC analysis by centrifuging for
5 to 10 minutes at 3200 RPM. Sample supernatant was filtered using 0.45pm nylon
membrane disc syringe filters. Filtered samples were analyzed for carbohydrates
(maltotetraose, maltotriose, maltose, glucose, fructose), organic acids (succinic, acetic,
and lactic) and alcohol fermentation products (methanol and ethanol) using an ethanol
analysis program created with the Waters’ Breeze software (version 3.30 SPA). The
ethanol analysis program was calibrated using external standards. All standards were
purchased from Sigma-Aldrich. Sample injection volume was 5 pL, and the flow rate
was 0.6 mL per minute using a mobile phase o f 0.005 M sulfuric acid. The column
heater was held at a temperature of 50°C and the sample was analyzed at 35°C. Sample
run time was 28 minutes.
Spirulina samples required additional preparation due to heavy coloration of the
supernatant after centrifugation and filtration. Solid phase extraction (SPE) was used to
remove the green pigments of the Spirulina. Discovery DSC-18 (Sigma-Aldrich, St.
Louis, MO) SPE tubes were used. The column bed was polymerically bonded octadecyl
with an 18 percent carbon loading. Tubes were 3 mL in volume with a bed weight of 500
mg, particle size o f 50 pm, and pore size was 70 A. Phycocyanin, the pigment
responsible for the blue tint in blue-green algae, was not removed using SPE since the
• &molecule is much larger than the pore size of the SPE particle beads. However, at the
end of liquefaction most samples had lost their blue tint and a dark green-brown color
was present. It is suspected that the phycocyanin is affected by the heat and residence
59
time of the liquefaction step, although this has not been confirmed. Samples that
remained heavily pigmented by phycocyanin after mixing and liquefaction steps could
not be analyzed on the HPLC.
C hapter 3 References:
1 Gershwin, M. E.; Belay, A., Ed. Spirulina in Human Nutrition and Health [Online]; CRC Press: Boca Raton, 2008.http://lib.myilibrary.com.proxy.wm.edu/Browse/open.asp7IDM13666 (accessed Mar 13, 2010).
Habib, M. A. B.; Parvin, M.; Huntington, T. C.; Hasan, M. R. A Review on Culture, Production and Use o f Spirulina as Food fo r Humans and Feeds fo r Domestic Animals and Fish. FAO Fisheries and Aquaculture Circular No. 1034. Food and Agricultural Organization of the United Nations: Rome, 2008.
Fisher Scientific Company. Fisher Scientific Model 550 Sonic Dismembrator Instruction Manual.
4 Microfluidics International Corporation: Particle Size Reduction, 2009. http://www.microfluidicscorp.com/index.php?option=com_content&view=article&id=97 &Itemid=146 (accessed Jun 25, 2009).
5 Hydro Dynamics, Inc.: Harnessing the Power of Cavitation. Technology, 2009. http://hydrodynamics.com/technology/ (accessed Aug 3, 2009).
6 Chiovitti, A.; Molino, P.; Crawford, S. A.; Teng, R.; Spurck, T.; Wetherbee, R. The glucans extracted with warm water from diatoms are mainly derived from intracellular chrysolaminaran and not extracellular polysaccharides. Eur. J. Phycol. 2004. 39, pp. 117- 128.
7 Kelsall, D.; Lyons, T. Grain Dry Milling and Cooking Procedures. In The Alcohol Textbook, 4th Ed.; K.A. Jacques, T.P. Lyons, D.R. Kelsall. Nottingham University Press: Nottingham, U.K. 2003. pp 9-22.
8 Troxler, R.; Ehrhardt, M.; Brown-Mason, A.; Offner, G. Primary Structure of Phycocyanin from the Unicellular Rhodophyte Cyanidium caldarium. J. Biol. Chem. 1981, 256 (23), 12176-12184.
60
C hapter 4: Results and Discussion
4.1. Compositional Analyses
4.1.1. W ild Algae
The compositions of wild algae harvested on May 4, 2009 and June 9, 2009 were
analyzed by Midwest Laboratories. The wild algae were analyzed in order to compare
properties from one month to another. The compositional results of the algae gave a
preliminary indication of how the algae would perform as a feedstock for ethanol
production. The upper, middle, and lower sections of the VIMS floway were analyzed
separately for the two harvests to compare the properties of the algae that are retained on
each section of the VIMS floway. It was hypothesized that the algae in the upper section
of the VIMS floway, which is closest to where water enters, would have the highest
nutrient content. Those algae would likely absorb the nutrients in the highest quantity
because they are exposed to these components first as the water flows down the trough;
simple sedimentation would also likely be greater and contribute to the mineral (ash)
content. Table 4.1 gives the compositional analyses of the algae for the different
sections and harvest dates.
61
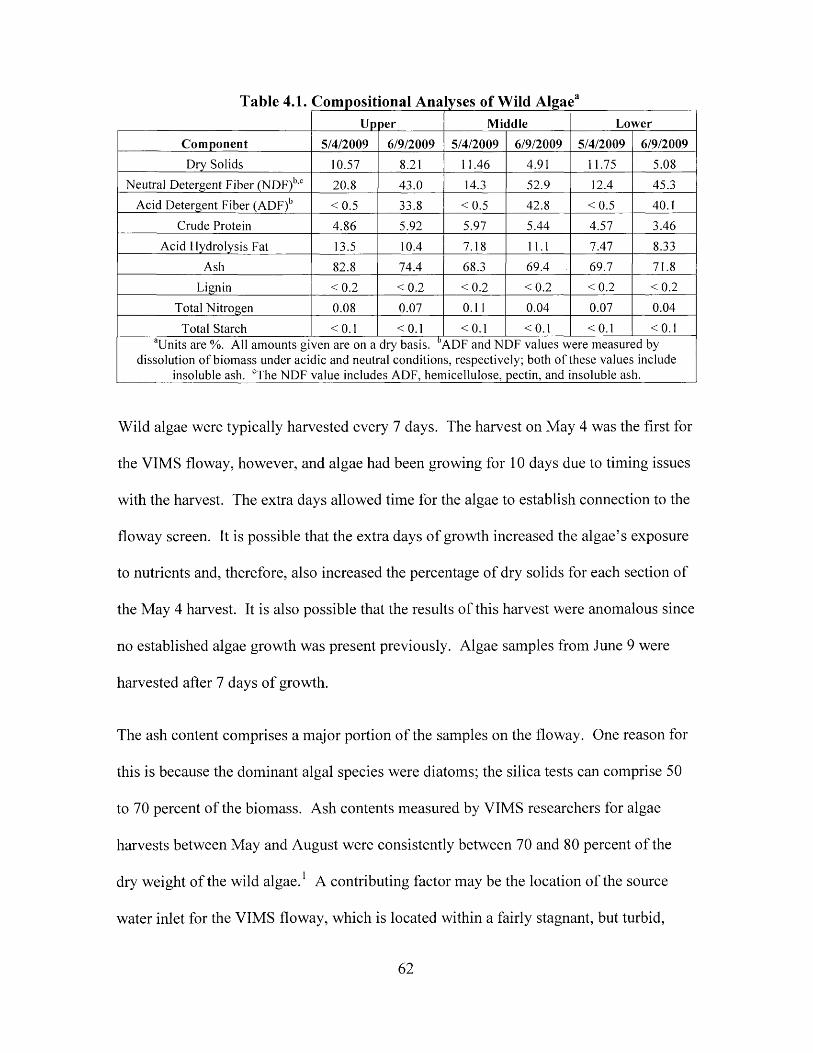
Table 4.1. Compositional Analyses of Wild AlgaeaUp per Middle Lower
Component 5/4/2009 6/9/2009 5/4/2009 6/9/2009 5/4/2009 6/9/2009
Dry Solids 10.57 8.21 11.46 4.91 11.75 5.08
Neutral Detergent Fiber (NDF)b,c 20.8 43.0 14.3 52.9 12.4 45.3
Acid Detergent Fiber (ADF)b < 0 .5 33.8 < 0 .5 42.8 < 0 .5 40.1
Crude Protein 4.86 5.92 5.97 5.44 4.57 3.46
Acid Hydrolysis Fat 13.5 10.4 7.18 11.1 7.47 8.33
Ash 82.8 74.4 68.3 69.4 69.7 71.8
Lignin < 0 .2 < 0 .2 < 0 .2 < 0 .2 < 0 .2 < 0 .2
Total Nitrogen 0.08 0.07 0.11 0.04 0.07 0.04
Total Starch < 0 .1 < 0.1 < 0.1 < 0.1 < 0.1 < 0.1aUnits are %. All amounts given are on a dry basis. ADF and NDF values were measured by
dissolution o f biomass under acidic and neutral conditions, respectively; both o f these values include insoluble ash. °The NDF value includes ADF, hemicellulose, pectin, and insoluble ash.______
Wild algae were typically harvested every 7 days. The harvest on May 4 was the first for
the VIMS floway, however, and algae had been growing for 10 days due to timing issues
with the harvest. The extra days allowed time for the algae to establish connection to the
floway screen. It is possible that the extra days of growth increased the algae’s exposure
to nutrients and, therefore, also increased the percentage of dry solids for each section of
the May 4 harvest. It is also possible that the results of this harvest were anomalous since
no established algae growth was present previously. Algae samples from June 9 were
harvested after 7 days of growth.
The ash content comprises a major portion of the samples on the floway. One reason for
this is because the dominant algal species were diatoms; the silica tests can comprise 50
to 70 percent of the biomass. Ash contents measured by VIMS researchers for algae
harvests between May and August were consistently between 70 and 80 percent of the
dry weight of the wild algae. 1 A contributing factor may be the location of the source
water inlet for the VIMS floway, which is located within a fairly stagnant, but turbid,
62
basin located in a section of the York River. Paul Richardson, Lab Manager for VIMS
professor Dr. Emmett Duffy, noted that ideally the VIMS floway inlet pipe should be
projected directly into the York River.2
The starch content of each wild algae sample was less than 0.1 percent, as shown in Table
4.1. The low starch content is unfavorable for ethanol production. The acid detergent
fiber and neutral detergent fiber values were high. Acid detergent fiber (ADF) and
neutral detergent fiber (NDF) contents may be different between samples due to the
differences in harvest times and climate conditions between harvests. The ADF portion
of the algae typically consists of lignin and cellulose whereas the NDF portion of the
algae usually consists of the ADF portion plus hemicellulose and pectin. There is often
a peak growth period during which the algae must be harvested. In a demonstration of
how to harvest the VIMS floway, Dr. Patrick Kangas of the University of Maryland noted
that if the algae are not harvested during this peak time, nutrient content may be lost.
This nutrient content includes nitrogen, phosphorus, and the simple and complex
carbohydrates required for cellular functions.4 The amount of lignin was determined to
be negligible in these samples.
The ADF and NDF portions in these samples include acid-insoluble ash; therefore, the
exact amounts of cellulose, hemicellulose, and pectin cannot be unambiguously
determined. As a result, the negligible ADF content in the samples from May 4 may be a
result of the longer growth time, which may have caused a drop in the available
carbohydrates in the form of cellulose, or a number of other factors, such as climatic
effects or inlet water variations, which would have caused the portion of acid-insoluble
ash to decrease. If cellulose and hemicellulose are present in addition to the acid-
63
insoluble ash, these carbohydrates should be beneficial in fermentation and
saccharification. A well-suited enzyme mixture could hydrolyze the cellulose portion
into fermentable sugars. Hemicellulose may also be hydrolyzed with an appropriate
enzyme mixture.
The May 4 harvest had higher nitrogen content in all three sections than the June 9
harvest. The May harvest also resulted in the middle section having the greatest amount
o f nitrogen of all samples analyzed. One possible reason for this result may be due to the
amount of algal coverage on the VIMS floway. If the biomass becomes too dense, or the
algal filaments too long, the wild algae may begin to slough from the upper section and
travel to the lower sections and become lodged.4 The increase in nitrogen and solids
content in the middle section, and solids content in the lower section, indicate that this
transfer may have taken place once the algal biomass in the upper section became too
dense.
Results o f the mineral analyses for each harvest can be found in Table 4.2. Mineral
content appears to be the highest in the upper section o f the VIMS floway for the May 4
analysis. For the June 9 harvest, only phosphorous, iron, and possibly zinc and copper
follow the trend o f decreasing as algae is harvested farther down the trough and away
from the water inlet. It should be noted that aside from phosphorous, iron, zinc and
copper, the June 9 harvest exhibited the highest mineral content in the middle section of
the VIMS floway. Due to the mixed results, the hypothesis that mineral content would be
highest in the upper sections of the floway is not fully supported. Therefore, no
conclusions can be drawn without further sampling and analyses.
64
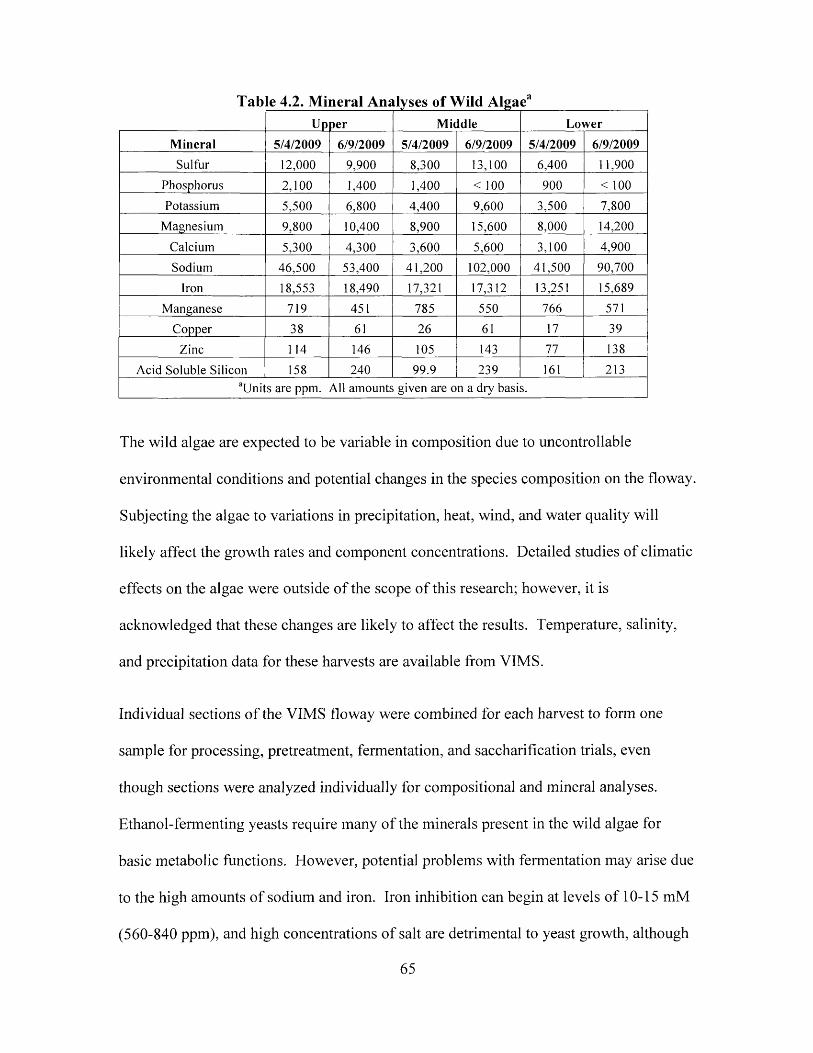
Tab e 4.2. Mineral Analyses of Wild AlgaeUp per Middle Lower
Mineral 5/4/2009 6/9/2009 5/4/2009 6/9/2009 5/4/2009 6/9/2009Sulfur 12,000 9,900 8,300 13,100 6,400 11,900
P hosp horus 2,100 1,400 1,400 < 100 900 < 100
P otassium 5,500 6,800 4,400 9,600 3,500 7,800
M a gn esiu m 9,800 10,400 8,900 15,600 8,000 14,200
C alciu m 5,300 4,300 3,600 5,600 3,100 4,900
Sod ium 46,500 53,400 41,200 102,000 41,500 90,700
Iron 18,553 18,490 17,321 17,312 13,251 15,689
M an gan ese 719 451 785 550 766 571
C opper 38 61 26 61 17 39
Z inc 114 146 105 143 77 138
A c id S o lu b le S ilico n 158 240 99.9 239 161 213aU n its are ppm . A ll am ounts g iv en are on a dry basis.
The wild algae are expected to be variable in composition due to uncontrollable
environmental conditions and potential changes in the species composition on the floway.
Subjecting the algae to variations in precipitation, heat, wind, and water quality will
likely affect the growth rates and component concentrations. Detailed studies of climatic
effects on the algae were outside of the scope of this research; however, it is
acknowledged that these changes are likely to affect the results. Temperature, salinity,
and precipitation data for these harvests are available from VIMS.
Individual sections o f the VIMS floway were combined for each harvest to form one
sample for processing, pretreatment, fermentation, and saccharification trials, even
though sections were analyzed individually for compositional and mineral analyses.
Ethanol-fermenting yeasts require many of the minerals present in the wild algae for
basic metabolic functions. However, potential problems with fermentation may arise due
to the high amounts of sodium and iron. Iron inhibition can begin at levels of 10-15 mM
(560-840 ppm), and high concentrations of salt are detrimental to yeast growth, although
65
inhibitory levels of these components depend upon the concentrations of other minerals
present.5
4.1.2. Spirulina
Spirulina were analyzed for the same compositional and mineral components as the wild
algae harvested from the VIMS floway. Results can be found in Table 4.3.
Table 4.3. Compositional and M ineral Analyses of SpirulinaaComponent Amount, in %Dry Solids 91.41
Neutral Detergent Fiber (NDF)b,c 1.86Acid Detergent Fiber (ADF)b < 0 .5
Crude Protein 76.8Acid Hydrolysis Fat 6.28
Ash 7.13Lignin < 0 .2
Total Nitrogen 11.2Total Starch 2.95
Mineral Amount, in ppmSulfur 10,200
Phosphorus 12,800Potassium 18,900
Magnesium 3,600Calcium 1,300Sodium 11,700
Iron 811Manganese 35
Copper 1Zinc 8
Acid Soluble Silicon NAaAll amounts given are on a dry basis. bADF and NDF values were measured by dissolution o f biomass under acidic and neutral conditions, respectively; both o f
these values include insoluble ash. cThe NDF value includes ADF, hemicellulose, pectin, and insoluble ash.
Several differences exist between the wild algae and Spirulina compositions. Most
notably, the NDF and ADF concentrations are much lower in the Spirulina, and the total
66
starch content is nearly three percent. These results suggest the carbohydrates present are
likely to consist of more simple carbohydrates versus the complex cellulose and
hemicellulose.
The crude protein content is over 12 times higher in the Spirulina than in the wild algae.
The total nitrogen content is also much higher in the Spirulina, and is likely due to the
high percentage of protein. Ash content is approximately 7 times lower, making the
Spirulina a cleaner feedstock. The lower ash content may also contribute to the lower
NDF and ADF contents since these values do contain insoluble ash.
Mineral content comparisons between the wild algae and Spirulina are mixed.
Phosphorous and potassium are much higher in the Spirulina while sodium and iron are
much lower. Solids concentrations used in Spirulina fermentation trials never exceeded
15 percent. Thus, the mineral contents reported in Table 4.3 will be reduced by a factor
o f six, and are unlikely to negatively affect fermentation.
4.2. Cell Disruption
4.2.1. Wild Algae Cell Disruption
The dominant species of algae growing on the VIMS floway is Melosira nummuloides.6
These algae cells are characterized by a silica sheath that assembles and grows around the
actual algae cell walls. As the algae cells divide and multiply, the cells are held together
by valves that essentially lock the algae into doublets and triplets of cells (Figure 2.13,
section 2.3.3.1.2).7
67
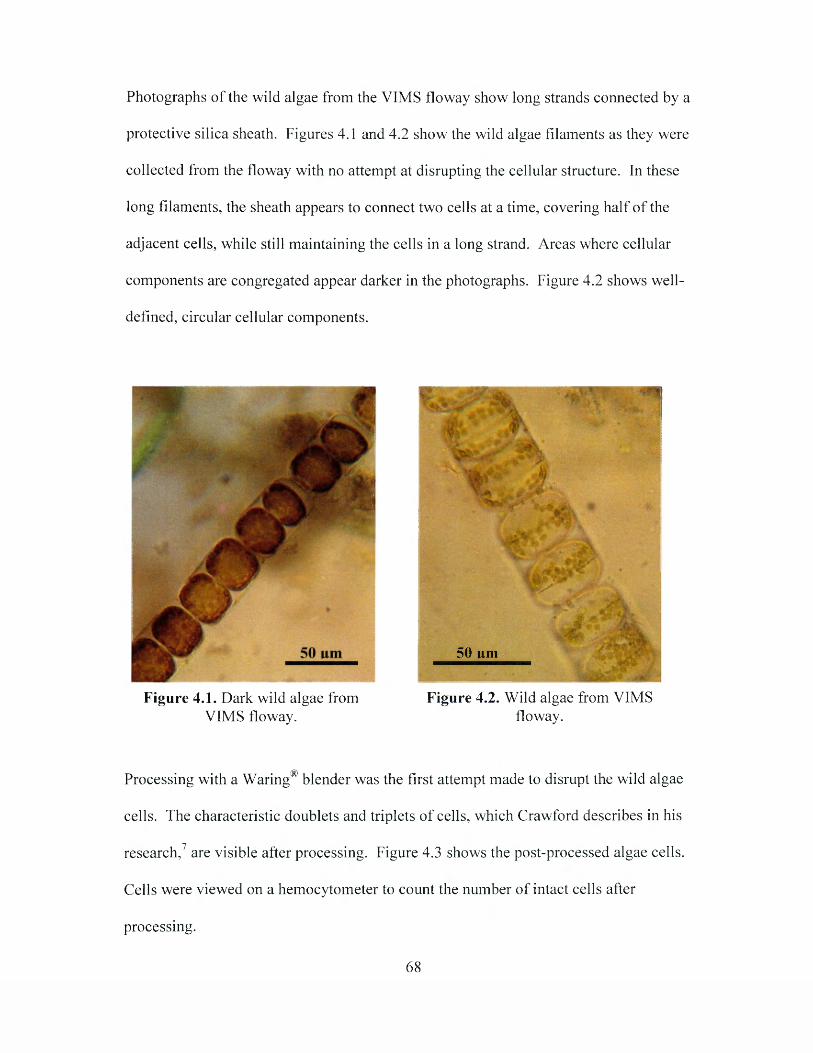
Photographs of the wild algae from the VIMS floway show long strands connected by a
protective silica sheath. Figures 4.1 and 4.2 show the wild algae filaments as they were
collected from the floway with no attempt at disrupting the cellular structure. In these
long filaments, the sheath appears to connect two cells at a time, covering half of the
adjacent cells, while still maintaining the cells in a long strand. Areas where cellular
components are congregated appear darker in the photographs. Figure 4.2 shows well-
defined, circular cellular components.
50 uni
Figure 4.1. Dark wild algae from Figure 4.2. Wild algae from VIMSVIMS floway. floway.
Processing with a Waring® blender was the first attempt made to disrupt the wild algae
cells. The characteristic doublets and triplets o f cells, which Crawford describes in his
research,7 are visible after processing. Figure 4.3 shows the post-processed algae cells.
Cells were viewed on a hemocytometer to count the number of intact cells after
processing.
68
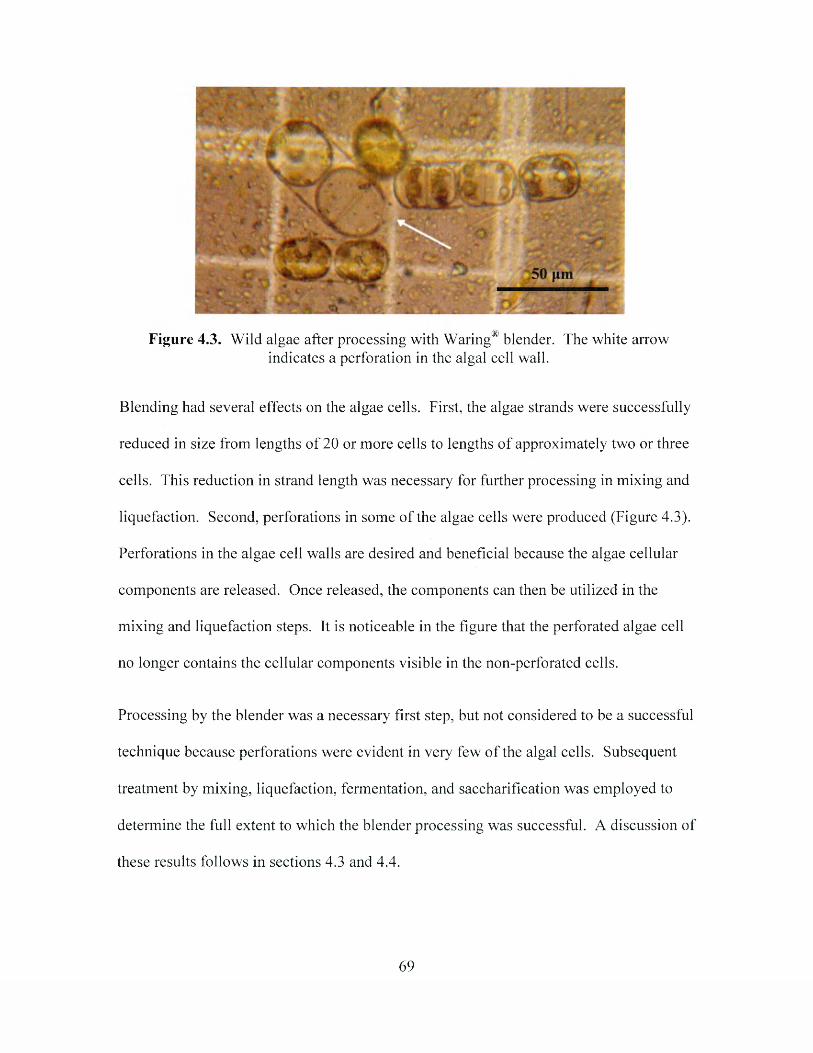
Figure 4.3. Wild algae after processing with Waring® blender. The white arrow indicates a perforation in the algal cell wall.
Blending had several effects on the algae cells. First, the algae strands were successfully
reduced in size from lengths of 20 or more cells to lengths of approximately two or three
cells. This reduction in strand length was necessary for further processing in mixing and
liquefaction. Second, perforations in some of the algae cells were produced (Figure 4.3).
Perforations in the algae cell walls are desired and beneficial because the algae cellular
components are released. Once released, the components can then be utilized in the
mixing and liquefaction steps. It is noticeable in the figure that the perforated algae cell
no longer contains the cellular components visible in the non-perforated cells.
Processing by the blender was a necessary first step, but not considered to be a successful
technique because perforations were evident in very few of the algal cells. Subsequent
treatment by mixing, liquefaction, fermentation, and saccharification was employed to
determine the full extent to which the blender processing was successful. A discussion of
these results follows in sections 4.3 and 4.4.
69
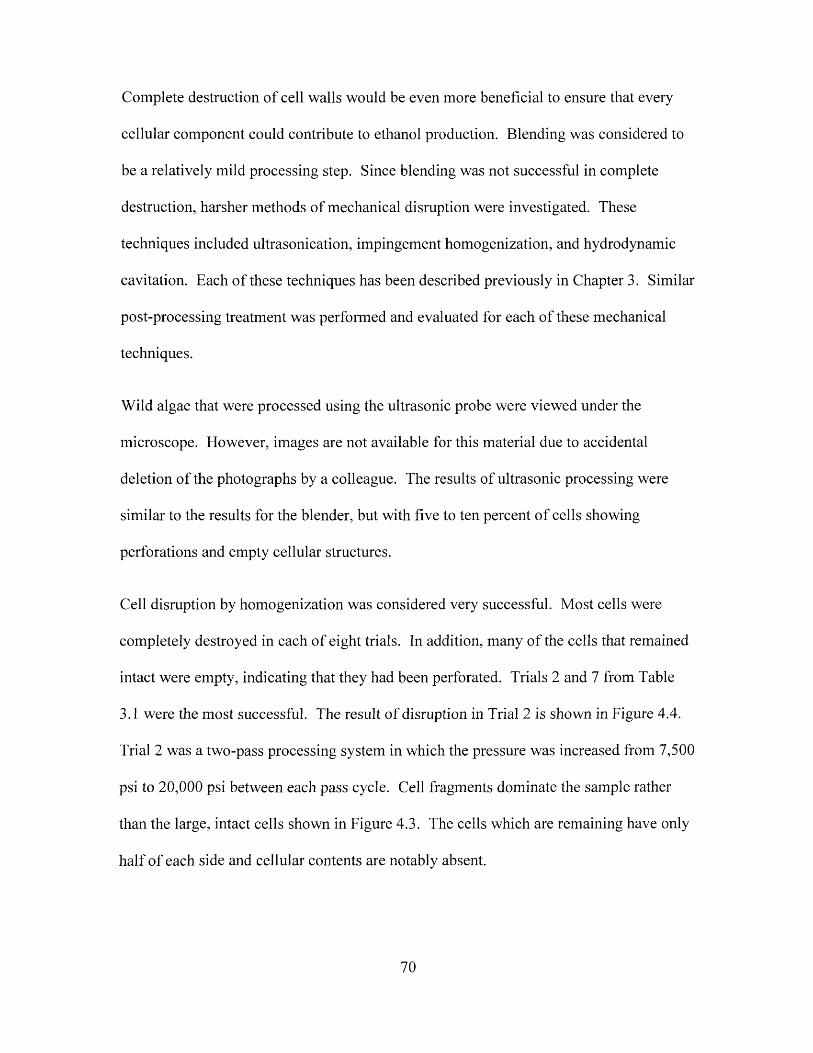
Complete destruction of cell walls would be even more beneficial to ensure that every
cellular component could contribute to ethanol production. Blending was considered to
be a relatively mild processing step. Since blending was not successful in complete
destruction, harsher methods of mechanical disruption were investigated. These
techniques included ultrasonication, impingement homogenization, and hydrodynamic
cavitation. Each of these techniques has been described previously in Chapter 3. Similar
post-processing treatment was performed and evaluated for each of these mechanical
techniques.
Wild algae that were processed using the ultrasonic probe were viewed under the
microscope. However, images are not available for this material due to accidental
deletion of the photographs by a colleague. The results of ultrasonic processing were
similar to the results for the blender, but with five to ten percent o f cells showing
perforations and empty cellular structures.
Cell disruption by homogenization was considered very successful. Most cells were
completely destroyed in each o f eight trials. In addition, many of the cells that remained
intact were empty, indicating that they had been perforated. Trials 2 and 7 from Table
3.1 were the most successful. The result o f disruption in Trial 2 is shown in Figure 4.4.
Trial 2 was a two-pass processing system in which the pressure was increased from 7,500
psi to 20,000 psi between each pass cycle. Cell fragments dominate the sample rather
than the large, intact cells shown in Figure 4.3. The cells which are remaining have only
half of each side and cellular contents are notably absent.
70
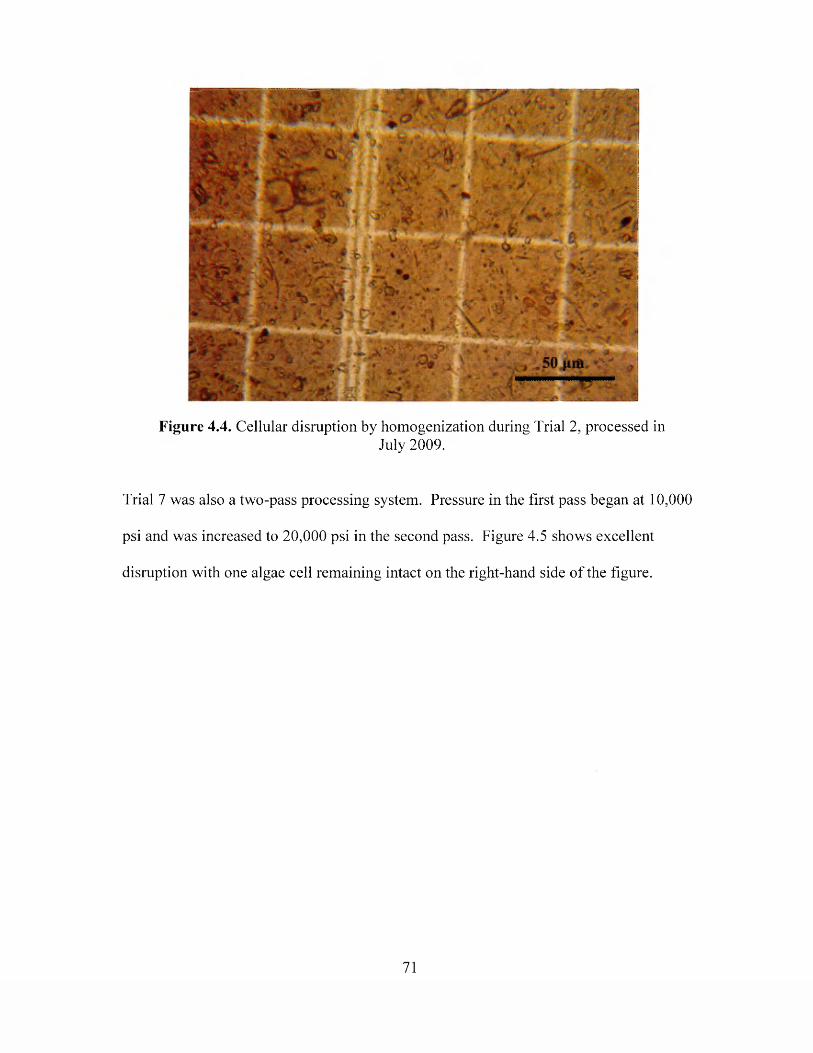
Figure 4.4. Cellular disruption by homogenization during Trial 2, processed inJuly 2009.
Trial 7 was also a two-pass processing system. Pressure in the first pass began at 10,000
psi and was increased to 20,000 psi in the second pass. Figure 4.5 shows excellent
disruption with one algae cell remaining intact on the right-hand side of the figure.
71
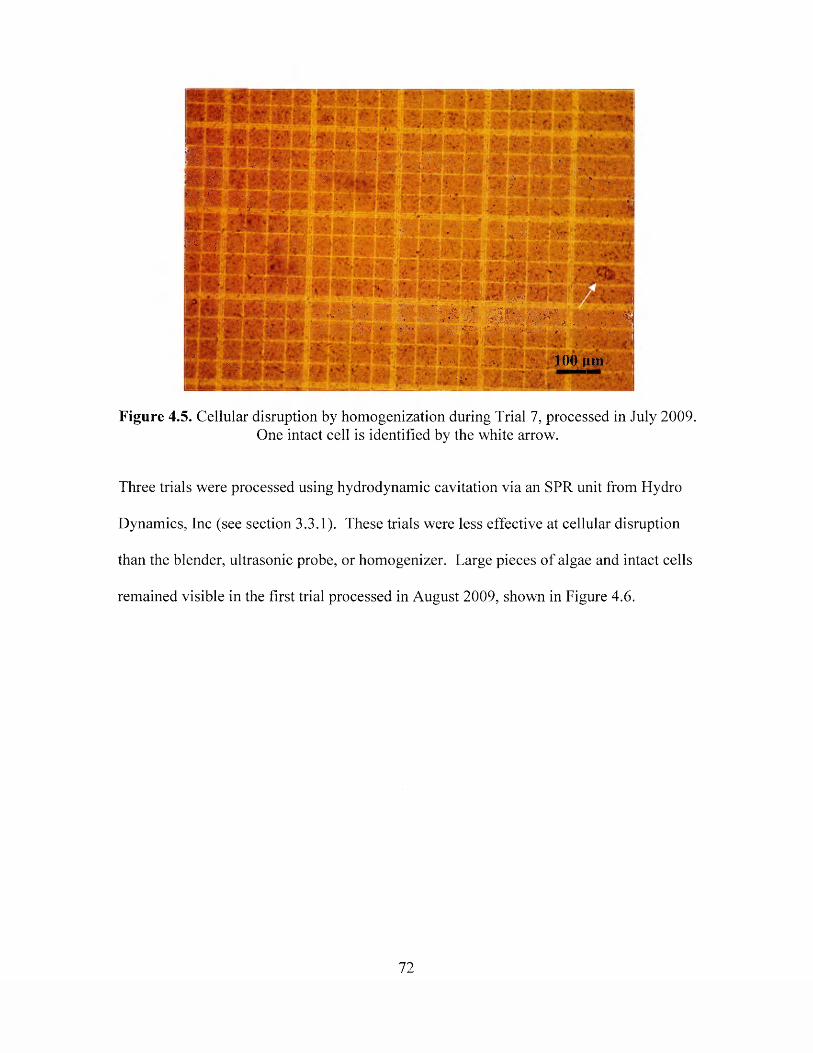
>• V . i : •? -- ,
S | f •' • - * • : i f f .. •• • • .*■ * .• . * . ’^ ^ ' * W ■• v* < ,ysv V * - <■' . ' v i ? - , X -. t . •- :♦"
U S <* i- ■,' '3k.-*VKfSti’*J P : •’.' •I Tv% *f' £ ^ &
* ~ 11 88888811. (88SB>&;-<! :,V. •’• . .r v •••:•'*• ■■••• .'.-•. • '-• '•. •■■ =•..- •.. • ,V • -
: 31KMSEl 5W«B’ ' •., C. t - « • ■- -r. * ’ lO ^ im*■ '’ -’;<f i l . “ ,V>- » I '' A ‘ J*. ."**?** v 3 i * *'* *■••- i * * Aa .. -' \ ••'
Figure 4.5. Cellular disruption by homogenization during Trial 7, processed in July 2009. One intact cell is identified by the white arrow.
Three trials were processed using hydrodynamic cavitation via an SPR unit from Hydro
Dynamics, Inc (see section 3.3.1). These trials were less effective at cellular disruption
than the blender, ultrasonic probe, or homogenizer. Large pieces o f algae and intact cells
remained visible in the first trial processed in August 2009, shown in Figure 4.6.
72
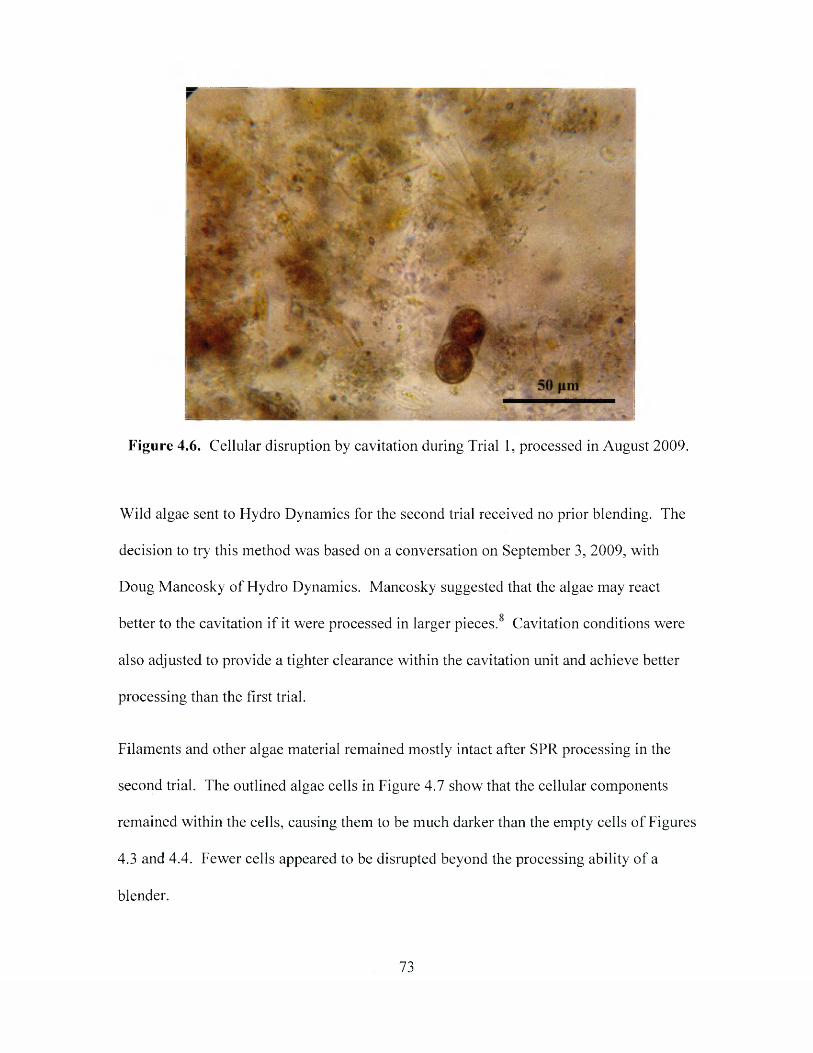
Figure 4.6. Cellular disruption by cavitation during Trial 1, processed in August 2009.
Wild algae sent to Hydro Dynamics for the second trial received no prior blending. The
decision to try this method was based on a conversation on September 3, 2009, with
Doug Mancosky of Hydro Dynamics. Mancosky suggested that the algae may react
better to the cavitation if it were processed in larger pieces. Cavitation conditions were
also adjusted to provide a tighter clearance within the cavitation unit and achieve better
processing than the first trial.
Filaments and other algae material remained mostly intact after SPR processing in the
second trial. The outlined algae cells in Figure 4.7 show that the cellular components
remained within the cells, causing them to be much darker than the empty cells of Figures
4.3 and 4.4. Fewer cells appeared to be disrupted beyond the processing ability of a
blender.
73
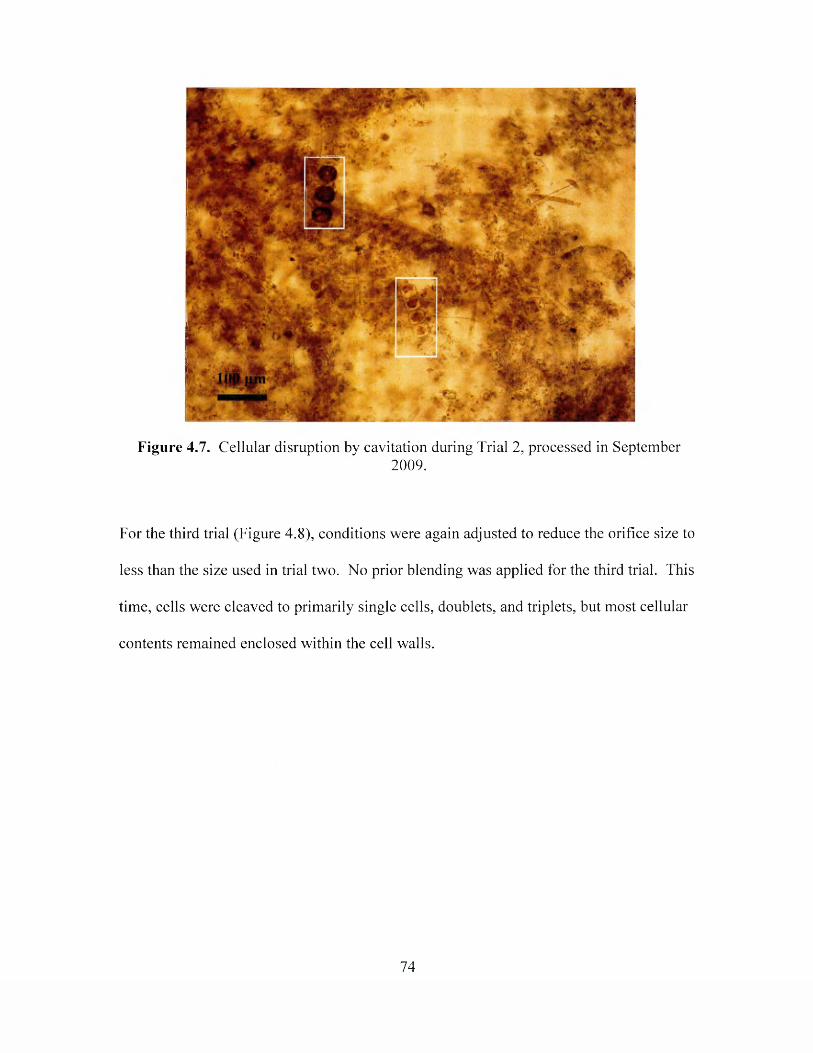
Figure 4.7. Cellular disruption by cavitation during Trial 2, processed in September2009.
For the third trial (Figure 4.8), conditions were again adjusted to reduce the orifice size to
less than the size used in trial two. No prior blending was applied for the third trial. This
time, cells were cleaved to primarily single cells, doublets, and triplets, but most cellular
contents remained enclosed within the cell walls.
74
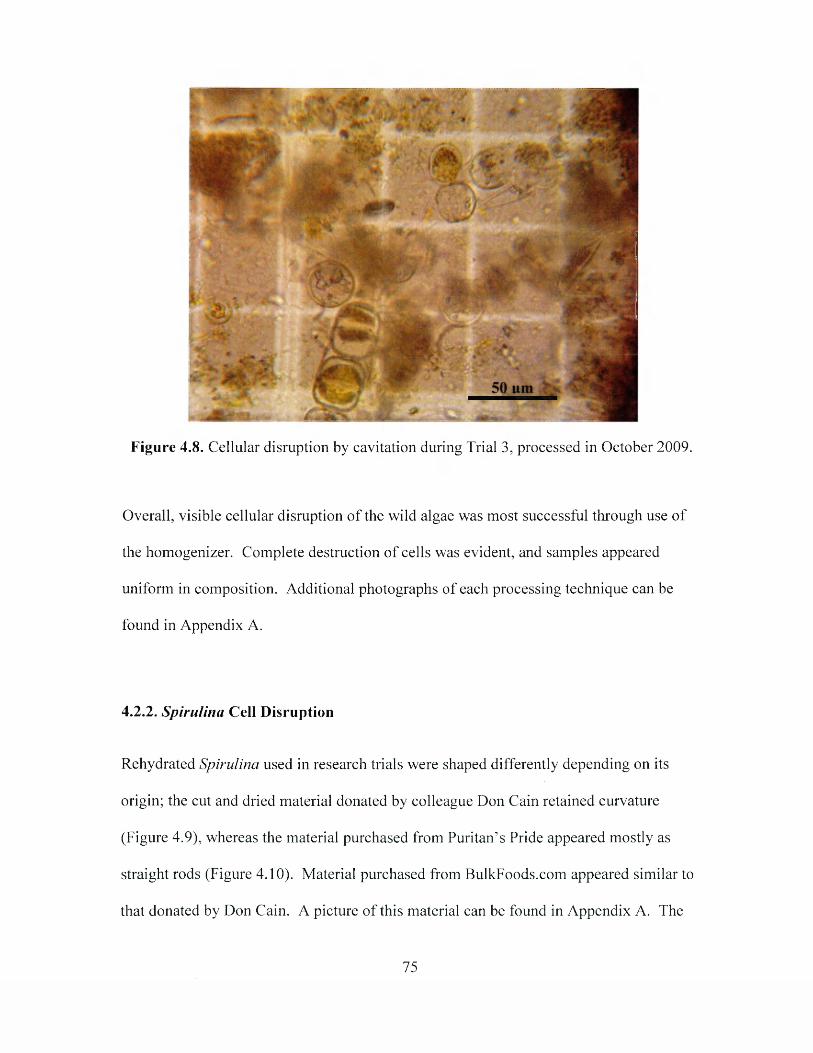
Figure 4.8. Cellular disruption by cavitation during Trial 3, processed in October 2009.
Overall, visible cellular disruption of the wild algae was most successful through use of
the homogenizer. Complete destruction of cells was evident, and samples appeared
uniform in composition. Additional photographs of each processing technique can be
found in Appendix A.
4.2.2. Spirulina Cell Disruption
Rehydrated Spirulina used in research trials were shaped differently depending on its
origin; the cut and dried material donated by colleague Don Cain retained curvature
(Figure 4.9), whereas the material purchased from Puritan’s Pride appeared mostly as
straight rods (Figure 4.10). Material purchased from BulkFoods.com appeared similar to
that donated by Don Cain. A picture of this material can be found in Appendix A. The
75
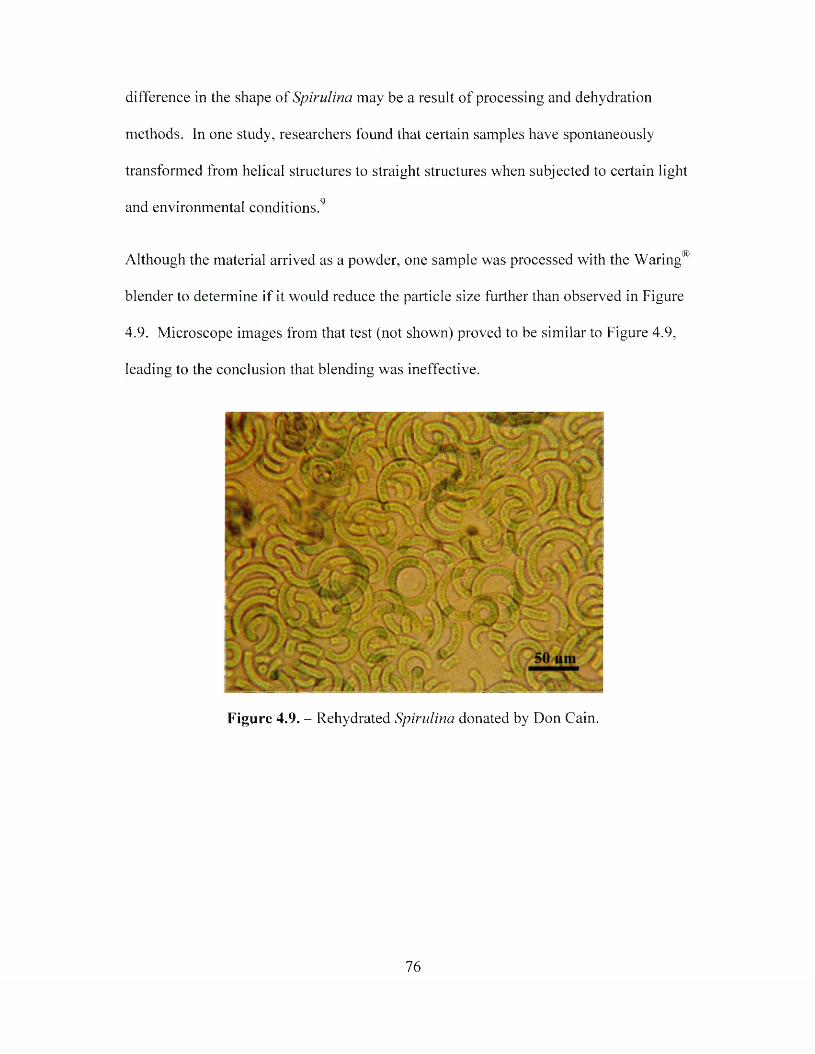
difference in the shape of Spirulina may be a result o f processing and dehydration
methods. In one study, researchers found that certain samples have spontaneously
transformed from helical structures to straight structures when subjected to certain light
and environmental conditions.9
Although the material arrived as a powder, one sample was processed with the Waring®
blender to determine if it would reduce the particle size further than observed in Figure
4.9. Microscope images from that test (not shown) proved to be similar to Figure 4.9,
leading to the conclusion that blending was ineffective.
Figure 4.9. - Rehydrated Spirulina donated by Don Cain.
76
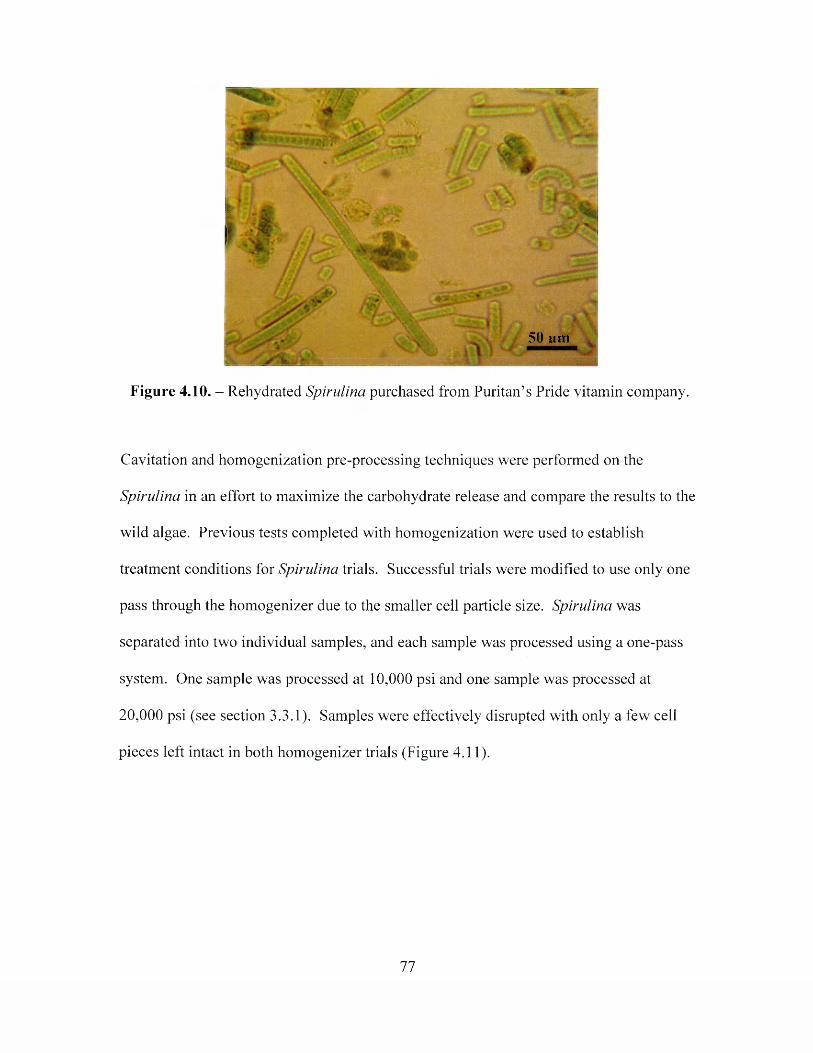
50 um
Figure 4.10. - Rehydrated Spirulina purchased from Puritan’s Pride vitamin company.
Cavitation and homogenization pre-processing techniques were performed on the
Spirulina in an effort to maximize the carbohydrate release and compare the results to the
wild algae. Previous tests completed with homogenization were used to establish
treatment conditions for Spirulina trials. Successful trials were modified to use only one
pass through the homogenizer due to the smaller cell particle size. Spirulina was
separated into two individual samples, and each sample was processed using a one-pass
system. One sample was processed at 10,000 psi and one sample was processed at
20,000 psi (see section 3.3.1). Samples were effectively disrupted with only a few cell
pieces left intact in both homogenizer trials (Figure 4.11).
77
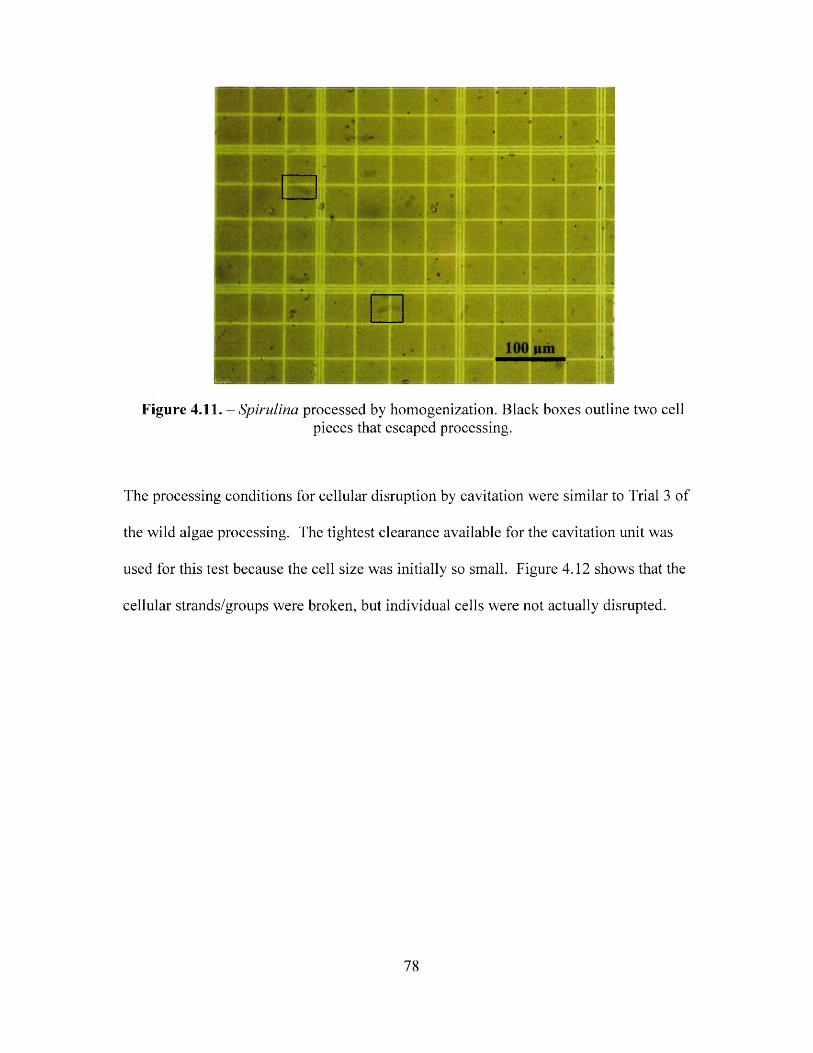
H R
Figure 4.11. - Spirulina processed by homogenization. Black boxes outline two cellpieces that escaped processing.
The processing conditions for cellular disruption by cavitation were similar to Trial 3 of
the wild algae processing. The tightest clearance available for the cavitation unit was
used for this test because the cell size was initially so small. Figure 4.12 shows that the
cellular strands/groups were broken, but individual cells were not actually disrupted.
78
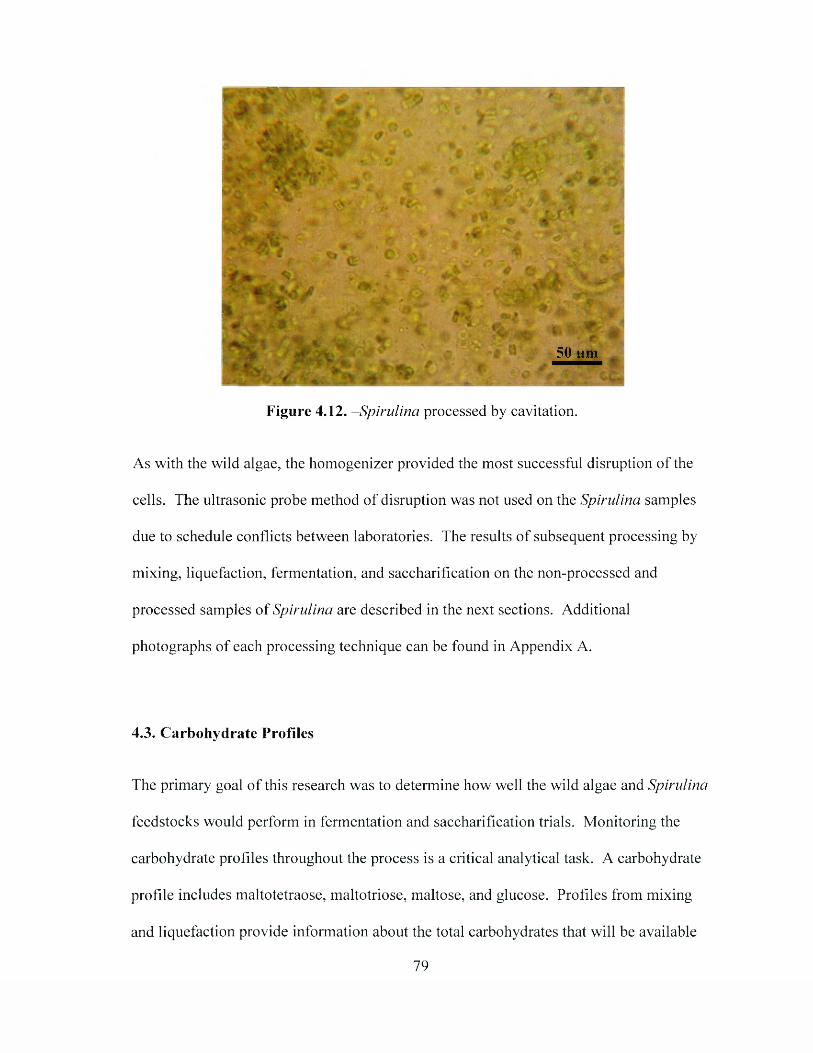
50 urn
Figure 4.12. -Spirulina processed by cavitation.
As with the wild algae, the homogenizer provided the most successful disruption of the
cells. The ultrasonic probe method of disruption was not used on the Spirulina samples
due to schedule conflicts between laboratories. The results of subsequent processing by
mixing, liquefaction, fermentation, and saccharification on the non-processed and
processed samples of Spirulina are described in the next sections. Additional
photographs of each processing technique can be found in Appendix A.
4.3. Carbohydrate Profiles
The primary goal o f this research was to determine how well the wild algae and Spirulina
feedstocks would perform in fermentation and saccharification trials. Monitoring the
carbohydrate profiles throughout the process is a critical analytical task. A carbohydrate
profile includes maltotetraose, maltotriose, maltose, and glucose. Profiles from mixing
and liquefaction provide information about the total carbohydrates that will be available
79
to yeast during fermentation. Saccharification trial profiles are critical because they
allow for evaluation of carbohydrate production kinetics within the wild algae or
Spirulina system. A sample in which simple carbohydrates are produced quickly will
ultimately lead to shorter fermentation times and increased through-put of large-scale
ethanol operations, but yeast could potentially experience “sugar shock” (also called the
Crabtree effect) if high concentrations of glucose are available too quickly.5 Extended
carbohydrate release times require larger holding vessels and a potential increase in
capital expenditures in order to achieve the same large-scale output level, but may
ultimately provide better fermentation results.
4.3.1. Wild Algae Carbohydrates
HPLC was used to analyze the carbohydrate profiles of samples from mixing and
liquefaction. Fermentation and saccharification carbohydrate profiles were also
developed by monitoring these steps at selected time intervals. “Mid Fermentation” or
“Mid Saccharification” samples were analyzed between 16 and 24 hours after the start of
fermentation. Samples were also analyzed at the end of each trial to determine the
differences in carbohydrate profiles due to conversion of complex sugars to simple sugars
or ethanol. End points were determined by considering several factors, including total
carbohydrates, usable carbohydrates, and glucose.
Prior to attempts at cellular disruption or pretreatment, a trial was completed on three
samples of wild algae to determine the carbohydrate profile and fermentability of the
untreated substrate alone. Samples were collected from the same sections of the VIMS
80
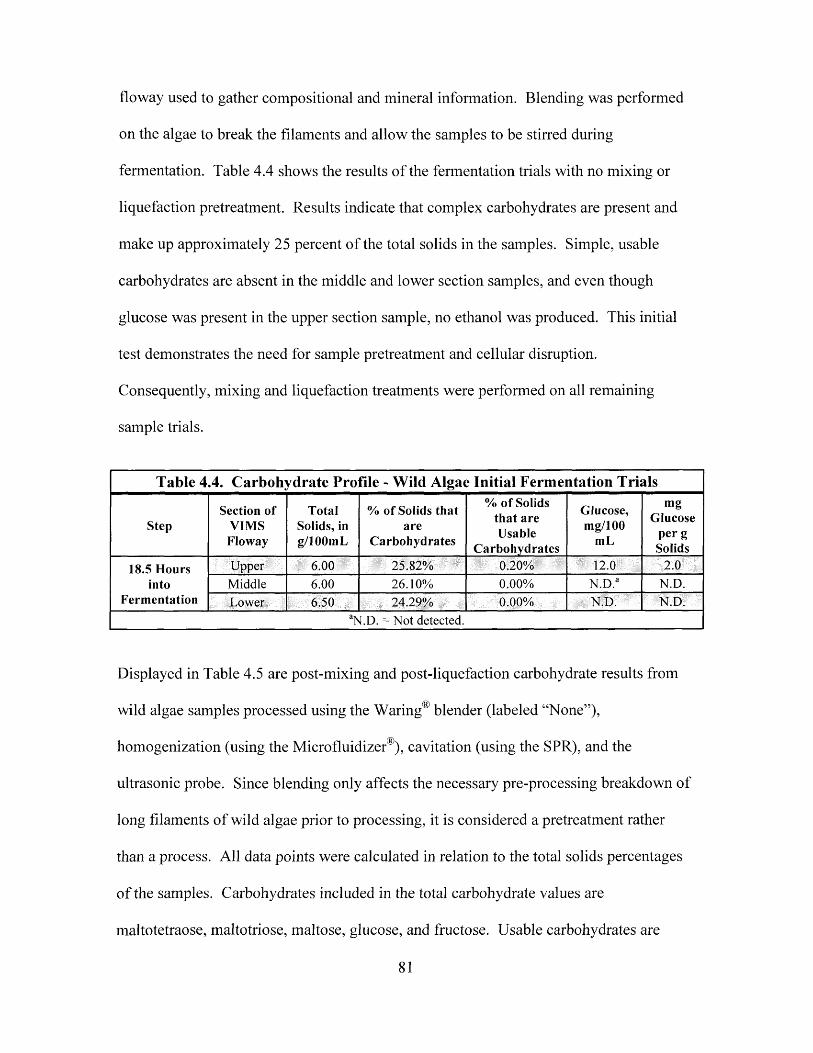
floway used to gather compositional and mineral information. Blending was performed
on the algae to break the filaments and allow the samples to be stirred during
fermentation. Table 4.4 shows the results of the fermentation trials with no mixing or
liquefaction pretreatment. Results indicate that complex carbohydrates are present and
make up approximately 25 percent of the total solids in the samples. Simple, usable
carbohydrates are absent in the middle and lower section samples, and even though
glucose was present in the upper section sample, no ethanol was produced. This initial
test demonstrates the need for sample pretreatment and cellular disruption.
Consequently, mixing and liquefaction treatments were performed on all remaining
sample trials.
Table 4.4. Carbohydrate Profile - Wild Algae Initial Fermentation Trials
StepSection of
VIMS Floway
Total Solids, in g/lOOmL
% of Solids that are
Carbohydrates
% of Solids that are Usable
Carbohydrates
Glucose,mg/100
mL
mgGlucose
pergSolids
18.5 Hours into
Fermentation
Upper 6.00 ■ 25.82% 0.20% 12.0 2.0Middle 6.00 26.10% 0.00% N.D.a N.D.Lower 6.50 24.29% 0.00% N.D. N.D.
aN.D. = Not detected.
Displayed in Table 4.5 are post-mixing and post-liquefaction carbohydrate results from
wild algae samples processed using the Waring® blender (labeled “None”),
homogenization (using the Microfluidizer®), cavitation (using the SPR), and the
ultrasonic probe. Since blending only affects the necessary pre-processing breakdown of
long filaments of wild algae prior to processing, it is considered a pretreatment rather
than a process. All data points were calculated in relation to the total solids percentages
o f the samples. Carbohydrates included in the total carbohydrate values are
maltotetraose, maltotriose, maltose, glucose, and fructose. Usable carbohydrates are
81
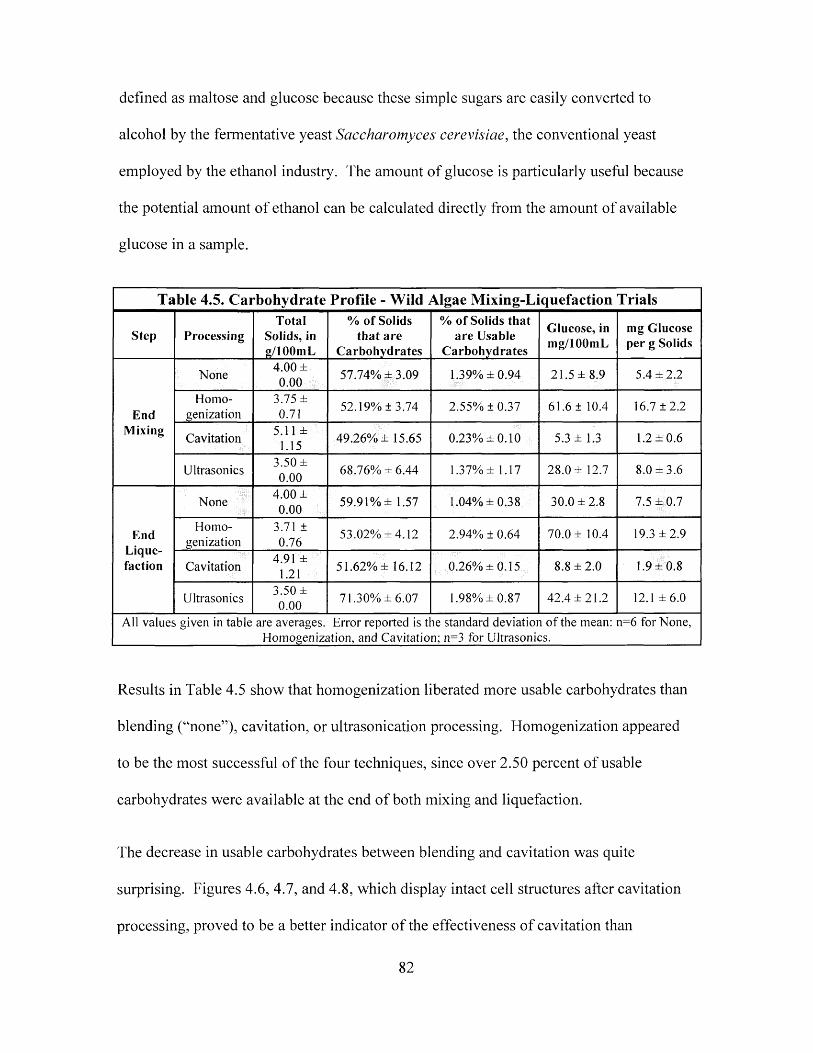
defined as maltose and glucose because these simple sugars are easily converted to
alcohol by the fermentative yeast Saccharomyces cerevisiae, the conventional yeast
employed by the ethanol industry. The amount of glucose is particularly useful because
the potential amount of ethanol can be calculated directly from the amount of available
glucose in a sample.
Table 4.5. Carbohydrate Profile - Wild Algae Mixing-Liquefaction Trials
Step ProcessingTotal
Solids, in g/lOOmL
% of Solids that are
Carbohydrates
% of Solids that are Usable
Carbohydrates
Glucose, in mg/lOOmL
mg Glucose per g Solids
EndMixing
None 4.00 ± 0.00 57.74% ± 3 .0 9 1.39% ± 0 .9 4 21.5 ± 8 .9 5.4 ± 2 .2
Homogenization
3.75 ± 0.71 52.19% ± 3 .74 2.55% ± 0.37 61.6 ± 10.4 16.7 ± 2 .2
Cavitation 5.11 ± 1.15 49.26% ± 15.65 0.23% ± 0 .1 0 5.3 ± 1.3 1.2 ± 0 .6
Ultrasonics3.50 ± 0.00
68.76% ± 6.44 1.37% ± 1.17 28.0 ± 12.7 8.0 ± 3 .6
EndLiquefaction
None 4.00 ± 0.00
59.91% ± 1.57 1.04% ± 0 .3 8 30.0 ± 2 .8 7.5 ± 0 .7
Homogenization
3.71 ± 0.76
53.02% ± 4 .1 2 2.94% ± 0.64 70.0 ± 10.4 19.3 ± 2 .9
Cavitation 4.91 ± 1.21 51.62% ± 16.12 0.26% ± 0 .1 5 8.8 ± 2 .0 1.9 ± 0 .8
Ultrasonics3.50 ± 0.00 71.30% ± 6 .0 7 1.98% ± 0 .8 7 42.4 ± 2 1 .2 12.1 ± 6 .0
All values given in table are averages. Error reported is the standard deviation o f the mean: n=6 for None, Homogenization, and Cavitation; n=3 for Ultrasonics.
Results in Table 4.5 show that homogenization liberated more usable carbohydrates than
blending (“none”), cavitation, or ultrasonication processing. Homogenization appeared
to be the most successful of the four techniques, since over 2.50 percent of usable
carbohydrates were available at the end of both mixing and liquefaction.
The decrease in usable carbohydrates between blending and cavitation was quite
surprising. Figures 4.6, 4.7, and 4.8, which display intact cell structures after cavitation
processing, proved to be a better indicator of the effectiveness of cavitation than
82
originally anticipated. Results from each o f the wild algae processing trials using
cavitation were averaged due to individual data between the three trials varying
minimally.
Table 4.6 gives the carbohydrate profile of the wild algae in fermentation. Typically, the
total carbohydrates should decrease in a sample as it is fermenting because enzymes are
converting complex sugars into simple sugars which the yeast then consumes.
Processing by ultrasonication reduced the percentage of solids that are carbohydrates by
just 2.15 percent between the beginning and end of fermentation. Blending reduced this
same parameter by less than half o f a percent, and cavitation gave a slight increase o f less
than one tenth o f a percent. Minimal to no reduction in total carbohydrates between the
beginning and end stages suggests that the yeast were not able to consume the sugars
present, likely due to the inability o f the enzymes to convert the complex carbohydrates
into simple carbohydrates. An ideal scenario in fermentation would have involved the
percent o f solids that are carbohydrates being reduced to less than ten percent.
83
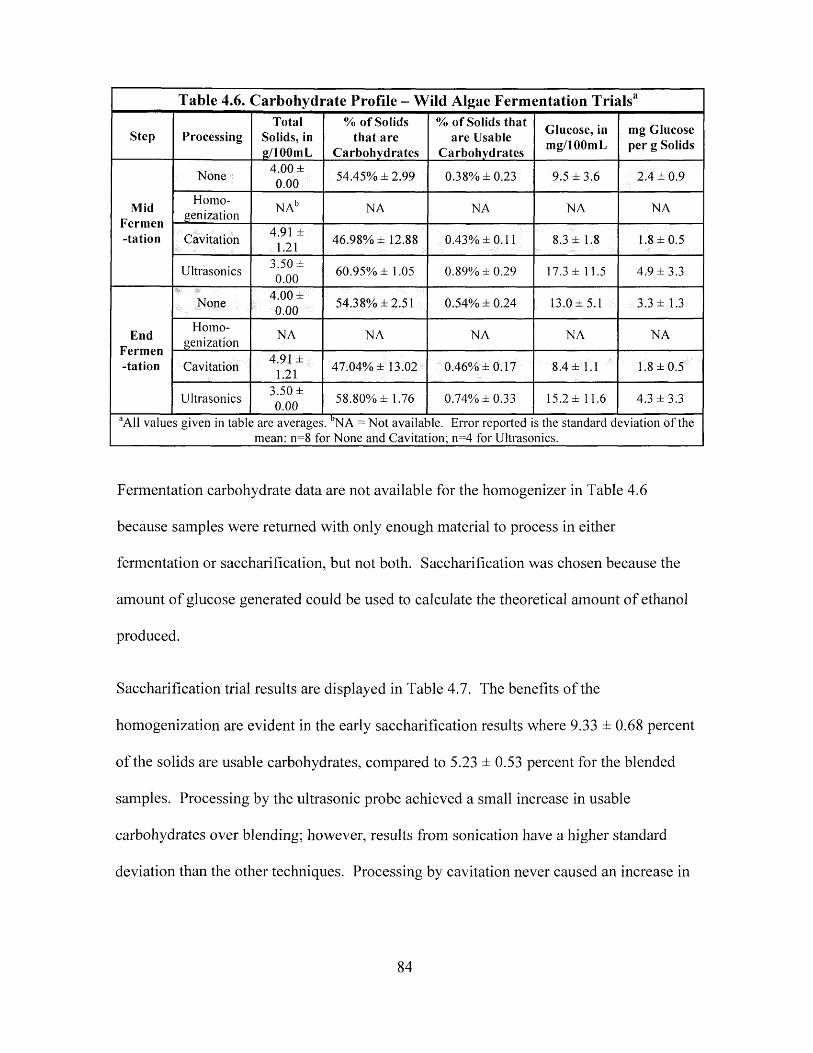
Table 4.6. Carbohydrate Profile - Wild Algae Fermentation Trials3
Step ProcessingTotal
Solids, in g/lOOmL
% of Solids that are
Carbohydrates
% of Solids that are Usable
Carbohydrates
Glucose, in mg/100m L
mg Glucose per g Solids
MidFermen-tation
None 4.00 ± 0.00
54.45% ± 2.99 0.38% ± 0 .2 3 9.5 ± 3.6 2.4 ± 0.9
Homogenization N A b NA NA NA NA
Cavitation 4.91 ± 1.21
46.98% ± 12.88 0.43% ±0.11 8.3 ± 1 .8 1.8 ± 0 .5
Ultrasonics 3.50 ± 0.00
60.95% ± 1.05 0.89% ± 0.29 17.3 ± 11.5 4,9 ± 3 .3
EndFermen-tation
None 4.00 ± 0.00 54.38% ±2.51 0.54% ± 0.24 13.0 ± 5 .1 3.3 ± 1 .3
Homogenization
NA NA NA NA NA
Cavitation 4.91 ± 1.21 47.04% ± 1 3 .0 2 0.46% ± 0 .1 7 8.4 ± 1.1 1.8 ± 0 .5
Ultrasonics3.50 ± 0.00
58.80% ± 1.76 0.74% ± 0 .3 3 15.2 ± 11.6 4.3 ± 3 .3
aAll values given in table are averages. bNA =: Not available. Error reported is the standard deviation o f the ________________________mean: n=8 for None and Cavitation; n=4 for Ultrasonics.________________________
Fermentation carbohydrate data are not available for the homogenizer in Table 4.6
because samples were returned with only enough material to process in either
fermentation or saccharification, but not both. Saccharification was chosen because the
amount o f glucose generated could be used to calculate the theoretical amount of ethanol
produced.
Saccharification trial results are displayed in Table 4.7. The benefits o f the
homogenization are evident in the early saccharification results where 9.33 ± 0.68 percent
of the solids are usable carbohydrates, compared to 5.23 ± 0.53 percent for the blended
samples. Processing by the ultrasonic probe achieved a small increase in usable
carbohydrates over blending; however, results from sonication have a higher standard
deviation than the other techniques. Processing by cavitation never caused an increase in
84
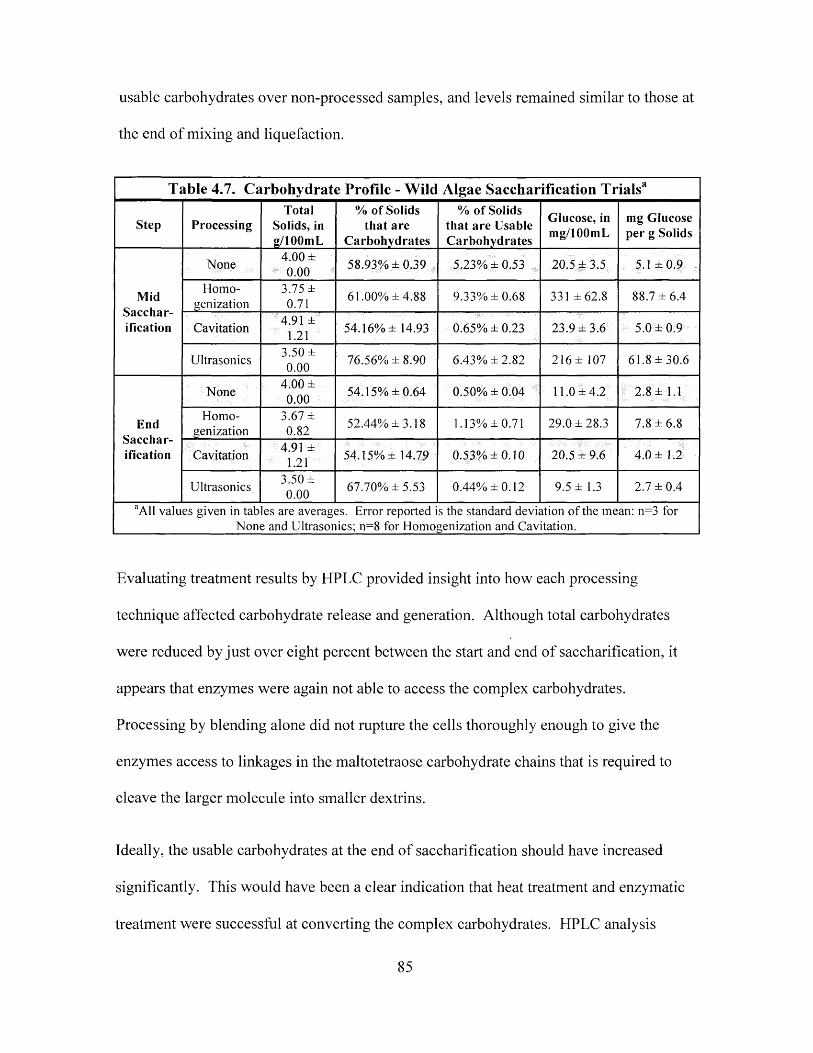
usable carbohydrates over non-processed samples, and levels remained similar to those at
the end of mixing and liquefaction.
Table 4.7. Carbohydrate Profile - Wild Algae Saccharification Trials3
Step ProcessingTotal
Solids, in g/lOOmL
% of Solids that are
Carbohydrates
% of Solids that are Usable Carbohydrates
Glucose, in mg/lOOmL
mg Glucose per g Solids
MidSaccharification
None4.00 ± 0.00 58.93% ± 0.39 5.23% ± 0 .5 3 20.5 ± 3 .5 5.1 ± 0 .9
Homogenization
3.75 ± 0.71 61.00% ± 4 .8 8 9.33% ± 0.68 331 ± 6 2 .8 88.7 ± 6 .4
Cavitation 4.91 ± 1.21 54.16% ± 14.93 0.65% ± 0.23 23.9 ± 3 .6 5.0 ± 0 .9
Ultrasonics3.50 ± 0.00 76.56% ± 8.90 6.43% ± 2.82 216 ± 107 61.8 ± 3 0 .6
EndSaccharification
None 4.00 ± 0.00
54.15% ± 0 .6 4 0.50% ± 0.04 11.0 ± 4 .2 2.8 ± 1.1
Homogenization
3.67 ± 0.82 52.44% ± 3 .1 8 1.13% ± 0 .71 29.0 ± 28 .3 7.8 ± 6 .8
Cavitation4.91 ±
1.21 54.15% ± 14.79 0.53% ± 0 .1 0 20.5 ± 9.6 4.0 ± 1 .2
Ultrasonics3.50 ± 0.00 67.70% ± 5 .5 3 0.44% ± 0 .1 2 9.5 ± 1.3 2.7 ± 0 .4
aAll values given in tables are averages. Error reported is the standard deviation o f the mean: n=3 for None and Ultrasonics; n=8 for Homogenization and Cavitation.
Evaluating treatment results by HPLC provided insight into how each processing
technique affected carbohydrate release and generation. Although total carbohydrates
were reduced by just over eight percent between the start and end o f saccharification, it
appears that enzymes were again not able to access the complex carbohydrates.
Processing by blending alone did not rupture the cells thoroughly enough to give the
enzymes access to linkages in the maltotetraose carbohydrate chains that is required to
cleave the larger molecule into smaller dextrins.
Ideally, the usable carbohydrates at the end of saccharification should have increased
significantly. This would have been a clear indication that heat treatment and enzymatic
treatment were successful at converting the complex carbohydrates. HPLC analysis
85
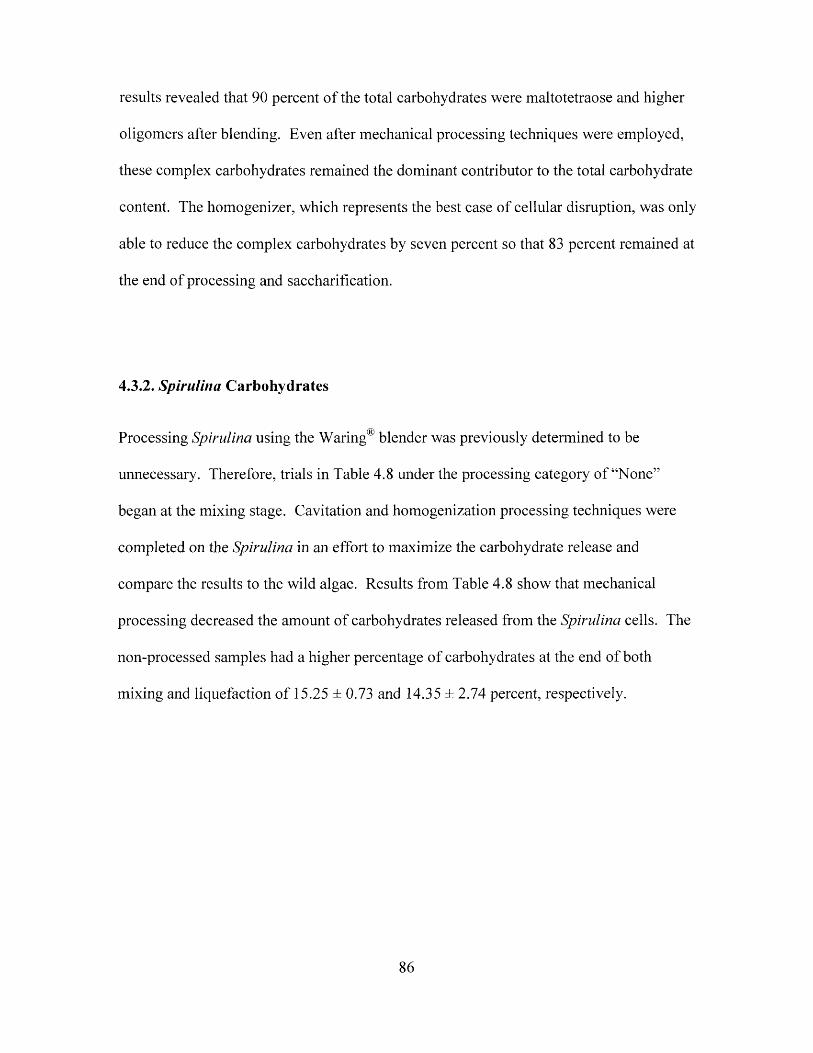
results revealed that 90 percent of the total carbohydrates were maltotetraose and higher
oligomers after blending. Even after mechanical processing techniques were employed,
these complex carbohydrates remained the dominant contributor to the total carbohydrate
content. The homogenizer, which represents the best case of cellular disruption, was only
able to reduce the complex carbohydrates by seven percent so that 83 percent remained at
the end of processing and saccharification.
4.3.2. Spirulina Carbohydrates
Processing Spirulina using the Waring® blender was previously determined to be
unnecessary. Therefore, trials in Table 4.8 under the processing category of “None”
began at the mixing stage. Cavitation and homogenization processing techniques were
completed on the Spirulina in an effort to maximize the carbohydrate release and
compare the results to the wild algae. Results from Table 4.8 show that mechanical
processing decreased the amount of carbohydrates released from the Spirulina cells. The
non-processed samples had a higher percentage of carbohydrates at the end of both
mixing and liquefaction o f 15.25 ± 0.73 and 14.35 ± 2.74 percent, respectively.
86
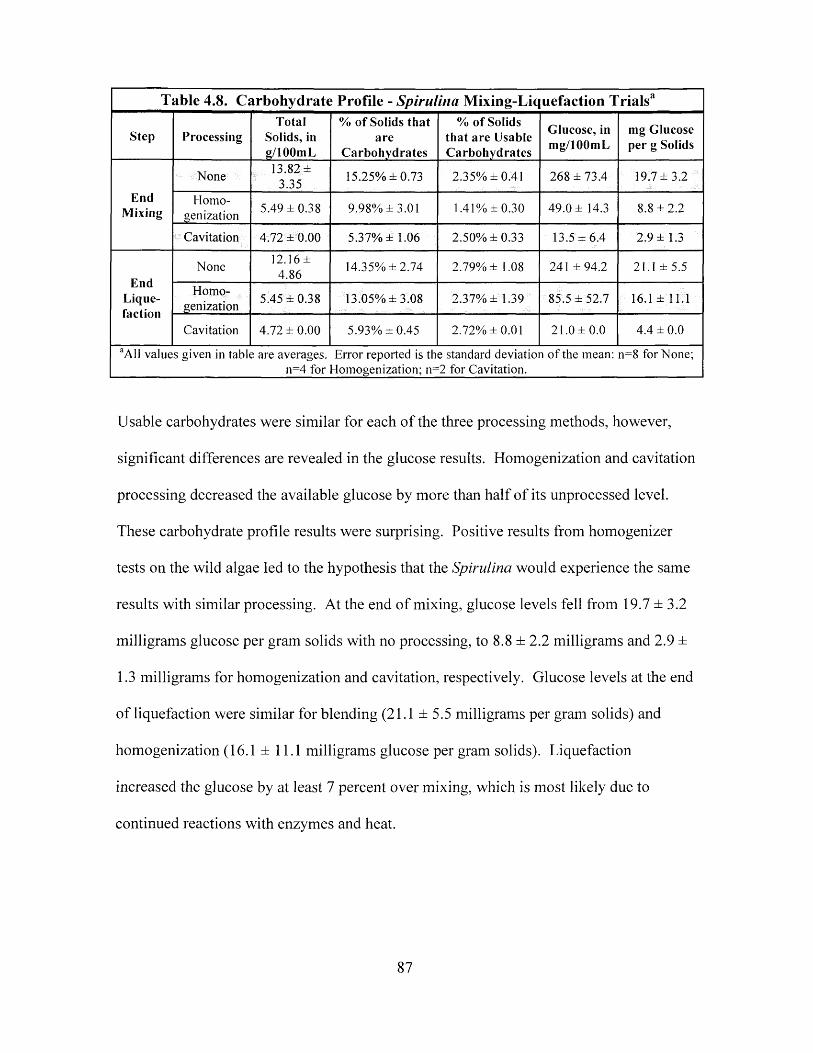
Table 4.8. Carbohydrate Profile - Spirulina Mixing-Liq uefaction Trials3
Step ProcessingTotal
Solids, in g/lOOmL
% of Solids that are
Carbohydrates
% of Solids that are Usable Carbohydrates
Glucose, in mg/lOOmL
mg Glucose per g Solids
EndMixing
None 13.82 ± 3.35 15.25% ± 0 .7 3 2.35% ±0 .41 268 ± 7 3 .4 19.7 ± 3 .2
Homogenization 5.49 ± 0.38 9.98% ± 3 .01 1.41% ± 0 .3 0 49.0 ± 14.3 8.8 ± 2 .2
Cavitation 4.72 ± 0.00 5.37% ± 1 .0 6 2.50% ± 0.33 13.5 ± 6 .4 2.9 ± 1.3
EndLiquefaction
None 12.16 ± 4.86
14.35% ± 2 .7 4 2.79% ± 1.08 241 ± 9 4 .2 21.1 ± 5 .5
Homogenization 5.45 ± 0 .3 8 13.05% ± 3 .0 8 2.37% ± 1.39 85.5 ± 5 2 .7 16.1 ± 11 .1
Cavitation 4.72 ± 0 .0 0 5.93% ± 0 .4 5 2.72% ±0.01 21.0 ± 0.0 4.4 ± 0 .0
aAU values given in table are averages. Error reported is the standard deviation o f the mean: n=8 for None;n=4 for Homogenization; n=2 for Cavitation.
Usable carbohydrates were similar for each of the three processing methods, however,
significant differences are revealed in the glucose results. Homogenization and cavitation
processing decreased the available glucose by more than half of its unprocessed level.
These carbohydrate profile results were surprising. Positive results from homogenizer
tests on the wild algae led to the hypothesis that the Spirulina would experience the same
results with similar processing. At the end of mixing, glucose levels fell from 19.7 ±3 .2
milligrams glucose per gram solids with no processing, to 8.8 ± 2.2 milligrams and 2.9 ±
1.3 milligrams for homogenization and cavitation, respectively. Glucose levels at the end
of liquefaction were similar for blending (21.1 ± 5.5 milligrams per gram solids) and
homogenization (16.1 ± 11.1 milligrams glucose per gram solids). Liquefaction
increased the glucose by at least 7 percent over mixing, which is most likely due to
continued reactions with enzymes and heat.
87
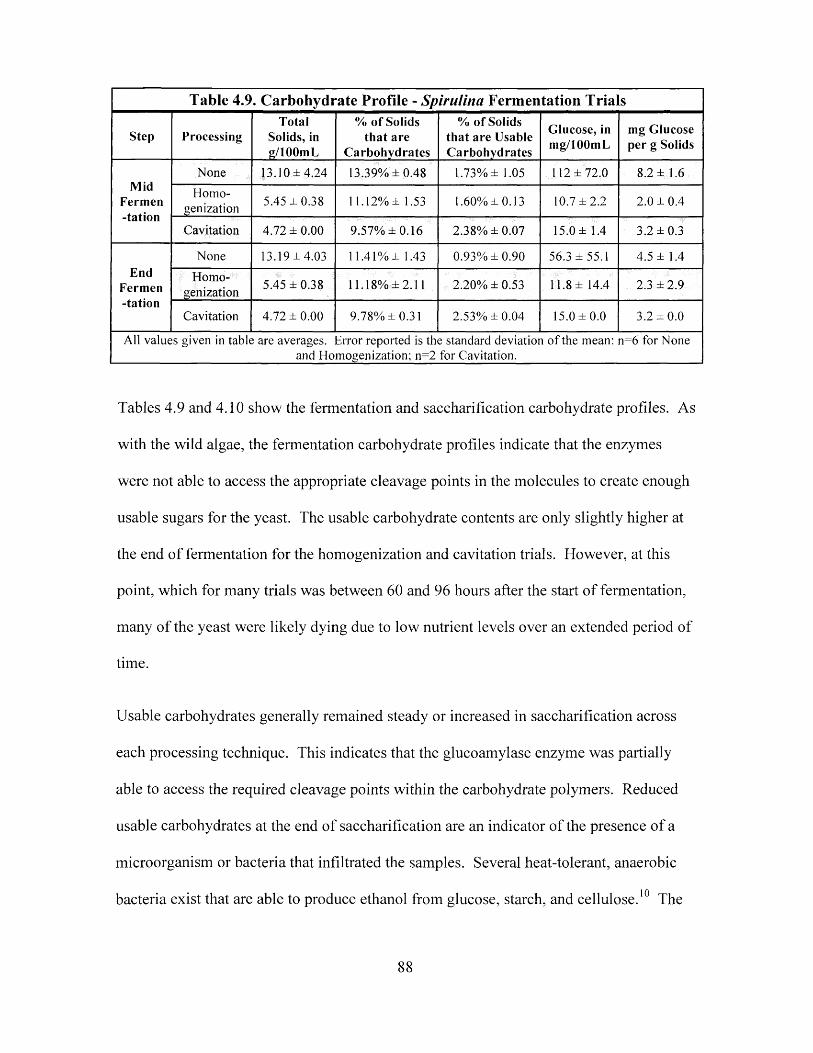
Table 4.9. Carbohydrate Profile - Spirulina Fermentation Trials
Step ProcessingTotal
Solids, in g/lOOmL
% of Solids that are
Carbohydrates
% of Solids that are Usable Carbohydrates
Glucose, in mg/lOOmL
mg Glucose per g Solids
MidFermen-tation
None 13.10 ± 4 .2 4 13.39% ± 0 .4 8 1.73% ± 1.05 112 ± 72.0 8.2 ± 1.6
Homogenization 5.45 ± 0 .3 8 11.12% ± 1.53 1.60% ± 0 .1 3 10.7 ± 2 .2 2.0 ± 0 .4
Cavitation 4.72 ± 0.00 9.57% ± 0 .1 6 2.38% ± 0 .0 7 15.0 ± 1.4 3.2 ± 0 .3
EndFermen-tation
None 13.19 ± 4.03 11.41% ± 1.43 0.93% ± 0.90 56.3 ± 55 .1 4.5 ± 1.4
Homogenization 5.45 ± 0 .3 8 11.18% ± 2 .1 1 2.20% ± 0.53 11.8 ± 14.4 2.3 ± 2 .9
Cavitation 4.72 ± 0 .0 0 9.78% ± 0 .31 2.53% ± 0.04 15.0 ± 0 .0 3.2 ± 0 .0
All values given in table are averages. Error reported is the standard deviation o f the mean: n=6 for Noneand Homogenization; n=2 for Cavitation.
Tables 4.9 and 4.10 show the fermentation and saccharification carbohydrate profiles. As
with the wild algae, the fermentation carbohydrate profiles indicate that the enzymes
were not able to access the appropriate cleavage points in the molecules to create enough
usable sugars for the yeast. The usable carbohydrate contents are only slightly higher at
the end of fermentation for the homogenization and cavitation trials. However, at this
point, which for many trials was between 60 and 96 hours after the start of fermentation,
many of the yeast were likely dying due to low nutrient levels over an extended period of
time.
Usable carbohydrates generally remained steady or increased in saccharification across
each processing technique. This indicates that the glucoamylase enzyme was partially
able to access the required cleavage points within the carbohydrate polymers. Reduced
usable carbohydrates at the end of saccharification are an indicator of the presence o f a
microorganism or bacteria that infiltrated the samples. Several heat-tolerant, anaerobic
bacteria exist that are able to produce ethanol from glucose, starch, and cellulose.10 The
bacteria likely consumed some of the carbohydrates that would have otherwise
contributed to the usable carbohydrate value.
Table 4.10. Carbohydrate Profile - Spirulina Saccharification Trials
Step ProcessingTotal
Solids, in g/lOOmL
% of Solids that are
Carbohydrates
% of Solids that are Usable Carbohydrates
Glucose, in g/lOOmL
mg Glucose per g Solids
MidSaccharification
None15.00 ±
0.00 16.85% ±3.41 2.91% ± 2 .6 8 435 ±401 29.0 ± 2 6 .7
Homogenization
5.45 ± 0 .3 8 14.23% ± 2 .8 3 3.54% ± 1.54 101.7 ± 76.1
19.4 ± 15.6
Cavitation 4.72 ± 0.00 10.55% ± 0 .21 2.94% ± 0 .1 5 31.5 ± 4.9 6.7 ± 1.0
EndSaccharification
None11.77 ±
4.86 14.55% ± 5 .0 7 1.59% ± 1.09 54.1 ± 4 2 .8 5.0 ± 2 .8
Homogenization 5.45 ± 0.38 11.93% ± 2 .1 2 2.18% ± 0 .1 5 6.7 ± 1.9 1.2 ± 3 .3
Cavitation 4.72 ± 0.00 10.37% ±0.31 2.51% ± 0 .4 6 15.5 ± 19.1 3.3 ± 4 .0
All values given in tables are averages. Error reported is the standard deviation o f the mean: n=6 for Noneand Homogenization; n=2 for Cavitation.
Reasons for the decrease in total carbohydrates after homogenization and cavitation are
uncertain. One theory involves the initial processing methods used to produce a powder
from the Spirulina. As previously described in section 2.3.3.1.3, when Spirulina is
harvested, water is removed to form a paste of Spirulina. The paste is then loaded into a
spray dryer and mist of Spirulina is projected into a drying chamber which uses high heat
to evaporate the water and form a powder.11 This process used to produce a
nutraceutical-quality powder may have altered this alga in a way such that further
processing is actually detrimental rather than beneficial. In the “as-purchased” powder
form, the Spirulina is readily digested by humans, and so essentially needs no further
processing to access the carbohydrates.
The percent o f the solids that are carbohydrates are greater for the wild algae samples
than for the Spirulina samples. Although the usable carbohydrates of wild algae are less
89
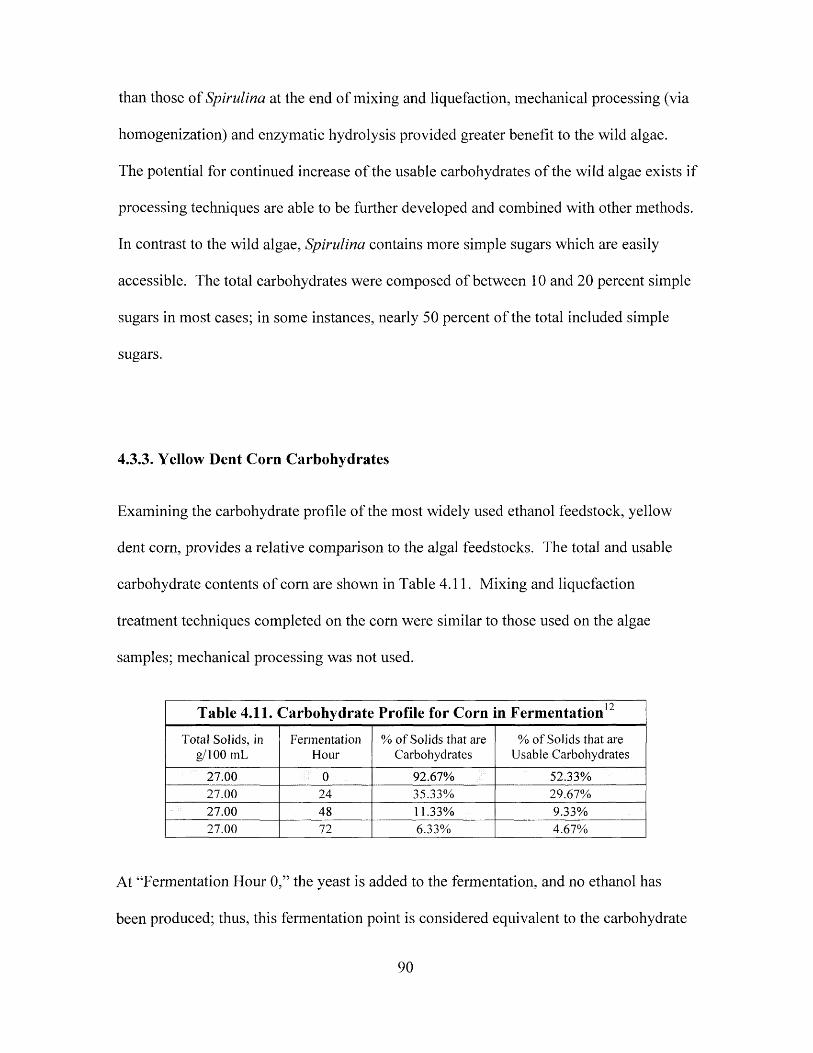
than those of Spirulina at the end of mixing and liquefaction, mechanical processing (via
homogenization) and enzymatic hydrolysis provided greater benefit to the wild algae.
The potential for continued increase of the usable carbohydrates o f the wild algae exists if
processing techniques are able to be further developed and combined with other methods.
In contrast to the wild algae, Spirulina contains more simple sugars which are easily
accessible. The total carbohydrates were composed of between 10 and 20 percent simple
sugars in most cases; in some instances, nearly 50 percent of the total included simple
sugars.
4.3.3. Yellow Dent Corn Carbohydrates
Examining the carbohydrate profile of the most widely used ethanol feedstock, yellow
dent com, provides a relative comparison to the algal feedstocks. The total and usable
carbohydrate contents o f corn are shown in Table 4.11. Mixing and liquefaction
treatment techniques completed on the corn were similar to those used on the algae
samples; mechanical processing was not used.
Table 4.11. Carbohydrate Profile for Corn in Fermentation12
Total Solids, in g/100 mL
FermentationHour
% o f Solids that are Carbohydrates
% o f Solids that are Usable Carbohydrates
27.00 0 92.67% 52.33%27.00 24 35.33% 29.67%27.00 48 11.33% 9.33%27.00 72 6.33% 4.67%
At “Fermentation Hour 0,” the yeast is added to the fermentation, and no ethanol has
been produced; thus, this fermentation point is considered equivalent to the carbohydrate
90
results at the end of mixing and liquefaction. Approximately 93 percent of the total
solids are carbohydrates in yellow dent corn. Only 6.33 percent remain unconverted by
the end of fermentation, at 72 hours. Usable carbohydrates are 52.33 percent at the start
o f fermentation, and by the end of fermentation, the usable carbohydrates are reduced to
4.67 percent. The reduction in total and usable carbohydrates indicates that enzymes in
fermentation were able to cleave dextrin chains into glucose and that yeast utilized the
glucose.
The total carbohydrates of the wild algae and Spirulina are less than the total
carbohydrates of com. The usable carbohydrates for each algae are significantly less than
those of com. For each algae to become economically viable as a feedstock, processing
methods should aim to achieve similar levels of usable carbohydrates and total
carbohydrate conversion.
4.4. Ethanol Production
Once carbohydrate profiles are analyzed, a reasonable conjecture can be made about the
ethanol yields that will result from a certain feedstock. Theoretical ethanol yields can be
calculated based on the usable carbohydrates generated in saccharification trials.
However, fermentation trials will prove whether the theoretical yields are similar to
actual yields, which depend on many different factors.
91
4.4.1. Wild Algae Ethanol Yield
The HPLC peak that constitutes maltotetraose and higher oligomers is typically reduced
through the action of glucoamylase enzymes cleaving longer chains of maltodextrins into
individual glucose units.13 It was noted in the discussion in the previous section that the
maltotetraose carbohydrate peak demonstrated little to no change throughout mixing,
liquefaction, fermentation, or saccharification for the wild algae. With the maltotetraose
carbohydrate peak remaining unchanged throughout fermentation and saccharification,
the ethanol yields will be determined primarily on the basis of the glucose and usable
carbohydrates.
Fermentation and saccharification results from the four processing methods are compared
in Table 4.12. Ethanol yields in mid-fermentation were taken 16 to 24 hours after yeast,
nutrients, and enzymes were added to the algae mixtures. Fermentations were stopped
between 60 and 120 hours, on average, after fermentation began. Most ethanol was
produced by 24 hours into fermentation; only 15 to 35 percent of the total ethanol was
added in the remaining 36 to 96 hours. Between 0.46 and 0.74 percent of usable
carbohydrates were available at the end o f fermentation (Table 4.6). Given that the
usable carbohydrates at the beginning/mid fermentation point were 0.38 to 0.89 percent,
fermentation times could likely be shortened to 24 to 36 hours. It is also possible that
additional alcohol was produced and then used again by the yeast as glucose supplies
declined. Saccharomyces cerevisiae yeast has the ability to alter its metabolism as the
environment changes. As the amount of ethanol increases and glucose decreases, the
yeast begins to consume ethanol and convert it into acetaldehyde.14
92
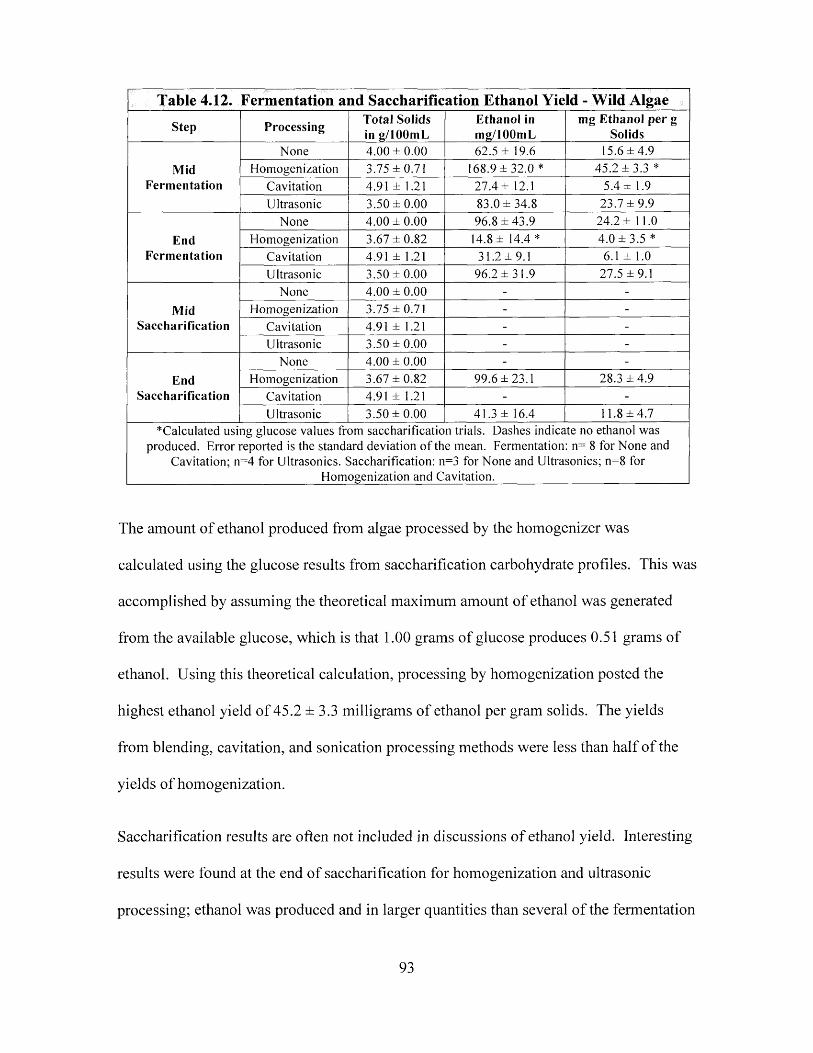
Table 4.12. Fermentation and Saccharification Ethanol Yield - Wild Algae
Step Processing Total Solids in g/lOOmL
Ethanol in mg/lOOmL
mg Ethanol per g Solids
MidFermentation
None 4.00 ± 0 .0 0 62.5 ± 19.6 15.6 ± 4 .9Homogenization 3.75 ±0 .71 168.9 ± 32.0 * 45.2 ± 3 .3 *
Cavitation 4.91 ± 1.21 27.4 ± 12.1 5.4 ± 1.9Ultrasonic 3.50 ± 0 .0 0 83.0 ± 3 4 .8 23.7 ± 9 .9
EndFermentation
None 4.00 ± 0 .0 0 96.8 ± 4 3 .9 24.2 ± 11.0Homogenization 3.67 ± 0 .8 2 14.8 ± 14.4 * 4.0 ± 3 .5 *
Cavitation 4.91 ± 1.21 31.2 ± 9.1 6.1 ± 1.0Ultrasonic 3.50 ± 0 .0 0 96.2 ± 3 1 .9 27.5 ± 9 .1
MidSaccharification
None 4.00 ± 0 .0 0 - -
Homogenization 3.75 ± 0.71 - -Cavitation 4.91 ± 1.21 - -
Ultrasonic 3.50 ± 0 .0 0 - -
EndSaccharification
None 4.00 ± 0 .0 0 - -
Homogenization 3.67 ± 0 .8 2 99.6 ±23 .1 28.3 ± 4 .9Cavitation 4.91 ± 1.21 - -Ultrasonic 3.50 ± 0 .0 0 41.3 ± 16.4 11.8 ± 4 .7
^Calculated using glucose values from saccharification trials. Dashes indicate no ethanol was produced. Error reported is the standard deviation o f the mean. Fermentation: n= 8 for None and
Cavitation; n=4 for Ultrasonics. Saccharification: n=3 for None and Ultrasonics; n=8 forHomogenization and Cavitation.
The amount of ethanol produced from algae processed by the homogenizer was
calculated using the glucose results from saccharification carbohydrate profiles. This was
accomplished by assuming the theoretical maximum amount o f ethanol was generated
from the available glucose, which is that 1.00 grams of glucose produces 0.51 grams of
ethanol. Using this theoretical calculation, processing by homogenization posted the
highest ethanol yield of 45.2 ±3.3 milligrams of ethanol per gram solids. The yields
from blending, cavitation, and sonication processing methods were less than half o f the
yields of homogenization.
Saccharification results are often not included in discussions of ethanol yield. Interesting
results were found at the end of saccharification for homogenization and ultrasonic
processing; ethanol was produced and in larger quantities than several of the fermentation
93
trials. Although no yeast was added to these trials, it is suspected that indigenous yeast or
microorganisms, which were naturally present in the wild algae, consumed the available
carbohydrates and produced ethanol. As mentioned in section 4.3.2, several ethanol-
producing bacteria exist that are able to withstand the high temperatures of liquefaction.10
The production of ethanol in saccharification is likely to skew the carbohydrate results,
and it is suspected that glucose and usable carbohydrate amounts would have been
slightly higher in the absence of ethanol in the saccharification trials shown in Table 4.7.
An experiment designed to test this theory could be one topic for future work.
4.4.2. Spirulina Ethanol Yield
Fermentation and saccharification of the Spirulina with only mixing and liquefaction heat
treatment gave promising results. The ethanol yields for these Spirulina trials can be
found in Table 4.13. Unprocessed Spirulina trials produced 14.8 ± 1 .9 milligrams
ethanol per gram solids by mid-fermentation, which was between 20 and 24 hours after
yeast, enzymes, and nutrients were added to the treated Spirulina. By the end of
fermentation, 60 to 90 hours later, on average, 17.5 ± 5.5 milligrams ethanol per gram
solids were produced. These results were higher than those of the Spirulina processed
using both homogenization and cavitation, which correlates well with the carbohydrate
results. The maximum ethanol yield from homogenization and cavitation were 13.2 ± 2.5
and 11.3 ± 1.0 milligrams ethanol per gram solids, respectively, at the end of
fermentation.
94
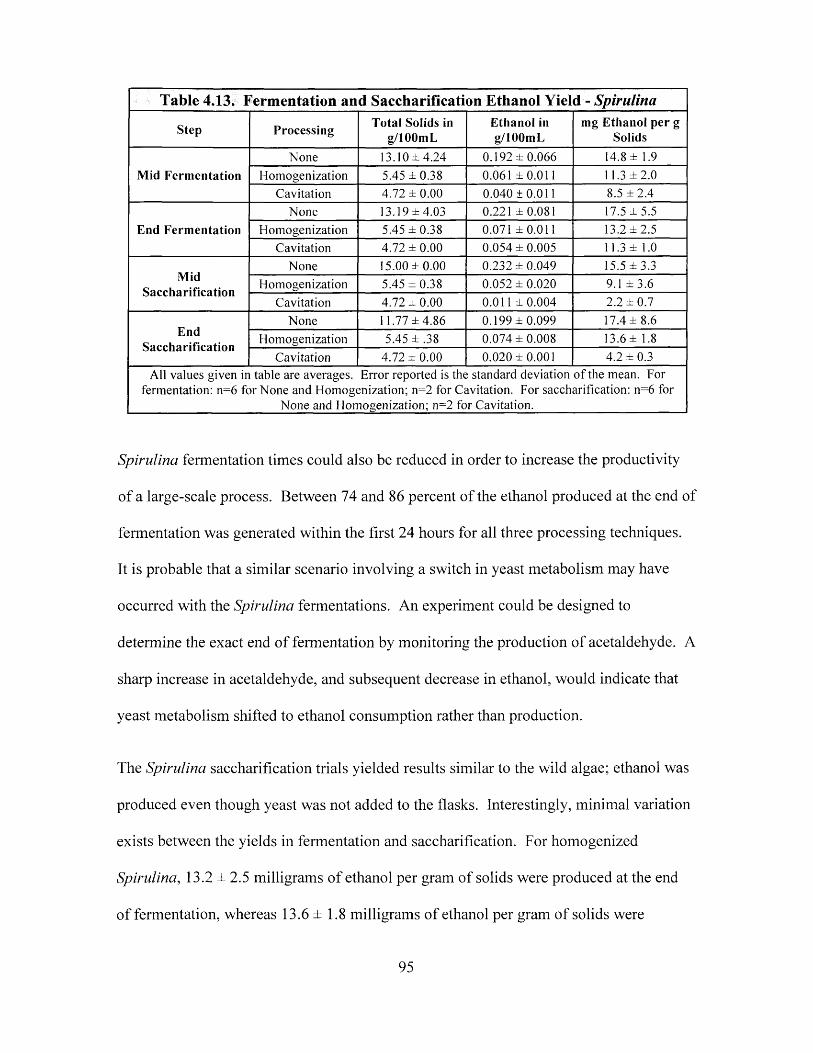
Table 4.13. Fermentation and Saccharification Ethanol Yield - Spirulina
Step Processing Total Solids in g/lOOmL
Ethanol in g/lOOmL
mg Ethanol per g Solids
Mid FermentationNone 13.10 ± 4.24 0.192 ± 0 .0 6 6 14.8 ± 1.9
Homogenization 5.45 ± 0 .3 8 0.061 ±0 .011 11.3 ± 2 .0Cavitation 4.72 ± 0.00 0.040 ±0.011 8.5 ± 2 .4
End FermentationNone 13.19 ± 4.03 0.221 ±0 .081 17.5 ± 5 .5
Homogenization 5.45 ± 0 .3 8 0.071 ±0 .011 13.2 ± 2 .5Cavitation 4.72 ± 0 .0 0 0.054 ± 0 .0 0 5 11.3 ± 1.0
MidSaccharification
None 15.00 ± 0 .0 0 0.232 ± 0 .0 4 9 15.5 ± 3 .3Homogenization 5.45 ± 0 .3 8 0.052 ± 0 .0 2 0 9.1 ± 3 .6
Cavitation 4.72 ± 0.00 0.011 ± 0 .0 0 4 2.2 ± 0 .7
EndSaccharification
None 11.77 ± 4 .8 6 0.199 ± 0.099 17.4 ± 8.6Homogenization 5.45 ± .3 8 0.074 ± 0 .0 0 8 13.6 ± 1.8
Cavitation 4.72 ± 0.00 0.020 ±0 .001 4.2 ± 0.3All values given in table are averages. Error reported is the standard deviation o f the mean. For
fermentation: n=6 for None and Homogenization; n=2 for Cavitation. For saccharification: n=6 for None and Homogenization; n=2 for Cavitation.
Spirulina fermentation times could also be reduced in order to increase the productivity
of a large-scale process. Between 74 and 86 percent of the ethanol produced at the end of
fermentation was generated within the first 24 hours for all three processing techniques.
It is probable that a similar scenario involving a switch in yeast metabolism may have
occurred with the Spirulina fermentations. An experiment could be designed to
determine the exact end of fermentation by monitoring the production of acetaldehyde. A
sharp increase in acetaldehyde, and subsequent decrease in ethanol, would indicate that
yeast metabolism shifted to ethanol consumption rather than production.
The Spirulina saccharification trials yielded results similar to the wild algae; ethanol was
produced even though yeast was not added to the flasks. Interestingly, minimal variation
exists between the yields in fermentation and saccharification. For homogenized
Spirulina, 13.2 ± 2.5 milligrams of ethanol per gram of solids were produced at the end
of fermentation, whereas 13.6 ± 1.8 milligrams of ethanol per gram of solids were
95
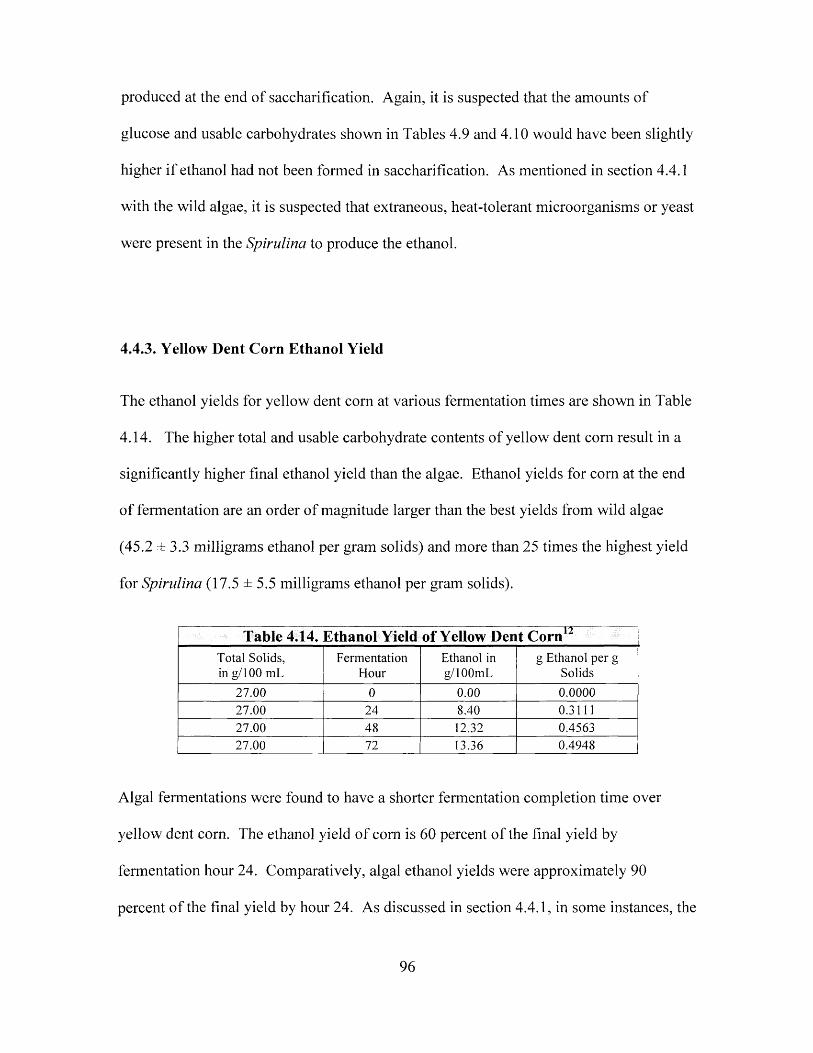
produced at the end of saccharification. Again, it is suspected that the amounts of
glucose and usable carbohydrates shown in Tables 4.9 and 4.10 would have been slightly
higher if ethanol had not been formed in saccharification. As mentioned in section 4.4.1
with the wild algae, it is suspected that extraneous, heat-tolerant microorganisms or yeast
were present in the Spirulina to produce the ethanol.
4.4.3. Yellow Dent Corn Ethanol Yield
The ethanol yields for yellow dent corn at various fermentation times are shown in Table
4.14. The higher total and usable carbohydrate contents of yellow dent corn result in a
significantly higher final ethanol yield than the algae. Ethanol yields for com at the end
of fermentation are an order of magnitude larger than the best yields from wild algae
(45.2 ±3 .3 milligrams ethanol per gram solids) and more than 25 times the highest yield
for Spirulina (17.5 ± 5.5 milligrams ethanol per gram solids).
Table 4.14. Ethanol Yield of Yellow Dent Corn12Total Solids, Fermentation Ethanol in g Ethanol per gin g/100 mL Hour g/lOOmL Solids
27.00 0 0.00 0.000027.00 24 8.40 0.311127.00 48 12.32 0.456327.00 72 13.36 0.4948
Algal fermentations were found to have a shorter fermentation completion time over
yellow dent corn. The ethanol yield of corn is 60 percent of the final yield by
fermentation hour 24. Comparatively, algal ethanol yields were approximately 90
percent o f the final yield by hour 24. As discussed in section 4.4.1, in some instances, the
96
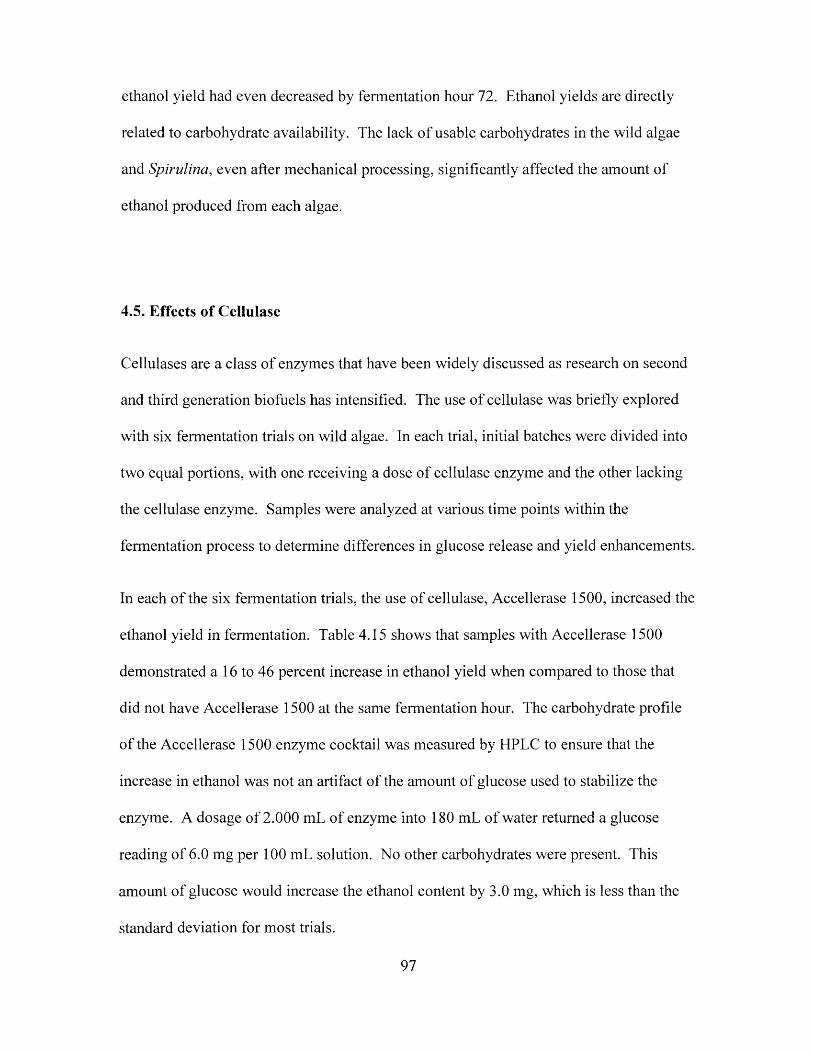
ethanol yield had even decreased by fermentation hour 72. Ethanol yields are directly
related to carbohydrate availability. The lack of usable carbohydrates in the wild algae
and Spirulina, even after mechanical processing, significantly affected the amount of
ethanol produced from each algae.
4.5. Effects of Cellulase
Cellulases are a class of enzymes that have been widely discussed as research on second
and third generation biofuels has intensified. The use of cellulase was briefly explored
with six fermentation trials on wild algae. In each trial, initial batches were divided into
two equal portions, with one receiving a dose of cellulase enzyme and the other lacking
the cellulase enzyme. Samples were analyzed at various time points within the
fermentation process to determine differences in glucose release and yield enhancements.
In each of the six fermentation trials, the use of cellulase, Accellerase 1500, increased the
ethanol yield in fermentation. Table 4.15 shows that samples with Accellerase 1500
demonstrated a 16 to 46 percent increase in ethanol yield when compared to those that
did not have Accellerase 1500 at the same fermentation hour. The carbohydrate profile
of the Accellerase 1500 enzyme cocktail was measured by HPLC to ensure that the
increase in ethanol was not an artifact of the amount of glucose used to stabilize the
enzyme. A dosage of 2.000 mL of enzyme into 180 mL of water returned a glucose
reading of 6.0 mg per 100 mL solution. No other carbohydrates were present. This
amount of glucose would increase the ethanol content by 3.0 mg, which is less than the
standard deviation for most trials.
97
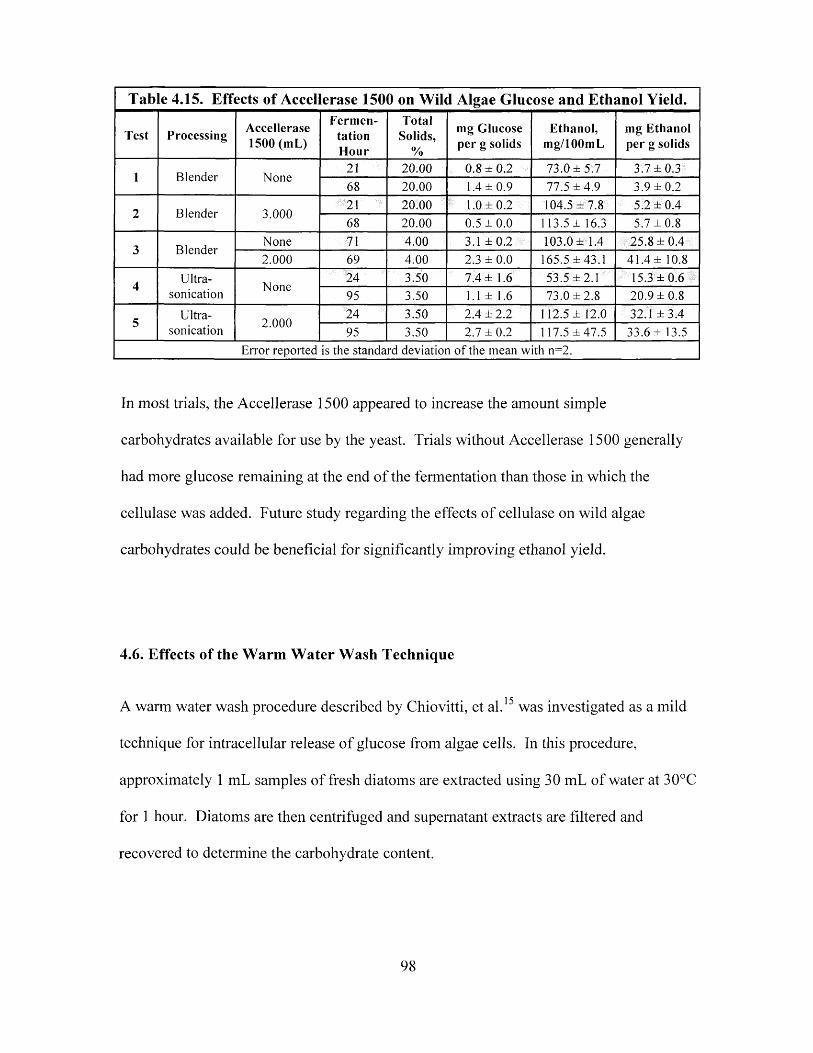
Table 4.15. Effects of Accellerase 1500 on Wild Algae Glucose and Ethanol Yield.
Test Processing Accellerase 1500 (mL)
FermentationHour
TotalSolids,
%
mg Glucose per g solids
Ethanol, mg/100m L
mg Ethanol per g solids
1 Blender None21 20.00 0.8 ± 0.2 73.0 ± 5 .7 3.7 ± 0 .368 20.00 1.4 ± 0 .9 77.5 ± 4 .9 3.9 ± 0 .2
2 Blender 3.00021 20.00 1.0 ± 0 .2 104.5 ± 7 .8 5.2 ± 0.468 20.00 0.5 ± 0 .0 113.5 ± 16.3 5.7 ± 0 .8
3 BlenderNone 71 4.00 3.1 ± 0 .2 103.0 ± 1 .4 25.8 ± 0 .42.000 69 4.00 2.3 ± 0.0 165.5 ±43 .1 41.4 ± 10.8
4 Ultra-sonication None
24 3.50 7.4 ± 1 .6 53.5 ± 2 .1 15.3 ± 0 .695 3.50 1.1 ± 1.6 73.0 ± 2 .8 20.9 ± 0 .8
5 Ultra-sonication 2.000
24 3.50 2.4 ± 2.2 112.5 ± 12.0 32.1 ± 3.495 3.50 2.7 ± 0 .2 117.5 ± 4 7 .5 33.6 ± 13.5
Error reported is the standard deviation o f the mean with n=2.
In most trials, the Accellerase 1500 appeared to increase the amount simple
carbohydrates available for use by the yeast. Trials without Accellerase 1500 generally
had more glucose remaining at the end of the fermentation than those in which the
cellulase was added. Future study regarding the effects of cellulase on wild algae
carbohydrates could be beneficial for significantly improving ethanol yield.
4.6. Effects of the Warm Water Wash Technique
A warm water wash procedure described by Chiovitti, et al.15 was investigated as a mild
technique for intracellular release o f glucose from algae cells. In this procedure,
approximately 1 mL samples of fresh diatoms are extracted using 30 mL of water at 30°C
for 1 hour. Diatoms are then centrifuged and supernatant extracts are filtered and
recovered to determine the carbohydrate content.
98
A modified form of this method was used in this research in order to determine if the
procedure would increase the glucose released from the VIMS wild algae. The
modifications to the procedure have been described in section 3.3.2. The extraction
temperature was increased to 60°C since many commercial cellulase enzymes are active
at this temperature, although cellulase enzyme was not used in the extraction step for
these trials.
Table 4.16. Warm Water Wash Extraction Results for Wild Algaea
Hour DP4+ DP3 Maltose Glucose Fructose TotalSugars Ethanol
Noextraction
1 M/Lb 2.509 _ d 0.029 0.037 - 2.575 -
2 24 2.116 - 0.016 0.014 0.009 2.155 0.104
3 95 1.806 - 0.013 0.009 0.008 1.836 0.084
Noextraction
4 M/L 2.453 - 0.035 0.040 0.009 2.537 -
5 24 2.059 - 0.015 0.003 0.010 2.087 0.121
6 95 2.004 - 0.011 0.010 0.012 2.037 0.151
With extraction (Trial 1)
7 Before WWWC 2.082 - 0.009 - - 2.091 -
8After Distill
H 20 2.133 - 0.001 0.006 0.002 2.142 -
9M/L (After
WWW) 2.259 - 0.019 0.029 0.018 2.325 -
10 19 2.017 - 0.021 0.009 0.017 2.064 0.066
11 113 1.949 - 0.017 0.010 - 1.976 0.076
With extraction (Trial 2)
12 Before WWW 2.080 - 0.012 - - 2.092 -
13After Distill
H 202.138 0.005 0.004 2.147 -
14M/L (After
WWW)2.190 - 0.013 0.027 0.024 2.254 -
15 19 1.978 - 0.016 0.008 0.016 2.018 0.075
16 113 1.947 - 0.015 0.008 0.016 1.986 0.062
aAll samples were at 3.5% total solids; amounts are in g/100 mL. bM/L = Mixing/Liquefaction. CWWW = Warm Water Wash. dDashes indicate that component was not detected by the HPLC.
Results from the extraction are shown in Table 4.16. HPLC data taken before and after
the warm water wash steps show that the extraction technique appears to have increased
the glucose minimally, from 0.000 grams per 100 mL in lines 7 and 12, to 0.004 to 0.006
grams per 100 mL in lines 8 and 13. However, the amount of maltose decreased in each
99
case of extraction, suggesting that perhaps the procedure caused activation of an enzyme
which would cleave a portion of the maltose into glucose. Maltotetraose and higher
oligomers (DP4+) did increase by approximately 0.050 grams per 100 mL (lines 7 to 8
and lines 12 to 13). This could be due to a size reduction in high molecular weight
carbohydrates that were originally out of the window of detection by HPLC for
maltotetraose and higher oligomers.
Mixing and liquefaction treatments appear to have a greater effect on carbohydrate
release. Following these treatments, the amount of each detected carbohydrate increased
(2.142 grams of total carbohydrates in line 8 to 2.325 grams in line 9). This is most
likely due to the enzymes that were used, which are designed to cleave longer dextrin
chains and branches. Trials without extraction show higher maltose and glucose levels
than trials with extraction (lines 1 and 4). Based on these results, it appears the modified
warm water wash procedure was not effective on the wild algae.
A further experiment in which cellulase enzyme was added to the extraction step should
be considered. The positive results demonstrated in section 4.5 indicate that cellulase
may have a beneficial effect in this step, especially considering that the temperature used
for extraction is closer to the ideal temperature for optimal cellulase activity.
4.7. Sample Uncertainty
When the results from the compositional analyses are summed, they exceed 100 percent,
which suggests uncertainty associated with the measurements and/or artifacts associated
100
with sample handling. In particular, two cases are present in which the data sum to
greater than 100 percent: the compositional analysis data and the sum of the total
carbohydrate and ash values. Several reasons for these discrepancies exist.
1. ADF and NDF components in the compositional analyses each contain insoluble
portions of ash (section 4.1). This amounts to a portion of the ash content being
considered twice in the results.
2. The NDF component consists of the ADF component in addition to hemicellulose
and lignin (section 4.1). Summing the ADF and NDF components would
therefore consider the ADF component twice.
3. The calibration of the HPLC was completed using carbohydrates typically found
in the fermentation profile of yellow dent com (section 3.5). The carbohydrate
components in the HPLC chromatograms were identified on the basis of retention
times and were not confirmed using mass spectrometry. Non-carbohydrate
components, which appeared at similar retention times, therefore, were considered
carbohydrates and contributed to the total value.
4. Aliquots were removed from stirring, processed algae samples in order to
determine percent dry weight per unit volume. Settling of contents and
limitations in stirring efficiency may have resulted in artificially low values in the
limited number of algae dry weight measurements. Additionally, minor losses
due to evaporation may have increased the dry weight proportion of the salts in
these measurements.
101
5. Each section of the VIMS floway was analyzed individually for compositional
and mineral analyses; however, the three sections of the floway were combined
for processing, pretreatment, fermentation, and saccharification trials.
Chapter 4 References:
1 Canuel, E. Physical Sciences, Virginia Institute of Marine Science, Gloucester Point, VA. Personal communication. 15 Apr 2010.
2Richardson, P. Marine Biodiversity Laboratory, Virginia Institute of Marine Science, Gloucester Point, VA. “Re: ATS Question.” Email to the author. 12 Jan 2010.
3 “Composition of Fiber in Feeds.” Feed Memo, memo F401. Midwest Laboratories. Accessed 1 May 2009.<https://www.midwestlabs.com/images/stories/pdfs/feed_memos/f401_composition_of_f iber_in_feeds. pdf>.
4 Kangas, P. Environmental Science and Technology Department, University of Maryland, College Park, MD. Informal lecture on harvesting the VIMS Algal Turf Scrubber. 4 May 2009.
5 Russell, I. Understanding Yeast Fundamentals. In The Alcohol Textbook, 4th Ed.; K.A. Jacques, T.P. Lyons, D.R. Kelsall. Nottingham University Press: Nottingham, U.K. 2003. pp. 85-119.
6 Duffy, E. Biological Sciences, Virginia Institute of Marine Science, Gloucester Point, VA. “Re: Characterization of Algae Species.” Email to the author. 18 Jun 2009.
7 Crawford, R. M. The organic component of the cell wall of the marine diatom Melosira nummuloides (Dillw.) C. Ag, Eur. J. Phycol. 1973, 8: 3, 257-266.
8 Mancosky, D.; Hammerstrom, J. Hydro Dynamics, Inc, Rome, GA. Personal communication, September, 2009.
9 Ciferri, O. Spirulina, the Edible Microorganism. Microbiol Rev. 1983, 47 (4), 551-578.
10 Wiegel, J.; Ljungdahl, L. The importance of thermophilic bacteria in biotechnology. Crit. Rev. Biotechnol. 1985, 3 (1), 39-108.
102
11 Gershwin, M. E.; Belay, A., Ed. Spirulina in Human Nutrition and Health [Online]; CRC Press: Boca Raton, 2008.http://lib.myilibrary.com.proxy.wm.edu/Browse/open.asp?ID=l 13666 (accessed Mar 13, 2010).
12 Singh, V.; Batie, C.; Aux, G.; Rausch, K.; Miller, C. Dry-Grind Processing of Com with Endogenous Liquefaction Enzymes. Cereal Chem. 2006, 83 (4), 317-320.
13 Power, R. Enzymatic conversion of starch to fermentable sugars. In The Alcohol Textbook, 4th Ed.; K.A. Jacques, T.P. Lyons, D.R. Kelsall. Nottingham University Press: Nottingham, U.K. 2003. pp 23-32.
14 Piskur, J.; Rozpedowska, E.; Polakova, S.; Merico, A.; Compagno, C. How did Saccharomyces evolve to become a good brewer? Trends Genet. 2006, 22 (4): 183-186.
15 Chiovitti, A.; Molino, P.; Crawford, S. A.; Teng, R.; Spurck, T.; Wetherbee, R. The glucans extracted with warm water from diatoms are mainly derived from intracellular chrysolaminaran and not extracellular polysaccharides. Eur. J. Phycol. 2004. 39, 117- 128.
103
Chapter 5: Conclusions
Due to the changes in processing requirements and enzymes, the economics of second
and third generation feedstocks for ethanol production are likely to be very different than
first generation feedstocks. New feedstocks are being constantly researched to improve
the processing methods and feedstock characteristics. As our understanding of the
feedstocks improves, economic conditions for implementation will improve as well.
5.1. Wild Algae Potential as a Feedstock for Ethanol Production
The results of this research find that wild algae have the potential to be used as a
feedstock for ethanol production if mechanical processing techniques and enzymes are
used to enhance carbohydrate release. Total carbohydrate content in the wild algae varies
between 46 and 76 percent of the total solids content. Usable carbohydrates, maltose and
glucose, were much lower, ranging from 0.50 percent to 9.33 percent of the total solids,
depending on the processing method. The ability to improve the percentage of usable
carbohydrates was demonstrated through use of a homogenizer and ultrasonic probe, and
the homogenizer caused the greatest increase in usable carbohydrates over the non
processed samples. A calculated maximum ethanol yield of 45.2 ±3.3 milligrams
ethanol per gram solids was achieved through the use of the homogenizer. As such, a
mechanical processing device would be a necessary piece of equipment for a commercial
algae-to-ethanol facility.
Fermentation of the algae occurred in less time than for a typical com fermentation.
Most algae fermentations were complete 36 hours after yeast inoculation, whereas corn
104
fermentations typically need 48 to 60 hours for completion.1 Shorter fermentation times
on wild algae would increase the amount of material that could be processed through a
commercial production facility, which would be financially beneficial. Formation of
unwanted fermentation by-products would also be reduced with a shorter fermentation
time. When carbohydrate and nutrient sources are depleted, the yeast Saccharomyces
cerevisiae will utilize ethanol as a food source to make unwanted components, such as
acetaldehyde.2 Ending fermentation when carbohydrates are fully consumed would
maintain higher yields and decrease unnecessary by-products.
5.2. Spirulina Potential as a Feedstock for Ethanol Production
The ease of processing Spirulina in mixing and liquefaction steps offers a benefit to the
overall ethanol production process. However, the carbohydrate content of Spirulina was
much lower than the wild algae. Total carbohydrates in Spirulina ranged from 5 to 17
percent of the total solids content, which is 4 to 9 times less than the total carbohydrates
o f the wild algae.
In each trial, total carbohydrates were reduced by mechanical processing, although
reasons for this decrease are not certain. Mechanical processing did not significantly
increase the usable carbohydrate content in the Spirulina. As a result, the maximum
ethanol yield of 17.5 ± 5.5 milligrams ethanol per gram solids was achieved in non
processed samples.
105
Spirulina is currently a high-value product in the nutritional supplement market due to
the protein content. Prices for a pound of Spirulina can range from 12 to 15 dollars,3’4
which is significantly more expensive than any current feedstock for ethanol production.
Corn futures for May 2010 were at $3.60 per bushel as of March 9, 2010, which averages
to $0.06 per pound of corn.5
The value of Spirulina in the nutritional market will prohibit this type of algae from
becoming a feedstock for ethanol production, unless the carbohydrates and protein could
be separated and sold individually. Concentrating each stream could potentially increase
the value of the pure protein and reduce the price of the carbohydrates.
5.3. Mechanical Processing Results
Reduction of wild algal filaments through the use o f blending provided a baseline for the
total and available carbohydrates. Baseline data collection for Spirulina began at the
pretreatment stage with no prior size reduction, due to the Spirulina arriving as a fine
powder. Wild algae and Spirulina demonstrated mixed results from mechanical
processing.
Impingement homogenization processing provided the greatest increase in usable
carbohydrates for the wild algae sample. Total carbohydrates decreased in Spirulina and
usable carbohydrates remained unchanged as a result of homogenization processing.
Hydrodynamic cavitation proved ineffective at increasing the total carbohydrates in both
algae samples, and it caused a significant decrease in usable carbohydrates for the wild
106
algae. Ultrasonication provided a minimal increase in usable carbohydrates for wild
algae. Spirulina was not tested by ultrasonication. Based on this research, the use of an
impingement homogenizer has the potential to increase the usable carbohydrate content
in wild algae samples by as much as 50 percent over blending alone. A homogenizer
would improve the economics of a commercial production facility using wild algae as a
feedstock.
Cellular disruption by cavitation may improve if the processing parameters are optimized.
Personnel at Hydro Dynamics, Inc., provider o f the SPR cavitation device, noted that the
cavitation devices can be significantly improved if a company was interested in large-
scale use of the device for algal cell disruption.6 Studies comparing ultrasonication,
homogenization, and cavitation disruption methods indicate that hydrodynamic cavitation
is the most energy efficient process when it is optimized.7 The cavitation devices used in
this research were selected as a starting point, and only optimized minimally by
decreasing the orifice clearance where cavitation occurred. Further optimization may
increase the amount of cellular disruption.
Improved harvesting techniques may increase the amount of cellular disruption. One
study by Save, et al., in which yeast cells were disrupted by hydrodynamic cavitation,
found that cells which are growing, or in the exponential phase of the cell cycle, will
disrupt easier than those in the stationary phase.8 Wild algae and Spirulina processed in
this work were not processed until 24 hours after harvest. If the algae are easier to
process immediately after harvesting, mechanical processing facilities would need to be
located near the site of the growing algae.
107
The cost of a device for mechanical cell disruption is likely to determine which method is
initially used. The amount of material that each device can process, energy requirements
of each device, as well as the desired size of the production facility, will also factor into
the cost considerations. As improvements are made in processing and production, the
costs will decrease.
5.4. Future Work
The results of this body of work show that wild algae have the potential to be used as a
feedstock for ethanol production. Three issues should be investigated further in order to
determine if an algae feedstock would be sustainable source of carbohydrates. These
issues include: 1) Feedstock variability; 2) Cellulase dosages; and 3) Wild algae
carbohydrate composition.
Feedstock variability may seriously impact the sustainability of a wild algae source, thus
affecting the long-term use as a feedstock. Climate effects, seasonal changes, and
physical location of the floway could all affect the type of algae growing and the
production of biomass in a given harvest period. Evaluation of the algae on the VIMS
floway was completed over a period of four months. Seasonal changes were not a
concern over this period. In a large scale operation, a floway would be producing algae
consistently throughout a year. Evaluation of the algae would need to take place over the
course of at least one year before a determination could be made about the conditions of
the algae on a full-time basis. If algal biomass production were unsustainable on the
108
floway for certain times throughout the year it would affect the economics of a
commercial-scale production facility.
This research found that an increase in ethanol yield occurred through the use o f a
cellulase enzyme in fermentation. This work should be explored further to identify the
optimal enzyme dosages based on the biomass concentration. Other fermentation
enzymes, such as proteases, should also be evaluated. Proteases cleave proteins to
release nitrogen compounds, which may be beneficial to the fermentative yeast.
The carbohydrates in the wild algae and Spirulina samples demonstrated a unique
challenge over carbohydrates of grains in that the majority of the carbohydrates were
unaffected by enzymatic hydrolysis. As discussed in section 4.3.1 of the wild algae
results, at least 83 percent of initial carbohydrates remained at the end of processing and
saccharification. Further analytical work is needed to evaluate the exact composition of
these algal carbohydrates in order to understand the best methods for effective
processing. If an alternative processing method or enzyme would cleave the
carbohydrates into a usable form, the wild algae could be more valuable as a feedstock
for ethanol production.
Chapter 5 References:
1 Elander, R.; Putsche, V. Ethanol from Corn: Technology and Economics. In Handbook on Bioethanol: Production and Utilization; Wyman, C. Ed.; Taylor and Francis: Washington, D.C., 1996; pp 329-349.
2 Piskur, J.; Rozpedowska, E.; Polakova, S.; Merico, A.; Compagno, C. How did Saccharomyces evolve to become a good brewer? Trends Genet. 2006, 22 (4): 183-186.
109
3 Puritan’s Pride: Spirulina Powder, 2010. http://www.puritan.com/green-food- 057/spirulina-powder-005193 (accessed Mar 22, 2010).
4 Bulk Foods: Spirulina Powder, 2010.http://www.bulkfoods.com/search_results.asp?txtsearchParamTxt=4745&txtsearchParam txt=24&txtsearchParamType=ALL&txtsearchParamMan=ALL&txtsearchParamVen=A AL&txtFromSearch=fromSearch (accessed Mar 22, 2010).
5 Berry, I. DJ CBOT Corn Outlook: Down 2c-4c On Dollar, Technical Selling. Futures and Commodity Market News [Online].http://news.tradingeharts.eom/futures/l/6/136453661.html (accessed Mar 22, 2010).
6 Mancosky, D.; Hammerstrom, J. Hydro Dynamics, Inc, Rome, GA. Personal communication, January, 2010.
7 Balasundaram, B.; Pandit, A. Selective release of invertase by hydrodynamic cavitation' Biochem EngJ. 2001, 8, 251-256.
8 Save, S.; Pandit, A.; Joshi, J. Use of hydrodynamic cavitation for large scale microbial cell disruption. Trans. I. ChemE. Part C. 1997, 75, 41-49.
110
Appendix A
Additional Figures of Wild Algae and Spirulina.
Figure A -l. Raw wild algae growing on the VIMS ATS™ in early May, 2009.............112
Figure A-2. Harvesting o f raw wild algae from VIMS ATS™ by Dr. Walter Adey 112
Figure A-3. Wild algae cell captured in the process o f reproduction................................. 113
Figure A-4. Wild algae cells after blender processing.......................................................... 113
Figure A-5. Wild algae processed by homogenization, Trial 1........................................... 114
Figure A-6. Wild algae processed by homogenization, Trial 3........................................... 114
Figure A-7. Wild algae processed by homogenization, Trial 4........................................... 115
Figure A-8. Wild algae processed by homogenization, Trial 5........................................... 115
Figure A-9. Wild algae processed by homogenization, Trial 6........................................... 116
Figure A-10. Wild algae processed by homogenization, Trial 8.........................................116
Figure A-l 1. Wild algae processed by cavitation, Trial 1....................................................117
Figure A -12. Wild algae processed by cavitation, Trial 2 ....................................................117
Figure A-13. Wild algae processed by cavitation, Trial 3....................................................118
Figure A-14. Rehydrated Spirulina purchased from BulkFoods.com................................ 118
Figure A -l5. Spirulina processed by homogenization..........................................................119
Figure A -16. Spirulina processed by cavitation.....................................................................119
Figure A-l 7. Set-up of mixing and liquefaction steps prior to fermentation.....................120
Figure A -l8. Fermentation and saccharification flask set-up.............................................. 120
111
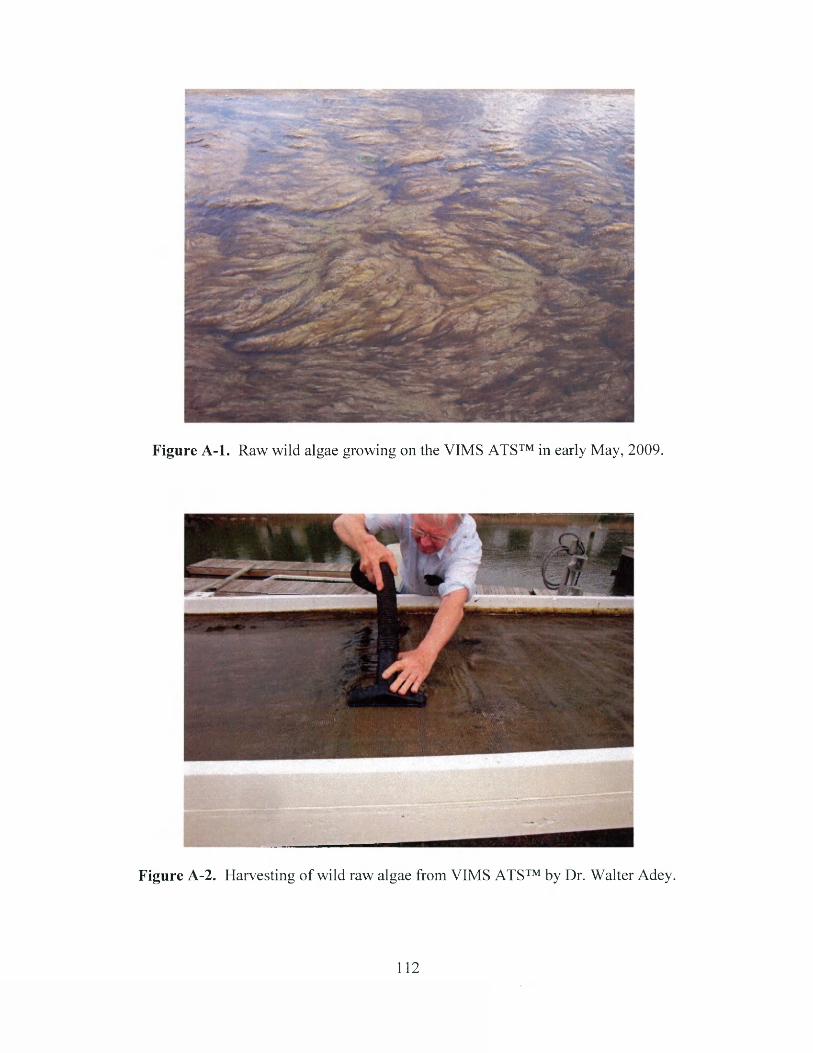
Figure A -l. Raw wild algae growing on the VIMS ATS™ in early May, 2009.
Figure A-2. Harvesting of wild raw algae from VIMS ATS™ by Dr. Walter Adey.
112
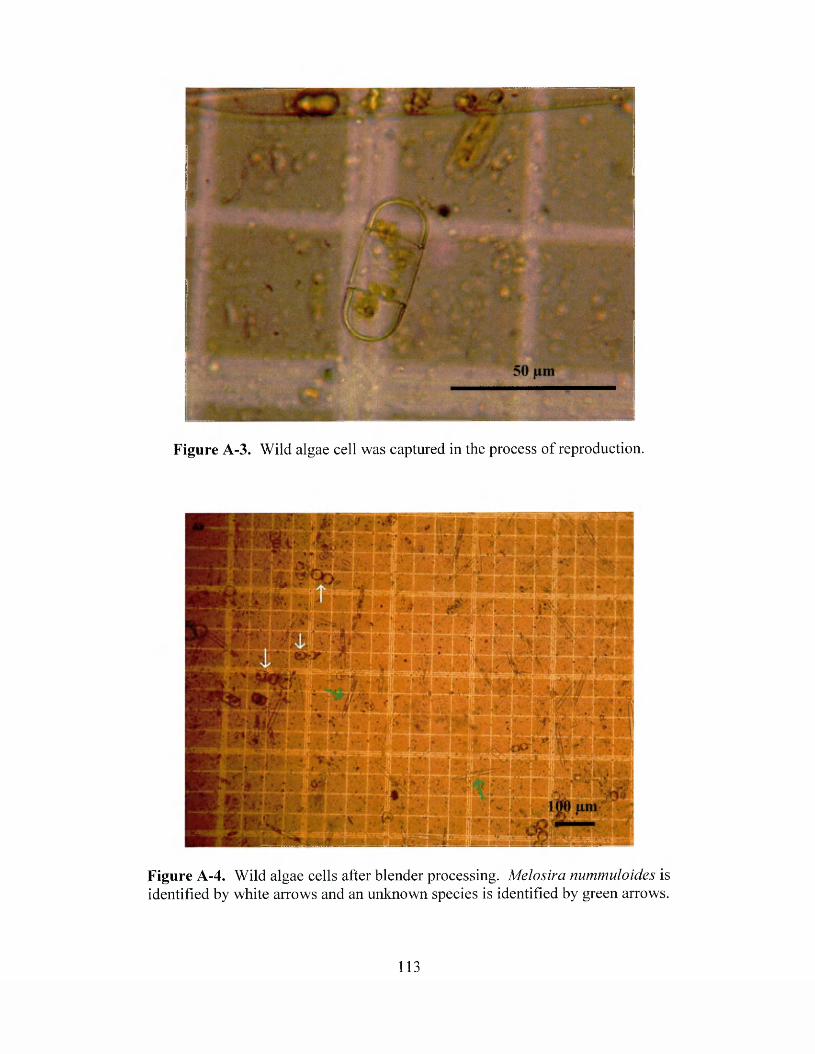
Figure A-3. Wild algae cell was captured in the process of reproduction.
Figure A-4. Wild algae cells after blender processing. Melosira nummuloides is identified by white arrows and an unknown species is identified by green arrows.
113
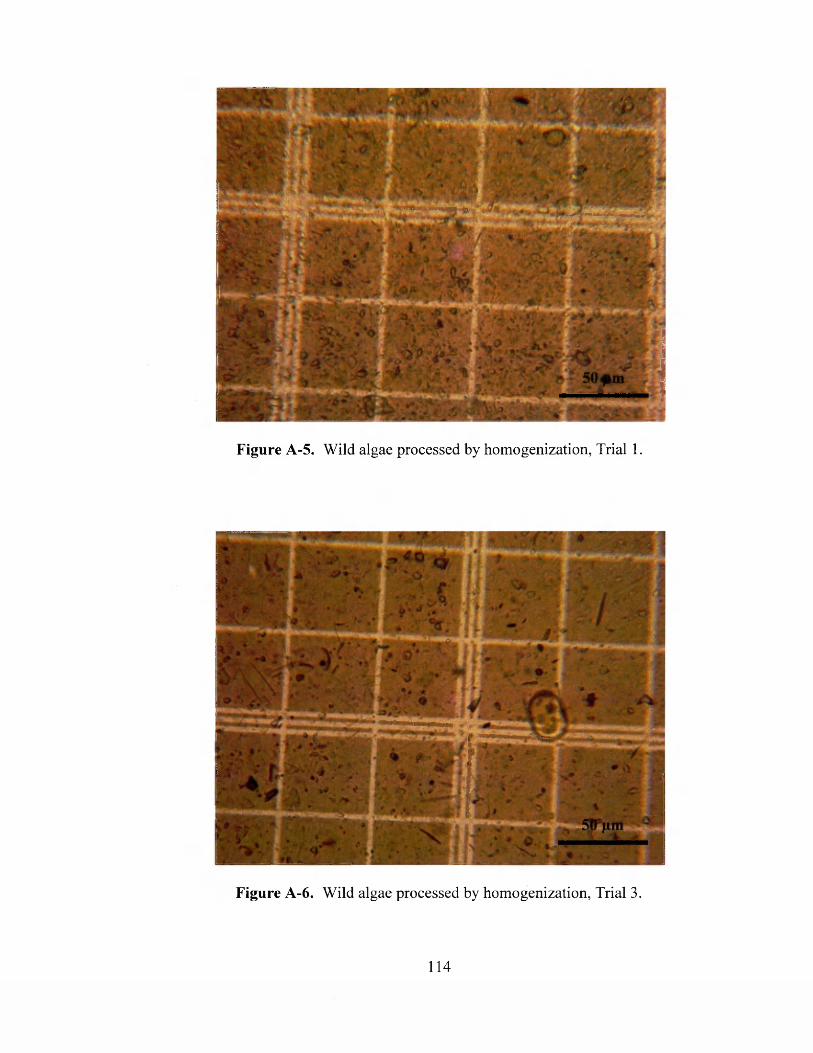
Figure A-5. Wild algae processed by homogenization, Trial 1.
Figure A-6. Wild algae processed by homogenization, Trial 3.
114
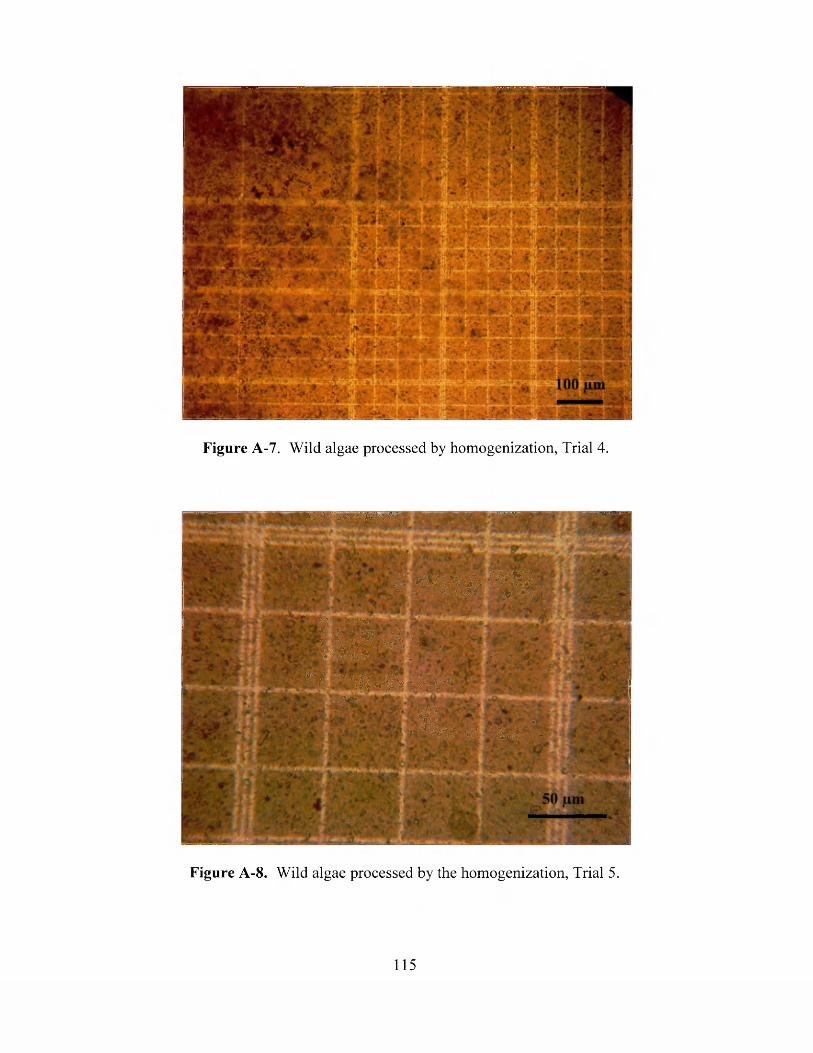
Figure A-7. Wild algae processed by homogenization, Trial 4.
M J M H mamm
V T O j f t - W . . .
* & • V jJ J .* § * v i s * v - * '
f%5? * r f 1“ ' i iiiilBiir ’■ --»■
*J I „ I# ,> W ft«■ j S L * * ■ » ■‘• j l - ' J ' . ' f > ;
■•4 !»r£*& .‘ t* *sip! .f
>*“ ■** Z f f ' W ' . ' f ' vTs r a*- k.f a?. *&* f ^ y % v 41V *>,50'
f - .* / fV :»/’ : 'I'tS *♦
Figure A-8. Wild algae processed by the homogenization, Trial 5.
115
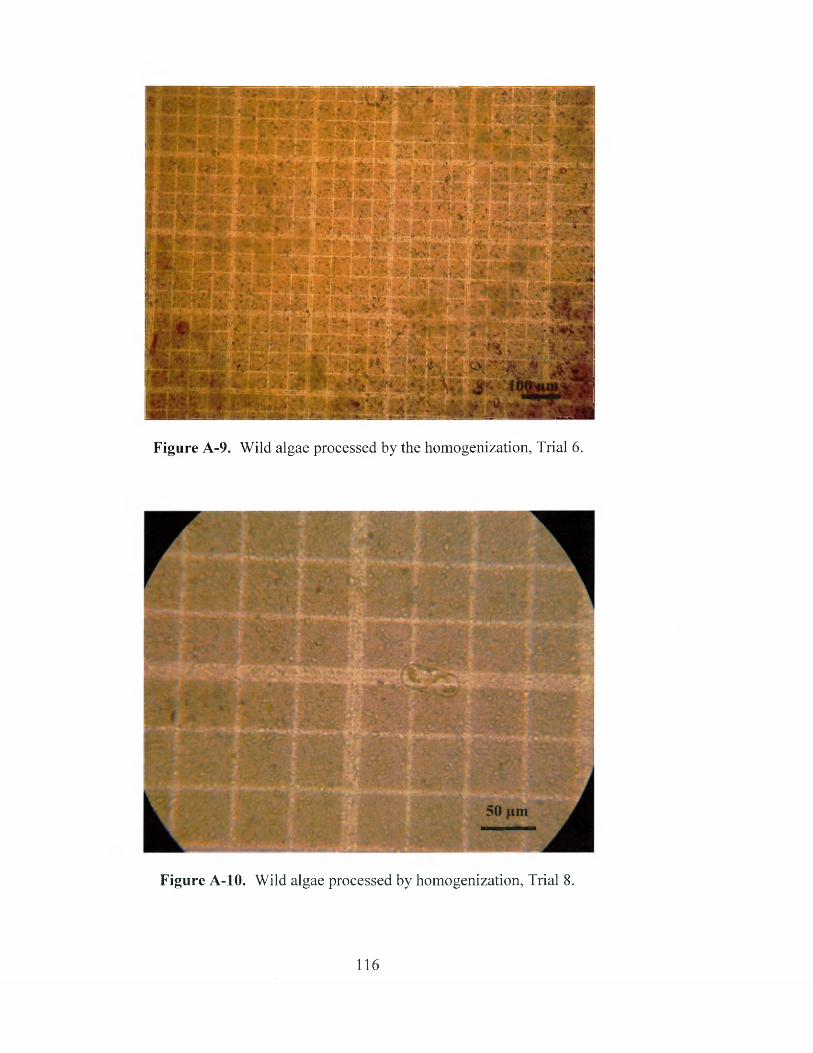
3psr
Figure A-9. Wild algae processed by the homogenization, Trial 6.
Figure A-10. Wild algae processed by homogenization, Trial 8.
116
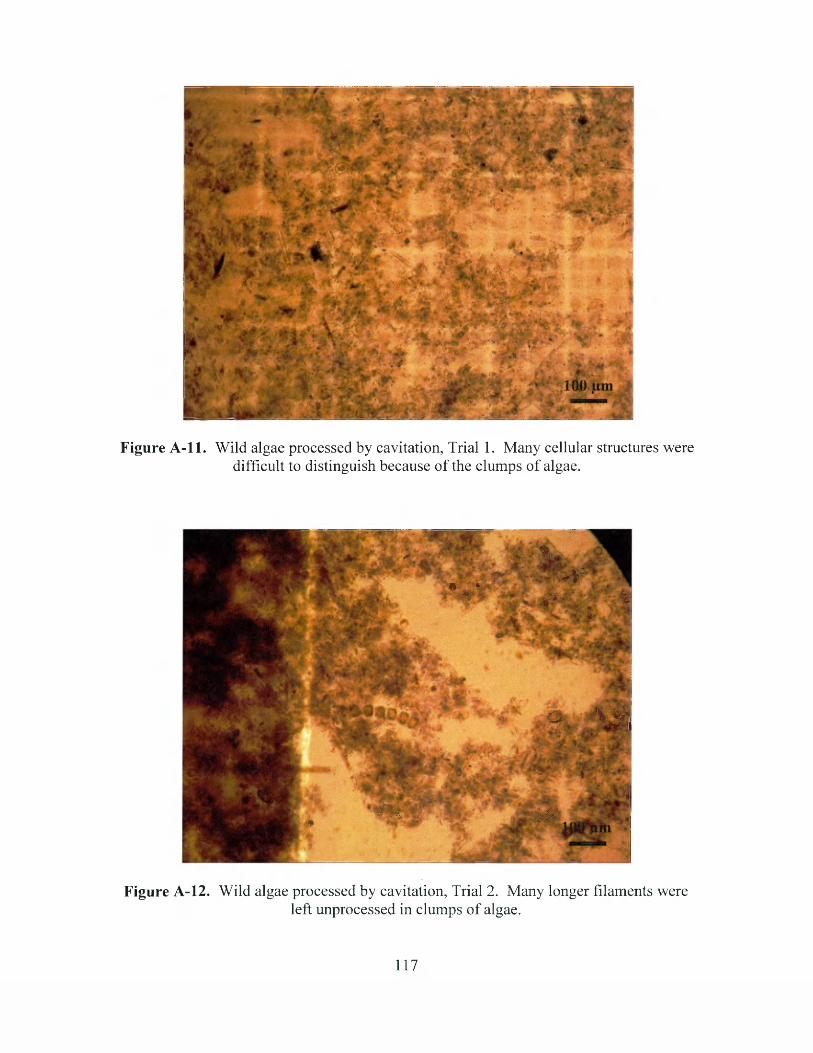
Figure A - ll . Wild algae processed by cavitation, Trial 1. Many cellular structures were difficult to distinguish because of the clumps of algae.
* 2%i - -jrAfc» «s
%'■i'm
'a * ™‘Sr*V*« %w
If>V'*
iyC **.%' ,** %'■ -m ■ jjjfyfi .
& % H
. sibl** ■
t i k
r.anfc
Figure A-12. Wild algae processed by cavitation, Trial 2. Many longer filaments wereleft unprocessed in clumps of algae.
117
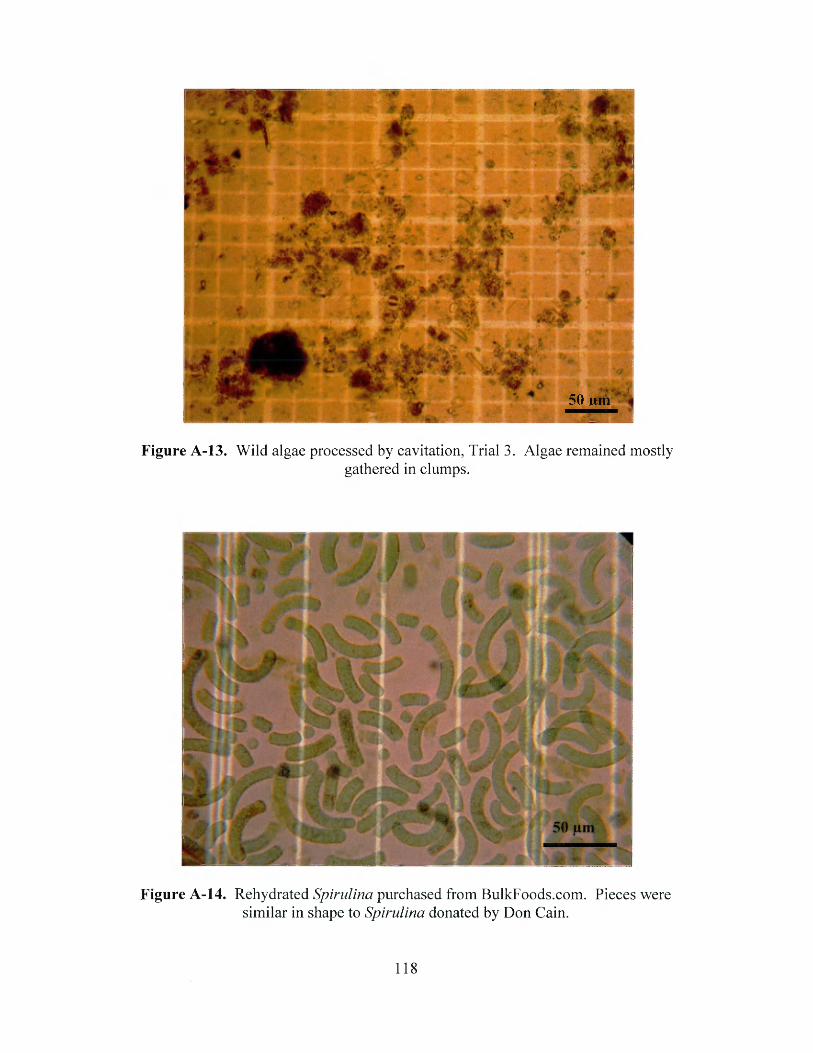
50 iLim
Figure A-13. Wild algae processed by cavitation, Trial 3. Algae remained mostlygathered in clumps.
j9
Figure A-14. Rehydrated Spirulina purchased from BulkFoods.com. Pieces were similar in shape to Spirulina donated by Don Cain.
118
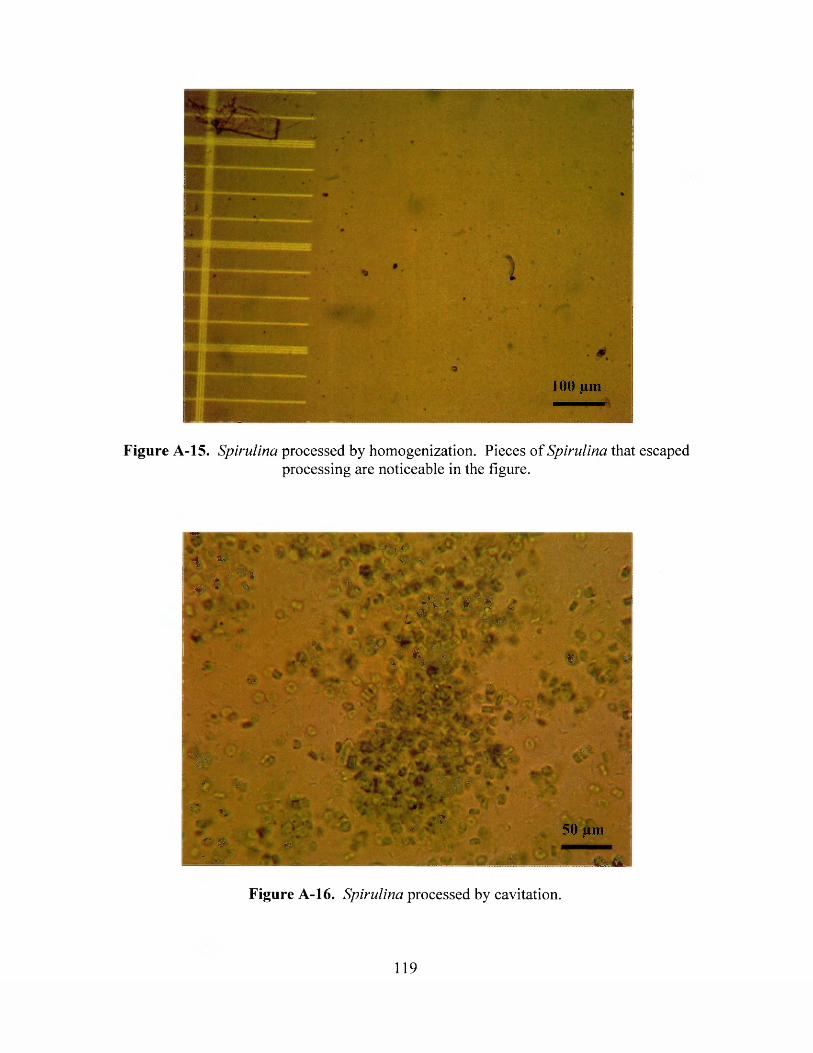
100 Jim
Figure A-15. Spirulina processed by homogenization. Pieces of Spirulina that escapedprocessing are noticeable in the figure.
& '•*•••*•...
. - - *m * \ ^
A * ’ . .H P p p i l l
^ w-' c* j & r « p .*
L *’ spN v «*■ *(? - >.
” *•* A.?.#.*>
* -A ...... f * - b
F -*v . . .
• a ? " - ■
■ 0 4r:.
i %
. o # ■•* ■ B H H H H
A
! y . f *
Im - *$ im i* h
«* ’ * 50 fim
t m
Figure A-16. Spirulina processed by cavitation.
119
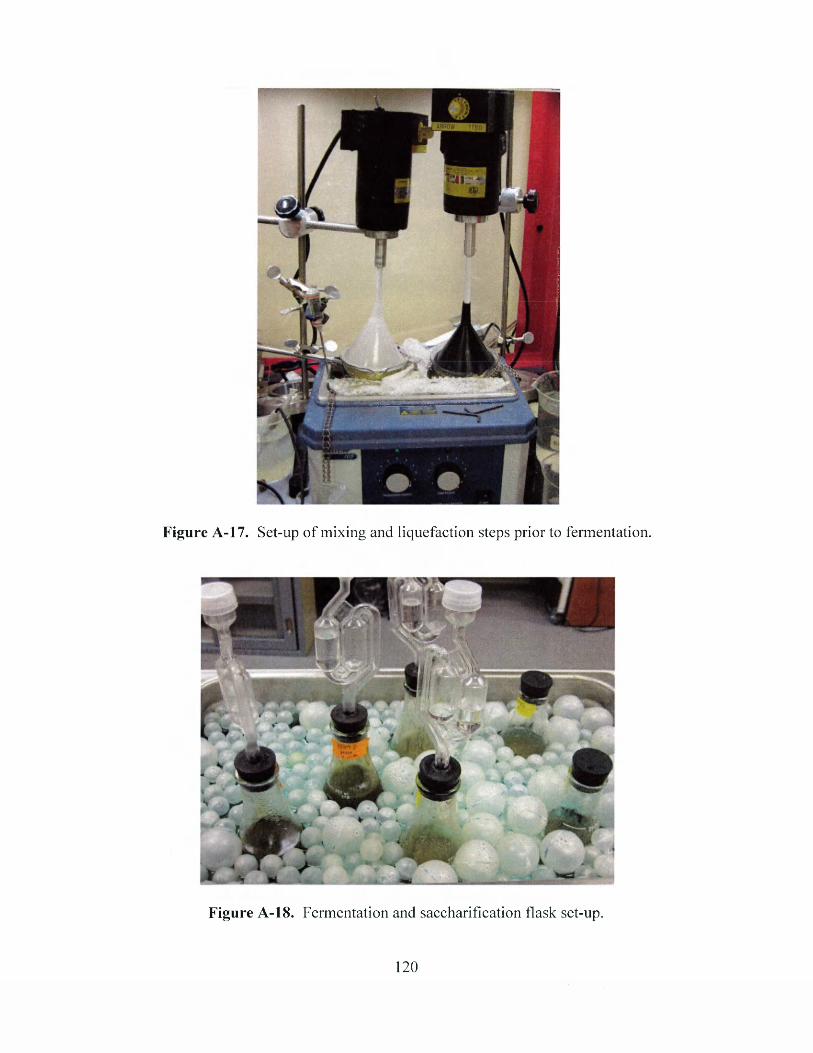
Figure A -l 7. Set-up of mixing and liquefaction steps prior to fermentation.
Figure A -l8. Fermentation and saccharification flask set-up.
120
Appendix B
HPLC Data Sheets of Representative Samples
Figure B -l. Wild algae midway into fermentation. This figure displays representative chromatograms from midway into fermentation using no processing, ultrasonic processing, and cavitation (SPR) processing techniques. Homogenization processing was not available because fermentation was not completed on this sample..............................123
HPLC component tables for Figure B - l .............................................................................124
Figure B-2. Wild algae at the end of fermentation. This figure displays representative chromatograms from the end of fermentation using the same processing techniques as Figure B -l. Again, fermentation was not completed for a homogenized sample............125
HPLC component tables for Figure B-2............................................................................. 126
Figure B-3. Wild algae midway into saccharification. This figure displays representative chromatograms from midway into saccharification using no processing, homogenization (Microfluidizer®), cavitation (SPR), and ultrasonic processing techniques.................................................................................................................................... 127
HPLC component tables for Figure B-3............................................................................. 128
Figure B-4. Wild algae at the end of saccharification. This figure displays representative chromatograms from the end of saccharification using the same processing techniques as Figure B-3........................................................................................................... 130
HPLC component tables for Figure B-4............................................................................. 131
Figure B-5. Spirulina midway into fermentation. This figure displays representative chromatograms from midway into fermentation using no processing, homogenization (Microfluidizer®), and cavitation (SPR) processing techniques..........................................133
HPLC component tables for Figure B-5............................................................................. 134
Figure B-6. Spirulina at the end of fermentation. This figure displays representative chromatograms from the end o f fermentation using the same processing techniques as Figure B-5.................................................................................................................................... 136
HPLC component tables for Figure B-6............................................................................. 137
Figure B-7. Spirulina midway into saccharification. This figure displays representative chromatograms from midway into saccharification using no processing, homogenization (Microfluidizer®), and cavitation (SPR) processing techniques..........................................139
121
HPLC component tables for Figure B-7. 140
Figure B-8. Spirulina at the end of saccharification. This figure displays representative chromatograms from the end of saccharification using the same processing techniques as Figure B-8.................................................................................................................................... 142
HPLC component tables for Figure B-8............................................................................. 143
Notes:Component labels are placed at the beginning point of each peak in each chromatogram. Vertical hash marks indicate where the apex of the peak is located.Due to the nature o f the Breeze® HPLC software system, only the components for the lowest line are labeled.
122
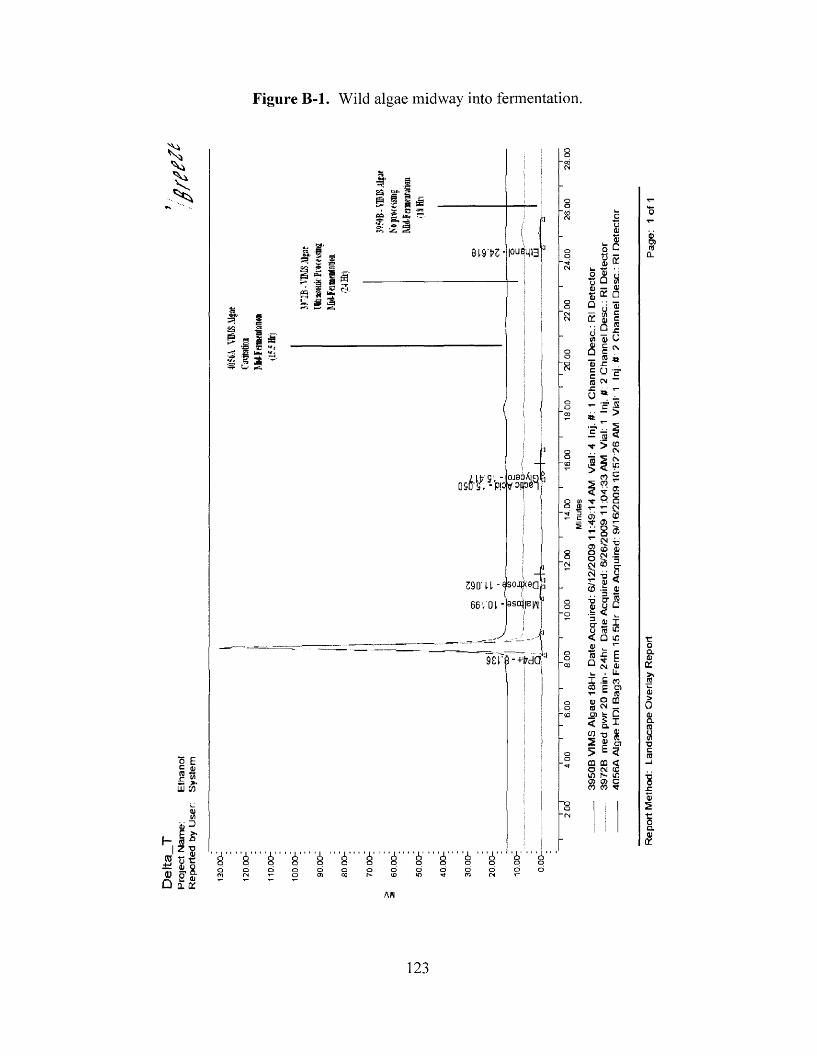
Figure B -l. Wild algae midway into fermentation.
S
I Em &JSLU W
£ S'I— (fl I Z ■o<D-2= <D O£ FS-l j q . cc:
■ST' S
1 I 's & I I * £0 2 £o' .? ^
M *3 1 1 £ 3 S §’ 5> 5J M B 2£ ^
aww
3 § a0 C w/ .2 HM •£*1 ak -
|0UBL|13
osff ojaiAinP V ^ V
£90'U - soj eaji!..(33sq|e66rot -
9 £ l ' 8 - + w a
6 i i i i A 6 6 A ( i i 6 i < iS a o o o o o o o o o o o o
uflj
O 0
— QJDC □ J £4) c Q ”
_ (0 »flj -Ci ° £(5 CM “£ - T-o * ^-- •=• ra
a —W 2 > < ra 5 <? < v « Qr ^ 0!
r ®^ § ® « s ■= § ® £ o ™ *5 S ! ® f f" * g
<Uii ffSg ^ □
y to u? < Q iflv v_I 5 Eq a p>. . u.
CD .h
i •- mCO c r a f c TOs S “ra □ < u rc■o
l »racn co < O CM CO in r— 25 0) ra o ra ra tt
AH
123
Rep
ort
Met
hod:
L
ands
cape
O
verla
y R
epor
t Pa
ge:
1 of
1
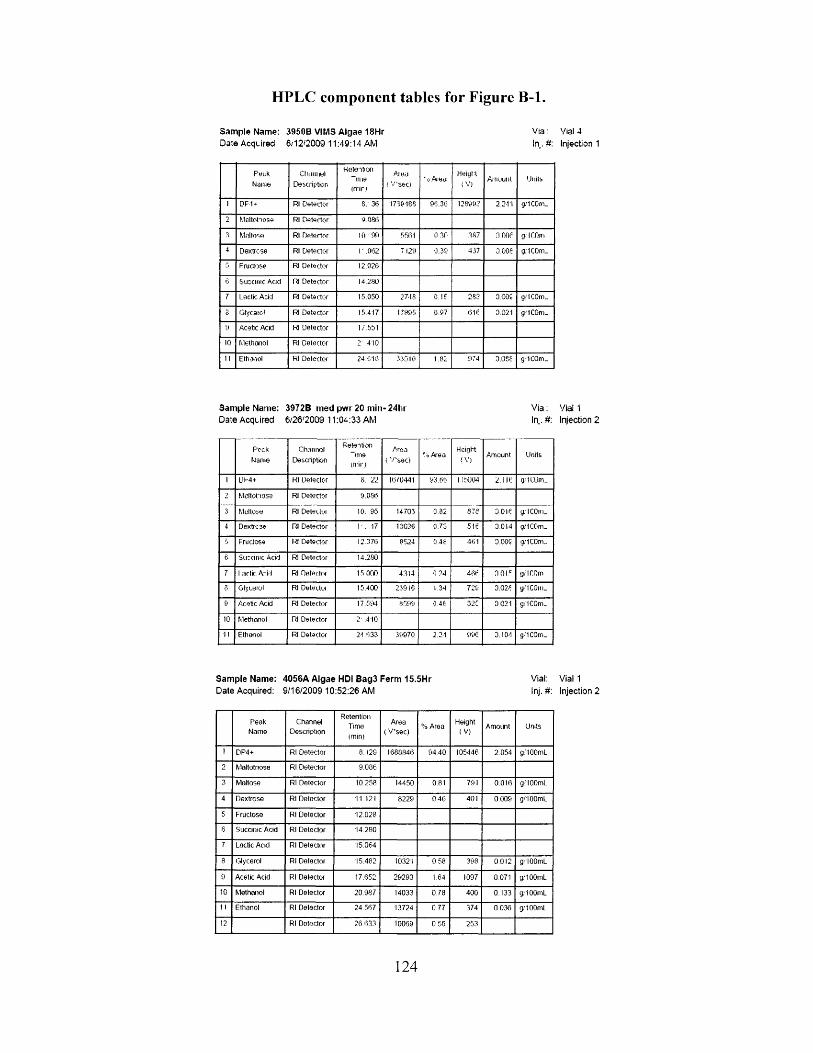
HPLC component tables for Figure B -l.
Sam ple Name: 3950B VIMS Algae 18Hr Via: Vial 4Date Acquired 6/12'2009 11:49:14 AM In .# : Injection 1
P e t*Name
ChannelDescription
Retention“ me( tr io
Ateu ( V’sec)
V A ieuH eiyll
<V)Amount Units
1 D F U Rl Detector 8. 36 1780188 96.31: 128993 2.2-11 g/1 C0m_
2 Moltotaose Rl Detector 9.086
3 Maltose Rl Detector 10 99 5561 0 30 .887 f] f)0f: g/ICOm
4 Dextrose Rl Detector 1' .062 7 120 0.39 437 0,006 g. ICOm-
Fructose Rl Detector 12.028
6 Succinic Acid Rl Detector 14.2.SO
7 Lactic Acid Rl Detector 15.050 2718 0.15 233 D.00£ g/ICOm-
8 Glycaiol Rl Detector 15.417 17895 0.97 616 0.021 g/ICGni-
* Acetic Acid Rl Detector 1 /5 5 1
10 Methanol Rl Detector 2 .410
II Ethanol Rl Detector 24.018 33010 1.82 974 0.08? g.'1C0m_
Sam ple Name: 3972B nied pw r 20 ruin- 24hi V ia: Vial 1Date Acquired 6/26'2009 11:04:33 AM In..#: Injection 2
PockName
Ch.mnolDescription
Retention “ me Orir >
Area (. V se c )
t o AreaHeight
!V)Amount Units
1 UR4+ Rl Detector 8. 72 16/0441 93. tit I 15004 2 .1 It: g/1LUm_
2 M eltonose Rl Detector 9.066
3 Mulluse Rl DeleUoi 10. 95 14703 0.32 STS 0 .0 16 g.- ICOiii-
4 Dextrcse Rl Detector r . 17 13036 0,73 516 3 .0 14 g/1C0m_
5 Fructose Rl Detector 12.376 8524 0.45 461 3.00C g/1C0m_
6 Succinic Acid Rl Detector 14.290
7 1 nrtir. Acid Rl Detector 15 nno 4314 0 24 466 on if g/ICOm
3 Glycwol Rl Detecloi 15.400 23918 1.34 726 3.028 y/IC0m_
9 Acetic Acid Rl Detector 17.094 8099 0.48 32C 0.021 g/ICOm-
10 Methanol Rl Detector 2' .410
11 Ethanol Rl Detector 24.633 39070 2.2-1 996 3.10-1 g/1C0m_
Sam ple Name: 4056A Algae HDI Bag3 Ferm 15.5Hr Vial: Vial 1Date Acquired: 9/16/2009 10:52:26 AM Inj. #: Injection 2
PeakName
ChannelDescription
RetentionTime(min)
Area ( V’sec)
% AreaHeight
(V )Amount Units
1 DP4+ Rl D etector 8.129 1688846 94 40 105446 2 0 5 4 g/100mL
2 Maltotnose Rl Detector 9.086
3 Maltose Rl D etector 10.258 14450 081 791 0.016 g/IOOmL
4 Dextrose Rl Detector 11.121 8229 0.46 401 0 0 0 9 g/IOOmL
5 Fructose Rl Detector 12.028
6 Succinic Acid Rl Detector 14.280
7 Lactic Acid Rl D etector 15.064
8 Glycerol Rl Detector 15.482 10321 0 58 398 0 0 1 2 g/IOOmL
9 Acetic Acid Rl Detector 17.652 29293 1.64 1097 0.071 g/IOOmL
10 Methanol Rl Detector 20.987 14033 0.78 400 0.133 g/IOOmL
II Ethanol Rl Detector 24.567 13724 0.77 374 0 0 3 6 g/IOOmL
12 Rl Detector 26.633 IOOI39 0 56 253
124
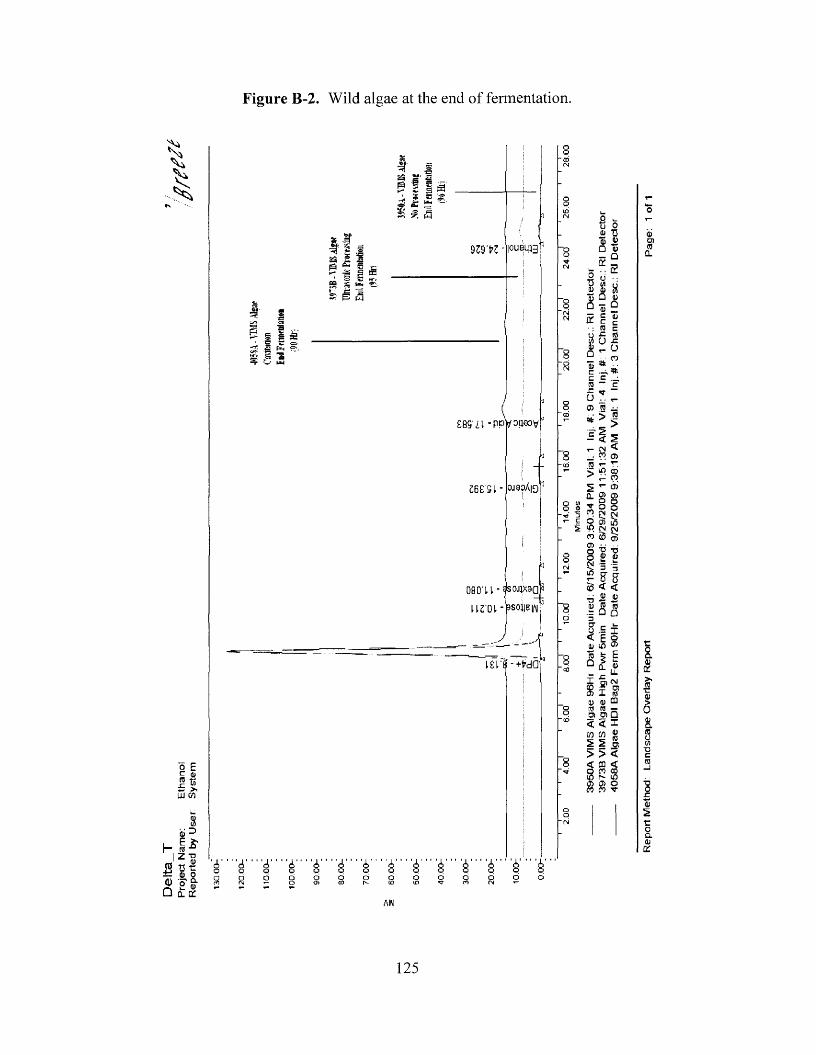
Figure B-2. Wild algae at the end of fermentation.
? e" t) £: > UJ CO
8i i 3
hI z rejS tfr
— S v ' 5 * 8 -Q U «B
•Is
=?! ■■8
§§
1s S '
•r»
c
§F*re*9
—r *3
i? sr 3' I -sg A 1 c-“ -is § rS
r r =P 5
I ' S2 • * s I l i a-i* 2 ,2 s t f
i s s
939'W- cueqj3
£ 8 S 7 l - P P 1 /0 1 .1 9 0 V
C 6 £ SL * 0J90A|9
080'U ■ sojjxaap uroi -Woi|e|fli’J
t e i If - +t da
dj' c!> ' i " ‘ <i ' i i ' i ' ' A A i ' '' <i A AO o o o p o o p p o p p p
ot) 0ft tiHi jj □ re
5 u •P tfi u1) O (5"33 Q d□ ® £c Cja:
a. cc
6 f r- O«<?
*C
O 7 . r - 0) B -
I Si - CN <I- ^ CO 05 re *- tt 5 Irt eo ^ ^ CO^ ®£L g O 5 o J O OCO tN (vi S o5 ii5
CM CM CO < g 55
s i tH in 2 o <o < <d re «j '5O’
01 E o E™ 5
- f i 11X o)M CO ~ c r o I reD H) □re re —O) O) □< < Ig « 82 2 a > > << 03 < O CO CO 10 MOo> a> o co co re-
re
AW
125
Repo
rt
Met
hod
Lan
dsca
pe
Ove
rlay
R
epor
t
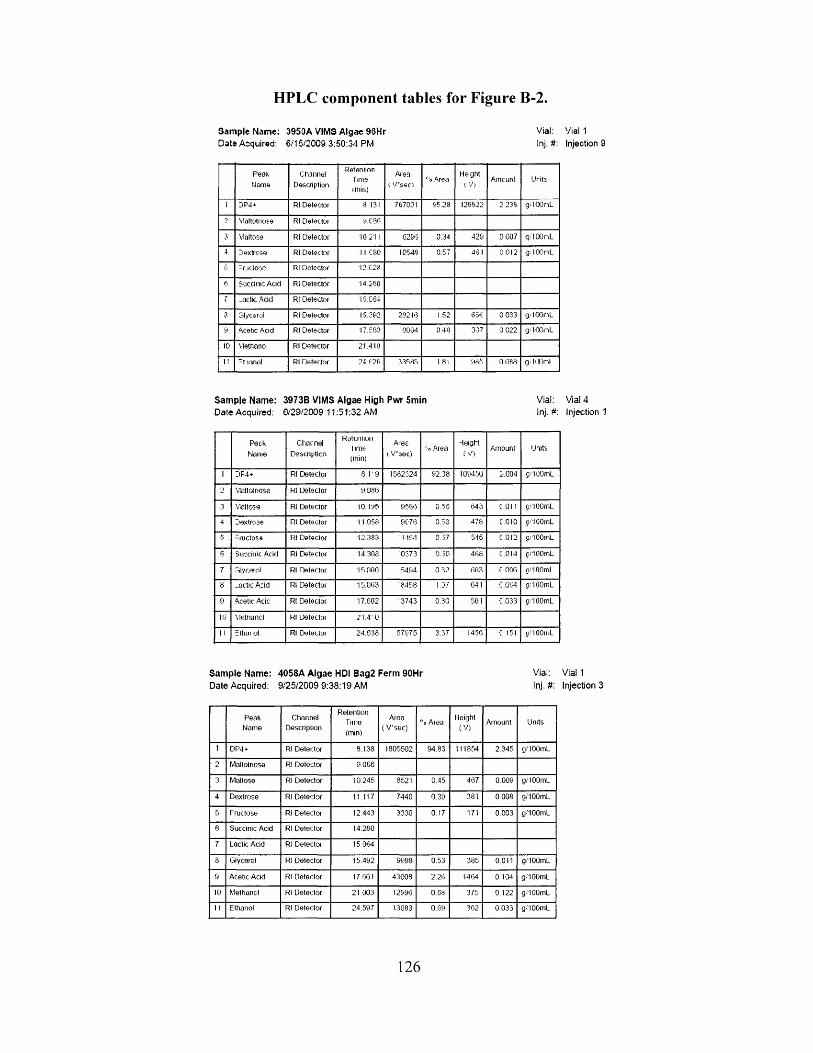
HPLC component tables for Figure B-2.
Sam ple Name: 3950A VIMS Algae 96Hr Vial: Vial 1Date Acquired: 6/15/2009 3:50:34 PM Inj. #: Injection 9
Peak N cane
ChannelDescription
RetentionTimsimins
Area ( V ssc.)
% AreaHe ght
t ViAincunt Units
1 DP4^ Rl Detector 8.131 767031 55.28 126822 2 238 g/IOOnL
2 M altetiiose Rl D etector y .cao
3 Maltose Rl D etector 10.211 6293 0.34 429 0 007 q/1 OOnL
4 Dextrose Rl Detector 11.C80 10548 0.57 4 6 1 0 0 12 g< I OOnL
5 r rjd o o o Rl Dotcctor ■I2.C28
* 5ucclr»c A dd Rl D etector 14.260
7 .ac tic A dd Rl Detector 15.C64
3 Glycerol Rl Detector 15.292 282 16 1.52 656 0 033 g; I OOnL
y Acetic Acid Rl D etector 17.503 0094 0.40 367 0 022 g/IOOmL
10 M ethane Rl D etector 21.410
I! -tm n o l Rl Detector 24 i=?6 33585 1 8 : 065 0 088 g- lOOnl
Sam ple Name: 3973B VIMS Algae High Pwr 5min Vial: Vial 4Date Acquired: G/29/2009 11:51:32 AM Inj.#: Injection 1
P eckNome
C luirnelDescription
R etentionlim e(mini
Ares 1 V*sec)
• 0 AreaHeight
i V)Amount Units
I DF4+ Rl D etector 8 .1' & 1582524 92.38 109450 O O g/IOOmL
2 Mollotriose Kl D etector 9.086
.3 M altose Rl D etector 10.196 9586 0.56 643 c o n g/IOOmL
4 Dextrose Rl D etector 11.058 9676 0.33 478 C .0I0 g/IOOmL
5 : ructose Rl D etector 12.383 ■ 115-1 0.37 545 c.012 g/1 OOmL
6 succinic Acid Rl D etector 14.308 0373 0,30 468 C.0I4 g/1 OOmL
7 Glycerol Rl D etector 15 000 5404 0 VO 60.3 r oof. g/1 OOinl
8 _actic A dd Rl Detector 15.0(53 ' 8458 1.37 641 C .064 g/1 OOmL
y Acetic Acic: Rl D etector 17.602 ■3743 0 3 0 501 C.033 g/1 OOmL
ll.i Methanol Rl D etector 2 1 .4 -0
I I SlllUf ol Rl Delectoi 24.338 57575 3.37 1456 C. 151 y/IOOiuL
S am ple Name: 4058A A lgae HDI Bag2 Ferm 90Hr Vial: Vial 1Date Acquired: 9/25/2009 9:38:19 AM Inj.#: Injection 3
PeakN am e
C hannelDescription
R etentionTime(min)
Area ( V’sec)
% AreaHeight
(V )Amount Units
1 DP4+ Rl D etector 8.138 1805502 94.83 111854 2.345 g/IOOmL
2 Maltotriose Rl D etector 9.086
3 M altose Rl D etector 10.245 8521 0.45 467 0.009 g/IOOmL
4 D extrose Rl D etector 11.117 7440 0.39 381 0.008 g/IOOmL
5 Fructose Rl D etector 12.443 3330 0.17 171 0.003 g/1 OOmL
6 Succinic Acid Rl D etector 14.280
7 Lactic Acid Rl D etector 15.064
8 Glycerol Rl D etector 15.492 9998 0,53 385 0.011 g/IOOmL
9 Acetic Acid Rl D etector 17 661 43008 2.26 1464 0 104 g/1 OOmL
to M ethanol Rl D etector 21.003 12996 0.68 375 0.122 g/1 OOmL
1 1 Ethanol Rl D etector 24.597 13083 0.69 362 0.033 g/IOOmL
126
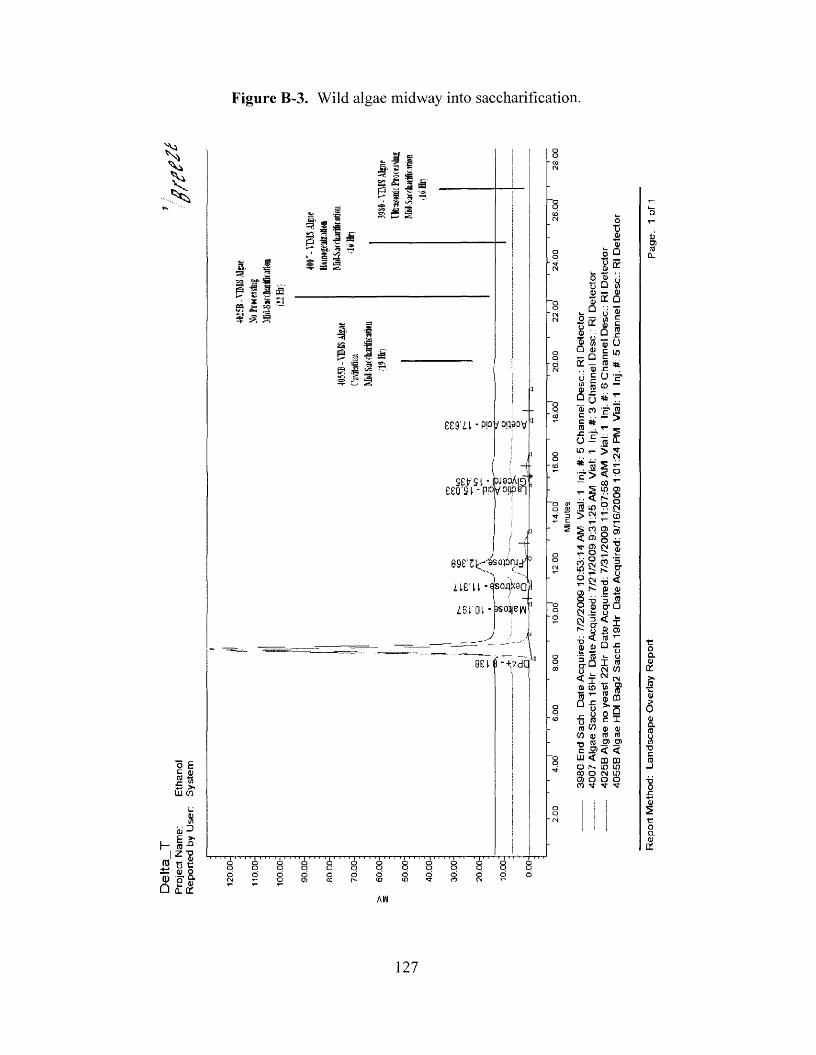
Figure B-3. Wild algae midway into saccharification.
“O" (N
€
“O' cd
Z t $ L l -pp / q ^ v
Setr'SL -IPJ3 I0 eeost - pp !ipB-|
—Qo £I Ilu co
o■c »_ .22 o "53 tJ □ 0 — % * Qce
A M <u□ <D c— Q c q ; — n . . -c u § os | ®□ (J =ftc rf l a i r sU5 r- >* a s•£■> <— ^ CO
— < f-<2 LO 9
^ W r
5 : CO O)
? ® o v ffl Nr - O n
5= £3 -ys 7 .£9 TJ 3 ° o a $s o$^ u ft43 < M # 1) Q = (5 >-0-Q Io CM
£ - CM
ID (O 15 ■tS T" flj W fljQ r 5 ,1-j y ^ r: U 0■5 rc cra CO a)
CO a;■o « - c 5 < lu < mO M OCO O CM0)0 o co •«j-
O)
AW
127
4055
B A
lgae
HD
I Ba
g2
Sacc
h 19
Hr
Date
Acq
uire
d: 9
/16/
2009
1
01
24 PM
Vial
: 1
Inj.
#: 5
Cha
nnel
Des
c.:
Rl D
etec
tor
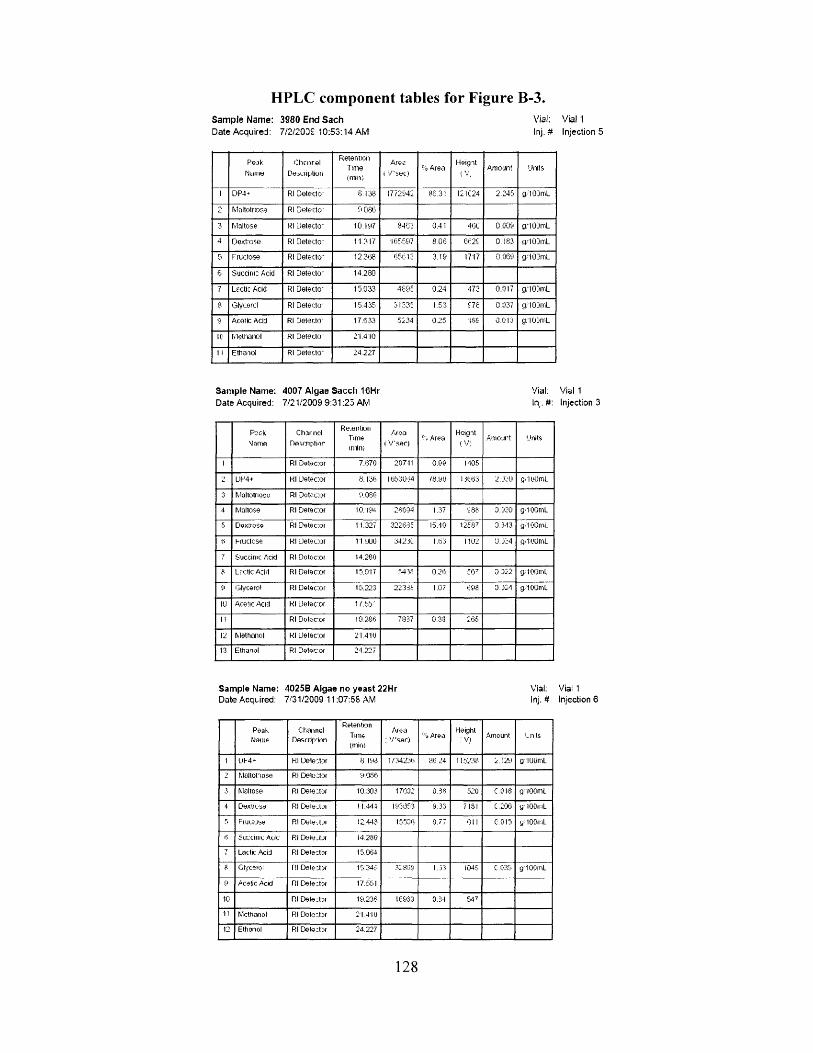
HPLC component tables for Figure B-3.Sam ple Name: 3980 End S ach Vial: Vial 1Date Acquired: 7/2/20DS 10:53:14 AM Inj.# Injection 5
P eak
Nan it)C hcnre l
DeaCiipliun
RetentionTune(min)
Area
( '/ 's e c t% Area
HeigatAmount Units
1 DP4 + Rl D etecto- 8.138 1772942 86.31 I2IC24 2.245 g/1 ODrnL
2 Mnltotriose Rl D e tecto - 9.0815
3 M altose Rl D etecto- 10 197 8462 0.41 46C 0.009 g/IODmL
4 D extrose Rl D etecto ' 11.317 1 6 5 5 9 7 8.06 6629 0.183 p/1 ODiTiL
Fm ctose Rl D etecto- 12.368 65612 3.19 1717 0.069 g"IODmL
6 Succirn: Acid Rl D e tecto ' 14.280
7 Lectic Acid Rl D etecto- 15.033 4895 0.24 473 0.017 g/IODniL
3 Glycercl Rl D etecto ' 15.435 31838 1.53 678 0.037 g/103mL
9 Acetic Acid Rl D etecto- 17.633 5234 0.25 159 0.013 g/1 CDmL
10 M ethanol Rl D etecto- 21.410
1 1 Ethanol Rl D e tecto- 24.227
Sam ple Name: 4007 Algae Saccli 16Hr Vial: Vial 1Date Acquired: 7/21/2009 9:31:25 AM In . #: Injection 3
P ack 9 nine
Ch.ir nolnesrriptior
Re.eiHicmTimeimlm
Area 1 V s e r )
c . AreaH cig it
<v;Amount Units
I Rl Detector 7.670 20711 0.90 1406
UP4+ Kl D e te c ta 8.136 Hti.53U;4 78.90 13663 2.J30 grli'UmL
3 Maltotriosc Rl Dotoctor 9.086
4 M altose Rl Detector 10.194 23634 1.37 586 3.320 g/1 OOmL
5 Dextrose Rl Detector 11.327 322635 15.10 12587 3.343 g/1 OOmL
6 hructcse Kl Detector IHKJO 34231 1.63 1102 U J :4 g/IOOmL
7 Succinic Acid Rl Detector 14.280
3 Lc-ctlc A:id Rl Detector 15.017 5435 0,26 567 3.322 g/IOOmL
0 Glycerol Rl Detector 15.223 22335 1.07 c98 0.324 g/1 OOmL
10 Acetic Acid Kl Detector 1 r .t* '
It Rl Dotector 19.288 7837 0.33 265
12 Methanol Kl Detector 21.410
13 Ethanol Rl Detector 24.227
Sample Name: 4025B Algae no y eas t 22Hr Vial: Viai 1Date Acquired: 7'31/2009 11:07:58 AM Inj.# Injection 6
Peak M miiF
ChannelDfiscrip’ion
RetentionTime(mini
Area : V s e r ) % Area
HeightV)
Amount L n ts
1 UI-4+ Kl Delector 8.196 1/34236 86.24 115286 2.1261 g ItilimL
M oltonose Rl Detector 9.086
.1 Maltose Rl Detector 10,303 17(332 0.38 520 CO 18 g/'IOGmL
4 Dexln.se Rl CfeteDui 11.444 193053 9.33 7181 C.206 g IOOiiiL5 Fiuctuse Rl D e leJo i 12.44? 15536 0.77 O il CO 15 y IOOiiiL* Succinic Acic Rl D e te J ji 14.280
7 Lactic Acid P.I Detector 15.064
8 Glycerol 171 Dele star 15.246 32839 1.33 1045 C.035 gUOOmL
Cl Acetic Acid Dl Detector 17.551
10 Rl Detector 19.236 16933 0.34 547
11 Methanol Rl Dotector 21.410
12 Ethanol Rl Detector 24.227
128
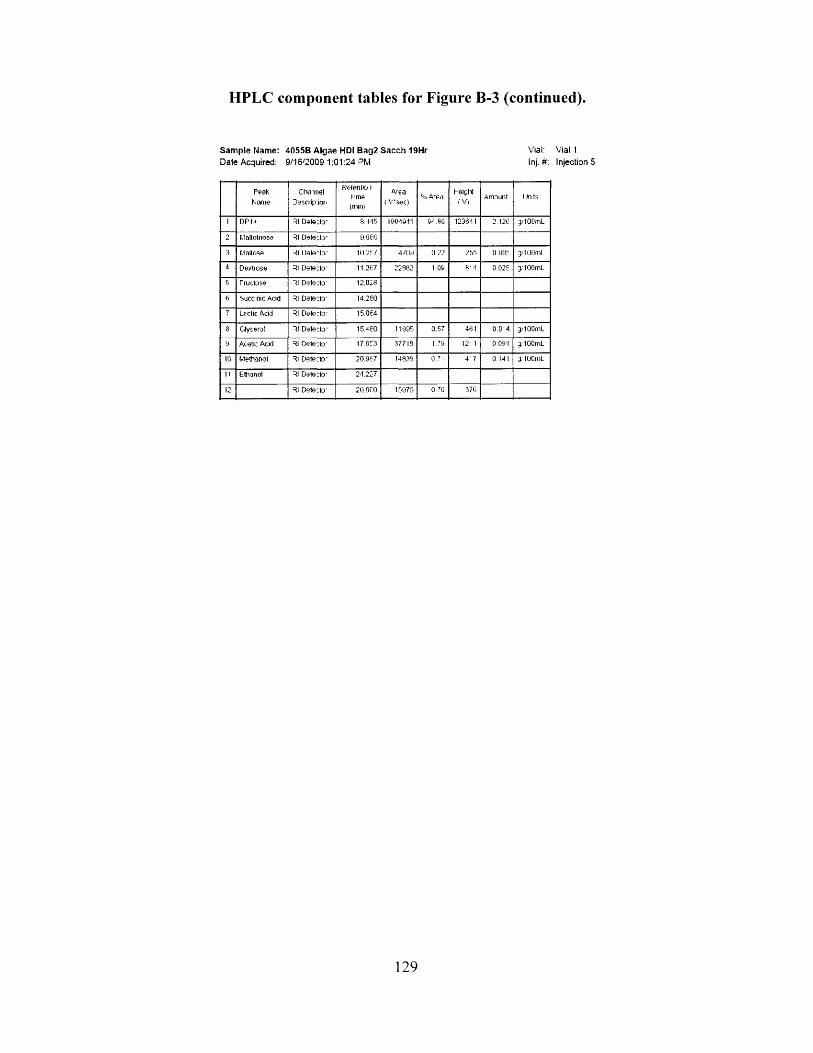
HPLC component tables for Figure B-3 (continued).
Sam ple Name: 4055B Algae HDI Bag2 Sacch 19Hr Vial: Vial IDale Acquired: 9/1 S'2009 1:01:24 PM Inj.#: Injection 5
PeakName
Clio mel Description
Retentto iI inie (nun)
Area ( V 'sec)
A, A-eat-eig lt
( V)Amount l in ts
1 D PI* 31 Detecto' 5.1-15 1904011 9-3 80 123641 2.126 g/IOOmL
2 Maltotriose 31 Detecto' aoeo
:t Maltose 31 Detecto' •lilCV 4/04 il 7! 733 11 till.’' g/Hlliml
4 D«l)<tfOS9 31 Detecto' 1'1.267 22882 1.09 8' -1 0.025 g/IOOmL
5 T ruc.tose 31 Detecto' '12.028
IS 3ucc rtc Add 31 Detecto' 14.250
7 Lr clic Acid 31 Detecto- 15.064
8 Glycerol 31 Detecto' 15A60 11995 0.57 461 0.0 4 g/100mL
9 Acetic Acid 31 Detecto' 17.053 377 IS 1.79 12'1 0.091 g.'l OOmL
10 Methanol 31 Detecto' 20.967 14 833 0.71 4 '7 0.141 3,'IOOniL
II Ethanol 31 Detecto' 24.227
12 31 Detecto' 20.060 15970 0 .7G 370
129
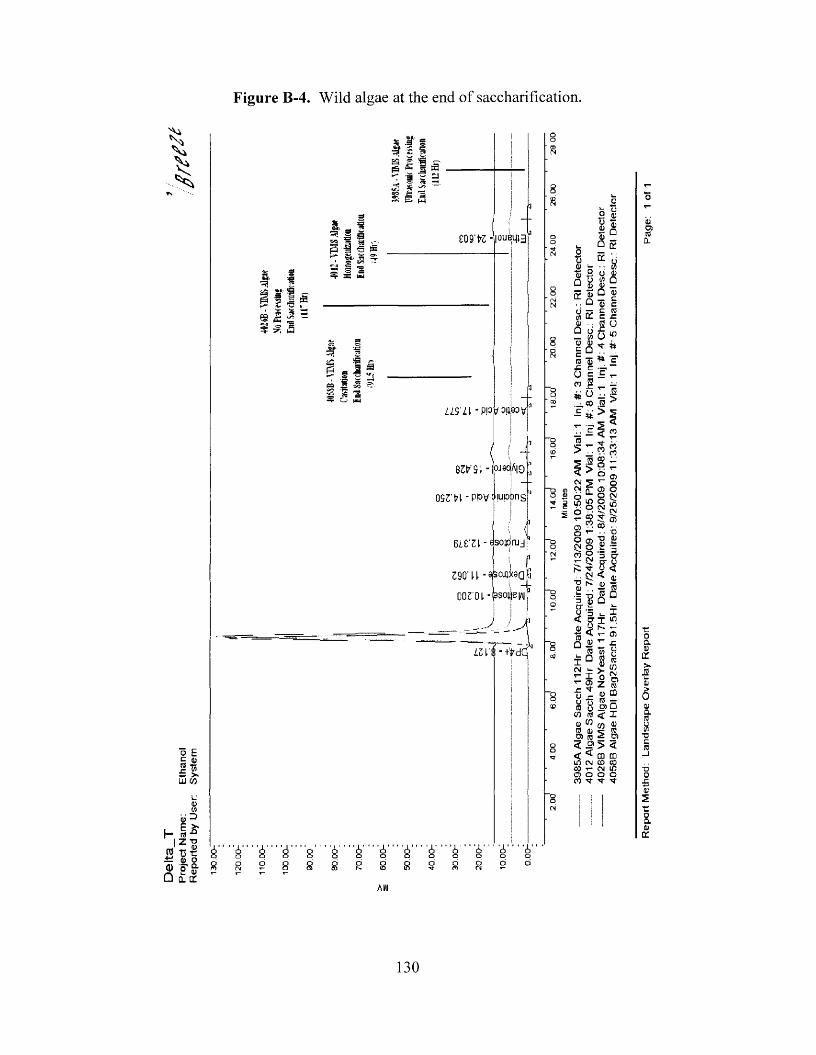
Figure B-4. Wild algae at the end of saccharification.
Q E
nH I CO
Vw
3I Z 13
±i t) oX 's’®□ Q.CC
115 i i -PPP.U*
6i£'Zl -asoiqnjj
390' 11 - 9SOJ1X9Q k]00 S'01 -Uoj|eN[
4'Obro
o a;
uQ Ecc
H o iU tf) Qa> «> _ B Q ura(J ^
(/) LL C X.4) ■ ; S (J
D O «fl T *in ^ 'ET
rara jp 6co _ tt o
■ cO S-£*>
,S In S'
CO
CM ■>
2 *S s
£ ra- o < < «3 ^ ii 15
•fa -d JS □3 4) U
u '5 u i< fflK I« y £ -q - r -g« Jj U Q J) it
_ WI a>£ m-ouraoo
(U £ > o d>Z ra D CD raw O) □
f5 < Xa> ^ to qjSSL <u 5 SI ® ro _ 2* < 2> «
< **■ CD CD
0)000 CO M" M" M '
AW
130
Repo
rt
Met
hod:
L
ands
cape
O
verl
ay
Rep
ort
Page
: 1
of 1
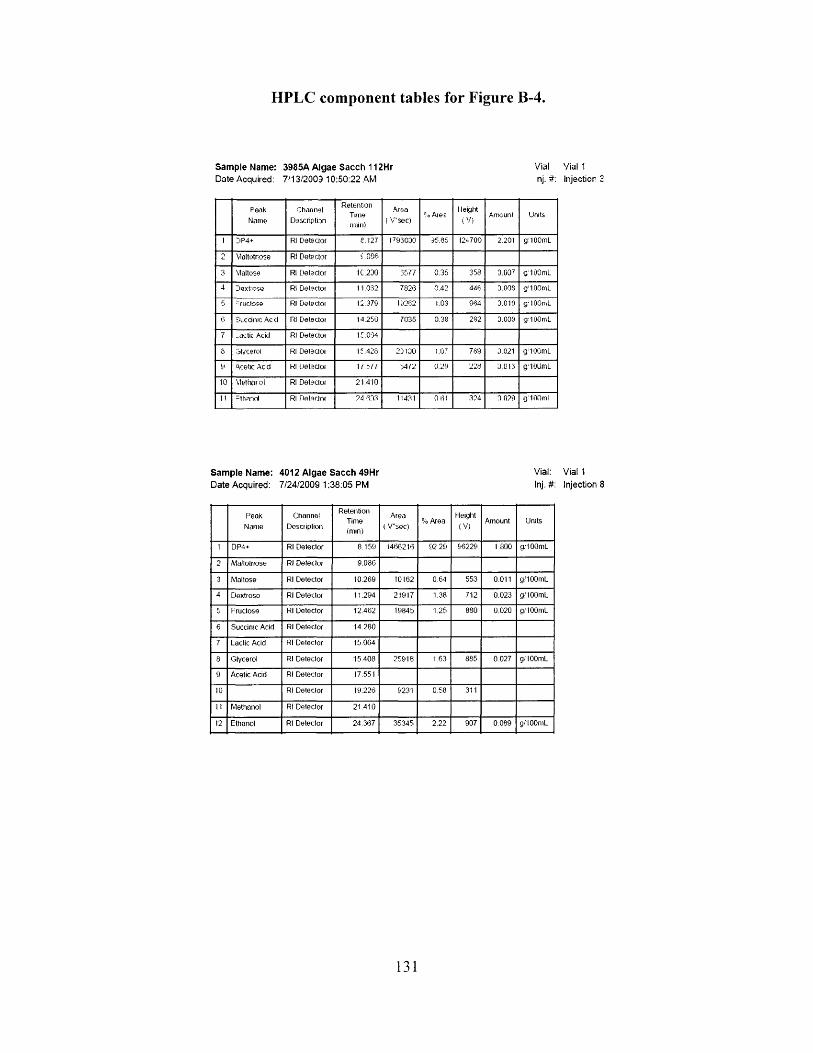
HPLC component tables for Figure B-4.
Sam ple Name: 3985A A lgae S acch 112Hr Vial Vial 1Date Acquired: 7 '1 3/2003 10:50:22 AM nj. #: Injections
Peak
Name
Channel
Description
RetentionTune(mini
Area
( V 'sec)°.o Are s
Height
! V)Amount Units.
1 DP4+ Rl D etector e i2 r lT930D0 35.85 12^700 2.201 g'lOOmL
2 Maltotriose Rl D etector i .086
3 Maltose Rl D etector 1C.230 3577 0.35 358 0.00^ O'! OOmL
4 D ex ro se Rl Detector 1 1 0 3 2 7826 0.42 446 3.DOS g'100mL
5 r ructose Rl D e tedoi 12.370 13202 1.03 064 0.010 gel OOmL
?■ Succinic Ac d Rl Detector 14.250 7035 0.38 282 0.009 g:100mL
7 _attic Acid Rl D etector 1 C.004
3 Glycerol Rl Oetectoi 15.428 20 100 1.07 789 3.021 glOOmL
9 Acetic Ac d Kl D etector 1 / 1 / 7 3 4 /2 U.29 228 0.013 g.'IOUmL
10 Vlethorol Rl Detector 21 .410
11 -thanol Rl Detector 24 633 11431 n m 324 0 029 g: 100ml
Sam ple Nam e: 4012 Algae S acch 49Hr Vial: Vial 1Date Acquired: 7/24/2009 1:38:05 PM Inj.#: Injection 8
P eakNam e
C hannelDescription
R etentionTime(rnin)
Area ( V s e c )
% AreaHeight(V )
Amount Units
1 DP4+ Rl Detector 8.159 1466216 92.29 96229 I 800 g/IOOmL
2 M altolriose Rl D etector 9.086
3 M altose Rl Detector 10.269 10162 0.64 553 0.011 g/1 OOmL
4 D extrose Rl D etector 11.294 21917 1.38 712 0.023 g/IOOmL
5 Fructose Rl Detector 12.4(32 19845 1.25 880 0.020 g/IOOmL
6 Succinic Acid Rl Detector 14 280
7 Lactic Acid Rl Detector 15.064
8 Glycerol Rl Detector 15.408 25918 1.63 885 0 0 2 7 gs lOOmL
9 Acetic Acid Rl Detector 17.551
10 Rl D etector 19.226 9231 0.58 311
11 M ethanol Rl D etector 21 410
12 Ethanol Rl Detector 24.367 35345 2.22 907 0.089 g/1 OOmL
131
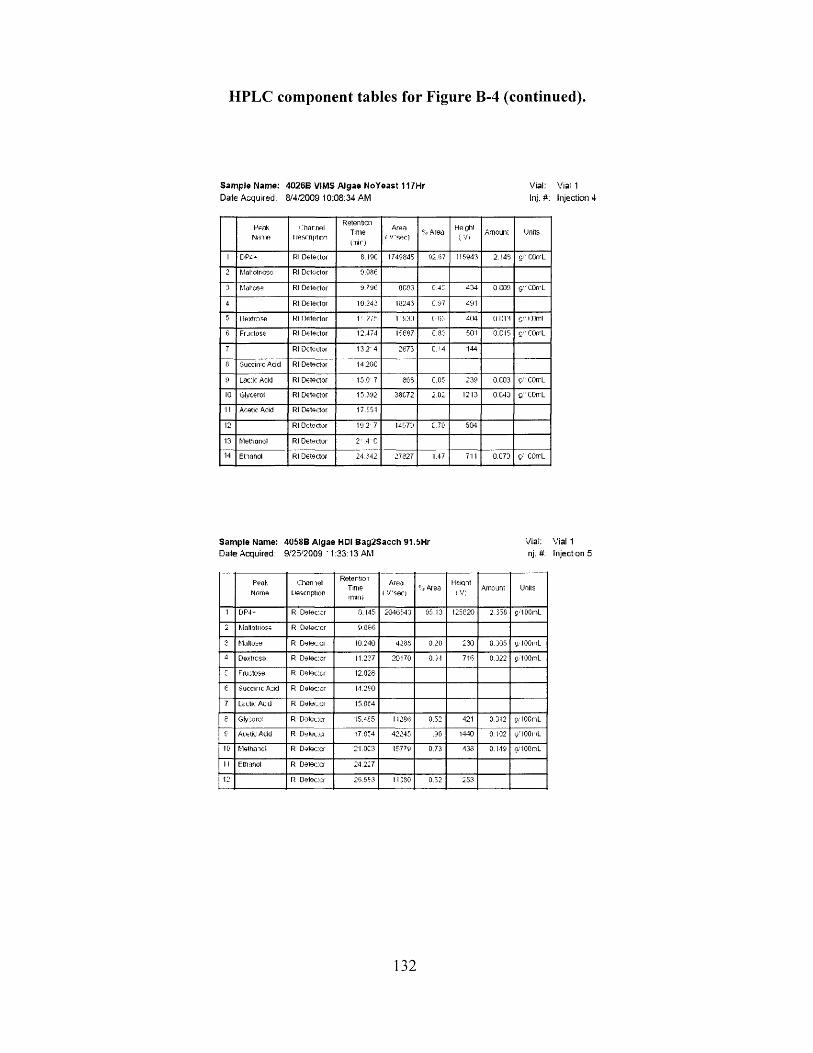
HPLC component tables for Figure B-4 (continued).
Sam ple Name: 4026B VIMS Algae NoYeast 117Hr Vial: Vial 1Dale Acquired 8/4/2009 10:08:34 AM Inj.#: Injection4
PenkN m w
' th a rm l 1 te sc n p tm
RetentionTime(T*r>
Aren ( V’SflC) % Area
HeohlAmoun: Units
1 DP4-* Rl Detector 8. ISC 1740845 02.67 115943 2 1 4 5 cr COrrL
2 M alxtrooc Rl Detector o.ose3 Maltose Rl Detector 9796 0CO3 C.45 434 0.C03 Si" COn'L
4 Rl Detector 10.243 13245 C.97 491
5 I textrnse Rl Detector 1 ' 7/L 1 ll-il-CI ( lie 404 nun S" Ctlrrl
6 Fractose Rl Detector 12.474 15687 C.83 501 0.C 15 cr COrrL
7 Rl Detector 13.2 4 2673 C.M 144
(1 Succinic A dd Rl Detector 14.2CC
9 Lactic Acid Rl Detector 15.0 7 865 C.05 239 0.C03 g." COrrL
10 Glycerol Rl Detector 13.302 381572 2.02 1213 Q.C43 &" COn’L
II Acetic Acid Rl Detector 17.551
12 Rl Detector 10 2 7 K073 C.70 504
13 Methanol Rl Detector 2 .4 C
14 E tia n d Rl Detector 24.342 27827 1 47 711 0.C7D g/' COn’L
Sam ple Name: 4058B Algae HDI Bag2Sacch 91.5Hr Vial: Vial 1Date Acquired: 9/25/2009 ' 1:33:13 AM nj. #: Inject on 5
PeakNome
Chon lel Description
FtetertioiTrueinniii
Area l V/'sec)
% AreaHeight
Amount Units
1 DP4- R D etecxr 0.145 2046543 95.13 125520 2.550 g/1 OOnL
2 Mnltotriose R D etecxr 9.056
3 Maltose R Detec.ci O o 4238 0.20 230 0.395 ij/IOOrtL
4 Dextrose R D etecxr 11.227 20170 0 .3 1 716 0.322 g/1 OOnL
c Fructose R D etecxr 12.028
6 Succinc Acid R D etecxr 14.250
7 Lactic Ac 0 R D etee.u 15.064
8 Gly:oroi R Doloc'.cr 15.455 11286 0.52 421 0.3I2 g/1 OOnL
s Acetic Acid R Delec.ci 17.034 42245 . Iitl 1440 0.102 y-IOOnL
10 M ethaicl R D etecxr 21.0C3 15770 0.73 438 0.1-19 g/1 OOnL
1! Ethanol R D etecxr 24.227
12 R D eteccr 2*3.553 11380 0.52 253
132
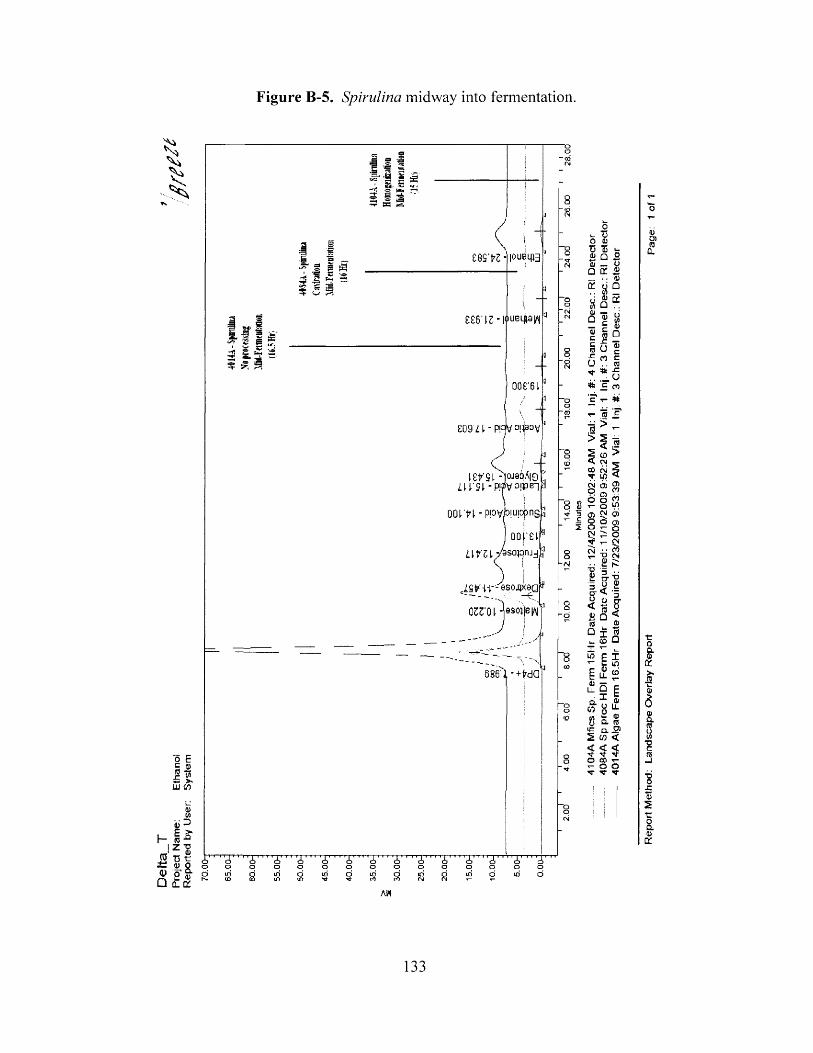
Figure B-5. Spirulina midway into fermentation.
~o
l£V'9l >1ojqdA|oZU St -P!?V3ipe-i
OOrt'kPPVP'.uppnS ) 00|’£l
Aim T sopnjj
ASY\\'-eso$kQQ
- o
I Z ~o**' <u i3 T3 c
AW
oj —o oe
a o^ n U .TJ- %
‘c
> 2 i “< CNVO cviT u>CN 02 9 C5
§££ Q« 8 2 * s «
* *o oo•>- owO£OJ5roaa>K
133
4014
A A
lgae
Fe
rm
16.5
Hr
Date
A
cqui
red:
7/2
3/20
09
9:53
:39
AM
Vial
: 1
Inj
#: 3
Cha
nnel
Des
c : R
l D
etec
tor
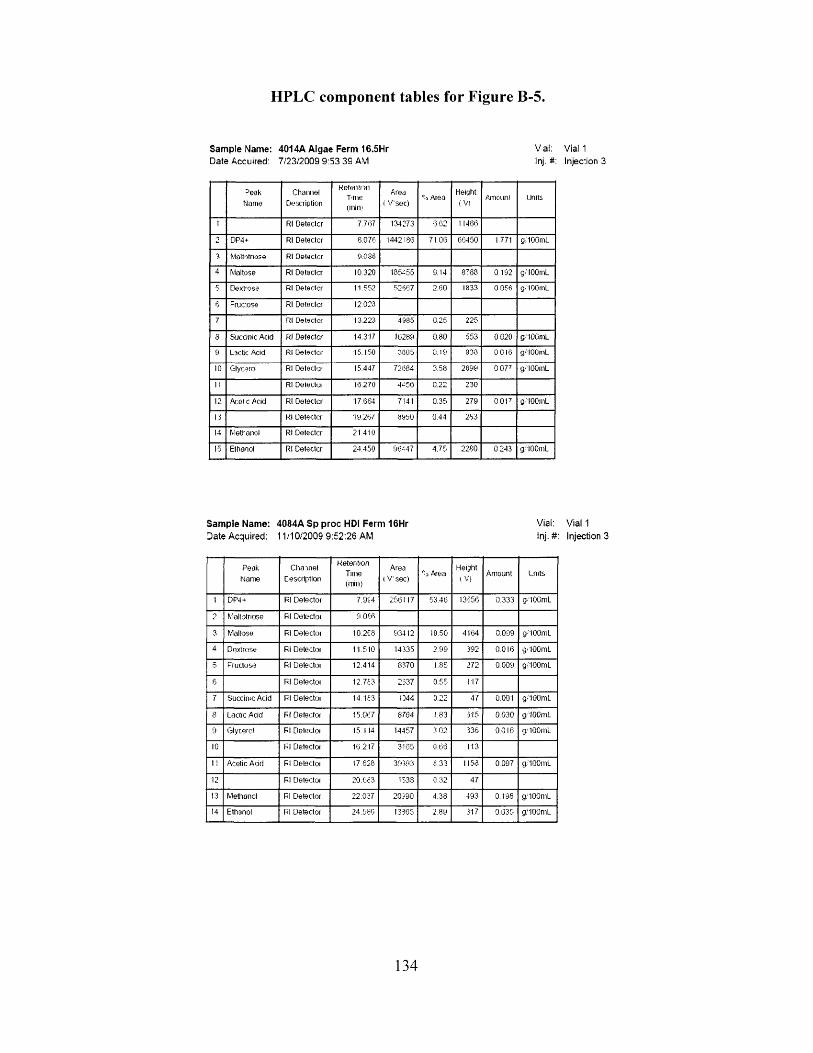
HPLC component tables for Figure B-5.
S am ple Name: 4014A Algae Ferm 16.5Hr Val:Date Accuired: 7/23/2009 9:53 3S AM Inj.#:
^ea k
N am e
C hannel
D escription
K e te n to nT m etlnim
Area t V ’sec)
% AreaHeight(V )
Amount Units
1 Rl D etectcr 7.767 134273 6.62 1 1466
'■> DP4+ Rl D etectcr 8.076 14 4 2 :86 71.06 66450 I 771 g/100mL
3 M altotnose Rl D etectcr 9.086
4 M altose Rl D etectcr 10.320 1 85-55 9.14 8768 0 192 g/IOOmL
5 Dextrose Rl D etectcr 11.552 52667 2.60 1833 0 056 g/IOOmL
fj F ructose Rl D etectcr 12.028
7 Rl D etectcr 13.223 4085 0.25 225
8 Succinic Acid Rl D etectcr 14.317 16289 0.80 553 0 020 g/IGOmL
9 Lactic .Acid Rl D etectcr 15.150 3005 0.19 930 OOI6 g/100m L
10 Glycerol Rl D etectcr 15.447 72684 3.58 2699 0 077 g'lOOniL
11 Rl Detectcr 16.270 4 -5 6 0.22 230
12 Acet c Acid Rl D etectcr 17.664 7141 0.35 279 0 017 g/IOOmL
13 Kl U etectcr 1 9 .26 / 8950 (J.44 283
14 M etranol Rl D etectcr 21 .410
15 Ethanol Rl D etectcr 24 .450 9 6 -4 7 4 .75 2280 0 243 g/IOOmL
S am p le Nam e: 4084A S p p ro c HDI Ferm 16Hr Vial:Date Acquired: 11/10/2009 9:52:26 AM Inj.#:
P eak
N am e
C h a inel
Descrtptlon
R eten tionTime(min)
A rea
( V sec )% Area
Height
(. V)A m ount Units
1 DP4+ Rl D etector 7 .954 256117 53.46 13656 0.333 g/100mL
2 M altotriose Rl D etector 9 .056
3 M altose Rl D etector 10.2C8 93412 19.50 4164 0.099 g/IOOmL
4 D extrose Rl D etector 11.510 14335 2.99 392 0.016 g/IGOmL
5 Fructose Rl D etector 12.414 8370 1.85 272 0.009 g/IOOmL
6 Rl D etector 12.753 2537 0.55 117
7 Succinic Acid Rl D etector 14.153 1344 0.22 47 0.001 g/IOOmL
p Lactic Acid Rl D etectoi 15.067 87(34 1.83 615 0.030 g/IOOmL
9 Glycerol Rl D etector 15.114 14457 3.02 636 0.016 g/IOOmL
10 Rl D etector 16.217 3165 0.66 113
11 Acetic Acid PI D etector 17.628 3S393 8.33 1158 0.097 g/100mL
12 Rl D etector 20.653 1338 0.32 47
13 Metinancl PI D etector 22.027 20390 4.38 493 0.198 g/IOOmL
14 Ethanol PI D etector 24.556 13365 2.89 317 0.035 g/1 OOmL
Vial 1Injection 3
Vial 1 Injection 3
134
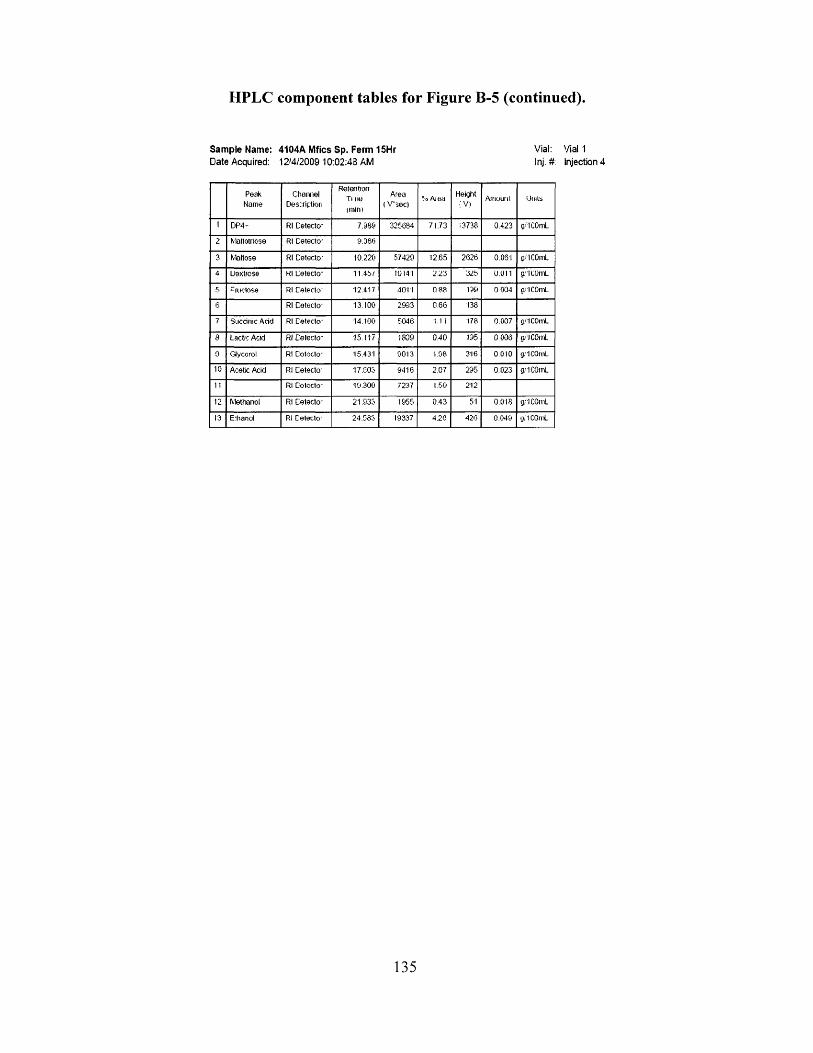
HPLC component tables for Figure B-5 (continued).
Sam ple Name: 4104A Mfics Sp. Ferm 15Hr Vial: Vial 1Date Acquired: 12'4/2009 10:02:43 AM Inj.# Injection 4
PeakNam e
C hannelDescription
R etention Ti lie (mini
Area ( V ’sec)
% A iea Height:v»
Amount Units
1 D P 4- Rl C etec to ' 7 .989 325684 71.73 13738 0.423 g/ICOmL
2 M altotriose Rl C etec to ' 9 .388
3 M altose Rl C etec to ' 10.220 57429 12.65 2626 0.061 g/ICOmL
4 D extrose Kl D e tecto - 11.45/’ t0 141 2.23 325 0.011 g/llU m L
5 F ructose Rl Cetecto" 12.417 4011 0.88 199 0.004 g/ICOmL
6 Rl C e tec to ’ 13.100 2933 0.66 138
7 Succinic Acid Rl Cetecto" 14.100 5046 1.1 I 178 0.007 g/1C0mL
8 Lactic Acid Rl C etecto" 15.117 1809 0.40 195 0.006 G'ICOmL
0 Glycerol Rl Cotccto" 15.431 0013 1.08 316 0 .0 I0 g,'1C0mL
10 Acetic Acid Rl Cetecto" 17.803 9416 2.07 295 0.023 a/ICOinL
11 Rl Cotccto" 10.300 7237 1.50 212
12 M ethanol Rl C e tec to - 21 .933 1955 0.43 51 0.018 g/ICOinL
13 Ethanol Rl Cetecto" 24.583 19337 4.20 420 0,049 g<1C0mL
135
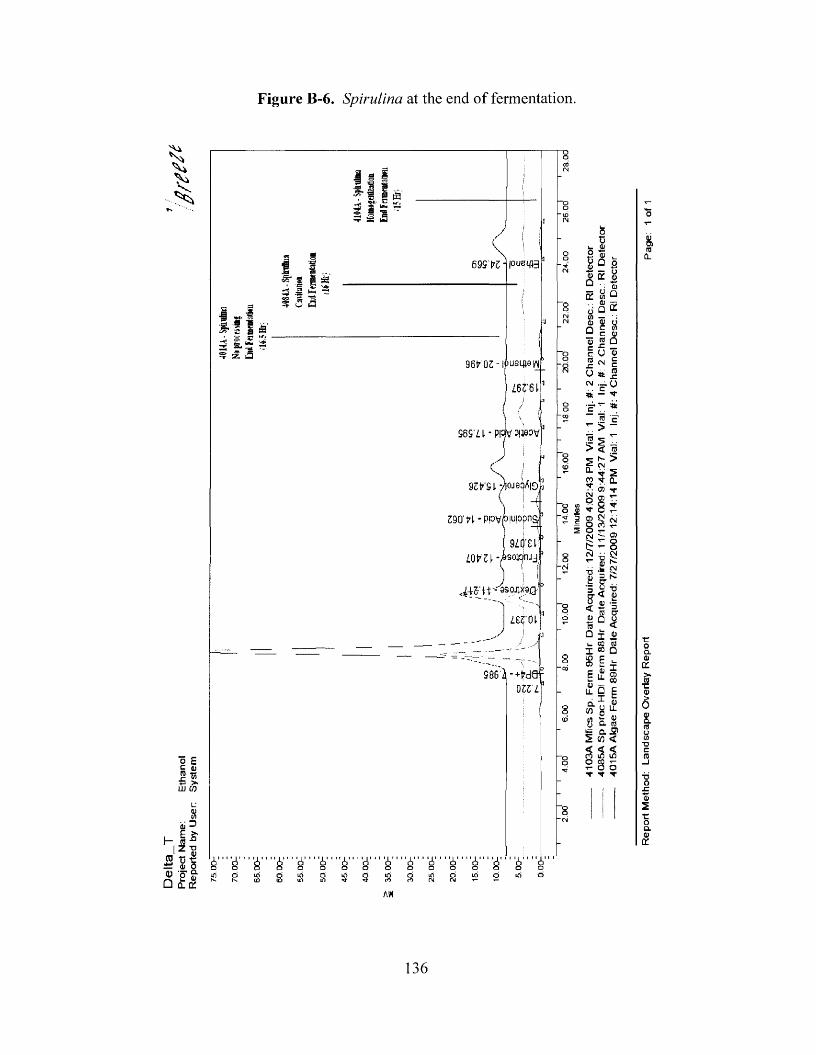
Figure B-6. Spirulina at the end of fermentation.
S
o s£ <u J9 To ♦= >lu <d
u 8
di ^ E >*rt-° Z TJ
jS'T3r _ n o OJ 'o £■□ L. <UCl 01
\ -
■I i ss | ?T X M
699'W-pueqei ! *-3ZE ‘5?i a a
96 'OZ - 1PU8L||©M i6T6t
ses'ii -pi v afljwv
9Zfr'£l ViojeqAio
290' H • PPVP!u!°pn^
m 'tv L W Z [ ->so^nJj
L Z Z ' 0 \fJ
9 8 6 'V +W Q f D III
6 ' 1' 6 ' ' ’cfj1' " i ' i ' i ' ' " 6 " y ' ' 6 ' ' i i 6 i 1 y ' 1 '6 6a o o o o o o o o o a o o o o o
(N
o: w. . <L)M □<U (U □ £<0 re= r;ns
U_ M CO » J2CM O
O 'to
]■ >I 2 > <*7 l“-c\
O- **0 «J < t;y a
I .2cc co
i* i «S a r a C l 2
S « < 3 55 ^n in u io co t-T- o oT ■* T
AW
136
Repo
rt M
etho
d:
Lan
dsca
pe
Ove
rlay
Rep
ort
Page
: 1
of 1
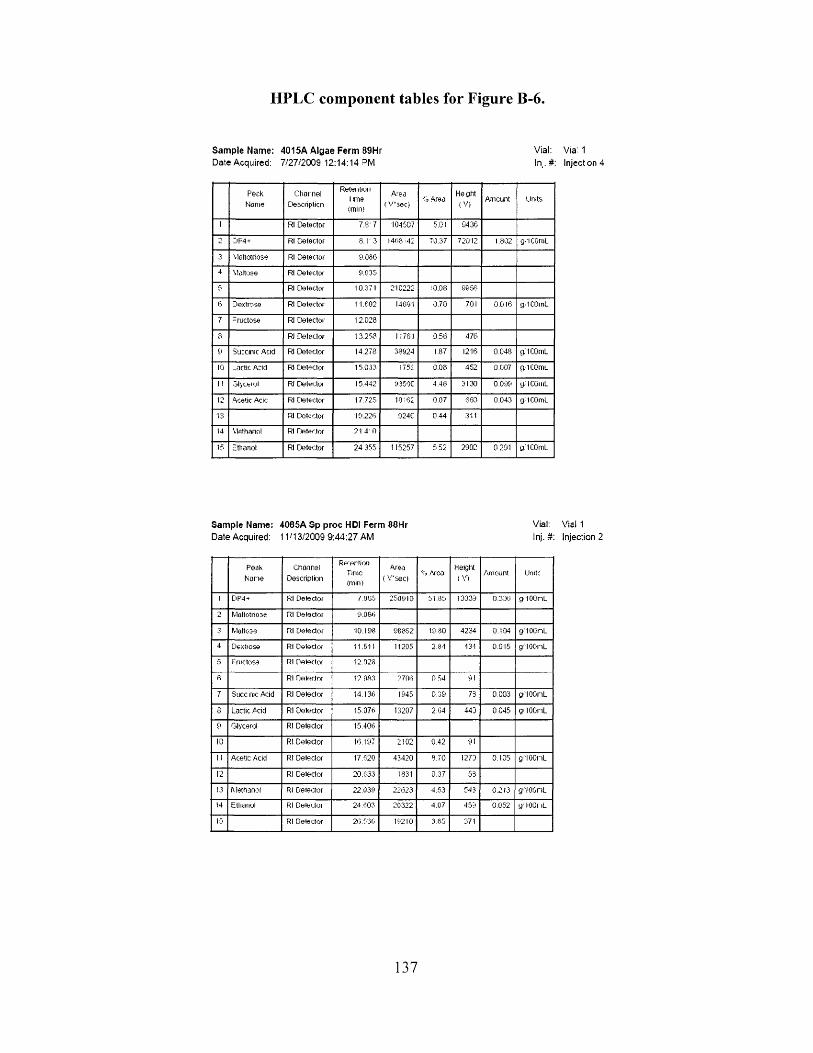
HPLC component tables for Figure B-6.
Sam ple Name: 4015A Algae Ferm 89Hr Vial:Date Acquired: 7/27/2009 12:14:14 °M In .# :
P eckName
C harne lDescription
R etentionlim e(rnin)
Area < V ’3ec)
to AreaH eght< V>
Amount Units
1 Rl D etector 7 .3 '7 104507 5.01 9436
2 DF4+ Rl Detector S. I ' 3 1468 142 70.37 72012 1.802 g'lCOmL
3 Moltotriose Rl D etector 9.086
4 M altose Rl D etector 9.035
5 Rl Detector 10.371 210222 10.08 9056
6 Dextrose Rl Detector 11.602 14691 0.70 701 0.016 g.ICOmL
7 -ru c to se Rl D etector 12.028
a Rl D etector 13.258 1 1761 0.56 476
9 Succinic Acid Rl D etector 14.278 38924 1.87 1216 0.048 g.ICOmL
to _actic Acid Rl Detector 15.033 1752 0.08 452 0.007 g'lCOmL
11 o ly w u l Rl Delectei 15.442 9350C 4.48 3 130 0.099 y/lCOniL
12 Acetic Acic Rl D etector 17.725 10162 0.07 863 0.043 g-ICOmL
13 Rl D otcctor 10.226 024C 0.44 311
14 Methanol Rl neter.tor 21 4 0
15 Ethanol Rl D etector 24.355 115257 5.52 2902 0.291 g-1C0mL
Sam ple Name: 4085A S p p roc HDI Ferm 88Hr Vial:Date Acquired: 11M3/2009 9:44:27 AM Inj. #:
Peak
N o n e
C hannel
Description
R e w tin nTime(mill)
Area ( V’sec)
% AreaHeight(V )
Amount Unite
1 DP4+ Rl Detector 7.905 250910 51.05 13339 0.330 g-IOOnL
2 Maltotrio3e Rl Delector 9.086
8 M altose Rl Detector 10.198 98852 19.80 4234 0 .I0 4 g-IOOnL
4 Dextiose Rl Delector 11.511 11205 2.8-1 131 0,015 g-IOOnL
5 Fructose Rl Detector 12.028
6 Rl Detector 12 08:1 2706 0 54 91
7 S ucc me Acid Rl Detector 14.136 1945 0.39 73 0.003 g"l OOnL
8 Lactic Acid Rl Delector 15.076 1.3207 2.04 443 0.045 g'1 OOnL
9 Glycerol Rl D etector 15.406
10 Rl Detector 16.197 2102 0.42 91
II Acetic Acid Rl Detector 17.620 43420 8.70 1273 0.105 g'lO O nL
12 Rl D etector 20.633 1831 0.37 53
13 M ethanol Rt Detector 22.039 22623 4.53 543 0.213 g lO O n L
14 Ethanol Rl DeleUoi 24.60? 20322 4.07 453 0.052 y-IOOi iL
1:3 Rl D etector 20.536 16210 3.85 371
Via! 1Inject on 4
Vial 1 Injection 2
137
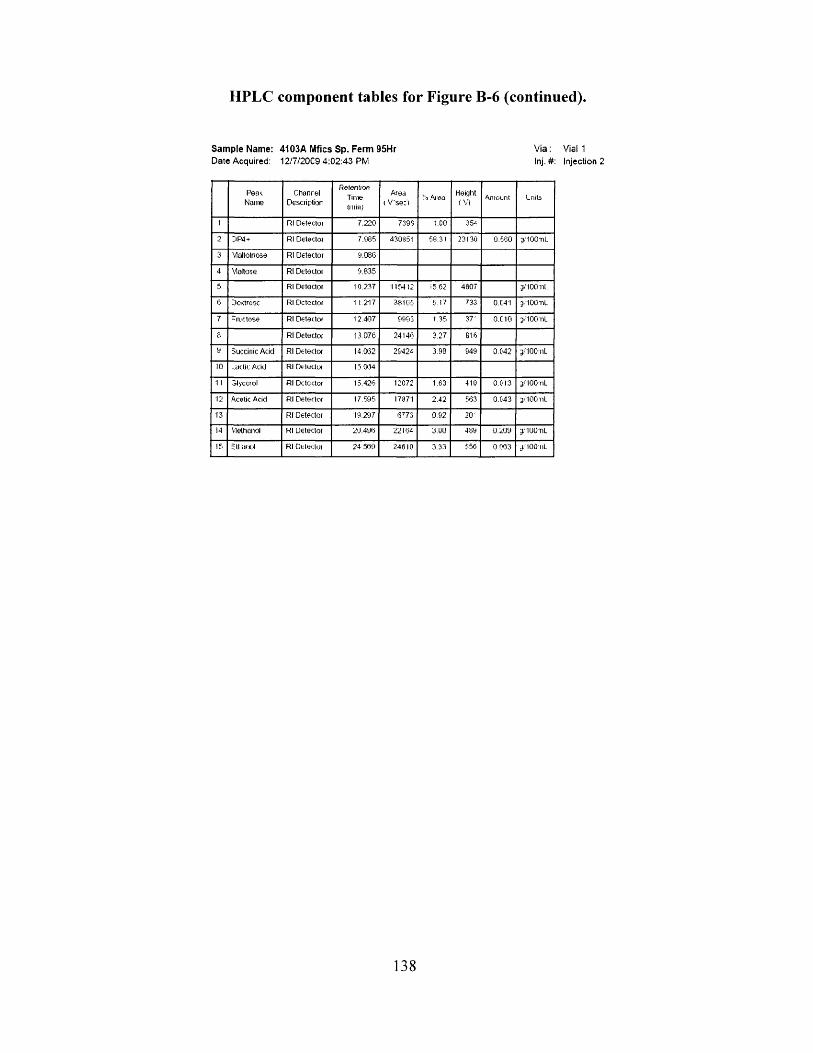
HPLC component tables for Figure B-6 (continued).
Sam ple Name: 4103A Mfics Sp. Ferm 95Hr Via:Date Acquired: 12/7/20C9 4:02:43 PM Inj. #:
ReneN am e
C hanre lDescription
RetentionTimeiiiiin.i
Area ( V 's e : t
Tj AreaH eiaht{ V)
A m otnt Lrnts
1 Rl Detector 7.220 739S 1.00 354
2 DP4+ Rl D etector 7.5185 430S51 58.31 23130 0.560 g/IOOnL
3 Vloltolnose Rl D etector 9.086
4 M altose Rl D etector 9.835
5 Rl D etector 10.237 115412 15.52 4807 3/10011L
6 DoKtrcoc Rl Detector 1 1.217 38165 5.! 7 733 0.041 g.'IOOriL
7 r n c to s e Rl Detector 12.407 9993 1.35 3 7 ' 0.010 3/100tiL8 Rl D etector 13.076 24146 3.27 816
9 Succinic Acid Rl Detector 14.062 29424 3.93 949 0.C42 3/IOOnL
10 -a ttic Acid Rl D ele tlo i 15.084
1 1 Slycorol Rl D etector 15.426 12072 1.63 410 0 .0 13 3 /1 0 0 11L
12 Acetic Acid Rl D etector 17.595 17871 2.42 563 0.043 3 /10011L
13 Rl Detector 19.207 6 773 0.92 2 0 '
14 Methanol Rl D etector 29.496 2 2 164 I3.U0 489 0.209 3/IOOT1L
15 ill UIK.ll Rl Detecloi 24.569 24610 3.33 556 0.063 3: IOO11L
Vial 1 Injection 2
138
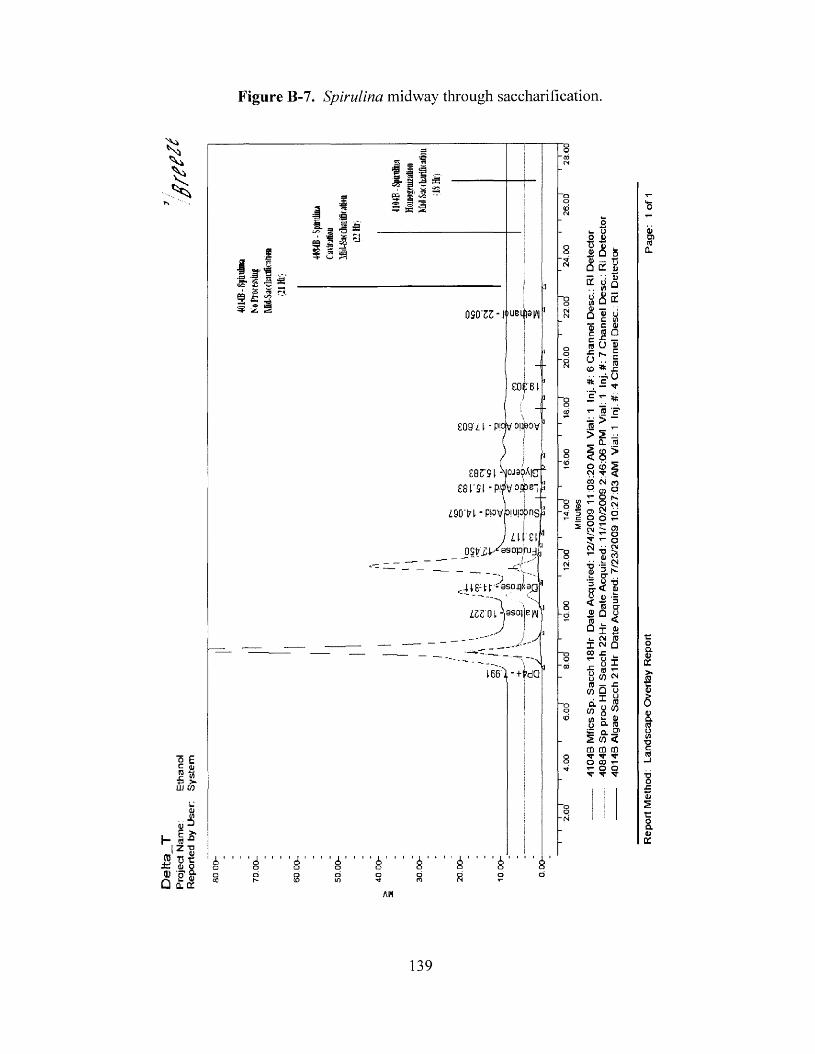
Figure B-7. Spirulina midway through saccharification.
%
"P Em £+= > LU ( 0
tosiD
h ffl-S'm|Z «JB tj -c
— ( D Ojj *g, 8-Q CL IT
I .
~ M 5■ Si, « —<S 8 3 "s “
si| £
« I 5S « i£*-*■ r~\
,1'f
s i S OSO'SS - |<»ueLpa
£Q9'Z I -p w o p p o y '/ I/ ! '3f j
ears i eSl'Sl -PIW^eTf
Z90'H -PPVpiuppnsa
iU'St_ JSW^sopm-j;
zee'oi W h)ew
J L
i66'l-+tda
■<i " ' ' 6 ' 1 ' ' 6 ’ ' ' ' A ' ’ ' ' A ' ' ' ' A ' ' ' ' A ' ' ' ' Ao o o o o o o o
o u HI) L J Q o ® T5 Q £ a;
. (D o Qu 01 re — Q ®
VIq a:
(0rt O «a ^ s•mJ rj <0 * £
* s*
ra
t- ren ** , > S -< qO CD CM -M-
0) 9 O ^SdO T=
re co
< re^ re ® Oq il . CM
U
CM Q
(0CO ^
ra ;=; CO Q
co XU an
c Q .O )2 co < co cq m ^ re1O ffl r T- O Ot- t t
AW
139
Rep
ort
Met
hod:
L
ands
cape
O
verl
ay
Rep
ort
Pag
e:
1 of
1
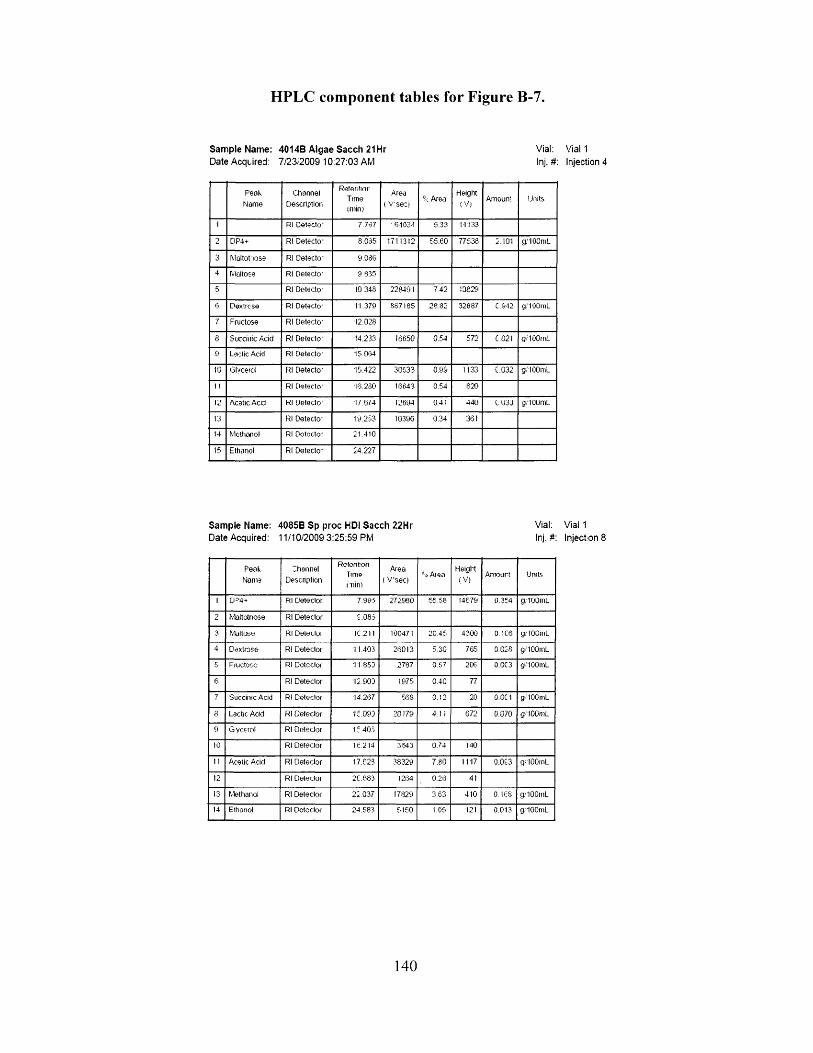
HPLC component tables for Figure B-7.
Sam ple Nam e: 4014B A lgae S acch 21Hr Vial:Date Acquired: 7/2312009 10:27:03 AM Inj. #:
P eak
N am eC hannel
Description
R etenfiorTirne(mini
Area
t V 'se c )°-c A rea
Height(V )
Amount Units
1 Rl D etectcr 7.787 •(51034 5.33 14133
2 DP4+ Rl D e tecto - 8.085 1711312 55.60 77538 2.101 g/IOOmL
3 M altot'iose Rl D e tec to - 9.086
4 M altose Rl D e tec to - 9 .635
5 Rl D e tecto - 10.348 228491 7.42 10829
6 Dextrose Rl D e tec to - 11.379 887185 28.82 32887 C.042 g/TOOmL
7 Fructose Rl D e tecto - 12.028
8 Succinic Acid Rl D e tec to - 14.233 16650 0.54 572 £.021 g/TOOmL
Cl Lactic Acid Rl D e tecto - 15.064
10 Glycerol Rl D e tecto - 15.422 30533 0.99 1133 C.032 g/IOOmL
1 ! Rl D e tec to - 1(3.230 16643 0.54 620
12 Acetic A cd Rl U e tecto - i / . e / 4 12694 U.41 440 L.U3J g.TUOmL
13 Rl D e tecto - 19.233 10396 0.34 361
14 M ethanol Rl D otocto- 21.410
15 Ethanol Rl D e tec to - 24.227
Sam ple Name: 4085B S p p roc HDI S acch 22Hr Vial.Date Acquired: 11/10/2009 3:25:59 PM Inj.#:
Peak
N am e
Channel
Description
R o tc n to nTimem in i
A rea
( V ’sec )% Area
Height
< V)A m our t Units
I D-'4+ Rl D etector 7.995 272980 55.58 14579 0.364 g n o o m L
2 M altotnose Rl D etector £ .085
3 M altose Rl Deleuloi 1C 211 100471 20.45 4300 0. IC6 y/100iuL
4 D extrose Rl D etector 11.403 26013 5.30 765 0.028 gTOOmL
5 Fiuctooc Rl Dotcclor 11.853 2787 0.57 206 0.0C3 g/IOOinL
6 Rl D etector 12.903 1975 0.40 77
j Succinic Acid Rl D etector 14.267 5(38 0.12 28 O.OC1 g/TOOmL
a Lactic Acid Rl O etecl or 15.093 20179 4.1 1 672 0.070 g/IOOmL
g G ycero l Rl D eteclor 13.403
10 Rl D eteclor l<: .214 3643 0.74 140
11 Acetic Acid Rl D eteclor 17.623 38329 7.80 1117 0.0£3 g/IOOmL
12 Rl Delecloi 2C.083 12(34 0.26 41
13 M ethanol Rl D eteclor 22.037 17829 3.63 410 0 . 168 g/TOOmL
14 Ethanol Rl D otcclor 24.583 5150 1.05 121 0.013 g/TOOmL
Vial 1
Injection 4
Vial 1 Inject on 8
140
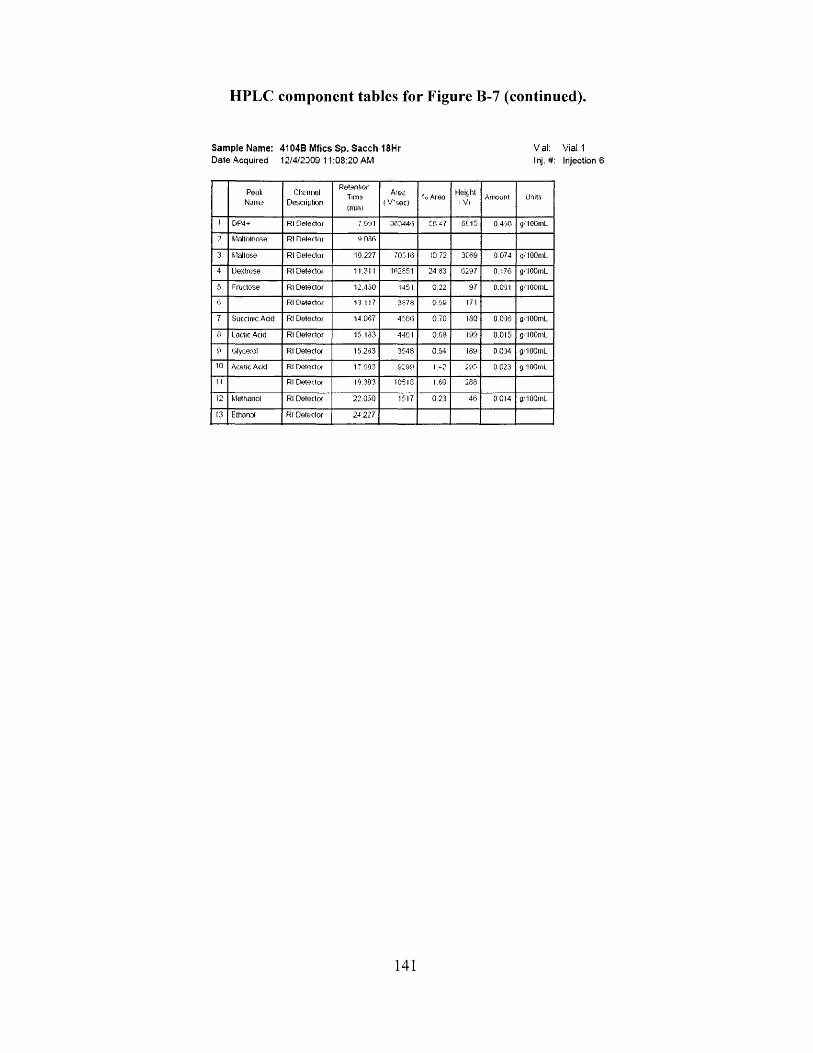
HPLC component tables for Figure B-7 (continued).
Sam ple Name: 4104B Mfics Sp . S a c ch 18Hr V al: Vial 1Dale Acquired 12/4/2309 11:08:20 AM Inj.#: Injection 6
PeakN am e
C hannelDescription
RetentionTims
(m!n.i
Area ( V s e c )
"o Area HeightV)
Amount Units
1 DP4->- Rl Detector 7.991 303446 E0A7 16815 0.450 g/100mL
? Mnttotriose Rl D etector SI 038
3 M altose Rl D etector 10.227 70316 10.72 3939 0.074 g/IOOmL
4 Dextrose Rl Detector 11.311 102851 24.83 6297 0.176 g/IOOinL
5 Fructose Rl D etector 12.450 1451 0.22 97 0.091 g/IOOmL
* Rl D etector 13.117 3878 0.59 171
7 Succinic Acid Rl D etector 14.007 4566 0.70 180 0.036 O/IOOinL
8 Lactic Acid Rl D etector 15.133 4461 0.68 199 0.015 g/IOOmL
9 Glycerol Rl Detector 15.233 3548 0.54 189 0.034 g/100mL
10 Acetic Acid Rl D etector 17.003 6199 l> 2 290 0.023 g/IOOmL
1 ! Rl D etector 19.303 1051S 1.60 288
12 Methanol Rl Detector 22.050 1517 0.23 46 0.014 g/IOOmL
13 Ethanol Rl D etector 24 .227
141
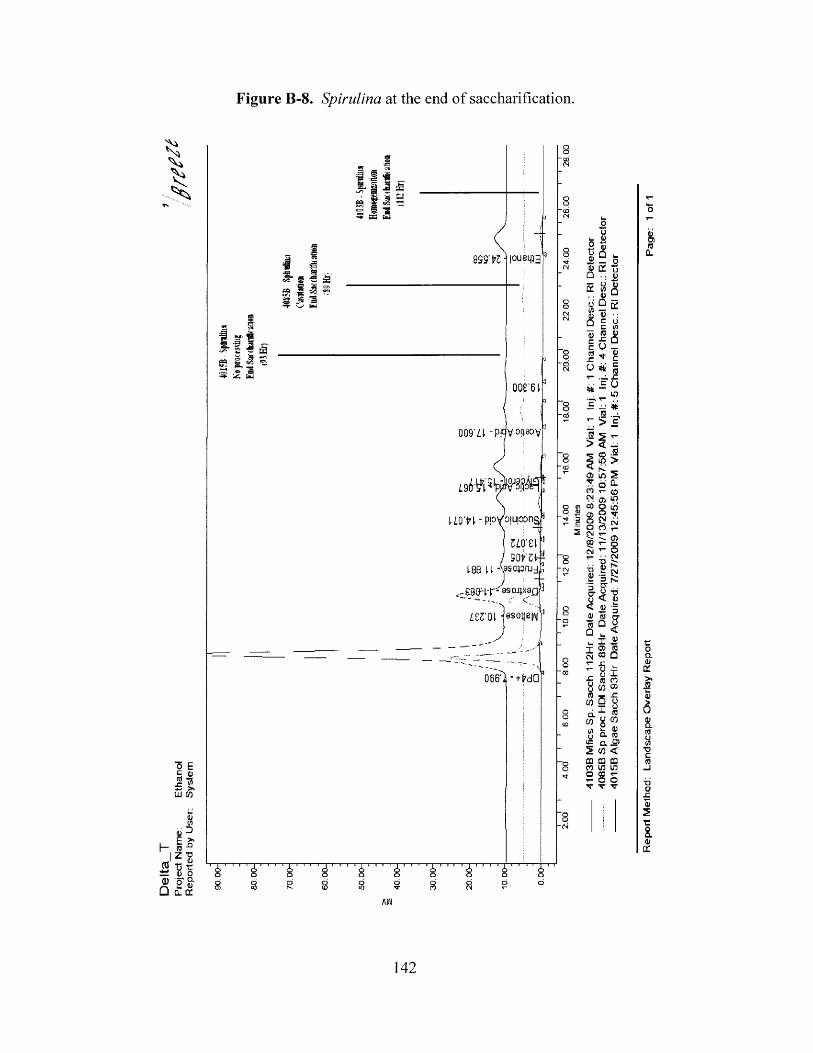
Figure B-8. Spirulina at the end of saccharification.
-d
009'il- -pW^eov
j.i O • PPV°!u!oon§ Z L V Z l 3
j soktf188' U Apsopmjfi
~o
o EE oj£ >LU CO
ft«=>E ^I- »■“
J z>sJS T3 -E ^a> o o(I) 'o’ 9- qQ I ct 8
oCDoCO oIs- oLO
o o(*) oCN o o
* JB5 <y« n o u*5 cr□ ..S 8 .. o
Q | a> _g " O__ 4"o «ra
% —
.Sy; > > <
o> in
O’. o < fli15Q
XCDCO
£ <0 m m « in a co oV TT
0)O)wn
a>5roa0)CE
AM
142
4015
B A
lgae
Sa
cch
93H
r Da
te A
cqui
red:
7/2
7/20
09
12:4
5:56
PM
V
ial:
1 In
j. #:
5 C
hann
el D
esc.
: Rl
Det
ecto
r
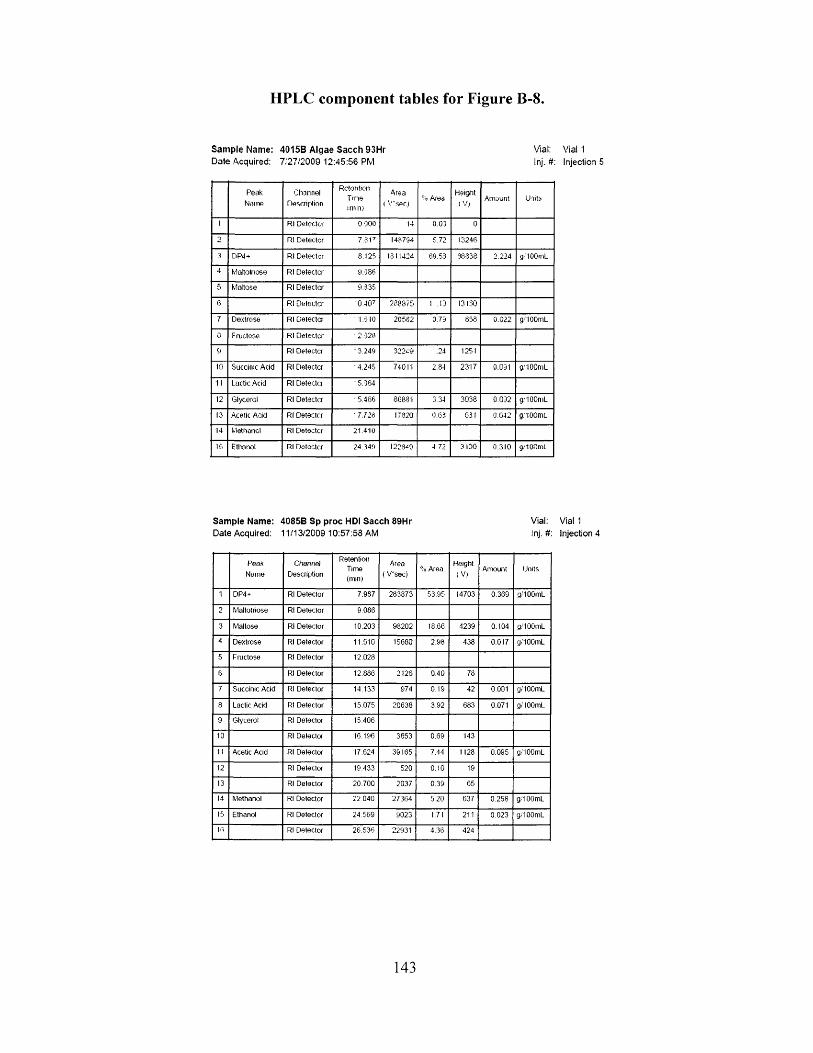
HPLC component tables for Figure B-8.
Sam ple Name: 4015B Algae S acch 93Hr Vial:Date Acquired: 7;27/2009 12:45:56 PM Inj. #:
PeakN am e
ChannelDescription
R etention T in e till n i
Area ( V 'sec)
% AreaHeight
(V )Amount Units
1 Rl Detector 0.000 14 0.03 02 Rl Detector 7 .3 I 7 I487S4 5.72 13246
3 DP4+ Rl D etector 8.125 1311424 69.53 88838 2.224 g."l OOmL
4 Maltolriose Rl D etector 9.086
5 M altose Rl D etector 9,3.35
fi Rl D etector • 0 .407 288875 1 .13 13150
7 Dextrose Rl Detector • 1.010 20582 0.73 838 0.022 g/IOOmL
0 Fructose Rl D etector ' 2.0213
9 Rl D etector • 3.240 32249 .24 1251
10 Succinic Acid Rl Detector ' 4.245 74011 2.34 2317 0.031 g/IOOmL
11 Lactic Acid Rl D etector ' 5.064
12 Glycerol Rl Detector ' 5.466 80881 3.34 3038 0.032 gHOOniL
13 Acetic A dd Rl D etector ' 7.726 17820 (.1.153 (531 0.042 g/IOOmL
14 Methanol Rl D etector 21.410
15 Ethanol Rl Dotoctcr 24.340 122849 4.72 3130 0.310 g100n iL
Sam ple Name: 4085B Sp proc HDI S acch 89Hr Vial:Date Acquired: 11/13/2009 10:57:58 AM Inj.#:
PeakN ame
ChannelDescription
RetentionTime(min)
Area ( V 'sec)
% AreaHeight
{V>Amount Units
1 DP4+ Rl D etector 7.987 283873 53.95 14703 0.369 g/IOOmL
2 M altotnose Rl D etector 9.086
3 M altose Rl Delector 10.203 98202 18.66 4239 0.104 g/1 OOmL
4 Dextrose Rl D etector 11.510 15660 2.98 438 0.017 g/IOOmL
5 Fructose Rl D etector 12.028
6 Rl D etector 12.886 2126 0.40 78
7 Succinic Acid Rl D eteclor 14.133 974 0.19 42 0.001 g/IOOmL
8 Lactic Acid Rl D etector 15.075 20638 3.92 683 0 071 g/IOOmL
9 Glycerol Rl Detector 15.406
10 Rl Delector 16.196 3653 0.69 143
11 Acetic Acid Rl Detector 17.624 39165 7.44 1128 0.095 g/IOOmL
12 Rl Delector 19.433 520 0.10 19
13 Rl Detector 20.700 2037 0,39 65
14 Methanol Rl D etector 22.040 27364 5.20 637 0.258 g /l OOmL
15 Ethanol Rl D etector 24.569 9023 171 211 0.023 g/IOOmL
16 Rl Delector 26.536 22931 4.36 424
Vial 1Injection 5
Vial 1 Injection 4
143
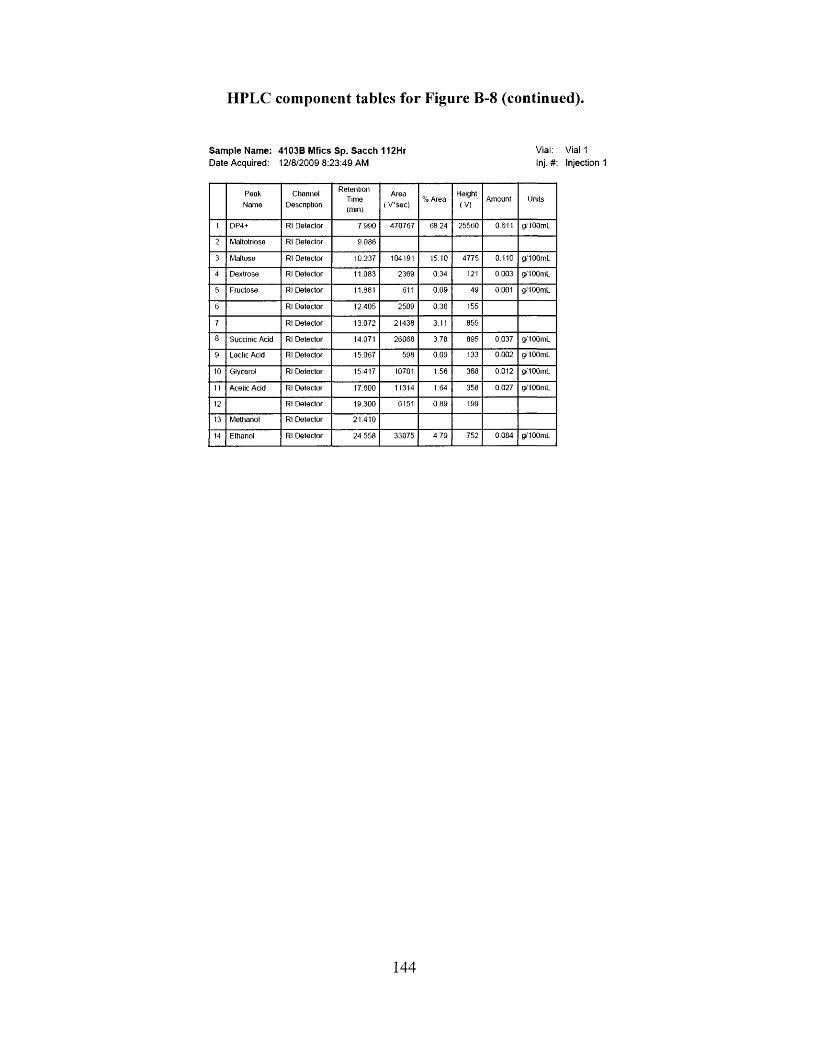
HPLC component tables for Figure B-8 (continued).
S am ple Nam e: 4103B Mfics Sp. S acch 112Hr Vial:Date Acquired: 12/8/2009 8:23:49 AM Inj.#:
P eak
N am e
C hannelDescription
R etentionTime(min)
Area
( V’sec)% A rea
Height(V )
Amount Units
1 DP4+ Rl D etector 7 990 470767 68.24 25560 0.611 g/TOOmL
2 M altotriose Rl D etector 9.086
3 M altose Rl D etector 10.237 104191 15.10 4775 0.110 gTOOmL
4 D extrose Rl D etector 11.083 2369 0.34 121 0.003 g 'l OOmL
5 Fructose Rl D etector 11.881 611 0.09 49 0.001 g /10OmL
6 Rl D etector 12.405 2509 0.36 155
7 Rl D etector 13.072 2 1438 3 .1 1 855
8 Succinic Acid Rl D etector 14.071 26068 3.78 895 0.037 g ' l OOmL
9 Lactic Acid Rl D etector 15.067 598 0.09 133 0.002 gT OOmL
10 Glycerol Rl D etector 15.417 10781 1.56 368 0.012 g/100mL
11 Acetic Acid Rl D etector 17.600 11314 1.64 358 0.027 gi I OOmL
12 Rl D etector 19.300 6 151 0.89 199
13 M ethanol Rl D etector 21 .410
14 Ethanol Rl D etector 24 .558 33075 4.79 752 0.084 gTOOmL
Vial 1
Injection 1
144
Appendix C
Raw Data Spreadsheets for Wild Algae and Spirulina.
Table C -l. Wild algae gathered May 4, 2009 from VIMS............................................... 146
Table C-2. Wild algae gathered May 26, 2009 from VIMS............................................. 147
Table C-3. Wild algae gathered June 9, 2009 from VIMS............................................... 148
Table C-4. Wild algae gathered June 23, 2009 from VIMS............................................. 149
Table C-5. Wild algae gathered July 7, 2009 from VIMS................................................ 151
Table C-6. Wild algae gathered July 28, 2009 from VIMS..............................................153
Table C -l. Wild algae gathered August 18, 2009 from VIMS.........................................154
Table C-8. Wild algae gathered September 16, 2009 from VIMS.................................. 155
Table C-9. Wild algae gathered October 5, 2009 from VIMS......................................... 156
Table C-10. Wild algae before and after selected processing; before treatment, fermentation, and saccharification........................................................................................... 157
Table C -ll . Spirulina treated with no processing.....................................................159
Table C-12. Spirulina processed by cavitation (SPR)..............................................162
Table C-13. Spirulina processed by homogenization (Microfluidizer)................. 163
List of abbreviations for data tables.Mix or M Mixing DP 2 MaltoseLiq or L Liquefaction DP 1 Glucose (Dextrose)WWW Warm water wash extraction Fruc FructoseDistill Distillation o f water S. A. Succinic acidSacch Saccharification L. A. Lactic AcidFerm Fermentation Glyc Glycerol%TS Percent total solids A. A. Acetic Acid
DP 4+ Maltotetraose and higher dextrin oligomers MeOH MethanolDP 3 Maltotriose EtOH Ethanol
Notes:Dashes in tables indicate that the component was not detected by the HPLC.
145
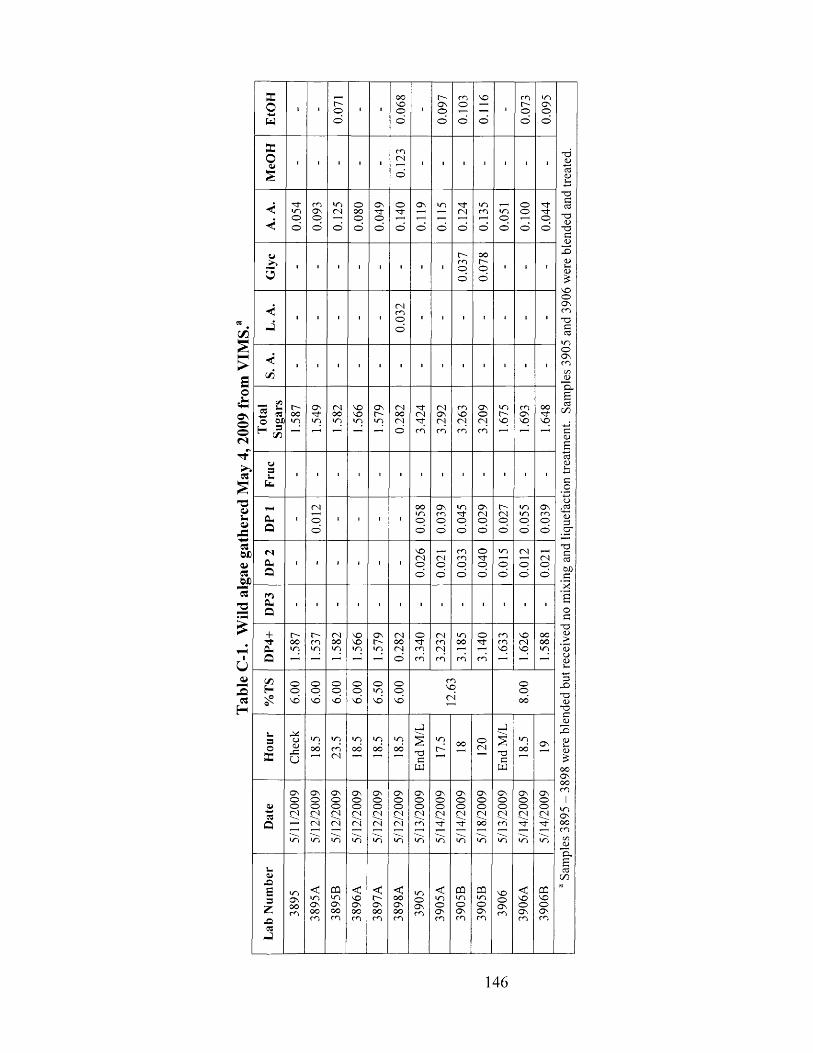
%H H
>So
as©o0 3
iO
' O<uu<w
05W )
4 )05J2f13' O
U<w
03H
ffiOs-»H
33o<U
J
<
c / 5
o oil^ C/3
3U
fa -
O ,
Q
03a <
Q
coQ -
Q
+" tOhQ
C/3H
o33
3Q
X )
5
x3
J
r -c o
oo
ONoo03
ONOOc o
f "o
ONoin03
ON
03
O
O
03OO
©o
ONooO )
0QONoo
oo ooo
03OO
NONO
OO
NO
ONoo03
<NOONOOc o
ON■*to
NOlO
ONoo03
<O nOOc o
ooNOo©
03O
o• * t
03c oo
O nO '
03OO0 3
o
O nO '
oinNO
03OO03©
OO
ONoo03
<OOONOOm
_ 3
TOe
W
ONoo03
oON
O 'O nO
ON
©
"* t03■<t
mo
NO03O
o
o■St
oo
i n
o
03ON03
Oo
03o
03CO03c o
oo
ONoo03
ONoo03
<i noONc o
OQi noONc o
NO
©
I t0 3
O 'c oo©
ooO 'o©
NO03
ON©03
ON03©©
©'!t©
©' t
©03
O n©©03OO
CQi n©O nCO
J
T3C
P J
ON©o03
NO©ONc o
O '©
©©
O 'NO
3 003o
©©
ON©©03
<NO©ON
ON©
©©
■*t
©
c oONNO
OO' tNO
i ni n©
03
©©
NO03NO
©©
©©
03©
OOo o
ON©©03
CQNO©ONc o
- a<D
T 33eS
T3C
NO©ONc oT 3
Ccd
i n©ONCO
C l.
BOSC/3
3. o -
T33OSOS)3
3- O
TO3CD
OOONOOCO
I
cxS3
g o
146
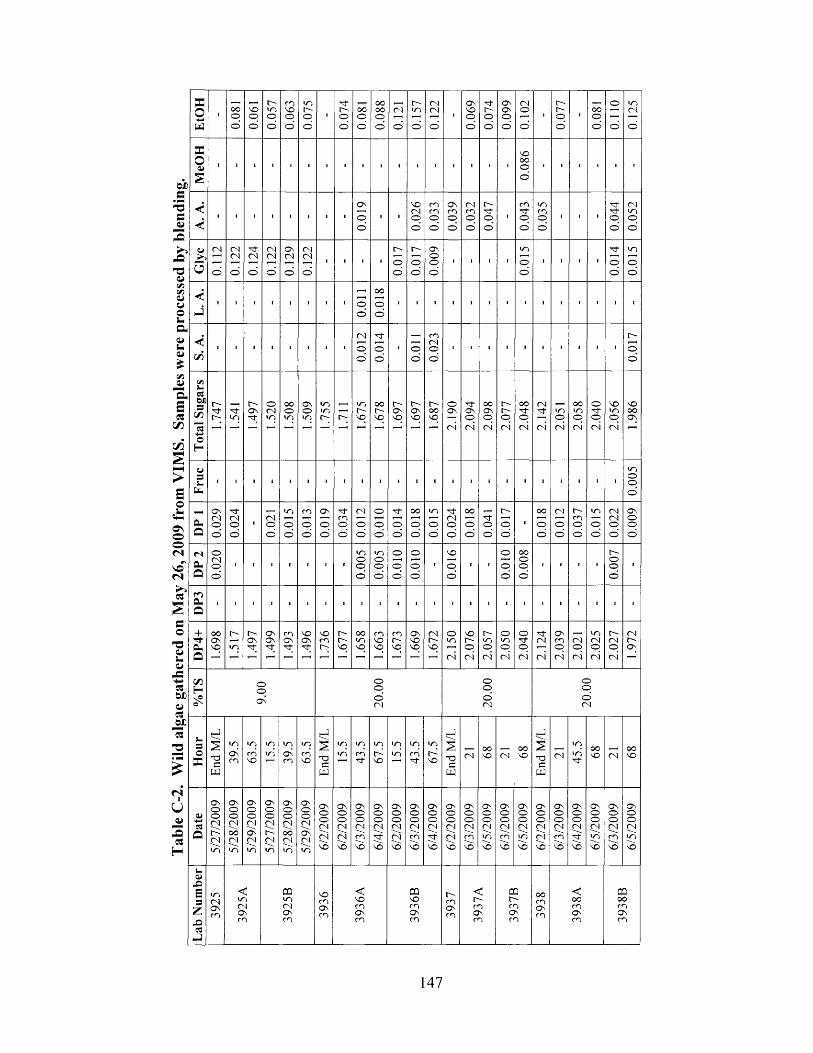
Tabl
e C
-2.
Wild
al
gae
gath
ered
on
May
26
, 20
09
from
VIM
S.
Sam
ples
wer
e pr
oces
sed
by bl
endi
ng.
EtO
H i oooo 0.
061 r-~in©
© 0.06
3 m,r-~©©
I•'t©©
oo©©
oooo©© 0.
121
0.15
7 zzvo I
0.06
9 n-©© 0.
099
0.10
2
Ir-r-©©
I oo©©
oi
ro
0.12
5
MeO
H
l 1 I i I ■ l • 1 1 ■ - 1 I ' ■ ISOoo©©
I ■ I ■ 1 i
A. A
.i 1 I i I ' ■ 1
Os
©©
1 ■soCN©©
o so s©©
Oscn©©
C4cnoo
t-'©©
1c o
©©
t ocnoo
■ ■ 1 ©©
CNin©©
Gly
c C4
O
C4<N
o 0.12
4 CNCN
©
6z
ro
CN<N
©
I 1 ' 1 ©©
r-©©
Os©©©
i 1 i Iino©
1 i l 1 ©©
in©©
1 L.
A.
i 1 I i ■ ■ 1 1 ©©
00©©
■ ■ i i 1 ' ■ ■ 1 ■ I 1 1 i
S. A
.
■ 1 ■ ' ■ i I 1CN
©©
■'3-©©
■ ©©
o sCN©©
i 1 ' ■ ■ ■ ■ I 1 1r-©©
Tota
l Su
gars
r-O; to Osp
©CNin
oo©ICSOs©in
tntrsr-inr-SO
oor-sq OSSO OsSO ooso
2.19
02.
094 OOosp
C4
t"r-~<©CN
oo'd-©c n
CN'3"CN
in©CN
OOtr>©C4 2.
040
2.05
6 soooOs
Fruc 1 1 i ' I ■ i • ■ ■ i 1 1 I I i ■ ■ i i i 1 ■
in©©©
DP
10.
029 04o
©i <N©
©
in©©
o s
©© 0.
019
o s©©
CN
©©
©©©
■"t©©
oo©©
u s
©© 0.
024 OO
o©
©o
r-©©
■00©©
CN
©© 0.
037 trs
oo
CNCN©© 0.
009
DP
2 o<NO©
1 i ' ■ i i •
u s©©©
in©©©
©©©
©©>©
1
0.01
6
1 1
0100
oo©©©
• i i • ©©©
i
DP3 i 1 ■ I ■ i l 1 i ■ ' ' 1 I 1 1 1 1 1 ■ i 1 i i
DP4
+ OOosSO0-p
r-"OS OSOsT7fo sOs soOs so
cnr-so
oou sso
o sS OSO
o sc-SOOSsoso
CN
so
2.15
02.
076
2.05
72.
050
2.04
02.
124
2.03
9
CN©CN
inCN©
CN 2.02
7 CNt"Os
%T
S o©OS 20
.00
20.0
0 ©©©( N
Hou
rEn
d M
/L toOscn
inr nso
lO mOso s
ino sso
End
M/L
t n
t r i
u s
o s
u s
SO
I / ’Su s
u s
o ssfI / s
SO
End
M/L
CNo os o CN
o os o
End
M/L
CN
• n
i nOOS O CN
OOs o
Dat
e1
5/27
/200
95/
28/2
009
5/29
/200
95/
27/2
009
5/28
/200
95/
29/2
009
6/2/
2009
6/2/
2009
6/3/
2009
6/4/
2009
6/2/
2009
6/3/
2009
6/4/
2009
6/2/
2009
6/3/
2009
6/5/
2009
6/3/
2009
6/5/
2009
6/2/
2009
6/3/
2009
6/4/
2009
6/5/
2009
6/3/
2009
6/5/
2009
Lab
Num
ber
t oC 4O scn 39
25A
3925
B SOo sO so s 39
36A
3936
B r-cnO scn 39
37A
3937
B o oc oo sc o 39
38A
3938
B
147
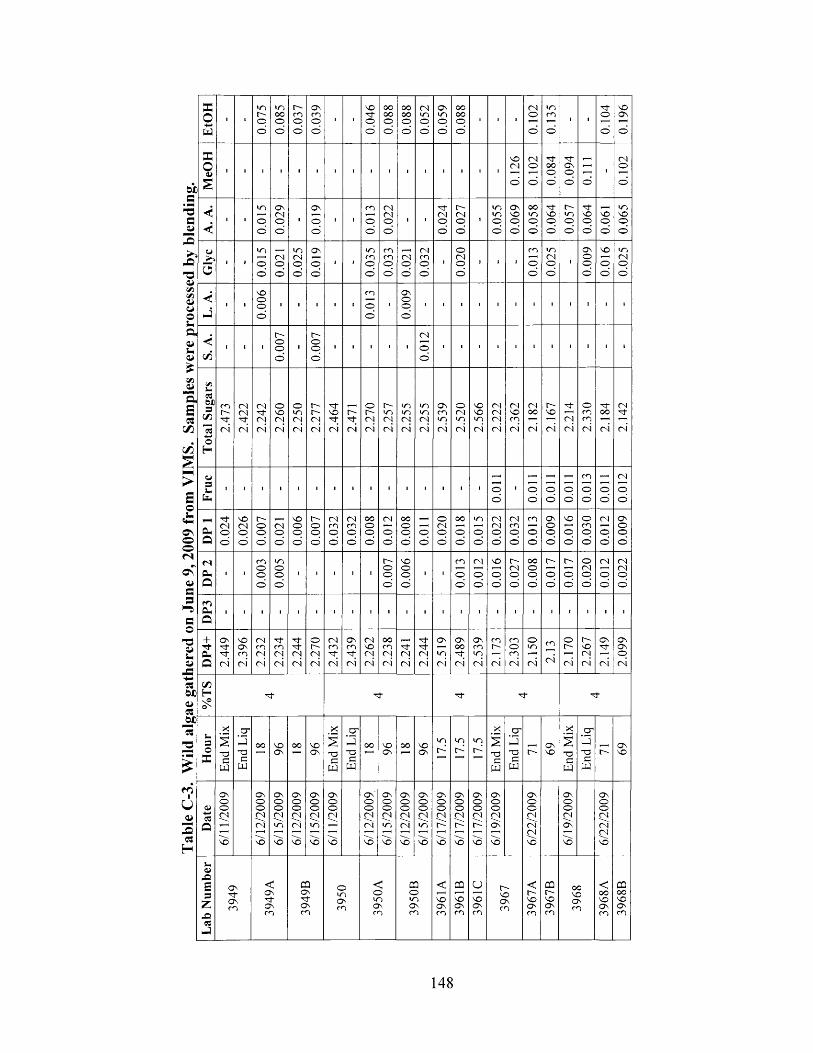
toi)a
-3ca>
3>>
-fi<u5 05 0<uuoaa>M,a>*5 0u
" aSc«CZ5C/5
EtO
H i 1
0.07
5 LOOOoo 0.
037
0.03
9
I i
0.04
6 oooooO
00oooo 0.
052
0.05
9 oooooo
■ ■ 1
0.10
20.
135
I ■ oo
9610M
eOH
i 1 i 1 • I I i I i 1 1 i 1 i ■
9ZV0 0.10
20.
084
0.09
4
o■
0.10
2
<<
■ 1 Oo 0.
029
1
6100 ■ i
c n
oo 0.
022
1 1
0.02
40.
027
l
0.05
5 690 0 0.
058
NOoo
r-oo 0.
064
NOoo 0.
065
CJO
i 10.
015
0.02
10.
025
0.01
9
I i
0.03
50.
033 <No
© 0.03
2
I
0.02
0
l 1 jc o
o© 0.
025
■
6000 0.01
60.
025
<J
■ 1
0.00
6
■ ■ ■ I ic o
oo
IONo©
oI I I ■ I i 1 ■ 1 ■ l ■
<t i
i 1 I
0.00
7
Ir~ -ooo
I ■ i I 1
0.01
2
I I i I ■ 1 l 1 i l I
Tota
l Su
gars
2.47
3 zzvz 2.24
22.
260
1 2.
250
2.27
72.
464 r-
(N 2.27
02.
257
2.25
52.
255
2.53
92.
520
2.56
62.
222
2.36
22.
182 Z.91'3 2.
214 o
c nc n
<N 2.18
42.
142
NH>so
£o\©o
uss_u.
t 1 i i i l I i ■ I ■ I I i l oo
i o©
o©
oo
c n
p
ooo 0.
012
C u
Q 0.02
40.
026
0.00
7
<NOo
NOooo 0.
007
0.03
20.
032 oooo
o 0.01
2 00oo©
o© 0.
020 o o
©
©
©
o 0.02
20.
032
0.01
30.
009
0.01
60.
030
0.01
2 6000
< N
oCa>S33
S3O
- 3a>I *a tn
< s
CmQ
• I
eooo 0.00
5
1 I I 1 1
0.00
70.
006
I 1
CO©© 0.
012
0.01
60.
027 oooo
o
r-©o
t"-©© 0.
020
0.01
20.
022
cnCMQ
1 i i I ' ■ I I 1 I l 1 I ■ I I I ' ■ i I I ■
DP4
+2.
449
2.39
62.
232
2.23
42.
244
2.27
02.
432
2.43
92.
262
2.23
82.
241
2.24
42.
519
2.48
92.
539
2.17
32.
303
2.15
0 cn<N 2.
170
2.26
7 6PVZ 2.09
9
Tabl
e C
-3.
Wild
al
gae
gat]
%T
S
Tfr
Hou
rEn
d M
ixEn
d L
iq
oo n oO n
oo NOON
End
Mix
End
Liq
oo NOON
00 NOON
End
Mix
End
Liq
t" ONNO
End
Mix
End
Liq
i>■ OnNO
4>
fi
6/11
/200
9
6/12
/200
96/
15/2
009
6/12
/200
96/
15/2
009
6/11
/200
9
6/12
/200
96/
15/2
009
6/12
/200
96/
15/2
009
6/17
/200
96/
17/2
009
6/17
/200
96/
19/2
009
6/22
/200
9
6/19
/200
9
6/22
/200
9
Lab
Num
ber
o nTtONCO 3 9
49A
3949
B O‘-OONcn 39
50A
3950
B
3961
A39
61B
3961
C r-~NOONCO 39
67A
3967
B ooNOONcn 39
68A
|39
68B
148
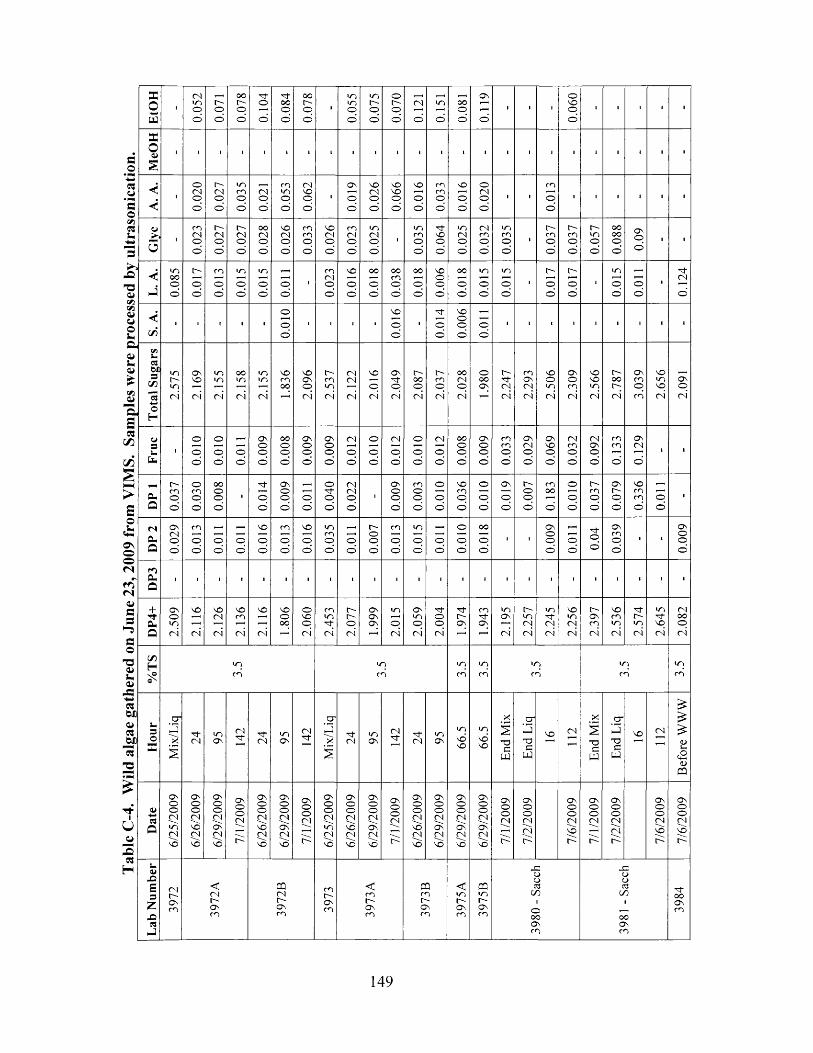
Tabl
e C
-4.
Wild
al
gae
gath
ered
on
June
23
,200
9 fro
m V
IMS.
Sa
mpl
es
were
pr
oces
sed
by ul
tras
onic
atio
n.E
tOH
l
0.05
2
0.07
1
0.07
8 ■m-©
o 0.08
4
0.07
8
i
0.05
5
0.07
5 ©c-©© 0.
121
0.15
1
0.08
1
0.11
9
■ l ■©so©©
1 i I l I
MeO
H- i ■ ■ i - i ■ ■ ■ i ■ ■ i ■ I l ■ 1 ■ ■ I 1 I
A.
A.
-oCNO©
CN©©
incn©©
CN©©
min©©
CNSO©©
■Os©©
soCN©©
SOsoo©
SO©©
cncn©©
so©©
©CN©©
• icn©©
1 i ■ ■ I I
cj
Oi
cnCNo©
CN©©
CN©©
OOCN©©
SOCN©©
cncn©©
soCN©©
cnCN©©
inCN©©
1incn©©
■nrso©©
inCN©©
CNcn©©
tocnoo
i cn©©
t -cn©©
r---■n©©
oooo©©
Os©©
I I
L.
A. IT)
OO©©
oo
cn©©
in©©
in©©
©©
■cnCN©©
SO©©
OO©©
oocn©©
oo©©
soO©©
OO©©
un©©
inoo
i ©©
©©
iin©©
©©
I 04O
S. A
.
' ' ■ • '©©©
■ ■ 1 1so©©
■ ©©
so©©©
©©
1 i ■ i ■ ■ i I i
Tot
al
Su
gars
mc-inCN 2.
169 in
in
CN
ooin
CN
inin
CN
SOcnoo
2.09
6 c -mmCN
CNCN
CN 2.01
6 Os"xt"©CN
C-oo©CN
e'en©CN
ooCN©CN
©ooos
2.24
7 cnON0404 2.
506
2.30
9
2.56
6 c-oo
CN
OScn©cn
soinso04
OnO04
Fru
c
1oo©
©©©
©©
Os©©©
oo©©© 0.
009
60
00
CN©©
©©©
CN©©
©©© 0.
012 OO
©©©
600 0 0.
033
0.02
9
0.06
9
0.03
2
0.09
2 cncn
© 0.12
9
i i
DP
1
0.03
7 ocno©
OO©©©
■ ©©
OS©©©
©©
©©©
CNCN©©
■Os©©©
cn©©©
©©©
som©©
©©© 0.
019 r "
©©©
cnoo
©
©©© 0.
037
0.07
9
0.33
6
oo
•
DP
2 OsCNOO
cn©©
©©
©©
SO©©
cn©©
so©©
incn©© ©
©
r -oo©
cn©©
in©©
o©
©©©
oo©©
i ■OS©©©
o©
©© 0.
039
I 1OS©©©
DP3 ■ ■ 1 ■ 1 ■ ■ ■ ■ ■ i ■ i ■ 1 ■ ■ ■ ■ ■ i 1 1 1
DP4
+
2.50
9
2.11
6
2.12
6
2.13
6 9irz
so©oo
2.06
0 cnin
CN 2.07
7 OsOSOs
in©CN 2.
059
2.00
4 r-Os
c n
OSinOs
CN 2.25
7 inCN
CN 2.25
6 r~-Osc n
CN 2.53
6
2.57
4 inso04
CNOO©CN
%T
S IT>cn
incn
incn
inc n
inc n
incn
inr n
Hou
r
Mix
/Liq
04inOn
04 ■rtCN
inOsCN
Mix
/Liq
CNinOs
CN
CNtoOs
msoso
insoso
End
Mix
End
Liq
SO CN
End
Mix
End
Liq
SO 04
Befo
re
WW
W
Dat
e
6/25
/200
9
6/26
/200
9
6/29
/200
9
7/1/
2009
6/26
/200
9
6/29
/200
9
7/1/
2009
6/25
/200
9
6/26
/200
9
6/29
/200
9
7/1/
2009
6/26
/200
9
6/29
/200
9
6/29
/200
9
6/29
/200
9
7/1/
2009
Os©©CN
CN
7/6/
2009
7/1/
2009
7/2/
2009
7/6/
2009
'
7/6/
2009
Lab
Nu
mb
er
CNc-Osc n 39
72A
3972
B cnr~~OScn 39
73A
3973
B
3975
A
3975
B
3980
-
Sacc
h
3981
-
Sac
ch
rOOO ncn
149
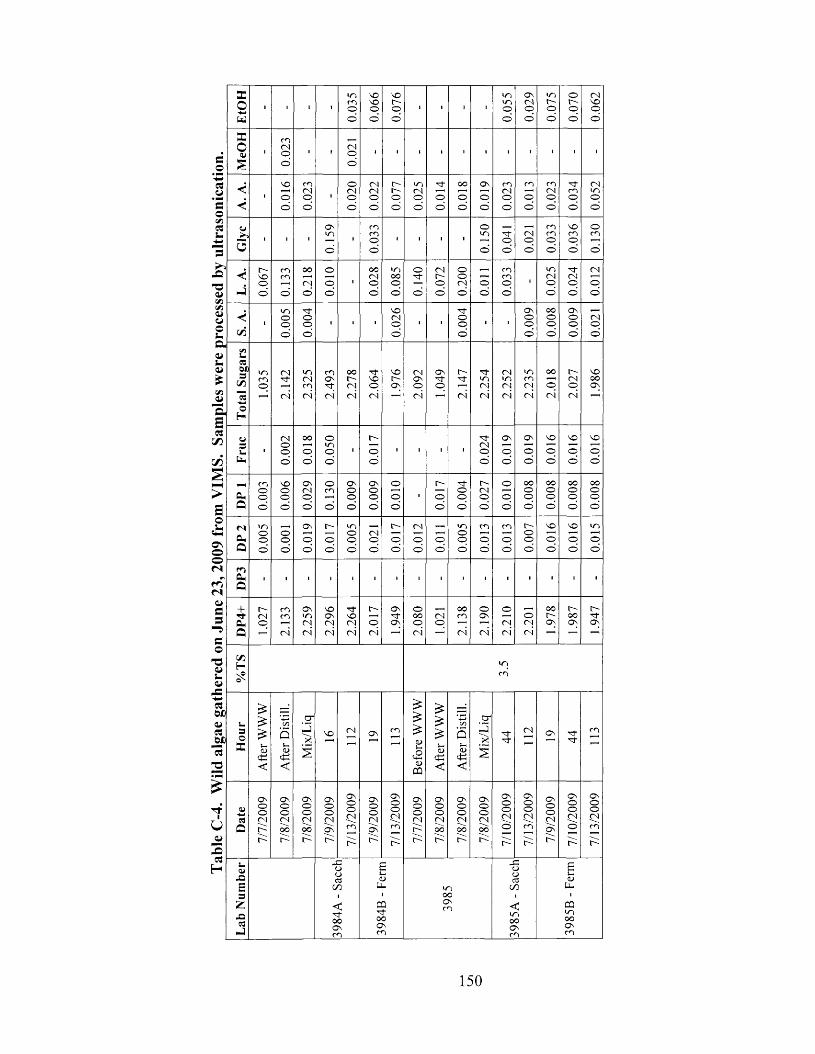
a>s-0>*xn0>"HE93
C/52l-H>Eo«MONoo<Nrn<N0>aa•“5=O-oa>s-a>-C■+■*oOiDla>«M"3-a
TfiUCL*2C3H
EtO
H
l i i 1
0.03
5
0.06
6
0.07
6
l i 1 i
| 0.
055
0.02
9
0.07
5
0.07
0 39
0‘0
MeO
H
■rnCNOO
i 'CNOo
i ■ l i I i ■ ■ i I i
A.
A.
■VOOO
mCNoo
I
0.02
0 CNCNo©
r -r -oo
IT)(NOO
oo
OOoo
ONoo
cnCN©©
cnpo
rnCNp© 0.
034 CNin
p©
Giv
e■ i 1
0.15
9
lcnrnO©
' i ■ 1oin
o
n-©©
<N©©
cnrn©©
NOm©©
©rn
©L.
A. r -NO
oo
mmo
ooCN©
ooo '
looCNpo
■noooo
o
o
CNr-po 0.
200
o©
cncnp©
■mcnp©
N"CNO©
CN©©
S. A
.
1inooo
oo©
1 1 1
0.02
6
- ■n-ooo
1 ■
0.00
9 oo©p©
ON©©©
<N©©
Tot
al
Su
gar
s
inm©
2.14
2 m(Ncncn
cnONpCN 2.
278
2.06
4 NOp
2.09
2 ONn -p
2.14
7
2.2
54
2.25
2
2.23
5
2.01
8 CN©CN
NOOO©
Fru
c
■
0.00
2 oooo
Oin©©
■
0.01
7
1 I ■ i
0.02
4
, 0.
019
0.01
9
0.01
6
91
00
NO©©
DP
1 cnOOO 0.
006 ONCNo
o
ocn
o
ONoo©
ONopo
opo
IC"po
N"Oo© 0.
027 ©
©©
ooo©©
oo©©©
oo©p©
OO©©©
DP
2 inooo
ooo
ONo©
t~~oo
mopo
CNoo
t~~oo
<NOO
o©
inooo
mo©
cn©©
©©o
NOp©
NO©o
in©©
DP
3 1 ' 1 1 1 1 • i 1 ' ■ ■ ' i 1 ■
DP
4+ inCNO
2.13
3
2.25
9
2.29
6
2.26
4
2.01
7 ONO)
2.0
80 CN©
2.13
8
2.1
90
2.2
10 ©CNCN
ooON
INOOOnNp
%T
S incn
Ho
ur
Afte
r W
WW
Afte
r D
isti
ll.
Mix
/Liq
VO CN Ov rn
Befo
re
WW
W
Afte
r W
WW
Afte
r D
isti
ll.
Mix
/Liq
N"N"CN ON
N"m
Dat
e
7/7/
2009
7/8/
2009
7/8
/200
9
7/9/
2009
7/13
/200
9
7/9/
2009
7/13
/200
9 ONoo<Nr -n 7/
8/20
09
7/8/
2009
7/8/
2009
7/10
/200
9
7/13
/200
9
7/9/
2009
7/1
0/20
09
7/13
/200
9
Lab
Nu
mb
er
3984
A -
Sacc
h
3984
B -
Ferm
inooONrn
3985
A -
Sacc
h
3985
B -
Ferm
150
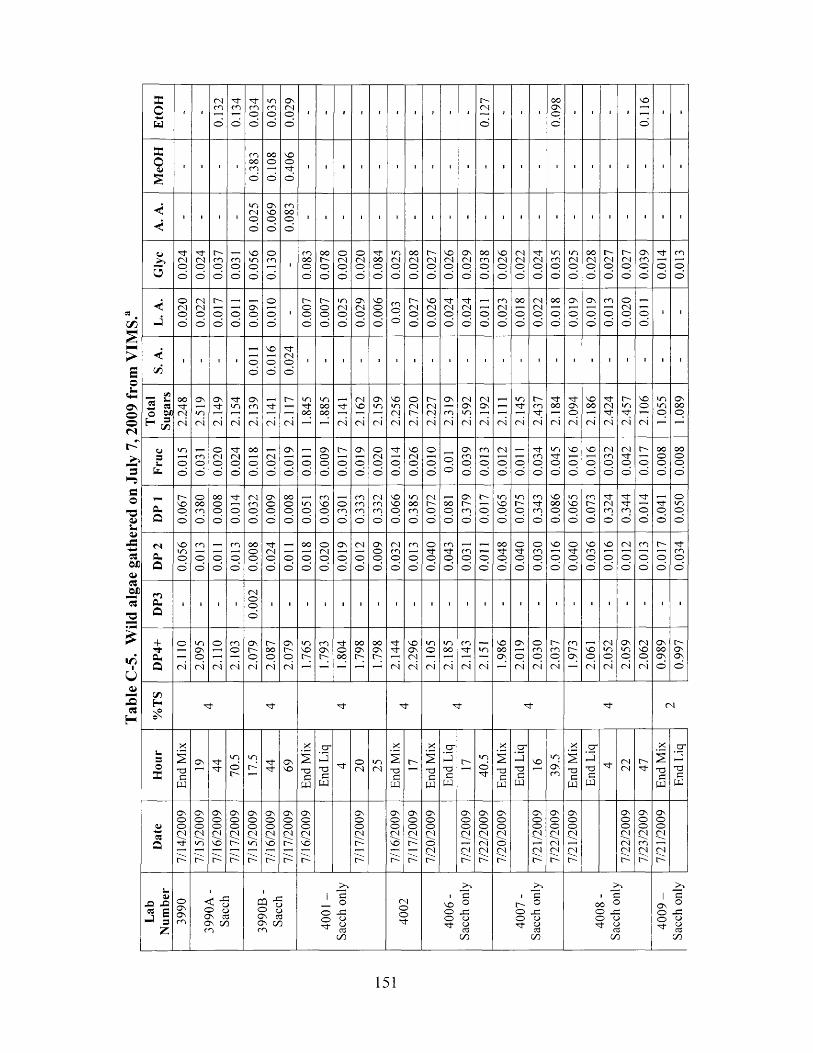
Tabl
e C
-5.
Wild
al
gae
gath
ered
on
July
7,20
09
from
VIM
S.
Xo'Ww
Xo0)
<<
<yo
<J
<c/3
OnQ
<N
f i .
Q
o -
a
+TfQha
C/5Ho '-
!—3O
X
osa
OS X! X« E-J 3
z
■rCNO
oCNO
o
o
t"NOo
mo
o "
ON ^ t
oCNo
O no
CN
T33W
O nOO<N
3"3-
< f ^ x ° o oO n 03ON 0 0r n
o oO
Or n
CNpo
ONoo
3 -3 -
m os £ON OOr n
o
o
ONCNo
o
ONoo
NOo
o
oCNo
o ’
3 -oo o
2"J
OS3W
O X o 03^ 3
00
oCN
ONooCN
CNoo3-
c r
J333
w
ON( No
( NO n
O nmo
o
ONr-~
m3 "
3 -
CN
O3 "o
c r
J333
W
> >1 3 i 3
NO o r - Oo X o Xo o o o3 " o
3o o
3 " o»3
0 0
3 -CN|o
<NCn|o
ONooCN
CN
000 4o
o
X
3 33
w
oCNo
o
3 -CN3 ;
( N
CNmoo
3 "CN
I co o ° o X o o^ 8 oo
<N
o
o '
NOo
o
o
3 "
o
o
m
o
o
ONo oo
oo
oono
o
3 -mo
o ’
ONono
ONo oO n
O
CN<N
ONooCN
CNCN
O nOOCNmCN
c r
X
333
W
' so
Xoo300
151
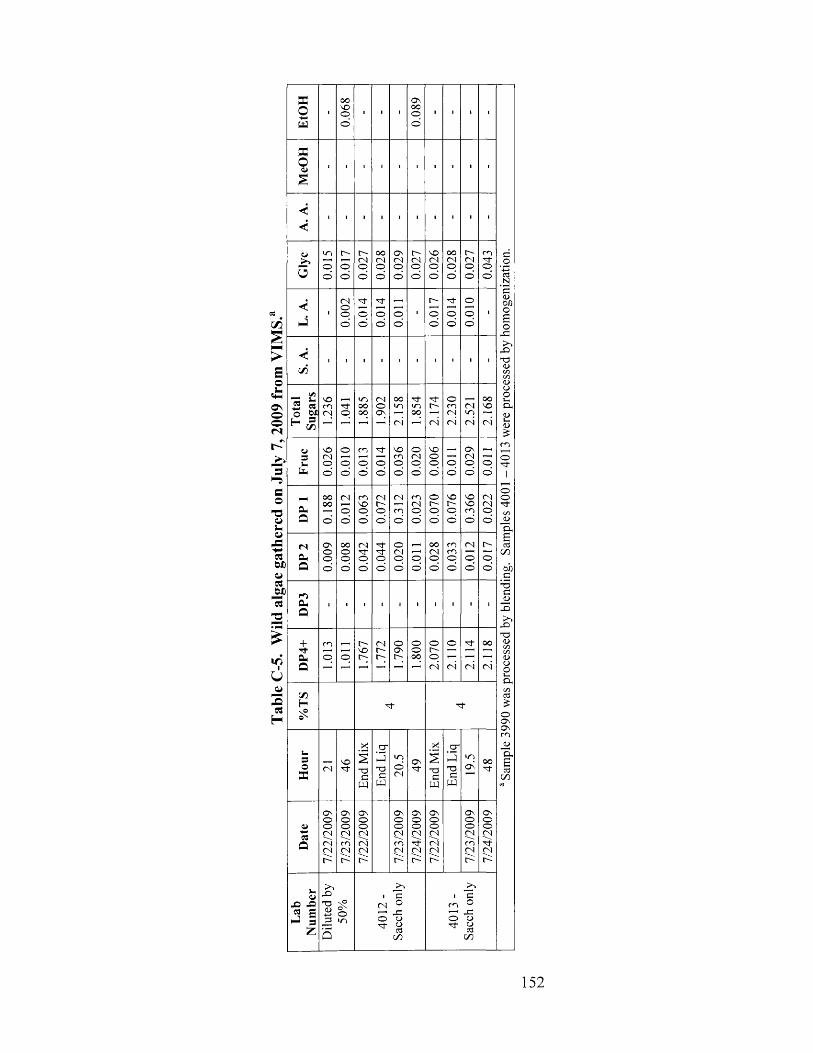
cn%HH>Eo£o\oo<N
3Coa>s-o>XOJD«esJ2f-a
IT)iua>2csH
EtO
H
ioovooo
I I IOvoooo'
1 i i i
a Sam
ple
3990
wa
s pr
oces
sed
by bl
endi
ng.
Sam
ples
40
01
- 40
13
were
pr
oces
sed
by ho
mog
eniz
atio
n.
MeO
H
■ ■ I ' I ■ I ■ i i
A. A
.
i ■ I I I ■ I i i i
Gly
c
0.01
5 t-~oo 0.
027
0.02
80.
029
0.02
70.
026
0.02
80.
027
0.04
3
L. A
.I
0.00
2 •'tf'o©
oo
©o
I
0.01
7
o©
0100 iS.
A.
I l i 1 ■ I ■ ' I i
Tot
alSu
gars
1.23
61.
041 V'loooo
1.90
22.
158 inoo
2.17
42.
230
2.52
12.
168
Fruc
0.02
6 ooo
c n
o©
o©
VOc n©o 0.
020
0.00
6
o© 0.
029
0.01
1
DP
1 8810 0.01
20.
063
1 0.
072
0.31
20.
023
0.07
00.
076
0.36
60.
022
DP
2
0.00
9 ooo©o 0.
042 r•n-o
o 0.02
0
oo 0.
028
0.03
30.
012 t--
oo
DP3 • 1 I i I ■ i 1 I 1
DP4
+
1.01
31.
011
1.76
71.
772
1.79
0 oooo
2.07
02.
110
2.11
42.
118
%T
S
- ' t
Hou
r
<N 46En
d M
ixEn
d L
iq20
.5 49En
d M
ixEn
d L
iq19
.548
Dat
e
7/22
/200
97/
23/2
009
7/22
/200
9
7/23
/200
97/
24/2
009
7/22
/200
9
7/23
/200
97/
24/2
009
Lab
Num
ber
Dilu
ted
by
50%
4012
- Sa
cch
only
4013
-
Sacc
h on
ly
152
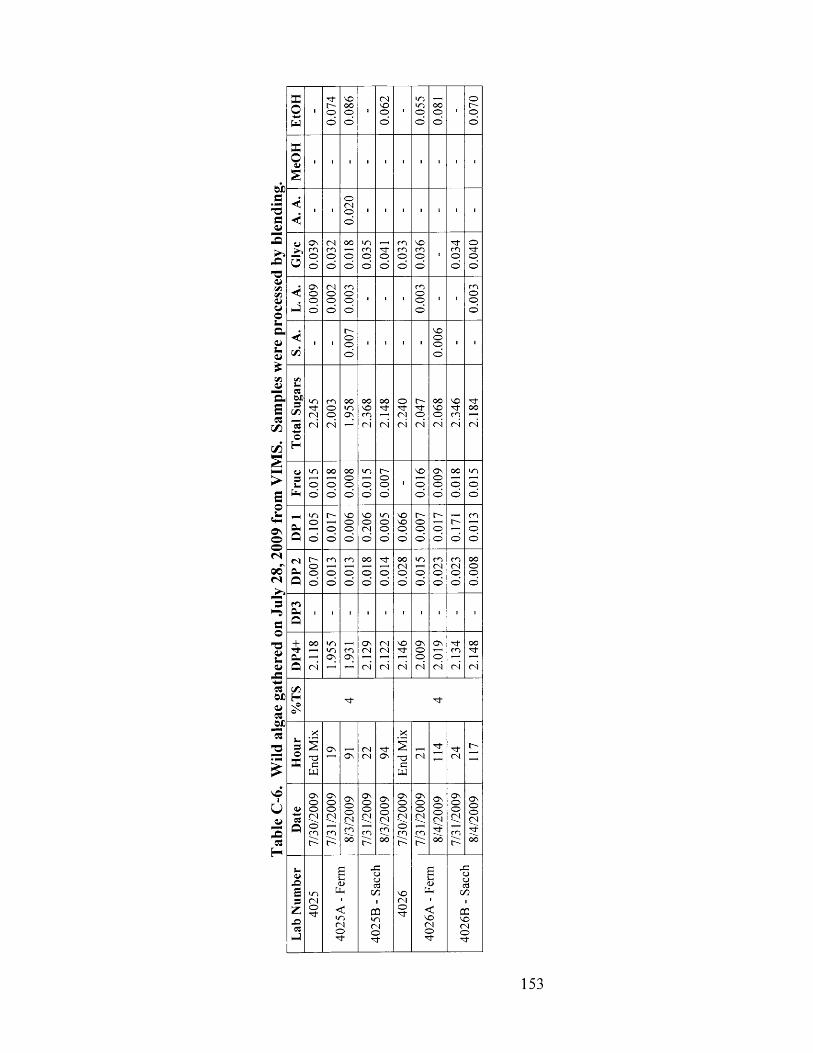
6Da-3aQi
>>&-o
uos -as.
C3C/3
C/3
Eo>«CHON.oofN00CN>?SS
sionsu<a03OX)0>03JSJD"3-o
'sOIVi j203H
EtO
H
i'tnoo 0.
086
I
0.06
2
■
0.05
5 oooo
ior-po
MeO
H
i ■ 1 ■ I i I 1 i ■
A.
A.
i 1
0.02
0
■ I i I * i i
Gly
c0.
039
0.03
2 oooo
incnpo
oo
COCOoo 0.
036
■ copo
o■'tOo
L. A
.0.
009 CN
Ooo
cnooo
i 1 1cnooo
1 icnopo
S. A
.
i 1r-opo
i ■ 1 ■NOopo
i i
Tot
al S
ugar
s
in■'3"CNCN
cnoocn
ooinON
2.36
82.
148
2.24
02.
047
2.06
82.
346
2.18
4
Fru
c
OO
oooo
OOooo
inpo 0.
007
I
9100
ONooo
oopo
inpo
DP
1 ino
o
r-oo
NOOOo 0.
206 m
opo
9900 0.00
70.
017 r-~
o
cnoo
DP
20.
007 cn
oo
cnpo
oopo
n -po
ooCNpo
inoo
cn<Noo
cnCNpo
ooopo
DP
3
l ■ 1 1 ■ 1 1 1 1 i
DP
4+2.
118 in
inON
c np
6 ZVZzzvz9PVZ 2.
009
2.01
92.
134
2.14
8
%T
S N- n -
Hou
rEn
d M
ix
ONO n
CNCN ON
End
Mix
<NN"CN
IN
Dat
e7/
30/2
009
7/31
/200
98/
3/20
097/
31/2
009
8/3/
2009
7/30
/200
97/
31/2
009
8/4/
2009
7/31
/200
98/
4/20
09
Lab
Num
ber
inCNo
4025
A -
Ferm
4025
B -
Sacc
h
NOCNOn-
4026
A -
Ferm
4026
B -
Sacc
h
153
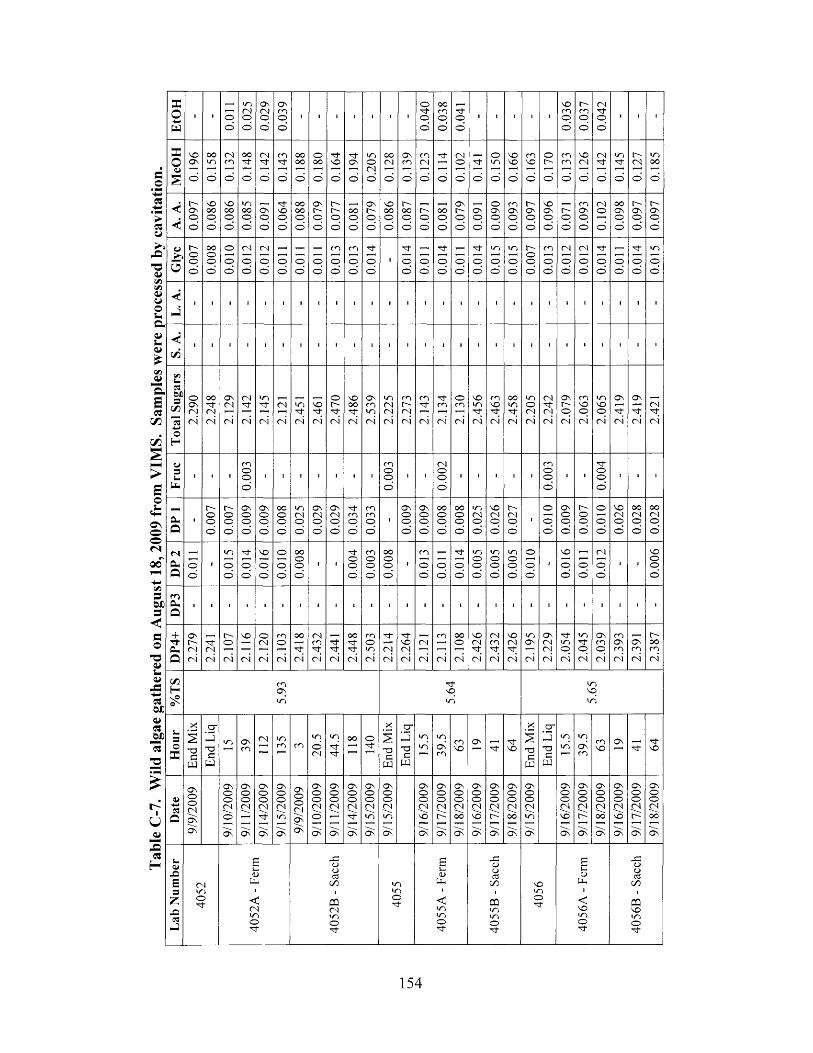
Tabl
e C
-7.
Wild
al
gae
gath
ered
on
Aug
ust
18,2
009
from
VIM
S.
Sam
ples
wer
e pr
oces
sed
by ca
vita
tion.
EtO
H
l 1 o© 0.
025
0.0
29
0.0
39 ■ i I I • l 1ooo 0.
038
o©
■ ■ I I ■
0.0
36
0.0
37
0.04
2
I i l
MeO
H 96
10
0.15
8 CNcn
o
oo
o
CN
©
cn
o
oooo
© 0.18
0
0.16
4
0.19
4 w ooCNo 0.
128
0.13
9 cnCNo 0.
114
0.10
2
o 0.15
0 99
10
cnso
©
ot—
©
cncn
O 0.12
6
0.14
2 to
© 0.12
7
0.18
5
V V
0.09
7
0.08
6
0.08
6 w noooo
OsO©
N-NOoo
oooo©o 0.
079
0.07
7 oooo 0.
079
0.08
6 oooo
INo©
oooo 0.
079 ONo
o 0.09
0 cnONoo 0.
097
0.09
6 NOO
cnONoo 0.
102
0.09
8
0.09
7
0.09
7
Gly
c0.
007 oo
ooo
ooo 0.
012
0.01
2o©
oo
oo
cnoo
cnoo
oo
I o©
oo
■n-oo
©©
oo
unoo
w o
oo
INOoo
cno©
CNoo 0.
012
o©
oo
oo
oo
L. A
.
i ■ 1 l I 1 • ■ 1 ■ 1 I 1 1 ■ 1 ■ 1 I 1 1 1 l ■ i 1 1
S. A
.
i 1 1 1 I 1 ■ 1 1 ■ 1 I 1 1 ■ 1 1 1 1 1 1 1 1 i i * 1
Tot
al S
ugar
s2.
290
2.24
8
6ZVZ
2.14
2
2.14
5 CN
CN
wo
CN
SOnt;CN 2.
470
2.48
6
2.53
9
2.22
5 cnt"-CNCN 2.
143
2.13
4
2.13
0
2.45
6 cnso
CN 2.45
8
2.20
5
2.24
2
2.0
79
cnsooCN 2.
065
2.4
19
2.4
19 CN
CN
Fru
c
i ■ 1cnoo©
I i 1 1 I ■ icnooo
■ i
0.00
2
■ i i l ■cnoO©
l •oo©
I 1 i
DP
1
ir -oo© 0.
007
0.00
9
0.00
9 OOoo©
w oCNo© 0.
029
0.02
9 xt-cnoo
cncn©©
1
0.00
9 ONooo
oooo©
ooooo
w oCNo© 0.
026
0.02
7i
01
00
60
00
NOO©
o©© 0.
026
0.02
8
0.02
8
DP
2
oo
1 oo
o©
'O©©
ooo
ooooo
i I ooo
c nooo
ooo©o
lc n
oo
oo
o©
w oooo
w oooo
w ooo©
ooo
1
91
00 o
o 0.01
2
I ■NOOO©
DP3 1 1 i 1 1 1 1 i ■ 1 i 1 I 1 i 1 1 1 ■ 1 1 I 1 l I ■ 1
DP4
+2.
279 N-
CN
CN 2.10
7 91VZOZVZ
2.10
3
2.41
8
2.43
2
n-
<N 2.44
8 c now o
CN 2.21
4
2.26
4
CN
CN
c n
CN 2.10
8
2.4
26
!
2.43
2
9ZVZ
2.19
5
2.22
9
2.05
4
2.04
5
2.03
9 c nO sc n
CN
O nc n
CN 2.38
7
%T
S c nO n
w 3NO
WO
w oNO
WO
Hou
rEn
d M
ix
End
Liq
w n O nc n
CNc n c n
w o
©CN
Gn
N"oo o
End
Mix
End
Liq
WO
WO
w o
O nc n
c nso
ONNO
End
Mix
End
Liq un
to*oO Sc n
c nso
O sNO
Dat
e
9/9
/200
9
9/1
0/2
00
9
9/1
1/20
09
ONooCN
O n 9/1
5/20
09
9/9/
2009
9/1
0/20
09
9/11
/200
9
9/1
4/20
09
9/1
5/20
09
9/15
/200
9
9/16
/200
9
9/1
7/20
09
9/1
8/20
09
9/16
/200
9
9/17
/200
9
9/1
8/20
09
9/1
5/20
09
9/16
/200
9
9/17
/200
9i
9/18
/200
9
9/16
/200
9
9/17
/20
09
9/1
8/20
09
Lab
Num
ber
CN
oN"
4052
A
- F
erm
4052
B
- S
acch
w ow ooN"
4055
A
- F
erm
4055
B
- S
acch
NOWOo
4056
A
- F
erm
4056
B
- S
acch
154
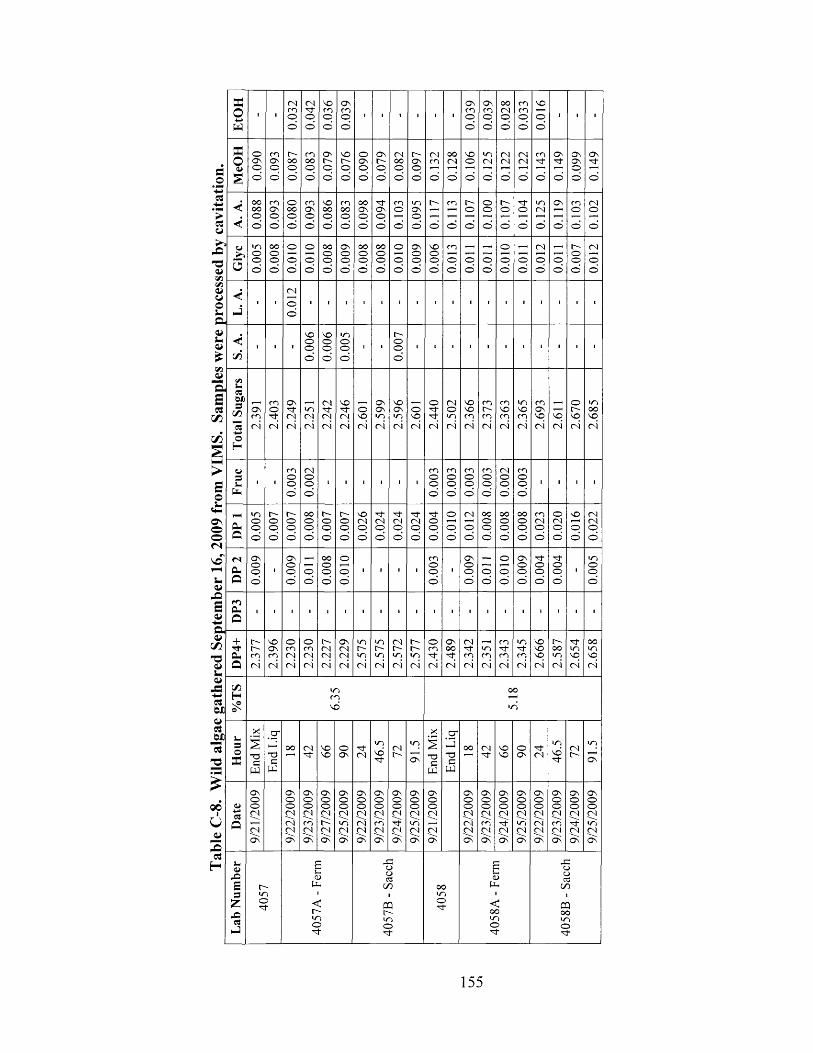
>53u-£!'■aa>5C5C(UuoS-,&
53Iflx/x
>
©*OS©oCN
VO
a4>CZ5'Oa>s.vX53WDa>53J2f-a
CN
cnd
00IU©
53H
r-~monr
<uI-Lh<inonT
co00
OQmonr
onT <OnT
c300
PQo oononr
155
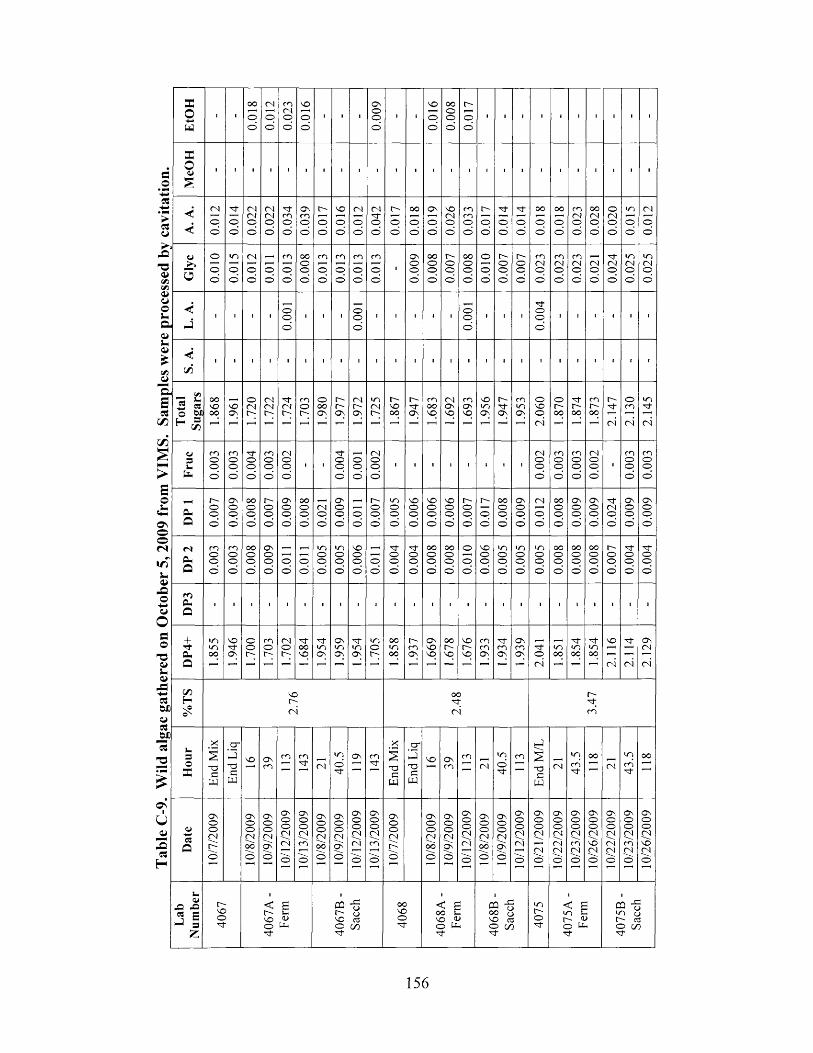
ECStni/i
>Eo
*as©
ao ■ 1OO
o
(N
o
t oCNo
v o
o 1 1 1
O voo i
v o
o
o ooo
N
o 1 1 1 1 1 1 1 1
H o o o o o o o o
Me
OH
■ 1 1 ■ 1 ■ 1 1 1 1 i 1 ' 1 1 ■ 1 1 1 1 1 1 1 1 1
< CN
O
d -
o
CNCNo
CNCNo
d "cn©
o vcn© o
v o
o
CN
©
CNo ro
IN
o
o o
o
o v
o
VOCNo
c oc oo
N
©
d -
o
d -
©
o o
©
o o
©
c oCN©
o oCN©
©CN©
v o
©
CN
©< o o o o o o o o o o o o o o o © © © © © © © © © ©
Gly
c o
o
o o
o
( N
o o
cn©
00oo
c o
o
CO
o
c o
o
c o
o 1
o voo
o ooo
I Noo
o ooo
©
©
IN©©
N©©
c oCN©
COCN©
c oCN©
CN©
d -CN©
v oCN©
v oCN©
o o o o O o o o o o o o o o © © © © © © © © © ©
< 1 1 1 1 oo
( 1 1 oo 1 1 1 1 1 ©
o 1 1 1d -©© 1 1 1 i 1 1
n-3 o O o ©
< 1 1 1 1 i i 1 i 1 1 1 1 1 1 1 1 1 1 1 1 1 1 1
C/3
* __ _ t/1
,2 cs© w>
o oVOo o
v oO v
oCNc-~
( NCNc-~
d -<Nr -
c ooc-~
oo oOV
r -f "O v
( N
O v
'JOCN
C -VOo o
Nd -O v
COo ov o
CNO vv o
COOVv o
VOI/Oo v
Nd -C v
c oV 0o v
©v o©
©Io o
d -I00
c oNo o
Nd -
©c o
v od -
^ C/3 ’— l ,— l ' 1 1—1 1 1 1—1 ' 1 ,— l 1 1 r—1 ' 1 1 ' 1 T—1 ' 1 ’ 1 CN r_H ' 1 1—1 CN CN CN
(Jau
co©o
cn©o
d -oo
cn©o
CNOo 1 1
d -oo
Oo
CNoo 1 1 1 1 1 1
CN©©
co©©
CO©©
CN©© 1
co©©
co©©
b o o o o o o o o © © © © © ©
Cu
t-~oo
O vOo
o ooo
r -oo
OvOO
o ooo
CNo
o voo o
r -oo
'JOoo
VOo©
v ooo
v ooo
r~~©©
t— ©
o o©©
o v©©
CN
o
o o©©o v©©
OV©©
d "CN©
OV©©
o v©©Q o o o o o o o o o o o o o o © © © © © © © © © © ©
<n
Cu
coOO
cn©o
o ooo
Ovoo o o
VO)oo
'JOoo
v ooo o
d -oo
d -oo
o ooo
o oo©
©
©
v o©©
I/O©©
'JO©©
v o©©
o oo©
o o©©
o o©©
I— © ©
d -©©
d "o©
Q O o o o o o o o o o o o o o © © © © © © © © © © ©
DP
3
■ 1 1 1 1 1 1 1 1 ■ i ' 1 1 ■ 1 1 1 1 ■ 1 ■ 1 1 1
+t TCl.
OOo oo o
v od -O v
ooIN
cn©N
CNoC-"
d "o oVO
d -v oo v
o vc nOV
"d -'JOOV
'JOoI N
ooI/Ooo
I— COo v
OVv ov o
00Nv o
VONVO
cocoo v
d -coo v
OVcoo v
d -©
</0oo
d "v ooo
d -v ooo
v o d " o vCN
Q 1—1 ' ' ,— l ’ 1 '~l 1—1 ' 1 ’— l ' 1 1—1 ’ 1 ' 1 ' 1 CN ’ 1 1—1 CN CN CN
oCdi/5s-4 )
XO
oao'Vos-a>Xcs6X)(Uc«J»JD
H-s®VOr-~
ood -CN
t " -d "
o
a
hJ
asi
U
c-»
X«
H
«Q
4>jo jo« E—I 3
z
c-~VOod -
< pn C v oO tJi d -
CQ -g
S £O C/3 d "
OOVOod "
<ooVOod -
CQ •§OO ov o cd o oo d -
< £ £ 5o 0- d-
CQ -5 v o o r~~ cdO 00 d "
156
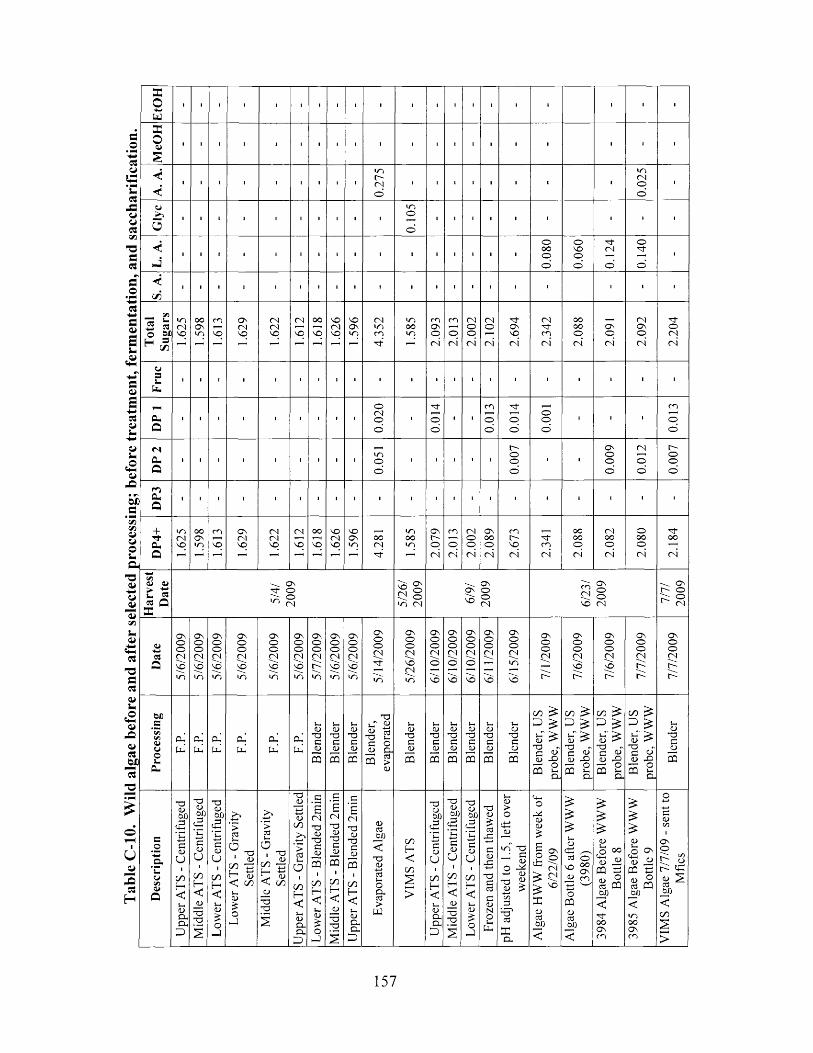
S3
V -cQcuucqxcucuCQC«
'OS3A
S3#oV -CQ
-**aouas-
KOM
ffio
o>>
<
J<
crOCCNCD
(NCNCO
inCNO
CNm
oo
N -ONCD
CN
OOOoo ’
CN' ' tcn
ocoo
pCN
"3 -CN
O cO
(NO
o'd-
(NONo
•"toCNCN
ft*Q
oCNoo
oo
ooo
m
oo
CUu
aOU
X !
WDG
soOcuos -
CUcucu
a.Q
oo
r~-ooOCoo
CN
oo
c-~ooo
ro~Q
O cCNCO
CNCNCO
00CN■'t
t-~c q
CN
'ItrnCN
oopCN
CNOOpCN
oCN
'd-oo
a> cu
3 °
o c *d- o o c Oc O
O CNCO
^ o CJ oCO CN
- O ct"- o oCNf "
ucuCQ
S3CQcu5-
&CU
XcuCQ
OSQ
Ocoo(N
OcOOCN
OcOOCN
OCooCNioCN
OcOoCN
OcOOCN
OcOOCNCO?=
OcooCNCO
OnOOCN
OooCN
OX)s
oL.a .
_T <L>
CL CL,
CQ 03
T3C
03
c(Us
00 ^ c- I>(U
- aC(U X )
CQ 2 a.
oo ^D> fc ^T3C cu
03 2 CL
o o ) >
t 3C W<u P
03 2CL
o o ^
p > fc ^C cu<U -O5 2
C L
T3Ccus
uGU
XCQ
H
#o
.S-*uoV)a>
Q
>Cd
° n-.
oo p£ «< 00
ai t3<uoo ~f—1< oo
cdOX)
<
oC Lcd>
W
00H<oo
s
>
>op_aj
on "O P G 1 a> o
T3cd
KC L
COO OO Oc
Q-> rn JC wO
03<ucdM)
<
£cuLhO 00'S «03 t ! <u 5 cd 03 b 0
N"OOOCm
03 P
cd 03 00
<
Oc O
t~- P
% :OX)
157
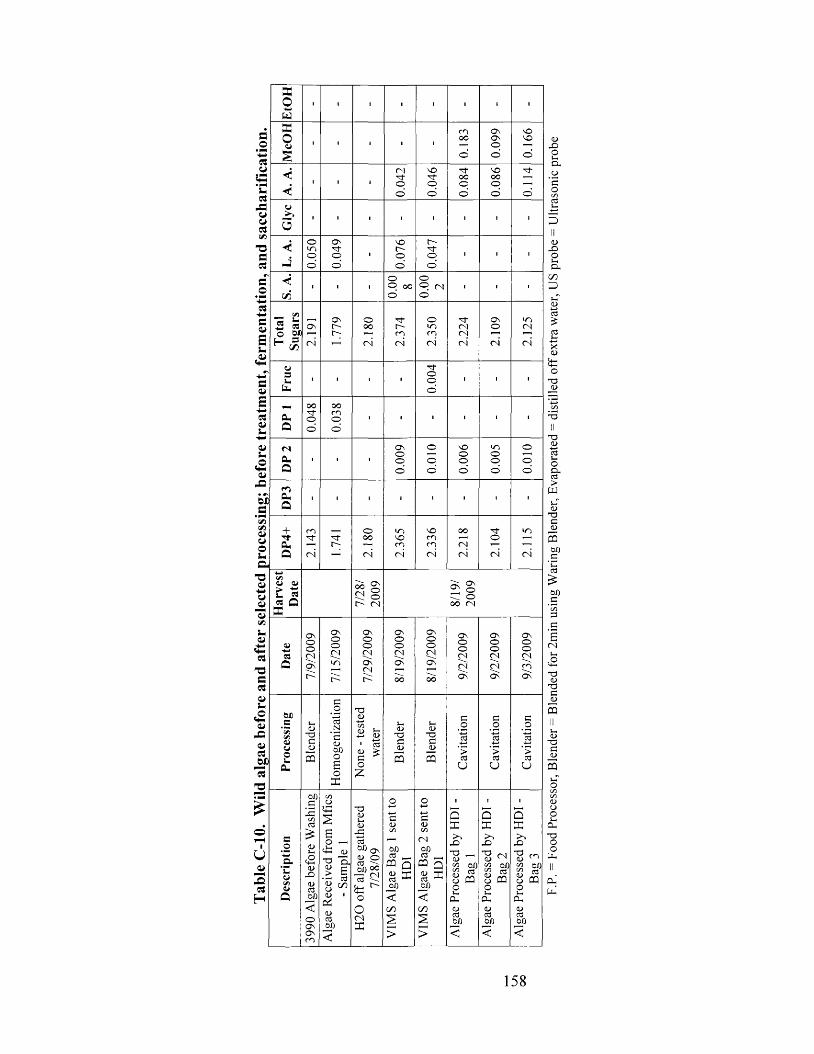
158
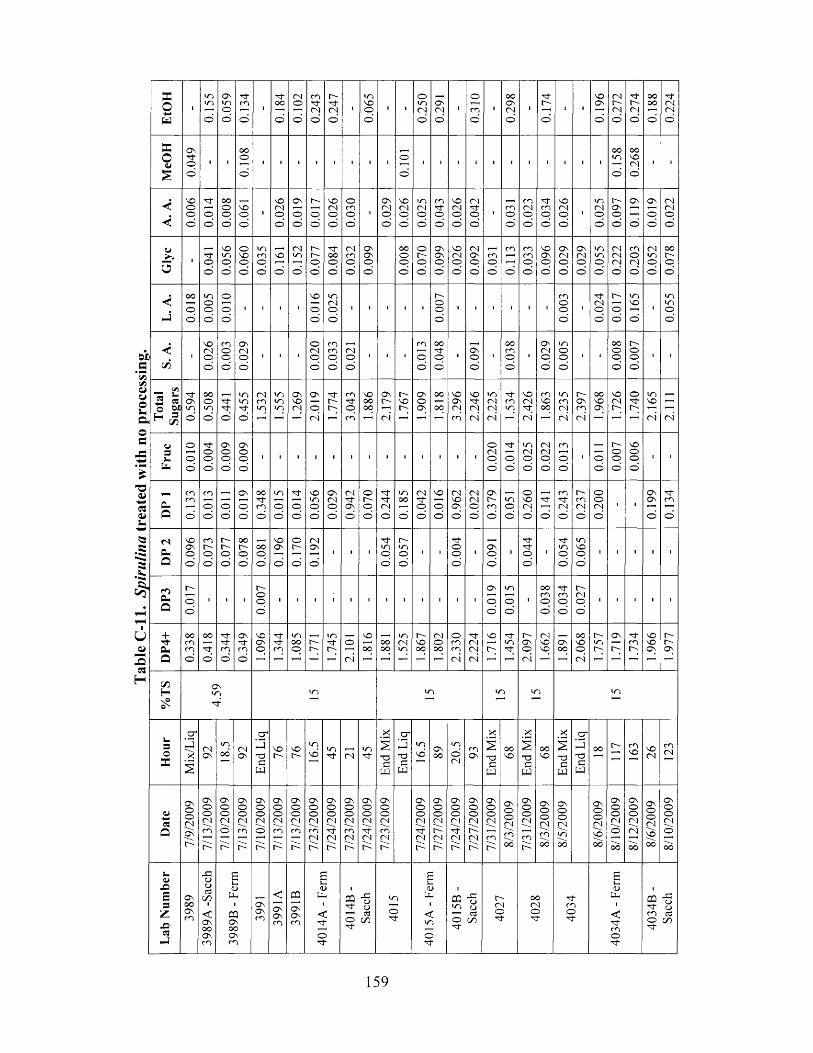
Tabl
e C
-ll.
Spir
ulin
a tre
ated
wi
th
no pr
oces
sing
.
EtO
H
i
0.15
50.
059
0.13
4
l-fooO 0.
102
0.24
3 INN"CNO
I
0.06
5
■ 1
0.25
00.
291
i
0.31
0
■
0.29
8
■
0.17
4
• ■
0.19
60.
272
0.27
40.
188
0.22
4
MeO
H
0.04
9
■ ■oood
I ■ i ■ i ■ ■ i oo
■ i ' ■ I ■ ■ ■ ■ i ■oomd
oovoCNd
■ ■A.
A. vooo
d
'fod
ooood
vood
■
voCNOd
O s
od
r~-od
VOCNOO
oc npo
■O sCNOO
VOCNp
o
inCNoo
c n
oo
voCNOo
CN' i fOo
I c np
o
c nCNOo
N"c noo
voCNp
o■
mCNod
INO sOd
o s
d
O s
Od
CNCNOd
Gly
c
1 ■ fod
voinod
oVOp
d
mc noO
vod
CNind 0.
077
OOpo
CNc np
o
O sO Soo
ooop
o
oNoo
O sO sOO
voCNoo
CNO sOo
c noo
c n
o
c nc np
o
voo soo
O sCNoo
O sCNOo
u ninp
d
CNCNCNd
c noCNd
CNinp
d
ooNOd
L. A
. oop
d
inood
op
d■ ■ ■ ■
VO
od
inCNoo
■ 1 1 1 ■NOOo
1 1 i ■ ■ 1c nooo
■'fCNp
d
IN
Od
invod
■ininod
S. A
.
1voCNod
c nood
O sCNOd
■ 1 1oCNod
c nc noo
CNOo
1 ■ 1c n
p
o
oo'd -oo
•O soo
iooc noo
•O sCNOo
inop
o1 i
ooop
d
NOod
■ i
Tot
alSu
gars
OSV")
o ’
oooind
N-pd
inin-fd
CNc nin
inminO SvoCN
2.01
9
NIN
c n
p
c n
vooooo
2.17
9 INVON
O Sop
oooo
3.29
62.
246
2.22
5 'Ifc nin
2.42
6 c nvoooinc nCNCN
NO sc nCN
oovop
voCNN
o'fIN
invoCN CN
Fru
c ood
"fop
d
O Sop
d 0.00
9
i ■ i ■ i ■ 1 ■ i 1 1 i ■
0.02
0 ■foo
inCNoo
CNCNoo
c n
oo
i p
d 0.00
7 9000 i '
DP
1 mc n
d
c n
p
dp
d 0.01
9 ooc nd
inp
d
*fod
voinod 0.
029
0.94
20.
070
CNO
mooo 0.
042 vo
oo
CNVOpo
CNCNOo
O sNc no
inoo
ovoCNo
'Ifo
c n'3 -CNo
N -c nCNo 0.
200
I IO sO s
d 0.13
4
DP
2 voo sod
mr -p
d
ni np
d
oonod
oop
d
VOO s
d
oN
d
CNO s
d
i ■ 1 inoo
Nmp
o■ 1 o
p
o1 O So
oi
'C f^ fOO
1'Ifinp
o
u nvoOo
I I l ■ i
DP3
r-od
■ i 1nood
1 1 • i ■ l • ■ ■ 1 i 1o s
p
o
mp
oi
ooc nOo
'fc np
O
INCNoo
1 I ■ i ■
DP4
+ ooc nc n
O
oopd
'fc nd
O s- fc nd
voo so
n -n -c n
mooo r-~IN oCN
'O
0 0oooo
inc nm
r -vooo(Nooo
2.33
02.
224 VO
N
'C fin'C f
2.09
7 CNvovo O SooooVOp
CN
r -mr -
O s ' fc ne '
VOvoO S
r-~NO s
%T
S O sin■d
i n in in v n m
Hou
r
Mix
/Liq
CNO s
in0 0
CNO s
End
Liq
vor-~ voc~-invo in
CNin
End
Mix
End
Liq in
vd O SooinoCN
c nO s
End
Mix
oovo
End
Mix
oovo
End
Mix
End
Liq
oo envo vo<N
c nc n
Dat
e
7/9/
2009
7/13
/200
97/
10/2
009
7/13
/200
97/
10/2
009
7/13
/200
97/
13/2
009
7/23
/200
97/
24/2
009
7/23
/200
97/
24/2
009
7/23
/200
9
7/24
/200
9 O SooC lN
C lN 7/
24/2
009
7/27
/200
97/
31/2
009
8/3/
2009
7/31
/200
98/
3/20
098/
5/20
09
8/6/
2009
8/10
/200
91
8/12
/200
98/
6/20
098/
10/2
009
Lab
Num
ber
O sooO sc n
3989
A -S
acch
3989
B -
Ferm
O sO sc n 39
91A
3991
B
4014
A -
Ferm
4014
B-
Sacc
h ino
4015
A -
Ferm
4015
B -
Sacc
h NCNO■r
ooCNof
c no'f
4034
A -
Ferm
4034
B -
Sacc
h
159
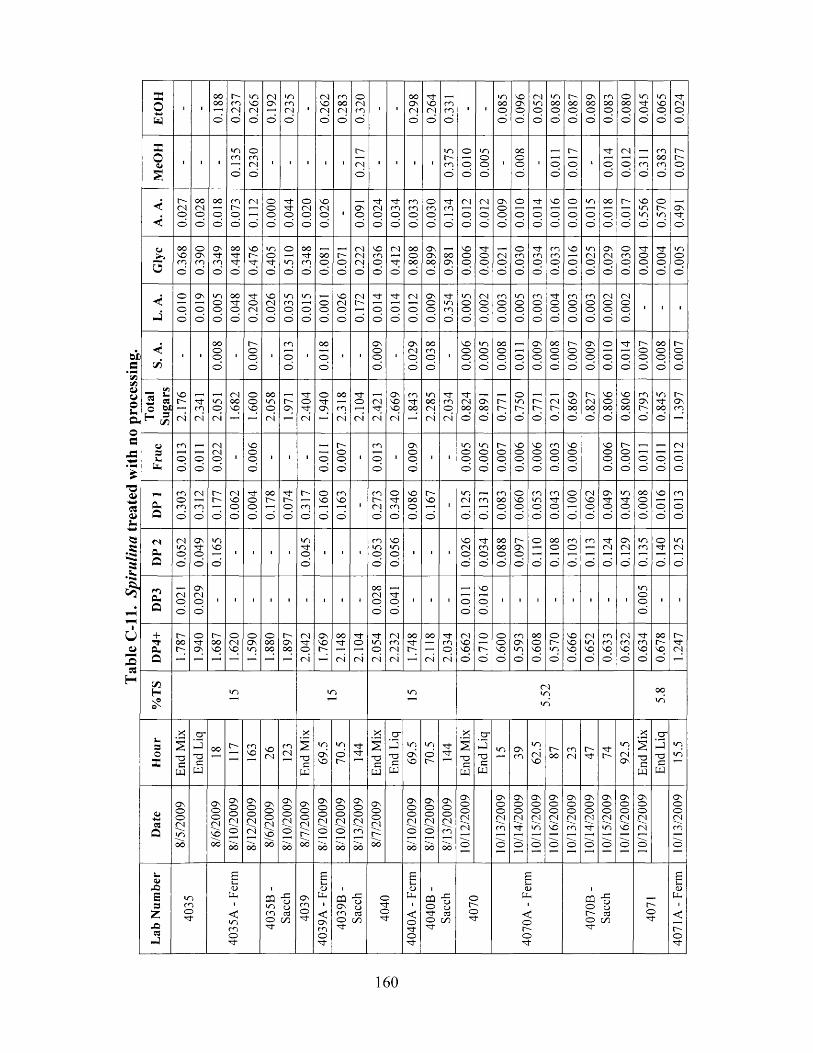
Tabl
e C
-ll.
Spir
ulin
a tre
ated
wi
th no
proc
essi
ng.
EtO
H
■ ■
0.1
88
0.2
37
0.2
65
Z6
V0
0.2
35
■
0.2
62
0.2
83
0.3
20
■ 1
0.2
98
0.2
64
0.3
31
■ ■
i no op
o
96
00
0.0
52 m
o op
o
INOOoo
O sOOp
o 0.0
83 o
o ooo
i ns tp
o 0.0
65 S t
CNO
O
Me
OH
■ ■ ■
i nc n
o 0.2
30
i ■ ■ ■ ■r -
CNo
■ 1 I ■mNc no
o
o
o
i noo
o
1
o ooo
o
i o
o
r -
o
o >
1S t
p
o
CN
o
o
c no
c no oc n
o
NNO
O
A.
A.
CNoo
o oCNo
o
o o
o
o
c nnoo
(N
O
ooo
o
S tS to
o
o( NOo
s oCNo
o
■O so
o
S tCNO
o
S t< nOo 0
.03
3 oc npo
s tc n
o
CN
oo
CN
o
o
OSop
o
o
o
o
s t
oo
s o
p
o
o
oo
i n
oo
o o
po
N
o
o
SOi ni n
o
oINi n
o
OSs to >
Gly
c o oSOc n
o
oONc no
O ss tc no
o os ts to
s oI N
O
i nos tO
O
i n
o
OOS tc no
o ooo
N -O
o
(NCNCNO
s oc no
o
CN
s tO
o ooo o
o
OSo so o
o
o o O s
o
s oop
o
S too
o
CNp
o
oc no
o
s tc npo 0
.03
3 s o
p
o
i nCNp
o
O sCNo
o
oc noo
s too
o
s too
o
u noo
o
L.
A. o
o
o
O s
oo
i noo
o
OOs to
o
s tOCNO
SO( Noo
i nc no
o
i n
o
o
oo
o
s oCNOo
CNN
O
S t
o
o
s f
O
O
CN
o
o
o soo
o
S ti nc n
o
mop
o
<Noo
o
c nop
o
i nopo
c nop
o
s too
o
c nooo
c nop
o >
CNop
o
CNooo
1 1 1
S.
A.
1 1
o ooo
o
■
NOO
o
1c n
o
o
i
o o
o
o■ i
O soo
o
i
OSCNo
o
o oc no
o■
0.0
06 i n
oo
o
o oop
o
p
o
o sop
o
o ooo
o
NOo
c >
o sop
o
o
o
o
s t
p
o
Noo
o
o ooo
o
Noo
o
To
tal
Su
ga
rs 9L
VZ
s tc nCN
i no
( N
CNOOs o
oos o
o oi no
CN
NOS
2.4
04 o
S to s
o o
c n
CN 2.1
04
CNs t
CN 2.6
69 c n
s to o
i no oCN
CN 2.0
34 s t
( NOO
o ’
OsOO
o ’
NIN
o ’ 0.7
50
NN -
O
CNN
o ’ 0.8
69
0.8
27
0.8
06 s o
oo o
o ’
mo sIN
o ’
i nS tOO
o ’
I NOSc n
Fr
uc c n
oo
oo
CNCNOo
1
0.0
06
' i ■ o
o
Noo
o
Ic n
po
■
OSoo
o' I
i nop
o
i noo
o
t-~ooo
SOoo
o
SOOO
O
c nooo
SOop
c >
s oooo
Nooo
o
ooo
CN
o
o
DP
1 c noc no
( N
c no
r -I N
o
CNs oo
o
s too
o
00r—
o
s tNO
O
I N
c no
os o
o
c ns o
o
Ic nNCNo ’
os t< no
s oo ooo
NSO
O
I
i nCN
o
c n
o
c no opo
os oo
o
r ni no
o
r nn t -po
oo
o
(NSOoo
OSS tpo
i nS to
o
o oooo
s o
o
o
c n
o
o
DP
2 CNi no
o ’
O ss to
o
i ns o
o ’
1 ■ i 1
i nS to
o
1 ■ i
c ni no
o
SOi noo
■ ■ ISOCNOo
s tc noo
o oo ooo >
No so
o >
o
o
o oo
o
c no
d> 0.1
13 S t
CN
o
OSCN
o
i nm
o
oS t
o
mCN
o
DP
3 CNo
o
OS(No
o
1 1 1 ■ 1 ■ ■ 1 i
o oCNo
o
s tOo
1 ■ I oo
s o
o
o
1 1 1 1 ■ ■ 1 1i nooo
■ 1
DP
4+ C"~
o o C ■
os tO s
N -o oSO
oCNSO
oO s
oo o00
NO sOO
2.0
42 o s
s o [—
o oS t
CN 2.1
04
2.0
54 CN
c nCNCN
o oS tN
OO
CN 2.0
34 CN
SOs o
o 0.7
10 o
os o
o
c nO si n
o
o oopo
oI— i n
o 0.6
66 CN
i ns o
o
mc ns o
o
CNc ns o
o 0.6
34 o o
Np
o
Ns tCN
%T
S
i n i n i nCNi n
i n
o o
i n
Ho
ur
End
Mix
End
Liq
o o f " c n'O s o
CN
m(N
End
Mix
i n
o ^s o
i n
oI N
End
Mix
End
Liq
i n
O sSO
i n
ot—
T-j-
End
Mix
End
Liq
i n O sc n
m
ris o
NOO
cn Ns t
s ti n
CNO s
End
Mix
End
Liq
i n
i n
Da
te
J8
/5/2
00
9
8/6
/20
09
8/1
0/2
00
9
8/1
2/2
00
9
8/6
/20
09
8/1
0/2
00
9
8/7
/20
09
8/1
0/2
00
9
8/1
0/2
00
9
8/1
3/2
00
9
8/7
/20
09
8/1
0/2
00
9
8/1
0/2
00
9
8/1
3/2
00
9
10
/12
/20
09
10
/13
/20
09
10
/14
/20
09
10
/15
/20
09
10
/16
/20
09
10
/13
/20
09
10
/14
/20
09
10
/15
/20
09
10
/16
/20
09
10
/12
/20
09
10
/13
/20
09
La
b
Nu
mb
er
i ncnos t
4035
A -
Ferm
40
35
B
-
Sacc
h Osc no
4039
A -
Ferm
40
39
B
-
Sacc
h os tos t
4040
A -
Ferm
40
40
B
-
Sacc
h oNOs r
4070
A -
Ferm
40
70
B
-
Sacc
h
INOs t
4071
A -
Ferm
160
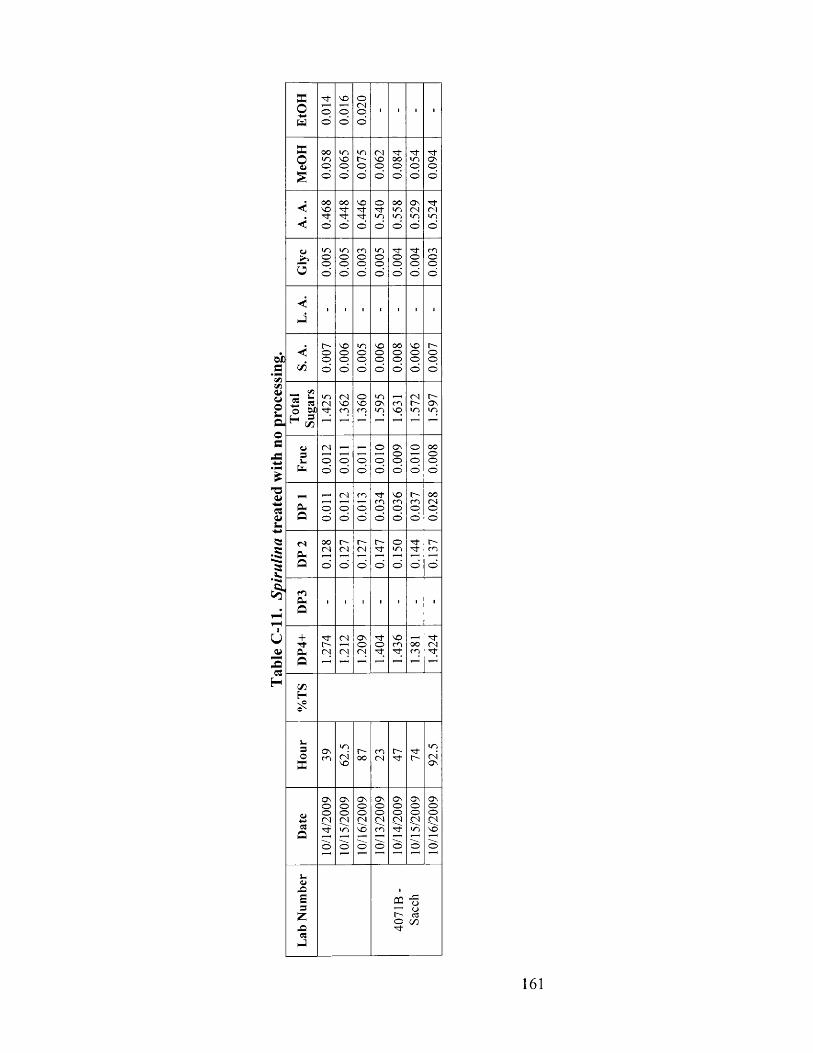
WDa
*IZ)ItloouC-|oa
csa>s-
52*55.4.•»>»
U<w
c«H
PCow
PCo
<
in5
<<J
c /5
C/53 I* o
F-h 3 ^ C/2
3I -U-
CuO
<NPhQ
rOP h
Q
+TTCuQ
C/2H
3OPC
a>XE3
zX!3
J
o<NO
(NVOO
<NVOcn
oo
mOO
O sO<N
t-~oo
■*too
sooo
'3-mo
O sOo<N
O s<N
O SO©o
t"-■ t
O sO
SOoo©
•Tf■ t
t -O Sin
00oo
00<No
• f<N
ca ■§^ c_>t-~ 3O C/2 *3"
161
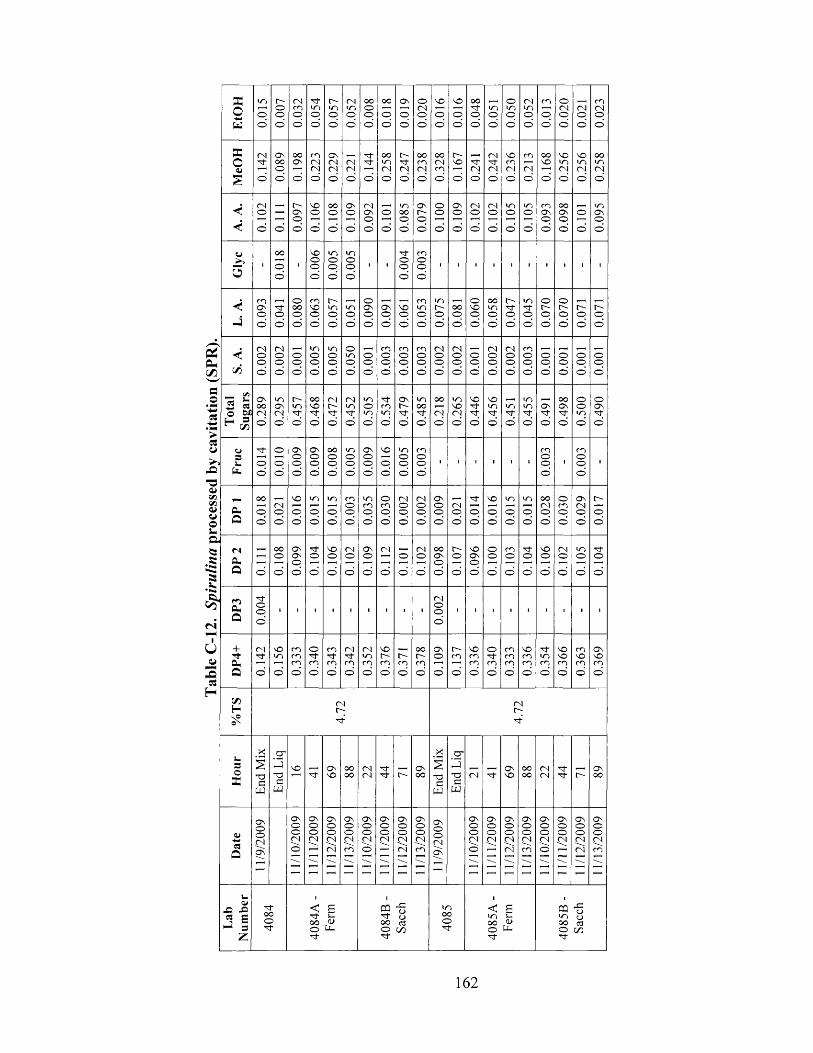
Cm
w
flo• Pp+ PCS+ P• Pp
k
o
X !
0 )
o «0>Wos .oj«
. «*csa&N
•l»»
( N
<a>2H
Wo-ww
33o<u
<5
> »
3
J
c /5
<«s-3(9fl3C/3
CUQ
fsO'o
O
+- to .Q
C/3Hx °CT'
3Oas
«Q
cuX XI« E|- 1 3z
oo
NO■o
crX
T3C
w
ON
o
ONo
oo
oooo
r-~t o"3-
O nOO
ONONO
00o
NOOO
t oOo
ON( N( N
O
( Nr -
o
o■^t
O nO
<Nr -
O nNO
< s• J- (-,OO rUo (-M
oo
^ r
< ooo
oONo
ot o
ONoo
ONo
moo
<Nt o
<NO
oo
O nr-~
o
<NOo
o
<N<N
ONOo
NO3-
r-o
o©
cr"Oc
w
ooo^t
<Noo
o■*r
©o
o
to©
<Nt"-
ONNO
t-o
NOto
o(NO
NOto(N©
ooO nO
OO
00CNO
ONo
or -o
oo©
ooO n■ r©
mooo
oo©
o
ONNO
O nO O (N
cq -gto U OO 03 O C/3 "tt
162
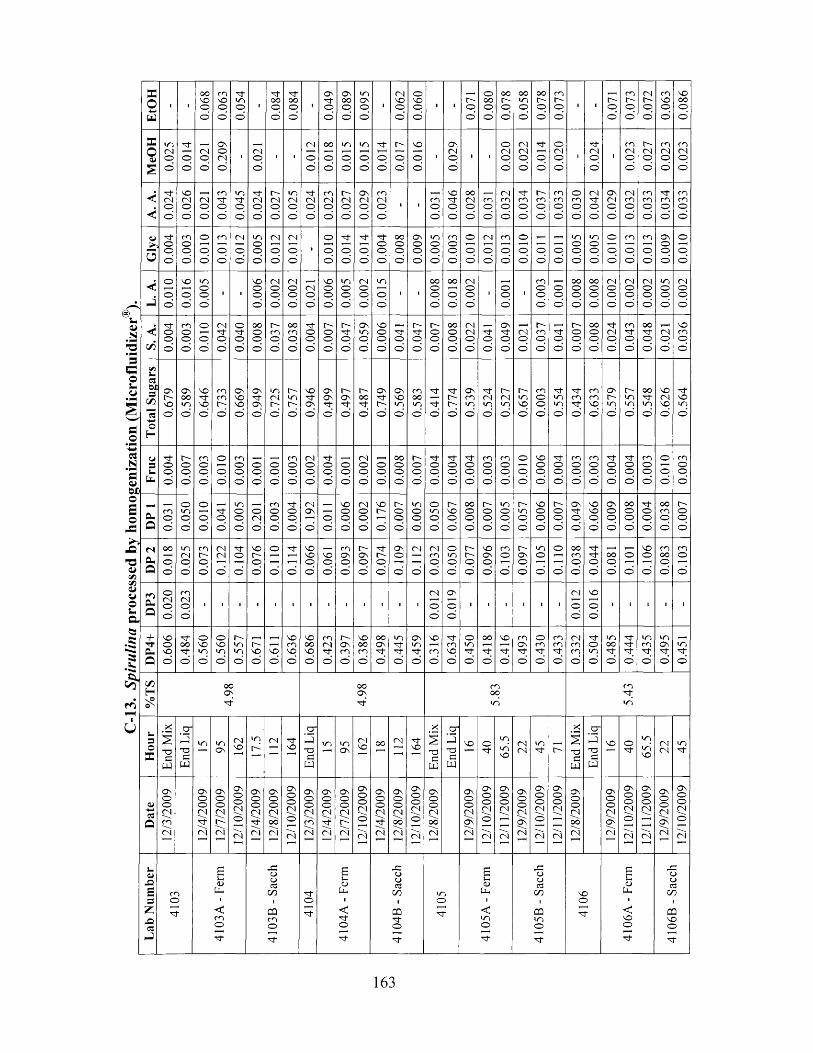
C-1
3.
Spiru
lina
proc
esse
d by
hom
ogen
izat
ion
(Mic
roflu
idiz
er®
)E
tOH
■ ■
8900 0.06
31
0.05
4
■
- to o©
© 0.08
4
■
0.04
90.
089
0.09
5
■
1 0.
062 0900 I i
0.07
1 ©o o©
©
o oN©
© 0.05
8 o oN©
© 0.07
3
■ ■
0.07
10.
073
0.07
20.
063 980
0
MeO
H i nCN©
©
' t
oo
( NO
©
ON©( N©
i CN©
©
1 ■
CN
©
©
o o
©
©
i n
©
©
i n
©
©
' t
©
©
N
©
©
NO
©
©■
ONCN©
©
■ ■
©CN©
©
<NCN©
©
©
©
©CN©
©
■
• c tCN©
©
■
cn( N©
© 0.02
7 cnCN©
©
cnCN©
©
<<
' tCNo©
NOCNo©
CN©
©
cn' t©
©
i n' t©
©
^ r( N©
©
N( N©
©
mCN©
©
' t( N©
©
cnCN©
©
I NCN©
©
ONCN©
©
cnCN©
©• i
cn©
©
NON -©
©
o oCN©
©
cn©
©
CNcn©
©
^ tcn©©
Ncn©© 0.
033 ©
cn©
©
CNN "©
©
ONCN©
©
CNcn©
©
cncn©
©
' tcn©
©
cncn©
©
Giv
e ^ t
§©
cno©©
©
©©
cn©©
CN
©©
i n©©©
CN
©©
CN
©©
■
©
©©
' t
©©
' t
©©
©©©
OO©©©
ON©©©
m©©©
cn©©
©
©
©
©
CN
©
©
cn©
©
©©©
©©
©©
i n©©©
i n©©©
©©© 0.
013 cn
©©
ON©©©
©©©
L. A
. o©©
NO
©©
i n©©
©
■ ■
NO©©
©
CN©©
©
( N©©
©
( N©
©
NO©©©
i n©©
©
( N©©©
i n
©
©• 1
o o©©
©
o o
©
©
CN©©©
i ©©©
'cn©©©
©©©
o o©©©
o o©©©
CN©©©
CN©©
©
( N©©
©
i n©©
©
CN©©
©
S. A
. " t -oo©
cnoo©
©
©
©
CN■ 't©
©
©' t©
©
OO©©
©
Nm©
©
o ocn©
©
^ t©©
©
I— © ©
©
N^ t©
©
ONi n©
©
NO©©
©
' t©
©
I NN "©
©
I N©©
©
o o©©
©
( N( N©
©
^ f-©
©
ON' I t©
©
CN©
©
t— cn ©
©
©
©
N©©
©
o o©©
©
' tCN©
©
cn' t©
©
OO
©
©
CN©
©
NOcn©
©
Tota
l Su
gars
O nC"-NO
©
ONOO» n
o ’
NO"x tNO
©
cncnN
©
O nNONO
o ’
O n^ tON
©
i nCNI N
©
Ni nN
©
NO' tON
©
ONON■nr©
I— On
©
t— o o N " ©
O n' tN
©
O nNOi n
©
cno oi n
©
■n-
' t
©
' tI NI N©
ONcni n
©
N "CNi n
©
N -( Ni n
©
Ii nNOc >
cn©©
©
N "i ni n
©
N "cn" t© >
cncnNO
©
ONC^-m
©
r -mi n
©
o oN "m
©
NOCNNO
©
' tNOi n
©
Fruc o
o©
r-~oo©
cn©©
©
©
©
©
cn©©
©
©©
©
©©
©
cn©©
©
CN©©
©
' t©©
©
©©
©
CN©©
©
©©
©
o o©©
©
t— © ©
©
©©
©
©©
©
' t©©
©
cn©©
©
cn©©
©
©
©
©
NO©©
©
N -©©
©
cn©©
©
cn©©
©
©©
©
©©
©
cn©©©
0100
cn©©©
DP
I cn©©
oi n©©
©©©
©©
i n©©©
©CN©
cn©©©
©©©
CNON
©©© 0.
006 CN
©©
©
NOI N
©
N©©
©
i n©©
©
©i n©
©
I NNO©
©
OO©©
©
t— © ©
©
i n©©
©
C— i n ©
©
9000
N©©
©
ONN "©
© 0.06
6 ON©©
©
OO©©
©
N -©©
©
0 0cn©
©
©©
©
DP
2 o o
o©
i nCNo©
cnI N©
©
(N(N
©
" t©
©
NON©
©
oir
o
0.11
4 NONO©
©
NO©
©
cnON©
©
I NON©©
' tN©© 0.
109 CN
©
(Ncn©©
©i n©©
II— © © 0.
096 cn©
©
NON©
©
o©
©
©
OOcn©
©
' tN -©
©
OO©
©
©
©
NO©
©
cno o©
©
cn©
©
DP
3 oCNo©
m(N©
©
i ■ ■ i 1 ■ • > 1 ■ i ■ iCN
©
©
ON
©
©
1 ■ ■ 1 i '
CN
©
©
NO
©
©
1 1 ■ ■ ■
DP
4+ NOoNO
©
I to o' t
©
©NOi n
©
©NOi n
©
Ni ni n
©
NNO
©
NO
©
NOcnNO
©
NOOONO
©
CO( N
O
NONcn©
NOOOcn©
OOON' t©
i n■ f■ t
©
ONi n' t
©
NO
cn©
" tcnNO
©
©m' t
©
o o
©
NO
©
cnON■^t
©
©CO
o
cncn
©
CNcncn©
' t©i n
©
i no o' t©
N "N "' t©
i ncnN t©
i nON' t©
m■*t
©
%T
S o oON
' t
OOO n
t
cno o
i n
cnN -i n
| H
our
End
Mix
End
Liq
i n i nO n
CNNO
i n
I N(N
NO
End
Liq
uo mON
CNNO OO CN
NO
End
Mix
End
Liq
NO ©N-i n
i nNO
CNCN
t nN
End
Mix
End
Liq
NO ©N"i ni nNO
CNCN
i nN"
Dat
e12
/3/2
009
12/4
/200
9 O n©©CNr~-CN
12/1
0/20
0912
/4/2
009
12/8
/200
912
/10/
2009
12/3
/200
912
/4/2
009
12/7
/200
912
/10/
2009
12/4
/200
912
/8/2
009
12/1
0/20
0912
/8/2
009
12/9
/200
912
/10/
2009
12/1
1/20
0912
/9/2
009
12/1
0/20
0912
/11/
2009
12/8
/200
9
12/9
/200
912
/10/
2009
12/1
1/20
09
j12
/9/2
009
12/1
0/20
09
Lab
Num
ber
cn©' t
4103
A -
Ferm
4103
B -
Sacc
h
•n-©
4104
A -
Ferm
4104
B -
Sacc
h
i n©" t
4105
A -
Ferm
4105
B -
Sacc
h
NO©N"
4106
A -
Fenn
4106
B -
Sacc
h
163
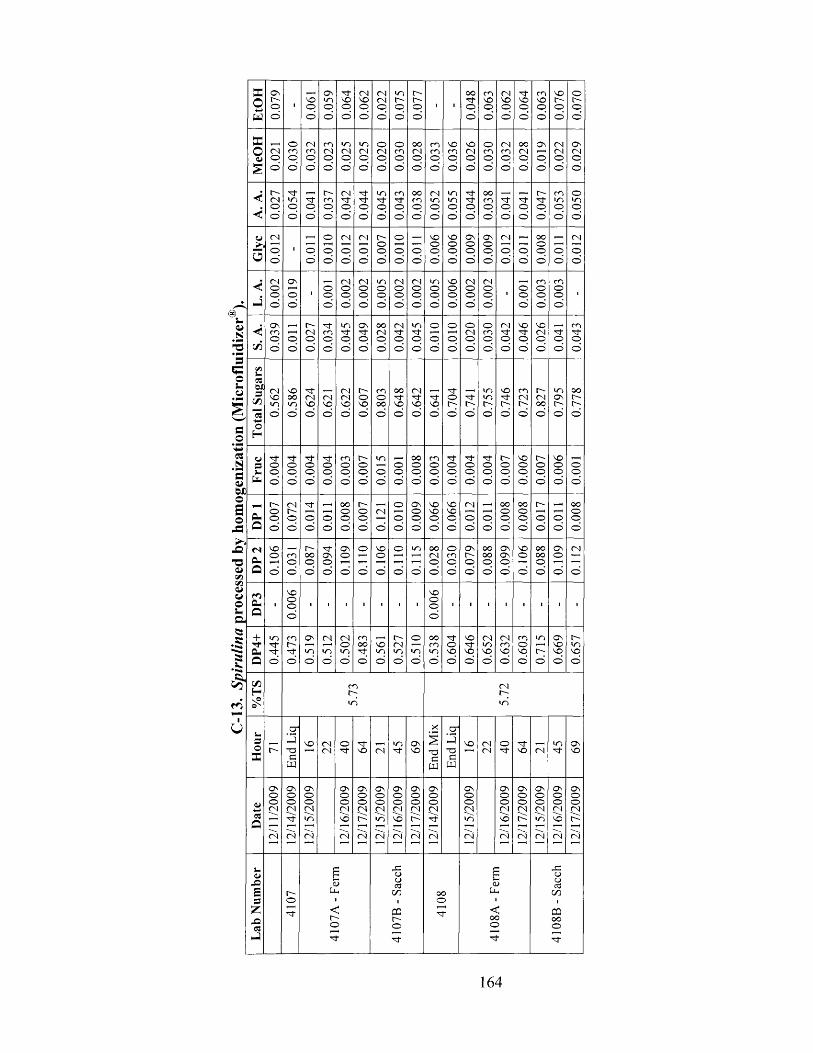
(§>u.a3*3©3-iU
G#ocs.ag<ubJDLo3o
p fl
pO
0)a>CJo3 -a52
*5sI-
r6
0.0
79
'NOod 0
.05
9 n rNOod 0
.06
2
0.02
20
.07
5
0.0
77
i io on roo 0
.06
3
0.0
62 n r
NOoo
£9
00
NOO 'pd 0
.07
0
O CN c n i n i n o o o o c n NO NO o 04 00 O n 04 O n04 c n c n CN 04 04 04 c n 04 c n c n 04 c n c n 04 04 04O p o o o O o o o p p o o o o o o oo ’ o ’ o ’ d o ’ o ’ o ’ c> o ’ o ’ o ’ o ' o o o d d d
r - n r o~ CN ' t i n c n o o 04 i n n r o o O ' c n o04 «n n r c n nT n r N t n r c n i n i n n r c n nT n r n r un i np o O p o o o o O p o o o p o o p oo ’ o ’ o ' o ' o ’ d o ’ o ’ o ’ o ’ o o ’ o ' o ’ o ’ o ’ o ’ o ’
04 _ o CN 04 O ' o NO NO ON ON 04 oo 04T—1 o r—H o o o o r—H 1—I o t—I 1—H
O i o o o o p o o o o o o p o o p od d d d d d o o o o o o o o d d d
0 4 ON (N 04 m 04 04 i n NO 04 CN ___, c n c nO o o o o o o o o o o o o oo o 1 p o o o o o o o o o 1 o o o 1d d d d d d o o o o o o o d d
ON o~ n r i n ON o o 04 i n o o o o 04 NO NO c nc o 1—1 CN c n n r n r 04 n r n t r-H 0 4 c n nT n r 04 n r n ro o O o o o o p O o o o o o o o o od d d d d d d o o o o o o o o d d d
CN NO n r CN o - c n oo 04 n r i n NO c n O ' i n o oNO oo CN (N <N o o n r nT nT o nT un nT 04 04 ON O 'i n >n NO NO NO NO o o NO O NO O ; O ' O ; O ' 0" o o O ' O 'd d O O d d d O o o o o o o o d d d
n r n r nT ' i t c n O ' un 00 c n n r nT n r O ' NO O ' NO ,__,o o o o o o r—1 o o o o o o o o o o op o o p o p o o p o o o p o o o o od d d d d d d o o o o o o o d d d d
r - CN n r o o O ' o O n NO NO 0 4 o o oo O ' _ l o oo O ' 1—I o o CN O NO NO .—< o o oo o o o o o o O p o o o p o o o od d d d d d d o O o o o o o d d d d
NO ,__, o - n r ON o NO o i n o o o ON o o ON NO oo ON 04o c n o o ON o 1—1 o .“H 04 c n O ' o o ON o o o o —H>—1 o p o '—I 1 1—1 '—1 >—1 o p o o o I—1 o 1 ’—1d d d d d d d o o o o o o o d d d d
NO NOo o
1 o 1 1 1 1 1 1 ■ o 1 1 1 1 1 1 1 1d o
m c n ON CN CN c n O ' o o o nT NO O) 04 c n i n ON O 'n r C" T—l o o o NO CN .—» c n o n r m c n o 1—H NO i nn r n r i n m i n n t i n i n i n m NO NO NO NO NO O'; NO NOd d d d d d o o o o o o o o d d d d
c n 04O ;
i n i r i
a- X2 "
,__, P NO (N o n r ____ i n O n % p NO 04 o n r i n ONO ' n 3 r—1 CN n r NO 04 nT NO T3 1—1 04 nT NO 04 n r NO
C £3 cw w w
O n ON ON ON ON ON ON O n ON O n ON On ON O n ONO o o o o o o O O o o o o o oO o o o o o o O O o o o o o o04 CN CN CN 04 04 04 04 04 0 4 04 04 04 04 JN— n f i n o o ^ i n NO O- n f i n o o - m O O ''—1 '—1 1—1 I—1 1 1 >—1 '—1 I—1 '—1 '—1 '-n —ICN CN CN 0 4 CN 04 0 4 04 C4 CN CN 04 CN 04 04' 1 r-H ,—l 1—1 ' 1 ,—l ’ 1 ' 1 T—H T~^ r-H 1—1 ’ 1
U oa> o <D o
cto~ U h C/4 oo pH GOo i o 1•^t < PQ n t < OQr- O ' oo o oo o o o
n r n t n r n r
164
Appendix D
Midwest Laboratories Data Sheets
D .l. - VIMS ATS™ Upper Section Sample from May 2009.............................................166
D.2. - VIMS ATS™ Middle Section Sample from May 2009 ...........................................167
D.3. - VIMS ATS™ Lower Section Sample from May 2009.............................................168
D.4. - VIMS ATS™ Upper Section Sample from June 2009.............................................169
D.5. - VIMS ATS™ Middle Section Sample from June 2009 ...........................................170
D.6. - VIMS ATS™ Lower Section Sample from June 2009.............................................171
D.7. - Spirulina Powder Analysis Results..............................................................................172
165
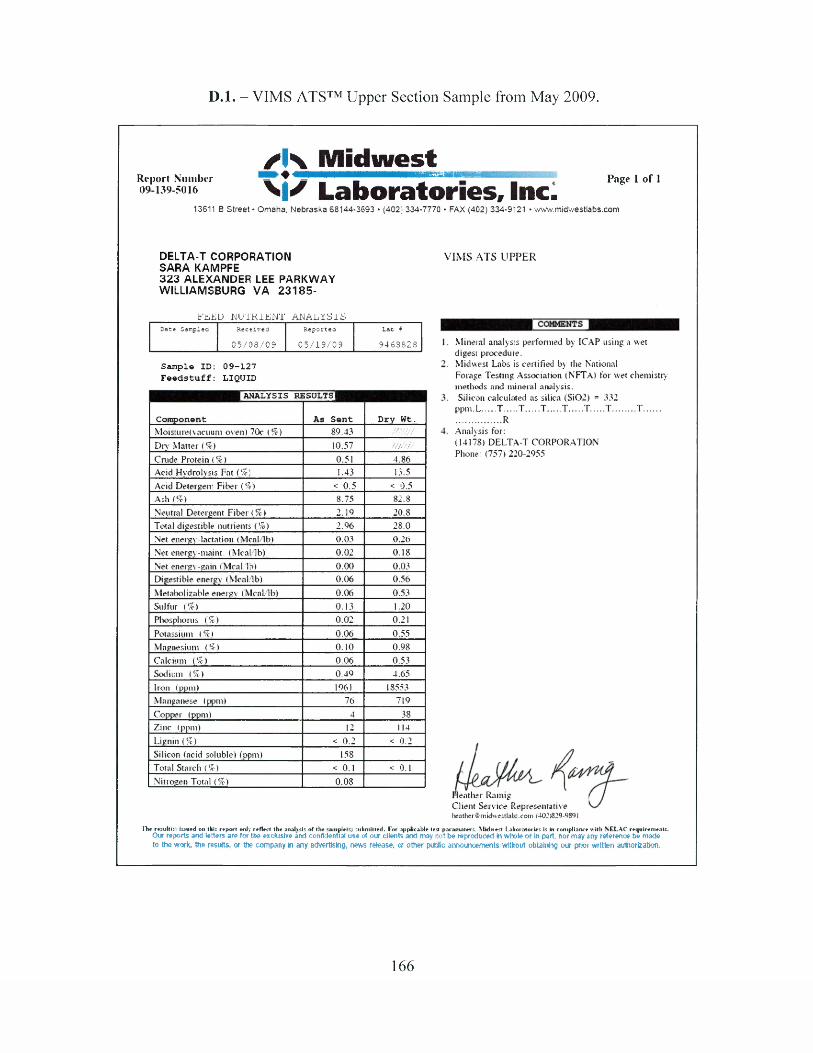
D .l. - VIMS ATS™ Upper Section Sample from May 2009.
✓ K M id w e s tReport Number ♦ • ■ ■ ■ ■ ■ ■ ■ ■ ■ ■ ■ ■ ■ ■ ■ ■ ■ ■ ■ ■ ■ I p a ge j 0 f j
09139-5016 \ | ^ L a b o ra to r ie s , Inc.13611 B Street • Omaha. Nebraska 68144-3693 • (402} 334-7770 • FAX (402) 334-9'21 • www.midwestlabs.com
DELTA-T CORPORATION SARA KAMPFE 3 2 3 ALEXANDER LEE PARKWAY WILLIAMSBURG VA 2 3 1 8 5 -
VIMS ATS UPPER
FELD NU'lKiENT ANALYSISDate Sanelea Received Reported Lab #
0 5 /0 8 /0 9 0 5 /1 9 /0 9 9 4 63828
Sam ple ID: F e e d s t u f f :
0 9 - 1 2 7
LIQUID
ANALYSIS RESULTSl
Com ponent As S e n t Dry Wt.Moisture(vacuum oven) 70c (%) 89.43 / / / / / / /Dry Matter (%) 10.57 / / / / / / /Crude Protein (9c) 0.51 4.86Acid Hydrolysis Fat (%) 1.43 13.5Acid Detergent Fiber (%) < 0.5 < 0.5Ash (%) 8.75 82.8Neutral Detergent Fiber (%) 2.19 20.8Total digestible nutrients (9c) 2.96 28.0Net energy-lactation (Mcal/lb) 0.03 0.26Net energy-maint. (Mcal/lb) 0.02 0.18Net energy-gain (Mcal/lb) 0.00 0.03Digestible energy (Mcal/lb) 0.06 0.56Metabolizable energy (Mcal/lb) 0.06 0.53Sulfur (%) 0.13 1.20Phosphorus (%) 0.02 0.21
Potassium (9c) 0.06 0.55Magnesium (%) 0.10 0.98Calcium (%) 0.06 0.53Sodium (%) 0.49 4.65Iron (ppm) 1961 18553Manganese (ppm) 76 719Copper (ppm) 4 38Zinc (ppm) 12 114Lignin (%) < 0.2 < 0.2Silicon (acid soluble) (ppm) 158Total Starch (9c) < 0.1 < 0.1Nitrogen Total (%) 0.08
Mineral analysis performed by ICAP using a wet digest procedure.Midwest Labs is certified by the NationalForage Testing Association (NFTA) for wet chemistrym e t h o d s a n d m i n e r a l a n a l y s i s .
Silicon calculated as silica (Si02) = 332ppm.L T T ........ T T T T .........T...............................RAnalysis for:(14178) DELTA-T CORPORATION Phone: (757) 220-2955
leather Ramig Client Service Representative heathcrdmidweitlab-.com (402>829-9391
Th* result!:) issued on this repo rt on!) reflect the analysis of the sainpie(s) subm itted. For applicable test paraiuaters. Midwest Laboratories is tat compliance with NCLAC requirem ents.Our reports and letters are for the exclusive and confidential use of our clients and may not be reproduced in whole or In part, nor may any reference be made to the work, the results, or the company in any advertising, news release, or other public announcements without obtaining our prior written authorization.
166

D.2. - VIMS ATS™ Middle Section from May 2009.
/ K M id w e s tReport Number j * * * * * * * * * * * •• • *' , Page I of 1>1/ Laboratories, Inc.09-139-5017
13811 B Street * Omaha. Nebraska 63144-3893 • <4021 334-7770 * FAX (402) 334-3121 • www.nnkhyestlabs.ccm
DELTA-T CORPORATION GARA KAMPFE 3 2 3 ALEXANDER LEE PARKWAY WILLIAMSBURG VA 2 3 1 3 5 -
VIMS ATS MIDDLE
ANALYSIS RZ CULTSI
F Z Z D N U T R IE N T ANAL 1 3 I S• i ;s ••rpl.fl Siss sir: a Sssesss i a>> t
0 5 / D3 /3 3 0 5 /1 9 /0 9 943 3 8 2 ?
S a m p le 2 2 : 0 3 -1 2 8E'e&ds c u f f : LIQUID
C om ponent As Sent. Dry w t.Moisture/vacuum overt 70c 1ft) 38.54 / / / / / / /D n 1 Matter ( f t) 11 46Crude Protein (ft) 0 .6S 5.97Actd Hydrolysis Fat (ft) 0.32 7. ISAcid .Detergent Fiber (ft) 4 C.5 * 0.5Ash (ft) 7.37 63.3Neutral Detergent Fiber | ft) 1.64 14.3Total digestible nutrients (ft) 3.91 34.8Net enrrgv-lact at-.on i McaL lb) 0.04 0.33Net energy-mairst. (McaUb) 0.03 0.26Net encrgy-gs-.n (Mcal/lb) 0.01 0.09Digestible energy (Mcal/lb) O.OS 0.68Metabolisable energy (Mcal/lb) 0.07 0.65Sulfur (ft) 0.09 0.33Phosphorus ( ft f 0.02 0.14Potassium (ft) 0.05 0.44Magnesium (ft) 0.10 0.39Calcium (96) 0.04 0.36Sodium (ft) 0.47 4.12Iron (ppm) 19 85 17321Manganese (pram) 00 735Copper fppm) J 26Zinc (ppm) 12 105Lignin (ft) < 0.2 < 0.2Silicon (actd soluble) (ppm) 9 0 9Total Starch (ft) < 0.1 < 0.1Nitrogen Total (ft) 0.11
1. Mineral analysis performed by ICAP ucing a wetdirest procedure.
2. Midwest Labs is certified b y the NationalForage Testing Association (NFI'A) for wet chemistry methods and mineral analysis.
3. Silicon calculated a s silica (Si02) = 210ppcn-L T T T T T T..........T ..................... K
4. Analysis for: (14178) DELTA-T CORPORATION Phone: (757) 220-2955
Heather Karr.tf /leather Rarr.ig Client Service Representative hea h erf i m iiw w flste.M T . 14CC;S2t>-OjQ I
1X4 n M R ftt i s j m m nils - t o t - ea ly r«T *n Oh u u m i s sf t f t t sn m p eiri asM aM td f a r t » i i : a B * tsa p i r s n s t s r : . M im a L a tw a te n u B In n a f U i a « s l i N ElA C r»qiiiriir.*nr:Our reports and Lit sty m k t th# «tdusiwf ami certWenfeil use <4 ,>ut cforih and may not w reproduced it wholu or in part, wot TOy any whrenow b# mMte to tie pratt, ti* tncute. or ft# company in any adh«Hsir$. m m rftMMt of otwr puWfe arm«HK»ftwnt$ without obtaining am print written autwrBaton.
167
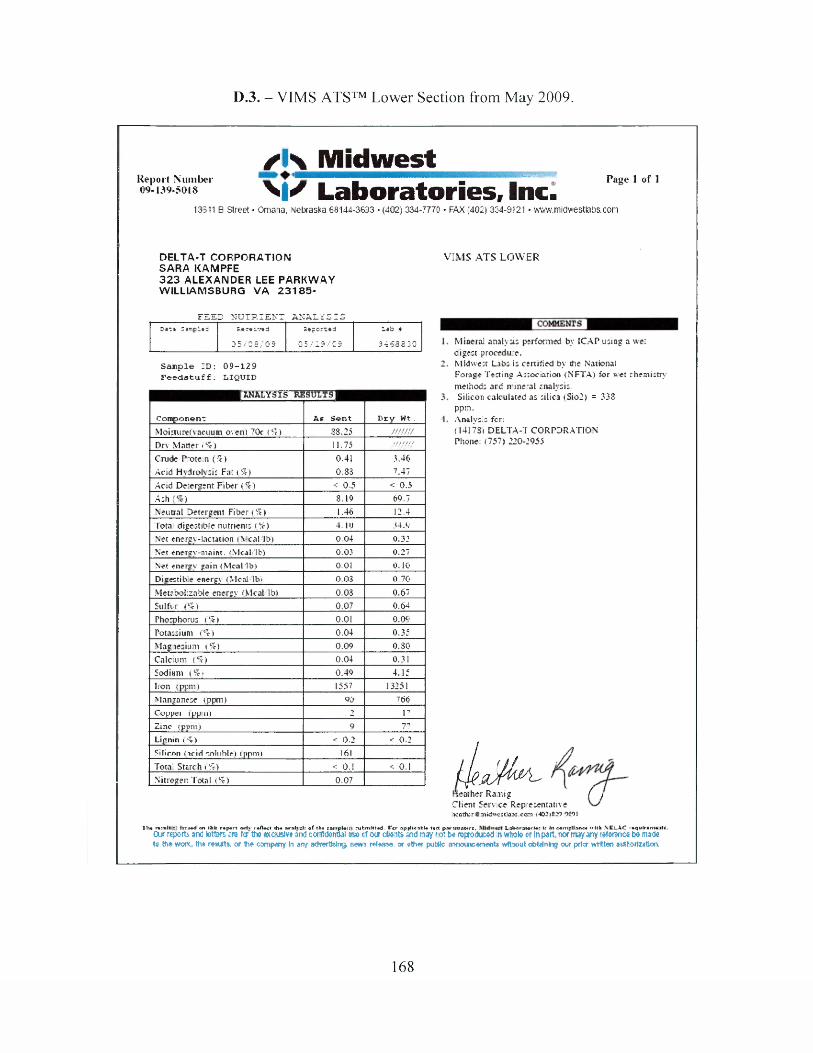
D.3. - VIMS ATS™ Lower Section from May 2009.
S H M id w e s tR eport N um ber m mmmmmmmKmm Page 1 o f 109-139.50.8 \ | / Laboratories, Inc.
13511 B Street • Omana, Nebraska 68144-3633 • (402) 334-7770 • FAX .402) 334-9121 • www.midwestlabs. con
DELTA-T CORPORATION SARA KAMPFE 3 2 3 ALEXANDER LEE PARKWAY WILLIAMSBURG VA 2 3 1 8 5 -
VIXlS ATS LOWER
F E S D N U T R IE N T A N A L Y S ISD»tt 3BTpl%3 R«c«iv*d Sepor-«d Lab a
0 5 /0 8 /0 9 0 5 / 1 9 / C9 9468330
Sam ple ID: 0 9 -1 2 9 F e e d s t u f f . L IQ U ID
I ANALYSIS RESULTS !
Component As S en t D ry W t .
Moisturet vacuum oven) 70c (% 1 88.25 / / / / / / /
Drv Matter <%) 11.75 // / / / / /Crude Prote.n (%) 0.41 3.46Acid Hydroly sis Fa: (%) 0.83 7.47Acid De:ergent Fiber (% ) < 0.5 < 0.5Ash ) 8.19 69.7Neutral Detergent Fiber {%) 1.48 12.4Iota, digestible nutrients ( Vc) 4.10 34.VNet energy-lactation (Mcal/lb) 0.04 0.32Net encrgy-mnint. (Mcal/lb) 0.03 0 .2"Net energy gain (Mcal/lb) 0.01 0.10Dicestib e energy (Mcal/lb) 0 03 0.70Metabolizable energy (McaHbl 0.03 0.67Sulfiir <%) 0.07 0.64Phosphorus (%) 0.01 0.09Potassium (%) 0.04 0.35Magnesium ( %) 0.09 0.80Calcium (%) 0.04 0.31Sodium (%) 0.49 4.15Iron (ppm) 1557 13251Manganese (ppm) 90 766Coppei ippiii) 2 17Zinc (ppm) 9 77Lignin (S )
<N6V c 0.2Silicon (acid soluble) ippmi 161
Tota Starch (%) < 0.1 < 0.1Nitrogen Total <%) 0.07
Mineral analysis performed by ICAP using a we: digest procedure.Midwest Labs is certified by the NationalF o r a g e T e s t i n g A s s o c i a t i o n ( N F T A ) f o r w e t c h e m i s t r y
meihods ard mineral analysis.Silicon calculated as silica (Sio2) = 338
ppm.Analysts fcr:(14178) DELTA-T CORPORATION Phone: (757) 220-2955
ije d h '^Heather Rarsig ( IClient Service RepresentativeKothcr<S midNvc5i3a>3.ccm <402)820 *>£01
11m r*:ult:- i;:j«d oo thk r*p«rt orrlv rtfUct th« aratlt :l: of th« ;artpk<rt rubmittod. Fcr applicabU tort parimatwrc, LaborawrU: t: In compliant* nltfc \C L XC roqulrom* rtrOur reports and letters are (cr the asciuslv® and corftctermai ess o! out clients and nay rot be reproduced in whole or In part, nor may any reference be made ts tfte wait, the results, or the company in any adwcttetng, news release, or ether puttfc avmncenento wttsout obtaining our pritr written auttorteatlon.
168
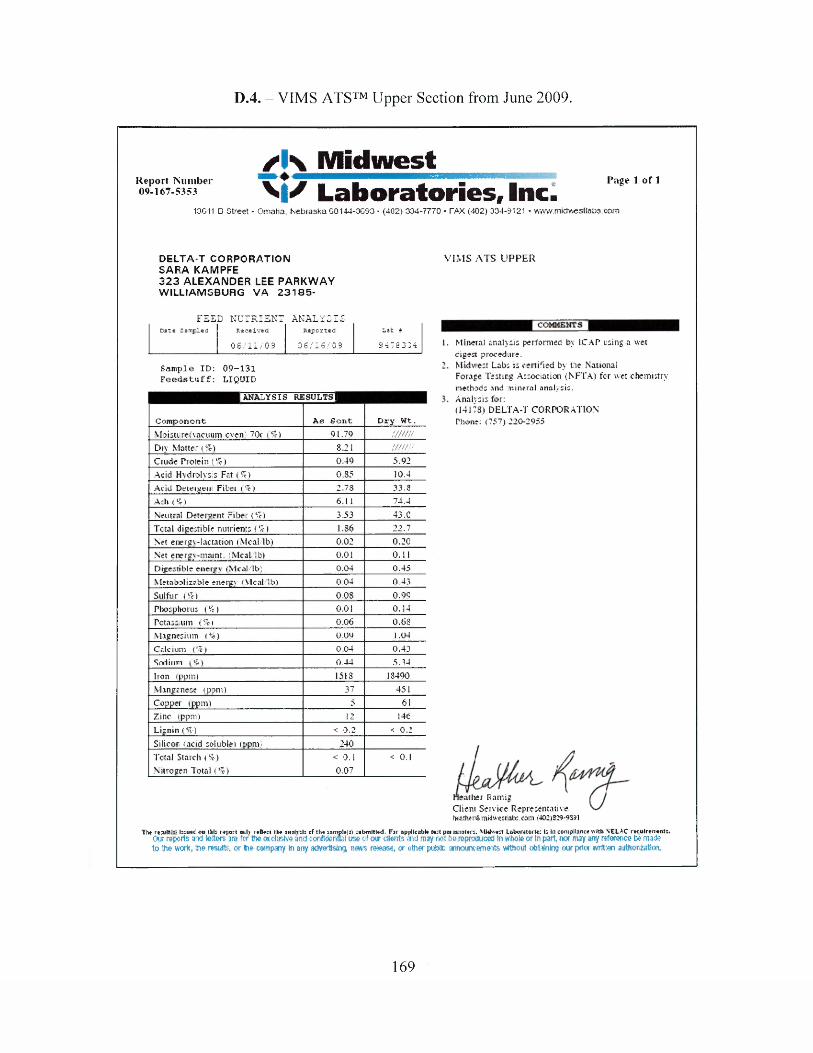
D.4. - VIMS ATS™ Upper Section from June 2009.
/■Iv MidwestReport N um ber " T ' X m m m * m ■ • ra g e 1 o f 1om*7.sm3 \ | / Laboratories, Inc.
130 It D Street • Omaha, Nebraska G0144-0090 • (402) 334-7770 - TAX (402) 334-9121 - WAW.midvvest1ab3.com
DELTA T CORPORATION SARA KAMPFE 3 2 3 ALEXANDER LEE PARKWAY WILLIAMSBURG VA 2 3 1 8 5 -
V IM S A T S U PP E R
F S S D NU TR IEN T A N A L Y S ISDan* Sarrpled R *c«iv td Reported Lah 4
0 6 / 1 1 / 0 9 0 6 / 1 6 / 0 9 3 4 7 8 3 7 4
Sam ple ID: 0 9 -1 3 1 F e e d s t u f f : LIQUID
I ANALYSIS RESULTS I
Com ponont Ae S o n t D ry Wt.Moisture! vacuum oven) 70c (ft) 91.79 m m /Div Matter (ft) 8.21 i/m /Crude Protein (ft) 0.49 5.92Acid Hydrolysis Fat (ft) 0.85 10.4Acid Dcteigeiu Filei (ft) 2.78 33.3Ash (ft) 6.11 74.4
Neutral Detergent Fiber (ft) 3.53 43 .CTctal digestible nutrients (ft) 1.86 22.7Net energv-lactation (Mcal/lb) 0.02 0.2CNet energy-maint. (Mcal/lb) 0.01 0 .1 1Digestible energy (Mcal/lb! 0.04 0.45Metabolizable energy (Mcal/lb) 0.04 0.43Sulfur (ft) 0.08 0.99Phosphorus (ft) 0.01 0.14Potass um (ft) 0.06 0.68Magnesium (ft) 0 .0V 1.04Calcium {%) 0.04 0.43Sodinrr (ft) 0.44 5.34Iron (ppm) 1518 18490Manganese ( p o m ) 37 451Copper ( p p m ) 5 61Zinc (ppm) 12 I4CLiznin ( ft) < 0.2 < 0.2Silicon (acid soluble) (ppm) 240Tctal Starch ( f t) < 0.1 < 0.1Nitrogen Total (ft) 0.07
Mineral analysis performed by 1CAP using a wet digest procedure.Mid vest Labs is certified by the NationalForage Testing Association (NFTA) fcr wet chemistrymethods and mineral analysis.Analysis for:(14178) DELTA-T CORPORATION Phone: (757) 220-2955
eather Pam is Clieni Service Representative heather® mktwestata.com (402)329-9391
I ht remit.;■ l::ut< on llili report or.lv reflect the nnalv :l: cf the ;ampl?!si cebiultted. Far applicable teit par .waters, \ H w t t Laboratorle: is In comp lance with VELAC reculrenient:Our reports and letter* m for tf® «c!wlw and s<mft#nwf use of oar clfente and may net be reproduced ft whole or In part, nor may any referent® t» matte to the work, the results?, or he company in any adwWna news release, or other pubifc annountemette without ctriatnlng our prior written arthoriaOcn.
169
D.5. - VIMS ATS™ Middle from June 2009.
/ I \ MidwestK .p ort \u m b t r " > ♦ 11. ' T 1' . , P » " ] o f lo»-i6740*4 \ | / Laboratories, Inc.
13-811 B Street - Omaha. Nebraska 63144-3683 • {402} 334-7773 - FAX {402) 334-8127 • *wKW.midw®Klates-com
DELTA-T CORPORATION SARA KAMPFE 3 2 3 ALEXANDER LEE PARKWAY WILLIAMGBURG VA 2 3 1 5 5 -
VIMS ATS MIDDLE
ANALYSIS RE501531
F E S D N U TRIENT A N A L Y SISDstc. 5*!?pl<cd JSccc arc«d Ecportcd lab ♦
0 6 /2 1 /0 3 Q6 /1 6 /0 9 94 7 8 3 2 5
Sam ple ID ; 0 9 -1 3 2F e e d s t u f f : LIQUID
Com ponent As S e n t Dry w t.Moisture/vacuum oven) 70c (%) 95.09 fjf / fj /D n Matter (® ) 4.91Crude Protein { 4c( 0.27 5.44A c i d Hydrolysis Fat {&) 0.55 I t . 1A c i d Detergent Fiber (*») 2.10 42.8Ash ! % ) 3.41 69.4Neutral Detergent Fiber 2.59 52.9Total digestible nutrients (951 1.23 25.1Net energy-lactation (Mcal/lb) 0.01 0.22Net energy-maint. (McaLlb'i o.ot 0.14Digestible energy • Mcal/lb* 0.02 0.50Metabolisable energy (Mcal.'lb) 0.02 0.48Sulfur (41) 0.06 1.31l'hosphoru: ($?) < 0.01 < 0.0 iPotassium (H) 0.05 0.96Magnesium (%) 0.08 1.56Calcium (ft) 0.03 0.56Sodium {%) 0.50 30.2Iron (ppm) 820 17312Manganese <ppmi n7 550Copper ippirs) 3 61I I I . £ “ <« 7 143Ls gnin (91) < 0.2 < 0.2Silicon (actd soluble) (ppm) '239Total Starch (So) < <0 .1 < 0 1Nitrogen Total (%) 0.04
Mineral: analysis performed by ICAP using a wet digest procedure.Midwest Labs is c e it t f a d bv the NationalForage Testing Association (NFTA) for -wet chemistry*methods and mineral analysis.Analysis far:(145 78) DELTA-T CORPORATION Phone: (757) 220-2955
leather RamigC heist Sen ice Representative tu - i ih e r e m i d » - « t 1a.fcs e o r , 14 0 2 ) 2 2 9 -9 3 9 I
T h * r t s s l t i s i is s rn d t isi ^u b m le tad F o r ip p lk o K * i s s t M r s r s iK s r : , M id - s s t L n b o r a io r is : t lit !*:sh N E lA C r t q u l r i r r « n t :— Tow mf » t IsswproduwdiRwhate win part *«r«w|'8?f r ^ s r w t lw s t *
t» #!# -wmk, tw result*, or the company in any adwising, mm ntait*. or ot»r pubic xmmawrNnts wWwut efe tailing m p 4 r wfcton swttediatas.
H H H P H b m ! o n t h l : r i p s d s d * i d W t th * im a lv jl i s f th * : « m f l* u iOur reporti ana w orn m ter Hw awtohre and ca n fifcm z! uu> of <
170
D.6. - VIMS ATS™ Lower Section from June 2009.
S l\ MidwestR eport Num ber * S P ^ ~m _ , Page 1 of I09-167-5355 V |/ Laboratories, Inc.
13811 5 Street • Omaha. Nebraska 68144-3683 • (402) 334-7770 * FAX (402) 334-9121 » wiW'A'.niictaiesilates.com
DELTA-T CORPORATION SARA KAMPFE3 2 3 ALEXANDER LEE PARKWAY WILLIAMSBURG VA 2 3 1 S5-
V IMS ATS LOWER
ANALYSIS RESULTS |
FES D NUTRIENT ANALYSISZmzz —•”?!“d GUnivc4 X*b *
O S/11 /09 C6 /1 6 /0 3 9412136
C anp le I3> : 09 -1 3 3F e e d s t u f f : LIQUID
com ponent As s e n t D ry wts.Moistureivacitum oven) ?0c i ft) 94.62Dr. Matter (56) 5.05Crude Protein (ft) 0.23 4.57Acid Hydrolysis Fat (ft) 0.42 8.33Acid Detergent Fsber (ft) 2 .0+ 40.1Ash (ft) 3.65 71 SNeutral Detergent Fiber f ft) 2.30 +5.3lotal digestible nutrients (ft) I.C6 20.9Net energy-lactatson (Mcal/lb) o.oi O.ISNet energy-maint. (Mcal- tb) o.co 0.09Digestible energy (Mcallb) 0.02 0.42Metabolisable energy (Mcal/lb) 0.02 0.40Sulfur (ft) 0.06 1.19Phosphorus (ft) < 0.01 A O b
Potassium (ft ) O.C+ 0.7SMagnesium (ft) 0.07 1.42Calcium ( f t) 0.02 0.49Sodium ( f t) 0.46 9.07Iron (ppm i 767 15686Manganese ipprr.) 29 571Copper (ppm) 2 39Zinc (ppm) 7 138L:gnin (ft) < 0.2 < 0.2Silicon (acid soluble) (ppm) 213Total Stanch ( f t ) < 0.1 0 .1Nitrogen Total ( f t ) 0.04
1. Mineral analysis performed by (CAP using a wet digest procedure.
2. Midwest Lads is certified by the NationalForage Testing Association (NFTA> for wet chemistry methods and mineral analysis.
3. Analysis for:(14178) DELTA-T CORPORATION Phone: (757) 220-2655
l e a t h e r R a m i gClient Service Representative faeiSlMrS midwertiafes.co® 14CC. 319-9391
rssu U iii ls a » C an t ill: rsj»rt senv rofiwt t lie anal:-::: o f 111* :a m c 34i:> anil d ie : ro t jjp.lkafc$* tsrt Eorjra irars, M M ir ta Labor a le r t s : ts In c a n p M M * w ith N e l A c r tq u lr:n-onr:.O w r t jM r ts a n d W h r s m im ( h a m<Mmm a n d e n n m w f k d u » « o * s l a n t s a n d mtf » « o * m p re d u e a d is w fcela or in p a r t : n o r m a y wf r a f e m r e a m mfa t e t tw wmK th e m a t t e . m f t * c o m f u n y in any a d ra rfM n g , n e w s r# M B * o r « § a r p u b ic a m M M M M ftfe i w t f t o s t e b ta n in g o u r p i e r w r it te n a a f w r i s f c a ,
171
D.7. - Spirulina Powder Analysis Results.
✓K MidwestReport N um ber 111 ■* w m m m m m m m m m P age 1 o f 1
>K Laboratories, Inc.1 0 - 0 2 9 -5 0 4 6
1301! D Street • Omaha, Nebraska GO! 44-3033 - (402) 334-7770 - TAX (402) 334-9121 - vww.micSvvestlabs.com
DELTA-T CORPORATION SARA KAMPFE 3 2 3 ALEXANDER LEE PARKWAY WILLIAMSBURG VA 2 3 1 8 5 -
SPIRULINA POWDER
pi
L‘l D NUTRIENT ANALYSIS
E a r * S a r r p l a c R * r * iv * d R e p o r t e d L ab +
0 1 /2 1 /1 0 0 1 /2 9 /1 0 9550596
Sam ple ID: F e e d s t u f f :
1 0 -1 0 1FINISHED FEEDS
I ANALYSIS RESULTS I
Com ponent A s S o n t D ry W t .
Moisture (% 1 8.59 / / / / / / /Dry Matter (%) 91.41 / / / / / / /Crude Protein (%) 70.2 76. SCrude Fat (%) 5.74 6.28Acid Deteigenl Filtei (%) < 0.5 < 0 .3
Ash ( « ) 6.51 7 .1 3
Neutral Detergent Fiber (55) 1.70 1.86
Total digestible nutrients (%) 70.8 77.4Net erergy-lactation (Mcal/lb) 0.74 0.81Net energy-maint. (Mcal/lb) 0 .7 6 0.83Net encrgy-gain (Mcal/lb) 0.51 0.56Digestible energy (Meal/lb) 1 42 1.55Metabolizable enetjrv (Mcal/lb) 1.14 1.25Sulfur (%) 0.93 1.02Phosphorus ( 5 ) 1.17 1.28Potassium (%) 1./2 1.89Magnesium (%) 0 .3 3 0 .3 6
Calcium (9-) O.I7 O PScdium (%) 1.07 1.17
Iron (ppm) 741 811Manganese (ppm) 32 35Copper (ppm) 1 1Zinc ippm) 7 8Lignin 1 %) < 0,2 < 0.2Total Starch (%) 2.70 2.95Nitrogen Total (%) 11.2
Mineral analysis performed by 1C AD using a v e t digest procedure.Midwest Labs is certified by the NationalForage Testing Association (NFTA) for wet chemistrymethods and mineral analysis.Total starch value includes all hydrolyzable carbohydrates.Analysis for:(14178) DELTA-T CORPORATION Phone: (757) 220-2955
heather Ramig Client Sen ice Representative hea th e r® m id w es tlab s .co m 1402>829-9391
th e r r a d l f s l l s w t on tkfc repo rt oiilv reflect til* a n c h : t ; ef th* sa«nple<a) subm itted. Tor oppllc.ib* t e a param eter:, M ldv'e:t Laborito rle ; 1: In com pliance w ith N'ELAC requirem ent;.Our reports and tetters are tar the exclusive and cenSdsnfel use of cwr dterrts a r t may not be reproduced In whole or In part, nor nay any refsreacs ba mails to ihs work, toe results, or ihe campsny In any acfvertJslrtg, n m release, or other puWlc announcements vtithoi! obtaining our pilot written authorization.
172
VITA
Name:
Date and Place of Birth:
Education:
Presentations:
Honors and Awards:
ProfessionalExperience:
Sara Katherine Kampfe
June 14, 1984Celina, Ohio, United States of America
Bowling Green State University, May 2006 Bachelor of Science, Chemistry American Chemical Society Certified GPA: 3.53 of 4.00
College of William and Mary, May 2010 Candidate for Master o f Science, Chemistry GPA: 3.83 of 4.00
Graduate Research Symposium, March 26-27, 2010 College of William and Mary Poster titled “Processing and Conversion of Algae to Bioethanol”
Presidential Merit Scholarship, 2002University Excellence Grant, 2003Dr. Elliott Blinn Memorial Chemistry Scholarship, 2004Mortar Board Inductee, 2005Incogen, Inc. Award for Excellence in Scholarship in the Natural
and Computational Sciences, 2010
Applied Process Technology International, LLC. (Purchased the Delta-T Corporation in February, 2010) February 2010 - present Chemist
Delta-T Corporation August 2006 - February 2010 Analytical Chemist
173
Related Documents