PROCESS ANALYSIS FOR MATERIAL FLOW SYSTEMS Thorsten Schmidt, David Wustmann, Robert Schmaler Technische Universität Dresden Institute of Material Handling and Industrial Engineering Professorship of Logistics Engineering Abstract This paper describes a generic approach for analysis of internal behavior of logistic systems based on event logs. The approach is demonstrated by an example of event data from the simulation model of an automated material handling system (MHS) in a manufacturing company. The purpose of the analysis is the identification of design and operation problems and their causes, prospectively. As a result, the simulation model developer obtains the condensed and ranked information on events. These events describe the internal system behavior with anomalies pointing at either possible problems or capacity reserves. 1 Introduction The design of MHS is challenging due to high system complexity and heterogeneity. It involves typically elaborate simulations, but the analysis of these simulation results is often limited to the acquisition of global key indicators or needs some educated guess regarding the location of critical elements, respectively. In particular, the detailed knowledge of internal transport processes on sections is usually inadequate. In addition, analysis of these systems at runtime is difficult due to a large amount of monitoring data. Thus, the (automated) in-depth analysis of logistic systems and their internal transport processes during design and operation steps would contribute much to improve their performance. Although the standard tool material flow simulation answers the question if the conceptual design of a system in layout and controlling fits global requirements (e.g. system throughput or cycle time), it does not answer the question of the degree of fulfillment. The internal performance often is only analyzed intuitively or visually by the system developer. Referring to Dangelmaier et al. this analysis mostly depends on the experience of experts and coincidence [1, p.4].

Welcome message from author
This document is posted to help you gain knowledge. Please leave a comment to let me know what you think about it! Share it to your friends and learn new things together.
Transcript

PROCESS ANALYSIS FOR MATERIAL FLOW SYSTEMS
Thorsten Schmidt, David Wustmann, Robert Schmaler
Technische Universität Dresden Institute of Material Handling and Industrial Engineering
Professorship of Logistics Engineering
Abstract
This paper describes a generic approach for analysis of internal behavior of logistic systems based on event logs. The approach is demonstrated by an example of event data from the simulation model of an automated material handling system (MHS) in a manufacturing company. The purpose of the analysis is the identification of design and operation problems and their causes, prospectively. As a result, the simulation model developer obtains the condensed and ranked information on events. These events describe the internal system behavior with anomalies pointing at either possible problems or capacity reserves.
1 Introduction The design of MHS is challenging due to high system complexity and heterogeneity. It involves typically elaborate simulations, but the analysis of these simulation results is often limited to the acquisition of global key indicators or needs some educated guess regarding the location of critical elements, respectively. In particular, the detailed knowledge of internal transport processes on sections is usually inadequate. In addition, analysis of these systems at runtime is difficult due to a large amount of monitoring data. Thus, the (automated) in-depth analysis of logistic systems and their internal transport processes during design and operation steps would contribute much to improve their performance.
Although the standard tool material flow simulation answers the question if the conceptual design of a system in layout and controlling fits global requirements (e.g. system throughput or cycle time), it does not answer the question of the degree of fulfillment. The internal performance often is only analyzed intuitively or visually by the system developer. Referring to Dangelmaier et al. this analysis mostly depends on the experience of experts and coincidence [1, p.4].

In [2] a summary of the currently popular view on the theme "Output analysis for simulations" can be found. They discuss commonly known statistical methods but only use them for the determination of global performance characteristics [cf. as well 3,4]. Bratley et al. [5] explain, for example, how significant estimators can be determined to evaluate the performance of the overall system. These estimators describe how specific characteristics depend on certain global parameters.
The idea of using event data for the analysis of internal system processes is not new. An interesting approach, for example, is presented by Kemper and Tepper [6,7]. They rely on the strong (human) capacity for visual perception of correlations. Though suggestions for aggregating large amounts of data are depicted, the focus is on the representation of the reduced event space with the help of "Message Sequence Charts". Another visual approach, which uses self-organizing feature maps, is described in [8]. The methodologically closest numerical approach to ours can be found in Better et al. [9] . They develop a combination of dynamic data mining and optimization techniques in order to reduce the required number of simulation runs for the optimization of system parameters. The objective therefore is the troubleshooting in the modeling process, but the internal process analysis. A way to model-based process analysis, which is based on the layout of a bottling facility, is discussed in [10]. However, this approach is limited to certain types of errors on the targeted inspection of single components.
In addition to the listed graphically approaches for an internal process analysis based on reduced event data also numerical approaches exist in other domains. In [11] and [12] for example, methods for event-based analysis of business processes are discussed. The focus of "business process mining" in the first instance however, is to create adequate models and recognize relevant process steps.
It should be noted that current methods for various analyses provide very good results. Visual procedures facilitate the analysis and global performance parameters are determined by the means of aggregated data. However, these methods allow no access to single events and thus no targeted search for internal anomalies on sections of automated transport systems.
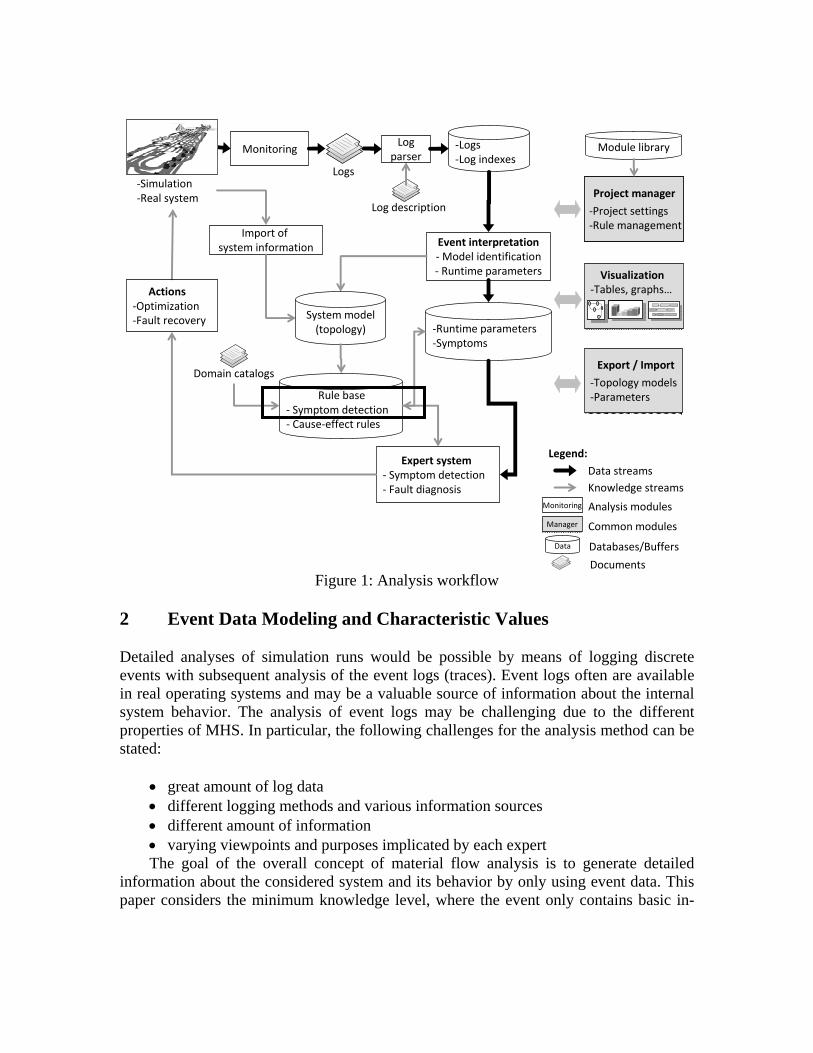
An approach for the numerical analysis of in-house MHS based on information from event data has to fulfill different requirements. Amongst others, the heterogeneous system objectives and system requirements have direct influence on the analysis. For example, total flow is relevant for the assessment of transport processes in a bottle filling machine. For baggage handling systems additionally maximum throughput time is important, for the single bottle this is not significant. A more detailed explanation of the problem and of the overall concept for (semi) automated material flow diagnostics can be found in [13] and [14]. The marking in Figure 1 (rule base – symptom detection) shows the classification in the overall concept of the method module presented in this article.
‐Simulation‐Real system
Log description
Domain catalogs
Project manager‐Project settings‐Rule management
Project manager‐Project settings‐Rule management
Visualization‐Tables, graphs…Actions
‐Optimization‐Fault recovery
Monitoring Logparser
‐Logs‐Log indexes
Rule base‐ Symptom detection‐ Cause‐effect rules
Expert system‐ Symptom detection‐ Fault diagnosis
Event interpretation‐Model identification‐ Runtime parameters
‐Runtime parameters‐Symptoms
Import of system information
System model(topology)
Export / Import‐Topology models‐Parameters
Logs
Module library
Legend:Data streamsKnowledge streams
Monitoring Analysis modulesManagerManager Common modulesData Databases/Buffers
Documents Figure 1: Analysis workflow
2 Event Data Modeling and Characteristic Values Detailed analyses of simulation runs would be possible by means of logging discrete events with subsequent analysis of the event logs (traces). Event logs often are available in real operating systems and may be a valuable source of information about the internal system behavior. The analysis of event logs may be challenging due to the different properties of MHS. In particular, the following challenges for the analysis method can be stated:
• great amount of log data • different logging methods and various information sources • different amount of information • varying viewpoints and purposes implicated by each expert The goal of the overall concept of material flow analysis is to generate detailed
information about the considered system and its behavior by only using event data. This paper considers the minimum knowledge level, where the event only contains basic in-

formation (kernel attributes) and no further characteristics of system elements are known. These kernel event-attributes are namely:
• time stamp of event • identifier of the component where the event was produced • identifier of the load or action that triggered the event This consideration level covers the most basic aspects that are common to all logistic
systems. Along with that, including further event and system information is still possible. Whereas the analysis of results from conveyor system simulations serves as example, the analysis principles are also transferrable to other applications.
To enable the generic analysis of different systems, the system parameters and expert knowledge have to be formalized in a common model. An extended state-transition model for description of the system elements and their runtime parameters is proposed. It is supposed that a state-transition model is a least common denominator of different logistic systems, since it complies with the nature of logistics as a sequence of transportation actions. The extended state-transition model (fig. 2) consists of entities (states, transitions, loads etc.), each of which possesses further runtime parameters.
Runtime parameter of state (e.g.):- Trace time
- Min./Max.- Distribution
- Time in system- Min./Max.- Distribution
- Load counter- Performance index-…
State
Transition
Load
Path
L
P
T
S
Static parameter of state (e.g.):-Vertex degree
- In-degree- Out-degree
- Stress Centrality- Hansen integral accessibility index- …
Sink
Objects
Figure 2: Elements of the extended state-transition-model (eSTM)
Each entity of the model has parameters of the following types:
• Static parameters represent essential properties of the system and do not change over time. Typical static parameters are e.g. identifier, vertex degree (in degree or out degree, i.e. the sum of incoming or outgoing transitions) of the state.
• Dynamic parameters change over time and are calculated in proper time intervals. These are e.g. the transportation time of a load, average inter-arrival time of loads at a state in some time interval and so on.
The static parameters may also describe relations between entities. For example, the
parameters source and destination of a transition describe the corresponding states. Therefore, the set of static relations between entities describes the topological model of the logistic system. Additionally the parameters may represent absolute (e.g. transportation time of load) and relative values, which depend on further parameters. 3 Analysis of Internal Transport Processes 3.1 General Aspects The main objective of the analysis is to identify anomalies on sections in the transport process, although the global parameters of the entire system indicate no wrongdoing. Based on the calculated run-time parameters different rules can be used for detecting symptoms of internal system errors. The rules for detection of suboptimal internal behavior or capacity reserves can be divided in the following types according to the method of their definition:
• threshold-based rules (requires additional meta-information) • anomalies (statistic outliers) • combination of several rules different types
Tests of the parameters and rules for the identification of anomaly events indicated
beside functionality the need to characterize the anomaly events. For a large base of events and a corresponding large number of identified anomalies, the characterization of anomaly events gives detailed information about their relevance to internal behavior. Criteria for the characteristic of anomaly events are for example:
• Differentiation to parameter value (e.g. magnitude of the deviation from normal
behavior or threshold) • Distinction regarding to the place in the material flow system (e.g. primary or
secondary path, network analysis and evaluation of the anomaly location, for example based on the robustness of the graph or by using the theory of complex networks [15,16])
• Anomaly-frequency of moving objects (e.g. the first anomaly event from a transport unit is possibly less critical than the last one)

• Anomaly-frequency of stationary objects (e.g. the first anomaly event on a state, a transition or a path is possibly less critical)
• Anomaly-cluster (e.g. anomaly events on the same object in the time period) The chosen examples show, besides the background of the evaluation step, the
evaluation method has to be object-based, analog to the parameters and identification rules. A more detailed presentation of the evaluation approach can be found in [17]. The anomaly evaluation is strongly associated with the identification step. If several anomalies are detected on different objects a detailed analysis of the selected objects defined for specific periods of time is possible, based on the evaluation results.
Essentially the paper elaborates a rule for the second type (see above) in detail by using an example in capture 3.3. This rule is an adaptation of a method of statistical process control (SPC) on the considered problem and is described in the following chapter. 3.2 Adapted SPC Approach for Anomaly-Identification For the identification of events which differ from normal behavior, a modified quality management approach is proposed. The originally for quality control areas applied SQC method uses random samples from manufacturing processes. These samples together with some statistical devices are thus used to get conclusions about the quality of the processes. If this happens in terms of a process inspection during manufacturing it is called Statistical Process Control - SPC [18, p.27].
SPC differentiates between a process under control and out of control situations. If the process state is stable and therefore its mean values and variances of the characteristic values as well, the process is called under control. However, out of control situations exist when the process state and the distribution of its characteristic values changes significantly [18, p.22-23]. In SPC two different kinds of possible process variations are identified: the common ones, which are unavoidable and not assignable, and the special ones, which are assignable for one defined cause. The common ones are caused by unavoidable process deviations within the process itself due to materials being processed, the environment or the performance of staff. If only this kind of deviations occur, the process distribution is assumed to be varying according to a constant mean (process is under control). However, special process deviations (e.g. defective tool) mean that the process is out of control and the cause is assignable [19, p.2]. SPC method is already used for simulation studies to define the end of the warm-up period [19].
The equality of out of control situations with changes in state and abnormal/ suboptimal system behavior on sections respectively, allows adequate use of the SPC method. The adapted Statistical Process Control approach for anomaly event identification will be explained in general in this section and in chapter 3.3 it will be demonstrated by using an example.

Single event data iY first are merged into vector Y and describe a time series, where m is the total number of observations and iY the ith observation. ( ) ;...;; 21 mYYYy = , (1) i=1,…,m The SPC method has two basic assumptions to the data: (A) the data has to be uncorrelated and (B) normally distributed. Since that in MHS data typically is correlated it has to be transformed to quasi-uncorrelated data. An approved approach to deal with that problem is the batch means method [20, p.450].
In the first step the data is divided into sections of defined length, the so-called batches (h∈H). The goal of this is to generate a time series of batch means ( hμ ) because correlation by trend decreases with an increasing batch size (k) [21, p.459]. Starting value of the batch size (k) is (k=1). If at least 20 batches exist ( 20≥H ), batch means can be calculated ( hμ ). The result is a time series of batch means ( y ) with the number of (b) out of batches (h) with the size of (k), generated of the event vector (Y) with m single events (i)
( ) ( )b
hkkhi i
hm YYYykm;...;;h
k
YYYYYy ;...;; 21mit ;...;; 21
1)1(21 =→⎥⎦
⎥⎢⎣⎢==→=
∑ +−= (2)
For this approach the main difficulty is to find the right batch size (k). Thus the
series of the resulting batch means has to fulfill the requirements (A) and (B). One method to determine the correlation between batch means is the Von Neumann test. In this test the batch size is doubled until a pre-defined reference value is reached [22,23]. Alternatively the calculation of lag 1 autocorrelation can be used instead of the Von Neumann test. Referring to this rule of thumb from Robinson the requirement for uncorrelated data is fulfilled as soon as the lag 1 autocorrelation becomes smaller than “0,1” [19, p.441]. From a statistical point of view the consideration of just lag 1 autocorrelation by far is not enough to gather uncorrelated data from it, since correlations of higher degrees still would have to be considered, too. For the SPC method this assumption is sufficient.
Additionally the batch size (k) has to fulfill the requirement for normal distribution of the batch means. Known methods can to test for normality are e.g. the Kolmogorov-Smirnov test [24, p.269-271] or the Anderson-Darling test [25, p.765-769]. Another method is the chi-square test which is used in this article [3, p.357-363]. If the batch size (k) is determined by lag 1 autocorrelation and the means of the resulting batches (h) fit requirements of the chi-square test, the calculation of the control limits (CL) can begin. These control limits give information about if an out of control situation exists or the considered process is under control.

Afterwards mean value ( μ̂ ) and standard deviation (σ̂ ) of all batch means are calculated to determine the estimators for the control limits (CL). With the help of these estimators, three sets of control limits (CL) are calculated (3 pairs of upper and lower control limits):
3;2;1für
2
ˆˆ =±= zb
zCL σμ (3)
The second term of formula (3) as a function of z in the following will be considered as z-sigmaUP and z-sigmaLOW for the upper-/lower control limit, respectively. On the basis of pre-defined rules regarding the behavior relative to the control limits, out of control situations can be detected [27 in 26]:
i. One point plots outside of the 3-sigma control limit. ii. 2 out of 3 consecutive points plot outside of one 2-sigma control limit. iii. 4 out of 6 consecutive points plot outside of one 1-sigma control limit. iv. 8 consecutive points plot on one side of μ̂ .
Points 2 and 3 refer to one certain control limit (either up or low). That means that if
2 consecutive points plot for example firstly over an upper and secondly under a lower control limit this would not be an out of control situation. The visualization in Figure 3 shows an example for that with using stochastic data.
µh
b
µh
µ
1sigma (z=1)
2sigma (z=2)
3sigma (z=3)
ˆµ
Figure 3: Example of SPC output data visualization
Thus μ̂ represents normal behavior and µ the series of batch means. For anomaly
event identification for automated transport processes with continuous handling equipment therefore a difference bigger than 3-sigmaLOW between μ̂ and the optimum (e.g. shortest transport time between 2 event locations) is a hint for continuing overload on a certain section.

Compared to quality management, for the analysis of parts of transport processes within a material flow system all deviations have to be considered. On the one hand the control limits could be used to evaluate deviations and on the other hand to determine a range of tolerance around the calculated normal behavior. For the reason that the rules to determine out of control situations are crucial for anomaly event identification, they have to be adjusted for the certain system if necessary. Adjusted rules for example could be defined as follows:
i. Analysis of all deviations outside of 3-sigma control limits. ii. Analysis of deviations between 2- and 3-sigma control limit in the following case:
a. 4 out of 6 consecutive batch means plot in between. iii. Analysis of deviations outside of the 1-sigma control limits.
b. 6 out of 8 consecutive batches means plot in between. iv. 10 consecutive points plot on one side of μ̂ . This parameterization is object of research. The goal is the definition of general
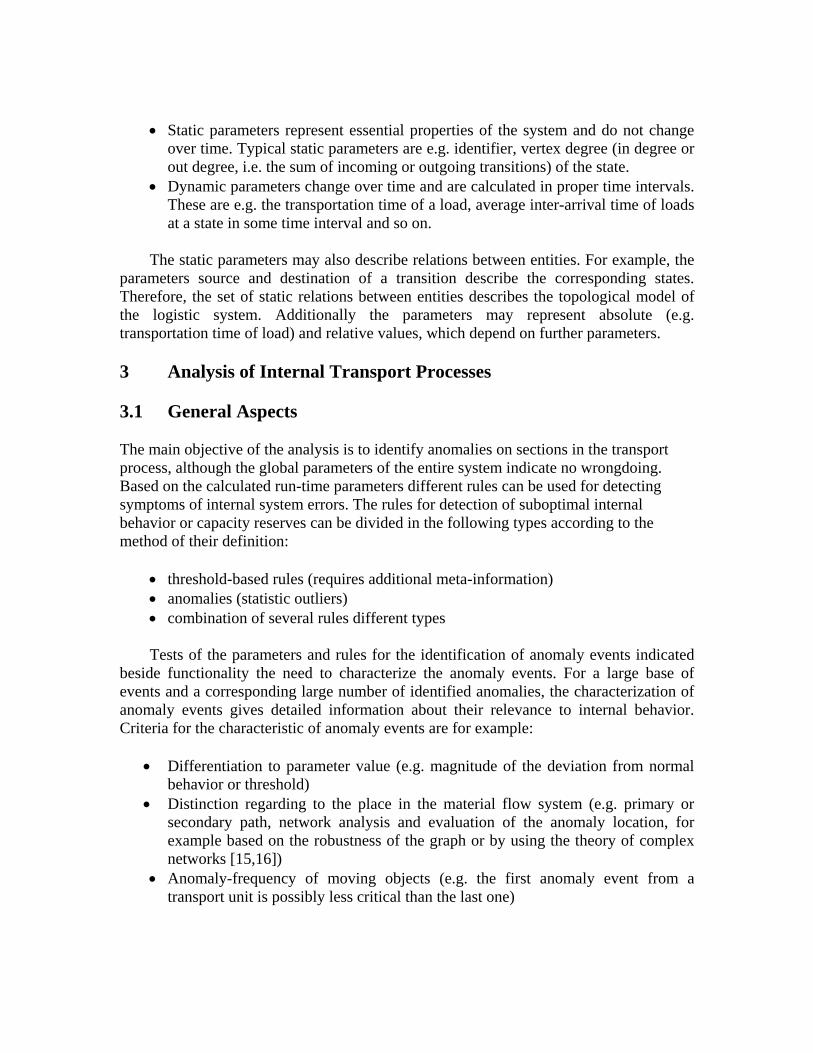
criteria for the creation of the rules. At this point experiments with different sets of data from different systems are executed to test how far specific system attributes or the technical configuration of conveyor components on single sections can deliver evidence. To sum up the steps of the adapted SPC method for anomaly event identification are visualized in a flow chart (Figure 4).
The SPC method for the considered objects in a defined time interval always should be executed for different parameters simultaneously. On the one hand this increases the result certainty and on the other hand the behavior on one section cannot be described completely by just one parameter. After the explanation of the SPC method as an approach for the identification of anomaly events, the method will be validated by an example in the next section.
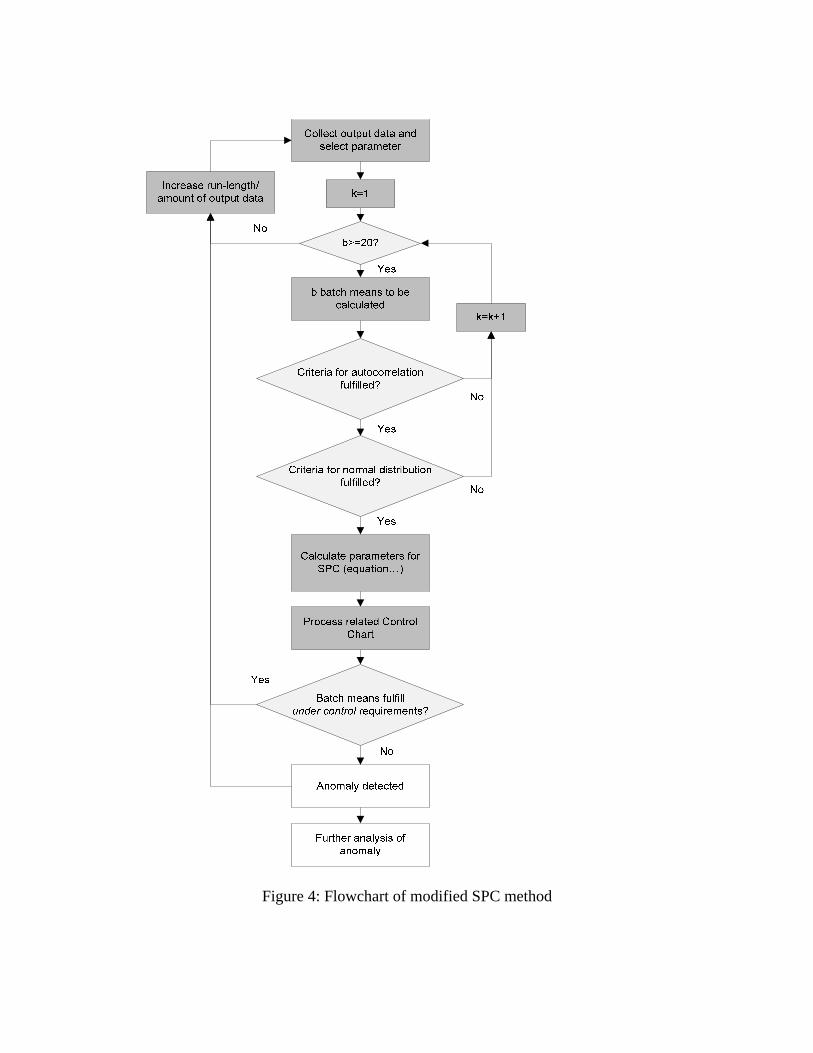
Figure 4: Flowchart of modified SPC method

3.3 Example The following example shows the application of the adapted SPC method. The used data has been generated by a simulation model from manufacturing company. Figure 5 shows an extract of the network of the transport system the example is based on.
Figure 5: Extract of the network of the sample transport system
The sample has been chosen because it is one of the most busy and thus most critical
areas in the process system. The bottleneck of this sample is the merge where loads which use the marked piece of track between start and end point are often delayed by other loads entering from the southern track the bottleneck. Both streams (eastbound and northbound) are main streams of the facility, which puts special attention to this intersection.
With the knowledge of the network structure of this example, a big variability outside of the statistical normal behavior can be expected as a result of the adapted SPC method for anomaly identification.
The data base of the example consists of about 250 loads which have used the marked piece of track. Notable, more loads do not yield a better result. The TransportTime is the time the loads needed on their way from Start to End (see Figure 5 above). These 250 events have been put together in batches to find the right batch size which fits autocorrelation and normal distribution requirements. The following table shows the results for lag-1 autocorrelation and chi-square test for normal distribution for the different batch sizes (k).
Table 1: Test results for different batch sizes
Batch size (k)
Test for lag-1 autocorrelation
Chi-square test for normal distribution
r1 Χ2-value (cum.) Χ2-limit (95%) Χ2-limit (99%) 1 0.0165629 199.0711 16.9190 21.6660 2 ‐0.070387332 45.1385 15.5073 20.0902 3 0.036336055 22.5213 14.0671 18.4753 4 ‐0.05701343 11.9010 12.5916
16.8119
Since a batch size of 4 events per batch fulfills both requirements, the calculation of the SPC parameters and the process related control chart as well can be calculated on this basis. The result graphic is shown in Figure 6.
7
8
9
10
11
12
13
14
15
16
17
0 5 10 15 20 25 30 35 40 45 50 55 60
Tran
spor
tTim
e
bY 1sigma(z=±1) 2sigma(z=±2) 3sigma(z=±3) µ̂¯h
Figure 6: SPC control chart
With having the attributes of the example network in mind, the batch means outside of the upper 3 sigmaCL have to be considered as very critical. These are probably at least small traffic jams where loads had to wait for other loads to pass the merge at the bottleneck. For this example it is reasonable to look at the first modified rule only

because this already identifies a huge amount of anomalies. As a result of the adapted SPC method for each anomaly in the time series of the batch means a group of events can be identified which characterize the duration of time of temporary blockings (3 sigmaUP) or performance reserve (3 sigmaLOW). Now it is possible for the analyst to have a closer look at single events which are part of the batch mean outliers and to evaluate the trend of different parameters regarding certain objects as well.
In this example only the dynamic parameter transport time has been considered. The principle stays the same for any other parameter as e.g. InterArrivalTime or load counter. For a detailed analysis of anomalies it is necessary to investigate other parameters as well since the system behavior cannot be described by just a single parameter. Depending on the goal of the analysis or the most important system requirements a prioritized analysis based on different parameters is considerable. 4 Summary and Prospects The paper presents a methodological approach to improve performance and sustainability from automated material flow systems for in-house logistics, based on event logs. A simulation study or running system generates a huge amount of data. With increasing amount of data the available information potential is not fully used. This article proposes a (semi)automated procedure for the evaluation and identification of system characteristics on the basis of these event data. The focus of this paper is an adapted statistical process control approach to identify anomalies.
As a result of the overall concept of material flow diagnostics, the simulation model developer or system operator obtains the condensed and classified information on events, which describes the internal system behavior with anomalies pointing at possible problems or capacity reserves. The presented method allows the systematic search and evaluation for anomaly-events in the internal behavior of automated and tracked in-house logistic systems. Figure 7 shows a screenshot of a software prototype and an example for visualization of the analyses results. This prototype software is developed in cooperation with the Chair of Technical Information Systems of Technische Universität Dresden in the research project.
One aspect of the future researches focus on the use of additional event information (e.g. transport priority for specific loads). In contrast to the previous question "What information can be obtained from the standard event attributes?" will the question asked which event information are necessary for the desired analysis.

Project-Editor
Rule-Editor & Test Environment
Objects/ Instances
Extended State-Transition-Model
Result-Gant-Chart, -Graph
Figure 7: Example of thermic picture result-visualization in the prototype
Acknowledgements This research project was promoted by financial resources of the Federal Ministry of Economics and Labor through the German Federation of Industrial Research Associations "Otto-von-Guericke" e.V. (AiF) under the authority of the German Logistics Association e.V. (BVL). References [1] Dangelmaier, W.; Franke, W.; Mueck, B. and Fischer, M.: “Komponenten zur
aktiven Unterstützung der Analyse von Materialflusssimulationen in virtuellen Umgebungen,“ 2. Paderborner Workshop Augmented & Virtual Reality in der Produktentstehung, 123, 141-151, Paderborn (2003).
[2] Nakayama, M.K.: “Output analysis for simulations,” Proceedings of the 38th
conference on Winter simulation, 36-46, Monterey (2006).

[3] Law, A.M. and Kelton, D.M.: Simulation Modeling and Analysis, McGraw-Hill (2000).
[4] Fishman, G.S.: Discrete-event simulation, Springer, New York (2001). [5] Bratley, P.; Fox, B.L. and Schrage, L.E.: A guide to simulation, Springer, New York
(1987). [6] Kemper, P. and Tepper, C.: “Trace based analysis of process interaction models,”
Proceedings of the 37th conference on Winter simulation, 427-436 (2005). [7] Kemper, P. and Tepper, C.: “Automated Trace Analysis of Discrete-Event System
Models,” IEEE Software Engineering, 35, 2, 195-208 (2009) [8] Wölker, M.: Analyse logistischer Systeme mit selbstorganisierenden
Merkmalskarten, Dissertation, University Dortmund, Maschinenwesen (2000) [9] Better, M.; Glover, F. and Laguna, M.: “Advances in analytics: integrating dynamic
data mining with simulation optimization,” IBM Journal of Research and Development, 51, 3, 477-487 (2007).
[10] Struss, P. and Ertl, B.: “Post-mortem Diagnosis of Bottling Plants Based on
Recorded Data,” Safeprocess '09, 7th IFAC Symposium on Fault Detection, Supervision and Safety of Technical Processes, (2009)
[11] Aalst, van der W.M.P.; Reijers, H.A.; Weijters, A.J.M.M. et al.: “Business process
mining: An industrial application,” Information Systems, 32, 5, 713-732 (2007). [12] Rozinat, A.; Mans, R.S.; Song, M. and Aalst, van der W.M.P.: “Discovering
simulation models,” Information Systems, 34, 3, 305-327 (2009). [13] Wustmann, D.; Vasyutynskyy, V. and Schmidt, T.: “Ansätze zur automatischen
Analyse und Diagnose von komplexen Materialflusssystemen,“ Proceeding of the 5th Fachkolloquium der Wissenschaftlichen Gesellschaft für Technische Logistik 2009, 1-20 (2009).
[14] Vasyutynskyy, V.; Gellrich, A.; Kabitzsch, K. and Wustmann, D.: “Analysis of
Internal Logistic Systems based on Event Logs,” Proceedings of the 15th IEEE International Conference on Emerging Techonologies and Factory Automation, 13-16 (2010).

[15] Hammel, C.; Schulze, F.; Peters, C. and Flemming, A.: “Application of methods from complex network theory to MHS Layout optimization,” Progress in Material Handling Research: 2008, 526-542 (2008).
[16] Hammel, C. & Wustmann, D.: „Robustheit in Materialflusssystemen,“ Proceeding of
Institutskolloquium 2011 Planungsprozesse – Innovation & Nachhaltigkeit, 52-58 (2011)
[17] Schmidt, T.; Wustmann, D. and Vasyutynskyy, V.: “Identifizierung und Bewertung
von Anomalien im Materialflussverhalten auf der Basis von Ereignisdaten,“ Proceedings of the 14th ASIM-Conference: Simulation in Produktion und Logistik, 429–436 (2010).
[18] Faes, G.: SPC - Statistische Prozesskontrolle: Eine praktische Einführung in die
statistische Prozesskontrolle und deren Nutzung, 2, Norderstedt, Books on Demand GmbH (2009).
[19] Robinson, S.: “A statistical process control approach for estimating the warm-up
period,” Proceedings of the 2002 Winter Simulation Conference, 1, 439–446. (2002). [20] Banks, J.; Carson, J.S.; Nelson, B.L. and Nicol, D.M.: Discrete-Event System
Simulation, 5., Prentice Hall (2009). [21] Kleijnen, J. P.: Statistical techniques in simulation, 1, Marcel Decker Inc. (1974). [22] Neumann, J.: “Distribution of the ratio of the mean square successive difference to
the variance,” The Annals of Mathematical Statistics, 12, 4, 367–395 (1941). [23] Fishman, G.S.: “Grouping observations in digital simulation,” Management Science,
24, 5, 510–521 (1978). [24] James, F.; Eadie, W.T.; Drijard, D.; Roos, M. and Sadoulet, B.: Statistical methods
in experimental physics (2nd Edition), Singapore, World Scientific, 269–271 (2006). [25] Anderson, T.W. and Darling, D.A.: “A test of goodness of fit,” Journal of the
American Statistical Association, 49, 268, 765–769 (1954). [26] Montgomery, D.C.: Introduction to statistical quality control, Hoboken (N.J.), John
Wiley (2005). [27] Western Electric Company: Statistical quality control handbook, Indianapolis,
Western Electric Co. (1956).
Related Documents