Proceedings of 2017 Electrical Engineering Symposium (EES2017) - Vol. 1

Welcome message from author
This document is posted to help you gain knowledge. Please leave a comment to let me know what you think about it! Share it to your friends and learn new things together.
Transcript

Proceedings of 2017 Electrical Engineering Symposium (EES2017) - Vol. 1

i
PROCEEDINGS OF 2017
ELECTRICAL ENGINEERING SYMPOSIUM
(EES2017)
VOLUME 1
Proceedings of 2017 Electrical Engineering Symposium (EES2017) - Vol. 1

ii
First Edition 2017
Hak cipta terpelihara. Tiada dibenarkan mengeluar ulang mana-mana bahagian artikel, ilustrasi, dan isi
kandungan buku ini dalam apa juga bentuk dan cara apa jua sama ada dengan cara elektronik, fotokopi,
mekanik, atau cara lain sebelum mendapat izin bertulis daripada Timbalan Naib Canselor (Penyelidikan
& Inovasi), Universiti Teknologi Malaysia, 81310 UTM Johor Bahru, Johor Darul Ta’zim, Malaysia.
Perundingan tertakluk kepada perkiraan royalti atau honorarium.
All rights reserved. No part of this publication may be reproduced or transmitted in any form or by any
means, electronic or mechanical including photocopying, recording, or any information storage and
retrieval system without permission in writing from Deputy Vice-Chancellor (Research & Innovation)
Universiti Teknologi Malaysia, 81310 UTM Johor Bahru, Johor Darul Ta’zim, Malaysia. Negotiation
is subject to royalty or honorarium estimation.
Diterbitkan oleh: Fakulti Kejuruteraan Elektrik, Universiti Teknologi Malaysia, 81310 Johor Bahru
Johor, Malaysia
Proceedings of 2017 Electrical Engineering Symposium (EES2017) - Vol. 1

iii
PREFACE
This book introduces several research works from final year undergraduate project till the level of master
project by taught course. The projects have been evaluated by industries as well as academician to ensure
that its fulfill the standard of each level before it can be published. The text emphasizes the combination
of the research material in different field of engineering generally in power, electronic, communication,
control and mechatronic which hampered by three main program offered by Faculty of Electrical
Engineering.
This book is generally suitable as an accompaniment to students and researchers that generally involved
with different field of study including modeling and control design for various example of application.
There are also research on hardware design implementation which integrate both for simulation and
experimental study as well as laboratory sessions available at a particular institution.
Mohamad Kamal A. Rahim
Md. Pauzi Abdullah
Faculty of Electrical Engineering
Universiti Teknologi Malaysia
Proceedings of 2017 Electrical Engineering Symposium (EES2017) - Vol. 1

iv
2017 ELECTRICAL ENGINEERING SYMPOSIUM COMMITTEE
GENERAL CHAIR
PROFESSOR DR. MOHAMAD KAMAL A. RAHIM
CO-CHAIR
IR. DR. MD. PAUZI ABDULLAH
2017 ELECTRICAL ENGINEERING SYMPOSIUM MEMBERS
DR. KAMALUDIN MOHD. YUSOF
DR. SHAHARIN FADZLI ABD. RAHMAN
DR. YUSMEERAZ YUSOF
DR. MOHD. HAFIZI AHMAD
DR. NURUL EZAILA ALIAS
DR. ZULKARNAIN AHMAD NOORDEN
DR. MOHD. AFZAN OTHMAN
DR. MOHD. AMRI MD. YUNUS
DR. MOHD. RASHIDI SALIM
2017 ELECTRICAL ENGINEERING SYMPOSIUM SECRETARIAT STAFF
SABRINA ZAINAL ABIDIN
AZLINA MOHD. LAZIM
Proceedings of 2017 Electrical Engineering Symposium (EES2017) - Vol. 1

v
NO TITLE PAGE NUMBER
1 Solar Powered Fertigation System
Author(s):-
Nabilah Afiah Mohd Isa
Salinda Buyamin
Norzanah Rosmin
Mohamad Shukri Zainal Abidin
1 – 5
2 Car Park Assistance using Fuzzy Logic
Author(s):-
Muhamad Imran Mazlan
Yahaya Md Sam
6 – 11
3 Modelling and Simulation of Controller for Active Suspension
System
Author(s):-
Choo Yong Chien
Yahaya Md Sam
12 – 17
4 Mobile Cranes’ Safety System at Construction Sites
Author(s):-
Nur Shafiqah Abdullah
Zamani Mohd Zain
18 – 21
5 Indoor Security Surveilliance System with a Mobile Patrolling
Robot
Author(s):-
Muhammad Ishak Mohamed Ibrahim
Nasarudin Ahmad
22 – 25
6 Car Front View Detection using AdaBoost
Author(s):-
Shiresh Rajendran
Ahmad Ridhwan Wahap
26 – 31
7 Smart Advertising Robot with Image Recognition
Author(s):-
Nik Ahmad Faisal Mohd. Kamarolzaman
Yeong Che Fai
32 – 35
8 Automated Guided Vehicle (AGV) for High Mix Low Volume
Manufacturing Industry
Author(s):-
Poh Hung Yong
Rosbi Mamat
36 – 40
Proceedings of 2017 Electrical Engineering Symposium (EES2017) - Vol. 1

vi
NO TITLE PAGE NUMBER
9 Balloon Networked Control System
Author(s):-
Nurul Amirah Azman
Nurul Adilla Mohd. Subha
41 – 44
10 Water Flow Meter and Monitoring System
Author(s):-
Muhammad Zulhilmi Halim
Norhaliza Abdul Wahab
45 – 48
11 Mobile Robot for Outdoor Monitoring
Author(s):-
Mohamad Firdaus Mohd. Nor
Nasarudin Ahmad
49 – 52
12 Energy Harvesting from Rooftop Ventilator
Author(s):-
Nurul Nadiah Zulkifli
Leow Pei Ling
53 – 56
13 Autotuned Electrical Muscle Stimulator With Electromyogram
Biofeedback
Author(s):-
Muhammad Naqiuddin Nazali
Leow Pei Ling
57 – 61
14
Vision Aided Automated Guided Vehicle
Author(s):-
Mohamad Danial Yazid
62 – 67
15
Leow Pei Ling
Application of Sensors in Quality Evaluation of Mangoes
Author(s):-
Journal Low Sze Kit
68 – 72
16
17
Khairul Hamimah Abas
Automatic Sluice Gate Control at Paddy Field
Author(s):-
Muhammad Fauzan Saafi
Herlina Abdul Rahim
Vision based Text Recognition Reading Assistive System
Author(s):-
Tan Siu Fong
Fatimah Sham Ismail
73 – 78
79 – 84
Proceedings of 2017 Electrical Engineering Symposium (EES2017) - Vol. 1

vii
NO TITLE PAGE NUMBER
18 Convolutional Neural Network for Optimal Pineapple
Harvesting
Author(s):-
85 – 89
19
Ahmad Aizuddin Azman
Fatimah Sham Ismail
Motorized Turning Seat
Author(s):-
90 – 93
20
Vinod Vijayan
Anita Ahmad
Low Cost Webcam based Color Sorting System
Author(s):-
Mohamad Faezzudin Ahmad Jaafar
Mohamad Noh Ahmad
Mohamad Amir Shamsudin
94 – 98
21 Development of the Internet of Things (IoT)
for an Industrial Automated Guided Vehicle (AGV)
System
Author(s):-
Muhammad Nadzmi Abd Rahman
99 – 102
22
Herman Wahid
Active Vibration Control of Flexible Beam using Piezoelectric
Elements
Author(s):-
Zul Fahmi Khamiti
103 – 107
23
Zaharuddin Mohamed
Quadcopter Based Transporter
Author(s):-
Mohammad Khairul Tajudin
Mohamad Amir Shamsudin
108 – 113
24
Modeling and Sway Control of a Double-Pendulum Overhead
Crane System
Author(s):-
Tan Ying Jian
Zaharuddin Mohamed
114 – 119
25 Smart Home Security System with Iot
Author(s):-
Muhammad Nasrullah Mustaffar
Norhaliza Abdul Wahab
120 – 123
Proceedings of 2017 Electrical Engineering Symposium (EES2017) - Vol. 1

viii
NO TITLE PAGE NUMBER
26 Smart Walking Cane
Author(s):-
Suhaizadiana Ismail
124 – 127
27
Sallehuddin Ibrahim
Robot Gripper and Machine Vision for Electronic Component
Pick and Place
Author(s):-
Mohamad Nasrul Mohd Izazi
128 – 132
28
Kumeresan A. Danapalasingam
Semi-Autonomous Direct Seeding Mobile Robot for Paddy
Field
Author(s):-
Muhamad Shafiq Ali
133 – 136
29
Johari Halim Shah Osman
Ammonia Detection System using Integrated Microfluidic-
Microneedle
Author(s):-
Khairul Akmal Muslimin
Mohd Ridzuan Ahmad
137 – 141
30 Listening Device for Locating Underground Water Leakage in
Residential Area
Author(s):-
Muhammad Anugerah Affendi Saliman
142 – 147
31
Abdul Rashid Husain
Digital Control of Water Level Plant using MyOpenLab
Software
Author(s):-
Nur Azmah Mat Kia
Rosbi Mamat
148 – 153
32
Multi-Rate Controller for Networked Multi Agent System
(NMAS)
Author(s):-
Nurul ‘Atikah Zakaria
Nurul Adilla Mohd Subha
154 – 157
33 Agarwood Grading Estimation using Artificial Neural Network
Technique and Carving Automation
Author(s):-
Muhammad Syafiq Afif Ishak
Mohd Amri Md Yunus
158 – 163
Proceedings of 2017 Electrical Engineering Symposium (EES2017) - Vol. 1

ix
NO TITLE PAGE NUMBER
34
Energy Scavenging from Waste Heat of Home Refrigerator
Author(s):-
Nur Afni Izyani Zainuddin
Herman Wahid
164 – 167
35
Magnet Engine Free Energy Generator
Author(s):-
Siti Amirah Ramli
Anita Ahmad
168 – 173
Proceedings of 2017 Electrical Engineering Symposium (EES2017) - Vol. 1

Solar Powered Fertigation System
Nabilah Afiah binti Mohd Isa, Salinda Buyamin*
Faculty of Electrical Engineering
Universiti Teknologi Malaysia
Johor Bahru, Malaysia.
[email protected], [email protected]*
Norzanah Rosmin, Mohamad Shukri Zainal Abidin
Faculty of Electrical Engineering
Universiti Teknologi Malaysia
Johor Bahru, Malaysia.
[email protected], [email protected]
Abstract— This paper proposes a solar powered system that
could be installed in a conventional fertigation plant. The main
objectives of this proposed system is to manage the amount of
plants watering by benefitting the free source of solar energy
from the sun, besides increasing the plants yield. To be a reliable
system, two batteries (Sealed Lead Acid, 12V, 7.2Ah) were used
to store the solar energy and then used as the battery backup for
the later use. The energy management algorithm of this system
is controlled using an Arduino Mega circuit, equipped with a
data logging shield for the data recording purpose. As the
results of the experimental study, it was found that during sunny
day, battery can be charged up to 75% in eight hours, when one
PV panel (12V, 20W) was used. It was also shown that the
proposed system can be operated successfully. As an
implication, a low-cost and reliable solar powered system for
fertigation plant was successfully developed and operated
automatically.
Keywords— Solar powered; solar energy; fertigation;
photovoltaic (PV); battery backup; Arduino.
I. INTRODUCTION
Solar energy from the sun is a free power source, clean-green renewable energy (RE), high reliability, low maintenance and has long life span [1-2]. Our country, Malaysia is situated at the equatorial region and receives an average of solar radiation between 400-600 MJ/m2 per month. Fig. 1 shows the average solar radiation zones in Malaysia. Due to this, the usage of photovoltaic (PV) in generating electricity is quite efficient. In addition, Malaysia has a constant weather condition throughout the year (hot and wet) [1]. PV panel uses an ultraviolet from sunlight to generate electricity [3]. In PV panel, semiconductor materials are installed to enable the electricity conductivity, reliable to generate input voltage, and therefore, able to control the current flow through its natural electronic process [1][3,4]. There are various types of PV that widely used in the market such as monocrystalline silicon, polycrystalline silicon, thick-film silicon and amorphous silicon. Since PV markets are growing rapidly nowadays, the PV usage is economically viable as the cost of the PV panels keep reducing from year to year [2].
Since Malaysia has hot and wet climate throughout the year, agricultural has becomes one of the popular activities that promising incomes to its population. Through agricultures in our own lands, foods and raw materials can be supplied easier, cheaper and faster. Demands on these items become increasing with increment of population. Hence,
nowadays, traditional agriculture becomes not really practical for massive productions. Presently, there are numerous agronomic plants are operated automatically using diesel generator, either by individual installation or utility company. However, since solar PV which offering free energy resources constantly almost every day along the year, it is becomes more popular nowadays due to its less-cost solution.
Fig. 1 Average Solar Radiation in Malaysia [1]
For the more productive yields and labours, most farmers prefer to plant their crops using fertigation approach. Fertigation system is one of a good alternative which could replace the traditional agriculture as it could reduce the wastage of water during the watering activity by monitoring the moisture of the soil. The word “fertigation” is actually comes from the combination words of ‘fertilizer’ and ‘irrigation’ [5]. This approach mixes the water and fertilizer in one container and then the liquid mixture will be watered to the crops in several periodic times and amount that has been set, appropriate to the type of the planted crops.
The objective of this paper is to propose a solar powered system for agriculture purpose. In this study, rock melon was used as the plant crop. In section I, an introduction and some works in this area has been presented. In section II, the proposed system will be demonstrated before the research method is explained in section III. The experimental results and research conclusion will be given in section IV and V, respectively.
II. SOLAR POWERED FERTIGATION SYSTEM
Typical solar powered system for fertigation plant is
Proceedings of 2017 Electrical Engineering Symposium (EES2017) - Vol. 1
1

shown in Fig. 2.
Fig. 2. Schematic diagram of typical solar powered system
Based on Fig.2., this project proposed the usage of battery-coupled system where the battery is connected to solar panel. Battery is used to store energy gained from solar panel. The presence of battery helps to avoid the wastage of energy. Solar charge controller is connected between solar panel and battery to avoid from overcharging or undercharging of battery.
III. METHODOLOGY
A. Proposed system
Fig. 3 demonstrates the diagram of the proposed solar powered system for rock melon fertigation plant in this study.
Fig. 3. Schematic diagram of proposed solar powered system
Based on Fig.3., the proposed system used an amount of two batteries as compared to typical system. Both batteries take turns to operate and connected via relay. The reason for the usage of two batteries is to improve the longevity of energy supplied to the load as low amount of solar radiation received by solar panel. One of the battery which connected to the system is operated as a backup battery when the operating battery is experiencing the loss of energy. This method is reliable to create a continuous supply to the load.
B. Main Components
There are four main components that must be identified and sized for the proposed solar powered fertigation plant system; solar PV panel, battery charger and its controller, and solar battery.
1. Solar PV panel
Electricity is produced by an extreme nuclear activity located at the center of the sun. This process generates an energetic particle called photons when a huge amount of solar radiation is produced [3][6]. Fig. 4 shows the process occurs on the surface of crystalline silicon solar cell before electricity is generated [3]. Electricity is generated in solar energy by using photovoltaic effect [6]. Solar panel (silicon) is made up of semiconductor material which able to conduct electricity and control current under certain conditions. Normally, the specification of semiconductor material is dependent on the amount of impurities added to it [4].
Fig. 4 Process occurs on the surface of crystalline silicon solar cell
To select an appropriate type of solar PV panel, it is necessary to consider these two items: calculation of average daily power consumption and capacity of battery. To estimate the average daily power consumption, the total energy consumption that absorbed by the loads must be calculated. List all the loads considered, list the power rating for each respective loads, and then, multiply the power rating for each load with the total hour used, before summed up all the energy consumed. To estimate the number of PV panel required, multiply the power rating of the PV panel with the number of hours of sunlight received by solar panel [7]. The size of PV panel however, should be larger than the average daily power consumption. For battery size, the system voltage must be identified first. Typically, system voltage is set to 12V or 24V. It also depends on how many slots/arrays that required by the loads. Battery is typically evaluated by Amp-hour (Ah) and its charging capability. Batteries have their own charging capacity. For instance, SLA or AGM batteries charging current are typically limited to 20% of the rated capacity. For instance, 12 Ah batteries cannot receive charge higher than 2.4A.
The solar PV used in this study is monocrystalline type (12V, 20W, with 1.14A rated current), while the battery used is from the SLA type (12V 7.2 Ah). The number of solar panel should be chosen based on the amount of charge can be
Proceedings of 2017 Electrical Engineering Symposium (EES2017) - Vol. 1
2

stored by the chosen battery in order to avoid a waste of energy [7].
2. Battery charger and its controller Solar charger and its controller play an important role in
monitoring and controlling the charging process of the solar
battery. It helps to limit the amount of charge or current
entering and leaving the battery. The function of charger
controller is vital to block the reverse current and protect the
battery from overcharged situations, besides avoiding the
drainage problem. Battery is known as very sensitive and
needs to be well maintained to retain its performance and life
span. In battery charger, there is a regulator. Regulator has a
function to stop the charging process when the battery voltage
exceeded its maximum level. When battery supplies current
to the loads, the regulator will be triggered when reached at a
preset low-voltage and thus allows the charging process to be
continued again [8][9][10]. In order to maintain the performance of battery, a suitable solar charger must be chosen. The consideration for choosing the suitable battery charger is calculating the controller array current and controller load current. Controller array current can be estimated using Eq (1) [10].
𝐴_𝑆𝐶𝐶 = 𝑀_𝑆𝐶𝐶 𝑥 𝑀𝑜𝑑_𝑝𝑎𝑟𝑎𝑙𝑙𝑒𝑙 𝑥 𝑆𝐹 Eq (1)
where A_SCC is the array short circuit current, M_SCC is the module short circuit current, Mod_parallel is modules in parallel and SF is safety factor, and assumed as 1.25 for this study. For this study, for a 20W solar panel, it has a short circuit current of 1.27A. Hence, the minimum value of the battery charger is 1.27 A x 1 x 1.25 = 1.6 A.
To calculate the controller load current, Eq (2) can be used [10].
𝑀𝑎𝑥 𝐿𝑜𝑎𝑑 𝐶𝑢𝑟𝑟𝑒𝑛𝑡 = 𝑇𝑜𝑡𝑎𝑙 𝐶𝑜𝑛𝑛𝑒𝑐𝑡𝑒𝑑 𝑊𝑎𝑡𝑡𝑠
𝑆𝑦𝑠𝑡𝑒𝑚 𝑉𝑜𝑙𝑡𝑎𝑔𝑒 Eq (2)
For this study, the load connected to the PV panel is 20W and the system DC voltage is 12V. Hence, the controller load current is 20W/12V = 1.67A. Thus, 1.67 A is the minimum value of charge controller output current. This output current is pulled from the batteries through solar battery charger controller.
3. Battery
Two solar batteries used in this study are from the type of Sealed Lead Acid, 12V system voltage with battery capacity of 7.2Ah.
C. Logging parameter
For the data logging purpose, data logging shield with Real Time Clock (RTC) is used. Data logging is important to store the collected data and also to observe the functionality of the developed solar powered system. Some modification has been done in the logging shield before attaching the logging shield to the Arduino Mega by connecting pin A4 and pin A5, to pin 20 and pin 21, respectively. The attached SD Card also needs to be formatted to FAT32 into the SD card slot. The voltage sensing circuit was developed using a voltage divider where a resistor (R2) is connected to an analogue input and the Ground of Arduino Mega. The voltage
divider concept is used to minimise the value of the voltage entering the Arduino pin to 5V. The circuit of this data logging is as depicted in Fig. 5.
Fig. 5 Data Logging Circuit
The Arduino meter is created by using a voltage divider circuit, ACS 712 and LCD monitoring display. Arduino meter is developed to display the data parameters that read from the PV panel, batteries, and load. A current sensor (ACS712) is used to read the value of the current. Current sensor is also connected to the Analog pin of the Arduino. ACS712 has a limitation of high sensitivity to the magnetic field. Thus, it is quite difficult to achieve a stable and precise output reading of the current. For quality data collection and reading, the ACS712 needs to be calibrated by using Arduino. Then, the parameters gained from the Arduino meter (voltage sensing circuit and current sensors) can be projected on LCD display. In order to minimize the pin used on the Arduino circuit, an I2C LCD display module is used. The I2C LCD display is communicating through SCA (Arduino Mega pin 20) and SCL (Arduino Mega pin 21).
D. Circuit protection
In order to create a smooth changeover between two SLA batteries, a relay is used. The positive polarity of the battery is connected to the Normally Open (NO) point and another battery is connected to the Normally Closed (NC) points of the installed relay. Fig. 6 shows the circuit for the protection purpose. The circuit consists of a fuse that connected in series with the load. Meanwhile, a Zener diode is connected in parallel with the load to protect the circuit from overcurrent, overvoltage and reverse current problems.
Fig. 6 Protection Circuit
Proceedings of 2017 Electrical Engineering Symposium (EES2017) - Vol. 1
3
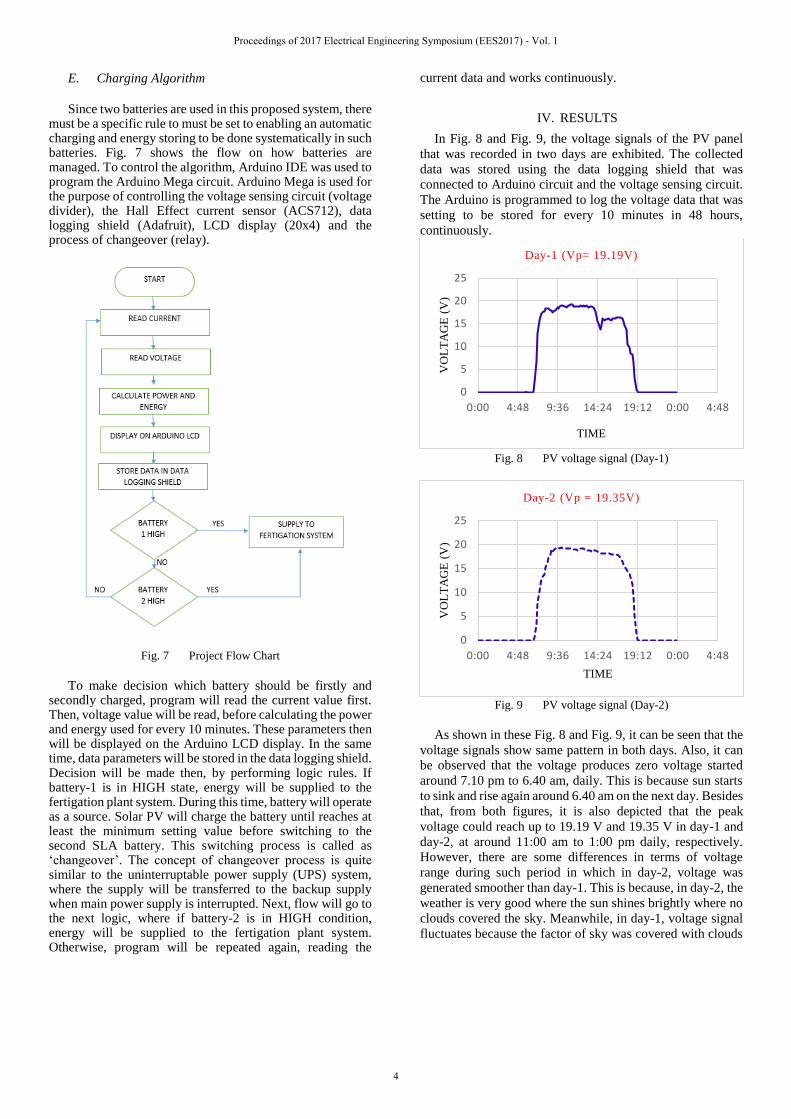
E. Charging Algorithm
Since two batteries are used in this proposed system, there must be a specific rule to must be set to enabling an automatic charging and energy storing to be done systematically in such batteries. Fig. 7 shows the flow on how batteries are managed. To control the algorithm, Arduino IDE was used to program the Arduino Mega circuit. Arduino Mega is used for the purpose of controlling the voltage sensing circuit (voltage divider), the Hall Effect current sensor (ACS712), data logging shield (Adafruit), LCD display (20x4) and the process of changeover (relay).
Fig. 7 Project Flow Chart
To make decision which battery should be firstly and secondly charged, program will read the current value first. Then, voltage value will be read, before calculating the power and energy used for every 10 minutes. These parameters then will be displayed on the Arduino LCD display. In the same time, data parameters will be stored in the data logging shield. Decision will be made then, by performing logic rules. If battery-1 is in HIGH state, energy will be supplied to the fertigation plant system. During this time, battery will operate as a source. Solar PV will charge the battery until reaches at least the minimum setting value before switching to the second SLA battery. This switching process is called as ‘changeover’. The concept of changeover process is quite similar to the uninterruptable power supply (UPS) system, where the supply will be transferred to the backup supply when main power supply is interrupted. Next, flow will go to the next logic, where if battery-2 is in HIGH condition, energy will be supplied to the fertigation plant system. Otherwise, program will be repeated again, reading the
current data and works continuously.
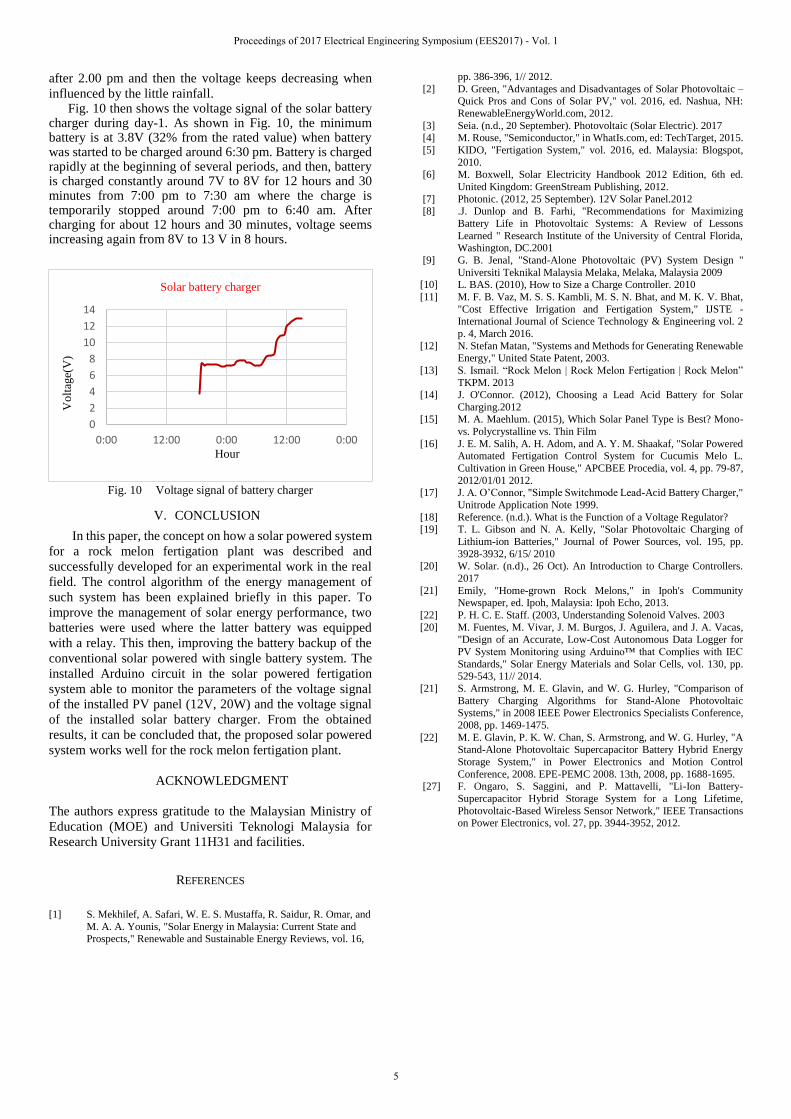
IV. RESULTS
In Fig. 8 and Fig. 9, the voltage signals of the PV panel
that was recorded in two days are exhibited. The collected
data was stored using the data logging shield that was
connected to Arduino circuit and the voltage sensing circuit.
The Arduino is programmed to log the voltage data that was
setting to be stored for every 10 minutes in 48 hours,
continuously.
Fig. 8 PV voltage signal (Day-1)
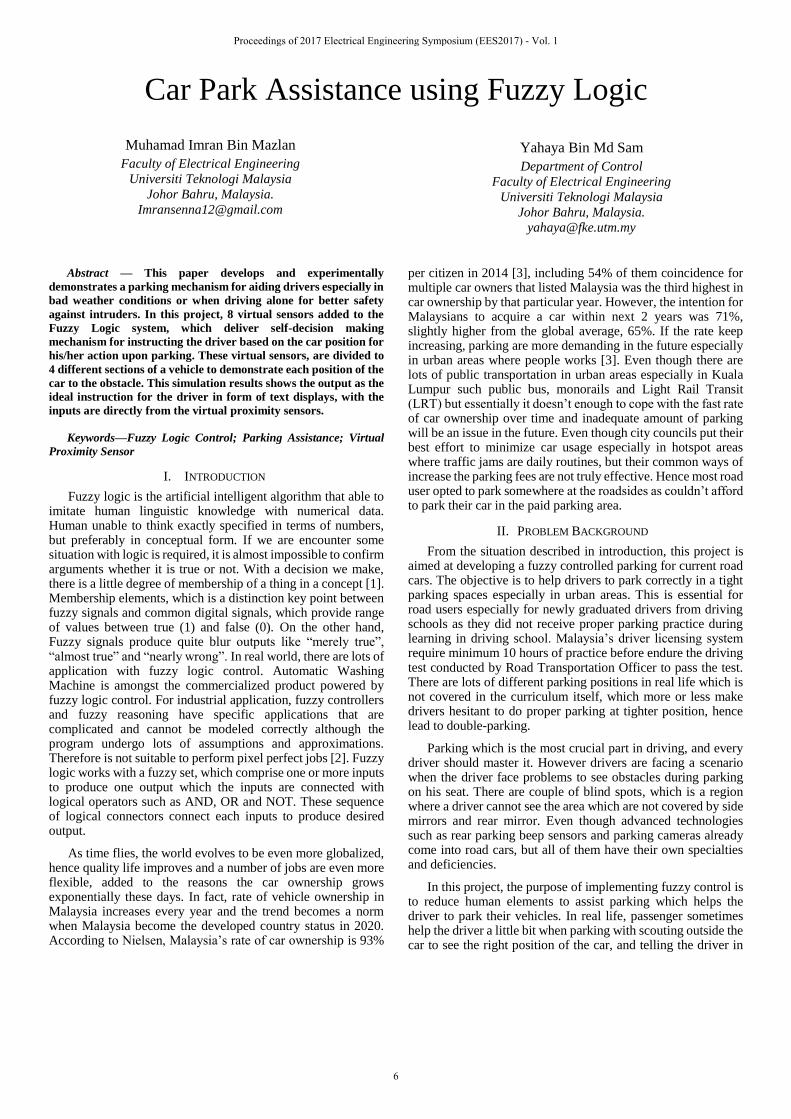
Fig. 9 PV voltage signal (Day-2)
As shown in these Fig. 8 and Fig. 9, it can be seen that the
voltage signals show same pattern in both days. Also, it can
be observed that the voltage produces zero voltage started
around 7.10 pm to 6.40 am, daily. This is because sun starts
to sink and rise again around 6.40 am on the next day. Besides
that, from both figures, it is also depicted that the peak
voltage could reach up to 19.19 V and 19.35 V in day-1 and
day-2, at around 11:00 am to 1:00 pm daily, respectively.
However, there are some differences in terms of voltage
range during such period in which in day-2, voltage was
generated smoother than day-1. This is because, in day-2, the
weather is very good where the sun shines brightly where no
clouds covered the sky. Meanwhile, in day-1, voltage signal
fluctuates because the factor of sky was covered with clouds
0
5
10
15
20
25
0:00 4:48 9:36 14:24 19:12 0:00 4:48
VO
LT
AG
E (
V)
TIME
Day-1 (Vp= 19.19V)
0
5
10
15
20
25
0:00 4:48 9:36 14:24 19:12 0:00 4:48
VO
LT
AG
E (
V)
TIME
Day-2 (Vp = 19.35V)
Proceedings of 2017 Electrical Engineering Symposium (EES2017) - Vol. 1
4
after 2.00 pm and then the voltage keeps decreasing when
influenced by the little rainfall. Fig. 10 then shows the voltage signal of the solar battery charger during day-1. As shown in Fig. 10, the minimum battery is at 3.8V (32% from the rated value) when battery was started to be charged around 6:30 pm. Battery is charged rapidly at the beginning of several periods, and then, battery is charged constantly around 7V to 8V for 12 hours and 30 minutes from 7:00 pm to 7:30 am where the charge is temporarily stopped around 7:00 pm to 6:40 am. After charging for about 12 hours and 30 minutes, voltage seems increasing again from 8V to 13 V in 8 hours.
Fig. 10 Voltage signal of battery charger
V. CONCLUSION
In this paper, the concept on how a solar powered system
for a rock melon fertigation plant was described and
successfully developed for an experimental work in the real
field. The control algorithm of the energy management of
such system has been explained briefly in this paper. To
improve the management of solar energy performance, two
batteries were used where the latter battery was equipped
with a relay. This then, improving the battery backup of the
conventional solar powered with single battery system. The
installed Arduino circuit in the solar powered fertigation
system able to monitor the parameters of the voltage signal
of the installed PV panel (12V, 20W) and the voltage signal
of the installed solar battery charger. From the obtained
results, it can be concluded that, the proposed solar powered
system works well for the rock melon fertigation plant.
ACKNOWLEDGMENT
The authors express gratitude to the Malaysian Ministry of
Education (MOE) and Universiti Teknologi Malaysia for
Research University Grant 11H31 and facilities.
REFERENCES
[1] S. Mekhilef, A. Safari, W. E. S. Mustaffa, R. Saidur, R. Omar, and
M. A. A. Younis, "Solar Energy in Malaysia: Current State and Prospects," Renewable and Sustainable Energy Reviews, vol. 16,
pp. 386-396, 1// 2012.
[2] D. Green, "Advantages and Disadvantages of Solar Photovoltaic – Quick Pros and Cons of Solar PV," vol. 2016, ed. Nashua, NH:
RenewableEnergyWorld.com, 2012.
[3] Seia. (n.d., 20 September). Photovoltaic (Solar Electric). 2017 [4] M. Rouse, "Semiconductor," in WhatIs.com, ed: TechTarget, 2015.
[5] KIDO, "Fertigation System," vol. 2016, ed. Malaysia: Blogspot,
2010. [6] M. Boxwell, Solar Electricity Handbook 2012 Edition, 6th ed.
United Kingdom: GreenStream Publishing, 2012.
[7] Photonic. (2012, 25 September). 12V Solar Panel.2012 [8] .J. Dunlop and B. Farhi, "Recommendations for Maximizing
Battery Life in Photovoltaic Systems: A Review of Lessons
Learned " Research Institute of the University of Central Florida, Washington, DC.2001
[9] G. B. Jenal, "Stand-Alone Photovoltaic (PV) System Design "
Universiti Teknikal Malaysia Melaka, Melaka, Malaysia 2009 [10] L. BAS. (2010), How to Size a Charge Controller. 2010
[11] M. F. B. Vaz, M. S. S. Kambli, M. S. N. Bhat, and M. K. V. Bhat,
"Cost Effective Irrigation and Fertigation System," IJSTE - International Journal of Science Technology & Engineering vol. 2
p. 4, March 2016.
[12] N. Stefan Matan, "Systems and Methods for Generating Renewable Energy," United State Patent, 2003.
[13] S. Ismail. “Rock Melon | Rock Melon Fertigation | Rock Melon”
TKPM. 2013 [14] J. O'Connor. (2012), Choosing a Lead Acid Battery for Solar
Charging.2012 [15] M. A. Maehlum. (2015), Which Solar Panel Type is Best? Mono-
vs. Polycrystalline vs. Thin Film
[16] J. E. M. Salih, A. H. Adom, and A. Y. M. Shaakaf, "Solar Powered Automated Fertigation Control System for Cucumis Melo L.
Cultivation in Green House," APCBEE Procedia, vol. 4, pp. 79-87,
2012/01/01 2012. [17] J. A. O’Connor, "Simple Switchmode Lead-Acid Battery Charger,"
Unitrode Application Note 1999.
[18] Reference. (n.d.). What is the Function of a Voltage Regulator? [19] T. L. Gibson and N. A. Kelly, "Solar Photovoltaic Charging of
Lithium-ion Batteries," Journal of Power Sources, vol. 195, pp.
3928-3932, 6/15/ 2010 [20] W. Solar. (n.d)., 26 Oct). An Introduction to Charge Controllers.
2017
[21] Emily, "Home-grown Rock Melons," in Ipoh's Community Newspaper, ed. Ipoh, Malaysia: Ipoh Echo, 2013.
[22] P. H. C. E. Staff. (2003, Understanding Solenoid Valves. 2003
[20] M. Fuentes, M. Vivar, J. M. Burgos, J. Aguilera, and J. A. Vacas, "Design of an Accurate, Low-Cost Autonomous Data Logger for
PV System Monitoring using Arduino™ that Complies with IEC
Standards," Solar Energy Materials and Solar Cells, vol. 130, pp. 529-543, 11// 2014.
[21] S. Armstrong, M. E. Glavin, and W. G. Hurley, "Comparison of
Battery Charging Algorithms for Stand-Alone Photovoltaic Systems," in 2008 IEEE Power Electronics Specialists Conference,
2008, pp. 1469-1475.
[22] M. E. Glavin, P. K. W. Chan, S. Armstrong, and W. G. Hurley, "A Stand-Alone Photovoltaic Supercapacitor Battery Hybrid Energy
Storage System," in Power Electronics and Motion Control
Conference, 2008. EPE-PEMC 2008. 13th, 2008, pp. 1688-1695. [27] F. Ongaro, S. Saggini, and P. Mattavelli, "Li-Ion Battery-
Supercapacitor Hybrid Storage System for a Long Lifetime,
Photovoltaic-Based Wireless Sensor Network," IEEE Transactions on Power Electronics, vol. 27, pp. 3944-3952, 2012.
0
2
4
6
8
10
12
14
0:00 12:00 0:00 12:00 0:00
Vo
ltag
e(V
)
Hour
Solar battery charger
Proceedings of 2017 Electrical Engineering Symposium (EES2017) - Vol. 1
5
Car Park Assistance using Fuzzy Logic
Muhamad Imran Bin Mazlan
Faculty of Electrical Engineering
Universiti Teknologi Malaysia
Johor Bahru, Malaysia.
Yahaya Bin Md Sam
Department of Control
Faculty of Electrical Engineering
Universiti Teknologi Malaysia
Johor Bahru, Malaysia.
Abstract — This paper develops and experimentally
demonstrates a parking mechanism for aiding drivers especially in
bad weather conditions or when driving alone for better safety
against intruders. In this project, 8 virtual sensors added to the
Fuzzy Logic system, which deliver self-decision making
mechanism for instructing the driver based on the car position for
his/her action upon parking. These virtual sensors, are divided to
4 different sections of a vehicle to demonstrate each position of the
car to the obstacle. This simulation results shows the output as the
ideal instruction for the driver in form of text displays, with the
inputs are directly from the virtual proximity sensors.
Keywords—Fuzzy Logic Control; Parking Assistance; Virtual
Proximity Sensor
I. INTRODUCTION
Fuzzy logic is the artificial intelligent algorithm that able to imitate human linguistic knowledge with numerical data. Human unable to think exactly specified in terms of numbers, but preferably in conceptual form. If we are encounter some situation with logic is required, it is almost impossible to confirm arguments whether it is true or not. With a decision we make, there is a little degree of membership of a thing in a concept [1]. Membership elements, which is a distinction key point between fuzzy signals and common digital signals, which provide range of values between true (1) and false (0). On the other hand, Fuzzy signals produce quite blur outputs like “merely true”, “almost true” and “nearly wrong”. In real world, there are lots of application with fuzzy logic control. Automatic Washing Machine is amongst the commercialized product powered by fuzzy logic control. For industrial application, fuzzy controllers and fuzzy reasoning have specific applications that are complicated and cannot be modeled correctly although the program undergo lots of assumptions and approximations. Therefore is not suitable to perform pixel perfect jobs [2]. Fuzzy logic works with a fuzzy set, which comprise one or more inputs to produce one output which the inputs are connected with logical operators such as AND, OR and NOT. These sequence of logical connectors connect each inputs to produce desired output.
As time flies, the world evolves to be even more globalized, hence quality life improves and a number of jobs are even more flexible, added to the reasons the car ownership grows exponentially these days. In fact, rate of vehicle ownership in Malaysia increases every year and the trend becomes a norm when Malaysia become the developed country status in 2020. According to Nielsen, Malaysia’s rate of car ownership is 93%
per citizen in 2014 [3], including 54% of them coincidence for multiple car owners that listed Malaysia was the third highest in car ownership by that particular year. However, the intention for Malaysians to acquire a car within next 2 years was 71%, slightly higher from the global average, 65%. If the rate keep increasing, parking are more demanding in the future especially in urban areas where people works [3]. Even though there are lots of public transportation in urban areas especially in Kuala Lumpur such public bus, monorails and Light Rail Transit (LRT) but essentially it doesn’t enough to cope with the fast rate of car ownership over time and inadequate amount of parking will be an issue in the future. Even though city councils put their best effort to minimize car usage especially in hotspot areas where traffic jams are daily routines, but their common ways of increase the parking fees are not truly effective. Hence most road user opted to park somewhere at the roadsides as couldn’t afford to park their car in the paid parking area.
II. PROBLEM BACKGROUND
From the situation described in introduction, this project is aimed at developing a fuzzy controlled parking for current road cars. The objective is to help drivers to park correctly in a tight parking spaces especially in urban areas. This is essential for road users especially for newly graduated drivers from driving schools as they did not receive proper parking practice during learning in driving school. Malaysia’s driver licensing system require minimum 10 hours of practice before endure the driving test conducted by Road Transportation Officer to pass the test. There are lots of different parking positions in real life which is not covered in the curriculum itself, which more or less make drivers hesitant to do proper parking at tighter position, hence lead to double-parking.
Parking which is the most crucial part in driving, and every driver should master it. However drivers are facing a scenario when the driver face problems to see obstacles during parking on his seat. There are couple of blind spots, which is a region where a driver cannot see the area which are not covered by side mirrors and rear mirror. Even though advanced technologies such as rear parking beep sensors and parking cameras already come into road cars, but all of them have their own specialties and deficiencies.
In this project, the purpose of implementing fuzzy control is to reduce human elements to assist parking which helps the driver to park their vehicles. In real life, passenger sometimes help the driver a little bit when parking with scouting outside the car to see the right position of the car, and telling the driver in
Proceedings of 2017 Electrical Engineering Symposium (EES2017) - Vol. 1
6

which direction of steering wheel he need to spin. In case of the driver drives alone, it’s hard for them to determine the car position alone as he/she has to estimate the car position without knowing the exact angle of the car pointed during parking especially for road rookies. In short, this project promotes an alternative for road users to park with assisted texts, which is derived from the current technology available in market.
A. Related Technologies of Parking Assistance in Existing
Cars
Driving assist evolves these days, thanks to electronics development to improve driving which led to less driving distraction. From traction control to limit wheel spin during acceleration and wet surface drive to the active suspension which let the car maintains its height in all moments during the drive – including hard braking and massive acceleration to the parking assistance which evolves from rear parking sensor, to the parking cameras which currently available in the market.
Fig. 1. Reverse Parking Sensor System on Suzuki Swift
First of all, Reverse parking sensor system, as shown in figure 1 normally uses proximity sensors such as ultrasonic sensors to detect obstacles during car reversing [4]. Literally these devices exists widely in cars with low-tier or mid-tier pricing. Malaysian carmakers, Proton and Perodua are still stick to this parking assist sensor for most of their models. There are two to four sensors attached at the back bumper of a vehicle varies with different carmaker and models. These sensors produce acoustic pulses, with a control obstacles behind. The system will notify the drivers with beep sound based on the distance between the vehicle and the obstacles. The rate of the beep sound getting faster when it is closer to obstacles. Since the system is amongst the cheapest in current market and available with OEM aftermarket accessories, therefore the system is still active and available in market. However, this system is only applicable to reverse parking style only, as it is not installed at the front with assumption it is the driver’s view and driver him/herself may do a decision making when parking.
Fig. 2. Rear Parking Camera
Rear parking camera is the camera installed at the back of the car, and connected to the cockpit of the car or the screen of audio display to show the image of the rear view of the car to alleviate rear blind spot [4], so the driver can decide how to park their cars. Basically their design is different with other type of cameras as they display horizontally flipped image, so called mirror image. This is a must as the camera and driver may face opposite direction. The camera’s right is the driver’s left and the other way round. The camera positioned at the rear bumper with downward angles which display potential obstacle on the ground and approaching walls and typically uses wide lens or fish eye lens to aid larger view angle.
Even though the camera shows the rear image, their exact distance from the car cannot determined correctly as it spoils camera ability to see faraway objects which is a drawback of this technology. Even it works when parking in the cities, but improper lighting may hurt and led to misjudging.
III. METHODOLOGY
From the car model, 8 virtual proximity sensors are used and placed at selected side of the car. Theoretically, the space between the sensors is 45 degrees per sensor for better grasp of the car position. However, most obvious problem observed in real life parking situation is dealing with front and rear edges of the car. So the sensor position slightly adjusted to match with real life situation as shown in figure 1 and 2
A. Fuzzy Logic Rules Set
As mentioned above, the first step of building the system is creating fuzzy rules and table 1 shows the position where these sensors are located.
TABLE I. TABLE OF SENSORS ASSIGNMENT
Virtual Sensor number Sensor Position
1 Front
2 Left_Front
3 Left
4 Left_Rear
Proceedings of 2017 Electrical Engineering Symposium (EES2017) - Vol. 1
7

Virtual Sensor number Sensor Position
5 Rear
6 Right_Rear
7 Right
8 Right_Front
From these 8 sensors above, they are separated into 4
different sensor combination due to their position and detection,
which require 4 different fuzzy rules to implement to produce
desired output. As shown in figure 2, the car is divided into 4
parts which 3 sensors are used in each part to create a decision
making which implemented using fuzzy logic. Table 2 shows
the combination of the sensors for single fuzzy rules.
TABLE II. SENSOR COMBINATIONS AND ITS RESPECTIVE POSITIONS
Virtual Sensors
Combination Sensor Positions
1 Front - Left Front - Left
2 Left – Rear Left – Rear
3 Rear – Rear Right – Right
4 Right – Front Right - Front
From table 2, there are 4 positions of the sensors which
overlap between each rules. Non-edge sensors are overlap
within 2 rules which used to synchronize between 2 sets of rule.
Initial test of using 2 positions of each combination gives
simpler fuzzy rules but inaccurate car position during parking
event occurs especially at a place which don’t have proper
parking lots.
Since there are 4 fuzzy rules to make the system. Table 3, 4,
5, and 6 are further explained the rules for each virtual sensor
combinations.
TABLE III. FUZZY RULES FOR VIRTUAL SENSORS COMBINATION 1
No Input Sensor Position
Output Left Front Front Left
1 Far Far Far Choose Your Direction
2 Far Far Close Move slightly forward or
left
3 Far Far Too Close Forward only
4 Far Close Far OK
5 Far Close Close Move Slightly Forward
6 Far Close Too Close Move slightly forward or
left
7 Far Too
Close Far OK
8 Far Too
Close Close OK
9 Far Too
Close Too Close OK
10 Close Far Far Move slightly forward or
left
11 Close Far Close Move Slightly Left
12 Close Far Too Close Forward only
13 Close Close Far Move Slightly Left
14 Close Close Close Move slightly forward or
left
15 Close Close Too Close Move Slightly Forward
16 Close Too
Close Far OK
17 Close Too
Close Close OK
18 Close Too
Close Too Close OK
19 Too Close Far Far Forward only
20 Too Close Far Close Forward only
21 Too Close Far Too Close Forward only
22 Too Close Close Far Move Slightly Forward
23 Too Close Close Close Forward only
24 Too Close Close Too Close Move Slightly Forward
25 Too Close Too
Close Far OK
26 Too Close Too
Close Close OK
27 Too Close Too
Close Too Close OK
TABLE IV. FUZZY RULES FOR VIRTUAL SENSORS COMBINATION 2
No Input Sensor Position
Output Left Rear Rear Left
1 Far Far Far Choose Your Direction
2 Far Far Close Reverse Slightly or left
3 Far Far Too
Close Reverse only
4 Far Close Far OK
5 Far Close Close Reverse slightly
6 Far Close Too
Close Reverse Slightly or left
7 Far Too Close Far OK
8 Far Too Close Close OK
9 Far Too Close Too
Close OK
10 Close Far Far Reverse Slightly or left
11 Close Far Close Reverse Slightly Left
12 Close Far Too
Close Reverse only
13 Close Close Far Reverse Slightly Left
14 Close Close Close Reverse Slightly or left
15 Close Close Too
Close Reverse Slightly or right
16 Close Too Close Far Reverse Slightly Left
17 Close Too Close Close OK
18 Close Too Close Too
Close OK
19 Too Close Far Far Reverse only
20 Too Close Far Close Reverse Slightly or right
21 Too Close Far Too
Close Reverse only
22 Too Close Close Far Reverse slightly
23 Too Close Close Close Reverse slightly
24 Too Close Close Too
Close Reverse only
25 Too Close Too Close Far OK
26 Too Close Too Close Close OK
27 Too Close Too Close Too
Close OK
Proceedings of 2017 Electrical Engineering Symposium (EES2017) - Vol. 1
8
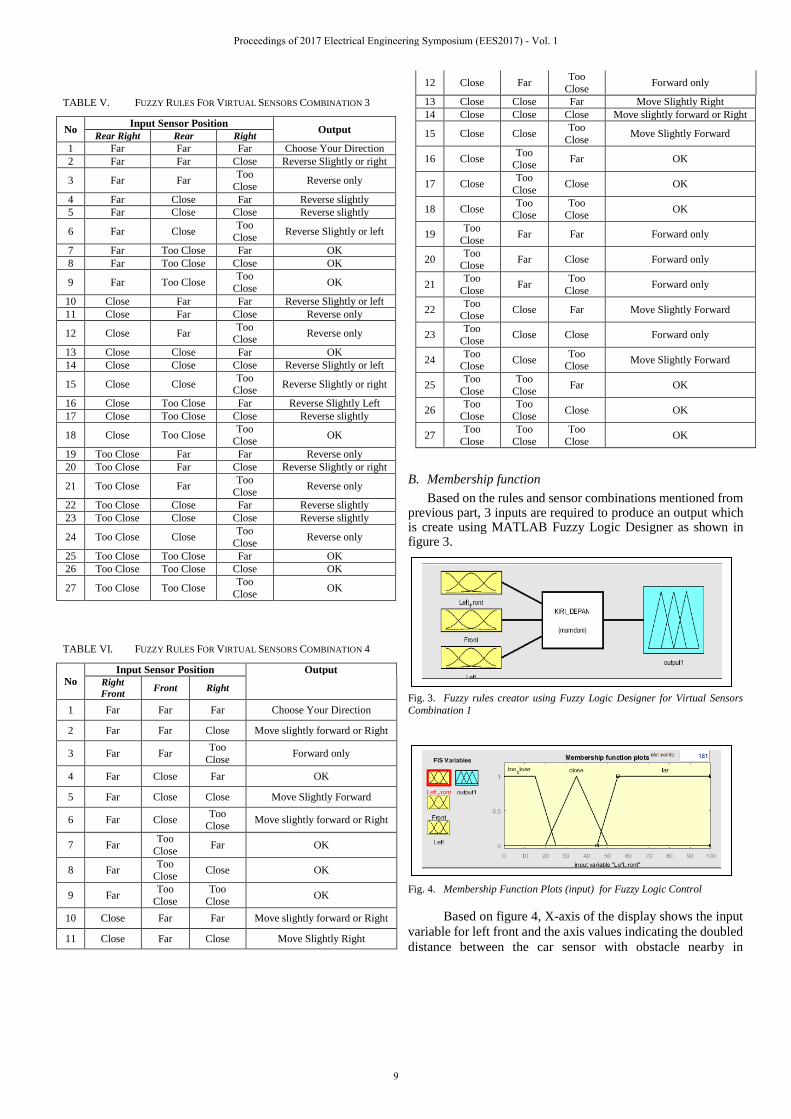
TABLE V. FUZZY RULES FOR VIRTUAL SENSORS COMBINATION 3
No Input Sensor Position
Output Rear Right Rear Right
1 Far Far Far Choose Your Direction
2 Far Far Close Reverse Slightly or right
3 Far Far Too
Close Reverse only
4 Far Close Far Reverse slightly
5 Far Close Close Reverse slightly
6 Far Close Too
Close Reverse Slightly or left
7 Far Too Close Far OK
8 Far Too Close Close OK
9 Far Too Close Too
Close OK
10 Close Far Far Reverse Slightly or left
11 Close Far Close Reverse only
12 Close Far Too
Close Reverse only
13 Close Close Far OK
14 Close Close Close Reverse Slightly or left
15 Close Close Too
Close Reverse Slightly or right
16 Close Too Close Far Reverse Slightly Left
17 Close Too Close Close Reverse slightly
18 Close Too Close Too
Close OK
19 Too Close Far Far Reverse only
20 Too Close Far Close Reverse Slightly or right
21 Too Close Far Too
Close Reverse only
22 Too Close Close Far Reverse slightly
23 Too Close Close Close Reverse slightly
24 Too Close Close Too
Close Reverse only
25 Too Close Too Close Far OK
26 Too Close Too Close Close OK
27 Too Close Too Close Too
Close OK
TABLE VI. FUZZY RULES FOR VIRTUAL SENSORS COMBINATION 4
No Input Sensor Position Output
Right
Front Front Right
1 Far Far Far Choose Your Direction
2 Far Far Close Move slightly forward or Right
3 Far Far Too
Close Forward only
4 Far Close Far OK
5 Far Close Close Move Slightly Forward
6 Far Close Too
Close Move slightly forward or Right
7 Far Too
Close Far OK
8 Far Too
Close Close OK
9 Far Too
Close
Too
Close OK
10 Close Far Far Move slightly forward or Right
11 Close Far Close Move Slightly Right
12 Close Far Too
Close Forward only
13 Close Close Far Move Slightly Right
14 Close Close Close Move slightly forward or Right
15 Close Close Too
Close Move Slightly Forward
16 Close Too
Close Far OK
17 Close Too
Close Close OK
18 Close Too
Close Too
Close OK
19 Too
Close Far Far Forward only
20 Too
Close Far Close Forward only
21 Too
Close Far
Too
Close Forward only
22 Too
Close Close Far Move Slightly Forward
23 Too
Close Close Close Forward only
24 Too
Close Close
Too Close
Move Slightly Forward
25 Too
Close
Too
Close Far OK
26 Too
Close
Too
Close Close OK
27 Too
Close
Too
Close
Too
Close OK
B. Membership function
Based on the rules and sensor combinations mentioned from previous part, 3 inputs are required to produce an output which is create using MATLAB Fuzzy Logic Designer as shown in figure 3.
Fig. 3. Fuzzy rules creator using Fuzzy Logic Designer for Virtual Sensors
Combination 1
Fig. 4. Membership Function Plots (input) for Fuzzy Logic Control
Based on figure 4, X-axis of the display shows the input
variable for left front and the axis values indicating the doubled
distance between the car sensor with obstacle nearby in
Proceedings of 2017 Electrical Engineering Symposium (EES2017) - Vol. 1
9

centimeter unit. However for left and right sensors, the input
variable is 4 times than the input range shown in figure 4 with
consideration to open and close the door for passenger to go in
and out of the car. Too_close membership lies between 0 cm
to 50 cm in which the sensed point of a car is too close with the
obstacle. Close membership lies from 40 cm to 100 cm and far
membership lies from 90cm onwards. Assume the car
symmetrical setup which all tyres possessed with same pressure
and all the sensors are placed at the same height from the road
in the car, then same membership functions for input sensors
are identical for all 8 sensors used.
Fig. 5. Membership Function Plots (output) for Fuzzy Logic Control
Based on figure 5, the output members are not overlap
between each other as it is for fulfill the inputs desired outcome
for right rear parking situation. Overall, there are 7 desired
outputs which its range is almost identically distributed in a
range between 0 and 1 for output variable.
Membership function for the output is almost equally
distributed and ranged 0.14 per output. In this part, the
membership function is the test displayed instruction for the
drivers during parking. Table VII shows the parameters of the
membership function with all members are using triangular
membership function.
TABLE VII. PARAMETERS OF MEMBERSHIP FUNCTIONS
Membership Function
Parameters Instructions (Output)
[0 0.07 0.14] Slightly_Backward_or_Right
[0.14 0.21 0.28] Slightly_Reverse
[0.28 0.35 0.42] Reverse_only
[0.42 0.49 0.56] Choose_Your_Direction
[0.56 0.63 0.7] Slight_left_reverse
[0.7 0.77 0.84] Reverse_slight_right
[0.84 0.92 1] OK
C. Operation
Basically the operation starts when the car stop. Assuming the cars not driven over 20 km/h during parking event, the sensor starts working with display “choose your direction”. Once the driver seeking for right parking position, then the fuzzy logic interact between each other hence producing outputs as shown in table III, IV, V and VI.
D. SIMULINK simulation
Fig. 6. Simulink simulation for full model
From figure 6, it is the initial simulation of the project
where the sensor is replaced with constants, assuming the value
of the constant is defined as the distance of the input sensors to
the obstacle near to it. For the outputs, as of now, they are
displayed using scopes in form of graph as ways to convert the
output to word is still in progress.
IV. RESULTS
Since the desired output in form of text is still in progress, here are some initial results that displayed using oscilloscope. The results shown below is the result which using constant input where the car is static.
A. Constant Input
Based on figure 6, assuming a situation where car is
currently placed between 2 cars in a parking lot as shown in
figure 7.
Fig. 7. Car Parking between 2 cars
When the distance of a car to each front and rear is
around 40 cm and facing obstacle 60 cm from the left side.
Meanwhile the sensor edges are 54 cm from obstacle which
is the front and rear car, subjected to 40° turn from front and
rear sensor. When a simulation run with all the parameters
filled as in figure 6, the output in form of graph pops out as
shown in figure 8.
Proceedings of 2017 Electrical Engineering Symposium (EES2017) - Vol. 1
10
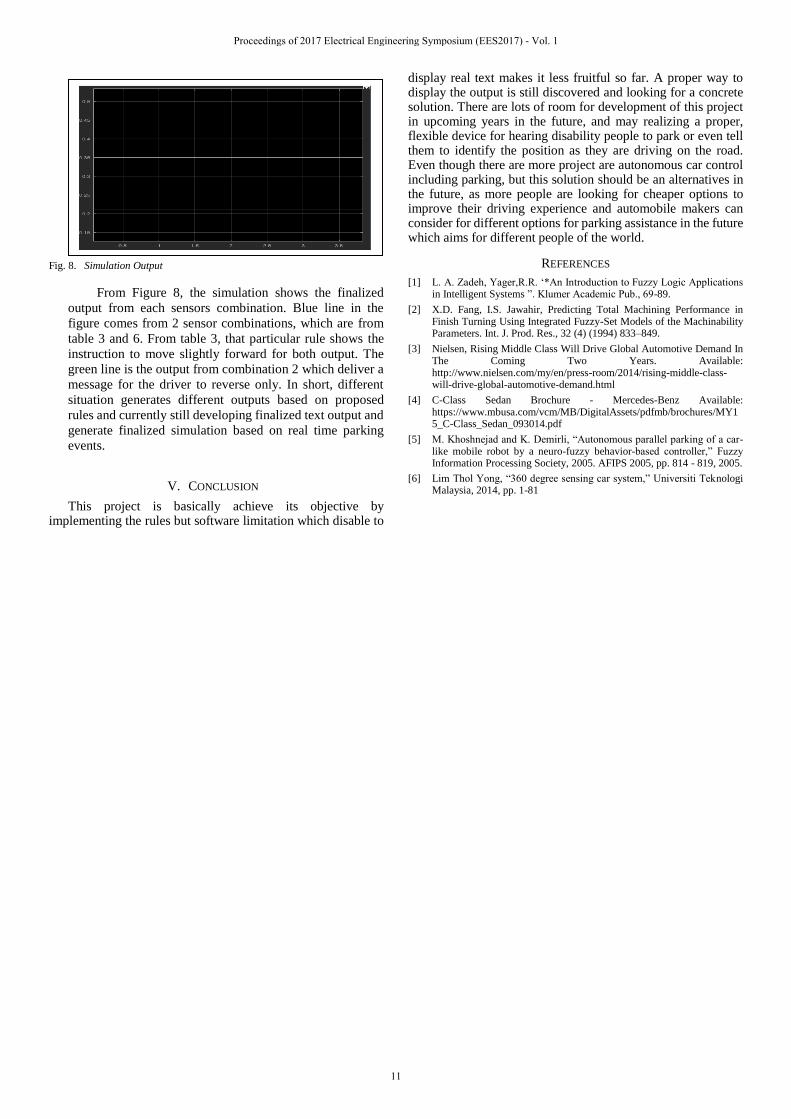
Fig. 8. Simulation Output
From Figure 8, the simulation shows the finalized
output from each sensors combination. Blue line in the
figure comes from 2 sensor combinations, which are from
table 3 and 6. From table 3, that particular rule shows the
instruction to move slightly forward for both output. The
green line is the output from combination 2 which deliver a
message for the driver to reverse only. In short, different
situation generates different outputs based on proposed
rules and currently still developing finalized text output and
generate finalized simulation based on real time parking
events.
V. CONCLUSION
This project is basically achieve its objective by implementing the rules but software limitation which disable to
display real text makes it less fruitful so far. A proper way to display the output is still discovered and looking for a concrete solution. There are lots of room for development of this project in upcoming years in the future, and may realizing a proper, flexible device for hearing disability people to park or even tell them to identify the position as they are driving on the road. Even though there are more project are autonomous car control including parking, but this solution should be an alternatives in the future, as more people are looking for cheaper options to improve their driving experience and automobile makers can consider for different options for parking assistance in the future which aims for different people of the world.
REFERENCES
[1] L. A. Zadeh, Yager,R.R. ‘*An Introduction to Fuzzy Logic Applications in Intelligent Systems ”. Klumer Academic Pub., 69-89.
[2] X.D. Fang, I.S. Jawahir, Predicting Total Machining Performance in Finish Turning Using Integrated Fuzzy-Set Models of the Machinability Parameters. Int. J. Prod. Res., 32 (4) (1994) 833–849.
[3] Nielsen, Rising Middle Class Will Drive Global Automotive Demand In The Coming Two Years. Available: http://www.nielsen.com/my/en/press-room/2014/rising-middle-class-will-drive-global-automotive-demand.html
[4] C-Class Sedan Brochure - Mercedes-Benz Available: https://www.mbusa.com/vcm/MB/DigitalAssets/pdfmb/brochures/MY15_C-Class_Sedan_093014.pdf
[5] M. Khoshnejad and K. Demirli, “Autonomous parallel parking of a car-like mobile robot by a neuro-fuzzy behavior-based controller,” Fuzzy Information Processing Society, 2005. AFIPS 2005, pp. 814 - 819, 2005.
[6] Lim Thol Yong, “360 degree sensing car system,” Universiti Teknologi Malaysia, 2014, pp. 1-81
Proceedings of 2017 Electrical Engineering Symposium (EES2017) - Vol. 1
11
Modelling and Simulation of Controller for Active
Suspension System
Choo Yong Chien
Faculty of Electrical Engineering
Universiti Teknologi Malaysia
Johor Bahru, Malaysia.
Yahaya Md Sam
Department of Control and Mechatronic Engineering
Faculty of Electrical Engineering
Universiti Teknologi Malaysia
Johor Bahru, Malaysia.
Abstract—The conventional suspension system on the car is
known as passive suspension system and the behavior of the
suspension system is fixed based on proper design. The response
on the system is rigid no matter how the road profile is. Therefore,
this work will focus on designing a suspension system that the
behavior of the system will be adjusted based on the road profile
that the car will pass through and the system is known as active
suspension system. The controllers for the active suspension
system proposed are state feedback controllers that designed
based on Linear Quadratic Regulator (LQR) and Linear
Quadratic Gaussian (LQG) concept. The state variables of the
passive suspension system model should be measurable and feed
to the controller in order to operate the force actuator installed on
the passive suspension system. The active suspension systems
designed should improve the ride comfort by a realistic and
achievable way. This was achieved in this work by focusing on
reducing the vertical displacement of car body without exceed the
limit of the suspension travel that allow to be. The performance of
LQR and LQG controller were verified by simulating the active
suspension systems on the quarter car model in Simulink and the
result shows that the controller work properly.
Keywords—active suspension system, quarter car model, LQR,
LQG
I. INTRODUCTION
The suspension system of a car consists of tires, spring, shock absorber and the linkage which connecting the car body and the wheel to allow a relative motion between the wheel and the car body. It is an important component that must have in every vehicle as it absorbs the road shock experienced by the wheel and prevents the shock being transmitted to the car body and thus reduce the impact of the road shock on the car body. Therefore, the main function of the suspension system is support the vehicle body and increase ride comfort [1]. There are four parameters that are represent the performance of a suspension system significantly, the parameters are ride comfort, body motion, road handling and suspension deflection [2].
Ride comfort is defined as how comfortable the driving experience is. Ride comfort is affected by the body motion of the car. Body motion is the motion of the car body due to an external disturbance from the road surface. On the other hand, road handling ability of a vehicle is the ability of the vehicle wheel to stay contact with the road surface so that the vehicle will not out of control as the vehicle is uncontrollable if it does
not contact with the road surface. Lastly, the suspension deflection refers to the deflection of the suspension system when a force exert on it. The deflection should be so low as possible so that the relative displacement between the wheel that connect to the suspension system and the road surface [3] will be lower and the wheel will keep grip with the road surface in order to have a smooth drive.
Currently, there are three types of suspension system, they are passive, semi-active and active suspension system. The passive suspension system consists of a spring and a damper to store the energy from the road surface in the spring and dissipate it by the damper [4]. In Semi-active suspension system, the damping force of the damper can be modulated based on the operating conditions that varies with the road surface. Active suspension system consists a force actuator to counter the force acting on the wheel due to the road surface.
The performance of a suspension system is determined by the road handling and ride comfort of the vehicle that the system installed in. The road handling and ride comfort are conflicting each other [5] due to the response of the suspension system. The behavior of the passive suspension is rigid and this will cause the performance of the system is depend on the road profile and caused an imbalance result in terms of comfort and road handling ability.
This project focuses on the active suspension to design a suitable controller for the force actuator to improve the performance of the suspension system by altering the behavior of the system in an acceptable range.
II. LITERATURE REVIEW
Quarter car model, as stated in name it is the model of a quarter of a full car. The quarter car model do not represent the geometric effects of a full car model such as the rolling effect due to the unsynchronized road input profile that acting on each of the wheel and the pitching effect due to a change in the center of mass of the car when a sudden brake. However, it contains the most basic features of the real problem and includes a proper representation of problem of controlling wheel and wheel-body load variation [6]. Fig. 1 shows the schematic diagram that represent the basic quarter car model that based on passive suspension system [6].
Proceedings of 2017 Electrical Engineering Symposium (EES2017) - Vol. 1
12

Fig. 1. Quarter car model with passive suspension system
The elastic and damping characteristics of the system is designed based on specific requirement and the parameter is fixed. Therefore, it shows a poor performance when the road profile is keep changing and deviate from the condition used during design the passive suspension system.
Active suspension system is another way to modify the passive suspension system by installing a force actuator parallel with the damper and the spring to counter the force acting on the wheel due to the road surface [7]. The force actuator in the system is controlled by a controller to give an output force to minimize the force due to the road input profile and the force generated is based on the feedback from the active suspension system. In order to get a great performance in terms of ride comfort and road handling, the controller require an effective control strategy in order to get a good performance in both terms. Fig. 2 shows the detailed structure of a basic active suspension system [8].
Fig. 2. Quarter car model with passive suspension system
The design strategy that will be focused on this thesis is state feedback controller. State-feedback control is a powerful tool for designing a controller for active suspension system [20]. The state variables are chosen based on the requirement and become the inputs for the state feedback controller. Hence, different state variable may be chosen and give a different result by same approach. To design a state feedback controller, the state variable must be measurable and must be available for feedback to the controller. It gives a clearer relationship between the controller parameters and controller behavior. This strategy was done and the result shows an improvement on the performance of the active suspension system [20].
The first type of state feedback controller is controller with pole placement control design. In this method, the closed loop poles of the system should be lied at the desired position depend on the requirement after the controller is installed in the system. This means that all the zeroes and poles should be manipulated
and forced to be lied at specific desired location. Since the closed loop pole is at the desired location, the output of the system should be match with the design specification.
Linear Quadratic Regulator (LQR) is another approach to implement a state feedback controller. LQR is one of the solution to solve the LQG problems, one of the fundamental question in control design. The performance of the controller design is greatly depend on the weighting factor that determined and applied on a specific state vector. The active suspension system may not able to reduce the amplitude of the important parameters in the system if the controller was not designed properly [9].
In LQR controller, it is assumed that all the state variable is measurable and available for the controller all the time. This is unrealistic as all the state variable need to be measured accurately and this is hard to achieve due to the disturbance of noise. When the state variable is not fully observable and available, there is another technique to design a state feedback controller known as Linear Quadratic Gaussian (LQG) control. LQG is the optimal controller obtained as the combination of an optimal LQR state feedback gain with feedback from estimates from an optimal Linear Quadratic Estimator (LQE) without measuring the actual state variable. Hence, not all the state variable need to be measured and feed to the controller although the design of the controller involving all the state variables.
There are some advanced design strategies to implement a controller for active suspension system such as fuzzy self-tuning PID controller that is very effective and can be used in vehicles that will be manufactured in future[10]. But the design algorithm is complex and hard to design a suitable rule base for the controller. The other strategy to design the controller are variable structure control with sliding mode [11], adaptive controller [12], H∞ control [13], and by neural network [14] were developed by researchers.
III. METHODOLOGY
First, the quarter car model for passive and active suspension system is established so that the models can be represent in mathematical expression in terms of state space equation. After that, the controllers is designed based on pole placement control design, LQR and lastly LQG approach. Lastly, a suitable road input profile is modelled to verify the performance of the suspension systems.
A. Mathematical modelling for suspension systems
The mathematical expression is obtained start from identifying the motion of the wheel and the car body when there is a road input profile. Fig. 3 shows the schematic diagram for an active suspension system.
Proceedings of 2017 Electrical Engineering Symposium (EES2017) - Vol. 1
13

Fig. 3. Quarter car model with passive suspension system
Table I shows the related parameter in the active suspension system whereas Table II shows the related variables for the mathematical expression for the active suspension system.
TABLE I. PARAMETER IN ACTIVE SUSPENSION SYSTEM
Parameter Symbol Value
Mass of car body
(sprung mass)
Mb 350 kg
Mass of wheel
(unsprung mass)
Mw 40 kg
Dumper Bs 1000 Ns/m
Suspension spring (spring stiffness)
Ks 15000 N/m
Tire spring (tire
stiffness)
Kt 150000 N/m
TABLE II. VARIABLE IN ACTIVE SUSPENSION SYSTEM
Related variable Symbol
Vertical displacement of car body Xb
Vertical velocity of car body Xb
Vertical acceleration of car body Xb
Vertical displacement of car wheel Xw
Vertical velocity of car wheel Xw
Vertical acceleration of car wheel Xw
Road input profile Xi
Actuator force Fs
The derivation of the mathematical expression start with identify the motion equation of Mb, the mass of car body and Mw, the mass of wheel based on Fig. 1.
For Mb:
MbXb = Fs - Bs (Xb – Xw) – Ks (Xb - Xw)
For Mw:
MwXw = - Fs - Bs (Xw – Xb) - Ks (Xw – Xb) – Kt (Xw - Xi)
Equation (1) and Equation (2) are then rewrite in state space equation form and the equation represent the mathematical model for the active suspension system:
x = 𝐴x+𝐵𝑢+𝐸z
x =
[ −𝐵𝑠
𝑀𝑏
−𝐾𝑠
𝑀𝑏
𝐵𝑠
𝑀𝑏
𝐾𝑠
𝑀𝑏
1 0 0 0𝐵𝑠
𝑀𝑤
𝐾𝑠
𝑀𝑤
−𝐵𝑠
𝑀𝑤
−(𝐾𝑠+𝐾𝑡)
𝑀𝑤
0 0 1 0 ]
x+
[
1
𝑀𝑏
0−1
𝑀𝑤
0 ]
𝑢+
[ 00𝐾𝑡
𝑀𝑤
0 ]
z
Where x is equal to [Xb Xb Xw Xw] T, x is equal to [Xb Xb Xw
Xw] T, u is equal to [Fs] and z is equal to [Xi].
After substituting what value of parameters, Equation (3) become:
x =
[ −20
7
−300
7
20
7
300
7
1 0 0 0
25 375 −25 −4125
0 0 1 0 ] x+
[
1
350
0−1
40
0 ]
𝑢+[
00
37500
]z
The difference between active and passive suspension system is only that the extra force actuator present in active suspension system. Therefore, the mathematical model for active suspension system can be convert into mathematical model for passive suspension system by remove the force actuator from the system by let the actuator force become zero at all time. The mathematical model for passive suspension system is represent by Equation (5) shown in below:
x =
[ −20
7
−300
7
20
7
300
7
1 0 0 0
25 375 −25 4125
0 0 1 0 ] x +[
00
37500
]z
B. Controller design by pole placement method
First, let the actuator force, u is based on the feedback signal of the state vector, x.
u = -kx
Where k is equal to [k1 k2 k3 k4] T.
Substituting Equation (6) into Equation (4):
x =
[ −20
7−
𝑘1
350
−300
7−
𝑘2
350
20
7−
𝑘3
350
300
7−
𝑘4
350
1 0 0 0
25 +𝑘1
40375 +
𝑘2
40−25 +
𝑘3
404125 +
𝑘4
40
0 0 1 0 ]
x+[
00
37500
]z
Since the aim of the controller is to reduce the vertical displacement of the car body, the only output of the compensated system that need to be obtain is the vertical displacement of the car body, Xb.
y = 𝐻x
y = [0 1 0 0]x
Where y is equal to [Xb].
Proceedings of 2017 Electrical Engineering Symposium (EES2017) - Vol. 1
14

The transfer function, T(s) that relating the input of the system, Xi(s) and the output of the system, Xb(s) is shown in Equation (9):
T(s) =𝑋𝑏(𝑠)
𝑋𝑖(𝑠)
T(s) =10.714(𝑠+
15000−𝑘41000−𝑘3
)(1000−𝑘3)
𝑠4+(𝑘1350
−𝑘340
+27.86)𝑠3+(𝑘2350
−𝑘440
+4167.86)𝑠2
+(10.714𝑘1+10714.29)𝑠+(10.714𝑘2+160714.29)
In order to manipulate T(s), all the zeroes and poles in T(s) must be under controlled. From Equation (9) we know that T(s) contains one zero and four poles and each of them need to be adjustable. Since T(s) is only consists of four adjustable parameter from k, therefore it is not possible to manipulate all the zero and poles in order to generate a desired output as there are five terms that need to be manipulated in T(s) .
In conclusion, the force actuator is not suitable to be controlled by the controller that designed based on pole placement method.
C. Controller design by LQR method
In LQR controller, the actuator force, u is still based on the feedback signal of the state variable, which means u is equal to the product of current value of the state vector and a constant gain vector, k as stated in Equation (6).
The control input, u(t) should minimize the performance index, J that represent the performance characteristic requirement related to x(t) as well as the controller input limitation related to u(t). The expression of J is shown in Equation (10).
J = ∫ (𝑥𝑇𝑄𝑥 + 𝑢𝑇𝑅𝑢) 𝑑𝑡∞
0
The design start by considering Equation (3) as:
x = Ax+𝐵𝑢
Where:
A =
[ −20
7
−300
7
20
7
300
7
1 0 0 0
25 375 −25 −4125
0 0 1 0 ] , B=[
00
37500
]
Then the LQR controller has the following form:
u(t)=-R-1BTPx(t) = -kx(t)
And P can be calculated by algebraic Riccati equation:
PA+ATP-PBR-1BTP+Q=0
Where Q and R are the controller design parameters with the condition of Q and R must be greater than zero. In this project, the value of Q and R are determined based on output weighting that Q and R are chosen based on the output that want to keep small, which is stated in Equation (8).
Let:
Q = α*HTH = α*[
0 0 0 0
0 1 0 0
0 0 0 0
0 0 0 0
]
And
R = β
Where α and β are the tuning parameters. The large value of Q indicates that the controller stabilize the system with least possible change in x(t) whereas a small value of R indicates that the controller is stabilizing the system with more energy.
By letting α = 5000 and β = 0.0001, k is equal to [524.7 1583.1 5.7 –1366.7] and u(t) is equal to [-524.7 -1583.1 -5.7 1366.7]*x(t).
The value of R is very small because the impact of the force from the actuator is very small as the mass of the car body is very big and lots of energy is required to move it. The value of Q is large as the magnitude of Xb is too small and is insignificant in order to design the controller.
D. Controller design by LQG method
LQG control is achieved by combining a LQR control law and a LQE as an observer to estimate the value of state variables. Based on separation principle, LQE and LQR in the LQG controller can be designed independently.
The aim of designing the LQE is to reduce the state variable that need to be measured from the actual active suspension system by designing an estimator to estimate all the state variable by only a single state variable from the real system. Kalman Filter is chosen as the LQE for the system.
The equation that represent the Kalman filter is:
x = Ax + Bu + L(y-Cx )
Where L is the optimal estimator gain which is calculated by the equation of:
L=PCR-1
And P is calculated based on the algebraic Riccati equation stated in Equation (18).
AP+PAT+PCTR-1CP+Q=0
Where Q and R are the tuning parameter. R is related to how noisy the output sensor is and Q is related to how rough the
Proceedings of 2017 Electrical Engineering Symposium (EES2017) - Vol. 1
15
system is. Since this project is not involving any hardware, the value of Q and R are set as 1.
The matrix C is depend on which state variable is chosen as the input for the estimator. In this project, the estimator is design based on the state variable, Xb and the matrix C is equal to matrix H stated in Equation (8).
The value of L calculated is [10.2268 4.5226 -207.5524 1.4165] T. The estimator is verified by matlab via Simulink and the estimated state variable is almost identical with the state variable of the simulated active suspension system.
For the LQR in the LQG controller, the LQR controller designed before is used to test the difference between the performance of the force actuator that drive based on the actual state variable and the estimated state variable.
E. Modelling of road input profile
One of the common road disturbance is due to the presence of bump that force the drive to speed down the speed of vehicle or else suffer from the vibration acting on the car body when the car across the bump. Since the main function of bump is to alert driver to slow down before but not when across the bump, the uncomfortable feeling should be reduced but not eliminated so that the bump is still will be alerted by the driver. The mathematical expression for a bump is as shown Equation (19) [15]:
𝑟(𝑡) = 𝑎
2(1 − 8𝑐𝑜𝑠𝜋𝑡)
Where r(t) road profile, a is the amplitude of the bump and t is the time that the car across the bump. In this project, Xi is defined as shown in Equation (20):
𝑥𝑖 =
𝑎1
2(1 − 𝑐𝑜𝑠 8𝜋𝑡) ; 0.5 ≤ 𝑡 ≤ 0.75
𝑎2
2(1 − 𝑐𝑜𝑠 8𝜋𝑡) ; 3 ≤ 𝑡 ≤ 3.25
0 ; 𝑒𝑙𝑠𝑒𝑤ℎ𝑒𝑟𝑒
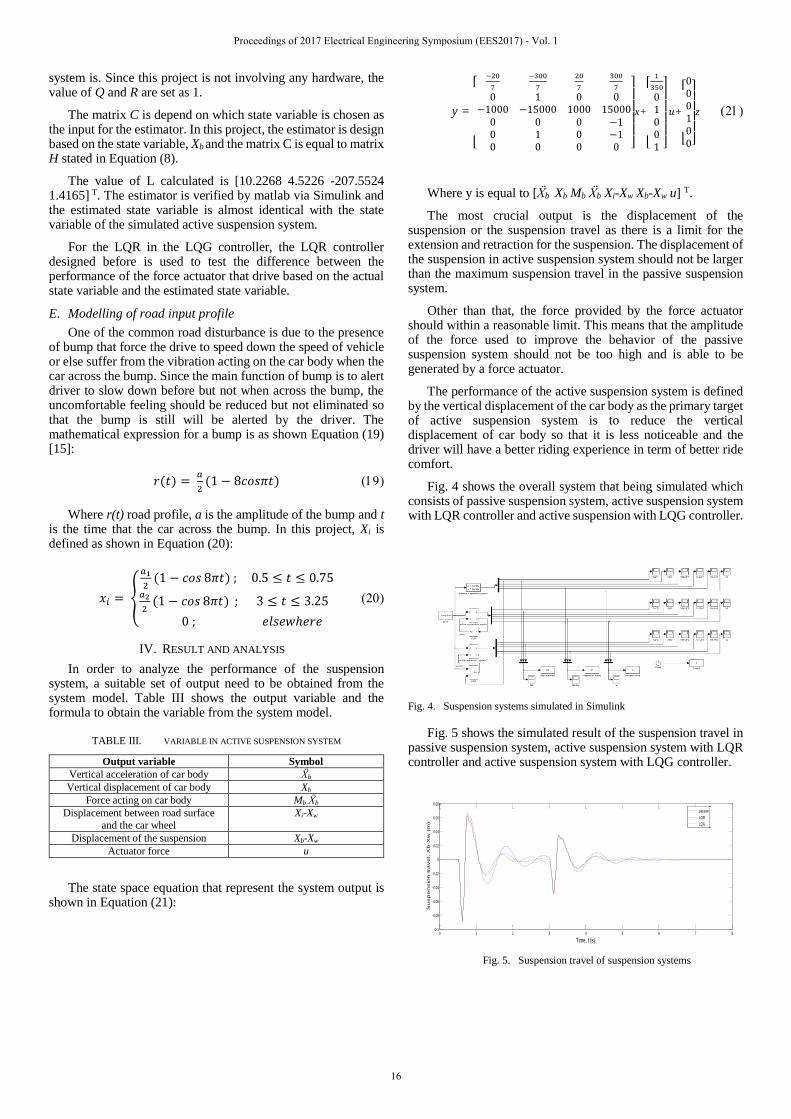
IV. RESULT AND ANALYSIS
In order to analyze the performance of the suspension system, a suitable set of output need to be obtained from the system model. Table III shows the output variable and the formula to obtain the variable from the system model.
TABLE III. VARIABLE IN ACTIVE SUSPENSION SYSTEM
Output variable Symbol
Vertical acceleration of car body Xb
Vertical displacement of car body Xb
Force acting on car body Mb Xb
Displacement between road surface
and the car wheel
Xi-Xw
Displacement of the suspension Xb-Xw
Actuator force u
The state space equation that represent the system output is shown in Equation (21):
y =
[
−20
7
−300
7
20
7
300
7
0 1 0 0−1000 −15000 1000 15000
0 0 0 −10 1 0 −10 0 0 0 ]
x+
[
1
350
01001 ]
𝑢+
[
000100]
z
Where y is equal to [Xb Xb Mb Xb Xi-Xw Xb-Xw u] T.
The most crucial output is the displacement of the suspension or the suspension travel as there is a limit for the extension and retraction for the suspension. The displacement of the suspension in active suspension system should not be larger than the maximum suspension travel in the passive suspension system.
Other than that, the force provided by the force actuator should within a reasonable limit. This means that the amplitude of the force used to improve the behavior of the passive suspension system should not be too high and is able to be generated by a force actuator.
The performance of the active suspension system is defined by the vertical displacement of the car body as the primary target of active suspension system is to reduce the vertical displacement of car body so that it is less noticeable and the driver will have a better riding experience in term of better ride comfort.
Fig. 4 shows the overall system that being simulated which consists of passive suspension system, active suspension system with LQR controller and active suspension with LQG controller.
Fig. 4. Suspension systems simulated in Simulink
Fig. 5 shows the simulated result of the suspension travel in passive suspension system, active suspension system with LQR controller and active suspension system with LQG controller.
0 1 2 3 4 5 6 7 8-0.1
-0.08
-0.06
-0.04
-0.02
0
0.02
0.04
0.06
0.08
Time, t (s)
Su
sp
en
sio
n tra
ve
l, X
b-X
w (
m)
passive
LQR
LQG
Fig. 5. Suspension travel of suspension systems
Proceedings of 2017 Electrical Engineering Symposium (EES2017) - Vol. 1
16
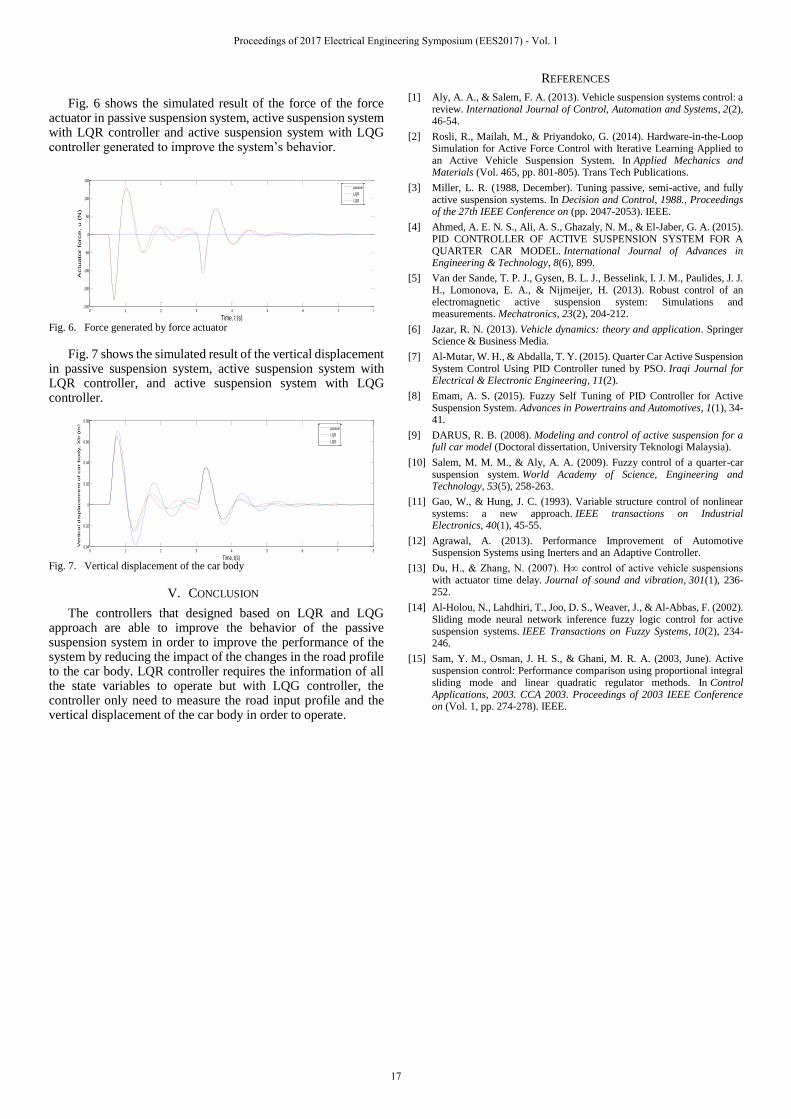
Fig. 6 shows the simulated result of the force of the force actuator in passive suspension system, active suspension system with LQR controller and active suspension system with LQG controller generated to improve the system’s behavior.
Fig. 6. Force generated by force actuator
Fig. 7 shows the simulated result of the vertical displacement in passive suspension system, active suspension system with LQR controller, and active suspension system with LQG controller.
Fig. 7. Vertical displacement of the car body
V. CONCLUSION
The controllers that designed based on LQR and LQG approach are able to improve the behavior of the passive suspension system in order to improve the performance of the system by reducing the impact of the changes in the road profile to the car body. LQR controller requires the information of all the state variables to operate but with LQG controller, the controller only need to measure the road input profile and the vertical displacement of the car body in order to operate.
REFERENCES
[1] Aly, A. A., & Salem, F. A. (2013). Vehicle suspension systems control: a review. International Journal of Control, Automation and Systems, 2(2), 46-54.
[2] Rosli, R., Mailah, M., & Priyandoko, G. (2014). Hardware-in-the-Loop Simulation for Active Force Control with Iterative Learning Applied to an Active Vehicle Suspension System. In Applied Mechanics and Materials (Vol. 465, pp. 801-805). Trans Tech Publications.
[3] Miller, L. R. (1988, December). Tuning passive, semi-active, and fully active suspension systems. In Decision and Control, 1988., Proceedings of the 27th IEEE Conference on (pp. 2047-2053). IEEE.
[4] Ahmed, A. E. N. S., Ali, A. S., Ghazaly, N. M., & El-Jaber, G. A. (2015). PID CONTROLLER OF ACTIVE SUSPENSION SYSTEM FOR A QUARTER CAR MODEL. International Journal of Advances in Engineering & Technology, 8(6), 899.
[5] Van der Sande, T. P. J., Gysen, B. L. J., Besselink, I. J. M., Paulides, J. J. H., Lomonova, E. A., & Nijmeijer, H. (2013). Robust control of an electromagnetic active suspension system: Simulations and measurements. Mechatronics, 23(2), 204-212.
[6] Jazar, R. N. (2013). Vehicle dynamics: theory and application. Springer Science & Business Media.
[7] Al-Mutar, W. H., & Abdalla, T. Y. (2015). Quarter Car Active Suspension System Control Using PID Controller tuned by PSO. Iraqi Journal for Electrical & Electronic Engineering, 11(2).
[8] Emam, A. S. (2015). Fuzzy Self Tuning of PID Controller for Active Suspension System. Advances in Powertrains and Automotives, 1(1), 34-41.
[9] DARUS, R. B. (2008). Modeling and control of active suspension for a full car model (Doctoral dissertation, University Teknologi Malaysia).
[10] Salem, M. M. M., & Aly, A. A. (2009). Fuzzy control of a quarter-car suspension system. World Academy of Science, Engineering and Technology, 53(5), 258-263.
[11] Gao, W., & Hung, J. C. (1993). Variable structure control of nonlinear systems: a new approach. IEEE transactions on Industrial Electronics, 40(1), 45-55.
[12] Agrawal, A. (2013). Performance Improvement of Automotive Suspension Systems using Inerters and an Adaptive Controller.
[13] Du, H., & Zhang, N. (2007). H∞ control of active vehicle suspensions with actuator time delay. Journal of sound and vibration, 301(1), 236-252.
[14] Al-Holou, N., Lahdhiri, T., Joo, D. S., Weaver, J., & Al-Abbas, F. (2002). Sliding mode neural network inference fuzzy logic control for active suspension systems. IEEE Transactions on Fuzzy Systems, 10(2), 234-246.
[15] Sam, Y. M., Osman, J. H. S., & Ghani, M. R. A. (2003, June). Active suspension control: Performance comparison using proportional integral sliding mode and linear quadratic regulator methods. In Control Applications, 2003. CCA 2003. Proceedings of 2003 IEEE Conference on (Vol. 1, pp. 274-278). IEEE.
0 1 2 3 4 5 6 7 8-200
-150
-100
-50
0
50
100
150
Time, t (s)
Actu
ato
r force, u (
N)
passive
LQR
LQG
0 1 2 3 4 5 6 7 8-0.04
-0.02
0
0.02
0.04
0.06
0.08
Time, t(s)
Ve
rtica
l d
isp
lace
me
nt o
f ca
r b
od
y, X
b (
m)
passive
LQR
LQG
Proceedings of 2017 Electrical Engineering Symposium (EES2017) - Vol. 1
17

Mobile Cranes’ Safety System at Construction Sites
Nur Shafiqah Binti Abdullah
Faculty of Electrical Engineering
Universiti Teknologi Malaysia
Johor Bahru, Malaysia.
Zamani Mohd Zain
Department of / Centre of
Faculty of Electrical Engineering
Universiti Teknologi Malaysia
Johor Bahru, Malaysia.
Abstract— Safety issue involving mobile cranes at construction
sites has become serious matter due to its working environment and
the complexity of working practices. This project proposed a low cost
automated monitoring system kit to help monitoring the hazard on the
operation of mobile crane at construction site. The prototype system is
an integrated electronic alert system for the crane operator when lifting
a load using mobile crane. Sensor was used to obtained boom length
and angle which then processed by the controller module installed in
the driver’s operating room using Arduino Mega as the processor. The
data obtained will then being send to the Ground Monitoring Terminal
(GMT) which is at ground worksite were done for supervision
purposes. At the end of this project, an anti-accident algorithm was
executed and the real-time data was recorded using MATLAB to
ensure the safety of mobile crane during construction.
Keywords— mobile cranes; Arduino Mega; monitoring system
I. INTRODUCTION
The field of construction today have become significant part of industrial culture, safety issue on construction site is highly concerns especially regarding mobile crane. Mobile crane is one of the heavy-duty equipment for moving heavy structure and materials on construction sites. The effectiveness and safety of the mobile crane is degrading due to the flexible nature of crane physical structures. Based on the figure from Department of Occupational Safety and Health, Ministry of Human Resources Malaysia, in 2014, the rate for an accident to happen in construction sites is 3.10 per 1000 workers while rate of fatality is 4.21 per 100000 workers. In 2015, the accident rate per 1000 workers in 2015 is 2.81 while fatality rate per 100000 workers is 4.84. Even though there is slightly decline of the accident rates between 2014 and 2015, the rates are still considered as big figures of numbers for construction field. Safety measure should be implemented by respective company in order to prevent the rate to increase from year to year. However, these studies only focusing on how to tackle armature crane operator handling crane which according to the load chart of a mobile crane and real-time data supervise problem. Fig.1 shows the mobiles crane parts.
II. LITERATURE REVIEW
1. Construction and Crane Security System Kit
This thesis that was published in 2016 focusing on an integrated electronic alert system for stress and strain movement on construction structure. The sensor module that was attached to the construction structure in order to detect any vibration or
displacement events which will then send to Arduino Uno Board to compute the data and trigger the alert system for the user.
2. A Proactive System for Real-Time Safety Management inConstruction Sites
This paper reports the development of a first prototype for the proactive safety management and real-time signaling of potential overhead hazards. It is expected to enhance standard safety policies and assist inspectors and coordinators in executing their tasks. The system performs real-time tracking using ultra wide band technology and implements proactive virtual fencing logics. The development of the system, its laboratory test results, the algorithm optimization, and the final field test results are reported herein. The results achieved demonstrate the capability of proactive logics to reinforce safety management policies and assist personnel in coping with unpredictable hazardous events.
3. Dynamic Responses of Hydraulic Mobile Crane withConsideration of The Drive System
This paper focusing on improvement of dynamic calculation of mobiles cranes. using the new method, the flexible multibody model of the structure will be couples with the model of the drive system. In that way the elastic deformation, the rigid body motion of structures and the dynamic behavior of the drive system can be determined in an integrated model. The calculation method has been realized for a hydraulic mobile crane. In addition to the structural elements, the mathematical modelling for hydraulic drive- and control system is described. The crane rotating simulation for arbitrary working conditions has been carried out. As a result, a more exact representation of dynamic behavior, not only for the crane structure, but also for the drive system is achieved.
Fig. 1. Mobiles Cranes Parts
Proceedings of 2017 Electrical Engineering Symposium (EES2017) - Vol. 1
18
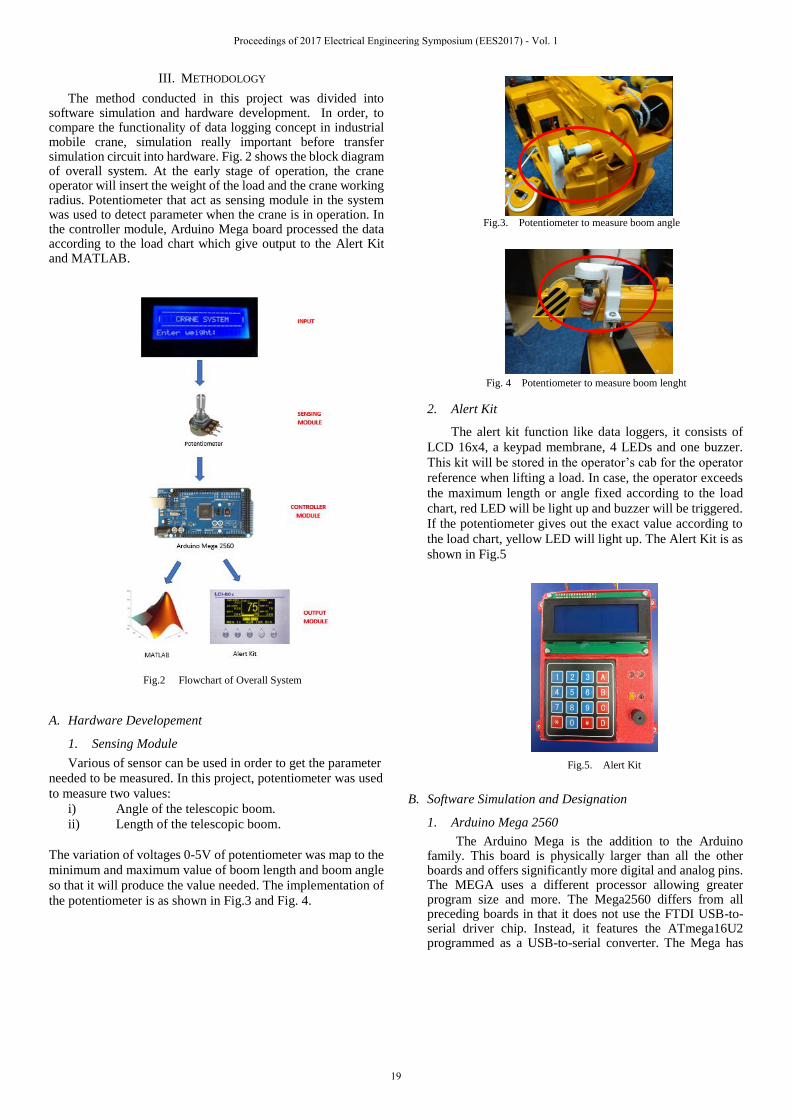
III. METHODOLOGY
The method conducted in this project was divided into software simulation and hardware development. In order, to compare the functionality of data logging concept in industrial mobile crane, simulation really important before transfer simulation circuit into hardware. Fig. 2 shows the block diagram of overall system. At the early stage of operation, the crane operator will insert the weight of the load and the crane working radius. Potentiometer that act as sensing module in the system was used to detect parameter when the crane is in operation. In the controller module, Arduino Mega board processed the data according to the load chart which give output to the Alert Kit and MATLAB.
A. Hardware Developement
1. Sensing Module
Various of sensor can be used in order to get the parameter
needed to be measured. In this project, potentiometer was used
to measure two values:
i) Angle of the telescopic boom.
ii) Length of the telescopic boom.
The variation of voltages 0-5V of potentiometer was map to the
minimum and maximum value of boom length and boom angle
so that it will produce the value needed. The implementation of
the potentiometer is as shown in Fig.3 and Fig. 4.
2. Alert Kit
The alert kit function like data loggers, it consists of
LCD 16x4, a keypad membrane, 4 LEDs and one buzzer.
This kit will be stored in the operator’s cab for the operator
reference when lifting a load. In case, the operator exceeds
the maximum length or angle fixed according to the load
chart, red LED will be light up and buzzer will be triggered.
If the potentiometer gives out the exact value according to
the load chart, yellow LED will light up. The Alert Kit is as
shown in Fig.5
B. Software Simulation and Designation
1. Arduino Mega 2560
The Arduino Mega is the addition to the Arduino family. This board is physically larger than all the other boards and offers significantly more digital and analog pins. The MEGA uses a different processor allowing greater program size and more. The Mega2560 differs from all preceding boards in that it does not use the FTDI USB-to-serial driver chip. Instead, it features the ATmega16U2 programmed as a USB-to-serial converter. The Mega has
Fig.2 Flowchart of Overall System
Fig.3. Potentiometer to measure boom angle
Fig. 4 Potentiometer to measure boom lenght
Fig.5. Alert Kit
Proceedings of 2017 Electrical Engineering Symposium (EES2017) - Vol. 1
19

four hardware serial ports, which means maximum speed if you need a second or third (or fourth) port. The Arduino Mega works in the same way the Arduino Uno does but the difference is that it uses ATmega2560 microcontroller and has more number of digital pins, analog pins. In this project, Arduino Mega will process input from potentiometer, maps with the load chart and then gives output to the Alert Kit and MATLAB. Fig.6 shows the circuit diagram of the system.
2. Mobile Crane’s Load Chart
Each crane has a load chart that, in short, specifies the crane’s capabilities—detailing its features and how its lift capacity varies when considering distance and angle. Before a crane is rented, transported, employed or purchased, the crane chart must be consulted. Everyone, from the crane operator, to the job supervisors, to even the sales guys have to know how to read a load chart. Table 1 shows example of crane performance which will map to the load chart as shown in Fig.7
Here, the chart illustrates the total weight able to be picked up at an 81-degree angle while outriggers is extended. The column to the left indicates the radius of the lift, the one to the far right, the maximum boom length each weight can be carried at. and on the x axis, indicates the working radius on how far the boom is extended from the initial position.
TABLE I. CRANE PERFORMANCE
Crane Performance
Maximum Total Rated load
Boom
Length
Load
Weight
6.70 m
boom 22,000 kg
11.00 m boom
12,000 kg
21.60 m 8,000 kg
28.00 m 6,000 kg
3. MATLAB Graphical User Interface (GUI)
In this project, GUI was used to communicate Arduino with MATLAB to show the output of potentiometer for supervision purposes. The GUI typically contains controls such as menus, toolbars, buttons, and sliders. Many MATLAB products, such as Curve Fitting Toolbox™, Signal Processing Toolbox™, and Control System Toolbox™ include apps with custom user interfaces. Fig.8 shows the GUI used to communicate Arduino Mega to MATLAB.
IV. RESULTS AND DISCUSIONS
After entered value of load weight and working
distance, Arduino calculate the potentiometer value and maps
to the boom length and angle. In this example, 22000 is entered
for the load weight and 2m for the working distance. From the
load chart suppose the boom length is 6.7m and angle should be
60°, if the boom length is longer then red LED lights up. If not
yellow LED lights to indicate it is safe.
Fig.6. Circuit Diagram
Fig. 7. Load chart of a mobile crane
Fig. 8. Graphical User Interface (GUI)
Fig. 9. Result 1
Proceedings of 2017 Electrical Engineering Symposium (EES2017) - Vol. 1
20

Fig.9 shows that LED from boom is still in red
which indicate, it is still below rated length.
Fig. 10 shows that LED from angle is still in red
which indicate, it is still below rated angle.
Fig. 11 shows that LED from angle and boom is still
in red which indicate, both is still below rated length and
angle.
Fig. 12 shows that LED from angle and boom is in
yellow which indicate, both is at safe angle and length to
operate. While in Fig. 13 shows the result of serial
communication between MATLAB and Arduino. The GUI
shows the weight load, working distance and graph on the
potentiometer when it is operated.
V. CONCLUSIONS AND RECOMMENDATIONS
Construction sites are always prone to accidents especially
when mobiles are involved. The proposed system, through the
deployment of an alert kit and supervision system using
MATLAB, aims at helping construction or safety personnel in
making rapid decisions to avoid or minimize these accidents
when in an operation. The results proof of concept– a
demonstration that a relatively low-cost system kit can be used
to mobile crane operator on harsh and dynamic construction
sites.
In order to improve the performance of the system, a better
sensor should be used to get the exact boom length and boom
angle under any circumstance. Furthermore, the Internet of
Thing (IoT) technologies should be implemented so that the
supervision part will not limited to only at the construction
site, in fact can be monitor by engineer from far.
REFERENCES
[1] Muhammad Nasruddin Bin Mohd Shah. “Construction and Crane Security System Kit”, 2016, pp. 1-13.
[2] Daichi D. Fujioka, “Tip-Over Stability Analysis For Mobile Boom Cranes With Single- And Double-Pendulum Payloads,” Georgia Institute of Technology, 2010, pp. 23-24.
[3] Kevin Tantesevi, Burcu Akinci. “Automated generation of workspace requirements of mobile crane operations to support conflict detection” Carnegie Mellon University, 2010, pp. 1-4.
[4] Wolfgang Wilhelm, Ratmgen-Hosel,Kriiger GmbH & Co. KG, Essen, Fed. “Load-Monitoring System For Boom-Type Crane”, Germany, 1985, pp. 8-11.
[5] Alessandro Carbonari, Alberto Giretti, Berardo Naticchia, “A proactive system for real-time safety management in construction sites”, Università Politecnica delle Marche, 2011.
[6] Teach-ict. (n.d.). “Advantages and Disadvantages.” [Online]. Available:http://www.teach-ict.com/gcse_new/control/ data_logging/ miniweb/pg6.htm, [Accessed October 1, 2016].
[7] Mathworks. “Sonar distance graph on Matlab” [Online]. Available: https://www.hackster.io/Luis_R_A/sonar-distance-graph-on-matlab-6d3a1b, [Accessed November 4, 2016].
[8] Department of Occupational Safety And Health, Ministry Of Human Resource Malaysia. “National occupational Accident Fatality Rate” [Online]. Available: http://www.dosh.gov.my/index.php/en/national-occupational-accident-fatality-rate, [Accessed September 11, 2016]
[9] Ministry of Manpower Singapore, " New mobile cranes to be equipped with data loggers from 1st August 2015," [Online]. Available: http://www.mom.gov.sg/newsroom/press-releases/2015/new-mobile-cranes-to-beequipped-with-data-loggers-from-1-august-2015, [Accessed October 1st, 2016]
Fig. 10. Result 2
Fig. 11. Result 3
Fig. 12. Result 4
Fig. 13. Result 4
Proceedings of 2017 Electrical Engineering Symposium (EES2017) - Vol. 1
21
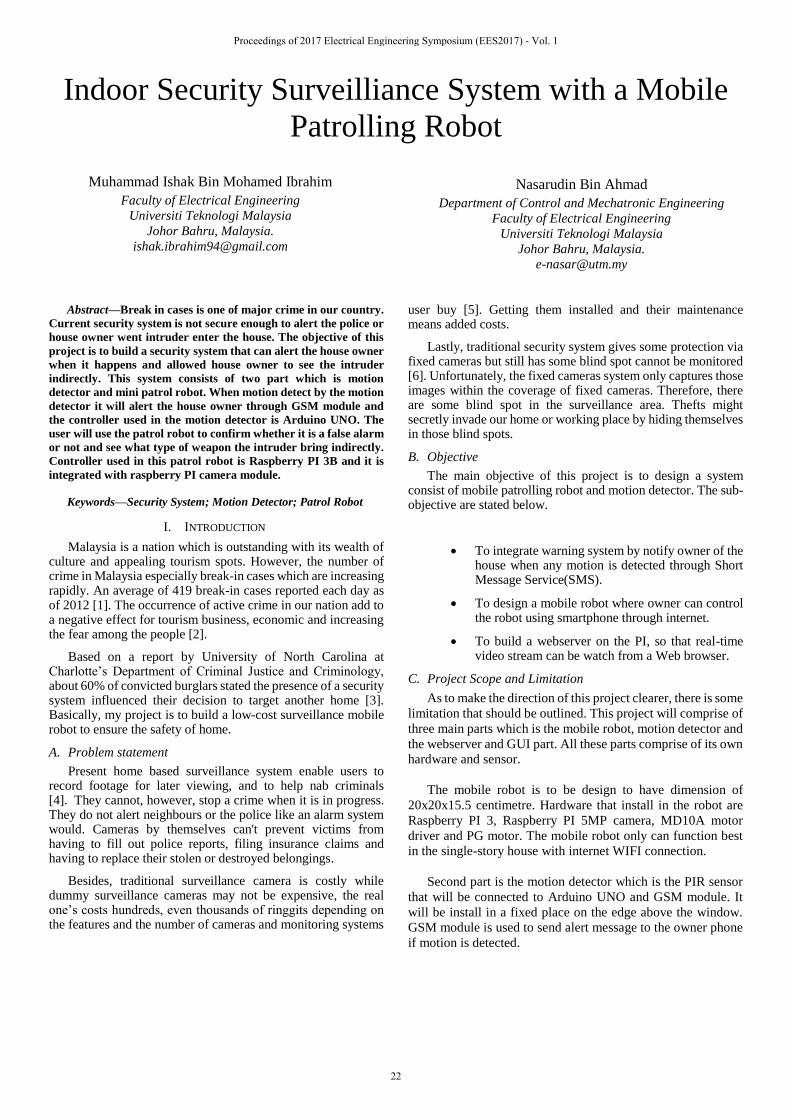
Indoor Security Surveilliance System with a Mobile
Patrolling Robot
Muhammad Ishak Bin Mohamed Ibrahim
Faculty of Electrical Engineering
Universiti Teknologi Malaysia
Johor Bahru, Malaysia.
Nasarudin Bin Ahmad
Department of Control and Mechatronic Engineering
Faculty of Electrical Engineering
Universiti Teknologi Malaysia
Johor Bahru, Malaysia.
Abstract—Break in cases is one of major crime in our country.
Current security system is not secure enough to alert the police or
house owner went intruder enter the house. The objective of this
project is to build a security system that can alert the house owner
when it happens and allowed house owner to see the intruder
indirectly. This system consists of two part which is motion
detector and mini patrol robot. When motion detect by the motion
detector it will alert the house owner through GSM module and
the controller used in the motion detector is Arduino UNO. The
user will use the patrol robot to confirm whether it is a false alarm
or not and see what type of weapon the intruder bring indirectly.
Controller used in this patrol robot is Raspberry PI 3B and it is
integrated with raspberry PI camera module.
Keywords—Security System; Motion Detector; Patrol Robot
I. INTRODUCTION
Malaysia is a nation which is outstanding with its wealth of culture and appealing tourism spots. However, the number of crime in Malaysia especially break-in cases which are increasing rapidly. An average of 419 break-in cases reported each day as of 2012 [1]. The occurrence of active crime in our nation add to a negative effect for tourism business, economic and increasing the fear among the people [2].
Based on a report by University of North Carolina at Charlotte’s Department of Criminal Justice and Criminology, about 60% of convicted burglars stated the presence of a security system influenced their decision to target another home [3]. Basically, my project is to build a low-cost surveillance mobile robot to ensure the safety of home.
A. Problem statement
Present home based surveillance system enable users to record footage for later viewing, and to help nab criminals [4]. They cannot, however, stop a crime when it is in progress. They do not alert neighbours or the police like an alarm system would. Cameras by themselves can't prevent victims from having to fill out police reports, filing insurance claims and having to replace their stolen or destroyed belongings.
Besides, traditional surveillance camera is costly while dummy surveillance cameras may not be expensive, the real one’s costs hundreds, even thousands of ringgits depending on the features and the number of cameras and monitoring systems
user buy [5]. Getting them installed and their maintenance means added costs.
Lastly, traditional security system gives some protection via fixed cameras but still has some blind spot cannot be monitored [6]. Unfortunately, the fixed cameras system only captures those images within the coverage of fixed cameras. Therefore, there are some blind spot in the surveillance area. Thefts might secretly invade our home or working place by hiding themselves in those blind spots.
B. Objective
The main objective of this project is to design a system consist of mobile patrolling robot and motion detector. The sub-objective are stated below.
To integrate warning system by notify owner of thehouse when any motion is detected through ShortMessage Service(SMS).
To design a mobile robot where owner can controlthe robot using smartphone through internet.
To build a webserver on the PI, so that real-timevideo stream can be watch from a Web browser.
C. Project Scope and Limitation
As to make the direction of this project clearer, there is some
limitation that should be outlined. This project will comprise of
three main parts which is the mobile robot, motion detector and
the webserver and GUI part. All these parts comprise of its own
hardware and sensor.
The mobile robot is to be design to have dimension of
20x20x15.5 centimetre. Hardware that install in the robot are
Raspberry PI 3, Raspberry PI 5MP camera, MD10A motor
driver and PG motor. The mobile robot only can function best
in the single-story house with internet WIFI connection.
Second part is the motion detector which is the PIR sensor
that will be connected to Arduino UNO and GSM module. It
will be install in a fixed place on the edge above the window.
GSM module is used to send alert message to the owner phone
if motion is detected.
Proceedings of 2017 Electrical Engineering Symposium (EES2017) - Vol. 1
22
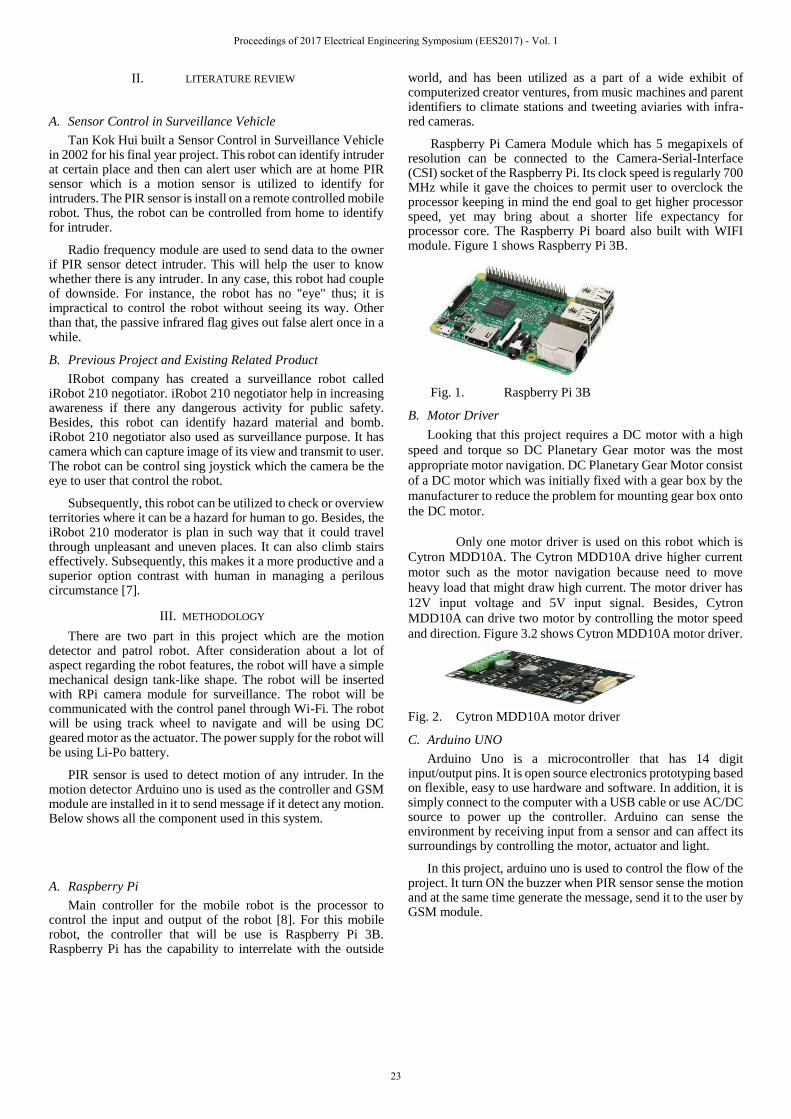
II. LITERATURE REVIEW
A. Sensor Control in Surveillance Vehicle
Tan Kok Hui built a Sensor Control in Surveillance Vehicle in 2002 for his final year project. This robot can identify intruder at certain place and then can alert user which are at home PIR sensor which is a motion sensor is utilized to identify for intruders. The PIR sensor is install on a remote controlled mobile robot. Thus, the robot can be controlled from home to identify for intruder.
Radio frequency module are used to send data to the owner if PIR sensor detect intruder. This will help the user to know whether there is any intruder. In any case, this robot had couple of downside. For instance, the robot has no "eye" thus; it is impractical to control the robot without seeing its way. Other than that, the passive infrared flag gives out false alert once in a while.
B. Previous Project and Existing Related Product
IRobot company has created a surveillance robot called iRobot 210 negotiator. iRobot 210 negotiator help in increasing awareness if there any dangerous activity for public safety. Besides, this robot can identify hazard material and bomb. iRobot 210 negotiator also used as surveillance purpose. It has camera which can capture image of its view and transmit to user. The robot can be control sing joystick which the camera be the eye to user that control the robot.
Subsequently, this robot can be utilized to check or overview territories where it can be a hazard for human to go. Besides, the iRobot 210 moderator is plan in such way that it could travel through unpleasant and uneven places. It can also climb stairs effectively. Subsequently, this makes it a more productive and a superior option contrast with human in managing a perilous circumstance [7].
III. METHODOLOGY
There are two part in this project which are the motion detector and patrol robot. After consideration about a lot of aspect regarding the robot features, the robot will have a simple mechanical design tank-like shape. The robot will be inserted with RPi camera module for surveillance. The robot will be communicated with the control panel through Wi-Fi. The robot will be using track wheel to navigate and will be using DC geared motor as the actuator. The power supply for the robot will be using Li-Po battery.
PIR sensor is used to detect motion of any intruder. In the motion detector Arduino uno is used as the controller and GSM module are installed in it to send message if it detect any motion. Below shows all the component used in this system.
A. Raspberry Pi
Main controller for the mobile robot is the processor to control the input and output of the robot [8]. For this mobile robot, the controller that will be use is Raspberry Pi 3B. Raspberry Pi has the capability to interrelate with the outside
world, and has been utilized as a part of a wide exhibit of computerized creator ventures, from music machines and parent identifiers to climate stations and tweeting aviaries with infra-red cameras.
Raspberry Pi Camera Module which has 5 megapixels of resolution can be connected to the Camera-Serial-Interface (CSI) socket of the Raspberry Pi. Its clock speed is regularly 700 MHz while it gave the choices to permit user to overclock the processor keeping in mind the end goal to get higher processor speed, yet may bring about a shorter life expectancy for processor core. The Raspberry Pi board also built with WIFI module. Figure 1 shows Raspberry Pi 3B.
Fig. 1. Raspberry Pi 3B
B. Motor Driver
Looking that this project requires a DC motor with a high
speed and torque so DC Planetary Gear motor was the most
appropriate motor navigation. DC Planetary Gear Motor consist
of a DC motor which was initially fixed with a gear box by the
manufacturer to reduce the problem for mounting gear box onto
the DC motor.
Only one motor driver is used on this robot which is
Cytron MDD10A. The Cytron MDD10A drive higher current
motor such as the motor navigation because need to move
heavy load that might draw high current. The motor driver has
12V input voltage and 5V input signal. Besides, Cytron
MDD10A can drive two motor by controlling the motor speed
and direction. Figure 3.2 shows Cytron MDD10A motor driver.
Fig. 2. Cytron MDD10A motor driver
C. Arduino UNO
Arduino Uno is a microcontroller that has 14 digit input/output pins. It is open source electronics prototyping based on flexible, easy to use hardware and software. In addition, it is simply connect to the computer with a USB cable or use AC/DC source to power up the controller. Arduino can sense the environment by receiving input from a sensor and can affect its surroundings by controlling the motor, actuator and light.
In this project, arduino uno is used to control the flow of the project. It turn ON the buzzer when PIR sensor sense the motion and at the same time generate the message, send it to the user by GSM module.
Proceedings of 2017 Electrical Engineering Symposium (EES2017) - Vol. 1
23
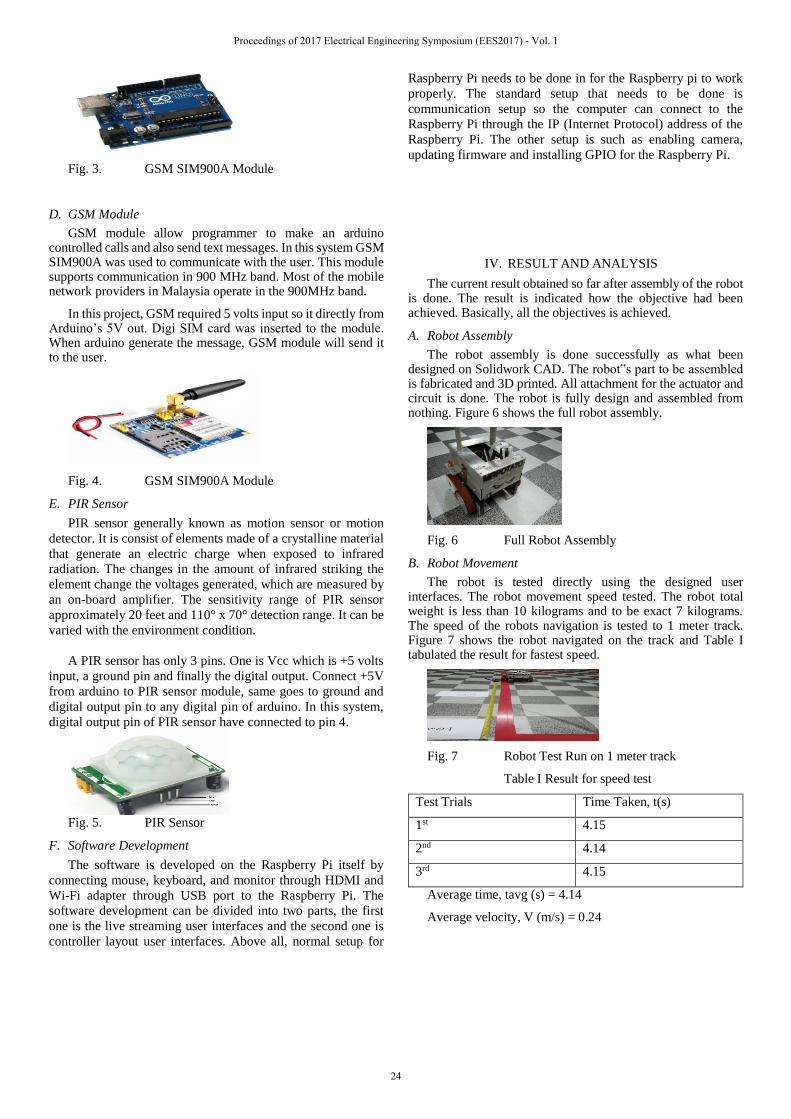
Fig. 3. GSM SIM900A Module
D. GSM Module
GSM module allow programmer to make an arduino controlled calls and also send text messages. In this system GSM SIM900A was used to communicate with the user. This module supports communication in 900 MHz band. Most of the mobile network providers in Malaysia operate in the 900MHz band.
In this project, GSM required 5 volts input so it directly from Arduino’s 5V out. Digi SIM card was inserted to the module. When arduino generate the message, GSM module will send it to the user.
Fig. 4. GSM SIM900A Module
E. PIR Sensor
PIR sensor generally known as motion sensor or motion
detector. It is consist of elements made of a crystalline material
that generate an electric charge when exposed to infrared
radiation. The changes in the amount of infrared striking the
element change the voltages generated, which are measured by
an on-board amplifier. The sensitivity range of PIR sensor
approximately 20 feet and 110° x 70° detection range. It can be
varied with the environment condition.
A PIR sensor has only 3 pins. One is Vcc which is +5 volts
input, a ground pin and finally the digital output. Connect +5V
from arduino to PIR sensor module, same goes to ground and
digital output pin to any digital pin of arduino. In this system,
digital output pin of PIR sensor have connected to pin 4.
Fig. 5. PIR Sensor
F. Software Development
The software is developed on the Raspberry Pi itself by
connecting mouse, keyboard, and monitor through HDMI and
Wi-Fi adapter through USB port to the Raspberry Pi. The
software development can be divided into two parts, the first
one is the live streaming user interfaces and the second one is
controller layout user interfaces. Above all, normal setup for
Raspberry Pi needs to be done in for the Raspberry pi to work
properly. The standard setup that needs to be done is
communication setup so the computer can connect to the
Raspberry Pi through the IP (Internet Protocol) address of the
Raspberry Pi. The other setup is such as enabling camera,
updating firmware and installing GPIO for the Raspberry Pi.
IV. RESULT AND ANALYSIS
The current result obtained so far after assembly of the robot is done. The result is indicated how the objective had been achieved. Basically, all the objectives is achieved.
A. Robot Assembly
The robot assembly is done successfully as what been designed on Solidwork CAD. The robot‟s part to be assembled is fabricated and 3D printed. All attachment for the actuator and circuit is done. The robot is fully design and assembled from nothing. Figure 6 shows the full robot assembly.
Fig. 6 Full Robot Assembly
B. Robot Movement
The robot is tested directly using the designed user interfaces. The robot movement speed tested. The robot total weight is less than 10 kilograms and to be exact 7 kilograms. The speed of the robots navigation is tested to 1 meter track. Figure 7 shows the robot navigated on the track and Table I tabulated the result for fastest speed.
Fig. 7 Robot Test Run on 1 meter track
Table I Result for speed test
Test Trials Time Taken, t(s)
1st 4.15
2nd 4.14
3rd 4.15
Average time, tavg (s) = 4.14
Average velocity, V (m/s) = 0.24
Proceedings of 2017 Electrical Engineering Symposium (EES2017) - Vol. 1
24
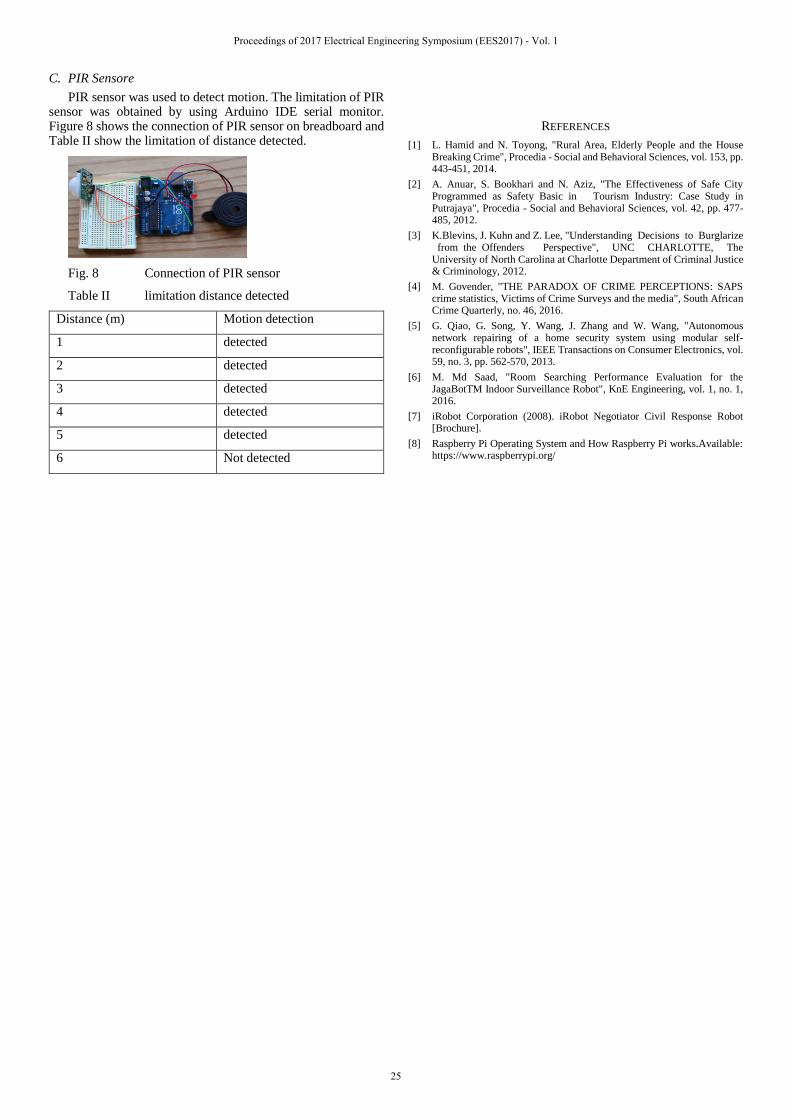
C. PIR Sensore
PIR sensor was used to detect motion. The limitation of PIR sensor was obtained by using Arduino IDE serial monitor. Figure 8 shows the connection of PIR sensor on breadboard and Table II show the limitation of distance detected.
Fig. 8 Connection of PIR sensor
Table II limitation distance detected
Distance (m) Motion detection
1 detected
2 detected
3 detected
4 detected
5 detected
6 Not detected
REFERENCES
[1] L. Hamid and N. Toyong, "Rural Area, Elderly People and the House Breaking Crime", Procedia - Social and Behavioral Sciences, vol. 153, pp. 443-451, 2014.
[2] A. Anuar, S. Bookhari and N. Aziz, "The Effectiveness of Safe City Programmed as Safety Basic in Tourism Industry: Case Study in Putrajaya", Procedia - Social and Behavioral Sciences, vol. 42, pp. 477-485, 2012.
[3] K.Blevins, J. Kuhn and Z. Lee, "UnderstandingDecisionstoBurglarizefromtheOffenders Perspective", UNC CHARLOTTE, The University of North Carolina at Charlotte Department of Criminal Justice & Criminology, 2012.
[4] M. Govender, "THE PARADOX OF CRIME PERCEPTIONS: SAPS crime statistics, Victims of Crime Surveys and the media", South African Crime Quarterly, no. 46, 2016.
[5] G. Qiao, G. Song, Y. Wang, J. Zhang and W. Wang, "Autonomous network repairing of a home security system using modular self-reconfigurable robots", IEEE Transactions on Consumer Electronics, vol. 59, no. 3, pp. 562-570, 2013.
[6] M. Md Saad, "Room Searching Performance Evaluation for the JagaBotTM Indoor Surveillance Robot", KnE Engineering, vol. 1, no. 1, 2016.
[7] iRobot Corporation (2008). iRobot Negotiator Civil Response Robot [Brochure].
[8] Raspberry Pi Operating System and How Raspberry Pi works.Available: https://www.raspberrypi.org/
Proceedings of 2017 Electrical Engineering Symposium (EES2017) - Vol. 1
25
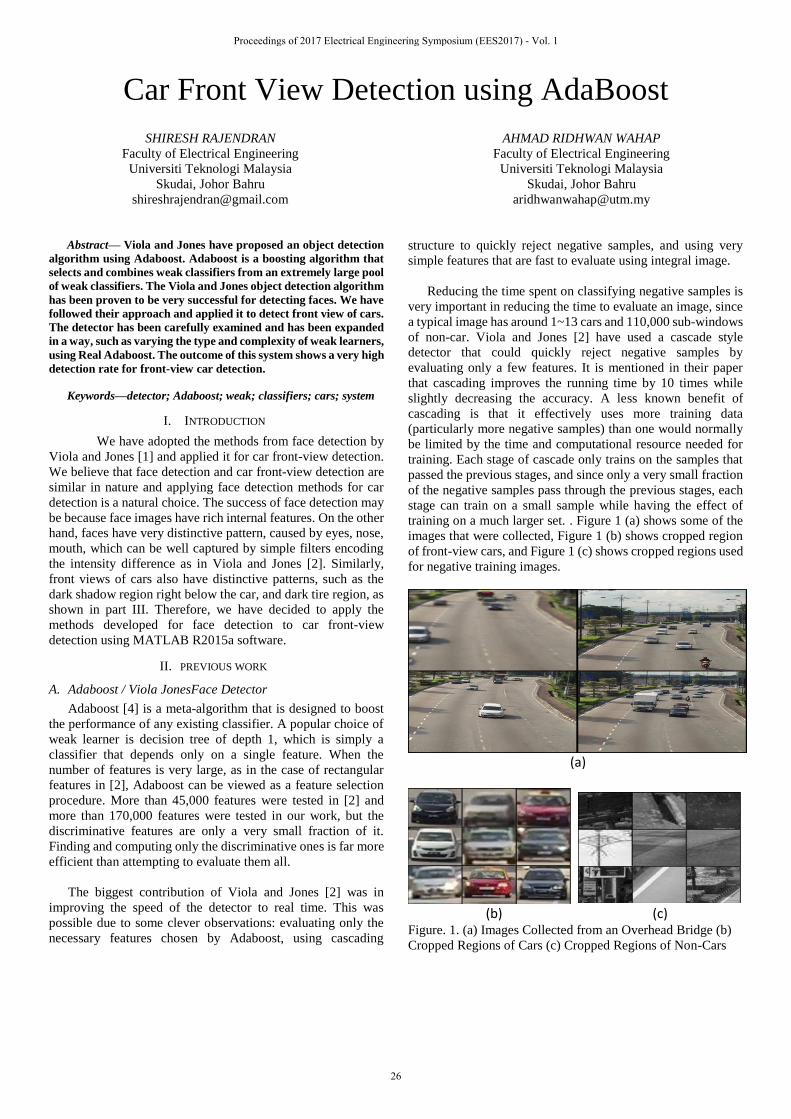
Car Front View Detection using AdaBoost
SHIRESH RAJENDRAN
Faculty of Electrical Engineering
Universiti Teknologi Malaysia
Skudai, Johor Bahru
AHMAD RIDHWAN WAHAP
Faculty of Electrical Engineering
Universiti Teknologi Malaysia
Skudai, Johor Bahru
Abstract— Viola and Jones have proposed an object detection
algorithm using Adaboost. Adaboost is a boosting algorithm that
selects and combines weak classifiers from an extremely large pool
of weak classifiers. The Viola and Jones object detection algorithm
has been proven to be very successful for detecting faces. We have
followed their approach and applied it to detect front view of cars.
The detector has been carefully examined and has been expanded
in a way, such as varying the type and complexity of weak learners,
using Real Adaboost. The outcome of this system shows a very high
detection rate for front-view car detection.
Keywords—detector; Adaboost; weak; classifiers; cars; system
I. INTRODUCTION
We have adopted the methods from face detection by
Viola and Jones [1] and applied it for car front-view detection.
We believe that face detection and car front-view detection are
similar in nature and applying face detection methods for car
detection is a natural choice. The success of face detection may
be because face images have rich internal features. On the other
hand, faces have very distinctive pattern, caused by eyes, nose,
mouth, which can be well captured by simple filters encoding
the intensity difference as in Viola and Jones [2]. Similarly,
front views of cars also have distinctive patterns, such as the
dark shadow region right below the car, and dark tire region, as
shown in part III. Therefore, we have decided to apply the
methods developed for face detection to car front-view
detection using MATLAB R2015a software.
II. PREVIOUS WORK
A. Adaboost / Viola JonesFace Detector
Adaboost [4] is a meta-algorithm that is designed to boost
the performance of any existing classifier. A popular choice of
weak learner is decision tree of depth 1, which is simply a
classifier that depends only on a single feature. When the
number of features is very large, as in the case of rectangular
features in [2], Adaboost can be viewed as a feature selection
procedure. More than 45,000 features were tested in [2] and
more than 170,000 features were tested in our work, but the
discriminative features are only a very small fraction of it.
Finding and computing only the discriminative ones is far more
efficient than attempting to evaluate them all.
The biggest contribution of Viola and Jones [2] was in
improving the speed of the detector to real time. This was
possible due to some clever observations: evaluating only the
necessary features chosen by Adaboost, using cascading
structure to quickly reject negative samples, and using very
simple features that are fast to evaluate using integral image.
Reducing the time spent on classifying negative samples is
very important in reducing the time to evaluate an image, since
a typical image has around 1~13 cars and 110,000 sub-windows
of non-car. Viola and Jones [2] have used a cascade style
detector that could quickly reject negative samples by
evaluating only a few features. It is mentioned in their paper
that cascading improves the running time by 10 times while
slightly decreasing the accuracy. A less known benefit of
cascading is that it effectively uses more training data
(particularly more negative samples) than one would normally
be limited by the time and computational resource needed for
training. Each stage of cascade only trains on the samples that
passed the previous stages, and since only a very small fraction
of the negative samples pass through the previous stages, each
stage can train on a small sample while having the effect of
training on a much larger set. . Figure 1 (a) shows some of the
images that were collected, Figure 1 (b) shows cropped region
of front-view cars, and Figure 1 (c) shows cropped regions used
for negative training images.
(a)
(b) (c) Figure. 1. (a) Images Collected from an Overhead Bridge (b)
Cropped Regions of Cars (c) Cropped Regions of Non-Cars
Proceedings of 2017 Electrical Engineering Symposium (EES2017) - Vol. 1
26
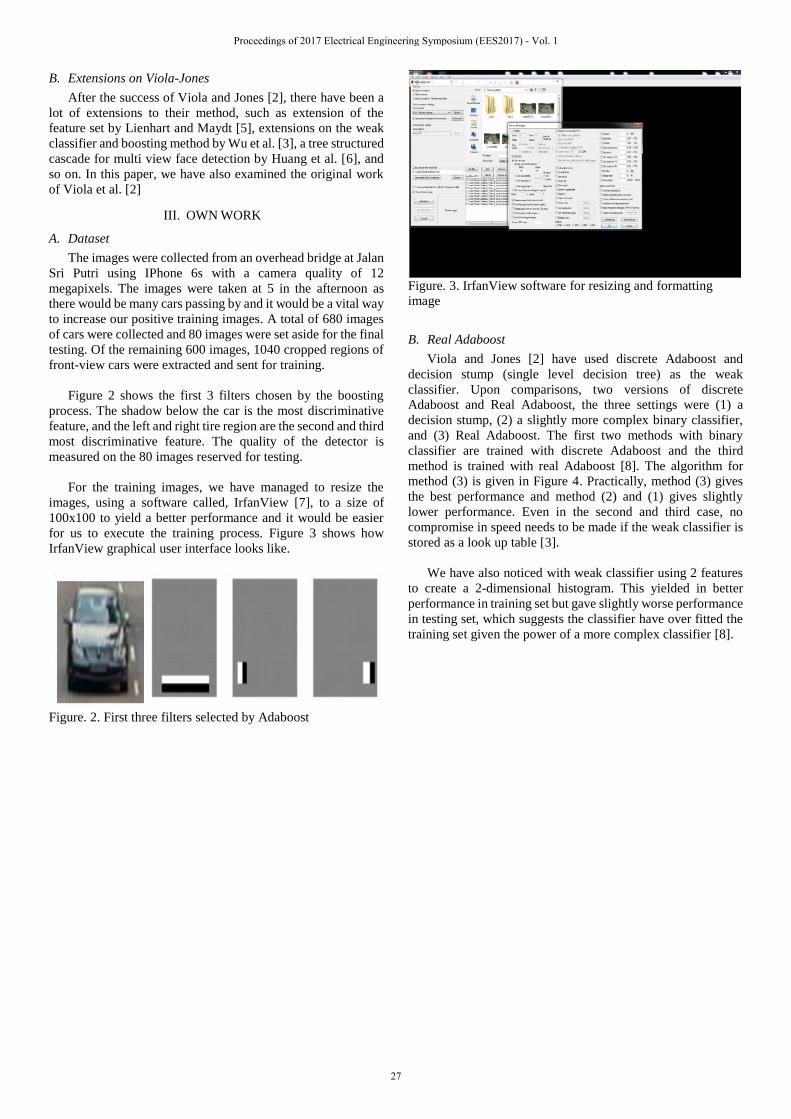
B. Extensions on Viola-Jones
After the success of Viola and Jones [2], there have been a
lot of extensions to their method, such as extension of the
feature set by Lienhart and Maydt [5], extensions on the weak
classifier and boosting method by Wu et al. [3], a tree structured
cascade for multi view face detection by Huang et al. [6], and
so on. In this paper, we have also examined the original work
of Viola et al. [2]
III. OWN WORK
A. Dataset
The images were collected from an overhead bridge at Jalan
Sri Putri using IPhone 6s with a camera quality of 12
megapixels. The images were taken at 5 in the afternoon as
there would be many cars passing by and it would be a vital way
to increase our positive training images. A total of 680 images
of cars were collected and 80 images were set aside for the final
testing. Of the remaining 600 images, 1040 cropped regions of
front-view cars were extracted and sent for training.
Figure 2 shows the first 3 filters chosen by the boosting
process. The shadow below the car is the most discriminative
feature, and the left and right tire region are the second and third
most discriminative feature. The quality of the detector is
measured on the 80 images reserved for testing.
For the training images, we have managed to resize the
images, using a software called, IrfanView [7], to a size of
100x100 to yield a better performance and it would be easier
for us to execute the training process. Figure 3 shows how
IrfanView graphical user interface looks like.
Figure. 2. First three filters selected by Adaboost
Figure. 3. IrfanView software for resizing and formatting
image
B. Real Adaboost
Viola and Jones [2] have used discrete Adaboost and
decision stump (single level decision tree) as the weak
classifier. Upon comparisons, two versions of discrete
Adaboost and Real Adaboost, the three settings were (1) a
decision stump, (2) a slightly more complex binary classifier,
and (3) Real Adaboost. The first two methods with binary
classifier are trained with discrete Adaboost and the third
method is trained with real Adaboost [8]. The algorithm for
method (3) is given in Figure 4. Practically, method (3) gives
the best performance and method (2) and (1) gives slightly
lower performance. Even in the second and third case, no
compromise in speed needs to be made if the weak classifier is
stored as a look up table [3].
We have also noticed with weak classifier using 2 features
to create a 2-dimensional histogram. This yielded in better
performance in training set but gave slightly worse performance
in testing set, which suggests the classifier have over fitted the
training set given the power of a more complex classifier [8].
Proceedings of 2017 Electrical Engineering Symposium (EES2017) - Vol. 1
27

Figure. 4. Real Adaboost Algorithm
C. Dataset
We trained a cascade detector, which returns an XML file.
We used that XML file to detect objects, cars (only from front-
view) in this case, in an image. As we are going to use
MATLAB R2015a, we have our MATLAB R2015a software
installed on our PC along with image processing and computer
vision toolboxes.
The process is of two steps:
Train our cascade detector with all the data files.
Use the output XML file to detect objects in a
picture.
Figure 5 shows our line to train the data, which eventually gives
an output xml file
Figure. 5. MATLAB code line to train data
Figure 6 shows an overview on how the process
works and how the XML is generated. Picture courtesy,
MATLAB main web page.
Figure 6 Overall process generating XML file
The first argument, an xml file is going to be saved in
our current directory (MATLAB command window), so we
used that to detect cars front-view. Next argument is a struct file
in MATLAB, which is the data of all positive images. It
contains two fields namely, ‘imageFileName’ and
‘objectBoundingBoxes’. Size of this struct file would be 1x960
in this case as we have 960 positive images. Before doing so,
Figure 8 is the graphical user interface of Training Image
Labeler, we created a vector file containing all positive training
images with the help of Training Image Labeler application
which can be found in MATLAB. Figure 7 shows the lines
needed to run to create the bounding box of 960 positive
training images and Figure 9 shows the struct file containing
positive training images.
Figure. 7. MATLAB code to create bounding box
Figure. 8. Training Image Labeler Application
‘trainCascadeObjectDetector('shireshskudai.xml', mydata, negativeFolder);’
mydata= struct('imageFilename', 'Just a
random string', 'objectBoundingBoxes',
'Just a random string');
for i=0:549, mydata(i+1).imageFilename =
strcat('trainImagesPos/pos-', num2str(i),
'.pgm');
mydata(i+1).objectBoundingBoxes = [1, 1,
100, 40]
end
Proceedings of 2017 Electrical Engineering Symposium (EES2017) - Vol. 1
28
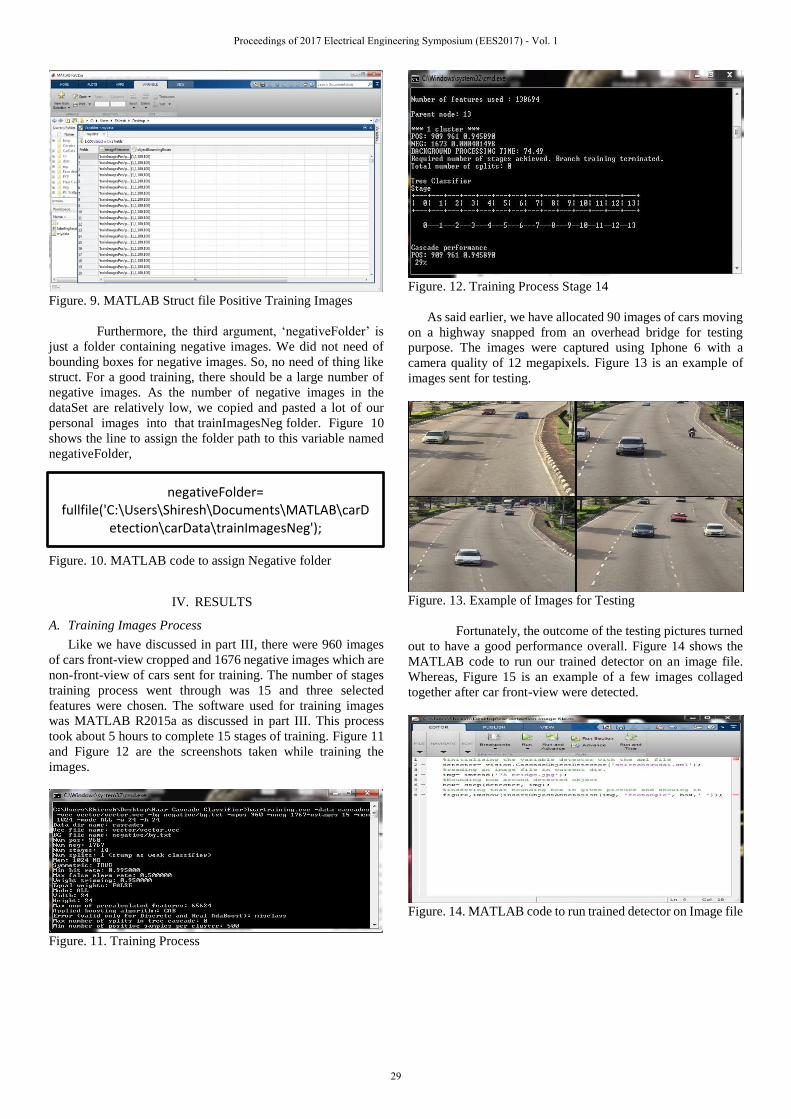
Figure. 9. MATLAB Struct file Positive Training Images
Furthermore, the third argument, ‘negativeFolder’ is
just a folder containing negative images. We did not need of
bounding boxes for negative images. So, no need of thing like
struct. For a good training, there should be a large number of
negative images. As the number of negative images in the
dataSet are relatively low, we copied and pasted a lot of our
personal images into that trainImagesNeg folder. Figure 10
shows the line to assign the folder path to this variable named
negativeFolder,
Figure. 10. MATLAB code to assign Negative folder
IV. RESULTS
A. Training Images Process
Like we have discussed in part III, there were 960 images
of cars front-view cropped and 1676 negative images which are
non-front-view of cars sent for training. The number of stages
training process went through was 15 and three selected
features were chosen. The software used for training images
was MATLAB R2015a as discussed in part III. This process
took about 5 hours to complete 15 stages of training. Figure 11
and Figure 12 are the screenshots taken while training the
images.
Figure. 11. Training Process
Figure. 12. Training Process Stage 14
As said earlier, we have allocated 90 images of cars moving
on a highway snapped from an overhead bridge for testing
purpose. The images were captured using Iphone 6 with a
camera quality of 12 megapixels. Figure 13 is an example of
images sent for testing.
Figure. 13. Example of Images for Testing
Fortunately, the outcome of the testing pictures turned
out to have a good performance overall. Figure 14 shows the
MATLAB code to run our trained detector on an image file.
Whereas, Figure 15 is an example of a few images collaged
together after car front-view were detected.
Figure. 14. MATLAB code to run trained detector on Image file
negativeFolder= fullfile('C:\Users\Shiresh\Documents\MATLAB\carD
etection\carData\trainImagesNeg');
Proceedings of 2017 Electrical Engineering Symposium (EES2017) - Vol. 1
29
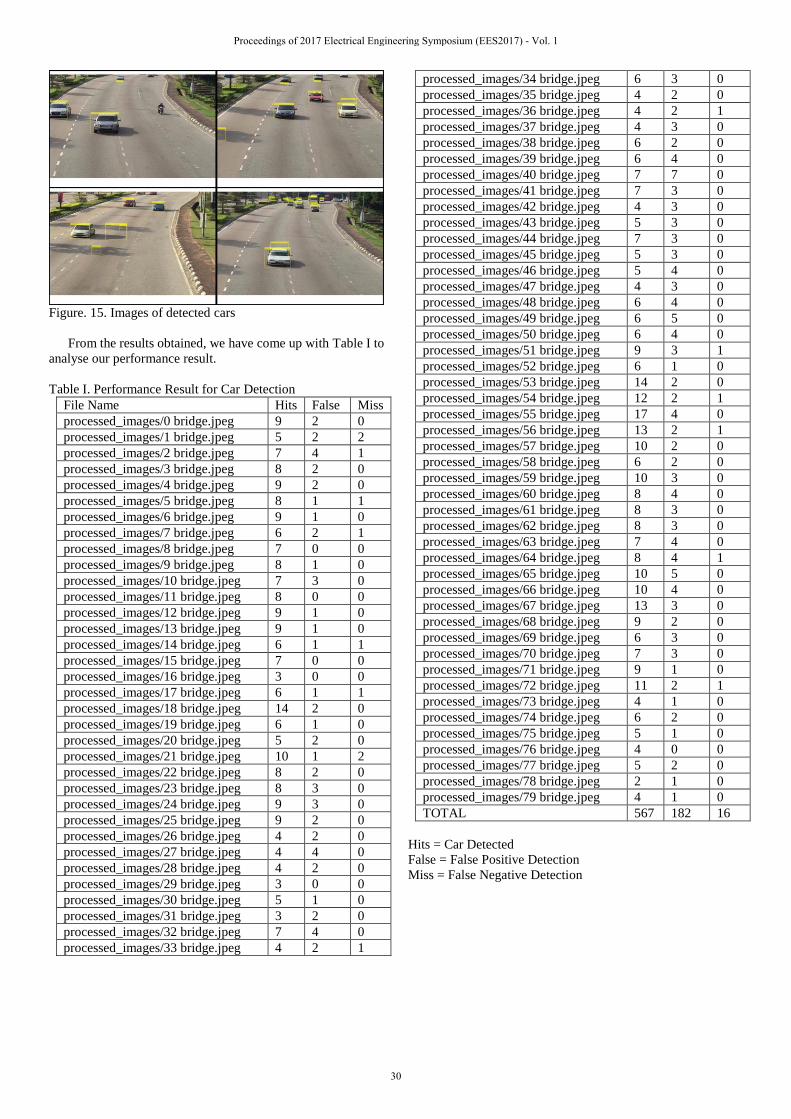
Figure. 15. Images of detected cars
From the results obtained, we have come up with Table I to
analyse our performance result.
Table I. Performance Result for Car Detection
File Name Hits False Miss
processed_images/0 bridge.jpeg 9 2 0
processed_images/1 bridge.jpeg 5 2 2
processed_images/2 bridge.jpeg 7 4 1
processed_images/3 bridge.jpeg 8 2 0
processed_images/4 bridge.jpeg 9 2 0
processed_images/5 bridge.jpeg 8 1 1
processed_images/6 bridge.jpeg 9 1 0
processed_images/7 bridge.jpeg 6 2 1
processed_images/8 bridge.jpeg 7 0 0
processed_images/9 bridge.jpeg 8 1 0
processed_images/10 bridge.jpeg 7 3 0
processed_images/11 bridge.jpeg 8 0 0
processed_images/12 bridge.jpeg 9 1 0
processed_images/13 bridge.jpeg 9 1 0
processed_images/14 bridge.jpeg 6 1 1
processed_images/15 bridge.jpeg 7 0 0
processed_images/16 bridge.jpeg 3 0 0
processed_images/17 bridge.jpeg 6 1 1
processed_images/18 bridge.jpeg 14 2 0
processed_images/19 bridge.jpeg 6 1 0
processed_images/20 bridge.jpeg 5 2 0
processed_images/21 bridge.jpeg 10 1 2
processed_images/22 bridge.jpeg 8 2 0
processed_images/23 bridge.jpeg 8 3 0
processed_images/24 bridge.jpeg 9 3 0
processed_images/25 bridge.jpeg 9 2 0
processed_images/26 bridge.jpeg 4 2 0
processed_images/27 bridge.jpeg 4 4 0
processed_images/28 bridge.jpeg 4 2 0
processed_images/29 bridge.jpeg 3 0 0
processed_images/30 bridge.jpeg 5 1 0
processed_images/31 bridge.jpeg 3 2 0
processed_images/32 bridge.jpeg 7 4 0
processed_images/33 bridge.jpeg 4 2 1
processed_images/34 bridge.jpeg 6 3 0
processed_images/35 bridge.jpeg 4 2 0
processed_images/36 bridge.jpeg 4 2 1
processed_images/37 bridge.jpeg 4 3 0
processed_images/38 bridge.jpeg 6 2 0
processed_images/39 bridge.jpeg 6 4 0
processed_images/40 bridge.jpeg 7 7 0
processed_images/41 bridge.jpeg 7 3 0
processed_images/42 bridge.jpeg 4 3 0
processed_images/43 bridge.jpeg 5 3 0
processed_images/44 bridge.jpeg 7 3 0
processed_images/45 bridge.jpeg 5 3 0
processed_images/46 bridge.jpeg 5 4 0
processed_images/47 bridge.jpeg 4 3 0
processed_images/48 bridge.jpeg 6 4 0
processed_images/49 bridge.jpeg 6 5 0
processed_images/50 bridge.jpeg 6 4 0
processed_images/51 bridge.jpeg 9 3 1
processed_images/52 bridge.jpeg 6 1 0
processed_images/53 bridge.jpeg 14 2 0
processed_images/54 bridge.jpeg 12 2 1
processed_images/55 bridge.jpeg 17 4 0
processed_images/56 bridge.jpeg 13 2 1
processed_images/57 bridge.jpeg 10 2 0
processed_images/58 bridge.jpeg 6 2 0
processed_images/59 bridge.jpeg 10 3 0
processed_images/60 bridge.jpeg 8 4 0
processed_images/61 bridge.jpeg 8 3 0
processed_images/62 bridge.jpeg 8 3 0
processed_images/63 bridge.jpeg 7 4 0
processed_images/64 bridge.jpeg 8 4 1
processed_images/65 bridge.jpeg 10 5 0
processed_images/66 bridge.jpeg 10 4 0
processed_images/67 bridge.jpeg 13 3 0
processed_images/68 bridge.jpeg 9 2 0
processed_images/69 bridge.jpeg 6 3 0
processed_images/70 bridge.jpeg 7 3 0
processed_images/71 bridge.jpeg 9 1 0
processed_images/72 bridge.jpeg 11 2 1
processed_images/73 bridge.jpeg 4 1 0
processed_images/74 bridge.jpeg 6 2 0
processed_images/75 bridge.jpeg 5 1 0
processed_images/76 bridge.jpeg 4 0 0
processed_images/77 bridge.jpeg 5 2 0
processed_images/78 bridge.jpeg 2 1 0
processed_images/79 bridge.jpeg 4 1 0
TOTAL 567 182 16
Hits = Car Detected
False = False Positive Detection
Miss = False Negative Detection
Proceedings of 2017 Electrical Engineering Symposium (EES2017) - Vol. 1
30
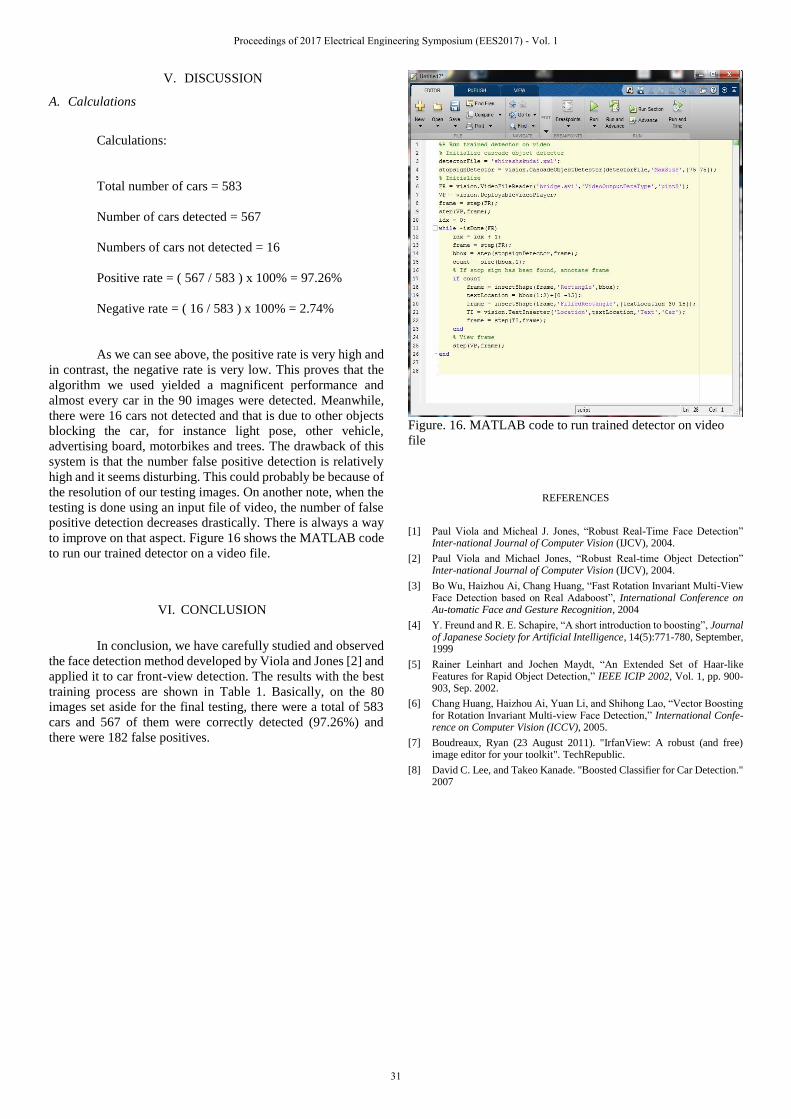
V. DISCUSSION
A. Calculations
Calculations:
Total number of cars = 583
Number of cars detected = 567
Numbers of cars not detected = 16
Positive rate = ( 567 / 583 ) x 100% = 97.26%
Negative rate = ( 16 / 583 ) x 100% = 2.74%
As we can see above, the positive rate is very high and
in contrast, the negative rate is very low. This proves that the
algorithm we used yielded a magnificent performance and
almost every car in the 90 images were detected. Meanwhile,
there were 16 cars not detected and that is due to other objects
blocking the car, for instance light pose, other vehicle,
advertising board, motorbikes and trees. The drawback of this
system is that the number false positive detection is relatively
high and it seems disturbing. This could probably be because of
the resolution of our testing images. On another note, when the
testing is done using an input file of video, the number of false
positive detection decreases drastically. There is always a way
to improve on that aspect. Figure 16 shows the MATLAB code
to run our trained detector on a video file.
VI. CONCLUSION
In conclusion, we have carefully studied and observed
the face detection method developed by Viola and Jones [2] and
applied it to car front-view detection. The results with the best
training process are shown in Table 1. Basically, on the 80
images set aside for the final testing, there were a total of 583
cars and 567 of them were correctly detected (97.26%) and
there were 182 false positives.
Figure. 16. MATLAB code to run trained detector on video
file
REFERENCES
[1] Paul Viola and Micheal J. Jones, “Robust Real-Time Face Detection” Inter-national Journal of Computer Vision (IJCV), 2004.
[2] Paul Viola and Michael Jones, “Robust Real-time Object Detection” Inter-national Journal of Computer Vision (IJCV), 2004.
[3] Bo Wu, Haizhou Ai, Chang Huang, “Fast Rotation Invariant Multi-View Face Detection based on Real Adaboost”, International Conference on Au-tomatic Face and Gesture Recognition, 2004
[4] Y. Freund and R. E. Schapire, “A short introduction to boosting”, Journal of Japanese Society for Artificial Intelligence, 14(5):771-780, September, 1999
[5] Rainer Leinhart and Jochen Maydt, “An Extended Set of Haar-like Features for Rapid Object Detection,” IEEE ICIP 2002, Vol. 1, pp. 900-903, Sep. 2002.
[6] Chang Huang, Haizhou Ai, Yuan Li, and Shihong Lao, “Vector Boosting for Rotation Invariant Multi-view Face Detection,” International Confe-rence on Computer Vision (ICCV), 2005.
[7] Boudreaux, Ryan (23 August 2011). "IrfanView: A robust (and free) image editor for your toolkit". TechRepublic.
[8] David C. Lee, and Takeo Kanade. "Boosted Classifier for Car Detection." 2007
Proceedings of 2017 Electrical Engineering Symposium (EES2017) - Vol. 1
31

Smart Advertising Robot with Image Recognition
Nik Ahmad Faisal Bin Mohd Kamarolzaman
Faculty of Electrical Engineering
Universiti Teknologi Malaysia
Johor Bahru, Malaysia.
Yeong Che Fai
Department of Mechatronics and Robotics
Faculty of Electrical Engineering
Universiti Teknologi Malaysia
Johor Bahru, Malaysia.
Abstract—This paper describes project to improve and
interrupt digital advertising board market. The demand for the
digital board keep on increasing and there is potential market to
improve the system to make it more interesting. Instead of using
current digital billboard approach, the project suggests to use
moving robot carrying digital display and provide interaction with
user either for advertisement, directory listing, and digital menu
for restaurant. Most outdoor advertising has the issue to provide
statistics of the ads performance. The analytics can be used to
further improve ads shown at the boards. By using Microsoft
Cognitive Services, the project can now analyze emotion, gender,
and age group of people interacting with the advertising robot.
Crowd profiling is useful to record user interaction preferences.
Keywords— advertising analytics;face recognition; Autonomous
navigation,
I. INTRODUCTION
This project sparks when our collaborator was approach by customers from shopping mall and retail restaurant that want to find other creative way to blast ads and attract people to their property. Recognizing the potential of the solutions, the team started to build prototype to validate the response for the solutions. Along the way, we noticed that the application can be varying from directory listing and menu listing for restaurant.
II. LITERATURE REVIEW
A. Bluebotics Geneva Airport Information Counter
Bluebotics has worked with Geneva Airport to develop information counter moving robot. The robot managed to move around in the airport environment around dynamic environment which involve people walking around[1]. The robot can gives guide to the users on where about of location inside building. Bluebotics claimed they use ANT navigation developed by Bluebotics themselves [2].
Fig. 1. Bluebotics Geneva Airport Information Counter.
B. Beam Telepresence Robot
The Beam Telepresence robot uses same differential drive system which is can apply to current project. The hardware design is simple and cost wise is better. The height of the screen need to be consider and adjustable height adjustment of the screen can be implemented. This robot is for users to interact with other people in remote location with the features of user can control the robot. Hence, telepresence robot name. This robot is a plain video conferencing system on a drive-able robot[3] .
Fig. 2. Beam Telepresence Robot.
Proceedings of 2017 Electrical Engineering Symposium (EES2017) - Vol. 1
32

III. METHODS
A. System Architecture
The project integrates different platform for different functions of the robot features. Among them is Microsoft Cognitive Services, Robot Operating System, Universal Windows Platform, Microsoft SQL Azure, and Microsoft Power BI. The navigation part of the project is using ROS [4]. The main software is running Universal Windows Platform.
Fig. 3. System Overview.
B. Digital advertising
For our very first prototype, navigation part of the robot was to used standard ROS navigation stack in which it has path planning feature to
C. ROS-based Navigation
Robotic Operating System framework is used For our very first prototype, navigation part of the robot was to used standard ROS navigation stack in which it has path planning feature to let the robot moves around the obstacle by simply set the final point or target where the robot want to go. But different needs were found, instead of letting the robot plan and moves around, the planning part is removed to ensure the robot movement is within pre-plotted waypoints. One of the team members wrote part of navigation code for our collaborators and instead of reinvent the wheel, we will use the company navigation stack which is very easy to use.
D. ROS-based Navigation
For our very first prototype, navigation part of the robot was
to used standard ROS navigation stack in which it has path
planning feature to let the robot moves around the obstacle by
simply set the final point or target where the robot want to go.
But different needs were found, instead of letting the robot plan
and moves around, the planning part is removed to ensure the
robot movement is within pre-plotted waypoints. One of the
team members wrote part of navigation code for our
collaborators and instead of reinvent the wheel, we will use the
company navigation stack which is very easy to use.
To localize itself, the robot use Adaptive Monte-Carlo
Localization (AMCL) package [5]. Initial approximate
coordinate in map must be set first to localize in the map
correctly after any movement that are referencing to the laser
data and encoder data.
We wrote navigation code to handle straight line movement
and Bezier curve movement. In the map, path is pre-plotted
based on these 2 types of path. For straight line, initial
coordinate and final coordinate is needed.
Bezier Curve have 4 coordinates that determines the curvature
of the line. We interpolate the curve to be use as reference by
the robot [6]. Both of navigation type calculate linear error and
angular error to be feedback to the robot base.
E. User Interface
In order to do targeted advertising, the project need to have
vision analysis to process gender, age group and emotion.
Instead of training new model using large datasets, we found
out that Microsoft Cognitive Services has useful API to perform
the analysis. The Face API, Emotion API, and Vision API is
used in the project to make it more interesting to the people
around. Adding value to the interactivity itself.
For Face API, person profiling can be integrated to offer ads
or service based on the person preferences. The application can
greet people by the name (if manual profiling was done) and
show ads based on their interaction history with the robot. For
targeted ads based on demographic alone can be used for initial
interaction user with the robot.
Fig. 4. User Interface.
F. Cloud based Database and Analytics
The project uses Microsoft SQL Azure to store data collected
from the vision analysis. The data can be further visualized by
using Microsoft PowerBI. From there, because of
advertisement, advertiser can access the dashboard to improve
their ads content based on data collected.
Proceedings of 2017 Electrical Engineering Symposium (EES2017) - Vol. 1
33
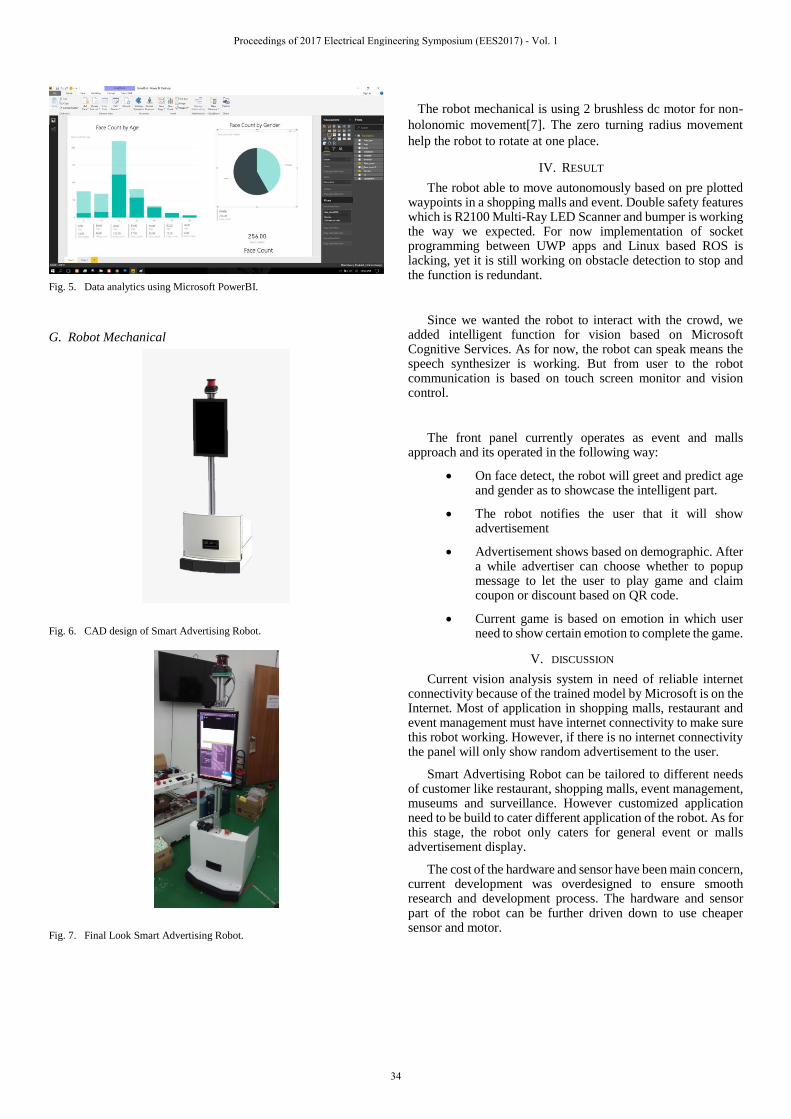
Fig. 5. Data analytics using Microsoft PowerBI.
G. Robot Mechanical
Fig. 6. CAD design of Smart Advertising Robot.
Fig. 7. Final Look Smart Advertising Robot.
The robot mechanical is using 2 brushless dc motor for non-
holonomic movement[7]. The zero turning radius movement
help the robot to rotate at one place.
IV. RESULT
The robot able to move autonomously based on pre plotted waypoints in a shopping malls and event. Double safety features which is R2100 Multi-Ray LED Scanner and bumper is working the way we expected. For now implementation of socket programming between UWP apps and Linux based ROS is lacking, yet it is still working on obstacle detection to stop and the function is redundant.
Since we wanted the robot to interact with the crowd, we added intelligent function for vision based on Microsoft Cognitive Services. As for now, the robot can speak means the speech synthesizer is working. But from user to the robot communication is based on touch screen monitor and vision control.
The front panel currently operates as event and malls approach and its operated in the following way:
On face detect, the robot will greet and predict ageand gender as to showcase the intelligent part.
The robot notifies the user that it will showadvertisement
Advertisement shows based on demographic. Aftera while advertiser can choose whether to popupmessage to let the user to play game and claimcoupon or discount based on QR code.
Current game is based on emotion in which userneed to show certain emotion to complete the game.
V. DISCUSSION
Current vision analysis system in need of reliable internet connectivity because of the trained model by Microsoft is on the Internet. Most of application in shopping malls, restaurant and event management must have internet connectivity to make sure this robot working. However, if there is no internet connectivity the panel will only show random advertisement to the user.
Smart Advertising Robot can be tailored to different needs of customer like restaurant, shopping malls, event management, museums and surveillance. However customized application need to be build to cater different application of the robot. As for this stage, the robot only caters for general event or malls advertisement display.
The cost of the hardware and sensor have been main concern, current development was overdesigned to ensure smooth research and development process. The hardware and sensor part of the robot can be further driven down to use cheaper sensor and motor.
Proceedings of 2017 Electrical Engineering Symposium (EES2017) - Vol. 1
34
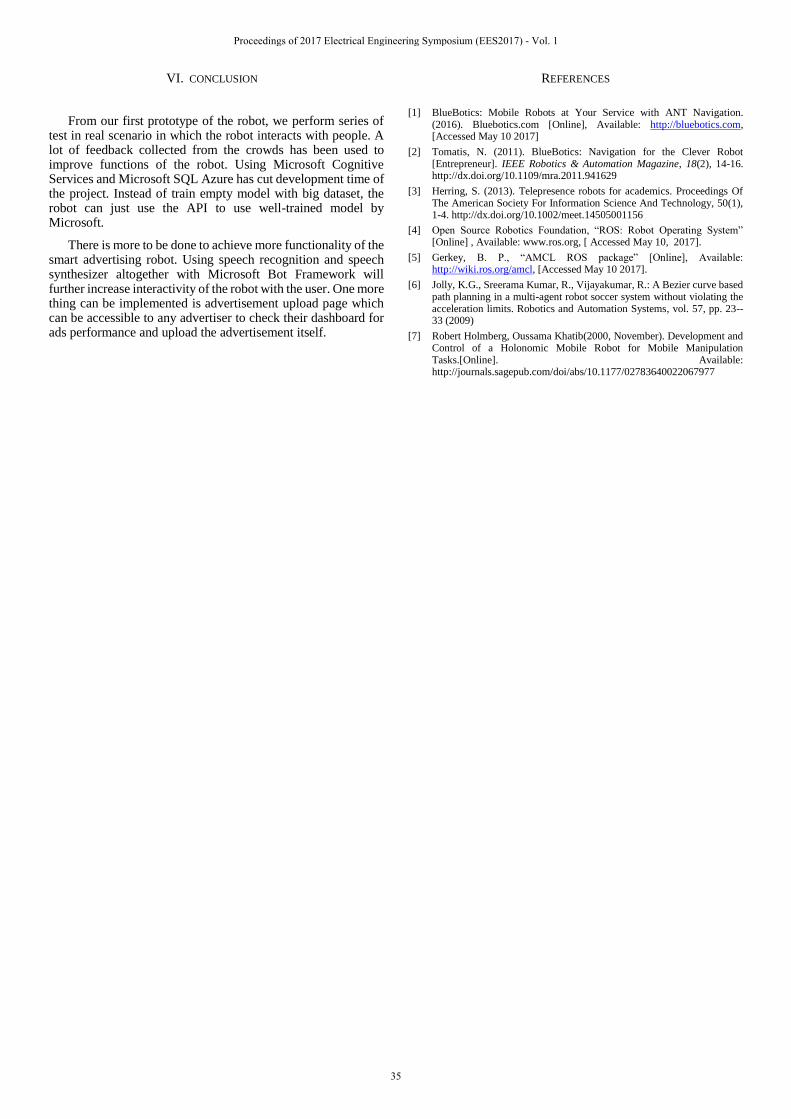
VI. CONCLUSION
From our first prototype of the robot, we perform series of test in real scenario in which the robot interacts with people. A lot of feedback collected from the crowds has been used to improve functions of the robot. Using Microsoft Cognitive Services and Microsoft SQL Azure has cut development time of the project. Instead of train empty model with big dataset, the robot can just use the API to use well-trained model by Microsoft.
There is more to be done to achieve more functionality of the smart advertising robot. Using speech recognition and speech synthesizer altogether with Microsoft Bot Framework will further increase interactivity of the robot with the user. One more thing can be implemented is advertisement upload page which can be accessible to any advertiser to check their dashboard for ads performance and upload the advertisement itself.
REFERENCES
[1] BlueBotics: Mobile Robots at Your Service with ANT Navigation. (2016). Bluebotics.com [Online], Available: http://bluebotics.com, [Accessed May 10 2017]
[2] Tomatis, N. (2011). BlueBotics: Navigation for the Clever Robot [Entrepreneur]. IEEE Robotics & Automation Magazine, 18(2), 14-16. http://dx.doi.org/10.1109/mra.2011.941629
[3] Herring, S. (2013). Telepresence robots for academics. Proceedings Of The American Society For Information Science And Technology, 50(1), 1-4. http://dx.doi.org/10.1002/meet.14505001156
[4] Open Source Robotics Foundation, “ROS: Robot Operating System” [Online] , Available: www.ros.org, [ Accessed May 10, 2017].
[5] Gerkey, B. P., “AMCL ROS package” [Online], Available: http://wiki.ros.org/amcl, [Accessed May 10 2017].
[6] Jolly, K.G., Sreerama Kumar, R., Vijayakumar, R.: A Bezier curve based path planning in a multi-agent robot soccer system without violating the acceleration limits. Robotics and Automation Systems, vol. 57, pp. 23--33 (2009)
[7] Robert Holmberg, Oussama Khatib(2000, November). Development and Control of a Holonomic Mobile Robot for Mobile Manipulation Tasks.[Online]. Available: http://journals.sagepub.com/doi/abs/10.1177/02783640022067977
Proceedings of 2017 Electrical Engineering Symposium (EES2017) - Vol. 1
35

Automated Guided Vehicle(AGV) For High Mix Low
Volume Manufacturing Industry
Poh Hung Yong
Faculty of Electrical Engineering
Universiti Teknologi Malaysia
Johor Bahru, Malaysia.
Rosbi bin Mamat
Department of Control and Mechatronic Engineering
Faculty of Electrical Engineering
Universiti Teknologi Malaysia
Johor Bahru, Malaysia.
Abstract—Automated Guided Vehicles will become the
necessity needs in the industrial world when automation takes
over the world. There are different kind of AGV in the market
and towing AGV have been used in this project because of the
robust design and cost effective purposes. In a continuous
changing industrial, a customize AGV is needed with high
flexibility. Therefore, this work focus on developing a customize
AGV with a normal AGV function and addition of a custom
Graphic User Interface (GUI). Magnetic sensor is used to detect
the magnetic line for AGV to navigate from one place to another.
Magnetic approach is used because of the robustness compare to
using colour sensor to detect colour where magnetic will not be
affected by the surrounding light intensity. The configuration of
sensor placement also stated in this project. Proportional Integral
(PI) control is also used to control the output of the motor to be
smoother. Graph is plotted when tuning the motor to acquire a
more precise result and adjustment of the PI values. Arduino is
used as the central processing unit (CPU) for the motor control
and line following program. GUI is designed to let user to be
more easily interact with the AGV and can manually to order the
AGV to a specific location by clicking button. Qt creator is used
as the platform for the GUI interface where the programming
language is C++. This system provides a more flexible platform
for company to directly access to AGV system. AGV able to
correctly navigate to the specific location by following the
schedule or task given. It can function normally as the other
AGV.
Keywords—AGV; GUI; Qt creator;hall effect sensor; colour
sensor; arduino; PID; scheduling.
I. INTRODUCTION
Automated Guided Vehicle (AGV) was built and
introduced in 1953. It was built from tractor and used to
moving raw materials or products from one place to another
place. In the late 1950 and early 1960, AGV started to
implement in many factories. In 1974, Volvo plant has largely
deployed the use of AGV in Kalmar, Sweden. In 1984, more
than 1500 AGVs is used in 3300 factories across the world
[1]. AGV is widely used because it can increase the efficiency
of production line, prevent aging workforce and protect the
safety of workers. Moreover, Company used AGV to perform
difficult reach task, highly repeatability task and also
dangerous task. These enable humans to perform other tasks
that required more challenges or thinking skills. AGV is
implemented to focus on handling material from one place to
another but now AGV has transformed into another type
which AGV works with robots to perform welding or painting
task [2]. AGV required a centralized control system to control
its path and destination, although there can be on-board
intelligence installed inside the AGV itself, making it able to
communicate with other AGV when performing tasks.
AGVs have been transformed from the old type of
towing into three main types of AGV which are Tractor type,
Unit Load type and Forked type. Tractor type is to pull a
trolley from behind the AGV. Unit Load type AGV floor plan
is designed based on the factory’s production line layout,
which means AGV can share the workspace with other worker
because AGV only occupy a specific space for a while to get
the jobs done. The guide path is flexible, as high mix low
volume company required changes from time to time, the
guide path can be changed in a matter of minutes. AGV have
different path to be guided which includes wired path, guide
tape, natural and vision. Wired means wire must be embedded
down the floor along the pathway of AGV need to follow.
Guide tape means to put a tape whether is magnetic tape or
colored tape along the guide path for AGV to track and
follow. Natural guidance means AGV using range finder like
laser range finder to detect the path to follow. Vision guidance
is to use camera to know the path to follow.
II. LITERATURE REVIEW
A. wheel of AGV
In the manufacturing industry, the AGV developed mostly uses differential wheel. It is because differential wheel has the zero radius turning degree and is easier to control compared to other configuration of wheel [3] and [4]. Differential wheel is chosen because of the easy configuration and the simplicity in the design. Differential drive also has high precision where slip will not occur easily. Differential drive enables a more precise line follow with only controlling 2 motors. Figure 2.5 shows the differential drives.
B. guidance of AGV
Most of the industry used guided magnetic type to guide the AGV because the installation steps is easy [4]. By using magnetic as the guidance of AGV, AGV can determine its
Proceedings of 2017 Electrical Engineering Symposium (EES2017) - Vol. 1
36

position by scanning on the magnetic tape on the floor. Using line following method with magnetic provides the AGV with high accuracy and flexibility which will also increase the cost as well [4].
C. controller of AGV
Nowadays, RPi is starting to get more popular when it can function as a controller while having its own interface which is like a mini computer. RPi is already implemented in the industry to make car for a factory when Peugeot Citroen car engineer uses RPi to make robot [5]. RPi have many function but only sold at low cost. RPi is also used to create a management system in a sports stadium by using multiple sensor [6]. It controls the audio, video output, lighting and fragrance of the stadium.
While considered RPi is also stable and able to create a User interface for the user. RPi is selected as the controller for GUI while microcontroller is used as a low level control system to control motor and sensor data.
D. tuning method of AGV
Proportional Integral Derivative (PID) controller is widely used in the industry to control the speed of motor. The simplicity to apply the control method to a system and able to get the desired output make many users to implement it in their system. PID controller can be divided into 4 parts, P controller, PI controller, PD controller and PID controller. Different type of controller fits for different system. P in PID control the proportional gain or transient time while I in PID enables to eliminate the offset and D in PID is to eliminate the overshoot from the define value [7].
E. Type of AGV
Towing AGV is commonly seen in factories where AGV towed trolley from one end of the factory to the other end. A single tractor AGV is used to compare to multiple tractor AGV. Simulation is carried out and indicates that multiple tractor reduce the effectiveness of AGV [8].
III. PROJECT METHODOLOGY
In product design, there are 2 main controller is going to be used in this project, which is raspberry pi 3 and Arduino Mega. Raspberry Pi 3 is mainly in charge of the high level design which is creating a GUI for user to operate the AGV, communicating with the server through Wi-Fi and communicating with Arduino to send data. Moreover, Arduino Mega is used for the low level design which is motor control, data acquisition and process of sensor data, communicating with Raspberry pi and user input.
Fig. 1 .AGV Fig. 2. Floor plan
Fig. 3. Overview of AGV system
A. Raspberry pi 3 and GUI
Raspberry Pi 3 is used as the controller for Graphic User Interface in AGV. It also acts as the intermediate point to connect the server (computer) to the AGV. Raspberry Pi 3 provides a Raspbian operating system which is similar to the Linux interface then many programmers are familiar. RPi3 also preloaded with many different programming languages which allow user to program using python and communicate with the other devices. RPi3 also have a WI-FI integrated onto the board and does not need an external shield for it to connect to the router to communicate with the server. Overall, RPi 3 is a low cost microcomputer which can integrate with different electronic device while have its own user interface [9].
The purpose of creating GUI is to enhance user experience when using AGV and let them operate the AGV by ordering the AGV to move to the desired destination in the program. The GUI is programmed to create a text file that loaded with information when a button in the GUI is clicked. The text file is then used to communicate with the server or Arduino.
The GUI can perform four tasks. The first task is by security which call the user to key in log in user and password before using. Secondly, User can view the status of AGV on where the AGV is moving to. Thirdly, the interface able to upload the table from server. Lastly, the interface also let the user to key in manually by setting the AGV current and next destination.
B. Arduino Mega
Arduino Mega 2560 is a microcontroller which based on ATmega2560. It has 54 Digital Input Output pin where 15 of it provides Pulse Width Modulation (PWM), 16 analog pins and 4 Universal Asynchronous Receiver Transmitter (UART) which is enough to use to combine sensor reading and motor reading. Arduino is used to get sensor reading because sensor needed an analog output from Arduino which Raspberry Pi did not have. Arduino Mega is a microcontroller which is used to control the motor speed and movement. Sensor data acquisition, filter and processing also included in Arduino.
C. Ultrasonic Sensor
Fig. 4. Ultrasonic sensor
Proceedings of 2017 Electrical Engineering Symposium (EES2017) - Vol. 1
37
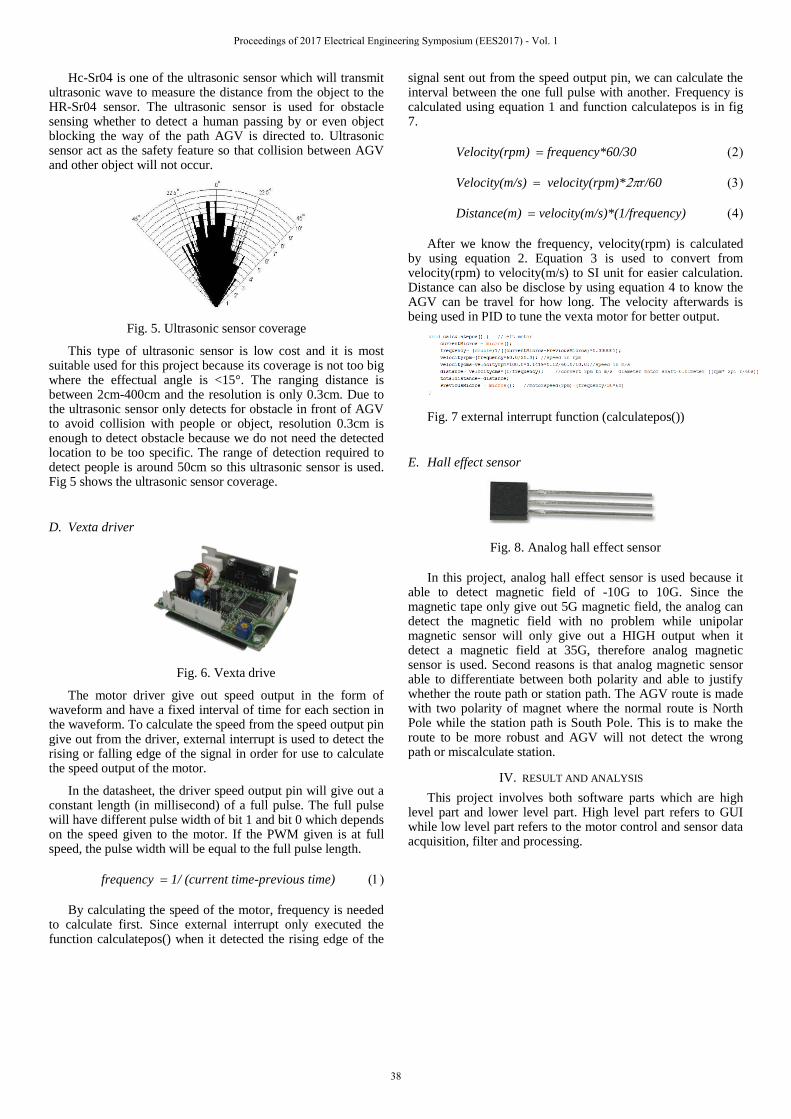
Hc-Sr04 is one of the ultrasonic sensor which will transmit ultrasonic wave to measure the distance from the object to the HR-Sr04 sensor. The ultrasonic sensor is used for obstacle sensing whether to detect a human passing by or even object blocking the way of the path AGV is directed to. Ultrasonic sensor act as the safety feature so that collision between AGV and other object will not occur.
Fig. 5. Ultrasonic sensor coverage
This type of ultrasonic sensor is low cost and it is most suitable used for this project because its coverage is not too big where the effectual angle is <15°. The ranging distance is between 2cm-400cm and the resolution is only 0.3cm. Due to the ultrasonic sensor only detects for obstacle in front of AGV to avoid collision with people or object, resolution 0.3cm is enough to detect obstacle because we do not need the detected location to be too specific. The range of detection required to detect people is around 50cm so this ultrasonic sensor is used. Fig 5 shows the ultrasonic sensor coverage.
D. Vexta driver
Fig. 6. Vexta drive
The motor driver give out speed output in the form of waveform and have a fixed interval of time for each section in the waveform. To calculate the speed from the speed output pin give out from the driver, external interrupt is used to detect the rising or falling edge of the signal in order for use to calculate the speed output of the motor.
In the datasheet, the driver speed output pin will give out a constant length (in millisecond) of a full pulse. The full pulse will have different pulse width of bit 1 and bit 0 which depends on the speed given to the motor. If the PWM given is at full speed, the pulse width will be equal to the full pulse length.
frequency1/ (current time-previous time)
By calculating the speed of the motor, frequency is needed to calculate first. Since external interrupt only executed the function calculatepos() when it detected the rising edge of the
signal sent out from the speed output pin, we can calculate the interval between the one full pulse with another. Frequency is calculated using equation 1 and function calculatepos is in fig 7.
Velocity(rpm)frequency*60/30
Velocity(m/s) velocity(rpm)*r/60
Distance(m)velocity(m/s)*(1/frequency)
After we know the frequency, velocity(rpm) is calculated by using equation 2. Equation 3 is used to convert from velocity(rpm) to velocity(m/s) to SI unit for easier calculation. Distance can also be disclose by using equation 4 to know the AGV can be travel for how long. The velocity afterwards is being used in PID to tune the vexta motor for better output.
Fig. 7 external interrupt function (calculatepos())
E. Hall effect sensor
Fig. 8. Analog hall effect sensor
In this project, analog hall effect sensor is used because it able to detect magnetic field of -10G to 10G. Since the magnetic tape only give out 5G magnetic field, the analog can detect the magnetic field with no problem while unipolar magnetic sensor will only give out a HIGH output when it detect a magnetic field at 35G, therefore analog magnetic sensor is used. Second reasons is that analog magnetic sensor able to differentiate between both polarity and able to justify whether the route path or station path. The AGV route is made with two polarity of magnet where the normal route is North Pole while the station path is South Pole. This is to make the route to be more robust and AGV will not detect the wrong path or miscalculate station.
IV. RESULT AND ANALYSIS
This project involves both software parts which are high level part and lower level part. High level part refers to GUI while low level part refers to the motor control and sensor data acquisition, filter and processing.
Proceedings of 2017 Electrical Engineering Symposium (EES2017) - Vol. 1
38

A. GUI
Fig. 9. Login page
AGV application is developed to perform navigation functions and status of AGV. The GUI have 3 pages which are login page, status page and path page (manual mode).
On the login page in fig 9, the user required to login in with the correct username and password in order to go into the status page. The application will pop up message to notify the user when the user has successfully login. The password and username is set in the program and read as a string when user key in the username and password.
Fig. 10. Status window
After login, the user interface will show the current
AGV status. The interface will show the AGV ID, Battery
Level, Date and Time. There is also a status window to
indicate where the AGV currently going. Fig 10 shows the
interface of the status window. There is a “refresh” and “add
path button” on the bottom of the status window. “Add path
button” is clicked to change the interface to another interface
while “refresh button” just refreshing the status display.
Fig. 11. Manual mode
Manual mode lets the user to select the destination of
the AGV that the users want the AGV to proceed. When the
user click the “Set Button”, the path set window will show the
path set by the user. When done is click, the AGV will go to
the destination set by the user.
B. PID control
Fig. 12. PID output
PID controller is the most frequent controller used in the industry nowadays. The feedback mechanism is reliable and easy to be implemented. PID contains of 3 term which is proportional, Integral and derivative. By calculating the error which the output vary from the setpoint, PID controller is able to apply correction based on the given P,I and D values.
When tuning the PID, 3 distance and 3 speed is set and it divided into 3 section to see the response of motor. The first section is 2meter is set to speed 0.3m/s then in the next section is 6meter and is set to speed 0.6m/s and lastly is also 3meter and is set to speed 0.3m/s.
As we can see the motor react accordingly to what setpoint is given although there are some oscillation in the graph but response output is very good given that the motor can run in a straight line. Using different speed in tuning able to let us see the motor reacts from low to high speed and vice versa.
V. CONCLUSION
The floor plan is customize and the AGV is program to suit the floor. The program can be change easily to suit different floor plan according to the factory design. The GUI enable people to access and identify the problem occurred in the AGV easily. First time user also able to easily understand the interface and able to quickly operate the AGV.
The result shows that the AGV perform as expected where it can transport material from the warehouse to the station appointed. Even with different lighting condition, the AGV able to perform task as appointed. Magnetic line follow is prove to be same as detecting colour of line. GUI also prove t be useful as the operator does not need to go to the control centre to control the AGV but just access to the AGV on the spot. AGV also can be troubleshoot easily as a monitor is place on the AGV. By applying these into the AGV, AGV can have less breakdown time while more operating time.
REFERENCES
[1] J. Zygmont, "Guided vehicles set manufacturing in motion," High Technology, p. 16, December 1986.
[2] S. Yaghoubi, S. Khalili, R. M. Nezhad, M. R. Kazemi and M. Sakhaiifar, "DESIGNING AND METHODOLOGY OF AUTOMATED GUIDED VEHICLE ROBOTS/ SELF GUIDED VEHICLES SYSTEMS, FUTURE TRENDS," International Journal of Research and Reviews in Applied Sciences, vol. 13, no. 1, 2012.
Proceedings of 2017 Electrical Engineering Symposium (EES2017) - Vol. 1
39

[3] S. Yu, C. Ye, H. Liu and J. Chen, "Development of an omnidirectional Automated Guided Vehicle with MY3 wheels," Perspectives in Science, vol. 7, p. 364—368, 2016.
[4] G. J. Cawood and I. A. Gorlach, "Navigation and locomotion of a low-cost Automated Guided Cart," 2015 Pattern Recognition Association of South Africa and Robotics and Mechatronics International Conference (PRASA-RobMech), Port Elizabeth, pp. 83-88, 2015.
[5] "PEUGEOT CITROEN: RASPBERRY PI FACTORY ROBOT," The MagPi Magazine, [Online]. Available: https://www.raspberrypi.org/magpi/peugeot-citroen-robots/. [Accessed 29 November 2016].
[6] Designerz, "Raspberry PI and Arduino in industrial environments," DESIGNSPARK, 29 April 2016. [Online]. Available: https://www.rs-
online.com/designspark/raspberry-pi-and-Arduino-in-industrial-environments. [Accessed 29 November 2016].
[7] X. Li, C. Luo, Y. Xu and P. Li, "A Fuzzy PID controller applied in AGV control system," 2016 International Conference on Advanced Robotics and Mechatronics (ICARM), pp. 555-560, 2016.
[8] U. Bilge, Tanchoco and J.M.A, "AGV Systems with Multi-Load Carriers: Basic Issues and Potential Benefits," Journal of Manufacturing Systems, vol. 16, no. 3, 1997.
[9] H. Guerra, A. Cardoso, V. Sousa, J. Leitão, V. Graveto and L. M. Gomes, "Demonstration of programming in Python using a remote lab with Raspberry Pi," 2015 3rd Experiment International Conference (exp.at'15), Ponta Delgada, pp. 101-102, 2015 .
Proceedings of 2017 Electrical Engineering Symposium (EES2017) - Vol. 1
40

Balloon Networked Control System
Nurul Amirah Binti Azman
Faculty of Electrical Engineering
Universiti Teknologi Malaysia
Johor Bahru, Malaysia.
Nurul Adilla Binti Mohd Subha
Department of Control and Mechatronic Engineering
Faculty of Electrical Engineering
Universiti Teknologi Malaysia
Johor Bahru, Malaysia.
Abstract— The paper is concerned with the design of multiple
balloon-networked control system with direction angle control. It
presents a low cost networked multi-agent system consisting of
multiple balloons, where each of them comprises a wireless fidelity
(Wi-fi) for signal communication. One balloon is called master
agent who able to receive signal from the user at ground-based
station and able to transmit signal to other agents. Other agents
are called slave agent will receive the transmitted signal from the
master agent and execute the order immediately corresponding to
the received signal. Consequently, all agents will reach the
consensus for direction angle of the balloon.
Keywords— network control system, multi-agent, Wi-Fi,
balloons
I. INTRODUCTION
Networked Control System (NCS) is a control system where the control loops are closed through a communication network. The basic elements for NCS are sensors, controller, and actuators of a digital controller reside on different computer nodes linked by a communication network. The application of NCS is aim to overcome the disadvantages of conventional digital control system, such as difficulty of modification, vulnerability to electrical noise, difficulty in maintenance and upgrades, at the application level. The research of the NCS is categorized into two: (1) Control over network; and (2) Control of network. Control over network deals more with control strategies and control system design over the network to minimize the effect of adverse network parameters on NCS performance [8]. Control of network is more on study and research on communications and networks to make them suitable for real time NCS, such as routing control, congestion reduction, networking protocol, etc. The project that is being discussed in this paper is the application of the control over network of NCS.
The application of NCS can be seen in various industries for example, unmanned aerial vehicles (UAV), remote diagnostic and troubleshooting, space and terrestrial exploration, access in hazardous environments, manufacturing plant monitoring and also tele-operations
The application of helium balloons to access dangerous and hazardous environment is proven in several case studies [14]. It is also frequently use for other scientific research purposes, for example, in weather or atmosphere research which is used to gather information on the temperature, wind speed, humidity, atmospheric pressure and also use for mapping geographical
area. A balloon networked control system can fly ceaselessly for undetermined periods (provided enough energy supply using battery or solar energy), achieve steady buoyancy, and also suitable for high altitude [4]. Balloon is chosen as an agent to minimize cost of monitoring and maintenance. Besides that, during launching, it does not require high technical skills. Therefore, with these advantages, this research proposes the use of helium balloons for balloon-networked control system with direction angle control.
II. METHODOLOGY
A. General Construction
Figure 1 shows the general construction of an agent of the balloon networked control system, which made up of balloon, string, box, servo motor, as well as fan. For this project, a 36 inch latex balloon with helium as lifting gas is chosen as an agent. There will be no potential hazard and no ecological damage resulting from the use of the helium as it is natural, non-flammable and non-toxic gas. The box is made up by 3D printing material.
Figure 1: Hardware setup for each agent
Proceedings of 2017 Electrical Engineering Symposium (EES2017) - Vol. 1
41
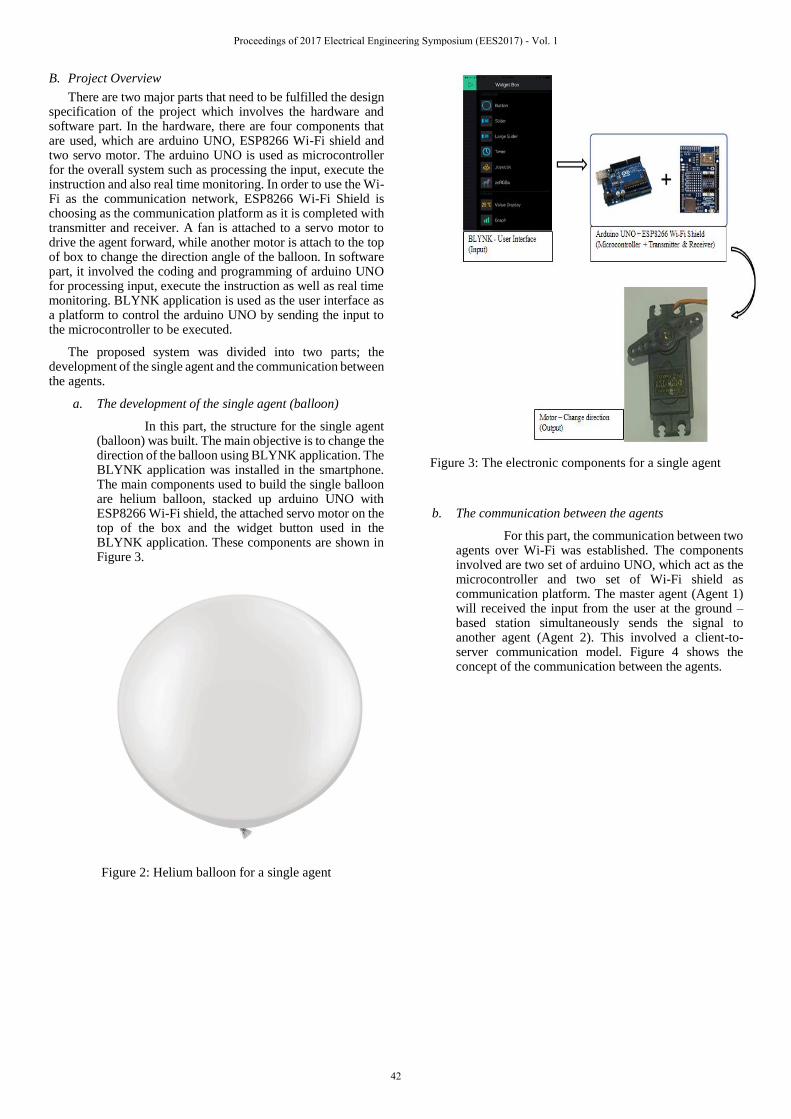
B. Project Overview
There are two major parts that need to be fulfilled the design specification of the project which involves the hardware and software part. In the hardware, there are four components that are used, which are arduino UNO, ESP8266 Wi-Fi shield and two servo motor. The arduino UNO is used as microcontroller for the overall system such as processing the input, execute the instruction and also real time monitoring. In order to use the Wi-Fi as the communication network, ESP8266 Wi-Fi Shield is choosing as the communication platform as it is completed with transmitter and receiver. A fan is attached to a servo motor to drive the agent forward, while another motor is attach to the top of box to change the direction angle of the balloon. In software part, it involved the coding and programming of arduino UNO for processing input, execute the instruction as well as real time monitoring. BLYNK application is used as the user interface as a platform to control the arduino UNO by sending the input to the microcontroller to be executed.
The proposed system was divided into two parts; the development of the single agent and the communication between the agents.
a. The development of the single agent (balloon)
In this part, the structure for the single agent (balloon) was built. The main objective is to change the direction of the balloon using BLYNK application. The BLYNK application was installed in the smartphone. The main components used to build the single balloon are helium balloon, stacked up arduino UNO with ESP8266 Wi-Fi shield, the attached servo motor on the top of the box and the widget button used in the BLYNK application. These components are shown in Figure 3.
Figure 2: Helium balloon for a single agent
Figure 3: The electronic components for a single agent
b. The communication between the agents
For this part, the communication between two agents over Wi-Fi was established. The components involved are two set of arduino UNO, which act as the microcontroller and two set of Wi-Fi shield as communication platform. The master agent (Agent 1) will received the input from the user at the ground – based station simultaneously sends the signal to another agent (Agent 2). This involved a client-to-server communication model. Figure 4 shows the concept of the communication between the agents.
Proceedings of 2017 Electrical Engineering Symposium (EES2017) - Vol. 1
42

Figure 4: General concept of the communication setup
between the agents
III. RESULT AND DISCUSSION
A. The System of A Single Agent
Firstly, the connection between the laptop and
transmitter/receiver need to be established. The ESP Wi-Fi
Shield which, act as the transmitter/receiver, a specific IP
address is used to ensure the connectivity of the internet.
The IP address can be obtained from the Serial Monitor after
the sketch is uploaded. The IP address is entered to any
search bar of web browser. As the webpage shown the
display that has been set in the sketch, the connection is
successfully established.
Figure 5: Serial monitor and display from IP address
Next, a simple test is done in order to develop the
communication between arduino UNO board and BLYNK.
The test involves a LED and a button widget in the BLYNK
application. When the button in the BLYNK is on, the LED
is supposed to light up. In order to do that, a simple sketch
that involving the communication between the board and
BLYNK is uploaded. The functions in the figure 6 not only
involve the communication between arduino UNO and
BLYNK application, but also ESP Wi-Fi Shield as well.
This shows that the communication between the
microcontroller and the android application is possible and
sending instruction also possible.
Figure 6: Functions of ESP library and BLYNK
Since the communication between the stacked up
UNO, Wi-Fi shield and the BLYNK application is
established, the previous sketch is combined with the sketch
for servo motor. In this coding, the virtual pin is used to send
any data from the arduino to the BLYNK and vice versa.
The widgets used for this part are two buttons, where the
first button is defined with 145 degree and the second button
is define with 35 degree. When the first button is pressed,
the motor moved its angle to 145 degree from the original
position. Hence, the direction of the balloon is also changed
as the motor is attached to the box containing the electronic
components.
Figure 7: Results when button pressed
B. The Communication Between The Agents
Once the components are assembled, the connection
between the microcontrollers is set up. A simple
programming was done to test the communication of the
agents, where a master device sends an input to another
Proceedings of 2017 Electrical Engineering Symposium (EES2017) - Vol. 1
43
device which assigned as slave. The communication
between the microcontrollers is successfully established
once the same pipe of data is connected between the master
agent and the slave agent.
To ensure that the second agent received the input that
has been sent to the main agent, the signal received need to
be executed simultaneously by both agents. However, a
delay of execution is expected from the second agent due to
the network stabilization.
IV. CONCLUSION
The main objective of this project is to develop the consensus of direction angle for multiple balloons-networked control system, which can be control over Wi-Fi as communication network. Using arduino UNO and ESP8266 Wi-Fi shield, the objectives of the project are successfully achieved. The two motors (agents) can be controlled through Wi-Fi by using BLYNK application as platform by pressing the widget buttons. Next, all agents achieved the consensus in direction angle even though the user’s input only connected directly to the master balloon. The communication between the microcontrollers was successfully established even though with stability problem. This system has potential to be applied in wide range of application such as access to dangerous environments and hazardous activities.
REFERENCES
[1] E. N. Mambou, G.M. Yamga, J. Meyer & H. C. Ferreira (2016). Development of a helium gas balloon flying system for aerial photographing and observation. Communication Software and Network (ICCSN), 2016 8th IEEE International Conference on. 681 – 685
[2] I. Vandermeulen, M. Guay, & P. J. Mclellan (2016). Formation control of high-altitude balloons by distributed extremum seeking control. American Control Conference (ACC). 2524 – 2529
[3] Y. Shibata, Y. Sato, N. Ogasawara, G. Chiba, & K. Takahata (2009). A New Ballooned Wireless Mesh Network System for Disaster Use. Advanced Information Networking and Applications, 2009. AINA '09. International Conference on. 816 – 821
[4] S. Kubo, A. Sakaguch, & T. Takimoto (2014). Development of flying observation system with helium gas
balloon and tilt rotors. Proc. Int. Conf. on Control Automation and Systems. 1627 – 1630
[5] B. Silva et al. (2014). Mapping Two Competing Grassland Species from a Low-Altitude Helium Balloon. IEEE Journal of Selected Topics in Applied Earth Observations and Remote Sensing, vol. 7. 3038 – 3049
[6] T. G. Guzik (2015). The High Altitude Student Platform (HASP) as a Model Multi-Payload Balloon Platform. IEEE Aerospace Conference. 1 – 10
[7] N. Inagawa, I. Yamamoto, & T. Nakamura (2009). Research on network system of unmanned flying observation robot. Proc. ICCAS-SICE. 2644 – 2647
[8] R. A. Gupta & M. Chow (2010). Networked Control System: Overview and Research Trends. IEEE Transactions On Industrial Electronics, vol. 57, 2527 – 2535
[9] A. C. Sniderman, M. E. Broucke, & G. M. T. D'Eleuterio (2015). Formation control of balloons: A block circulant approach. American Control Conference (ACC) 2015. 1463 – 1468
[10] M. Guay, I. Vandermeulen, S. Dougherty, & P. Mclellan (2015). Distributed extremum-seeking control over networks of dynamic agents. American Control Conference (ACC) 2015. 159 – 164
[11] D. Kim (2013). A Survey of Balloon Networking Applications and Technologies. CSE570S: Recent Advances in Networking – Data Center Virtualization, SDN, Big Data, Cloud Computing, Internet of Things. 1 – 13
[12] A. G. Andurkar & PrachiZodpe (2016). A Review Paper on Project “LOONS”. International Journal of Advanced Research in Computer and Communication Engineering, vol. 5. 132 – 138
[13] K. Matsuo & K. Tajima (2014). A Study of Network Emulation for IP Network – Based Control System of a Small Motor. Electrical Machines and Systems (ICEMS), 2014 17th International Conference on. 2216 – 2220
[14] B. Lonneville, C. Stal, B. De Roo, B. De Wit, A. De Wit, & P. De Maeyer (2014). Helium Balloons For 3D Modeling: Off To A Flying Start? Low Cost 3D Workshop Conference.
[15] A. Fallis (2013). Arduino UNO. J. Chem. Inf. Model, vol. 53, no. 9. 1689–1699
[16] “Introducing project loon: Balloon-powered internet access”, Official Google Blog, 2013, [online] Available: http://googleblog.blogspot.ca/2013/06/introducing-project-loon.html.
[17] “Loon for all - project loon”, Google, 2015, [online] Available: http://www.google.com/loon/.
Proceedings of 2017 Electrical Engineering Symposium (EES2017) - Vol. 1
44

Water Flow Meter and Monitoring System
Muhammad Zulhilmi Bin Halim
Faculty of Electrical Engineering
Universiti Teknologi Malaysia
Johor Bahru, Malaysia.
Norhaliza Binti Abdul Wahab
Department of Control & Mechatronics Engineering
Faculty of Electrical Engineering
Universiti Teknologi Malaysia
Johor Bahru, Malaysia.
Abstract—This study about extending the flow meter reading
from site to the control room using internet, simple Internet of
Thing (IoT). The existing flow meter in industries need workers to
go to site to take reading of flowing liquid or gas. This is sometime
having their own risk to the workers if the site classified as
hazardous area
I. INTRODUCTION
Flow meters widely used in many industries around the world. Some of the industries that usually use the flow meters are the food and beverage industry, oil and gas plants and chemical or pharmaceutical factories. Flow meters used to measure the flow rate of fluid (liquid or gases) through a pipe. The factors for choice the right flow meters are fluid flow profile (laminar, turbulent, or transitional), fluid characteristics (viscosity, turbidity, single or double phase etc.). Some of other considerations are output-connectivity options and mechanical restrictions. There are many types of flow meters available that usually used in industries. Some of flow meters are, differential-pressure, electromagnetic or magmeter, Coriolis, ultrasonic (Doppler-shift and transit-time) flow meter. Each of these flow meters has their own application but its function still the same, to measure flow rate. In industry, these flow meters fixed install between two pipes and the meter’s display attached together to the flow meters. In other hand, the workers need to take the reading for inspection at field. This is one of the risk that can cause accident at workplace.
II. OBJECTIVE
A. Investigate the effect of water flow before and after 90°
pipe fitting
For this objective, this research would like to investigate the flow of water inside pipe before and after 90° pipe fitting. This related to investigate either the water flow in laminar flow or turbulent flow.
B. Viewing flow measurement from field to control room
The existing flow meter in industries, if the workers want to inspect the flow of liquid, they need to go to field to record the reading, but for this paper study, all the reading regarding to the flow will show directly to control room via internet or Bluetooth. But this paper focusing on internet only.
III. METHODOLOGY
This paper study used some method in lab experiment to fulfill all the objectives.
Some of the method of experiment are:
A. Designing the flow of experiment
For this study, the concept of design thinking is used to achieve the objective. In design thinking, there are several parts that can be implement as research guidelines. Design thinking involve conceive, design, implement and operate (CDIO).
Conceive is a part that where all the ideas are develop from the problems. From this part, problem statement developed. From conceive and half of design part, some of the process happen here such as sense and sensibility, empathy, ideation and prototype. Both of this part let the idea to grow more to get the better design that meet end user requirements.
In implement part, all the decision, plan and agreement made. These is involving tool, utensil or other apparatus or equipment for the purpose. Implement also involve design realization. This part needed to test the designing ideas if it is reliable or not.
The operate part is a part where all the data from testing design is collected and analyze. If there are problems occur, some modification needed to overcome the problems. Hence, fulfill the end user requirements. This part is a part that designer can implement all the engineering aspects that can be consider.
B. Flow Simulation
Flow simulation conducted by using SolidWorks software using uncomplicated design. The simulation divided by two parts, part 1 is for study the flow before the 90° pipe fitting and part 2 is for after the 90° pipe fitting. These to study the flow behavior before the 90° pipe fitting and after it.
Proceedings of 2017 Electrical Engineering Symposium (EES2017) - Vol. 1
45
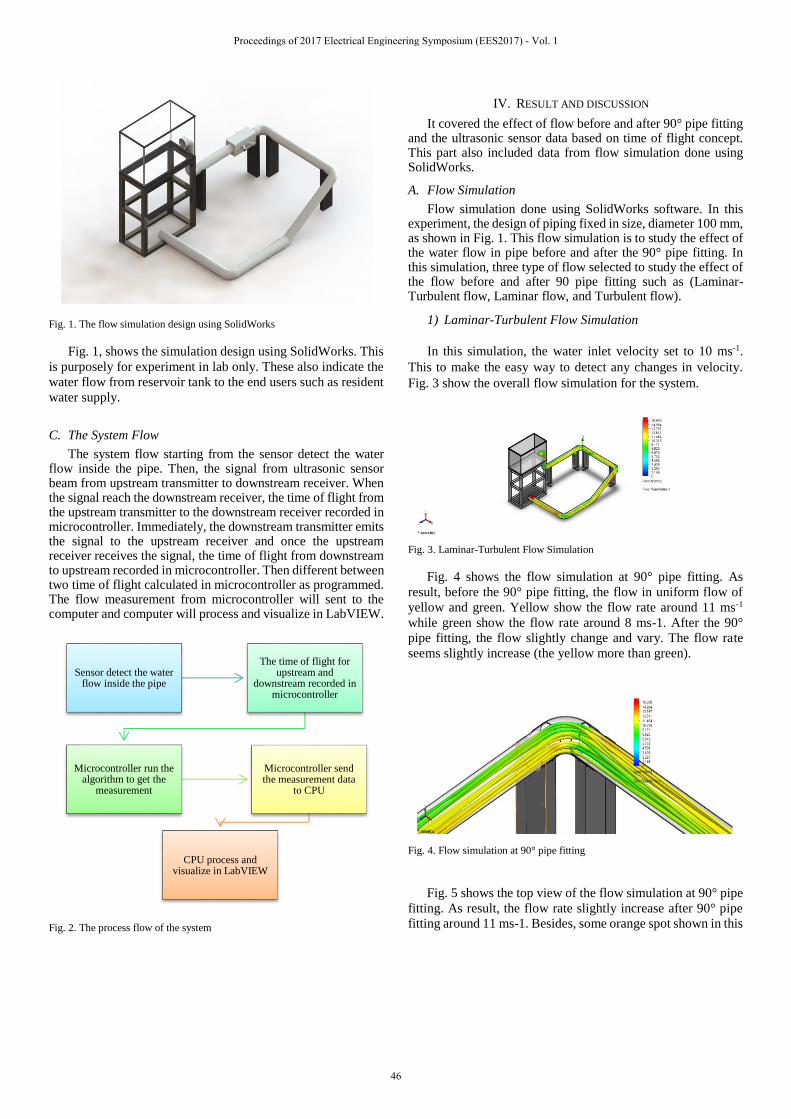
Fig. 1. The flow simulation design using SolidWorks
Fig. 1, shows the simulation design using SolidWorks. This
is purposely for experiment in lab only. These also indicate the
water flow from reservoir tank to the end users such as resident
water supply.
C. The System Flow
The system flow starting from the sensor detect the water flow inside the pipe. Then, the signal from ultrasonic sensor beam from upstream transmitter to downstream receiver. When the signal reach the downstream receiver, the time of flight from the upstream transmitter to the downstream receiver recorded in microcontroller. Immediately, the downstream transmitter emits the signal to the upstream receiver and once the upstream receiver receives the signal, the time of flight from downstream to upstream recorded in microcontroller. Then different between two time of flight calculated in microcontroller as programmed. The flow measurement from microcontroller will sent to the computer and computer will process and visualize in LabVIEW.
Fig. 2. The process flow of the system
IV. RESULT AND DISCUSSION
It covered the effect of flow before and after 90° pipe fitting and the ultrasonic sensor data based on time of flight concept. This part also included data from flow simulation done using SolidWorks.
A. Flow Simulation
Flow simulation done using SolidWorks software. In this experiment, the design of piping fixed in size, diameter 100 mm, as shown in Fig. 1. This flow simulation is to study the effect of the water flow in pipe before and after the 90° pipe fitting. In this simulation, three type of flow selected to study the effect of the flow before and after 90 pipe fitting such as (Laminar-Turbulent flow, Laminar flow, and Turbulent flow).
1) Laminar-Turbulent Flow Simulation
In this simulation, the water inlet velocity set to 10 ms-1.
This to make the easy way to detect any changes in velocity.
Fig. 3 show the overall flow simulation for the system.
Fig. 3. Laminar-Turbulent Flow Simulation
Fig. 4 shows the flow simulation at 90° pipe fitting. As
result, before the 90° pipe fitting, the flow in uniform flow of
yellow and green. Yellow show the flow rate around 11 ms-1
while green show the flow rate around 8 ms-1. After the 90°
pipe fitting, the flow slightly change and vary. The flow rate
seems slightly increase (the yellow more than green).
Fig. 4. Flow simulation at 90° pipe fitting
Fig. 5 shows the top view of the flow simulation at 90° pipe
fitting. As result, the flow rate slightly increase after 90° pipe
fitting around 11 ms-1. Besides, some orange spot shown in this
Sensor detect the water flow inside the pipe
The time of flight for upstream and
downstream recorded in microcontroller
Microcontroller run the algorithm to get the
measurement
Microcontroller send the measurement data
to CPU
CPU process and visualize in LabVIEW
Proceedings of 2017 Electrical Engineering Symposium (EES2017) - Vol. 1
46

figure. This means, the flow rate at the orange spot around 13
ms-1.
Fig. 5. Top view of flow simulation at 90° pipe fitting
2) Laminar Flow Simulation.
Fig. 6 shows the full simulation result for Laminar flow. For
this simulation, the velocity of the water inlet set to 10 ms-1.
Fig. 6. Flow simulation for Laminar Flow
As result in Fig. 7, there is slightly different flow pattern
before and after the 90° pipe fitting. Before the 90° pipe fitting,
the flow pattern seems to be organize with variation of flow
rate. At the below of pipe, the flow rate is about 13 ms-1. In the
middle pipe, the flow rate is about 10 ms-1 to 11 ms-1 while at
top of pipe, the flow rate is about 8 ms-1.
After the 90° pipe fitting, the flow pattern slightly seems to
rotate. Its means, the water inside the pipe is flowing in a
rotation pattern. In Fig. 8, the result shows that after the 90°
pipe fitting, there is red spot at outside the pipe. This means, the
velocity at the red spot is about 15 ms-1.
Fig. 7. Flow simulation at 90° pipe fitting
Headings, or heads, are organizational devices that guide
Fig. 8. Top view of flow simulation at 90° pipe fitting
3) Turbulent Flow Simulation
Fig. 9 shows the flow simulation at 90° pipe fitting. As the
result, the flow pattern flow smoothly with variation of flow
rate. At the bottom of pipe, the flow rate is higher than flow rate
at top of pipe with about 13 ms-1 and 9 ms-1 respectively. At the
middle of pipe, the flow rate is about 10 ms-1.
Besides, after 90° pipe fitting, the flow pattern keeps the
flow as the flow pattern before the 90° pipe fitting. But the flow
rate varies from the original flow rate.
Fig. 9. Flow simulation at 90° pipe fitting
Fig. 10 show the top view of flow simulation. As result, after
90° pipe fitting, the flow rate maximum at the outside of pipe
with 13 ms-1, while the other side of pipe is about 10 ms-1.
Fig. 10. Top view of flow simulation at 90° pipe fitting
Proceedings of 2017 Electrical Engineering Symposium (EES2017) - Vol. 1
47
V. CONCLUSION
The conclusion part made based on the overall result
obtained from the simulation or experiment. From the result of
simulation that has been presented in the previous chapter, it
can be seen that:
1. For the laminar-turbulent flow and turbulent flow,
the flow pattern of water particles seems not much
different compared to the laminar flow simulation.
2. For laminar flow simulation, there is unique
transformation of flow rate after the 90° pipe fitting.
3. The pressure before the 90° pipe fitting is higher
than the pressure after the 90° pipe fitting for the three
simulation.
4. For the laminar-turbulent flow and turbulent flow,
the pressure at 90° pipe fitting’s wall is at high
pressure. While the laminar flow has uniform pressure
at the 90° pipe fitting.
REFERENCES
[1] Yuto Inouea, H.K., Hideki Murakawa, Masanori Aritomi, Michitsugu Mori, "A study of ultrasonic propagation for ultrasonic flow rate measurement," 21 June 2007.
[2] Yong Chen, Y.H., Xiaoqian Chen, "Acoustic propagation in viscous fluid with uniform flow and a novel design methodology for ultrasonic flow meter," 22 October 2012.
[3] V.E. Sakharov, S.A.K., B.D. Zaitsev, I.E. Kuznetsova, S.G. Joshi, "Liquid level sensor using ultrasonic Lamb waves," 2003.
[4] Tao Huang, L.Q., "Chaos Theory Based Ultrasonic Doppler for Velocity Measurement of Fluid in the Petroleum Channel," Fifth International Conference on Natural Computation, 2009.
[5] Slavik Lubomir, R.J., Novak Miroslav, "Optimization of magnetic circuit in electromagnetic flow meter," 17th International Carpathian Control Conference, 2016.
[6] Santhosh KV, B.R., "An Intelligent Flow Measurement Technique using Ultrasonic Flow Meter with Optimized Neural Network," International Journal of Control and Automation 4 December 2012, 5(4).
[7] Sanehiro Wada, K.T., Noriyuki Furuichi, "Effect of low-frequency ultrasound on flow rate measurements using the ultrasonic velocity profile method," Journal of Nuclear Science and Technology, 10 May 2013.
[8] Noriyuki Furuichi, H.S., Yoshiya Terao, Masaki Takamoto, "A new calibration facility for water flowrate at high Reynolds number," 4 November 2008.:
Proceedings of 2017 Electrical Engineering Symposium (EES2017) - Vol. 1
48
Mobile Robot for Outdoor Monitoring
MOHAMAD FIRDAUS BIN MOHD NOR
Faculty of Electrical Engineering
Universiti Teknologi Malaysia
Johor Bahru, Malaysia.
Nasarudin Ahmad
Department of Control and Mechatronic Engineering
Faculty of Electrical Engineering
Universiti Teknologi Malaysia
Johor Bahru, Malaysia.
Abstract- The proposed automated unit is utilized for video
surveillance of remote place and also remotely control of the unit
utilizing Wi-Fi as medium. Raspberry pi fill the need of server and
also the microchip for the framework. An implanted web server
makes a simple route for observing and controlling any gadget which
is at remote place. Video is caught through the webcam set on the
automated unit and vivacious transmitted to the remote end. Controls
are given on the comfort page where one can see the live spilling and
additionally can control the development of mechanical unit. This
paper gives an approach towards video surveillance and control
utilizing propelled processor like raspberry pi. The proposed
framework can be utilized as a part of military applications just by
including couple of sensors like infrared sensors so as we can
distinguish the developments. In medicinal services applications the
proposed framework can be utilized just by changing the plan the
automated unit.
I. INTRODUCTION
An installed web server makes a simple path for observing and controlling any gadget which is at remote place. For planning the framework we require remote pc alongside the internet facility at the remote areas. On the off chance that we don't have web network still we can utilize the unit utilizing Wi-Fi. We actualize a framework which is versatile, minimal effort and having less upkeep. The detailing of this ongoing information relating to the procedure plants is along these lines be of extraordinary use for future investigation.
As the internet of things is the concept, newly introduced in the field of electronics. The concept is about handling the things with the use of internet and the best model for these applications is raspberry pi. When the surveillance is considered, raspberry pi serve his purpose as it is good at connectivity because it is ready embedded with Wi-Fi features.[5].
Robots are being utilized as a part of assortment of modern applications for different exercises like pick and place, painting, gathering of subsystems and in perilous spots for material taking care of and so on. Robots are ending up plainly more progressed as innovation addition in the regions of CPU speed, sensors, recollections and so forth. Also, there is perpetually requesting applications even in protection. With the quick development of the Internet, an ever increasing number of cutting edge gadgets or sensors have been implanted into it for playing out the coveted work, conveyed PC frameworks, reconnaissance cameras, telescopes and controllers. In spite of the fact that the usage of Internet mechanical autonomy or online apply autonomy is moderately new and still in its initial stage, it has accumulated the enormous enthusiasm of numerous scientists on the planet.
The proposed system consist of two units mainly a robotic unit and remotely control unit. The robotic unit is consisting of the webcam the heart of the project, raspberry pi along with the MDD10A containing motor driven IC and step-down dc-dc converter.
II. SYSTEM OVERVIEW
A. Manual mode
Here in this project, one can control the robot from remote end say mobile or laptop with the use of Wi-Fi as well as Internet and also we can get the live streaming of video from the robot for the purpose of surveillance, this video is obtained on web browser of the remote device from where we are operating the device also we are able to control the robotic movement. DC motors are being used for the movement of robotic wheels and servo motor is used for camera movement. Raspberry Pi B+ is used for video processing and sending the processed video to user PC with the help of Wi-Fi as well as internet.
The wheels of robot are controlled by DC motor and the development of camera by the servo motor. With the assistance of web program, one can without much of a stretch controls the automated unit and can screens video gushing of the encompassing condition of that robotic unit. At the robotic unit, Raspberry pi is utilized for the control of DC engines and servo motor. Raspberry Pi requires 5 volt supply with least of 1500-2000mA current. This raspberry pi is controlled through small scale USB link. 5 volt is required for the USB ports. It works at 700 MHz. We can utilize python to compose the code into the raspberry pi.
B. Autonomous mode
Secondly, Autonomous mobile robot for this application will use Neo-6M GPS module. Many considerations have been made for this application. The main factor for the consideration is the 4 channel GPS receiver designed to operate with L1 frequency and GPS receiver continuously tracks and uses the signal to compute and update position. Small sizes make it light and easy to handle and also can be use in rugged terrain because of water proofing. Due to minimum power requirement which is 3v it is suitable for autonomous mobile robot that needs longer power for localization and navigation. With proper calibration the accuracy will be ±2 with ±5 degrees extreme northern and southern latitudes and 1 degree resolution.
Along the navigation from the first waypoint to final waypoint sonar sensor will detect the obstacle within range.
Proceedings of 2017 Electrical Engineering Symposium (EES2017) - Vol. 1
49
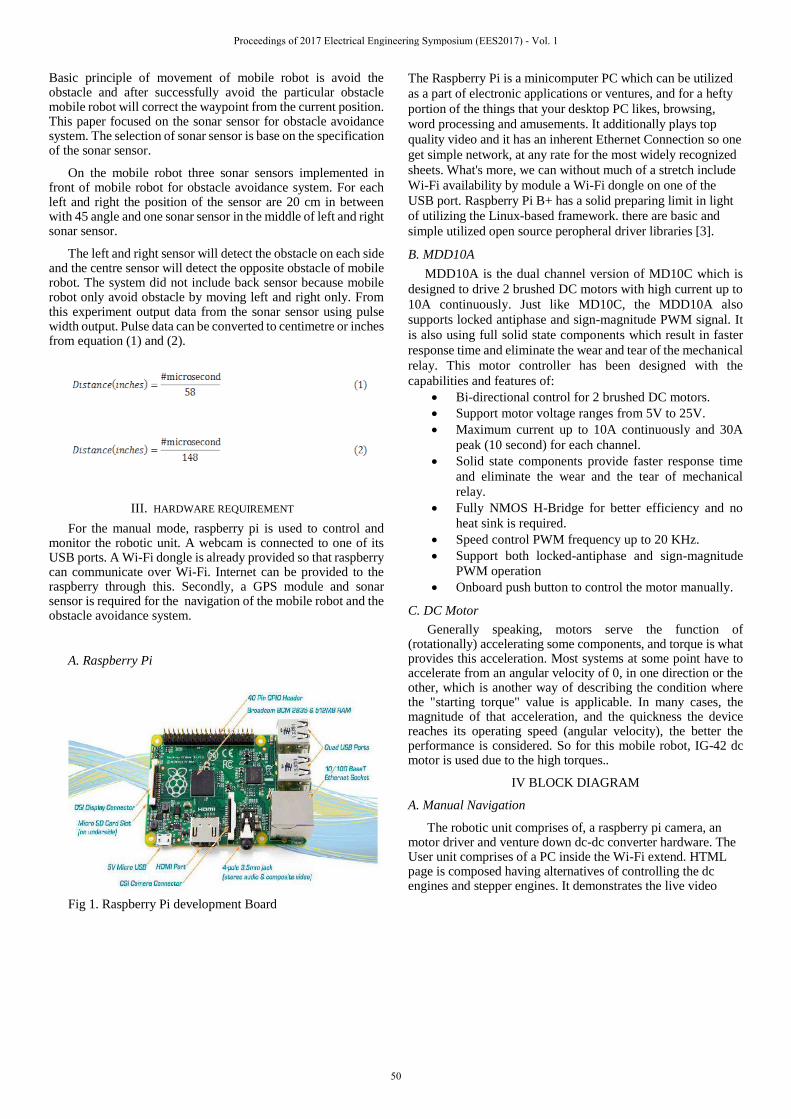
Basic principle of movement of mobile robot is avoid the obstacle and after successfully avoid the particular obstacle mobile robot will correct the waypoint from the current position. This paper focused on the sonar sensor for obstacle avoidance system. The selection of sonar sensor is base on the specification of the sonar sensor.
On the mobile robot three sonar sensors implemented in front of mobile robot for obstacle avoidance system. For each left and right the position of the sensor are 20 cm in between with 45 angle and one sonar sensor in the middle of left and right sonar sensor.
The left and right sensor will detect the obstacle on each side and the centre sensor will detect the opposite obstacle of mobile robot. The system did not include back sensor because mobile robot only avoid obstacle by moving left and right only. From this experiment output data from the sonar sensor using pulse width output. Pulse data can be converted to centimetre or inches from equation (1) and (2).
III. HARDWARE REQUIREMENT
For the manual mode, raspberry pi is used to control and monitor the robotic unit. A webcam is connected to one of its USB ports. A Wi-Fi dongle is already provided so that raspberry can communicate over Wi-Fi. Internet can be provided to the raspberry through this. Secondly, a GPS module and sonar sensor is required for the navigation of the mobile robot and the obstacle avoidance system.
A. Raspberry Pi
Fig 1. Raspberry Pi development Board
The Raspberry Pi is a minicomputer PC which can be utilized
as a part of electronic applications or ventures, and for a hefty
portion of the things that your desktop PC likes, browsing,
word processing and amusements. It additionally plays top
quality video and it has an inherent Ethernet Connection so one
get simple network, at any rate for the most widely recognized
sheets. What's more, we can without much of a stretch include
Wi-Fi availability by module a Wi-Fi dongle on one of the
USB port. Raspberry Pi B+ has a solid preparing limit in light
of utilizing the Linux-based framework. there are basic and
simple utilized open source peropheral driver libraries [3].
B. MDD10A
MDD10A is the dual channel version of MD10C which is
designed to drive 2 brushed DC motors with high current up to
10A continuously. Just like MD10C, the MDD10A also
supports locked antiphase and sign-magnitude PWM signal. It
is also using full solid state components which result in faster
response time and eliminate the wear and tear of the mechanical
relay. This motor controller has been designed with the
capabilities and features of:
Bi-directional control for 2 brushed DC motors.
Support motor voltage ranges from 5V to 25V.
Maximum current up to 10A continuously and 30A
peak (10 second) for each channel.
Solid state components provide faster response time
and eliminate the wear and the tear of mechanical
relay.
Fully NMOS H-Bridge for better efficiency and no
heat sink is required.
Speed control PWM frequency up to 20 KHz.
Support both locked-antiphase and sign-magnitude
PWM operation
Onboard push button to control the motor manually.
C. DC Motor
Generally speaking, motors serve the function of (rotationally) accelerating some components, and torque is what provides this acceleration. Most systems at some point have to accelerate from an angular velocity of 0, in one direction or the other, which is another way of describing the condition where the "starting torque" value is applicable. In many cases, the magnitude of that acceleration, and the quickness the device reaches its operating speed (angular velocity), the better the performance is considered. So for this mobile robot, IG-42 dc motor is used due to the high torques..
IV BLOCK DIAGRAM
A. Manual Navigation
The robotic unit comprises of, a raspberry pi camera, an motor driver and venture down dc-dc converter hardware. The User unit comprises of a PC inside the Wi-Fi extend. HTML page is composed having alternatives of controlling the dc engines and stepper engines. It demonstrates the live video
Proceedings of 2017 Electrical Engineering Symposium (EES2017) - Vol. 1
50
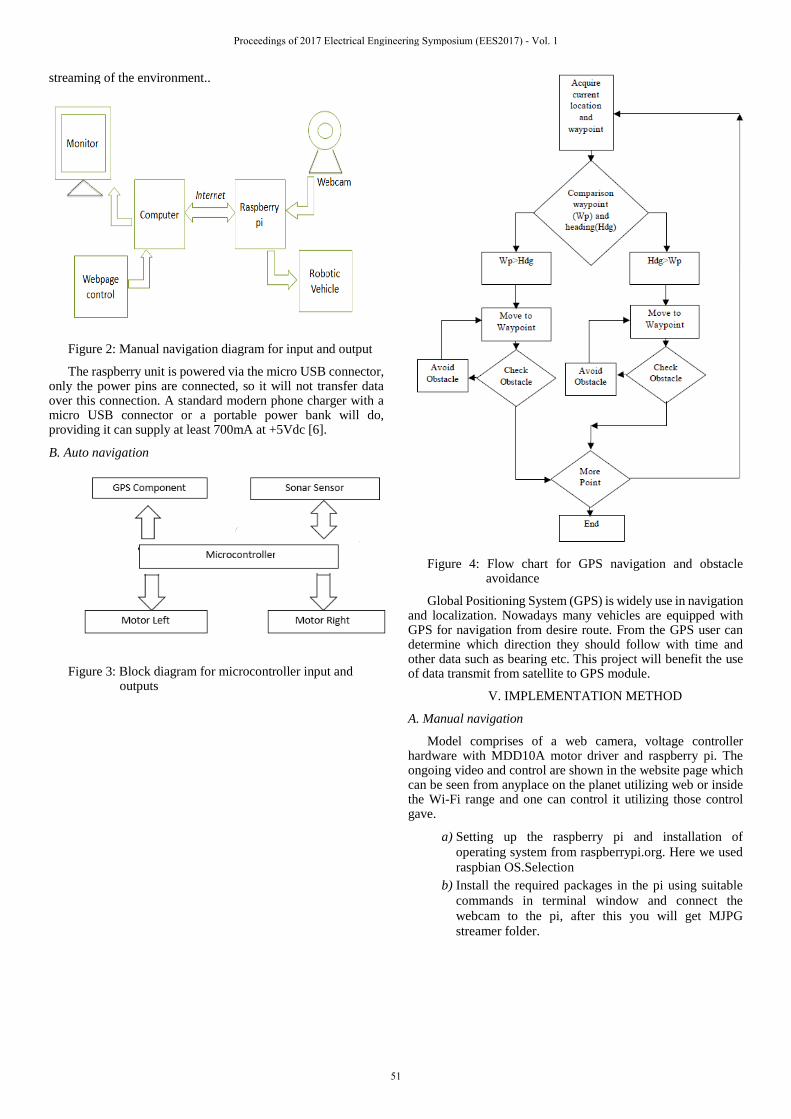
streaming of the environment..
Figure 2: Manual navigation diagram for input and output
The raspberry unit is powered via the micro USB connector, only the power pins are connected, so it will not transfer data over this connection. A standard modern phone charger with a micro USB connector or a portable power bank will do, providing it can supply at least 700mA at +5Vdc [6].
B. Auto navigation
Figure 3: Block diagram for microcontroller input and outputs
Figure 4: Flow chart for GPS navigation and obstacle avoidance
Global Positioning System (GPS) is widely use in navigation and localization. Nowadays many vehicles are equipped with GPS for navigation from desire route. From the GPS user can determine which direction they should follow with time and other data such as bearing etc. This project will benefit the use of data transmit from satellite to GPS module.
V. IMPLEMENTATION METHOD
A. Manual navigation
Model comprises of a web camera, voltage controller hardware with MDD10A motor driver and raspberry pi. The ongoing video and control are shown in the website page which can be seen from anyplace on the planet utilizing web or inside the Wi-Fi range and one can control it utilizing those control gave.
a) Setting up the raspberry pi and installation of
operating system from raspberrypi.org. Here we used
raspbian OS.Selection
b) Install the required packages in the pi using suitable
commands in terminal window and connect the
webcam to the pi, after this you will get MJPG
streamer folder.
Proceedings of 2017 Electrical Engineering Symposium (EES2017) - Vol. 1
51

c) Now design the control page that provides a way to
control our robot this page is designed with HTML
and PHP and write the controlling of the robot code
based on the MDD10A we have used.
d) To setup wifi configuration,we can use ifconfig
command. Once we got the IP address we can use it
for controlling purpose.
e) Now build the robotic unit, we can use DC motor
based simple robot. To control the motor, we need
the MDD10A for controlling teo motors.
f) Connection of power supply. Here we used 12v
rechargeable battery for driving the motor.
g) Pi gets turn on as soon as you connect 5v supply; you
can see green LED blinking while start-up process.
After some time open browser in the Laptop or
mobile and write down following link:
IPaddress/filename
B. Auto navigation
The setting is only different on the implementation of the sonar sensor and the GPS module.
VI EXPECTED RESULT
a) Manual navigation
Utilizing this automated framework a remote region can be checked effortlessly from remote end. One can without much of a stretch screen and also control the action of the mechanical unit. This framework can be utilized any conditions and territories where it is troublesome for the security powers to achieve it can screen the zones. As the correspondence is finished with the assistance of web so restriction of scope of operation does not emerge and along these lines we can screen any remote regions. In the event that this robot is inside the Wi-Fi go there is no need of web as well. We control the robot utilizing the Wi-Fi as a medium.
b) Auto navigation
The mobile robot can move as indicated by preset waypoint with hindrance evasion executed in the framework. The precision of the route profoundly rely on upon the flag from satellite with change from 4 to 12 enter satellites. The exactness of hitting the stamp can float from 10 feet to 20 feet. In the event that the waypoints are preset starting with one point then onto the next between 12 feet and the precision is 20 feet the waypoint 1 and 2 will be perceive as one point. To make framework more compelling because of the less exactness of the framework the
preset waypoint should be a long way from every more than 20 feet.
The obstacle avoidance can detect rock and small tree on it path. The main issue of the obstacle avoidance system are the detection of the grass as an obstacle can make the system unreliable. The position of the sonar sensor needs to move higher than the grass.
VII CONCLUSION
We can utilize this framework for military applications introducing appropriate sensors. Just by changing the automated unit plan we can utilize it in doctor's facilities for patient checking. Utilizing some substance sensors we can recognize destructive gas spillage in the chamber the time postpone which happens in the execution of orders can be diminished and in this manner we can have all the more ongoing access to the robot. With lessened time postpone we can have speedier operation and fast reaction to any unlawful exercises in the observed zone. Additionally it can be utilized as a spy robot. The robot is exceptionally practical.
REFERENCES
[1] [1] Wi-Fi Robot for Video Monitoring &Surveillance System By Pavan C & Dr. B.Sivakumar, International Journal of Scientific & Engineering Research Volume 3, Issue 8, August- 2012 J. Clerk Maxwell, A Treatise on Electricity and Magnetism, 3rd ed., vol. 2. Oxford: Clarendon, 1892, pp.68-73.
[2] robot using Zigbee Communication By Krishnaswamy Kannan and Gowtham S, International Journal of Engineering Science and Technology (IJEST), ISSN : 0975-5462 Vol. 4 No.10 October 2012. K. Elissa, “Title of paper if known,” unpublished.
[3] Secured Spy IP Control Robot Using Raspberry Pi By V. Meenakshi, Ch. Lakshmi Saketh, K. KalyanKumar, International Journal of Emerging Technology and Advanced Engineering, Volume 5, Issue 2, February 2015.
[4] Y. Yorozu, M. Hirano, K. Oka, and Y. Tagawa, “Electron spectroscopy studies on magneto-optical media and plastic substrate interface,” IEEE Transl. J. Magn. Japan, vol. 2, pp. 740-741, August 1987 [Digests 9th Annual Conf. Magnetics Japan, p. 301, 1982].
[5] Wi-Fi Robot for Video Monitoring & Surveillance System by Pavan C & Dr. B. Sivakumar, International Journal of Scientific & Engineering Research Volume 3, Issue 8, August- 2012
[6] Md Athiq UR Raza Ahamed M., Wajid Ahamed, A Domestic Robot for Security Systems by Video Surveillance Using Zigbee Technology, International Journal of Scientific Engineering and Technology (ISSN : 2277-1581) Volume 2 Issue 5, pp : 448-453 1 May 2013.
[7] P. Saucy and F. Mondana, KhepOnTheWeb: Open access to a mobile robot on the Internet, IEEE
Proceedings of 2017 Electrical Engineering Symposium (EES2017) - Vol. 1
52

Energy Harvesting from Rooftop Ventilator
Nurul Nadiah Binti Zulkifli
Faculty of Electrical Engineering
Universiti Teknologi Malaysia
Johor Bahru, Malaysia.
Dr. Leow Pei Ling
Faculty of Electrical Engineering
Universiti Teknologi Malaysia
Johor Bahru, Malaysia.
Abstract—Malaysian energy sector is still highly dependent
on non-renewable source of energy such as fossil fuel and
natural gas. In the long term, the burning fossil fuel and
natural gas will deplete and become more expensive. To
overcome this problem, the researchers have been widely
interested in Renewable Energy field which is more abundant
and environmental friendly. Development of the renewable
energy using wind can be used to replace fossil energy and
natural gas. This study is focusing on the modification of the
rooftop ventilator system equipped with a small DC motor to
generate electricity by applying the concept of Vertical Axis
Wind Turbine. A small DC motor is installed in 16-inch
rooftop ventilator. 1:2 gear ratios is installed to the turbine
shaft to allow the rotation of rotor inside the DC generator
while the ventilator is spinning. The results are showed that the
DC generator would begin to generate voltage of 4.63 volt at
fan speed of 1 which is the lowest fan speed and produce
21.44mW power which is sufficient to supply small DC loads
such as LED light.
Keywords—rooftop ventilator, dc generator, vertical axis
wind turbine
I. INTRODUCTION
Broiler industry has been giving great impact to the country. The common risk and challenges for Malaysian broiler farmers are the high indoor temperature inside the broiler house can lead to heat stroke of broilers and cause loses to the farmers. Generally, exhaust fans are installed to ensure good ventilation and keep the indoor temperature low. However, not many farmers afford to install fans as there will be additional cost for the energy consumption. To overcome this problem, the researchers have been widely interested in Renewable Energy field to ensure the energy security and global environment. Renewable energy from the roof top ventilator helps to provide clean electricity and at the same time provides a sustainable energy solution for the broiler house. Therefore, it can be used to replace fossil energy such as oil and coal, that causing the environmental pollution.
II. LITERATURE REVIEW
The concept of natural ventilation by using non-electrical energy is lead to be the roof top ventilator [1]. Roof top ventilator is common for factories and even residential houses to keep the temperature indoor low by encouraging ventilation within the house. There are several advantages using roof top ventilators which include that they do not need electrical supply to work. Roof top
ventilator is cost saving because there is no operating cost and no maintenance needed [2]. Fig. 1 shows how the working principle of the rooftop ventilator in controlling the temperature inside a building.
Fig.1. How the rooftop ventilator control the temperature inside a building
Roof ventilator consists of stationary part that composed of base and fixed shaft and rotational part that composed of blades and disc bearing that connect the fixed shaft on stationary part [3]. Fig. 2 shows the construction of rooftop ventilator.
Fig.2. Construction of rooftop ventilator
By using the concept of wind energy, from past to present there are a lot of study on the probability to adapt the wind energy to generate electricity. One of the applications is by using vertical wind turbine to generate energy by converting the kinetic energy from the rotating windmill into mechanical energy that will move the rotor to generate energy [4].
The wind turbines produce electricity by converting the kinetic energy in wind into mechanical power and the
Proceedings of 2017 Electrical Engineering Symposium (EES2017) - Vol. 1
53
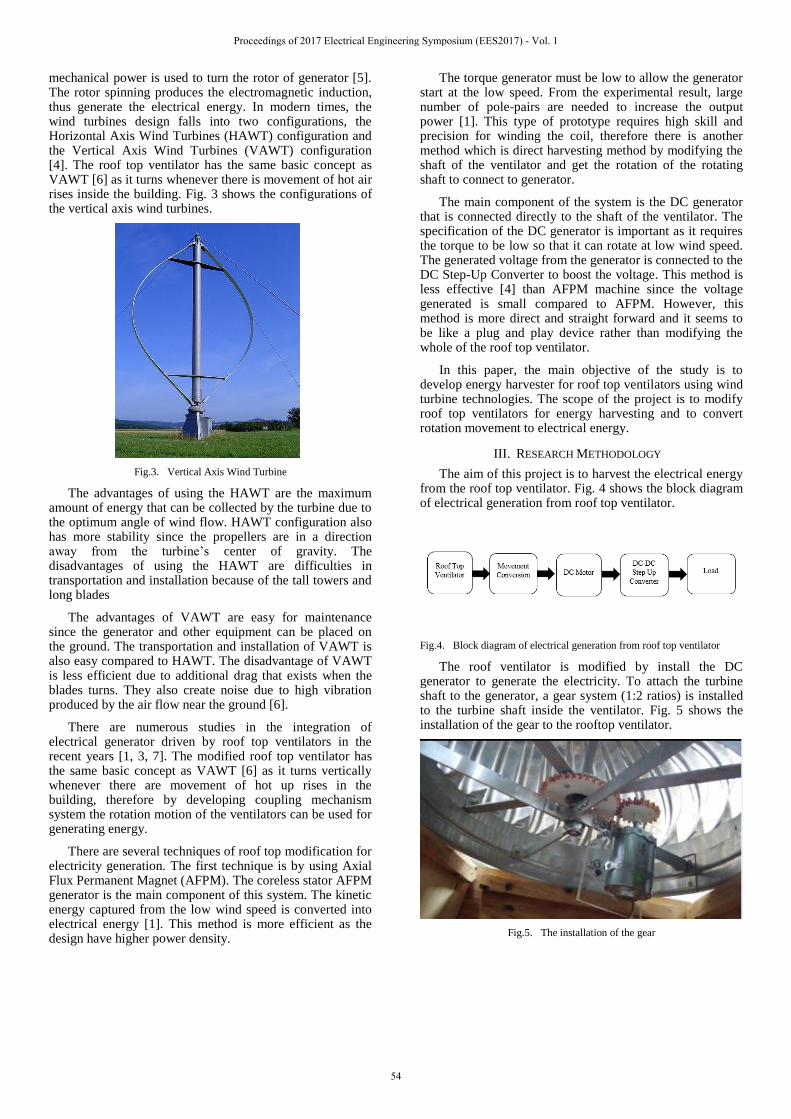
mechanical power is used to turn the rotor of generator [5]. The rotor spinning produces the electromagnetic induction, thus generate the electrical energy. In modern times, the wind turbines design falls into two configurations, the Horizontal Axis Wind Turbines (HAWT) configuration and the Vertical Axis Wind Turbines (VAWT) configuration [4]. The roof top ventilator has the same basic concept as VAWT [6] as it turns whenever there is movement of hot air rises inside the building. Fig. 3 shows the configurations of the vertical axis wind turbines.
Fig.3. Vertical Axis Wind Turbine
The advantages of using the HAWT are the maximum amount of energy that can be collected by the turbine due to the optimum angle of wind flow. HAWT configuration also has more stability since the propellers are in a direction away from the turbine’s center of gravity. The disadvantages of using the HAWT are difficulties in transportation and installation because of the tall towers and long blades
The advantages of VAWT are easy for maintenance since the generator and other equipment can be placed on the ground. The transportation and installation of VAWT is also easy compared to HAWT. The disadvantage of VAWT is less efficient due to additional drag that exists when the blades turns. They also create noise due to high vibration produced by the air flow near the ground [6].
There are numerous studies in the integration of electrical generator driven by roof top ventilators in the recent years [1, 3, 7]. The modified roof top ventilator has the same basic concept as VAWT [6] as it turns vertically whenever there are movement of hot up rises in the building, therefore by developing coupling mechanism system the rotation motion of the ventilators can be used for generating energy.
There are several techniques of roof top modification for electricity generation. The first technique is by using Axial Flux Permanent Magnet (AFPM). The coreless stator AFPM generator is the main component of this system. The kinetic energy captured from the low wind speed is converted into electrical energy [1]. This method is more efficient as the design have higher power density.
The torque generator must be low to allow the generator start at the low speed. From the experimental result, large number of pole-pairs are needed to increase the output power [1]. This type of prototype requires high skill and precision for winding the coil, therefore there is another method which is direct harvesting method by modifying the shaft of the ventilator and get the rotation of the rotating shaft to connect to generator.
The main component of the system is the DC generator that is connected directly to the shaft of the ventilator. The specification of the DC generator is important as it requires the torque to be low so that it can rotate at low wind speed. The generated voltage from the generator is connected to the DC Step-Up Converter to boost the voltage. This method is less effective [4] than AFPM machine since the voltage generated is small compared to AFPM. However, this method is more direct and straight forward and it seems to be like a plug and play device rather than modifying the whole of the roof top ventilator.
In this paper, the main objective of the study is to develop energy harvester for roof top ventilators using wind turbine technologies. The scope of the project is to modify roof top ventilators for energy harvesting and to convert rotation movement to electrical energy.
III. RESEARCH METHODOLOGY
The aim of this project is to harvest the electrical energy from the roof top ventilator. Fig. 4 shows the block diagram of electrical generation from roof top ventilator.
Fig.4. Block diagram of electrical generation from roof top ventilator
The roof ventilator is modified by install the DC generator to generate the electricity. To attach the turbine shaft to the generator, a gear system (1:2 ratios) is installed to the turbine shaft inside the ventilator. Fig. 5 shows the installation of the gear to the rooftop ventilator.
Fig.5. The installation of the gear
Proceedings of 2017 Electrical Engineering Symposium (EES2017) - Vol. 1
54
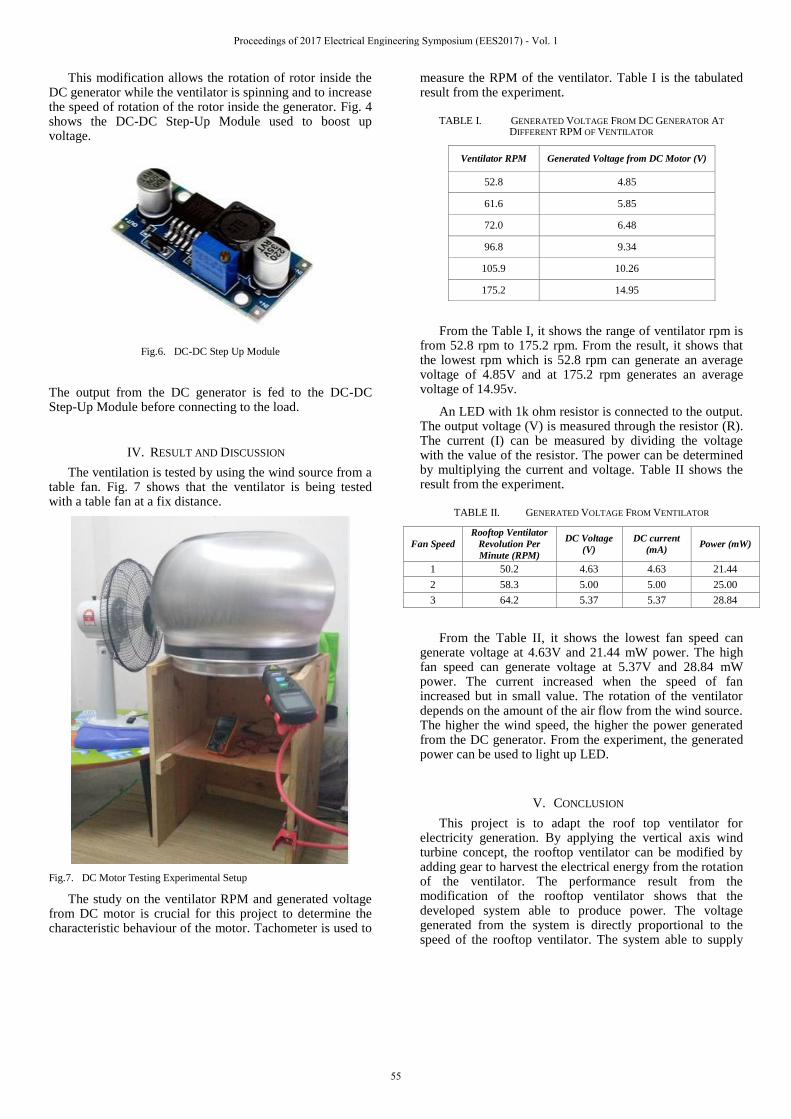
This modification allows the rotation of rotor inside the DC generator while the ventilator is spinning and to increase the speed of rotation of the rotor inside the generator. Fig. 4 shows the DC-DC Step-Up Module used to boost up voltage.
Fig.6. DC-DC Step Up Module
The output from the DC generator is fed to the DC-DC Step-Up Module before connecting to the load.
IV. RESULT AND DISCUSSION
The ventilation is tested by using the wind source from a table fan. Fig. 7 shows that the ventilator is being tested with a table fan at a fix distance.
Fig.7. DC Motor Testing Experimental Setup
The study on the ventilator RPM and generated voltage from DC motor is crucial for this project to determine the characteristic behaviour of the motor. Tachometer is used to
measure the RPM of the ventilator. Table I is the tabulated result from the experiment.
TABLE I. GENERATED VOLTAGE FROM DC GENERATOR AT
DIFFERENT RPM OF VENTILATOR
Ventilator RPM Generated Voltage from DC Motor (V)
52.8 4.85
61.6 5.85
72.0 6.48
96.8 9.34
105.9 10.26
175.2 14.95
From the Table I, it shows the range of ventilator rpm is from 52.8 rpm to 175.2 rpm. From the result, it shows that the lowest rpm which is 52.8 rpm can generate an average voltage of 4.85V and at 175.2 rpm generates an average voltage of 14.95v.
An LED with 1k ohm resistor is connected to the output. The output voltage (V) is measured through the resistor (R). The current (I) can be measured by dividing the voltage with the value of the resistor. The power can be determined by multiplying the current and voltage. Table II shows the result from the experiment.
TABLE II. GENERATED VOLTAGE FROM VENTILATOR
Fan Speed
Rooftop Ventilator
Revolution Per
Minute (RPM)
DC Voltage
(V)
DC current
(mA) Power (mW)
1 50.2 4.63 4.63 21.44
2 58.3 5.00 5.00 25.00
3 64.2 5.37 5.37 28.84
From the Table II, it shows the lowest fan speed can generate voltage at 4.63V and 21.44 mW power. The high fan speed can generate voltage at 5.37V and 28.84 mW power. The current increased when the speed of fan increased but in small value. The rotation of the ventilator depends on the amount of the air flow from the wind source. The higher the wind speed, the higher the power generated from the DC generator. From the experiment, the generated power can be used to light up LED.
V. CONCLUSION
This project is to adapt the roof top ventilator for electricity generation. By applying the vertical axis wind turbine concept, the rooftop ventilator can be modified by adding gear to harvest the electrical energy from the rotation of the ventilator. The performance result from the modification of the rooftop ventilator shows that the developed system able to produce power. The voltage generated from the system is directly proportional to the speed of the rooftop ventilator. The system able to supply
Proceedings of 2017 Electrical Engineering Symposium (EES2017) - Vol. 1
55
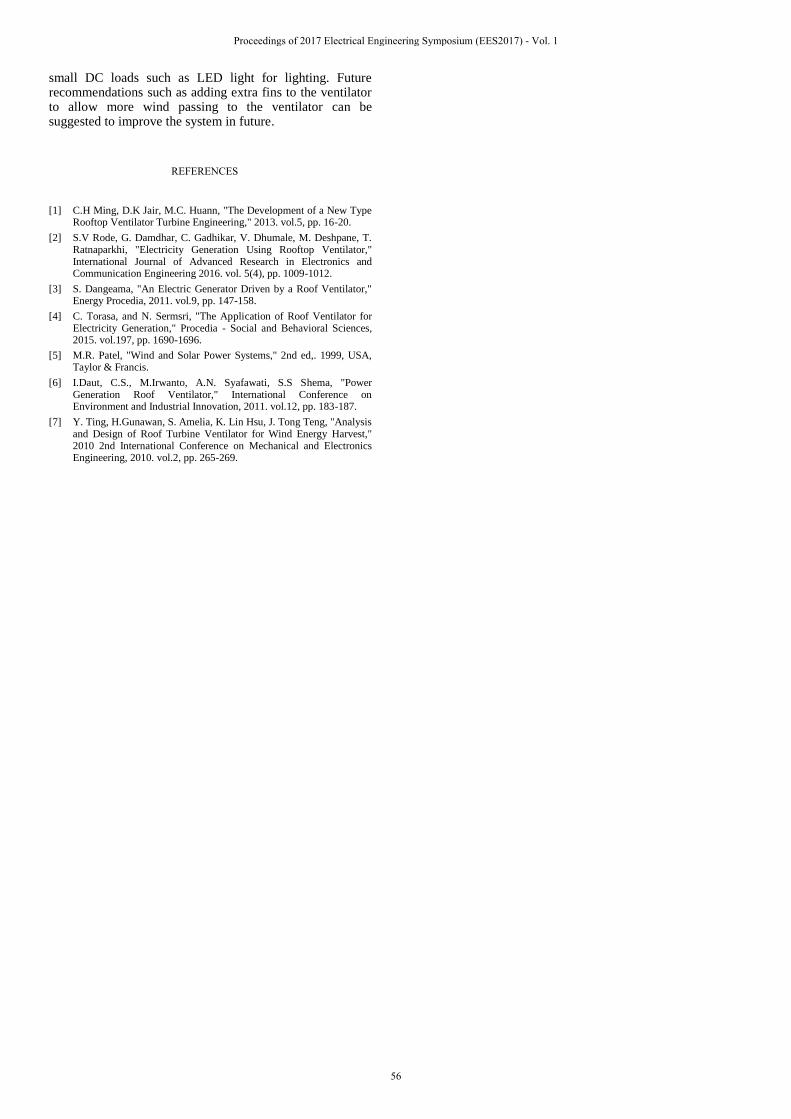
small DC loads such as LED light for lighting. Future recommendations such as adding extra fins to the ventilator to allow more wind passing to the ventilator can be suggested to improve the system in future.
REFERENCES
[1] C.H Ming, D.K Jair, M.C. Huann, "The Development of a New Type Rooftop Ventilator Turbine Engineering," 2013. vol.5, pp. 16-20.
[2] S.V Rode, G. Damdhar, C. Gadhikar, V. Dhumale, M. Deshpane, T. Ratnaparkhi, "Electricity Generation Using Rooftop Ventilator," International Journal of Advanced Research in Electronics and Communication Engineering 2016. vol. 5(4), pp. 1009-1012.
[3] S. Dangeama, "An Electric Generator Driven by a Roof Ventilator," Energy Procedia, 2011. vol.9, pp. 147-158.
[4] C. Torasa, and N. Sermsri, "The Application of Roof Ventilator for Electricity Generation," Procedia - Social and Behavioral Sciences, 2015. vol.197, pp. 1690-1696.
[5] M.R. Patel, "Wind and Solar Power Systems," 2nd ed,. 1999, USA, Taylor & Francis.
[6] I.Daut, C.S., M.Irwanto, A.N. Syafawati, S.S Shema, "Power Generation Roof Ventilator," International Conference on Environment and Industrial Innovation, 2011. vol.12, pp. 183-187.
[7] Y. Ting, H.Gunawan, S. Amelia, K. Lin Hsu, J. Tong Teng, "Analysis and Design of Roof Turbine Ventilator for Wind Energy Harvest," 2010 2nd International Conference on Mechanical and Electronics Engineering, 2010. vol.2, pp. 265-269.
Proceedings of 2017 Electrical Engineering Symposium (EES2017) - Vol. 1
56
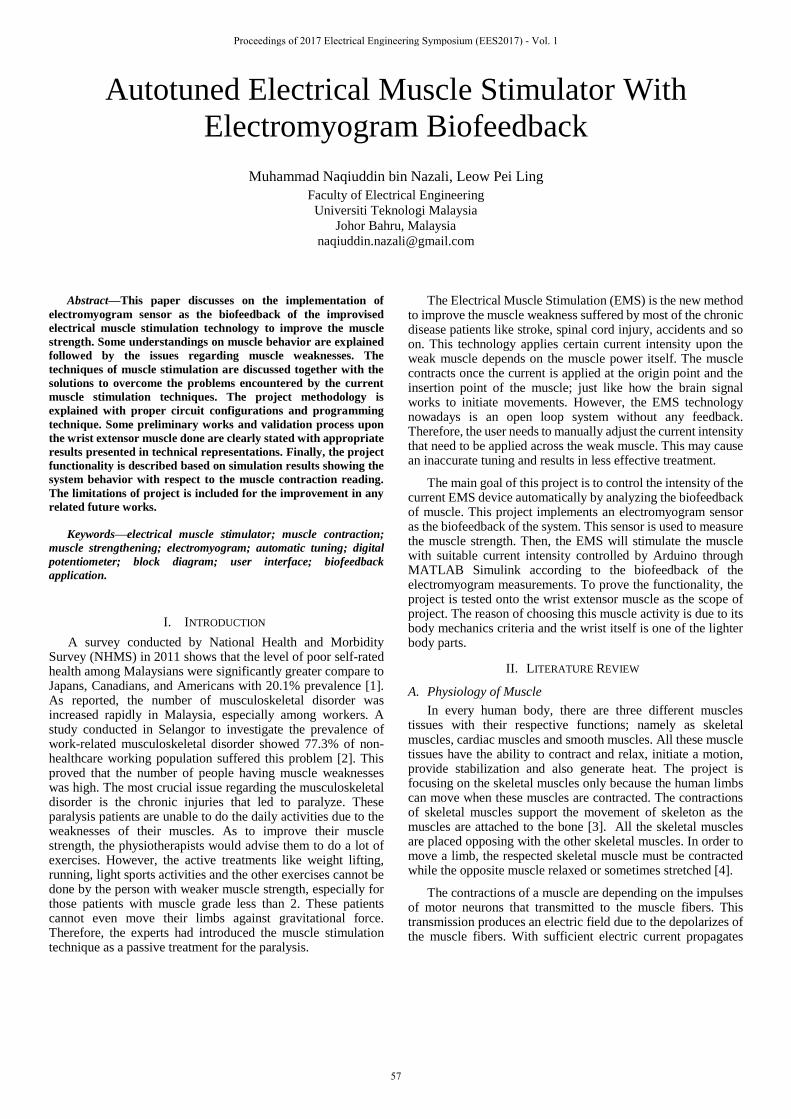
Autotuned Electrical Muscle Stimulator With
Electromyogram Biofeedback
Muhammad Naqiuddin bin Nazali, Leow Pei Ling
Faculty of Electrical Engineering
Universiti Teknologi Malaysia
Johor Bahru, Malaysia
Abstract—This paper discusses on the implementation of
electromyogram sensor as the biofeedback of the improvised
electrical muscle stimulation technology to improve the muscle
strength. Some understandings on muscle behavior are explained
followed by the issues regarding muscle weaknesses. The
techniques of muscle stimulation are discussed together with the
solutions to overcome the problems encountered by the current
muscle stimulation techniques. The project methodology is
explained with proper circuit configurations and programming
technique. Some preliminary works and validation process upon
the wrist extensor muscle done are clearly stated with appropriate
results presented in technical representations. Finally, the project
functionality is described based on simulation results showing the
system behavior with respect to the muscle contraction reading.
The limitations of project is included for the improvement in any
related future works.
Keywords—electrical muscle stimulator; muscle contraction;
muscle strengthening; electromyogram; automatic tuning; digital
potentiometer; block diagram; user interface; biofeedback
application.
I. INTRODUCTION
A survey conducted by National Health and Morbidity Survey (NHMS) in 2011 shows that the level of poor self-rated health among Malaysians were significantly greater compare to Japans, Canadians, and Americans with 20.1% prevalence [1]. As reported, the number of musculoskeletal disorder was increased rapidly in Malaysia, especially among workers. A study conducted in Selangor to investigate the prevalence of work-related musculoskeletal disorder showed 77.3% of non-healthcare working population suffered this problem [2]. This proved that the number of people having muscle weaknesses was high. The most crucial issue regarding the musculoskeletal disorder is the chronic injuries that led to paralyze. These paralysis patients are unable to do the daily activities due to the weaknesses of their muscles. As to improve their muscle strength, the physiotherapists would advise them to do a lot of exercises. However, the active treatments like weight lifting, running, light sports activities and the other exercises cannot be done by the person with weaker muscle strength, especially for those patients with muscle grade less than 2. These patients cannot even move their limbs against gravitational force. Therefore, the experts had introduced the muscle stimulation technique as a passive treatment for the paralysis.
The Electrical Muscle Stimulation (EMS) is the new method to improve the muscle weakness suffered by most of the chronic disease patients like stroke, spinal cord injury, accidents and so on. This technology applies certain current intensity upon the weak muscle depends on the muscle power itself. The muscle contracts once the current is applied at the origin point and the insertion point of the muscle; just like how the brain signal works to initiate movements. However, the EMS technology nowadays is an open loop system without any feedback. Therefore, the user needs to manually adjust the current intensity that need to be applied across the weak muscle. This may cause an inaccurate tuning and results in less effective treatment.
The main goal of this project is to control the intensity of the current EMS device automatically by analyzing the biofeedback of muscle. This project implements an electromyogram sensor as the biofeedback of the system. This sensor is used to measure the muscle strength. Then, the EMS will stimulate the muscle with suitable current intensity controlled by Arduino through MATLAB Simulink according to the biofeedback of the electromyogram measurements. To prove the functionality, the project is tested onto the wrist extensor muscle as the scope of project. The reason of choosing this muscle activity is due to its body mechanics criteria and the wrist itself is one of the lighter body parts.
II. LITERATURE REVIEW
A. Physiology of Muscle
In every human body, there are three different muscles tissues with their respective functions; namely as skeletal muscles, cardiac muscles and smooth muscles. All these muscle tissues have the ability to contract and relax, initiate a motion, provide stabilization and also generate heat. The project is focusing on the skeletal muscles only because the human limbs can move when these muscles are contracted. The contractions of skeletal muscles support the movement of skeleton as the muscles are attached to the bone [3]. All the skeletal muscles are placed opposing with the other skeletal muscles. In order to move a limb, the respected skeletal muscle must be contracted while the opposite muscle relaxed or sometimes stretched [4].
The contractions of a muscle are depending on the impulses of motor neurons that transmitted to the muscle fibers. This transmission produces an electric field due to the depolarizes of the muscle fibers. With sufficient electric current propagates
Proceedings of 2017 Electrical Engineering Symposium (EES2017) - Vol. 1
57

across the muscles, it is then able to contract to initiate the movements [3]. The muscle strength can be improved by alternately contract and retract the muscle during the active exercises. Nevertheless, the sustained activities of muscles can cause fatigue once it reaches the limits. Muscle fatigue are known as the gradual decreases in muscle force due to the repeated contractions. The definition of muscle fatigue has been focused as an exercise-induced reduction in the production of muscle force during the sustained activities [5, 6]. The muscle fatigue must be avoided in any muscle treatment, otherwise, the task cannot be done due to the decreases of force. It will take some times for the muscle to develop back gradually. With this condition, the muscle fatigue is justified as not the reason of any task failure [7]. Instead, the muscle getting weaker due to the other reasons.
In Malaysia, most reported cases involving musculoskeletal disorder are related with work activities in an awkward posture [8]. This are resulted in the weakening of the muscle among these populations. Without appropriate exercises, the muscles are getting much weaker. The worst cases may lead to paralyze. Clinically, the muscle can be strengthening by appropriate stimulation technique. One has proved that the electrical stimulation can improve the muscle strength, increase the motion range, reduce pain and heal the muscle tissue. [9] One of the modern stimulation technique is by applying the electrical current across the muscle. This technique is known as the Electrical Muscle Stimulation.
B. Electrical Muscle Stimulation
The primary study of electrical stimulations has done by Michael Faraday in 1831 after he observed the active movement once the current is applied across a nerve [10]. The electrical stimulation earlier application was to relieve muscle pain [11], but it has now been commonly used to treat the weak muscle became stronger [12]. The concept is by applying a transcutaneous electrical current across the muscle to produce the muscle contractions [13]. The repetitions in muscle contractions helped to strengthening the muscle as a passive treatment.
However, the disadvantages of EMS have shown that it may lead to muscle fatigue when overstimulated because the delivery of the treatment are not well-customized [9]. Barbara M. Doucet, A.L., and Lisa Griffinb (2012) had discussed the important parameters that must be considered during the stimulation. The most important parameter is the current intensity and the pulses frequency of the EMS device. The higher intensity are essential to improve the muscle strength [14]. Meanwhile the pulses frequency are said to be at constant lower level so that the muscle contracted smoothly at low force [15], Unfortunately, there are no parameters that indicates whether the muscle are getting fatigue or not when applying the current intensity and the pulse frequency across the muscle. Therefore, the system needs a suitable sensor to monitor the muscle capability.
C. Biofeedback Instruments
Sinkjaer, T., et al. (2003) had proposed the implementations of electromyogram (EMG) sensor, electroneurogram (ENG) sensor and electroencephalogram (EEG) sensor in the
development of EMS technology [16]. The EMG sensor is used to obtain the biopotential reading of the skeletal muscle. Meanwhile, the ENG sensor and EEG sensor are used to record the nerve signal and brain signal respectively [17]. There are also several instruments that can measure the electric potentials and magnetic fields through the surface of human body including electrooculogram, electroretinogram, electrocochleogram, electrocardiogram and so on. All these instruments are measuring the electric fields produced from the depolarization of muscle membranes and also the conduction of nerve impulses that can be obtained through body skin [18]. In this project, only the EMG sensor are used since the projects dealt with skeletal muscle behavior only.
Electromyography is a study on the measurement of skeletal muscle biopotentials. It measures the electric potential on the skin through the electrode. Every skeletal muscles are contracted under the voluntary control once instigated by the neurons impulse. These motor neurons are producing the electrical potentials known as motor unit action potentials (MUAPs) [4]. As the muscle tissue conduct these MUAPs, the electrical potential can be obtained by placing the electrode onto the respective muscle tissue. In short, the electromyography measures the presence MUAPs in the superficial muscle tissue that can be easily obtained on the body surfaces.
The EMG readings are having a lot of noises because the electrode is contacted on a single motor unit with many muscle fibers. Therefore, the EMG will measures a combination of MUAPs when muscle is contracted [19]. Since the raw EMG signal are disturbed with a lot of noises, a proper signal conditioning technique is implement in the development of EMG sensor. The earlier research has introduced the technique to obtain the enveloped EMG signal for better measurement with the implementation of the rectifier, the amplifications and the filters [20, 21]. This project implements a smart EMG sensor as the biofeedback sensor with integrated signal conditioning circuits and Arduino compatible instead of building the new EMG sensor.
III. METHODOLOGY
The project is made to control the current intensity of the EMS device automatically by sensing the muscle strength. The Arduino UNO R3 is used as the microcontroller of the system programmed using MATLAB Simulink. This tools also used to be the user interface with the dashboards libraries. Therefore, the user can observe the treatment behavior through this application.
A. Project Design
In order to ensure the reliability of the system, the current EMS device, BioMed 2000 XL, was hacked instead of developing the new device. Basically, the current EMS devices are using potentiometer to tune the current intensity. In this project, the potentiometer is replaced by the digital potentiometer, MCP4161 from Microchip Technology Inc. the microcontroller are programmed to control this digital potentiometer through Serial Peripheral Interface(SPI) communication to achieve desired current intensity of EMS.
The controlled current intensity of the EMS device depends on the muscle strength. Therefore, the electromyogram sensor, MyoWare, is implemented as the input of the system. This
Proceedings of 2017 Electrical Engineering Symposium (EES2017) - Vol. 1
58
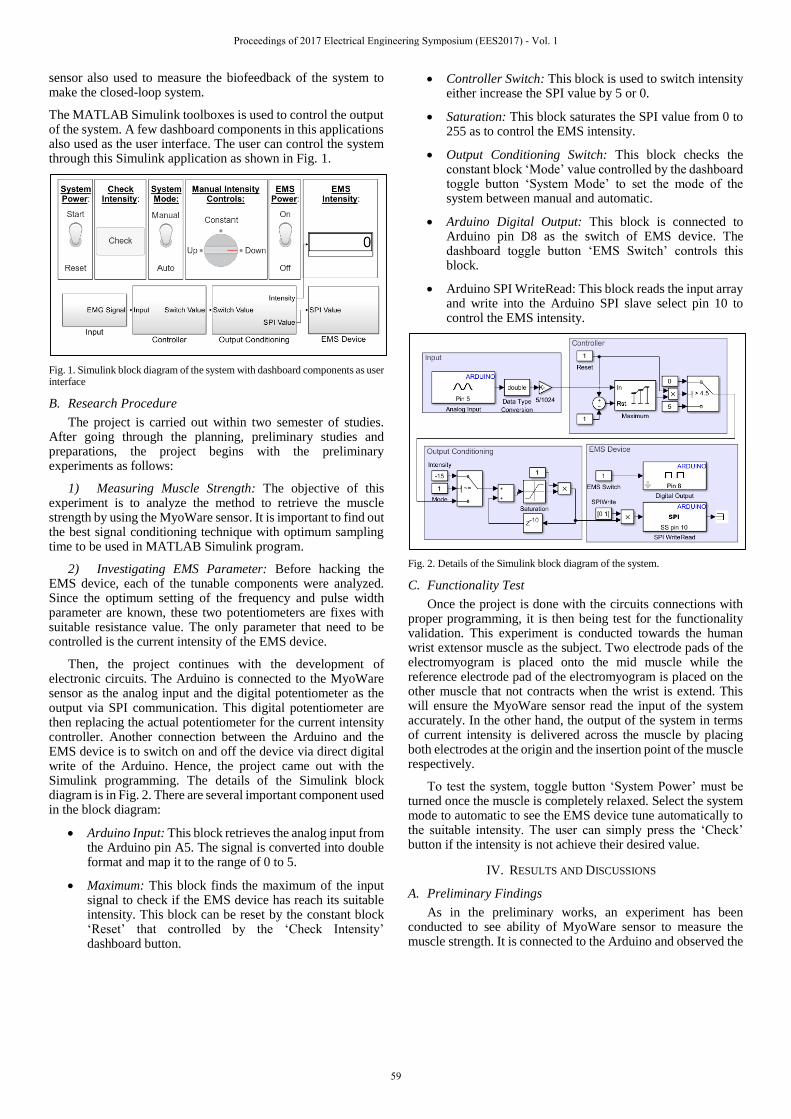
sensor also used to measure the biofeedback of the system to make the closed-loop system.
The MATLAB Simulink toolboxes is used to control the output of the system. A few dashboard components in this applications also used as the user interface. The user can control the system through this Simulink application as shown in Fig. 1.
Fig. 1. Simulink block diagram of the system with dashboard components as user interface
B. Research Procedure
The project is carried out within two semester of studies. After going through the planning, preliminary studies and preparations, the project begins with the preliminary experiments as follows:
1) Measuring Muscle Strength: The objective of thisexperiment is to analyze the method to retrieve the muscle strength by using the MyoWare sensor. It is important to find out the best signal conditioning technique with optimum sampling time to be used in MATLAB Simulink program.
2) Investigating EMS Parameter: Before hacking theEMS device, each of the tunable components were analyzed. Since the optimum setting of the frequency and pulse width parameter are known, these two potentiometers are fixes with suitable resistance value. The only parameter that need to be controlled is the current intensity of the EMS device.
Then, the project continues with the development of electronic circuits. The Arduino is connected to the MyoWare sensor as the analog input and the digital potentiometer as the output via SPI communication. This digital potentiometer are then replacing the actual potentiometer for the current intensity controller. Another connection between the Arduino and the EMS device is to switch on and off the device via direct digital write of the Arduino. Hence, the project came out with the Simulink programming. The details of the Simulink block diagram is in Fig. 2. There are several important component used in the block diagram:
Arduino Input: This block retrieves the analog input fromthe Arduino pin A5. The signal is converted into doubleformat and map it to the range of 0 to 5.
Maximum: This block finds the maximum of the inputsignal to check if the EMS device has reach its suitableintensity. This block can be reset by the constant block‘Reset’ that controlled by the ‘Check Intensity’dashboard button.
Controller Switch: This block is used to switch intensityeither increase the SPI value by 5 or 0.
Saturation: This block saturates the SPI value from 0 to255 as to control the EMS intensity.
Output Conditioning Switch: This block checks theconstant block ‘Mode’ value controlled by the dashboardtoggle button ‘System Mode’ to set the mode of thesystem between manual and automatic.
Arduino Digital Output: This block is connected toArduino pin D8 as the switch of EMS device. Thedashboard toggle button ‘EMS Switch’ controls thisblock.
Arduino SPI WriteRead: This block reads the input arrayand write into the Arduino SPI slave select pin 10 tocontrol the EMS intensity.
Fig. 2. Details of the Simulink block diagram of the system.
C. Functionality Test
Once the project is done with the circuits connections with proper programming, it is then being test for the functionality validation. This experiment is conducted towards the human wrist extensor muscle as the subject. Two electrode pads of the electromyogram is placed onto the mid muscle while the reference electrode pad of the electromyogram is placed on the other muscle that not contracts when the wrist is extend. This will ensure the MyoWare sensor read the input of the system accurately. In the other hand, the output of the system in terms of current intensity is delivered across the muscle by placing both electrodes at the origin and the insertion point of the muscle respectively.
To test the system, toggle button ‘System Power’ must be turned once the muscle is completely relaxed. Select the system mode to automatic to see the EMS device tune automatically to the suitable intensity. The user can simply press the ‘Check’ button if the intensity is not achieve their desired value.
IV. RESULTS AND DISCUSSIONS
A. Preliminary Findings
As in the preliminary works, an experiment has been conducted to see ability of MyoWare sensor to measure the muscle strength. It is connected to the Arduino and observed the
Proceedings of 2017 Electrical Engineering Symposium (EES2017) - Vol. 1
59
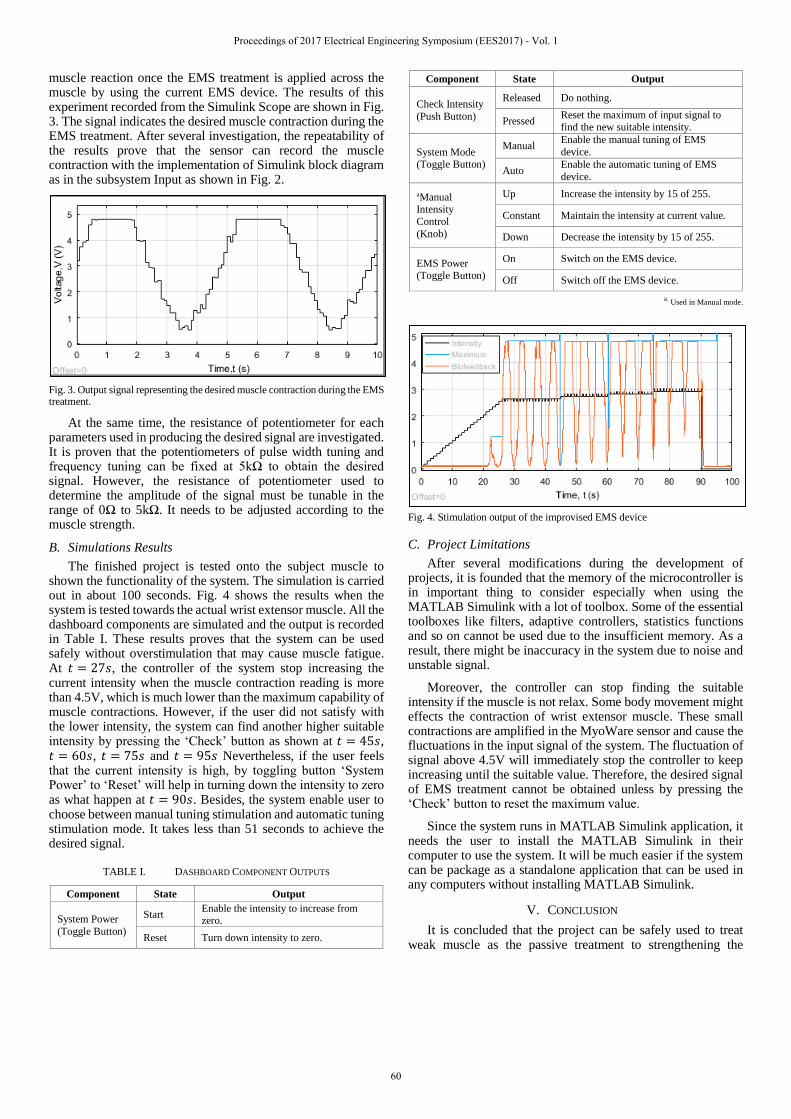
muscle reaction once the EMS treatment is applied across the muscle by using the current EMS device. The results of this experiment recorded from the Simulink Scope are shown in Fig. 3. The signal indicates the desired muscle contraction during theEMS treatment. After several investigation, the repeatability of the results prove that the sensor can record the muscle contraction with the implementation of Simulink block diagram as in the subsystem Input as shown in Fig. 2.
Fig. 3. Output signal representing the desired muscle contraction during the EMS treatment.
At the same time, the resistance of potentiometer for each parameters used in producing the desired signal are investigated. It is proven that the potentiometers of pulse width tuning and frequency tuning can be fixed at 5kΩ to obtain the desired signal. However, the resistance of potentiometer used to determine the amplitude of the signal must be tunable in the range of 0Ω to 5kΩ. It needs to be adjusted according to the muscle strength.
B. Simulations Results
The finished project is tested onto the subject muscle to shown the functionality of the system. The simulation is carried out in about 100 seconds. Fig. 4 shows the results when the system is tested towards the actual wrist extensor muscle. All the dashboard components are simulated and the output is recorded in Table I. These results proves that the system can be used safely without overstimulation that may cause muscle fatigue. At 𝑡 = 27𝑠, the controller of the system stop increasing the current intensity when the muscle contraction reading is more than 4.5V, which is much lower than the maximum capability of muscle contractions. However, if the user did not satisfy with the lower intensity, the system can find another higher suitable intensity by pressing the ‘Check’ button as shown at 𝑡 = 45𝑠, 𝑡 = 60𝑠, 𝑡 = 75𝑠 and 𝑡 = 95𝑠 Nevertheless, if the user feels that the current intensity is high, by toggling button ‘System Power’ to ‘Reset’ will help in turning down the intensity to zero as what happen at 𝑡 = 90𝑠. Besides, the system enable user to choose between manual tuning stimulation and automatic tuning stimulation mode. It takes less than 51 seconds to achieve the desired signal.
TABLE I. DASHBOARD COMPONENT OUTPUTS
Component State Output
System Power
(Toggle Button)
Start Enable the intensity to increase from zero.
Reset Turn down intensity to zero.
Component State Output
Check Intensity
(Push Button)
Released Do nothing.
Pressed Reset the maximum of input signal to find the new suitable intensity.
System Mode (Toggle Button)
Manual Enable the manual tuning of EMS
device.
Auto Enable the automatic tuning of EMS
device.
aManual Intensity
Control
(Knob)
Up Increase the intensity by 15 of 255.
Constant Maintain the intensity at current value.
Down Decrease the intensity by 15 of 255.
EMS Power (Toggle Button)
On Switch on the EMS device.
Off Switch off the EMS device.
a.Used in Manual mode.
Fig. 4. Stimulation output of the improvised EMS device
C. Project Limitations
After several modifications during the development of projects, it is founded that the memory of the microcontroller is in important thing to consider especially when using the MATLAB Simulink with a lot of toolbox. Some of the essential toolboxes like filters, adaptive controllers, statistics functions and so on cannot be used due to the insufficient memory. As a result, there might be inaccuracy in the system due to noise and unstable signal.
Moreover, the controller can stop finding the suitable intensity if the muscle is not relax. Some body movement might effects the contraction of wrist extensor muscle. These small contractions are amplified in the MyoWare sensor and cause the fluctuations in the input signal of the system. The fluctuation of signal above 4.5V will immediately stop the controller to keep increasing until the suitable value. Therefore, the desired signal of EMS treatment cannot be obtained unless by pressing the ‘Check’ button to reset the maximum value.
Since the system runs in MATLAB Simulink application, it needs the user to install the MATLAB Simulink in their computer to use the system. It will be much easier if the system can be package as a standalone application that can be used in any computers without installing MATLAB Simulink.
V. CONCLUSION
It is concluded that the project can be safely used to treat weak muscle as the passive treatment to strengthening the
Proceedings of 2017 Electrical Engineering Symposium (EES2017) - Vol. 1
60

muscle. The automatic tuning function of the project is verified as it produces slightly the same output signal as the current technologies. The main advantage of this automatic tuning system is that it can avoid overstimulation of the muscle due to the error in the setting of current intensity of the EMS device. In addition, the progress of the treatment also can be observed through the simple user interface.
REFERENCES
[1] Chan, Y.Y., et al. (2015), Lifestyle, chronic diseases and self-rated health among Malaysian adults: results from the 2011 National Health and Morbidity Survey (NHMS). BMC Public Health.
[2] Balakrishnan, R., M.E. Chellappan, and E. Changalai (2016), Prevalence of work-related musculoskeletal disorders among non-healthcare working population in different gender at Selangor. International journal of physical education, sports and health.
[3] Mohsen S, Kim K. J., Mehrad M. (2007), Anatomy and Physiology of Human Muscle, in Artificial Muscles, Taylor & Francis Group, LLC.
[4] Reaz, M., M. Hussain, and F. Mohd-Yasin (2006), Techniques of EMG signal analysis: detection, processing, classification and applications. Biological procedures online.
[5] Bigland-Ritchie B & Woods JJ (1984). Changes in muscle contractile properties and neural control during human muscular fatigue, Muscle Nerve.
[6] Søgaard K, Gandevia SC, Todd G, Petersen NT & Taylor JL (2006). The effect of sustained low-intensity contractions on supraspinal fatigue in human elbow flexormuscles. J Physiol
[7] Enoka, R.M. and J. Duchateau (2008), Muscle fatigue: what, why and how it influences muscle function. The Journal of Physiology.
[8] Md. Mainul Islam (2012). The exposure workers at risk is necessary to prevent injury Common, Musculoskeletal Disorders Among Physiotherapist, CRP.
[9] Barbara M. Doucet, A.L., and Lisa Griffinb (2012), Neuromuscular Electrical Stimulation for Skeletal Muscle Function. YALE JOURNAL OF BIOLOGY AND MEDICINE.
[10] Cambridge NA (1997). Electrical apparatus used in medicine before 1900. Proc R Soc Med.
[11] Deyo RA, Walsh NE, et al. (1990). A controlled trial of transcutaneous electrical nerve stimulation (TENS) and exercise for chronic low back pain. New Engl J Med.
[12] Sluka KA, Walsh D (2003). Transcutaneous electrical nerve stimulation: basic science mechanisms and clinical effectiveness. J Pain
[13] K. W. Eric Cheng, Y.L., et al. (2004), Senior Member, IEEE, Development of a Circuit for Functional Electrical Stimulation IEEE TRANSACTIONS ON NEURAL SYSTEMS AND REHABILITATION ENGINEERING.
[14] Gondin J, Cozzone PJ, Bendahan D (2011). Is high-frequency neuromuscular electrical stimulation a suitable tool for muscle performance improvement in both healthy humans and athletes? Eur J Appl Physiol.
[15] Bhadra N, Peckham PH (1997). Peripheral nerve stimulation for restoration of motor function. J Clin Neurophysiology.
[16] Sinkjaer, T., et al. (2003), Biopotentials as command and feedback signals in functional electrical stimulation systems. Medical Engineering & Physics.
[17] Webster, J.G. (1998), Medical Instrumentation Application and Design. John Wiley & Sons, Inc.
[18] Robert B. Northrop (2002), Measurement of Electrical Potentials and Magnetic Fields from the Body Surface in Noninvasive Instrumentation and Measurement in Medical Diagnosis, CRC Press LLC.
[19] Kleissen RFM, Buurke JH, et al. (1998). Electromyography in the biomechanical analysis of human movement and its clinical application. Gait Posture
[20] Masshor (2010), M.A.b., Design of An Electromyogram System, in Faculty of Electrical Engineering, Universiti Teknologi Malaysia.
[21] Meyer-Waarden (2005), W.W.v.M.a.K., Bioinstrumentation, CRC Press LLC.
Proceedings of 2017 Electrical Engineering Symposium (EES2017) - Vol. 1
61
Vision Aided Automated Guided Vehicle
Mohamad Danial Bin Yazid
Faculty of Electrical Engineering
Universiti Teknologi Malaysia
Johor Bahru, Malaysia.
Leow Pei Ling
Department of Control and Mechatronics Engineering
Faculty of Electrical Engineering
Universiti Teknologi Malaysia
Johor Bahru, Malaysia.
Abstract—This paper presents an automated guided vehicle
that are use two navigation method that is track and trackless
navigation method. This project use image processing approach in
order to develop the trackless navigation method. There are some
experiments have been conduct to test the vehicle in order to
achieve the objective and scope of this project. The objective of this
project is to design a track and trackless AGV by using image
processing method for human following feature. The scope of the
study is to design a prototype that can lift the weight up to 20
kilograms and develop an AGV system with track and trackless
mechanism for indoor navigations. The experiment result shows
that the first scope of this project have been achieved.
INTRODUCTION
Automated Guided Vehicle (AGV) has been
introduced to the world for the first time in 1953[1]. At that
time, the AGV is a modified towing tractor that are follow
imbedding wire in a grocery warehouse floor. This AGV detect
the magnetic field that are produce by the imbedding wire [2].
Through 60 years of continuous research and development,
AGV has integrated with modern technologies for better
performance. The growth of AGV usage in China has been
reported to be roughly about 16,000 units in 2015 and the
demand is expected to increase up to 22,000 in 2020. This
technology is very demanding in advance country in order for
them to evolve their factory sector and increase the productivity
of the factory. This growth has been followed by Malaysia in
order to be at par with the other advance country such as China,
Japan, America and others.
Besides that, there are many cases of injuries that
happened in workplace such as back pain, joint problem and
many more. The cause of this problem were caused by heavy
lifting goods that is too heavy such as boxes of assembled
goods, raw materials, office materials and more. By having this
technology, it will help human in order to moving the heavy
from one place to another. This technology also can do the
transport and deliver job continuously. Like example, when we
reading a book in the library, we have to put it back to a trolley
at the certain place. Imagine that the trolley is moving to collect
the books and returned to the collection counter. That will save
your time in order to return the book.
LITERATURE REVIEW
Automated Guided Vehicle
The first reported AGV in the 1953 is made up from a
towing truck that have been modified to pull a trailer and follow
an overhead wire [3]. After that, this technology was going
through his first development process in middle of 1970. At this
time, this technology has been developing by adding up their
ability and design from the first model. The development
process has changed the pulling system to the platform for
moving the desired item. Later, the navigation system of this
technology has been develop by adding the control and
information unit rather than just follow the overhead wire.
As the electronic and microprocessor become more
advance, the new navigation system was developing and it is
called “Dead Reckoning Algorithm” [4]. This system is used to
increase the capabilities of AGV in traverse the steel expansion
joints on the factory floor or to cross the steel gate. In other
words, the AGV could leave the track, turn at a programmed
radius and then continue its course by follow the track after the
turn was done by using this navigation system. In 1980, the non
- wire navigation system was introduced. There are four types
of navigation system that are currently used in AGV system and
this paper focuses on trackless navigations. These navigations
will be explaining on the other subtopic.
There are six types of AGV in the world. The first type is a
towing vehicle AGVs. This is the first model of AGV that are
introduced in 1953. This type can tow the load that are more
than 1000 lb. and it can move the load more than 1000 feet of
distance. This AGV can be modified from a flatbed trailers,
pallet trucks and custom trailers.
After that, the unit load type AGV was introduced. This
AGV is used to transport individual unit load onboard the
vehicle. It is equipped with powered or non – powered roller,
chain or belt deck, or custom deck. The load that can be moved
by this AGV can also be moved by a pallet truck, automatic
load/unload equipment and many more. Next type is a pallet
trucks AGVs. This AGV is widely used in distribution work
because of the mechanism design. As you can see, it’s base are
fixed for palletized load and the base cannot move up and down.
The maximum load that this AGV can lift is about 1000 – 2000
Proceedings of 2017 Electrical Engineering Symposium (EES2017) - Vol. 1
62
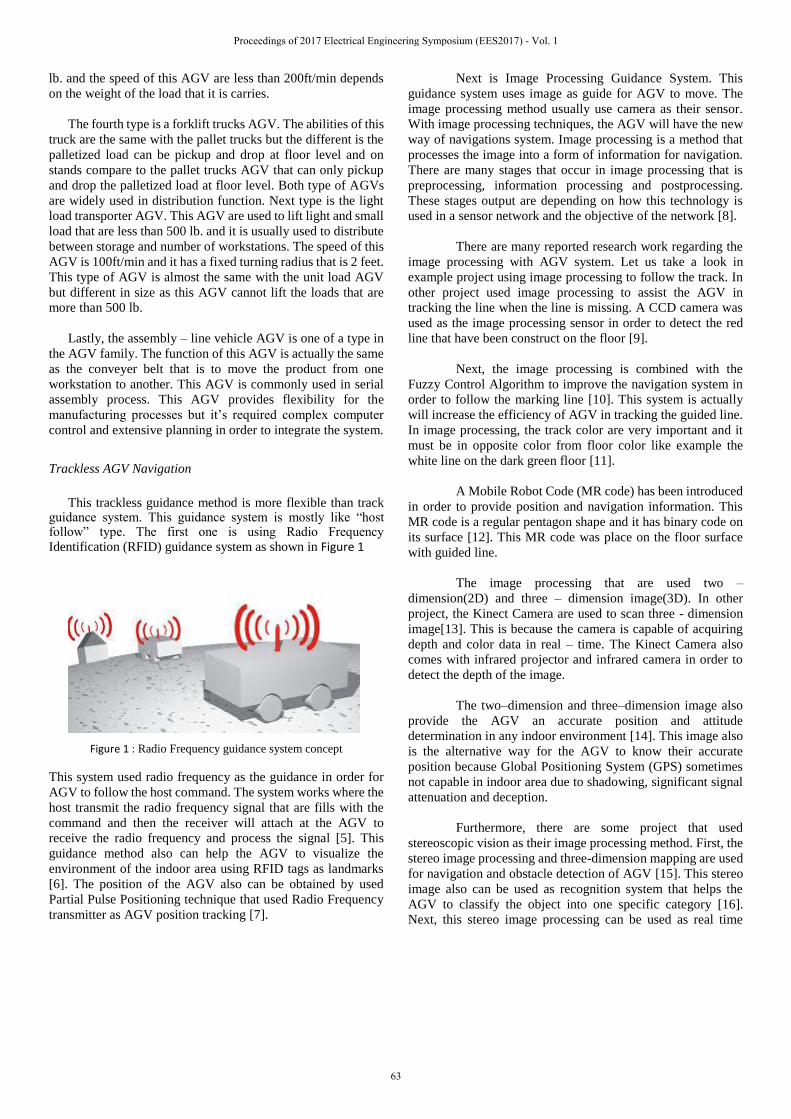
lb. and the speed of this AGV are less than 200ft/min depends
on the weight of the load that it is carries.
The fourth type is a forklift trucks AGV. The abilities of this
truck are the same with the pallet trucks but the different is the
palletized load can be pickup and drop at floor level and on
stands compare to the pallet trucks AGV that can only pickup
and drop the palletized load at floor level. Both type of AGVs
are widely used in distribution function. Next type is the light
load transporter AGV. This AGV are used to lift light and small
load that are less than 500 lb. and it is usually used to distribute
between storage and number of workstations. The speed of this
AGV is 100ft/min and it has a fixed turning radius that is 2 feet.
This type of AGV is almost the same with the unit load AGV
but different in size as this AGV cannot lift the loads that are
more than 500 lb.
Lastly, the assembly – line vehicle AGV is one of a type in
the AGV family. The function of this AGV is actually the same
as the conveyer belt that is to move the product from one
workstation to another. This AGV is commonly used in serial
assembly process. This AGV provides flexibility for the
manufacturing processes but it’s required complex computer
control and extensive planning in order to integrate the system.
Trackless AGV Navigation
This trackless guidance method is more flexible than track guidance system. This guidance system is mostly like “host follow” type. The first one is using Radio Frequency Identification (RFID) guidance system as shown in Figure 1
Figure 1 : Radio Frequency guidance system concept
This system used radio frequency as the guidance in order for
AGV to follow the host command. The system works where the
host transmit the radio frequency signal that are fills with the
command and then the receiver will attach at the AGV to
receive the radio frequency and process the signal [5]. This
guidance method also can help the AGV to visualize the
environment of the indoor area using RFID tags as landmarks
[6]. The position of the AGV also can be obtained by used
Partial Pulse Positioning technique that used Radio Frequency
transmitter as AGV position tracking [7].
Next is Image Processing Guidance System. This
guidance system uses image as guide for AGV to move. The
image processing method usually use camera as their sensor.
With image processing techniques, the AGV will have the new
way of navigations system. Image processing is a method that
processes the image into a form of information for navigation.
There are many stages that occur in image processing that is
preprocessing, information processing and postprocessing.
These stages output are depending on how this technology is
used in a sensor network and the objective of the network [8].
There are many reported research work regarding the
image processing with AGV system. Let us take a look in
example project using image processing to follow the track. In
other project used image processing to assist the AGV in
tracking the line when the line is missing. A CCD camera was
used as the image processing sensor in order to detect the red
line that have been construct on the floor [9].
Next, the image processing is combined with the
Fuzzy Control Algorithm to improve the navigation system in
order to follow the marking line [10]. This system is actually
will increase the efficiency of AGV in tracking the guided line.
In image processing, the track color are very important and it
must be in opposite color from floor color like example the
white line on the dark green floor [11].
A Mobile Robot Code (MR code) has been introduced
in order to provide position and navigation information. This
MR code is a regular pentagon shape and it has binary code on
its surface [12]. This MR code was place on the floor surface
with guided line.
The image processing that are used two –
dimension(2D) and three – dimension image(3D). In other
project, the Kinect Camera are used to scan three - dimension
image[13]. This is because the camera is capable of acquiring
depth and color data in real – time. The Kinect Camera also
comes with infrared projector and infrared camera in order to
detect the depth of the image.
The two–dimension and three–dimension image also
provide the AGV an accurate position and attitude
determination in any indoor environment [14]. This image also
is the alternative way for the AGV to know their accurate
position because Global Positioning System (GPS) sometimes
not capable in indoor area due to shadowing, significant signal
attenuation and deception.
Furthermore, there are some project that used
stereoscopic vision as their image processing method. First, the
stereo image processing and three-dimension mapping are used
for navigation and obstacle detection of AGV [15]. This stereo
image also can be used as recognition system that helps the
AGV to classify the object into one specific category [16].
Next, this stereo image processing can be used as real time
Proceedings of 2017 Electrical Engineering Symposium (EES2017) - Vol. 1
63
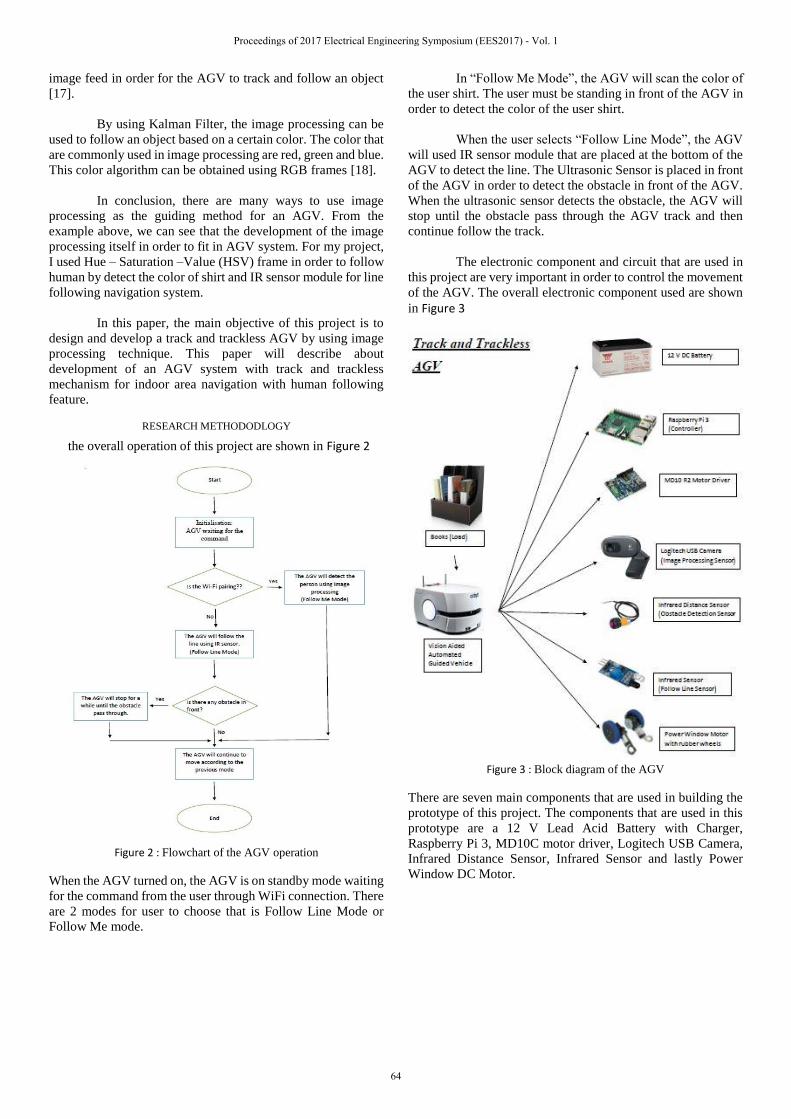
image feed in order for the AGV to track and follow an object
[17].
By using Kalman Filter, the image processing can be
used to follow an object based on a certain color. The color that
are commonly used in image processing are red, green and blue.
This color algorithm can be obtained using RGB frames [18].
In conclusion, there are many ways to use image
processing as the guiding method for an AGV. From the
example above, we can see that the development of the image
processing itself in order to fit in AGV system. For my project,
I used Hue – Saturation –Value (HSV) frame in order to follow
human by detect the color of shirt and IR sensor module for line
following navigation system.
In this paper, the main objective of this project is to
design and develop a track and trackless AGV by using image
processing technique. This paper will describe about
development of an AGV system with track and trackless
mechanism for indoor area navigation with human following
feature.
RESEARCH METHODODLOGY
the overall operation of this project are shown in Figure 2
Figure 2 : Flowchart of the AGV operation
When the AGV turned on, the AGV is on standby mode waiting
for the command from the user through WiFi connection. There
are 2 modes for user to choose that is Follow Line Mode or
Follow Me mode.
In “Follow Me Mode”, the AGV will scan the color of
the user shirt. The user must be standing in front of the AGV in
order to detect the color of the user shirt.
When the user selects “Follow Line Mode”, the AGV
will used IR sensor module that are placed at the bottom of the
AGV to detect the line. The Ultrasonic Sensor is placed in front
of the AGV in order to detect the obstacle in front of the AGV.
When the ultrasonic sensor detects the obstacle, the AGV will
stop until the obstacle pass through the AGV track and then
continue follow the track.
The electronic component and circuit that are used in
this project are very important in order to control the movement
of the AGV. The overall electronic component used are shown
in Figure 3
Figure 3 : Block diagram of the AGV
There are seven main components that are used in building the
prototype of this project. The components that are used in this
prototype are a 12 V Lead Acid Battery with Charger,
Raspberry Pi 3, MD10C motor driver, Logitech USB Camera,
Infrared Distance Sensor, Infrared Sensor and lastly Power
Window DC Motor.
Proceedings of 2017 Electrical Engineering Symposium (EES2017) - Vol. 1
64
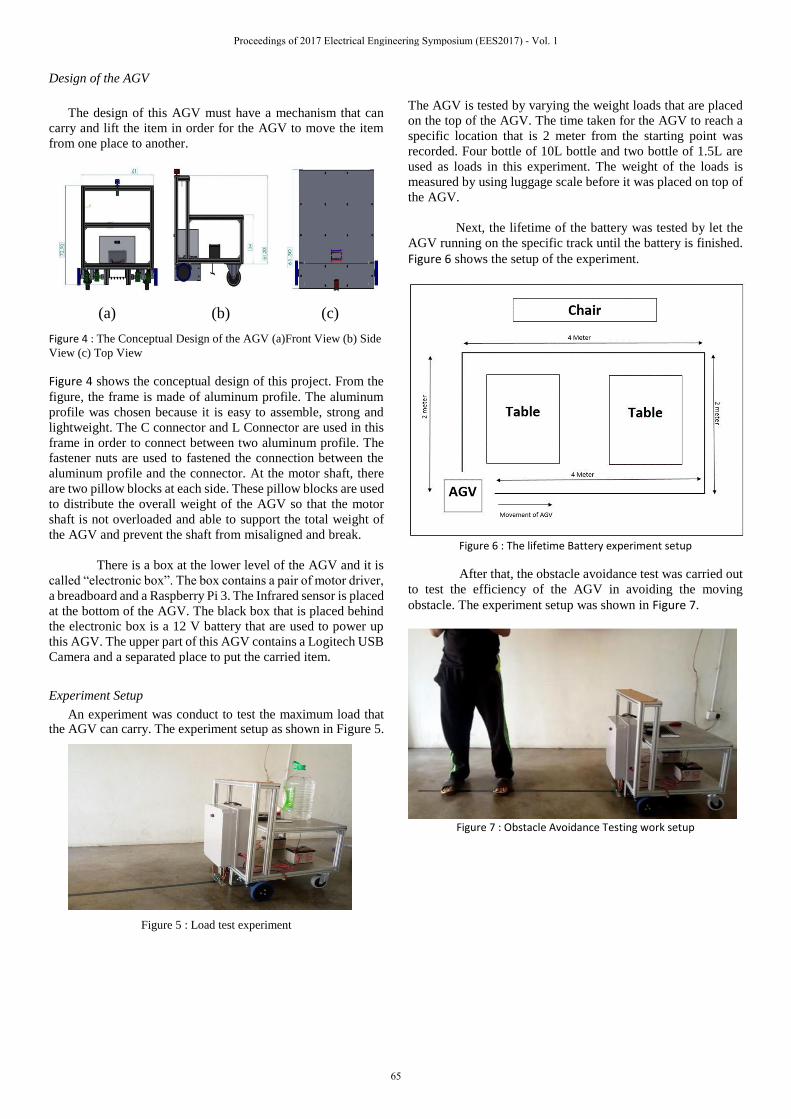
Design of the AGV
The design of this AGV must have a mechanism that can
carry and lift the item in order for the AGV to move the item
from one place to another.
(a) (b) (c)
Figure 4 : The Conceptual Design of the AGV (a)Front View (b) Side
View (c) Top View
Figure 4 shows the conceptual design of this project. From the
figure, the frame is made of aluminum profile. The aluminum
profile was chosen because it is easy to assemble, strong and
lightweight. The C connector and L Connector are used in this
frame in order to connect between two aluminum profile. The
fastener nuts are used to fastened the connection between the
aluminum profile and the connector. At the motor shaft, there
are two pillow blocks at each side. These pillow blocks are used
to distribute the overall weight of the AGV so that the motor
shaft is not overloaded and able to support the total weight of
the AGV and prevent the shaft from misaligned and break.
There is a box at the lower level of the AGV and it is
called “electronic box”. The box contains a pair of motor driver,
a breadboard and a Raspberry Pi 3. The Infrared sensor is placed
at the bottom of the AGV. The black box that is placed behind
the electronic box is a 12 V battery that are used to power up
this AGV. The upper part of this AGV contains a Logitech USB
Camera and a separated place to put the carried item.
Experiment Setup
An experiment was conduct to test the maximum load that the AGV can carry. The experiment setup as shown in Figure 5.
Figure 5 : Load test experiment
The AGV is tested by varying the weight loads that are placed
on the top of the AGV. The time taken for the AGV to reach a
specific location that is 2 meter from the starting point was
recorded. Four bottle of 10L bottle and two bottle of 1.5L are
used as loads in this experiment. The weight of the loads is
measured by using luggage scale before it was placed on top of
the AGV.
Next, the lifetime of the battery was tested by let the
AGV running on the specific track until the battery is finished.
Figure 6 shows the setup of the experiment.
Figure 6 : The lifetime Battery experiment setup
After that, the obstacle avoidance test was carried out
to test the efficiency of the AGV in avoiding the moving
obstacle. The experiment setup was shown in Figure 7.
Figure 7 : Obstacle Avoidance Testing work setup
Proceedings of 2017 Electrical Engineering Symposium (EES2017) - Vol. 1
65
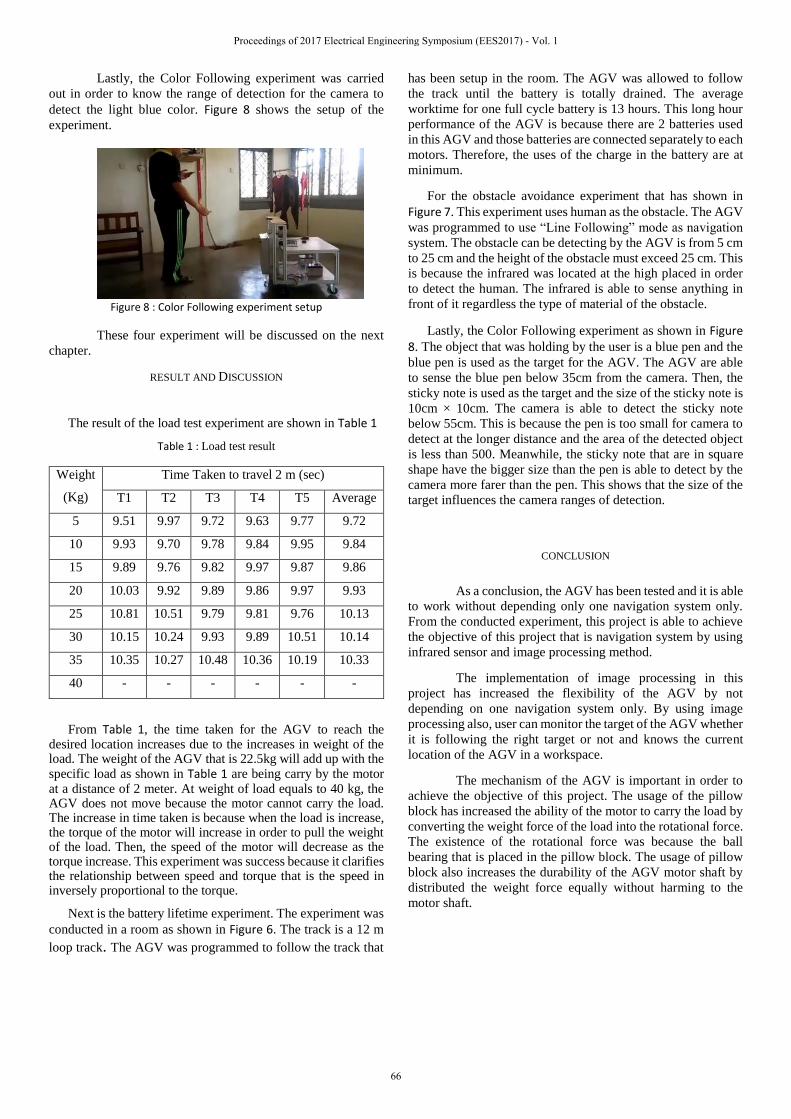
Lastly, the Color Following experiment was carried
out in order to know the range of detection for the camera to
detect the light blue color. Figure 8 shows the setup of the
experiment.
Figure 8 : Color Following experiment setup
These four experiment will be discussed on the next
chapter.
RESULT AND DISCUSSION
The result of the load test experiment are shown in Table 1
Table 1 : Load test result
Weight
(Kg)
Time Taken to travel 2 m (sec)
T1 T2 T3 T4 T5 Average
5 9.51 9.97 9.72 9.63 9.77 9.72
10 9.93 9.70 9.78 9.84 9.95 9.84
15 9.89 9.76 9.82 9.97 9.87 9.86
20 10.03 9.92 9.89 9.86 9.97 9.93
25 10.81 10.51 9.79 9.81 9.76 10.13
30 10.15 10.24 9.93 9.89 10.51 10.14
35 10.35 10.27 10.48 10.36 10.19 10.33
40 - - - - - -
From Table 1, the time taken for the AGV to reach the desired location increases due to the increases in weight of the load. The weight of the AGV that is 22.5kg will add up with the specific load as shown in Table 1 are being carry by the motor at a distance of 2 meter. At weight of load equals to 40 kg, the AGV does not move because the motor cannot carry the load. The increase in time taken is because when the load is increase, the torque of the motor will increase in order to pull the weight of the load. Then, the speed of the motor will decrease as the torque increase. This experiment was success because it clarifies the relationship between speed and torque that is the speed in inversely proportional to the torque.
Next is the battery lifetime experiment. The experiment was
conducted in a room as shown in Figure 6. The track is a 12 m
loop track. The AGV was programmed to follow the track that
has been setup in the room. The AGV was allowed to follow
the track until the battery is totally drained. The average
worktime for one full cycle battery is 13 hours. This long hour
performance of the AGV is because there are 2 batteries used
in this AGV and those batteries are connected separately to each
motors. Therefore, the uses of the charge in the battery are at
minimum.
For the obstacle avoidance experiment that has shown in
Figure 7. This experiment uses human as the obstacle. The AGV
was programmed to use “Line Following” mode as navigation
system. The obstacle can be detecting by the AGV is from 5 cm
to 25 cm and the height of the obstacle must exceed 25 cm. This
is because the infrared was located at the high placed in order
to detect the human. The infrared is able to sense anything in
front of it regardless the type of material of the obstacle.
Lastly, the Color Following experiment as shown in Figure 8. The object that was holding by the user is a blue pen and the
blue pen is used as the target for the AGV. The AGV are able
to sense the blue pen below 35cm from the camera. Then, the
sticky note is used as the target and the size of the sticky note is
10cm × 10cm. The camera is able to detect the sticky note
below 55cm. This is because the pen is too small for camera to
detect at the longer distance and the area of the detected object
is less than 500. Meanwhile, the sticky note that are in square
shape have the bigger size than the pen is able to detect by the
camera more farer than the pen. This shows that the size of the
target influences the camera ranges of detection.
CONCLUSION
As a conclusion, the AGV has been tested and it is able
to work without depending only one navigation system only.
From the conducted experiment, this project is able to achieve
the objective of this project that is navigation system by using
infrared sensor and image processing method.
The implementation of image processing in this
project has increased the flexibility of the AGV by not
depending on one navigation system only. By using image
processing also, user can monitor the target of the AGV whether
it is following the right target or not and knows the current
location of the AGV in a workspace.
The mechanism of the AGV is important in order to
achieve the objective of this project. The usage of the pillow
block has increased the ability of the motor to carry the load by
converting the weight force of the load into the rotational force.
The existence of the rotational force was because the ball
bearing that is placed in the pillow block. The usage of pillow
block also increases the durability of the AGV motor shaft by
distributed the weight force equally without harming to the
motor shaft.
Proceedings of 2017 Electrical Engineering Symposium (EES2017) - Vol. 1
66
The usage of infrared sensor as obstacle avoidance
also increased the safety feature of the AGV. This is because
the used infrared sensor can detect anything in front of it within
20cm. Therefore, this AGV are safe to use in indoor application
area such as supermarket, warehouse, library and any
environment that involving moving and sorting work.
REFERENCES
[1] L. Han, H. Qian, W. K. Chung, K. W. Hou, K. H. Lee,
X. Chen, G. Zhang, and Y. Xu, "System and design of
a compact and heavy-payload AGV system for
flexible production line." pp. 2482-2488.
[2] T. Muller, Automated Guided Vehicle, Kempston,
England: IFS Ltd., 1983.
[3] H. Martínez-Barberá, and D. Herrero-Pérez,
“Autonomous navigation of an automated guided
vehicle in industrial environments,” Robotics and
Computer-Integrated Manufacturing, vol. 26, no. 4,
pp. 296-311, 8//, 2010.
[4] D. Yaling, G. Xiaoying, L. Zhun, and S. Mei, "The
new navigation system for automatic guided vehicle."
pp. 4653-4658.
[5] J.-L. Hou, and T.-G. Chen, “An RFID-based Shopping
Service System for retailers,” Advanced Engineering
Informatics, vol. 25, no. 1, pp. 103-115, 1//, 2011.
[6] T. Tsukiyama, “RFID Based Navigation System for
Indoor Mobile Robots,” IFAC Proceedings Volumes,
vol. 44, no. 1, pp. 1084-1089, 1//, 2011.
[7] E. Hammerle, P. Winton, and S. Fett, "A multipath-
mitigating indoor carrier-phase position tracking
system." pp. 671-673.
[8] L. Grewe, and B. Shahshahani, "Image Processing
Background," Distributed Sensor Networks, Second
Edition, Chapman & Hall/CRC Computer &
Information Science Series, pp. 59-92: Chapman and
Hall/CRC, 2012.
[9] S. Butdee, and A. Suebsomran, "Automatic guided
vehicle control by vision system." pp. 694-697.
[10] C. Wang, L. Wang, J. Qin, Z. Wu, L. Duan, M. Cao,
Z. Li, Weiguangli, Z. Lu, Y. Ling, M. Li, Y. Wang, J.
Long, M. Huang, Y. Li, and Q. Wang, "Development
of a vision navigation system with Fuzzy Control
Algorithm for Automated Guided Vehicle." pp. 2077-
2082.
[11] A. H. Ismail, H. R. Ramli, M. H. Ahmad, and M. H.
Marhaban, "Vision-based system for line following
mobile robot." pp. 642-645.
[12] A. Ye, H. Zhu, Z. Xu, C. Sun, and K. Yuan, "A vision-
based guidance method for autonomous guided
vehicles." pp. 2025-2030.
[13] E. Hitomi, J. da Silva, and G. Ruppert, "3D scanning
using RGBD imaging devices," Computational Vision
and Medical Image Processing IV, pp. 197-202: CRC
Press, 2013.
[14] E. Dill, and M. U. d. Haag, "Integration of 3D and 2D
imaging data for assured navigation in unknown
environments." pp. 285-294.
[15] G. Spampinato, J. Lidholm, C. Ahlberg, F. Ekstrand,
M. Ekstr, x00F, and L. Asplund, "An embedded stereo
vision module for industrial vehicles automation." pp.
52-57.
[16] N. K. Verma, G. Kumar, A. Siddhant, P. Nama, A.
Raj, A. Mustafa, N. K. Dhar, and A. Salour, "Vision
based obstacle avoidance and recognition system." pp.
1-7.
[17] N. K. Verma, P. Nama, G. Kumar, A. Siddhant,
Ocean, A. Raj, N. K. Dhar, and A. Salour, "Vision
based object follower automated guided vehicle using
compressive tracking and stereo-vision." pp. 1-6.
[18] A. V. Gulalkari, D. Sheng, P. S. Pratama, H. K. Kim,
G. S. Byun, and S. B. Kim, "Kinect camera sensor-
based object tracking and following of four wheel
independent steering automatic guided vehicle using
Kalman filter." pp. 1650-1655.
Proceedings of 2017 Electrical Engineering Symposium (EES2017) - Vol. 1
67

Application of Sensors in Quality Evaluation of
Mangoes
Journal Low Sze Kit
Faculty of Electrical Engineering
Universiti Teknologi Malaysia
Johor Bahru, Malaysia.
Khairul Hamimah Abas
Control and Mechatronics Engineering Department
(CMED)
Faculty of Electrical Engineering
Universiti Teknologi Malaysia
Johor Bahru, Malaysia.
Abstract— This paper describes about the final year project on
the application of 200kHz ultrasonic sensor in the quality
evaluation of mangoes. In this project, a quality evaluation device
was built to assess the ripeness of mangoes: unripe, ripe and over
ripe. Two units of 19mm metal 200kHz ultrasonic transceiver were
interfaced with an Arduino Uno microcontroller, whereby the
output was shown on an 16x2 Liquid Crystal Display (LCD). The
usage of ultrasonic sensor in evaluating the quality of mangoes is
non-invasive as compared to the conventional method where
samples of mangoes were sacrificed to determine the quality of the
batch harvested. Besides, the usage of ultrasonic sensor promotes
repeatability in measuring the ripeness of mangoes, whereby the
ripeness of all the mangoes harvested can be assessed, rather than
judgement based on samples tested. From the results, it was found
that for an unripe mango, the voltage reading is 1.15V. For an over
ripe mango, the voltage reading is 1.24V, whereas for a ripe
mango, the voltage reading is 1.01V. In this project, the type of
mango evaluated is MA165, a common cultivar found in Malaysia.
Keywords—ultrasonic; quality evaluation; mangoes; ripeness;
I. INTRODUCTION
Mango (Mangifera Indica) is one of the most popular tropical fruit in the World. [1] It is also known as the "king of fruits." [2] Due to its popularity throughout the world, mangoes are being cultivated, harvested and exported rapidly. Traditionally, a mango is harvested based on judgements by the growers by observing the appearance of the fruit. [3] Naked eye observation is used to assess the quality of mango. [4] Traditional approaches are either subjective or time-consuming, so it should be a surprise that how to measure fruits’ internal and external attributes nondestructively and rapidly has become a research hotspot. [5] With the drawbacks of the traditional invasive techniques in postharvest procedure, in which the quality of the mangoes are being evaluated. Numerous works are being carried out to explore some non-destructive methods such as Near Infrared (NIR), Nuclear Magnetic Resonance (NMR), X-ray and Computed Tomography (CT), electronic nose, machine vision and ultrasound for quality determination of fruits. [6] The problem statement of the project is the replacement of invasive techniques with non-invasive techniques with implementation of sensor instrumentation in quality evaluation of mangoes. Two objectives were identified for this project: (1) to develop a mango quality evaluation device
for non-invasive assessment in quality of mangoes, (2) to fulfill the requirement as a part of assessment for the degree of Bachelors of Engineering (Electrical-Mechatronics). Six scopes were identified upon commencing with this project: (1) two units of 19mm metal 200kHz ultrasonic transceiver are used, with one acting as the transmitter and the other as receiver, (2) a quality evaluation device is built to ease the assess the ripeness of mangoes, (3) the configuration of ultrasonic transducer in this project is reflection mode, in which the acoustic wave transmitted from the transmitter reflects upon contact with the seed of the mango and detected by the receiver, (4) the quality evaluated is the voltage reading of the ultrasonic receiver, where the readings are further being classified according to the ripeness of the mangoes, (5) the type of mangoes cultivar being assessed is Maha 65 (MA 165), a common cultivar available in the country, (6) the target user of this device will be daily consumers, which consists of adult members of different age, gender and background in the society.
II. LITERATURE REVIEW
A. Ultrasonic Transducer
Ultrasonic transducer applies the working principle of ultrasound. When a disturbance occurs at a portion in an elastic medium, it propagates through the medium in a finite time as a mechanical sound wave by the vibrations of molecules, atoms or any particles present. [7] There are a few characteristics of ultrasonic waves: reflection, refraction, diffraction, and absorption. When a wave is traveling through one material and impinges on a boundary between it and a second medium, part of the energy travels forward as one wave through the second medium while a part is reflected back into the first medium, usually with a phase change. [8] This is known as Reflection. Time-of-flight (TOF) is used to measure the time for the ultrasound waves to travel from the transmitter to the receiver, with possible reflections involved upon contact with another medium. It is also used in absorption, also known as transmission mode. One of the condition for the medium in TOF measurement is that the medium must be clean, with no impurities involved. Or else, Doppler's effect of measurement should be taken into account. Doppler effect is the change in frequency or wavelength of a wave (or other periodic event) for an observer moving relative to its source. [9] Refraction is a phenomenon, whereby a wave traveling from one material into
Proceedings of 2017 Electrical Engineering Symposium (EES2017) - Vol. 1
68

another material can experience a change in its course. [10] a wave passing near the edge of an object has a tendency to become bent toward and around it. [10] The bending is known as diffraction. [10] In wave absorption, Ultrasonic waves may lose energy and get absorbed depending on the type of material and distance it traveled. [10] These days, most practical ultrasound sources are based on the piezoelectric principle of transconduction. [11] Piezoelectric has an advantage of simple construction and operation, which makes them suitable for a variety of applications. Ultrasonic transducer has been applied widely in nondestructive evaluation: high temperature monitoring in harsh environments and also imaging (also known as tomography). Process tomography is the general name given to a range of techniques in which data are recorded using remote sensors and then manipulated to provide measurements of concentration distribution and flow phenomena within process equipment such as pipes and reactors. [12]
The exponential increment in the relationship between receiving and transmitting making ultrasonic sensor a good sensor in evaluating the ripening of mangoes. The attenuation in the transmitting and receiving signals of ultrasonic sensors matches the graph of maturity level and total sugar across a certain period. Error! Reference source not found. Studies have proven that ultrasonic sensor is a suitable sensor in evaluating the maturity level of a mango.
B. Near Infrared Spectroscopy (NIS)
Near infrared spectroscopy shows the best results among the other ranges of the magnetic spectrum. [14] Voltage is applied across the system to launch the infrared optical power generated by the light source NIR emitter diode. [14] When fruit is in contact with the infrared optical transmitter, infrared optical power light is transmitted through the fruit texture to the receiver circuit which based on photo-detector to detect the infrared optical power light and to convert it into an electrical signal. [14] The obtained result was in the range of 3.5 V to 4.2 V for unripe mango fruit and the ripest one. [14] This method developed has proven that the quality of fruit can be determined non-destructively.
The visible and near infrared (Vis/NIR) spectroscopy, multispectral imaging and hyperspectral imaging techniques can also be applied in the quality evaluation of mangoes. [5] Imaging and spectroscopy are two important directions of conventional optical technology. [5] Imaging techniques obtain the images of fruits and spatial information. [5] Spectroscopy provides information about the chemical components and physical properties of fruits by obtaining optical information. [5] Imaging spectral techniques enable the acquisition of fruit images and spectral information simultaneously, with high spectral resolution and multiple wavebands. [5] According to the spectral resolution, imaging spectroscopy can be divided into multispectral imaging, hyperspectral imaging and ultra-spectral imaging. [5] Multispectral imaging and hyperspectral imaging are proved to be feasible for the measurement of fruit quality parameters. [5] Visible and near infrared (Vis/NIR) radiation covers the range from 380–2500 nm in the electromagnetic spectrum. [5] As the signals of almost all major structures and functional groups of organic compounds can be detected with a considerably stable spectrogram, therefore these spectra are
commonly used for analysis. [5] Wavebands which are used in multispectral and hyperspectral imaging technologies can also be used. [5] When incident radiation hits on a surface, it can be reflected, transmitted or absorbed. [5] This reflects the physical attribute and chemical constitution inside the samples. [5] With the obtained spectrum, chemometric methods are applied to obtain the information on the quality of mangoes and eliminate the interference factors of the samples. [5] The reflectance spectroscopy to measure the soluble solid contents (SSC) and pH values of mangoes. [6] Schmilovitch et al. later applied the near infrared (NIR) reflectance spectroscopy to measure the firmness, SSC, acidity and storage period of mangoes. [15]
III. METHODOLOGY
A. Block Diagram
The push button and 200kHz ultrasonic transceiver serve as analog input components to the system. The 200kHz of the transmitter pulse was generated by Arduino Uno with the pulse width modulation (PWM) script as in timer2 programming of microprocessor. At all times, the transmitter is generating pulses at 200kHz. Only when the push button is hit, the transceiver unit reads the sensor input. The sensor reading is converted from analog to digital (ADC) to fit in the maximum of 5V input of Arduino Uno. Fig. 1 shows the block diagram of the quality evaluation system.
The voltage reading is then sent to the 16x2 liquid crystal display to enable the users to access the sensor input.
B. Flow Chart
As microcontroller is implemented in the quality evaluation
system, therefore a flow chart is constructed to provide an
overall flow for programming. Fig. 2 shows the flow chart of
the quality evaluation system.
Fig. 1. Block diagram of the quality evaluation system
Proceedings of 2017 Electrical Engineering Symposium (EES2017) - Vol. 1
69

As there are three classification of ripeness of mangoes,
therefore in the flow chart there are three conditions to be
checked. However, the evaluation of mangoes cannot be done
if the push button is not hit. Therefore, the condition of the push
button must be first checked and placed on the top priority of
the flow chart. The voltage values of A and B are determined
during the experiment upon completion of the hardware.
C. Circuit System Design
The circuit was first connected as shown in Fig 3. The
transceiver unit which acted as the transmitter was connected to
pin 3 of Arduino Uno, whereas the receiver was connected to
pin A0. Pin 4 to pin 9 were to connected to the 16x2 liquid
crystal display (LCD) in an orderly manner: RS, E, D4, D5, D6,
D7. On the LCD, pin VSS, RW and pin K were connected to
the Ground terminal, pin VDD was connected from the 5V
power supply terminal. Pin V0 was connected from the output
of 10kΩ potentiometer, whereas pin A was connected to a 330Ω
resistor and the other terminal of the resistor was connected to
5V power supply terminal. The three units of normally open
push button (NOPB) were connected to pin 10, 11 and 12 of the
Arduino Uno. A 10kΩ resistor was connected to each of the
NOPB from Ground to act as a pull up resistor for the NOPB.
From the 9V battery, the positive terminal was connected to the
common terminal of slide switch, the output of the slide switch
was connected to the DC power plug positive terminal. The
negative terminal of the 9V battery was connected to the
negative terminal of the DC power plug. The DC power plug
was plugged into the Arduino Uno to power up the circuit. The
LCD, NOPB, and slide switch was connected on a separate
board. Jumper wires were used to provide power supply to the
components and feed the inputs and outputs (I/O) to and from
the microcontroller.
Fig. 3 Circuit System Design
After the circuit was connected, testing was done on the
functionality of each component, especially on the LCD and
push button. In order to do this, a series of Arduino source code
was compiled and ran.
D. Procedures
The profiles of the subject tested, which are the Maha 65 (MA165) mangoes, were created. Nine mangoes, with three of each ripeness classification were purchased from the Taman Universiti Market. The mango samples were tested on the voltage characteristics according to the classification of ripeness of mangoes. Both the transmitter and receiver were placed on the surface of the fruit. In order to obtain the most effective placement of transmitter and receiver unit on the fruit, the experiment was conducted at three separate distance: the minimum distance whereby both the transmitter and receiver were placed next to each other, the maximum distance which is the farthest separation of the transmitter and receiver on the fruit, as well as the distance in between the maximum and minimum. The button was pressed and the reading at the receiver was detected. The analog sensor input value was then processed, went through analog-to-digital conversion (ADC) to be read as voltage value. The process of ADC was done by Arduino Uno. The voltage value was then sent to the LCD for observation. All observations were recorded and tabulated. The procedures were repeated for the other eight samples, and the experiment was repeated for seven continuous days.
IV. RESULTS AND DISCUSSION
An experiment was conducted in identifying the voltage reading on the 200kHz ultrasonic transceiver for each classification of ripeness of mangoes. The voltage reading for each sample was taken for seven straight days. The results and analysis were further discussed in this section.
A. Results and discussions
Table I shows the minimum, maximum, median, mean and mode distance recorded from the experiment.
Fig. 2. Flow chart of quality evaluation system
Proceedings of 2017 Electrical Engineering Symposium (EES2017) - Vol. 1
70

TABLE I. MINIMUM, MAXIMUM, MEDIAN, MEAN AND MODE DISTANCE
RECORDED
Ripeness
Distance (cm)
Minimum Maximum Median Mean Mode
Unripe 0.0 10.0 4.0 3.8 4.5
Over ripe 0.0 9.5 4.2 3.9 4.5
Ripe 0.0 10.0 3.7 3.8 4.5
The maximum distance between transmitter and receiver was much limited by the length of the mango samples. However, upon analysis it was found that for all classification of ripeness, an effected distance between transmitter and receiver recorded was 4.5cm. This was shown from the mode distance, 4.5cm separation between transmitter and receiver was recorded as effective distance eight times in seven days. Therefore, it can be said that the ripeness of mangoes can be measured by placing the transmitter and receiver of 200kHz ultrasonic transceiver 4.5cm apart from each other for the most effective measurement.
Table II. shows the voltage reading of unripe samples of mangoes at minimum, maximum and effective separation distance between transmitter and receiver.
TABLE II. VOLTAGE READING OF UNRIPE SAMPLES OF MANGOES AT
MINIMUM, MAXIMUM AND EFFECTIVE SEPARATION DISTANCE BETWEEN
TRANSMITTER AND RECEIVER
Day Minimum Maximum Effective Distance
1 3.20 0.91 2.58
2 0.22 1.60 1.53
3 0.92 1.32 1.48
4 1.54 1.83 1.48
5 1.32 1.04 1.15
6 1.41 1.35 1.08
7 0.92 0.64 0.64
From Table II., it can be seen that as the unripe mangoes ripen across seven days, the voltage reading decreases. This is due to the fact that as an unripe mango ripens, the concentration of sugar increases, and the total soluble solid (TSS) reduces. [16][17] This results in the wall of the fruit softens, less energy was needed to transmit ultrasonic wave into the fruit and reflect to the receiver.
Table III. shows the voltage reading of unripe samples of mangoes at minimum, maximum and effective separation distance between transmitter and receiver.
TABLE III. VOLTAGE READING OF OVER RIPE SAMPLES OF MANGOES AT
MINIMUM, MAXIMUM AND EFFECTIVE SEPARATION DISTANCE BETWEEN
TRANSMITTER AND RECEIVER
Day Minimum Maximum Effective Distance
1 1.97 2.89 2.15
2 0.66 0.51 0.59
3 0.34 0.19 3.50
4 1.14 0.97 1.19
5 1.51 1.08 1.01
6 1.40 1.24 1.00
7 1.51 0.84 1.27
From Table III., it was found that as the over ripe mango further ripened, the voltage reading decrease drastically in two days, and increase gradually in the following five days. The wall of the fruit softened resulting in less energy needed to transmit ultrasonic wave into the fruit and reflected back to the receiver. Further softening in the wall of the fruit resulting in the ultrasonic wave transmitted came in contact directly with the seed of the fruit. The hard surface of the seed reflected the transmitted ultrasonic wave to the receiver. However, in Day 3, there was a sudden spike of voltage reading in effective measurement distance. This reading was considered as extreme values and discarded in analysis.
Table IV. shows the voltage reading of unripe samples of mangoes at minimum, maximum and effective separation distance between transmitter and receiver.
TABLE IV. VOLTAGE READING OF RIPE SAMPLES OF MANGOES AT
MINIMUM, MAXIMUM AND EFFECTIVE SEPARATION DISTANCE BETWEEN
TRANSMITTER AND RECEIVER
Day Minimum Maximum Effective Distance
1 3.11 3.24 3.47
2 0.19 0.15 0.20
3 1.09 1.05 0.91
4 0.87 1.11 0.78
5 1.34 0.76 0.79
6 1.01 1.14 0.82
7 1.52 1.12 0.83
According to Table IV., the voltage reading for the ripe mango samples decreased in the first two days. However, the voltage reading increased and was maintained at a quite similar value for the remaining five days. From the effective separation
Proceedings of 2017 Electrical Engineering Symposium (EES2017) - Vol. 1
71
distance between the transmitter and receiver, it can be said that the voltage reading for ripe mangoes is about 0.50V. The earlier drastic decrease could possibly due to the fact that the ultrasonic transceivers were unstable and the duration between reading once the button was hit was 400 milliseconds. Another possible reason was due to the presence of air gap between the ultrasonic transceiver and the surface of the fruit. Therefore, to overcome this problem, couplant was suggested to prevent air gaps between the transceiver and the surface of the fruit.
V. CONCLUSION
As a conclusion, a quality evaluation device was built with two units of 19mm metal 200kHz ultrasonic transceiver, Arduino Uno and 16x2 liquid crystal display. Quality evaluation of mangoes were done with the ultrasonic transceiver configured into reflection mode, whereby one unit acted as the transmitter while the other as receiver. The separation distance between the transmitter and receiver obtained was 4.5cm Non-invasive techniques was implemented successfully. The type of quality parameter being assessed is the ripeness of the mangoes. As mango ripens, the total soluble solids (TSS) contents and sugar content increases. The wall of mangoes softens. The type of mangoes being used in this project is Maha 65 (MA165). The target users for the quality evaluation device is daily consumers.
For an unripe mango, the voltage reading is 1.15V, whereas for an over ripe mango is 1.21V and 1.01V for a ripe mango.
REFERENCES
[1] Mango Facts. (n.d.). Retrieved from http://www.mango.org/en/About-Mangos/Mango-Facts
[2] Purseglove, J.W., 1972. Mangoes west of India. Acta Horticulturae, 24: 107–74.
[3] Sivakumar, D., Jiang, Y., & Yahia, E. M. (2011). Maintaining mango (Mangifera indica L.) fruit quality during the export chain. Food Research International, 44(5), 1254-1263. doi:10.1016/j.foodres.2010.11.022.
[4] Rashmi Pandey, Prof. Nikunj Gamit, & Prof. Sapan Naik. (2014). A novel non-destructive grading method for Mango (Mangifera Indica L.) using fuzzy expert system. Paper presented at 2014 International Conference on Advances in Computing, Communications and Informatics (ICACCI): Advances in Computing, Communications and Informatics, New Delhi, India. doi: 10.1109/ICACCI.2014.6968366.
[5] Wang, H., Peng, J., Xie, C., Bao, Y., & He, Y. (2015). Fruit Quality Evaluation Using Spectroscopy Technology: A Review. Sensors, 15(5), 11889-11927. doi:10.3390/s150511889.
[6] Jha, S. N., Narsaiah, K., Sharma, A. D., Singh, M., Bansal, S., & Kumar, R. (2010). Quality parameters of mango and potential of non-destructive techniques for their measurement — a review. Journal of Food Science and Technology, 47(1), 1-14. doi:10.1007/s13197-010-0004-6.
[7] Mukhopadhyay, S. C., & Huang, R. H. (2008). Sensors: advancements in modeling, design issues, fabrication and practical applications (Vol. 21). Berlin: Springer. ISBN: 978-3-540-69030-6.
[8] Carlin B (1960) Ultrasonics, 2nd edn. McGraw-Hill, New York.
[9] Doppler, C. (1842). Über das farbige Licht der Doppelsterne und einiger anderer Gestirne des Himmels (About the coloured light of the binary stars and some other stars of the heavens). Publisher: Abhandlungen der Königl. Böhm. Gesellschaft der Wissenschaften (V. Folge, Bd. 2, S. 465-482)
[10] Terzic, J., Terzic, E., Nagarajah, R., & Alamgir, M. (2013). Ultrasonic Fluid Quantity Measurement in Dynamic Vehicular Applications. Cham: Springer International Publishing. ISBN: 978-3-319-00632-1
[11] Kuttruff H (1991) Ultrasonics—fundamentals and applications. London, Elsevier Applied Science
[12] Williams, R. A., & Beck, M. S. (1995). Process tomography: principles, techniques and applications (1st ed.). Oxford: Butterworth-Heinemann. ISBN: 9780750607445
[13] Ibrahim, S., Ramli, A., & Yunus, M. A. (2015). An ultrasonic system for determining papaya physiological properties. doi:10.1063/1.4915734
[14] Izneid, B. A., Fadhel, M. I., Al-Kharazi, T., Ali, M., & Miloud, S. (2012). Design and develop a nondestructive infrared spectroscopy instrument for assessment of mango (Mangifera indica) quality. Journal of Food Science and Technology, 51(11), 3244-3252. doi:10.1007/s13197-012-0880-z
[15] Schmilovitch, Z.; Mizrach, A.; Hoffman, A.; Egozi, H.; Fuchs, Y. Determination of mango physiological indices by near-infrared spectrometry. Postharvest Biol. Technol. 2000, 19, 245–252.
[16] Islam, M. K., Khan, M. Z., Sarkar, M. A., Absar, N., & Sarkar, S. K. (2013). Changes in Acidity, TSS, and Sugar Content at Different Storage Periods of the Postharvest Mango ( Mangifera indica L.) Influenced by Bavistin DF. International Journal of Food Science, 2013, 1-8. doi:10.1155/2013/939385
[17] Valente, M., LAUX, D., & PRADES, A. (n.d.). Changes of ultrasound characteristics of mango juice during fruit ripening. Retrieved November 5, 2016, from https://agritrop.cirad.fr/567096/1/document_567096.pdf.
Proceedings of 2017 Electrical Engineering Symposium (EES2017) - Vol. 1
72

Automatic Sluice Gate Control at Paddy Field
Muhammad Fauzan Bin Saafi
Faculty of Electrical Engineering
Universiti Teknologi Malaysia
Johor Bahru, Malaysia.
Herlina Bt. Abdul Rahim
Department of Mechatronic and Control
Faculty of Electrical Engineering
Universiti Teknologi Malaysia
Johor Bahru, Malaysia.
Abstract—This paper introduce the solution of the problem at
paddy field canal. The design utilize GSM technology,
microcontroller, and non-contact sensor to measure the water
level. The GSM monitoring was being used because of the people
and the location of the project problem. This system result have
been shown the sluice gate can be automated and monitored by
GSM. So, this system are really suitable to be apply at the project
location.
Keywords—automatic;gsm monitoring;paddy field;sluice gate;
I. INTRODUCTION
As we know rice is the most importance food in Asian.
So that to make Malaysia as a main rice producer, Malaysian
government has set its rice independence level at 65% and is fit
for producing this sum at present to satisfy Asian rice request
[1]. Therefore to make the rice production in Malaysia fulfill
the level that the Malaysia government have set, the technology
of rice cultivation must be improve to increase the rice
production while reduce the work force of the farmer. The
automation technology must be introduce to the farmer so that
they can use it in their rice cultivation.
Automation technology have been always applied in
agriculture to reduce work force and increase the crop yield. In
rice production or cultivation, an automation system for the
water control will really help in reducing the work force of the
farmer and increase the rice production. It also helps to reduce
wastage, effective usage of fertilizer and thereby increase the
crop yield [2]. If the automated irrigation take place, the farmer
will be easy to monitor their crop [3]. The paddy cultivation are
not same as other crop which is need the sprinkle to watering
them.
Paddy growth are really influence by the water supply.
Water should be keep standing in the field throughout the
growth period of paddy. The paddy need flooded soil to grow
them so the water are really needed to irrigate well in their
growth period. Flooded soils helped improve stand
establishment by compensating for reduced germination and
mortality of seedling when flooded at early stages [4]. It also
have greater availability in nutrient and can suppress weed
competition. The flooded soil also a micro-climate which
favorable to the paddy production.
Even though flooded soil have many advantages to the
crop, excess water can lead to reduction of the crop production.
Excess water may harmful to the crop which is crop may be
affected to the pest and diseases. It also may cause the moisture
stress and effect to the root growth. Fertilizer loss also might
occur if the crop have excess water. It will lead to poor
germination of the crop. The irrigation layout also may affected
if the field have excess water. The soil wall that have been built
by the farmer to separate their field may collapse because of the
excess water.
So that, to overcome the excess water problem of the
excess water, the sluice gate at the drainage must be apply
automated system. Therefore the farmer not need usually to go
check the water level whether he need to open the sluice gate or
not.
II. LITERATURE REVIEW
A. Introduction
This chapter covers the literature review for this
project. It will be the backbone that support the proposed idea
for this project system. The literature review of this project have
been separate into 3 part which is water level measurement,
alert and monitoring system, and the sluice gate and its actuator.
At first, the information and theories about water level
measurement will be explain. Next, about monitoring system
and lastly about sluice gate and it actuator.
B. Water level measurement
Water level can be measure by using many sensor and
technique. It became important to measure the distance in many
application such as water level in drainage. The water level
monitoring could give early cautioning flood and the loss could
be diminished [5]. There are many method of measuring the
water level. Some method to measure water level are using
mechanical sensors such as resistive, capacitive, or magnetic
sensor. Although there are many method, the method can be
separate in two main group. The first one is continuous level
measurement for process monitoring while another one is point
level measurement to activate alarm [5]. The method that might
been used in this project is point level measurement.
A perfect water level sensing system must be capable
to feature stability, high resolution and low cost [6]. Thus, to
select the most suitable sensor in an application, there are many
aspect must be consider before selecting it. Level sensors are
categorized into two type which are invasive and non-invasive.
Proceedings of 2017 Electrical Engineering Symposium (EES2017) - Vol. 1
73
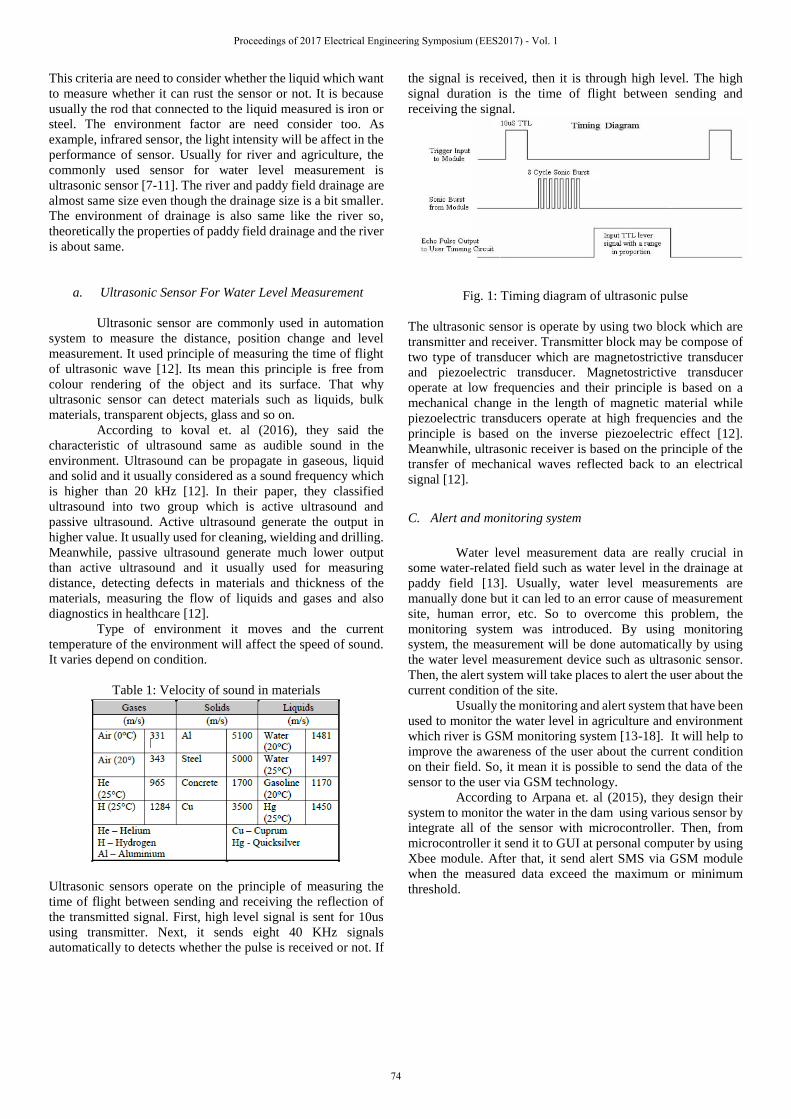
This criteria are need to consider whether the liquid which want
to measure whether it can rust the sensor or not. It is because
usually the rod that connected to the liquid measured is iron or
steel. The environment factor are need consider too. As
example, infrared sensor, the light intensity will be affect in the
performance of sensor. Usually for river and agriculture, the
commonly used sensor for water level measurement is
ultrasonic sensor [7-11]. The river and paddy field drainage are
almost same size even though the drainage size is a bit smaller.
The environment of drainage is also same like the river so,
theoretically the properties of paddy field drainage and the river
is about same.
a. Ultrasonic Sensor For Water Level Measurement
Ultrasonic sensor are commonly used in automation
system to measure the distance, position change and level
measurement. It used principle of measuring the time of flight
of ultrasonic wave [12]. Its mean this principle is free from
colour rendering of the object and its surface. That why
ultrasonic sensor can detect materials such as liquids, bulk
materials, transparent objects, glass and so on.
According to koval et. al (2016), they said the
characteristic of ultrasound same as audible sound in the
environment. Ultrasound can be propagate in gaseous, liquid
and solid and it usually considered as a sound frequency which
is higher than 20 kHz [12]. In their paper, they classified
ultrasound into two group which is active ultrasound and
passive ultrasound. Active ultrasound generate the output in
higher value. It usually used for cleaning, wielding and drilling.
Meanwhile, passive ultrasound generate much lower output
than active ultrasound and it usually used for measuring
distance, detecting defects in materials and thickness of the
materials, measuring the flow of liquids and gases and also
diagnostics in healthcare [12].
Type of environment it moves and the current
temperature of the environment will affect the speed of sound.
It varies depend on condition.
Table 1: Velocity of sound in materials
Ultrasonic sensors operate on the principle of measuring the
time of flight between sending and receiving the reflection of
the transmitted signal. First, high level signal is sent for 10us
using transmitter. Next, it sends eight 40 KHz signals
automatically to detects whether the pulse is received or not. If
the signal is received, then it is through high level. The high
signal duration is the time of flight between sending and
receiving the signal.
Fig. 1: Timing diagram of ultrasonic pulse
The ultrasonic sensor is operate by using two block which are
transmitter and receiver. Transmitter block may be compose of
two type of transducer which are magnetostrictive transducer
and piezoelectric transducer. Magnetostrictive transducer
operate at low frequencies and their principle is based on a
mechanical change in the length of magnetic material while
piezoelectric transducers operate at high frequencies and the
principle is based on the inverse piezoelectric effect [12].
Meanwhile, ultrasonic receiver is based on the principle of the
transfer of mechanical waves reflected back to an electrical
signal [12].
C. Alert and monitoring system
Water level measurement data are really crucial in
some water-related field such as water level in the drainage at
paddy field [13]. Usually, water level measurements are
manually done but it can led to an error cause of measurement
site, human error, etc. So to overcome this problem, the
monitoring system was introduced. By using monitoring
system, the measurement will be done automatically by using
the water level measurement device such as ultrasonic sensor.
Then, the alert system will take places to alert the user about the
current condition of the site.
Usually the monitoring and alert system that have been
used to monitor the water level in agriculture and environment
which river is GSM monitoring system [13-18]. It will help to
improve the awareness of the user about the current condition
on their field. So, it mean it is possible to send the data of the
sensor to the user via GSM technology.
According to Arpana et. al (2015), they design their
system to monitor the water in the dam using various sensor by
integrate all of the sensor with microcontroller. Then, from
microcontroller it send it to GUI at personal computer by using
Xbee module. After that, it send alert SMS via GSM module
when the measured data exceed the maximum or minimum
threshold.
Proceedings of 2017 Electrical Engineering Symposium (EES2017) - Vol. 1
74

Fig. 2: System block diagram [19]
Meanwhile, according to Saraswati et. al (2012), it is
possible to send SMS data measured by connecting the GSM
module directly to the microcontroller. They used ultrasonic
sensor to measure the water level then send it data to the cell
phone by using GSM module [16]. The GSM module that they
have been used is SIM300C which is compatible with their
country communication band [16]. The user can request the
data from microcontroller then microcontroller will calculate
the water level then it send the data to the cell phone.
D. Sluice Gate and Actuator
Sluice gate is a moveable gate that control the quantity
of water flow through it by rising it or lowering it. To increase
the flow of the water, the gate needed to rise and to decrease it
the gate is needed to lower. There are several style of sluice gate
that presently used such as vertical rising sluice gate, flap gate,
and radial sluice gate. The style of the gate are depending on
the condition of the water flow and the size of the drainage.
Usually the traditional sluice gate is manually operate sluice
gate but nowadays people use actuator to open the gate.
By referring Ibrahim et. al (2015), in their paper they
propose to build gate automation and control module (GACM)
to automatically open and closed the gate. The present system
that they want to apply their system is hydraulic vertical rising
sluice gate operate manually. So, they want to improve the
current system to automatic. The actuator they used to open the
gate is 3.75HP Permanent Magnet DC Motor. The decision of
using DC motor rather than AC motor can be justified with
regards to creating world as far as cost-adequacy and
adaptability [20]. For the most part, AC motor are 3 stage phase
motor requiring a 3 stage supply not really accessible in a large
portion of the channel system of Indus Basin.
Fig.3: Gate Automation & Control Module Architecture [20]
III. METHODOLOGY
The control system of this project use arduino UNO as
controller as well as its processing unit for the data. The coding
for the arduino are done by using arduino IDE. Since the
ultrasonic sensor input and output are digital input, therefore it
can use digital port at arduino. After the arduino receive the
input from the sensor the distance are needed to calculate by
calculating the time of flight of it signal.
Distance = (Time x Speed of Sound in Air (340 m/s))/2
After some calculation, the arduino will decide
whether the actuator need to ON or OFF to open and close the
sluice gate. Then, the arduino will send the message via GSM
module to the authorities.
Figure 4: Flowchart of the system
A. Main Component
The main component in this project is Arduino UNO,
HC-SR04 ultrasonic sensor, SIM900A GSM module and
GA12-N20 Geared Mini DC Motor.
1) Arduino UNO and Arduino IDE
Arduino UNO is selected as a controller for this project due to
it advance technology capability. It used ATmega328P as it
microcontroller which is high performance but low power
microcontroller and use 16 MHz crystal oscillator. Arduino
UNO use 5V as its operating voltage and it recommended input
voltage is 7-12 volt. It also have 14 digital input and output pin
whereas 6 of it provide PWM output. The software will be used
to program the arduino is Arduino IDE which use C and C++
as it programming language. Furthermore, arduino has a vast
open resources and community which really help the
understanding. Figure 3.3 shows the arduino UNO.
Proceedings of 2017 Electrical Engineering Symposium (EES2017) - Vol. 1
75
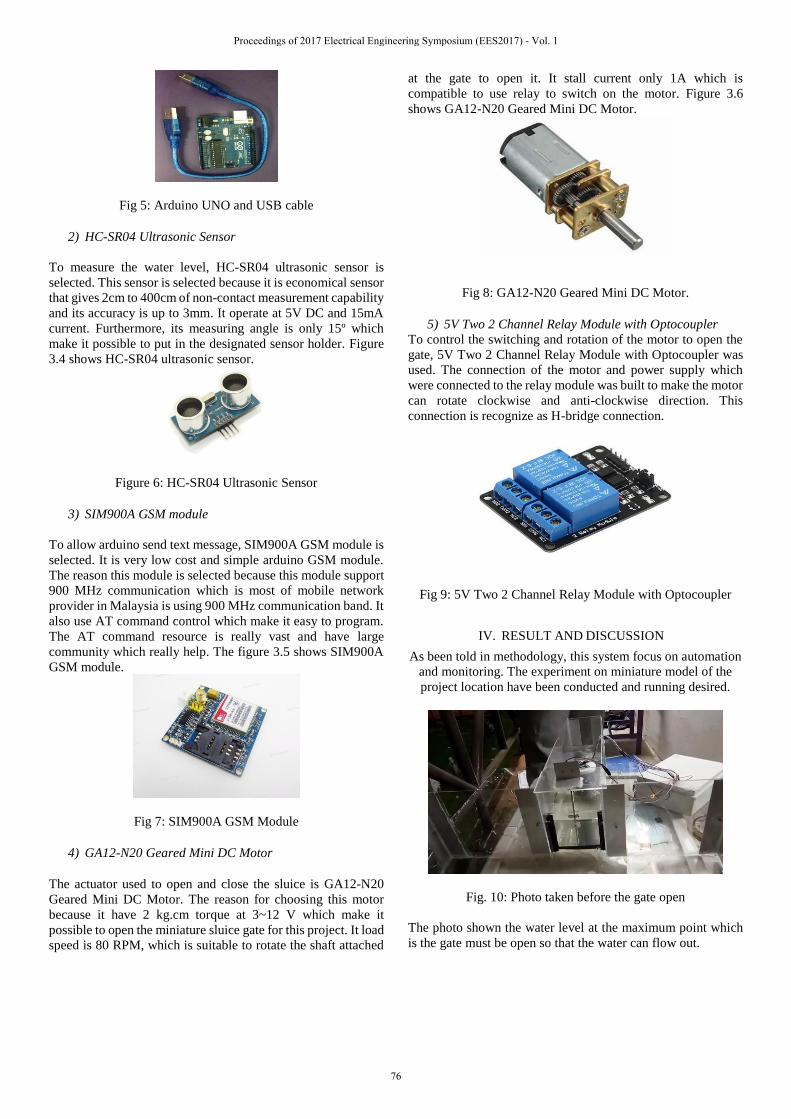
Fig 5: Arduino UNO and USB cable
2) HC-SR04 Ultrasonic Sensor
To measure the water level, HC-SR04 ultrasonic sensor is
selected. This sensor is selected because it is economical sensor
that gives 2cm to 400cm of non-contact measurement capability
and its accuracy is up to 3mm. It operate at 5V DC and 15mA
current. Furthermore, its measuring angle is only 15º which
make it possible to put in the designated sensor holder. Figure
3.4 shows HC-SR04 ultrasonic sensor.
Figure 6: HC-SR04 Ultrasonic Sensor
3) SIM900A GSM module
To allow arduino send text message, SIM900A GSM module is
selected. It is very low cost and simple arduino GSM module.
The reason this module is selected because this module support
900 MHz communication which is most of mobile network
provider in Malaysia is using 900 MHz communication band. It
also use AT command control which make it easy to program.
The AT command resource is really vast and have large
community which really help. The figure 3.5 shows SIM900A
GSM module.
Fig 7: SIM900A GSM Module
4) GA12-N20 Geared Mini DC Motor
The actuator used to open and close the sluice is GA12-N20
Geared Mini DC Motor. The reason for choosing this motor
because it have 2 kg.cm torque at 3~12 V which make it
possible to open the miniature sluice gate for this project. It load
speed is 80 RPM, which is suitable to rotate the shaft attached
at the gate to open it. It stall current only 1A which is
compatible to use relay to switch on the motor. Figure 3.6
shows GA12-N20 Geared Mini DC Motor.
Fig 8: GA12-N20 Geared Mini DC Motor.
5) 5V Two 2 Channel Relay Module with Optocoupler
To control the switching and rotation of the motor to open the
gate, 5V Two 2 Channel Relay Module with Optocoupler was
used. The connection of the motor and power supply which
were connected to the relay module was built to make the motor
can rotate clockwise and anti-clockwise direction. This
connection is recognize as H-bridge connection.
Fig 9: 5V Two 2 Channel Relay Module with Optocoupler
IV. RESULT AND DISCUSSION
As been told in methodology, this system focus on automation
and monitoring. The experiment on miniature model of the
project location have been conducted and running desired.
Fig. 10: Photo taken before the gate open
The photo shown the water level at the maximum point which
is the gate must be open so that the water can flow out.
Proceedings of 2017 Electrical Engineering Symposium (EES2017) - Vol. 1
76
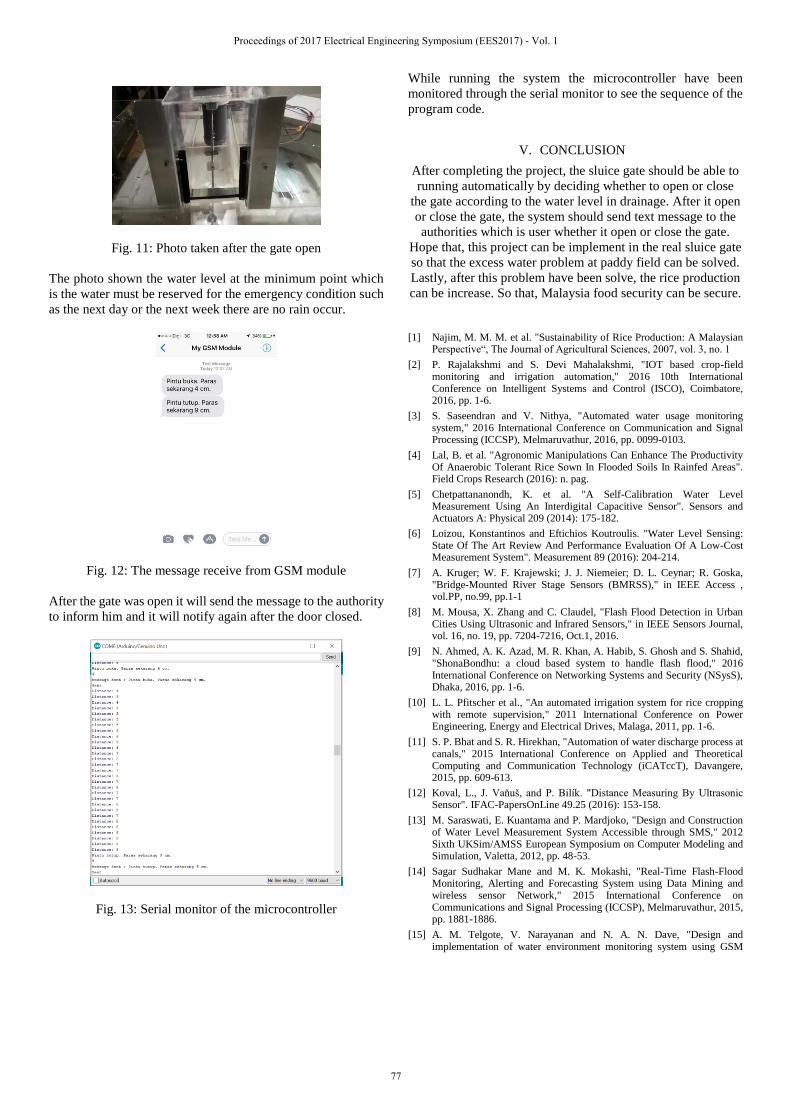
Fig. 11: Photo taken after the gate open
The photo shown the water level at the minimum point which
is the water must be reserved for the emergency condition such
as the next day or the next week there are no rain occur.
Fig. 12: The message receive from GSM module
After the gate was open it will send the message to the authority
to inform him and it will notify again after the door closed.
Fig. 13: Serial monitor of the microcontroller
While running the system the microcontroller have been
monitored through the serial monitor to see the sequence of the
program code.
V. CONCLUSION
After completing the project, the sluice gate should be able to
running automatically by deciding whether to open or close
the gate according to the water level in drainage. After it open
or close the gate, the system should send text message to the
authorities which is user whether it open or close the gate.
Hope that, this project can be implement in the real sluice gate
so that the excess water problem at paddy field can be solved.
Lastly, after this problem have been solve, the rice production
can be increase. So that, Malaysia food security can be secure.
[1] Najim, M. M. M. et al. "Sustainability of Rice Production: A Malaysian
Perspective“, The Journal of Agricultural Sciences, 2007, vol. 3, no. 1
[2] P. Rajalakshmi and S. Devi Mahalakshmi, "IOT based crop-field monitoring and irrigation automation," 2016 10th International Conference on Intelligent Systems and Control (ISCO), Coimbatore, 2016, pp. 1-6.
[3] S. Saseendran and V. Nithya, "Automated water usage monitoring system," 2016 International Conference on Communication and Signal Processing (ICCSP), Melmaruvathur, 2016, pp. 0099-0103.
[4] Lal, B. et al. "Agronomic Manipulations Can Enhance The Productivity Of Anaerobic Tolerant Rice Sown In Flooded Soils In Rainfed Areas". Field Crops Research (2016): n. pag.
[5] Chetpattananondh, K. et al. "A Self-Calibration Water Level Measurement Using An Interdigital Capacitive Sensor". Sensors and Actuators A: Physical 209 (2014): 175-182.
[6] Loizou, Konstantinos and Eftichios Koutroulis. "Water Level Sensing: State Of The Art Review And Performance Evaluation Of A Low-Cost Measurement System". Measurement 89 (2016): 204-214.
[7] A. Kruger; W. F. Krajewski; J. J. Niemeier; D. L. Ceynar; R. Goska, "Bridge-Mounted River Stage Sensors (BMRSS)," in IEEE Access , vol.PP, no.99, pp.1-1
[8] M. Mousa, X. Zhang and C. Claudel, "Flash Flood Detection in Urban Cities Using Ultrasonic and Infrared Sensors," in IEEE Sensors Journal, vol. 16, no. 19, pp. 7204-7216, Oct.1, 2016.
[9] N. Ahmed, A. K. Azad, M. R. Khan, A. Habib, S. Ghosh and S. Shahid, "ShonaBondhu: a cloud based system to handle flash flood," 2016 International Conference on Networking Systems and Security (NSysS), Dhaka, 2016, pp. 1-6.
[10] L. L. Pfitscher et al., "An automated irrigation system for rice cropping with remote supervision," 2011 International Conference on Power Engineering, Energy and Electrical Drives, Malaga, 2011, pp. 1-6.
[11] S. P. Bhat and S. R. Hirekhan, "Automation of water discharge process at canals," 2015 International Conference on Applied and Theoretical Computing and Communication Technology (iCATccT), Davangere, 2015, pp. 609-613.
[12] Koval, L., J. Vaňuš, and P. Bilík. "Distance Measuring By Ultrasonic Sensor". IFAC-PapersOnLine 49.25 (2016): 153-158.
[13] M. Saraswati, E. Kuantama and P. Mardjoko, "Design and Construction of Water Level Measurement System Accessible through SMS," 2012 Sixth UKSim/AMSS European Symposium on Computer Modeling and Simulation, Valetta, 2012, pp. 48-53.
[14] Sagar Sudhakar Mane and M. K. Mokashi, "Real-Time Flash-Flood Monitoring, Alerting and Forecasting System using Data Mining and wireless sensor Network," 2015 International Conference on Communications and Signal Processing (ICCSP), Melmaruvathur, 2015, pp. 1881-1886.
[15] A. M. Telgote, V. Narayanan and N. A. N. Dave, "Design and implementation of water environment monitoring system using GSM
Proceedings of 2017 Electrical Engineering Symposium (EES2017) - Vol. 1
77

technology," 2015 International Conference on Technologies for Sustainable Development (ICTSD), Mumbai, 2015, pp. 1-4.
[16] M. Saraswati, E. Kuantama and P. Mardjoko, "Design and Construction of Water Level Measurement System Accessible through SMS," 2012 Sixth UKSim/AMSS European Symposium on Computer Modeling and Simulation, Valetta, 2012, pp. 48-53.
[17] Kuchekar, Nilesh D. "GSM Based Advanced Water Deployment System For Irrigation Using A Wireless Sensor Network & Android Mobile". International Journal of Electrical Electronics and Data Communication 3.8 (2015): n. pag.
[18] Suhasini, Chimata and Diwakar R. Marur. "Gsm And Wireless Sensor Network BASED Smart Automated Irrigation System". IJIREEICE 3.4 (2015): 50-53.
[19] A. M. Telgote, V. Narayanan and N. A. N. Dave, "Design and implementation of water environment monitoring system using GSM technology," 2015 International Conference on Technologies for Sustainable Development (ICTSD), Mumbai, 2015, pp. 1-4.
[20] S. Ibrahim, M. Soban, F. Akhtar and A. Muhammad, "Gate Automation for Closed Loop Control of Distributary Irrigation Canals in the Indus Basin," 2015 13th International Conference on Frontiers of Information Technology (FIT), Islamabad, 2015, pp. 341-346.
Proceedings of 2017 Electrical Engineering Symposium (EES2017) - Vol. 1
78
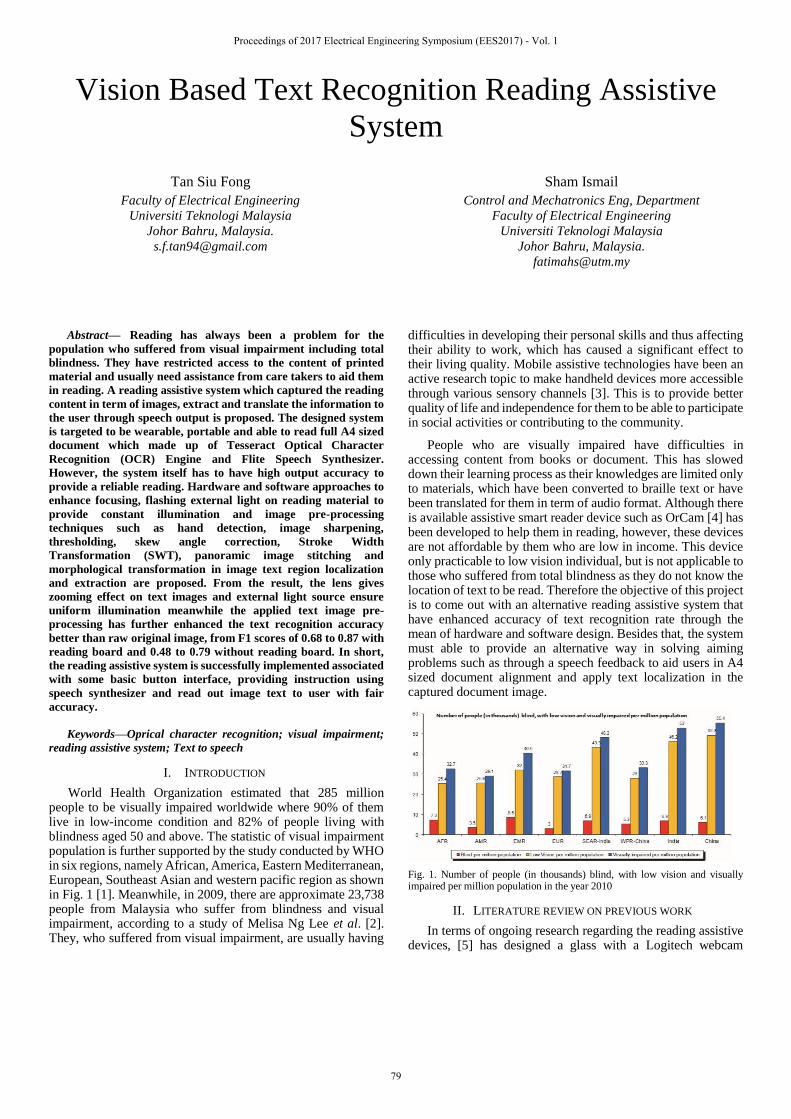
Vision Based Text Recognition Reading Assistive
System
Tan Siu Fong
Faculty of Electrical Engineering
Universiti Teknologi Malaysia
Johor Bahru, Malaysia.
Sham Ismail
Control and Mechatronics Eng, Department
Faculty of Electrical Engineering
Universiti Teknologi Malaysia
Johor Bahru, Malaysia.
Abstract— Reading has always been a problem for the
population who suffered from visual impairment including total
blindness. They have restricted access to the content of printed
material and usually need assistance from care takers to aid them
in reading. A reading assistive system which captured the reading
content in term of images, extract and translate the information to
the user through speech output is proposed. The designed system
is targeted to be wearable, portable and able to read full A4 sized
document which made up of Tesseract Optical Character
Recognition (OCR) Engine and Flite Speech Synthesizer.
However, the system itself has to have high output accuracy to
provide a reliable reading. Hardware and software approaches to
enhance focusing, flashing external light on reading material to
provide constant illumination and image pre-processing
techniques such as hand detection, image sharpening,
thresholding, skew angle correction, Stroke Width
Transformation (SWT), panoramic image stitching and
morphological transformation in image text region localization
and extraction are proposed. From the result, the lens gives
zooming effect on text images and external light source ensure
uniform illumination meanwhile the applied text image pre-
processing has further enhanced the text recognition accuracy
better than raw original image, from F1 scores of 0.68 to 0.87 with
reading board and 0.48 to 0.79 without reading board. In short,
the reading assistive system is successfully implemented associated
with some basic button interface, providing instruction using
speech synthesizer and read out image text to user with fair
accuracy.
Keywords—Oprical character recognition; visual impairment;
reading assistive system; Text to speech
I. INTRODUCTION
World Health Organization estimated that 285 million people to be visually impaired worldwide where 90% of them live in low-income condition and 82% of people living with blindness aged 50 and above. The statistic of visual impairment population is further supported by the study conducted by WHO in six regions, namely African, America, Eastern Mediterranean, European, Southeast Asian and western pacific region as shown in Fig. 1 [1]. Meanwhile, in 2009, there are approximate 23,738 people from Malaysia who suffer from blindness and visual impairment, according to a study of Melisa Ng Lee et al. [2]. They, who suffered from visual impairment, are usually having
difficulties in developing their personal skills and thus affecting their ability to work, which has caused a significant effect to their living quality. Mobile assistive technologies have been an active research topic to make handheld devices more accessible through various sensory channels [3]. This is to provide better quality of life and independence for them to be able to participate in social activities or contributing to the community.
People who are visually impaired have difficulties in accessing content from books or document. This has slowed down their learning process as their knowledges are limited only to materials, which have been converted to braille text or have been translated for them in term of audio format. Although there is available assistive smart reader device such as OrCam [4] has been developed to help them in reading, however, these devices are not affordable by them who are low in income. This device only practicable to low vision individual, but is not applicable to those who suffered from total blindness as they do not know the location of text to be read. Therefore the objective of this project is to come out with an alternative reading assistive system that have enhanced accuracy of text recognition rate through the mean of hardware and software design. Besides that, the system must able to provide an alternative way in solving aiming problems such as through a speech feedback to aid users in A4 sized document alignment and apply text localization in the captured document image.
Fig. 1. Number of people (in thousands) blind, with low vision and visually impaired per million population in the year 2010
II. LITERATURE REVIEW ON PREVIOUS WORK
In terms of ongoing research regarding the reading assistive devices, [5] has designed a glass with a Logitech webcam
Proceedings of 2017 Electrical Engineering Symposium (EES2017) - Vol. 1
79

capable of auto focusing to read text and product labelling from handheld objects. It solves the aiming problem through a motion based approach where user has to shake the handheld object to isolate interest object from background. It involves the uses of laptop as its data processing unit and for generating audio output. Meanwhile, [6] uses a scanner to scan physical A4 sized document into text images before performing the text extraction. The designed system included a scanner which is large in size and not to be wearable by the user. This has restricted the portability of the system. A Linux based operating system, namely the VimpyOS is used as the control unit in producing output on any VimpyOS compatible hardware. Finger Reader proposed by [7] introduced the use of wearable ring like devices on finger to read papers with printed text. Coupled with haptic feedback and real time auditory, it guides user to scan through text via vibration pulses generated by the vibration of the motor on the device. As the software is a standalone PC application, it is presumed that it involves a personal computer in processing. A high resolution mini video is in use during the finding. On the other hand, [8] allows skew text images detection up to ±15o and perform orientation correction by performing simple image rotation. It uses a web camera to capture the text images with Raspberry pi as the main processing unit.
A. Building Block of Reading Assistive System
From the review of finding by [5-12], it can be concluded that all of the related work which work on a reading assistive system consist 5 stages. Firstly, an image of text is captured through a text capturing devices such as a camera or scanner. After that, it undergoes pre-processing to detect and enhance the region of text before it is fed into an OCR Engine for text extraction. The extracted text is written as a file with an extension such as “.txt” where this file is then being read out by a speech synthesizer to the user.
B. OCR Engine
It is the engine that in charge of extracting text in capturing images and write the extracted content into a file to be used by a speech synthesizer. [8] uses Template matching with the ASCII value of recognized character as a method of character recognizing rather than using third party developed packages as the OCR Engine. Meanwhile [5] has tested OmniPage and ABBYReader closed source solutions and Tesseract as the open source solution in performing the text recognition and extraction. [7] also proposed the use of Tesseract as an image to text engine. Lastly, Cuneiform software packages is used by [6] to read printed text from images.
C. Speech synthesizer or Text To Speech
Speech synthesizer is used to read the text extracted output file from the OCR Engine and convert it into audio format by saving it into MP3 files or is directly read to the user. eSpeak software package is used as the Speech synthesizer in generating output audio by [8] & [6]. With laptop used as the data processing unit, [5] used Microsoft Speech Software Development kit to load files and play the text information to the user. The translation of text to speech is accomplished in [7] with the used of the Flite package as the Speech synthesizer.
D. Pre-Processing involved in text recognition
Text detection has been an important process, which depends muchly on content-based image analysis task [13] in a reading assistive system. The importance of pre-processing in enhancing text region by ensuring efficient foreground extraction has been stressed by [12]. An improved algorithm for background subtraction can reduce the effect of complex background must be implemented. As a reading assistive system emphasized the accuracy of speech translated text content, poor image quality such as uneven lighting, degradation and blurring can cause noise, therefore text in an image or video must be robustly detected before feeding to OCR Engine. Besides that, the performance of OCR drops drastically when applied to scene images. First, this is mostly due to OCR is designed for scanned text images and greatly depends on page segmentation to isolate text from background pixels. Second, natural scene images are captured under various imaging conditions which imposed noise, blur, occlusions. Therefore, text segmentation played an important role in providing great text recognition performance [14]. Sophisticated text reading system usually will employed page segmentation scheme to identify text regions in images, as this will help to reduce the time spent by OCR Engine in interpreting nontext item [15].
Text segmentation, text images enhancement and background subtraction can be categorized as the pre-processing of text images or scenes text. These pre-processing involves learning gradient features of stroke orientations and distributions using Adaboost model [5], using Matched Wavelets and MRF Model in locating text [16] and OTSU thresholding, morphological transformation in generating drawing contour which used to draw the bounding boxes for each character [15] before the extracted character is applied in the OCR Engine.
Stroke Width Transform (SWT) [14] transforms the image data from containing color values per pixel to containing the most likely stroke width of image pixel which likely to be a character in a natural scene. SWT proposed by this paper is robust where it's able to detect text regardless of its scale, direction, font or even language compared to traditional, dependable text detection such as different language character training model or matching in searching text region. With a local image operator combined with geometric reasoning can be used to recover text reliably. All the previous work proved that pre-processing and post processing is significant in implementing a reliable reading assistive system.
III. METHODOLOGY
Image of document must be taken before it can be read out, therefore fitting a full A4 size reading material in a camera view is difficult as there is a tradeoff between pixel containing character information and distance between the reading materials. Moreover, a low vision user might have problem to know the exact position of the document and the reading assistive device to fit in the full sized document. It is important that the output extracted text has to be accurate enough to provide reliable reading as the TTS engine read according to what has been extracted in the form of text. Therefore, the proposed method is used to address the text alignment, localization, and enhance the accuracy of text recognition rate through the mean of hardware and software design. To illustrate
Proceedings of 2017 Electrical Engineering Symposium (EES2017) - Vol. 1
80

the design, Raspberry pi 3 model B single board computer is used as the center processing unit which in charge of decision making meanwhile Raspberry pi camera will be used as text images capturing device. The overall system will consist of a wearable glass attached to the pi camera meanwhile a single board computer, earpiece, and some input switches for basic interaction with the device on a wearable arm wristed band. The chosen OCR Engine and speech synthesizer are Tesseract package and Festival package respectively. These packages are chosen due to their open sourced availability and they are still under active development by the developer community.
A. Hardware Design
As the pi camera is a low cost embedded camera which lack of auto focusing capability, certain degree reading glasses lens (diopter strength +1.00, +1.50, +2.00) is proposed to add in front of the camera to give a clearer focus in a shorter shooting distance. As the normal reading distance is usually within arm reachable range, lens with a fixed focal length can be calculated to give best focus and magnification to the document. 1 diopter is said to be lens with 1 meter focal length. For reading glasses, magnification increased as the focal length gets shorter whereby the magnification on reading lens is called diopter strength. Given a formula as in (1), it is known that diopter is the reciprocal of the focal length. However, this doesn’t necessarily mean small focal length is suitable for this application as focal length decreased, the document has to be within the focal length to give better focus, or else it will blur the image. Therefore, by assuming maximum reach of human arm to be 60 cm (0.6 meter), it gives +1.66 diopter approximate to +1.5 diopter to give focus plus magnification, which provide clear image within reading distance of 60 cm. With the diopter strength increased, the reading distance has to be decreased or place document closer to the camera. However, this calculation does not include the focal length of pi camera itself, so it is just a rough approximation.
Diopter = 1 / (Focal Length (meter)) (1)
Besides that, to provide consistent lighting during day and night, flashing of external light on reading material is proposed. The images of text are to be taken under the external light source to eliminate noise on text extraction due to nonuniform illumination on the captured documents. It also used to enhance the contrast between black colored text and printed paper’s background.
B. Software Design
Firstly, in order to fit the document into camera view, video streaming is started and user is requested by the system through speech instruction by Flite to center their document in front of them. This is done by ensuring both hand of user which are holding the document is inside the camera view. Therefore hand contour detection is used to extract user’s hand in YRCB color space as stated in [17]. This paper finding proposed different range of color code for different skin color where for normal skin color, hand is represented by [(0, 133, 77) to (255, 173, 127)] in a YRCB image. However, object which shares the same color code as our hand tends to make the image noisy. Therefore, each contour is filtered by its area and solidity whereby contours that fulfilled certain properties as hand is differentiated from nonhand object. By taking both sides and bottom of camera view
as reference as shown in Fig. 2, user is given instruction to align the document in a left to right motion until both hands is fit into both sides view, then the user is prompted again to align the document in a top to bottom manner until the hand contour is fit in the bottom reference zone. After alignment is done, video streaming is stopped and an image is captured as shown in Fig. 2. In order to further provide uniform light illumination, external light source is flashed during the document capturing interval.
Fig. 2. Line drawn in green is the system reference for document alignment through hand contour detection (left) and image taken after video streaming is stopped (right)
The operation of capturing images is applied with a pre-set parameter named sharpness in pi camera setting. Sharpness is defined as the boundaries between zone of different tones in images where their boundaries are usually crisp step and clearly seen (not blur). From the available scale of -100 to 100, sharpness of 100 is applied to provide clearer text character boundaries throughout the capturing of images. However, from Fig. 2 it is obvious that only part of the document is being captured. Problem arises when it comes to take full view of document while maintaining the high amount pixels content of a character. To issue this problem, two images are to be taken; one on the top edge of the document, and another taken on bottom edge of the document as shown in Fig. 3. The two images are then stitched together to produce a panoramic image of a full sized document. Prior to the stitching, both original images will undergo grayscale conversion, thresholding, Laplacian edge operator, edge enhancement and morphological filtering to produce two binary images. This is to prevent stitching two original images that might have different light exposure on background due to movement while aligning the document. Edge enhancement, dilation and erosion are used to maintain and preserve the text or character edge generate by Laplacian operator in the binary image. However, it is recommended to hold the document around the center edge of the document.
Fig. 3. Two reference (top and bottom) for system to captured two images that will be stitched into full document view
The effort in improving the output recognition rate is to emphasize on the pre-processing on text images before feeding the image to Tesseract OCR engine. Sequence of proposed method involved in the pre-processing is discussed. After getting the stitched binary image, foreground document has to
Proceedings of 2017 Electrical Engineering Symposium (EES2017) - Vol. 1
81

be isolated from noisy background. Canny edge detection and dilation is first applied to search for connecting contour that represent the document’s edge.
Text localization is to enable the system to automatically detect text region in the binary image and perform text segmentation for easy character recognition by the OCR Engine. SWT operator from [14] is used to perform this job through detecting character stroke width. This is to get Region of Interest (ROI) on character or text in the binary image. The ROIs obtained allow a mask to be created to mask out noncharacter region such as picture or nontext component. The pre-processing process ends with the use of parent rectangles to enclose segment of child rectangles or ROIs to produce a few bounding rectangle that eventually being used to crop text regions from the background.
Pre-processed image is then feed into the Tesseract OCR engine to extract text from an image. The recognized text in image is split into sentences by using an appropriate delimiter to indicate the end of sentences such as the full stop, exclamation mark, question mark and etc. The text is splited into sentences, this made the speech playback, fast forwarding and pausing possible with button interfaces to adjust according to the individual preference. The system also incorporated volume control button and some logic to initiate the system again after the process ended.
IV. RESULT AND DISCUSSION
The prototype is being worn as shown in Fig. 4. The samples are being categorized as document placed on reading board and document without reading board where accuracy rate is being compared and discussed. As part of document edge will be occluded by user’s hand, the purpose of reading board is to enhance the document edge; if the edge is nicely detected, hence allow perspective transformation to take place else the document undergoes skew detection and correction. This is to compare the method being used and how they affect the document on a noisy background. The sample as shown in Fig. 4 to identify the effect of addition of reading lenses, flashing of external light source and application of pre-processing on the accuracy of text recognition. The reading glasses lens of +1.5 diopter strength is identified physically to give the best zooming effect under the raspberry pi Camera.
Fig. 4. Reading assistive system prototype being worn by user (left) and created sample text (right)
The proposed method through hand contour detection is shown in Fig. 5, which then speech instruction given by system to aid users in aiding document alignment in left-right motion, the document is fitted inside both sides of camera view. Meanwhile, the stitching of two images taken at bottom and top
of document has successfully captured the full A4 sized document. To provide consistent comparison, stitched binary image are chosen as the original image to be compared in this section. The representation for the image labelling is described as follows:
vBorder represent image taken with reading board while noBorder represent image taken with absent of reading board
original represent image taken without any presence of flash light, added reading lens and pre-processing
vProcessing represent image taken without any presence of flash light, added reading lens but with pre-processing
vLightLens represent image captured under the presence of flash light and added reading lens with pre-processing
Fig. 5. Aligned document and stitched image showing full sized document
A. Qualitative analysis
This section covers observational analysis of the proposed method on hardware design and software design based on the captured image and OCR extracted text file respectively. The effect of flashing light and added +1.5 diopter reading lens when capturing document is compared as in Table I based on Fig. 6.
TABLE I. OBSERVATIONAL RESULT COMPARISON BETWEEN ORIGINAL
IMAGE AND IMAGE CAPTURED WITH LIGHT PLUS READING LENS
Remarks on captured sample text image
Original image capture
under normal condition
The image looked blur and not clear. The
character edges are less striking and loses focus.
Image captured under
presence of light and added reading lens
The captured image looks brighter and the
contrast between black and white color tones is more obvious. The added reading lens is more
obvious to be seen on sentences.
Fig. 6. Original image (left) and image captured under presence of light and added reading lens (right)
B. Quantitative analysis
From the extracted text file, the qualitative analysis is illustrated directly by comparing the output of extracted text from each of the proposed methods. As some of the proposed method produce almost similar recognition text output, in order to provide a more descriptive analysis, quantitative analysis is
Proceedings of 2017 Electrical Engineering Symposium (EES2017) - Vol. 1
82
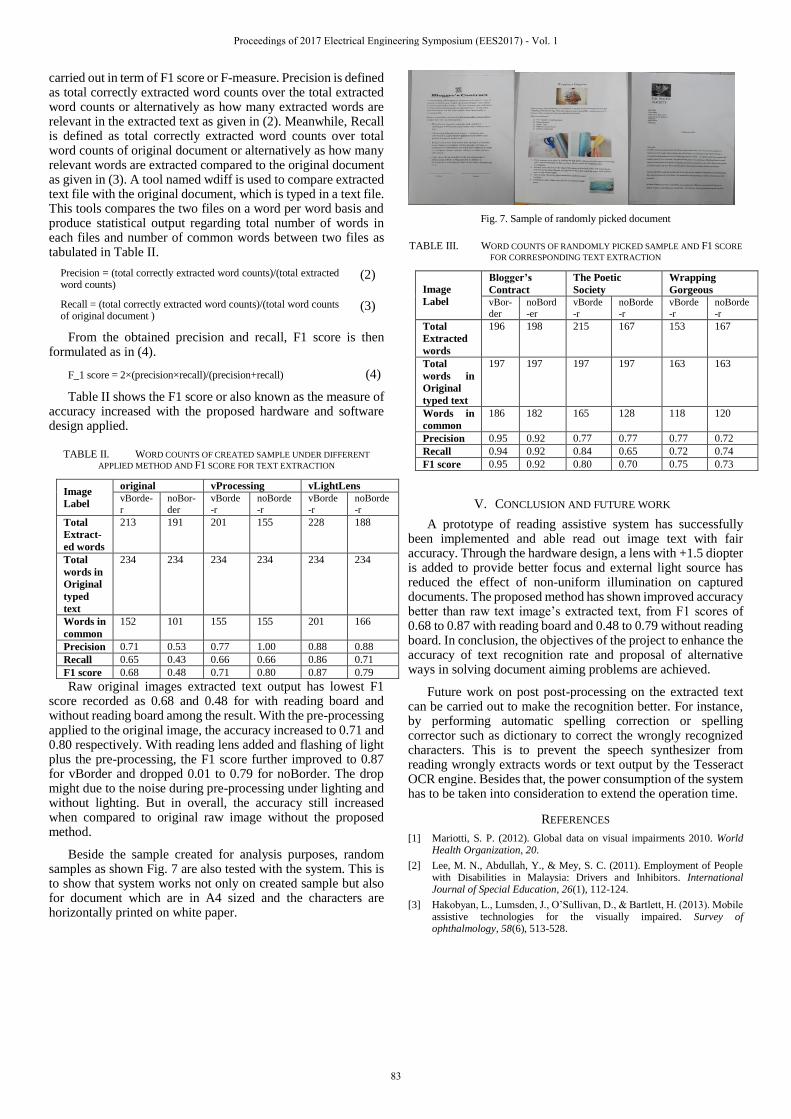
carried out in term of F1 score or F-measure. Precision is defined as total correctly extracted word counts over the total extracted word counts or alternatively as how many extracted words are relevant in the extracted text as given in (2). Meanwhile, Recall is defined as total correctly extracted word counts over total word counts of original document or alternatively as how many relevant words are extracted compared to the original document as given in (3). A tool named wdiff is used to compare extracted text file with the original document, which is typed in a text file. This tools compares the two files on a word per word basis and produce statistical output regarding total number of words in each files and number of common words between two files as tabulated in Table II.
Precision = (total correctly extracted word counts)/(total extracted word counts)
(2)
Recall = (total correctly extracted word counts)/(total word counts of original document )
(3)
From the obtained precision and recall, F1 score is then formulated as in (4).
F_1 score = 2×(precision×recall)/(precision+recall) (4)
Table II shows the F1 score or also known as the measure of accuracy increased with the proposed hardware and software design applied.
TABLE II. WORD COUNTS OF CREATED SAMPLE UNDER DIFFERENT
APPLIED METHOD AND F1 SCORE FOR TEXT EXTRACTION
Image
Label
original vProcessing vLightLens vBorde-
r
noBor-
der
vBorde
-r
noBorde
-r
vBorde
-r
noBorde
-r
Total
Extract-
ed words
213 191 201 155 228 188
Total
words in
Original
typed
text
234 234 234 234 234 234
Words in
common 152 101 155 155 201 166
Precision 0.71 0.53 0.77 1.00 0.88 0.88
Recall 0.65 0.43 0.66 0.66 0.86 0.71
F1 score 0.68 0.48 0.71 0.80 0.87 0.79
Raw original images extracted text output has lowest F1 score recorded as 0.68 and 0.48 for with reading board and without reading board among the result. With the pre-processing applied to the original image, the accuracy increased to 0.71 and 0.80 respectively. With reading lens added and flashing of light plus the pre-processing, the F1 score further improved to 0.87 for vBorder and dropped 0.01 to 0.79 for noBorder. The drop might due to the noise during pre-processing under lighting and without lighting. But in overall, the accuracy still increased when compared to original raw image without the proposed method.
Beside the sample created for analysis purposes, random samples as shown Fig. 7 are also tested with the system. This is to show that system works not only on created sample but also for document which are in A4 sized and the characters are horizontally printed on white paper.
Fig. 7. Sample of randomly picked document
TABLE III. WORD COUNTS OF RANDOMLY PICKED SAMPLE AND F1 SCORE
FOR CORRESPONDING TEXT EXTRACTION
Image
Label
Blogger’s
Contract The Poetic
Society Wrapping
Gorgeous vBor-
der
noBord
-er
vBorde
-r
noBorde
-r
vBorde
-r
noBorde
-r
Total
Extracted
words
196 198 215 167 153 167
Total
words in
Original
typed text
197 197 197 197 163 163
Words in
common 186 182 165 128 118 120
Precision 0.95 0.92 0.77 0.77 0.77 0.72
Recall 0.94 0.92 0.84 0.65 0.72 0.74
F1 score 0.95 0.92 0.80 0.70 0.75 0.73
V. CONCLUSION AND FUTURE WORK
A prototype of reading assistive system has successfully been implemented and able read out image text with fair accuracy. Through the hardware design, a lens with +1.5 diopter is added to provide better focus and external light source has reduced the effect of non-uniform illumination on captured documents. The proposed method has shown improved accuracy better than raw text image’s extracted text, from F1 scores of 0.68 to 0.87 with reading board and 0.48 to 0.79 without reading board. In conclusion, the objectives of the project to enhance the accuracy of text recognition rate and proposal of alternative ways in solving document aiming problems are achieved.
Future work on post post-processing on the extracted text can be carried out to make the recognition better. For instance, by performing automatic spelling correction or spelling corrector such as dictionary to correct the wrongly recognized characters. This is to prevent the speech synthesizer from reading wrongly extracts words or text output by the Tesseract OCR engine. Besides that, the power consumption of the system has to be taken into consideration to extend the operation time.
REFERENCES
[1] Mariotti, S. P. (2012). Global data on visual impairments 2010. World Health Organization, 20.
[2] Lee, M. N., Abdullah, Y., & Mey, S. C. (2011). Employment of People with Disabilities in Malaysia: Drivers and Inhibitors. International Journal of Special Education, 26(1), 112-124.
[3] Hakobyan, L., Lumsden, J., O’Sullivan, D., & Bartlett, H. (2013). Mobile assistive technologies for the visually impaired. Survey of ophthalmology, 58(6), 513-528.
Proceedings of 2017 Electrical Engineering Symposium (EES2017) - Vol. 1
83
[4] Wexler, Y., Shashua, A., Tadmor, O., & Ehrlich, I. (2013). U.S. Patent Application No. 13/914,792.
[5] Yi, C., Tian, Y., & Arditi, A. (2014). Portable camera-based assistive text and product label reading from hand-held objects for blind persons. IEEE/ASME Transactions On Mechatronics, 19(3), 808-817.
[6] Tripathy, A., Pathak, A., Rodrigues, A., & Chaudhari, C. (2012, October). VIMPY—A Yapper for the visually impaired. In Information and Communication Technologies (WICT), 2012 World Congress on (pp. 167-172). IEEE.
[7] Shilkrot, R., Huber, J., Liu, C., Maes, P., & Nanayakkara, S. C. (2014, April). FingerReader: a wearable device to support text reading on the go. In CHI'14 Extended Abstracts on Human Factors in Computing Systems (pp. 2359-2364). ACM.
[8] Velmurugan, D., Sonam, M.S., Umamaheswari, S., Parthasarathy, S & Arun, K.R. (2016, March). A Smart Reader for Visually Impaired People Using Raspberry PI. International Journal of Engineering Science & Computing, 6(3), 2997-3001. doi:10.4010/2016.699
[9] Hassan, E. A., & Tang, T. B. (2016, July). Smart Glasses for the Visually Impaired People. In International Conference on Computers Helping People with Special Needs (pp. 579-582). Springer International Publishing.
[10] Pégeot, F., & Goto, H. (2012, November). Scene text detection and tracking for a camera-equipped wearable reading assistant for the blind. In Asian Conference on Computer Vision (pp. 454-463). Springer Berlin Heidelberg.
[11] Yi, C., & Tian, Y. (2015). Assistive Text Reading from Natural Scene for Blind Persons. In Mobile Cloud Visual Media Computing (pp. 219-241). Springer International Publishing.
[12] Nagaraja, L., Nithin, D., Nagarjun, R. S., Murthy, V. S., & Anand, N. M. Vision based text recognition using raspberry PI. In National Conference on Power Systems & Industrial Automation (NCPSIA 2015).
[13] Liu, J., Su, H., Yi, Y., & Hu, W. (2016). Robust text detection via multi-degree of sharpening and blurring. Signal Processing, 124, 259-265.
[14] Epshtein, B., Ofek, E., & Wexler, Y. (2010, June). Detecting text in natural scenes with stroke width transform. In Computer Vision and Pattern Recognition (CVPR), 2010 IEEE Conference on (pp. 2963-2970). IEEE.
[15] Wu, V., Manmatha, R., & Riseman, E. M. (1999). Textfinder: An automatic system to detect and recognize text in images. IEEE Transactions on pattern analysis and machine intelligence, 21(11), 1224-1229.
[16] Kumar, S., Gupta, R., Khanna, N., Chaudhury, S., & Joshi, S. D. (2007). Text extraction and document image segmentation using matched wavelets and MRF model. IEEE Transactions on Image Processing, 16(8), 2117-2128.
[17] Chai, D., & Ngan, K. N. (1999). Face segmentation using skin-color map in videophone applications. IEEE Transactions on circuits and systems for video technology, 9(4), 551-564.
Proceedings of 2017 Electrical Engineering Symposium (EES2017) - Vol. 1
84

Convolutional Neural Network For Optimal
Pineapple Harvesting
Ahmad Aizuddin bin Azman
Faculty of Electrical Engineering
Universiti Teknologi Malaysia
Johor Bahru, Malaysia.
Fatimah Sham Ismail
Control & Mechatronic Engineering Department (CMED),
Faculty of Electrical Engineering
Universiti Teknologi Malaysia
Johor Bahru, Malaysia.
Abstract— Pineapple ripeness can be divided into seven stages
of maturity indices. Upon ripening, pineapple’s peel gradually
changes colour from green to yellowish, which spreading from
bottom to the top. Conventional method of inspection is prone to
human errors as it is done manually by farmers with different
knowledge and experience. This project proposes new intelligent
method using convolutional neural network (CNN) that has the
ability to learn unique features from the given task automatically
through supervised learning. The simulation results show that
the method achieved 100% classification’s accuracy for
determining unripe and fully ripe level and 82% accuracy for
partially ripe level.
Keywords—convolutional neural network(CNN); pineapple
ripeness classification; python programming language; keras
I. INTRODUCTION
First Convolutional Neural Network has been introduced to public in early 1990 by LeCun [1] for handwritten zip code recognition trained using backpropagation. To this date, CNN has been widely implemented for multiple task recognition task, such as action recognition [2], object recognition [3], detection of pedestrian [4], classification of traffic sign [5], face detection [6] and digit recognition [7] which have successfully show competitive result.
In Malaysia, Federal Agricultural Marketing Authority has been entrusted the duty to control and monitors the fruit production. The fruits will undergo a controlled standard process before being marketed to the public. The process of fruit quality inspection can be done either by FAMA or the farm owner who have a license called Self-Regulated by Regulated Entities (SRBRE) granted by FAMA [8]. However, the inspection is prone to human error due to different knowledge and experience.
Machine vision system has been widely practice for quality evaluation for automated sorting and grading system in agricultural sector. Hence, with the assist of vision system, assessment of pineapple maturity will be more accurate. Moreover, the labor cost can be reduced and the production rate will be maximized. Therefore, the main objective of this project is to develop a CNN for pineapple system’s classification for having automated pineapple sorting and grading system using python language with ‘Keras’ library.
II. PINEAPPLE RIPENESS
A. Pineapple’s Maturity
Pineapple ripeness can be distinguished based on the external view skin’s color. The maturity is divided into seven stages based on the exhibited color of pineapple’s peel. Fig. 1, shows the different type of pineapple maturity based on FAMA’s guideline [8]. Table I shows the ripeness level based on the index maturity.
Fig. 1. Different index of pineapple maturity.
TABLE I. Ripeness level with corresponding index of maturity.
Level of ripeness Index of maturity
Unripe 1,2
Partially Ripe 3,4,5
Fully ripe 6,7
Proceedings of 2017 Electrical Engineering Symposium (EES2017) - Vol. 1
85
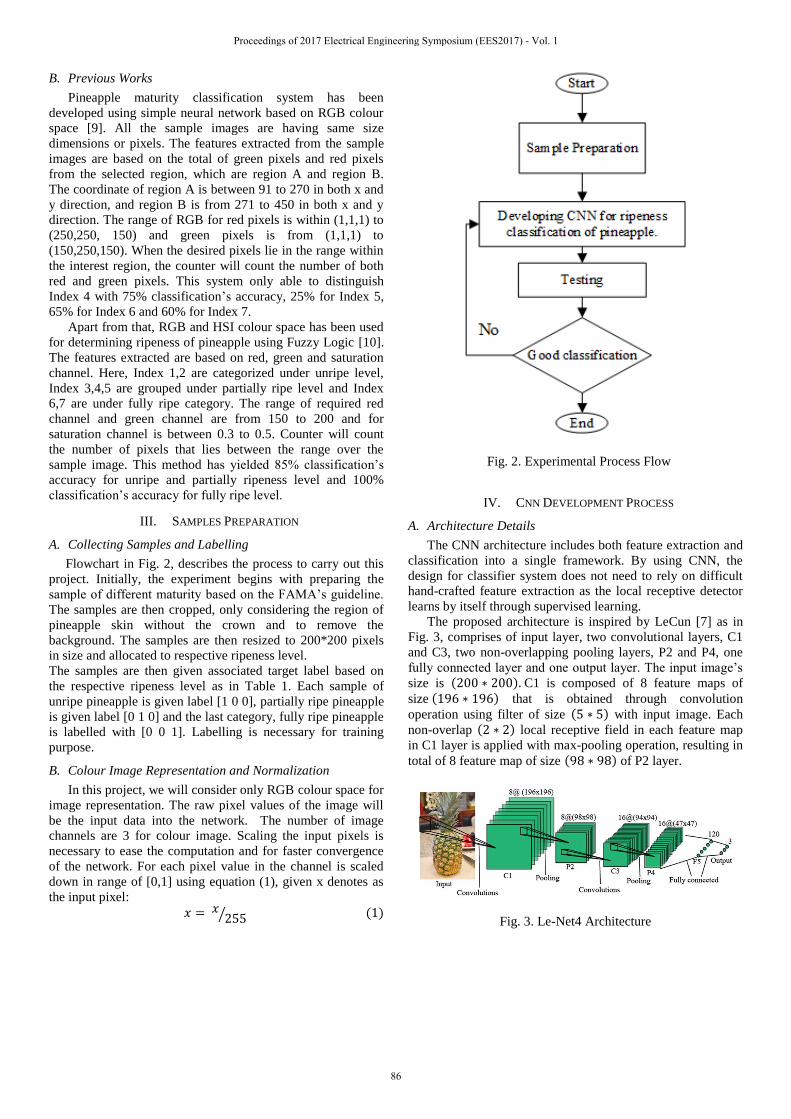
B. Previous Works
Pineapple maturity classification system has been
developed using simple neural network based on RGB colour
space [9]. All the sample images are having same size
dimensions or pixels. The features extracted from the sample
images are based on the total of green pixels and red pixels
from the selected region, which are region A and region B.
The coordinate of region A is between 91 to 270 in both x and
y direction, and region B is from 271 to 450 in both x and y
direction. The range of RGB for red pixels is within (1,1,1) to
(250,250, 150) and green pixels is from (1,1,1) to
(150,250,150). When the desired pixels lie in the range within
the interest region, the counter will count the number of both
red and green pixels. This system only able to distinguish
Index 4 with 75% classification’s accuracy, 25% for Index 5,
65% for Index 6 and 60% for Index 7.
Apart from that, RGB and HSI colour space has been used
for determining ripeness of pineapple using Fuzzy Logic [10].
The features extracted are based on red, green and saturation
channel. Here, Index 1,2 are categorized under unripe level,
Index 3,4,5 are grouped under partially ripe level and Index
6,7 are under fully ripe category. The range of required red
channel and green channel are from 150 to 200 and for
saturation channel is between 0.3 to 0.5. Counter will count
the number of pixels that lies between the range over the
sample image. This method has yielded 85% classification’s
accuracy for unripe and partially ripeness level and 100%
classification’s accuracy for fully ripe level.
III. SAMPLES PREPARATION
A. Collecting Samples and Labelling
Flowchart in Fig. 2, describes the process to carry out this
project. Initially, the experiment begins with preparing the
sample of different maturity based on the FAMA’s guideline.
The samples are then cropped, only considering the region of
pineapple skin without the crown and to remove the
background. The samples are then resized to 200*200 pixels
in size and allocated to respective ripeness level.
The samples are then given associated target label based on
the respective ripeness level as in Table 1. Each sample of
unripe pineapple is given label [1 0 0], partially ripe pineapple
is given label [0 1 0] and the last category, fully ripe pineapple
is labelled with [0 0 1]. Labelling is necessary for training
purpose.
B. Colour Image Representation and Normalization
In this project, we will consider only RGB colour space for
image representation. The raw pixel values of the image will
be the input data into the network. The number of image
channels are 3 for colour image. Scaling the input pixels is
necessary to ease the computation and for faster convergence
of the network. For each pixel value in the channel is scaled
down in range of [0,1] using equation (1), given x denotes as
the input pixel:
𝑥 = 𝑥255⁄ (1)
Fig. 2. Experimental Process Flow
IV. CNN DEVELOPMENT PROCESS
A. Architecture Details
The CNN architecture includes both feature extraction and
classification into a single framework. By using CNN, the
design for classifier system does not need to rely on difficult
hand-crafted feature extraction as the local receptive detector
learns by itself through supervised learning.
The proposed architecture is inspired by LeCun [7] as in
Fig. 3, comprises of input layer, two convolutional layers, C1
and C3, two non-overlapping pooling layers, P2 and P4, one
fully connected layer and one output layer. The input image’s
size is (200 ∗ 200). C1 is composed of 8 feature maps of
size (196 ∗ 196) that is obtained through convolution
operation using filter of size (5 ∗ 5) with input image. Each
non-overlap (2 ∗ 2) local receptive field in each feature map
in C1 layer is applied with max-pooling operation, resulting in
total of 8 feature map of size (98 ∗ 98) of P2 layer.
Fig. 3. Le-Net4 Architecture
Proceedings of 2017 Electrical Engineering Symposium (EES2017) - Vol. 1
86

C3 layer is composed of 16 feature maps of size (94 ∗ 94)
resulting in convolution operation using (5 ∗ 5) filter with
previous feature maps. Layer P4 has 16 feature maps of size
(47 ∗ 47), which each unit in feature map of layer P4 is
connected to non-overlap local receptive field of size (2 ∗ 2)
in the corresponding feature map of C3.
All the multi stage feature maps are then fully connected to
120 neurons in F5 layer. Here, a dropout function with a rate
value of 0.25 is introduced in F5 layer. Both convolutional
layers and the fully connected layer will be passed to ReLu
activation function, in order to introduce non-linearity in the
network.
Neurons of F5 layer are then fully connected to output
layer. Output layer will consist of 3 neurons corresponding to
the number of classification. Softmax activation function is
applied to each unit in output layer by squashing the highest
output value amongst the units in output layer to ‘1’ and
suppressing the rest to ‘0’. Highest probability value gives the
predicted class.
Basically, the CNN tries to find the correct weight value
that gives the minimal error between the targeted/labelled
output and predicted output for every iteration in an epoch.
B. Learning Process
The dataset is divided into two, which are training sample
and validation sample. 90% of samples corresponding to 243
samples are used for training the network and 27 samples as
validation samples. The batch size chosen is 27 for each
iteration, specifically, an iteration process consist of forward
propagation and backward propagation.
Throughout the training process, the weight and bias are
updated frequently during back-propagation by calculating the
gradient of loss function with respect to the weights in all
layers (gradient descent) using normalizer algorithm. A loss
function measures the discrepancy between desired output of
the image and probability output of the system.
The trainable parameters (weights and biases) are trained
using back-propagation algorithm which is ‘adadelta’ function
with learning rate 1.0 on training samples in randomized
order. Hence, the gradient will update the trainable parameter
9 times for every epoch with ‘categorical-cross entropy’ used
as the loss function.
The network will be trained for 100 epochs. For every
epoch, the classifier system is tested on validation sample to
observe the accuracy and loss. Early stopping during training
is applied whenever the network stops learning any new
features.
C. System’s Performance on Classification
Initially, validation samples are used to obtain the
confusion matrix of the chosen network in order to visualize
precision of individual ripeness level. Next, the network is
tested on the random images which are not from either
training dataset and validation set to determine the reliability
of the network.
V. RESULT AND DISCUSSION
A. Learning Process
In this project, the early stopping criterion is based on the
validation loss. Fig. 4, shows the graph of ‘training loss versus
validation loss’. From observation, after 30th epoch, both training loss and
validation loss has slight converging. The reason to this
problem is the network has stopped learning any new features.
At such state the training and validation performance should
both become stationary distributions and the optimal value
should occur with uniform probability anywhere between the
epochs in which local optimum is reached and infinity. Hence,
the training is stopped at 40th epoch to avoid overfitting.
The proposed network has yielded an accuracy of 92.6% in
classification of pineapple ripeness and 0.09 categorical cross
entropy error. Specifically, lower categorical cross entropy
error tells the difference between targeted label and predicted
output is small.
Fig. 4. Training loss versus validation for 40 epochs of
training.
B. System’s Performance on Classification
The yielded accuracy of the network is based on the
classification of the validation sample. A total of 27 samples
consists of 8 samples of unripe category, 9 samples of partially
ripe category and 10 samples of fully ripe category are used on
the performance of system’s classification evaluation of the
proposed network.
The summary of prediction results on validation sample
for RGB color space are shown in confusion matrix as in
Table II. Confusion matrix is used to visualize the precision
of each individual ripeness category. Here, precision
intuitively describes the ability of the classifier not to label
negative sample as positive.
Proceedings of 2017 Electrical Engineering Symposium (EES2017) - Vol. 1
87

TABLE II. Confusion Matrix
Ripeness
Level Unripe
Partially
ripe
Fully
ripe Precision
Unripe 8 0 0 1.00
Partially
ripe 0 9 0 0.82
Fully ripe 0 2 8 1.00
Average Precision 0.94
Based on Table II, the proposed network has lowest
precision, 0.82 for determining the partially ripe category,
compared to unripe category and fully ripe category. Out of 10
fully ripe samples, 2 of them is classified wrongly under
partially ripe category. All the samples from unripe category
and partially ripe category are categorized correctly, yielding
1.00 accuracy.
From the confusion matrix, we may say that the proposed
system has outperformed [10] in classification’s accuracy for
unripe ripeness level with 7.5% improvement. On contrary,
classification for partially ripe level has shown 1.5% increase
in error. Both systems have 100% classification’s accuracy of
fully ripe level. Using CNN approach still produces
competitive result even without the use of hand-engineered
feature extraction and selection.
The CNN predicts the ripeness of pineapple by yielding the
percentage of probability as shown in Table III. Based on
Table III, both unripe category and fully ripe category, each
category yielded 99% and 98% accuracy in average. On other
hand, partially ripe category yielded 93% accuracy in average.
This is due to the proposed network has lowest precision when
determining the partially ripe category.
TABLE III. Output probability of random sample.
Category Sample Image Output Probability
Unripe
Partially
ripe
Fully
ripe
CONCLUSION
In conclusion, FAMA’s guideline for distinguishing
different maturity of pineapple has been used as the
benchmark for preparing the sample images in this project.
Besides that, the use of Convolutional Neural Network by
Keras for classifying the pineapple into 3 main categories
which are unripe, partially ripe, fully ripe has been
demonstrated in this project. The analysis on the
classification’s performance of the proposed system has
showed competitive result even without difficult hand-
engineered feature extraction and selection.
In the future work, the designed classifier has to be make
more flexible and robust. The sample images used for training
have to be at good resolution and at varying environment's
condition, for example - light intensity such as morning,
evening, afternoon, night at different position. Moreover,
comparative performance using different colour space has to
be addressed too. Lastly, choosing appropriate optimizer and
learning rate are also necessary for smoothing the learning
process.
REFERENCES
[1] Y. LeCun, B. Boser, J. S. Denker, D. Henderson, R. E. Howard, W.
Hubbard, and L. D. Jackel, “Backpropagation applied to handwritten zip code recognition,” Neural Computation, vol. 1, no. 4, pp. 541–551, 1989.
[2] S. Ji, W. Xu, M. Yang, and K. Yu, “3D convolutional neural networks for human action recognition,” IEEE Transactions on Pattern Analysis and Machine Intelligence, vol. 35, no. 1, pp. 221–231, 2013.
[3] A. Krizhevsky, I. Sutskever, and G. Hinton, “ImageNet classification with deep convolutional neural networks,” in Advances in Neural Information Processing Systems, vol. 25, pp. 1106–1114, 2012,
Proceedings of 2017 Electrical Engineering Symposium (EES2017) - Vol. 1
88

[4] P. Sermanet and K. Kavukcuoglu, “Pedestrian detection with unsupervised multi-stage feature learning,” in International Conference on Computer Vision and Pattern Recognition, in press, 2013.
[5] D. Ciresan, U. Meier, J. Masci, and J. Schmidhuber, “A committee of neural networks for traffic sign classification,” in International Joint Conference on Neural Networks, pp. 1918–1921, 2011.
[6] M. Osadchy, Y. Cun, and M. Miller, “Synergistic face detection and pose estimation with energy-based models,” The Journal of Machine Learning Research, vol. 8, pp. 1197–1215, 2007.
[7] Y. LeCun, L. Bottou, Y. Bengio, and P. Haffner, “Gradient based learning applied to document recognition,” Proceedings of the IEEE, vol. 86, no. 11, pp. 2278–2324, 1998.
[8] FAMA, “Menuju kearah Kualiti Malaysia’s Best Siri Panduan Kualiti Nenas”, 2006.
[9] R. Shamsudin, W.R. Wan Daud, M.S Takrif, O. Hassan, S.M. Mustapha Kamal, and A.G.L. Abdullah, “Influence of Temperature and Soluble Solid Contents on Rheological Properties of the Josapine Variety of Pineapple Fruit (Ananas Comosus L.)”, International Journal of Engineering and Technology, vol. 4, pp. 213-220, 2007.
[10] J. I. Asnor, S. Rosnah, Z. W. H. Wan, and H. A. B. Badrul,” Pineapple Maturity Recognition Using RGB Extraction”,World Academy of Science,Engineering and Technology,vol.78 ,pp. 147-150 ,2013.
Proceedings of 2017 Electrical Engineering Symposium (EES2017) - Vol. 1
89
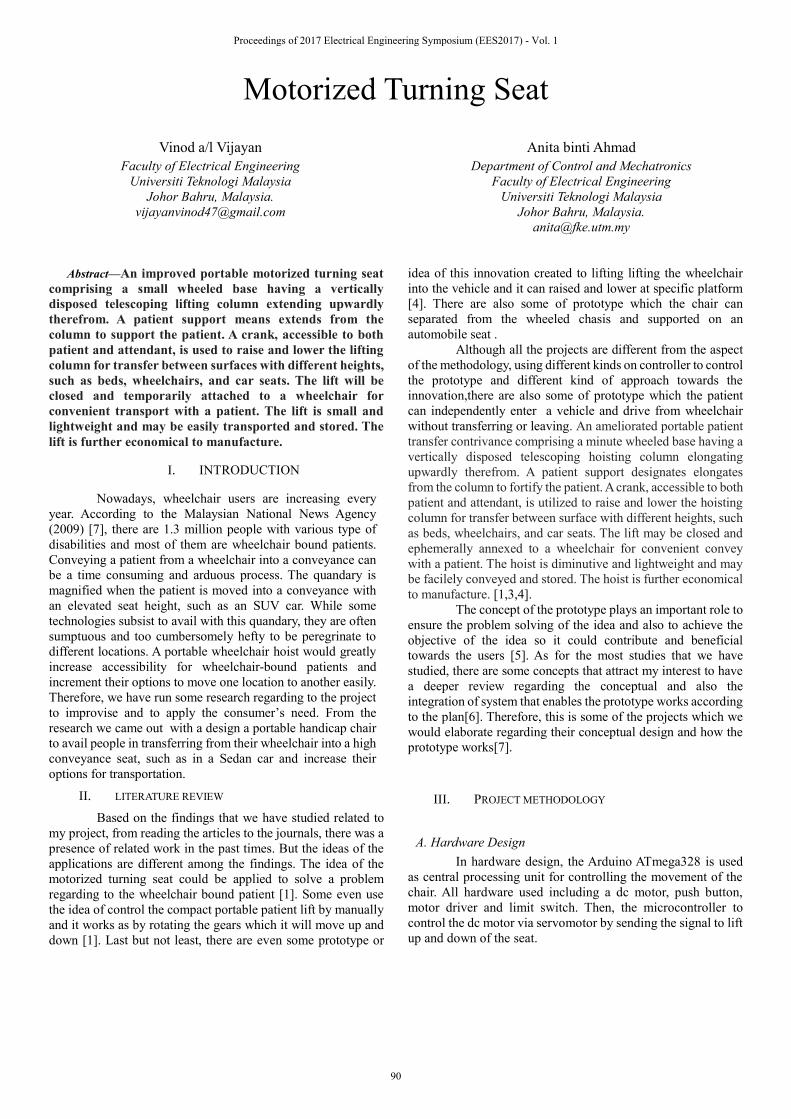
Motorized Turning Seat
Vinod a/l Vijayan
Faculty of Electrical Engineering
Universiti Teknologi Malaysia
Johor Bahru, Malaysia.
Anita binti Ahmad
Department of Control and Mechatronics
Faculty of Electrical Engineering
Universiti Teknologi Malaysia
Johor Bahru, Malaysia.
Abstract—An improved portable motorized turning seat
comprising a small wheeled base having a vertically
disposed telescoping lifting column extending upwardly
therefrom. A patient support means extends from the
column to support the patient. A crank, accessible to both
patient and attendant, is used to raise and lower the lifting
column for transfer between surfaces with different heights,
such as beds, wheelchairs, and car seats. The lift will be
closed and temporarily attached to a wheelchair for
convenient transport with a patient. The lift is small and
lightweight and may be easily transported and stored. The
lift is further economical to manufacture.
I. INTRODUCTION
Nowadays, wheelchair users are increasing every
year. According to the Malaysian National News Agency
(2009) [7], there are 1.3 million people with various type of
disabilities and most of them are wheelchair bound patients.
Conveying a patient from a wheelchair into a conveyance can
be a time consuming and arduous process. The quandary is
magnified when the patient is moved into a conveyance with
an elevated seat height, such as an SUV car. While some
technologies subsist to avail with this quandary, they are often
sumptuous and too cumbersomely hefty to be peregrinate to
different locations. A portable wheelchair hoist would greatly
increase accessibility for wheelchair-bound patients and
increment their options to move one location to another easily.
Therefore, we have run some research regarding to the project
to improvise and to apply the consumer’s need. From the
research we came out with a design a portable handicap chair
to avail people in transferring from their wheelchair into a high
conveyance seat, such as in a Sedan car and increase their
options for transportation.
II. LITERATURE REVIEW
Based on the findings that we have studied related to
my project, from reading the articles to the journals, there was a
presence of related work in the past times. But the ideas of the
applications are different among the findings. The idea of the
motorized turning seat could be applied to solve a problem
regarding to the wheelchair bound patient [1]. Some even use
the idea of control the compact portable patient lift by manually
and it works as by rotating the gears which it will move up and
down [1]. Last but not least, there are even some prototype or
idea of this innovation created to lifting lifting the wheelchair
into the vehicle and it can raised and lower at specific platform
[4]. There are also some of prototype which the chair can
separated from the wheeled chasis and supported on an
automobile seat .
Although all the projects are different from the aspect
of the methodology, using different kinds on controller to control
the prototype and different kind of approach towards the
innovation,there are also some of prototype which the patient
can independently enter a vehicle and drive from wheelchair
without transferring or leaving. An ameliorated portable patient
transfer contrivance comprising a minute wheeled base having a
vertically disposed telescoping hoisting column elongating
upwardly therefrom. A patient support designates elongates
from the column to fortify the patient. A crank, accessible to both
patient and attendant, is utilized to raise and lower the hoisting
column for transfer between surface with different heights, such
as beds, wheelchairs, and car seats. The lift may be closed and
ephemerally annexed to a wheelchair for convenient convey
with a patient. The hoist is diminutive and lightweight and may
be facilely conveyed and stored. The hoist is further economical
to manufacture. [1,3,4].
The concept of the prototype plays an important role to
ensure the problem solving of the idea and also to achieve the
objective of the idea so it could contribute and beneficial
towards the users [5]. As for the most studies that we have
studied, there are some concepts that attract my interest to have
a deeper review regarding the conceptual and also the
integration of system that enables the prototype works according
to the plan[6]. Therefore, this is some of the projects which we
would elaborate regarding their conceptual design and how the
prototype works[7].
III. PROJECT METHODOLOGY
A. Hardware Design
In hardware design, the Arduino ATmega328 is used
as central processing unit for controlling the movement of the
chair. All hardware used including a dc motor, push button,
motor driver and limit switch. Then, the microcontroller to
control the dc motor via servomotor by sending the signal to lift
up and down of the seat.
Proceedings of 2017 Electrical Engineering Symposium (EES2017) - Vol. 1
90

Fig 1: The overall development of hardware
B. Assemble Process
After all the hardware and components are prepared, it is the
time for the process of assembling the components to take
place. In this process of creating the prototype, there are 6 steps
that must be followed in order to ensure the best quality of the
product and an illustration is shown below. Also the elaboration
of the process of each step will be provided for a clearer picture
regarding the topic.
Fig 2: Flowchart in assembly process of the prototype
C. Software Implementation
In software development, Arduino software version
1.5.7 had been use to write a programming order to control the
dc motor movement by connect it at servomotor. It can move
up and down and also forward and backward by a limit. Besides
that, limit switch are used to limit the movement of the motor.
The push button are installed to allow the mechanism to start
and stop according to the height of the seat and bed. Finally, the
TeamViewer software had been used to make the network
communication between a server computer and a client
computer.This software is a free license for personal or non-
commercial use only where the communication can be done.
Fig 3: Arduino software had been used to write the
programme and upload to the Arduino board in order
to control the dc motor functionality.
IV. RESULTS
A. Mechanical Design
First and foremost, we design the mechanism of the
prototype using 3D CAD design Solidwork. Then I build it
using some materials based on my design. Figure 4 shows
the design of the motorized turning seat prototype. The
prototype also can be fold and portable to move one
location to another. Besides that, the prototype can be
placed into the car trunk without disassembly. Figure 5
shows the design of the prototype which can be fold.
Proceedings of 2017 Electrical Engineering Symposium (EES2017) - Vol. 1
91
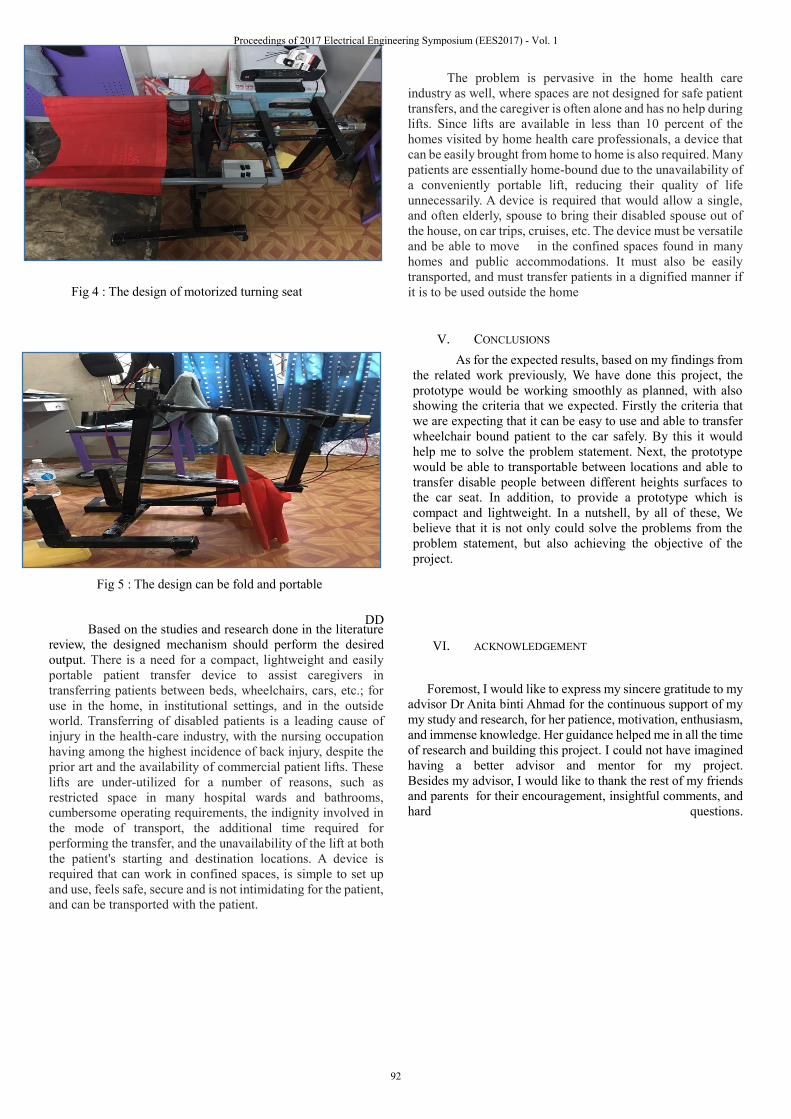
Fig 4 : The design of motorized turning seat
Fig 5 : The design can be fold and portable
Based on the studies and research done in the literature
review, the designed mechanism should perform the desired
output. There is a need for a compact, lightweight and easily
portable patient transfer device to assist caregivers in
transferring patients between beds, wheelchairs, cars, etc.; for
use in the home, in institutional settings, and in the outside
world. Transferring of disabled patients is a leading cause of
injury in the health-care industry, with the nursing occupation
having among the highest incidence of back injury, despite the
prior art and the availability of commercial patient lifts. These
lifts are under-utilized for a number of reasons, such as
restricted space in many hospital wards and bathrooms,
cumbersome operating requirements, the indignity involved in
the mode of transport, the additional time required for
performing the transfer, and the unavailability of the lift at both
the patient's starting and destination locations. A device is
required that can work in confined spaces, is simple to set up
and use, feels safe, secure and is not intimidating for the patient,
and can be transported with the patient.
The problem is pervasive in the home health care
industry as well, where spaces are not designed for safe patient
transfers, and the caregiver is often alone and has no help during
lifts. Since lifts are available in less than 10 percent of the
homes visited by home health care professionals, a device that
can be easily brought from home to home is also required. Many
patients are essentially home-bound due to the unavailability of
a conveniently portable lift, reducing their quality of life
unnecessarily. A device is required that would allow a single,
and often elderly, spouse to bring their disabled spouse out of
the house, on car trips, cruises, etc. The device must be versatile
and be able to move in the confined spaces found in many
homes and public accommodations. It must also be easily
transported, and must transfer patients in a dignified manner if
it is to be used outside the home
V. CONCLUSIONS
As for the expected results, based on my findings from
the related work previously, We have done this project, the
prototype would be working smoothly as planned, with also
showing the criteria that we expected. Firstly the criteria that
we are expecting that it can be easy to use and able to transfer
wheelchair bound patient to the car safely. By this it would
help me to solve the problem statement. Next, the prototype
would be able to transportable between locations and able to
transfer disable people between different heights surfaces to
the car seat. In addition, to provide a prototype which is
compact and lightweight. In a nutshell, by all of these, We
believe that it is not only could solve the problems from the
problem statement, but also achieving the objective of the
project.
DD
VI. ACKNOWLEDGEMENT
Foremost, I would like to express my sincere gratitude to my
advisor Dr Anita binti Ahmad for the continuous support of my
my study and research, for her patience, motivation, enthusiasm,
and immense knowledge. Her guidance helped me in all the time
of research and building this project. I could not have imagined
having a better advisor and mentor for my project.
Besides my advisor, I would like to thank the rest of my friends
and parents for their encouragement, insightful comments, and
hard questions.
Proceedings of 2017 Electrical Engineering Symposium (EES2017) - Vol. 1
92

REFERENCES
[1] Alexander Brandorff.,(2012 August 13).Compact
Portable Patient Lift,US 6,430,761 B1
[2] Rodvinon I,Zamotin.,(1987 January 2).Wheelchair
for transferring occupant to motor vehicle, US
[3]
4,669,943
Clifford I,Wolfe.,(1991 October 1).Wheelchair
lift and transfer system,US 5,052,879
[4] William B, Plewright.,(1989 June 20).Patient transfer
and conveying vehicle, US 4839933 A
[5] J Fowler.,(1973 January 13).Lift device, US 3710962
A
[6] http://www.ameriglide.com/item/ameriglide-325-
fp.html
[7] http://www.braunability.com/millennium.cfm
Proceedings of 2017 Electrical Engineering Symposium (EES2017) - Vol. 1
93
Low Cost Webcam based Color Sorting System
Mohamad Faezzudin Bin Ahmad Jaafar
Faculty of Electrical Engineering
Universiti Teknologi Malaysia
Johor Bahru, Malaysia.
Mohamad Noh Bin Ahmad, Mohamad Amir Bin
Shamsudin
Department of Control and Mechatronics
Faculty of Electrical Engineering
Universiti Teknologi Malaysia
Johor Bahru, Malaysia.
[email protected], [email protected]
Abstract—This paper describes an automatic color sorting by
using webcam and be controlled by Programmable Logic
Controller (PLC). Manual system for color inspection for
product’s sorting requires a lot of cost including the vision system
and manpower. Using an automated system by using low cost
webcam can produce more consistence result with a minimal cost.
PLC is currently used widely by the industry to control the process
or machine in factory or manufacturing system. The existing
industrial camera was especially design so that it can be integrate
with PLC to produce an output. For example is the final product
inspection. But the costs were mostly can be categorized as
expensive. In this project, the use of a low cost webcam is used to
detect the product’s color to be read by PLC as the controller. In
other word, to design a low cost PLC based system that capable of
sorting the product according to their colors as well as establish
the communication between the webcam and PLC. This model is
using MATLAB software to classify the product’s color and
Arduino Uno as the medium for the output signal. Pneumatic
system applied as the actuator to sort the product according to
their color which in this model is between red and green. As the
result, the product will be sorted into red, green or neither both.
This may be a significant key especially for small industries to use
an automated system for their manufacturing processes.
I. INTRODUCTION
It is an important step to determine the quality and validity of a product. For example, quality inspection of fruit is mostly using their colors to distinguish between a good and bad fruits. Until 1990s, the inspection of fruit products was performed manually and its result were not consistence due to human error cause by fatigue and boredom.[5] Machine or robot was used to replace human for more consistence, low cost, and effective result. As for the vision system, machine vision early application was in the sixties for various purposes and nowadays being applied widely in many fields such as agriculture, inspecting product label, inspecting colors, robot handling, analyzing terrestrial image and in manufacturing process.[4] Now, the industrial automation had at the level which Programmable Logic Control (PLC) is a common in controlling the process in the industries. PLC is an industrial solid-state computer that monitors inputs and outputs, and make a logic-based decisions for actuation or automation. PLC read input from input devices such as sensors, push button, digital or analog input.[7] For image processing integrated with PLC, there are a lot of product that can provide the camera for industrial purpose. But for a low
cost machine vision system, webcam was used in this project to distinguish between colors for inspection and sorting purposes. By using a medium for data transfer from PLC and webcam such as Arduino, the input color from the webcam can be send to PLC for the output response. But this system also has its limit as it cannot cover the whole product image for processing which it may need the usage of more than one camera such as Intelligent Fruit Sorting System project.[5] There is several literature review were made based on the system.
A. Manual and Automatic Inspection
There are two methods that being used to inspect a product for quality or sorting that is manual and automatic inspection. Manual inspection is totally using the worker’s vision and automatic inspection is using the machine vision to capture and processing the image to produce a signal for the output responses. The disadvantage of human eyesight compared to the machine vision is that different people have their own perception in color classification and uniformity that might yield to uncertain output. For example is the inspection on hardwood panel product which they need to determine the uniformity for the product.[1]
B. Color Classification Techniques
First is RGB representation (red, blue and green). This method was using these three colors as the reference. It can be used to differentiate between colors for color inspection. For example in MATLAB, LabVIEW and Vision Assistant software, the color was verified based on the number of pixels and the measurement between the difference of reference RGB value with the product’s color.[2]
Another technique is by using HSI image (hue, saturation and intensity). This technique is more advance compared to RGB method as it simplify algorithm for color classification and save more memory space and time.[4]
For fast processing, Ohta color space technique was fast as it can complete the algorithm within 50 milliseconds. It also has a better accuracy and stability. In short, this method is better than HSI image technique.[5]
Proceedings of 2017 Electrical Engineering Symposium (EES2017) - Vol. 1
94

II. SYSTEM DESCRIPTION
This project was divided into three parts which is vision, data processing and control. The hardware used is a webcam, an Arduino Uno, Omron CPM2 PLC, push buttons, relay module, conveyor and pneumatic elements. The software used is MATLAB version 2014a, Arduino IDE and CX-Programmer. The whole configuration can be seen from fig.3.
Fig.1 shows the sketch of webcam based color sorting system
A. Vision and image acquisition
For vision part, a webcam will be placed on the top to capture the top view of the product. The color classification were using MATLAB version 2014a by using RGB color representation. The program will classify two colors that is red or green.
B. Data Processing
For red or green color, signal will be trigger in MATLABand serial communication was set up with Arduino sothat the signal will be transfer into output from theArduino’s I/O pins.
To transfer the signal as the input to the PLC, relaymodule was configured to act as switches to supply thesignal to the input of PLC. I/O pins from Arduino cannotbe connected directly to the PLC as the voltage fromArduino was not sufficient to activate the signal input forPLC.
C. Control and Actuation
The goal for the project is to sort the product according to their color which in this case is either red, green or others (rejected). CX-Programmer is used to create an Omron’s PLC programming sequences for the application. The actuator was using electro-pneumatic system whereas electrical control was use to the pneumatic system. In this case, pneumatic cylinder is controlled by two 5/2 pneumatic directional control valve. These valves were triggered by the signal from PLC and power supply to sort between red and green color. The pneumatic circuit diagram is shown as in fig.2.
Fig.2 shows the pneumatic circuit for the actuator
Omron CPM2 can be considered have less features compared to the other model such as CP1H which have the analog feature. But for this project, it was acceptable to use even a basic PLC as it only required basic features to perform it application.
Fig.3 shows the setup of the project.
III. EXPERIMENTS
To create communication between webcam and PLC, there must be a medium for data processing and signal transfer. In this project, Matlab software is used to create a color classification from the webcam and Arduino Uno as the transit for the signal transfer to the PLC. The programming in Matlab yield to color classification and integration with Arduino. First, video capturing object must be initializing to create a communication between the video inputs from desired webcam to the Matlab. ‘videoinput’ function was use to initialize the input data from the webcam. There are several ways to communicate between Matlab and Arduino such as serial communication, using RS232 communication and Matlab Arduino Support Package.
Proceedings of 2017 Electrical Engineering Symposium (EES2017) - Vol. 1
95
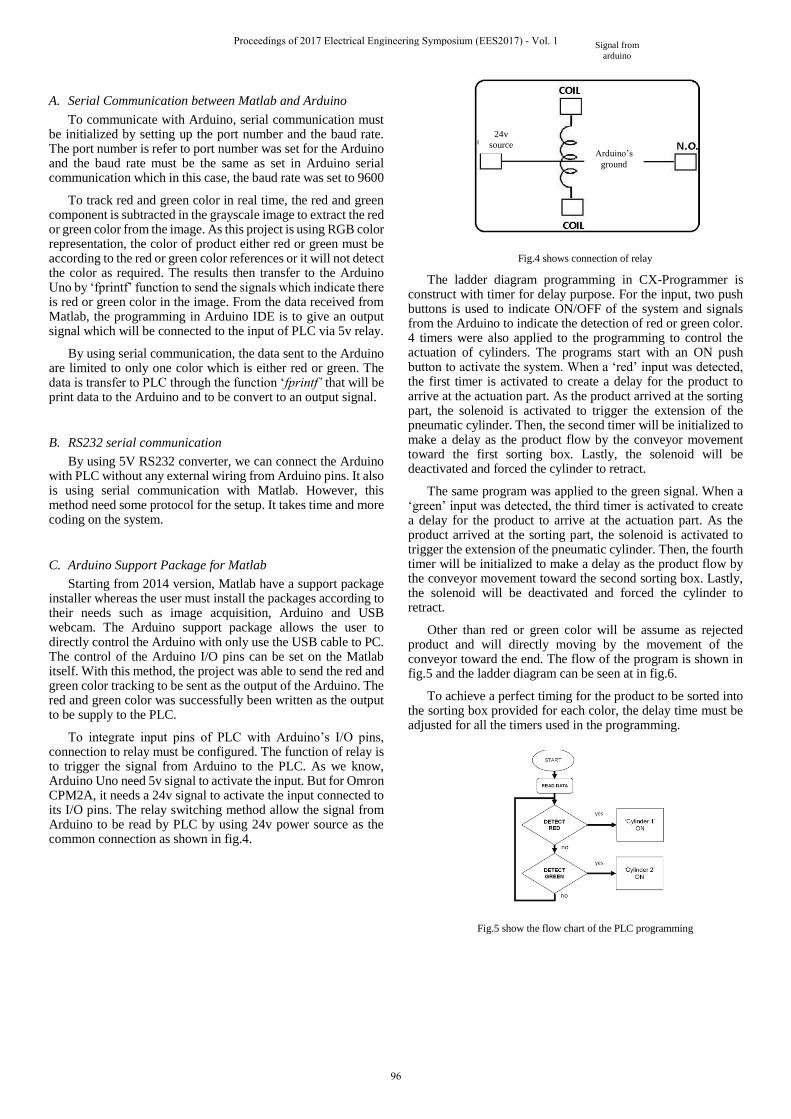
A. Serial Communication between Matlab and Arduino
To communicate with Arduino, serial communication must be initialized by setting up the port number and the baud rate. The port number is refer to port number was set for the Arduino and the baud rate must be the same as set in Arduino serial communication which in this case, the baud rate was set to 9600
To track red and green color in real time, the red and green component is subtracted in the grayscale image to extract the red or green color from the image. As this project is using RGB color representation, the color of product either red or green must be according to the red or green color references or it will not detect the color as required. The results then transfer to the Arduino Uno by ‘fprintf’ function to send the signals which indicate there is red or green color in the image. From the data received from Matlab, the programming in Arduino IDE is to give an output signal which will be connected to the input of PLC via 5v relay.
By using serial communication, the data sent to the Arduino are limited to only one color which is either red or green. The data is transfer to PLC through the function ‘fprintf’ that will be print data to the Arduino and to be convert to an output signal.
B. RS232 serial communication
By using 5V RS232 converter, we can connect the Arduino with PLC without any external wiring from Arduino pins. It also is using serial communication with Matlab. However, this method need some protocol for the setup. It takes time and more coding on the system.
C. Arduino Support Package for Matlab
Starting from 2014 version, Matlab have a support package installer whereas the user must install the packages according to their needs such as image acquisition, Arduino and USB webcam. The Arduino support package allows the user to directly control the Arduino with only use the USB cable to PC. The control of the Arduino I/O pins can be set on the Matlab itself. With this method, the project was able to send the red and green color tracking to be sent as the output of the Arduino. The red and green color was successfully been written as the output to be supply to the PLC.
To integrate input pins of PLC with Arduino’s I/O pins, connection to relay must be configured. The function of relay is to trigger the signal from Arduino to the PLC. As we know, Arduino Uno need 5v signal to activate the input. But for Omron CPM2A, it needs a 24v signal to activate the input connected to its I/O pins. The relay switching method allow the signal from Arduino to be read by PLC by using 24v power source as the common connection as shown in fig.4.
Fig.4 shows connection of relay
The ladder diagram programming in CX-Programmer is construct with timer for delay purpose. For the input, two push buttons is used to indicate ON/OFF of the system and signals from the Arduino to indicate the detection of red or green color. 4 timers were also applied to the programming to control the actuation of cylinders. The programs start with an ON push button to activate the system. When a ‘red’ input was detected, the first timer is activated to create a delay for the product to arrive at the actuation part. As the product arrived at the sorting part, the solenoid is activated to trigger the extension of the pneumatic cylinder. Then, the second timer will be initialized to make a delay as the product flow by the conveyor movement toward the first sorting box. Lastly, the solenoid will be deactivated and forced the cylinder to retract.
The same program was applied to the green signal. When a ‘green’ input was detected, the third timer is activated to create a delay for the product to arrive at the actuation part. As the product arrived at the sorting part, the solenoid is activated to trigger the extension of the pneumatic cylinder. Then, the fourth timer will be initialized to make a delay as the product flow by the conveyor movement toward the second sorting box. Lastly, the solenoid will be deactivated and forced the cylinder to retract.
Other than red or green color will be assume as rejected product and will directly moving by the movement of the conveyor toward the end. The flow of the program is shown in fig.5 and the ladder diagram can be seen at in fig.6.
To achieve a perfect timing for the product to be sorted into the sorting box provided for each color, the delay time must be adjusted for all the timers used in the programming.
Fig.5 show the flow chart of the PLC programming
24v
source
Signal from
arduino
Arduino’s
ground
Proceedings of 2017 Electrical Engineering Symposium (EES2017) - Vol. 1
96
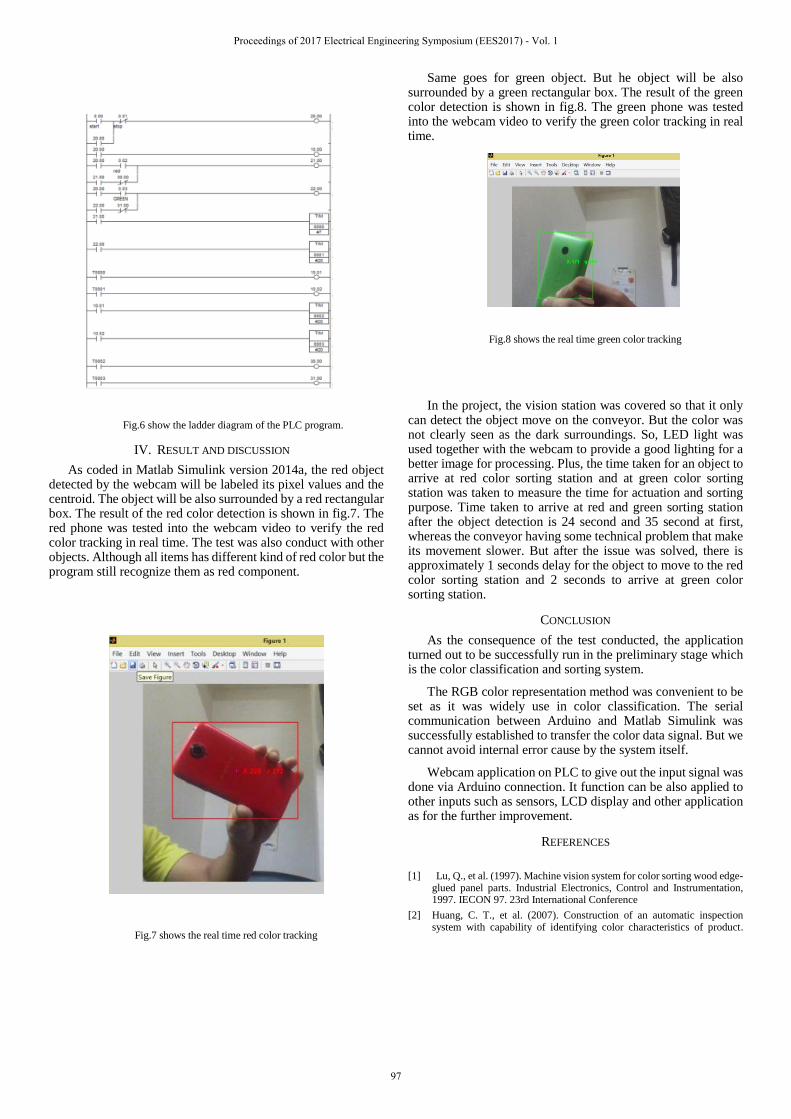
Fig.6 show the ladder diagram of the PLC program.
IV. RESULT AND DISCUSSION
As coded in Matlab Simulink version 2014a, the red object detected by the webcam will be labeled its pixel values and the centroid. The object will be also surrounded by a red rectangular box. The result of the red color detection is shown in fig.7. The red phone was tested into the webcam video to verify the red color tracking in real time. The test was also conduct with other objects. Although all items has different kind of red color but the program still recognize them as red component.
Fig.7 shows the real time red color tracking
Same goes for green object. But he object will be also surrounded by a green rectangular box. The result of the green color detection is shown in fig.8. The green phone was tested into the webcam video to verify the green color tracking in real time.
Fig.8 shows the real time green color tracking
In the project, the vision station was covered so that it only can detect the object move on the conveyor. But the color was not clearly seen as the dark surroundings. So, LED light was used together with the webcam to provide a good lighting for a better image for processing. Plus, the time taken for an object to arrive at red color sorting station and at green color sorting station was taken to measure the time for actuation and sorting purpose. Time taken to arrive at red and green sorting station after the object detection is 24 second and 35 second at first, whereas the conveyor having some technical problem that make its movement slower. But after the issue was solved, there is approximately 1 seconds delay for the object to move to the red color sorting station and 2 seconds to arrive at green color sorting station.
CONCLUSION
As the consequence of the test conducted, the application turned out to be successfully run in the preliminary stage which is the color classification and sorting system.
The RGB color representation method was convenient to be set as it was widely use in color classification. The serial communication between Arduino and Matlab Simulink was successfully established to transfer the color data signal. But we cannot avoid internal error cause by the system itself.
Webcam application on PLC to give out the input signal was done via Arduino connection. It function can be also applied to other inputs such as sensors, LCD display and other application as for the further improvement.
REFERENCES
[1] Lu, Q., et al. (1997). Machine vision system for color sorting wood edge-glued panel parts. Industrial Electronics, Control and Instrumentation, 1997. IECON 97. 23rd International Conference
[2] Huang, C. T., et al. (2007). Construction of an automatic inspection system with capability of identifying color characteristics of product.
Proceedings of 2017 Electrical Engineering Symposium (EES2017) - Vol. 1
97

2007 IEEE International Conference on Industrial Engineering and Engineering Management.
[3] Liwei, Z., et al. (2005). "Development of a mechatronic sorting system for removing contaminants from wool." IEEE/ASME Transactions on Mechatronics 10(3): 297-304.
[4] Buzera, M., et al. (2008). Techniques of Analysing the Colour of Produces for Automatic Classification. 2008 International Conference on Intelligent Engineering Systems, February 25-29,2008 Miami, Florida
[5] Guo, F. and Q. Cao (2004). Study on color image processing based intelligent fruit sorting system. Fifth World Congress on Intelligent
Control and Automation, 2004. WCICA, June 15-19, 2004, Hangzhou, P.R. China
[6] Wang, L., et al. (2013). Machine Vision Applications in Agricultural Food Logistics. 2013 Sixth International Conference on Business Intelligence and Financial Engineering.
[7] Carlos Gonzales (2015). Engineering Essential: What is a Programmable Logic Controller.2015 http://www.machinedesign.com/engineering-essentials/engineering-essentials-what-programmable-logic-control
Proceedings of 2017 Electrical Engineering Symposium (EES2017) - Vol. 1
98
Development of the Internet of Things (IoT)
for an Industrial Automated Guided Vehicle (AGV)
System
Muhammad Nadzmi Abd Rahman
Faculty of Electrical Engineering
University Technology of Malaysia
Johor, Malaysia
Herman Wahid
Faculty of Electrical Engineering
University Technology of Malaysia
Johor, Malaysia
Abstract—This paper describes the implementation of the
Internet of Things for an industrial Automated Guided Vehicle
(AGV). Wireless communication is used as a platform to make the
connection between AGV and server. The server would control the
activity of the AGV such as traffic, motor speed, sensor reading
and others. Therefore, many interfaces were designed by using the
software like login and register form, connection and AGV control
form. Error would be shown if the user wrongly put the data.
Besides that, the data also would be sent to the cloud for
monitoring the AGV.
Keywords—Wireless communication, server, data, interfaces
I. INTRODUCTION
Nowadays, technology has come to its peak where every country in this world is advancing their technology day by day. But somehow perhaps what people all over the world needs from advancing technology is conducive medium for them to enhance their day by having most of their time connected to the internet either they can access through mobile’s application or website. Soon in the future, maybe everything in this world would be connected to the internet so that all people around can access it anytime and anywhere.
The Internet of Things (IoT) is the name given to computerization of everything in our lives. It allows public and objects to be connected anytime and anyone are allow to use it. Soon everything will be on the Internet: the things we own, the things we interact with in public, autonomous thing that interact with each other.
Mostly the technology used especially in the heavy industry because they need such a large amount of production within a specific time to supply their products to the customer. One of the technology used is Automated Guided Vehicle (AGV). This AGV is a mobile robot that follows markers or wires in the floor, or some uses vision, magnets or lasers for navigation. They are most often used in industrial applications to move the materials around the manufacturing facility or warehouse.
The main problem that usually occurs to the AGV’s user is
if there is multiple AGVs operate around the workplace. It
seems very hard to monitor and control the traffic especially at
the junction or one way road. Somehow, if there is no safety
and uncontrolled traffic, probably the AGV would be collided
each other and crash. Therefore to overcome this problem,
tracking sensor is used to monitor and track the current location
of the AGV and design the algorithm to avoid them from
collide.
There are three main objective in this project which is to
investigate the remote control of high dense low volume of
Automated Guided Vehicle, develop wireless communication
based on Internet of Things (IoT) and test the data
transmission between client and server.
This paper is organized as follows: in Section 2, explanation
about the list of material and software use. Section 3 describes
the methodology to develop the software on AGV. In the last
two sections, the result of the motor speed and sensor reading
from the cloud using ThinkSpeak followed by the conclusion
section
II. PROJECT METHODOLOGY
The definition of the methodology is a system of methods
used in a particular area of study or activity, to achieve a certain
goal or objective. In this chapter, the methodology regarding
the idea of the innovation would be explain deeply from the
hardware, software to the parts of project assembly and the
development.
A. List of Material
To ensure the project will be working according as planned,
the right choice of hardware used in the project is crucial in
order to ensure the project is develop and working as planned.
Therefore, the list of materials will be provided and elaboration
will be made for the understanding of reason why the following
materials is chosen in order to develop the project.
i. RASPBERRY-PI 3
Proceedings of 2017 Electrical Engineering Symposium (EES2017) - Vol. 1
99
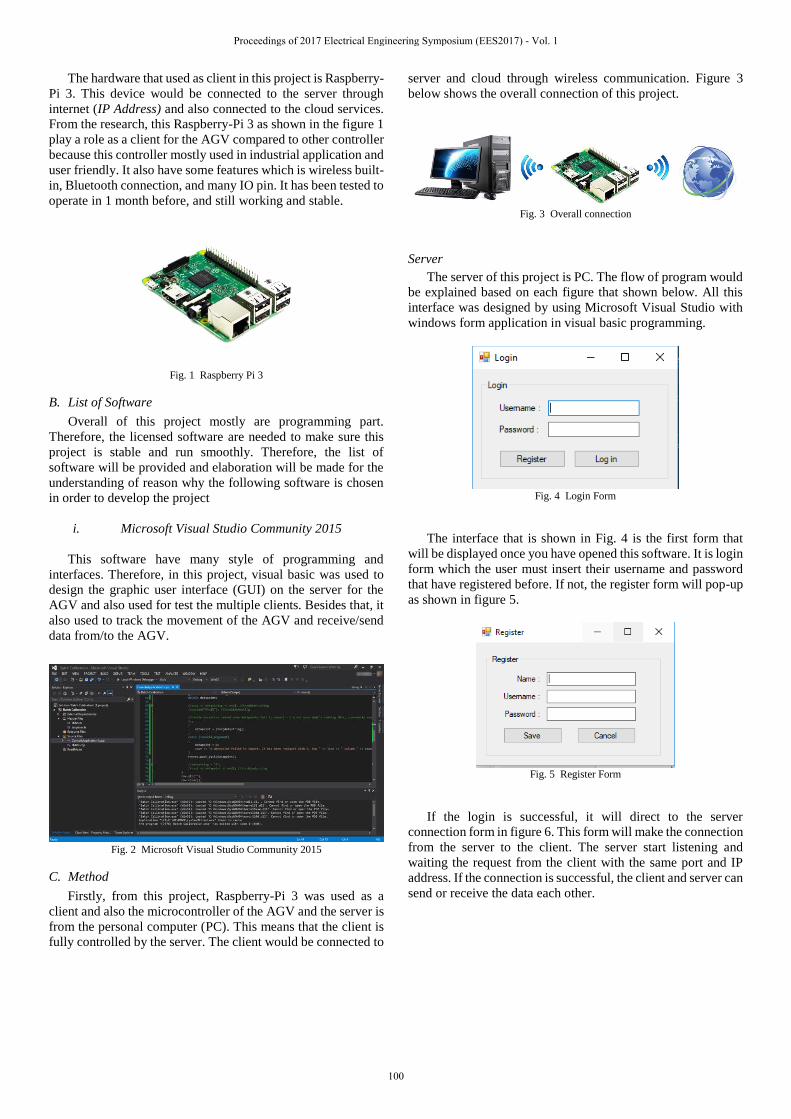
The hardware that used as client in this project is Raspberry-
Pi 3. This device would be connected to the server through
internet (IP Address) and also connected to the cloud services.
From the research, this Raspberry-Pi 3 as shown in the figure 1
play a role as a client for the AGV compared to other controller
because this controller mostly used in industrial application and
user friendly. It also have some features which is wireless built-
in, Bluetooth connection, and many IO pin. It has been tested to
operate in 1 month before, and still working and stable.
Fig. 1 Raspberry Pi 3
B. List of Software
Overall of this project mostly are programming part.
Therefore, the licensed software are needed to make sure this
project is stable and run smoothly. Therefore, the list of
software will be provided and elaboration will be made for the
understanding of reason why the following software is chosen
in order to develop the project
i. Microsoft Visual Studio Community 2015
This software have many style of programming and
interfaces. Therefore, in this project, visual basic was used to
design the graphic user interface (GUI) on the server for the
AGV and also used for test the multiple clients. Besides that, it
also used to track the movement of the AGV and receive/send
data from/to the AGV.
Fig. 2 Microsoft Visual Studio Community 2015
C. Method
Firstly, from this project, Raspberry-Pi 3 was used as a
client and also the microcontroller of the AGV and the server is
from the personal computer (PC). This means that the client is
fully controlled by the server. The client would be connected to
server and cloud through wireless communication. Figure 3
below shows the overall connection of this project.
Fig. 3 Overall connection
Server
The server of this project is PC. The flow of program would
be explained based on each figure that shown below. All this
interface was designed by using Microsoft Visual Studio with
windows form application in visual basic programming.
Fig. 4 Login Form
The interface that is shown in Fig. 4 is the first form that
will be displayed once you have opened this software. It is login
form which the user must insert their username and password
that have registered before. If not, the register form will pop-up
as shown in figure 5.
Fig. 5 Register Form
If the login is successful, it will direct to the server
connection form in figure 6. This form will make the connection
from the server to the client. The server start listening and
waiting the request from the client with the same port and IP
address. If the connection is successful, the client and server can
send or receive the data each other.
Proceedings of 2017 Electrical Engineering Symposium (EES2017) - Vol. 1
100
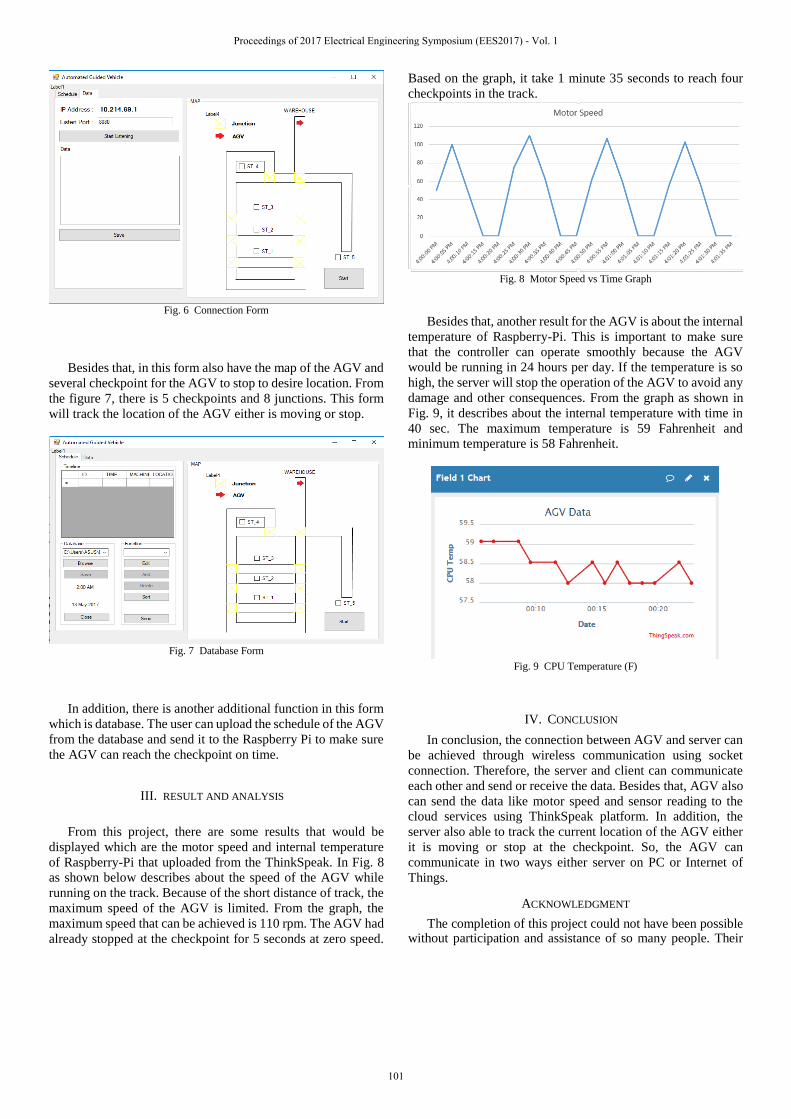
Fig. 6 Connection Form
Besides that, in this form also have the map of the AGV and
several checkpoint for the AGV to stop to desire location. From
the figure 7, there is 5 checkpoints and 8 junctions. This form
will track the location of the AGV either is moving or stop.
Fig. 7 Database Form
In addition, there is another additional function in this form
which is database. The user can upload the schedule of the AGV
from the database and send it to the Raspberry Pi to make sure
the AGV can reach the checkpoint on time.
III. RESULT AND ANALYSIS
From this project, there are some results that would be
displayed which are the motor speed and internal temperature
of Raspberry-Pi that uploaded from the ThinkSpeak. In Fig. 8
as shown below describes about the speed of the AGV while
running on the track. Because of the short distance of track, the
maximum speed of the AGV is limited. From the graph, the
maximum speed that can be achieved is 110 rpm. The AGV had
already stopped at the checkpoint for 5 seconds at zero speed.
Based on the graph, it take 1 minute 35 seconds to reach four
checkpoints in the track.
Fig. 8 Motor Speed vs Time Graph
Besides that, another result for the AGV is about the internal
temperature of Raspberry-Pi. This is important to make sure
that the controller can operate smoothly because the AGV
would be running in 24 hours per day. If the temperature is so
high, the server will stop the operation of the AGV to avoid any
damage and other consequences. From the graph as shown in
Fig. 9, it describes about the internal temperature with time in
40 sec. The maximum temperature is 59 Fahrenheit and
minimum temperature is 58 Fahrenheit.
Fig. 9 CPU Temperature (F)
IV. CONCLUSION
In conclusion, the connection between AGV and server can
be achieved through wireless communication using socket
connection. Therefore, the server and client can communicate
each other and send or receive the data. Besides that, AGV also
can send the data like motor speed and sensor reading to the
cloud services using ThinkSpeak platform. In addition, the
server also able to track the current location of the AGV either
it is moving or stop at the checkpoint. So, the AGV can
communicate in two ways either server on PC or Internet of
Things.
ACKNOWLEDGMENT
The completion of this project could not have been possible without participation and assistance of so many people. Their
Proceedings of 2017 Electrical Engineering Symposium (EES2017) - Vol. 1
101

contribution are sincerely appreciated and gratefully acknowledged. However the group would like to express their deep appreciation and indebtedness particularly to the following. Dr. Herman b. Wahid as supervisor for this project and guide me through all the pain to make sure this project successful. To all relative, friends and others who in one way or another shared their knowledge and support, either morally, financially and physically. Above all, greatly thank you for all the cooperation and helping hand through this project.
REFERENCES
[1] R. Shete and S. Agrawal, "IoT based urban climate monitoring using Raspberry Pi," 2016 International Conference on Communication and Signal Processing (ICCSP), Melmaruvathur, 2016, pp. 2008-2012.
[2] F. Corman et al., "Optimizing hybrid operations at large-scale automated container terminals," 2015 International Conference on Models and Technologies for Intelligent Transportation Systems (MT-ITS), Budapest, 2015, pp. 514-521.
[3] D. Pavithra and R. Balakrishnan, "IoT based monitoring and control system for home automation," 2015 Global Conference on Communication Technologies (GCCT), Thuckalay, 2015, pp. 169-173.
[4] M. Vanitha, M. Selvalakshmi and R. Selvarasu, "Monitoring and controlling of mobile robot via internet through raspberry Pi board," 2016
Second International Conference on Science Technology Engineering and Management (ICONSTEM), Chennai, 2016, pp. 462-466.
[5] T. N. Gia, M. Jiang, A. M. Rahmani, T. Westerlund, P. Liljeberg and H. Tenhunen, "Fog Computing in Healthcare Internet of Things: A Case Study on ECG Feature Extraction," 2015 IEEE International Conference on Computer and Information Technology; Ubiquitous Computing and Communications; Dependable, Autonomic and Secure Computing; Pervasive Intelligence and Computing, Liverpool, 2015, pp. 356-363.
[6] N. A. Zaini, N. Zaini, M. F. A. Latip and N. Hamzah, "Remote monitoring system based on a Wi-Fi controlled car using Raspberry Pi," 2016 IEEE Conference on Systems, Process and Control (ICSPC), Melaka, Malaysia, 2016, pp. 224-229
[7] P. H. Kulkarni, P. D. Kute and V. N. More, "IoT based data processing for automated industrial meter reader using Raspberry Pi," 2016 International Conference on Internet of Things and Applications (IOTA), Pune, 2016, pp. 107-111.
[8] C. A. Cosmas and N. Y. Dahlan, "Development of visual basic GUI for Option C energy saving of IPMVP," 3rd IET International Conference on Clean Energy and Technology (CEAT) 2014, Kuching, 2014, pp. 1-6.
[9] K. Osman, J. Ghommam and M. Saad, "Combined road following control and automatic lane keeping for automated guided vehicles," 2016 14th International Conference on Control, Automation, Robotics and Vision (ICARCV), Phuket, 2016, pp. 1-6.
[10] M. A. Abu and Mohamad Yusri Yacob, "Development and simulation of an agriculture control system using fuzzy logic method and Visual Basic environment," 2013 International Conference on Robotics, Biomimetics, Intelligent Computational Systems, Jogjakarta, 2013, pp. 135-142.
Proceedings of 2017 Electrical Engineering Symposium (EES2017) - Vol. 1
102

Active Vibration Control of Flexible Beam using
Piezoelectric Elements
Zul Fahmi Bin Khamiti
Faculty of Electrical Engineering
Universiti Teknologi Malaysia
Johor Bahru, Malaysia.
Zaharuddin Mohamed
Department of Control and Mechatronics Engineering
Faculty of Electrical Engineering
Universiti Teknologi Malaysia
Johor Bahru, Malaysia.
Abstract— Vibration suppression of a flexible beam systems
using piezoelectric elements is reviewed in this article. The smart
structure system consists of a beam as the host structure and the
piezoelectric elements as the actuation and sensing elements. An
experimental set-up has been developed to obtain the active vibration
suppression of the smart beam. The set-up consists of a smart
cantilever beam, data acquisition system and MATLAB based
controller. PID controller is used in this experiment to control the
flexible beam to ensure it move to the exact desired angle using the
closed-loop PID encoder feedback. The PID controller also used for
reducing the deflection and vibration of the flexible beam by using
the piezoelectric feedback.
I. INTRODUCTION
Vibration is a mechanical phenomenon
whereby oscillations occur about an equilibrium point.
Vibration can be desirable and also be undesirable depends on
the systems. Unfortunately, vibration was considered
undesirable in many applications because produce an unwanted
outcome. The presence of vibrations also can cause structural
or mechanical failures to machine or to the structure itself.
These vibrations also may cause discomfort to human and in
worst case, can cause death.
The vibration in a flexible structure is considered
undesirable and need to be controlled. For the vibration control
of a flexible structure, obviously the need to suppress all the
oscillation that faced by the structure. Control has been of great
interest since many applications that related to the flexible
structures such as high speed robots, requiring low weight,
lower energy consumption, ease for handling and also safer
operation due to reduced inertia [1]. Control of a flexible
structures has become broadly field of research among the
researchers since past few decades. Usually, the experimental
validation and implementation of vibration controls have relied
mainly on the use of proof mass actuator, brushless motors and
also viscous dampers but recently, piezoelectric elements has
been widely used because of their properties of materials have
a lot of advantages if compared to the others [2-4].
Two major approaches which is active control and
passive control have been accepted broadly [5]. These
approaches can be found in many thesis, journal and also books
that related to the vibration controls. In the passive method,
vibrations of the structure is damped using passive dampers or
materials with significant viscoelasticity [6]. This method of
vibration control will increase the total weight of structure
considerably but is best for high frequency applications. Then,
the active vibration control was introduced by the researchers
to overcome the weakness of the passive control method. The
active vibration control is a method that integrates sensors and
actuators with the flexible structures, operated by a suitable
control scheme. For this active vibration control, it is very
important issue in selecting the suitable sensors and actuators
[7].
Among the different types of transducers, distributed
piezoelectric elements (sensor and actuator) received the most
attention among the researches because of certain features such
as less weight, high bandwidth, low cost, its dynamic effects,
low maintenance and also easy for bonding with the flexible
structures [8,9]. This piezoelectric elements also has the
capability of a wide frequency range of control. The use of this
piezoelectric transducers has given rise to new approaches in
the active control of flexible structures.
Although the piezoelectric elements shows superiority
in control of flexible structures which their distributed nature
for control the flexible structure systems, this issue is not well
addressed yet in designing the control systems due to analytical
complexity. Therefore, this cause raising in interest of question
in term of sizing, shaping and also the suitable placement of
piezoelectric elements to achieve an optimal control systems.
Despite some of the results in these control systems, there is
still a need for experiment and research for a more reliable
dynamic model and easy to design. Also the need for efficient
controller for real implementation. In addition, there is still need
for optimization of shape and placement of the piezoelectric
elements in the active vibration control of flexible structures.
Proceedings of 2017 Electrical Engineering Symposium (EES2017) - Vol. 1
103
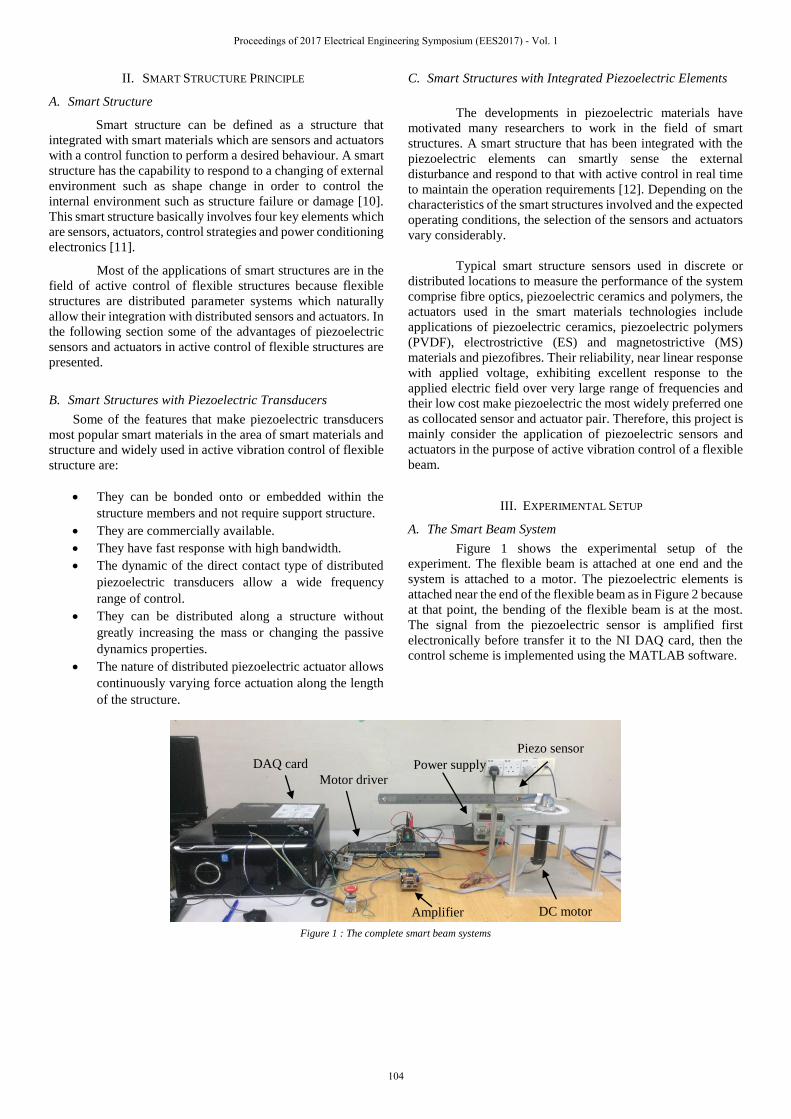
II. SMART STRUCTURE PRINCIPLE
A. Smart Structure
Smart structure can be defined as a structure that
integrated with smart materials which are sensors and actuators
with a control function to perform a desired behaviour. A smart
structure has the capability to respond to a changing of external
environment such as shape change in order to control the
internal environment such as structure failure or damage [10].
This smart structure basically involves four key elements which
are sensors, actuators, control strategies and power conditioning
electronics [11].
Most of the applications of smart structures are in the
field of active control of flexible structures because flexible
structures are distributed parameter systems which naturally
allow their integration with distributed sensors and actuators. In
the following section some of the advantages of piezoelectric
sensors and actuators in active control of flexible structures are
presented.
B. Smart Structures with Piezoelectric Transducers
Some of the features that make piezoelectric transducers
most popular smart materials in the area of smart materials and
structure and widely used in active vibration control of flexible
structure are:
They can be bonded onto or embedded within the
structure members and not require support structure.
They are commercially available.
They have fast response with high bandwidth.
The dynamic of the direct contact type of distributed
piezoelectric transducers allow a wide frequency
range of control.
They can be distributed along a structure without
greatly increasing the mass or changing the passive
dynamics properties.
The nature of distributed piezoelectric actuator allows
continuously varying force actuation along the length
of the structure.
C. Smart Structures with Integrated Piezoelectric Elements
The developments in piezoelectric materials have
motivated many researchers to work in the field of smart
structures. A smart structure that has been integrated with the
piezoelectric elements can smartly sense the external
disturbance and respond to that with active control in real time
to maintain the operation requirements [12]. Depending on the
characteristics of the smart structures involved and the expected
operating conditions, the selection of the sensors and actuators
vary considerably.
Typical smart structure sensors used in discrete or
distributed locations to measure the performance of the system
comprise fibre optics, piezoelectric ceramics and polymers, the
actuators used in the smart materials technologies include
applications of piezoelectric ceramics, piezoelectric polymers
(PVDF), electrostrictive (ES) and magnetostrictive (MS)
materials and piezofibres. Their reliability, near linear response
with applied voltage, exhibiting excellent response to the
applied electric field over very large range of frequencies and
their low cost make piezoelectric the most widely preferred one
as collocated sensor and actuator pair. Therefore, this project is
mainly consider the application of piezoelectric sensors and
actuators in the purpose of active vibration control of a flexible
beam.
III. EXPERIMENTAL SETUP
A. The Smart Beam System
Figure 1 shows the experimental setup of the
experiment. The flexible beam is attached at one end and the
system is attached to a motor. The piezoelectric elements is
attached near the end of the flexible beam as in Figure 2 because
at that point, the bending of the flexible beam is at the most.
The signal from the piezoelectric sensor is amplified first
electronically before transfer it to the NI DAQ card, then the
control scheme is implemented using the MATLAB software.
Figure 1 : The complete smart beam systems
DAQ card
Motor driver Power supply
Piezo sensor
Amplifier DC motor
Proceedings of 2017 Electrical Engineering Symposium (EES2017) - Vol. 1
104

B. Simulink Design with PID Controller
Figure 3 shows the open-loop of the system to move
the flexible beam system to desired angle and Figure 4 shows
the closed-loop of the system with addition of PID controller.
The PID controller is chosen in this experiment since it is the
common controller and easy implementation. In addition, the
PID controller also provides better robust stability. The PID
controller is used to control the flexible beam to ensure it move
to the exact desired angle using the closed-loop PID encoder
feedback. The PID controller also used for reducing the
deflection and vibration of the flexible beam by using the
piezoelectric sensor feedback in this experiment.
The P (proportional) gain is used to amplify the
feedback signal (error). The speed of the control system
response increase proportionally with the P (proportional) gain.
However, if the P (proportional) gain is too big, the system will
become unstable. The I (integral) component sums the error
terms over the time. The integral response will continue
increase over the time unless the error is zero. So, the I (integral)
gain is used for eliminating the steady-state error. Lastly, the D
(derivative) gain is used to decrease the overshoot and reduce
oscillation at the endpoint.
C. PID Controller Tuning
The PID controller must be tuned in order to get an
efficient control of the system. Because of the widespread use
of PID control, it is highly desirable to have efficient manual
and automatic methods of tuning the controllers. A good insight
into PID tuning is also useful in developing more schemes for
automatic tuning and loop assessment.
In this experiment, the PID controller was tuned by
using Ziegler-Nichols tuning method. This tuning method was
developed by John G. Ziegler and Nathaniel B. Nichols [13].
The tuning process is performed by set the I (integral) and D
(derivative) gains to zero. Then the P (proportional) gain, 𝐾𝑝 is
increased (from zero) until it reaches the ultimate gain 𝐾𝑢, at
which the output of the control loop has stable and consistent
oscillations. The value of 𝐾𝑢 and the oscillation period 𝑇𝑢that
obtained from the process are used to set the value of P, I and
D gains depends on the type of the controller used. Since this
experiment used the PID controller, the value of P, I and D is
calculated using the formula that listed on Table 1. These 3
parameters are used to establish the correction 𝑢(𝑡) from the
error 𝑒(𝑡) via the equation:
𝑢(𝑡) = 𝐾𝑝( 𝑒(𝑡) + 1
𝑇𝑖
∫ 𝑒(𝜏)𝑑𝜏𝑡
0
+ 𝑇𝑑
𝑑𝑒(𝑡)
𝑑𝑡)
Table 1 : Ziegler-Nichols Tuning Rule Based on Critical Gain 𝐾𝑝 and Critical
Period 𝑇𝑢
Control Type 𝐾𝑝 𝐾𝑖 𝐾𝑑
P 0.50𝐾𝑢 - -
PI 0.45𝐾𝑢 1.2𝐾𝑝
𝑇𝑢
-
PID 0.6𝐾𝑢 2𝐾𝑝
𝑇𝑢
𝐾𝑝𝑇𝑢
8
Piezo sensor
Figure 2 : Piezoelectric sensor and actuator placement
Piezo actuator
Figure 3 : Simulink block of the open loop system
Figure 4 : Simulink block of the closed-loop system with PID controller
Proceedings of 2017 Electrical Engineering Symposium (EES2017) - Vol. 1
105
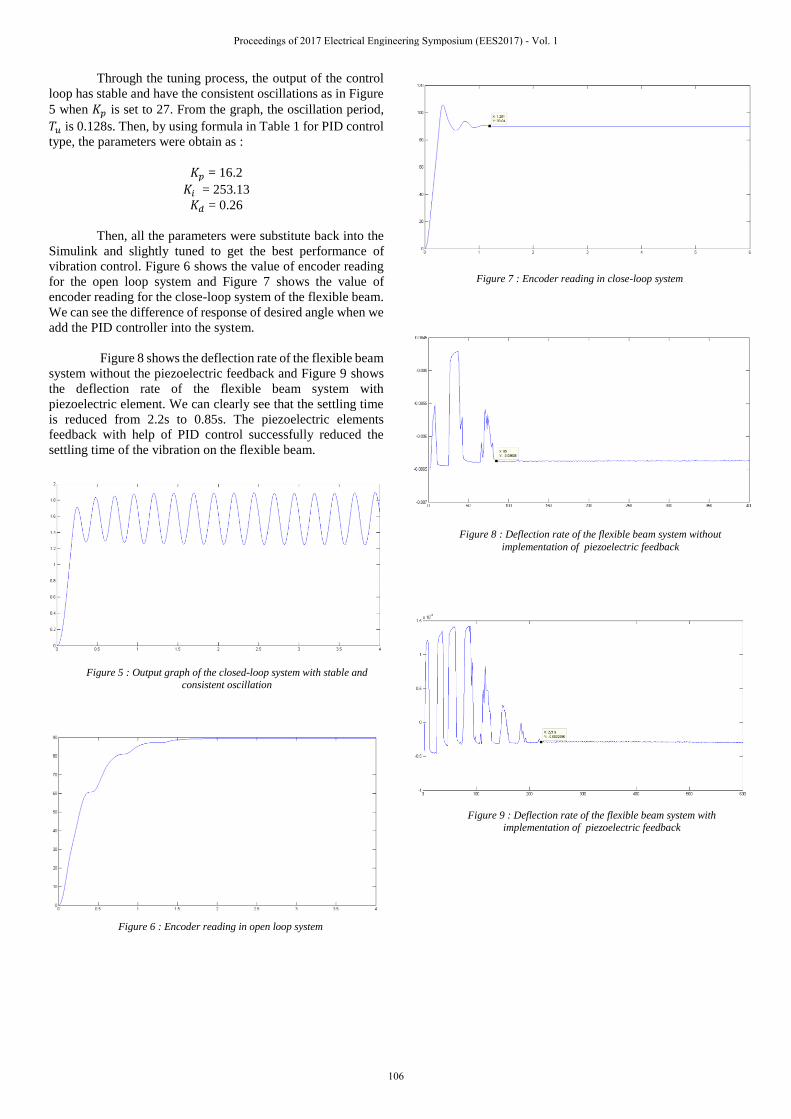
Through the tuning process, the output of the control
loop has stable and have the consistent oscillations as in Figure
5 when 𝐾𝑝 is set to 27. From the graph, the oscillation period,
𝑇𝑢 is 0.128s. Then, by using formula in Table 1 for PID control
type, the parameters were obtain as :
𝐾𝑝 = 16.2
𝐾𝑖 = 253.13
𝐾𝑑 = 0.26
Then, all the parameters were substitute back into the
Simulink and slightly tuned to get the best performance of
vibration control. Figure 6 shows the value of encoder reading
for the open loop system and Figure 7 shows the value of
encoder reading for the close-loop system of the flexible beam.
We can see the difference of response of desired angle when we
add the PID controller into the system.
Figure 8 shows the deflection rate of the flexible beam
system without the piezoelectric feedback and Figure 9 shows
the deflection rate of the flexible beam system with
piezoelectric element. We can clearly see that the settling time
is reduced from 2.2s to 0.85s. The piezoelectric elements
feedback with help of PID control successfully reduced the
settling time of the vibration on the flexible beam.
Figure 7 : Encoder reading in close-loop system
Figure 8 : Deflection rate of the flexible beam system without
implementation of piezoelectric feedback
Figure 5 : Output graph of the closed-loop system with stable and
consistent oscillation
Figure 6 : Encoder reading in open loop system
Figure 9 : Deflection rate of the flexible beam system with
implementation of piezoelectric feedback
Proceedings of 2017 Electrical Engineering Symposium (EES2017) - Vol. 1
106
IV. CONCLUSION
In a nutshell, a PID controller with encoder feedback has
been successfully designed to get the exact angle of position of
the flexible beam system. The PID controller also implemented
for the vibration control of the flexible beam system. All the
objective in this experiment has been achieved and proved by
the results in this experiment. This experiment also can be said
successful because the vibration of the flexible beam has been
reduced from 2.2s settling time to 0.85s settling time.
V. REFERENCE
[1] Khot, S. M., et al. "Active vibration control of
cantilever beam by using PID based output feedback
controller." Journal of Vibration and Control, 18(3),
2012, 366-372.
[2] Darivandi Shoushtari, Neda. "Optimal Active Control
of Flexible Structures Applying Piezoelectric
Actuators.", 2013.
[3] Junfeng Hu and Guiyang Xu. "Vibration control of
piezoelectric flexible structure using robust control
methodology." Journal of Theoretical and Applied
Information Technology, 51(2), 2013.
[4] W. J. Manning, Andrew R. Plummer and M. C.
Levesley. "Vibration control of a flexible beam with
integrated actuators and sensors." Smart Materials and
Structures, 9(6), 2000, 932.
[5] Leleu, Sylvaine, Hisham Abou-Kandil, and Yvan
Bonnassieux. "Piezoelectric actuators and sensors
location for active control of flexible
structures." Instrumentation and Measurement
Technology Conference, 2000. IMTC 2000.
Proceedings of the 17th IEEE, Vol. 2, 2000.
[6] G. Song, V. Sethi, and H-N. Li. "Vibration control of
civil structures using piezoceramic smart materials: A
review." Engineering Structures 28(11), 2006, 1513-
1524.
[7] Kumar, K. Ramesh, and S. Narayanan. "Active
vibration control of beams with optimal placement of
piezoelectric sensor/actuator pairs." Smart Materials
and Structures, 17(5), 2008, 055008.
[8] I. Bruant, et al. "Active control of beam structures with
piezoelectric actuators and sensors: modeling and
simulation." Smart Materials and Structures, 10(2),
2001, 404.
[9] K. Kumar, Ramesh, and S. Narayanan. "The optimal
location of piezoelectric actuators and sensors for
vibration control of plates." Smart Materials and
Structures, 16(6), 2007, 2680.
[10] [27] I. Chopra, “Review of state of art of smart
structures and integrated systems”, AIAA
journal, 40(11), 2002, 2145-2187.
[11] Gupta, Vivek, Manu Sharma, and Nagesh Thakur.
"Optimization criteria for optimal placement of
piezoelectric sensors and actuators on a smart
structure: a technical review." Journal of Intelligent
Material Systems and Structures. 21(12), 2010, 1227-
1243.
[12] M. Sahin, F. M. Karadal, Y. Yaman, O. F. Kircali, V.
Nalbantoglu, F.D. Ulker and T. Caliskan, “Smart
structures and their applications on active vibration
control: Studies in the Department of Aerospace
Engineering, METU”, Journal of
Electroceramics, 20(3-4), 2008, 167-174.
[13] Åström, Karl Johan, and Tore Hägglund. "Revisiting
the Ziegler–Nichols step response method for PID
control." Journal of process control, 14(6), 2004, 635-
650.
Proceedings of 2017 Electrical Engineering Symposium (EES2017) - Vol. 1
107
Quadcopter Based Transporter
Mohammad Khairul bin Tajudin
Faculty of Electrical Engineering
Universiti Teknologi Malaysia
Johor Bahru, Malaysia.
Mohamad Amir bin Shamsudin
Department of Control & Mechatronics Engineering
Faculty of Electrical Engineering
Universiti Teknologi Malaysia
Johor Bahru, Malaysia.
Abstract— the purpose of this project is to design a scale down
quadcopter based vehicle that can emulate quadcopter based
transporter. The project will develop the mechanism to work as a
transporter to carry the item. There is several online delivery
issues that happen to customer such as failed to arrive when
promised, had problems with delivery of their item, and human
labor during the delivery process. Human still have a problem to
transfer their item to the customer in effective ways. In industrial
robotic revolution nowadays, the use of robotic in industry has
become the first choice to improve the quality of their services or
product. To solve this problem, Unmanned Aerial Vehicle (UAV)
is a feasible solution to improve the delivery services by providing
the quadcopter as a transporter. These features include the fact
that they are maneuverable, can still be over a given point in space
and able to carry additional equipment or load. Quadcopter was
implementing by asymmetrical model instead of symmetrical
model that really common nowadays. The proposed model should
be able to lift up the load and able to transfer it to the specific
position. The research can be further prototyped to practically
have a system for delivery services for the online shop company.
I. INTRODUCTION
Based in definition by techtarget.com website, a drone in a technological context is formally known as unmanned aerial vehicles (UAV) and essentially, a drone is a flying robot. The aircrafts may be remotely controlled or can fly autonomously through software-controlled flight plans in their embedded systems working in conjunction with onboard sensors [1].
According to Commercial UAV News article, Ian Smith state that, it is always interesting to discover what led people to careers in the drone industry. Whether it was a previous position that had something to do with similar technology, or if it just stemmed from something else that something more primal that had been with them since they were younger [2].
Quadcopter is a type of multi-rotors helicopter that has four numbers of rotors that give it the thrust it needs to move. They are divided to two sets of identical, fixed pitch propellers- two spin clockwise and the other two, counter-clockwise. The control of the craft is achieved by using remote control transmitters to change the speed of the rotors.
There was too much decision to be made by the pilot. The only solution to that is with the help of electronic controller and sensors and that is why the electronic parts of the quadcopter are as important as the mechanical parts. The harmony collaboration of mechanical and electronic part made navigating the quadcopter much easier. Thanks to the rapid development of
computers microelectronics technology that made quadcopter as a reliable rotorcraft.
Quadcopters also usually has a simple and symmetrical shape as it is where most components will be mounted to and where the center of gravity supposed to be. However, there are several problems associated with using this type of construction. The main problem is calculation of the effective control of quadcopters [3]. To solve this problem, asymmetric model has been proposed. This asymmetric model will consider a model with such precision that necessary for the implementation of complex maneuvers that require high control precision [3]. The scale of a quadcopter is often determined by the diagonal measurement in millimeters from motor to motor through the center of the frame [4].
II. LITERATURE REVIEW
A. Modelling of a Quadcopter
There are several methods to do the mathematical approach to model the kinematics and dynamics of a quadcopter. According to the majority of the papers written, the traditional way of modelling a quadcopter is by using the Euler angles method. It is a method introduced by Leonhard Euler that uses three angles to describe the orientation of a rigid body in 3-dimensional space. Andrew Gibiansky, a software and robotics engineer used Euler Angle ZYZ in his approach to model a quadcopter according to his journal [5]. He claimed that his quadcopter's mathematical modelling to be highly simplified as there are a number of ignored advanced effects that contribute to the dynamics of the quadcopter to be highly nonlinear. His derivation of quadcopter's equations motion started with the voltage-torque relation for the brushless motor and then with the quadcopter kinematics and dynamics.
In Figure 1, he starts deriving quadcopter dynamics by introducing the two frames in which will operate. The inertial frame is defined by the ground, with gravity pointing in the negative z direction. The body frame is defined by the orientation of the quadcopter, with the rotor axes pointing in the positive z direction and the arms pointing in the x and y directions [5].
Proceedings of 2017 Electrical Engineering Symposium (EES2017) - Vol. 1
108

Fig. 1. Dynamic of quadcopter model
Aerodynamical effects such as flapping blade and non-zero free stream velocity are also ignored and replaced by a linear drag force representing air friction in all directions to complete his version of mathematical modelling of a quadcopter. An Italian hardware engineer, Tommaso Bresciani, has his own version of quadcopter model [6]. He mentioned that he used Newton-Euler method to describe the quadcopter's orientation, which is actually the derivation from Euler Angler. In classical mechanics, the Newton-Euler equations describe the combined translational and rotational dynamics of a rigid body.
New asymmetric model of quad copters is proposed in this project, it having the biggest number of perspectives. However, the efficiency of this model will not be improved if it uses the control algorithm for a symmetric or linear model [3]. Therefore, it is necessary to analyze the control methods for this model. New mathematical model of quadcopters and analyze the algorithms and principles of control for various kinds of trajectories, maneuvers, and conditions. The mathematical model has to take into account the asymmetry of the design and the effects of external influences [3].
Fig. 2. New assymmetric quadcopter model
Based on Figure 2, quadcopter moves relative to the fixed inertial coordinate system (ICS) (oXYZ). Axis 0x 0y and 0z form an orthogonal right-handed coordinate system. Axis 0z is in the opposite direction to the vector of gravity. Introduce two auxiliary coordinate systems (CS). The coordinate system Oc Xc Yc Zc is related to the center of mass of quadcopters (CSM), and the coordinate system Og Xg Yg Zg associated with the quadcopters geometric center (CSG).
The axes of the coordinate system are parallel to the axes of the inertial coordinate system. The quadcopter related with the right movable orthogonal coordinate system oc Xp Yp Zp (MCS). MCS starts at the center of mass of quadcopters. The angular position of a quadcopter is defined in MCS by
The center of mass of a quadcopter is defined by vector X = (x, y, z) in ICS. The linear velocity vector of a quadcopter is
defined as Vc = (vxc, vyc, vzc) and the angular velocity vector as W = (p, q, r) in CSM.
Euler angles η = (φ, θ, ψ):
Roll φ, Pitch θ and Yaw ψ.
Axis Oc xp is connected with one of the arms of a quadcopter,
Axis Oc yp lies in the plane of a quadcopter,
Axis Oc zp is upwardly directed relative to a quadcopter.
The center of mass of a quadcopter is defined by vector X = (x, y, z) in ICS. The linear velocity vector of a quadcopter is defined as Vc = (vxc, vyc, vzc) and the angular velocity vector as W = (p, q, r) in CSM.
Most manufacturers simplify their tasks by developing symmetry with respect to frame design. This greatly simplifies the mathematical description of the motion of quadcopters, but on the other hand, it is necessary to use additional equipment to comply with such symmetry. Manufactured devices differ significantly since the center of gravity with geometric center and the arm with the motors may be positioned at any angle relative to each other [3].
Propose model of quadcopters has the center of gravity structure shifted. One of the arms is also shifted relative to the geometric center of quadcopters and rotated at an angle, generally not a right angle, relative to the other arm. By refer to Figure 2, l is the distance from the edge of the second platform to the intersection with the center of the first platform,
l1l2l
l1 is the distance from the edge of the platform to the center of the motor. In Figure 2.1.2, a dotted line shows a quadcopter symmetric model. The main elements of quadcopters are the basic platform, two arms, four motors, unit with electrical system and accessories [3].
III. METHODOLOGY
A. Flowchart of the Project
Proceedings of 2017 Electrical Engineering Symposium (EES2017) - Vol. 1
109
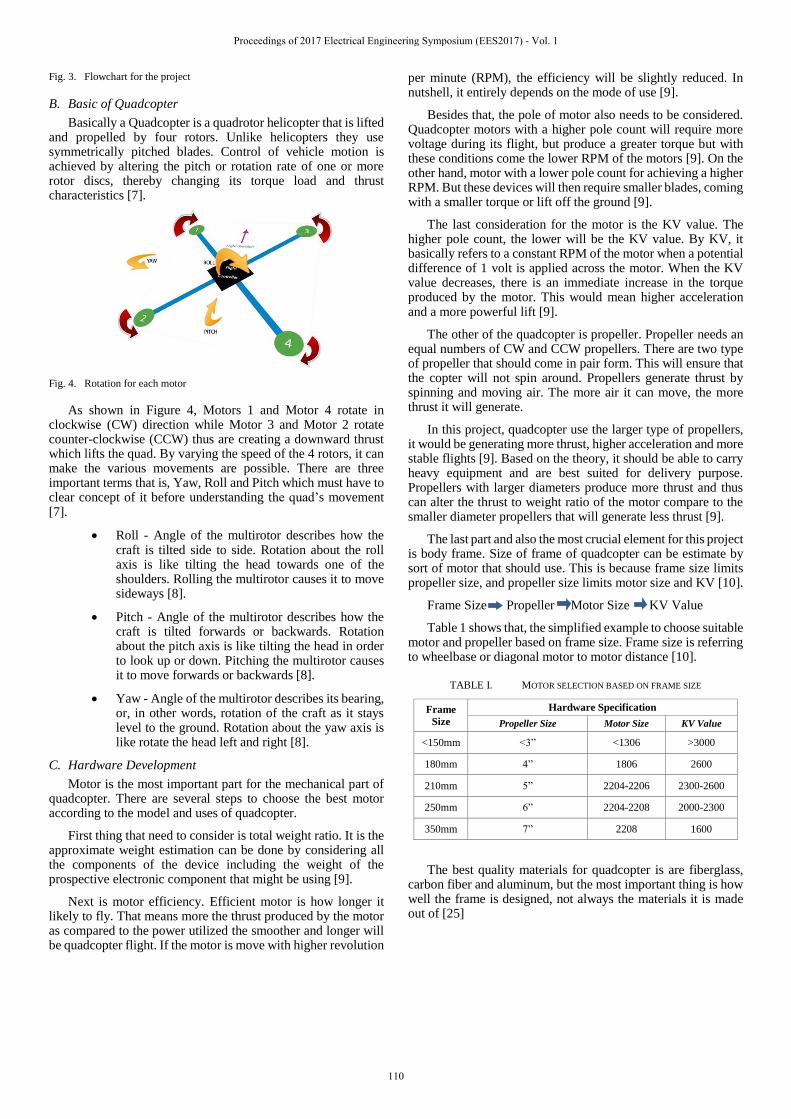
Fig. 3. Flowchart for the project
B. Basic of Quadcopter
Basically a Quadcopter is a quadrotor helicopter that is lifted and propelled by four rotors. Unlike helicopters they use symmetrically pitched blades. Control of vehicle motion is achieved by altering the pitch or rotation rate of one or more rotor discs, thereby changing its torque load and thrust characteristics [7].
Fig. 4. Rotation for each motor
As shown in Figure 4, Motors 1 and Motor 4 rotate in clockwise (CW) direction while Motor 3 and Motor 2 rotate counter-clockwise (CCW) thus are creating a downward thrust which lifts the quad. By varying the speed of the 4 rotors, it can make the various movements are possible. There are three important terms that is, Yaw, Roll and Pitch which must have to clear concept of it before understanding the quad’s movement [7].
Roll - Angle of the multirotor describes how the craft is tilted side to side. Rotation about the roll axis is like tilting the head towards one of the shoulders. Rolling the multirotor causes it to move sideways [8].
Pitch - Angle of the multirotor describes how the craft is tilted forwards or backwards. Rotation about the pitch axis is like tilting the head in order to look up or down. Pitching the multirotor causes it to move forwards or backwards [8].
Yaw - Angle of the multirotor describes its bearing, or, in other words, rotation of the craft as it stays level to the ground. Rotation about the yaw axis is like rotate the head left and right [8].
C. Hardware Development
Motor is the most important part for the mechanical part of quadcopter. There are several steps to choose the best motor according to the model and uses of quadcopter.
First thing that need to consider is total weight ratio. It is the approximate weight estimation can be done by considering all the components of the device including the weight of the prospective electronic component that might be using [9].
Next is motor efficiency. Efficient motor is how longer it likely to fly. That means more the thrust produced by the motor as compared to the power utilized the smoother and longer will be quadcopter flight. If the motor is move with higher revolution
per minute (RPM), the efficiency will be slightly reduced. In nutshell, it entirely depends on the mode of use [9].
Besides that, the pole of motor also needs to be considered. Quadcopter motors with a higher pole count will require more voltage during its flight, but produce a greater torque but with these conditions come the lower RPM of the motors [9]. On the other hand, motor with a lower pole count for achieving a higher RPM. But these devices will then require smaller blades, coming with a smaller torque or lift off the ground [9].
The last consideration for the motor is the KV value. The higher pole count, the lower will be the KV value. By KV, it basically refers to a constant RPM of the motor when a potential difference of 1 volt is applied across the motor. When the KV value decreases, there is an immediate increase in the torque produced by the motor. This would mean higher acceleration and a more powerful lift [9].
The other of the quadcopter is propeller. Propeller needs an equal numbers of CW and CCW propellers. There are two type of propeller that should come in pair form. This will ensure that the copter will not spin around. Propellers generate thrust by spinning and moving air. The more air it can move, the more thrust it will generate.
In this project, quadcopter use the larger type of propellers, it would be generating more thrust, higher acceleration and more stable flights [9]. Based on the theory, it should be able to carry heavy equipment and are best suited for delivery purpose. Propellers with larger diameters produce more thrust and thus can alter the thrust to weight ratio of the motor compare to the smaller diameter propellers that will generate less thrust [9].
The last part and also the most crucial element for this project is body frame. Size of frame of quadcopter can be estimate by sort of motor that should use. This is because frame size limits propeller size, and propeller size limits motor size and KV [10].
Frame Size Propeller Motor Size KV Value
Table 1 shows that, the simplified example to choose suitable motor and propeller based on frame size. Frame size is referring to wheelbase or diagonal motor to motor distance [10].
TABLE I. MOTOR SELECTION BASED ON FRAME SIZE
Frame
Size
Hardware Specification
Propeller Size Motor Size KV Value
<150mm <3” <1306 >3000
180mm 4” 1806 2600
210mm 5” 2204-2206 2300-2600
250mm 6” 2204-2208 2000-2300
350mm 7” 2208 1600
The best quality materials for quadcopter is are fiberglass, carbon fiber and aluminum, but the most important thing is how well the frame is designed, not always the materials it is made out of [25]
Proceedings of 2017 Electrical Engineering Symposium (EES2017) - Vol. 1
110

D. Electronic Development
The brushless motors are normally in 3 phases, direct supply of DC power will not turn the motors on. By using Electronic Speed Controllers (ESC), it will generate three high frequency signals with different but controllable phases continually to keep the motor turning. The ESC is also able to source a lot of current as the motors can draw a lot of power.
The ESC is an inexpensive motor controller board that has a battery input and a three phase output for the motor. Each ESC is controlled independently by a Pulse Position Modulation (PPM) signal. For quadcopter, it is recommended the controller should support high enough frequency signal, so the motor speeds can be adjusted quick enough for optimal stability.
When selecting a suitable ESC, the most important factor is the source current. It should always choose an ESC with at least 10 A or more in sourcing current as what your motor will require. Another important factor is the programming facilities, which means in some ESC, it allowed using different signals frequency range. This is especially useful for custom controller board [11].
A multicopter control board is the essential part of your multicopter. It is the heart of the quadcopter and controls the motor independently and corrects for equal balancing. In this project, the quadcopter use Arducopter board that already has all necessary component for the quadcopter.
A GPS module measures quadcopter location by measuring how long a signal takes to travel from a satellite. A GPS module is also able to give an estimation of quadcopter altitude. The main feature used by the GPS module is that quadcopter can autonomously fly to way-points and it can potentially fly on its own from takeoff to landing [12].
E. Programming Development
Programming is the crucial part that needs to tackle as finish the hardware and electronic development. Programming is depends on what board controller it is. In this project, the quadcopter use an Arducopter controller boards that using ATmega as microcontroller. The software that suitable for that purpose is using Mission Planner.
For the testing purpose, such as rotor testing, in this project, the quadcopter only using the Arduino Nano board and Arduino IDE software.
Mission Planner will work as a ground station that typically a software application, running on a ground-based computer, which communicates with the quadcopter via wireless telemetry. It displays real-time data on the quadcopter’s performance and position. It will show many of the same instruments that prototype would have if it were flying a real plane. It also can be used to control a quadcopter in flight, uploading new mission commands and setting parameters. It is often also use to monitor the live video stream from a quadcopter’s cameras [13].
IV. RESULT AND DISCUSSION
A. Phase I
Solidwork design is use for the first phase in this project. Based on the design on Figure 5, the model and the mechanism can be decided and implement it into the prototype.
Fig. 5. Solidwork design for the draft planning
This design use asymmetrical model approach to be test in the real design. All the important part of mechanical will be assemble to view how the design will be made. In this phase, the design only for the draft and will be improve by the next phase to see it function well or not.
For the prototype, the frame of the quadcopter was using acrylic material. The reason is to make the frame lighter. From the design, the acrylic was cut using laser cuter machine to make it have shape and follow the design. The motor and propeller or known as rotor and ESC is attached on the frame to test the functionality of each material and to measure the effectiveness of the frame as shown in Figure 6.
Fig. 6. Prototype of quadcopter in Phase I
The testing process only using the Arduino Nano and simple code to drive the motor was uploaded to the board. From the result, all the motor is move in clockwise direction. To make the quadcopter lift, the direction for motors 1 and motor 4 must be rotate in clockwise direction while motor 3 and motor 2 must rotate in counter-clockwise. To solve this problem, the polarity of the ESC in motor 2 and motor 3 must be change. After the change, the direction of each motor was finally following the desire direction.
Another problem that has been face in this phase is the ability the frame to support the motor movement. When the rotor is move and produces the thrust, the arm of the frame cannot withstand with the larger force and will be crash if the more impact happens to it. To improve this design, the project has to move to Phase II.
Proceedings of 2017 Electrical Engineering Symposium (EES2017) - Vol. 1
111
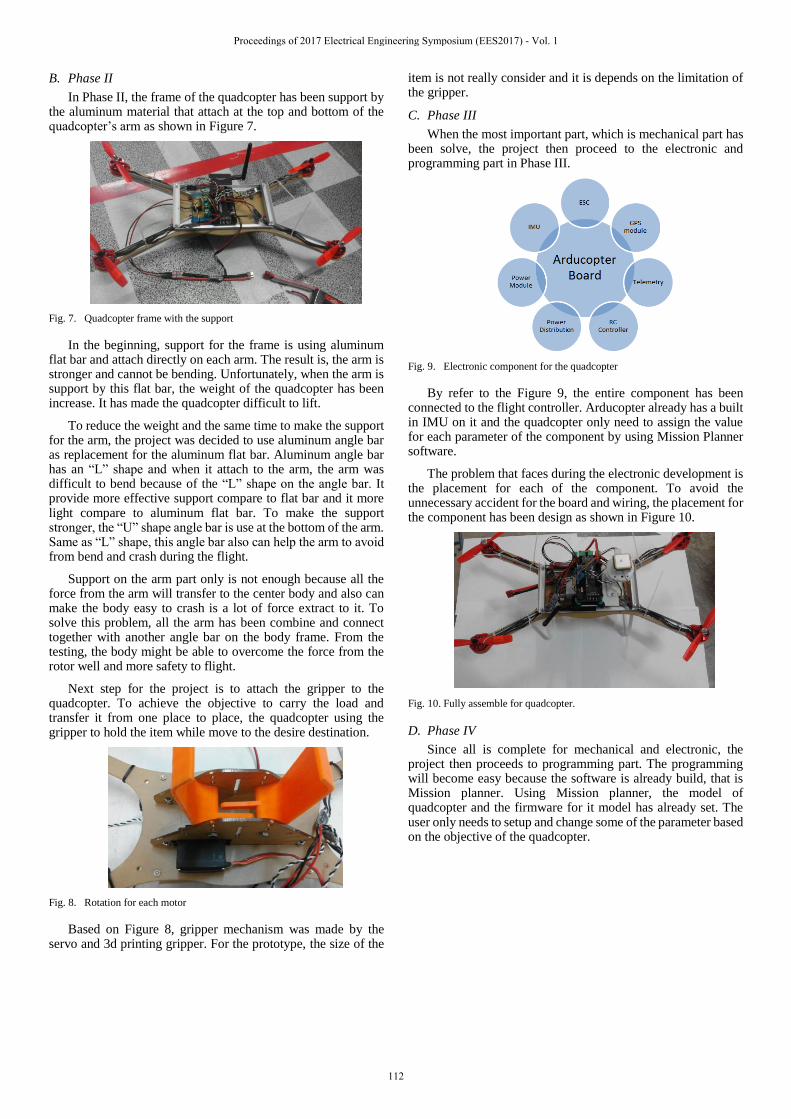
B. Phase II
In Phase II, the frame of the quadcopter has been support by the aluminum material that attach at the top and bottom of the quadcopter’s arm as shown in Figure 7.
Fig. 7. Quadcopter frame with the support
In the beginning, support for the frame is using aluminum flat bar and attach directly on each arm. The result is, the arm is stronger and cannot be bending. Unfortunately, when the arm is support by this flat bar, the weight of the quadcopter has been increase. It has made the quadcopter difficult to lift.
To reduce the weight and the same time to make the support for the arm, the project was decided to use aluminum angle bar as replacement for the aluminum flat bar. Aluminum angle bar has an “L” shape and when it attach to the arm, the arm was difficult to bend because of the “L” shape on the angle bar. It provide more effective support compare to flat bar and it more light compare to aluminum flat bar. To make the support stronger, the “U” shape angle bar is use at the bottom of the arm. Same as “L” shape, this angle bar also can help the arm to avoid from bend and crash during the flight.
Support on the arm part only is not enough because all the force from the arm will transfer to the center body and also can make the body easy to crash is a lot of force extract to it. To solve this problem, all the arm has been combine and connect together with another angle bar on the body frame. From the testing, the body might be able to overcome the force from the rotor well and more safety to flight.
Next step for the project is to attach the gripper to the quadcopter. To achieve the objective to carry the load and transfer it from one place to place, the quadcopter using the gripper to hold the item while move to the desire destination.
Fig. 8. Rotation for each motor
Based on Figure 8, gripper mechanism was made by the servo and 3d printing gripper. For the prototype, the size of the
item is not really consider and it is depends on the limitation of the gripper.
C. Phase III
When the most important part, which is mechanical part has been solve, the project then proceed to the electronic and programming part in Phase III.
Fig. 9. Electronic component for the quadcopter
By refer to the Figure 9, the entire component has been connected to the flight controller. Arducopter already has a built in IMU on it and the quadcopter only need to assign the value for each parameter of the component by using Mission Planner software.
The problem that faces during the electronic development is the placement for each of the component. To avoid the unnecessary accident for the board and wiring, the placement for the component has been design as shown in Figure 10.
Fig. 10. Fully assemble for quadcopter.
D. Phase IV
Since all is complete for mechanical and electronic, the project then proceeds to programming part. The programming will become easy because the software is already build, that is Mission planner. Using Mission planner, the model of quadcopter and the firmware for it model has already set. The user only needs to setup and change some of the parameter based on the objective of the quadcopter.
Proceedings of 2017 Electrical Engineering Symposium (EES2017) - Vol. 1
112

Fig. 11. Assign the waypoint for the quadcopter using Mission Planner
V. CONCLUSION
This project showed that the mechanism of the quadcopter work as important thing to be consider. All the material that choose to build a quadcopter is crucial and any of error that happen need to be aware. Quadcopter also need to consider the weight that will be carrying other than itself.
There are other few things that need to consideration such as body frame material, type of motor and propeller and how to use the software provided in most effective way. This is vital process before development of system is running. The expected outcomes of the proposed model are might be able to lift the load and carry it the desire place.
REFERENCES
[1] Jeremiah Karpowicz, Exploring the Present and Future of the Drone Industry‟. Commercial UAV News. December 13 2016. [Online]. Available: http://www.expouav.com/news/latest/exploring-present-future-drone-industry/. [Accessed: December 20, 2016].
[2] What is drone (unmanned aerial vehicle, UAV)? - Definition from WhatIs.com‟. IoT Agenda. [Online]. Available: http://internetofthingsagenda.techtarget.com /definition/drone [Accessed: November 28, 2016]
[3] Beniak, R., & Gudzenko, O. (2016). Control Methods Design For a Model of Asymmertrical Quadrocopter. Journal of Automation, Mobile Robotics & Intelligent Systems, 10(2).
[4] Malloy Hoverbike. The official website of The Hoverbike. [Online]. Available: http://www.hover-bike.com/ [Accessed: September 25, 2016]
[5] Gibiansky, A. (2010). Quadcopter Dynamics, Simulation, and Control.
[6] Bresciani, T. (2008). Modelling, identification and control of a quadrotor helicopter. MSc Theses.
[7] Quadcopter Basic [Online]. Available: https://creativentechno.wordpress.com /2012/06/13/quadcopter-basics/ [Accessed: December 21, 2016]
[8] The Physic of Quadcopter Flight? [Online]. Available: http://blacktieaerial.com/the-physics-of-quadcopter-flight/ [Accessed: December 20, 2016]
[9] Quadcopter Motor: Understanding The Driving force of The Drones? [Online]. Available: http://mydronelab.com/accessories/quadcopter-motors.html [Accessed: December 21, 2016]
[10] How to choose Motor and Propeller for Quadcopter? [Online]. Available: https://oscarliang.com/quadcopter-motor-propeller/ [Accessed: November 9, 2016]
[11] How to Pick The Best Multirotor Frame?. [Online]. Available: http://myfirstdrone.com/tutorials/best-multirotor-frame/ Accessed: November 10, 2016]
[12] What to consider when buying a ESC for your multirotor? [Online]. Available: http://www.dronetrest.com/t/what-to-consider-when-buying-a-esc-for-your-multirotor/1305 [Accessed: November 10, 2016]
[13] Ardupilot Community. The official website of Arducopter. [Online]. Available: http://ardupilot.org/copter/index.html [Accessed: April 15, 2017]
Proceedings of 2017 Electrical Engineering Symposium (EES2017) - Vol. 1
113
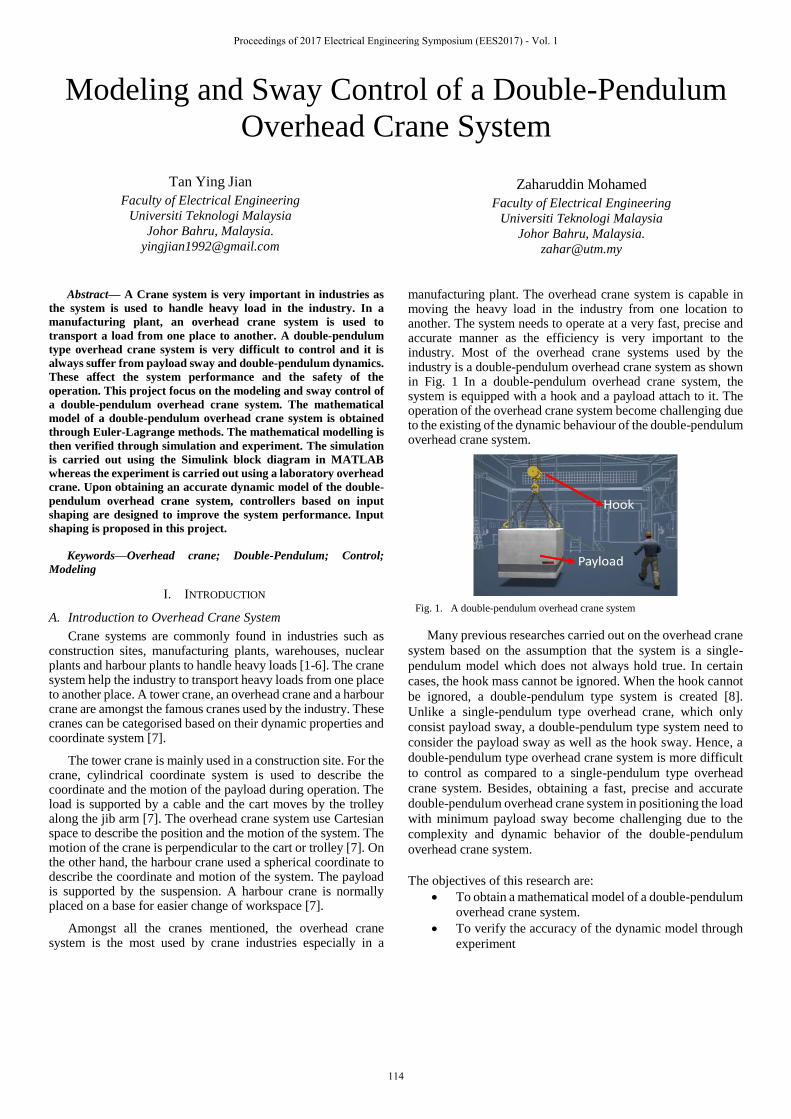
Modeling and Sway Control of a Double-Pendulum
Overhead Crane System
Tan Ying Jian
Faculty of Electrical Engineering
Universiti Teknologi Malaysia
Johor Bahru, Malaysia.
Zaharuddin Mohamed
Faculty of Electrical Engineering
Universiti Teknologi Malaysia
Johor Bahru, Malaysia.
Abstract— A Crane system is very important in industries as
the system is used to handle heavy load in the industry. In a
manufacturing plant, an overhead crane system is used to
transport a load from one place to another. A double-pendulum
type overhead crane system is very difficult to control and it is
always suffer from payload sway and double-pendulum dynamics.
These affect the system performance and the safety of the
operation. This project focus on the modeling and sway control of
a double-pendulum overhead crane system. The mathematical
model of a double-pendulum overhead crane system is obtained
through Euler-Lagrange methods. The mathematical modelling is
then verified through simulation and experiment. The simulation
is carried out using the Simulink block diagram in MATLAB
whereas the experiment is carried out using a laboratory overhead
crane. Upon obtaining an accurate dynamic model of the double-
pendulum overhead crane system, controllers based on input
shaping are designed to improve the system performance. Input
shaping is proposed in this project.
Keywords—Overhead crane; Double-Pendulum; Control;
Modeling
I. INTRODUCTION
A. Introduction to Overhead Crane System
Crane systems are commonly found in industries such as construction sites, manufacturing plants, warehouses, nuclear plants and harbour plants to handle heavy loads [1-6]. The crane system help the industry to transport heavy loads from one place to another place. A tower crane, an overhead crane and a harbour crane are amongst the famous cranes used by the industry. These cranes can be categorised based on their dynamic properties and coordinate system [7].
The tower crane is mainly used in a construction site. For the crane, cylindrical coordinate system is used to describe the coordinate and the motion of the payload during operation. The load is supported by a cable and the cart moves by the trolley along the jib arm [7]. The overhead crane system use Cartesian space to describe the position and the motion of the system. The motion of the crane is perpendicular to the cart or trolley [7]. On the other hand, the harbour crane used a spherical coordinate to describe the coordinate and motion of the system. The payload is supported by the suspension. A harbour crane is normally placed on a base for easier change of workspace [7].
Amongst all the cranes mentioned, the overhead crane system is the most used by crane industries especially in a
manufacturing plant. The overhead crane system is capable in moving the heavy load in the industry from one location to another. The system needs to operate at a very fast, precise and accurate manner as the efficiency is very important to the industry. Most of the overhead crane systems used by the industry is a double-pendulum overhead crane system as shown in Fig. 1 In a double-pendulum overhead crane system, the system is equipped with a hook and a payload attach to it. The operation of the overhead crane system become challenging due to the existing of the dynamic behaviour of the double-pendulum overhead crane system.
Fig. 1. A double-pendulum overhead crane system
Many previous researches carried out on the overhead crane
system based on the assumption that the system is a single-
pendulum model which does not always hold true. In certain
cases, the hook mass cannot be ignored. When the hook cannot
be ignored, a double-pendulum type system is created [8].
Unlike a single-pendulum type overhead crane, which only
consist payload sway, a double-pendulum type system need to
consider the payload sway as well as the hook sway. Hence, a
double-pendulum type overhead crane system is more difficult
to control as compared to a single-pendulum type overhead
crane system. Besides, obtaining a fast, precise and accurate
double-pendulum overhead crane system in positioning the load
with minimum payload sway become challenging due to the
complexity and dynamic behavior of the double-pendulum
overhead crane system.
The objectives of this research are:
To obtain a mathematical model of a double-pendulum
overhead crane system.
To verify the accuracy of the dynamic model through
experiment
Proceedings of 2017 Electrical Engineering Symposium (EES2017) - Vol. 1
114

To design a suitable controller for the double-
pendulum overhead crane system to reduce payload
sway and double-pendulum dynamics.
II. LITERATURE REVIEW
The overhead crane system used by most of the industry is a double-pendulum type overhead crane system with a hook and payload attach it. The overhead crane system needs to operate at a very fast, precise and accurate manner in positioning the load because efficiency is very important to all the industries. However, a double-pendulum type overhead crane systems suffered from payload oscillations [1-2,8-10,5-7,9-12] and double-pendulum dynamics [1-2,5-9,12,14-15].
The payload oscillation degrades the efficiency of the operation. It causes the difficulty for the operators to manipulate the payloads faster and accurately [1-2,8-9]. The operation takes a longer time to settle down and this increase the completion time.
The hook mass used in the overhead crane system cannot be less than the payload mass as if the payload is too heavy, the string will tend to break. In order to avoid this problem, a larger hook mass is used. However, double-pendulum dynamics with high sway will be created when the system has a larger hook mass as compared to payload mass [3-4]. The double-pendulum dynamic will affect the safety [13] of the operators since most of the crane systems are control by operators.
A. Control of a Double-Pendulum Overhead System
1) Feedforward Control In feedforward control, the control variable adjustment is
based on the knowledge about the system especially the mathematical model of the system. All the system variables as well as the disturbance need to be understood before a feedforward control system can be designed. The system will only react based on the established feedforward system because feedback signal is not based on the error of the system. Fig. 2 shows the block diagram of a feedforward control of a system.
Fig. 2. Feedforward control system
Input shaping [1,9,14,16-18] is the most famous method used by the researchers. Input shaping does not require feedback from the system and it is established based the estimated natural frequencies and the damping ratio of the system [5,16-18]. Input shaping helps to filter out unwanted signal such as the vibration and the command generated by operators [1,5,17-18]. This will reduce the payload sway of the system and also reduce the completion time of a task [1]. There are also several researches using Zero Vibration (ZV), Zero Vibration Derivative (ZVD), Zero Vibration Derivative Derivative (ZVDD) and Specified Insensitivity (SI) [5] shapers as control methods to solve the payload sway and double-pendulum dynamics.
Since there is no feedback is required from the system, camera or sensor is not required during the implementation of feedforward control system in the overhead crane system.
Hence, it is cheap to implement [12]. Input shaping is not a feedback system; therefore, it is compatible with the human operators [1,5,17-18]. The major drawback of feedforward control is that it is unable to handle the modelling errors, external disturbances and unexpected vibration from the dynamic behavior of a double-pendulum overhead crane system [6].
2) Feedback Control
Feedback control system takes the output response such as
the hook and payload sway into consideration to adjust its
performance to meet the system requirement. Hence, an
additional sensor device such as sensor or camera is required to
obtain the payload sway of the system. With the reading of hook
and payload sway as the feedback of the system, a closed-loop
feedback control system can be established. Amongst the
feedback controller, Proportional-Derivative(PD) controller [1]
and fuzzy logic controller [8] are commonly used. A study
shows that the use of PD controller is able to improve the
performance of an overhead crane system by 66% [1]. Apart
from PD controller, fuzzy logic controller is also introduced to
the overhead crane system to improve system performance. In
fuzzy logic control, single-input-rule modules (SIRMs) was
introduced. SIRMs employs genetic algorithm to tune the
parameters of the overhead crane system [8]. Fig. 3 shows the
block diagram of a feedback control system.
Fig. 3. Feedback control system
III. RESEARCH METHODOLOGY
A. Experimental Overhead Crane System
Fig. 4 shows an overhead crane system manufactured by INTECO that is used in this project. The overhead crane system is a 3D crane with a dimension of length, width and height of 1.0 m. The system is equipped with angle sensor, position sensor, motor drive and power amplifier.
Fig. 4. An Overhead crane system by INTECO
Fig. 5 shows the position sensor of the overhead crane system. The position sensor is actually an incremental encoder. When the cart start moving, the incremental encoder will start to count, the readings from the encoder will be converted into cart position of the system. Fig. 6 shows the cart and angle sensors of the overhead crane system. The angle sensor is positioned
signalIn
put
signal Controller System
signalOu
Output
signal
Disturbance
Input
signal Controller System
Output
signal
Sensor
Error +
-
Proceedings of 2017 Electrical Engineering Symposium (EES2017) - Vol. 1
115
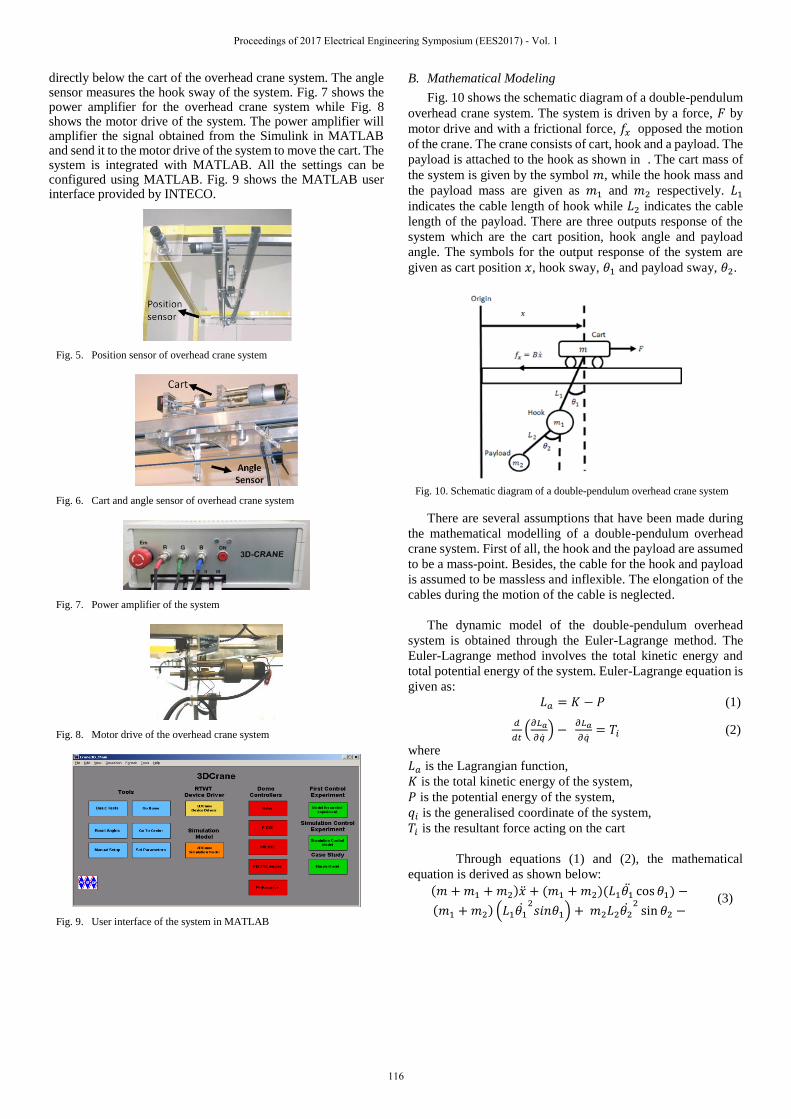
directly below the cart of the overhead crane system. The angle sensor measures the hook sway of the system. Fig. 7 shows the power amplifier for the overhead crane system while Fig. 8 shows the motor drive of the system. The power amplifier will amplifier the signal obtained from the Simulink in MATLAB and send it to the motor drive of the system to move the cart. The system is integrated with MATLAB. All the settings can be configured using MATLAB. Fig. 9 shows the MATLAB user interface provided by INTECO.
Fig. 5. Position sensor of overhead crane system
Fig. 6. Cart and angle sensor of overhead crane system
Fig. 7. Power amplifier of the system
Fig. 8. Motor drive of the overhead crane system
Fig. 9. User interface of the system in MATLAB
B. Mathematical Modeling
Fig. 10 shows the schematic diagram of a double-pendulum
overhead crane system. The system is driven by a force, 𝐹 by
motor drive and with a frictional force, 𝑓𝑥 opposed the motion
of the crane. The crane consists of cart, hook and a payload. The
payload is attached to the hook as shown in . The cart mass of
the system is given by the symbol 𝑚, while the hook mass and
the payload mass are given as 𝑚1 and 𝑚2 respectively. 𝐿1
indicates the cable length of hook while 𝐿2 indicates the cable
length of the payload. There are three outputs response of the
system which are the cart position, hook angle and payload
angle. The symbols for the output response of the system are
given as cart position 𝑥, hook sway, 𝜃1 and payload sway, 𝜃2.
Fig. 10. Schematic diagram of a double-pendulum overhead crane system
There are several assumptions that have been made during
the mathematical modelling of a double-pendulum overhead
crane system. First of all, the hook and the payload are assumed
to be a mass-point. Besides, the cable for the hook and payload
is assumed to be massless and inflexible. The elongation of the
cables during the motion of the cable is neglected.
The dynamic model of the double-pendulum overhead
system is obtained through the Euler-Lagrange method. The
Euler-Lagrange method involves the total kinetic energy and
total potential energy of the system. Euler-Lagrange equation is
given as:
𝐿𝑎 = 𝐾 − 𝑃 (1)
𝑑
𝑑𝑡(
𝜕𝐿𝑎
𝜕) −
𝜕𝐿𝑎
𝜕= 𝑇𝑖 (2)
where
𝐿𝑎 is the Lagrangian function,
𝐾 is the total kinetic energy of the system,
𝑃 is the potential energy of the system,
𝑞𝑖 is the generalised coordinate of the system,
𝑇𝑖 is the resultant force acting on the cart
Through equations (1) and (2), the mathematical
equation is derived as shown below:
(𝑚 + 𝑚1 + 𝑚2) + (𝑚1 + 𝑚2)(𝐿1𝜃1 cos 𝜃1) −
(𝑚1 + 𝑚2) (𝐿1𝜃12
𝑠𝑖𝑛𝜃1) + 𝑚2𝐿2𝜃22
sin 𝜃2 −(3)
Proceedings of 2017 Electrical Engineering Symposium (EES2017) - Vol. 1
116
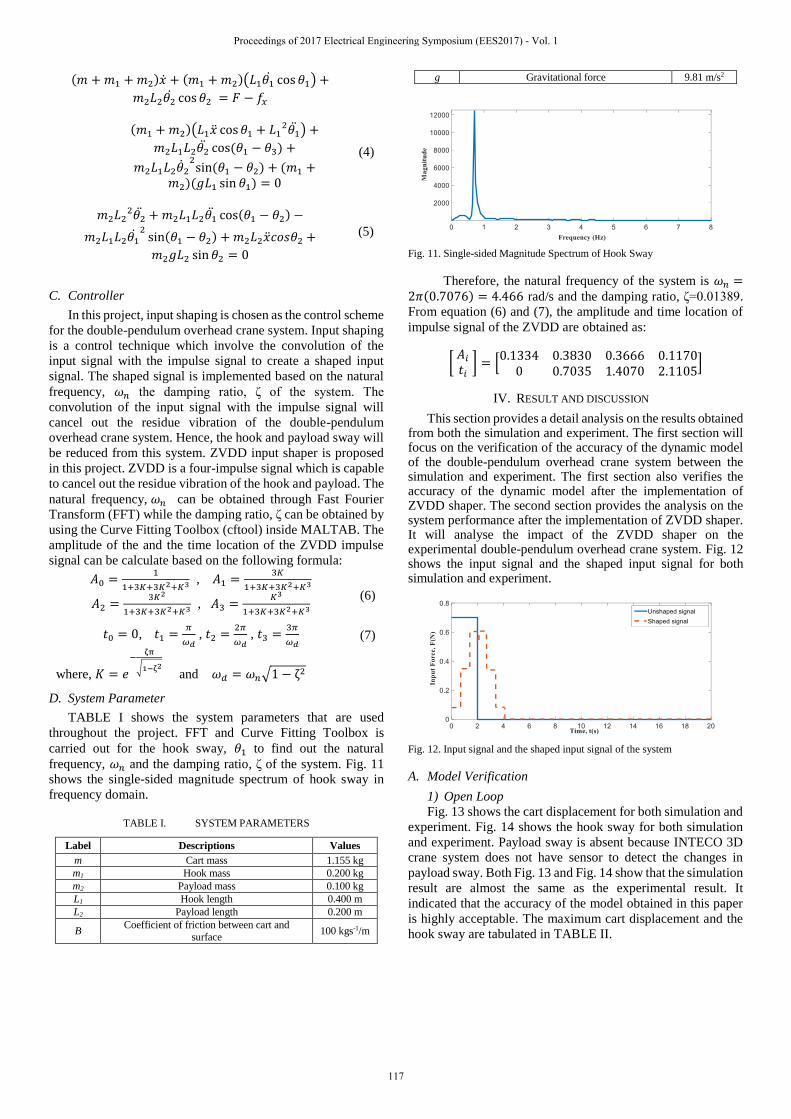
(𝑚 + 𝑚1 + 𝑚2) + (𝑚1 + 𝑚2)(𝐿1𝜃1 cos 𝜃1) +
𝑚2𝐿2𝜃2 cos 𝜃2 = 𝐹 − 𝑓𝑥
(𝑚1 + 𝑚2)(𝐿1 cos 𝜃1 + 𝐿12𝜃1) +
𝑚2𝐿1𝐿2𝜃2 cos(𝜃1 − 𝜃3) +
𝑚2𝐿1𝐿222
sin (𝜃1 − 𝜃2) + (𝑚1 +𝑚2)(𝑔𝐿1 sin 𝜃1) = 0
(4)
𝑚2𝐿22𝜃2 + 𝑚2𝐿1𝐿2𝜃1 cos(𝜃1 − 𝜃2) −
𝑚2𝐿1𝐿2𝜃12
sin(𝜃1 − 𝜃2) + 𝑚2𝐿2𝑐𝑜𝑠𝜃2 +
𝑚2𝑔𝐿2 sin 𝜃2 = 0
(5)
C. Controller
In this project, input shaping is chosen as the control scheme
for the double-pendulum overhead crane system. Input shaping
is a control technique which involve the convolution of the
input signal with the impulse signal to create a shaped input
signal. The shaped signal is implemented based on the natural
frequency, 𝜔𝑛 the damping ratio, ζ of the system. The
convolution of the input signal with the impulse signal will
cancel out the residue vibration of the double-pendulum
overhead crane system. Hence, the hook and payload sway will
be reduced from this system. ZVDD input shaper is proposed
in this project. ZVDD is a four-impulse signal which is capable
to cancel out the residue vibration of the hook and payload. The
natural frequency, 𝜔𝑛 can be obtained through Fast Fourier
Transform (FFT) while the damping ratio, ζ can be obtained by
using the Curve Fitting Toolbox (cftool) inside MALTAB. The
amplitude of the and the time location of the ZVDD impulse
signal can be calculate based on the following formula:
𝐴0 =1
1+3𝐾+3𝐾2+𝐾3 , 𝐴1 =3𝐾
1+3𝐾+3𝐾2+𝐾3
𝐴2 =3𝐾2
1+3𝐾+3𝐾2+𝐾3 , 𝐴3 =𝐾3
1+3𝐾+3𝐾2+𝐾3 (6)
𝑡0 = 0, 𝑡1 =𝜋
𝜔𝑑 , 𝑡2 =
2𝜋
𝜔𝑑 , 𝑡3 =
3𝜋
𝜔𝑑 (7)
where, 𝐾 = 𝑒
−ζπ
√1−ζ2 and 𝜔𝑑 = 𝜔𝑛√1 − ζ2
D. System Parameter
TABLE I shows the system parameters that are used
throughout the project. FFT and Curve Fitting Toolbox is
carried out for the hook sway, 𝜃1 to find out the natural
frequency, 𝜔𝑛 and the damping ratio, ζ of the system. Fig. 11
shows the single-sided magnitude spectrum of hook sway in
frequency domain.
TABLE I. SYSTEM PARAMETERS
Label Descriptions Values
m Cart mass 1.155 kg
m1 Hook mass 0.200 kg
m2 Payload mass 0.100 kg
L1 Hook length 0.400 m
L2 Payload length 0.200 m
B Coefficient of friction between cart and
surface 100 kgs-1/m
g Gravitational force 9.81 m/s2
Fig. 11. Single-sided Magnitude Spectrum of Hook Sway
Therefore, the natural frequency of the system is 𝜔𝑛 =2𝜋(0.7076) = 4.466 rad/s and the damping ratio, ζ=0.01389.
From equation (6) and (7), the amplitude and time location of
impulse signal of the ZVDD are obtained as:
[ 𝐴𝑖
𝑡𝑖 ] = [
0.1334 0.3830 0.3666 0.11700 0.7035 1.4070 2.1105
]
IV. RESULT AND DISCUSSION
This section provides a detail analysis on the results obtained from both the simulation and experiment. The first section will focus on the verification of the accuracy of the dynamic model of the double-pendulum overhead crane system between the simulation and experiment. The first section also verifies the accuracy of the dynamic model after the implementation of ZVDD shaper. The second section provides the analysis on the system performance after the implementation of ZVDD shaper. It will analyse the impact of the ZVDD shaper on the experimental double-pendulum overhead crane system. Fig. 12 shows the input signal and the shaped input signal for both simulation and experiment.
Fig. 12. Input signal and the shaped input signal of the system
A. Model Verification
1) Open Loop
Fig. 13 shows the cart displacement for both simulation and
experiment. Fig. 14 shows the hook sway for both simulation
and experiment. Payload sway is absent because INTECO 3D
crane system does not have sensor to detect the changes in
payload sway. Both Fig. 13 and Fig. 14 show that the simulation
result are almost the same as the experimental result. It
indicated that the accuracy of the model obtained in this paper
is highly acceptable. The maximum cart displacement and the
hook sway are tabulated in TABLE II.
Proceedings of 2017 Electrical Engineering Symposium (EES2017) - Vol. 1
117
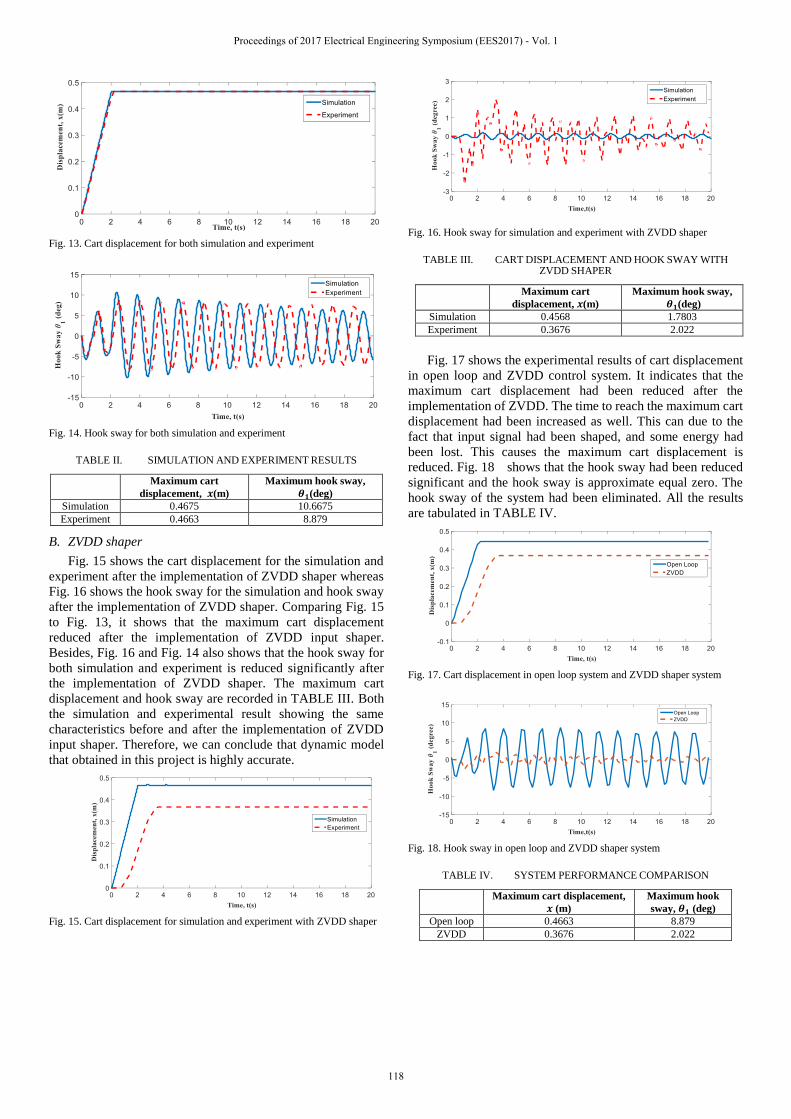
Fig. 13. Cart displacement for both simulation and experiment
Fig. 14. Hook sway for both simulation and experiment
TABLE II. SIMULATION AND EXPERIMENT RESULTS
Maximum cart
displacement, 𝒙(m)
Maximum hook sway,
𝜽𝟏(deg)
Simulation 0.4675 10.6675
Experiment 0.4663 8.879
B. ZVDD shaper
Fig. 15 shows the cart displacement for the simulation and
experiment after the implementation of ZVDD shaper whereas
Fig. 16 shows the hook sway for the simulation and hook sway
after the implementation of ZVDD shaper. Comparing Fig. 15
to Fig. 13, it shows that the maximum cart displacement
reduced after the implementation of ZVDD input shaper.
Besides, Fig. 16 and Fig. 14 also shows that the hook sway for
both simulation and experiment is reduced significantly after
the implementation of ZVDD shaper. The maximum cart
displacement and hook sway are recorded in TABLE III. Both
the simulation and experimental result showing the same
characteristics before and after the implementation of ZVDD
input shaper. Therefore, we can conclude that dynamic model
that obtained in this project is highly accurate.
Fig. 15. Cart displacement for simulation and experiment with ZVDD shaper
Fig. 16. Hook sway for simulation and experiment with ZVDD shaper
TABLE III. CART DISPLACEMENT AND HOOK SWAY WITH
ZVDD SHAPER
Maximum cart
displacement, 𝒙(m)
Maximum hook sway,
𝜽𝟏(deg)
Simulation 0.4568 1.7803
Experiment 0.3676 2.022
Fig. 17 shows the experimental results of cart displacement
in open loop and ZVDD control system. It indicates that the
maximum cart displacement had been reduced after the
implementation of ZVDD. The time to reach the maximum cart
displacement had been increased as well. This can due to the
fact that input signal had been shaped, and some energy had
been lost. This causes the maximum cart displacement is
reduced. Fig. 18 shows that the hook sway had been reduced
significant and the hook sway is approximate equal zero. The
hook sway of the system had been eliminated. All the results
are tabulated in TABLE IV.
Fig. 17. Cart displacement in open loop system and ZVDD shaper system
Fig. 18. Hook sway in open loop and ZVDD shaper system
TABLE IV. SYSTEM PERFORMANCE COMPARISON
Maximum cart displacement,
𝒙 (m)
Maximum hook
sway, 𝜽𝟏 (deg)
Open loop 0.4663 8.879
ZVDD 0.3676 2.022
Proceedings of 2017 Electrical Engineering Symposium (EES2017) - Vol. 1
118
V. CONCLUSION
As a conclusion, the dynamic model of the double-
pendulum overhead crane system had been verified and it is
highly accurate. The implementation of ZVDD as input shaper
has successfully eliminate the hook and payload sway as well
as the double-pendulum dynamics.
REFERENCE
[1] A. Karajgikar, J. Vaughan., W. Singhose, "Double-pendulum crane operator performance comparing PD-feedback control and input shaping," Eccomas Thematic Conference, Brussels, Belgium, 4-7 July 2011
[2] D. Qian, S. Tong., B. Yang, S. Lee, "Design of simultaneous input-shaping-based SI”, Technical Sciences, 2015
[3] Guo Weiping, Liu Diantong, Yi Jianqiang and Zhao Dongbin, "Passivity-based-control for double-pendulum-type overhead cranes," 2004 IEEE Region 10 Conference TENCON 2004., 2004, pp. 546-549 Vol. 4
[4] M. Kenison, W. Singhose, “Input Shaper Design for Double-Pendulum Planar Gantry Cranes,” Proceedings of the 1999 IEEE International Conference on Control Applications, Hawai’I, USA, August 22-27, 1999, pp.539-544
[5] J. Vaughan, E. Maleki and W. Singhose, "Advantages of using command shaping over feedback for crane control," Proceedings of the 2010 American Control Conference, Baltimore, MD, 2010, pp. 2308-2313.
[6] Zhang, M., et al., “Adaptive tracking control for double-pendulum overhead cranes subject to tracking error limitation, parametric uncertainties and external disturbances.” Mechanical Systems and Signal Processing, 2016. 76–77: p. 15-32.
[7] J. Vaughan, D. Kim and W. Singhose, "Control of Tower Cranes With Double-Pendulum Payload Dynamics," in IEEE Transactions on Control Systems Technology, vol. 18, no. 6, pp.1345-1358, Nov.2010.
[8] Qian, D., S. Tong, and S. Lee, “Fuzzy-Logic-based control of payloads subjected to double-pendulum motion in overhead cranes.” Automation in Construction, 2016. 65: p. 133-143.
[9] [9] Kim, D. and W. Singhose, “Performance studies of human operators driving double-pendulum bridge cranes.” Control Engineering Practice, 2010. 18(6): p. 567-576.
[10] M. A. Ahmad, R. M. T. Raja Ismail, M. S. Ramli and N. Hambali, "Investigations of NCTF with input shaping for sway control of a double-
pendulum-type overhead crane," 2010 2nd International Conference on Advanced Computer Control, Shenyang, 2010, pp. 456-461
[11] Huang, J., Z. Liang, and Q. Zang, “Dynamics and swing control of double-pendulum bridge cranes with distributed-mass beams.” Mechanical Systems and Signal Processing, 2015. 54–55: p. 357-366.
[12] W. Singhose, D. Kim, and M. Kenison, “Input Shaping Control of Double-Pendulum Bridge Crane Oscillations.” Journal of Dynamic Systems, Measurement, and Control, 2008. 130(3): p. 034504-034504.
[13] O'Connor, W. and Habibi, H., “Gantry crane control of a double-pendulum, distributed-mass load, using mechanical wave concepts”, Mechanical Science, 4, 251-261, 2013.
[14] D. Kim and W. Singhose, “Reduction of Double-Pendulum Bridge Crane Oscillations”, The 8th International Conference on Motion and Vibration Control (MOVIC 2006), KAIST, Daejeon, Korea, August 27 - 30, 2006, pp.300 -305
[15] W. E. Singhose and S. T. Towell, "Double-pendulum gantry crane dynamics and control," Proceedings of the 1998 IEEE International Conference on Control Applications (Cat. No.98CH36104), Trieste, 1998, pp. 1205-1209 vol.2.
[16] Kyung-Tae Hong, Chang-Do Huh, Keum-Shik Hong, "Command Shaping Control for Limiting The Transient Sway Angle of Crane System." International Journal of Control, Automation and Systems, Vol. 1, No.1 , March 2003, pp.43-52
[17] M. A. Ahmad, R. M. T. R. Ismail, M. S. Ramli, A. N. K. Nasir and N. Hambali, "Feed-forward Techniques for Sway Suppression in a Double-Pendulum-Type Overhead Crane," 2009 International Conference on Computer Technology and Development, Kota Kinabalu, 2009, pp. 173-178.
[18] M. A. Ahmad, R. M. T. Raja Ismail, M. S. Ramli and N. Hambali, "Comparative assessment of feed-forward schemes with NCTF for sway and trajectory control of a DPTOC," 2010 International Conference on Intelligent and Advanced Systems, Kuala Lumpur, Malaysia, 2010, pp. 1-6.
[19] M. Adeli, H. Zarabadipour, S. H. Zarabadi and M. A. Shoorehdeli, "Anti-swing control for a double-pendulum-type overhead crane via parallel distributed fuzzy LQR controller combined with genetic fuzzy rule set selection," 2011 IEEE International Conference on Control System, Computing and Engineering, Penang, 2011, pp. 306-311.
[20] E. Maleki, W. Singhose and S. Srinivasan, "Positioning and control of boom crane luffing with double-pendulum payloads," 2010 IEEE International Conference on Control Applications, Yokohama, 2010, pp. 1319-1324.
Proceedings of 2017 Electrical Engineering Symposium (EES2017) - Vol. 1
119

Smart Home Security System with Iot
Muhammad Nasrullah Bin Mustaffar
Faculty of Electrical Engineering
Universiti Teknologi Malaysia
Johor Bahru, Malaysia.
Norhaliza Abdul Wahab
Department of Control and Mechatronic Engineering
Universiti Teknologi Malaysia
Johor Bahru, Malaysia.
Abstract—This paper presents a smart home security system
that have been integrated with IoT applications to make the system
easily access from anywhere as long as internet connection is there.
Home security become more crucial in our lives as the possibilities
of intrusion increase day by day. The method for this home
security system are using magnetic contact door and IR as the
sensor to detect any breaches and activate the system with locking
the door using solenoid lock. Buzzer and the RGB led are used to
alert the user and surrounding neighbors. Internet apps is used to
activate the system and give alert if any door has been breaches.
Hardware of this system are Arduino Mega 2560 and ESP 8266 as
the microcontroller. Arduino IDE also used for the programming
of this security system.
Keywords—microcontroller, smart home, security, quality of
edutainment
I. INTRODUCTION
Smart Home Security system can also be known as the
intelligent security system which can help reduce the intrusion
that had been increased every day. Nowadays, the security
system is very important to protect our family and help reduce
the crime rates. Different home use different automation
security system as long as they can provide safety to the owner,
efficient and convenient [1]. Some of the security system, they
use security officers to guard the house, alarm to alert the user
and the thief, monitoring system using CCTV and much more
with the new production of electronic hardware and software.
Home need to be monitored at all times from the theft as the
rate of crime involving robbery and murder are increasing
recently. So, home monitoring system should be improved and
upgraded to be more efficient to reduce crime rate.
Various method can be integrated to improve the smart
home security system than only security monitoring and the
using of security officers to guard the house. Unfortunately,
both these methods are less reliable, wasteful and not suitable
as our era become more modern. All of the system need to work
more effective by giving user advantage to monitor their home
even not at their home. In other words, manual method is no
longer reliable and need to change to the automated system that
give the user to monitor the system. This automated system may
help prevent human error and save more resources to help
improve other system to make the home more modern and
friendly to the user[2].
Automated security system provides extra layer of the
security by using user authentication to avoid break-ins in the
house and track the intruder movement. Sensor-based system
such as IR sensor is used to detect any movement across the
house. Alarm module is used to improve the system security of
each home from the intruder.
In this project, the objectives are:
i. To develop the home security system with IoT
applications built in the system.
ii. To design a system that can be easily maintenance
and monitored.
iii. To develop efficient system by reducing the cost
installation and maintenance.
iv. To expose this advance security system with IoT
integrated in the system for the use to use in their
daily life.
The scope of the project will make the security system
portable and can be control by smartphones with internet. This
system also can detect any intruder in the house and alert the
user by alarm and notifications. Hardware of this system is
using Arduino MEGA 2560 as the microcontroller of the
system. The system will be used when user went hometown or
not in the house.
II. LITERATURE REVIEW
In understanding the concept of the security system. This
literature review will explain a few projects that are related with
this project especially their methods and implementation.
A. The Internet of Things in Home Security System: An
Overview
In this project, the home security system is integrated with IoT applications where any objects such as smartphones, Internet TVs, sensors and actuators are connected to the Internet where the devices are intelligently linked together enabling new forms of communication between things and people, and between things themselves [3]. Different devices and the hardware such as home security, sensors, appliances and system are now being connected to the internet so that it can be controlled remotely using the smartphones. Not only the devices
Proceedings of 2017 Electrical Engineering Symposium (EES2017) - Vol. 1
120
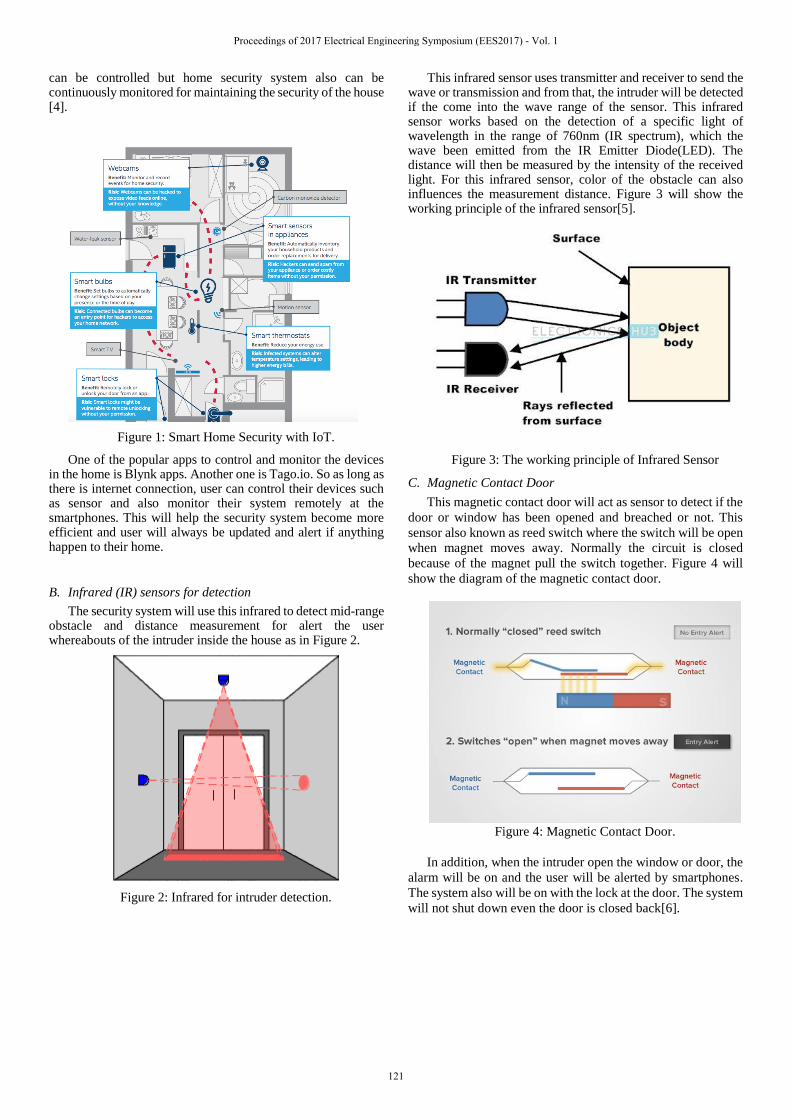
can be controlled but home security system also can be continuously monitored for maintaining the security of the house [4].
Figure 1: Smart Home Security with IoT.
One of the popular apps to control and monitor the devices in the home is Blynk apps. Another one is Tago.io. So as long as there is internet connection, user can control their devices such as sensor and also monitor their system remotely at the smartphones. This will help the security system become more efficient and user will always be updated and alert if anything happen to their home.
B. Infrared (IR) sensors for detection
The security system will use this infrared to detect mid-range obstacle and distance measurement for alert the user whereabouts of the intruder inside the house as in Figure 2.
Figure 2: Infrared for intruder detection.
This infrared sensor uses transmitter and receiver to send the wave or transmission and from that, the intruder will be detected if the come into the wave range of the sensor. This infrared sensor works based on the detection of a specific light of wavelength in the range of 760nm (IR spectrum), which the wave been emitted from the IR Emitter Diode(LED). The distance will then be measured by the intensity of the received light. For this infrared sensor, color of the obstacle can also influences the measurement distance. Figure 3 will show the working principle of the infrared sensor[5].
Figure 3: The working principle of Infrared Sensor
C. Magnetic Contact Door
This magnetic contact door will act as sensor to detect if the
door or window has been opened and breached or not. This
sensor also known as reed switch where the switch will be open
when magnet moves away. Normally the circuit is closed
because of the magnet pull the switch together. Figure 4 will
show the diagram of the magnetic contact door.
Figure 4: Magnetic Contact Door.
In addition, when the intruder open the window or door, the
alarm will be on and the user will be alerted by smartphones.
The system also will be on with the lock at the door. The system
will not shut down even the door is closed back[6].
Proceedings of 2017 Electrical Engineering Symposium (EES2017) - Vol. 1
121
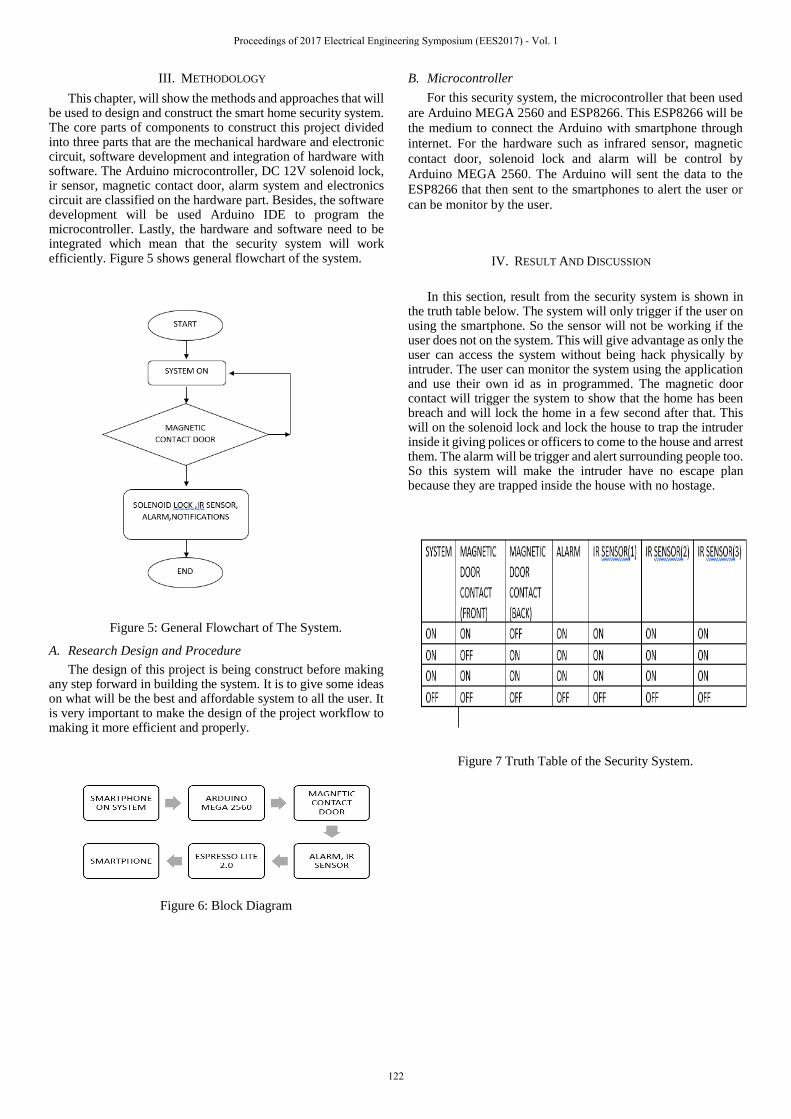
III. METHODOLOGY
This chapter, will show the methods and approaches that will be used to design and construct the smart home security system. The core parts of components to construct this project divided into three parts that are the mechanical hardware and electronic circuit, software development and integration of hardware with software. The Arduino microcontroller, DC 12V solenoid lock, ir sensor, magnetic contact door, alarm system and electronics circuit are classified on the hardware part. Besides, the software development will be used Arduino IDE to program the microcontroller. Lastly, the hardware and software need to be integrated which mean that the security system will work efficiently. Figure 5 shows general flowchart of the system.
Figure 5: General Flowchart of The System.
A. Research Design and Procedure
The design of this project is being construct before making any step forward in building the system. It is to give some ideas on what will be the best and affordable system to all the user. It is very important to make the design of the project workflow to making it more efficient and properly.
Figure 6: Block Diagram
B. Microcontroller
For this security system, the microcontroller that been used
are Arduino MEGA 2560 and ESP8266. This ESP8266 will be
the medium to connect the Arduino with smartphone through
internet. For the hardware such as infrared sensor, magnetic
contact door, solenoid lock and alarm will be control by
Arduino MEGA 2560. The Arduino will sent the data to the
ESP8266 that then sent to the smartphones to alert the user or
can be monitor by the user.
IV. RESULT AND DISCUSSION
In this section, result from the security system is shown in
the truth table below. The system will only trigger if the user on using the smartphone. So the sensor will not be working if the user does not on the system. This will give advantage as only the user can access the system without being hack physically by intruder. The user can monitor the system using the application and use their own id as in programmed. The magnetic door contact will trigger the system to show that the home has been breach and will lock the home in a few second after that. This will on the solenoid lock and lock the house to trap the intruder inside it giving polices or officers to come to the house and arrest them. The alarm will be trigger and alert surrounding people too. So this system will make the intruder have no escape plan because they are trapped inside the house with no hostage.
Figure 7 Truth Table of the Security System.
Proceedings of 2017 Electrical Engineering Symposium (EES2017) - Vol. 1
122

V. CONCLUSION
This smart home security system was very successful in the
system meet all the requirement and can reduce the crime rate.
It also meets the required capabilities and objectives as been
targeted. The hardware and programming parts is achieving
satisfaction level and for the future improvement it is
recommended to have an PIR sensor to make sure the
sensitivity and range more better and have built in camera to
monitor inside the house. Thus, it will become more secure and
efficient security system.
REFERENCES
[1] Cyril Jose, A. and Malekian, R. (2015) Smart Home Automation Security: A Literature Review. Smart Computing Re
[2] Bangali, J. and Shaligram, A. (2013) Design and Implementation of Security Systems for Smart Home Based on GSM Technology. International Journal of Smart Home, 7, 201-208. http://dx.doi.org/10.14257/ijsh.2013.7.6.19
[3] G. Kortuem, F. Kawsar, D. Fitton, and V. Sundramoorthy, "Smart objects as building blocks for the internet of things," Internet Computing, IEEE, vol. 14, pp. 44-51, 2010.
[4] C.-H. Chen, C.-C. Gao, and J.-J. Chen, "Intelligent Home Energy Conservation System Based On WSN," presented at the International Conference on Electrical, Electronics and Civil Engineering, Pattaya, 2011. Done
[5] M.R. Yaacob, N.S.N. Anwar, A.M. Kassim, 2012, ACEEE International Journal on Electrical and Power Engineering , Vol.3, No.2.Giaimo, C. (2017). Door Sensor Secrets: What They Are, How They Work & 6 Unexpected Uses. [online] SimpliSafe Blog.
Proceedings of 2017 Electrical Engineering Symposium (EES2017) - Vol. 1
123
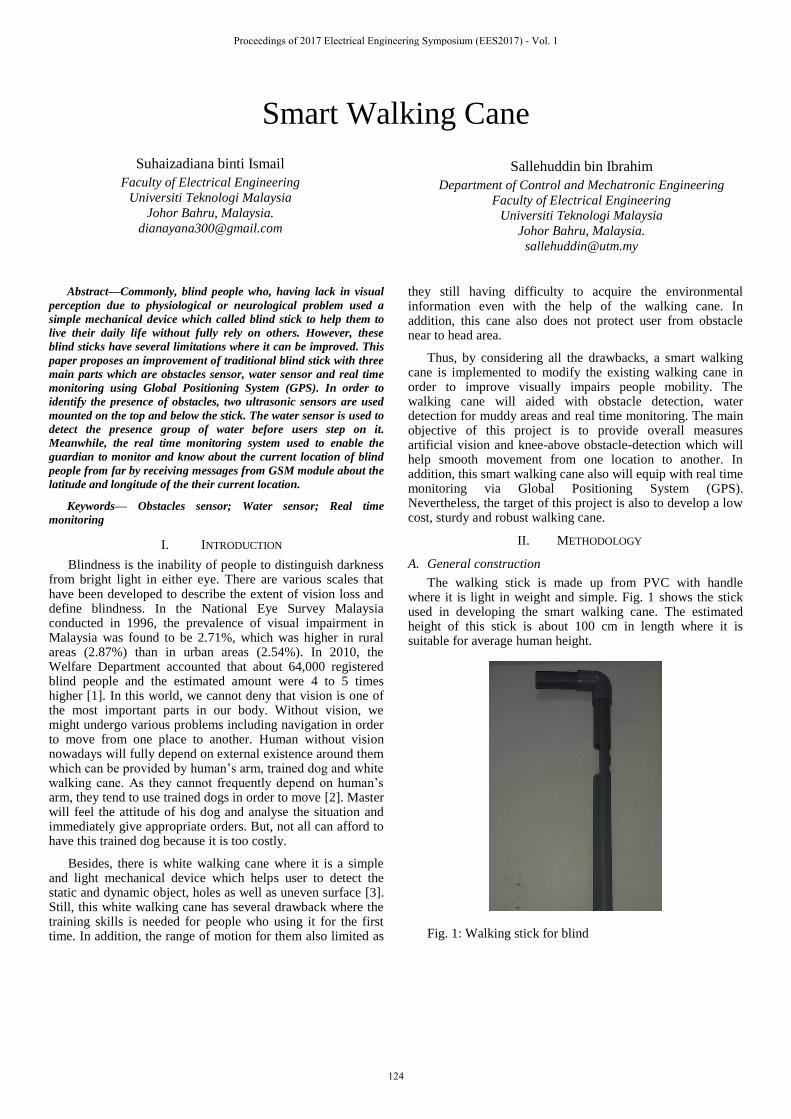
Smart Walking Cane
Suhaizadiana binti Ismail
Faculty of Electrical Engineering
Universiti Teknologi Malaysia
Johor Bahru, Malaysia.
Sallehuddin bin Ibrahim
Department of Control and Mechatronic Engineering
Faculty of Electrical Engineering
Universiti Teknologi Malaysia
Johor Bahru, Malaysia.
Abstract—Commonly, blind people who, having lack in visual
perception due to physiological or neurological problem used a
simple mechanical device which called blind stick to help them to
live their daily life without fully rely on others. However, these
blind sticks have several limitations where it can be improved. This
paper proposes an improvement of traditional blind stick with three
main parts which are obstacles sensor, water sensor and real time
monitoring using Global Positioning System (GPS). In order to
identify the presence of obstacles, two ultrasonic sensors are used
mounted on the top and below the stick. The water sensor is used to
detect the presence group of water before users step on it.
Meanwhile, the real time monitoring system used to enable the
guardian to monitor and know about the current location of blind
people from far by receiving messages from GSM module about the
latitude and longitude of the their current location.
Keywords— Obstacles sensor; Water sensor; Real time
monitoring
I. INTRODUCTION
Blindness is the inability of people to distinguish darkness from bright light in either eye. There are various scales that have been developed to describe the extent of vision loss and define blindness. In the National Eye Survey Malaysia conducted in 1996, the prevalence of visual impairment in Malaysia was found to be 2.71%, which was higher in rural areas (2.87%) than in urban areas (2.54%). In 2010, the Welfare Department accounted that about 64,000 registered blind people and the estimated amount were 4 to 5 times higher [1]. In this world, we cannot deny that vision is one of the most important parts in our body. Without vision, we might undergo various problems including navigation in order to move from one place to another. Human without vision nowadays will fully depend on external existence around them which can be provided by human’s arm, trained dog and white walking cane. As they cannot frequently depend on human’s arm, they tend to use trained dogs in order to move [2]. Master will feel the attitude of his dog and analyse the situation and immediately give appropriate orders. But, not all can afford to have this trained dog because it is too costly.
Besides, there is white walking cane where it is a simple and light mechanical device which helps user to detect the static and dynamic object, holes as well as uneven surface [3]. Still, this white walking cane has several drawback where the training skills is needed for people who using it for the first time. In addition, the range of motion for them also limited as
they still having difficulty to acquire the environmental information even with the help of the walking cane. In addition, this cane also does not protect user from obstacle near to head area.
Thus, by considering all the drawbacks, a smart walking cane is implemented to modify the existing walking cane in order to improve visually impairs people mobility. The walking cane will aided with obstacle detection, water detection for muddy areas and real time monitoring. The main objective of this project is to provide overall measures artificial vision and knee-above obstacle-detection which will help smooth movement from one location to another. In addition, this smart walking cane also will equip with real time monitoring via Global Positioning System (GPS). Nevertheless, the target of this project is also to develop a low cost, sturdy and robust walking cane.
II. METHODOLOGY
A. General construction
The walking stick is made up from PVC with handle where it is light in weight and simple. Fig. 1 shows the stick used in developing the smart walking cane. The estimated height of this stick is about 100 cm in length where it is suitable for average human height.
Fig. 1: Walking stick for blind
Proceedings of 2017 Electrical Engineering Symposium (EES2017) - Vol. 1
124

B. Project overview
This project involved both hardware and software. In hardware, there are six components are used such as arduino UNO, ultrasonic sensors, vibrator, buzzer, GPS and GSM module. The arduino UNO is used as microcontroller for overall system such as obstacles detection and real time monitoring. In order to sense the obstacles, ultrasonic sensors are used together with vibrator as indicator. Buzzer is used in water sensor and acts as an alarm that alert user when the present of water is detected. Next, GPS module is working together with GSM module in providing a real time monitoring for guardian. As for software part, it involved the coding and programming of arduino UNO for both obstacles detection and the real time monitoring.
The proposed system consists of three main units which are water sensor unit, obstacles detection unit and GPS tracker unit.
a. Water sensor unit
This unit is designed to avoid user from getting wet by alarm them with beeping sound from buzzer as indicator. This unit involved several components such as 220 kilo ohm resistor, 0.01 microfarad ceramic capacitor, 1 microfarad electrolyte capacitor, IC 555 and a buzzer. Fig. 2 show component that involved in water sensor unit:
Fig. 2: Component involved in water sensor unit
b. Obstacles detection unit
This unit aims for enable the blind people to walk freely and smoothly without having worried of bumping into any kind of obstruction or obstacles present in their path.
Fig. 3: Overall connection of obstacles detection unit
Fig. 3 shows the overall connection of obstacles detection unit. There are two HC-SR04 ultrasonic sensors with 4 pin which are VCC, GND, Echo and Trig which located both above and below knee to detect the obstacles. As shown is figure above, Echo and Trig pin for both ultrasonic sensors are connected to pin 9 and pin 8 of arduino UNO. This sensor uses sonar to determine the distance to an object. It is non-contact type sensor with high accuracy and stable reading. It can detect up to 400 centimetres range. This unit will alarm user by mini vibration motor where it producing vibration according to voltage supplied. This unit also equipped with slide switch. Users need to slide it to power up and power off when the stick not in used in order to save the power usage.is not in use.
c. Real time monitoring unit
This real time monitoring unit mainly designed for the blind guardian to monitor and know the current location of the blind people from far. The GPS module works together with GSM module and provide the latitude and longitude of current location through message.
Fig. 4: Connection of real time monitoring unit
Fig. 4 shows the connection of real time monitoring system. The type GPS module used is SKM53 Skylab where it has 4 pins which are VSS, GND, TX and RX. While, type of GSM used is sim900a with 4 pins which are VCC, GND, 5VT which is TX and 5VR which is RX. Both modules are powered up by arduino UNO. TX and RX of GPS module are connected to pin 6 and 7 respectively while TX and RX of GSM module are connected to RX and TX of the arduino UNO.
This smart walking cane is not only focused on adult, but it is also can be used for children who having visual impaired since childhood. As for parents who having children with visual impairments, they must be worried about their child whereabouts whenever they are working. This real time monitoring will decrease the worries as they can know the exact location and monitor them even from far. Besides, this unit also can be used for blind people for them to know their current location from latitude and longitude receives from message. They can use blind short message service (sms) reader application to read the message.
GPS
module
GSM
module
Proceedings of 2017 Electrical Engineering Symposium (EES2017) - Vol. 1
125
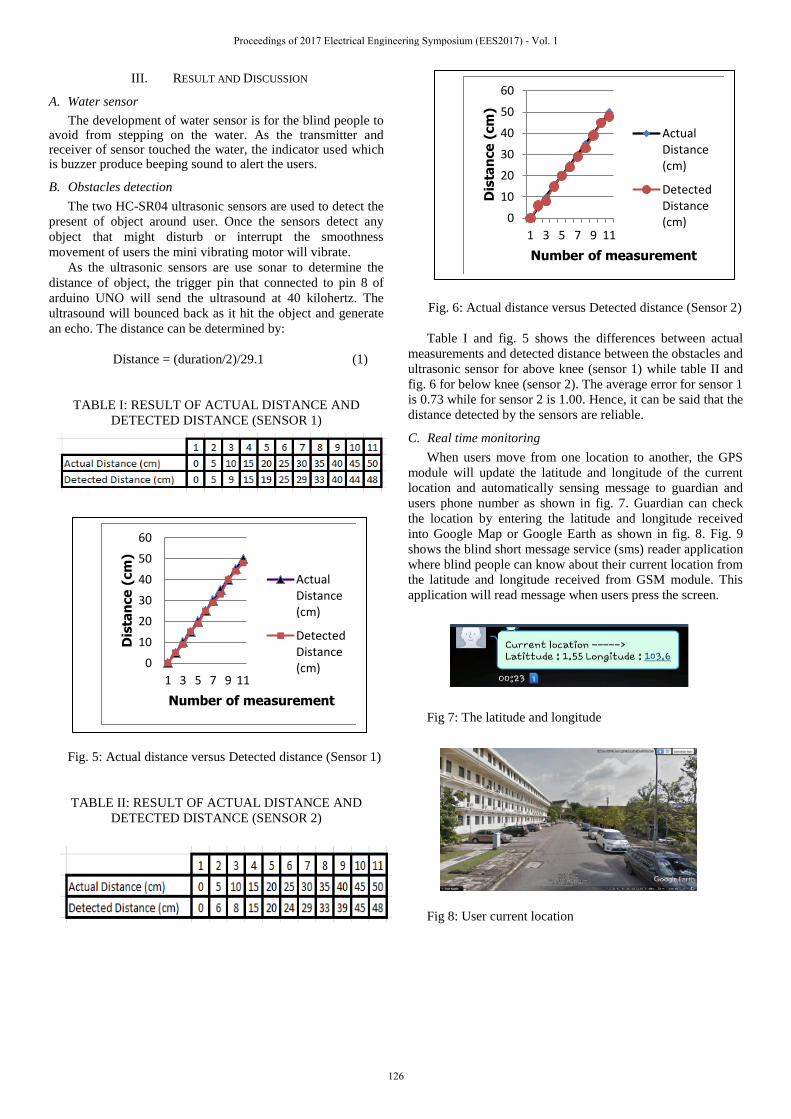
III. RESULT AND DISCUSSION
A. Water sensor
The development of water sensor is for the blind people to avoid from stepping on the water. As the transmitter and receiver of sensor touched the water, the indicator used which is buzzer produce beeping sound to alert the users.
B. Obstacles detection
The two HC-SR04 ultrasonic sensors are used to detect the
present of object around user. Once the sensors detect any
object that might disturb or interrupt the smoothness
movement of users the mini vibrating motor will vibrate.
As the ultrasonic sensors are use sonar to determine the
distance of object, the trigger pin that connected to pin 8 of
arduino UNO will send the ultrasound at 40 kilohertz. The
ultrasound will bounced back as it hit the object and generate
an echo. The distance can be determined by:
Distance = (duration/2)/29.1 (1)
TABLE I: RESULT OF ACTUAL DISTANCE AND
DETECTED DISTANCE (SENSOR 1)
Fig. 5: Actual distance versus Detected distance (Sensor 1)
TABLE II: RESULT OF ACTUAL DISTANCE AND
DETECTED DISTANCE (SENSOR 2)
Fig. 6: Actual distance versus Detected distance (Sensor 2)
Table I and fig. 5 shows the differences between actual
measurements and detected distance between the obstacles and
ultrasonic sensor for above knee (sensor 1) while table II and
fig. 6 for below knee (sensor 2). The average error for sensor 1
is 0.73 while for sensor 2 is 1.00. Hence, it can be said that the
distance detected by the sensors are reliable.
C. Real time monitoring
When users move from one location to another, the GPS
module will update the latitude and longitude of the current
location and automatically sensing message to guardian and
users phone number as shown in fig. 7. Guardian can check
the location by entering the latitude and longitude received
into Google Map or Google Earth as shown in fig. 8. Fig. 9
shows the blind short message service (sms) reader application
where blind people can know about their current location from
the latitude and longitude received from GSM module. This
application will read message when users press the screen.
Fig 7: The latitude and longitude
Fig 8: User current location
0
10
20
30
40
50
60
1 3 5 7 9 11
Dis
tan
ce
(cm
)
Number of measurement
ActualDistance(cm)
DetectedDistance(cm)
0
10
20
30
40
50
60
1 3 5 7 9 11
Dis
tan
ce
(cm
)
Number of measurement
ActualDistance(cm)
DetectedDistance(cm)
Proceedings of 2017 Electrical Engineering Symposium (EES2017) - Vol. 1
126
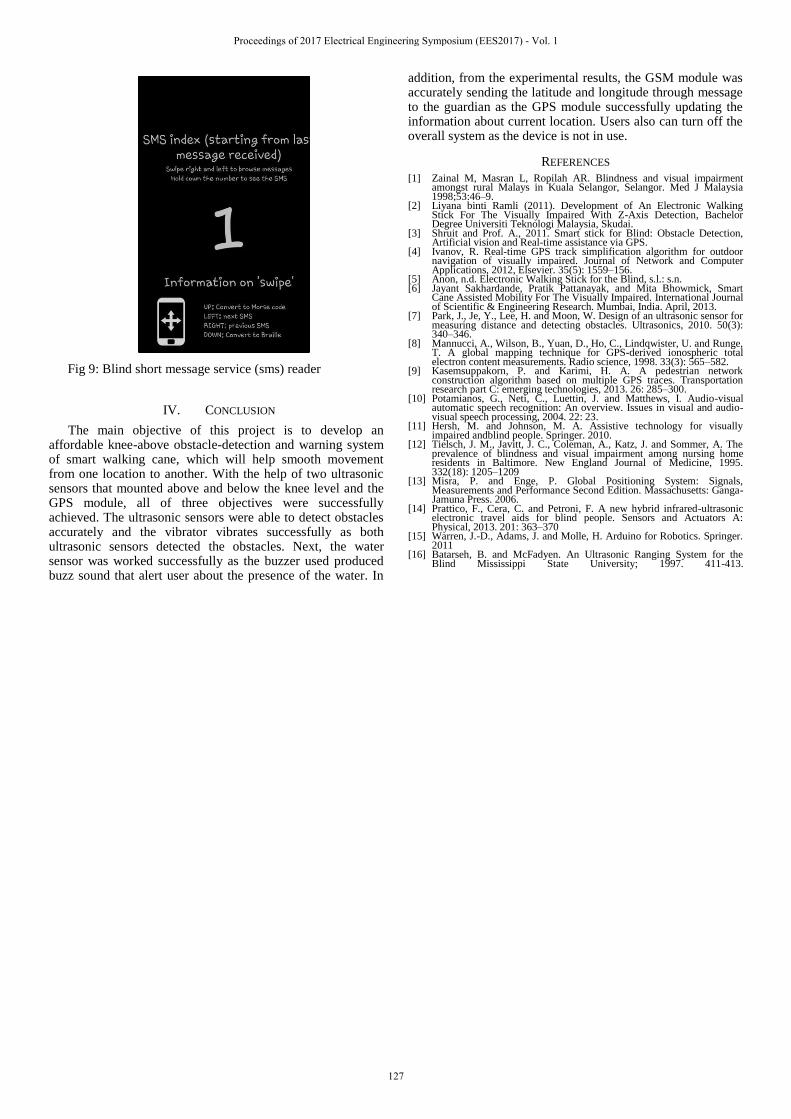
Fig 9: Blind short message service (sms) reader
IV. CONCLUSION
The main objective of this project is to develop an affordable knee-above obstacle-detection and warning system of smart walking cane, which will help smooth movement from one location to another. With the help of two ultrasonic sensors that mounted above and below the knee level and the GPS module, all of three objectives were successfully achieved. The ultrasonic sensors were able to detect obstacles accurately and the vibrator vibrates successfully as both ultrasonic sensors detected the obstacles. Next, the water sensor was worked successfully as the buzzer used produced buzz sound that alert user about the presence of the water. In
addition, from the experimental results, the GSM module was accurately sending the latitude and longitude through message to the guardian as the GPS module successfully updating the information about current location. Users also can turn off the overall system as the device is not in use.
REFERENCES
[1] Zainal M, Masran L, Ropilah AR. Blindness and visual impairment amongst rural Malays in Kuala Selangor, Selangor. Med J Malaysia 1998;53:46–9.
[2] Liyana binti Ramli (2011). Development of An Electronic Walking Stick For The Visually Impaired With Z-Axis Detection, Bachelor Degree Universiti Teknologi Malaysia, Skudai.
[3] Shruit and Prof. A., 2011. Smart stick for Blind: Obstacle Detection, Artificial vision and Real-time assistance via GPS.
[4] Ivanov, R. Real-time GPS track simplification algorithm for outdoor navigation of visually impaired. Journal of Network and Computer Applications, 2012, Elsevier. 35(5): 1559–156.
[5] Anon, n.d. Electronic Walking Stick for the Blind, s.l.: s.n. [6] Jayant Sakhardande, Pratik Pattanayak, and Mita Bhowmick, Smart
Cane Assisted Mobility For The Visually Impaired. International Journal of Scientific & Engineering Research. Mumbai, India. April, 2013.
[7] Park, J., Je, Y., Lee, H. and Moon, W. Design of an ultrasonic sensor for measuring distance and detecting obstacles. Ultrasonics, 2010. 50(3): 340–346.
[8] Mannucci, A., Wilson, B., Yuan, D., Ho, C., Lindqwister, U. and Runge, T. A global mapping technique for GPS-derived ionospheric total electron content measurements. Radio science, 1998. 33(3): 565–582.
[9] Kasemsuppakorn, P. and Karimi, H. A. A pedestrian network construction algorithm based on multiple GPS traces. Transportation research part C: emerging technologies, 2013. 26: 285–300.
[10] Potamianos, G., Neti, C., Luettin, J. and Matthews, I. Audio-visual automatic speech recognition: An overview. Issues in visual and audio-visual speech processing, 2004. 22: 23.
[11] Hersh, M. and Johnson, M. A. Assistive technology for visually impaired andblind people. Springer. 2010.
[12] Tielsch, J. M., Javitt, J. C., Coleman, A., Katz, J. and Sommer, A. The prevalence of blindness and visual impairment among nursing home residents in Baltimore. New England Journal of Medicine, 1995. 332(18): 1205–1209
[13] Misra, P. and Enge, P. Global Positioning System: Signals, Measurements and Performance Second Edition. Massachusetts: Ganga-Jamuna Press. 2006.
[14] Prattico, F., Cera, C. and Petroni, F. A new hybrid infrared-ultrasonic electronic travel aids for blind people. Sensors and Actuators A: Physical, 2013. 201: 363–370
[15] Warren, J.-D., Adams, J. and Molle, H. Arduino for Robotics. Springer. 2011
[16] Batarseh, B. and McFadyen. An Ultrasonic Ranging System for the Blind Mississippi State University; 1997. 411-413.
Proceedings of 2017 Electrical Engineering Symposium (EES2017) - Vol. 1
127
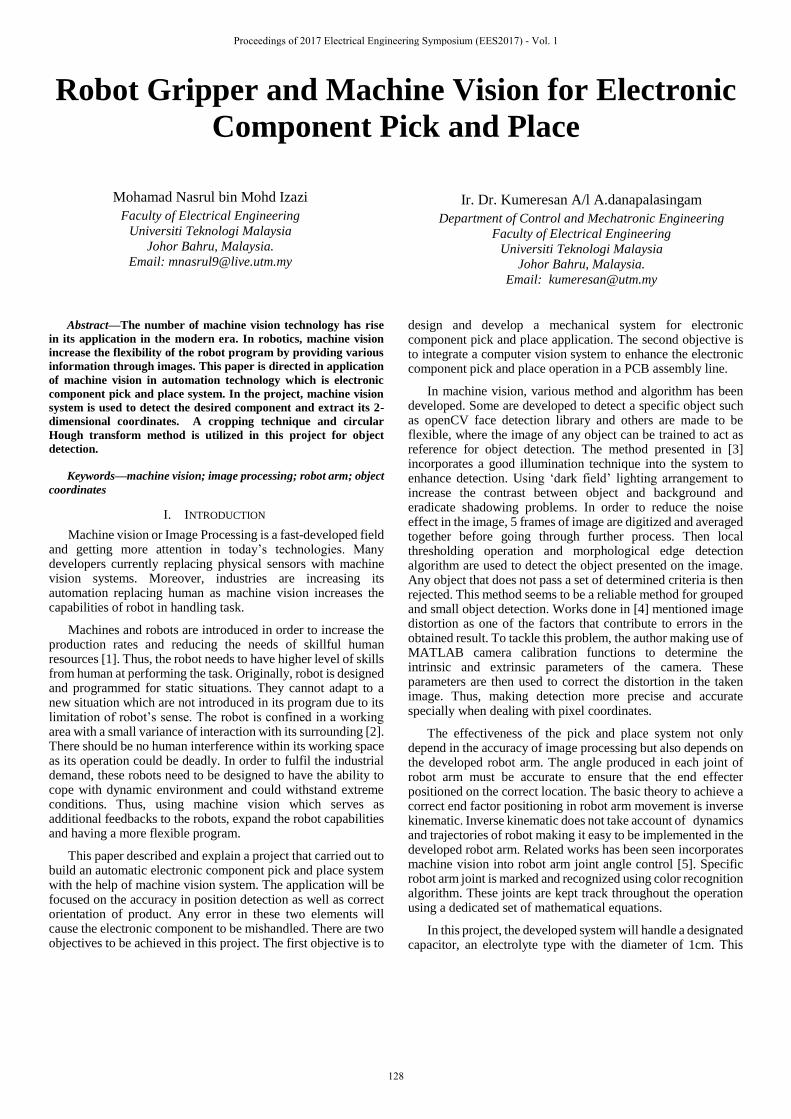
Robot Gripper and Machine Vision for Electronic
Component Pick and Place
Mohamad Nasrul bin Mohd Izazi
Faculty of Electrical Engineering
Universiti Teknologi Malaysia
Johor Bahru, Malaysia.
Email: [email protected]
Ir. Dr. Kumeresan A/l A.danapalasingam
Department of Control and Mechatronic Engineering
Faculty of Electrical Engineering
Universiti Teknologi Malaysia
Johor Bahru, Malaysia.
Email: [email protected]
Abstract—The number of machine vision technology has rise
in its application in the modern era. In robotics, machine vision
increase the flexibility of the robot program by providing various
information through images. This paper is directed in application
of machine vision in automation technology which is electronic
component pick and place system. In the project, machine vision
system is used to detect the desired component and extract its 2-
dimensional coordinates. A cropping technique and circular
Hough transform method is utilized in this project for object
detection.
Keywords—machine vision; image processing; robot arm; object
coordinates
I. INTRODUCTION
Machine vision or Image Processing is a fast-developed field and getting more attention in today’s technologies. Many developers currently replacing physical sensors with machine vision systems. Moreover, industries are increasing its automation replacing human as machine vision increases the capabilities of robot in handling task.
Machines and robots are introduced in order to increase the production rates and reducing the needs of skillful human resources [1]. Thus, the robot needs to have higher level of skills from human at performing the task. Originally, robot is designed and programmed for static situations. They cannot adapt to a new situation which are not introduced in its program due to its limitation of robot’s sense. The robot is confined in a working area with a small variance of interaction with its surrounding [2]. There should be no human interference within its working space as its operation could be deadly. In order to fulfil the industrial demand, these robots need to be designed to have the ability to cope with dynamic environment and could withstand extreme conditions. Thus, using machine vision which serves as additional feedbacks to the robots, expand the robot capabilities and having a more flexible program.
This paper described and explain a project that carried out to build an automatic electronic component pick and place system with the help of machine vision system. The application will be focused on the accuracy in position detection as well as correct orientation of product. Any error in these two elements will cause the electronic component to be mishandled. There are two objectives to be achieved in this project. The first objective is to
design and develop a mechanical system for electronic component pick and place application. The second objective is to integrate a computer vision system to enhance the electronic component pick and place operation in a PCB assembly line.
In machine vision, various method and algorithm has been developed. Some are developed to detect a specific object such as openCV face detection library and others are made to be flexible, where the image of any object can be trained to act as reference for object detection. The method presented in [3] incorporates a good illumination technique into the system to enhance detection. Using ‘dark field’ lighting arrangement to increase the contrast between object and background and eradicate shadowing problems. In order to reduce the noise effect in the image, 5 frames of image are digitized and averaged together before going through further process. Then local thresholding operation and morphological edge detection algorithm are used to detect the object presented on the image. Any object that does not pass a set of determined criteria is then rejected. This method seems to be a reliable method for grouped and small object detection. Works done in [4] mentioned image distortion as one of the factors that contribute to errors in the obtained result. To tackle this problem, the author making use of MATLAB camera calibration functions to determine the intrinsic and extrinsic parameters of the camera. These parameters are then used to correct the distortion in the taken image. Thus, making detection more precise and accurate specially when dealing with pixel coordinates.
The effectiveness of the pick and place system not only depend in the accuracy of image processing but also depends on the developed robot arm. The angle produced in each joint of robot arm must be accurate to ensure that the end effecter positioned on the correct location. The basic theory to achieve a correct end factor positioning in robot arm movement is inverse kinematic. Inverse kinematic does not take account of dynamics and trajectories of robot making it easy to be implemented in the developed robot arm. Related works has been seen incorporates machine vision into robot arm joint angle control [5]. Specific robot arm joint is marked and recognized using color recognition algorithm. These joints are kept track throughout the operation using a dedicated set of mathematical equations.
In this project, the developed system will handle a designated capacitor, an electrolyte type with the diameter of 1cm. This
Proceedings of 2017 Electrical Engineering Symposium (EES2017) - Vol. 1
128
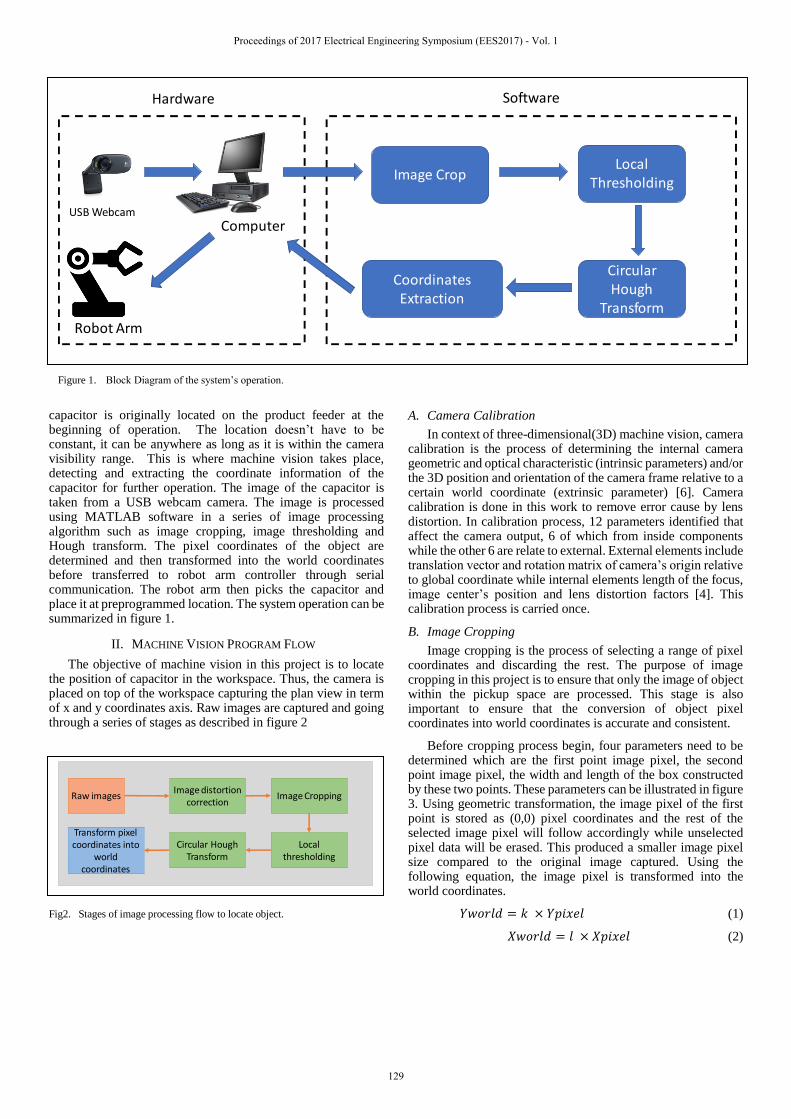
capacitor is originally located on the product feeder at the beginning of operation. The location doesn’t have to be constant, it can be anywhere as long as it is within the camera visibility range. This is where machine vision takes place, detecting and extracting the coordinate information of the capacitor for further operation. The image of the capacitor is taken from a USB webcam camera. The image is processed using MATLAB software in a series of image processing algorithm such as image cropping, image thresholding and Hough transform. The pixel coordinates of the object are determined and then transformed into the world coordinates before transferred to robot arm controller through serial communication. The robot arm then picks the capacitor and place it at preprogrammed location. The system operation can be summarized in figure 1.
II. MACHINE VISION PROGRAM FLOW
The objective of machine vision in this project is to locate the position of capacitor in the workspace. Thus, the camera is placed on top of the workspace capturing the plan view in term of x and y coordinates axis. Raw images are captured and going through a series of stages as described in figure 2
Fig2. Stages of image processing flow to locate object.
A. Camera Calibration
In context of three-dimensional(3D) machine vision, camera calibration is the process of determining the internal camera geometric and optical characteristic (intrinsic parameters) and/or the 3D position and orientation of the camera frame relative to a certain world coordinate (extrinsic parameter) [6]. Camera calibration is done in this work to remove error cause by lens distortion. In calibration process, 12 parameters identified that affect the camera output, 6 of which from inside components while the other 6 are relate to external. External elements include translation vector and rotation matrix of camera’s origin relative to global coordinate while internal elements length of the focus, image center’s position and lens distortion factors [4]. This calibration process is carried once.
B. Image Cropping
Image cropping is the process of selecting a range of pixel coordinates and discarding the rest. The purpose of image cropping in this project is to ensure that only the image of object within the pickup space are processed. This stage is also important to ensure that the conversion of object pixel coordinates into world coordinates is accurate and consistent.
Before cropping process begin, four parameters need to be determined which are the first point image pixel, the second point image pixel, the width and length of the box constructed by these two points. These parameters can be illustrated in figure 3. Using geometric transformation, the image pixel of the first point is stored as (0,0) pixel coordinates and the rest of the selected image pixel will follow accordingly while unselected pixel data will be erased. This produced a smaller image pixel size compared to the original image captured. Using the following equation, the image pixel is transformed into the world coordinates.
𝑌𝑤𝑜𝑟𝑙𝑑 = 𝑘 × 𝑌𝑝𝑖𝑥𝑒𝑙 (1)
𝑋𝑤𝑜𝑟𝑙𝑑 = 𝑙 × 𝑋𝑝𝑖𝑥𝑒𝑙 (2)
Image CropLocal
Thresholding
Circular Hough
Transform
Coordinates Extraction
USB WebcamComputer
Robot Arm
Hardware Software
Figure 1. Block Diagram of the system’s operation.
Raw imagesImage distortion
correction
Local thresholding
Circular Hough Transform
Transform pixelcoordinates into
world coordinates
Image Cropping
Proceedings of 2017 Electrical Engineering Symposium (EES2017) - Vol. 1
129

where
𝑘 = 𝑝𝑖𝑐𝑘𝑢𝑝𝑠𝑝𝑎𝑐𝑒ℎ𝑒𝑖𝑔ℎ𝑡/𝑝𝑖𝑥𝑒𝑙ℎ𝑒𝑖𝑔ℎ𝑡
𝑙 = 𝑝𝑖𝑐𝑘𝑢𝑝𝑠𝑝𝑎𝑐𝑒𝑤𝑖𝑑𝑡ℎ/𝑝𝑖𝑥𝑒𝑙𝑤𝑖𝑑𝑡ℎ
These equations only determine the two-dimensional(2D) coordinates system of X and Y. The term height is referring to the Y coordinate axis while the term width is referring to the Z coordinate axis.
Fig3. The two points determining the height and width of product pickup space.
C. Circular Hough Transform
The Hough Transform (HT), according to [7] can be described as the integral of a function that represents the data points with respect to a kernel function that is define implicitly through the selection of a shape parameterization and parameter-space quantization. The purpose of Hough Transform is to find imperfect instances of objects within a certain class of shapes by a voting procedure.
Originally, Hough Transform is used to detect line in an image but later its application expands into detecting various shapes and its position. In this project, Hough Transform is used to detect circular image in the binary image. It also provide the pixel coordinates of the center of the circular image.
III. ROBOTARM MECHANISM
Robot arm is a type of programmable mechanical manipulator, with similar function to a human arm. The arm consists of multiple rotational actuator that act as joints to position its link to a certain angle that combine to produced desired end effecter positioning and trajectory. A typical robot arm usually designed to represent human arm which has three joints, the shoulder, elbow and the wrist.
A robot end effecter is a device through which a robot interact with the surrounding environment through method of grasping, lifting and manipulating the workpieces [8]. As robot gripper is less adaptable than human hands, the robot gripper should be designed specifically for a certain application. In the market, robot gripper can be categorized into two; Industrial use and Hobby or leisure use[9]. [7]. Industrial robot grippers are more complex in design where the functionality of the gripper must be high, mechanically robust and stable [10, 11]. On the
other hand, robot grippers used by hobbyists are simple in design and mechanical movement. In this project, a gripper is built as the robot arm end effecter to lift the capacitor.
Fig4. Developed Robot Arm.
A. Inverse Kinematic
Inverse kinematic is a problem of determining the angle of robot joints based on the desired coordinates of end effecter. It is more difficult than the forward kinematic problem. To solve the inverse kinematic problem, there are several ways such as kinematic decoupling technique and geometrical method. To Consider the following figure:
Fig5. Side view of two degree of freedom robot manipulator.
Figure5 is a robot manipulator with 2 degree of freedom in which there exist 2 angles to be determine. By using geometric approach, the following functions are derived:
𝜃2 = = 𝑎𝑡𝑎𝑛 (𝐷, ±√1 − 𝐷2) (3)
𝜃1 = 𝑎 𝑡𝑎𝑛2(𝑟, 𝑠) − 𝑎 tan 2 (𝑎1, (𝑎2 × 𝐷), 𝑎2 × (±√1 − 𝐷2))
Geometric approach requires an arctangent function in order
to evaluate the angle θ for -π ≤ θ ≤ π , in which returns 𝑡𝑎𝑛−1(𝑥
𝑦)
adjusted to appropriate quadrant. The funtion atan2(x,y) is defined as follows:
First point
Second point
width
height
Image of Pickupspace
(4)
Proceedings of 2017 Electrical Engineering Symposium (EES2017) - Vol. 1
130

𝜃 = 𝑎 tan 2(𝑥, 𝑦) =
0° ≤ 𝜃 ≤ 90° 𝑓𝑜𝑟 + 𝑥 𝑎𝑛𝑑 + 𝑦90° ≤ 𝜃 ≤ 180° 𝑓𝑜𝑟 − 𝑥 𝑎𝑛𝑑 + 𝑦
−180° ≤ 𝜃 ≤ −90° 𝑓𝑜𝑟 − 𝑥 𝑎𝑛𝑑 − 𝑦 −90° ≤ 𝜃 ≤ 0° 𝑓𝑜𝑟 + 𝑥 𝑎𝑛𝑑 − 𝑦
(5)
By using these formula, the joint angle 𝜃1 and 𝜃2 can be determine by subtituting the value of the end-affector point coordinates (x, y) into the equation.
B. Workspace of Robot Arm
The working environment in which the robot arm operates and interact is called workspace. The project workspace consists of a robot arm, product feeder, camera and a container for product placing. The layout of the workspace is illustrated in figure 5.
Fig5. Layout of the project workspace.
IV. POSITION DETECTION ACCURACY EXPERIMENT
This experiment is a test to determine the accuracy of the developed machine vision program in detecting the object location on a two-dimensional space of x and y. A camera is installed 43cm above the pickup space. A pin is used as the object to be detect by the system. The image captured by the webcam can be seen in figure 3.
Again, the cropping technique is used in this experiment to increase the accuracy of the system in correlating the pixel space and the world space. Equation (1) and (2) are utilized in this experiment. The measured space height and width are 23.8cm and 35.1 cm respectively with measurement equipment sensitivity of 0.05cm. A set of ten test is carried out and the result is presented in table 1. Bear in mind that the measured position represents the center location of the pin measured using equipment while detected position represents location calculated by machine vision system. This experiment is carried out under fluorescent light with uniform intensity. The error generated by machine vision system is calculated using the following equation.
Error = Measured Position – Detected position (6)
TABLE I. RESULT OF THE EXPERIMENT
Test No.
Measured Position (cm)
Detected position (cm)
Error, E (cm)
x y x y x y
1 5.90 3.95 5.70 3.87 0.20 0.08
2 23.00 6.00 23.3 5.94 -0.30 0.06
3 13.60 9.00 13.60 9.08 0.00 -0.08
4 19.60 11.00 19.80 11.22 -0.2 -0.22
5 21.60 14.00 21.84 14.28 -0.24 -0.08
6 27.80 20.00 27.64 20.43 0.16 -0.43
7 33.00 22.00 33.51 22.47 -0.51 -0.47
8 5.95 17.5 5.67 17.56 0.28 -0.06
9 30.55 3.05 30.97 2.87 -0.42 0.18
10 1.35 13.00 1.02 13.30 0.33 -0.30
Mean error generated in x and y position for this experiment can be calculated as the following:
= 1
𝑛∑ |𝐸|𝑛
𝑖=1 (6)
Where is the mean error and n is the number of test carried. The calculated mean error in X position is 0.0264cm while the calculated mean error in Y position is 0.196cm.
These errors can be caused by several factors. The first factor is the flaw in the image cropping technique used. This technique requires that the orientation of the workspace must be correct in which each line present must be parallel with the image frame. If there is any angular displaced between them, the cropped image will contain error in its width and height parameters. The second factor would be the error in camera orientation which are not parallel to the captured space. The other factors would be light disturbance, inaccurate camera calibration and inconsistency in measurement.
V. CONCLUSION
In conclusion, the desired pick and place electronic component system is successfully built. The develop machine vision program is reliable enough to provide information of the located object for pickup. The challenge lies in the kinematic of the robot arm. As the sensitivity of the joint angle is only 1 degree, the error in end effecter positioning increase as the object is further away from the robot arm center location.
REFERENCES
[1] Ribeiro, A.F., Machine vision for industry. 1996.
[2] Heyer, C. Human-robot interaction and future industrial robotics applications. in 2010 IEEE/RSJ International Conference on Intelligent Robots and Systems. 2010.
[3] Jones, P., et al., Integration of image analysis and robotics into a fully automated colony picking and plate handling system. Nucleic Acids Research, 1992. 20(17): p. 4599-4606.
[4] Hosseininia, S.J., K. Khalili, and S.M. Emam, Flexible Automation in Porcelain Edge Polishing Using Machine Vision. Procedia Technology, 2016. 22: p. 562-569.
[5] Szabo, R. and A. Gontean, Robotic Arm Control Algorithm Based on Stereo Vision Using RoboRealm Vision. Advances in Electrical and Computer Engineering, 2015. 15(2): p. 65-74.
[6] Tsai, R., A versatile camera calibration technique for high-accuracy 3D machine vision metrology using off-the-shelf TV cameras and lenses. IEEE Journal on Robotics and Automation, 1987. 3(4): p. 323-344.
RobotArm
Place container
Pickup Space
Camera position
Proceedings of 2017 Electrical Engineering Symposium (EES2017) - Vol. 1
131

[7] Princen, J., J. Illingworth, and J. Kittler, A formal definition of the Hough transform: Properties and relationships. Journal of Mathematical Imaging and Vision, 1992. 1(2): p. 153-168.
[8] Osman, D.J.H.S., Brief Notes On Robotics. 4 ed. 2009, Univesiti Teknologi Malaysia: Fakulti Kejuruteraan Elektrik.
[9] Fuster, G., Gripper design and development for a modular robot. 2015.
[10] Bolboe, M. and I. Staretu. Antropomorphic gripper with two symmetrical fingers, designed for industrial robots. in Robotics in Alpe-Adria-Danube Region (RAAD), 2014 23rd International Conference on. 2014. IEEE.
[11] Honarpardaz, M., et al., Finger design automation for industrial robot grippers: A review. Robotics and Autonomous Systems, 2017. 87: p. 104-119.
Proceedings of 2017 Electrical Engineering Symposium (EES2017) - Vol. 1
132
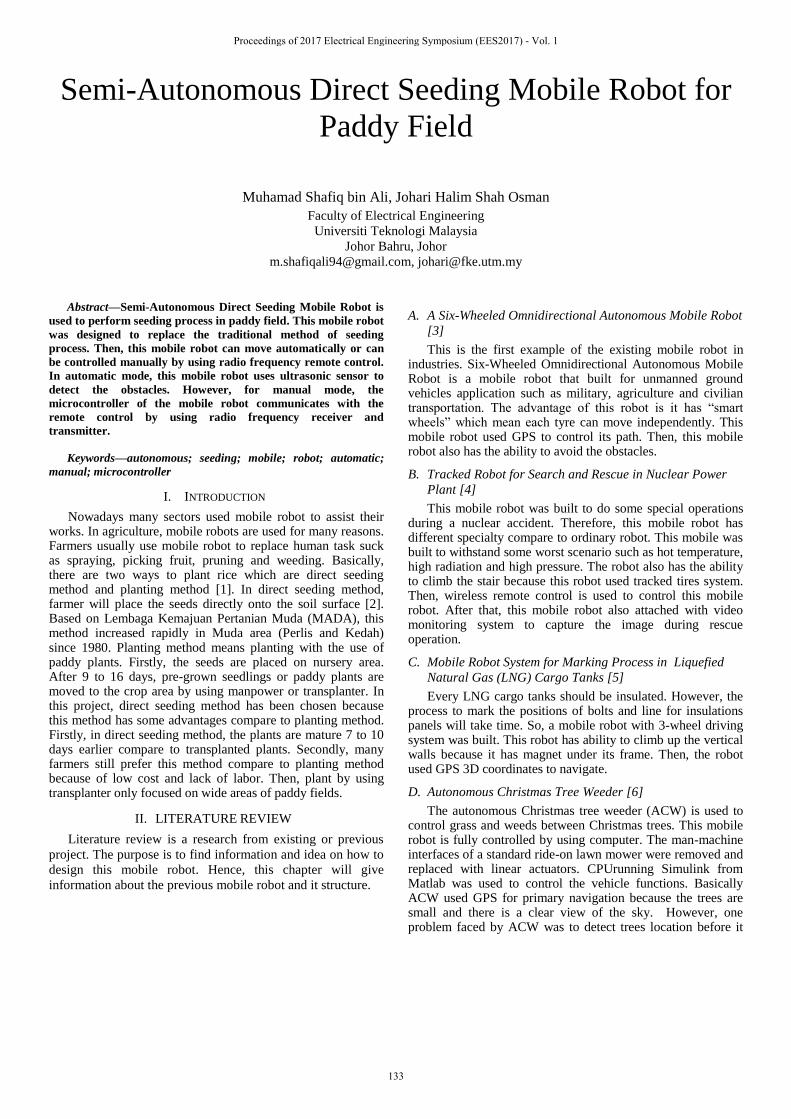
Semi-Autonomous Direct Seeding Mobile Robot for
Paddy Field
Muhamad Shafiq bin Ali, Johari Halim Shah Osman
Faculty of Electrical Engineering
Universiti Teknologi Malaysia
Johor Bahru, Johor
[email protected], [email protected]
Abstract—Semi-Autonomous Direct Seeding Mobile Robot is
used to perform seeding process in paddy field. This mobile robot
was designed to replace the traditional method of seeding
process. Then, this mobile robot can move automatically or can
be controlled manually by using radio frequency remote control.
In automatic mode, this mobile robot uses ultrasonic sensor to
detect the obstacles. However, for manual mode, the
microcontroller of the mobile robot communicates with the
remote control by using radio frequency receiver and
transmitter.
Keywords—autonomous; seeding; mobile; robot; automatic;
manual; microcontroller
I. INTRODUCTION
Nowadays many sectors used mobile robot to assist their works. In agriculture, mobile robots are used for many reasons. Farmers usually use mobile robot to replace human task suck as spraying, picking fruit, pruning and weeding. Basically, there are two ways to plant rice which are direct seeding method and planting method [1]. In direct seeding method, farmer will place the seeds directly onto the soil surface [2]. Based on Lembaga Kemajuan Pertanian Muda (MADA), this method increased rapidly in Muda area (Perlis and Kedah) since 1980. Planting method means planting with the use of paddy plants. Firstly, the seeds are placed on nursery area. After 9 to 16 days, pre-grown seedlings or paddy plants are moved to the crop area by using manpower or transplanter. In this project, direct seeding method has been chosen because this method has some advantages compare to planting method. Firstly, in direct seeding method, the plants are mature 7 to 10 days earlier compare to transplanted plants. Secondly, many farmers still prefer this method compare to planting method because of low cost and lack of labor. Then, plant by using transplanter only focused on wide areas of paddy fields.
II. LITERATURE REVIEW
Literature review is a research from existing or previous
project. The purpose is to find information and idea on how to
design this mobile robot. Hence, this chapter will give
information about the previous mobile robot and it structure.
A. A Six-Wheeled Omnidirectional Autonomous Mobile Robot
[3]
This is the first example of the existing mobile robot in industries. Six-Wheeled Omnidirectional Autonomous Mobile Robot is a mobile robot that built for unmanned ground vehicles application such as military, agriculture and civilian transportation. The advantage of this robot is it has “smart wheels” which mean each tyre can move independently. This mobile robot used GPS to control its path. Then, this mobile robot also has the ability to avoid the obstacles.
B. Tracked Robot for Search and Rescue in Nuclear Power
Plant [4]
This mobile robot was built to do some special operations during a nuclear accident. Therefore, this mobile robot has different specialty compare to ordinary robot. This mobile was built to withstand some worst scenario such as hot temperature, high radiation and high pressure. The robot also has the ability to climb the stair because this robot used tracked tires system. Then, wireless remote control is used to control this mobile robot. After that, this mobile robot also attached with video monitoring system to capture the image during rescue operation.
C. Mobile Robot System for Marking Process in Liquefied
Natural Gas (LNG) Cargo Tanks [5]
Every LNG cargo tanks should be insulated. However, the process to mark the positions of bolts and line for insulations panels will take time. So, a mobile robot with 3-wheel driving system was built. This robot has ability to climb up the vertical walls because it has magnet under its frame. Then, the robot used GPS 3D coordinates to navigate.
D. Autonomous Christmas Tree Weeder [6]
The autonomous Christmas tree weeder (ACW) is used to control grass and weeds between Christmas trees. This mobile robot is fully controlled by using computer. The man-machine interfaces of a standard ride-on lawn mower were removed and replaced with linear actuators. CPUrunning Simulink from Matlab was used to control the vehicle functions. Basically ACW used GPS for primary navigation because the trees are small and there is a clear view of the sky. However, one problem faced by ACW was to detect trees location before it
Proceedings of 2017 Electrical Engineering Symposium (EES2017) - Vol. 1
133
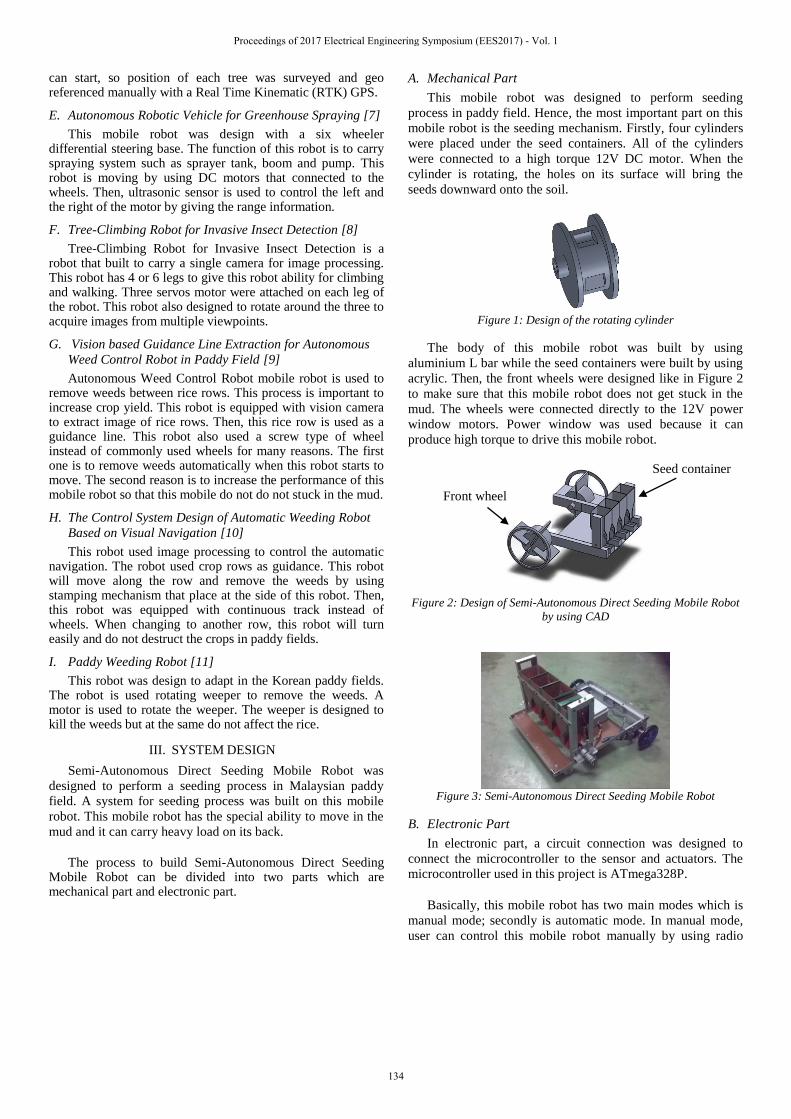
can start, so position of each tree was surveyed and geo referenced manually with a Real Time Kinematic (RTK) GPS.
E. Autonomous Robotic Vehicle for Greenhouse Spraying [7]
This mobile robot was design with a six wheeler differential steering base. The function of this robot is to carry spraying system such as sprayer tank, boom and pump. This robot is moving by using DC motors that connected to the wheels. Then, ultrasonic sensor is used to control the left and the right of the motor by giving the range information.
F. Tree-Climbing Robot for Invasive Insect Detection [8]
Tree-Climbing Robot for Invasive Insect Detection is a robot that built to carry a single camera for image processing. This robot has 4 or 6 legs to give this robot ability for climbing and walking. Three servos motor were attached on each leg of the robot. This robot also designed to rotate around the three to acquire images from multiple viewpoints.
G. Vision based Guidance Line Extraction for Autonomous
Weed Control Robot in Paddy Field [9]
Autonomous Weed Control Robot mobile robot is used to remove weeds between rice rows. This process is important to increase crop yield. This robot is equipped with vision camera to extract image of rice rows. Then, this rice row is used as a guidance line. This robot also used a screw type of wheel instead of commonly used wheels for many reasons. The first one is to remove weeds automatically when this robot starts to move. The second reason is to increase the performance of this mobile robot so that this mobile do not do not stuck in the mud.
H. The Control System Design of Automatic Weeding Robot
Based on Visual Navigation [10]
This robot used image processing to control the automatic navigation. The robot used crop rows as guidance. This robot will move along the row and remove the weeds by using stamping mechanism that place at the side of this robot. Then, this robot was equipped with continuous track instead of wheels. When changing to another row, this robot will turn easily and do not destruct the crops in paddy fields.
I. Paddy Weeding Robot [11]
This robot was design to adapt in the Korean paddy fields. The robot is used rotating weeper to remove the weeds. A motor is used to rotate the weeper. The weeper is designed to kill the weeds but at the same do not affect the rice.
III. SYSTEM DESIGN
Semi-Autonomous Direct Seeding Mobile Robot was
designed to perform a seeding process in Malaysian paddy
field. A system for seeding process was built on this mobile
robot. This mobile robot has the special ability to move in the
mud and it can carry heavy load on its back.
The process to build Semi-Autonomous Direct Seeding Mobile Robot can be divided into two parts which are mechanical part and electronic part.
A. Mechanical Part
This mobile robot was designed to perform seeding
process in paddy field. Hence, the most important part on this
mobile robot is the seeding mechanism. Firstly, four cylinders
were placed under the seed containers. All of the cylinders
were connected to a high torque 12V DC motor. When the
cylinder is rotating, the holes on its surface will bring the
seeds downward onto the soil.
Figure 1: Design of the rotating cylinder
The body of this mobile robot was built by using
aluminium L bar while the seed containers were built by using
acrylic. Then, the front wheels were designed like in Figure 2
to make sure that this mobile robot does not get stuck in the
mud. The wheels were connected directly to the 12V power
window motors. Power window was used because it can
produce high torque to drive this mobile robot.
Figure 2: Design of Semi-Autonomous Direct Seeding Mobile Robot
by using CAD
Figure 3: Semi-Autonomous Direct Seeding Mobile Robot
B. Electronic Part
In electronic part, a circuit connection was designed to
connect the microcontroller to the sensor and actuators. The
microcontroller used in this project is ATmega328P.
Basically, this mobile robot has two main modes which is
manual mode; secondly is automatic mode. In manual mode,
user can control this mobile robot manually by using radio
Seed container
Front wheel
Proceedings of 2017 Electrical Engineering Symposium (EES2017) - Vol. 1
134
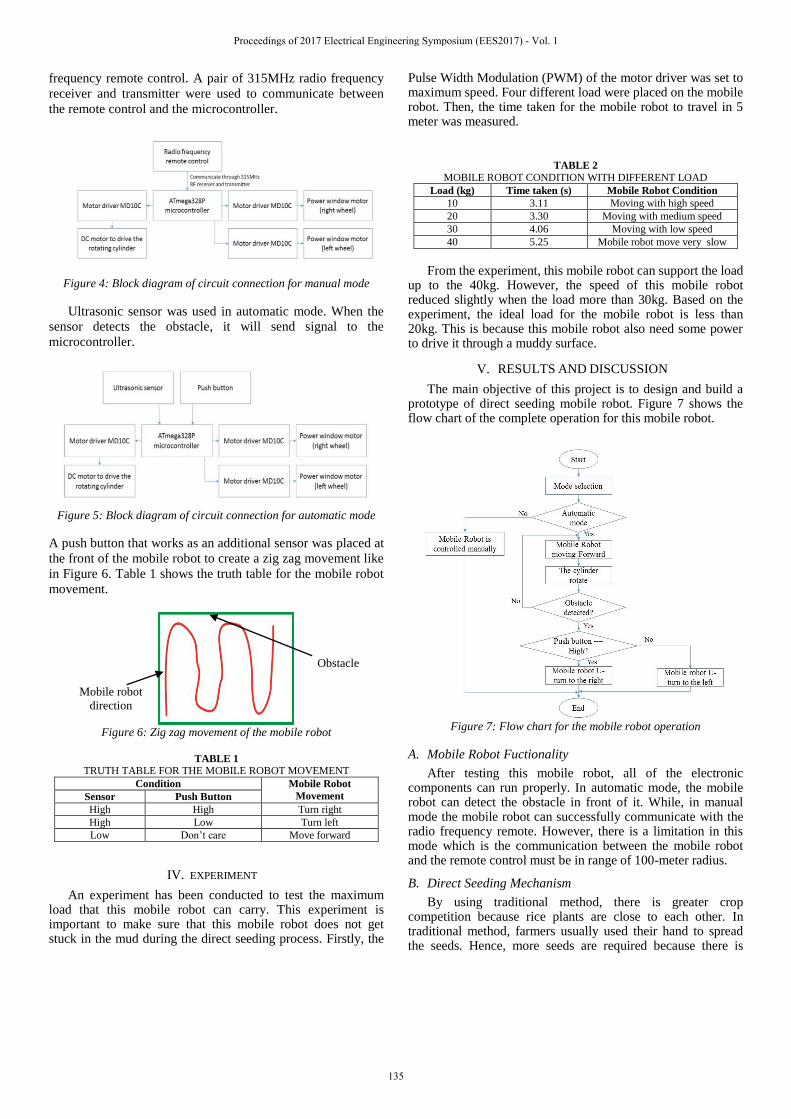
frequency remote control. A pair of 315MHz radio frequency
receiver and transmitter were used to communicate between
the remote control and the microcontroller.
Figure 4: Block diagram of circuit connection for manual mode
Ultrasonic sensor was used in automatic mode. When the
sensor detects the obstacle, it will send signal to the
microcontroller.
Figure 5: Block diagram of circuit connection for automatic mode
A push button that works as an additional sensor was placed at
the front of the mobile robot to create a zig zag movement like
in Figure 6. Table 1 shows the truth table for the mobile robot
movement.
Figure 6: Zig zag movement of the mobile robot
TABLE 1
TRUTH TABLE FOR THE MOBILE ROBOT MOVEMENT
Condition Mobile Robot
Movement Sensor Push Button
High High Turn right
High Low Turn left
Low Don’t care Move forward
IV. EXPERIMENT
An experiment has been conducted to test the maximum load that this mobile robot can carry. This experiment is important to make sure that this mobile robot does not get stuck in the mud during the direct seeding process. Firstly, the
Pulse Width Modulation (PWM) of the motor driver was set to maximum speed. Four different load were placed on the mobile robot. Then, the time taken for the mobile robot to travel in 5 meter was measured.
TABLE 2
MOBILE ROBOT CONDITION WITH DIFFERENT LOAD
Load (kg) Time taken (s) Mobile Robot Condition
10 3.11 Moving with high speed
20 3.30 Moving with medium speed
30 4.06 Moving with low speed
40 5.25 Mobile robot move very slow
From the experiment, this mobile robot can support the load up to the 40kg. However, the speed of this mobile robot reduced slightly when the load more than 30kg. Based on the experiment, the ideal load for the mobile robot is less than 20kg. This is because this mobile robot also need some power to drive it through a muddy surface.
V. RESULTS AND DISCUSSION
The main objective of this project is to design and build a prototype of direct seeding mobile robot. Figure 7 shows the flow chart of the complete operation for this mobile robot.
Figure 7: Flow chart for the mobile robot operation
A. Mobile Robot Fuctionality
After testing this mobile robot, all of the electronic components can run properly. In automatic mode, the mobile robot can detect the obstacle in front of it. While, in manual mode the mobile robot can successfully communicate with the radio frequency remote. However, there is a limitation in this mode which is the communication between the mobile robot and the remote control must be in range of 100-meter radius.
B. Direct Seeding Mechanism
By using traditional method, there is greater crop competition because rice plants are close to each other. In traditional method, farmers usually used their hand to spread the seeds. Hence, more seeds are required because there is
Mobile robot
direction
Obstacle
Proceedings of 2017 Electrical Engineering Symposium (EES2017) - Vol. 1
135
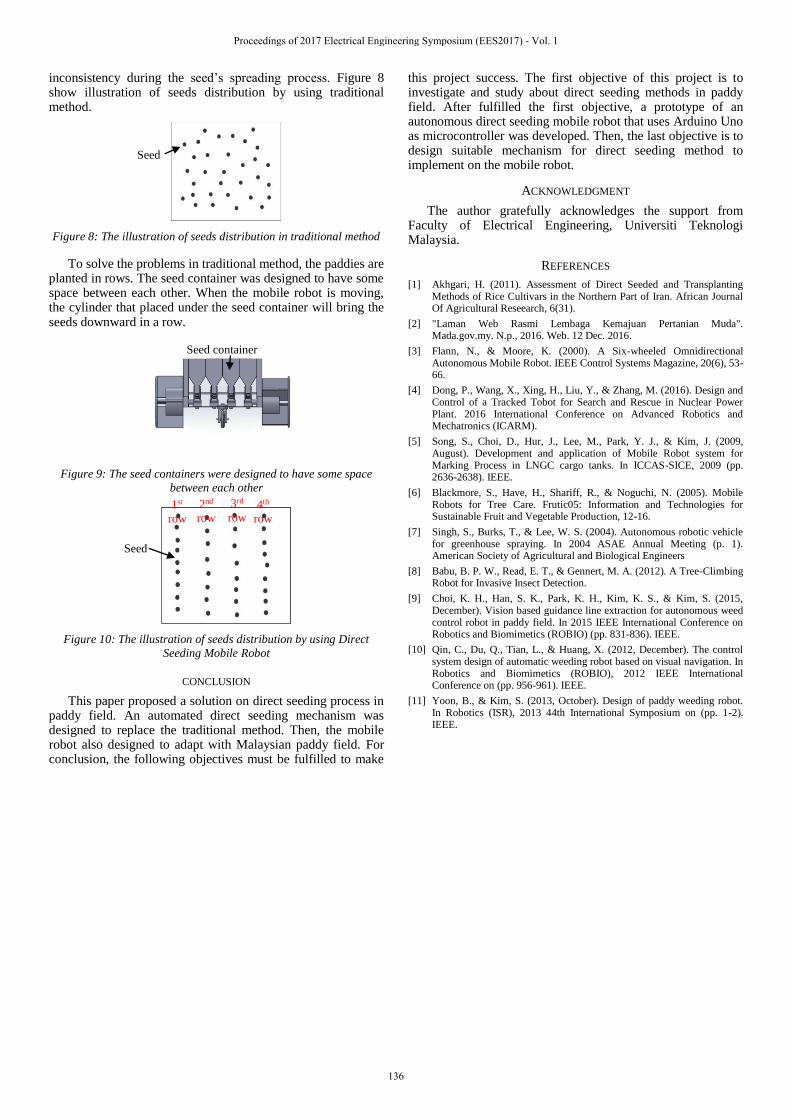
inconsistency during the seed’s spreading process. Figure 8 show illustration of seeds distribution by using traditional method.
Figure 8: The illustration of seeds distribution in traditional method
To solve the problems in traditional method, the paddies are planted in rows. The seed container was designed to have some space between each other. When the mobile robot is moving, the cylinder that placed under the seed container will bring the seeds downward in a row.
Figure 9: The seed containers were designed to have some space
between each other
Figure 10: The illustration of seeds distribution by using Direct
Seeding Mobile Robot
CONCLUSION
This paper proposed a solution on direct seeding process in paddy field. An automated direct seeding mechanism was designed to replace the traditional method. Then, the mobile robot also designed to adapt with Malaysian paddy field. For conclusion, the following objectives must be fulfilled to make
this project success. The first objective of this project is to investigate and study about direct seeding methods in paddy field. After fulfilled the first objective, a prototype of an autonomous direct seeding mobile robot that uses Arduino Uno as microcontroller was developed. Then, the last objective is to design suitable mechanism for direct seeding method to implement on the mobile robot.
ACKNOWLEDGMENT
The author gratefully acknowledges the support from Faculty of Electrical Engineering, Universiti Teknologi Malaysia.
REFERENCES
[1] Akhgari, H. (2011). Assessment of Direct Seeded and Transplanting Methods of Rice Cultivars in the Northern Part of Iran. African Journal Of Agricultural Reseearch, 6(31).
[2] "Laman Web Rasmi Lembaga Kemajuan Pertanian Muda". Mada.gov.my. N.p., 2016. Web. 12 Dec. 2016.
[3] Flann, N., & Moore, K. (2000). A Six-wheeled Omnidirectional Autonomous Mobile Robot. IEEE Control Systems Magazine, 20(6), 53-66.
[4] Dong, P., Wang, X., Xing, H., Liu, Y., & Zhang, M. (2016). Design and Control of a Tracked Tobot for Search and Rescue in Nuclear Power Plant. 2016 International Conference on Advanced Robotics and Mechatronics (ICARM).
[5] Song, S., Choi, D., Hur, J., Lee, M., Park, Y. J., & Kim, J. (2009, August). Development and application of Mobile Robot system for Marking Process in LNGC cargo tanks. In ICCAS-SICE, 2009 (pp. 2636-2638). IEEE.
[6] Blackmore, S., Have, H., Shariff, R., & Noguchi, N. (2005). Mobile Robots for Tree Care. Frutic05: Information and Technologies for Sustainable Fruit and Vegetable Production, 12-16.
[7] Singh, S., Burks, T., & Lee, W. S. (2004). Autonomous robotic vehicle for greenhouse spraying. In 2004 ASAE Annual Meeting (p. 1). American Society of Agricultural and Biological Engineers
[8] Babu, B. P. W., Read, E. T., & Gennert, M. A. (2012). A Tree-Climbing Robot for Invasive Insect Detection.
[9] Choi, K. H., Han, S. K., Park, K. H., Kim, K. S., & Kim, S. (2015, December). Vision based guidance line extraction for autonomous weed control robot in paddy field. In 2015 IEEE International Conference on Robotics and Biomimetics (ROBIO) (pp. 831-836). IEEE.
[10] Qin, C., Du, Q., Tian, L., & Huang, X. (2012, December). The control system design of automatic weeding robot based on visual navigation. In Robotics and Biomimetics (ROBIO), 2012 IEEE International Conference on (pp. 956-961). IEEE.
[11] Yoon, B., & Kim, S. (2013, October). Design of paddy weeding robot. In Robotics (ISR), 2013 44th International Symposium on (pp. 1-2). IEEE.
Seed
Seed container
1st
row
2nd
row
3rd
row 4th
row
Seed
Proceedings of 2017 Electrical Engineering Symposium (EES2017) - Vol. 1
136

Ammonia Detection System using Integrated
Microfluidic-Microneedle
Khairul Akmal Muslimin
Faculty of Electrical Engineering
Universiti Teknologi Malaysia
Johor Bahru, Malaysia.
Mohd Ridzuan Ahmad
Department of Control and Mechatronics (CMED)
Faculty of Electrical Engineering
Universiti Teknologi Malaysia
Johor Bahru, Malaysia.
Abstract—The purpose of this project is to develop a device
that able to conserve the safe ammonia level in water reservoir. An
Ammonia Detection System by using an Integrated Microfluidic-
Microneedle enable to log data of ammonia level in time altogether
to give prompt action as early detection system towards the
ammonia contamination. This project describes the system in
detail from conceptual idea to design an electrical approach to
tackle this vital problem since the existing approach applied in
industry is time consuming and manually operated. Since
capacitance is differed by element and its concentration, hence a
liquid capacitance detector is built to measure the capacitance of
liquid. The device works by inserting the sample of liquid into the
device to be tested. Then, the microcontroller (Arduino UNO)
sources AC voltage to generate constant currents that flows
through the liquid sample via a pair of electrodes. As a result the
capacitance of the liquid can be measured and displayed on the
LCD. These readings is then translated by comparing them with
part per million (ppm) reading of several ammonia concentration
in several water sample, thus a boundary can be made so that
ammonia level in water is according to water quality standard. If
the ammonia is above the allowable limit, a prompt message will
be sent by application via cloud that is controlled by ESP8266
which can be accessed by monitoring devices. Every reading taken
will be recorded in real time monitoring and all data will be logged
for minimizing the probability of losing data.
Index Term—Ammonia Detection System; Liquid Capacitance
Detector; Data Logger; Real Monitoring; Cloud.
I. INTRODUCTION
This project focuses on the water quality monitoring
system, more specifically ammonia level monitoring. The
crucial part of this project is to develop a system that monitor
ammonia level in water source by using electrical and
electrochemical approach [1].
Basically, this device monitor and detect the ammonia
level that beyond its par so that early action can be taken when
being prompted.
Thus, the development of this device could be divided into
three parts; the first part is verifying the existing liquid
capacitance detector to justify this electrical approach can relate
to differences in ammonia level [2]. The second part is
developing data logging system to record and log data taken by
liquid capacitance detector in time. The third part would be the
virtual monitoring via Cloud and push notification as early
prompt action when ammonia level is beyond its safe par.
II. LITERATURE REVIEW
There are many methods or devices have been existed and
used to detect the quality of water or contamination of water.
The most popular device to ammonia detection is Hach
DR900 Colorimeter, one of a product from Hach Company. This
colorimeter has been equipped by multiple sensor to measure the
complex parameters that related to water quality monitoring, i.e.
ammonium sallicate and aluminum sulphate [3]. DR900
Colorimeter is the high water quality sensing platform that give
the precise and detailed part per million (ppm) data through
detection of colour of water and its colour intensity. It is a need
of using the appropriate reagent to get the matched parameter
that desired. Applications of this device are suitable for detecting
the complex molecules that is exist along the water treatment
process. The water quality parameters that can be measured from
this device are intensity of ammonia, aluminum, sulphur and
carbon in water.
Another example is SmartTROLL Multiparameter Handheld
System is allowed to collect data on water quality parameters
based on Android or iOS mobile device. The parameters that can
be sensed by using this system are pH, dissolved oxygen (DO),
oxidation-reduction potential (ORP), water level and pressure,
salinity, total dissolved solids, resistivity, density, air and water
temperature and barometric pressure [4]. It is has features such
as instant data-sharing, real-time data, site tagging with photos
and GPS coordinates, field-replaceable sensor and auto-
calibration functions.
There is one method that is practically used but somehow
time consuming. Swimming Behavioural Spectrometer (SBS)
Proceedings of 2017 Electrical Engineering Symposium (EES2017) - Vol. 1
137
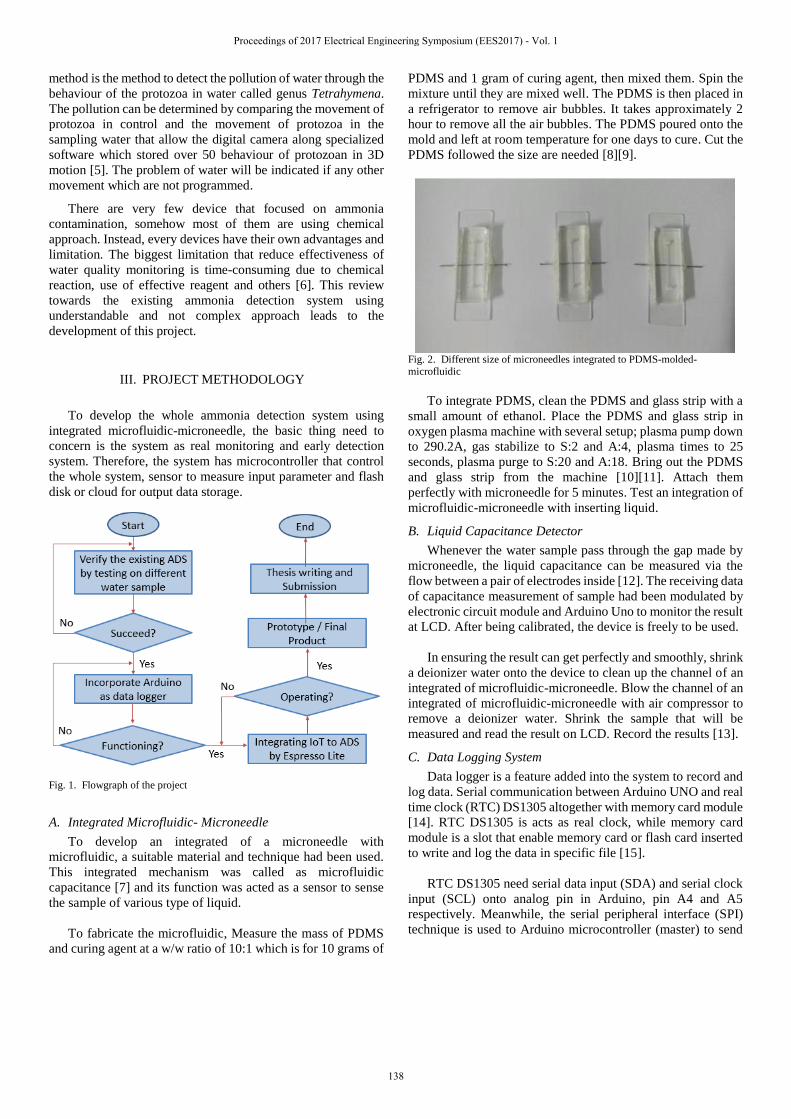
method is the method to detect the pollution of water through the
behaviour of the protozoa in water called genus Tetrahymena.
The pollution can be determined by comparing the movement of
protozoa in control and the movement of protozoa in the
sampling water that allow the digital camera along specialized
software which stored over 50 behaviour of protozoan in 3D
motion [5]. The problem of water will be indicated if any other
movement which are not programmed.
There are very few device that focused on ammonia
contamination, somehow most of them are using chemical
approach. Instead, every devices have their own advantages and
limitation. The biggest limitation that reduce effectiveness of
water quality monitoring is time-consuming due to chemical
reaction, use of effective reagent and others [6]. This review
towards the existing ammonia detection system using
understandable and not complex approach leads to the
development of this project.
III. PROJECT METHODOLOGY
To develop the whole ammonia detection system using
integrated microfluidic-microneedle, the basic thing need to
concern is the system as real monitoring and early detection
system. Therefore, the system has microcontroller that control
the whole system, sensor to measure input parameter and flash
disk or cloud for output data storage.
Fig. 1. Flowgraph of the project
A. Integrated Microfluidic- Microneedle
To develop an integrated of a microneedle with
microfluidic, a suitable material and technique had been used.
This integrated mechanism was called as microfluidic
capacitance [7] and its function was acted as a sensor to sense
the sample of various type of liquid.
To fabricate the microfluidic, Measure the mass of PDMS
and curing agent at a w/w ratio of 10:1 which is for 10 grams of
PDMS and 1 gram of curing agent, then mixed them. Spin the
mixture until they are mixed well. The PDMS is then placed in
a refrigerator to remove air bubbles. It takes approximately 2
hour to remove all the air bubbles. The PDMS poured onto the
mold and left at room temperature for one days to cure. Cut the
PDMS followed the size are needed [8][9].
Fig. 2. Different size of microneedles integrated to PDMS-molded-microfluidic
To integrate PDMS, clean the PDMS and glass strip with a
small amount of ethanol. Place the PDMS and glass strip in
oxygen plasma machine with several setup; plasma pump down
to 290.2A, gas stabilize to S:2 and A:4, plasma times to 25
seconds, plasma purge to S:20 and A:18. Bring out the PDMS
and glass strip from the machine [10][11]. Attach them
perfectly with microneedle for 5 minutes. Test an integration of
microfluidic-microneedle with inserting liquid.
B. Liquid Capacitance Detector
Whenever the water sample pass through the gap made by
microneedle, the liquid capacitance can be measured via the
flow between a pair of electrodes inside [12]. The receiving data
of capacitance measurement of sample had been modulated by
electronic circuit module and Arduino Uno to monitor the result
at LCD. After being calibrated, the device is freely to be used.
In ensuring the result can get perfectly and smoothly, shrink
a deionizer water onto the device to clean up the channel of an
integrated of microfluidic-microneedle. Blow the channel of an
integrated of microfluidic-microneedle with air compressor to
remove a deionizer water. Shrink the sample that will be
measured and read the result on LCD. Record the results [13].
C. Data Logging System
Data logger is a feature added into the system to record and
log data. Serial communication between Arduino UNO and real
time clock (RTC) DS1305 altogether with memory card module
[14]. RTC DS1305 is acts as real clock, while memory card
module is a slot that enable memory card or flash card inserted
to write and log the data in specific file [15].
RTC DS1305 need serial data input (SDA) and serial clock
input (SCL) onto analog pin in Arduino, pin A4 and A5
respectively. Meanwhile, the serial peripheral interface (SPI)
technique is used to Arduino microcontroller (master) to send
Proceedings of 2017 Electrical Engineering Symposium (EES2017) - Vol. 1
138

data to its peripheral, memory card module (slave) by SS,
MOSI, MISO and SCK accordingly [16].
D. Real Monitoring Via Cloud
The existing system can be monitored virtually however
giving the real time data. Serial UART pin 0 (RXD) and pin 1
(TXD) in Arduino microcontroller is connected serially to
ESP8266 module to get full control of the system as long as
connected to Internet [17].
Blynk Apps, an application that is used, acting as the global
user interface (GUI) that enable user to monitor the system
virtually [18]. It is as easy as drag and drop to have the system
with interactive interface. The widget in this application in not
only enable monitoring data by graph, moreover push
notification can be set whenever interrupt is introduced. For this
system, the interrupt will be the boundary is capacitance
reading for the safe ammonia level. Whenever system is
interrupted, the push notification will be sent to user showing
that the ammonia level is beyond its level [19].
E. Circuit Implementation
Fig. 3. Circuit diagram of the device
For the whole picture in this device as shown in Figure 3,
the Arduino UNO is the microcontroller that process all the
program. For analog input, pins A0 and A1 are connected to the
integrated microfluidic-microneedle that act as sensor. The
analog serial pins A4 and A5 are connected to RTC DS1307
that acts real time clock.
The Serial UART pins (pins 0 and 1) acts as serial write that
send data translated earlier to ESP8266 module. The digital I/O
pin 2 until pin 7 is connected to LCD to display the capacitance
reading. The SPI pins (pin 10 until pin 13) are connected to
memory card module as master-slave communication.
All the modules including LCD, RTC DS1307, ESP8266
module and memory card module are operating by connecting
them to the same node of supplied voltage (Vcc) and ground
(GND). To make them portable, external power supply (9V
battery) is connected to input voltage pin and ground pin in
Arduino UNO [20].
IV. RESULT AND ANALYSIS
A. Ammonia Level in Water and Capacitance Relationship
An experiment was conducted to find the relationship
between these ppm and capacitance parameter. As the result, a
capacitance reading can be obtained as the boundary limit to
ensure the safe ammonia level in water source by relating to its
ppm reading.
Different volume of ammonia solution is diluted into fixed
amount of 400mL of different water sample – deionized water,
tap water and raw water, in order to obtain their capacitance and
ppm reading, hence those parameter reading will show their
relationship.
Fig. 4. Capacitance reading towards different concentration of ammonia
solution in various water samples. Blue, red and green lines represent
capacitance reading of deionized water, tap water and raw water respectively, passing through integrated microfluidic-microneedle.
Fig. 5. Part per million (ppm) reading towards different concentration of ammonia solution in various water samples. Blue, red and green lines represent
ppm reading of deionized water, tap water and raw water respectively, passing
through integrated microfluidic-microneedle
From the Figure 4 and Figure 5, capacitance and ppm
reading are directly proportional to concentration of ammonia
solution in all water sample and consequence increase raw
Proceedings of 2017 Electrical Engineering Symposium (EES2017) - Vol. 1
139
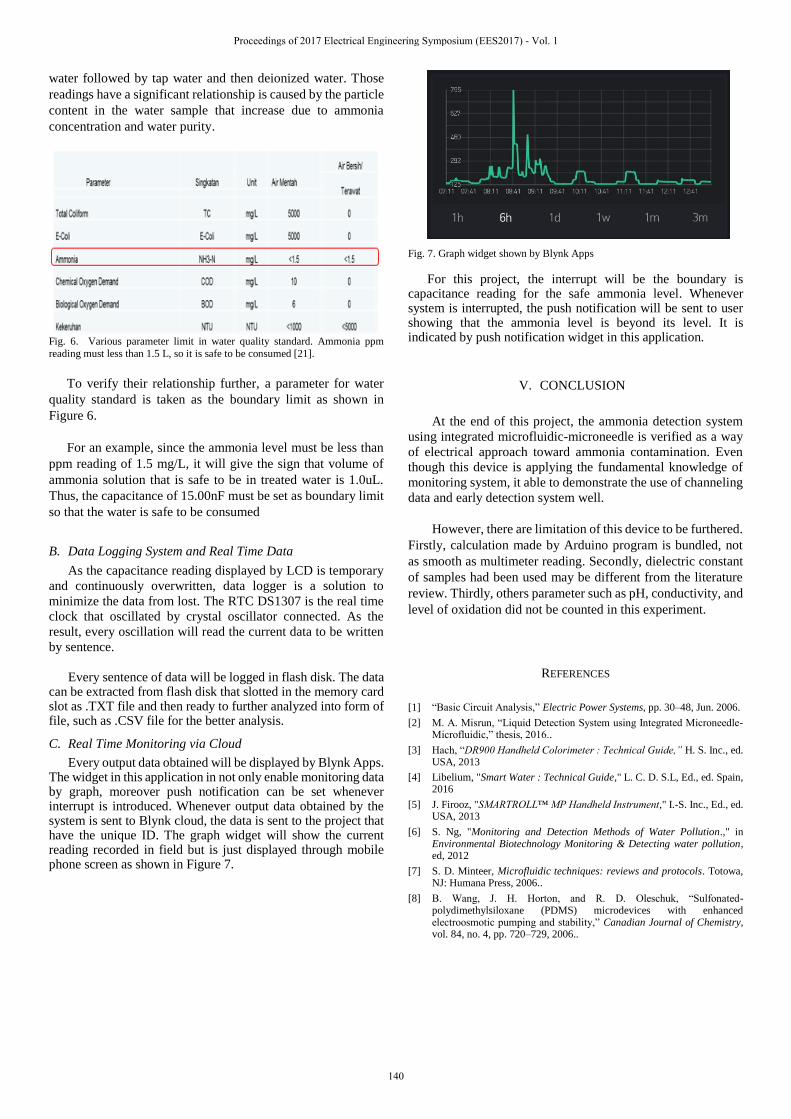
water followed by tap water and then deionized water. Those
readings have a significant relationship is caused by the particle
content in the water sample that increase due to ammonia
concentration and water purity.
Fig. 6. Various parameter limit in water quality standard. Ammonia ppm
reading must less than 1.5 L, so it is safe to be consumed [21].
To verify their relationship further, a parameter for water
quality standard is taken as the boundary limit as shown in
Figure 6.
For an example, since the ammonia level must be less than
ppm reading of 1.5 mg/L, it will give the sign that volume of
ammonia solution that is safe to be in treated water is 1.0uL.
Thus, the capacitance of 15.00nF must be set as boundary limit
so that the water is safe to be consumed
B. Data Logging System and Real Time Data
As the capacitance reading displayed by LCD is temporary
and continuously overwritten, data logger is a solution to
minimize the data from lost. The RTC DS1307 is the real time
clock that oscillated by crystal oscillator connected. As the
result, every oscillation will read the current data to be written
by sentence.
Every sentence of data will be logged in flash disk. The data can be extracted from flash disk that slotted in the memory card slot as .TXT file and then ready to further analyzed into form of file, such as .CSV file for the better analysis.
C. Real Time Monitoring via Cloud
Every output data obtained will be displayed by Blynk Apps. The widget in this application in not only enable monitoring data by graph, moreover push notification can be set whenever interrupt is introduced. Whenever output data obtained by the system is sent to Blynk cloud, the data is sent to the project that have the unique ID. The graph widget will show the current reading recorded in field but is just displayed through mobile phone screen as shown in Figure 7.
Fig. 7. Graph widget shown by Blynk Apps
For this project, the interrupt will be the boundary is capacitance reading for the safe ammonia level. Whenever system is interrupted, the push notification will be sent to user showing that the ammonia level is beyond its level. It is indicated by push notification widget in this application.
V. CONCLUSION
At the end of this project, the ammonia detection system
using integrated microfluidic-microneedle is verified as a way
of electrical approach toward ammonia contamination. Even
though this device is applying the fundamental knowledge of
monitoring system, it able to demonstrate the use of channeling
data and early detection system well.
However, there are limitation of this device to be furthered.
Firstly, calculation made by Arduino program is bundled, not
as smooth as multimeter reading. Secondly, dielectric constant
of samples had been used may be different from the literature
review. Thirdly, others parameter such as pH, conductivity, and
level of oxidation did not be counted in this experiment.
REFERENCES
[1] “Basic Circuit Analysis,” Electric Power Systems, pp. 30–48, Jun. 2006.
[2] M. A. Misrun, “Liquid Detection System using Integrated Microneedle-Microfluidic,” thesis, 2016..
[3] Hach, “DR900 Handheld Colorimeter : Technical Guide,” H. S. Inc., ed. USA, 2013
[4] Libelium, "Smart Water : Technical Guide," L. C. D. S.L, Ed., ed. Spain, 2016
[5] J. Firooz, "SMARTROLL™ MP Handheld Instrument," I.-S. Inc., Ed., ed. USA, 2013
[6] S. Ng, "Monitoring and Detection Methods of Water Pollution.," in Environmental Biotechnology Monitoring & Detecting water pollution, ed, 2012
[7] S. D. Minteer, Microfluidic techniques: reviews and protocols. Totowa, NJ: Humana Press, 2006..
[8] B. Wang, J. H. Horton, and R. D. Oleschuk, “Sulfonated-polydimethylsiloxane (PDMS) microdevices with enhanced electroosmotic pumping and stability,” Canadian Journal of Chemistry, vol. 84, no. 4, pp. 720–729, 2006..
Proceedings of 2017 Electrical Engineering Symposium (EES2017) - Vol. 1
140

[9] “Microfluidic Interface Provides PDMS Chip Connection,” Product News Network, 28-Jun-2012..
[10] P. L. Matheson, “Modeling of a poloidally symmetric toroidal field divertor in a reversed-field-pinch plasma machine,” thesis, 1989.
[11] D. Amouroux, “Speciation biogeochimique des elements traces aux interfaces des environnements aquatiques,” thesis, 2006.
[12] A. Trautmann, Advanced microneedle and microelectrode arrays. Tonning: Der Andere Verl., 2006..
[13] J. A. Roig, 8051: real time clock. 2002..
[14] M. A. Mazidi, S. Naimi, and S. Naimi, The AVR microcontroller and embedded systems: using Assembly and C. Boston: Prentice Hall, 2011.
[15] M. Evans, J. Noble, and J. Hochenbaum, Arduino in action. SHelter Island, N.Y: Manning, 2013.
[16] C. Doukas, Arduino, Sensors, and the Cloud. Sted: APress, 2012..
[17] C. Webb, Interrupt-: critical making for contemporary conditions. 2015..
[18] LCD: liquid crystal display, 1995. Tokyo: Optrex Corp., 1995.
[19] T. O'Neill and J. Williams, Arduino. Ann Arbor, MI: Cherry Lake Publishing, 2014.
[20] M. Schmidt, Arduino: a quick-start guide. Dallas, TX: Pragmatic Bookshelf, 2015..
[21] Ministry of Health Malaysia: 10th Malaysia plan (2011-2015). Kuala Lumpur: Ministry of Health. 2011.
Proceedings of 2017 Electrical Engineering Symposium (EES2017) - Vol. 1
141

Listening Device for Locating Underground Water
Leakage in Residential Area
Muhammad Anugerah Affendi Bin Saliman
Faculty of Electrical Engineering
Universiti Teknologi Malaysia
Johor Bahru, Malaysia.
Abdul Rashid Bin Husain
Department of Control and Mechatronic
Faculty of Electrical Engineering
Universiti Teknologi Malaysia
Johor Bahru, Malaysia.
Abstract— Leakage in water distribution system especially at
residential area is one of the big issues that continuously happened
in worldwide and cause too many losses to the water companies
and also their customers. Regarding to this issue, there are too
many researches related to the methods developed for controlling
the water leakage either detection on the hotspot of the leakage or
detection from the comparison data of water level current
consume and future. The purpose of this project is to trace the
underground water leakage by using the vibration detector device
in acoustic method. Generally, water leakage will produce some
noise of vibration and the wave will propagate along the soil. The
data acquisition is performed by conducting one experiment which
is the pipeline was designed by using two sizes of UPVC pipes,
20mm and 25mm diameter with some broken part to represent as
a leakage. In order to check the ability of the device sensor, the
experiment was repeated with buried the pipeline in different
depth between 0.1 to 0.4m and finally the data will be compared.
The data were displayed via the IOT system to easier the user used
the device. The results have shown that the depth and size of
pipeline influence the detection of leaks. The device is more
accurate and only suitable for small pipeline with high pressure of
water flow. Conclusions, the device made is really function to
detect the water leakage but still need improvement to make it
function well and better.
Keywords— water leakage; pipeline; vibrations; piezoelectric;
IOT system
I. INTRODUCTION
Water leak management is a big issue and growing concern around the world and cannot be solved until now, also give a trouble and impact especially to the user. Almost every piping system around the world have a water loss problem and the most common reason is leakage in water distribution systems such as at the valve, service connection, transmission pipes and mostly in distribution pipes [1]. Every second of leakage will make losses for certain industrial such as water supply industry that has to supply purified water at high cost to the consumer if many water leaks occur in their piping system. The estimation of water loss in Asia, is about 29 billion cubic per meter and its equal to $9 billion per year (Asian Development Bank) [2]. However, it has not just affected to economic issues presented by water companies, but it is also an ecological, sustainability, risk on health due to unclean water and safety issues [3].
There are several factors that cause the buried pipe leak and technically include horribly pipe connections, poor quality of workmanship, corrosion inside and outside pipe or mechanical damage caused by pressure from the traffic [3]. Besides that, disaster occurred on the piping system also give an impact to the pipes such as ground movement, flood, landslides, and others. Other factors are high water pressure in the pipe, damage due to excavation in construction activity, pipe age, and ground conditions [3]. In many countries, usually type of pipe use is cast iron or asbestos cement and mainly ductile iron, polyethylene (PE) in older water distribution, while for newer system, they are using polyvinyl chloride (PVC) especially in secondary networks and connection from the treatment plant to the consumer [6].
In order to avoid water loss through bursts and leaks in water distribution systems, new and more efficient methodologies are required and detections of water leaks can be improved if leaks can be detected early and effectively [7]. However, the current solution nowadays in industries always has limitations with several factors. According to the past review paper from R. Ben-Mansour, 2012, the effectiveness underground leak detection depends on the experiences of operator conduct the devices, place or ground condition and time operation used [4] [5] [8]. This paper will emphasize the relationships between the vibration effect of a pipe leak at the ground surface and their wave propagation. The technique will be focusing on an acoustic method which is using vibration sensor (piezoelectric).
II. LITERATURE REVIEW
A. Non Acoustic Methods for Water Leak Detection Methods
1) Ground Penetrating Radar: Ground penetrating radar,
GPR is a technique which uses high resolution geophysical
process based on changing in the electromagnetic pulses in the
microwave range [9]. These methods have been claimed and
explored through several numbers of studies, specifically for
detecting the plastic pipe leakage [10] [11] [12] [13].
Principally, the system worked using electromagnetic waves
radiate from the transmitting antenna. Buried object or
boundaries cause part of the way to bounce back to the receiver.
The time lag from the signal transmitted and receive signal from
the antenna can be used to determine the deepness, character
Proceedings of 2017 Electrical Engineering Symposium (EES2017) - Vol. 1
142

and properties of detection material. From the project test result
made in literatures before, GPR antenna with low frequency can
detect the large object and large debts while high frequency
antenna detect small object and small debts. GPR also able to
find hidden metallic and non-metallic structures without
varying the environment, but with GPR investigations there are
limitations depending on the unrestrained and restrained groups
of factors, and ground condition, for examples, soil penetration
depends on soil type and antenna type [14].
2) Thermography: The principle use of thermography (IR)
is detecting the thermal contrasts in soil due to water leaks by
using the camera and images [15]. There are several detection
methods in thermography process either with physical handheld
or sometimes with vehicles and also can attach infrared cameras
on a plane. Factors that affect thermal contrast is heat balance
of pavement surface and heat of moisture transfer in soil. In
addition, several advantages when use thermography, it can use
both in a day or night, also faster than others and highly
effective for large areas. By the way, from the experiment
conducted in literature, the IR camera cannot operate in summer
and winter due to the temperature effect [16].
3) Tracer Gas Technique: For tracer gas technique, water
leak can detect only by using gas sensor. In the operation
process, some non-toxic or any substance that can produce gas
such as helium or hydrogen was used. Firstly, the substance is
injected into the water pipe. Gas is produced from the reaction
of substance and water flow along the pipe to find a leak. The
gas escapes at a leak opening and absorb to the pavement. With
highly sensitive gas detector use, the leak will be traced.
B. Acoustic Methods for Water Leak Detection Methods
1) Listening Device: Listening device can be found in
electrical and mechanical depends on their features. Listening
method is also called as locate or pinpoint method [1]. In
practice, more user chooses the electrical listening device due
to the sensitive sensing element and also it has noise filter and
amplifier to control the output. Mostly, they use very high
sensitivity mechanisms or ground sensor such as geophone,
aqua phones, and listening rods that can detect vibration and
sound of water leak. The sensitivity of a piezoelectric sensor
(accelerometer) above 1 v/g is the common use and for the
geophone is 1mv/pa. The filter was used to make sure only the
actual signal of water leak can be detected by the ground sensor.
Listening device is commonly used to detect large leaks,
especially for the metal pipe system. It is not very suitable for
the non-metal pipe unless the high pressure of water in the pipe
makes a loud sound and vibration same with the metal pipe. For
the survey operation, mostly operator puts the sensor only at
convenient fittings, such as valves and fire hydrant. Another
way, ground microphones are used to pinpoint leaks in small
interval at the location target by listening sound or vibration
signal at the ground surface straightly above pipes [20].
However, the effectiveness of this method depends on the
surrounding conditions, especially from ambient noise such as
traffic and wind, the size of leaks, and the type of pipe. This
method is very easy to conduct and straightforward, but the
process will take a long time depends on the experiences of the
user [17].
Fig. 1. Acoustic method for water leakage detection [21].
2) Leak noise correlators: These are portable
microprocessor-based devices that pinpoint leaks automatically
based on the cross-correlation method [18]. A noise correlation
works by attaching hydrophone or two vibration sensors
normally accelerometer at two points suspected leak and
usually at fire hydrant or any point same pipe. This method uses
wireless radio transmitter to sense the vibration or the sound
frequency signal. By using the simple calculation and also from
the relationship between time delays, the propagation of
signals, and velocity of signals, the distance of leak from the
sensor can be traced [18] [20]. Usually, the engineer will refer
to the map or architecture drawing for piping system in that
place after they get the actual distance from the sensor point.
This is the most technique used to detect leakage, but it only
gives a satisfactory results only with metal pipes. For the plastic
pipes, this technique can be problematic because of the acoustic
signals are generally very low frequency and narrow band.
Nevertheless, high energy interferers, the presence of
surrounding noise, and signal scattering also will reduce the
effectiveness of this method [19].
III. METHODOLOGY
A. Design Flowchart
The Fig. 2 shows the flow of the project starting from the
literature review of the previous project, selection of sensor
from various type of sensor, selections of amplifier circuit that
give high output gain, Wi-Fi and hardware design. After all the
assembly part done, testing process was took place. The output
result from the testing process is very important to prove that
the device is really function or not to detect underground water
leakage.
Proceedings of 2017 Electrical Engineering Symposium (EES2017) - Vol. 1
143
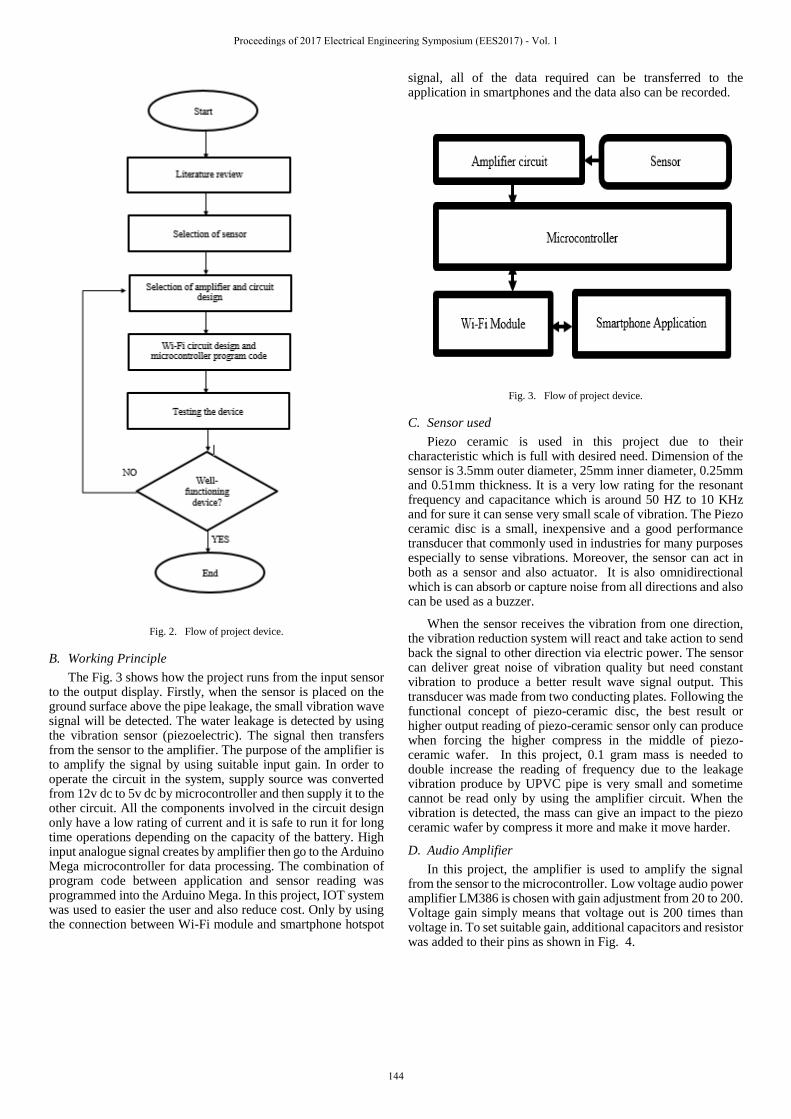
Fig. 2. Flow of project device.
B. Working Principle
The Fig. 3 shows how the project runs from the input sensor to the output display. Firstly, when the sensor is placed on the ground surface above the pipe leakage, the small vibration wave signal will be detected. The water leakage is detected by using the vibration sensor (piezoelectric). The signal then transfers from the sensor to the amplifier. The purpose of the amplifier is to amplify the signal by using suitable input gain. In order to operate the circuit in the system, supply source was converted from 12v dc to 5v dc by microcontroller and then supply it to the other circuit. All the components involved in the circuit design only have a low rating of current and it is safe to run it for long time operations depending on the capacity of the battery. High input analogue signal creates by amplifier then go to the Arduino Mega microcontroller for data processing. The combination of program code between application and sensor reading was programmed into the Arduino Mega. In this project, IOT system was used to easier the user and also reduce cost. Only by using the connection between Wi-Fi module and smartphone hotspot
signal, all of the data required can be transferred to the application in smartphones and the data also can be recorded.
Fig. 3. Flow of project device.
C. Sensor used
Piezo ceramic is used in this project due to their characteristic which is full with desired need. Dimension of the sensor is 3.5mm outer diameter, 25mm inner diameter, 0.25mm and 0.51mm thickness. It is a very low rating for the resonant frequency and capacitance which is around 50 HZ to 10 KHz and for sure it can sense very small scale of vibration. The Piezo ceramic disc is a small, inexpensive and a good performance transducer that commonly used in industries for many purposes especially to sense vibrations. Moreover, the sensor can act in both as a sensor and also actuator. It is also omnidirectional which is can absorb or capture noise from all directions and also can be used as a buzzer.
When the sensor receives the vibration from one direction, the vibration reduction system will react and take action to send back the signal to other direction via electric power. The sensor can deliver great noise of vibration quality but need constant vibration to produce a better result wave signal output. This transducer was made from two conducting plates. Following the functional concept of piezo-ceramic disc, the best result or higher output reading of piezo-ceramic sensor only can produce when forcing the higher compress in the middle of piezo-ceramic wafer. In this project, 0.1 gram mass is needed to double increase the reading of frequency due to the leakage vibration produce by UPVC pipe is very small and sometime cannot be read only by using the amplifier circuit. When the vibration is detected, the mass can give an impact to the piezo ceramic wafer by compress it more and make it move harder.
D. Audio Amplifier
In this project, the amplifier is used to amplify the signal from the sensor to the microcontroller. Low voltage audio power amplifier LM386 is chosen with gain adjustment from 20 to 200. Voltage gain simply means that voltage out is 200 times than voltage in. To set suitable gain, additional capacitors and resistor was added to their pins as shown in Fig. 4.
Proceedings of 2017 Electrical Engineering Symposium (EES2017) - Vol. 1
144
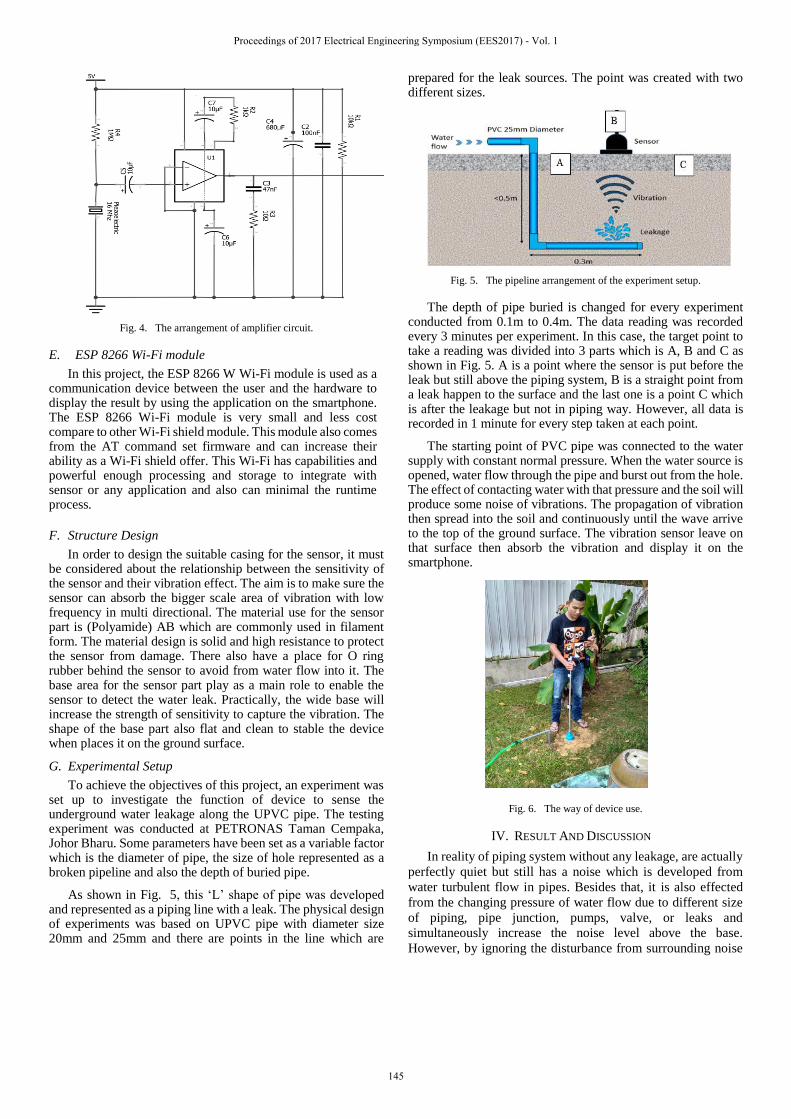
Fig. 4. The arrangement of amplifier circuit.
E. ESP 8266 Wi-Fi module
In this project, the ESP 8266 W Wi-Fi module is used as a communication device between the user and the hardware to display the result by using the application on the smartphone. The ESP 8266 Wi-Fi module is very small and less cost compare to other Wi-Fi shield module. This module also comes from the AT command set firmware and can increase their ability as a Wi-Fi shield offer. This Wi-Fi has capabilities and powerful enough processing and storage to integrate with sensor or any application and also can minimal the runtime process.
F. Structure Design
In order to design the suitable casing for the sensor, it must be considered about the relationship between the sensitivity of the sensor and their vibration effect. The aim is to make sure the sensor can absorb the bigger scale area of vibration with low frequency in multi directional. The material use for the sensor part is (Polyamide) AB which are commonly used in filament form. The material design is solid and high resistance to protect the sensor from damage. There also have a place for O ring rubber behind the sensor to avoid from water flow into it. The base area for the sensor part play as a main role to enable the sensor to detect the water leak. Practically, the wide base will increase the strength of sensitivity to capture the vibration. The shape of the base part also flat and clean to stable the device when places it on the ground surface.
G. Experimental Setup
To achieve the objectives of this project, an experiment was set up to investigate the function of device to sense the underground water leakage along the UPVC pipe. The testing experiment was conducted at PETRONAS Taman Cempaka, Johor Bharu. Some parameters have been set as a variable factor which is the diameter of pipe, the size of hole represented as a broken pipeline and also the depth of buried pipe.
As shown in Fig. 5, this ‘L’ shape of pipe was developed and represented as a piping line with a leak. The physical design of experiments was based on UPVC pipe with diameter size 20mm and 25mm and there are points in the line which are
prepared for the leak sources. The point was created with two different sizes.
Fig. 5. The pipeline arrangement of the experiment setup.
The depth of pipe buried is changed for every experiment conducted from 0.1m to 0.4m. The data reading was recorded every 3 minutes per experiment. In this case, the target point to take a reading was divided into 3 parts which is A, B and C as shown in Fig. 5. A is a point where the sensor is put before the leak but still above the piping system, B is a straight point from a leak happen to the surface and the last one is a point C which is after the leakage but not in piping way. However, all data is recorded in 1 minute for every step taken at each point.
The starting point of PVC pipe was connected to the water supply with constant normal pressure. When the water source is opened, water flow through the pipe and burst out from the hole. The effect of contacting water with that pressure and the soil will produce some noise of vibrations. The propagation of vibration then spread into the soil and continuously until the wave arrive to the top of the ground surface. The vibration sensor leave on that surface then absorb the vibration and display it on the smartphone.
Fig. 6. The way of device use.
IV. RESULT AND DISCUSSION
In reality of piping system without any leakage, are actually
perfectly quiet but still has a noise which is developed from
water turbulent flow in pipes. Besides that, it is also effected
from the changing pressure of water flow due to different size
of piping, pipe junction, pumps, valve, or leaks and
simultaneously increase the noise level above the base.
However, by ignoring the disturbance from surrounding noise
Proceedings of 2017 Electrical Engineering Symposium (EES2017) - Vol. 1
145
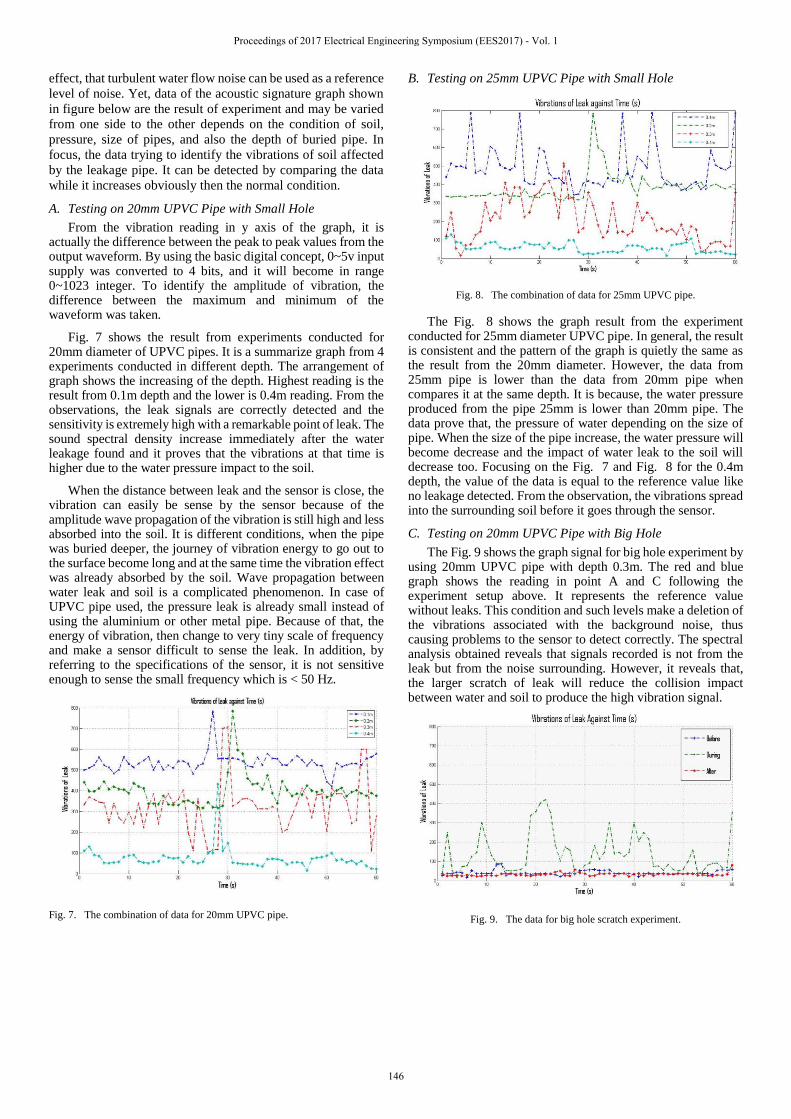
effect, that turbulent water flow noise can be used as a reference
level of noise. Yet, data of the acoustic signature graph shown
in figure below are the result of experiment and may be varied
from one side to the other depends on the condition of soil,
pressure, size of pipes, and also the depth of buried pipe. In
focus, the data trying to identify the vibrations of soil affected
by the leakage pipe. It can be detected by comparing the data
while it increases obviously then the normal condition.
A. Testing on 20mm UPVC Pipe with Small Hole
From the vibration reading in y axis of the graph, it is actually the difference between the peak to peak values from the output waveform. By using the basic digital concept, 0~5v input supply was converted to 4 bits, and it will become in range 0~1023 integer. To identify the amplitude of vibration, the difference between the maximum and minimum of the waveform was taken.
Fig. 7 shows the result from experiments conducted for 20mm diameter of UPVC pipes. It is a summarize graph from 4 experiments conducted in different depth. The arrangement of graph shows the increasing of the depth. Highest reading is the result from 0.1m depth and the lower is 0.4m reading. From the observations, the leak signals are correctly detected and the sensitivity is extremely high with a remarkable point of leak. The sound spectral density increase immediately after the water leakage found and it proves that the vibrations at that time is higher due to the water pressure impact to the soil.
When the distance between leak and the sensor is close, the vibration can easily be sense by the sensor because of the amplitude wave propagation of the vibration is still high and less absorbed into the soil. It is different conditions, when the pipe was buried deeper, the journey of vibration energy to go out to the surface become long and at the same time the vibration effect was already absorbed by the soil. Wave propagation between water leak and soil is a complicated phenomenon. In case of UPVC pipe used, the pressure leak is already small instead of using the aluminium or other metal pipe. Because of that, the energy of vibration, then change to very tiny scale of frequency and make a sensor difficult to sense the leak. In addition, by referring to the specifications of the sensor, it is not sensitive enough to sense the small frequency which is < 50 Hz.
Fig. 7. The combination of data for 20mm UPVC pipe.
B. Testing on 25mm UPVC Pipe with Small Hole
Fig. 8. The combination of data for 25mm UPVC pipe.
The Fig. 8 shows the graph result from the experiment conducted for 25mm diameter UPVC pipe. In general, the result is consistent and the pattern of the graph is quietly the same as the result from the 20mm diameter. However, the data from 25mm pipe is lower than the data from 20mm pipe when compares it at the same depth. It is because, the water pressure produced from the pipe 25mm is lower than 20mm pipe. The data prove that, the pressure of water depending on the size of pipe. When the size of the pipe increase, the water pressure will become decrease and the impact of water leak to the soil will decrease too. Focusing on the Fig. 7 and Fig. 8 for the 0.4m depth, the value of the data is equal to the reference value like no leakage detected. From the observation, the vibrations spread into the surrounding soil before it goes through the sensor.
C. Testing on 20mm UPVC Pipe with Big Hole
The Fig. 9 shows the graph signal for big hole experiment by using 20mm UPVC pipe with depth 0.3m. The red and blue graph shows the reading in point A and C following the experiment setup above. It represents the reference value without leaks. This condition and such levels make a deletion of the vibrations associated with the background noise, thus causing problems to the sensor to detect correctly. The spectral analysis obtained reveals that signals recorded is not from the leak but from the noise surrounding. However, it reveals that, the larger scratch of leak will reduce the collision impact between water and soil to produce the high vibration signal.
Fig. 9. The data for big hole scratch experiment.
Proceedings of 2017 Electrical Engineering Symposium (EES2017) - Vol. 1
146
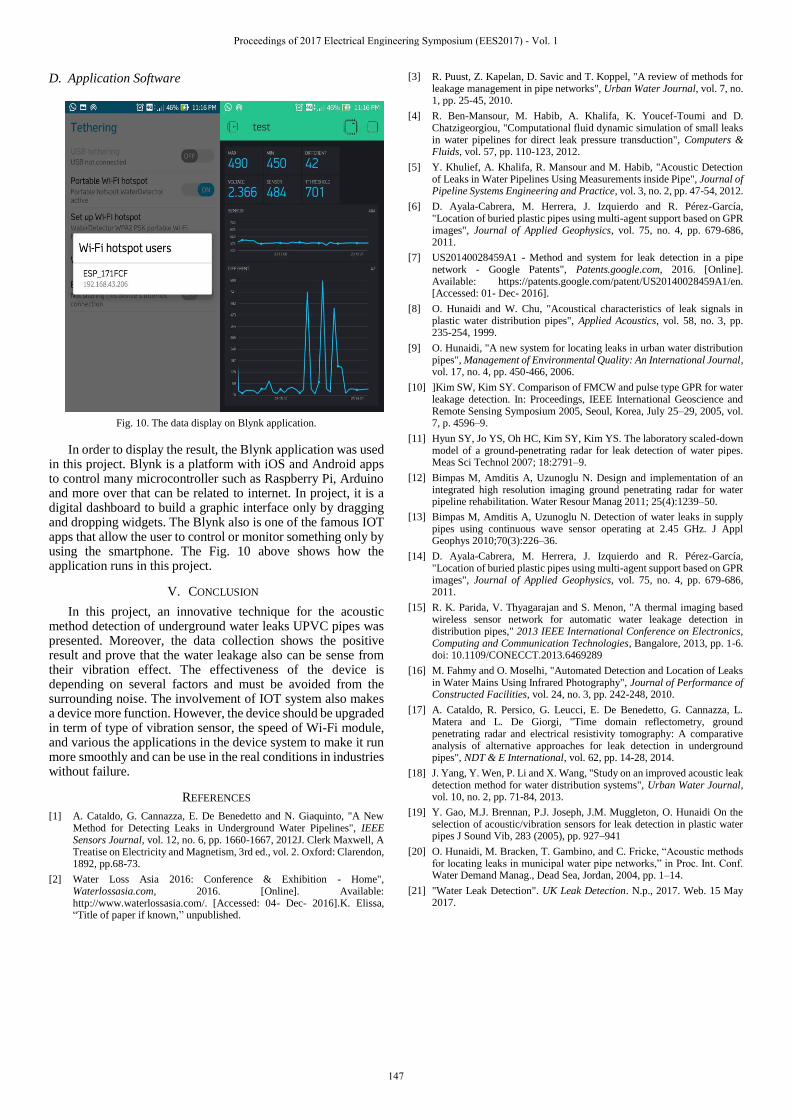
D. Application Software
Fig. 10. The data display on Blynk application.
In order to display the result, the Blynk application was used in this project. Blynk is a platform with iOS and Android apps to control many microcontroller such as Raspberry Pi, Arduino and more over that can be related to internet. In project, it is a digital dashboard to build a graphic interface only by dragging and dropping widgets. The Blynk also is one of the famous IOT apps that allow the user to control or monitor something only by using the smartphone. The Fig. 10 above shows how the application runs in this project.
V. CONCLUSION
In this project, an innovative technique for the acoustic method detection of underground water leaks UPVC pipes was presented. Moreover, the data collection shows the positive result and prove that the water leakage also can be sense from their vibration effect. The effectiveness of the device is depending on several factors and must be avoided from the surrounding noise. The involvement of IOT system also makes a device more function. However, the device should be upgraded in term of type of vibration sensor, the speed of Wi-Fi module, and various the applications in the device system to make it run more smoothly and can be use in the real conditions in industries without failure.
REFERENCES
[1] A. Cataldo, G. Cannazza, E. De Benedetto and N. Giaquinto, "A New Method for Detecting Leaks in Underground Water Pipelines", IEEE Sensors Journal, vol. 12, no. 6, pp. 1660-1667, 2012J. Clerk Maxwell, A Treatise on Electricity and Magnetism, 3rd ed., vol. 2. Oxford: Clarendon, 1892, pp.68-73.
[2] Water Loss Asia 2016: Conference & Exhibition - Home", Waterlossasia.com, 2016. [Online]. Available: http://www.waterlossasia.com/. [Accessed: 04- Dec- 2016].K. Elissa, “Title of paper if known,” unpublished.
[3] R. Puust, Z. Kapelan, D. Savic and T. Koppel, "A review of methods for leakage management in pipe networks", Urban Water Journal, vol. 7, no. 1, pp. 25-45, 2010.
[4] R. Ben-Mansour, M. Habib, A. Khalifa, K. Youcef-Toumi and D. Chatzigeorgiou, "Computational fluid dynamic simulation of small leaks in water pipelines for direct leak pressure transduction", Computers & Fluids, vol. 57, pp. 110-123, 2012.
[5] Y. Khulief, A. Khalifa, R. Mansour and M. Habib, "Acoustic Detection of Leaks in Water Pipelines Using Measurements inside Pipe", Journal of Pipeline Systems Engineering and Practice, vol. 3, no. 2, pp. 47-54, 2012.
[6] D. Ayala-Cabrera, M. Herrera, J. Izquierdo and R. Pérez-García, "Location of buried plastic pipes using multi-agent support based on GPR images", Journal of Applied Geophysics, vol. 75, no. 4, pp. 679-686, 2011.
[7] US20140028459A1 - Method and system for leak detection in a pipe network - Google Patents", Patents.google.com, 2016. [Online]. Available: https://patents.google.com/patent/US20140028459A1/en. [Accessed: 01- Dec- 2016].
[8] O. Hunaidi and W. Chu, "Acoustical characteristics of leak signals in plastic water distribution pipes", Applied Acoustics, vol. 58, no. 3, pp. 235-254, 1999.
[9] O. Hunaidi, "A new system for locating leaks in urban water distribution pipes", Management of Environmental Quality: An International Journal, vol. 17, no. 4, pp. 450-466, 2006.
[10] ]Kim SW, Kim SY. Comparison of FMCW and pulse type GPR for water leakage detection. In: Proceedings, IEEE International Geoscience and Remote Sensing Symposium 2005, Seoul, Korea, July 25–29, 2005, vol. 7, p. 4596–9.
[11] Hyun SY, Jo YS, Oh HC, Kim SY, Kim YS. The laboratory scaled-down model of a ground-penetrating radar for leak detection of water pipes. Meas Sci Technol 2007; 18:2791–9.
[12] Bimpas M, Amditis A, Uzunoglu N. Design and implementation of an integrated high resolution imaging ground penetrating radar for water pipeline rehabilitation. Water Resour Manag 2011; 25(4):1239–50.
[13] Bimpas M, Amditis A, Uzunoglu N. Detection of water leaks in supply pipes using continuous wave sensor operating at 2.45 GHz. J Appl Geophys 2010;70(3):226–36.
[14] D. Ayala-Cabrera, M. Herrera, J. Izquierdo and R. Pérez-García, "Location of buried plastic pipes using multi-agent support based on GPR images", Journal of Applied Geophysics, vol. 75, no. 4, pp. 679-686, 2011.
[15] R. K. Parida, V. Thyagarajan and S. Menon, "A thermal imaging based wireless sensor network for automatic water leakage detection in distribution pipes," 2013 IEEE International Conference on Electronics, Computing and Communication Technologies, Bangalore, 2013, pp. 1-6. doi: 10.1109/CONECCT.2013.6469289
[16] M. Fahmy and O. Moselhi, "Automated Detection and Location of Leaks in Water Mains Using Infrared Photography", Journal of Performance of Constructed Facilities, vol. 24, no. 3, pp. 242-248, 2010.
[17] A. Cataldo, R. Persico, G. Leucci, E. De Benedetto, G. Cannazza, L. Matera and L. De Giorgi, "Time domain reflectometry, ground penetrating radar and electrical resistivity tomography: A comparative analysis of alternative approaches for leak detection in underground pipes", NDT & E International, vol. 62, pp. 14-28, 2014.
[18] J. Yang, Y. Wen, P. Li and X. Wang, "Study on an improved acoustic leak detection method for water distribution systems", Urban Water Journal, vol. 10, no. 2, pp. 71-84, 2013.
[19] Y. Gao, M.J. Brennan, P.J. Joseph, J.M. Muggleton, O. Hunaidi On the selection of acoustic/vibration sensors for leak detection in plastic water pipes J Sound Vib, 283 (2005), pp. 927–941
[20] O. Hunaidi, M. Bracken, T. Gambino, and C. Fricke, “Acoustic methods for locating leaks in municipal water pipe networks,” in Proc. Int. Conf. Water Demand Manag., Dead Sea, Jordan, 2004, pp. 1–14.
[21] "Water Leak Detection". UK Leak Detection. N.p., 2017. Web. 15 May 2017.
Proceedings of 2017 Electrical Engineering Symposium (EES2017) - Vol. 1
147

Digital Control of Water Level Plant using
MyOpenLab Software
Nur Azmah binti Mat Kia
Faculty of Electrical Engineering
Universiti Teknologi Malaysia
Johor Bahru, Malaysia.
Rosbi bin Mamat
Department of Control and Mechatronic Engineering
Faculty of Electrical Engineering
Universiti Teknologi Malaysia
Johor Bahru, Malaysia.
Abstract— This paper present way to evaluate on how to
implement digital control by using less expensive software and
hardware for teaching, learning, research and real-time
implementation. In this project, digital control used both
MyOpenLab software and Arduino as data acquisition card
(DAQ). MyOpenLab software is the open source software which is
free to install and does not required a license. For this project,
module G30A, G30B and TY30 is used for prototype. Before
digital control system is applied, a few experiment is done such as
calibration process and experiment for full open valve condition
and half open valve condition. The calibration is done to determine
the voltage that is corresponding to the level of water. The
experiment for full open valve and half open valve condition is
done to determine the transfer function for this system. The
transfer function of this system is also used to find the parameter
of PI controller. The parameter of PI controller, 𝑲𝒑 and 𝑻𝒊 is used
in MyOpenLab software for digital control system. After the
digital control system is applied, the performance of this system is
shown in MyOpenLab software at the front panel. From this
performance, the characteristic of transient response was
determined. It shows that MyOpenLab software can operate same
as other software that required license and more expensive to
install such as MATLAB and Labview.
Keywords—MyOpenLab software; digital control; PID
controller; Arduino
I. INTRODUCTION
In Malaysia, water treatment plant used SCADA system that consists of PLC (Programmable Logic Controller) to monitor and control this plant. By using SCADA, all the process can be monitored and controlled at control room that is controlled by the person in charge. SCADA stands for Supervisory Control and Data Acquisition that commonly use in an industrial automation control system. SCADA system allows real time data from plant to be accessed from anywhere in the world [1]. The controlling and monitoring water treatment plant can be simulated by using MATLAB and LABVIEW. By using MATLAB software, simulink model can be used to simulate water control level for water treatment plant. However, Labview software uses graphical programming language to control and monitor water treatment plant. This graphical programming language is simple to create and visualize. Both software required specific data acquisition (DAQ) card for simulation.
Therefore, prototyping digital control or computer control in teaching, learning and research required software and hardware. Software that commonly used for digital control system is MATLAB and Labview. This two software also required a specific data acquisition (DAQ) card for communication with hardware system. This software and hardware are expensive because the software required a licence for installing process. So, the problem statement for this paper is to evaluate on how to implement a digital control by using less expensive software and hardware for teaching, learning, research and for real-time digital control implementation. The software and hardware used in this project is MyOpenLab software and Arduino as a data acquisition card (DAQ).
There are three objective for this paper which is to study the effectiveness of using MyOpenLab software for teaching and learning in Digital Control System. The second objective is to implement real time control of PI controller on a water tank level control system and lastly to evaluate the performance of analog PID and digital PID of the level control.
II. LITERATURE REVIEW
A. Overview of Digital Control System
Digital control system used digital signal (instruction) and a digital computer to control the process. However, there are some type of digital control system that require instruction to execute automatically because the control system requires information to do the process.
Fig.1 shows that the general block diagram for digital control system is consist of digital part and analog part. Digital part consist of computer, DAC and ADC while analog part consist of actuator, process and sensor. In digital control system, the analog to digital converter (ADC) used is to convert the analog signal from plant to digital signal before the information is transferred to computer. Meanwhile, the digital to analog converter (DAC) is used to convert digital signal from computer to analog signal to proceed with the process [2].
Proceedings of 2017 Electrical Engineering Symposium (EES2017) - Vol. 1
148
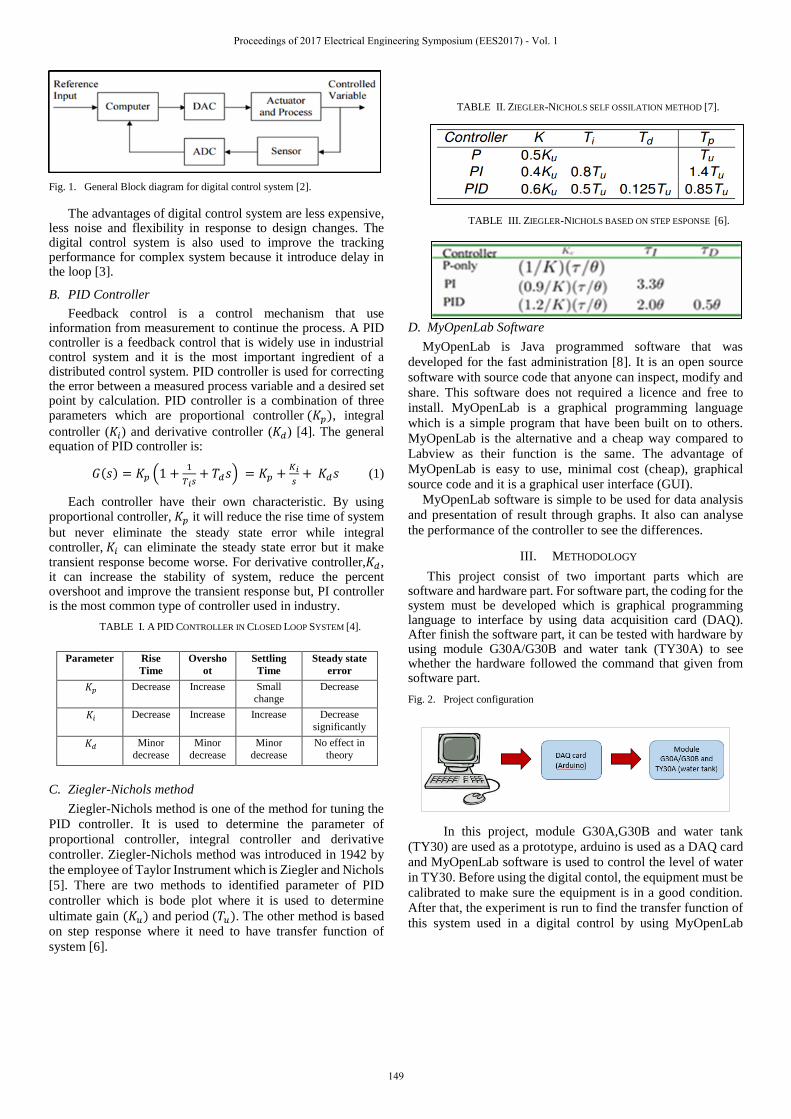
Fig. 1. General Block diagram for digital control system [2].
The advantages of digital control system are less expensive, less noise and flexibility in response to design changes. The digital control system is also used to improve the tracking performance for complex system because it introduce delay in the loop [3].
B. PID Controller
Feedback control is a control mechanism that use information from measurement to continue the process. A PID controller is a feedback control that is widely use in industrial control system and it is the most important ingredient of a distributed control system. PID controller is used for correcting the error between a measured process variable and a desired set point by calculation. PID controller is a combination of three parameters which are proportional controller (𝐾𝑝), integral
controller (𝐾𝑖) and derivative controller (𝐾𝑑) [4]. The general equation of PID controller is:
𝐺(𝑠) = 𝐾𝑝 (1 +1
𝑇𝑖𝑠+ 𝑇𝑑𝑠) = 𝐾𝑝 +
𝐾𝑖
𝑠+ 𝐾𝑑𝑠 (1)
Each controller have their own characteristic. By using proportional controller, 𝐾𝑝 it will reduce the rise time of system
but never eliminate the steady state error while integral controller, 𝐾𝑖 can eliminate the steady state error but it make transient response become worse. For derivative controller,𝐾𝑑, it can increase the stability of system, reduce the percent overshoot and improve the transient response but, PI controller is the most common type of controller used in industry.
TABLE I. A PID CONTROLLER IN CLOSED LOOP SYSTEM [4].
C. Ziegler-Nichols method
Ziegler-Nichols method is one of the method for tuning the
PID controller. It is used to determine the parameter of
proportional controller, integral controller and derivative
controller. Ziegler-Nichols method was introduced in 1942 by
the employee of Taylor Instrument which is Ziegler and Nichols
[5]. There are two methods to identified parameter of PID
controller which is bode plot where it is used to determine
ultimate gain (𝐾𝑢) and period (𝑇𝑢). The other method is based
on step response where it need to have transfer function of
system [6].
TABLE II. ZIEGLER-NICHOLS SELF OSSILATION METHOD [7].
TABLE III. ZIEGLER-NICHOLS BASED ON STEP ESPONSE [6].
D. MyOpenLab Software
MyOpenLab is Java programmed software that was
developed for the fast administration [8]. It is an open source
software with source code that anyone can inspect, modify and
share. This software does not required a licence and free to
install. MyOpenLab is a graphical programming language
which is a simple program that have been built on to others.
MyOpenLab is the alternative and a cheap way compared to
Labview as their function is the same. The advantage of
MyOpenLab is easy to use, minimal cost (cheap), graphical
source code and it is a graphical user interface (GUI).
MyOpenLab software is simple to be used for data analysis
and presentation of result through graphs. It also can analyse
the performance of the controller to see the differences.
III. METHODOLOGY
This project consist of two important parts which are software and hardware part. For software part, the coding for the system must be developed which is graphical programming language to interface by using data acquisition card (DAQ). After finish the software part, it can be tested with hardware by using module G30A/G30B and water tank (TY30A) to see whether the hardware followed the command that given from software part.
Fig. 2. Project configuration
In this project, module G30A,G30B and water tank
(TY30) are used as a prototype, arduino is used as a DAQ card
and MyOpenLab software is used to control the level of water
in TY30. Before using the digital contol, the equipment must be
calibrated to make sure the equipment is in a good condition.
After that, the experiment is run to find the transfer function of
this system used in a digital control by using MyOpenLab
Parameter Rise
Time
Oversho
ot
Settling
Time
Steady state
error
𝐾𝑝 Decrease Increase Small change
Decrease
𝐾𝑖 Decrease Increase Increase Decrease
significantly
𝐾𝑑 Minor
decrease
Minor
decrease
Minor
decrease
No effect in
theory
Proceedings of 2017 Electrical Engineering Symposium (EES2017) - Vol. 1
149
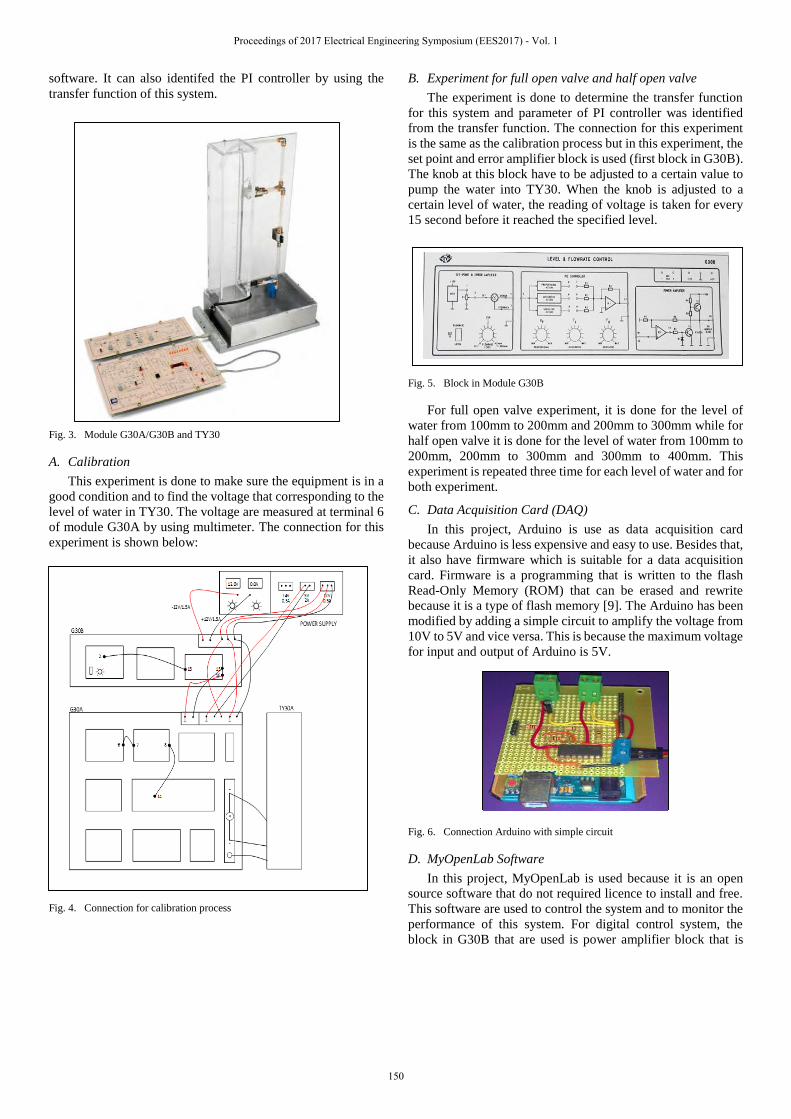
software. It can also identifed the PI controller by using the
transfer function of this system.
Fig. 3. Module G30A/G30B and TY30
A. Calibration
This experiment is done to make sure the equipment is in a
good condition and to find the voltage that corresponding to the
level of water in TY30. The voltage are measured at terminal 6
of module G30A by using multimeter. The connection for this
experiment is shown below:
Fig. 4. Connection for calibration process
B. Experiment for full open valve and half open valve
The experiment is done to determine the transfer function
for this system and parameter of PI controller was identified
from the transfer function. The connection for this experiment
is the same as the calibration process but in this experiment, the
set point and error amplifier block is used (first block in G30B).
The knob at this block have to be adjusted to a certain value to
pump the water into TY30. When the knob is adjusted to a
certain level of water, the reading of voltage is taken for every
15 second before it reached the specified level.
Fig. 5. Block in Module G30B
For full open valve experiment, it is done for the level of
water from 100mm to 200mm and 200mm to 300mm while for
half open valve it is done for the level of water from 100mm to
200mm, 200mm to 300mm and 300mm to 400mm. This
experiment is repeated three time for each level of water and for
both experiment.
C. Data Acquisition Card (DAQ)
In this project, Arduino is use as data acquisition card
because Arduino is less expensive and easy to use. Besides that,
it also have firmware which is suitable for a data acquisition
card. Firmware is a programming that is written to the flash
Read-Only Memory (ROM) that can be erased and rewrite
because it is a type of flash memory [9]. The Arduino has been
modified by adding a simple circuit to amplify the voltage from
10V to 5V and vice versa. This is because the maximum voltage
for input and output of Arduino is 5V.
Fig. 6. Connection Arduino with simple circuit
D. MyOpenLab Software
In this project, MyOpenLab is used because it is an open
source software that do not required licence to install and free.
This software are used to control the system and to monitor the
performance of this system. For digital control system, the
block in G30B that are used is power amplifier block that is
Proceedings of 2017 Electrical Engineering Symposium (EES2017) - Vol. 1
150
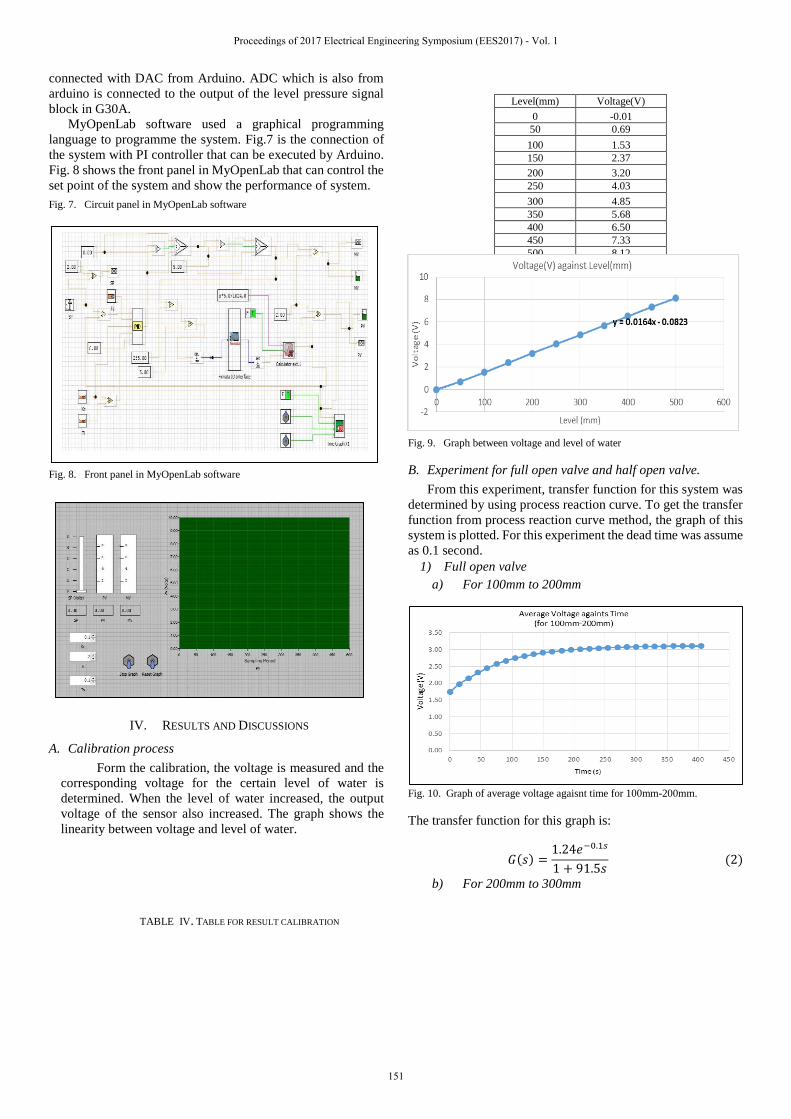
connected with DAC from Arduino. ADC which is also from
arduino is connected to the output of the level pressure signal
block in G30A.
MyOpenLab software used a graphical programming
language to programme the system. Fig.7 is the connection of
the system with PI controller that can be executed by Arduino.
Fig. 8 shows the front panel in MyOpenLab that can control the
set point of the system and show the performance of system.
Fig. 7. Circuit panel in MyOpenLab software
Fig. 8. Front panel in MyOpenLab software
IV. RESULTS AND DISCUSSIONS
A. Calibration process
Form the calibration, the voltage is measured and the
corresponding voltage for the certain level of water is
determined. When the level of water increased, the output
voltage of the sensor also increased. The graph shows the
linearity between voltage and level of water.
TABLE IV. TABLE FOR RESULT CALIBRATION
Fig. 9. Graph between voltage and level of water
B. Experiment for full open valve and half open valve.
From this experiment, transfer function for this system was
determined by using process reaction curve. To get the transfer
function from process reaction curve method, the graph of this
system is plotted. For this experiment the dead time was assume
as 0.1 second.
1) Full open valve
a) For 100mm to 200mm
Fig. 10. Graph of average voltage agaisnt time for 100mm-200mm.
The transfer function for this graph is:
𝐺(𝑠) =1.24𝑒−0.1𝑠
1 + 91.5𝑠 (2)
b) For 200mm to 300mm
Level(mm) Voltage(V)
0 -0.01
50 0.69
100 1.53
150 2.37
200 3.20
250 4.03
300 4.85
350 5.68
400 6.50
450 7.33
500 8.12
Proceedings of 2017 Electrical Engineering Symposium (EES2017) - Vol. 1
151
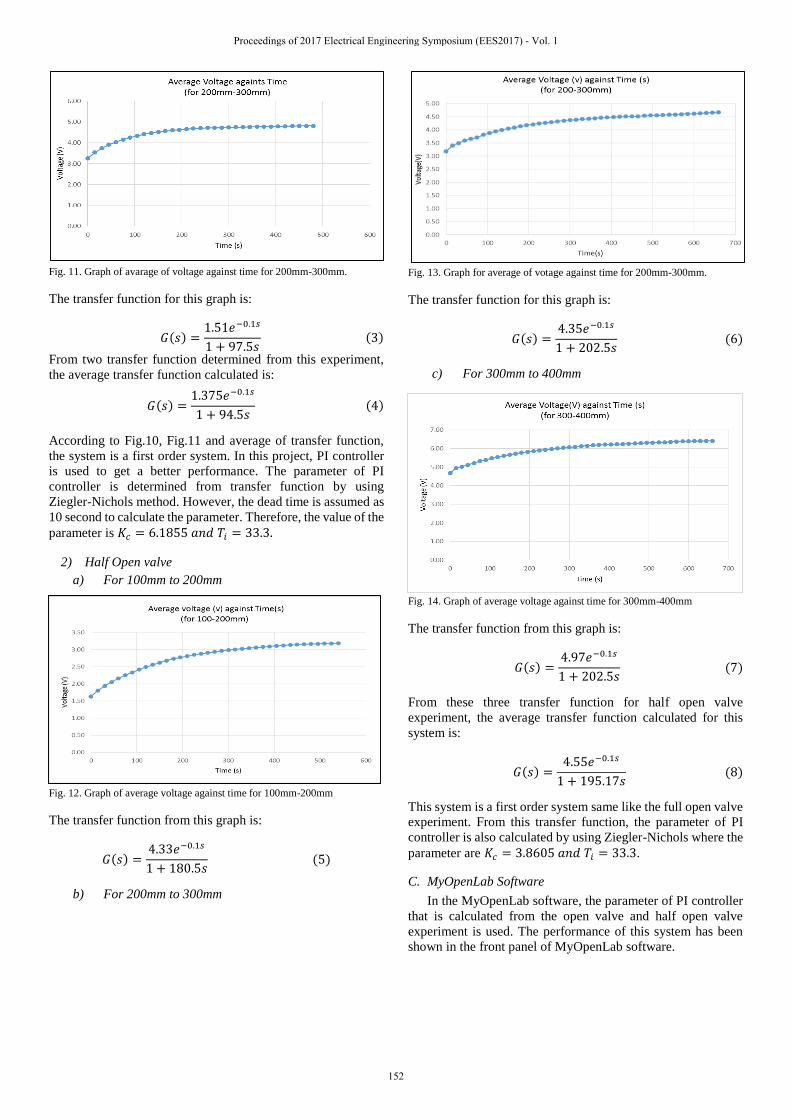
Fig. 11. Graph of avarage of voltage against time for 200mm-300mm.
The transfer function for this graph is:
𝐺(𝑠) =1.51𝑒−0.1𝑠
1 + 97.5𝑠 (3)
From two transfer function determined from this experiment,
the average transfer function calculated is:
𝐺(𝑠) =1.375𝑒−0.1𝑠
1 + 94.5𝑠 (4)
According to Fig.10, Fig.11 and average of transfer function,
the system is a first order system. In this project, PI controller
is used to get a better performance. The parameter of PI
controller is determined from transfer function by using
Ziegler-Nichols method. However, the dead time is assumed as
10 second to calculate the parameter. Therefore, the value of the
parameter is 𝐾𝑐 = 6.1855 𝑎𝑛𝑑 𝑇𝑖 = 33.3.
2) Half Open valve
a) For 100mm to 200mm
Fig. 12. Graph of average voltage against time for 100mm-200mm
The transfer function from this graph is:
𝐺(𝑠) =4.33𝑒−0.1𝑠
1 + 180.5𝑠 (5)
b) For 200mm to 300mm
Fig. 13. Graph for average of votage against time for 200mm-300mm.
The transfer function for this graph is:
𝐺(𝑠) =4.35𝑒−0.1𝑠
1 + 202.5𝑠 (6)
c) For 300mm to 400mm
Fig. 14. Graph of average voltage against time for 300mm-400mm
The transfer function from this graph is:
𝐺(𝑠) =4.97𝑒−0.1𝑠
1 + 202.5𝑠 (7)
From these three transfer function for half open valve
experiment, the average transfer function calculated for this
system is:
𝐺(𝑠) =4.55𝑒−0.1𝑠
1 + 195.17𝑠 (8)
This system is a first order system same like the full open valve
experiment. From this transfer function, the parameter of PI
controller is also calculated by using Ziegler-Nichols where the
parameter are 𝐾𝑐 = 3.8605 𝑎𝑛𝑑 𝑇𝑖 = 33.3.
C. MyOpenLab Software
In the MyOpenLab software, the parameter of PI controller
that is calculated from the open valve and half open valve
experiment is used. The performance of this system has been
shown in the front panel of MyOpenLab software.
Proceedings of 2017 Electrical Engineering Symposium (EES2017) - Vol. 1
152
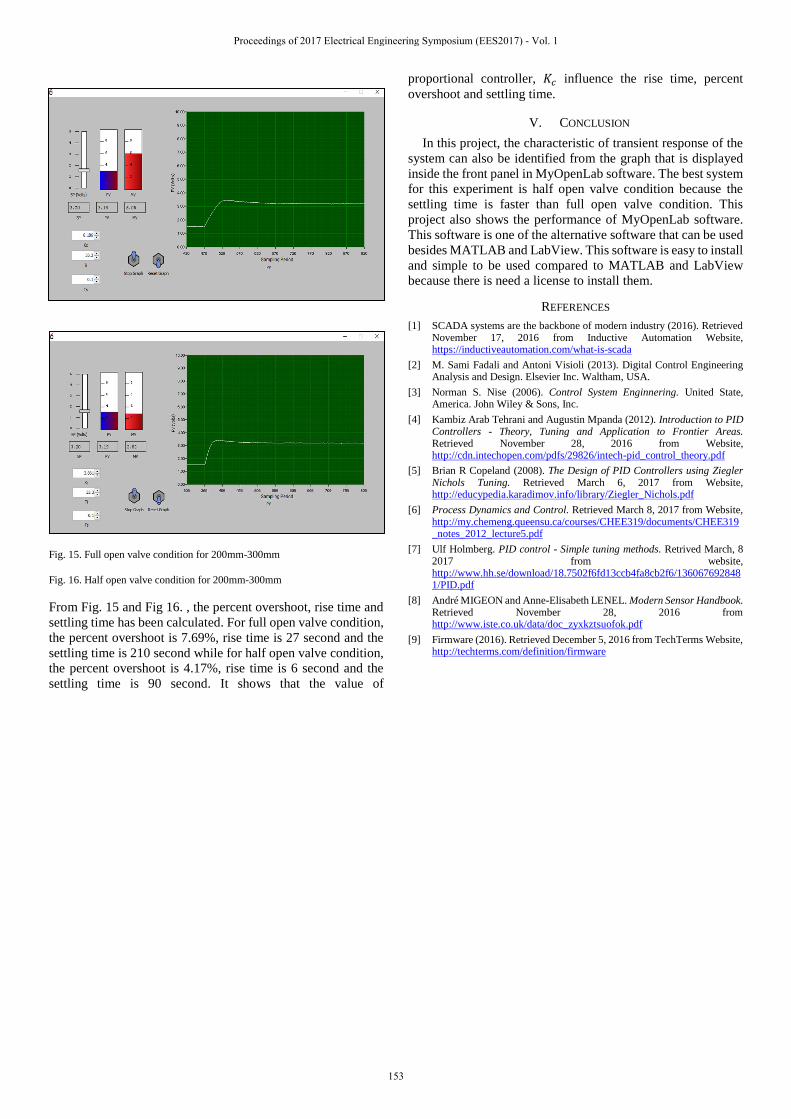
Fig. 15. Full open valve condition for 200mm-300mm
Fig. 16. Half open valve condition for 200mm-300mm
From Fig. 15 and Fig 16. , the percent overshoot, rise time and
settling time has been calculated. For full open valve condition,
the percent overshoot is 7.69%, rise time is 27 second and the
settling time is 210 second while for half open valve condition,
the percent overshoot is 4.17%, rise time is 6 second and the
settling time is 90 second. It shows that the value of
proportional controller, 𝐾𝑐 influence the rise time, percent
overshoot and settling time.
V. CONCLUSION
In this project, the characteristic of transient response of the
system can also be identified from the graph that is displayed
inside the front panel in MyOpenLab software. The best system
for this experiment is half open valve condition because the
settling time is faster than full open valve condition. This
project also shows the performance of MyOpenLab software.
This software is one of the alternative software that can be used
besides MATLAB and LabView. This software is easy to install
and simple to be used compared to MATLAB and LabView
because there is need a license to install them.
REFERENCES
[1] SCADA systems are the backbone of modern industry (2016). Retrieved November 17, 2016 from Inductive Automation Website, https://inductiveautomation.com/what-is-scada
[2] M. Sami Fadali and Antoni Visioli (2013). Digital Control Engineering Analysis and Design. Elsevier Inc. Waltham, USA.
[3] Norman S. Nise (2006). Control System Enginnering. United State, America. John Wiley & Sons, Inc.
[4] Kambiz Arab Tehrani and Augustin Mpanda (2012). Introduction to PID Controllers - Theory, Tuning and Application to Frontier Areas. Retrieved November 28, 2016 from Website, http://cdn.intechopen.com/pdfs/29826/intech-pid_control_theory.pdf
[5] Brian R Copeland (2008). The Design of PID Controllers using Ziegler Nichols Tuning. Retrieved March 6, 2017 from Website, http://educypedia.karadimov.info/library/Ziegler_Nichols.pdf
[6] Process Dynamics and Control. Retrieved March 8, 2017 from Website, http://my.chemeng.queensu.ca/courses/CHEE319/documents/CHEE319_notes_2012_lecture5.pdf
[7] Ulf Holmberg. PID control - Simple tuning methods. Retrived March, 8 2017 from website, http://www.hh.se/download/18.7502f6fd13ccb4fa8cb2f6/1360676928481/PID.pdf
[8] André MIGEON and Anne-Elisabeth LENEL. Modern Sensor Handbook. Retrieved November 28, 2016 from http://www.iste.co.uk/data/doc_zyxkztsuofok.pdf
[9] Firmware (2016). Retrieved December 5, 2016 from TechTerms Website, http://techterms.com/definition/firmware
Proceedings of 2017 Electrical Engineering Symposium (EES2017) - Vol. 1
153
Multi-Rate Controller for Networked Multi Agent
System (NMAS)
Nurul ‘Atikah binti Zakaria
Faculty of Electrical Engineering
Universiti Teknologi Malaysia
Johor Bahru, Malaysia.
Nurul Adilla Binti Mohd Subha
Department of Control and Mechatronics Engineering
Faculty of Electrical Engineering
Universiti Teknologi Malaysia
Johor Bahru, Malaysia.
Abstract—The paper discussed about methods used to design
the multi-rate controller for networked multi agent system
(NMAS). Consensus in NMAS is a system that consists of multiple
agents or a group of subsystem which exchange their information
through a shared network in order to achieve the consensus value.
In industrial practice, most systems are inherently multi-rate
systems because of the difference sampling rates employed at
every subsystem. In this work, the robust multi-rate PI controller
is introduced to minimize the effects of the network-induced delay.
The developed strategy is simulated with single-input single-
output (SISO) models for two dissimilar agents. The results show
significant improvement on the overshoot and settling time
compared to the single-rate controller.
Index Terms—Networked Control System (NCS), Multi-Agent
System, Network Delay, Proportional Integral(PI).
I. INTRODUCTION
Networked multi-agent system (NMAS) is a control system structure composed of several agents or a group of subsystem that are physically separated and exchange their information through a shared network [1]. The advantages of the NMAS structure such as higher flexibility and scalability have gained a wide interest from researchers worldwide.
The consensus is defined as agreement. Within the control perspective, consensus represents the cooperative behavior of the NMAS agents to achieve their common goal or consensus value through information exchange under share network communication. The goal can be represented by physical quantities such as angle, temperature, level, velocity, and mass.
In this study, the consensus value is defined as water level of the single tank. This value is also called as external reference input which is determined by the user. This input is connected directly to only one agent (leader) in the NMAS. Other agents need to communicate and exchange their information with the assigned leader in order to update its current state and converge to the consensus value. However, the presence of the network-induced delay inevitably introduces challenges for the agents to reach the consensus.
Proportional-integral (PI) controller is a common and widely used in the industry due to its simplicity and practicality. However, single-rate PI controller may not appropriate to be used for solving the consensus problem with network-induced delay. Therefore, the multi-rate PI controller is proposed to compensate the effects of the network delay and improve the consensus convergence performance.
Fig. 1. Research Methodology Flowchart.
II. LITERATURE REVIEW
A. PI Controller
Proportional Integral Derivative (PID) and Proportional Integral (PI) controllers are commonly used in industry and it is a control loop feedback mechanism in control system.
PI controller has its ability to make zero steady state error with a step change [3]. PI and PID controller also widely used in
Proceedings of 2017 Electrical Engineering Symposium (EES2017) - Vol. 1
154
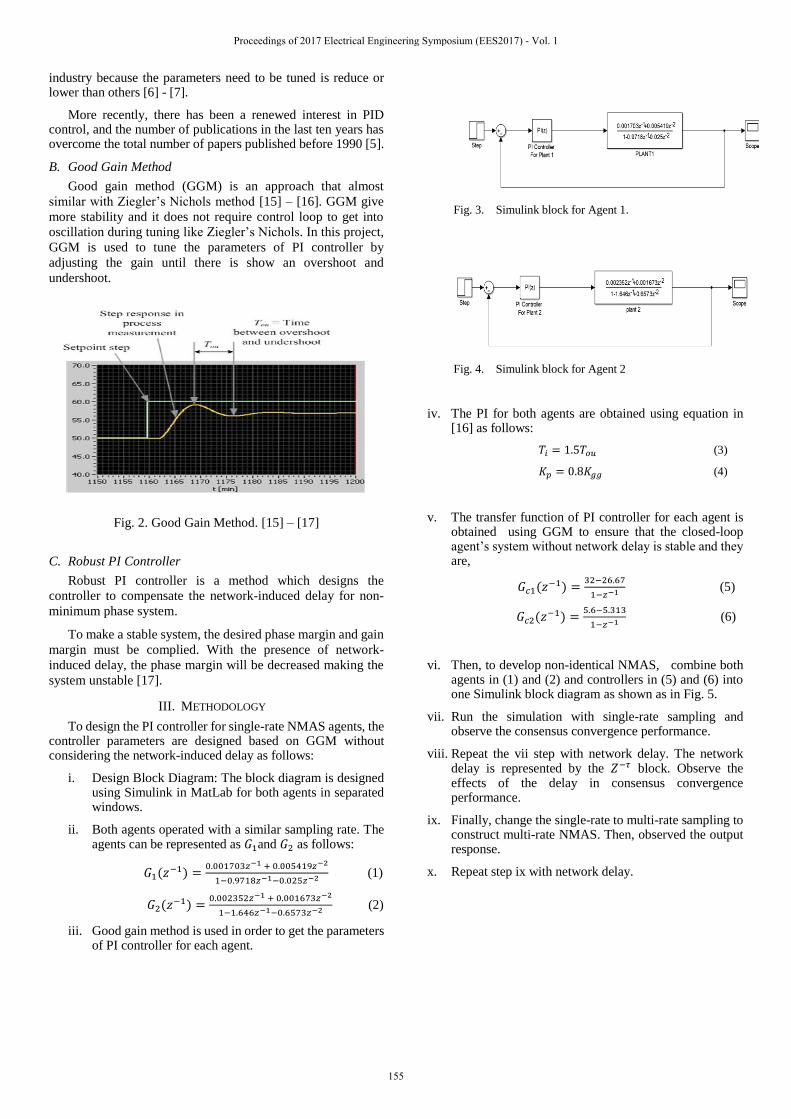
industry because the parameters need to be tuned is reduce or lower than others [6] - [7].
More recently, there has been a renewed interest in PID control, and the number of publications in the last ten years has overcome the total number of papers published before 1990 [5].
B. Good Gain Method
Good gain method (GGM) is an approach that almost
similar with Ziegler’s Nichols method [15] – [16]. GGM give
more stability and it does not require control loop to get into
oscillation during tuning like Ziegler’s Nichols. In this project,
GGM is used to tune the parameters of PI controller by
adjusting the gain until there is show an overshoot and
undershoot.
Fig. 2. Good Gain Method. [15] – [17]
C. Robust PI Controller
Robust PI controller is a method which designs the
controller to compensate the network-induced delay for non-
minimum phase system.
To make a stable system, the desired phase margin and gain
margin must be complied. With the presence of network-
induced delay, the phase margin will be decreased making the
system unstable [17].
III. METHODOLOGY
To design the PI controller for single-rate NMAS agents, the controller parameters are designed based on GGM without considering the network-induced delay as follows:
i. Design Block Diagram: The block diagram is designed using Simulink in MatLab for both agents in separated windows.
ii. Both agents operated with a similar sampling rate. The agents can be represented as 𝐺1and 𝐺2 as follows:
𝐺1(𝑧−1) =0.001703𝑧−1 + 0.005419𝑧−2
1−0.9718𝑧−1−0.025𝑧−2 (1)
𝐺2(𝑧−1) =0.002352𝑧−1 + 0.001673𝑧−2
1−1.646𝑧−1−0.6573𝑧−2 (2)
iii. Good gain method is used in order to get the parameters of PI controller for each agent.
Fig. 3. Simulink block for Agent 1.
Fig. 4. Simulink block for Agent 2
iv. The PI for both agents are obtained using equation in [16] as follows:
𝑇𝑖 = 1.5𝑇𝑜𝑢 (3)
𝐾𝑝 = 0.8𝐾𝑔𝑔 (4)
v. The transfer function of PI controller for each agent is obtained using GGM to ensure that the closed-loop agent’s system without network delay is stable and they are,
𝐺𝑐1(𝑧−1) =32−26.67
1−𝑧−1 (5)
𝐺𝑐2(𝑧−1) =5.6−5.313
1−𝑧−1 (6)
vi. Then, to develop non-identical NMAS, combine both agents in (1) and (2) and controllers in (5) and (6) into one Simulink block diagram as shown as in Fig. 5.
vii. Run the simulation with single-rate sampling and observe the consensus convergence performance.
viii. Repeat the vii step with network delay. The network delay is represented by the 𝑍−𝜏 block. Observe the effects of the delay in consensus convergence performance.
ix. Finally, change the single-rate to multi-rate sampling to construct multi-rate NMAS. Then, observed the output response.
x. Repeat step ix with network delay.
Proceedings of 2017 Electrical Engineering Symposium (EES2017) - Vol. 1
155

Fig. 5. Simulink block for NMAS without network delay.
Fig. 6. Simulatink block for NMAS with network delay.
It is expected that multi-rate NMAS with PI controller will degrade the performance obtain in single-rate NMAS with PI controller. Thus, improvement has to be made on the controller to enhance its ability in compensating the network-induced delay in multi-rate NMAS. Thus, multi-rate robust PI controller is proposed.
Robust PID is a method that takes consideration on the frequency domain analysis in control system, which are gain margin, phase margin and frequency [17].
For a high-order non-minimum phase system which contain the time delay element transfer function is as shown [17], so the transfer function for this multi rate NMAS is obtained,
𝐺1(𝑠) =𝐴0𝑠2+𝐴1𝑠+𝐴2
𝑠3+𝐴3𝑠2+𝐴4𝑠+𝐴5𝑒−𝑇𝑠 (7)
𝐺2(𝑠) =𝐴0𝑠+𝐴1
𝑠2+𝐴2𝑠+𝐴3𝑒−𝑇𝑠 (8)
where T is the time delay of the system [17]. From equation (7) and (8) the PI controller is obtained by using method mention in [17] but used only 𝐾𝑝 and 𝐾𝑖 . The proposed controller is
designed as,
𝐺𝑐(𝑠) = 𝐾𝑝 +𝐾𝑖
𝑠 (9)
𝐺𝑖(𝑠) = 𝐺𝑐(𝑠) . 𝐺𝑝(𝑠) =𝑁(𝑠)
𝐷(𝑠) (10)
𝐹(𝑗) = 𝐷(𝑗) + 𝐴−𝑗𝑁(𝑗) (11)
By solving (11) using (7)-(11), the parameter of robust PI controller can be obtained from frequency domain analysis by setting the desired output specification for the system.
Then, the output response is observed for multi-rate NMAS with network delay. The result is compared and discussed.
IV. RESULT
In this section, the consensus output performance for non-identical NMAS is presented. Results from both methods PI controller based GGM and robust PI controller are discussed.
A. Good Gain Method
Fig. 7. Single-rate NMAS without network delay.
Fig. 8. Single-rate NMAS with network delay
The result for multi-rate NMAS with PI controller based GGM
without and with delay can be illustrated in Fig. 7 and 8
respectively.
Fig. 9. NMAS Multi-rate without Delay Output.
The result for multi-rate NMAS with robust PI controller can be
illustrated in Fig. 6 and 7 respectively.
From Fig. 7 and Fig. 8 it can be concluded that the single-
rate NMAS is stable. However, with the presence of network
Proceedings of 2017 Electrical Engineering Symposium (EES2017) - Vol. 1
156

delay, both agents took a longer time to reach the consensus with
small ripples.
For Fig. 9, the multi-rate NMAS is unstable with PI
controller based GGM even though the network delay is not
considered. This show that the PI controller based GGM is not
suitable to be used with multi-rate NMAS.
Therefore, the new controller should be designed in order to
minimize the effect of the network delay and has an ability to
work with multi-rate NMAS. Thus, robust PI controller is
studied and investigated.
B. Robust PID
Using this method, the proposed controller should be able to minimize the effect of the network delay and suitable to be implemented with multi rate NMAS.
Fig. 10. Expected Response for Robust PI without delay.
Fig. 11. Expected Response for Robust PI with delay.
V. CONCLUSION
For the conclusion, the proposed robust PI controller has a better performance in solving the consensus problem for multi-rate NMAS. It is also able to minimize the effects of the constant network-induced delay.
ACKNOWLEDGMENT
Thanks to all people who is helping to finish this project and who is always help when there is problem in this project especially to my supervisor, Dr Nurul Adilla Mohd Subha
REFERENCES
[1] N. A. M. Subha and G. P. Liu, "Design and Practical Implementation of External Consensus Protocol for Networked Multiagent Systems with Communication Delays," in IEEE Transactions on Control Systems Technology, vol. 23, no. 2, pp. 619-631, March 2015.
[2] https://en.wikipedia.org/wiki/Multi-agent_system
[3] S. Singh. Dr. Pandey, Dipraj “Design of PI Controller to Minimize the Speed Error of DC Servo Motor.” International Journal of Science & Technology Research, vol. 1, 2012.
[4] J. C. Basilio and S. R. Matos, "Design of PI and PID controllers with transient performance specification," in IEEE Transactions on Education, vol. 45, no. 4, pp. 364-370, Nov 2002.
[5] J. G. Ziegler and N. B. Nichols, “Optimal settings for automatic controllers,”Trans. ASME, vol. 64, pp. 759–768, 1942.
[6] K. J. Astrom and T. Haglund, Automatic Tuning of PID Controllers, 1st ed. Research Triangle Park, NC: Instrum. Soc. Amer., 1988.
[7] K. J. Astrom and T. Haglund, PID Controllers: Theory, Design andTuning, 2nd ed. Research Triangle Park, NC: Instrum. Soc. Amer.,1995.
[8] Á. Cuenca, J. Salt, A. Sala and R. Piza, "A Delay-Dependent Dual-Rate PID Controller Over an Ethernet Network," in IEEE Transactions on Industrial Informatics, vol. 7, no. 1, pp. 18-29, Feb. 2011.
[9] H. B. J. Derbel, "Design of PID controllers for time-delay systems by the pole compensation technique," 2009 6th International Multi-Conference on Systems, Signals and Devices, Djerba, 2009, pp. 1-6
[10] A. Cuenca, J. Salt and V. Casanova, "Multi-rate PID Controller for a Networked Control System," 2007 IEEE International Symposium on Industrial Electronics, Vigo, 2007, pp. 2882-2886
[11] R. Olfati-Saber, J. A. Fax and R. M. Murray, "Consensus and Cooperation in Networked Multi-Agent Systems," in Proceedings of the IEEE, vol. 95, no. 1, pp. 215-233, Jan. 2007.
[12] L. H. Dreinhoefer, "Controller tuning for a slow nonlinear process," in IEEE Control Systems Magazine, vol. 8, no. 2, pp. 56-60, April 1988.
[13] A. Mirzal, "Delay compensation using PID controller and GA," 2013 IEEE International Conference on Control System, Computing and Engineering, Mindeb, 2013, pp. 300-304.
[14] J. Tornero, M. Tomizuka, C. Camina, E. Ballester and R. Piza, "Design of dual-rate PID controllers," Control Applications, 2001. (CCA '01). Proceedings of the 2001 IEEE International Conference on, Mexico City, 2001, pp. 859-865.
[15] F. Haugen, “The Good Gain Method for Simple Experimental Tuning of PI Controllers,” Norwegian Society of Automatic Control, 2012. Modeling, Identification and Control, Vol. 33, No. 4, 2012, pp. 141-152.
[16] F. Haugen, “The Good Gain Method for PI(D) Controller Tuning.” Tech Teach,2010 retrieved from http://techteach.no
[17] D.Pansari, B.Timande, D.Chandrakar, “A Design of Robust PID Controller for Non-Minnimum Network Control System.” in International Journal of Advance in Engineering & Technology, Vol. 5, Issue 1, pp. 486-493, Nov 2012.
Proceedings of 2017 Electrical Engineering Symposium (EES2017) - Vol. 1
157
Agarwood Grading Estimation using Artificial Neural
Network Technique and Carving Automation
Muhammad Syafiq Afif Bin Ishak
Faculty of Electrical Engineering
Universiti Teknologi Malaysia
Johor Bahru, Malaysia.
Mohd Amri Bin Md Yunus
Department of Control and Mechatronic
Faculty of Electrical Engineering
Universiti Teknologi Malaysia
Johor Bahru, Malaysia.
Abstract— Agarwood is a fragrant dark resinous wood formed
when Aquilaria tress infected with a certain type of mould and
appears like wood defects. It a most valuable non-timber product
has been traded in international markets because of its distinctive
aroma, and can be processed into incense and perfumes.
Agarwood grade is determined by wood several characteristics,
such as black color intensity, smell, texture and weight through
visual inspection. However, this could lead to several problems
such as false grading results. Traditionally, the carving process of
separation the uninfected Aquilaria wood that lacks of the dark
resinous accomplished by using simple tools like knife and chisel.
Hence, an expert worker is required to complete the task. In this
paper, the Artificial Neural Network (ANN) technique is used to
classify the Agarwood based on the features extraction from
Gabor Filter and percentage of black color estimation. At first, the
images of seven groups of wood defects or knots are identified: dry,
decayed, edge, encased, horn, leaf, and sound defect with total
sample of 410 knots. Then, these images of knots are matched into
three grade groups of Agarwood. Next, the experimental results
show the Agarwood can be classified into three grades groups
based on knot and black intensity. A set of selected images of knots
were used as trace pattern and carved on pieces of wood blocks by
using a Computer Numerical Control (CNC) machine where the
total time taken for each carving process was calculated. For each
image, two Gabor Filter features and percentage of black color
were used as ANN inputs. In conclusion the total accuracy of the
experiments is 98% and the total time of carving is increased with
the increased of grade group number.
Keywords— Articial Neural Network (ANN); Agarwood grading
system; Computer Numerical Control (CNC) machine
I. INTRODUCTION
In Malaysia, Agarwood is known as Depu, Gaharu or Cendana [1]. Otherwise, it also known as Agarwood or Eagleswood (British), Agar (India), Aloeswood (Bible), Adlerholz (German), Ahalim (Hebrew), Bais d’angle (Perancis), Ch’en Hsiang (China), Chan Krasna (Kemboja), Ghara (New Guinea), Ingkaras or Kaju Alim or Tanduk (Indonesia), Jin-ko (Jepun), Mai Kritsana (Thailand), Mai Ketsana (Laos), Ogoru (Assamese), Oud (Arab), Poa D’aquila (Portugis), Tengala (Brunei), and Tram Hurong (Vietnam) [1-5]. Agarwood is a fragrant wood that is usually derived from the infected timber of the genus Aquilaria Thymelaeceae or locally known as Karas [4, 6] and often occurs as dark coloured patches or streaks in the tree [5]. Karas or Aquilaria is the tree that will produce
Agarwood. Meanwhile, Agarwood refers to products or goods resulting from physical injury and mechanical either naturally or man-made which is bacteria injection or inculated [1]. There are 28 species of Aquilaria found in the world [7]. Mainly, in Malaysia only 5 species of Aquilaria can be found which is Aquilaria Beccariana, Aquilaria Hirta, Aquilaria Malaccensis, Aquilaria Microcarpa, and Aquilaria Rostrata [1, 7]. But, there are also introduced new species in Malaysia which are Aquilaria Sinensis, Aquilaria Crassna and Aquilaria Crassna-Hybri [1]. Agarwood is an important non-timber forest product. Agriculturalist sees the plantation of Agarwood as a green ‘gold mine’ of the future, if there is a breakthrough in processing technology.
Agarwood is consumed for three main purposes which are medicine, perfume, and incense [3-5, 8]. For thousand years, Agarwood has been used for medicinal purpose and continues to be used in Ayurvedic, Tibetan, and traditional East Asian medicine [3]. It is used for treating pleurisy, asthma, rheumatism and jaundice. It is also known to be beneficial to the liver, lungs and stomach. Agarwood is used as incense in Buddhist, Muslims and Hindus religious ceremonies [8]. Both Agarwood smoke and oil are normally used as perfume in the Middle East [3]. Agarwood has become the most valuable non-timber forest product traded in the international market [8]. These species have been listed under Appendix II for Convention on International Trade in Endangered Species of Wild Fauna and Flora (CITES). CITIES aims to ensure that the trade is well-regulated, and that it proceeds under a system of permits based on conditions of legality and sustainability [6].
Agarwood are produced in three forms, namely woodchips, sawdust and oil. The higher-grade Agarwood are sold in the marketing chain with minimal processing. Meanwhile, the lower grade Agarwood are processed into oil through distillation. However, the manual carving process of getting a valuable core of Agarwood required experienced. The uninfected part of the wood is removed to ensure that the wood is categorized as a better grade and hence higher prices [8]. This process only required simple tools such as knife and chisel.
This paper discuss the development of a system for grading the Agarwoood using Artificial Neural Network (ANN) technique and the implementation of carving automation by Computer Numerical Control (CNC) machine for valuable core acquisition of Agarwood.
Proceedings of 2017 Electrical Engineering Symposium (EES2017) - Vol. 1
158

The rest of this paper organized as follow. In section II, the literature review on basic principle of Artificial Neural Network and Agarwood grading system are discussed. In section III, the methodology of this research is explained. Section IV discusses the result obtained from the experiments. In section V, the conclusion is expounded.
II. LITERATURE REVIEW
A. Basic Principle of Artificial Neural Network
The idea of neural network development was established based on biological neuron. The human brain is comprised of a network of neurons that are coupled with receptors (dendrites) and effectors (axons). A neural network is a highly-interconnected processing elements of large number of sample [9, 10]. A biological neuron is shown in Fig. 1. By analogy from [11], the output processing element (axon) branches out and become the input to many other processing elements. These signals pass through connection weights (synaptic junction) that correspond to the synaptic strength of the neural connection. The input signal to a processing element are conditioned by the connection weights prior to being summed by the processing element.
Fig. 2 illustrates the artificial neural that similar function as compared to biological neuron. The processing elements joined together to form an appropriate network with adjustable weighting function for each input. This processing element is organized in a sequence of layer. Each layer is connected to each other. Commonly, there are three or more layers. These layers are an input layer, an output layer and hidden layer. An ANN can be used to solve classification, clustering and regression of related problems [9, 11].
Fig. 1. The depiction of a biological neuron.
Fig. 2. A generic ANN structure.
B. Agarwood Grading System
In common Agarwood is graded in grade A, grade B, grade C and Grade D. The grading system varies in different countries. The process of grading is depending on the intensity of black
color, smell, texture and weight of Agarwood. These are the characteristics used by a human expert to grade any Agarwood. Moreover, there is no international and unified standard for Agarwood until now.
Forest Department of Peninsular Malaysia (FDPM) has introduced their grading system which is based on the color of Agarwood resin and their potential end use [7]. This grading system is represented in Table I. Another grading system was introduced by Mazlan and Dahlan (2010) [12]. This system is divided into nine grades. In grade A and B, it has a subgrade which is break down into A1 to A10 and B1 to B10. This grading system is summarized in Table II.
TABLE I. AGARWOOD GRADING SYSTEM BY FDPM
Grade Resin color Potential used
Super A All color with
attractive shape Decoration or esthetical value
A Black or shiny black Aromatherapy or burnt for
fragrance
B Brown or dark brown Aromatherapy or burnt for
fragrance
C Whitish or yellowish Essential oil.
TABLE II. AGARWOOD GRADE FOUND IN MALAYSIA MARKET
Grade
Resin
coverage on
the surface
Resin color Wood shape
Super king Entire Total black
and shiny
Solid wood chunks
(500g to 3kg)
Triple king Entire Total black
and shiny
Solid wood chunks
(200g to 500g)
Double
super 90%
Less black
and shiny
Solid wood chunks
(50g to 200g)
Super 80% Black and
greyish
Solid wood chunks of
mixed sizes
A (A1-A10) Entire Black turning
into grey
Solid wood chunks of
mixed sizes
AB Entire Black turning
into brown
Solid wood chunks of
mixed sizes
B (B1-B10) Entire Black turning
into brown
Solid wood chunks of
mixed sizes
C 50% Grey Varies in shapes and
sizes
D Entire Grey and
whitish
Varies in shapes and
sizes
III. RESEARCH METHODOLOGY
A. Project Overview
This study covers both simulation and hardware works. Where the simulation parts are MATLAB software for ANN and thresholding technique, while Inkscape software for getting gcode. Then, hardware part is CNC machine for automation carving process. The general block diagram for this project is shows in Fig. 3.
Proceedings of 2017 Electrical Engineering Symposium (EES2017) - Vol. 1
159

Fig. 3. The project flow of this study.
After the process of ANN modelling using the standard
picture of wood is taken before carving. Then, the picture is
converted into grey color ad 32x32 pixel size format. The image
is also transformed by Gabor Filter for two features of mean and
standard deviation. The grade estimation can be obtained from
the ANN classification model which was estimated based on
standard images of wood defects (knots), and matched it with
appropriate Agarwood grade group member. After the grade is
estimated, the image is segmented through thresholding
technique into wanted and unwanted parts in the image
segmentation process. Then, Inskscape software is used to get
the gcode for CNC machine. Lastly the process of carving
utilized SpectraLight Machining Center. From the thresholded
image, the CNC is automatically operated to remove unwanted
parts which marked as blacked part of the final image.
B. Sample Preparation for ANN
The sample of wood defect is taken form the University of Oulu Wood and Knot Database [13]. The defect on each sample is perceived as knots of wood. This knot consists of seven group which are decayed knot, dry knot, edge knot, encased knot, horn knot, leaf knot and sound knot. Fig. 4 shows the difference shapes of knots used in this project. These knots will categorize into three grade which are grade 1, grade 2 and grade 3. Table III shows the grading system for this project. This categorization is based on the shape and intensity of black color of the knot. To match the defects level with Agarwood group grade: grade 1 is the good grade, grade 2 the is moderate grade and grade is the lower grade.
TABLE III. SAMPLE DATA
Grade Type of knot No of sample
1 Encased 49
2 Horn and edge 90
3 Dry, decayed, leaf and sound 271
(a) (b) (c) (d)
(e) (f) (g)
Fig. 4. (a) dry knot; (b) decayed knot; (c) sound knot; (d) leaf knot; (e) encased
knot; (f) horn knot; (g) edge knot
C. Features Extraction
The features used are texture features extracted from knot image using a Gabor filter bank and also the percentage of the black color of knot. The Gabor filters are 2D selective band pass filter which is frequency and orientation sensitive respectively [14]. Basically, using this filter, the filtered image is dilated, translated and rotated with regard to each other [14]. The mathematical definition is
𝐺𝑓,𝜃(𝑥, 𝑦) = 𝑒𝑥𝑝 [√−1(𝑥𝑓𝑐𝑜𝑠𝜃 + 𝑦𝑓𝑐𝑜𝑠𝜃) −𝑓2(𝑥2+𝑦2)
2𝜎2] (1)
Where x and y are the pixel coordinate of the image. f is the central frequency of the band pass. θ is the orientation of the filter and σ is the bandwidth. θ is varying to look for texture oriented in a particular direction. While, varying σ to change the support of the basis or the size of the image region being analyzed.
Basically, each image is converted to grayscale and normalized to size 32 x 32 pixels. A set of Gabor filter is utilized with six frequencies (0°, 30°, 60°, 90°, 120°, 150°) and six orientations (2.828, 5.657, 11.314, 22.627, 45.255, 90.51). The image is converted with these set filter bank. The result is 36 filtered images. This will give a difference information for each image corresponding to the orientation and frequency. Then, the output image is linked together by row to build a features vector of dimension 1024 x 36.
Meanwhile, the percentage black color of image is taken from this mathematical expression:
%𝐵𝑙𝑎𝑐𝑘 = (1−𝑎
𝑏) ∗ 100 (2)
Where a is the number of non-zero matrix and b is the number of array elements. Therefore, mean, standard deviation and percentage black color of each image are extracted and fed to the ANN classification.
Standard
image of
wood defect
(knots)
Classification
Image segmentation
Carving using CNC
Percentage
of black
color ANN
modelling
Image
Camera
Gabor
Filter
Feature
s
Picture C
Finalized
Simulation C
Hardware C
Proceedings of 2017 Electrical Engineering Symposium (EES2017) - Vol. 1
160
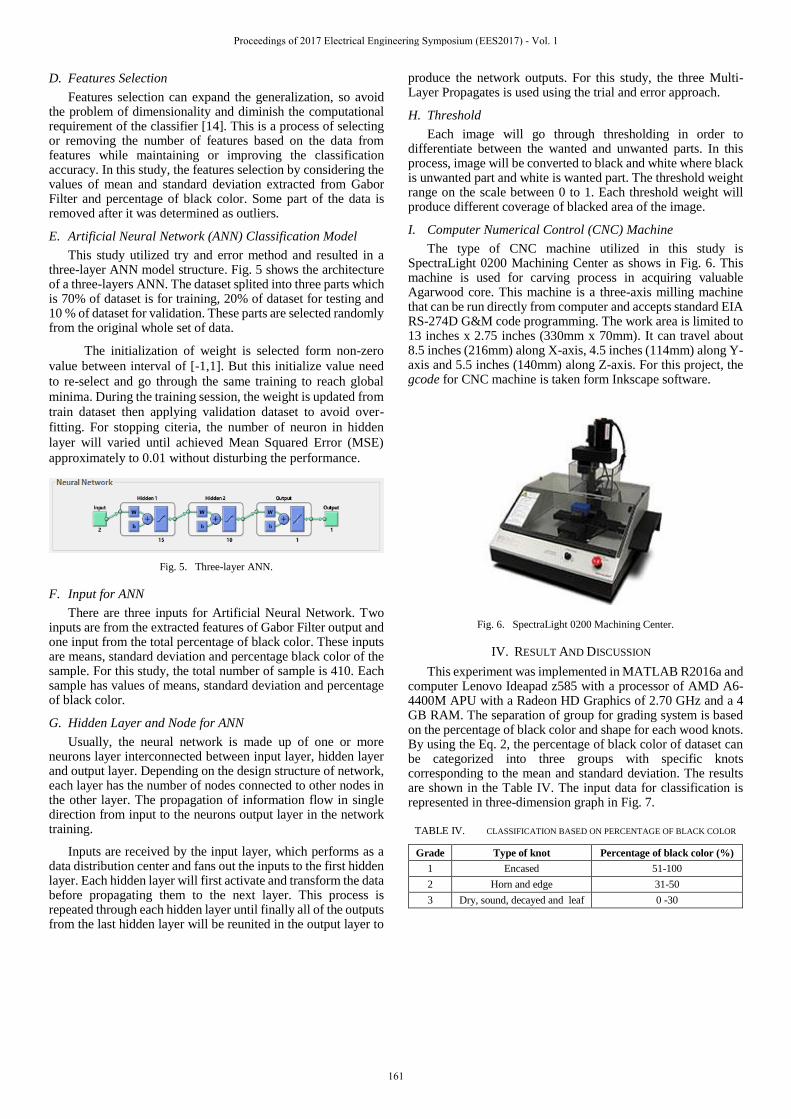
D. Features Selection
Features selection can expand the generalization, so avoid the problem of dimensionality and diminish the computational requirement of the classifier [14]. This is a process of selecting or removing the number of features based on the data from features while maintaining or improving the classification accuracy. In this study, the features selection by considering the values of mean and standard deviation extracted from Gabor Filter and percentage of black color. Some part of the data is removed after it was determined as outliers.
E. Artificial Neural Network (ANN) Classification Model
This study utilized try and error method and resulted in a three-layer ANN model structure. Fig. 5 shows the architecture of a three-layers ANN. The dataset splited into three parts which is 70% of dataset is for training, 20% of dataset for testing and 10 % of dataset for validation. These parts are selected randomly from the original whole set of data.
The initialization of weight is selected form non-zero
value between interval of [-1,1]. But this initialize value need
to re-select and go through the same training to reach global
minima. During the training session, the weight is updated from
train dataset then applying validation dataset to avoid over-
fitting. For stopping citeria, the number of neuron in hidden
layer will varied until achieved Mean Squared Error (MSE)
approximately to 0.01 without disturbing the performance.
Fig. 5. Three-layer ANN.
F. Input for ANN
There are three inputs for Artificial Neural Network. Two inputs are from the extracted features of Gabor Filter output and one input from the total percentage of black color. These inputs are means, standard deviation and percentage black color of the sample. For this study, the total number of sample is 410. Each sample has values of means, standard deviation and percentage of black color.
G. Hidden Layer and Node for ANN
Usually, the neural network is made up of one or more neurons layer interconnected between input layer, hidden layer and output layer. Depending on the design structure of network, each layer has the number of nodes connected to other nodes in the other layer. The propagation of information flow in single direction from input to the neurons output layer in the network training.
Inputs are received by the input layer, which performs as a data distribution center and fans out the inputs to the first hidden layer. Each hidden layer will first activate and transform the data before propagating them to the next layer. This process is repeated through each hidden layer until finally all of the outputs from the last hidden layer will be reunited in the output layer to
produce the network outputs. For this study, the three Multi-Layer Propagates is used using the trial and error approach.
H. Threshold
Each image will go through thresholding in order to differentiate between the wanted and unwanted parts. In this process, image will be converted to black and white where black is unwanted part and white is wanted part. The threshold weight range on the scale between 0 to 1. Each threshold weight will produce different coverage of blacked area of the image.
I. Computer Numerical Control (CNC) Machine
The type of CNC machine utilized in this study is SpectraLight 0200 Machining Center as shows in Fig. 6. This machine is used for carving process in acquiring valuable Agarwood core. This machine is a three-axis milling machine that can be run directly from computer and accepts standard EIA RS-274D G&M code programming. The work area is limited to 13 inches x 2.75 inches (330mm x 70mm). It can travel about 8.5 inches (216mm) along X-axis, 4.5 inches (114mm) along Y-axis and 5.5 inches (140mm) along Z-axis. For this project, the gcode for CNC machine is taken form Inkscape software.
Fig. 6. SpectraLight 0200 Machining Center.
IV. RESULT AND DISCUSSION
This experiment was implemented in MATLAB R2016a and computer Lenovo Ideapad z585 with a processor of AMD A6-4400M APU with a Radeon HD Graphics of 2.70 GHz and a 4 GB RAM. The separation of group for grading system is based on the percentage of black color and shape for each wood knots. By using the Eq. 2, the percentage of black color of dataset can be categorized into three groups with specific knots corresponding to the mean and standard deviation. The results are shown in the Table IV. The input data for classification is represented in three-dimension graph in Fig. 7.
TABLE IV. CLASSIFICATION BASED ON PERCENTAGE OF BLACK COLOR
Grade Type of knot Percentage of black color (%)
1 Encased 51-100
2 Horn and edge 31-50
3 Dry, sound, decayed and leaf 0 -30
Proceedings of 2017 Electrical Engineering Symposium (EES2017) - Vol. 1
161
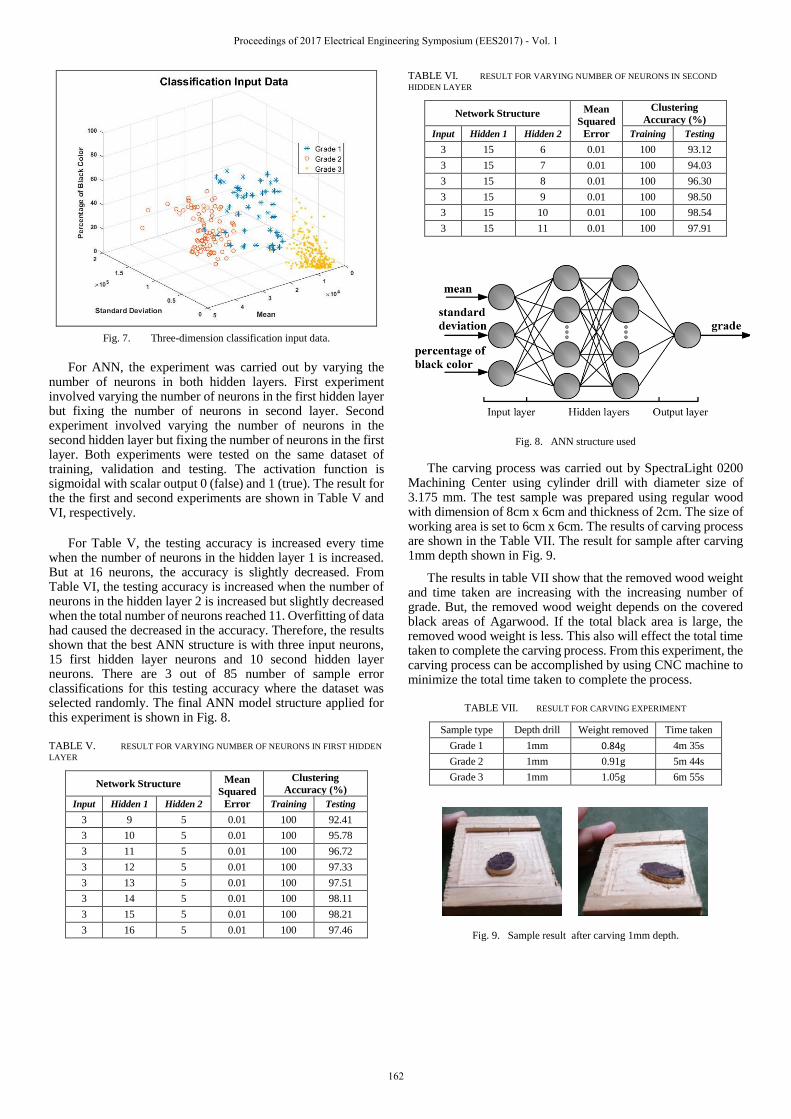
Fig. 7. Three-dimension classification input data.
For ANN, the experiment was carried out by varying the number of neurons in both hidden layers. First experiment involved varying the number of neurons in the first hidden layer but fixing the number of neurons in second layer. Second experiment involved varying the number of neurons in the second hidden layer but fixing the number of neurons in the first layer. Both experiments were tested on the same dataset of training, validation and testing. The activation function is sigmoidal with scalar output 0 (false) and 1 (true). The result for the the first and second experiments are shown in Table V and VI, respectively.
For Table V, the testing accuracy is increased every time when the number of neurons in the hidden layer 1 is increased. But at 16 neurons, the accuracy is slightly decreased. From Table VI, the testing accuracy is increased when the number of neurons in the hidden layer 2 is increased but slightly decreased when the total number of neurons reached 11. Overfitting of data had caused the decreased in the accuracy. Therefore, the results shown that the best ANN structure is with three input neurons, 15 first hidden layer neurons and 10 second hidden layer neurons. There are 3 out of 85 number of sample error classifications for this testing accuracy where the dataset was selected randomly. The final ANN model structure applied for this experiment is shown in Fig. 8.
TABLE V. RESULT FOR VARYING NUMBER OF NEURONS IN FIRST HIDDEN
LAYER
Network Structure Mean
Squared
Error
Clustering
Accuracy (%)
Input Hidden 1 Hidden 2 Training Testing
3 9 5 0.01 100 92.41
3 10 5 0.01 100 95.78
3 11 5 0.01 100 96.72
3 12 5 0.01 100 97.33
3 13 5 0.01 100 97.51
3 14 5 0.01 100 98.11
3 15 5 0.01 100 98.21
3 16 5 0.01 100 97.46
TABLE VI. RESULT FOR VARYING NUMBER OF NEURONS IN SECOND
HIDDEN LAYER
Network Structure Mean
Squared
Error
Clustering
Accuracy (%)
Input Hidden 1 Hidden 2 Training Testing
3 15 6 0.01 100 93.12
3 15 7 0.01 100 94.03
3 15 8 0.01 100 96.30
3 15 9 0.01 100 98.50
3 15 10 0.01 100 98.54
3 15 11 0.01 100 97.91
Fig. 8. ANN structure used
The carving process was carried out by SpectraLight 0200 Machining Center using cylinder drill with diameter size of 3.175 mm. The test sample was prepared using regular wood with dimension of 8cm x 6cm and thickness of 2cm. The size of working area is set to 6cm x 6cm. The results of carving process are shown in the Table VII. The result for sample after carving 1mm depth shown in Fig. 9.
The results in table VII show that the removed wood weight and time taken are increasing with the increasing number of grade. But, the removed wood weight depends on the covered black areas of Agarwood. If the total black area is large, the removed wood weight is less. This also will effect the total time taken to complete the carving process. From this experiment, the carving process can be accomplished by using CNC machine to minimize the total time taken to complete the process.
TABLE VII. RESULT FOR CARVING EXPERIMENT
Sample type Depth drill Weight removed Time taken
Grade 1 1mm 0.84g 4m 35s
Grade 2 1mm 0.91g 5m 44s
Grade 3 1mm 1.05g 6m 55s
Fig. 9. Sample result after carving 1mm depth.
Proceedings of 2017 Electrical Engineering Symposium (EES2017) - Vol. 1
162

V. CONCLUSION
In this paper, a three-layer Artificial Neural Network is utilized, built from 3 number of input neurons, 15 number of first hidden layer neurons, 10 number of second hidden layer neurons and 1 output. The inputs were extracted from Gabor filter (mean and standard deviation) and percentage of black color. The data was classified into three grades based on percentage of black color and wood knots. The results of ANN are satisfied with an accuracy 98.54%. The carving process was accomplished by using a CNC machine. The removed wood weight is proportional to the blacked area. The time taken to complete also depends on the covered black area of and complexity of the shape.
REFERENCES
[1] I. Muhammad, "Cabaran dan Halatuju Perladangan Karas di
Malaysia," Bengkel Gaharu Sesi I-2014, Fakulti Perhutanan,
Universiti Putra Malaysia, 43400 UPM Serdang, Selangor, Malaysia 10 Mac 2014.
[2] A. Barden, N. A. Anak, T. Muliken, and M. Song, "Heart of the
Matter: Gaharu and Trade and CITES Implementation for Aquilaria malaccensis," TRAFFIC, 2001.
[3] A. Abdullah, N. K. N. Ismail, T. A. A. Kadir, J. M. Zain, N. A.
Jusoh, and N. M. Ali, "Agar Wood Grade Determination System Using Image Processing," 2007.
[4] L. S. L. Chua, "Agarwood (Aquilaria malaccensis) in Malaysia,"
Forest Research Institute Malaysia, 2008.
[5] Y. Nik Yasmin, "Comparison of chemical profiles of selected
gaharu oils from Peninsular Malaysia," Malaysian Journal of Analytical Sciences, vol. 12, pp. 338-340, 2008.
[6] L. T. Wyn and N. A. Anak, "WOOD FOR THE TREES: A
REVIEW OF THE AGARWOOD (GAHARU) TRADE IN," 2010. [7] Manual Penggredan Gaharu Jabatan Perhutanan Semenanjung
Malaysia. Malaysia: Alamedia Sdn. Bhd., 2015.
[8] H. F. Lim, M. P. Mamat, and Y. S. Chang, "Production, use and trade of gaharu in Peninsular Malaysia," 2007.
[9] R. E. Uhrig, "Introduction to artificial neural networks," in
Industrial Electronics, Control, and Instrumentation, 1995., Proceedings of the 1995 IEEE IECON 21st International
Conference on, 1995, pp. 33-37 vol.1.
[10] D. Qi, P. Zhang, and L. Yu, "Study on wood defect detection based on artificial neural network," in 2008 IEEE Conference on
Cybernetics and Intelligent Systems, 2008, pp. 951-956.
[11] A. Dongare, R. Kharde, and A. D. Kachare, "Introduction to artificial neural network," International Journal of Engineering and
Innovative Technology (IJEIT), vol. 2, pp. 189-193, 2012.
[12] M. Mazlan and T. Dahlan, Pengredan dan Pemprosesan Gaharu. Selangor: Seminar Kebangsaan dan Pameran Gaharu, 2010.
[13] (September). University of Oulu Wood and Knot Database.
Available: http://www.ee.oulu.fi/research/ imag/knots/KNOTS/ [14] A. Marcano-Cedeño, J. Quintanilla-Domínguez, and D. Andina,
"Wood defects classification using Artificial Metaplasticity neural
network," in 2009 35th Annual Conference of IEEE Industrial Electronics, 2009, pp. 3422-3427.
Proceedings of 2017 Electrical Engineering Symposium (EES2017) - Vol. 1
163

Energy Scavenging from Waste Heat of Home
Refrigerator
Nur Afni Izyani Zainuddin
Faculty of Electrical Engineering
Universiti Teknologi Malaysia
Johor Bahru, Malaysia.
Herman Wahid
Department of Control and Mechatronic Engineering
Faculty of Electrical Engineering
Universiti Teknologi Malaysia
Johor Bahru, Malaysia.
Abstract—In recent years, the environmental issues such as
emissions and global warming are due to the limiting factor of the
energy resources .Extensive researches on new technologies of
power generation are currently ongoing. Thermoelectric power
generators (TEG) have emerged as another promising green
technology due to their diverse advantages. A TEG is usually
having two junctions incorporating different metals or alloys. If
heat is introduced to a circuit at the junction of two different
conductors, a current will be generated. In this project, a
prototype of TEG system will be designed to prove that it can
generate electricity using waste heat. The goal of this project is to
propose a solution for harvesting waste heat from refrigerator’s
compressor unit. Thermoelectric cooling module (TEC), a sensor
module based on the principle of Seebeck effect is used to achieve
the project aim. Heat sinks and aluminum are attached to TEC
module to maximize the temperature difference. The output
voltages may need to be amplified and regulated with suitable
conditioning circuits. These output voltages are expected could be
used for charging the low-powered portable gadgets such as
mobile phone and tablet.
Keywords—Thermoelectric generator; Thermoelectric cooler;
Seebeck effect
I. INTRODUCTION
In our daily life, we will definitely be using electricity no matter in any aspect of usage. Electricity has benefited not only to humans but also to the development of a country. In many countries, electricity is mainly generated by burning fossil fuels such as natural gas, oil and coal. Now, after more than 200 years of using it, this type of energy sources has dwindled. One of the best solutions to reduce the use of fossil fuels in generating electricity is by using thermoelectric generator. Besides that, waste from the combustion process can be recycled through the thermoelectric generator. The thermoelectric power generation is based on the Seebeck Effect. Statistic shows that only 34% of the energy becomes useful energy and the rest 66% are contribute to energy loss or waste heat. In order to reduce waste heat, thermoelectric generator (TEG) is one of the alternative solutions to produce energy from waste heat. For this project, heat energy will be harvested from the compressor of refrigerator and the voltage generated from waste heat could be used to charge low-power portable gadgets (e.g.: mobile phone).
The operation of home appliances produce waste heat and it is a loss that can lead to greenhouse effect. Generation of energy
from waste heat by using thermoelectric effect is a promising solution. However, suitable power conditioning circuit needs to be designed as thermoelectric generator will produce fluctuated output voltage with very low output power/current for limited temperature deviation.
The specific objectives of this project are to study the available energy harvesting technologies which focusing on waste heat based sources, through literature studies, to study the generation of regulated voltages using TEG module on refrigerator compressor and to design energy storage system, using suitable circuitries design and to analyze the designed model for its performance, reliability, energy efficiency and capability of being used practically as portable charger.
This paper is organized as follows: in Section I, an
introduction along with the problem statement and objectives
was addressed. Section II describes the literature review related
to the project. In addition, Section III explained the project
methodology to develop the proposed system. In the last two
sections, results and analysis were tabulated and discussed
followed by the conclusion section.
II. LITERATURE REVIEW
Literature review was carried out right through the whole project to increase the knowledge and skills needed to complete this project. The main sources for this project are previous related projects, research thesis, journals, and articles which are mostly obtained from online database provided by UTM and UTM library.
A. Electrical Energy Scavenging From Waste Heat
Whenever a work is done, small to large amounts of thermal
energy is intemperate into air, which if converted back to electric
energy may serve useful purpose [3]. Harvesting energy from
previously unemployed ambient sources can play important role
in saving energy and reducing the dependency to primary power
sources (AC power or battery) of an electronic system [4].
B. Energy Harvesting Using Thermoelectric Modules
The design of a thermoelectric generator (TEG) unit (see Fig. 1) as a solid state device using Seebeck effect of converting heat energy into electricity is dependent on the correct thermal gradient across the thermoelectric modules for the optimal operation of these modules [5]. Thermoelectric power
Proceedings of 2017 Electrical Engineering Symposium (EES2017) - Vol. 1
164
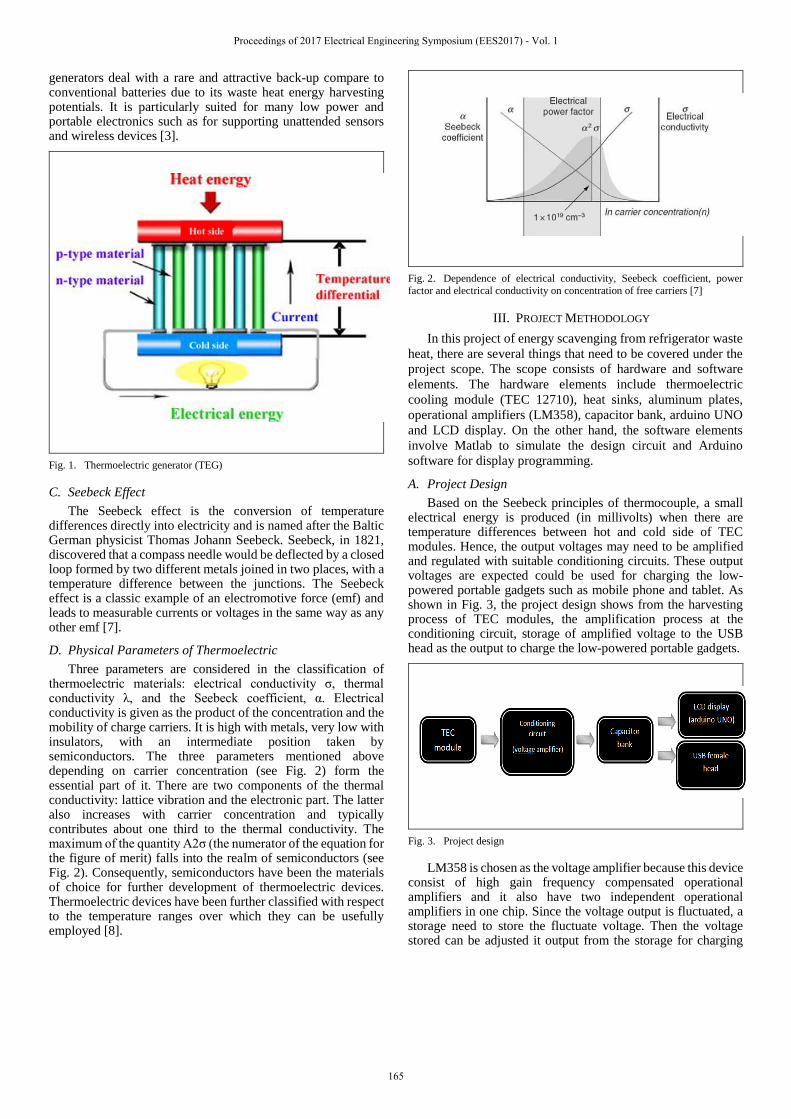
generators deal with a rare and attractive back-up compare to conventional batteries due to its waste heat energy harvesting potentials. It is particularly suited for many low power and portable electronics such as for supporting unattended sensors and wireless devices [3].
Fig. 1. Thermoelectric generator (TEG)
C. Seebeck Effect
The Seebeck effect is the conversion of temperature differences directly into electricity and is named after the Baltic German physicist Thomas Johann Seebeck. Seebeck, in 1821, discovered that a compass needle would be deflected by a closed loop formed by two different metals joined in two places, with a temperature difference between the junctions. The Seebeck effect is a classic example of an electromotive force (emf) and leads to measurable currents or voltages in the same way as any other emf [7].
D. Physical Parameters of Thermoelectric
Three parameters are considered in the classification of thermoelectric materials: electrical conductivity σ, thermal conductivity λ, and the Seebeck coefficient, α. Electrical conductivity is given as the product of the concentration and the mobility of charge carriers. It is high with metals, very low with insulators, with an intermediate position taken by semiconductors. The three parameters mentioned above depending on carrier concentration (see Fig. 2) form the essential part of it. There are two components of the thermal conductivity: lattice vibration and the electronic part. The latter also increases with carrier concentration and typically contributes about one third to the thermal conductivity. The maximum of the quantity Α2σ (the numerator of the equation for the figure of merit) falls into the realm of semiconductors (see Fig. 2). Consequently, semiconductors have been the materials of choice for further development of thermoelectric devices. Thermoelectric devices have been further classified with respect to the temperature ranges over which they can be usefully employed [8].
Fig. 2. Dependence of electrical conductivity, Seebeck coefficient, power
factor and electrical conductivity on concentration of free carriers [7]
III. PROJECT METHODOLOGY
In this project of energy scavenging from refrigerator waste
heat, there are several things that need to be covered under the
project scope. The scope consists of hardware and software
elements. The hardware elements include thermoelectric
cooling module (TEC 12710), heat sinks, aluminum plates,
operational amplifiers (LM358), capacitor bank, arduino UNO
and LCD display. On the other hand, the software elements
involve Matlab to simulate the design circuit and Arduino
software for display programming.
A. Project Design
Based on the Seebeck principles of thermocouple, a small electrical energy is produced (in millivolts) when there are temperature differences between hot and cold side of TEC modules. Hence, the output voltages may need to be amplified and regulated with suitable conditioning circuits. These output voltages are expected could be used for charging the low-powered portable gadgets such as mobile phone and tablet. As shown in Fig. 3, the project design shows from the harvesting process of TEC modules, the amplification process at the conditioning circuit, storage of amplified voltage to the USB head as the output to charge the low-powered portable gadgets.
Fig. 3. Project design
LM358 is chosen as the voltage amplifier because this device consist of high gain frequency compensated operational amplifiers and it also have two independent operational amplifiers in one chip. Since the voltage output is fluctuated, a storage need to store the fluctuate voltage. Then the voltage stored can be adjusted it output from the storage for charging
Proceedings of 2017 Electrical Engineering Symposium (EES2017) - Vol. 1
165
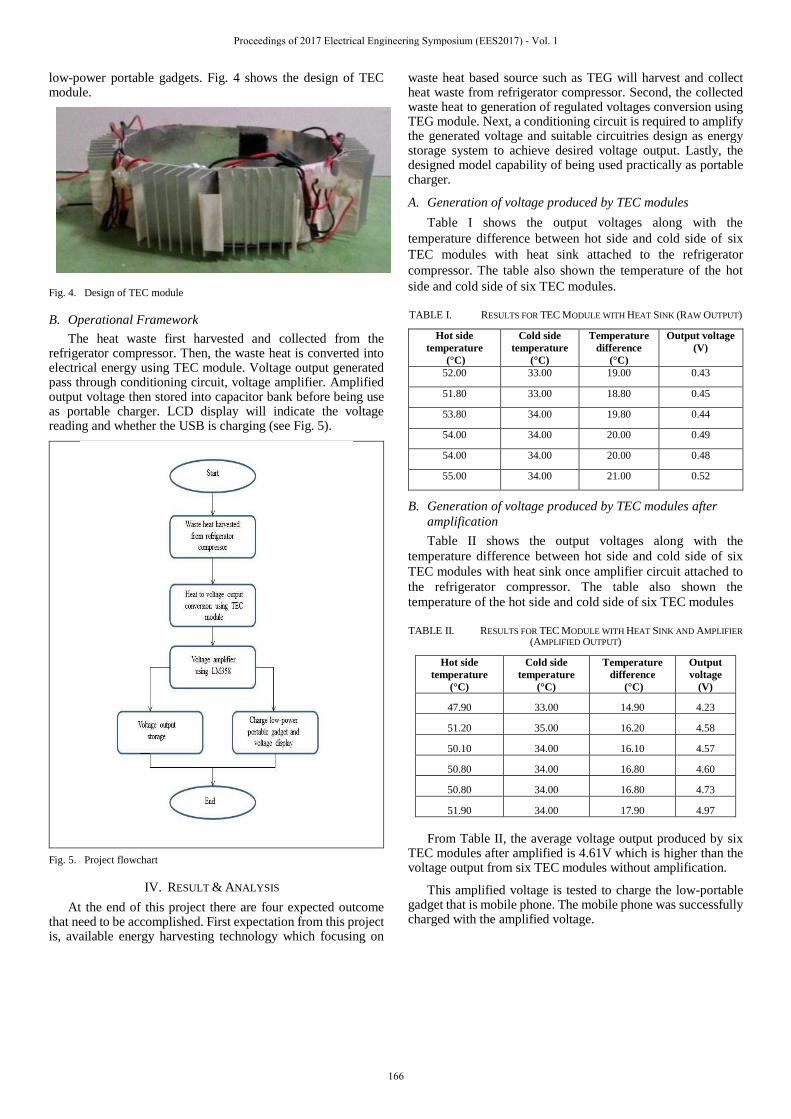
low-power portable gadgets. Fig. 4 shows the design of TEC module.
Fig. 4. Design of TEC module
B. Operational Framework
The heat waste first harvested and collected from the refrigerator compressor. Then, the waste heat is converted into electrical energy using TEC module. Voltage output generated pass through conditioning circuit, voltage amplifier. Amplified output voltage then stored into capacitor bank before being use as portable charger. LCD display will indicate the voltage reading and whether the USB is charging (see Fig. 5).
Fig. 5. Project flowchart
IV. RESULT & ANALYSIS
At the end of this project there are four expected outcome that need to be accomplished. First expectation from this project is, available energy harvesting technology which focusing on
waste heat based source such as TEG will harvest and collect heat waste from refrigerator compressor. Second, the collected waste heat to generation of regulated voltages conversion using TEG module. Next, a conditioning circuit is required to amplify the generated voltage and suitable circuitries design as energy storage system to achieve desired voltage output. Lastly, the designed model capability of being used practically as portable charger.
A. Generation of voltage produced by TEC modules
Table I shows the output voltages along with the
temperature difference between hot side and cold side of six
TEC modules with heat sink attached to the refrigerator
compressor. The table also shown the temperature of the hot
side and cold side of six TEC modules.
TABLE I. RESULTS FOR TEC MODULE WITH HEAT SINK (RAW OUTPUT)
Hot side
temperature
(°C)
Cold side
temperature
(°C)
Temperature
difference
(°C)
Output voltage
(V)
52.00 33.00 19.00 0.43
51.80 33.00 18.80 0.45
53.80 34.00 19.80 0.44
54.00 34.00 20.00 0.49
54.00 34.00 20.00 0.48
55.00 34.00 21.00 0.52
B. Generation of voltage produced by TEC modules after
amplification
Table II shows the output voltages along with the
temperature difference between hot side and cold side of six
TEC modules with heat sink once amplifier circuit attached to
the refrigerator compressor. The table also shown the
temperature of the hot side and cold side of six TEC modules
TABLE II. RESULTS FOR TEC MODULE WITH HEAT SINK AND AMPLIFIER
(AMPLIFIED OUTPUT)
Hot side
temperature
(°C)
Cold side
temperature
(°C)
Temperature
difference
(°C)
Output
voltage
(V)
47.90 33.00 14.90 4.23
51.20 35.00 16.20 4.58
50.10 34.00 16.10 4.57
50.80 34.00 16.80 4.60
50.80 34.00 16.80 4.73
51.90 34.00 17.90 4.97
From Table II, the average voltage output produced by six
TEC modules after amplified is 4.61V which is higher than the voltage output from six TEC modules without amplification.
This amplified voltage is tested to charge the low-portable gadget that is mobile phone. The mobile phone was successfully charged with the amplified voltage.
Proceedings of 2017 Electrical Engineering Symposium (EES2017) - Vol. 1
166
This experiment conducted with random opening of the refrigerator door. The act of opening the refrigerator door will lead to higher voltage. This is because the act of opening the door of refrigerator will turn on the refrigerator compressor. When the temperature inside the refrigerator is not reached its target, the compressor will turn on and cooling the temperature inside refrigerator until it achieved its target. This will lead to higher temperature differences between the hot side and cold side of TEC modules and higher voltage output.
V. CONCLUSION
This project was able to achieve the objective to amplify
the voltage produced from TEC modules and charging mobile
phone. The prototype of energy harvesting system from home
refrigerator compressor has been successfully developed to achieve the three objectives which are to study the available energy harvesting technologies which focusing on waste heat based sources, through literature studies, to study the generation of regulated voltages using TEG module on refrigerator compressor and to design energy storage system, using suitable circuitries design and to analyze the designed model for its performance, reliability, energy efficiency and capability of being used practically as portable charger.
This prototype of energy harvesting successfully harvest
the waste heat from home refrigerator compressor. TEC module
can be used to harvest the waste heat but it needs amplifier
circuit to amplify the voltage produce from the TEC module.
Voltage output from this energy harvesting system can be used
to charge low-power portable gadgets.
VI. ACKNOWLEDGEMENT
At the very beginning I would like to express my deepest gratitude to almighty Allah for giving me the strength and the composure to complete my final year project 1 and prepare this report within the scheduled time. Not to forget, the continuous support and courage from my family that keeps me going. Bearing in mind previous I am using this opportunity to express my deepest gratitude and special thanks to my supervisor, Dr. Herman bin Wahid who in spite of being extraordinarily busy with his duties, took time out to hear, guide and keep me on the correct path and allowing me to carry out my project. I express my deepest thanks to him for taking part in giving necessary advices and guidance throughout this semester. I choose this moment to acknowledge his contribution gratefully. I expose myself to independent learning skill. Based on this project, I have a deep knowledge of energy scavenging from home refrigerator waste heat using Thermoelectric Cooling module.
REFERENCES
[1] BCS “Engineering Scoping Study” 2006, pp 4
[2] Dhafer Abdulameer Shnawah, Mohamed Hamid Elsheikh, Mohd Faizul Mohd Sabri, Masjuki Haji Hassan, Mohamed Bashir Ali Bashir, Mahazani Mohamad and Suhana Binti Mohd Said “A review on thermoelectric renewable energy: Principle parameters that affect their performance ” University of Malaya, 2013, pp 2 – 37
[3] Zhou, Y., S. Paul, and S. Bhunia. Harvesting wasted heat in a microprocessor using thermoelectric generators: modeling, analysis and measurement. in Proceedings of the conference on Design, automation and test in Europe. 2008. ACM.
[4] Chen, W.-H., C.-Y. Liao, and C.-I. Hung, A numerical study on the performance of miniature thermoelectric cooler affected by Thomson effect. Applied Energy, 2012. 89(1): p. 464-473.
[5] Ando, O., et al., Acquisition and Monitoring System for TEG Characterization. International Journal of Distributed Sensor Networks, 2014.
[6] Electric Power Generated from Waste Heat, National Institute of Advanced Industrial Science and Technology (AIST), http://www.aist.go.jp/aist_e/latest_research/2005/20050617/20050617.html, 2005
[7] G. Min, “Thermoelectrics Handbook, Macro to Nano”, Thermoelectric Module Design Theories, CRC Press, 2006, pp 41
[8] Andreas Bitschi “Modelling of thermoelectric devices for electric power generation” Technical University of Vienna, 2009
[9] A.Jacks delightus peter, Balaji.D, D.Gowrishankar “Waste heat energy harvesting using thermo electric generator” Hindustan University, Chennai, 2013
[10] Z.B. Tang a, Y.D.Deng a, C.Q.Su a, W.W.Shuai a, C.J.Xie” A Research On Thermoelectric Generator's Electrical Performance Under Temperature Mismatch Conditions For Automotive Waste Heat Recovery System” Wuhan University of Technology, China, 2015
[11] Vargas-Almeida, A., M.A. Olivares-Robles, and P. Camacho-Medina, Thermoelectric System in Different Thermal and Electrical Configurations: Its Impact in the Figure of Merit. Entropy, 2013. 15(6): p. 2162-2180.
[12] Wang, C.-C., C.-I. Hung, and W.-H. Chen, Design of heat sink for improving the performance of thermoelectric generator using two-stage optimization. Energy, 2012. 39(1): p. 236-245.
[13] Patronis, Gene (1987). "Amplifiers". In Glen Ballou. Handbook for Sound Engineers: The New Audio Cyclopedia. Howard W. Sams & Co. p. 493. ISBN 0-672-21983-2.
[14] "Understanding Amplifier Operating "Classes"". electronicdesign.com. Retrieved 2016-06-20.
[15] Robert Boylestad and Louis Nashelsky (1996). Electronic Devices and Circuit Theory, 7th Edition. Prentice Hall College Division. ISBN 978-0-13-375734-7.
[16] Deshpande, R.P. (2014). Capacitors. McGraw-Hill. ISBN 9780071848565.
[17] Dorf, Richard C.; Svoboda, James A. (2001). Introduction to Electric Circuits (5th ed.). New York: John Wiley & Sons. ISBN 9780471386896.
[18] Ulaby, Fawwaz Tayssir (1999). Fundamentals of Applied Electromagnetics. Upper Saddle River, New Jersey: Prentice Hall. ISBN 9780130115546.
[19] "Power Supply Glossary". Aegis Power Systems, Inc. Aegis Power Systems, Inc. Retrieved 15 September 2014.
[20] Kordyban, T., 1998, Hot air rises and heat sinks – Everything you know about cooling electronics is wrong, ASME Press, NY.
[21] M. R. Hajmohammadi, V. Alizadeh Abianeh, M. Moezzinajafabadi and M. Daneshi, Fork-shaped highly conductive pathways for maximum cooling in a heat generating piece, Applied Thermal Engineering, 61 (2013) 228–235.
[22] Bulusu, A. Walker and D. G , “Review of electronic transport models for thermoelectric materials” , 2008
[23] Tritt, Terry, M. Subramanian, M. A. “Thermoelectric Materials, Phenomena, and Applications” , 2011
[24] Neeharika Naik-Dhungel “Waste Heat Streams Classified by Temperature” , 2012
[25] D.A.Reay “Heat Recovery Systems” E & F.N.Span, 1979
Proceedings of 2017 Electrical Engineering Symposium (EES2017) - Vol. 1
167
Magnet Engine Free Energy Generator
Siti Amirah Binti Ramli
Faculty of Electrical Engineering
Universiti Teknologi Malaysia
Johor Bahru, Malaysia.
Email: [email protected]
Dr. Anita Binti Ahmad
Department of Control and Mechatronics
Faculty of Electrical Engineering
Universiti Teknologi Malaysia
Johor Bahru, Malaysia.
Email: [email protected]
Abstract—This paper describes a research into an
innovation by testing the practicable and viability of the system
which is by using water pump in an aquarium to turn on the light
in the aquarium. A 12 volt direct current CPU cooling fan is used
as the turbine and motor to produce voltage to light up the bulb
inside the aquarium. The CPU cooling fan construction consist of
brush-less direct current motor which is, it is low torque
characteristic motor, long operating life and has rugged
construction. The water flow from the pump in the aquarium fall
onto the blade of the fan and it will start to rotate. The flowing
water must be in specified height to ensure that the blade can
rotate very fast and produce constant rotating speed as well as
constant output voltage. There is magnet at the center of the fan
around the blade and as the commutator inside the fan start to
rotate as for the brush-less direct current motor will start to
create flux around the magnet. The rotating conductor will cut
the flux lines and convert that cutted flux lines into output
voltage. Then, an amplifier is used to compare the output voltage
from the fan into the amplifier and power up the voltage booster
module. The voltage booster connected to the load. As the first
segment is completed, the amplifier will be integrated with the DC
to DC voltage booster to increase the voltage up to the usable
output value. Hence, the output value will be able to power up the
load within the range of the resultant voltage produced by the DC
to DC voltage booster.
Keywords—aquarium; water pump; CPU cooling fan;
amplifier; DC to DC voltage booster.
I. INTRODUCTION
Nowadays, the cost of energy is continually
increasing while environmental concerns are increasing as well
as many businesses are turning to green technology to save
long-term costs and take advantage of green marketing.
Innovation will be needed to manage the trend of rising energy
costs in the future and address environmental concerns [1].
This study tests the feasibility of an idea by using an aquarium
water pump and CPU cooling fan to produce an output value
for low consumption electrical load. Electricity is a crucial and
important for human to survive and keep on living. Electricity
can be considered as a very efficient way of energy
consumption in part because it is weightless as well as easy to
distribute. The CPU cooling fan has been used in this system
because it has axial flow fan shape which it is rotating in a
common unrestricted air space. The axial flow fans come in
many variations that all have one thing in common which is
they rotate about their axis and they move a column of air
parallel to that axis [2]. At the point where electricity
generates, it is a renewable form of energy as well as a clean
one. The generator can be implemented by using a mini fan or
blade which the certain amount of water at a certain height
flow onto the blade to make it continuously rotating and will
produce voltage and current. The output voltage and current
can be the new supply and sources for low power consumption
electrical load.
II. LITERATURE REVIEW
The reason why the hydro-generator more favorable because it
is a clean source of energy and will last longer which mean it
can be used for a long time period. The dynamic head (H),
amount of water flowing (Q) and the efficiency of the
generator give a crucial influences towards the performance of
the system. It is important to know the power potential of a
river where the flow, Q of the river is the amount of time (in
m3 or litters) that passes in a certain amount of time across a
section of the river also it is necessary to know the flow in the
river and the available head which is head is the vertical
difference in levels (m) through which water falls down [3]
.This available power will be converted by the hydro turbine
into mechanical power.
The ship propellers are one of the free-form surfaces,
such blades are design individually for each application and
the various parameters controlling the performances must be
considered so the design approach is important [4]. In this
paper, the blade design is based on the medial representation of
the blades, medial surface with profile curves attached to it. By
using suitable parameterization, the B-spline surfaces able to
describe the pressure and the suction size of the blade, the
design of blades for hydroelectric turbines and ship propellers
follows the classical approach. First, the medial surface is
designed using the conformal mapping of the projected
streamlines. Second, the profile curves are added to the medial
surface. The resulting surface is given by a medial surface and
profiles attached to it.
The modeling consists of a variable speed micro-
hydro turbine coupled to a permanent magnet synchronous
generator and connected to the electric grid through an
advanced power conditioning system [5]. The stator windings
of the system are connected to the next level, which is
composed of a three-phase rectifier bridge, a DC-DC converter
and a DC-AC power inverter. The generator will spin the
Proceedings of 2017 Electrical Engineering Symposium (EES2017) - Vol. 1
168
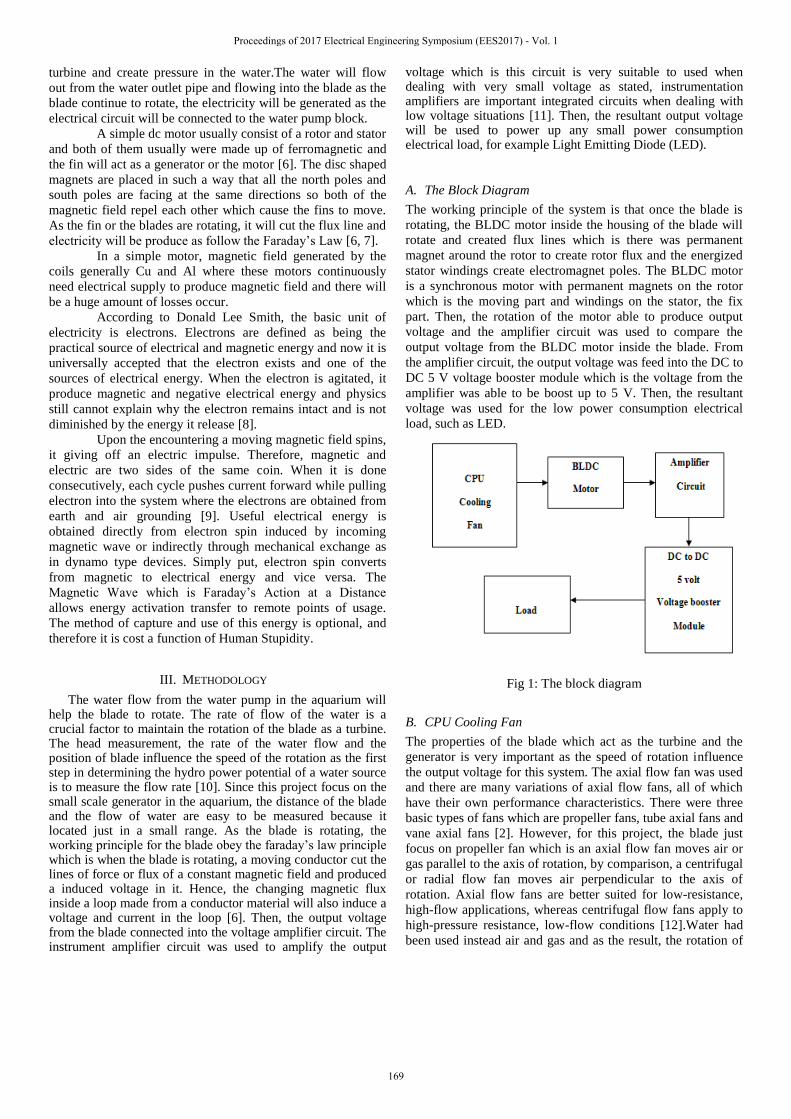
turbine and create pressure in the water.The water will flow
out from the water outlet pipe and flowing into the blade as the
blade continue to rotate, the electricity will be generated as the
electrical circuit will be connected to the water pump block.
A simple dc motor usually consist of a rotor and stator
and both of them usually were made up of ferromagnetic and
the fin will act as a generator or the motor [6]. The disc shaped
magnets are placed in such a way that all the north poles and
south poles are facing at the same directions so both of the
magnetic field repel each other which cause the fins to move.
As the fin or the blades are rotating, it will cut the flux line and
electricity will be produce as follow the Faraday’s Law [6, 7].
In a simple motor, magnetic field generated by the
coils generally Cu and Al where these motors continuously
need electrical supply to produce magnetic field and there will
be a huge amount of losses occur.
According to Donald Lee Smith, the basic unit of
electricity is electrons. Electrons are defined as being the
practical source of electrical and magnetic energy and now it is
universally accepted that the electron exists and one of the
sources of electrical energy. When the electron is agitated, it
produce magnetic and negative electrical energy and physics
still cannot explain why the electron remains intact and is not
diminished by the energy it release [8].
Upon the encountering a moving magnetic field spins,
it giving off an electric impulse. Therefore, magnetic and
electric are two sides of the same coin. When it is done
consecutively, each cycle pushes current forward while pulling
electron into the system where the electrons are obtained from
earth and air grounding [9]. Useful electrical energy is
obtained directly from electron spin induced by incoming
magnetic wave or indirectly through mechanical exchange as
in dynamo type devices. Simply put, electron spin converts
from magnetic to electrical energy and vice versa. The
Magnetic Wave which is Faraday’s Action at a Distance
allows energy activation transfer to remote points of usage.
The method of capture and use of this energy is optional, and
therefore it is cost a function of Human Stupidity.
III. METHODOLOGY
The water flow from the water pump in the aquarium will help the blade to rotate. The rate of flow of the water is a crucial factor to maintain the rotation of the blade as a turbine. The head measurement, the rate of the water flow and the position of blade influence the speed of the rotation as the first step in determining the hydro power potential of a water source is to measure the flow rate [10]. Since this project focus on the small scale generator in the aquarium, the distance of the blade and the flow of water are easy to be measured because it located just in a small range. As the blade is rotating, the working principle for the blade obey the faraday’s law principle which is when the blade is rotating, a moving conductor cut the lines of force or flux of a constant magnetic field and produced a induced voltage in it. Hence, the changing magnetic flux inside a loop made from a conductor material will also induce a voltage and current in the loop [6]. Then, the output voltage from the blade connected into the voltage amplifier circuit. The instrument amplifier circuit was used to amplify the output
voltage which is this circuit is very suitable to used when dealing with very small voltage as stated, instrumentation amplifiers are important integrated circuits when dealing with low voltage situations [11]. Then, the resultant output voltage will be used to power up any small power consumption electrical load, for example Light Emitting Diode (LED).
A. The Block Diagram
The working principle of the system is that once the blade is
rotating, the BLDC motor inside the housing of the blade will
rotate and created flux lines which is there was permanent
magnet around the rotor to create rotor flux and the energized
stator windings create electromagnet poles. The BLDC motor
is a synchronous motor with permanent magnets on the rotor
which is the moving part and windings on the stator, the fix
part. Then, the rotation of the motor able to produce output
voltage and the amplifier circuit was used to compare the
output voltage from the BLDC motor inside the blade. From
the amplifier circuit, the output voltage was feed into the DC to
DC 5 V voltage booster module which is the voltage from the
amplifier was able to be boost up to 5 V. Then, the resultant
voltage was used for the low power consumption electrical
load, such as LED.
Fig 1: The block diagram
B. CPU Cooling Fan
The properties of the blade which act as the turbine and the
generator is very important as the speed of rotation influence
the output voltage for this system. The axial flow fan was used
and there are many variations of axial flow fans, all of which
have their own performance characteristics. There were three
basic types of fans which are propeller fans, tube axial fans and
vane axial fans [2]. However, for this project, the blade just
focus on propeller fan which is an axial flow fan moves air or
gas parallel to the axis of rotation, by comparison, a centrifugal
or radial flow fan moves air perpendicular to the axis of
rotation. Axial flow fans are better suited for low-resistance,
high-flow applications, whereas centrifugal flow fans apply to
high-pressure resistance, low-flow conditions [12].Water had
been used instead air and gas and as the result, the rotation of
Proceedings of 2017 Electrical Engineering Symposium (EES2017) - Vol. 1
169
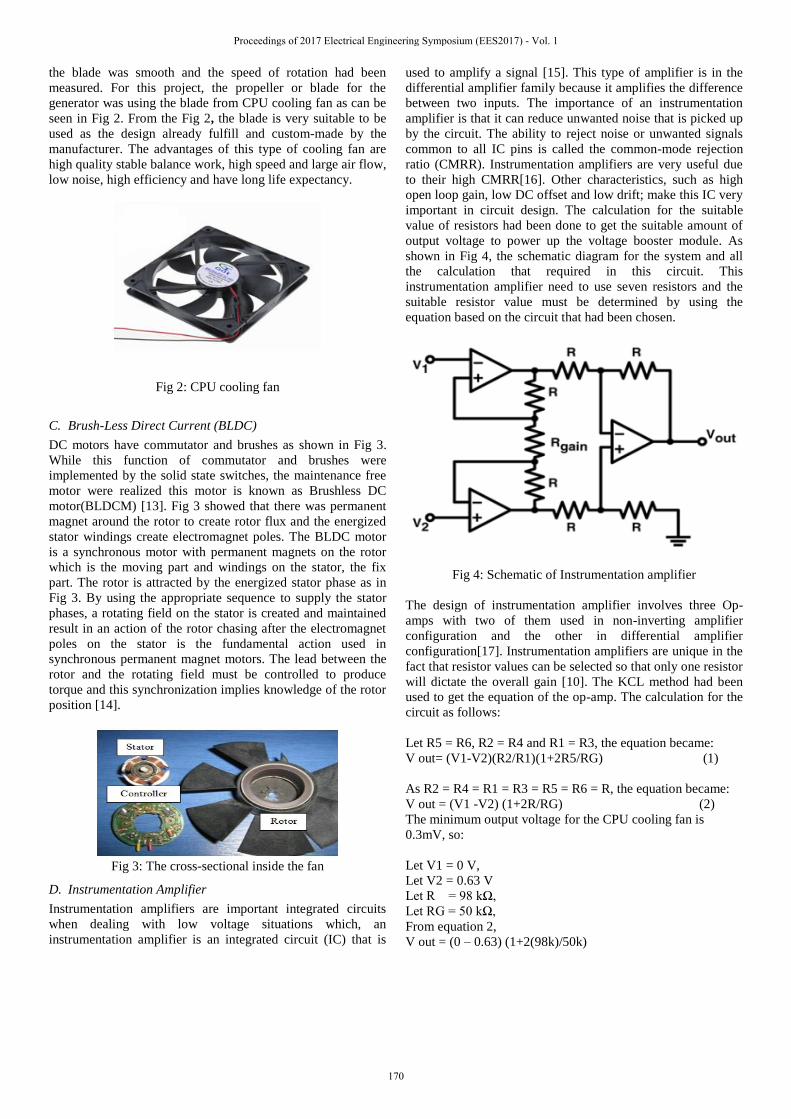
the blade was smooth and the speed of rotation had been
measured. For this project, the propeller or blade for the
generator was using the blade from CPU cooling fan as can be
seen in Fig 2. From the Fig 2, the blade is very suitable to be
used as the design already fulfill and custom-made by the
manufacturer. The advantages of this type of cooling fan are
high quality stable balance work, high speed and large air flow,
low noise, high efficiency and have long life expectancy.
Fig 2: CPU cooling fan
C. Brush-Less Direct Current (BLDC)
DC motors have commutator and brushes as shown in Fig 3.
While this function of commutator and brushes were
implemented by the solid state switches, the maintenance free
motor were realized this motor is known as Brushless DC
motor(BLDCM) [13]. Fig 3 showed that there was permanent
magnet around the rotor to create rotor flux and the energized
stator windings create electromagnet poles. The BLDC motor
is a synchronous motor with permanent magnets on the rotor
which is the moving part and windings on the stator, the fix
part. The rotor is attracted by the energized stator phase as in
Fig 3. By using the appropriate sequence to supply the stator
phases, a rotating field on the stator is created and maintained
result in an action of the rotor chasing after the electromagnet
poles on the stator is the fundamental action used in
synchronous permanent magnet motors. The lead between the
rotor and the rotating field must be controlled to produce
torque and this synchronization implies knowledge of the rotor
position [14].
Fig 3: The cross-sectional inside the fan
D. Instrumentation Amplifier
Instrumentation amplifiers are important integrated circuits
when dealing with low voltage situations which, an
instrumentation amplifier is an integrated circuit (IC) that is
used to amplify a signal [15]. This type of amplifier is in the
differential amplifier family because it amplifies the difference
between two inputs. The importance of an instrumentation
amplifier is that it can reduce unwanted noise that is picked up
by the circuit. The ability to reject noise or unwanted signals
common to all IC pins is called the common-mode rejection
ratio (CMRR). Instrumentation amplifiers are very useful due
to their high CMRR[16]. Other characteristics, such as high
open loop gain, low DC offset and low drift; make this IC very
important in circuit design. The calculation for the suitable
value of resistors had been done to get the suitable amount of
output voltage to power up the voltage booster module. As
shown in Fig 4, the schematic diagram for the system and all
the calculation that required in this circuit. This
instrumentation amplifier need to use seven resistors and the
suitable resistor value must be determined by using the
equation based on the circuit that had been chosen.
Fig 4: Schematic of Instrumentation amplifier
The design of instrumentation amplifier involves three Op-
amps with two of them used in non-inverting amplifier
configuration and the other in differential amplifier
configuration[17]. Instrumentation amplifiers are unique in the
fact that resistor values can be selected so that only one resistor
will dictate the overall gain [10]. The KCL method had been
used to get the equation of the op-amp. The calculation for the
circuit as follows:
Let R5 = R6, R2 = R4 and R1 = R3, the equation became:
V out= (V1-V2)(R2/R1)(1+2R5/RG) (1)
As R2 = R4 = R1 = R3 = R5 = R6 = R, the equation became:
V out = (V1 -V2) (1+2R/RG) (2)
The minimum output voltage for the CPU cooling fan is
0.3mV, so:
Let V1 = 0 V,
Let V2 = 0.63 V
Let R = 98 kΩ,
Let RG = 50 kΩ,
From equation 2,
V out = (0 – 0.63) (1+2(98k)/50k)
Proceedings of 2017 Electrical Engineering Symposium (EES2017) - Vol. 1
170

V out = 2.46 V.
The calculation is just a reference to determine the
suitable value of resistors to be used in designing the circuit.
The voltage amplifier was used because it has the concept of
gain which is the RG is the value for Gain Resistor needed for
this system and 50 KΩ resistor had been used to help boost the
voltage in the gain of 2, based on the Table 2.2. The instrument
amplifier need to use separated power supply which is the 1.5
V battery used to ensure the LM 324N can be operated. The
output from the fan is 0.63 V which will not able to operate the
voltage booster module and it needed another system to be
integrated with between the outputs from the propeller with the
voltage booster module. The amplifier was used because it is
able to compare the output voltage from the fan into the
amplifier to get the resultant amplified output voltage.
E. DC-DC Voltage Booster Module
The DC-DC Voltage Booster Module was used as the input for
the output of the amplifier. The input from any DC voltage of
1 V~5 V, output 5 V DC voltage is stable, high conversion
efficiency, up to 96%,ultra-small size, and installed in a variety
of small equipment. As the voltage booster module get the
input, the resultant output can be used to power up the load, for
example then LED because LED only consume low power of
electricity as compared to the others within the 5 V output
value.Table I show the characteristic of the module.
TABLE I: 5 V VOLTAGE BOOSTER MODULE PARAMETER
Fig 5: 5 V voltage booster module
IV. RESULT AND DISCUSSION
The output value for the system had been showed in Table II.
The testing for the system had been done to monitor the
performance of the system. The output current was able to be
boost up until 5 V and the load as LEDs can be light up by
using the system.
TABLE II: RESULT OF THE SYSTEM
Height
(cm)
Speed
(RPM)
Output
Voltage (V)
Output
current
(mA) 2 0 0 0
4 0 0 0
6 36.8 0.02 0.01
8 101.0 0.16 0.35
10 121.1 0.18 0.42
12 237.8 0.21 0.52
14 254.1 0.24 0.60
16 257.6 0.27 0.65
18 260.8 0.29 0.72
20 267.7 0.31 0.83
22 267.6 0.35 0.89
24 269.6 0.37 1.67
26 275.4 0.38 2.56
28 279.7 0.40 4.72
30 280.1 0.41 5.48
32 287.6 0.46 6.40
34 299.6 0.51 6.54
36 306.4 0.57 6.92
38 320.1 0.61 7.20
40 327.4 0.63 7.80
From the Fig 6, the height of the water source
influences the speed of the rotation. The graph clearly shows
that when the height is 40 cm above the CPU cooling fan, the
speed can reach up to 320 RPM. However, if the height is 2 cm
and 4 cm above the propeller, the speed remains at 0 RPM
because the blade was not able to move.
The conclusion that can be made is if the distance of
the head is increasing, then the speeds of the rotation also
increase. The graph linearly increases characteristic
performance of the height of the water source against the speed
of rotation.
Parameter Description
Input voltage 1 v to 5 v
Output voltage 5 v
Output current 500 mA
Dimension 17.55 mm x 25.22 mm x 5.85 mm
Proceedings of 2017 Electrical Engineering Symposium (EES2017) - Vol. 1
171
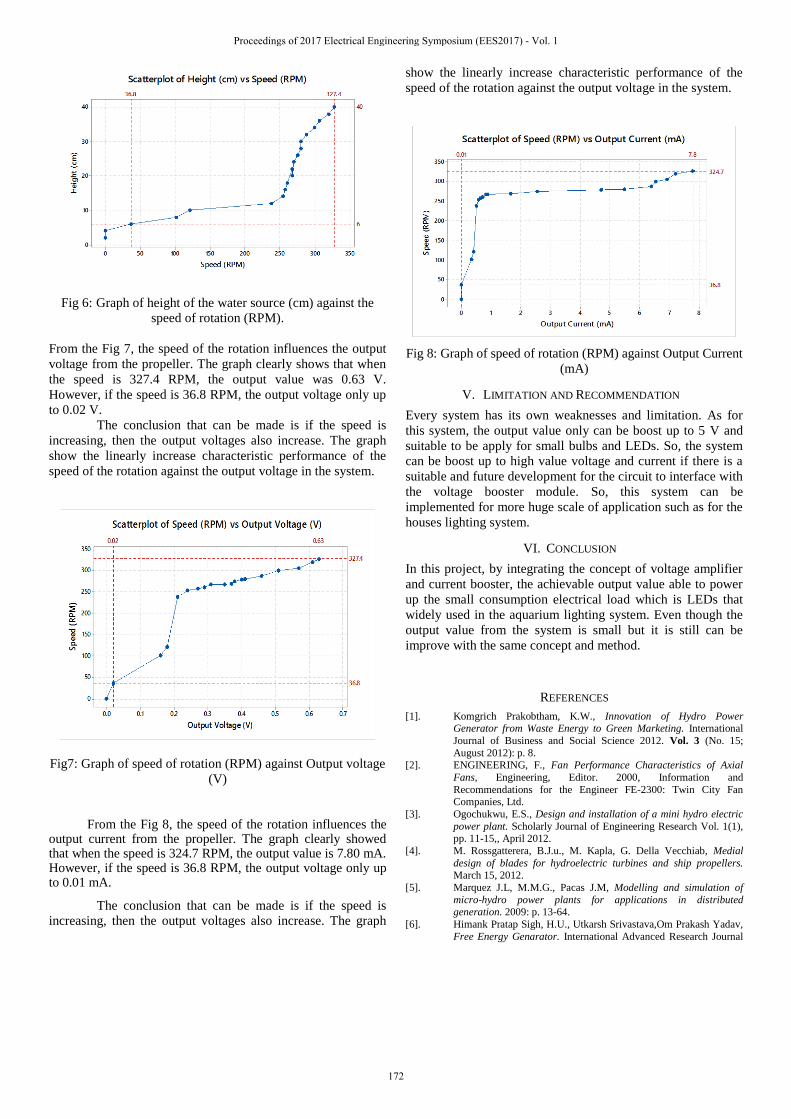
Fig 6: Graph of height of the water source (cm) against the
speed of rotation (RPM).
From the Fig 7, the speed of the rotation influences the output
voltage from the propeller. The graph clearly shows that when
the speed is 327.4 RPM, the output value was 0.63 V.
However, if the speed is 36.8 RPM, the output voltage only up
to 0.02 V.
The conclusion that can be made is if the speed is
increasing, then the output voltages also increase. The graph
show the linearly increase characteristic performance of the
speed of the rotation against the output voltage in the system.
Fig7: Graph of speed of rotation (RPM) against Output voltage
(V)
From the Fig 8, the speed of the rotation influences the
output current from the propeller. The graph clearly showed that when the speed is 324.7 RPM, the output value is 7.80 mA. However, if the speed is 36.8 RPM, the output voltage only up to 0.01 mA.
The conclusion that can be made is if the speed is
increasing, then the output voltages also increase. The graph
show the linearly increase characteristic performance of the
speed of the rotation against the output voltage in the system.
Fig 8: Graph of speed of rotation (RPM) against Output Current
(mA)
V. LIMITATION AND RECOMMENDATION
Every system has its own weaknesses and limitation. As for
this system, the output value only can be boost up to 5 V and
suitable to be apply for small bulbs and LEDs. So, the system
can be boost up to high value voltage and current if there is a
suitable and future development for the circuit to interface with
the voltage booster module. So, this system can be
implemented for more huge scale of application such as for the
houses lighting system.
VI. CONCLUSION
In this project, by integrating the concept of voltage amplifier
and current booster, the achievable output value able to power
up the small consumption electrical load which is LEDs that
widely used in the aquarium lighting system. Even though the
output value from the system is small but it is still can be
improve with the same concept and method.
REFERENCES
[1]. Komgrich Prakobtham, K.W., Innovation of Hydro Power Generator from Waste Energy to Green Marketing. International
Journal of Business and Social Science 2012. Vol. 3 (No. 15;
August 2012): p. 8. [2]. ENGINEERING, F., Fan Performance Characteristics of Axial
Fans, Engineering, Editor. 2000, Information and
Recommendations for the Engineer FE-2300: Twin City Fan Companies, Ltd.
[3]. Ogochukwu, E.S., Design and installation of a mini hydro electric
power plant. Scholarly Journal of Engineering Research Vol. 1(1), pp. 11-15,, April 2012.
[4]. M. Rossgatterera, B.J.u., M. Kapla, G. Della Vecchiab, Medial
design of blades for hydroelectric turbines and ship propellers. March 15, 2012.
[5]. Marquez J.L, M.M.G., Pacas J.M, Modelling and simulation of
micro-hydro power plants for applications in distributed generation. 2009: p. 13-64.
[6]. Himank Pratap Sigh, H.U., Utkarsh Srivastava,Om Prakash Yadav,
Free Energy Genarator. International Advanced Research Journal
Proceedings of 2017 Electrical Engineering Symposium (EES2017) - Vol. 1
172
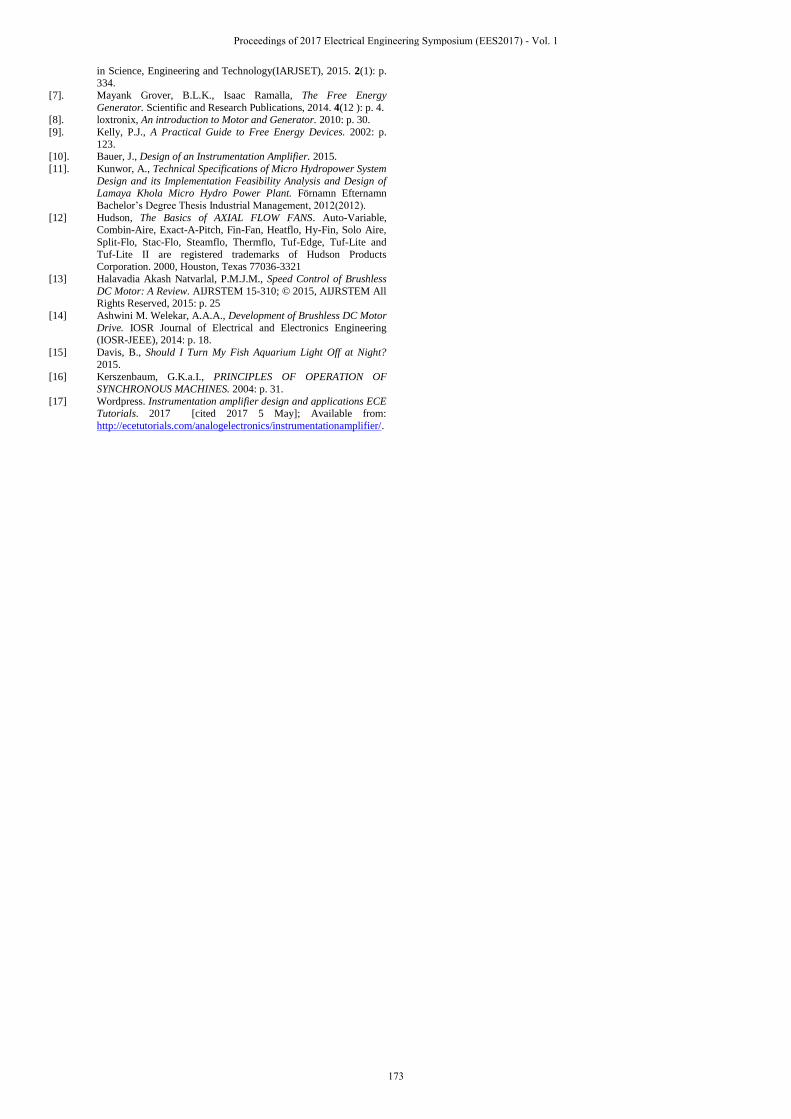
in Science, Engineering and Technology(IARJSET), 2015. 2(1): p. 334.
[7]. Mayank Grover, B.L.K., Isaac Ramalla, The Free Energy
Generator. Scientific and Research Publications, 2014. 4(12 ): p. 4.
[8]. loxtronix, An introduction to Motor and Generator. 2010: p. 30.
[9]. Kelly, P.J., A Practical Guide to Free Energy Devices. 2002: p.
123. [10]. Bauer, J., Design of an Instrumentation Amplifier. 2015.
[11]. Kunwor, A., Technical Specifications of Micro Hydropower System
Design and its Implementation Feasibility Analysis and Design of Lamaya Khola Micro Hydro Power Plant. Förnamn Efternamn
Bachelor’s Degree Thesis Industrial Management, 2012(2012).
[12] Hudson, The Basics of AXIAL FLOW FANS. Auto-Variable, Combin-Aire, Exact-A-Pitch, Fin-Fan, Heatflo, Hy-Fin, Solo Aire,
Split-Flo, Stac-Flo, Steamflo, Thermflo, Tuf-Edge, Tuf-Lite and
Tuf-Lite II are registered trademarks of Hudson Products Corporation. 2000, Houston, Texas 77036-3321
[13] Halavadia Akash Natvarlal, P.M.J.M., Speed Control of Brushless
DC Motor: A Review. AIJRSTEM 15-310; © 2015, AIJRSTEM All Rights Reserved, 2015: p. 25
[14] Ashwini M. Welekar, A.A.A., Development of Brushless DC Motor
Drive. IOSR Journal of Electrical and Electronics Engineering (IOSR-JEEE), 2014: p. 18.
[15] Davis, B., Should I Turn My Fish Aquarium Light Off at Night?
2015.
[16] Kerszenbaum, G.K.a.I., PRINCIPLES OF OPERATION OF
SYNCHRONOUS MACHINES. 2004: p. 31.
[17] Wordpress. Instrumentation amplifier design and applications ECE Tutorials. 2017 [cited 2017 5 May]; Available from:
http://ecetutorials.com/analogelectronics/instrumentationamplifier/.
Proceedings of 2017 Electrical Engineering Symposium (EES2017) - Vol. 1
173

Related Documents


