Welcome message from author
This document is posted to help you gain knowledge. Please leave a comment to let me know what you think about it! Share it to your friends and learn new things together.
Transcript
TABLE OF CONTENTS
S No Paper Title & Author(s)
01
Understanding Leadership Claiming as a negotiation process
Shreyaa Mukherjee
02
‘GREAT’ model of non-monetary levers to enhance employee engagement inIndian software services industry
Swaminathan Mani & Mridula Mishra
03
An Empirical Investigation of the Job Satisfaction of Indian Expatriates: TheMediating Role of Cultural Adjustment
Chhaya Mani Tripathi & Tripti Singh
04
Organizational Citizenship Behaviour: Evidence from the Indian Armed Forcesand Call for Discussion on a Broader Definition
Awanish Chaudhary
05
Sustainability in Business and Management: A bibliometric based integrativereview and future research agenda
Milind Kumar Jha & K. Rangarajan
06
Carbon Emissions & Ecological Business Conscience of Coal, Oil & GasBusinesses in India
Harini K N
07
The resource-based view guided sustainable development: a co-citation analysis
Sayantan Khanra & Rojers P Joseph
1
08
Comparison of Regression, ANNS and SVMS methods for Prediction of The IndianStock Market
Deepanshu Verma
09A Comprehensive Framework for Assessment of e-Government Services
Sayantan Khanra & Rojers P Joseph
10Impact of Co-creation in the practice of developing IoT solutions
Vishal Goyal & Anita Goyal
11
Product Differentiation Dominance in an Oligopolistic Market: A BibliometricStudy
Keshvi Nandu, Foram Shah, Anupriya Maliwal, Anuj Shah & Dev Derasari
12ICT Adoption and Insurance uptake in India
Shreya Biswas & Shreya Lahiri
13
Novelty and serendipity in recommender systems: a social choice theoryperspective
Aariz Faizan Javed
14
Can Online Product Sales be Increased by Ordering a Positive Review before aNegative One?
Bijit Ghosh & Spandan Chowdhury
15Factors affecting acceptance of mobile payment: A vendor's perspective
Kanav Mehra, Rounak Polley, Sarvesh Patidar & Ankur
16
Analysis of Green Supply Chain Power Structure Under Fairness Scheme
Soumita Ghosh, Abhishek Chakraborty & Alok Raj
2
17
Creating Sustainable Practices using HRM Systems during Turbulence: Towards aModel for Green Culture Developmen
Sudhanshu Maheshwari & Ashneet Kaur
18
Sustainability Mindset: Micro-foundation of Dynamic Capabilities for Innovationfor Sustainability
Asha K S Nair & Som Sekhar Bhattacharyya
19‘It depends’: Regulatory Focus & Risk-taking Behavior
Sakshi Aggarwal
20
Synergistic Combination of Constructivist Grounded Theory and AnalyticAutoethnography: A Novel Hybrid Research Paradigm to Develop IndigenousTheories
Awanish Kumar Chaudhary
21
Workplace Spirituality and Remote-Cyberloafing: A Conceptual View in theContext of Distributed Work Environments
Sauvik Kumar Batabyal & Kanika Tandon Bhal
22
An Analytical Study on Privatization of Oil Industry in Kuwait: Challenges andOpportunities
Hanan A-Hashash & Prof. Raphael Heffron
23
Founder Ownership and the Readability of Management Discussion and Analysissection of the annual report
Somya Arora & Prof. Yogesh Chauhan
24Career Success of Women: Role of Family Responsibilities, Mentoring AndPerceived Organizational SupportJyoti Chauhan, Geeta Mishra & Suman Bhakri
25Reinvigorating Green Bond as an Alternative Energy Investment amidstForeseeable Funding Crisis due to the Great LockdownSuvajit Banerjee & Spandan Chowdhury
3
26
Nature of Internal Labor Migration in India: Do Education and DigitalizationMatter\Sana Tabassum & Leena Mary Eapen
4
IIM Kozhikode Doctoral Symposium 2020
978-93-5437-613-9
Conference Proceedings Edited byProf. Mohammed Shahid Abdulla & Prof. Ram Kumar P. N
INDIAN INSTITUTE OF MANAGEMENT KOZHIKODE
Understanding Leadership Claiming as a Negotiation Process impacted by
Expected Future Negotiation Interaction
Shreya Mukherjee Ph.D. Scholar, Faculty of Management Studies
Address: Prof ND Kapoor Marg, University Enclave, New Delhi 110 007
Email id: [email protected]
Abstract
Leadership claiming has been researched as a relational and social process that establishes a leader-
follower relationship through granting and claiming of authority (DeRue & Ashford, 2010). Yet, no
research has looked into how an expectation of future negotiations (the anticipation of fairness,
friendliness, and cooperativeness) within the context of negotiating for leadership positions impacts
negotiator's subjective or objective value outcome (SV & OV) (Curhan & Brown, 2011). The primary aim
of this research is to answer the following questions. First, when future negotiations during leadership
claiming process are expected to be (or not) fair, friendly and cooperative then how does it impact SV and
OV outcome?. Second, how does this impact change when a negotiator is a man or a woman?.
Keywords: leadership, negotiation, women, subjective value outcomes, future interaction
Introduction
Leadership claiming has been researched as a relational and social process that establishes a
leader-follower relationship through granting and claiming of authority (DeRue & Ashford, 2010).
Given that negotiating for a leadership position is a long term repetitive relational exercise
between followers and leader, it is a surprise that expectations of future negotiations and the effect
of quality of those expected future negotiations (fairness, friendliness and cooperation) impacting
subjective or objective value outcomes (SV or OV) (Curhan & Brown, 2011) has not yet been
thoroughly explored. This becomes even more relevant from a gendered perspective of a woman
since the onus of decreasing number of women in leadership positions has been repeatedly put on
women's non-competitive and relational approach that leads to her opting out of leadership
positions willingly (Belkin, 2013; Kesebir, Lee, Elliot, & Pillutla, 2019). If aspiring for leadership
positions is not merely restricted to claiming assertively but is also consequential for impacting
leader-follower claiming-granting cyclical process which can reduce the probability of attaining
and make functioning as a leader difficult in future, then women do not appear to opt out simply
because they care for their relationships or are non-competitive. Contrarily, this paper contends
that due to the cyclical leadership claiming-granting process and effect of pre-negotiation
behavioral influences (like expectations from future negotiations) women trade off between
negotiation outcomes that give her a greater chance and merit of being recognized as a leader in
the long run (circuitously) than immediately.
Bowles (2012, pg 38) too calls for future research into understanding how using this
leadership claiming-granting process allows some women to “get away” with even self-advocacy,
and proposes to delve into “quality of women’s relationships and reputations that moderate self-
advocacy”. Using the theoretical lens of Conservation of Resources (COR) (Hobfall et. al, 2018)
our argument proposes that men and women approach the negotiation process of leadership
claiming and granting differently aiming to conserve and deploy different resources that enhances
the value (SV or OV) they associate with climbing the leadership ladder. The research aims to
answer conceptually using extant literature the following questions. First, when future
2
negotiations during leadership claiming process are expected to be (or not) fair, friendly and
cooperative then how does it impact SV and OV outcome in individuals?. Next, how does this
impact change when a negotiator is a man or a woman?. Also, what trends do SV and OV
outcomes show when compared between men and women?. The research aims to contribute to
existing leadership and negotiation literature; by enhancing our understanding of what kind of
outcomes are produced during leadership negotiation and why do men/women choose to navigate
their way to leadership positions through these evaluations.
Role of Gender in Leadership claiming
DeRue and Ashford (2010) express attaining leadership position as a social identity creation
process through claiming-by means of taking assertive action to reinstate leader or follower
identity, and through granting-by bestowing leader or follower identity to another. This they claim
can be an explicit or an implicit process between the leader and the follower, and develops into an
established relation when mutually accepted.
Women have been blamed to shun away from leadership positions due to their individual
choice (Belkin, 2013) such that these hierarchical positions are attainable but not desirable by
them (Gino, Wilmuth, & Brooks, 2015). The leadership literature on women typically have
explored her leadership journey as negotiating transactionally a “one time affair”, so her decisions
appear as a time slice when she is not claiming leadership assertively. But, DeRue and Ashford
(2010) propose that leadership is not simply a hierarchical process rather a long term relational or
social process, in which women need to establish their legitimacy (Bowles, 2012). Attaining this
legitimacy Bowles (2012) claims is co-dependent on “legitimizing agents who can lend social
capital and credibility to their ascent” (pg. 9) like followers. The negotiation literature also points
to how important followers are to women as women fear social backlash when advocating for self
(Exley et. al, 2016) but not when advocating for others (Amanatullah and Morris, 2010).
Inevitably this signifies multiple leader-follower interaction over a long period that requires
women to establish leader identity or legitimacy at different levels of "individual internalization,
relational recognition, and collective endorsement" (DeRue and Ashford, 2010, pg. 629), this is
akin to a negotiation that involves multiple future interactions with others. Therefore, the fear of
facing social backlash when advocating for self not others, the cyclical nature of leadership
claiming and granting as a relational process, and the co-dependency on legitimizing agents for
social capital to bend or shape organizational norms leads to what we call “an interaction effect”
that renders women to “objectively value subjective outcomes” of leadership negotiations (Curhan
et. al, 2010)
Expectation and Non-Expectation of Future Interaction in Leadership Claiming process
( EFLCNI & Non-EFLCNI) Roering, Slusher, and Schooler (1975) stated that irrespective of
bargaining or non-bargaining situations, parties involved in one-time vs multiple-time negotiation
interaction approach negotiation differently and expect different outcomes from negotiation due to
their differing commitment to future interactions. Roering et. al (1975) further explained future
interactions commitment based on two competing pressures a) the desire to maintain a strong
image that discourages “future exploitation by counterpart” and b) desire to avoid “social
disapproval” (pg. 387).
In this paper, we are drawing from literature on expectations of future interactions in
negotiation (Patton & Balakrishnan, 2010; Roering et. al, 1975) and extrapolating it within the
context of negotiation for leadership claiming and granting. Adapting from Patton and
Balakrishnan’s (2010) four stage negotiation process (pre-negotiation behavioral influences,
negotiation process, negotiation outcomes and post negotiation dispositions), we anticipate that
expectations of a fair, friendly and cooperative leadership claiming negotiation interaction
(EFLCNI) vs non-expectations (non-EFLCNI) will affect the individual's behavior differently
3
during negotiation process in accordance with their gender (male or female), and subsequently
affect the negotiation outcomes as well.
Subjective and Objective value outcome Recently, negotiation research has begun
focussing on subjective indicators of performance (Bendersky & McGinn, 2010; Curhan,
Elfenbein, & Xu, 2006). While OV such as more compensation, authority, monetary value,
economic benefits, gaining a leader's position and so on are obvious benefits. In leadership
negotiations which are relation-based to a large extent (refer LMX theory), SV holds significant
benefits too.
For the purpose of this paper, we adopt our understanding of SV from Curhan, Elfenbein, &
Xu (2006, pg 579). It is defined as "social, perceptual, and emotional consequences of a
negotiation, comprising the negotiator's feelings about the instrumental outcome, feelings about
him- or herself, feelings about the process, and feelings about the relationship". It is to note here
that subjective value outcome or objective value outcome are feelings associated with these
outcomes post negotiation.
Conservation of Resources Theory (COR)
COR’s (Hobfall et. al, 2018) basic premise is that individuals invest effort to “obtain, retain,
foster, and protect” (pg. 102) resources that are meaningful for them. This theory points to the fact
that individuals’ perceived appraisals of future anticipated events play a crucial role in
understanding their behavior. In other words, COR theory eliminates the need for an event to
occur in order to induce stress that consequentially leads to behavioral change in the victim. Either
the fear of loss of key resources or the possibility of not being able to gain key resources for future
need is enough to propel an individual to take some action. Other tenets of COR theory emphasize
how the degree of loss or gain of resources increases desperation in behavior. Principles of COR
state that the momentum (speed, impact and duration experienced) of loss of resources is
evaluated as significantly more important than gain of resources. And the greater the momentum
of resource loss experienced makes resource gain even more valuable. For which individuals do
not just invest more resources, but under extreme circumstances act “defensive, aggressive, and
irrational.” (Hobfall et. al, 2018, pg. 106). In alignment with COR theory it is safe to assume that
negotiating for leadership position also becomes an act of balancing, preserving and gaining
further resources that enhance negotiators chance of survival in the long run.
Interaction between EFLCNI/Non- EFLCNI, SV/OV, and Gender (male/female)
In leadership claiming and granting an obvious end outcome for the negotiator is to achieve
the desired leader's position. When individuals enter negotiation either with their gatekeepers or
supporters with EFLCNI, then SV for them serves as an insurance or commitment of upholding
the deal (Curhan & Brown, 2011). From COR we know individuals sustain and foster their
centrally valued resource. Under EFLCNI negotiators are also expected to adopt a more problem-
solving approach with lower aspiration (Patton and Balakrishnan, 2010), since they expect the
cooperativeness to be carried forward even in the future, leading to actual objective gains and a
win-win outcome for both parties. But when future interactions are not expected to be fair,
friendly, or cooperative then higher aspirations are met with efforts of resistance by the
counterpart, in order to protect individual resources. Individuals have to struggle to sustain and
foster the expectations of higher objective aspirations, eventually building up stress. Thus, we
propose this approach diminishes SV and OV for individuals post negotiation. Overall, we
propose that:
Proposition 1: When future interactions in leadership claiming are (or not) expected to be fair,
friendly and cooperative in nature, then both SV and OV of leadership claiming negotiation
enhances (or diminishes).
4
We also know highly aspirational competitive negotiators achieve their objective outcomes at
the expense of loss of future cooperation and likability (Lai et. al, 2013) as they are not bothered
about “post negotiation compliances” (Curhan et. al, 2010, pg. 704). But for women negotiation
literature points to how anticipated stress due to social-backlash expected for self-advocacy causes
them to become less competitive and more concession oriented (Amanatullah & Morris, 2010)
than when negotiating for others (like followers). In cases where women were forced to negotiate
assertively they lost more important resources than had they acted otherwise (Exley et. al, 2016).
And therefore, worried about post negotiation consequences even when women do negotiate
persistently they do so indirectly (Bowles & Flynn, 2010), or through “impression management
techniques” (Amanatullah & Morris, 2010, pg. 257).
Extrapolating COR theory “gain paradox principle” and “interaction effect” of social-
backlash, co-dependency on others, and concern for cyclical leadership claiming process, causes
women to consider SV outcomes (feelings about self, counterpart, process) as objectively more
important. Under Non-EFLCNI the fear of loss of SV as a resource (thereby also fear of loss of
OV or leadership position in future) is significantly higher than under EFLCNI for women, but
that is not the case for men due to absence of “interaction effect”. Therefore we propose that:
Proposition 2: For women, when they expect future leadership claiming negotiations to be fair,
friendly and cooperative then their SV increases more than that of men.
In EFLCNI a woman is aware of being evaluated for competence and capability, and not her
gender. Conversely in non-EFLCNI, when women are aware of being evaluated through a
"gendered lens" implying gender stereotypes (Bowles, 2013; Ely, Ibarra & Kolb, 2011 ) then it
leads to self-fulfilling prophecies (Bowles, 2013) leading to loss of leadership position as well as
SV. In alignment with COR fourth “desperation” principle due to severe loss of resources and no
sight of any gain of resources, women act in irrational and defensive ways of opting out of
leadership race, displaying concession behavior in negotiation or feeling relief at non-negotiation
of salary offer. Thus we propose that:
Proposition 3: For women, when they expect future leadership claiming negotiations not to be
fair, friendly and cooperative then both SV and OV decreases, and remains lesser than men.
As stated earlier under non-EFLCNI fear of resource loss propels relevance of resource gain
even higher. As a result, we know post negotiation OV and SV outcomes (feelings of
relationships, reputation or process) for women decreases more than men, and desire to gain these
resources while stemming its loss increases. In SV, “feelings for self/reputation” deserves special
relevance. Given that research shows us how women are inclined towards subjective satisfaction
more than objective satisfaction in career outcomes (Judge et. al, 1995), and that being satisfied
with subjective outcomes is a prescriptive stereotypical behavior that can lead to “identity-costs”
if women do not follow in-role behavior (Heilman 2001; Heilman & Okimoto, 2007). Under these
circumstances, for women triggers “desperation principle” and “resource loss cycle” of COR
theory, whereby the more women are dissatisfied by SV and OV outcomes post negotiation the
more they increase role-incongruities further imposing self-doubt, lower self-confidence, and her
resources spiral downwards increasing in momentum with each iteration leading finally to
desperation. Hence
5
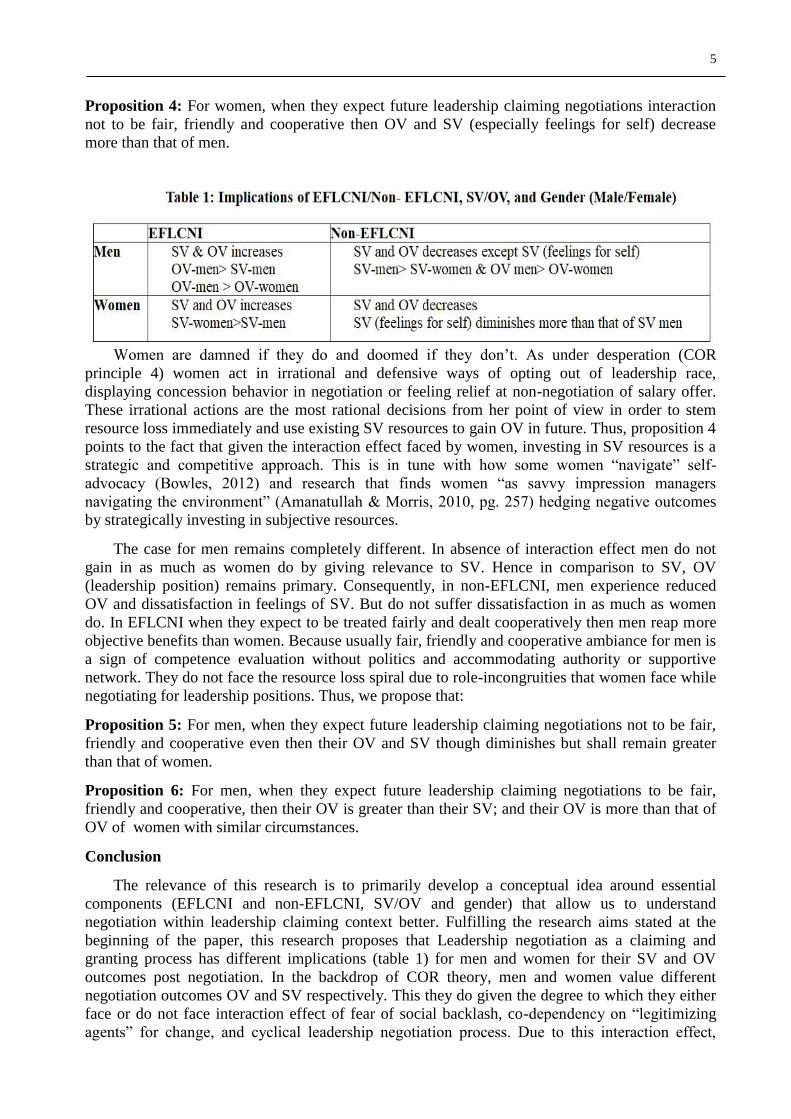
Proposition 4: For women, when they expect future leadership claiming negotiations interaction
not to be fair, friendly and cooperative then OV and SV (especially feelings for self) decrease
more than that of men.
Women are damned if they do and doomed if they don’t. As under desperation (COR
principle 4) women act in irrational and defensive ways of opting out of leadership race,
displaying concession behavior in negotiation or feeling relief at non-negotiation of salary offer.
These irrational actions are the most rational decisions from her point of view in order to stem
resource loss immediately and use existing SV resources to gain OV in future. Thus, proposition 4
points to the fact that given the interaction effect faced by women, investing in SV resources is a
strategic and competitive approach. This is in tune with how some women “navigate” self-
advocacy (Bowles, 2012) and research that finds women “as savvy impression managers
navigating the environment” (Amanatullah & Morris, 2010, pg. 257) hedging negative outcomes
by strategically investing in subjective resources.
The case for men remains completely different. In absence of interaction effect men do not
gain in as much as women do by giving relevance to SV. Hence in comparison to SV, OV
(leadership position) remains primary. Consequently, in non-EFLCNI, men experience reduced
OV and dissatisfaction in feelings of SV. But do not suffer dissatisfaction in as much as women
do. In EFLCNI when they expect to be treated fairly and dealt cooperatively then men reap more
objective benefits than women. Because usually fair, friendly and cooperative ambiance for men is
a sign of competence evaluation without politics and accommodating authority or supportive
network. They do not face the resource loss spiral due to role-incongruities that women face while
negotiating for leadership positions. Thus, we propose that:
Proposition 5: For men, when they expect future leadership claiming negotiations not to be fair,
friendly and cooperative even then their OV and SV though diminishes but shall remain greater
than that of women.
Proposition 6: For men, when they expect future leadership claiming negotiations to be fair,
friendly and cooperative, then their OV is greater than their SV; and their OV is more than that of
OV of women with similar circumstances.
Conclusion
The relevance of this research is to primarily develop a conceptual idea around essential
components (EFLCNI and non-EFLCNI, SV/OV and gender) that allow us to understand
negotiation within leadership claiming context better. Fulfilling the research aims stated at the
beginning of the paper, this research proposes that Leadership negotiation as a claiming and
granting process has different implications (table 1) for men and women for their SV and OV
outcomes post negotiation. In the backdrop of COR theory, men and women value different
negotiation outcomes OV and SV respectively. This they do given the degree to which they either
face or do not face interaction effect of fear of social backlash, co-dependency on “legitimizing
agents” for change, and cyclical leadership negotiation process. Due to this interaction effect,
6
women value SV outcomes more than men and use it as a strategic resource that enables them to
gain “objective value in negotiations” (Curhan et. al, 2010) in future over long time. From these
propositions, the research aims to add to negotiation and leadership literature by answering
Bowles (2012) call on how “quality of women’s relationships and reputations” allows women to
reach leadership position (Amanatullah & Morris, 2010). Thus, we are able to draw attention of
the researchers to the fact that given the realities of social backlash/negative expectancies in
negotiation process, choosing SV outcome is a strategic, competitive and rational approach for
women, and not because they are non-ambitious or non-competitive, emotional or relational in
nature.
References:
Amanatullah, E. T., & Morris, M. W. (2010). Negotiating gender roles: Gender differences in
assertive negotiating are mediated by women’s fear of backlash and attenuated when negotiating
on behalf of others. Journal of personality and social psychology, 98(2), 256.
Belkin, L. (2003), “Q: Why don’t more women choose to get to the top? A: They choose not to”,
New York Times Magazine, Vol.58, pp.42–47.
Bendersky, C., & McGinn, K. L. (2010). Perspective—open to negotiation: Phenomenological
assumptions and knowledge dissemination. Organization Science, 21(3)
Bowles, H. R. (2012). Claiming authority: How women explain their ascent to top business
leadership positions. Research in Organizational Behavior, 32, 189-212.
Bowles, H. R. (2013). Psychological perspectives on gender in negotiation. The Sage handbook
of gender and psychology, 465-483.
Curhan, J. R., & Brown, A. D. (2011). Parallel and Divergent Predictors of Objective and
Subjective Value in Negotiation. SSRN Electronic Journal.
Curhan, J. R., Elfenbein, H. A., & Eisenkraft, N. (2010). The objective value of subjective value:
A multi-round negotiation study. Journal of Applied Social Psychology, 40(3)
Curhan, J. R., Elfenbein, H. A., & Xu, H. (2006). What do people value when they negotiate?
Mapping the domain of subjective value in negotiation. Journal of personality and social
psychology, 91(3), 493.
DeRue, D. S., & Ashford, S. J. (2010). WHO WILL LEAD AND WHO WILL FOLLOW? A
SOCIAL PROCESS OF LEADERSHIP IDENTITY CONSTRUCTION IN ORGANIZATIONS.
Academy of Management Review, 35(4), 627-647.
Ely, R. J., Ibarra, H., & Kolb, D. M. (2011). Taking gender into account: Theory and design for
women's leadership development programs. Academy of Management Learning & Education,
10(3), 474-493.
Exley, C., Niederle, M., & Vesterlund, L. (2016). New research: Women who don’t negotiate
might have a good reason. Harvard Business Review.
Gino, F., Wilmuth, C. A., & Brooks, A. W. (2015). Compared to men, women view professional
advancement as equally attainable, but less desirable. Proceedings of the National Academy of
Sciences, 112(40), 12354-12359.
Heilman, M. E. & Okimoto, T. G. 2007. Why are women penalized for success at male tasks?
The implied communality deficit. Journal of Applied Psychology, 92: 81-92.
Heilman, M. E. 2001. Description and prescription: How gender stereotypes prevent women’s
ascent up the organizational ladder. Journal of Social Issues, 57: 657-674.
Hobfoll, S. E., Halbesleben, J., Neveu, J. P., & Westman, M. (2018). Conservation of resources in
the organizational context: The reality of resources and their consequences. Annual Review of
Organizational Psychology and Organizational Behavior, 5, 103-128.
Judge, T. A., Cable, D. M., Boudreau, J. W., & Bretz Jr, R. D. (1995). An empirical investigation
of the predictors of executive career success. Personnel psychology, 48(3)
Kesebir, S., Lee, S. Y., Elliot, A. J., & Pillutla, M. M. (2019). Lay beliefs about competition:
Scale development and gender differences. Motivation and Emotion, 43(5), 719-739.
Lai, L., Bowles, H. R., & Babcock, L. (2013). Social costs of setting high aspirations in
competitive negotiation. Negotiation and Conflict Management Research, 6(1), 1-12.

7
Patton, C., & Balakrishnan, P. S. (2010). The impact of expectation of future negotiation
interaction on bargaining processes and outcomes. Journal of Business Research, 63(8)
Roering, K. J., Slusher, E. A., & Schooler, R. D. (1975). Commitment to future interaction in
marketing transactions. Journal of Applied Psychology, 60(3), 386.
‘GREAT’ model of non-monetary levers to enhance employee engagement in
Indian software services industry
Swaminathan Mani1
Prof Mridula Mishra2
1Lovely Professional University, Phagwara, Punjab
2Mittal School of Business, Lovely Professional University, Phagwara, Punjab
Introduction
Indian software services (IT Services) companies have had spectacular growth over the past
three decades and have always been an employer of choice for the millions of people working in
this ector (NASSCOM, 2019). This sector has been the crown jewel for many decades– employing
over three million people (directly), and five times that number through indirect employment -
earning billions of dollars of revenue for these companies and precious foreign exchange for the
country. However, the employee engagement levels are dropping across sectors and across
countries including in Indian software services companies (Gallup, 2017). Literature shows that
highly engaged employees are critical to an organizational success. The Indian IT sector, which
was once famous for its liberal usage of monetary levers (high salaries, bonuses) are cutting costs
due to tough business environment. HR practitioners have to now use non-monetary levers, such
as job design and accelerated growth opportunities to keep their workforce engaged. However,
there has been limited research undertaken to study the impact of non-monetary levers to enhance
work engagement of Indian IT services employees. This study bridges the gap. The authors
identify 20 non-monetary variables, that can enhance employee engagement; collect data from 403
employees working in this sector, conduct factor analysis to reduce these 20 variables to five
factors – growth, renewal, enabling, aspirational and transparency levers – which forms the
acronym ‘GREAT’ – and used these factors as independent variables in a binary logistic
regression to predict their impact on employee engagement. All the five factors aided employee
engagement with three of them – growth, enabling and renewal levers – contributing significantly
Review of Literature
A highly engaged employee is a sine qua non to an organizational success (Authors, 2019)
with several additional benefits including increased productivity, lower employee turn-over and
reduced absenteeism (Authors, 2020). Kahn (1990) explained engagement across three dimensions
– Meaningfulness, safety and availability. Schaufeli & Bakker (2004) argued that engagement is
characterised by three levers of vigour, dedication and absorption. Engagement was thought to be
opposite state of burnout manifested by the core dimensions of exhaustion, cynicism and
inefficacy. However, Schaufeli & Bakker (2004) explained that employee engagement is much
more than the mere opposite end of the burnout spectrum. Another seminal work by Saks (2006)
identified the key antecedents (Job characteristics, perceived organizational support, perceived
supervisor support, rewards & recognition, procedural justice and distributive justice) and the
ensuing consequences (job satisfaction, organizational citizenship behaviour and intention to stay)
of employee engagement. Demerouti et al (2001) developed the Job-demands resources (JD-R)
Model which spoke of two categories – Job demands (Stressors) and resources (positive factors)
that have a bearing on burnout and performance. Bakker & Demerouti, (2014) highlighted the
need for renewal, on the need for work-life balance, (Ahuja, 2007) on the stress and burnouts of IT
services employees because of ‘boundaryless’ work environment, the criticality of career growth,
work-life balance, meaningful work, autonomy and learning opportunities (Ahuja, 2007). Factors
routinely used for studying employee engagement include meaningful work, autonomy, flexibility,
procedural justice, coaching accelerated career path, leadership, work environment, recognition
and rewards among others as per Authors (2020). Personal resources like optimism, resilience,
active coping style and self-efficacy have influence on employee engagement thereby reinforcing
the importance of personality traits and engagement (Xanthopoulou et al., 2009).
Research Methodology
Variables identified in the literature
The following 20 non-monetary variables (table 1) were found to predominantly appear in
literature survey and exploratory research.
Table 1: List of non-monetary variables identified from literature review and focus group
discussions
Variables Variables
Meaningful and purposeful work Brand
Flexible working arrangements Work-life balance
Appreciation /Recognition Co-worker relations
Work Environment Generous vacation policies
Accelerated career growth Fully funded training
Coaching Individual social responsibility (ISR)
Culture Feedback
Autonomy Procedural and distributive justice
CSR Sabbatical
Leadership Supervisor relations
Sampling, Sample size and Data collection
Stratified Random sampling was used in the study. The questionnaire was administered to 450
respondents. 403 entries were received that were complete in all respects. The reliability of the
instrument was found (Cronbach’s alpha) to be 0.846. Multivariate analysis, factor analysis (Data
reduction and underlying structure) and logistic regression (to develop a model) were used in the
study. Data was analysed using SPSS software to establish the relationship between dependant and
independent variables.
Factor analysis
Factor analysis was used to determine whether the 20 variables can be reduced to a smaller set
of factors and also to check the underlying structure of variables. Both Bartlett test and KMO give
the confidence to proceed with factor analysis as shown in Table 2.
Table 2: KMO and Bartlett test scores
KMO and Bartlett’s test
Kaiser-Meyer-Olkin (KMO) Measure of sampling adequacy
Bartlett test of sphericity Approx Chi square
df
Sig.
0.825
4252.252
190
0.000
The extraction method adopted was principal component analysis. The varimax rotation
distributes the variables evenly across the 5 factors. The variables that load on the five factors are
in table 3.
Table 3: Rotated component matrix with factor loadings
Rotated component matrix
Variable Component/Factors
1 2 3 4 5
Accelerated growth 0.854
Feedback 0.839
Training programs 0.808
Coaching 0.788
Meaningful work 0.773
Flexible work
arrangement
0.763
Appreciation 0.715
Autonomy 0.681
Work-life balance 0.639
Sabbatical 0.859
Vacation Policy 0.783
ISR 0.701
Brand 0.796
Culture 0.767
CSR 0.692
Leadership 0.637
Procedural and
distributive justice
0.860
Work environment
Co-worker relation
Supervisor relation
0.849
0.680
0.605
The five factors are named Growth lever (components that aids the employee to grow in the
job and also as a person – coaching, training programs. feedback and accelerated career path),
Renewal self (the components that help employee to recharge themselves including sabbatical,
generous vacation policies and ISR), Enabling self (having an enabling environment which
includes meaningful work, flexible working arrangement, appreciation, autonomy and work
environment), aspirational lever (that builds pride in the employee including brand, culture,
leadership and CSR) and transparency lever ( that provides transparency and fairness in dealing
like Procedural and distributive justice, co-worker relations, supervisor relations and work
environment) – which forms the acronym ‘GREAT’ as shown in Figure 1.
Hypothesis 1: Growth lever has positive impact on employee engagement
Four variables load on growth as shown in figure 1. They are accelerated career growth, fully
funded, tailored training programs, feedback and coaching.
Hypothesis 2: Renewal lever has positive impact on employee engagement
There are three variables that load on the renewal lever. They are sabbatical, generous
vacation policies and ISR/time off for Volunteering
Hypothesis 3: Enabling lever has positive impact on employee engagement
There are five variables that load on the enabling lever. They are meaningful and purposeful
work, flexible working arrangements, appreciation, autonomy and work environment.
Hypothesis 4: Aspirational lever has positive impact on employee engagement
There are four variables that load on the aspirational lever – brand, culture, leadership and
CSR.
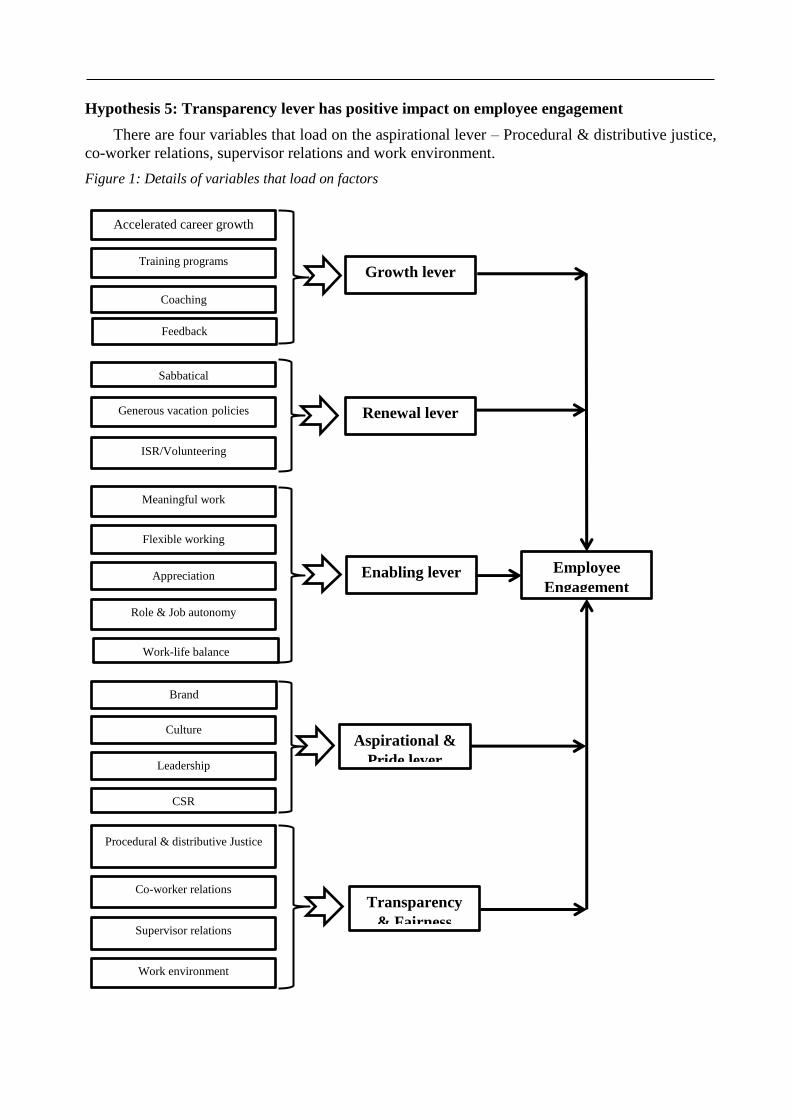
Hypothesis 5: Transparency lever has positive impact on employee engagement
There are four variables that load on the aspirational lever – Procedural & distributive justice,
co-worker relations, supervisor relations and work environment.
Figure 1: Details of variables that load on factors
Employee
Engagement
Role & Job autonomy
Meaningful work
Flexible working
arrangement Appreciation
Work-life balance
Sabbatical
Generous vacation policies
ISR/Volunteering
Training programs
Coaching
Accelerated career growth
Growth lever
Enabling lever
Renewal lever
Brand
Culture
Leadership
CSR
Aspirational &
Pride lever
Procedural & distributive Justice
Co-worker relations
Work environment
Transparency
& Fairness
Feedback
Supervisor relations
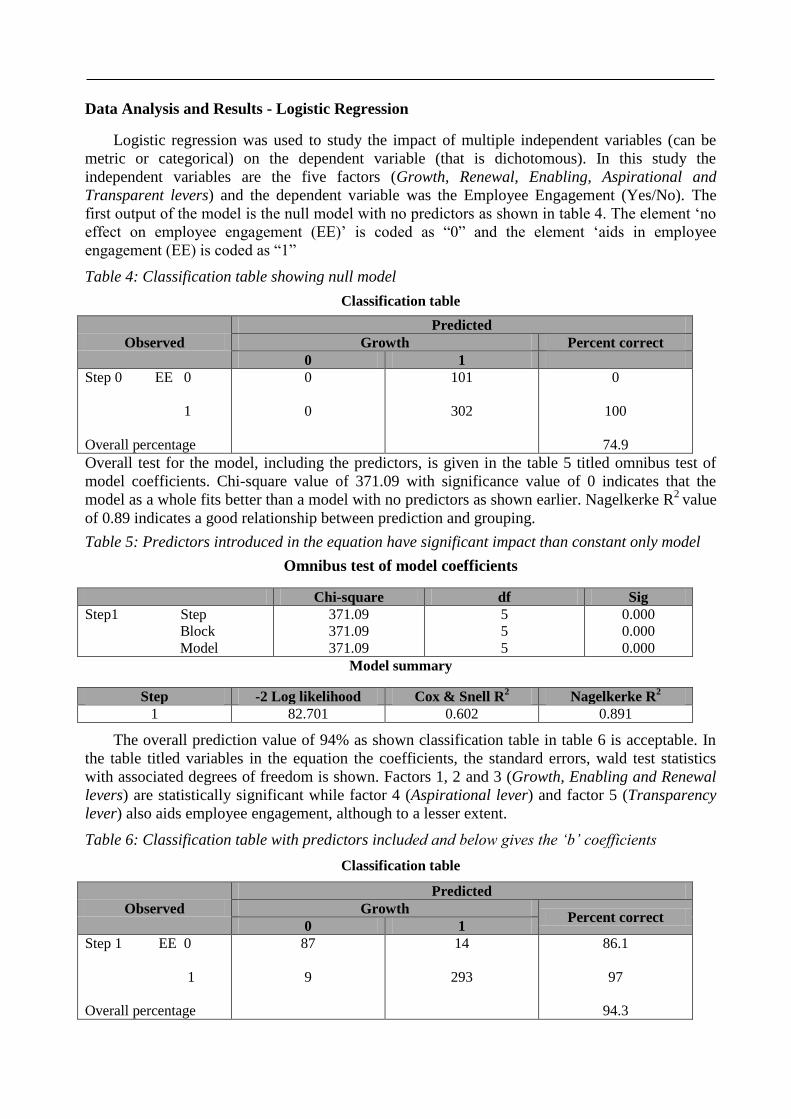
Data Analysis and Results - Logistic Regression
Logistic regression was used to study the impact of multiple independent variables (can be
metric or categorical) on the dependent variable (that is dichotomous). In this study the
independent variables are the five factors (Growth, Renewal, Enabling, Aspirational and
Transparent levers) and the dependent variable was the Employee Engagement (Yes/No). The
first output of the model is the null model with no predictors as shown in table 4. The element ‘no
effect on employee engagement (EE)’ is coded as “0” and the element ‘aids in employee
engagement (EE) is coded as “1”
Table 4: Classification table showing null model
Classification table
Observed
Predicted
Growth Percent correct
0 1
Step 0 EE 0
1
Overall percentage
0
0
101
302
0
100
74.9
Overall test for the model, including the predictors, is given in the table 5 titled omnibus test of
model coefficients. Chi-square value of 371.09 with significance value of 0 indicates that the
model as a whole fits better than a model with no predictors as shown earlier. Nagelkerke R2
value
of 0.89 indicates a good relationship between prediction and grouping.
Table 5: Predictors introduced in the equation have significant impact than constant only model
Omnibus test of model coefficients
Chi-square df Sig
Step1 Step
Block
Model
371.09
371.09
371.09
5
5
5
0.000
0.000
0.000
Model summary
Step -2 Log likelihood Cox & Snell R2 Nagelkerke R
2
1 82.701 0.602 0.891
The overall prediction value of 94% as shown classification table in table 6 is acceptable. In
the table titled variables in the equation the coefficients, the standard errors, wald test statistics
with associated degrees of freedom is shown. Factors 1, 2 and 3 (Growth, Enabling and Renewal
levers) are statistically significant while factor 4 (Aspirational lever) and factor 5 (Transparency
lever) also aids employee engagement, although to a lesser extent.
Table 6: Classification table with predictors included and below gives the ‘b’ coefficients
Classification table
Observed
Predicted
Growth Percent correct
0 1
Step 1 EE 0
1
Overall percentage
87
9
14
293
86.1
97
94.3
Variables in the equation
B SE Wald df Sig Exp(B)
Step 1a Growth
Enabling
Renewal
Aspirational
Transparency
Constant
2.551
3.654
1.380
0.898
0.847
3.376
0.434
0.474
0.448
0.289
0.317
0.485
34.532
59.504
9.510
9.656
7.147
48.522
1
1
1
1
1
1
0.000
0.000
0.002
0.002
0.008
0.000
12.826
38.614
3.975
2.456
2.332
29.265
Logistics regression equation for employee engagement in Indian software services
companies is given by
Log (p/1-p) = 3.376 + 2.551 F1 + 3.652 F2 + 1.380 F3 + 0.898 F4 + 0,847 F5
Log (p/1-p) = 3.376 + 2.551 Growth lever + 3.652 Enabling lever + 1.380 Renewal lever
+ 0.898 Aspirational lever + 0.847 Transparency lever
The probability that employee engagement can be enhanced is given by
e(3.376 + 2.551 F1 + 3.652 F2 + 1.380 F3 + 0.898 F4 + 0,847 F5)
/ 1+ (e(3.376 + 2.551 F1 + 3.652 F2 + 1.380 F3 + 0.898 F4 + 0,847 F5)
The results from the logistic regressions supports hypothesis 1, 2, 3, 4 and 5.
Discussions, managerial implications and limitations of the study
Our study has shown that while all the five levers have positive impact on employee
engagement, three of them (growth, renewal and enabling levers) have significant influence.
Statistically speaking, a one unit change in ‘growth lever’ has 2.5 times positive impact on
engagement, while ‘enabling lever’ has more than 3.6 times positive impact and ‘renewal lever’
has 1.3 times positive impact on employee engagement scores. In practical terms, this means that
companies and HR managers would see significant benefits by leveraging the underlying variables
of these three factors. It supports hypothesis 1, 2 and hypothesis 3. Aspirational lever and
transparency lever also contributes to employee engagement thereby supporting hypothesis 4 and
5 respectively. Engagement constructs have to be context specific to be meaningful. The priority
list of intervention needed to enhance engagement levels in companies have been shown by the
regression output. HR managers in Indian IT services companies who hitherto leveraged monetary
levers have, now, an empirically tested model of non-monetary levers available to enhance
employee engagement in their companies. The survey is a self-reported instrument and like all
self-reported instruments this too may suffer from personal biases. A cross sectional study like the
one conducted for this paper may suffer from ‘recency’ biases and is a snapshot at one point in
time. A longitudinal study conducted over a period of time will probably give more accurate
scores.
Conclusion
Indian software services companies will have to adopt non- monetary rewards to motivate
their workforce. There is also no consensus on the preferred ingredients of the basket of non-
financial levers for employees of this sector. This paper attempts to bridge that gap by identifying
20 non-monetary incentives, built a model of its constituents and identified five factors that can
positively impact employee engagement. These five factors - Growth lever, Renewal lever,
Enabling lever, Aspirational lever and Transparency lever (GREAT) model - can be used to
boost morale and create an engaged workforce in Indian IT services firms. These Indian IT firms
are synonymous with Brand India, globally and are country’s crown jewels. There is too much at
stake here.
References
1. Ahuja, M. K., Chudoba, K. M., Kacmar, C. J. 2007. IT road warriors: Balancing work-family conflict,
job autonomy, and work overload to mitigate turnover intentions, MIS Quarterly 31 (1): 1-17.
2. Bakker, A. & Demerouti, E. (2014). Job demands-resources theory. In P.Y. Chen & C.L. Cooper
(Eds.), Work and Wellbeing (Vol.3, pp. 37-64). Chichester, UK: Wiley- Blackwell.
3. International Journal of Stress Management, 21(1), 43–68. https://doi.org/10.1037/a0034508
4. Demerouti, E., Bakker, A. B., Nachreiner, F., & Schaufeli, W. B. (2001). The job demands-resources
model of burnout. Journal of Applied psychology, 86(3), 499
5. Gallup (2017), “The Worldwide Employee Engagement Crisis”, available at:
https://www.gallup.com/workplace/236495/worldwide-employee-engagement-
crisis.aspx?version=print (accessed February 2019)
6. Kahn, W. A. (1990). Psychological conditions of personal engagement and disengagement at work.
Academy of management journal, 33(4), 692-724
7. Authors (2019). Employee engagement – rest of the text masked for blind peer review
8. Authors (2020). Non-monetary – rest of the text masked for blind peer review
9. NASSCOM, https://www.nasscom.in Last accessed February 2019
10. Saks, A. M. (2006). Antecedents and consequences of employee engagement. Journal of Managerial
Psychology, 21(7), 600–619
11. Schaufeli, W. B., & Bakker, A. B. (2004). Job demands, job resources, and their relationship with
burnout and engagement: A multi‐sample study. Journal of Organizational Behavior: The International
Journal of Industrial, Occupational and Organizational Psychology and Behavior, 25(3), 293-315
12. Xanthopoulou, D., Bakker, A. B., Demerouti, E., & Schaufeli, W. B. (2009). Reciprocal relationships
between job resources, personal resources, and work engagement. Journal of Vocational
behavior, 74(3), 235-244.
An Empirical Investigation of the Job Satisfaction of Indian Expatriates: The
Mediating Role of Cultural Adjustment
Chhaya Mani Tripathi1
Dr Tripti Singh2
1&2 SMS, MNNIT Allahabad, Prayagraj
Abstract
The purpose of this study is to empirically examine the relationship between perceived organizational
support (POS), cultural adjustment, and job satisfaction. Structural equation modeling (SEM) was used to
test the hypothesized relationships. Using data collected from 220 Indian expatriates working in different
countries, we found that POS was significantly related to cultural adjustment and job satisfaction. Support
was also found for a partially mediated model where cultural adjustment partially mediated the relationship
between POS and job satisfaction.
Keywords: Indian expatriates, perceived organizational support, POS, job satisfaction, cross-cultural
adjustment.
Introduction
Internationalization has become a strategic business decision for organizations to thrive in a
highly competitive and volatile business environment. With MNCs relying heavily on expatriates
to fulfill their strategic goals, the role of expatriate management has become more critical than
ever (Riaz et al., 2014).
However, a significant body of research points to the high failure rate of these assignments
(Dowling, 2008), which leads to costly consequences not only for the expatriate but also for the
employing firm. Considering the expensive nature of these assignments, it becomes essential for
expatriates to perform well in their job in the host country. While the literature has a plethora of
studies on adjustment and performance of expatriates, relatively little attention has been paid to
job satisfaction, which happens to be a strong predictor of performance and retention of
expatriates (Bhaskar-Shrinivas et al., 2005). If an employee is satisfied with the job, he/she is
more likely to perform well and remain in the assignment, which contributes to the overall success
of the assignment. Therefore, it is imperative to understand what contributes to the job satisfaction
of employees on expatriate assignments. Perceived organizational support (POS), in this regard,
has been found to be positively related to the work attitude and well-being of employees (Bader,
2015). It has also been researched for its effect on adjustment, organizational commitment, and
employee turnover intentions on foreign assignments (Kraimer et al., 2001; Shaffer et al., 2001).
Hence, it would be worthwhile to study its impact on the job satisfaction of expatriates.
Hence, the purpose of this study is to empirically examine the role of POS in determining
adjustment and job satisfaction of expatriate employees. Our study contributes to expatriation
literature in several ways. Firstly, we add to the literature by testing the effect of POS on job
satisfaction through the mediating effect of cultural adjustment. Next to this, we apply
organizational support theory to explain how POS influences the expatriates’ job satisfaction.
Lastly, we test our model in the Indian context, a country that is a dominant source of expatriates
due to its large pool of skilled and English-speaking labor force (Vijayakumar and Cunningham,
2016).
The next section presents the theoretical background of our study and hypotheses
development. Figure 1 summarizes the hypothesized relationships.
Theoretical background and hypotheses development
Perceived organizational support (POS), cultural adjustment, and job satisfaction
Perceived organizational support (POS) is a core construct of organizational support theory
which posits that employees’ perception of supportive organizational climate leads to an increase
in overall well- being of employees, such as happiness, psychological adjustment, job satisfaction,
and self-realization (Kraimer et al., 2001). POS refers to the extent to which employees believe
that their organizations care about their general well-being and values their contribution in
achieving organizational goals (Eisenberger et al., 1986). Prior research indicates that employees
who have this feeling of care and support from their organizations tend to exhibit greater
citizenship behavior and are more committed to their organization (Rhoades et al., 2001).
Likewise, favorable and positive support from the organization is believed to enhance employees'
adjustment and job satisfaction. In particular, people with strong POS may be more adjusted to
cultural differences and can be expected to be contented and satisfied with their jobs. Based on
these arguments, we propose the following hypothesis:
H1. Perceived organizational support (POS) is positively related to expatriate cultural adjustment.
H2. Perceived organizational support (POS) is positively related to expatriate job satisfaction.
The mediating role of cultural adjustment
Being in a foreign nation, Expatriates tend to depend a lot on the receptivity of the host nation
society and the host workplace to become adjusted to the new culture and be effective at work
(Toh and DeNisi, 2007). Empirical studies have shown a positive relationship between POS and
expatriate adjustment (Kraimer et al., 2001). Not only this, but the adjustment has also been found
to be related to performance, withdrawal cognitions, organizational citizenship behavior, and
organizational commitment- all of which have been established as the consequence of job
satisfaction (Barakat et al., 2015). Hence, expatriate adjustment can be expected to be positively
related to job satisfaction as well. Additionally, the organizational theory suggests that help and
support will be available from the organization when needed to effectively carry out one's job and
deal with stressful situations (Kraimer and Wayne, 2004). Thus, it can be established that POS is
an incredibly valuable source of social support that helps expatriates adjust to the foreign culture,
which, in turn, facilitates an increase in job satisfaction. Based on the above discussion, the
following hypotheses are proposed:
H3. Cultural adjustment is positively related to expatriate job satisfaction.
H4. Cultural adjustment mediates the relationship between perceived organizational support
(POS) and expatriate job satisfaction.
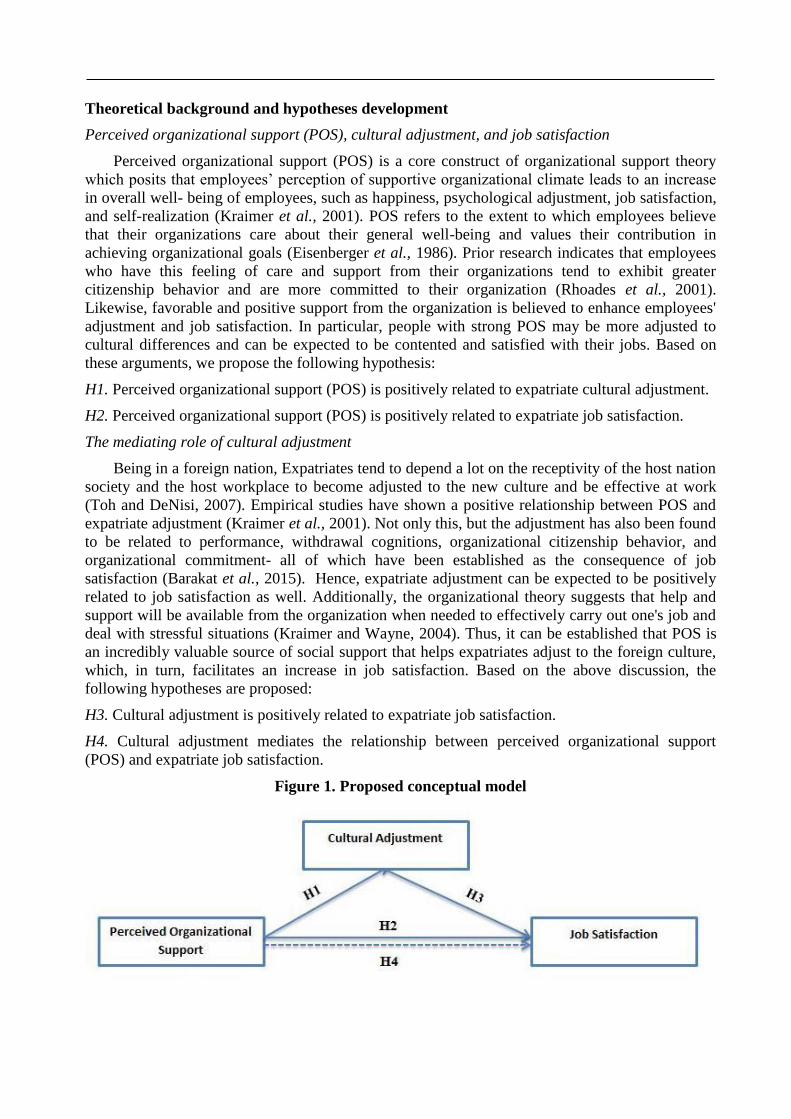
Figure 1. Proposed conceptual model
Methodology
Sample and procedure
The data for this study were collected through a structured questionnaire developed in
English. The participants were obtained through convenience and snowball sampling. Employees
who were currently on expatriate assignments were selected through multiple sources. Firstly,
email invitations were sent out to expatriates from the MBA program alumni list and researchers’
personal contacts, asking them to answer the questionnaire. Next, the respondents were asked to
send the questionnaire to expatriates from their personal contacts. Additional participation was
also solicited through online networks of expatriate associations and Facebook groups tailored to
expatriates. A total of 220 usable questionnaires were collected. Respondents were Indian
nationals expatriated to thirty-one countries. The majority of the sample consisted of male (73.6
%) lying between 30-40 years of age (48.6%). 61.8 % of the respondents were married, and 33.1%
had children. The respondents were working in a wide range of sectors (e.g., IT (45.9%), science
& technology (16.4%), education (5.5%), media & entertainment (1.8%), banking and financial
services (6.8%), and others (23.6%).
Measures
POS was measured using a four-item, five-point scale, adopted from Kraimer and Wayne
(2004). Respondents were asked to indicate their perceived support from the organization on a
scale ranging from 1= “strongly disagree” to 5= “strongly agree”. Sample item include: “I feel that
(company) cares about my career development”. Cultural adjustment was measured by a four-
item scale adopted from Black (1988). An item from the measure included “how adjusted are you
to the food in foreign?” A five-point scale ranging from 1 = “not adjusted at all” to 5 = “very well
adjusted” was used. Job satisfaction was measured using West et al.’s (1987) four-item post-
transition satisfaction scale. Expatriates rated their satisfaction from the job on a five-point scale
ranging from 1 = “strongly disagree” to 5 = “strongly agree”. Sample item is “I’m satisfied with
my work duties”.
Analysis and Results
We used two-stage procedures to test the theoretical framework (Anderson and Gerbing,
1988). The first stage involves testing the measurement models to assess the distinctiveness of the
measures. Therefore, confirmatory factor analysis (CFA) was performed to assess convergent and
discriminant validity. In the second stage, the structural model was tested to examine the
hypothesized relationships between the constructs. The descriptive statistics, i.e., means, standard
deviations, and correlations, are presented in Table1.
Measurement models
The measurement model was evaluated through CFA to check if the three measured variables
(i.e., perceived organizational support, cultural adjustment, and expatriate job satisfaction) were
distinct. The overall model fit was analyzed based on the chi-square (χ2) value and other global fit
indices like GFI (Goodness of Fit Index), AGFI (Adjusted Goodness of Fit Index), RMR (Root
Mean squared Error), RMSEA (Root Mean Square Error of Approximation), CFI (Comparative
Fit Index), and TLI (Tucker Lewis Index). The χ2
/degree of freedom (CMIN / df) of 2.36, and the
goodness-of-fit indices (GFI= 0.91; AGFI= 0.87, RMR= 0.03; RMSEA = 0.07; CFI = 0.94; TLI =
0.93) indicate that the values are within the prescribed limit and the data adequately fit the model
(Byrne, 2001; Cheng, 2007). Furthermore, convergent validity has been established as the
variance explained by each construct is greater than 0.50 and the composite reliability for each
construct is also greater than 0.70 (Hair et al., 2010). Additionally, the average variance explained
(AVE) of constructs being greater than the maximum shared variance (MSV) establishes the
discriminant validity (Hair et al., 2010). For reliability, we have used Cronbach’s α as the measure
of internal consistency. In the present study, α value greater than 0.80 for all constructs indicates
good reliability (Nunnally, 1978). Table 2 presents measures for validity and reliability analysis.
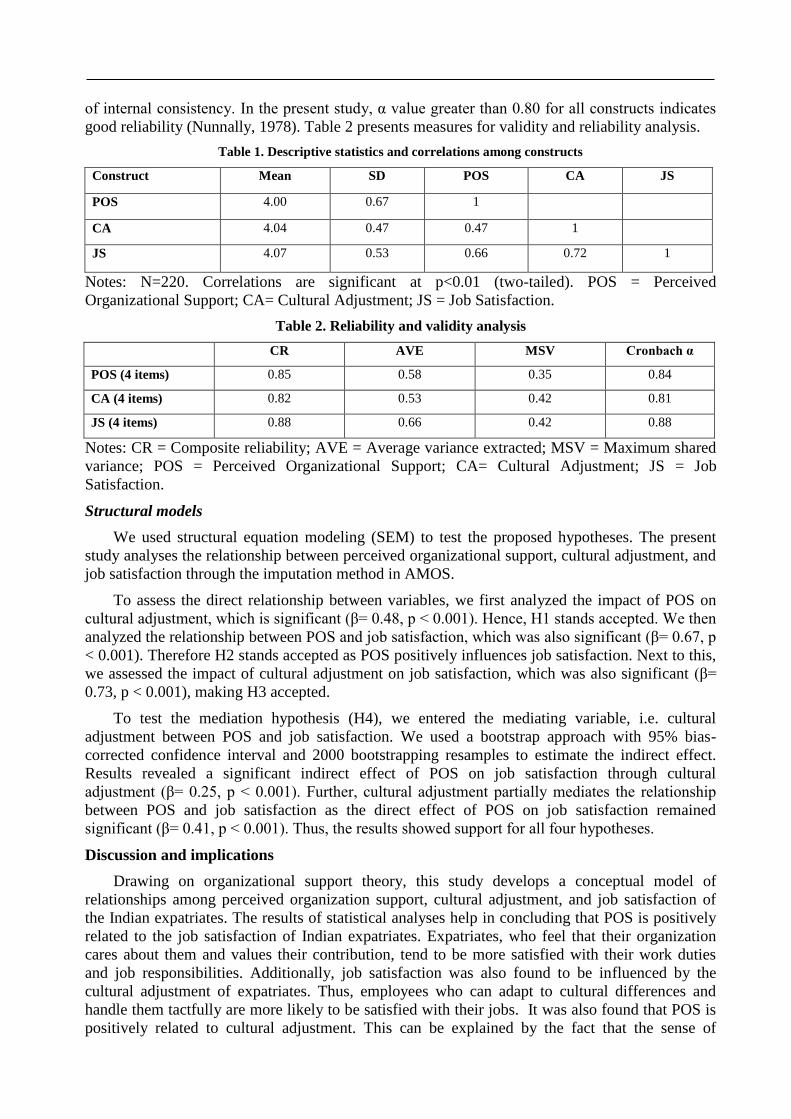
Table 1. Descriptive statistics and correlations among constructs
Construct Mean SD POS CA JS
POS 4.00 0.67 1
CA 4.04 0.47 0.47 1
JS 4.07 0.53 0.66 0.72 1
Notes: N=220. Correlations are significant at p<0.01 (two-tailed). POS = Perceived
Organizational Support; CA= Cultural Adjustment; JS = Job Satisfaction.
Table 2. Reliability and validity analysis
CR AVE MSV Cronbach α
POS (4 items) 0.85 0.58 0.35 0.84
CA (4 items) 0.82 0.53 0.42 0.81
JS (4 items) 0.88 0.66 0.42 0.88
Notes: CR = Composite reliability; AVE = Average variance extracted; MSV = Maximum shared
variance; POS = Perceived Organizational Support; CA= Cultural Adjustment; JS = Job
Satisfaction.
Structural models
We used structural equation modeling (SEM) to test the proposed hypotheses. The present
study analyses the relationship between perceived organizational support, cultural adjustment, and
job satisfaction through the imputation method in AMOS.
To assess the direct relationship between variables, we first analyzed the impact of POS on
cultural adjustment, which is significant (β= 0.48, p < 0.001). Hence, H1 stands accepted. We then
analyzed the relationship between POS and job satisfaction, which was also significant (β= 0.67, p
< 0.001). Therefore H2 stands accepted as POS positively influences job satisfaction. Next to this,
we assessed the impact of cultural adjustment on job satisfaction, which was also significant (β=
0.73, p < 0.001), making H3 accepted.
To test the mediation hypothesis (H4), we entered the mediating variable, i.e. cultural
adjustment between POS and job satisfaction. We used a bootstrap approach with 95% bias-
corrected confidence interval and 2000 bootstrapping resamples to estimate the indirect effect.
Results revealed a significant indirect effect of POS on job satisfaction through cultural
adjustment (β= 0.25, p < 0.001). Further, cultural adjustment partially mediates the relationship
between POS and job satisfaction as the direct effect of POS on job satisfaction remained
significant (β= 0.41, p < 0.001). Thus, the results showed support for all four hypotheses.
Discussion and implications
Drawing on organizational support theory, this study develops a conceptual model of
relationships among perceived organization support, cultural adjustment, and job satisfaction of
the Indian expatriates. The results of statistical analyses help in concluding that POS is positively
related to the job satisfaction of Indian expatriates. Expatriates, who feel that their organization
cares about them and values their contribution, tend to be more satisfied with their work duties
and job responsibilities. Additionally, job satisfaction was also found to be influenced by the
cultural adjustment of expatriates. Thus, employees who can adapt to cultural differences and
handle them tactfully are more likely to be satisfied with their jobs. It was also found that POS is
positively related to cultural adjustment. This can be explained by the fact that the sense of
support from the organization helps expatriates deal with the adjustment difficulties in the host
country. This helps expatriates acclimatize to the host nation society and workplace because they
believe that help will be available from the organization if they need anything or find anything
difficult. This study also checked the indirect effect of POS on job satisfaction through the
mediating effect of cultural adjustment. Support was found for partial mediation of cultural
adjustment on the relationship between POS and job satisfaction.
The results of inferential statistics helped us suggest various practical implications that can
help organizations achieve successful cross-cultural assignments. The positive association
between POS, cultural adjustment, and job satisfaction suggests that organizations should work on
strengthening the relationships with expatriating managers so that they are able to adjust well to
the host country and contribute to the success of assignment. This support should come from both
the parent country organization and the subsidiary. Also, help and support should be extended to
the families of expatriating managers to make them comfortable in handling the logistical issues,
such as housing, transportation, schooling of kids, spousal employment. This may help expatriates
overcome the stress and anxiety experienced during the adjustment phase and focus more on their
job responsibilities.
Limitations and directions for future research
The study has certain limitations that might affect its contributions. However, at the same
time, these limitations provide venues for future research. Firstly, our study sample consisted of
Indian expatriates only, which may prevent the generalization of results to other settings.
However, it would be interesting to see if the proposed model could be applied to expatriates of
different nationalities. Secondly, the study has involved only one outcome variable, i.e., job
satisfaction. Further studies on POS could involve other criterion variables such as performance,
organizational commitment, and withdrawal cognitions. Finally, the use of self-reported measures
in the study may increase the possibility of common method bias. Hence, it is suggested that
future researchers should include assessments from multiple sources, such as superiors,
subordinates, and peers.
References
1. Anderson, J. and Gerbing, D.W. (1988), “Some methods for re-specifying measurement models to
obtain uni-dimensional construct measurement”, Journal of Marketing Research, Vol. 19 No. 4,
pp. 453-460.
2. Bader, B. (2015), “The power of support in high-risk countries: Compensation and social support
as antecedents of expatriate work attitudes”, International Journal of Human Resource
Management, Vol. 26 No. 13, pp. 1712-1736.
3. Barakat, L. L., Lorenz, M. P., Ramsey, J. R. and Cretoiu, S. L. (2015), “Global managers: An
analysis of the impact of cultural intelligence on job satisfaction and performance”, International
Journal of Emerging Markets, Vol. 10 No. 4, pp. 781-800.
4. Bhaskar-Shrinivas, P., Harrison, D.A., Shaffer, M.A. and Luk, D.M. (2005), “Input-based and
time-based models of international adjustment: Meta-analytic evidence and theoretical extensions”,
Academy of management Journal, Vol. 48 No. 2, pp. 257-281.
5. Black, J.S. (1988), “Work role transitions: A study of American expatriate managers in
Japan”, Journal of international business studies, Vol. 19, No. 2, pp. 277-294.
6. Byrne, B.M. (2001), Structural Equation Modeling with Amos: Basic Concepts, Applications and
Programming, Laurence Erlbaum Associates, Mahwah, NJ and London.
7. Cheng, E.W.L. (2007), “SEM being more effective than multiple regression in parsimonious model
testing for management development research”, Journal of Management Development, Vol. 20 No.
7, pp. 650-667.
8. Dowling, P. (2008), International human resource management: Managing people in a
multinational context, Cengage Learning.
9. Eisenberger, R., Huntington, R., Hutchison, S. and Sowa, D. (1986), “Perceived organizational
support”, Journal of Applied psychology, Vol. 71 No. 3, pp. 500-507.
10. Hair, J. F., Anderson, R. E., Babin, B. J. and Black, W. C. (2010), Multivariate data analysis: A
global perspectives, Vol. 7, Pearson, Upper Saddle River, NJ.
11. Kraimer, M. L. and Wayne, S. J. (2004), “An examination of perceived organizational support as a
multidimensional construct in the context of an expatriate assignment”, Journal of
management, Vol. 30 No. 2, pp. 209-237.
12. Kraimer, M.L., Wayne, S.J. and Jaworski, R.A.A. (2001), “Sources of support and expatriate
performance: The mediating role of expatriate adjustment”, Personnel Psychology, Vol. 54 No. 1,
pp. 71-99.
13. Nunnally, J.C. (1978), Psychometric Theory, New York: McGraw-Hill.
14. Rhoades, L., Eisenberger, R. and Armeli, S. (2001), “Affective commitment to the organization:
The contribution of perceived organizational support”, Journal of applied psychology, Vol. 86 No.
5, pp. 825-836.
15. Riaz, S., Rowe, W.G. and Beamish, P.W. (2014), “Expatriate-deployment levels and subsidiary
growth: a temporal analysis”, Journal of World Business, Vol. 49 No. 1, pp. 1-11.
16. Shaffer, M. A., Harrison, D. A., Gilley, K. M. and Luk, D. M. (2001), “Struggling for balance amid
turbulence on international assignments: Work–family conflict, support, and commitment”,
Journal of Management, Vol. 27 No. 1, pp. 99–121.
17. Toh, S. M. and DeNisi, A. S. (2007), “Host country nationals as socializing agents: A social
identity approach”, Journal of Organizational Behavior, Vol. 28 No. 3, pp. 281–301.
18. Vijayakumar, P. B. and Cunningham, C. J. (2016), “Cross-cultural adjustment and expatriation
motives among Indian expatriates”, Journal of Global Mobility: The Home of Expatriate
Management Research, Vol. 4 No. 3, pp. 326-344.
19. West, M. A., Nicholson, N. and Rees, A. (1987), “Transitions into newly created jobs”, Journal of
Occupational Psychology, Vol. 60 No. 2, pp. 97-113.
Organizational Citizenship Behaviour: Evidence from the Indian Armed
Forces and Call for Discussion on a Broader Definition
Awanish Kumar Chaudhary1
1 Indian Institute of Management Lucknow
Abstract
Correct understanding of Organizational Citizenship Behaviour (OCB) plays a key role in developing and
nurturing OCBs, which helps improve the efficiency and effectiveness of organizations. OCB is a
phenomenon deeply embedded in culture: what comprises OCB would vary across cultures or contexts.
Hence, it is important to contextualize theories pertaining to OCB. A ground-up study on OCB in the
context of the Indian Armed Forces has indicated the need to review the definition, dimensions and related
theories of OCB, as applicable in the Indian context. The study suggests the need for a broader definition of
OCB (in line with the definition suggested by Organ in the year 1997) and inclusion of additional
dimensions which have typically been kept outside the purview of OCBs (like ‘Diligence and Professional
Competence’ and ‘Leadership’), in order to reflect the correct understanding of OCB for the Indian context.
Keywords: Organizational Citizenship Behaviour, Good Soldiers, Indian Armed Forces
Introduction
The term ‘Organizational Citizenship Behaviour’ (OCB) was coined by Prof. Dennis W
Organ, from Indiana University in USA, in his paper entitled “Job Satisfaction and the Good
Soldier: The Relationship between Affect and Employee”, published in The Academy of
Management Journal, in the year 1983 (Bateman, & Organ, 1983). The term good ‘Good Soldier’
has been used in the Organizational Theory literature to refer to individuals who display high
levels of OCB.
Prof Organ’s work drew tremendous interest amongst scholars, leading to proliferation of
research on OCB. However, scholars have often differed in their conceptualization of OCB. Off
late, it has been agreed that OCB is a phenomenon deeply embedded in culture – what comprises
OCB would vary across cultures or contexts. An indigenous, ground-up study on OCB in the
context of the Indian Armed Forces, as discussed in this paper, suggests the need to re-discuss the
definition (and the dimensions) of OCB, in favour of a wider definition.
Literature Review
Literature review suggests that concepts which underlie OCB have been recognized by
scholars much before than the term ‘OCB’ was coined: Barnard (1938), Roethlisberger & Dickson
(1939) and Katz & Kahn (1966) had already spoken of concepts like informal systems in
organizations, spontaneous contributions etc. However, the subject drew tremendous response
from researchers after the year 1983, when Prof Organ published his seminal work on OCB
(Bateman, & Organ, 1983). Till 2016, close to 2500 papers have been published on OCB
(Martinez, & Podsakoff, 2016); but scholars have conceptualized OCB in a number of different
ways (Bateman, & Organ, 1983; Organ, 1988; Organ, 1997; Organ, Podsakoff, & MacKenzie,
2006; Organ, 2017; Williams & Anderson,1991). There is little congruence amongst researchers
regarding concepts and model for OCB (Yen et al., 2008; Khan et al., 2017).
Issues: Definition of OCB
The definitions of OCB have been debated and vary greatly among scholars (Ball, 2013).
In Organizational and Behavioral Sciences it is not uncommon to have differing views amongst
scholars, but in the case of OCB, the differences were incisive and Prof Organ – ‘the father of
OCB’ had to change the definition of OCB on multiple occasions (Organ, 1988, 1997; Organ et
al., 2006).
The most widely accepted definition of OCB, published in Organ’s textbook in 2006, is:
“Individual behavior that is discretionary, not directly or explicitly recognized by formal reward
system, and that in the aggregate promotes efficient & effective functioning of the organization”
(Organ et al., 2006). Interestingly, Organ himself had questioned this definition way back in 1997
in these strong words: “Accumulated empirical evidence, some telling criticisms, & even the most
cursory glance at the business press compel us to rethink the defining character of OCB. It no
longer seems fruitful to regard OCB as extra role, beyond the job, or unrewarded by the formal
system.” Even while formalizing this definition in 2006, Organ mentioned in his book, “In truth
the way we should define OCB is not crystal clear” (Organ et al., 2006, pp 36).
Issues: Dimensions of OCB
As per Podsakoff et al. (2013), even though researchers have suggested that there are at least
two primary second-order dimensions of OCB, but there is disagreement amongst them on what
those dimensions are. LePine et al. (2002) identified over 40 measures of behaviors that had been
qualified as OCBs in the available literature. The seven most widely recognized dimensions of
OCB as proposed by Organ et al. (2006) are: helping behaviour, sportsmanship, organizational
loyalty, organizational compliance, individual initiative, civic virtue and self-development.
Whether presence of all dimensions is necessary for considering manifestation of OCB, or
whether presence of few dimensions and absence of balance dimensions would also be considered
as manifestation of OCB is an open question. OCB and CWB (Counter-productive Work
Behaviour) are affect-driven phenomena that exhibit considerable within-person variation (Dalal
et al., 2009). Thus there is a possibility of same person showing OCB and CWB simultaneously.
Can we conclude that a person is a ‘Good Soldier’ or an ‘Organizational Citizen’ if he displays
certain OCBs, and doesn’t display the others, or worse - shows deviant behavior in some other
cases?
Whether OCB is an Aggregate Construct or a Superordinate Construct is a question that has
not been answered conclusively by researchers (Rosen et al., 2018; Podsakoff et al., 2018).
Whether the various dimensions of OCB are to be looked separately and in isolation with each
other, or whether the different dimensions can be aggregated together to assess the overall OCB
profile of an employee, is an important issue which needs to be answered. The present
classification of dimensions of OCB helps in identifying whether a particular behavior can be seen
as OCB or not, however there is nothing much to suggest as to when can a person be identified as
a ‘Good Soldier’ or an ‘Organizational Citizen’. Another question that needs to be answered is
that whether OCBs are only about ‘behavior’, or are they about the underlying ‘feelings’ and
‘emotions’ as well?
To summarize, considerable differences and open issues exist regarding the dimensions of
OCB – right from what the dimensions are, to whether OCB is an Aggregate construct or a
Superordinate construct, and whether OCBs include the underlying feelings and emotions as well.
Reason for Differences on Theories Pertaining to OCB: Context and Culture
Scholars have acknowledged that the context in which an organization operates is likely to
impact even the basic understanding of OCB (Paine, & Organ, 2000; Podsakoff et al., 2018).
Scholars have agreed that most concepts related with OCB, which have been theorized in the
western context, may not be applied across different cultures/ context in the same form (Chen et
al., 2011; Gupta, & Singh, 2012; Wang, 2016).
Need for Context Based Ground-Up Studies on OCB
Ideally OCB study should start ‘ground-up’ in a different culture (Organ et al., 2006, pp 38).
Literature Review suggests that for correct understanding of OCB, contextualized, ground-up
study on OCB is necessary. To the best of our knowledge, very few studies have been undertaken
in Indian contexts with the aim of indigenous theory development on OCB - using ground-up
approach and qualitative techniques.
Grounded Theory Research on OCB in the Context of the Indian Armed Forces
A Grounded Theory research was conducted (Jul 2018 – Oct 2019) to study how OCB is
understood and perceived in the context of the Indian Armed Forces. The Indian Armed Forces
are the largest employers of the country, with over 15 Lakh employees, having pan India presence.
They have a strong value system which lays emphasis on aspects like loyalty, organizational
compliance, ‘esprit de corps’, ‘service before self’, etc – which are reflective of OCB. There is
need to study OCB in the context of the Armed Forces also because with changing societal values
in the macro Indian culture, there is pressure to change and adapt on the time tested culture,
traditions and values of the Armed Forces as well, some of which have conventionally been
perceived as pivotal to aspects related with OCB in the organization.
Data collection and analysis was undertaken using Charmaz’s constructivist grounded theory
methodology, wherein one group discussion and 19 in-depth interviews were conducted – with
participation of a total of 23 officers of the Indian Army, Indian Navy, Indian Air Force and the
Indian Coast Guard, belonging to different cadres and having rich field and staff experience.
Findings
Participating officers came up with 56 different stories of ‘Good Soldiers’, bringing out
various facets of OCB in the Armed Forces. Analysis revealed that ‘Good Soldiers’ can have
many different qualities, and they contribute to the organization in many different ways.
Definition of OCB
OCBs Are Not Discretionary. An important finding regarding the definition of OCB is
that: In the Armed Forces, OCBs are not discretionary. Almost all the interviewees made very
strong statements like, “…for a soldier the first and the foremost thing is loyalty,” “a soldier
should be loyal, a soldier should be honest, dedicated to duties...These are lacking in you then you
better don't be in this system.” OCBs emerged as a basic aspect of soldiering, and the core part of
the value system and culture of the organization.
OCBs Are Rewarded. It also emerged that OCBs do get recognized and rewarded in the
Armed Forces. While sharing the motivating factors for the ‘Good Soldiers’ of their stories, some
interviewees mentioned that these ‘Good Soldiers’ were getting rewarded regularly. In fact, there
is a formal mechanism to reward OCBs in the Armed Forces, and that apart, OCBs usually
become the differentiating factors for most rewards and appraisals. If OCBs are not getting
registered, it only reflects disconnected leadership. Connected leaders register OCBs, and reward
it – any which way.
Good Soldiers ‘Contribute’ to Teams and Organization. The study revealed that while
there can be many good qualities that may define a good soldier, but no single soldier can have all
the good qualities – in fact most employees have one or the other shortcoming. The common
theme that emerged across the interviews was that - despite whatever shortcomings that they may
have, good soldiers contribute to their teams and the organization - they compensate for their
shortcomings by performing in other areas, and ensure that they are not a liability, and that their
net contribution to the team and the organization is positive.
Interviewees gave examples of soldiers, who proved themselves as assets despite lacking on
more than a few fronts. For example, a sailor was on leave when a big militant attack happened in
a northern state. Anticipating correctly that the ship would sail out for operational deployment, he
reported back to duty on his own, paying expensive airfare. The interviewee remembered him as a
‘Good Soldier’ – even though he was an average performer, because he had contributed by his
attitude – his act had a positive psychological impact on everyone. The interviewee believed that,
if ever the ship’s gun was to misfire, then this sailor had the mettle to risk his life - to remove the
live shell from ship’s deck, for saving the ship. Only by his attitude, he was an immense asset.
Apt Definition for OCB. Based on study, it was apparent that the present definition of OCB –
which suggests that OCBs are discretionary, or not recognized by formal reward system, may not
be tenable. The study suggested that the definition of OCB should be broad – to cater for many
different ways ‘Good Soldiers’ contribute to their teams and organization - the definition should
hinge on contributions made by ‘Good Soldiers’. Accordingly, the definition of OCB proposed by
Organ (1997) is recommended as the apt definition of OCB in the context of the Indian Armed
Forces: “OCB refers to contributions to the maintenance and enhancements of the social and
psychological context that supports task performance.”
Dimensions of OCB
This study revealed over 40 categories related to dimensions of OCB, which mapped with the
seven most widely recognized dimensions of OCB discussed earlier. For example, an interviewee
remembered a ‘Good Soldier’, who had cut his leg in an accident during the operation of loading
armoured vehicles on trains, “…he had cut his leg…I told - just send him to hospital right away
but he said, Sir I will not move from here till the time the last vehicle is loaded.” Coding and
theoretical analysis mapped this behavior of the protagonist to OCB dimensions of Organizational
Compliance, Loyalty and Sportsmanship. Another interviewee remembered another good soldier:
“In this exercise when we had shortage of water, he was the one who suggested we will clean our
plates with sand...”; theoretical analysis mapped this to OCB dimensions of Sportsmanship and
Initiative.
New Insights. Apart from confirming the seven dimensions of OCB, this study led to new
insights, as mentioned below.
New Dimensions of OCB. Existing literature limits OCB to non-formal activities and doesn’t
recognize undertaking formal duties with ‘Diligence and Professional Competence’ as a type of
OCB. With a broader understanding of OCB as suggested by this study, undertaking formal duties
with ‘Diligence and Professional Competence’ was also identified as a new dimension of OCB,
which has tremendous positive effect on social and psychological context of organizations. Also,
studies on OCB have traditionally focused on lower level employees, and not emphasized on
leadership as a dimension of OCB. This study revealed importance of leadership across all levels
in the organization, and suggested ‘Leadership’ as another new dimension of OCB. All
interviewees emphasized upon ‘Leadership’ and ‘Diligence and Professional Competence’ as
important qualities of ‘Good Soldiers’.
Most Important Dimensions of OCB. ‘Loyalty’ and ‘Passion with Positive Attitude’ emerged
as the most significant qualities of ‘Good Soldiers’, as interviewees suggested that those who have
these can be guided to develop other dimensions of OCB.
OCBs Include the Underlying Feelings. It also emerged that OCBs are not just about the visible
behavior or actions, but OCBs also include the feelings and intentions underlying those actions -
which get exposed quickly in the eyes of discerning leaders, and eventually in everyone’s eyes.
Discussion
Definition
The finding from the context of the Indian Armed Forces, which suggests that the definition
of OCB should hinge around ‘contributions’ made by Good Soldiers, is consistent with the works
of scholars like Barnard (1938), Roethlisberger & Dickson (1939), Katz (1964), Katz & Kahn
(1966) or Podsakoff (2013), where emphasis on the keyword ‘contribution’ can be seen. Barnard
argued, “it is clear that the willingness of persons to contribute efforts to the cooperative system is
indispensible” (Barnard, 1938, pp 84). Roethlisberger & Dickson’s (1939) details on the
Hawthorne studies referred to sentiments within the informal organization which contribute to the
functioning of the formal system. Katz & Kahn (1966) referred to spontaneous contributions not
explicit in job descriptions or managerial directives, while conceptualizing organizations as open
systems. Podsakoff (2013) has argued on the advantages of the definition of OCB given by Organ
in 1997 (which has been recommended as the most apt definition of OCB in this study). It is a
broad definition with wider applicability, which doesn’t limit OCBs to behaviours not rewarded or
tasks not a part of formal role.
‘Diligence and Professional Competence’ as Dimension of OCB
Even though scholars have spoken of including the elements of job dedication related more
directly to the task as a dimensions of OCB in the past as well (e.g., Coleman, & Borman, 2000;
Scotter, & Motowidlo,1996), however this did not gain sufficient traction over the years. As a
result, existing literature limits OCBs to non-formal, non-task related activities and doesn’t
recognize undertaking formal duties with ‘Diligence and Professional Competence’ as a type of
OCB. With a much broader understanding of OCB as suggested by this study, doing formal duties
with ‘Diligence and Professional Competence in formal tasks’ was also identified as a new
dimension of OCB, which has tremendous positive effect on social and psychological context of
organizations. In fact undertaking of routine duties (and Diligence and Professional Competence
in formal tasks) should not be taken for granted. Positive contribution to the organization by way
of Diligence and Professional Competence in formal tasks would definitely be a manifestation of
OCB - by his Diligence and Professional Competence, not only an individual contributes to the
organization directly and formally on his own, but indirectly and informally as well - by impacting
the social and psychological context in a positive manner – by inspiring, motivating and training
others. Initial definition of OCB (Bateman, & Organ 1983; Smith, Organ, & Near 1983; Emily et
al., 2013) talked of OCBs as ‘above and beyond the routine duties’, which implies that OCBs are
‘over and above’ routine duties, and perhaps without routine duties OCBs may not count at all.
This premise also suggests that OCBs do encompass routine duties as well, and hence Diligence
and Professional Competence in undertaking routine or formal duties should count as a dimension
of OCB.
Leadership as Dimension of OCB
Studies on OCB have traditionally focused on lower level employees, and not emphasized on
leadership as an independent dimension of OCB. Amongst the most widely recognized
dimensions of OCB suggested by Podsakoff (2000), ‘individual initiative’ relates closely with
leadership. Similarly, ‘voice’ as dimension of OCB suggested by few scholars (LePine, & Van
Dyne, 1998, 2001) also reflects aspects of leadership. However leadership is a much broader
construct, encompassing many other qualities as well. This study revealed importance of
leadership across all levels in an organization – so much so that it is suggested that ‘Leadership’
be recognized as an independent dimension of OCB. Leadership is about all such things which
relate directly with OCB – whether it is about performing ‘above and beyond’ routine duties, or
about ‘Contributions to the maintenance and enhancements of the social and psychological context
that supports task performance’.
Most Significant Dimensions of OCB
This research work has also brought out that while all OCBs are desirable, but some forms of
OCBs are more desirable than others. Depending on context, preference that managers/ officers
and leaders place on various forms (manifestations) of OCB may vary. In this research work it has
clearly emerged that in the context of the Indian Armed Forces, ‘Loyalty’ and ‘Passion with
Positive Attitude’ emerged as the most significant qualities of ‘Good Soldiers’, as those who have
these, can be guided to develop other dimensions of OCB.
Loyalty as an Attitude
This study also revealed a broader understanding of Organizational Loyalty – Loyalty extends
not only to the organization, but also to superiors, colleagues and subordinates. As the context of
research in this study were the Indian Armed Forces, where personnel are transferred every two to
three years - resulting in frequent change in the set of superiors, colleagues and subordinates, yet
most personnel display loyalty so it can be inferred that loyalty is not related to tenure. Loyalty is
more an attitudinal variable, which would continue if antecedents exist, despite change in the set
of superiors, colleagues and subordinates (or the organization itself).
No Case for OCBs with Ulterior Motives
Few researchers have suggested that employees can indulge in OCBs with ulterior or self-
serving motives as well (Spector, 2013; Taber, & Deosthali, 2014). However, this study revealed
that the real feelings and real intentions underlying the behaviour and actions of an employee are
more important, which get exposed quickly in the eyes of discerning leaders, and eventually in
everyone’s eyes. This is consistent with observations of scholars like Donia et al. (2016). Inside an
organization OCBs do get measured over a period of time and the measure does include the
underlying feelings and intentions as well. If we apply the filter of underlying feelings of
‘Trustworthiness and Loyalty’ and ‘Passion and Positive Attitude’ to identify OCBs, then
behavior and actions of employees with ulterior motives shall not count as OCB in the first place.
In the long run, any behavior with ulterior or self-serving motives shall get revealed as selfish
behavior, as against genuine OCB. Hence ‘OCBs with ulterior motives’ is an oxymoron, and the
case of OCBs with ulterior motives doesn’t exist.
OCB: An Aggregate Construct
Rosen et al. (2018) have mentioned that OCB, if viewed in light of Organ’s (1997) definition,
would count as an aggregate construct. It has been emphasized in this research work that Good
Soldiers shall be identified on the basis of net positive contribution to the organization, wherein
they overcome their shortcomings by over-performing in other areas. This implies that aggregate
of reflective measures determines OCB, whereas individual reflective measures in isolation alone
do not determine OCB; which also suggests that OCB is an aggregate construct
Missing OCB Dimensions, Behavioural Variations and Good Soldiers
The study has also given insights into the question raised in the Literature Review Section:
Can we conclude that a person is a ‘Good Soldier’ or an ‘Organizational Citizen’ if he displays
certain OCBs, and doesn’t display the others, or worse - shows deviant behavior in some other
cases? Scholars have also talked of short duration affect variations leading to changes in behavior
displayed by personnel (Spence et al., 2014). This study has suggested that personnel would
always be good on some dimensions, and ‘not so good’ on others, and there would be variations in
their performance when measured across all the different dimensions of OCB. However whether
they are ‘Good Soldiers’ or not, would depend on the aggregate and in the long run – overall
whether they are contributing positively, overall whether they are an asset or a liability.
Conclusion
This study on OCB in the context of the Indian Armed Forces has given new insights, which
call for a broader definition of OCB (in line with the definition suggested by Organ in the year
1997) and inclusion of additional dimensions (like ‘Diligence and Professional Competence’ and
‘Leadership’) which have typically been kept outside the purview of OCBs. In addition, the study
has rendered clarity on quite a few issues pertaining to OCB. While the context of the study were
the Indian Armed Forces, but the findings do indicate a need to review the definition, dimensions
and related theories of OCB, as applicable in the Indian context. As scope for future research,
similar studies on OCB, using a ground-up approach, is recommended in civilian organizations in
India as well, to verify the findings and carry forward and complete the process of indigenous
theory development on OCB. Correct understanding of OCB shall play a key role for
academicians, leaders and employees in developing and nurturing OCBs, which in turn shall help
improve the effectiveness and efficiency of organizations, and lay the path for sustainable
development.
References
1. Ball, J. A. (2013). Organizational citizenship behavior at Catholic institutions of higher education:
Effects of organizational commitment, interpersonal-and system-level trust. Doctoral dissertation
submitted to the University of Iowa, Iowa City, Iowa, U.S.A.
2. Barnard, C. (1938). The functions of the executive. Cambridge, MA: Harvard University Press.
3. Bateman, T. S., & Organ, D. W. (1983). Job satisfaction and the good soldier: The relationship
between affect and employee ''citizenship'. Academy of Management Journal, 26(4), 587-595.
4. Chen, Y., Friedman, R., Yu, E., & Sun, F. (2011). Examining the positive and negative effects of
guanxi practice: A multi-level analysis of guanxi practices and procedural justice perceptions. Asia
Pacific Journal of Management, 28(4), 715–735
5. Coleman, V. I., & Borman, W. C. (2000). Investigating the underlying structure of the citizenship
performance domain. Human Resource Management Review, 10, 25-44. doi:10.1016/S1053-
4822(99)00037-6
6. Dalal R. S., Lam, H., Weiss, M., Welch, E. R., & Hulin, C. (2009). Within-person approach to
work behavior and performance: concurrent and lagged citizenship-counter productivity
associations, and dynamic relationships with affect and overall job performance.
The Academy of Management Journal 52(5),1051-1066.
7. Donia, M.B.L., Johns, G. & Raja, U. (2016). Good soldier or good actor? Supervisor accuracy in
distinguishing between selfless and self-serving OCB motives. Journal of Business Psychology, 31,
23–32 https://doi.org/10.1007/s10869-015-9397-6
8. Emily, M., Hailin, Q., Wilson, M., & Eastman, K. (2013). Modeling OCB for hotels: Don’t forget
the customers. Cornell Hospitality Quarterly, 308-317.
9. Gupta, V. & Singh, S. (2012). Empirical evaluation of dimensionality of organizational citizenship
behavior for Indian business context. Psychological Studies. 57.
10. Katz, D. & Kahn, R. L. 1966. The social psychology of organizations. New York:Wiley.
11. Khan, H., Yasir, M.,Yusof, H.M., Saleem ,M.M., & Khan,N.U. (2017). A review of the
conceptualization of organizational citizenship behavior. City University Research Journal, Special
Issue: AIC, Malaysia, 81-87.
12. Lepine, J. A., Erez, A., & Johnson, D. E. (2002). The nature and dimensionality of organizational
citizenship behavior: A critical review and meta-analysis. The Journal of Applied Psychology,
87(1), 52-65.
13. LePine, Jeffrey & Van Dyne, Linn. (2001). Voice and cooperative behavior as contrasting forms of
contextual performance: evidence of differential relationships with big five personality
characteristics and cognitive ability. The Journal of Applied Psychology. 86. 326-36.
10.1037/0021-9010.86.2.326.
14. Martinez, T.M., Podsakoff, N.P. (2016), Traditional predictors of ocb: reviews and
recommendations for future research. Paper Presented at the Annual Conference of the Academy of
Management, Anaheim, California, USA.
15. Organ, D. W. (1988). Organizational citizenship behavior: The good soldier syndrome. Lexington,
Mass: Lexington Books.
16. Organ, D. W. (1997). Organizational citizenship behavior: It's construct clean-up time. Human
Performance, 10(2), 85-97. doi:10.1207/s15327043hup1002_2
17. Organ, D. W. (2017). Organizational citizenship behavior: Recent trends and developments.
Annual Review of Organizational Psychology and Organizational Behavior, 80,295–306.
18. Organ, D. W., Podsakoff, P. M. & MacKenzie, S. B. (2006). Organizational citizenship behavior:
Its nature, antecedents and consequences. Sage, Thousand Oaks, CA.
19. Paine, J. B., & Organ, D. W. (2000). The cultural matrix of organizational citizenship behavior:
Some preliminary empirical and conceptual observations. Human Resource Management Review,
10,45-59.
20. Podsakoff, N. P., Morrison, E. W., & Martinez, T. M. (2018). The role of a good soldier: A review
of research on ocb role perceptions and recommendations for the future. In P.M. Podsakoff, S.B.
Mackenzie, & N.P. Podsakoff (Eds.), The Oxford handbook of organizational citizenship behavior.
Oxford University Press.
21. Podsakoff, N. P., Podsakoff, P. M., Mackenzie, S. B., Maynes, T. D. & Spoelma, T. M. (2013).
Consequences of unit-level organizational citizenship behaviors: A review and recommendations
for future research. Journal of Organizational Behavior, 35,87-119.
22. Roethlisberger, F. J., & Dickson, W. J. 1939. Management and the worker. Cambridge, MA:
Harvard University Press.
23. Rosen, C., Yochum, E., Passantino, L., Johnson, R., & Chang, C. (2018). Review and
recommended best practices for measuring and modeling organizational citizenship behavior. In
P.M. Podsakoff, S.B. Mackenzie, & N.P. Podsakoff (Eds.), The Oxford handbook of organizational
citizenship behavior. Oxford University Press.
24. Spector, P.E. (2013). Introduction: The dark and light sides of organizational citizenship behavior.
Journal of Organizational Behaviour. 34, 540-541. doi:10.1002/job.1846
25. Spence, J. R., Brown, D. J., Keeping, L. M., & Lian, H. (2014). Helpful today, but not tomorrow?
Feeling grateful as a predictor of daily organizational citizenship behaviors. Personnel Psychology.
67, 705–738. doi: 10.1111/peps.12051
26. Taber, T., & Deosthali, K. (2013). Analysis of self-reported motives for task-related helping:
implications for an integrated theory of helping. Journal of Business and Psychology. 29. 343-366.
10.1007/s10869-013-9327-4.
27. Van Scotter, J. R., & Motowidlo, S. J. (1996). Interpersonal facilitation and job dedication as
separate facets of contextual performance. Journal of Applied Psychology, 81(5), 525–
531. https://doi.org/10.1037/0021-9010.81.5.525
28. Wang, X. (2016). Organizational citizenship behavior: A literature review. Advances in
Economics, Business and Management Research, 16, 533-538.
29. Williams, L. J., & Anderson, S. E. (1991). Job satisfaction and organizational commitment as
predictors of organizational citizenship and in-role behaviors. Journal of Management, 17, 601–
617.
30. Yen, H. R., Li, E. Y., & Niehoff, B. P. (2008). Do organizational citizenship behaviors lead to
information system success?: Testing the mediation effects of integration climate and project
management. Information & Management, 45(6), 394-402.
INDIAN INSTITUTE OF MANAGEMENT KOZHIKODE
Sustainability in Business and Management: A bibliometric based integrative
review and future research agenda
Mr. Milind Kumar Jha, Indian Institute of Foreign Trade, New Delhi-110016,
[email protected], [email protected], +91-9910199132
Dr. K. Rangarajan Indian Institute of Foreign Trade, Kolkata-700107, [email protected], +91-9836189550
Abstract
This paper explored the sustainability domain using both performance analysis and science mapping
tools for the last 20 years and have characterized the conceptual, intellectual, and social structure of this
domain using 7588 bibliographic records of published articles for “business” and “management”. The
findings reveal that early literature in this multidisciplinary domain was derived from environmental issues
of business and strategy where the focus was on defining the construct itself. Later work moved its focus
towards the strategic impact of relevant sustainability issues and its impact on the performance of business
firms. This study will primarily help researchers working in this domain to get a quick start for further
contributions and policymakers to devise methods to enhance research and collaboration in this area.
Introduction
This paper aims to explore the sustainability knowledge domain in the subject categories of
“business” and “management” fields based on bibliometric analysis for the last 20 years, given
that we have seen an explosion of literature around this topic. Sustainability is a multidisciplinary
construct, but the focus of this analysis is to comprehend the sustainability landscape in the
corporate world, and hence the study was restricted for these subject areas only. We have
conducted this analysis by taking an inductive approach to perform bibliometric performance
analysis on the various unit of analysis namely articles, journals, and authors followed by science
mapping based on co-citation, co-word, and co-author analysis to uncover the intellectual,
conceptual and social structure respectively. The systematic literature review has been done to not
only uncover the underlying paradigms of this domain but also to explore the epistemological
characteristics, emerging trends, thematic patterns to highlight the historic areas of developments.
This study aims to address the following research questions:
1. How has the field of sustainability progressed in the last two decades?
2. Which entities (journals, authors, institutions, and countries) are most influential in
contributing to the field of sustainability in “business and management”?
3. What are the underlying paradigms, primary research themes, and social networks in this
knowledge domain?
Research Design and Methodology
This paper followed the PRISMA guidelines (Moher et al., 2009) for various steps in
conducting a literature review. Once the final list of articles was finalized using citation data from
Web of Science, we followed the steps suggested by Cobo et al. (2011) for conducting
bibliometric analysis in this paper. This study deployed both performance analysis and science
2
mapping methods at different levels using various tools for conducting research. We used different
units of analysis namely journals, documents, cited references, authors, and words during this
study. Content analysis of top document abstracts and “aims and scope” of top journals was
conducted to interpret the findings and identify the clusters in this study. The detailed steps for the
research design and methodology are shown in Figure-1. We have summarized our major findings
for the overall analysis in Table-1.
Research Findings and discussions.
The findings have been explained in terms of Descriptive and Trend Analysis, Source
analysis, Author analysis, and document analysis, the details of which are provided in Table-I and
Figure 1 to Figure- 7. Further, the conceptual structure of the knowledge domain as identified
using co-word analysis (see Figure-6(4)), intellectual structure of the domain was identified using
co-citation analysis and social structure of the domain was identified using co-author analysis (See
Figure-7). The source distribution follows the Bradfordian characteristics which help to identify
the most important journals for this domain (See Figure-3). The author analysis helped us to create
a list of highly cited documents from top authors working in different areas of sustainability
namely, sustainability and environment (Sarkis J, 2001; Boiral O, 2012, 2014; Gupta S, 2016;
Frey M, 2013, 2018), corporate sustainability models and issues (Svenssen G, 2012; Gupta S,
2013; Jabbour Cjc, 2008, 2011; Kolk A, 2010; Geels FW, 2010; Pinkse J, 2014, 2015; Searcy C,
2011; Bansal P, 2013, 2014), sustainable supply chain (SSC) management (Sarkis J, 2014;
Svenssen G, 2007; Seuring S, 2014; Pagell M, 2009; 2011), sustainability reporting and
accounting (Schaltegger S, 2010; Kolk A, 2010; Searcy C, 2015) and lastly sustainability
entrepreneurship and innovation (Schaltegger S, 2011; Geels FW, 2005; Wagner M, 2010, 2011).
As we analyze the documents based on global citations (figure-6(3)), Carter CR (2008) at first
rank is focused on SSC management whereas the next one from Christmann P (2000) is dedicated
to best environmental practices for achieving cost advantage. We find that though these papers
focus on different fields of research, all of these references are at the core of establishing the
foundational theories of business and management that are used by the multidisciplinary
knowledge domain of sustainability as the scholars try to analyze this domain from different
perspectives.
Our attempt to uncover the conceptual structure of the domain through different periods in the
alluvial diagram (figure-5(5)) shows that overall, the domain is converging from many diverse
topics in T1 that were part of the academic discourse at the equivalent level e.g. “performance”,
“environment”, “framework”, “resource-based-view” etc. In T2, many of these topics were
merged into a lower number of topics as some were derived from the combination of earlier topics
or few completely lost their existence as a prominent topic. Till T2, “Model” and “environment”
were completely merged into “management”, and RBV was merged to “firm” as a prominent
topic. “Business” and “firm” appeared as new topics in T2. Thus, from T1 to T2 most of the focus
of this domain shifted from multiple aspects to the role of business management in sustainability.
In T3, sustainability itself became the leading concept derived from management, framework, and
sector. “Performance” and “framework” also remained relevant topics during T1 to T3, but they
kept changing their constituents during the period. CSR, composed of earlier concepts like “firm”,
“framework” and “business” were a significant and new topic during this period and behavior as
an independent concept also started showing up in this context. In T4, the focus shifted to
“sustainability”, “management”, and impact derived from various topics from T4. The conceptual
clusters identified in this research are primarily along the dimensions of “framework and models”,
“strategic impact”, “behavior and values”, and “drivers and determinants” of sustainability.
Scholars can use one of these themes for doing a deep dive for their research or can find a new
dimension based on these clusters as a gap for further research. The cultural or value aspect of
sustainability seems to be less researched as reflected by the content of this cluster, which can be
3
picked as one of the areas to be investigated. Yet another area of research can be along with the
differences of dimensions in developed vs. developing countries and its relevant impact on
business and management. Another prominent topic to be covered in further research can be
sustainability and its relationship with and applications in different areas of business and
management e.g. human-resources, behavioral finance, trade policies, etc.
The three clusters based on the network of articles in intellectual structure analysis provide
the primary focus areas for the sustainability domain and it seems that now this domain has sound
theoretical background but the focus of existing research has primarily been from supply chain
management area or production technologies with a focus on environmental management. This
further means that there is ample opportunity for other areas of the business to contribute to this
domain primarily keeping the social aspect in the center of the academic discourse for business
and management. Cluster identified based on the network of authors reinforces the co-citation
results of articles that the domain has well-developed foundational theories but from an
application perspective, the domain is dominated by supply chain management or environmental-
related studies, providing an opportunity for scholars to bring other dimensions of business and
management in this domain. Cluster analysis based on journal network reinforced the multi-
disciplinary aspect of sustainability; however, we can also see that the domain doesn’t have many
dedicated journals for contribution in this area. Having a few dedicated journals focused on the
sustainability issues in different areas of management may increase the rigor of contributions for
sustainability increasing the depth of this entity as an independent knowledge-domain. The
historiographic analysis suggests the early focus of this domain on the environmental aspect and
recent focus on SSC and entrepreneurship.
The network analysis done for unraveling the social structure of this domain reveals a lack of
strong author or institutional networks. Given that sustainability is a multi-disciplinary domain, it
might be possible that scholars engaged in business and management subject-category may not be
doing research in sustainability as a mainstream discipline and hence different entities are working
in niches without the need for collaboration. Countries, on the other hand, have some existing
collaboration which also has a strong potential to increase. One of the reasons for this lack of
collaboration in this field may be the absence of incentives or policies focused on research in this
field or the absence of established institutions and regular conferences where most of such
collaboration initiates.
Conclusions
This paper explored the emergent trends, epistemological attributes, and thematic patterns in
this field while conducting the analysis at the level of the journal, documents, and authors
independently. Using a blend of co-citation, co-word, and co-author analysis followed by content
analysis of top entities, this paper identified the intellectual, conceptual, and social structure of this
domain. The findings of this study revealed that the domain is multidisciplinary and is still in the
growth phase, however there is a significant lack of collaboration between researchers among
institutions and countries. This domain has foundational theories coming from strategy and social
responsibility domain and latest research has been focused on SSC and analytical methods to be
used in this domain. Sustainability field is geographically well diversified though dominated by
contributors from Anglo-American and European nations. This study may help both expert and
novice researchers working in the sustainability domain to understand the historical trajectory and
current state to position their research questions and enhance the research paradigm using
emerging technologies. This research will also provide an exposure to the scholar community
working in sustainability to conduct systematic literature review and meta-analysis using
bibliometric methods and tools. Apart from the research community at different levels, the
findings from this study will also help policymakers in various countries and institutions to re-

4
orient their research activities in this area, so that contextual policies and practices can be adopted
in this research through cross-collaboration.
References:
1. Moher, D., Liberati, A., Tetzlaff, J., Altman, D. G., & Prisma Group. (2009). Preferred reporting
items for systematic reviews and meta-analyses: the PRISMA statement. PLoS med, 6(7),
e1000097.
2. Cobo, M. J., López-Herrera, A. G., Herrera-Viedma, E., & Herrera, F. (2011). An approach for
detecting, quantifying, and visualizing the evolution of a research field: A practical application to
the fuzzy sets theory field. Journal of informetrics, 5(1), 146-166.
Carbon Emissions & Ecological Business Conscience of Coal, Oil & Gas
Businesses in India
Harini K N 1
XLRI, Jamshedpur
Abstract
Carbon emissions from various industries are causing ecological imbalance - a substantial proportion
of these emissions are due to energy-producing businesses that use fossil fuels like Coal, Oil, and Natural
Gas for extraction and processing. Growth in the world economy over the past few decades has been
powered by increased usage of energy that has led to an increase in carbon footprint & intensity globally.
In this paper, an Ecological Business Conscience (EBC) Index has been developed to score the various
initiatives undertaken by the Coal, Oil & Gas businesses in India for reducing and managing their intensity
of carbon footprint. This index will act as an indicator, informing organizations and its various stakeholders
of their present level of EBC, while also highlighting areas that need to be addressed for further
improvements to reduce their carbon footprint and intensity for achieving corporate sustainability.
Keywords: Ecological Business Conscience Index; carbon footprint; corporate sustainability; ecological
imbalance; carbon emissions
Introduction
The Earth is the only habitable planet in our galaxy based on our knowledge today. What it
means is that - Earth has finite space, finite resources, and an environment that has to be protected
so that an ecological equilibrium can be maintained for the survival of all living beings. Any
imbalance caused can have severe implications on life in general and the survival of living beings
in particular. The world is experiencing climate change driven ecological imbalance as the Earth is
getting warmer due to changes in the climate faster than expected as a consequence of rapid
industrialization across the globe. An expected 2-degree centigrade rise in the world’s average
temperature in the next decades will make India’s summer monsoon highly unpredictable (India
Energy Outlook - World Energy Outlook Special Report, 2015). Shifting rain patterns will leave
some areas underwater, and others without enough water for irrigation, water for drinking, and
water for power generation will become scarce (Schultz & Williamson, 2005). This ecological
imbalance will impact the businesses, and hence the means of livelihood for millions will be at
risk. With the impact of climate change becoming more marked in recent years, governments,
businesses, and individuals are more concerned about the contributions of their actions to climate
change and are making a conscious effort to manage climate variation and measure their carbon
footprint or greenhouse gas (GHG) emissions caused from goods or actions, to diagnose tactics to
diminish these effects (Huang et al., 2009).
In this study, the objective is to develop an Ecological Business Conscience (EBC) Index
to score the various initiatives undertaken by the Coal, Oil & Gas businesses in India for reducing
and managing their intensity of carbon footprint. Carbon emissions comprise Green House
Emission (GHG) gases & CFCs (Chlorofluorocarbons) which trap heat and deplete the ozone
layer – hence these emissions can have catastrophic consequences on the global environment by
causing severe ecological imbalances. Increased usage of energy has led to an increase in carbon
footprint & intensity globally with energy-related activities contributing to more than 70% of
global GHG’s with India being the world’s third-largest emitter of greenhouse gases (Timperley,
2019). Therefore, the index developed in this study will act as an indicator, informing
organizations and its various stakeholders of their present level of EBC, while also highlighting
areas that need to be addressed for further improvements to reduce their carbon footprint and
intensity for achieving corporate sustainability.
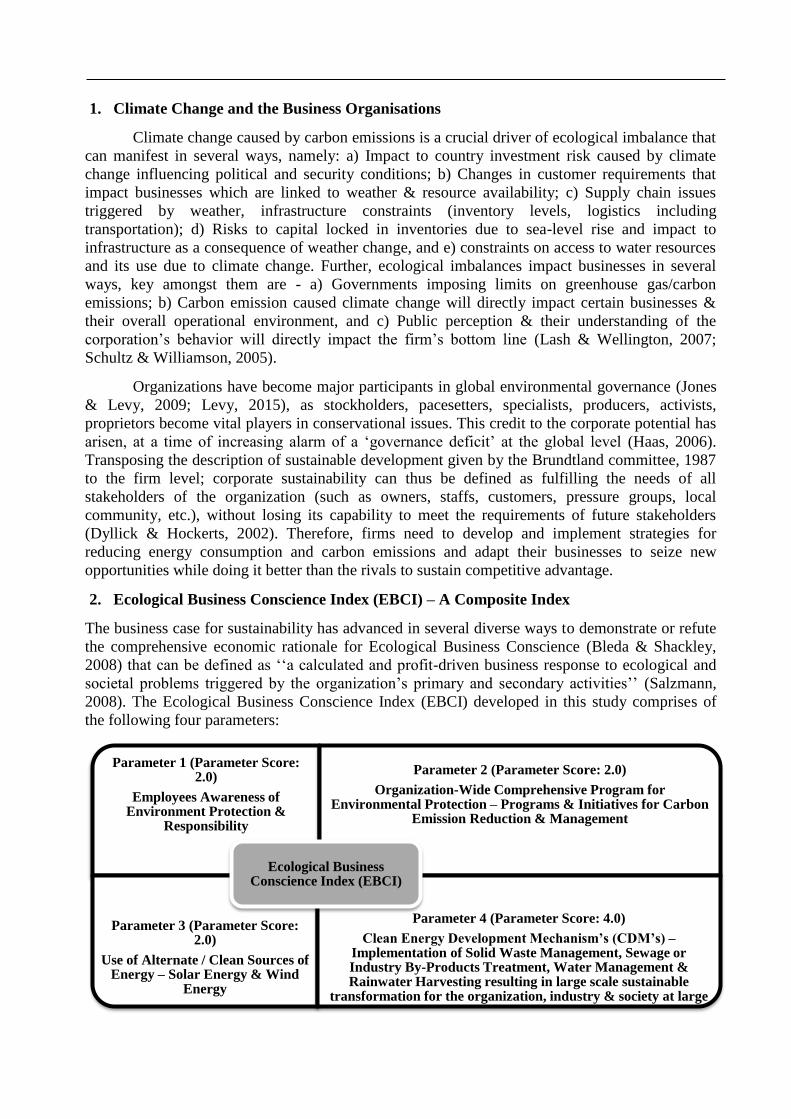
1. Climate Change and the Business Organisations
Climate change caused by carbon emissions is a crucial driver of ecological imbalance that
can manifest in several ways, namely: a) Impact to country investment risk caused by climate
change influencing political and security conditions; b) Changes in customer requirements that
impact businesses which are linked to weather & resource availability; c) Supply chain issues
triggered by weather, infrastructure constraints (inventory levels, logistics including
transportation); d) Risks to capital locked in inventories due to sea-level rise and impact to
infrastructure as a consequence of weather change, and e) constraints on access to water resources
and its use due to climate change. Further, ecological imbalances impact businesses in several
ways, key amongst them are - a) Governments imposing limits on greenhouse gas/carbon
emissions; b) Carbon emission caused climate change will directly impact certain businesses &
their overall operational environment, and c) Public perception & their understanding of the
corporation’s behavior will directly impact the firm’s bottom line (Lash & Wellington, 2007;
Schultz & Williamson, 2005).
Organizations have become major participants in global environmental governance (Jones
& Levy, 2009; Levy, 2015), as stockholders, pacesetters, specialists, producers, activists,
proprietors become vital players in conservational issues. This credit to the corporate potential has
arisen, at a time of increasing alarm of a ‘governance deficit’ at the global level (Haas, 2006).
Transposing the description of sustainable development given by the Brundtland committee, 1987
to the firm level; corporate sustainability can thus be defined as fulfilling the needs of all
stakeholders of the organization (such as owners, staffs, customers, pressure groups, local
community, etc.), without losing its capability to meet the requirements of future stakeholders
(Dyllick & Hockerts, 2002). Therefore, firms need to develop and implement strategies for
reducing energy consumption and carbon emissions and adapt their businesses to seize new
opportunities while doing it better than the rivals to sustain competitive advantage.
2. Ecological Business Conscience Index (EBCI) – A Composite Index
The business case for sustainability has advanced in several diverse ways to demonstrate or refute
the comprehensive economic rationale for Ecological Business Conscience (Bleda & Shackley,
2008) that can be defined as ‘‘a calculated and profit-driven business response to ecological and
societal problems triggered by the organization’s primary and secondary activities’’ (Salzmann,
2008). The Ecological Business Conscience Index (EBCI) developed in this study comprises of
the following four parameters:
Parameter 1 (Parameter Score: 2.0)
Employees Awareness of Environment Protection &
Responsibility
Parameter 2 (Parameter Score: 2.0)
Organization-Wide Comprehensive Program for Environmental Protection – Programs & Initiatives for Carbon
Emission Reduction & Management
Parameter 3 (Parameter Score: 2.0)
Use of Alternate / Clean Sources of Energy – Solar Energy & Wind
Energy
Parameter 4 (Parameter Score: 4.0)
Clean Energy Development Mechanism’s (CDM’s) – Implementation of Solid Waste Management, Sewage or Industry By-Products Treatment, Water Management & Rainwater Harvesting resulting in large scale sustainable
transformation for the organization, industry & society at large
Ecological Business Conscience Index (EBCI)
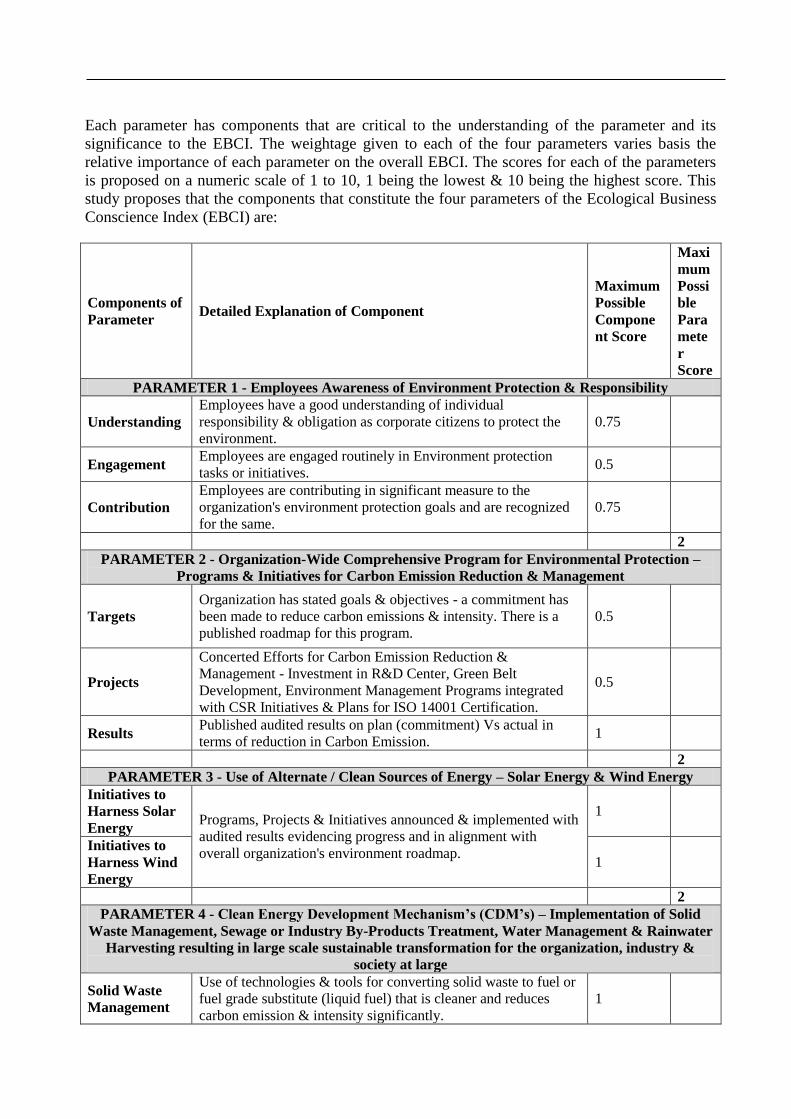
Each parameter has components that are critical to the understanding of the parameter and its
significance to the EBCI. The weightage given to each of the four parameters varies basis the
relative importance of each parameter on the overall EBCI. The scores for each of the parameters
is proposed on a numeric scale of 1 to 10, 1 being the lowest & 10 being the highest score. This
study proposes that the components that constitute the four parameters of the Ecological Business
Conscience Index (EBCI) are:
Components of
Parameter Detailed Explanation of Component
Maximum
Possible
Compone
nt Score
Maxi
mum
Possi
ble
Para
mete
r
Score
PARAMETER 1 - Employees Awareness of Environment Protection & Responsibility
Understanding
Employees have a good understanding of individual
responsibility & obligation as corporate citizens to protect the
environment.
0.75
Engagement Employees are engaged routinely in Environment protection
tasks or initiatives. 0.5
Contribution
Employees are contributing in significant measure to the
organization's environment protection goals and are recognized
for the same.
0.75
2
PARAMETER 2 - Organization-Wide Comprehensive Program for Environmental Protection –
Programs & Initiatives for Carbon Emission Reduction & Management
Targets
Organization has stated goals & objectives - a commitment has
been made to reduce carbon emissions & intensity. There is a
published roadmap for this program.
0.5
Projects
Concerted Efforts for Carbon Emission Reduction &
Management - Investment in R&D Center, Green Belt
Development, Environment Management Programs integrated
with CSR Initiatives & Plans for ISO 14001 Certification.
0.5
Results Published audited results on plan (commitment) Vs actual in
terms of reduction in Carbon Emission. 1
2
PARAMETER 3 - Use of Alternate / Clean Sources of Energy – Solar Energy & Wind Energy
Initiatives to
Harness Solar
Energy Programs, Projects & Initiatives announced & implemented with
audited results evidencing progress and in alignment with
overall organization's environment roadmap.
1
Initiatives to
Harness Wind
Energy
1
2
PARAMETER 4 - Clean Energy Development Mechanism’s (CDM’s) – Implementation of Solid
Waste Management, Sewage or Industry By-Products Treatment, Water Management & Rainwater
Harvesting resulting in large scale sustainable transformation for the organization, industry &
society at large
Solid Waste
Management
Use of technologies & tools for converting solid waste to fuel or
fuel grade substitute (liquid fuel) that is cleaner and reduces
carbon emission & intensity significantly.
1
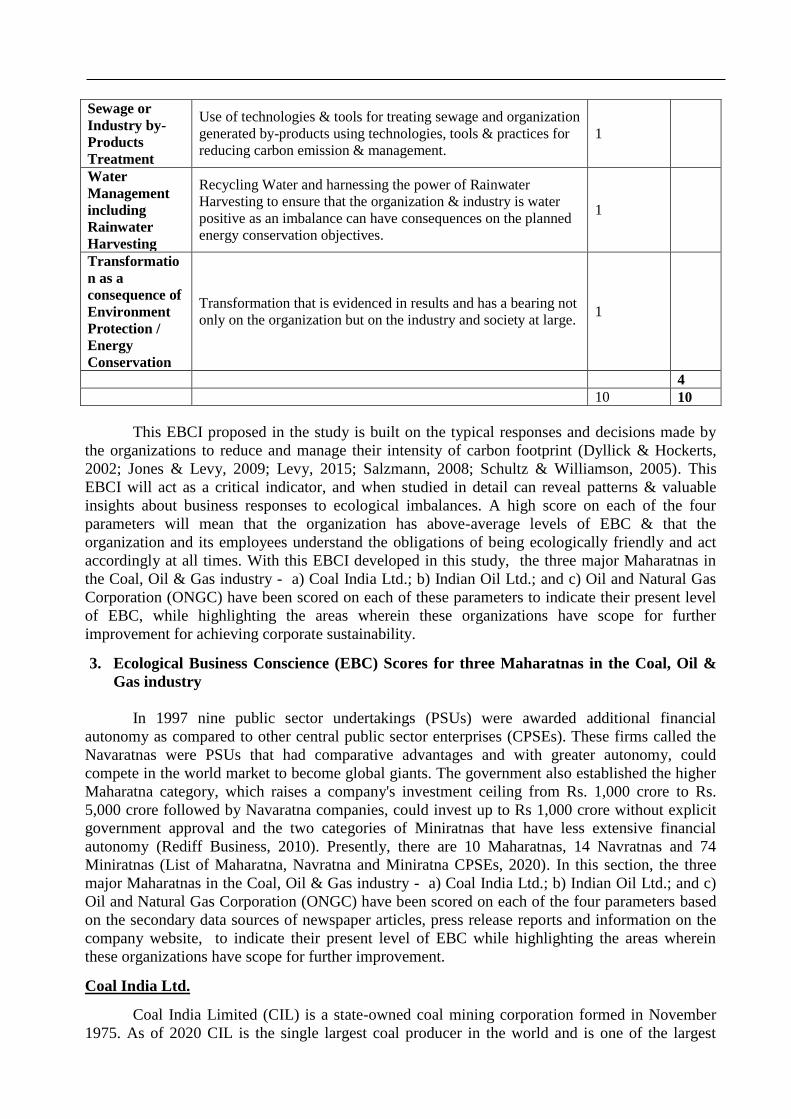
Sewage or
Industry by-
Products
Treatment
Use of technologies & tools for treating sewage and organization
generated by-products using technologies, tools & practices for
reducing carbon emission & management.
1
Water
Management
including
Rainwater
Harvesting
Recycling Water and harnessing the power of Rainwater
Harvesting to ensure that the organization & industry is water
positive as an imbalance can have consequences on the planned
energy conservation objectives.
1
Transformatio
n as a
consequence of
Environment
Protection /
Energy
Conservation
Transformation that is evidenced in results and has a bearing not
only on the organization but on the industry and society at large. 1
4
10 10
This EBCI proposed in the study is built on the typical responses and decisions made by
the organizations to reduce and manage their intensity of carbon footprint (Dyllick & Hockerts,
2002; Jones & Levy, 2009; Levy, 2015; Salzmann, 2008; Schultz & Williamson, 2005). This
EBCI will act as a critical indicator, and when studied in detail can reveal patterns & valuable
insights about business responses to ecological imbalances. A high score on each of the four
parameters will mean that the organization has above-average levels of EBC & that the
organization and its employees understand the obligations of being ecologically friendly and act
accordingly at all times. With this EBCI developed in this study, the three major Maharatnas in
the Coal, Oil & Gas industry - a) Coal India Ltd.; b) Indian Oil Ltd.; and c) Oil and Natural Gas
Corporation (ONGC) have been scored on each of these parameters to indicate their present level
of EBC, while highlighting the areas wherein these organizations have scope for further
improvement for achieving corporate sustainability.
3. Ecological Business Conscience (EBC) Scores for three Maharatnas in the Coal, Oil &
Gas industry
In 1997 nine public sector undertakings (PSUs) were awarded additional financial
autonomy as compared to other central public sector enterprises (CPSEs). These firms called the
Navaratnas were PSUs that had comparative advantages and with greater autonomy, could
compete in the world market to become global giants. The government also established the higher
Maharatna category, which raises a company's investment ceiling from Rs. 1,000 crore to Rs.
5,000 crore followed by Navaratna companies, could invest up to Rs 1,000 crore without explicit
government approval and the two categories of Miniratnas that have less extensive financial
autonomy (Rediff Business, 2010). Presently, there are 10 Maharatnas, 14 Navratnas and 74
Miniratnas (List of Maharatna, Navratna and Miniratna CPSEs, 2020). In this section, the three
major Maharatnas in the Coal, Oil & Gas industry - a) Coal India Ltd.; b) Indian Oil Ltd.; and c)
Oil and Natural Gas Corporation (ONGC) have been scored on each of the four parameters based
on the secondary data sources of newspaper articles, press release reports and information on the
company website, to indicate their present level of EBC while highlighting the areas wherein
these organizations have scope for further improvement.
Coal India Ltd.
Coal India Limited (CIL) is a state-owned coal mining corporation formed in November
1975. As of 2020 CIL is the single largest coal producer in the world and is one of the largest
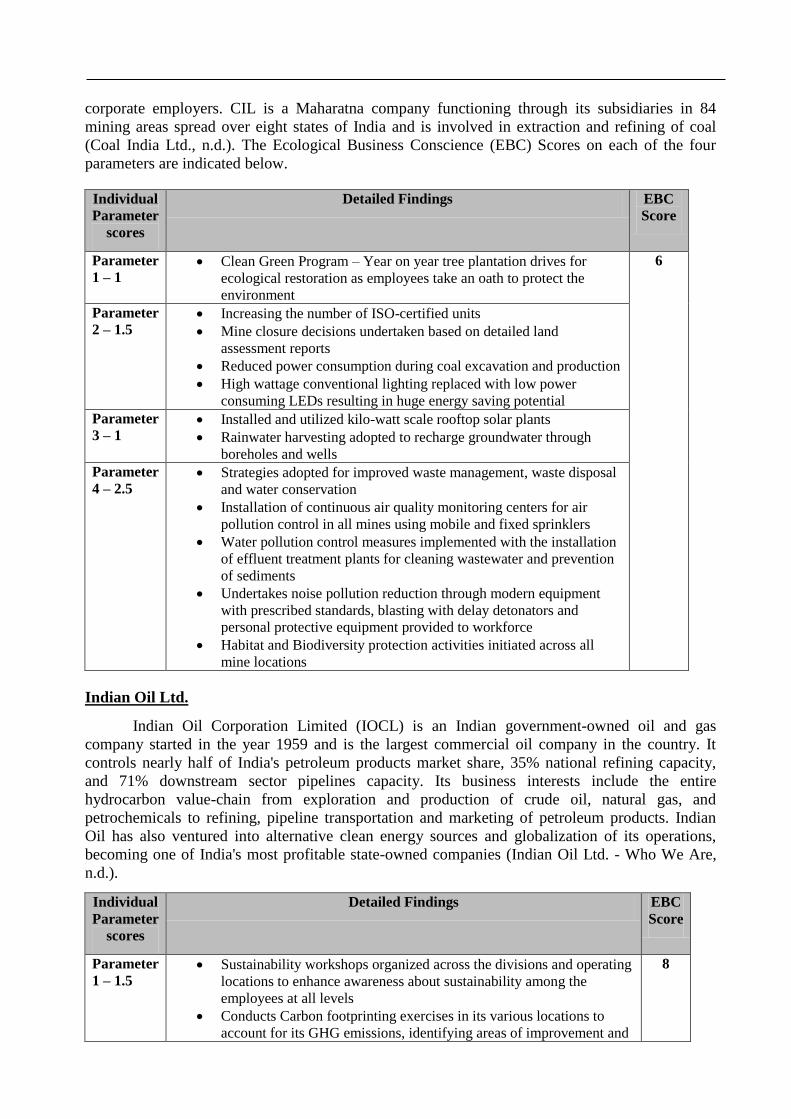
corporate employers. CIL is a Maharatna company functioning through its subsidiaries in 84
mining areas spread over eight states of India and is involved in extraction and refining of coal
(Coal India Ltd., n.d.). The Ecological Business Conscience (EBC) Scores on each of the four
parameters are indicated below.
Individual
Parameter
scores
Detailed Findings EBC
Score
Parameter
1 – 1 Clean Green Program – Year on year tree plantation drives for
ecological restoration as employees take an oath to protect the
environment
6
Parameter
2 – 1.5 Increasing the number of ISO-certified units
Mine closure decisions undertaken based on detailed land
assessment reports
Reduced power consumption during coal excavation and production
High wattage conventional lighting replaced with low power
consuming LEDs resulting in huge energy saving potential
Parameter
3 – 1 Installed and utilized kilo-watt scale rooftop solar plants
Rainwater harvesting adopted to recharge groundwater through
boreholes and wells
Parameter
4 – 2.5 Strategies adopted for improved waste management, waste disposal
and water conservation
Installation of continuous air quality monitoring centers for air
pollution control in all mines using mobile and fixed sprinklers
Water pollution control measures implemented with the installation
of effluent treatment plants for cleaning wastewater and prevention
of sediments
Undertakes noise pollution reduction through modern equipment
with prescribed standards, blasting with delay detonators and
personal protective equipment provided to workforce
Habitat and Biodiversity protection activities initiated across all
mine locations
Indian Oil Ltd.
Indian Oil Corporation Limited (IOCL) is an Indian government-owned oil and gas
company started in the year 1959 and is the largest commercial oil company in the country. It
controls nearly half of India's petroleum products market share, 35% national refining capacity,
and 71% downstream sector pipelines capacity. Its business interests include the entire
hydrocarbon value-chain from exploration and production of crude oil, natural gas, and
petrochemicals to refining, pipeline transportation and marketing of petroleum products. Indian
Oil has also ventured into alternative clean energy sources and globalization of its operations,
becoming one of India's most profitable state-owned companies (Indian Oil Ltd. - Who We Are,
n.d.).
Individual
Parameter
scores
Detailed Findings EBC
Score
Parameter
1 – 1.5 Sustainability workshops organized across the divisions and operating
locations to enhance awareness about sustainability among the
employees at all levels
Conducts Carbon footprinting exercises in its various locations to
account for its GHG emissions, identifying areas of improvement and
8
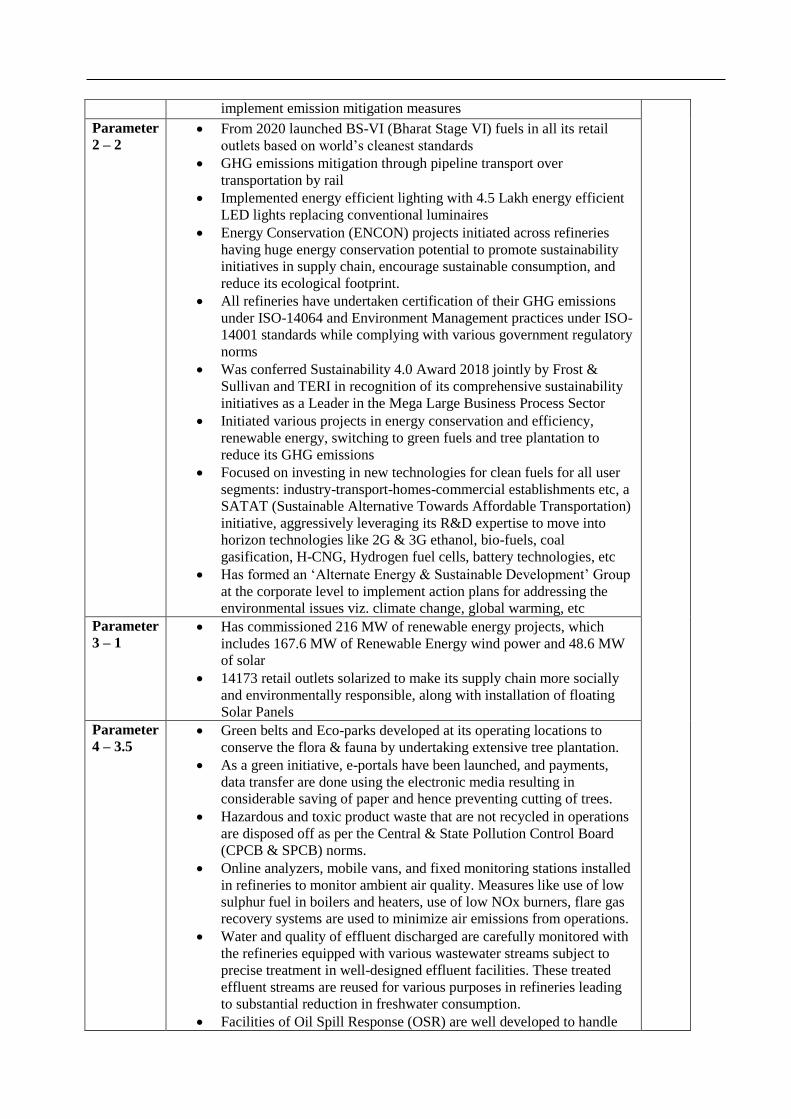
implement emission mitigation measures
Parameter
2 – 2 From 2020 launched BS-VI (Bharat Stage VI) fuels in all its retail
outlets based on world’s cleanest standards
GHG emissions mitigation through pipeline transport over
transportation by rail
Implemented energy efficient lighting with 4.5 Lakh energy efficient
LED lights replacing conventional luminaires
Energy Conservation (ENCON) projects initiated across refineries
having huge energy conservation potential to promote sustainability
initiatives in supply chain, encourage sustainable consumption, and
reduce its ecological footprint.
All refineries have undertaken certification of their GHG emissions
under ISO-14064 and Environment Management practices under ISO-
14001 standards while complying with various government regulatory
norms
Was conferred Sustainability 4.0 Award 2018 jointly by Frost &
Sullivan and TERI in recognition of its comprehensive sustainability
initiatives as a Leader in the Mega Large Business Process Sector
Initiated various projects in energy conservation and efficiency,
renewable energy, switching to green fuels and tree plantation to
reduce its GHG emissions
Focused on investing in new technologies for clean fuels for all user
segments: industry-transport-homes-commercial establishments etc, a
SATAT (Sustainable Alternative Towards Affordable Transportation)
initiative, aggressively leveraging its R&D expertise to move into
horizon technologies like 2G & 3G ethanol, bio-fuels, coal
gasification, H-CNG, Hydrogen fuel cells, battery technologies, etc
Has formed an ‘Alternate Energy & Sustainable Development’ Group
at the corporate level to implement action plans for addressing the
environmental issues viz. climate change, global warming, etc
Parameter
3 – 1 Has commissioned 216 MW of renewable energy projects, which
includes 167.6 MW of Renewable Energy wind power and 48.6 MW
of solar
14173 retail outlets solarized to make its supply chain more socially
and environmentally responsible, along with installation of floating
Solar Panels
Parameter
4 – 3.5 Green belts and Eco-parks developed at its operating locations to
conserve the flora & fauna by undertaking extensive tree plantation.
As a green initiative, e-portals have been launched, and payments,
data transfer are done using the electronic media resulting in
considerable saving of paper and hence preventing cutting of trees.
Hazardous and toxic product waste that are not recycled in operations
are disposed off as per the Central & State Pollution Control Board
(CPCB & SPCB) norms.
Online analyzers, mobile vans, and fixed monitoring stations installed
in refineries to monitor ambient air quality. Measures like use of low
sulphur fuel in boilers and heaters, use of low NOx burners, flare gas
recovery systems are used to minimize air emissions from operations.
Water and quality of effluent discharged are carefully monitored with
the refineries equipped with various wastewater streams subject to
precise treatment in well-designed effluent facilities. These treated
effluent streams are reused for various purposes in refineries leading
to substantial reduction in freshwater consumption.
Facilities of Oil Spill Response (OSR) are well developed to handle
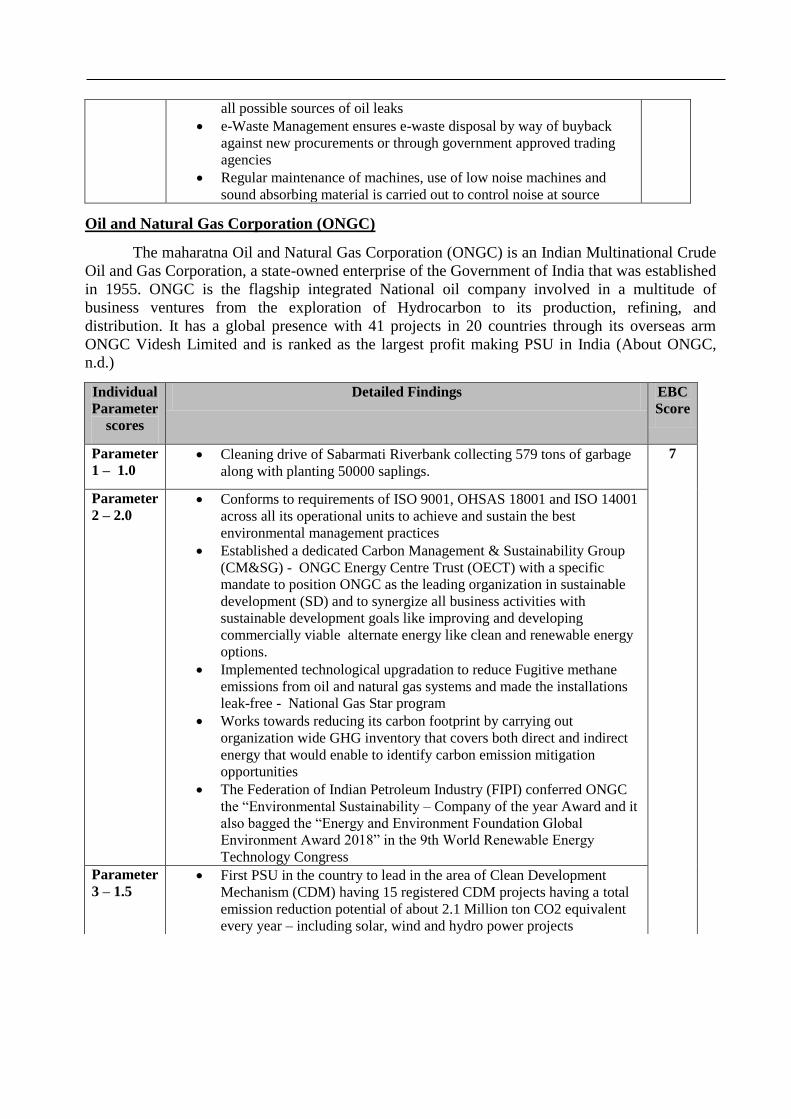
all possible sources of oil leaks
e-Waste Management ensures e-waste disposal by way of buyback
against new procurements or through government approved trading
agencies
Regular maintenance of machines, use of low noise machines and
sound absorbing material is carried out to control noise at source
Oil and Natural Gas Corporation (ONGC)
The maharatna Oil and Natural Gas Corporation (ONGC) is an Indian Multinational Crude
Oil and Gas Corporation, a state-owned enterprise of the Government of India that was established
in 1955. ONGC is the flagship integrated National oil company involved in a multitude of
business ventures from the exploration of Hydrocarbon to its production, refining, and
distribution. It has a global presence with 41 projects in 20 countries through its overseas arm
ONGC Videsh Limited and is ranked as the largest profit making PSU in India (About ONGC,
n.d.)
Individual
Parameter
scores
Detailed Findings EBC
Score
Parameter
1 – 1.0 Cleaning drive of Sabarmati Riverbank collecting 579 tons of garbage
along with planting 50000 saplings.
7
Parameter
2 – 2.0 Conforms to requirements of ISO 9001, OHSAS 18001 and ISO 14001
across all its operational units to achieve and sustain the best
environmental management practices
Established a dedicated Carbon Management & Sustainability Group
(CM&SG) - ONGC Energy Centre Trust (OECT) with a specific
mandate to position ONGC as the leading organization in sustainable
development (SD) and to synergize all business activities with
sustainable development goals like improving and developing
commercially viable alternate energy like clean and renewable energy
options.
Implemented technological upgradation to reduce Fugitive methane
emissions from oil and natural gas systems and made the installations
leak-free - National Gas Star program
Works towards reducing its carbon footprint by carrying out
organization wide GHG inventory that covers both direct and indirect
energy that would enable to identify carbon emission mitigation
opportunities
The Federation of Indian Petroleum Industry (FIPI) conferred ONGC
the “Environmental Sustainability – Company of the year Award and it
also bagged the “Energy and Environment Foundation Global
Environment Award 2018” in the 9th World Renewable Energy
Technology Congress
Parameter
3 – 1.5 First PSU in the country to lead in the area of Clean Development
Mechanism (CDM) having 15 registered CDM projects having a total
emission reduction potential of about 2.1 Million ton CO2 equivalent
every year – including solar, wind and hydro power projects
Conclusions
The key message in this study is that Ecological Business Conscience (EBC) Levels should
increase exponentially in organizations so that it drives actions that ensure the reduction of carbon
footprint and its intensity enabling effective carbon containment. The three businesses examined
in this study show that these firms are becoming “green” in terms of their operations, products &
services - all of them are aggressively using renewable energy in addition to advanced tools &
technologies to reduce their carbon footprint as evidenced by observations & findings based on
available information in secondary data sources detailed in this paper. The EBCI scores of these
companies clearly indicate the potential that each one of these firms has to reduce their carbon
footprint and intensity to contribute meaningfully to ecological balance.
Further, the EBC Index proposed in this study will be useful and can be applied without any
particular industry bias as a diagnostic tool. First, in our country – the fossil (Oil, Coal & Gas)
based state-owned and private corporations need to aggressively build on their current carbon
containment activities. Second, it is clear that renewable energy – both solar & wind will play a
crucial & significant role not only in reducing carbon footprint & intensity but will provide game-
changing cost leverage. This will make organizations competitive in their respective industries as
carbon controls & its management will reduce the overall cost of business operations. The bottom
line is that carbon controls & its effective management should be considered a business imperative
in today’s economic environment, hence more investments need to be made to increase EBC
levels in organizations on a priority basis. This study will provide a framework for firms to
understand their present standing in the path to corporate sustainability and will act as a guide for
organizations to decide on their way forward towards achieving their corporate sustainability
goals.
References
1. About ONGC. (n.d.). About ONGC. https://ongcindia.com/wps/wcm/connect/en/about-ongc/
history/
2. Bleda, M., & Shackley, S. (2008). The dynamics of belief in climate change and its risks in
business organisations. Ecological Economics, 66(2–3), 517–532. https://doi.org/10.1016/j.
ecolecon.2007.10.021
3. Coal India Ltd. (n.d.). Coal India Ltd. (CIL)—About the company. https://www.coalindia.in/en-
us/company/aboutus.aspx
4. Dyllick, T., & Hockerts, K. (2002). Beyond the business case for corporate sustainability. Business
Strategy and the Environment, 11(2), 130–141. https://doi.org/10.1002/bse.323
5. Haas, P. M. (2006). Addressing the Global Governance Deficit. Global Environmental Politics,
4(4), 01–15. https://doi.org/10.1162/glep.2004.4.4.1
Parameter
4 – 2.5 Ensures environmental sustainability by protecting the flora and fauna
through conservation of natural resources and maintaining quality of
soil, air and water by conducting the following activities: Tree
plantation programmes, rain water harvesting, promotion and
installation of environment-friendly technologies (solar energy
systems, improved cook stoves, water recycling unit, etc.);
Carrying out initiatives aimed to reduce, recycle and reuse waste in an
innovative manner adopting various measures like water foot-printing,
rainwater harvesting, sewage treatment plants and seawater
desalination for conservation and sustainable use of fresh water
Waste like e-waste, plastic waste, and metal waste generated at site are
safely disposed-off as per the applicable regulations while ensuring
minimization of waste disposal and reducing the release of waste into
the environment
6. Huang, Y. A., Weber, C. L., & Matthews, H. S. (2009). Categorization of Scope 3 Emissions for
Streamlined Enterprise Carbon Footprinting. Environmental Science & Technology, 43(22), 8509–
8515. https://doi.org/10.1021/es901643a
7. India Energy Outlook—World Energy Outlook Special Report. (2015). India Energy Outlook -
World Energy Outlook Special Report. http://www.iberglobal.com/files/2015/ IndiaEnergy
Outlook.pdf
8. Indian Oil Ltd. - Who we are. (n.d.). Indian Oil Ltd. https://www.iocl.com/aboutus/profile.aspx
9. Jones, C. A., & Levy, D. L. (2009). Business Strategies and Climate Change. In H. Selin & S. D.
VanDeveer (Eds.), Changing Climates in North American Politics (pp. 218–240). The MIT Press.
https://doi.org/10.7551/mitpress/9780262012997.003.0011
10. Lash, J., & Wellington, F. (2007). Competitive Advantage on a Warming Planet. Harvard Business
Review.
11. Levy, D. L. (2015). Business and the evolution of the climate regime: The dynamics of corporate
strategies. In The Business of Global Environmental Governance. MIT Press.
12. List of Maharatna, Navratna and Miniratna CPSEs. (2020, January 1). https://dpe.gov.in/about-
us/divisions/list-maharatna-navratna-and-miniratna-cpses
13. Rediff Business. (2010, August 26). Maharatnas, Navratnas: India’s best PSUs. https://www.rediff.
com/money/slide-show/slide-show-1-the-maharatnas-navratnas-of-india/20100826.htm
14. Salzmann, O. (2008). Corporate Sustainability Management in the Energy Sector. Springer Gabler.
10.1007/978-3-8349-8132-5
15. Schultz, K., & Williamson, P. (2005). Gaining Competitive Advantage in a Carbon-constrained
World: European Management Journal, 23(4), 383–391. https://doi.org/10.1016/j.emj.2005.06.010
16. Timperley, J. (2019, March 14). The Carbon Brief Profile: India. The Carbon Brief Profile: India.
https://www.carbonbrief.org/the-carbon-brief-profile-india
The resource-based view guided sustainable development: a co-citation analysis
Sayantan Khanra1
Rojers P Joseph2
1 Woxsen University, Hyderabad 2Indian Institute of Management Rohtak
Abstract
The conundrum for sustainable development between exploiting resources now and
conserving those resources later may be suitably addressed by the resource-based view (RBV).
However, there is a shortage of studies that systematically inspect the exertion of RBV on the
existing literature on sustainable development. The present study tends to bridge the literature gap
with a co-citation analysis of 595 articles on RBV-guided sustainable development from quality
journals. We identified four major thematic areas, namely eco-friendly firm initiatives, corporate
social responsibility, green supply chain management, and green product manufacturing from the
co-citation analysis. Content analysis of these thematic areas adds significant insights to the extant
literature, whereas a discussion about the evolution of these thematic areas may be appealing to
the practitioners.
Keywords: Corporate social responsibility, eco-friendly firm initiatives, green product
manufacturing, green supply chain management, resource-based view, sustainability, sustainable
development
INDIAN INSTITUTE OF MANAGEMENT KOZHIKODE
Comparison of Regression, ANNS and SVMS methods for
Prediction of The Indian Stock Market
Deepanshu Verma Email: [email protected]
Affiliation – Ambedkar University Delhi
Lothian Road, Kashmere Gate,
Delhi 110006
Abstract
Focusing on Indian context, this paper draws attention towards predicting the movements in stock markets. It
locates and maps the future position of the index, which is portrayed as a benchmark of the entire economy. For the
analysis, NSE was tested for 5 years with techniques of econometrics & soft computing to efficiently predict the index
and safeguard the funds invested by the investors.
For this study, a number of tests were applied and data has been analysed. This study found that SVMs has the
best prediction and outperform in minimising the error while the ANN's model sets back in front of SVMs and
Regression.
Keywords– Stock Market, Regression, Artificial Neural Networks (ANNs), Support Vector Machines (SVMs), Nifty,
India
A. Index Data Set
For this study, there has been identification of 26 crucial features, which affects the Nifty in
India. These factors consist of 9 broad areas from Index, companies, currencies, commodities
market, financial markets, economy, global indices, banking notifications and an outlier –
Demonetization. All these features are transcribed into various variables for numeric
calculations and modelling of the data. The financial data of 5 years from 1st April 2014 - 31
st
March 2019 is broken into 261 weeks’ duration to access data space and larger quantity of data for
accurate prediction model.
In this set of 261 weeks, 183 weeks (70%) will be treated as Training set to feed into the data and
rest 78 weeks (30%) is considered as Training set to verify the prediction accuracy and locating
residuals. The objective of larger proportion for training set is due to feeding of larger data set for
supervised learning and model accuracy purpose.
B. Multiple Regression Model
The regression model applies the given equation for the analysis:
∑ (16)
The values of the features shall be equated using least square estimation to generate optimal
results. The model results are represented using chart, which are given below.
Figure (3a) and (4a) are the set segmented data set for the prediction purpose. The training data has been fitted to the model and testing in the next phase with the real or actual data.
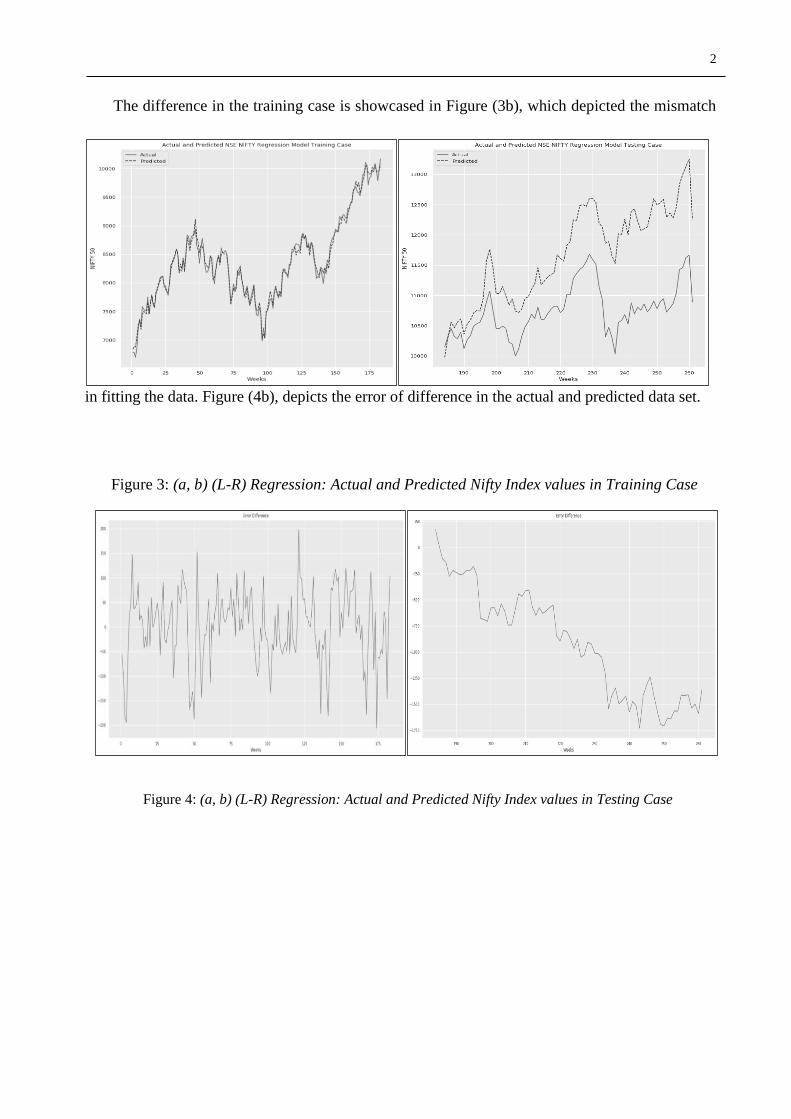
2
The difference in the training case is showcased in Figure (3b), which depicted the mismatch
in fitting the data. Figure (4b), depicts the error of difference in the actual and predicted data set.
Figure 3: (a, b) (L-R) Regression: Actual and Predicted Nifty Index values in Training Case
Figure 4: (a, b) (L-R) Regression: Actual and Predicted Nifty Index values in Testing Case
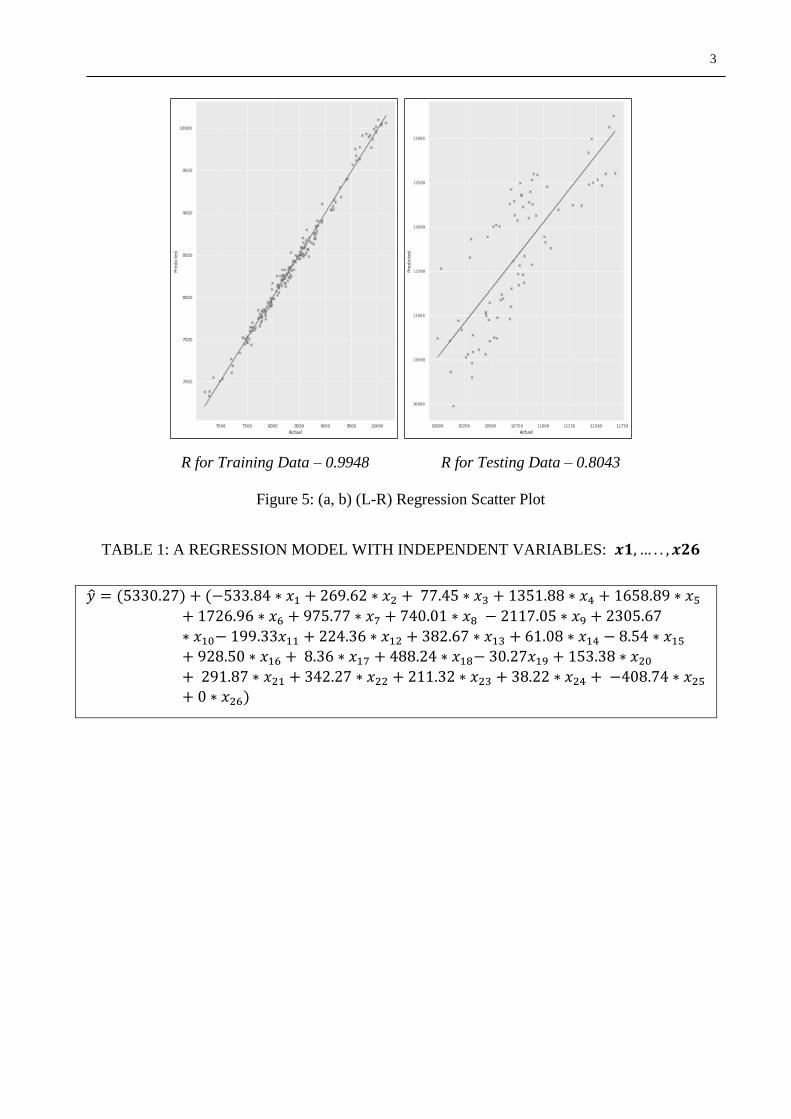
3
R for Training Data – 0.9948 R for Testing Data – 0.8043
Figure 5: (a, b) (L-R) Regression Scatter Plot
TABLE 1: A REGRESSION MODEL WITH INDEPENDENT VARIABLES:
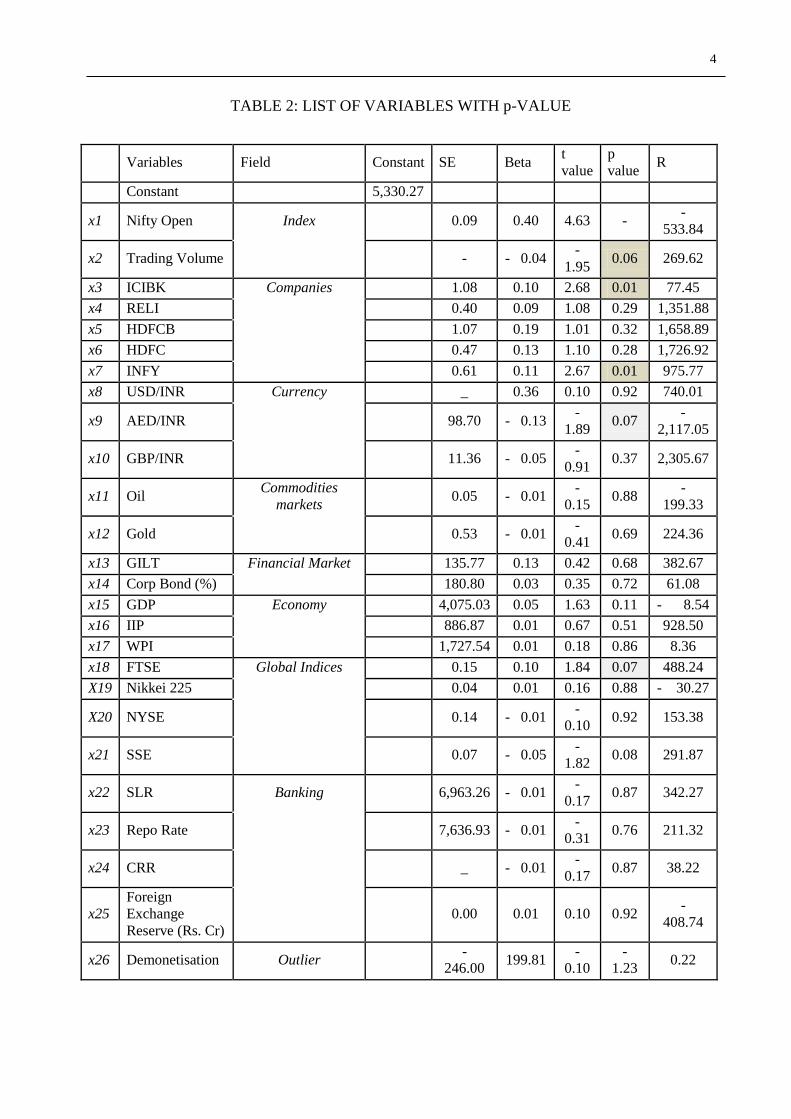
4
TABLE 2: LIST OF VARIABLES WITH p-VALUE
Variables Field Constant SE Beta
t
value
p
value R
Constant
5,330.27
x1 Nifty Open Index
0.09 0.40 4.63 - -
533.84
x2 Trading Volume
- - 0.04 -
1.95 0.06 269.62
x3 ICIBK Companies
1.08 0.10 2.68 0.01 77.45
x4 RELI
0.40 0.09 1.08 0.29 1,351.88
x5 HDFCB
1.07 0.19 1.01 0.32 1,658.89
x6 HDFC
0.47 0.13 1.10 0.28 1,726.92
x7 INFY
0.61 0.11 2.67 0.01 975.77
x8 USD/INR Currency
_ 0.36 0.10 0.92 740.01
x9 AED/INR
98.70 - 0.13 -
1.89 0.07
-
2,117.05
x10 GBP/INR
11.36 - 0.05 -
0.91 0.37 2,305.67
x11 Oil Commodities
markets 0.05 - 0.01
-
0.15 0.88
-
199.33
x12 Gold
0.53 - 0.01 -
0.41 0.69 224.36
x13 GILT Financial Market
135.77 0.13 0.42 0.68 382.67
x14 Corp Bond (%)
180.80 0.03 0.35 0.72 61.08
x15 GDP Economy
4,075.03 0.05 1.63 0.11 - 8.54
x16 IIP
886.87 0.01 0.67 0.51 928.50
x17 WPI
1,727.54 0.01 0.18 0.86 8.36
x18 FTSE Global Indices
0.15 0.10 1.84 0.07 488.24
X19 Nikkei 225
0.04 0.01 0.16 0.88 - 30.27
X20 NYSE
0.14 - 0.01 -
0.10 0.92 153.38
x21 SSE
0.07 - 0.05 -
1.82 0.08 291.87
x22 SLR Banking
6,963.26 - 0.01 -
0.17 0.87 342.27
x23 Repo Rate
7,636.93 - 0.01 -
0.31 0.76 211.32
x24 CRR
_ - 0.01 -
0.17 0.87 38.22
x25
Foreign
Exchange
Reserve (Rs. Cr)
0.00 0.01 0.10 0.92 -
408.74
x26 Demonetisation Outlier
-
246.00 199.81
-
0.10
-
1.23 0.22
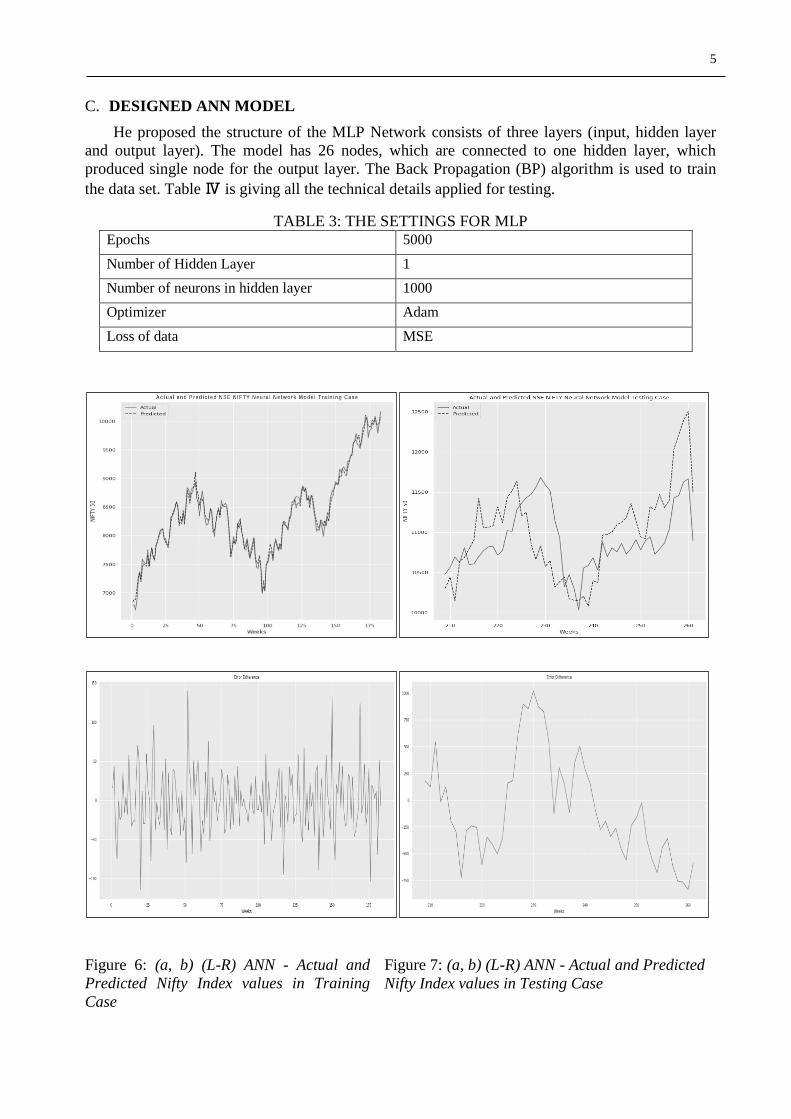
5
C. DESIGNED ANN MODEL
He proposed the structure of the MLP Network consists of three layers (input, hidden layer
and output layer). The model has 26 nodes, which are connected to one hidden layer, which
produced single node for the output layer. The Back Propagation (BP) algorithm is used to train
the data set. Table Ⅳ is giving all the technical details applied for testing.
TABLE 3: THE SETTINGS FOR MLP Epochs 5000
Number of Hidden Layer 1
Number of neurons in hidden layer 1000
Optimizer Adam
Loss of data MSE
Figure 6: (a, b) (L-R) ANN - Actual and
Predicted Nifty Index values in Training
Case
Figure 7: (a, b) (L-R) ANN - Actual and Predicted
Nifty Index values in Testing Case
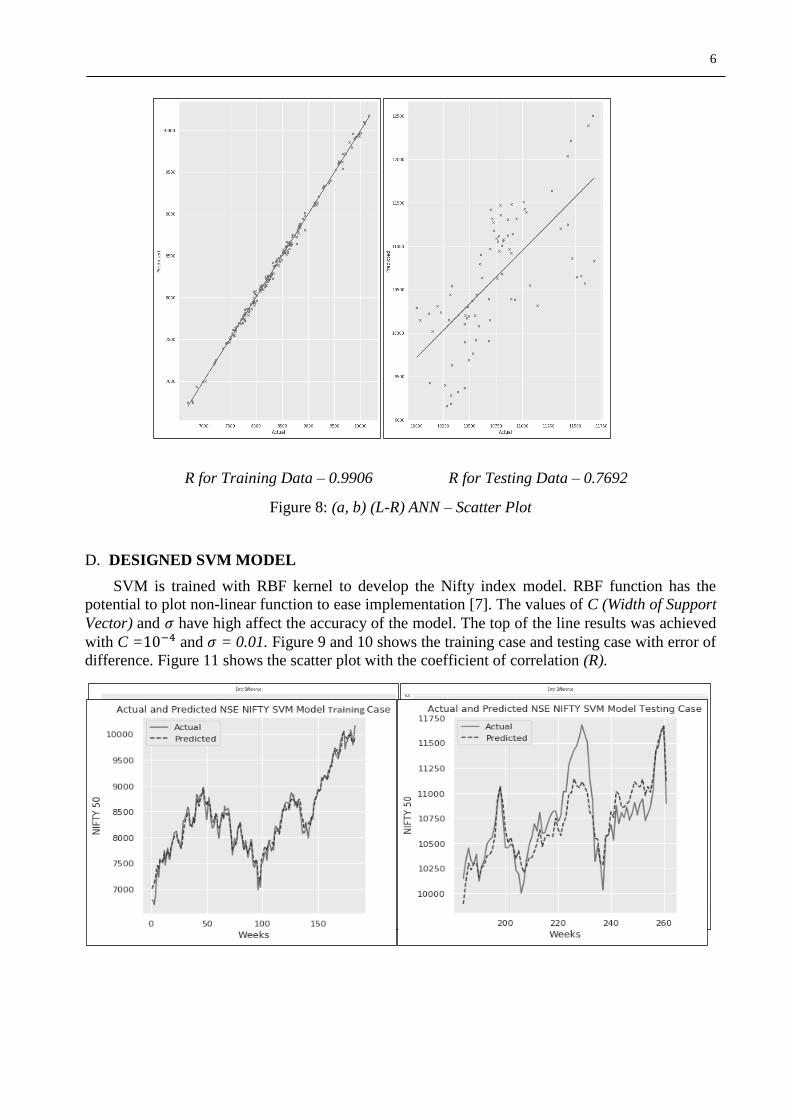
6
R for Training Data – 0.9906 R for Testing Data – 0.7692
Figure 8: (a, b) (L-R) ANN – Scatter Plot
D. DESIGNED SVM MODEL
SVM is trained with RBF kernel to develop the Nifty index model. RBF function has the
potential to plot non-linear function to ease implementation [7]. The values of C (Width of Support
Vector) and have high affect the accuracy of the model. The top of the line results was achieved
with C = and = 0.01. Figure 9 and 10 shows the training case and testing case with error of
difference. Figure 11 shows the scatter plot with the coefficient of correlation (R).
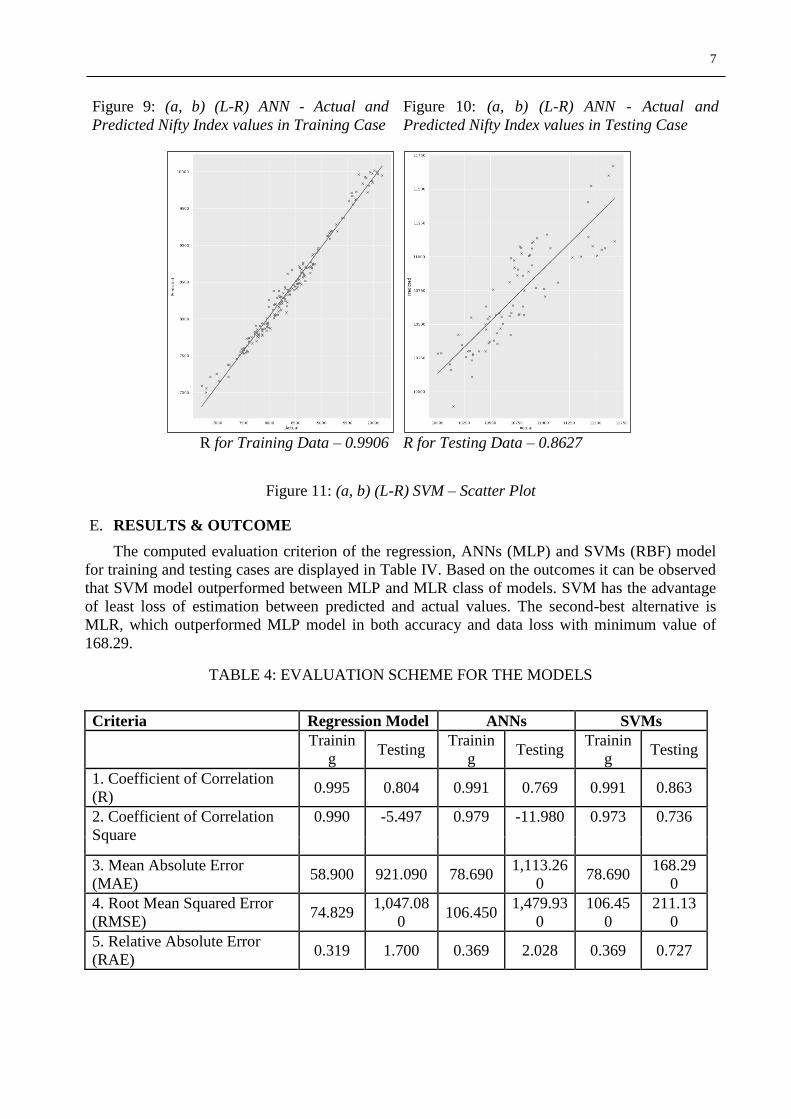
7
Figure 9: (a, b) (L-R) ANN - Actual and
Predicted Nifty Index values in Training Case
Figure 10: (a, b) (L-R) ANN - Actual and
Predicted Nifty Index values in Testing Case
R for Training Data – 0.9906 R for Testing Data – 0.8627
Figure 11: (a, b) (L-R) SVM – Scatter Plot
E. RESULTS & OUTCOME
The computed evaluation criterion of the regression, ANNs (MLP) and SVMs (RBF) model
for training and testing cases are displayed in Table IV. Based on the outcomes it can be observed
that SVM model outperformed between MLP and MLR class of models. SVM has the advantage
of least loss of estimation between predicted and actual values. The second-best alternative is
MLR, which outperformed MLP model in both accuracy and data loss with minimum value of
168.29.
TABLE 4: EVALUATION SCHEME FOR THE MODELS
Criteria Regression Model ANNs SVMs
Trainin
g Testing
Trainin
g Testing
Trainin
g Testing
1. Coefficient of Correlation
(R) 0.995 0.804 0.991 0.769 0.991 0.863
2. Coefficient of Correlation
Square
0.990 -5.497 0.979 -11.980 0.973 0.736
3. Mean Absolute Error
(MAE) 58.900 921.090 78.690
1,113.26
0 78.690
168.29
0
4. Root Mean Squared Error
(RMSE) 74.829
1,047.08
0 106.450
1,479.93
0
106.45
0
211.13
0
5. Relative Absolute Error
(RAE) 0.319 1.700 0.369 2.028 0.369 0.727
8
F. CONCLUSION AND FUTURE WORK
In this paper, we scrutinized and analysed data set on the different prediction models –
Regression, ANNs and SVMs for the prediction of Nifty. Using these models, we produced
Training and Testing results. Based on these results it is observed that these 26 features of
economic and market movement significantly affect the market movement for the specified during
the study.
The data was bundled on a weekly basis to mitigate any event loss. Between the generated
models, SVM models outperformed in predicting the stock market movement with minimised loss
of data function. All the results are verified using the evaluation criterion set.
For future work, there should be more focus on new and developing soft computing and
machine learning techniques to forecast and build a more robust model that emphasise on
increasing the accuracy even more.
G. REFERENCES
[1] Alaa F. Sheta (2015). A Comparison between Regression, Artificial Neural Networks and Support Vector
Machines for Predicting Stock Market Index - (IJARAI) International Journal of Advanced Research in
Artificial Intelligence, Vol. 4, No.7.
[2] Mingyue Qiu (2016). Application of artificial neural network for the prediction of stock market returns: The
case of the Japanese stock market -Chaos, Solitons and Fractals 85: 1–7.
[3] Hakob Grigoryan (2015). An Artificial Neural Network for Data Forecasting Purposes”, Informatica
Economică vol. 19.
[4] Amin Hedayati Moghaddam (2016). The Stock market index prediction using artificial neural network:
Journal of Economics, Finance and Administrative Science Volume 21, Issue 41, December pp. 89-93.
[5] Y. Kara (2011). Predicting direction of stock price index movement using artificial neural networks and
support vector machines: The sample of the Istanbul stock exchange, Expert Syst. Appl., vol. 38.
[6] Diebold, F., & Yilmaz, K. (2008). Macroeconomic Volatility and Stock Market Volatility, Worldwide. NBER
Working Paper No. 14269 (N)
[7] Kwon, C., & Shin, T. (1999). Co-integration and causality between macroeconomic variables and stock market
returns. Global Finance Journal, 10 (1), 71-81.
[8] Shangkun DENG, (2011). Combining Technical Analysis with Sentiment Analysis for Stock Price Prediction:
Ninth IEEE International Conference on Dependable, Autonomic and Secure Computing, pp. 5-8.
[9] Mukhopadhyay, D., & Sarkar, N. (2003). Stock return and macroeconomic fundamentals in model-
specification framework: Evidence from Indian stock market. Indian Statistical Institute Economic Research
Unit, ERU 2003-05 Discussion Paper, 1-28.
[10] Schwert, G. (1990). Stock Returns and Real Activity: A Century of Evidence. Journal of Finance, 45, 1237-
1257.
[11] W. Shen (2008). Forecasting stock indices using radial basis function neural networks optimized by artificial
fish swarm algorithm,” vol. 24, no. 3, pp. 378–38.
[12] X. Zhu (2008). Predicting stock index increments by neural networks: The role of trading volume under
different horizons. Expert System Application, vol. 34, no. 4, pp. 3043–3054.
INDIAN INSTITUTE OF MANAGEMENT KOZHIKODE
A Comprehensive Framework for Assessment of e-Government Services
Sayantan Khanra
Assistant Professor, School of Business, Woxsen University, Hyderabad – 502345, India.
Email: [email protected]
Rojers P Joseph [email protected] Assistant Professor, Indian Institute of Management Rohtak, Haryana – 124010,
India. Email: [email protected]
Abstract
Standardised approaches to assess e-Government services are rare in the prior literature. This study
identified key themes of mature e-Governance following a meta-ethnography approach. The study findings
suggests that online presence, facilitating interaction, integrated ecosystem, online payments, and
participatory e-Democracy are key themes of a mature e-Government system. Subsequently, we developed
an assessment framework using these themes. Furthermore, the framework is validated by assessing an
Indian e-Government service. The framework may help practitioners in assessing e-Government services
using a simple yet efficient framework, which may potentially emerge as a powerful tool for rating such
services.
Keywords: Assessment Framework, BHIM app, E-Governance, Meta-ethnography, Online services,
Service rating.
INDIAN INSTITUTE OF MANAGEMENT KOZHIKODE
Impact of Co-creation in the practice of developing IoT solutions
Vishal Goyal
IIM Lucknow ([email protected])
B-1, Institutional Area, Block B, Industrial Area, Sector 62, Noida, Uttar Pradesh 201307
Anita Goyal
IIM Lucknow ([email protected])
B-1, Institutional Area, Block B, Industrial Area, Sector 62, Noida, Uttar Pradesh 201307
Abstract
Co-creation happens whenever companies interact with customers right from conception, design,
customization, promotion or selling. Companies turn to co-creation to share resources, knowledge, risk and
develop new solutions. This article studies co-creation in the context of the Internet of Things (IoT). In an
IoT ecosystem, physical things are interconnected through the internet and interact to solve broad range of
requirements. IoT offers immense potential by a number of use cases and requires coordination between
various stakeholders. This article analyses the penetration of co-creation in IoT and of IoT companies'
involvement in co-creation. The study analyzes secondary qualitative data consisting of literature, media
interviews of IoT leaders and partner listing on company websites using “R” and google gvis utility. The
article proposes that co-creation can be used to develop a portfolio of customers and solutions.
Keywords : Internet of things, Co-creation, Ecosystem, Open Innovation, Business, Innovation, network,
platform
Introduction
Information technologies have drastically reduced the cost of coordination and this has led to
the innovation ecosystem as a core element of growth strategies by firms in a wide range of
Industries. Co-creation happens whenever companies interact with customers right from
conception, design, customization, promotion or selling (Chen, Ou Yang & Leo, 2017). This has
led to the importance of co-creation in the IoT ecosystem. IoT is a highly distributed system where
devices are connected to themselves and to human beings via embedded systems, components of
processing and connectivity (Woodside and Sood, 2017). IoT devices are communicating for
various purposes such as sensing, communication and data collection.
IoT is opening up a large number of use cases, services, and value which were not imaginable
earlier (Murray et al., 2016). IoT offers immense potential to virtually all sectors by enabling
innovative applications to consumers, firms and governments. Existing literature discussed co-
creation in general and its application in IoT but they have not analyzed penetration and level of
involvement of IoT companies in co-creation.
This article will address the following objectives of understanding co-creation in the context
of IoT.
- Understanding the involvement of IoT companies in practicing co-creation
To address the objective, we have undertaken two studies—first, literature review and word
analysis of literature. Second, word analysis of media interviews of TOP IoT leaders across the
world. We have analyzed the number of partners on the websites of various IoT companies. This
would help to understand the actual practice of co-creation in developing solutions and reaching
customers.
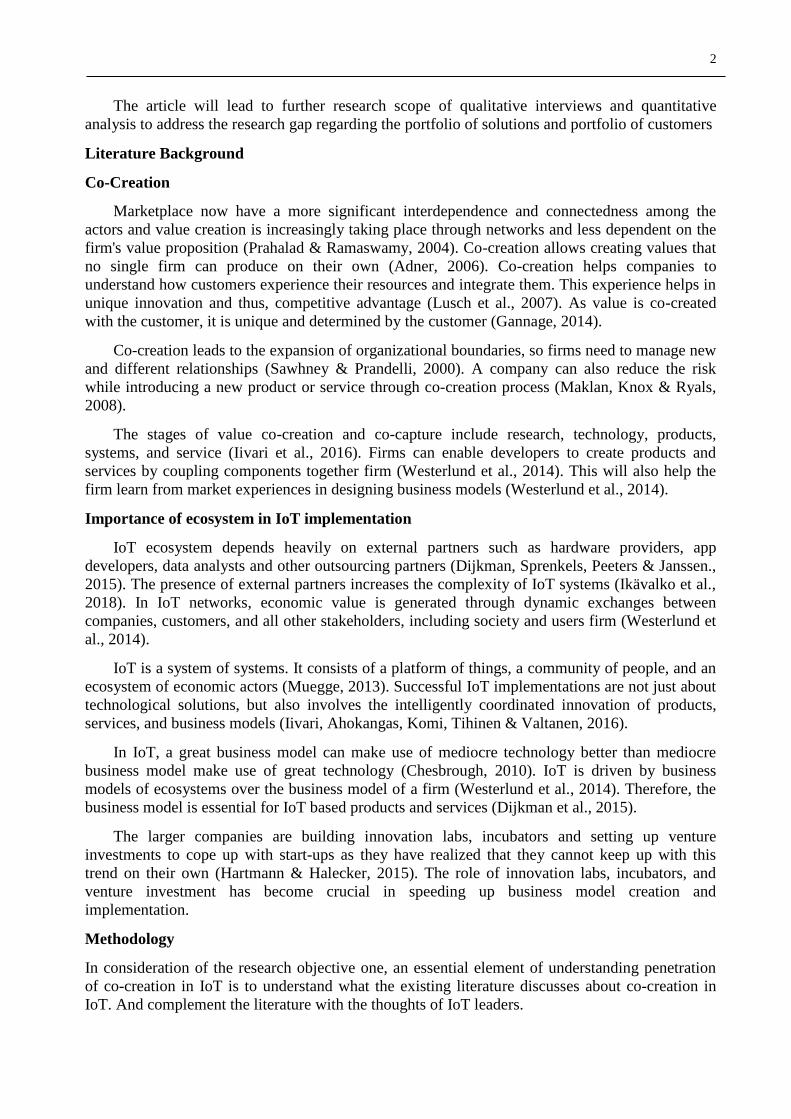
2
The article will lead to further research scope of qualitative interviews and quantitative
analysis to address the research gap regarding the portfolio of solutions and portfolio of customers
Literature Background
Co-Creation
Marketplace now have a more significant interdependence and connectedness among the
actors and value creation is increasingly taking place through networks and less dependent on the
firm's value proposition (Prahalad & Ramaswamy, 2004). Co-creation allows creating values that
no single firm can produce on their own (Adner, 2006). Co-creation helps companies to
understand how customers experience their resources and integrate them. This experience helps in
unique innovation and thus, competitive advantage (Lusch et al., 2007). As value is co-created
with the customer, it is unique and determined by the customer (Gannage, 2014).
Co-creation leads to the expansion of organizational boundaries, so firms need to manage new
and different relationships (Sawhney & Prandelli, 2000). A company can also reduce the risk
while introducing a new product or service through co-creation process (Maklan, Knox & Ryals,
2008).
The stages of value co-creation and co-capture include research, technology, products,
systems, and service (Iivari et al., 2016). Firms can enable developers to create products and
services by coupling components together firm (Westerlund et al., 2014). This will also help the
firm learn from market experiences in designing business models (Westerlund et al., 2014).
Importance of ecosystem in IoT implementation
IoT ecosystem depends heavily on external partners such as hardware providers, app
developers, data analysts and other outsourcing partners (Dijkman, Sprenkels, Peeters & Janssen.,
2015). The presence of external partners increases the complexity of IoT systems (Ikävalko et al.,
2018). In IoT networks, economic value is generated through dynamic exchanges between
companies, customers, and all other stakeholders, including society and users firm (Westerlund et
al., 2014).
IoT is a system of systems. It consists of a platform of things, a community of people, and an
ecosystem of economic actors (Muegge, 2013). Successful IoT implementations are not just about
technological solutions, but also involves the intelligently coordinated innovation of products,
services, and business models (Iivari, Ahokangas, Komi, Tihinen & Valtanen, 2016).
In IoT, a great business model can make use of mediocre technology better than mediocre
business model make use of great technology (Chesbrough, 2010). IoT is driven by business
models of ecosystems over the business model of a firm (Westerlund et al., 2014). Therefore, the
business model is essential for IoT based products and services (Dijkman et al., 2015).
The larger companies are building innovation labs, incubators and setting up venture
investments to cope up with start-ups as they have realized that they cannot keep up with this
trend on their own (Hartmann & Halecker, 2015). The role of innovation labs, incubators, and
venture investment has become crucial in speeding up business model creation and
implementation.
Methodology
In consideration of the research objective one, an essential element of understanding penetration
of co-creation in IoT is to understand what the existing literature discusses about co-creation in
IoT. And complement the literature with the thoughts of IoT leaders.
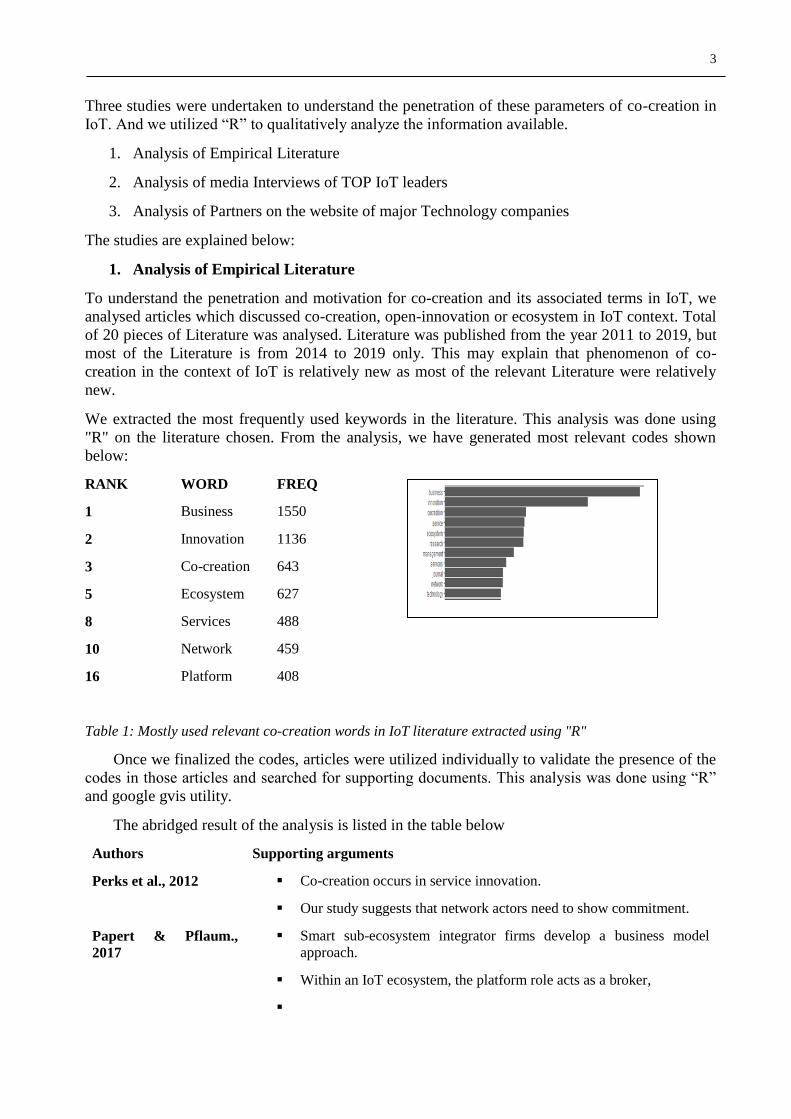
3
Three studies were undertaken to understand the penetration of these parameters of co-creation in
IoT. And we utilized “R” to qualitatively analyze the information available.
1. Analysis of Empirical Literature
2. Analysis of media Interviews of TOP IoT leaders
3. Analysis of Partners on the website of major Technology companies
The studies are explained below:
1. Analysis of Empirical Literature
To understand the penetration and motivation for co-creation and its associated terms in IoT, we
analysed articles which discussed co-creation, open-innovation or ecosystem in IoT context. Total
of 20 pieces of Literature was analysed. Literature was published from the year 2011 to 2019, but
most of the Literature is from 2014 to 2019 only. This may explain that phenomenon of co-
creation in the context of IoT is relatively new as most of the relevant Literature were relatively
new.
We extracted the most frequently used keywords in the literature. This analysis was done using
"R" on the literature chosen. From the analysis, we have generated most relevant codes shown
below:
RANK WORD FREQ
1 Business 1550
2 Innovation 1136
3 Co-creation 643
5 Ecosystem 627
8 Services 488
10 Network 459
16 Platform 408
Table 1: Mostly used relevant co-creation words in IoT literature extracted using "R"
Once we finalized the codes, articles were utilized individually to validate the presence of the
codes in those articles and searched for supporting documents. This analysis was done using “R”
and google gvis utility.
The abridged result of the analysis is listed in the table below
Authors Supporting arguments
Perks et al., 2012 Co-creation occurs in service innovation.
Our study suggests that network actors need to show commitment.
Papert & Pflaum.,
2017
Smart sub-ecosystem integrator firms develop a business model
approach.
Within an IoT ecosystem, the platform role acts as a broker,
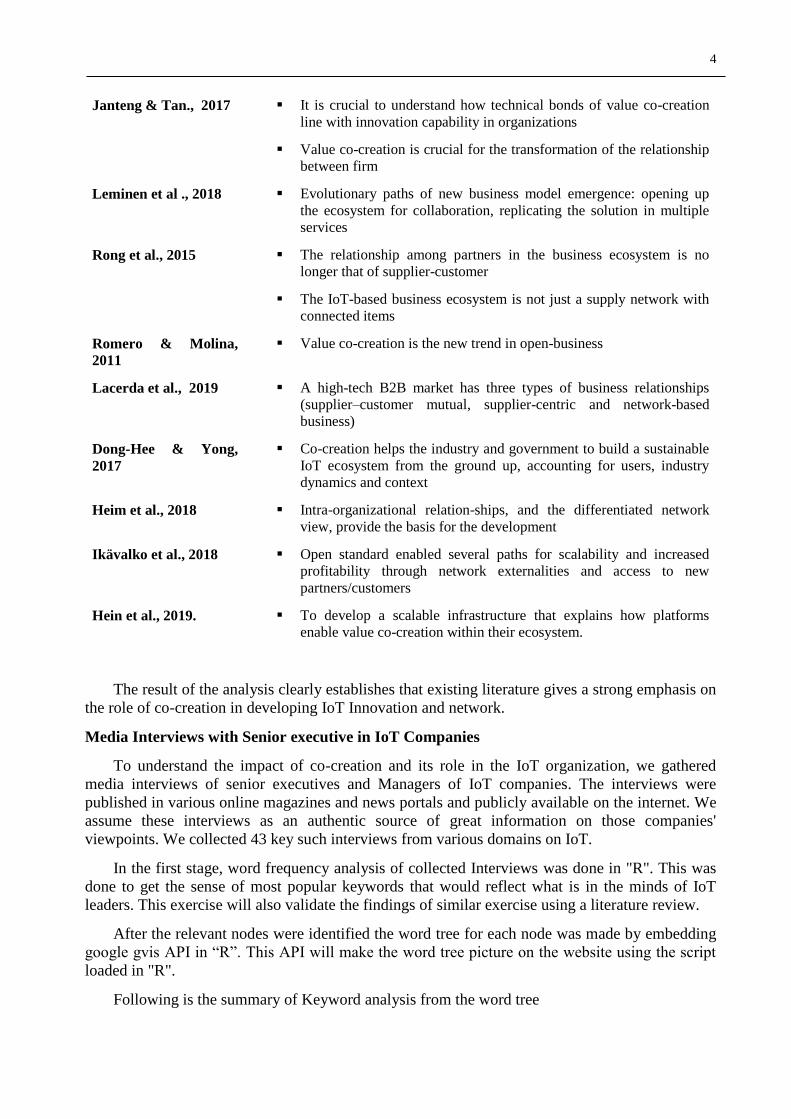
4
Janteng & Tan., 2017 It is crucial to understand how technical bonds of value co-creation
line with innovation capability in organizations
Value co-creation is crucial for the transformation of the relationship
between firm
Leminen et al ., 2018 Evolutionary paths of new business model emergence: opening up
the ecosystem for collaboration, replicating the solution in multiple
services
Rong et al., 2015 The relationship among partners in the business ecosystem is no
longer that of supplier-customer
The IoT-based business ecosystem is not just a supply network with
connected items
Romero & Molina,
2011
Value co-creation is the new trend in open-business
Lacerda et al., 2019 A high-tech B2B market has three types of business relationships
(supplier–customer mutual, supplier-centric and network-based
business)
Dong-Hee & Yong,
2017
Co-creation helps the industry and government to build a sustainable
IoT ecosystem from the ground up, accounting for users, industry
dynamics and context
Heim et al., 2018 Intra-organizational relation-ships, and the differentiated network
view, provide the basis for the development
Ikävalko et al., 2018 Open standard enabled several paths for scalability and increased
profitability through network externalities and access to new
partners/customers
Hein et al., 2019. To develop a scalable infrastructure that explains how platforms
enable value co-creation within their ecosystem.
The result of the analysis clearly establishes that existing literature gives a strong emphasis on
the role of co-creation in developing IoT Innovation and network.
Media Interviews with Senior executive in IoT Companies
To understand the impact of co-creation and its role in the IoT organization, we gathered
media interviews of senior executives and Managers of IoT companies. The interviews were
published in various online magazines and news portals and publicly available on the internet. We
assume these interviews as an authentic source of great information on those companies'
viewpoints. We collected 43 key such interviews from various domains on IoT.
In the first stage, word frequency analysis of collected Interviews was done in "R". This was
done to get the sense of most popular keywords that would reflect what is in the minds of IoT
leaders. This exercise will also validate the findings of similar exercise using a literature review.
After the relevant nodes were identified the word tree for each node was made by embedding
google gvis API in “R”. This API will make the word tree picture on the website using the script
loaded in "R".
Following is the summary of Keyword analysis from the word tree
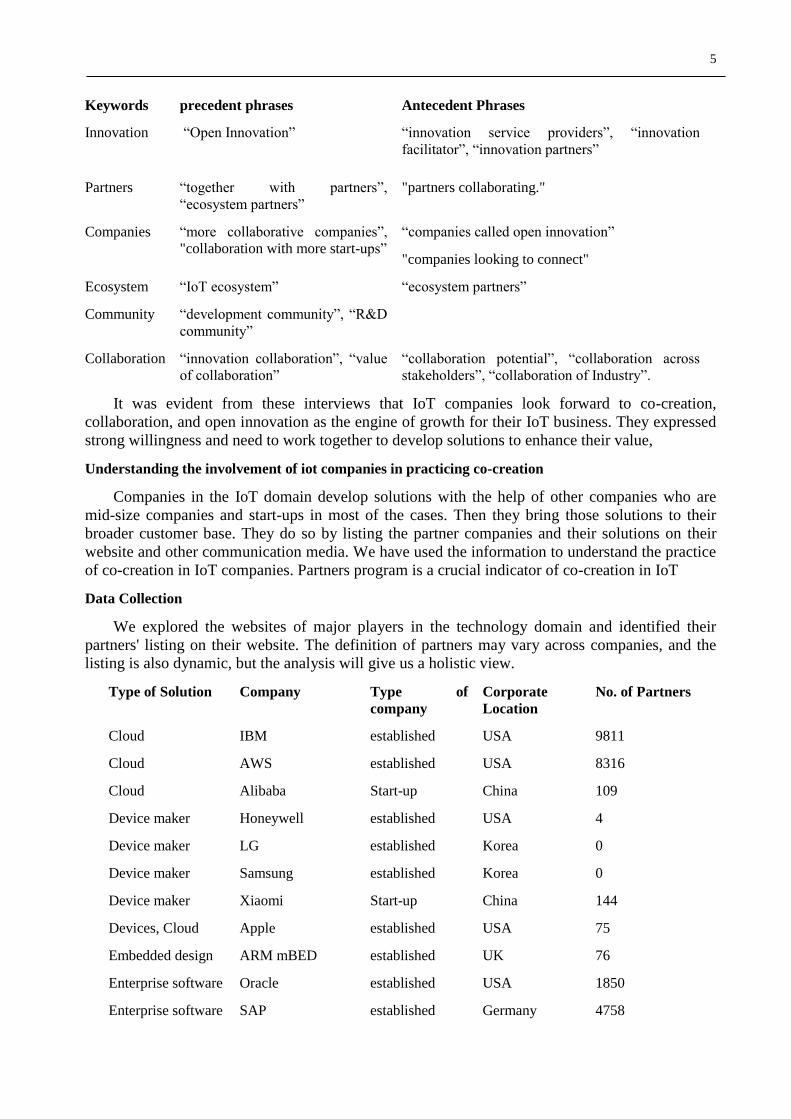
5
Keywords precedent phrases Antecedent Phrases
Innovation “Open Innovation”
“innovation service providers”, “innovation
facilitator”, “innovation partners”
Partners “together with partners”,
“ecosystem partners”
"partners collaborating."
Companies “more collaborative companies”,
"collaboration with more start-ups”
“companies called open innovation”
"companies looking to connect"
Ecosystem “IoT ecosystem” “ecosystem partners”
Community “development community”, “R&D
community”
Collaboration “innovation collaboration”, “value
of collaboration”
“collaboration potential”, “collaboration across
stakeholders”, “collaboration of Industry”.
It was evident from these interviews that IoT companies look forward to co-creation,
collaboration, and open innovation as the engine of growth for their IoT business. They expressed
strong willingness and need to work together to develop solutions to enhance their value,
Understanding the involvement of iot companies in practicing co-creation
Companies in the IoT domain develop solutions with the help of other companies who are
mid-size companies and start-ups in most of the cases. Then they bring those solutions to their
broader customer base. They do so by listing the partner companies and their solutions on their
website and other communication media. We have used the information to understand the practice
of co-creation in IoT companies. Partners program is a crucial indicator of co-creation in IoT
Data Collection
We explored the websites of major players in the technology domain and identified their
partners' listing on their website. The definition of partners may vary across companies, and the
listing is also dynamic, but the analysis will give us a holistic view.
Type of Solution Company Type of
company
Corporate
Location
No. of Partners
Cloud IBM established USA 9811
Cloud AWS established USA 8316
Cloud Alibaba Start-up China 109
Device maker Honeywell established USA 4
Device maker LG established Korea 0
Device maker Samsung established Korea 0
Device maker Xiaomi Start-up China 144
Devices, Cloud Apple established USA 75
Embedded design ARM mBED established UK 76
Enterprise software Oracle established USA 1850
Enterprise software SAP established Germany 4758
6
Network LoRa Alliance Start-up France 577
Network Sigfox Start-up France 696
Network Airtel established India 0
Network Vodafone established UK 97
Network devices HP Enterprise established USA 70
Semiconductor STMicroelectronics established Switzerland 221
Semiconductor Texas Instruments established USA 369
Semiconductor NXP established Netherland 280
System Integrator Hitachi Vintara established Japan 39
System Integrator Huawei established China 140
Table 1: Analysis of Partners on the website of major Technology companies
Data and Results
a) Cloud and Enterprise software companies have a large number of partners. Cloud
and Enterprise companies need several unique devices to connect to their platform, so they
need partners who develop unique solutions to make their solution more attractive to end
customers.
b) The partner ecosystem is prevalent in the Americas and Europe: Most of the Cloud
and embedded software companies originate from the Americas and Europe, and so co-
creation is commonplace in those regions.
c) Asia is yet to adopt co-creation in a significant way: Asian companies still do the
business in traditional methods and try to develop the whole solution in-house.
d) Start-up companies have adopted co-creation in a big way: Start-up companies lack
internal resources and aim to reach the scale in no time. The possibility to enroll co-
creation partners helps them increase the attractiveness of their platform and attract more
end customers.
Conclusion
As initially planned, we undertook a qualitative study of literature and secondary data to
address our objective. Analysis of empirical literature highlight keywords such as Business,
Innovation, Co-creation, Ecosystem, Network, Platform and Customers. Study of media interview
of IoT leaders highlighted keywords such as Innovation, Partners, Companies, Ecosystem,
Community and Collaboration. Media Interview also confirmed findings of literature review. The
words are synonymous and put a strong emphasis on the need and importance of co-creation in
this area.
We also analyzed the actual practice of Co-creation by analysing the Partner listing on IoT
Companies website. We identified that Co-creation is practiced by many IoT companies. It is
more prevalent in Europe and USA. Startups companies have adopted co-creation in a big way.
A company may develop a portfolio of customers not only on direct business expectation and
geographical reach but also to develop solutions for a broader customer base. It can set different
expectations from a different set of customers. Every customer will not give the same level of
business or commitment to the company.
7
Co-creation can help to bring solutions customized to a wide range of use-cases. Companies
may enable a basic solution and allows customers to co-create solutions. The co-created solutions
become part of solutions that companies can offer to other customers. In this way, they can make
the solution attractive.
We also feel the need to analyze further if companies can create a positive force for
themselves among the customer community once they have started co-creating projects with a
bunch of customers. As co-creation is emerging a strategic tool in IoT space, it should be
researched how many companies use co-creation as a strategic tool to align key performance
indicators of their manager to the extent of successful co-creation executed by them.
References
1. Adner, R. (2006). Match your innovation strategy to your innovation ecosystem. Harvard Business
Review, 84, 98-107.
2. Chen, T., Ou Yang, S. and Leo, C. (2017), “The beginning of value co-creation: understanding
dynamics, efforts and betterment”, Journal of Service Theory and Practice, Vol. 27 No. 6, pp.
1145-1166.
3. Chesbrough, H. (2010) Business Model Innovation: Opportunities and Barriers. Long Range
Planning, Vol. 43, No. 2-3, pp. 354-363.
4. Dijkman, R. M., Sprenkels, B., Peeters, T., & Janssen, A. (2015). Business models for the Internet
of Things. International Journal of Information Management, 35(6), 672-678.
5. Dong-Hee, S., & Yong, J. P. (2017). Understanding the internet of things ecosystem: Multi-level
analysis of users, society, and ecology. Digital Policy, Regulation and Governance, 19(1), 77-100.
6. Gannage Jr., G. J. (2014). A discussion of goods-dominant logic and service dominant logic: A
synthesis and application for service marketers. Journal of Service Science (Online).
7. Hartmann, M., & Halecker, B. (2015). Management of innovation in the industrial internet of
things. Manchester: The International Society for Professional Innovation Management (ISPIM).
8. Heim, I., Han, T., & Ghobadian, A. (2018). Value co-creation in ICT services company: A case
study of a cross-border acquisition. Journal of East - West Business, 24(4), 319-338.
9. Hein, A., Weking, J., Schreieck, M., Wiesche, M., Böhm, M., & Krcmar, H. (2019). Value co-
creation practices in business-to-business platform ecosystems. Electronic Markets, 29(3), 503-
518.
10. Iivari, M. M., Ahokangas, P., Komi, M., Tihinen, M., & Valtanen, K. (2016). Toward ecosystemic
business models in the context of industrial internet. Journal of Business Models, 4(2), 42-59.
11. Ikävalko, H., Turkama, P., & Smedlund, A. (2018). Value creation in the internet of things:
Mapping business models and ecosystem roles. Technology Innovation Management Review, 8(3),
5-15.
12. Janteng, J., & Tan, C. L. (2017). Effects of value co-creation on innovation capability: Knowledge
sharing as a moderator. Kidmore End: Academic Conferences International Limited. Retrieved
from
13. Lacerda, F., Lima-Marques, M., & Resmini, A. (2019). An information architecture framework for
the internet of things. Philosophy & Technology, 32(4), 727-744.
14. Leminen, S., Rajahonka, M., Westerlund, M., & Wendelin, R. (2018). The future of the internet of
things: Toward heterarchical ecosystems and service business models. The Journal of Business &
Industrial Marketing, 33(6), 749-767.
15. Lusch, R. F., Vargo, S. L., & O'Brien, M. (2007). Competing through service: Insights from
service-
16. Maklan, S., Knox, S. and Ryals, L. (2008), “New trends in innovation and customer relationship
management”, International Journal of Market Research, Vol. 50 No. 2, pp. 221-40.
17. Muegge, S. 2013. Platforms, Communities, and Business Ecosystems: Lessons Learned About
Technology Entrepreneurship in an Interconnected World. Technology Innovation Management
Review, 3(2): 5-15.
18. Murray, A., Papa, A., Cuozzo, B., & Russo, G. (2016). Evaluating the innovation of the internet of
things: Empirical evidence from the intellectual capital assessment. Business Process Management
Journal, 22(2), 341-356.
8
19. Papert, M., & Pflaum, A. (2017). Development of an ecosystem model for the realization of
internet of things (IoT) services in supply chain management. Electronic Markets, 27(2), 175-189.
20. Perks, H., Gruber, T., & Edvardsson, B. (2012). Co-creation in radical service innovation: A
systematic analysis of microlevel processes. The Journal of Product Innovation
Management, 29(6), 935.
21. Prahalad, C.K. and Ramaswamy, V. (2004), The Future of Competition: Co-creating Unique Value
with Customers, Harvard Business School Press, Boston, MA.
22. Romero, D., & Molina, A. (2011). Collaborative networked organisations and customer
communities:Value co-creation and co-innovation in the networking era. Production Planning &
Control, 22(5-6), 447.
23. Rong, K., Hu, G., Lin, Y., Shi, Y., & Guo, L. (2015). Understanding business ecosystem using a
6C framework in internet-of-things-based sectors. International Journal of Production
Economics, 159, 41.
24. Sawhney, M., & Prandelli, E. (2000). Communities of creation: Managing distributed innovation in
turbulent markets. California Management Review, 42(4), 24-54.
25. Westerlund, M., Leminen, S., & Rajahonka, M. (2014). Designing business models for the internet
of things. Technology Innovation Management Review, 4(7), 5-14.
26. Woodside, A. G., & Sood, S. (2017). Vignettes in the two-step arrival of the internet of things and
its reshaping of marketing management's service-dominant logic. Journal of Marketing
Management, 33(1-2), 98-110.
Product Differentiation Dominance in an Oligopolistic Market: A Bibliometric Study
Keshvi Nandu1, Foram Shah2, Anupriya Maliwal3, Anuj Shah4 and Dev
Derasari5 1,2,3,4 & 5 Ahmedabad University, Commerce Six Roads, Navrangpura, Ahmedabad - 380 009
Gujarat, India
Abstract Oligopoly as a form of market is making a comeback through the emerging markets of Online Connectivity and Communication which is making the research related to Oligopoly more-and-more relevant. The main aim of this paper, through Bibliometric Analysis, is to guide researchers and market players who are willing to explore the area of Oligopoly so that they know what is the trend in the research, which journals, countries, keywords and authors to refer when studying this concept and which are the key areas that have been researched thoroughly. The tools used for our Bibliometric Analysis are VosViewer and Citespace. The findings will work as a roadmap for future research by illustrating the evolution of research over time, areas of research interests and potential future directions.
Keywords– Oligopoly, competition, bibliometric analysis, price war, product differentiation, cournot model, bertrand model, trend analysis, citespace analysis, VOSviewer, citation analysis
INTRODUCTION: A new era of Oligopoly is emerging in the market such as mobile and computer operating systems and cellular networks which makes the functioning of the Oligopoly market a relevant field of research in the coming years. The way in which business is conducted in an Oligopoly is unorthodox as the suppliers have more power than the market and can change the whole market set-up with their single decision. Crude and gas industry was once known as the most valuable market because all the other markets were dependent on it. The connectivity industry is the new crude and gas industry. While crude and gas have been an oligopoly from ages, all the markets under the connectivity industry are trying to be one. Substantial research in the domain of Oligopoly has been done in the past but new scopes are emerging to analyse how the new oligopolies function. Our research has identified 1290 research papers published in the last decade, from 2011 to 2020. The focus of this research is to do bibliometric analysis of the research papers identified to map the trends and key areas related to Oligopoly and Product Differentiation and strengthen the research in the domain of Oligopoly.
This paper can be used as fertile soil for any crop that a researcher wants to grow in the field of Oligopoly. It is a single-window from which the researchers and practitioners can extract all the significant information related to Oligopoly and production and service differentiation to support their research or use it in their field of practice. REASON FOR STUDY: The purpose of the Bibliometric Analysis is to trace out the growth and development of Product and Service Differentiation in an Oligopoly market. The analysis was also intended to draw inferences about the collaboration among authors, references, countries and keywords. This paper also led to significant importance in computing high-yield authorship, countries, keywords and references and the nature of relationship between the cluster and the yield generated. This paper also intends to analyze the intention behind the
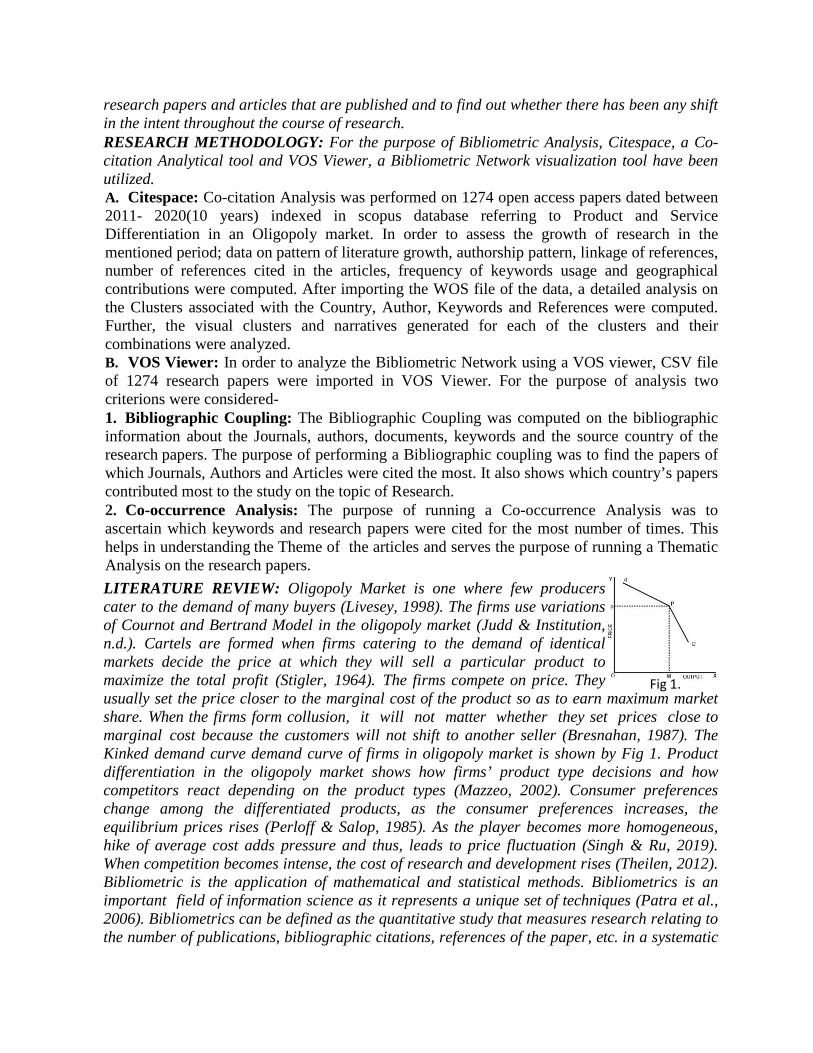
research papers and articles that are published and to find out whether there has been any shift in the intent throughout the course of research. RESEARCH METHODOLOGY: For the purpose of Bibliometric Analysis, Citespace, a Co-citation Analytical tool and VOS Viewer, a Bibliometric Network visualization tool have been utilized. A. Citespace: Co-citation Analysis was performed on 1274 open access papers dated between 2011- 2020(10 years) indexed in scopus database referring to Product and Service Differentiation in an Oligopoly market. In order to assess the growth of research in the mentioned period; data on pattern of literature growth, authorship pattern, linkage of references, number of references cited in the articles, frequency of keywords usage and geographical contributions were computed. After importing the WOS file of the data, a detailed analysis on the Clusters associated with the Country, Author, Keywords and References were computed. Further, the visual clusters and narratives generated for each of the clusters and their combinations were analyzed. B. VOS Viewer: In order to analyze the Bibliometric Network using a VOS viewer, CSV file of 1274 research papers were imported in VOS Viewer. For the purpose of analysis two criterions were considered- 1. Bibliographic Coupling: The Bibliographic Coupling was computed on the bibliographic information about the Journals, authors, documents, keywords and the source country of the research papers. The purpose of performing a Bibliographic coupling was to find the papers of which Journals, Authors and Articles were cited the most. It also shows which country’s papers contributed most to the study on the topic of Research. 2. Co-occurrence Analysis: The purpose of running a Co-occurrence Analysis was to ascertain which keywords and research papers were cited for the most number of times. This helps in understanding the Theme of the articles and serves the purpose of running a Thematic Analysis on the research papers. LITERATURE REVIEW: Oligopoly Market is one where few producers cater to the demand of many buyers (Livesey, 1998). The firms use variations of Cournot and Bertrand Model in the oligopoly market (Judd & Institution, n.d.). Cartels are formed when firms catering to the demand of identical markets decide the price at which they will sell a particular product to maximize the total profit (Stigler, 1964). The firms compete on price. They usually set the price closer to the marginal cost of the product so as to earn maximum market share. When the firms form collusion, it will not matter whether they set prices close to marginal cost because the customers will not shift to another seller (Bresnahan, 1987). The Kinked demand curve demand curve of firms in oligopoly market is shown by Fig 1. Product differentiation in the oligopoly market shows how firms’ product type decisions and how competitors react depending on the product types (Mazzeo, 2002). Consumer preferences change among the differentiated products, as the consumer preferences increases, the equilibrium prices rises (Perloff & Salop, 1985). As the player becomes more homogeneous, hike of average cost adds pressure and thus, leads to price fluctuation (Singh & Ru, 2019). When competition becomes intense, the cost of research and development rises (Theilen, 2012). Bibliometric is the application of mathematical and statistical methods. Bibliometrics is an important field of information science as it represents a unique set of techniques (Patra et al., 2006). Bibliometrics can be defined as the quantitative study that measures research relating to the number of publications, bibliographic citations, references of the paper, etc. in a systematic
Fig 1.
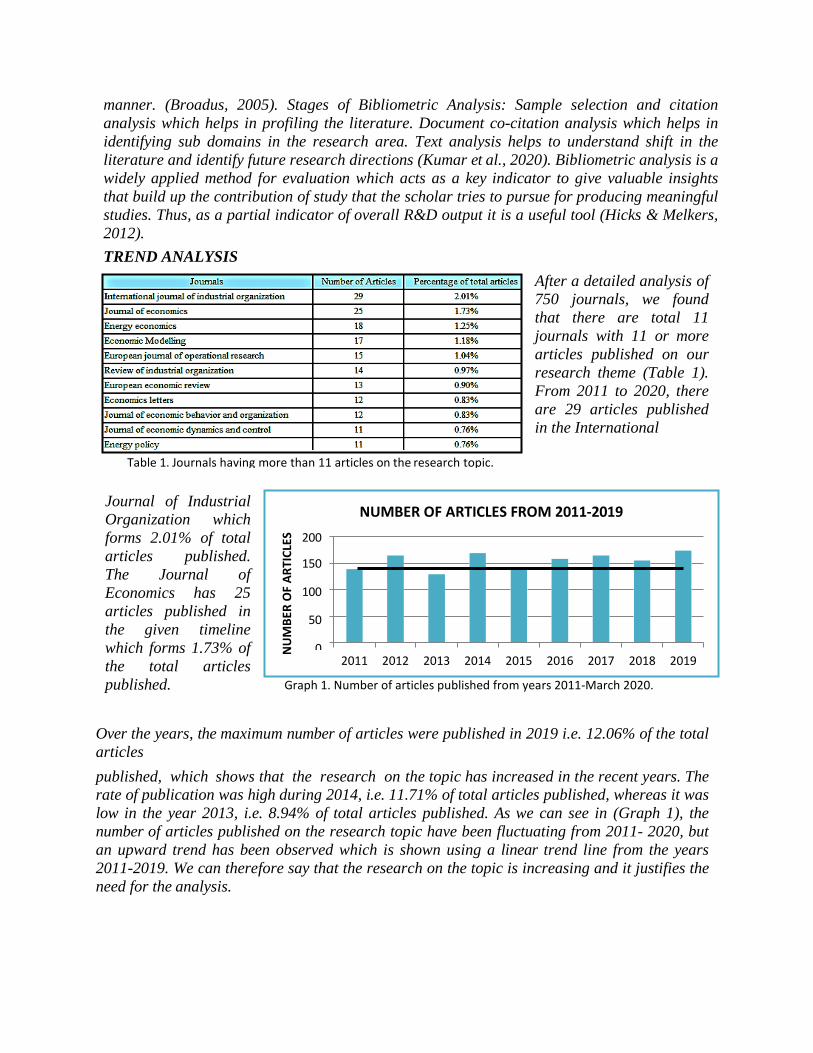
NUMBER OF ARTICLES FROM 2011-2019 200
150
100
50
0 2011 2012 2013 2014 2015 2016 2017 2018 2019
manner. (Broadus, 2005). Stages of Bibliometric Analysis: Sample selection and citation analysis which helps in profiling the literature. Document co-citation analysis which helps in identifying sub domains in the research area. Text analysis helps to understand shift in the literature and identify future research directions (Kumar et al., 2020). Bibliometric analysis is a widely applied method for evaluation which acts as a key indicator to give valuable insights that build up the contribution of study that the scholar tries to pursue for producing meaningful studies. Thus, as a partial indicator of overall R&D output it is a useful tool (Hicks & Melkers, 2012). TREND ANALYSIS
After a detailed analysis of 750 journals, we found that there are total 11 journals with 11 or more articles published on our research theme (Table 1). From 2011 to 2020, there are 29 articles published in the International
Journal of Industrial Organization which forms 2.01% of total articles published. The Journal of Economics has 25 articles published in the given timeline which forms 1.73% of the total articles published.
Over the years, the maximum number of articles were published in 2019 i.e. 12.06% of the total articles published, which shows that the research on the topic has increased in the recent years. The rate of publication was high during 2014, i.e. 11.71% of total articles published, whereas it was low in the year 2013, i.e. 8.94% of total articles published. As we can see in (Graph 1), the number of articles published on the research topic have been fluctuating from 2011- 2020, but an upward trend has been observed which is shown using a linear trend line from the years 2011-2019. We can therefore say that the research on the topic is increasing and it justifies the need for the analysis.
Table 1. Journals having more than 11 articles on the research topic.
Graph 1. Number of articles published from years 2011-March 2020.
NU
MBE
R O
F AR
TICL
ES
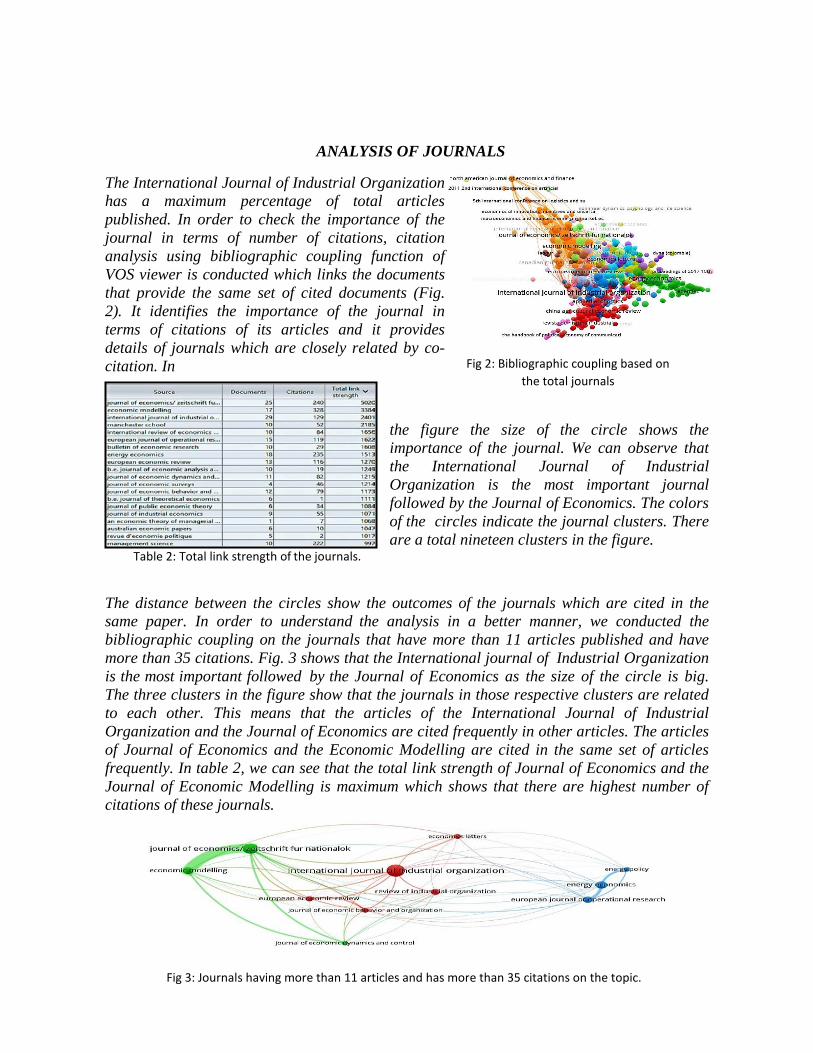
ANALYSIS OF JOURNALS
The International Journal of Industrial Organization has a maximum percentage of total articles published. In order to check the importance of the journal in terms of number of citations, citation analysis using bibliographic coupling function of VOS viewer is conducted which links the documents that provide the same set of cited documents (Fig. 2). It identifies the importance of the journal in terms of citations of its articles and it provides details of journals which are closely related by co-citation. In
the figure the size of the circle shows the importance of the journal. We can observe that the International Journal of Industrial Organization is the most important journal followed by the Journal of Economics. The colors of the circles indicate the journal clusters. There are a total nineteen clusters in the figure.
The distance between the circles show the outcomes of the journals which are cited in the same paper. In order to understand the analysis in a better manner, we conducted the bibliographic coupling on the journals that have more than 11 articles published and have more than 35 citations. Fig. 3 shows that the International journal of Industrial Organization is the most important followed by the Journal of Economics as the size of the circle is big. The three clusters in the figure show that the journals in those respective clusters are related to each other. This means that the articles of the International Journal of Industrial Organization and the Journal of Economics are cited frequently in other articles. The articles of Journal of Economics and the Economic Modelling are cited in the same set of articles frequently. In table 2, we can see that the total link strength of Journal of Economics and the Journal of Economic Modelling is maximum which shows that there are highest number of citations of these journals.
Table 2: Total link strength of the journals.
Fig 2: Bibliographic coupling based on the total journals
Fig 3: Journals having more than 11 articles and has more than 35 citations on the topic.
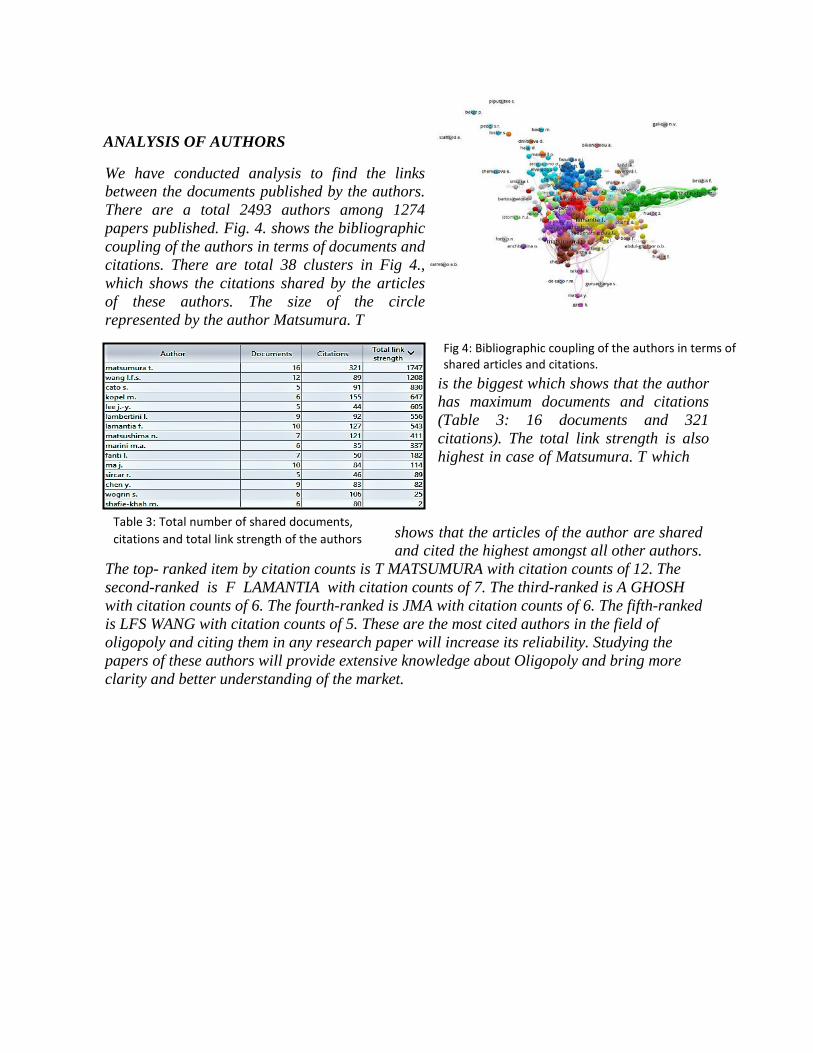
Fig 4: Bibliographic coupling of the authors in terms of shared articles and citations.
Table 3: Total number of shared documents, citations and total link strength of the authors
ANALYSIS OF AUTHORS
We have conducted analysis to find the links between the documents published by the authors. There are a total 2493 authors among 1274 papers published. Fig. 4. shows the bibliographic coupling of the authors in terms of documents and citations. There are total 38 clusters in Fig 4., which shows the citations shared by the articles of these authors. The size of the circle represented by the author Matsumura. T
is the biggest which shows that the author has maximum documents and citations (Table 3: 16 documents and 321 citations). The total link strength is also highest in case of Matsumura. T which
shows that the articles of the author are shared and cited the highest amongst all other authors.
The top- ranked item by citation counts is T MATSUMURA with citation counts of 12. The second-ranked is F LAMANTIA with citation counts of 7. The third-ranked is A GHOSH with citation counts of 6. The fourth-ranked is JMA with citation counts of 6. The fifth-ranked is LFS WANG with citation counts of 5. These are the most cited authors in the field of oligopoly and citing them in any research paper will increase its reliability. Studying the papers of these authors will provide extensive knowledge about Oligopoly and bring more clarity and better understanding of the market.
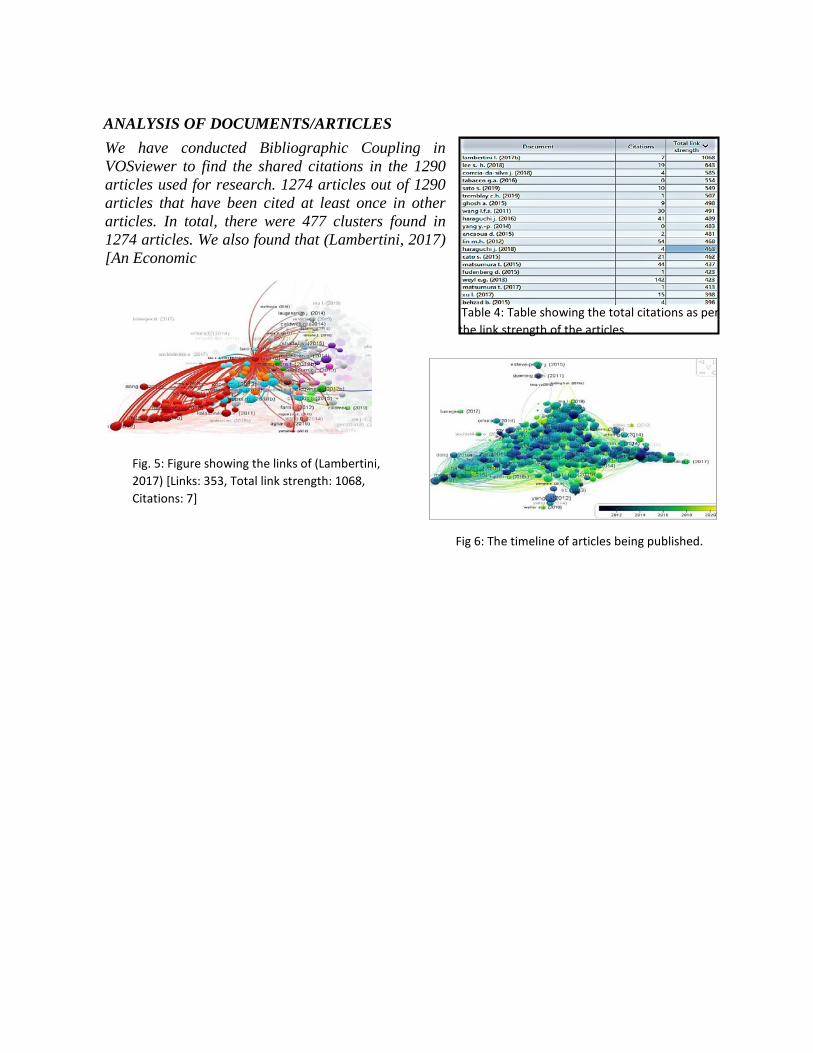
ANALYSIS OF DOCUMENTS/ARTICLES We have conducted Bibliographic Coupling in VOSviewer to find the shared citations in the 1290 articles used for research. 1274 articles out of 1290 articles that have been cited at least once in other articles. In total, there were 477 clusters found in 1274 articles. We also found that (Lambertini, 2017) [An Economic
Table 4: Table showing the total citations as per the link strength of the articles.
Fig. 5: Figure showing the links of (Lambertini, 2017) [Links: 353, Total link strength: 1068, Citations: 7]
Fig 6: The timeline of articles being published.
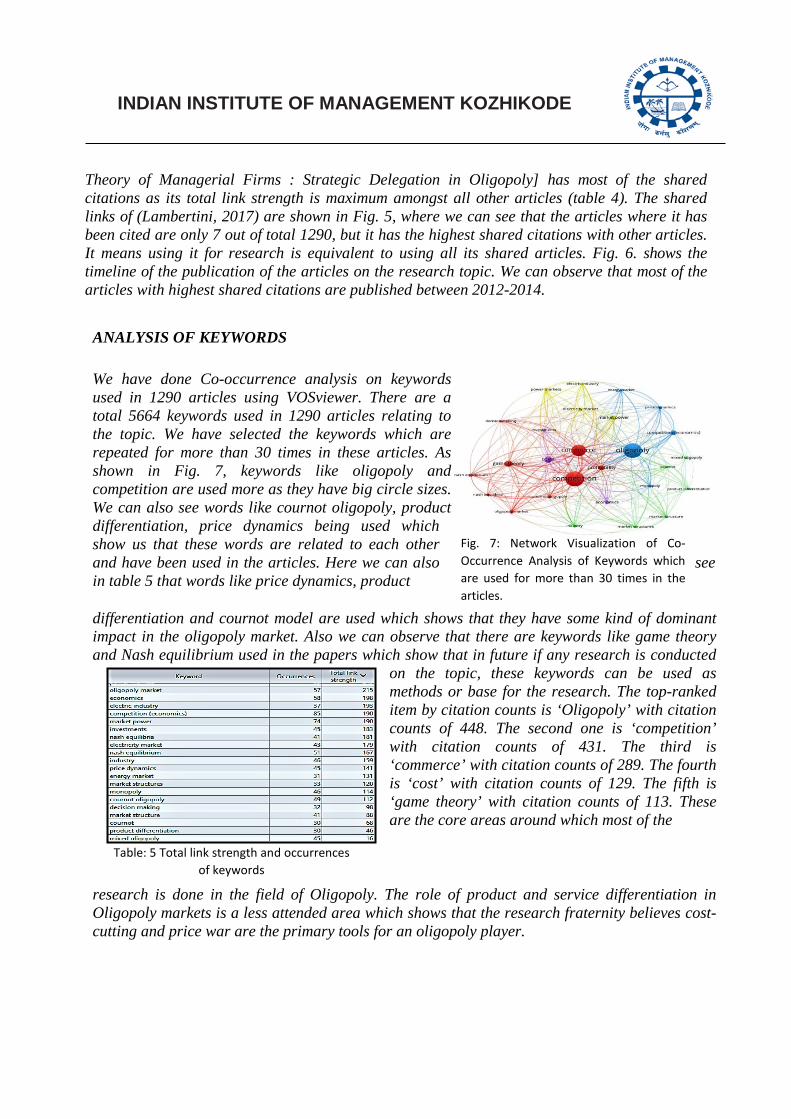
INDIAN INSTITUTE OF MANAGEMENT KOZHIKODE
Fig. 7: Network Visualization of Co-Occurrence Analysis of Keywords which are used for more than 30 times in the articles.
Theory of Managerial Firms : Strategic Delegation in Oligopoly] has most of the shared citations as its total link strength is maximum amongst all other articles (table 4). The shared links of (Lambertini, 2017) are shown in Fig. 5, where we can see that the articles where it has been cited are only 7 out of total 1290, but it has the highest shared citations with other articles. It means using it for research is equivalent to using all its shared articles. Fig. 6. shows the timeline of the publication of the articles on the research topic. We can observe that most of the articles with highest shared citations are published between 2012-2014. ANALYSIS OF KEYWORDS We have done Co-occurrence analysis on keywords used in 1290 articles using VOSviewer. There are a total 5664 keywords used in 1290 articles relating to the topic. We have selected the keywords which are repeated for more than 30 times in these articles. As shown in Fig. 7, keywords like oligopoly and competition are used more as they have big circle sizes. We can also see words like cournot oligopoly, product differentiation, price dynamics being used which show us that these words are related to each other and have been used in the articles. Here we can also see in table 5 that words like price dynamics, product differentiation and cournot model are used which shows that they have some kind of dominant impact in the oligopoly market. Also we can observe that there are keywords like game theory and Nash equilibrium used in the papers which show that in future if any research is conducted
on the topic, these keywords can be used as methods or base for the research. The top-ranked item by citation counts is ‘Oligopoly’ with citation counts of 448. The second one is ‘competition’ with citation counts of 431. The third is ‘commerce’ with citation counts of 289. The fourth is ‘cost’ with citation counts of 129. The fifth is ‘game theory’ with citation counts of 113. These are the core areas around which most of the
research is done in the field of Oligopoly. The role of product and service differentiation in Oligopoly markets is a less attended area which shows that the research fraternity believes cost-cutting and price war are the primary tools for an oligopoly player.
Table: 5 Total link strength and occurrences of keywords
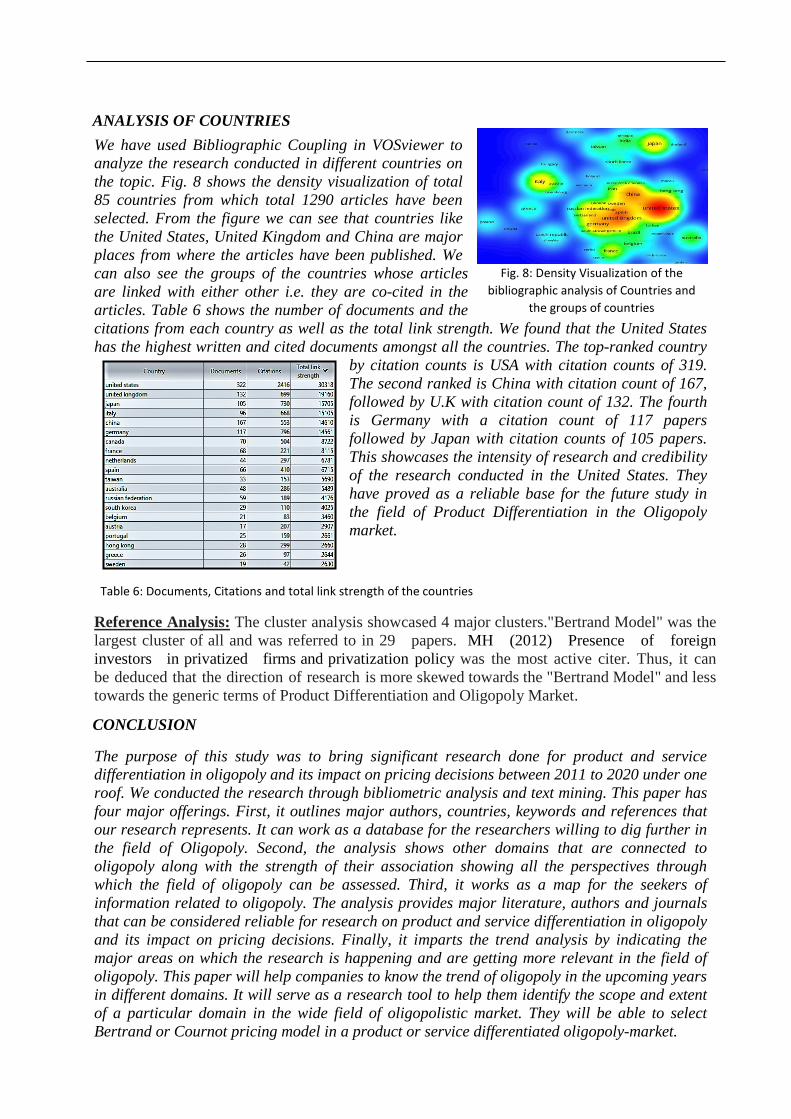
Fig. 8: Density Visualization of the bibliographic analysis of Countries and
the groups of countries
ANALYSIS OF COUNTRIES We have used Bibliographic Coupling in VOSviewer to analyze the research conducted in different countries on the topic. Fig. 8 shows the density visualization of total 85 countries from which total 1290 articles have been selected. From the figure we can see that countries like the United States, United Kingdom and China are major places from where the articles have been published. We can also see the groups of the countries whose articles are linked with either other i.e. they are co-cited in the articles. Table 6 shows the number of documents and the citations from each country as well as the total link strength. We found that the United States has the highest written and cited documents amongst all the countries. The top-ranked country
by citation counts is USA with citation counts of 319. The second ranked is China with citation count of 167, followed by U.K with citation count of 132. The fourth is Germany with a citation count of 117 papers followed by Japan with citation counts of 105 papers. This showcases the intensity of research and credibility of the research conducted in the United States. They have proved as a reliable base for the future study in the field of Product Differentiation in the Oligopoly market.
Reference Analysis: The cluster analysis showcased 4 major clusters."Bertrand Model" was the largest cluster of all and was referred to in 29 papers. MH (2012) Presence of foreign investors in privatized firms and privatization policy was the most active citer. Thus, it can be deduced that the direction of research is more skewed towards the "Bertrand Model" and less towards the generic terms of Product Differentiation and Oligopoly Market.
CONCLUSION
The purpose of this study was to bring significant research done for product and service differentiation in oligopoly and its impact on pricing decisions between 2011 to 2020 under one roof. We conducted the research through bibliometric analysis and text mining. This paper has four major offerings. First, it outlines major authors, countries, keywords and references that our research represents. It can work as a database for the researchers willing to dig further in the field of Oligopoly. Second, the analysis shows other domains that are connected to oligopoly along with the strength of their association showing all the perspectives through which the field of oligopoly can be assessed. Third, it works as a map for the seekers of information related to oligopoly. The analysis provides major literature, authors and journals that can be considered reliable for research on product and service differentiation in oligopoly and its impact on pricing decisions. Finally, it imparts the trend analysis by indicating the major areas on which the research is happening and are getting more relevant in the field of oligopoly. This paper will help companies to know the trend of oligopoly in the upcoming years in different domains. It will serve as a research tool to help them identify the scope and extent of a particular domain in the wide field of oligopolistic market. They will be able to select Bertrand or Cournot pricing model in a product or service differentiated oligopoly-market.
Table 6: Documents, Citations and total link strength of the countries
REFERENCES
1. Livesey, F. (1998). Oligopoly and Monopoly. In B. Atkinson, F. Livesey, & B. Milward (Eds.), Applied Economics (pp. 66–81). Macmillan Education UK. https://doi.org/10.1007/978-1-349-14250-7_4 2. Judd, K. L., & Institution, H. (n.d.). COURNOT VERSUS BERTRAND: A DYNAMIC RESOLUTION. 32. 3. Stigler, G. J. (1964). A Theory of Oligopoly. Journal of Political Economy, 72(1), 44–61. JSTOR. 4. Bresnahan, T. F. (1987). Competition and Collusion in the American Automobile Industry: The 1955 Price War. The Journal of Industrial Economics, 35(4), 457–482. JSTOR. https://doi.org/10.2307/2098583 5. Mazzeo, M. J. (2002). Competitive Outcomes in Product-Differentiated Oligopoly. The Review of Economics and Statistics, 84(4), 716–728. https://doi.org/10.1162/003465302760556521 6. Perloff, J. M., & Salop, S. C. (1985). Equilibrium with Product Differentiation. Review of Economic Studies, 52(1), 107. https://doi.org/10.2307/2297473 7. Singh, S., & Ru, C. G. (2019). Price rigidity, market competition, and product differentiation. Economic Research-Ekonomska Istraživanja, 32(1), 2941–2958. https://doi.org/10.1080/1331677X.2019.1653779 8. Theilen, B. (2012). Product differentiation and competitive pressure. Journal of Economics, 107(3), 257– 266. https://doi.org/10.1007/s00712-011-0261-5 9. Patra, S. K., Bhattacharya, P., & Verma, N. (2006). Bibliometric Study of Literature on Bibliometrics. DESIDOC Bulletin of Information Technology, 26(1), 27–32. https://doi.org/10.14429/dbit.26.1.3672 10. Broadus, R. (2005). Toward a definition of “bibliometrics.” Scientometrics, 12(5–6), 373–379. https://doi.org/10.1007/bf02016680 11. Kumar, B., Sharma, A., Vatavwala, S., & Kumar, P. (2020). Digital mediation in business-to-business marketing: A bibliometric analysis. Industrial Marketing Management, 85, 126–140. https://doi.org/10.1016/j.indmarman.2019.10.002 12. Hicks, D., & Melkers, J. (2012). Bibliometrics as a tool for research evaluation. In A. Link & N. Vornatas (Eds.), Handbook on the Theory and Practice of Program Evaluation.
ICT Adoption and Insurance uptake in India
Shreya Biswas1
Shreya Lahiri2
1&2 Birla Institute of Technology and Science, Pilani, Hyderabad Campus
Abstract
This study analyzes whether ICT adoption is related to improved insurance uptake at the household level in
India. Using the Indian Human Development Survey- 2011-12 (IHDS-2) we find that access to the internet
is related to higher insurance uptake by the households. Internet access generates twin benefits of
improving awareness related to the benefits of insurance products and help in reducing transaction costs for
the insurers. The study highlights the role of ICT in improving development outcomes in India. Further, we
find that the access to internet increase the insurance uptake of urban households more than rural
households. Finally, we find that the ICT adoption not only affects the insurance uptake decision but also
the quantity purchase of the insurance as well.
Keywords: Insurance, ICT, internet, India, Premium, households
JEL classification codes: G52, O16, O53, R22
1. Introduction
Insurance is a risk management product that can reduce vulnerability of households from
health, weather and income shocks especially in developing economies. Given the backdrop of
less than fully developed capital markets and under-developed social security system, insurance
products can play a dual role of reducing impact of major events on households as well as long
term savings instrument. Several empirical studies have found that more years of schooling are
related to higher consumption of insurance (Arun et. al., 2012; Shi et. al., 2015). Higher education
is related to a better understanding of complex products, and education is also related to improved
financial awareness regarding the need to insure uncertain life events.
In the digital era, the adoption of information and communication technology (ICT) can act as
a channel of information dissemination. Several papers have analyzed the role of ICT for
improving welfare outcomes of households such as income diversification (Leng et al., 2020),
access to credit (Pellegrina et al., 2017); women empowerment (Pei and Chib, 2020) and nutrition
(Sekabira and Qaim, 2017). In this study, we examine whether the adoption of ICT is related to
insurance uptake in India. To the best of our knowledge, no study in India has analyzed the role of
ICT adoption on insurance demand using nationally representative household data.
In 2018, the penetration of insurance in India was less than 4%, which is well below the
average of 8.9% for the OECD countries (Source: OECD Statistics). Since the launch of the
PMJDY (2014), the ownership of accounts among households has increased manifold, but
insurance penetration did not exhibit any significant improvement. Despite supply-side
interventions, insurance penetration is well below desirable levels.
One plausible reason contributing to low insurance penetration in developing economies like
India is the fairly complex nature of insurance instruments. In the digital era, the adoption of
information and communication technology (ICT) can act as a channel of information
dissemination. The access to ICT can help in reducing search costs; improve product related
awareness among consumers through internet marketing initiatives of the insurance companies
and circulation of awareness videos by regulators. Further, access to internet can reduce the shoe-
leather costs associated with visiting the nearest office for paying regular premiums. In this study
we intend to analyze whether adoption of ICT is related to insurance uptake in India. To the best
of our knowledge no studies in India have analyzed the role of ICT adoption on insurance demand
using nationally representative household data.
This study contributes to two specific strands of literature. First, we contribute to the
literature on the role of ICT for development. Second, there is a large body of literature that has
examined the macro factors that affect insurance penetration focused like per capita income,
financial development, institutional quality, inflation, life expectancy and dependency ratio
(Outreville, 1996). This study contributes to the emerging field of studies analyzing the micro
determinants of insurance in the context of developing economies.
The access to internet is crucial for access to digital awareness campaigns and improving the
understanding of benefits related to complex financial products like insurance. Furthermore,
access to internet also reduces the costs of buying insurance as the regular premium payments can
be paid digitally.
2. Data and methodology
The data for the analysis is based on the second round of household survey conducted by
Indian Human Development Survey during 2011-12 (IHDS-2). It is a nationally representative
survey of 42,152 households (14,573 urban households and 27,580 rural households) covering 34
states and union territories in India. This survey is conducted by the National Council of Applied
Economic Research (NCAER) and in collaboration with the University of Maryland. IHDS-2
provides data regarding the socio-economic characteristics of the households.
The dependent variable in our analysis is Insurance dummy that takes the value of one for
households owning either life or health insurance and zero otherwise. The interest variable is ICT
adoption which is captured access to internet. The ICT measure is given by Internet dummy which
takes the value one for the household having access to internet connection and zero otherwise. The
measure of ICT adoption will capture all the channels through which ICT adoption can affect
insurance uptake. Additionally, we control the socio-economic and demographic characteristics of
the households like, life events, income shock, number of dependents, ownership of farm land,
educational status, debt, asset ownership, age, expenditure, sex of household head, occupation,
social network, caste, religion and area of residence.
The ICT measure in the above specification may not be exogenous. There may be factors like
innate ability or motivation of the household that can affect ICT adoption. The households having
members with a higher innate ability or motivation are more likely to adopt ICT and may be better
placed to understand the benefits related to insurance.
The identification variable employed in the first stage should be a variable that is highly
correlated with the ICT measures, but unrelated to the dependent variable. We expect that the PSU
level internet connections will positively affect the ICT adoption of a household through peer
effect.
3. Results
In our sample, only 36 percent of the households have insurance, and 1.3 percent of total
expenditure is spent on paying insurance premium. Around 19 percent households have an internet
connection at home. We find that 60 percent of the households that have either Internet access
have insurance. However, the ICT adopters are socially more connected, have more educated adult
members, have lower indebtedness, and belong to higher asset quintiles.
We employ a treatment effect model to address this endogeneity and consider PSU-Internet
(internet access at PSU level) as identification variables. The coefficients of PSU-Internet is
positive and significant (columns 3 and 5 of Table 1) indicating that higher values of PSU-Internet
is likely to have a positive spillover effect on the Internet access and at household level
respectively either by the virtue of availability or peer effect. The probit model second stage of
both the IV probit and bivariate model suggest the coefficient of Internet is positive and
significant which indicates a positive effect of access to Internet on Insurance uptake at the
household level (columns 1,2 and 4).
In addition to the ICT adoption variable, we find larger social connection is not related to
reaping the benefit of internet for higher insurance uptake. We find that that similar to the findings
in literature households, with more expenditure, asset endowments, higher kids ratio, and higher
educational attainment have higher probability of buying insurance(Arun et al., 2012).
Additionally, families having regular income increase the likelihood of purchasing insurance. It is
observed that Muslim and Christian households are less likely to have insurance compared to
Hindu households.
4. ICT adoption and insurance premium
We analyze if the adoption of ICT improves the financial education of households and affects
the consumption of insurance by households. We employ an instrumental variable tobit model and
IV-Tobit where the dependent variable is Premium defined as the ratio of premium expenditure to
household expenditure. Table 2 represents the result of IV-Tobit model on regressing Premium on
Internet and other variables. We consider PSU-Internet access as the instruments to tackle the
issue of endogeneity of ICT measure. Consumption of insurance is unlikely to be affected by the
internet penetration, satisfying the instrument exogeneity condition. Table 2 suggests that there is
positive and significant relationship between accesses to Internet with the quantity of insurance
purchased by the household.
5. Conclusion:
Our study considers whether the adoption of ICT can improve insurance uptake in India by
improving the financial awareness of the households. Using a treatment effects model, we find
that households having an internet connection are more likely to participate in the insurance
market. The results provide evidence in favor of the positive spillover effects of technology on
development outcomes. The insurance companies and financial intermediaries should also fully
embrace ICT to reach out to the end consumers in remote areas and create awareness regarding the
need for insuring against future uncertain outcomes.
Moreover, we find that ICT adoption positively affects the amount of insurance purchased by
the households. In India, financial Robo-advisory is still in nascent stages, and further investments
in this domain can leverage the initial gains of ICT in affecting the demand for risk management
products of Indian households.
References:
1. Arun, T., Bendig, M. and Arun, S. (2012). “Bequest motives and determinants of micro life insurance
in Sri Lanka”. World Development, Vol 40, 1700-1711.
2. Leng, C., Ma, W., Tang, J. and Zhu, Z. (2020). “ICT adoption and income diversification among rural
household in China”. Applied Economics, Vol 52, 3614-3628.
3. Outreville, J. F. (1996). “Life insurance markets in developing countries”. Journal of Risk and
Insurance, Vol 63, 263- 278.
4. Pei, X. and Chib, A. (2020). “Beyond the gender (dis)empowerment dichotomy: The mobile phone as
social catalyst for gender transformation in the global south”. New Media and Society. DOI:
https://journals.sagepub.com/doi/10.1177/1461444820905295.
5. Pellegrina, L., Frazzoni, S., Rotondi, Z. and Vezzulli, A.(2017). “Does ICT adoption improve access
to credit for small enterprises”. Small Business Economics, Vol 48, 657-679.
6. Sekabira, H. and Qaim M. (2017). “Can mobile phones improve gender equality and nutrition? Panel
data evidence from Farm households in Uganda”. Food Policy, Vol 73, 95-103.
7. Shi X., Wang H. and Xing C. (2015). “The role of insurance in emerging markets: Human capital
protection, asset allocation and social interaction”. Journal of Banking and Finance, Vol 50, 19-33.
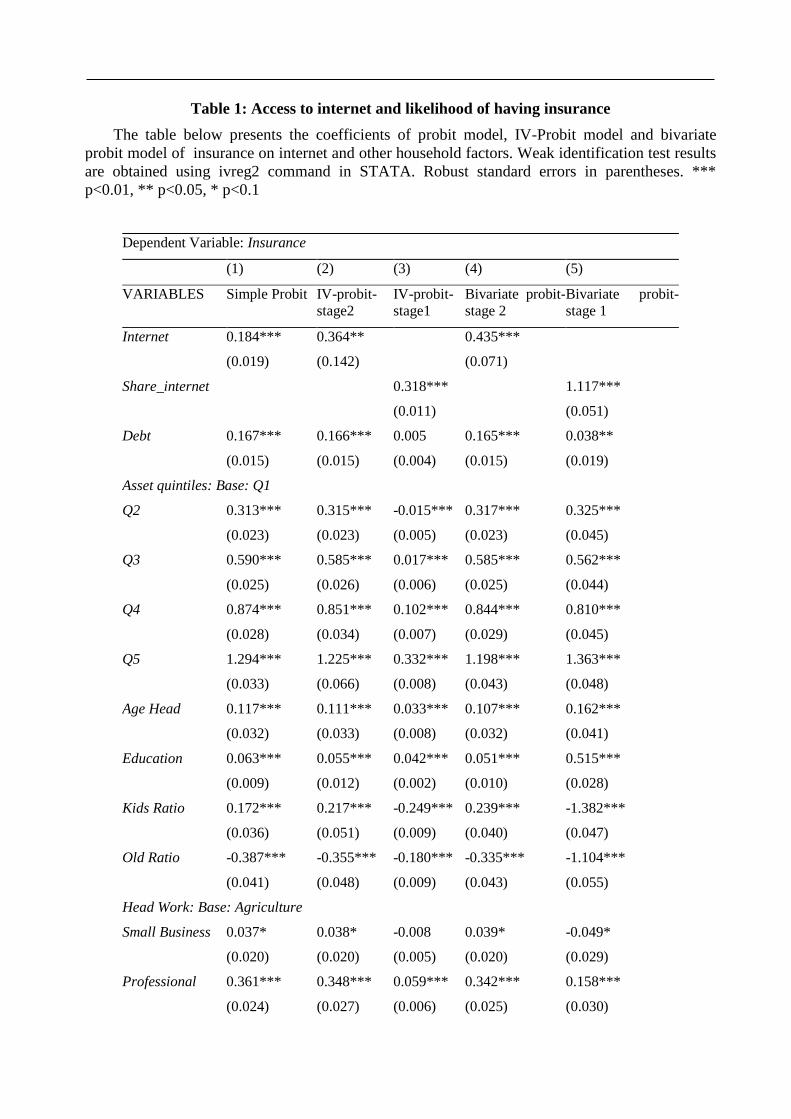
Table 1: Access to internet and likelihood of having insurance
The table below presents the coefficients of probit model, IV-Probit model and bivariate
probit model of insurance on internet and other household factors. Weak identification test results
are obtained using ivreg2 command in STATA. Robust standard errors in parentheses. ***
p<0.01, ** p<0.05, * p<0.1
Dependent Variable: Insurance
(1) (2) (3) (4) (5)
VARIABLES Simple Probit IV-probit-
stage2
IV-probit-
stage1
Bivariate probit-
stage 2
Bivariate probit-
stage 1
Internet 0.184*** 0.364** 0.435***
(0.019) (0.142) (0.071)
Share_internet 0.318*** 1.117***
(0.011) (0.051)
Debt 0.167*** 0.166*** 0.005 0.165*** 0.038**
(0.015) (0.015) (0.004) (0.015) (0.019)
Asset quintiles: Base: Q1
Q2 0.313*** 0.315*** -0.015*** 0.317*** 0.325***
(0.023) (0.023) (0.005) (0.023) (0.045)
Q3 0.590*** 0.585*** 0.017*** 0.585*** 0.562***
(0.025) (0.026) (0.006) (0.025) (0.044)
Q4 0.874*** 0.851*** 0.102*** 0.844*** 0.810***
(0.028) (0.034) (0.007) (0.029) (0.045)
Q5 1.294*** 1.225*** 0.332*** 1.198*** 1.363***
(0.033) (0.066) (0.008) (0.043) (0.048)
Age Head 0.117*** 0.111*** 0.033*** 0.107*** 0.162***
(0.032) (0.033) (0.008) (0.032) (0.041)
Education 0.063*** 0.055*** 0.042*** 0.051*** 0.515***
(0.009) (0.012) (0.002) (0.010) (0.028)
Kids Ratio 0.172*** 0.217*** -0.249*** 0.239*** -1.382***
(0.036) (0.051) (0.009) (0.040) (0.047)
Old Ratio -0.387*** -0.355*** -0.180*** -0.335*** -1.104***
(0.041) (0.048) (0.009) (0.043) (0.055)
Head Work: Base: Agriculture
Small Business 0.037* 0.038* -0.008 0.039* -0.049*
(0.020) (0.020) (0.005) (0.020) (0.029)
Professional 0.361*** 0.348*** 0.059*** 0.342*** 0.158***
(0.024) (0.027) (0.006) (0.025) (0.030)
Others 0.001 -0.003 0.016*** -0.004 0.052
(0.025) (0.025) (0.006) (0.025) (0.032)
Farmland 0.101*** 0.104*** -0.003 0.105*** 0.008
(0.019) (0.019) (0.005) (0.019) (0.025)
Head Sex:
Female
-0.048** -0.050** 0.013** -0.051** 0.069**
(0.023) (0.023) (0.005) (0.023) (0.029)
Religion: Hindu
Muslim -0.440*** -0.436*** 0.000 -0.434*** 0.009
(0.025) (0.024) (0.006) (0.025) (0.031)
Christian -0.171*** -0.165*** -0.026** -0.162*** -0.094*
(0.050) (0.049) (0.012) (0.050) (0.054)
Others 0.053 0.053 0.002 0.052 0.042
(0.041) (0.042) (0.010) (0.041) (0.048)
Cast : Base: General
SC -0.058*** -0.055** -0.007 -0.053** 0.003
(0.021) (0.021) (0.005) (0.021) (0.027)
ST -0.128*** -0.122*** -0.014** -0.119*** -0.137***
(0.031) (0.032) (0.007) (0.031) (0.046)
Others 0.033* 0.036** -0.010** 0.038** -0.021
(0.018) (0.018) (0.004) (0.018) (0.021)
Urban -0.042** -0.049** -0.006 -0.052*** -0.012
(0.020) (0.020) (0.005) (0.020) (0.025)
Income Shock 0.070*** 0.067*** 0.016*** 0.066*** 0.098***
(0.018) (0.018) (0.004) (0.018) (0.024)
Life Events -0.031** -0.029** -0.011*** -0.028** -0.054***
(0.014) (0.014) (0.003) (0.014) (0.018)
Z-Score-SN 0.135*** 0.128*** 0.038*** 0.125*** 0.138***
(0.008) (0.010) (0.002) (0.008) (0.009)
Constant -2.115*** -2.112*** -0.065* -2.108*** -3.228***
(0.139) (0.142) (0.034) (0.139) (0.186)
State fixed effects Yes Yes Yes Yes Yes
Rho -0.061 -0.154***
(0.048) (0.043)
Wald chi-square 1.620 12.865***
Observations 41,711 41,707 41,707 41,707 41,707
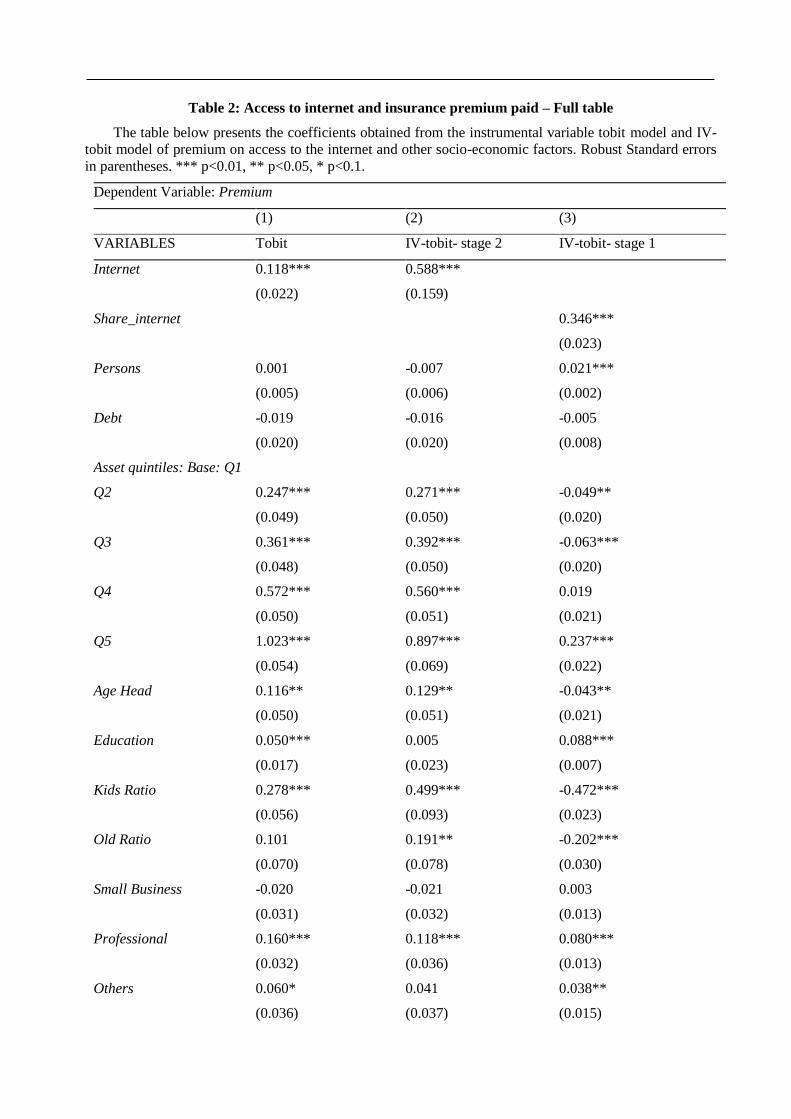
Table 2: Access to internet and insurance premium paid – Full table
The table below presents the coefficients obtained from the instrumental variable tobit model and IV-
tobit model of premium on access to the internet and other socio-economic factors. Robust Standard errors
in parentheses. *** p<0.01, ** p<0.05, * p<0.1.
Dependent Variable: Premium
(1) (2) (3)
VARIABLES Tobit IV-tobit- stage 2 IV-tobit- stage 1
Internet 0.118*** 0.588***
(0.022) (0.159)
Share_internet 0.346***
(0.023)
Persons 0.001 -0.007 0.021***
(0.005) (0.006) (0.002)
Debt -0.019 -0.016 -0.005
(0.020) (0.020) (0.008)
Asset quintiles: Base: Q1
Q2 0.247*** 0.271*** -0.049**
(0.049) (0.050) (0.020)
Q3 0.361*** 0.392*** -0.063***
(0.048) (0.050) (0.020)
Q4 0.572*** 0.560*** 0.019
(0.050) (0.051) (0.021)
Q5 1.023*** 0.897*** 0.237***
(0.054) (0.069) (0.022)
Age Head 0.116** 0.129** -0.043**
(0.050) (0.051) (0.021)
Education 0.050*** 0.005 0.088***
(0.017) (0.023) (0.007)
Kids Ratio 0.278*** 0.499*** -0.472***
(0.056) (0.093) (0.023)
Old Ratio 0.101 0.191** -0.202***
(0.070) (0.078) (0.030)
Small Business -0.020 -0.021 0.003
(0.031) (0.032) (0.013)
Professional 0.160*** 0.118*** 0.080***
(0.032) (0.036) (0.013)
Others 0.060* 0.041 0.038**
(0.036) (0.037) (0.015)
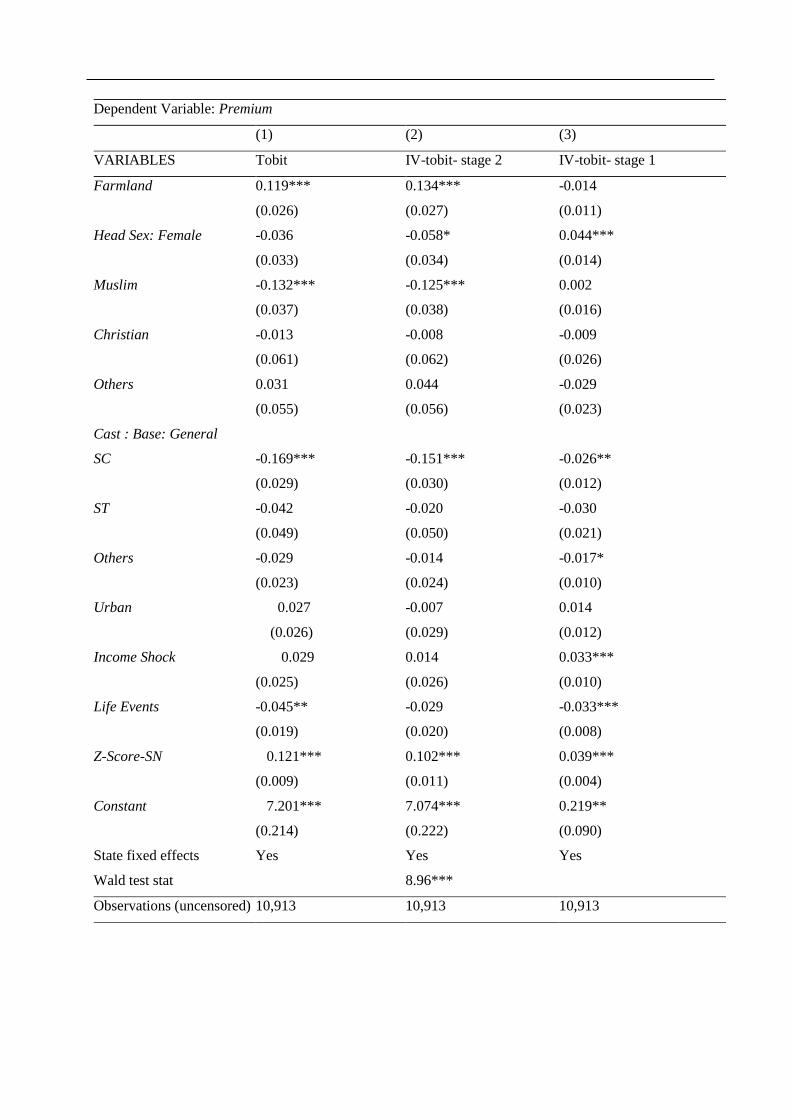
Dependent Variable: Premium
(1) (2) (3)
VARIABLES Tobit IV-tobit- stage 2 IV-tobit- stage 1
Farmland 0.119*** 0.134*** -0.014
(0.026) (0.027) (0.011)
Head Sex: Female -0.036 -0.058* 0.044***
(0.033) (0.034) (0.014)
Muslim -0.132*** -0.125*** 0.002
(0.037) (0.038) (0.016)
Christian -0.013 -0.008 -0.009
(0.061) (0.062) (0.026)
Others 0.031 0.044 -0.029
(0.055) (0.056) (0.023)
Cast : Base: General
SC -0.169*** -0.151*** -0.026**
(0.029) (0.030) (0.012)
ST -0.042 -0.020 -0.030
(0.049) (0.050) (0.021)
Others -0.029 -0.014 -0.017*
(0.023) (0.024) (0.010)
Urban 0.027 -0.007 0.014
(0.026) (0.029) (0.012)
Income Shock 0.029 0.014 0.033***
(0.025) (0.026) (0.010)
Life Events -0.045** -0.029 -0.033***
(0.019) (0.020) (0.008)
Z-Score-SN 0.121*** 0.102*** 0.039***
(0.009) (0.011) (0.004)
Constant 7.201*** 7.074*** 0.219**
(0.214) (0.222) (0.090)
State fixed effects Yes Yes Yes
Wald test stat 8.96***
Observations (uncensored) 10,913 10,913 10,913
Novelty and serendipity in recommender systems:
a social choice theory perspective
Aariz Faizan Javed1
1IIM Ranchi
Abstract
Social Choice Theory talks about the combination of the individual preferences to reach to some decision
in a collective sense. When employing the Collaborative filtering in the recommendations, we make the use
of Social Choice theory. Using the past behaviour of the user, the Recommender Systems suggest items to
the user. But sometimes the users get bored of these Recommendations. Novel items are those items about
which the user was not knowing while Serendipity introduces the surprise element in the suggestions and
helps increase the user satisfaction. But serendipity being subjective, there is no established way in which
Serendipity is defined. There have been some discussions on some definitions of serendipity in this paper
and also discussed some techniques like deep learning. We evaluate an algorithm on the Serendipity 2018
dataset that was released by the MovieLens research group. The results of the algorithm were compared
with the results of other baselines algorithms.
Keywords : Social Choice Theory, Serendipity, Novelty, Recommender Systems, Deep learning,
Unexpectedness, Room Mean Square Error (RMSE)
Introduction
There are a wide variety of products that are available to suit the needs of the users. But the
plethora of information that is available, might lead to a lot of confusion. This is where the
concept of Recommender system comes in. The Recommender system is the software which
suggests item to the users. They help in a lot of value addition to the marketers. These are widely
used across various online platforms to help the users in better selection. The concept of
serendipity in recommender systems is not new. (Kotkov et al., 2016)
Working on the different components of serendipity like relevance, novelty and
unexpectedness. Starting with the first parameter which is relevance, it means that the user has
some liking towards that particular item and will rate that highly when compared to the other
items that are there. The second concept around serendipity is novelty. Novel item are items that
have not yet been rated by the users which basically is the cold start problem. These can also be
some item that have been forgotten or are unknown. Here we take the novel item as an item that a
user has never heard about. The third one i.e. unexpectedness is a concept which refers to the
items that are striking very different from the user’s profile.
Literature Review
(Kim et al., 2017) while explaining a new angle to the Recommender System algorithms, said
that sometimes the Collaborative filtering and the Content Based filtering algorithm seem a touch
unproductive, because they lack that human angle to it. Also, there is a need to ensure that the
recommender systems need to evolve and ensure that better recommendations are provided to the
users. The users are generally more satisfied when there is that emotional connection. Since if the
recommendations are more personalized it goes one step further. Talking about the curators, they
are generally other users or some algorithm or an expert. There are so many places like LinkedIn
where the users curate their contact lists as to whom to connect to. The users in LinkedIn make
recommendation about some contact that is there in their network. Social network support by the
users are also very important because that generally acts like a catalyst. Now LinkedIn connects
through social networks there are scenarios of a perfect recommendation going through to the
users.
Talking about the accuracy, (Ge et al., 2010) has mentioned that when the serendipitous
encounters are implemented then we are successful in avoiding some of the obvious
recommendations in the case of collaborative filtering. It also solves the problem of over-
specification that can sometimes be there in the case of the content-based algorithm
(Pandey et al., 2018) in his paper which involves the concept of transfer learning, talks about
how the concepts of deep learning as well as transfer learning have not yet been explored in the
field of recommender systems involving the concept of serendipity.
(Kaminskas & Bridge, 2016) have talked about the novelty and the diversity have an impact
on the quality of the recommender system. Hence here there has been a lot of focus on the
measures that are beyond accuracy in recommended systems. Talking about the concept of
diversity and the relationship that it has with accuracy, it has been studied in the concept of
information retrieval and economics.
Literature of some techniques (Deep learning and Graph based)
(Batmaz et al., 2019) has mentioned about the impact of deep learning in the Recommender
Systems field. Talking about the active user who plays one of the most important roles in the
Collaborative filtering recommender Systems, the past items that the user has rated will be used to
recommend the items to the users who have a very compatible taste to the given user. So, there are
users (say number of users is a) and items (say the items are b), then there will be a user item
matrix which will be a*b.
(De Gemmis et al., 2015) have suggested a graph-based algorithm to solve the serendipity
problem by having the background knowledge to solve the issues related to the recommendations.
(Castells et al., 2011) talk about the concept of unexpectedness, diversity as well as some fusion
based approaches to serendipitous recommendations.
Novelty and Usefulness
(Zuva & Zuva, 2017) talks about the importance of diversity apart from novelty, serendipity,
unexpectedness and usefulness. The two types of diversity are the individual diversity and the
aggregate diversity. The individual diversity is the mean dissimilarity between all pairs of items
while aggregate diversity is the total number of distinct items. Techniques like ranking based
technique, standard ranking approach where unknown ratings are predicted and then they are used
to support the recommendations, item popularity-based approach, parametrized ranking approach
and the graph theoretic approach are used to measure the diversity
Vargas and Castells (2011) proposed a component metric which measures novelty and
neglects other components of serendipity:
where Ui corresponds to the set of users who rated item i, Ui ⊆ U.
(Kotkov et al., 2017) have talked about the cross-domain Recommender Systems where the
items share attributes. Here the data is taken from two different domains and this helps in
suggesting serendipitous items to the user. The source domain will be able to improve the
accuracy of the target domain for both the approaches i.e the content-based filtering as well as the
collaborative filtering algorithms.
Social Choice Theory
Social Choice Theory talks about the perspective of collective decision processes. This is not a
single standalone theory but multiple models that deal with the aggregate level of the individual
inputs like taking some decisions as a group or voting or on the basis of preferences, judgements
or the welfare. So how do a group of people choose some winning outcome given the plethora of
options at their disposal or how do we arrive at some preference that is coherent at a collective
level?
So, this theory considers the problem of aggregate preferences of the given members to ensure
that the final outcome is the preference that represents the totality of the society as a whole. Thus,
this theory is concerned with finding of some optimal solution that helps in the aggregation of the
preferences as a whole. The credits of this theory are given to Kenneth Arrow whose book has the
specifications of the conditions that a society’s choices should generally meet to reflect the
opinion of each of the individual. This theory has some elements of voting theory in it.
There seems to be a correspondence between collaborative filtering (CF) and Social Choice
theory. Both these frameworks are based on combining the preferences of a group into a single
relation. Some properties that Social Choice theory advocates have found true are very much
needed in the context of Collaborative filtering algorithms.
Unexpectedness
The content-based unexpectedness basically the dissimilar suggestions that are shown to the
users. These metrics were first proposed in a paper by Vargas and Castells (Vargas and Castells,
2011) and were later adopted in other papers too. These authors evaluate the concept the
serendipity into factors: these two are relevance and unexpectedness. The unexpectedness can be
measured through these while there are accuracy metrics like Root mean square error (RMSE) or
the mean absolute error to find the relevance component that is involved.
(Kotkov et al., 2018) has investigated the Serendipity based on the Real User Feedback. It was
about serendipity and its variations on broadening user preferences and user satisfaction. The issue
that the online available datasets is that there are quite a few assumptions that have been made as
these datasets don’t have the user feedback that is related to the serendipitous items. In this paper,
there was a survey that was carried out with around 475 people who participated in the survey.
The users were asked to rate eight statements using scales that varied from strongly agree to
strongly disagree. The definitions of serendipity involved three components. These were
Novelty
Relevance
Unexpectedness
Evaluation Metrics
(Patel & Amin, 2018) have written about how serendipity will ensure that the user will be
getting the recommendations that are not monotonous. He talks about serendipity as a
computational concept where the components of Serendipity have been talked about. The first of
the lot is the Prepared Mind which represents the system’s background knowledge base. The
experience that the user derives with respect to the item here is the Prepared Mind. The second
component is the Serendipity Trigger which includes the event or the phenomena. The next one is
the bridge which being synonymous to its name, connects the trigger with the result. When there is
a discussion on the field of information retrieval there are some metrics that are needed to measure
the accuracy of the systems. These two metrics are based on the confusion matrix.
Based on precision and recall the F-Measure is then defined as:
F-Measure = 2 * (Precision * Recall) / (Precision + Recall)
Methodology
We evaluate our algorithm on the Serendipity 2018 dataset.
Dataset
This dataset was released by the MovieLens research group. It includes the answers from users
as to how serendipitous some movies were. This also includes the past ratings of these users along
with some of the recommendations they received before answering the questions.
So, an experiment was conducted in MovieLens, where the users were asked as to how
serendipitous some movies were to them. This dataset has the user answers to questions and some
other useful information such as
past ratings of these users
recommendations they received before replying to our survey and
movie descriptions.
The dataset is meant for research regarding serendipity in recommender systems, such as
analysis of serendipitous movies or offline evaluation of serendipity-oriented recommendation
algorithms.
The dataset was generated on January 15, 2018. The data are contained in the files `
answers.csv`, ` movies.csv`, ` recommendations.csv`, ` tag_genome.csv`, ` tags.csv` and `
training.csv`. Overall, there are 10,000,000 ratings (2,150 ratings stored in `answers.csv` and
9,997,850 in `training.csv`).
In this dataset, each selected user had rated at least 1 movie. No demographic information is
included. Each user is represented by an id, and no other information is provided.
Metrics
These ratings given by the users to these recommended movies act like an appropriate measure
for calculating the
Root Mean Square Error (RMSE)
The Root Mean Square Error is the standard deviation of the residuals or the prediction errors.
The residuals indicate as to how far from the regression line, the data points are.
When we talk about the applications of RMSE in analytics, we use it evaluate our models as to
how accurate they are.
Since in RMSE the errors are squared before they are averaged hence RMSE gives a relatively
higher weightage on large errors
Experiment analysis
The collaborative filtering method, deals with making predictions about the recommendations
that should be given to a user based on the preferences of tastes and preferences of many other
users who share similar preferences. But there is the problem of overspecialisation that is faced in
Collaborative filtering technique.
Overspecialisation prevents the consumer to discover the new items and other options that
could be available to him. This doesn’t let the sales people reach their goals. Since diversity is
always desirable in recommendations, so having a wide range of alternative helps. So, if the
recommendations is only of those items that are having a high rating, then there is the problem of
overspecialisation that happens. For example, a user who has no experience for a Thai cuisine will
never get a recommendation for a Thai food even if there are some restaurants that are serving
Thai food are available around the user.
There is a technique of similarity fusion that is used to solve this problem. Apart from this,
there are some algorithms that have been used to ensure that features like diversity are
incorporated while making recommendations to the user. Here we apply the concept of novelty
along with the unexpected and the diverse recommendations to ensure that the problem of
overspecialisation is solved along with suggesting the user with serendipitous recommendations.
This algorithm takes the concept of novelty and then we compare the RMSE and the MAE values
obtained from this algorithm to some of the other standard algorithms.
Here we use the Jaccard Similarity formula as under
Then we define the unexpectedness as
Here, U is defined as the set of target users for whom recommendations are generated. Lu is
list of movies recommended for “U” without considering serendipitous clusters and Su is the list
of movies recommended to user “U”
The diversity here is captured by using only the Hamming distance formula
Results
Now to investigate the performance of our recommendation algorithm, we analyse the results
of some of the baseline algorithms. The first algorithm that we used as our baseline was the
SVD++ (Kumar et al, 2014). This algorithm uses the Singular Value Decomposition (SVD)
approach. This is our first baseline algorithm. The second baseline algorithm that we use is the
Continuous Restricted Boltzmann Machine (CRBM) [Chen et al, 2003]. This is the second
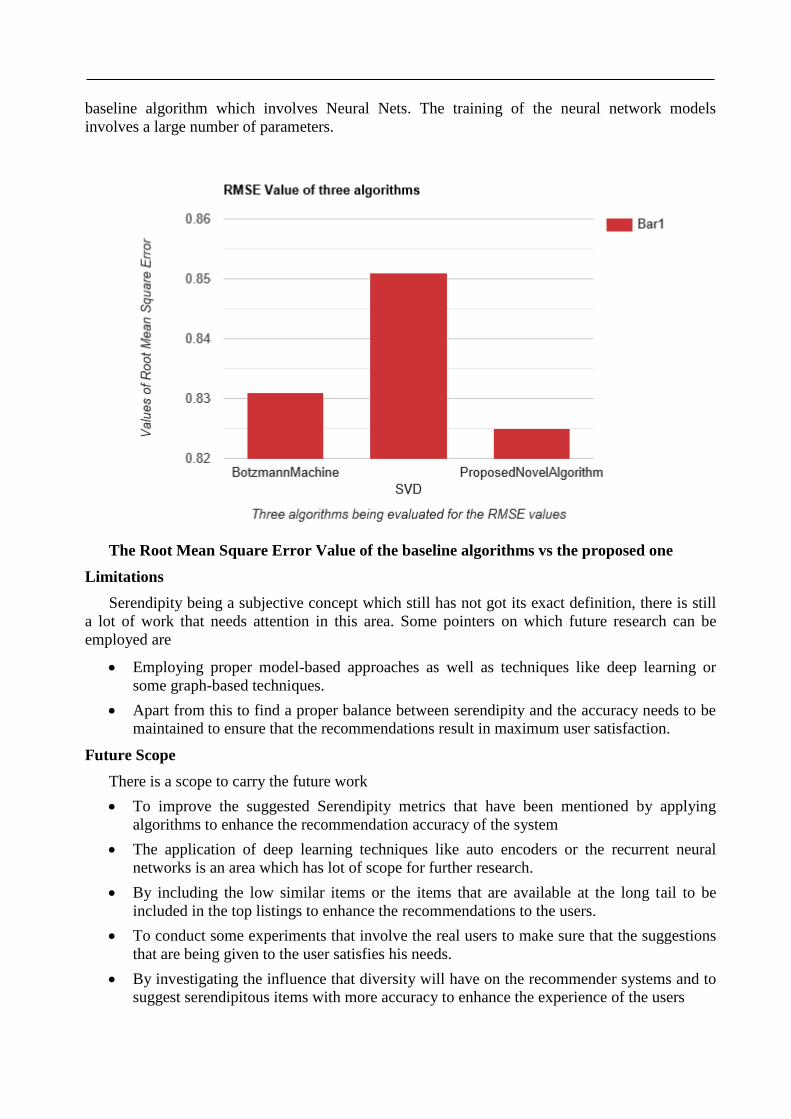
baseline algorithm which involves Neural Nets. The training of the neural network models
involves a large number of parameters.
The Root Mean Square Error Value of the baseline algorithms vs the proposed one
Limitations
Serendipity being a subjective concept which still has not got its exact definition, there is still
a lot of work that needs attention in this area. Some pointers on which future research can be
employed are
Employing proper model-based approaches as well as techniques like deep learning or
some graph-based techniques.
Apart from this to find a proper balance between serendipity and the accuracy needs to be
maintained to ensure that the recommendations result in maximum user satisfaction.
Future Scope
There is a scope to carry the future work
To improve the suggested Serendipity metrics that have been mentioned by applying
algorithms to enhance the recommendation accuracy of the system
The application of deep learning techniques like auto encoders or the recurrent neural
networks is an area which has lot of scope for further research.
By including the low similar items or the items that are available at the long tail to be
included in the top listings to enhance the recommendations to the users.
To conduct some experiments that involve the real users to make sure that the suggestions
that are being given to the user satisfies his needs.
By investigating the influence that diversity will have on the recommender systems and to
suggest serendipitous items with more accuracy to enhance the experience of the users
Reference
1. Batmaz, Z., Yurekli, A., Bilge, A., & Kaleli, C. (2019). A review on deep learning for
recommender systems: challenges and remedies. Artificial Intelligence Review, 52(1).
https://doi.org/10.1007/s10462-018-9654-y
2. Murakami, Tomoko, Koichiro Mori, and Ryohei Orihara (2008). Metrics for evaluating the
serendipity of recommendation lists. New frontiers in artificial intelligence. Springer Berlin
Heidelberg, 2008. 40-46.
3. V. Maccatrozzo, M. Terstall, L. Aroyo, and G. Schreiber, “SIRUP: Serendipity in
Recommendations via User Perceptions,” in Proc. 22nd Int. Conf. Intell. User Interfaces - IUI
’17, 2017, pp. 35-44.
4. Passant, Alexander; Mulvany, Ian; Mika, Peter; Maisonneauve, Nicholas; Löser, Alexander;
Cattuto, Ciro; Bizer, Chris; Bauckhage, Christian and Alani, Harith (2008). Mining for Social
Serendipity. In: Seminar on Social Web Communities, 21-26 September 2008, Dagstuhl.
5. T. Di Noia and V. C. Ostuni, Recommender Systems and Linked Open Data,” in Reasoning
Web. Web Logic Rules. Lecture Notes in Computer Science, 2015, vol 9203, p. 88–113.
6. Pease, Alison, Simon Colton, Ramin Ramezani, John Charnley and Kate Reed (2013). A
discussion on serendipity in creative systems.Proceedings of the Fourth International
Conference on Computational Creativity
7. Toms, E. G. (2000, December). Serendipitous Information Retrieval. In DELOS.
8. De Gemmis, M., Lops, P., Semeraro, G., & Musto, C. (2015). An investigation on the
serendipity problem in recommender systems. Information Processing and Management,
51(5), 695–717. https://doi.org/10.1016/j.ipm.2015.06.008
9. Foster,A.andFord,N.(2003). Serendipity and information seeking: an empirical study. Journal
of Documentation, 59(3):321–340
10. Vargas, S. and Castells, P. (2011). Rank and relevance in novelty and diversity metrics for
recommender systems. In Proceedings of the Fifth ACM Conference on Recommender
Systems,pages 109–116,NewYork, NY, USA. ACM.
11. Iaquinta, L., Semeraro, G., de Gemmis, M., Lops, P., and Molino, P. (2010). Can a
recommender system induce serendipitous encounters? INTECH Open Access Publisher.
12. Kaminskas, M. and Bridge, D. (2014). Measuring surprise in recommender systems. In
Workshop on Recommender Systems Evaluation: Dimensions and Design.
13. Kaminskas, M. and Ricci, F. (2012). Contextual music information retrieval and
recommendation: State of the art and challenges. Computer Science Review, 6(23):89 – 119.
14. Kotkov, D., Veijalainen, J., & Wang, S. (2016). Challenges of Serendipity in Recommender
Systems. In T. A. Majchrzak, P. Traverso, V. Monfort, & K.-H. Krempels (Eds.), WEBIST
2016 : Proceedings of the 12th International conference on web information systems and
technologies. Volume 2 (pp. 251-256). Setúbal: SCITEPRESS. doi:10.5220/
0005879802510256
15. Elkahky AM, Song Y, He X (2015) A multi-view deep learning approach for cross domain
user modeling in recommendation systems. In: Proceedings of the 24th international
conference on world wide web, Florence, Italy, pp 278–288
16. Georgiev K, Nakov P (2013) A non-iid framework for collaborative filtering with restricted
Boltzmann machines. In: Proceedings of the 30th international conference on machine
learning, pp III–1148–III– 1156
17. Strub F, Mary J (2015) Collaborative filtering with stacked denoising autoencoders and sparse
inputs. In: Proceedings of the NIPS workshop on machine learning for eCommerce, Montreal,
Canada
18. Donahue J, Anne Hendricks L, Guadarrama S, Rohrbach M, Venugopalan S, Saenko K,
Darrell T (2015) Long-term recurrent convolutional networks for visual recognition and
description. In: Proceedings of the28th IEEE conference on computer vision and pattern
recognition,Boston,MA,USA, pp2625–2634
19. Ge, M., Delgado-Battenfeld, C., & Jannach, D. (2010). Proceedings of the fourth ACM
conference on Recommender systems - RecSys ’10. The 16Th International Conference, 257.
https://doi.org/10.1145/1864708.1864761
20. Kotkov, D., Konstan, J. A., Zhao, Q., & Veijalainen, J. (2018). Investigating serendipity in
recommender systems based on real user feedback. Proceedings of the ACM Symposium on
Applied Computing, 1341–1350. https://doi.org/10.1145/ 3167132.3167276
21. Jordanous, A. (2012). A standardised procedure for evaluating creative systems:
Computational creativity evaluation based on what it is to be creative. Cognitive Computation
4(3):246–279.
22. Saat, N. I. Y., Noah, S. A. M., & Mohd, M. (2018). Towards serendipity for content-based
recommender systems. International Journal on Advanced Science, Engineering and
Information Technology, 8(4–2), 1762–1769. https://doi.org/10.18517/ijaseit.8.4-2.6807
23. Adamopoulos, P., & Tuzhilin, A. (2014). On Unexpectedness in Recommender Systems. ACM
Transactions on Intelligent Systems and Technology, 5(4), 1–32. https://doi.org/
10.1145/2559952
24. Castells, P., Wang, J., Lara, R., & Zhang, D. (2011). Workshop on Novelty and Diversity in
Recommender Systems - DiveRS 2011. RecSys’11 - Proceedings of the 5th ACM Conference
on Recommender Systems, DiveRS, 393–394. https://doi.org/10.1145/2043932.2044019
25. Chiu, Y. S., Lin, K. H., & Chen, J. S. (2011). A Social Network-based serendipity
recommender system. 2011 International Symposium on Intelligent Signal Processing and
Communications Systems: “The Decade of Intelligent and Green Signal Processing and
Communications”, ISPACS 2011, 1–5. https://doi.org/10.1109/ ISPACS.2011.6146073
26. De Gemmis, M., Lops, P., Semeraro, G., & Musto, C. (2015). An investigation on the
serendipity problem in recommender systems. Information Processing and Management,
51(5), 695–717. https://doi.org/10.1016/j.ipm.2015.06.008
27. Deshmukh, A. A., Nair, P., & Rao, S. (2019). A scalable clustering algorithm for serendipity in
recommender systems. IEEE International Conference on Data Mining Workshops, ICDMW,
2018-Novem, 1279–1288. https://doi.org/10.1109/ ICDMW.2018.00182
28. Jurdi, W. Al, El, M., Badran, K., & Demerjian, J. (n.d.). Serendipity-Aware Noise Detection
System for Recommender Systems.
29. Kaminskas, M., & Bridge, D. (2014). Measuring Surprise in Recommender Systems. RecSys
REDD 2014: International Workshop on Recommender Systems Evaluation: Dimensions and
Design, 69, 2–7. https://doi.org/10.1007/978-0-387-85820-3_4
30. Kotkov, D., Wang, S., & Veijalainen, J. (2017). Improving serendipity and accuracy in cross-
domain recommender systems. Lecture Notes in Business Information Processing, 292, 105–
119. https://doi.org/10.1007/978-3-319-66468-2_6
31. Murakami, T., Mori, K., & Orihara, R. (2008). Metrics for evaluating the serendipity of
recommendation lists. Lecture Notes in Computer Science (Including Subseries Lecture Notes
in Artificial Intelligence and Lecture Notes in Bioinformatics), 4914 LNAI, 40–46.
https://doi.org/10.1007/978-3-540-78197-4_5
32. Picault, J., Kostadinov, D., Castells, P., & Jaimes, A. (2010). Workshop on the practical use of
recommender systems algorithms & technology. Prsat, 373. https://doi.org/10.1145/
1864708.1864795
33. Ramakrishnan, N., Keller, B. J., Mirza, B. J., Grama, A. Y., & Karypis, G. (2001). When being
Weak is Brave: Privacy in Recommender Systems. http://arxiv.org/abs/cs/0105028
Can Online Product Sales be Increased by Ordering a Positive Review
before a Negative One?
Bijit Ghosh1
Spandan Chowdhury2
1Indian Institute of Technology, Delhi
2Jadavpur University
Abstract
Online shopping has created a paradigm shift in the purchasing behaviour of the customers as they interact
with businesses for buying products. Previous research has shown the effect of volume, valence and
content on online customer behaviour (Cheung & Thadani, 2012). This paper investigates the effect of
ordering of the positive and negative online reviews in ecommerce platforms on the customer purchase
decisions. The authors also propose a solution through which the opportunity loss due to this ordering
effect can be converted into potential sales for the ecommerce organizations.
Keywords: Consumer Purchase Decisions, Electronic Word of Mouth, Consumer Decision Manipulation,
Review Sentiment Polarity, Cognition, Cognitive Linguistics.
1. Introduction
With the spread of digitalization and the increasing availability of online shopping platforms,
the new trend of electronic transactions is gradually dominating all aspects of our daily life. The
increasing number of internet users have boosted the growth of e-commerce businesses in India as
well as in other countries of the world. Online shopping platforms, also known as E-commerce
platforms, have become an important and integral part of our lives. This disruptive form of
innovation has created a paradigm shift by radically changing the way of doing business in
traditional terms. Thus, in order to understand this phenomenon and bring further growth and
development in the sector, it is necessary to understand e-commerce business models on one hand,
and the buying patterns and consumer choices on the other.
To the consumer, the entire event of shopping for a product is an experience which is realized
in the cognitive domain. While buying a product from a brick and mortar shop, the consumer takes
into account various inputs apart from the product description and price before making a purchase
decision- these include non-verbal cues like the haptic sensations of touching and feeling a
product for gauging its quality or to assess the degree of comfort in using the product, the social
interaction between the consumer and the other buyers in the shop, the body language of the other
consumers who have recently bought a similar product in presence of the consumer, as well as
various verbal cues like pitch and loudness of voice of the salesperson who is selling the product
(Otto and Chung, 2000). Since these factors are not present in online shopping platforms, the
reviews provided by customers, by virtue of expressing positive and negative sentiments, play a
major role in finalizing a purchase decision.
Our paper aims to understand this pattern of consumer behaviour which depends on the
sentiment polarity reflected in the reviews made by consumers, and particularly investigate
whether the order in which these reviews are presented has a significant effect in influencing and
manipulating the purchase decisions.
2. Research Objectives
This paper aims to investigate the interaction between the sentiment associated with review
comments on e-commerce platforms and their ordering in influencing the purchase decisions of
consumers. Further details regarding the research methodology have been elaborated in section 4.
The main research questions of this study are as follows:
(a) Whether the ordering of online reviews bearing opposite sentiment polarity has an effect on
customer purchase decision,
(b) If the ordering as stated in (a) plays a role, then to what extent does it influence the
purchase decision,
In order to investigate these questions, the following hypotheses have been tested for validity:
Hypothesis 1: Ordering of opposing sentiments in the review has an effect on the purchase
decision.
Hypothesis 2: Negative review presented before positive review (N-P ordering) has a stronger
effect on customer's purchase decision than the case when positive review is presented before
negative review (P-N ordering)
3. Literature Review
In this section, we briefly review the work which has been done in this domain based on the
existing literature. The discussions pertaining to the ideas discussed in this paper are presented in
the following subsections.
3.1 Cognition, emotion & sentiment
The basic assumption of Cognitive Linguistics is that language and cognition interact (Croft
and Cruse, 2004). (Damasio, 1994) mentions that cognition also interacts with emotion. Thus,
language reflects conceptualization of emotion and expresses emotion (Foolen 1997, 2012). This
conceptualization is given a form in language using construals, which consist of a conceptual
content structured through syntactic organization.
Sentiments are the words or sentences that represent a view or opinion that is held or
expressed (Sahayak et.al., 2015). Thus, sentiments are linked to the emotions that a person feels
towards a particular event or an object, and indicates a very complex dispositional idea of the
object (Broad, 1954). (Feldman, 2013) states that sentiments can be investigated mainly in three
levels such as document level, sentence level and aspect level. In our work, we focus our attention
to sentence-level sentiments. Sentence level sentiments help us to understand whether the sentence
expresses any negative, positive or neutral opinion. When the sentence indicates a positive
opinion, the sentiment is classified as positive (positive polarity), whereas a negative opinion
expressed through the sentence expresses a negative sentiment (negative polarity). For the current
study, the neutral sentiments are not taken into consideration. Usually, there are sentiment-bearing
keywords which tend to indicate the polarity status—however, in relation to sarcasm-bearing
opinions, the sentiment-bearing words may give a wrong classificatory sense. Thus, in our work,
the sense conveyed by the entire sentence has been taken into account keeping in mind the
pragmatic uses of language.
3.2 Buying patterns on E-commerce platforms
Internet shopping has been a rapid development in the recent past. However still there is a big
difference in the acceptance rate of internet shopping among people especially in consumer goods
compared to the brick and mortar shopping. The magnifying differences which can be noted are
accounted to a number of factors like the range of information which can be a simulated by the
third-party systems like e-commerce platforms, the extent of familiarity of a technology in the
individual, using an open medium for the transactions and the newness of that particular medium
(Pavlou, 2002).
3.3 The importance of reviews in E-commerce platforms
There are three important attributes of the Electronic Word of Mouth (EWOM) that affect the
online purchase intention of the customer which are volume, valence and content (Cheung &
Thadani, 2012). The volume of EWOM refers to the number of online reviews which have been
posted by users per product/service (King et al., 2014). The valence of EWOM indicates whether
the review posted by the customer is positive, negative or mixed in nature. The content of the
EWOM constitutes the actual review (textual, photos or videos). These three constructs have
differential importance depending on the purchase goal of the customer and the product type in
question (Zhang et al., 2010). For example, the review valence comes into the picture in the
greater sense when the product is a high involvement one and the goal is risk aversion. Also the
positive, negative or mixed EWOM (PWOM, NWOM or MNWOM) has different effects on the
customer decision making process based on the context of the purchase and the product. Studies in
the past have posited that when the product is at the nascent stage in the development cycle and
the users are more internet savvy, the valence and volume of the EWOM takes primary
importance (Zhu & Zhang, 2010). It has been also seen that while both volumes of PWOM and
NWOM have important influences on the customer’s decisions, the NWOM is more impactful in
the cases of higher priced products than PWOM (Park & Lee, 2009).
4. Research Methodology
4.1 Questionnaires
Structured questionnaires were employed for data collection regarding the purchase choice
and manipulation of the choice through online reviews. These questionnaires were sent over the
email to the participants. The questionnaire was divided into two parts. The first part captured the
demographic details of the participant like the name, age, gender, highest level of education and
the city from where they are responding. The second part of the questionnaire consisted of two
pages- the first page had the product description along with the photo and the price. It was made
sure that the product was a contemporary one and the details were taken from an e-commerce
website. However, it was ensured that no detail regarding the particular brand to which the
product belongs was revealed, and any trace of brand information was removed from the product
image and product description to avoid any form of bias in the participant's mind. On the same
page, it was asked whether the respondent would want to purchase the product (based on the
product appearance and the technical description accompanying the image). On the next page, the
positive and negative review pair was presented (constructed by following the methodology
explained in section 4.3), followed by the question whether the respondent would want to change
their purchase decision (taken in the previous page) or stay with it. It was taken care of that the
respondent does not go back to the previous page to change the purchase decision by restricting
their page movements.
4.2 Product
The product selected was a laptop (worth Rs. 39,999 ~ 546 USD). The prices have been
quoted based on the currency exchange rate of US $1 = Rs. 73.35 (Indian Rupee) as on 5th
October, 2020. The reason behind choosing the laptop was that it is well-known to the general
public and it is widely used. Also, since it is a search good, it can be easily evaluated prior to the
purchase on the basis of the description and price.
4.3 Review Polarity Constructs
For the purpose of studying ordering effects of opposite polarity reviews, it was decided that a
compound sentence would be constructed as a consumer review - each compound sentence would
contain two clauses, one of positive sentiment polarity and the other having a negative sentiment
polarity. A total of ten (10) single-sentence reviews were collected from various web pages, the
set having five (5) negative sentiment reviews and five (5) positive sentiment reviews. The
sentiment strength of these reviews was evaluated based on scores in a pre-test conducted among
twenty (20) participants who were not part of the main survey. The respondents for this pretest
had an age range from 23 years to 35 years (Mean = 27.44 years, SD = 3.32 years). The
respondents were asked to assign a sentiment (positive or negative) to each of the sample single-
sentence reviews, and they were asked to indicate the level of valence (on a scale of 1 to 5, with 1
having the least valency and 5 having the most valency) to understand the degree to which they
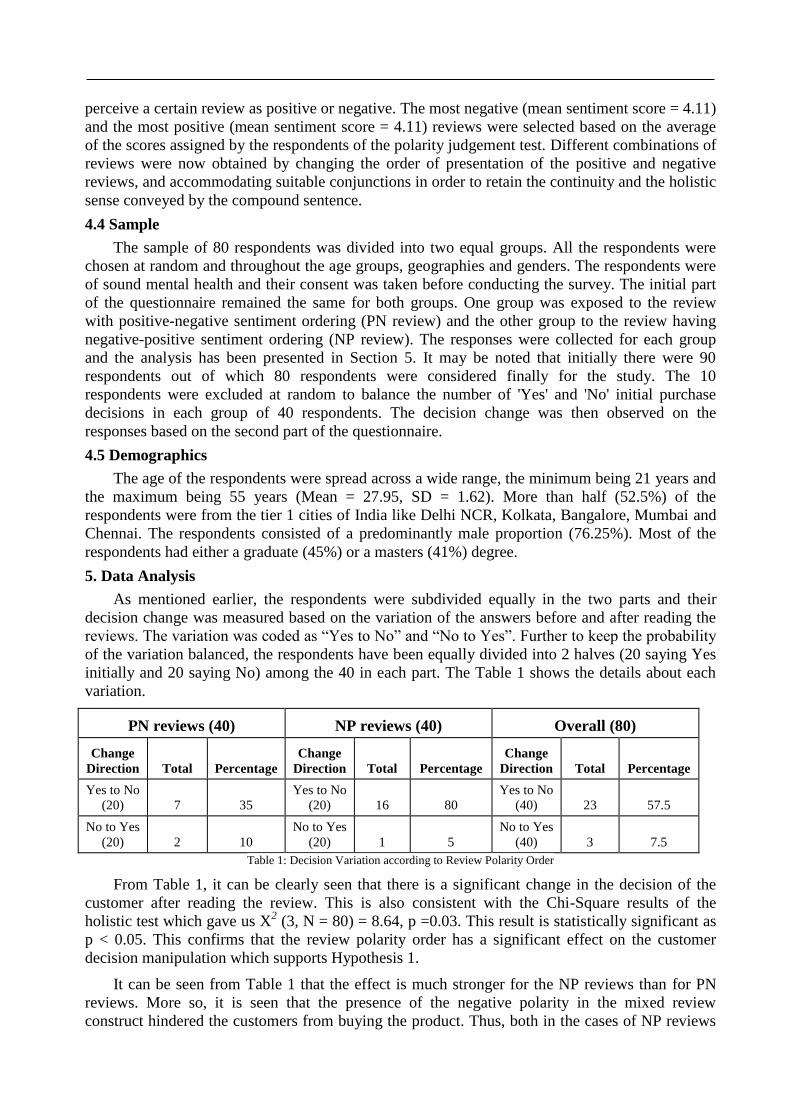
perceive a certain review as positive or negative. The most negative (mean sentiment score = 4.11)
and the most positive (mean sentiment score = 4.11) reviews were selected based on the average
of the scores assigned by the respondents of the polarity judgement test. Different combinations of
reviews were now obtained by changing the order of presentation of the positive and negative
reviews, and accommodating suitable conjunctions in order to retain the continuity and the holistic
sense conveyed by the compound sentence.
4.4 Sample
The sample of 80 respondents was divided into two equal groups. All the respondents were
chosen at random and throughout the age groups, geographies and genders. The respondents were
of sound mental health and their consent was taken before conducting the survey. The initial part
of the questionnaire remained the same for both groups. One group was exposed to the review
with positive-negative sentiment ordering (PN review) and the other group to the review having
negative-positive sentiment ordering (NP review). The responses were collected for each group
and the analysis has been presented in Section 5. It may be noted that initially there were 90
respondents out of which 80 respondents were considered finally for the study. The 10
respondents were excluded at random to balance the number of 'Yes' and 'No' initial purchase
decisions in each group of 40 respondents. The decision change was then observed on the
responses based on the second part of the questionnaire.
4.5 Demographics
The age of the respondents were spread across a wide range, the minimum being 21 years and
the maximum being 55 years (Mean = 27.95, SD = 1.62). More than half (52.5%) of the
respondents were from the tier 1 cities of India like Delhi NCR, Kolkata, Bangalore, Mumbai and
Chennai. The respondents consisted of a predominantly male proportion (76.25%). Most of the
respondents had either a graduate (45%) or a masters (41%) degree.
5. Data Analysis
As mentioned earlier, the respondents were subdivided equally in the two parts and their
decision change was measured based on the variation of the answers before and after reading the
reviews. The variation was coded as “Yes to No” and “No to Yes”. Further to keep the probability
of the variation balanced, the respondents have been equally divided into 2 halves (20 saying Yes
initially and 20 saying No) among the 40 in each part. The Table 1 shows the details about each
variation.
PN reviews (40) NP reviews (40) Overall (80)
Change
Direction Total Percentage
Change
Direction Total Percentage
Change
Direction Total Percentage
Yes to No
(20) 7 35
Yes to No
(20) 16 80
Yes to No
(40) 23 57.5
No to Yes
(20) 2 10
No to Yes
(20) 1 5
No to Yes
(40) 3 7.5
Table 1: Decision Variation according to Review Polarity Order
From Table 1, it can be clearly seen that there is a significant change in the decision of the
customer after reading the review. This is also consistent with the Chi-Square results of the
holistic test which gave us X2 (3, N = 80) = 8.64, p =0.03. This result is statistically significant as
p < 0.05. This confirms that the review polarity order has a significant effect on the customer
decision manipulation which supports Hypothesis 1.
It can be seen from Table 1 that the effect is much stronger for the NP reviews than for PN
reviews. More so, it is seen that the presence of the negative polarity in the mixed review
construct hindered the customers from buying the product. Thus, both in the cases of NP reviews
and PN reviews, the predominant decision was Yes to No. For the NP reviews, the percentage
(80%) was a lot higher than that of the PN reviews (35%). A Fisher’s Exact test was also done to
test the decision change according to the first purchase decision of the respondent (Yes or No)
prior to reading the review. The results of significance are compiled in the table below.
Laptop(Initial Decision = No) Laptop(Initial Decision = Yes)
No to Yes No to No Total Yes to No Yes to Yes Total
PN 2 18 20 PN 7 13 20
NP 1 19 20 NP 16 4 20
Total 3 37 40 Total 23 17 40
P value = 0.385 P value = 0.004
Table 2: Fisher's Exact Test Results
It can be seen from Table 2 that the effect of Review ordering on decision change is highly
significant when the initial answer is Yes (p = 0.004) than when the initial answer is No (p =
0.385). Hence decisions are more inclined to change from Yes to No rather than from No to Yes.
This supports Hypothesis 2 that the negative review presented before the positive review has a
higher effect on the customer purchase manipulation.
6. Discussion
This study aimed to shed light on whether the ordering of review polarity has any effect on
the customer decision manipulation and whether the negative effect is stronger than the positive
effect. The data analysis reveals that ordering of reviews has an effect on the minds of the
customer such that they change their decision. It was also shown that the negative effect is much
higher than the positive effect, which is consistent with our literature (Park & Lee, 2009).
Therefore the negative review placed before the positive review had greater change in the minds
of the customer towards not purchasing the product than the positive review placed before the
negative review. Hence, it is evident that people give more importance to negative reviews and
show a risk aversion behaviour. It can be seen that, NP reviews had a much higher percentage
(80%) of people changing their decision towards not buying than the PN reviews (35%). The
analysis shows there is a decrease by 45 percentage points. This results in an opportunity loss for
the seller and the e-commerce platform. It can be inferred that if 100 people who already decided
to make the purchase, see the NP-ordered review rather than the PN-ordered review, then 45
people change their purchase decision. Thus, for the laptop worth Rs. 40000 (~ 546 USD), the
opportunity loss amounts to Rs.18,00,000 (~24,540 USD). This is a striking problem which is
required to be resolved in order to avoid the opportunity loss.
In order to resolve this problem and convert this opportunity loss into potential revenue, the
authors suggest implementing an ordering restriction or constraint in the webpage section where
reviews of other customers are displayed. The customer usually shares the feedback including
both positive as well as negative sentiment statements in the provided textbox, and there is no
restriction in the ordering, which leads to the problem of opportunity loss as discussed in this
paper. It is being suggested by the authors that the e-commerce platforms incorporate two text
boxes for review submission instead of one, each for positive and negative feedback. The e-
commerce platform should display the positive customer review positioned before the negative
review, thereby negating the ordering effect which causes the decision manipulation to turn from
Yes to No as discussed previously. This in turn shall prevent the opportunity loss and convert the
same into sales for the product.
7. Limitations & Future Scope
There are a few specific limitations of this study which leave room for scope of future
research. Firstly, the product which was chosen here was search good. Hence, future research must
focus on the experiential goods as well for studying this effect. Secondly, the demographics of the
respondents were not taken into consideration here as an independent variable having an influence
on the decision manipulation effect. There may be future studies which can relate attributes like
gender and income to the importance given to online reviews. Lastly, the authors had chosen the
highest positive and highest negative reviews for the study. Other review combinations of
different polarity strengths may be investigated in future.
8. Conclusion
The study contributes towards the theoretical and the practical aspects of consumer cognition
and buying behaviour based on the sentiment polarity of online reviews. The study has examined
that the customer decision can be manipulated by ordering positive and negative online reviews or
E-WOM. This adds to the three factors provided by past researchers (Cheung & Thadani, 2012)
namely, volume, valence and content. In this paper, the authors add a fourth dimension, namely,
the ordering of review polarity which affects the decision change in the minds of the customer.
Thus, the authors show that a simple change in ordering of reviews can help the e-commerce
businesses tap the untapped volume of sales which was earlier getting counted as an opportunity
loss for the organization.
References
1. Broad, C. D. (1954). Emotion and sentiment. The Journal of Aesthetics and Art Criticism, 13(2),
203-214.
2. Cheung, C. M. K., & Thadani, D. R. (2012). The impact of electronic word-of-mouth
communication: A literature analysis and integrative model. Decision Support Systems, 54(1), 461–
470. https://doi.org/10.1016/j.dss.2012.06.008
3. Grice, P. (1975). "Logic and conversation". In Cole, P.; Morgan, J. (eds.). Syntax and semantics. 3:
Speech acts. New York: Academic Press. pp. 41–58.
4. King, R. A., Racherla, P., & Bush, V. D. (2014). What We Know and Don’t Know About Online
Word-of-Mouth: A Review and Synthesis of the Literature. Journal of Interactive Marketing,
28(3), 167–183. https://doi.org/10.1016/j.intmar.2014.02.001
5. Park, C., & Lee, T. M. (2009). Information direction, website reputation and eWOM effect: A
moderating role of product type. Journal of Business Research : JBR, 62(1).
6. Pavlou, P. A. (2002). What drives electronic commerce? A theory of planned behavior perspective.
Academy of Management Proceedings, 2002(1), A1–A6. https://doi.org/10.5465/ apbpp.
2002.7517579
7. Otto, J. R., & Chung, Q. B. (2000). A framework for cyber-enhanced retailing: Integrating e-
commerce retailing with brick-and-mortar retailing. Electronic Markets, 10(3), 185-191.
8. Zhang, J. Q., Craciun, G., & Shin, D. (2010). When does electronic word-of-mouth matter? A
study of consumer product reviews. Journal of Business Research, 63(12), 1336–1341.
9. Zhu, F., & Zhang, X. (Michael). (2010). Impact of online consumer reviews on sales: The
moderating role of product and consumer characteristics. Journal of Marketing, 74(2), 133–148.
https://doi.org/10.1509/jmkg.74.2.133
INDIAN INSTITUTE OF MANAGEMENT KOZHIKODE
Factors affecting acceptance of mobile payment: A vendor's perspective
Kanav Mehra [email protected]
IIM Visakhapatnam, Andhra Bank School of Business Building, AU Campus, Visakhapatnam – 530003
Rounak Polley [email protected]
IIM Visakhapatnam, Andhra Bank School of Business Building, AU Campus, Visakhapatnam – 530003
Sarvesh Patidar [email protected]
IIM Visakhapatnam, Andhra Bank School of Business Building, AU Campus, Visakhapatnam – 530003
Ankur [email protected]
IIM Visakhapatnam, Andhra Bank School of Business Building, AU Campus, Visakhapatnam - 530003
Abstract
The purpose of the study is to explore various factors that affect the acceptance of m-payments by
vendors. A total of 200 responses were used for analysis. Confirmatory factor analysis (CFA) was
performed to validate the measurement model. Path analysis using covariance-based structural equation
modeling (CB-SEM) and PROCESS macro was used to examine the hypothesis. The results indicated that
factors like transparency have a significant impact on the adoption of m-payments by vendors. In contrast,
results indicate that Perceived Risk, Non-compatibility, and Cash preference are factors that significantly
impact vendors' resistance to adopt M-payment services. The Initial Trust and Regret Avoidance mediate
various factors and acceptance/resistance to m-payment systems. This study emphasizes the key factors that
lead to either acceptance or resistance to m-payments.
Keywords: Mobile Payments, UPI, Convenience, Vendor Acceptance, Cash Preference, Perceived Risk
Introduction
Mobile payment has made a significant contribution to the growth of e-commerce. An M-
payment is a money payable using a portable electronic device such as a mobile phone or a tablet
for a good or service (Mallat, 2007). Mobile payments are often made in shops by scanning a bar
code on your phone's application to allow payment to the small and big retailers and convenience
stores. The payment information is encrypted during transmission, so payment is considered safer
than debit or credit card payments. However, mobile payment is different from mobile banking.
Banks are linked directly to mobile banking users, while a third party is obliged to complete the
entire process when paying through the mobile payment option.
Very little research is done on the vendor's intention to use and adapt the mobile payment
system level. This discrepancy in literature prompted the research. Therefore, our research's main
objective is to evaluate vendors' and merchants' adoption level and intention to use mobile
payment systems. The study expands the literature, showing the effect of numerous factors on the
vendors, which lead to the adoption of a mobile payment system. Bloomberg reports that only
53% of Indians have a bank account, of which the majority of accounts have a null balance
(Shankar and Datta, 2018). Nearly 80% of people use mobile phones. The figures suggest that in
the Indian market, there is immense scope for M-payment (Shankar and Datta, 2018). Hence, this
2
research contributes to the literature by investigating the multiple factors influencing vendors and
merchants' actions in the context of m-payments.
2. Literature Review
2.1 Payment Convenience (PC)
Convenience, versatility, and customer value leads to the adoption and growth of new
technology. In developing countries, where financial and banking facilities are not readily
available, M-payment is far more convenient for consumers. Based on the same, we are proposing
the following hypothesis.
H1: Convince of payment received has a significant impact on the seller for adopting m-payment
2.2 Ease of using m-payment (PEU)
Technology Acceptance Model (TAM) is popularly used in established studies exploring
technology acceptance, which asserts the perceived utility and ease of use of new technology
molds users' attitude to embrace the latest technology. Ease of use is an imminent factor in mobile
application acceptance. (Pavel Andrew et al., 2012). Based on the same, we are proposing the
following hypothesis.
H2: Ease of use of m-payment apps has a significant impact on the seller for M-payment
adoption.
2.3 Transparency (T)
Transparency between various parties over a platform is essential for increasing the network
effects of the platform. This helps in building up trust among vendors. Transparent policies and
terms of the condition increase the platform's transparency among its various users. Based on the
same, we are proposing the following hypothesis.
H3: Transparency is positively related to the vendor's adoption of m-payment.
2.4 Perceived Risk (PR)
Buyers' concerns regarding the privacy and protection of online payments are usually related
to authentication and confidentiality and fears about secondary usage and unauthorized access to
transactions and user data. (Lin and Wang, 2006). Based on the same, we are proposing the
following hypothesis.
H4: Perceived Risk is positively related to sellers' resistance to m-payment apps.
2.5 Non-compatibility with m-payments app (NC)
Compatibility measures the coherence between an idea and the future adopters' beliefs,
perceptions, and needs. (Mallat, 2007). Compatibility was found to be a major determinant of
mobile technology and the adoption of services. Based on the same, we are proposing the
following hypothesis.
H5: Lack of knowledge/ Non-Compatibility with M-payment apps is positively related to the
seller's resistance to M-Payments apps.
2.6 Cash preference (CF)
Indrajit Sinha (2014) stated that E- payment system had shown tremendous growth in India,
but there is still a lot to be done to increase its use. Nonetheless, 90 percent of transactions are
done using Cash. Based on the same, we are proposing the following hypothesis.
3
H6: There is a preference for Cash among sellers, which has a significant impact on the seller on
the adoption of m-payments.
2.7 Inertia (I)
In the context of Inertia, as consumer persistence and attachment in the use of an existing
system, even when there are superior alternatives or opportunities for improvement. Individuals do
not want to change their status quo because of the intrinsic essence of conservatism. Individuals
tend not to use the existing system because new systems are considered potentially unsafe or
stressful. (Shankar and Kumari, 2019). Based on the same, we are proposing the following
hypothesis.
H7: Inertia is positively related to a vendor's resistance to adopting m-payment.
2.8 Stakeholder influence (SI)
Stakeholder Influence means the consumer's understanding of his confidence in technology
by colleagues, family members, and other consumers. (Sivathanu, 2017). Vendors perceive a
positive image of using technology to achieve social status and identity in their reference groups.
(Venkatesh and Davis, 2000). Based on the same, we are proposing the following hypothesis
H8: Stakeholder influence is positively related to the vendor's adoption of m-payment.
2.9 Mediating Impact of Initial Trust
Trust is the vendor's confidence that other companies will not misuse their confidential data
and money. If other people also trust the system, then vendors also develop trust due to
stakeholder influence. The system is easy to use, and terms of condition kept transparent vendors
find the system dependable and trustworthy. The following hypothesis is proposed:
H9: Initial Trust mediates the relationship between a) Payment Convenience, b) Stakeholder
Influence, c) Perceived Ease of Use, and d) Transparency and acceptance of M-payment by
vendors.
2.10 Mediating impact of Regret Avoidance
Unpleasant outcomes of past decisions cause regret among individuals. This creates a certain level
of hesitation while adopting new technology. Factors like Risk and Non-compatibility with the
system can further increase regret, which can lead to the development of resistance. Cash-
Preference and a sense of maintaining the status quo are also potential factors that develop such
resistance to new technology. The following hypothesis is proposed:
H10: Regret Avoidance mediates the relationship between a) Perceived Risk, b) Non-
Compatibility, c) Inertia, and d) Cash Preference and resistance of M-payments by vendors
3. Research Method
3.1 Sampling and data collection procedure
This study's response was collected through a properly structured questionnaire at various
wholesale shops, retail shops, manufacturing units, and service providers from 2 major cities,
which are Visakhapatnam and Delhi. We selected various shops using the systematic sampling
method. A total of 200 sellers were approached from various domains to participate in the survey,
and 180 respondents took part in our survey. After deleting the incomplete/invalid responses, we
analyzed a total of 167 responses.
4
4. Results
4.1 Reliability and validity of the Measurement Model
We performed confirmatory factor analysis (CFA) using AMOS 21 to test the input variables'
reliability & validity, as presented in table 2. The results indicate that apart from 'Stakeholder
Influence' and 'Inertia,' all other constructs have a Cronbach alpha value more than 0.7,
establishing that the research constructs are reliable. Constructs' Stakeholder Influence' and
'Inertia' being unreliable were removed from the further analysis model. Results also show that the
Average variance expected (AVE) for the constructs is above .5, and composite reliability (CR)
scores for all variables are above 0.7. This confirms the convergent validity of the scale.
4.2
Path Analysis
The covariance-based structural equation model (SEM) using AMOS 21 was used to examine
direct effects (H1-H8). The mediation effects were examined using the PROCESS macro. The
result of the path analysis shown in table 4 indicates that 'Transparency' (ß=0.581, p<0.05) has a
positive effect on the vendors' acceptance of M-payments. Hence, H3 was accepted. On the other
hand, 'Payment Convenience' (ß=0.202, ns) and 'Perceived Ease of Use' (ß=0.018, ns) didn't
significantly impact the 'acceptance of M-payment' by vendors. Hence H1 and H2 were rejected.
Factors like Perceived Risk (ß=0.331, p<0.001), Non-Compatibility (ß=0.234, p≤0.001), and cash
preference (ß=0.234, p≤0.001) has a significant impact on resistance to M-payment systems by the
vendors. Hence, H4, H5, and H6 were accepted. Factors like Inertia and Stakeholder influence
turned out to be unreliable. Hence hypotheses H7 and H8 are rejected straightaway.
The results of mediation effects are represented in table 5 indicate that Initial trust mediates
the impact of Payment Convenience (indirect effect = 0.1311, LLCI = 0.0442, ULCI = 0.2188),
Stakeholder Influence (indirect effect = 0.1915, LLCI = 0.0725, ULCI = 0.3189), Perceived Ease
of Use (indirect effect = 0.1717, LLCI = 0.0847, ULCI = 0.2648) and Transparency (indirect
effect = 0.1966, LLCI = 0.1062, ULCI = 0.294) on acceptance of M-payment by vendors. Hence,
hypothesis H9a, H9b, H9c, and H9d were accepted. Regret Avoidance mediates the relationship
of Perceived Risk (indirect effect = 0.2113, LLCI = 0.0898, ULCI = 0.2951), Non-Compatibility
(indirect effect = 0.3551, LLCI = 0.2351, ULCI = 0.5045), Inertia (indirect effect = -0.3781, LLCI
5
= -0.5115, ULCI = -0.2264) and Cash Preference (indirect effect = 0.2182, LLCI = 0.0946, ULCI
= 0.3559) on resistance to M-payment by vendors. Hence, hypothesis H10a, H10b, H10c, and
H10d were accepted.
5.
Discussion
Increasing internet penetration and improvement in telecom infrastructure have facilitated the
increase of adoption of these payment options by the Indian consumer and vendors alike. Vendors
expect the platform to be transparent in terms of having complete information regarding revenue
sharing clearly stated. Nothing must be kept hidden from them, which turns out to be a crucial
factor. However, in the case of vendors, factors like Payment Convenience (PC), Perceived Ease
of Use (PEU), Stakeholder Influence (SI) didn't have a significant impact on their acceptance for
M-payments. Contrary to what was observed in the context of customers in various studies (Ozken
et al. (2009), Al-Qeisi et al. (2014), Pavel Andreev et al. (2012)). Since all platforms ensure
payment convenience and ease of use, they probably have less impact on vendors' intention to
adopt m-payment. As far as Stakeholder Influence is concerned, we found that vendors who
adopted m-payment did so by taping the current trends in payments and banking and not under
their customers' influence.
Further, results indicate that Perceived Risk, Non-compatibility, and Cash preference are
factors that significantly impact vendors' resistance to adopt M-payment services. These results
are consistent with previous research on a similar subject (Pavel Andreev et al. (2012)). Whereas
factors like Inertia has no significant impact on the vendor's resistance to m-payments (Shankar
and Kumari (2018)).
Initial Trust significantly mediates the impact of Payment convenience, Stakeholder
Influence, Perceived ease of use, and Transparency on m-payment adoption intention. These
findings are consistent with previous literature (Ozkan et al. (2009)). Regret Avoidance
significantly mediates the impact of Perceived Risk, Non-compatibility, Inertia, and Cash
preference on vendor's resistance to m-payment (Shankar and Kumari (2018)). Technology
adoption is low in India, specifically rural areas. Vendors in India still prefer Cash as a primary
means of transaction from customers.
6. Implication
6.1 Theoretical Implications
This study has several practical and theoretical implications. Theoretically, it contributes to
M-payment literature by examining the different factors affecting adoption intention from the
vendor perspective. Previous studies have been focused mostly on the consumer side of the M-
payment ecosystem; this study describes the other side of the market and fills the gap. This study
gives insights into how most commonly discussed factors like payment convenience and ease of
use can vary significantly on the market's seller side. Since these two factors do not turn out to be
significant compared to the customer side of the market. This study also explains why the
adoption of M-payment is more on the customer side of the market and examines the resistance
behavior towards m-payment from vendor perspective. Thus, enriching the trust literature.
6
6.2 Managerial Implications
Our study also provides important managerial implications for the M-payment systems. M-
payments have a growing market in India. Furthermore, in a pandemic like situation caused by the
COVID-19 outbreak where social distancing is required using Cash can be detrimental to public
health because Cash needs physical contact, and it changes the hands of many people. Our study
found that for the acceptance of M-payments, 'transparency' is a significant factor, whereas
'perceived ease of use' and 'payment convenience' are not. This can be explained by the fact that
the simplicity of the interface and convenient payment are the inherent features of an M-payment
system and are not a deciding factor in its adoption. In contrast, transparency is the benefit derived
from those features. And, on the other hand, perceived risk, non-compatibility, and cash
preference all are inhibitors. Meaning, there is a general lack of trust and understanding of the
system among the sellers. There is also the issue of compatibility, i.e., digital infrastructure and
digital literacy. The short-term solution to increase adoption is to incentivize them, like giving
cashback, etc. But incentives can only be given to a limited number of people. To increase the
adoption of M-payment among the sellers, the companies should focus on promoting transparency
and other added benefits rather than focussing on the features. Increasing awareness is necessary
to build trust among sellers in India.
7. Limitations and future research directions
Our study on M-payment adoption forms the sellers' perspective has significant implications
for management and academia. But there are certain limitations to our study. Firstly, our study is
limited to the sellers in the Indian context only (both urban and rural). A study connecting the
user(buyer) perspective & sellers' perspective may be needed to understand the payment
ecosystem's full picture. Secondly, our study deals specifically with the Indian sellers, and the
findings may not be entirely true for other economies. And the given model can be replicated for
understanding M-payment systems in other developing and developed economies, which can help
generalize the findings. Factors like 'stakeholder influence' and 'Inertia' were not reliable and
hence were not examined. But, from an academic perspective, these factors might be important
and needs to be re-examined. A multi-group analysis can be done between different education
levels and type of seller to identify more specific models in terms of the demographic.
References
1. Al-Qeisi, Kholoud & Dennis, Charles & Alamanos, Eleftherios & Jayawardhena, Chanaka. (2014).
Website design quality and usage behavior: Unified Theory of Acceptance and Use of Technology.
Journal of Business Research. 67. 2282–2290. 10.1016/j.jbusres.2014.06.016.
2. Andreev, Pavel & Pliskin, Nava & Rafaeli, Sheizaf. (2012). Drivers and Inhibitors of Mobile-
Payment Adoption by Smartphone Users. International Journal of E-Business Research. 8.
10.4018/jebr.2012070104.
7
3. Shankar, A, Kumari, P. Exploring the enablers and inhibitors of electric vehicle adoption intention
from sellers' perspective in India: A view of the dual‐factor model. IntJNonprofitVoluntSectMark.
2019; 24:e1662. https://doi.org/10.1002/nvsm.1662
4. Mallat, Niina. (2007). Exploring Consumer Adoption of Mobile Payments—A Qualitative Study.
The Journal of Strategic Information Systems. 16. 413-432. 10.1016/j.jsis.2007.08.001.
5. Weiss. (2011). Mobile payments, digital wallets, and tunnel vision. Biometric Technology Today -
Volume 2011, Issue 9. Pages 8-9, ISSN 0969-4765.
6. Shankar, A., & Datta, B. (2018). Factors Affecting Mobile Payment Adoption Intention: An Indian
Perspective. Global Business Review, S72-S89. https://doi.org/10.1177/0972150918757870
7. Lin, Hsin-Hui & Wang, Yi-Shun. (2006). An examination of the determinants of customer loyalty
in mobile commerce contexts. Information & Management. 43. 271-282. 10.1016/j.im.
2005.08.001.
8. Sivathanu, B. (2018), 'Adoption of digital payment systems in the era of demonetization in India:
An empirical study,' Journal of Science and Technology Policy Management
9. Venkatesh, Viswanath & Davis, Fred. (2000). A Theoretical Extension of the Technology
Acceptance Model: Four Longitudinal Field Studies. Management of Science. 46. 186-204.
10.1287/mnsc.46.2.186.11926.
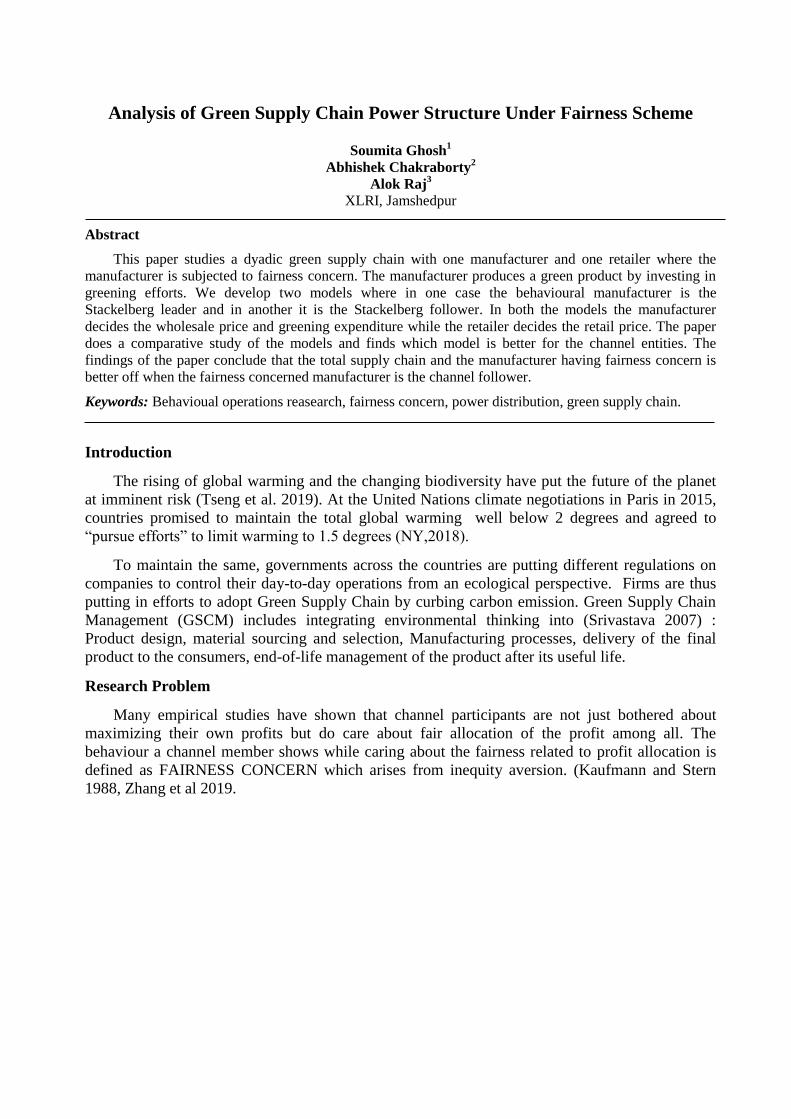
Analysis of Green Supply Chain Power Structure Under Fairness Scheme
Soumita Ghosh1
Abhishek Chakraborty2
Alok Raj3
XLRI, Jamshedpur
Abstract
This paper studies a dyadic green supply chain with one manufacturer and one retailer where the
manufacturer is subjected to fairness concern. The manufacturer produces a green product by investing in
greening efforts. We develop two models where in one case the behavioural manufacturer is the
Stackelberg leader and in another it is the Stackelberg follower. In both the models the manufacturer
decides the wholesale price and greening expenditure while the retailer decides the retail price. The paper
does a comparative study of the models and finds which model is better for the channel entities. The
findings of the paper conclude that the total supply chain and the manufacturer having fairness concern is
better off when the fairness concerned manufacturer is the channel follower.
Keywords: Behavioual operations reasearch, fairness concern, power distribution, green supply chain.
Introduction
The rising of global warming and the changing biodiversity have put the future of the planet
at imminent risk (Tseng et al. 2019). At the United Nations climate negotiations in Paris in 2015,
countries promised to maintain the total global warming well below 2 degrees and agreed to
“pursue efforts” to limit warming to 1.5 degrees (NY,2018).
To maintain the same, governments across the countries are putting different regulations on
companies to control their day-to-day operations from an ecological perspective. Firms are thus
putting in efforts to adopt Green Supply Chain by curbing carbon emission. Green Supply Chain
Management (GSCM) includes integrating environmental thinking into (Srivastava 2007) :
Product design, material sourcing and selection, Manufacturing processes, delivery of the final
product to the consumers, end-of-life management of the product after its useful life.
Research Problem
Many empirical studies have shown that channel participants are not just bothered about
maximizing their own profits but do care about fair allocation of the profit among all. The
behaviour a channel member shows while caring about the fairness related to profit allocation is
defined as FAIRNESS CONCERN which arises from inequity aversion. (Kaufmann and Stern
1988, Zhang et al 2019.
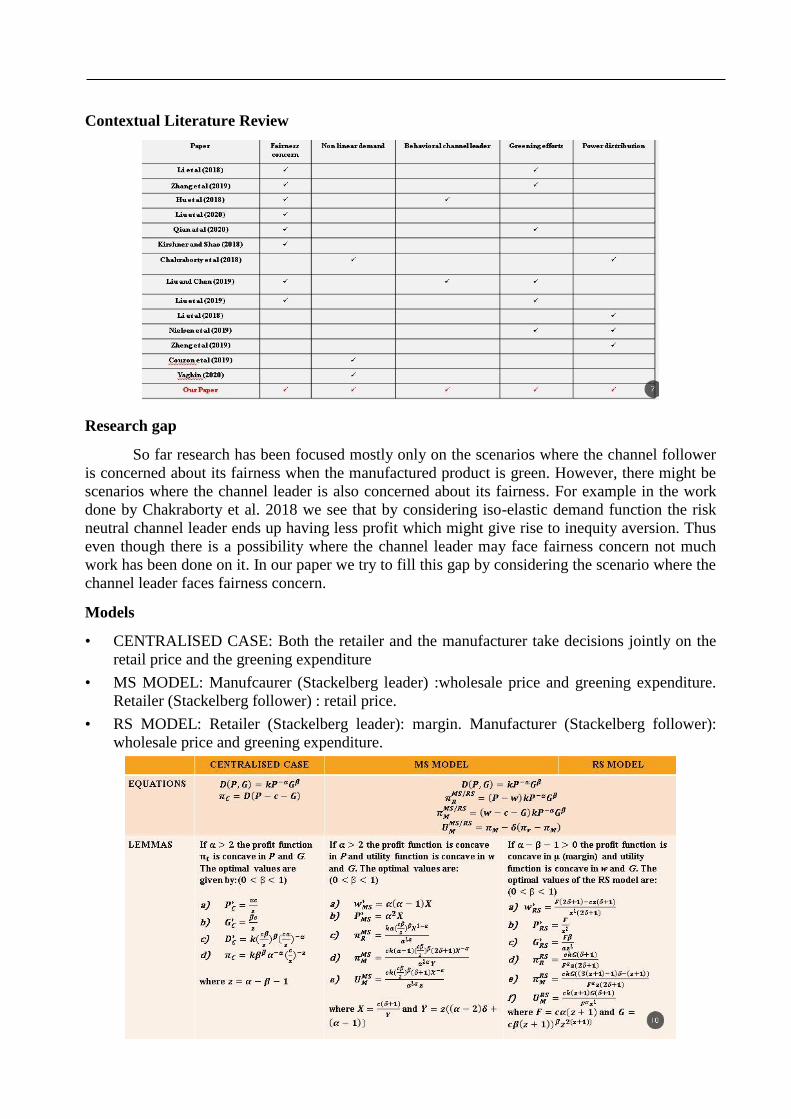
Contextual Literature Review
Research gap
So far research has been focused mostly only on the scenarios where the channel follower
is concerned about its fairness when the manufactured product is green. However, there might be
scenarios where the channel leader is also concerned about its fairness. For example in the work
done by Chakraborty et al. 2018 we see that by considering iso-elastic demand function the risk
neutral channel leader ends up having less profit which might give rise to inequity aversion. Thus
even though there is a possibility where the channel leader may face fairness concern not much
work has been done on it. In our paper we try to fill this gap by considering the scenario where the
channel leader faces fairness concern.
Models
• CENTRALISED CASE: Both the retailer and the manufacturer take decisions jointly on the
retail price and the greening expenditure
• MS MODEL: Manufcaurer (Stackelberg leader) :wholesale price and greening expenditure.
Retailer (Stackelberg follower) : retail price.
• RS MODEL: Retailer (Stackelberg leader): margin. Manufacturer (Stackelberg follower):
wholesale price and greening expenditure.
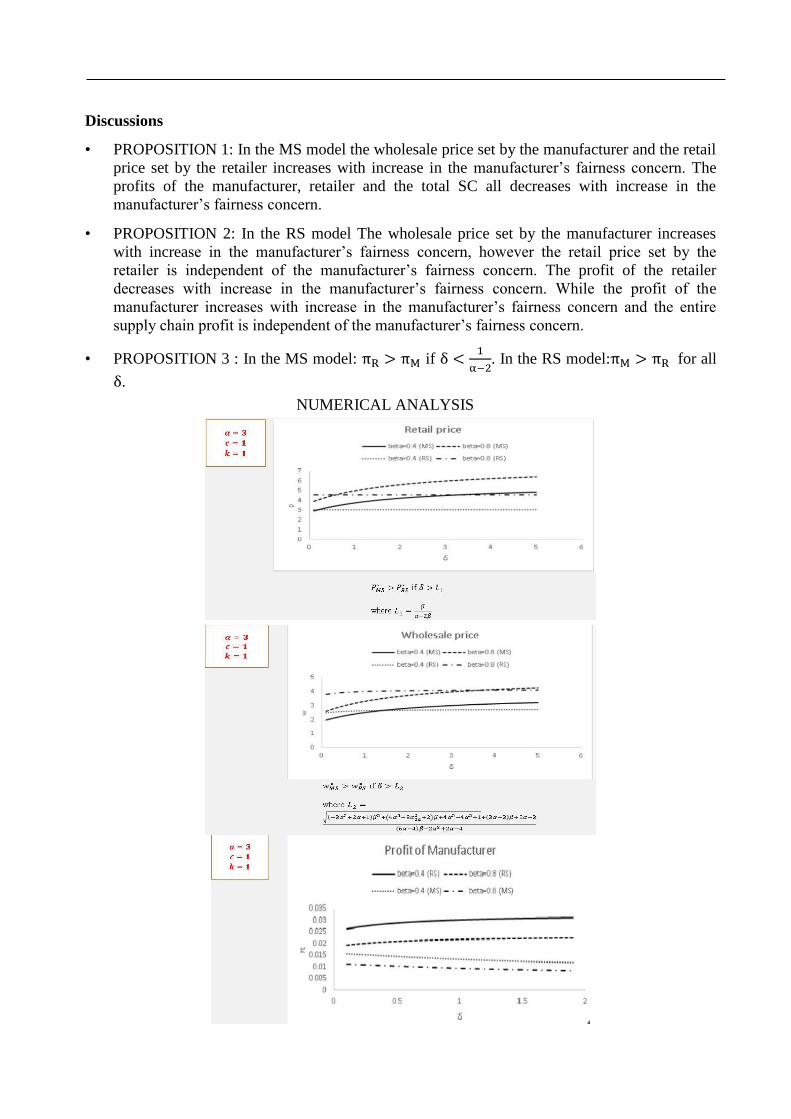
Discussions
• PROPOSITION 1: In the MS model the wholesale price set by the manufacturer and the retail
price set by the retailer increases with increase in the manufacturer’s fairness concern. The
profits of the manufacturer, retailer and the total SC all decreases with increase in the
manufacturer’s fairness concern.
• PROPOSITION 2: In the RS model The wholesale price set by the manufacturer increases
with increase in the manufacturer’s fairness concern, however the retail price set by the
retailer is independent of the manufacturer’s fairness concern. The profit of the retailer
decreases with increase in the manufacturer’s fairness concern. While the profit of the
manufacturer increases with increase in the manufacturer’s fairness concern and the entire
supply chain profit is independent of the manufacturer’s fairness concern.
• PROPOSITION 3 : In the MS model: if
. In the RS model: for all
.
NUMERICAL ANALYSIS
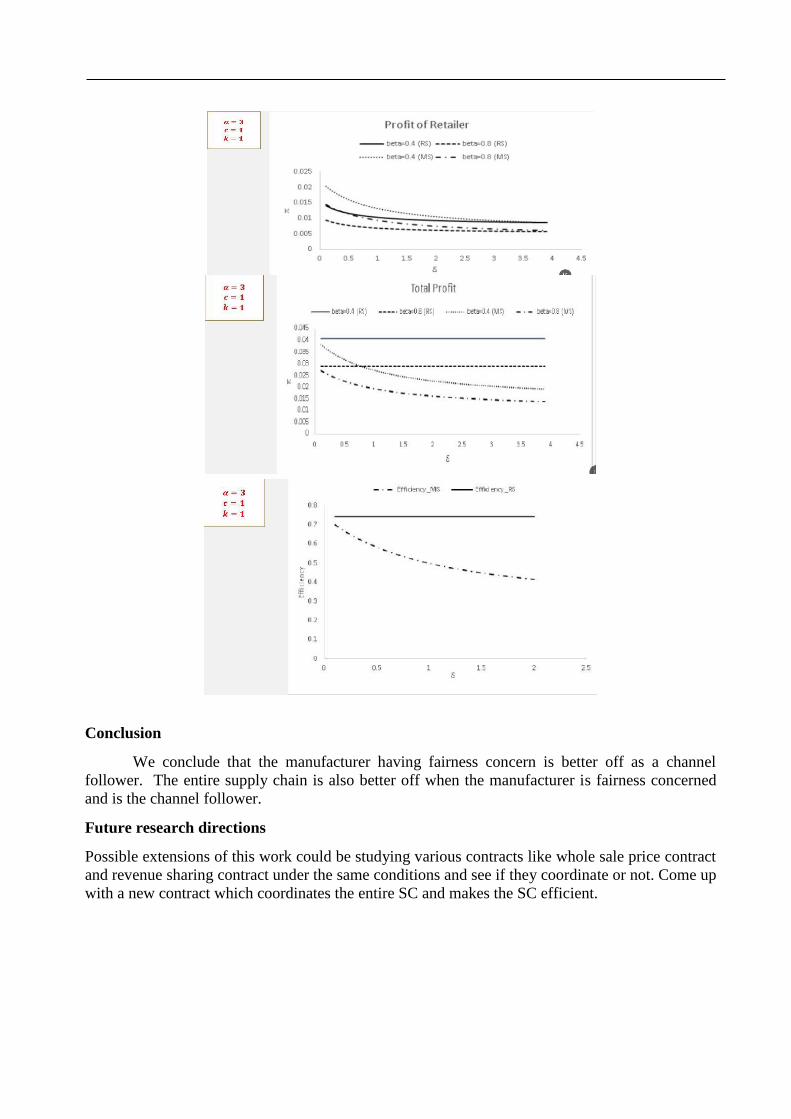
Conclusion
We conclude that the manufacturer having fairness concern is better off as a channel
follower. The entire supply chain is also better off when the manufacturer is fairness concerned
and is the channel follower.
Future research directions
Possible extensions of this work could be studying various contracts like whole sale price contract
and revenue sharing contract under the same conditions and see if they coordinate or not. Come up
with a new contract which coordinates the entire SC and makes the SC efficient.
References
1. Caliskan-Demirag, Ozgun, Youhua Frank Chen, and Jianbin Li (2010). Channel coordination
under fairness concerns and nonlinear demand". European Journal of Operational Research 207.3,
pp. 1321-326.
2. Chakraborty, Abhishek et al. (2018). Relative power in supply chains {Impact on channel
efficiency & contract design". Computers & Industrial Engineering 122, pp. 202-210.
3. Chan, Ricky YK et al. (2012). Environmental orientation and corporate performance: The
mediation mechanism of green supply chain management and moderating effect of competitive
intensity". Industrial Marketing Management 41.4, pp. 621-630.
4. Corbett, Charles J and Robert D Klassen (2006). Extending the horizons: environmental excellence
as key to improving operations". Manufacturing & Service Operations Management 8.1, pp. 5-22.
5. Couzon, Paulin, Yassine Ouazene, and Farouk Yalaoui (2019). Joint pricing and lot-sizing problem
with variable capacity". IFAC-PapersOnLine 52.13, pp. 106-111.
6. Donohue, Karen Lisa, Ozalp Ozer, and Yanchong Zheng (2019). Behavioral Operations: Past,
Present, and Future". Present, and Future (April 29, 2019).
7. Du, Shaofu et al. (2014). Newsvendor model for a dyadic supply chain with Nash bargaining
fairness concerns". International Journal of Production Research 52.17, pp. 5070-5085.
8. Edirisinghe, NCP, B Bichescu, and X Shi (2011). Equilibrium analysis of supply chain structures
under power imbalance". European Journal of Operational Research 214.3, pp. 568-578.
9. Ertek, Gurdal and Paul M Griffin (2002). Supplier-and buyer-driven channels in a twostage supply
chain". IIE transactions 34.8, pp. 691-700.
10. Esmaeili, Maryam, Mir-Bahador Aryanezhad, and Panlop Zeephongsekul (2009). A game theory
approach in seller-buyer supply chain". European Journal of Operational Research 195.2, pp. 442-
448.
INDIAN INSTITUTE OF MANAGEMENT KOZHIKODE
Creating Sustainable Practices using HRM Systems during Turbulence:
Towards a Model for Green Culture Development
Sudhanshu Maheshwari* Doctoral Scholar, Human Resource Management, Indian Institute of Management, Ahmedabad
Address: Room 3215, IIM Ahmedabad, Vastrapur, Ahmedabad, Gujarat - 380015
Email: [email protected]
Ashneet Kaur
Doctoral Scholar, Human Resource Management, Indian Institute of Management, Ahmedabad
Address: Room 2837, IIM Ahmedabad, Vastrapur, Ahmedabad, Gujarat - 380015
Email: [email protected]
Abstract
The need for organisations to operationalise sustainably has augmented in current times of expeditious
changing climate and viral spread of Covid-19. Hence, this study attempts to explore the mechanisms
through which HR systems can engender a sustainable outcome, especially in a turbulent environment. The
research intends to formulate a model that establishes the relationship between Green Human Resource
Management (GHRM) systems and environmental outcomes, such as, Green Innovation and
Environmental Performance while mediated through organisational culture in a turbulent environment. To
assimilate the rapidly changing demands, the study integrates absorptive capacity within the framework and
uses the theoretical lens of institutional logics to explain the given linkage. The study provides managerial
implications, theoretical contribution and future directions for the research in GHRM and sustainable
outcomes.
Keywords: environmental performance, green human resource management, green innovation, turbulent
environment
Introduction
The viral spread of Coronavirus disease 2019 (Anderson, Heesterbeek, Klinkenberg, and
Hollingsworth, 2020) facilitated through an unorganised wet market (Roosa, Lee, Luo, Kirpich,
Rothenberg, Hyman, and Chowell, 2020) has a profound socioeconomic impact on the world
(Craven, Mysore and Wilson, 2020). Similarly, climate-change associated sea level-rise triggered
through augmenting environmental pollution could engender an expected global loss of 0.15% of
dry land by 2050 (Bosello, Roson, and Tol, 2007). Such events have intensified the debate on
understanding the mitigative mechanisms for environmental damages and have developed an
urgent need for adopting sustainable corporate practices (Gadenne, Mia, Sands, Winata, and Hooi,
2012). One of the ways of cultivating sustainable organisational systems that enhances firm’s
environmental performance is through establishing robust organisational culture via green human
resource management (GHRM) practices (Roscoe, Subramanian, Jabbour, and Chong, 2019).
Such pro-environmental organisations could alleviate systemic environmental abuse prevalent by
various economies in the current times.
GHRM has been defined as human resource activities that have the potentiality to develop
sustainable outcomes ramar ). ew stu ies have shown that green human resource
management ) systems can evelo a ro-environmental culture for internal sta ehol ers
to voluntarily increase organisational environmental erformance ham u ov an abbour,
2
2019). However, dynamically and rapidly changing environmental sub-dimensions such as,
demand of customers, realigning of the suppliers, altering technology and changing socio-politics,
defined as turbulence, (Conner, 1998) need to be addressed and accordingly the firm needs to
adjust to ensure holistic development of pro-environmental organisational culture. The absorptive
capacity of the firm (Zahra and George, 2002) influences the organisational tendency to subsume
the impact of these environment dimensions to advance green organisational culture during
turbulence.
Probing the linkage between GHRM systems and green organisational culture is extremely
instrumental for the researchers to ensure sustainable development (Jackson, Renwick, Jabbour,
and Muller‐Carmen, 2011). Moreover, the literature on the development of sustainable
organisational culture through GHRM practices for green outcomes, especially during the
turbulent period is highly unde- researched (Daily, Bishop, and Massoud, 2012). Hence, our study
intends to enrich the GHRM literature through the development of a framework entailing
cultivation of green organisational culture via GHRM systems during turbulence to foster
environmental performance and green innovations. Environmental performance (EP) refers to the
measures that indicate pro-environmental outcomes of the organisation, such as, waste reduction,
recycling performance, cost savings and continuous improvements (Montabon, Sroufe, and
Narasimhan, 2007). The framework has been constructed through propositions that establishes the
mediating role of organisational culture between GHRM systems and environmental outcomes
(EP and Green Innovations). At the same time, the model features the moderating influence of
absorptive capacity on the relationship between GHRM systems and green organisational culture
during turbulence (refer figure 1).
The study adopts the theoretical lens of institutional logics to facilitate the understanding
of the linkage between green employee behaviour and pro-environment organisational culture
established via GHRM systems. Institutional Logics have been defined as a group of material
practices enveloping a particular value system (Mutch, 2018). In our study, the value corresponds
to the assimilation of green practices within the firm. These logics act as an anchor to prescribe
individual and organisational behaviour under specific social settings (Fan and Zietsma, 2017),
such as in the study, logics would be the corporation that fosters green-centric behaviour among
the employees within the organisational context acting as an anchor for their behavioural
prescription.
The paper begins with a brief review of GHRM and green organisational culture. The
second section and third section of the study highlights the theoretical underpinning of
institutional logics that facilitates in formulating the propositions and delves into the conceptual
framework construction through propositions development, respectively. The fourth section
discusses the theoretical contribution of the study, the managerial implication of the model,
provides future directions for the researchers and highlight the limitations of the study. The last
section summarises our complete research through a comprehensive conclusion.
GREEN HUMAN RESOURCE MANAGEMENT AND GREEN ORGANISATIONAL
CULTURE
Connelly and Smith (2012) stated that sustainable development entails simultaneous
assimilation of economic development and social welfare with pro-environmental orientation.
Augmented cognisance of environmental harm among the masses demanded organisation to align
their policies to protect the environment and ensure sustainable development (Bansal and Hunter,
2003). Thus, organisations began to restructure their policies, practices and procedures to align
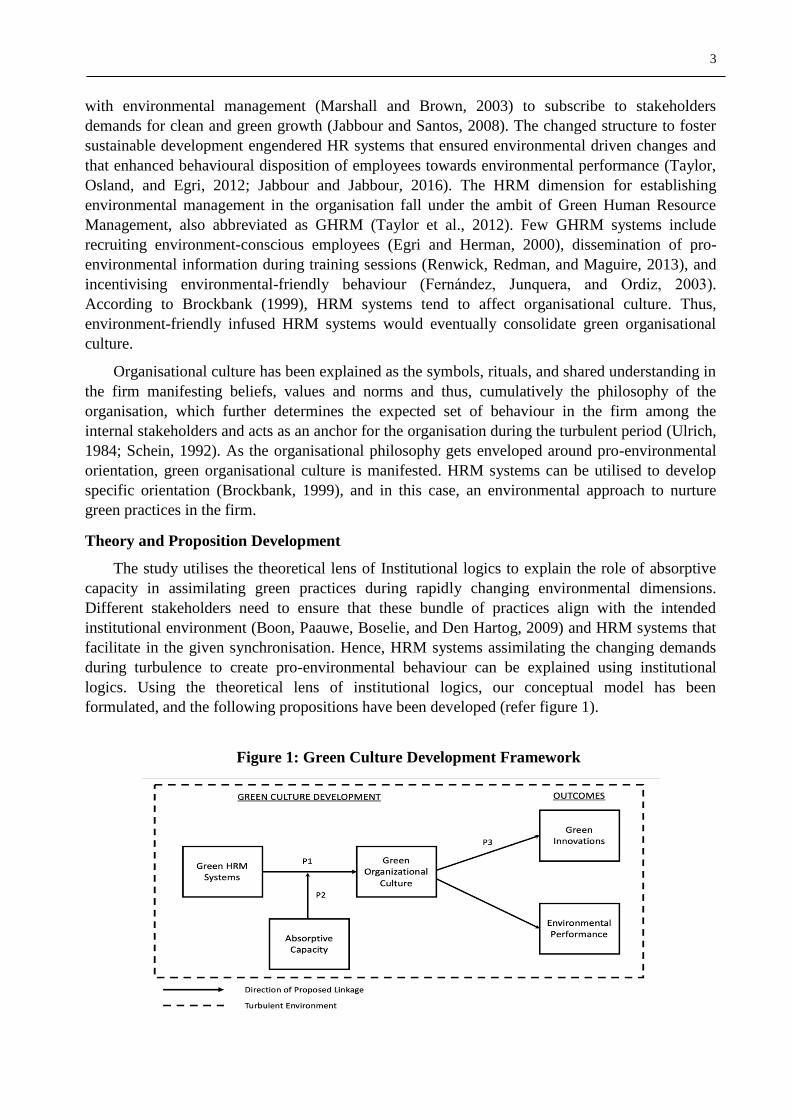
3
with environmental management (Marshall and Brown, 2003) to subscribe to stakeholders
demands for clean and green growth (Jabbour and Santos, 2008). The changed structure to foster
sustainable development engendered HR systems that ensured environmental driven changes and
that enhanced behavioural disposition of employees towards environmental performance (Taylor,
Osland, and Egri, 2012; Jabbour and Jabbour, 2016). The HRM dimension for establishing
environmental management in the organisation fall under the ambit of Green Human Resource
Management, also abbreviated as GHRM (Taylor et al., 2012). Few GHRM systems include
recruiting environment-conscious employees (Egri and Herman, 2000), dissemination of pro-
environmental information during training sessions (Renwick, Redman, and Maguire, 2013), and
incentivising environmental-friendly behaviour ( ern n e un uera an Or i ).
According to Brockbank (1999), HRM systems tend to affect organisational culture. Thus,
environment-friendly infused HRM systems would eventually consolidate green organisational
culture.
Organisational culture has been explained as the symbols, rituals, and shared understanding in
the firm manifesting beliefs, values and norms and thus, cumulatively the philosophy of the
organisation, which further determines the expected set of behaviour in the firm among the
internal stakeholders and acts as an anchor for the organisation during the turbulent period (Ulrich,
1984; Schein, 1992). As the organisational philosophy gets enveloped around pro-environmental
orientation, green organisational culture is manifested. HRM systems can be utilised to develop
specific orientation (Brockbank, 1999), and in this case, an environmental approach to nurture
green practices in the firm.
Theory and Proposition Development
The study utilises the theoretical lens of Institutional logics to explain the role of absorptive
capacity in assimilating green practices during rapidly changing environmental dimensions.
Different stakeholders need to ensure that these bundle of practices align with the intended
institutional environment (Boon, Paauwe, Boselie, and Den Hartog, 2009) and HRM systems that
facilitate in the given synchronisation. Hence, HRM systems assimilating the changing demands
during turbulence to create pro-environmental behaviour can be explained using institutional
logics. Using the theoretical lens of institutional logics, our conceptual model has been
formulated, and the following propositions have been developed (refer figure 1).
Figure 1: Green Culture Development Framework
4
HRM systems have a profound impact on the organisational culture as it has the potentiality
to affect the beliefs, values and norms of the organisation via interdependent HRM systems such
as recruitment, training, performance management ,and compensation (Amini, Bienstock, and
Narcum, 2018). Thus, an HRM system designed to train employees towards sustainable
development and formulating an incentive structure that rewards pro-environmental behaviour
leads to fostering a green culture in the organisation (Attaianese, 2012).
Proposition 1: Green HRM Systems tend to foster a pro-environmental organisational culture
GHRM systems affect sustainable organisational culture, and the absorptive capacity of the
firm influences this relationship. The dynamic capability of the firm to manifest knowledge and
utilise the firm's ability to develop sustainable competitive advantage is defined as the absorptive
capacity of the organisation (Zahra and George, 2002). This capacity is instrumental in enhancing
financial performance and environmental performance of the organisation, especially during a
rapidly changing and uncertain environment (Delmas et al., 2011). Once new knowledge is
generated using subsumed environmental dimensions via absorptive capacities, then the acquired
knowledge is moved across the organisation through individuals via established HRM systems
(Nonaka, 1994). The manifested knowledge once consolidated in the organisation is inferred by
internal stakeholders using various HR techniques (Klaas, Semadeni, Klimchak, and Ward,
2012). Further, this knowledge creation in the firm influences complex set of beliefs, ideas and
assumptions and in turn enhances the overall organisational culture of the organisation (Wang,
Su, and Yang, 2011).
Proposition 2: Augmented Absorptive capacity of the firm, especially during the turbulent period
strengthens the relationship between GHRM systems and organisational culture
Innovative climate and organisational capabilities assist innovation activities and such climate
and capabilities are fostered through the organisational culture (Muffatto, 1998). A study by
em el an Chang ) analyse that once the new organisational culture of ‘hi-tech mo el’
was established in the Taiwanese firms using HR techniques, high-tech innovations augmented in
these organisations. Thus, in alignment with the findings of Hampel and Chang (2002), a culture
formulated around green values and beliefs would stimulate innovations that mitigate
environmental damage, also called as green innovations.
Proposition 3: Pro-environmental organisational culture leads to green innovative products and
services
Discussion
Amid environmental urgencies, there is a dire need for organisations to adopt pro-
environmental behaviour. Hence, our study is an attempt in the same direction as it proposes a
holistic cultural development model for sustainable outcomes for the organisation, especially in a
turbulent environment. The sustainable consequents in the framework have been established
through a green organisational culture that in turn has been consolidated via GHRM systems.
Since, firms need to operationalise in a rapidly altering environment, their capacity to generate and
integrate new external knowledge become instrumental. Thus, the absorptive capacity of the firm
takes the forefront in assimilating this new knowledge with the existing one. Institutional logics
have been used as the theoretical lens to explain the way organisational culture moulds its
practices around the external demand of pro-environmental orientation to amalgamate with the
expected behaviour of internal stakeholders in the firm. Thus, our research attempts to make a
theoretical contribution towards institutional logics realm by probing the way institutional logics
operationalises based on the newly simultaneously generated knowledge in the organisation. The
5
research provides a robust scaffolding for human resource managerial domain. Using the proposed
model, HR managers and practitioners can be cognisant of designing HR systems that infuse green
practices in the firm, and that can lead to environmental-friendly innovations and enhanced EP.
Every study has its set of limitations, and our study is no exception. As the research provide a
conceptual model through proposition building, it does not offer any empirical generalizability
(Becker, 1996). Hence, our claims of the study need to be substantiated empirically to ensure its
applicability to broader contexts. At the same time, we anticipate that green innovations would
influence EP, and this dimension has not been probed in our study. The study provides directions
to future researchers to understand various mechanisms and interplays during the cultivation of
pro-environmental culture through GHRM systems. It opens the plethora of perspectives for
sustainable researchers to explore the ways organisations subsume environment-centric beliefs and
values during turbulence. Thus, the model provides hope for organisations to adopt a pro-
environmental culture and contribute in achieving United Nation's Sustainable Development Goal
(SDG) number eleven to make human settlements and cities more sustainable (United Nations,
2020).
Conclusion
The extent of literature is at the nascent stage on developing a robust model for cultivating
green organisational culture via GHRM systems for achieving environmental outcomes. Our study
is among the first few studies that probe the mediating role of organisational culture through
GHRM systems to acquire sustainable outputs in the turbulent context. Our model has the
potentiality for the firms to become more accommodative of practices leading to green
innovations and advance environmental performance in a rapidly changing environment. Hence,
our study attempts to stimulate management research to explore the proposed linkage --- both
theoretically and empirically.
References
1. Attaianese, E. (2012). A broader consideration of the human factor to enhance sustainable building design.
Work, 41(1), 2155–2159.
2. Bansal, P., & Hunter, ,T. 2003. Strategic explanations for the early adoption of ISO 14001. Journal of
Business Ethics, 46(3): 289–299.
3. Becker, B. J. (1996). The generalizability of empirical research results. In C. P. Benbow & D. J. Lubinski
(Eds.), Intellectual talent: Psychometric and social issues (p. 362–383). Johns Hopkins University Press.
4. Boon, C., Paauwe, J., Boselie, P., & Den Hartog, D. (2009). Institutional pressures and HRM: Developing
institutional fit. Personnel Review, 38(5), 492–508.
5. Bosello, F., Roson, R., & Tol, R. S. J. (2007). Economy-wide Estimates of the Implications of Climate
Change: Sea Level Rise. Environmental and Resource Economics, 37(3), 549–571.
6. Broc ban W. 999). If were really strategically roactive: resent an future irections in ’s
contribution to competitive advantage. Human Resource Management, 38, 337–352.
7. Connelly, J., & Smith, ,G. 2012. Politics and the environment: From theory to practice. Hoboken: T&F
8. Conner, D.R. (1998), Leading at the Edge of Chaos: How to Create the Nimble Organization, John Wiley,
New York, NY.
9. Craven . ysore . an Wilson. ). ‘COVID- 9: Im lications for business’. cKinsey &
Company. Available at: https://www.mckinsey.com/business-functions/risk/our-insights/covid-19-
implications-for-business (accessed on 20 June 2020).
10. Daily, B. F., Bishop, J. W., & Massoud, J. A. (2012). The role of training and empowerment in
environmental performance: A study of the Mexican maquiladora industry. International Journal of
Operations & Production Management, 32(5), 631–647.
11. Delmas, M., Hoffmann, V. H., & Kuss, M. (2011). Under the tip of the iceberg: Absorptive capacity,
environmental strategy, and competitive advantage. Business & Society, 50(1), 116–154.
12. Egri, C. P., & Herman, S. (2000). Leadership in the North American environmental sector: Values,
leadership styles and contexts of environmental leaders and their organizations. Academy of Management
Journal, 43(4), 571–604.
13. Fan, G. H., & Zietsma, C. (2017). Constructing a shared governance logic: The role of emotions in enabling
dually embedded agency. Academy of Management Journal, 60(6), 2321–2351.
6
14. ern n e . un uera B. Or i . ). Organi ational culture an human resources in the
environmental issue: A review of the literature. The International Journal of Human Resource Management,
14(4), 634–656. https://doi.org/10.1080/0958519032000057628
15. Gadenne, D., Mia, L., Sands, J., Winata, L., & Hooi, G. (2012). The influence of sustainability performance
management practices on organisational sustainability performance. Journal of Accounting & Organizational
Change, 8(2), 210–235.
16. Hempel, P. S., & Chang, C. D. (2002). Reconciling traditional Chinese management with high-tech Taiwan.
Human Resource Management Journal, 12, 77–95.
17. Jabbour, C. J. C., & Jabbour, A. B. L. D. ,S. 2016. Green human resource management and green supply
chain management: Linking two emerging agendas. Journal of Cleaner Production, 112: 1824–1833.
18. Jabbour, C. J. C. & Santos, F. C. S. A. 2008. Relationships between human resource dimensions &
environmental management in companies: Proposal of model. Journal of Cleaner Production, 16, 51-58
19. Jackson, S. E., Renwick, D. W. S., Jabbour, C. J. C., & Muller‐Carmen, M. (2011). State‐of‐the‐art an future irections for green human resource management: Intro uction to the s ecial issue. eitschrift f r
Personalforschung, 25(2), 99–116.
20. Klaas, B. S., Semadeni, M., Klimchak, M., & Ward, A.-K. (2012). High-performance work system
implementation in small and medium enterprises: A knowledge-creation perspective. Human Resource
Management, 51(4), 487–510.
21. Kramar, R. (2014). Beyond strategic human resource management: is sustainable human resource
management the next approach? International Journal of Human Resource Management, 25(8), 1069–1089.
22. Lau, C., & Ngo, H. (2004). The HR system, organszational culture, and product innovation. International
Business Review, 13(6), 685 703.
23. Montabon, F., Sroufe, R., & Narasimhan, R. (2007). An examination of corporate reporting, environmental
management practices and firm performance. Special Issue on Innovative Data Sources for Empirically
Building and Validating Theories in Operations Management, 25(5), 998–1014.
24. Muffatto, M. (1998). Corporate and individual competencies: how do they match the innovation process?
International Journal of Technology Management, 15, 836–853.
25. Mutch, A. (2018). Practice, substance, and history: Reframing institutional logics. Academy of Management
Review, 43(2), 242–258.
26. Nonaka, I. (1994). A dynamic theory of organisational knowledge creation. Organisation Science, 5, 14–37.
27. ham . . u ov . abbour C. . C. 9). reening the hos itality in ustry: ow o green
human resource management practices influence orgasizational citizenship behaviour in hotels. Tourism
Management, in press, 72, 386–399.
28. Renwick, D. W. S., Redman, T., & Maguire, S. (2013). Green human resource management: A review and
research agenda. International Journal of Management Reviews, 15(1), 1–14.
29. Roosa, K., Lee, Y., Luo, R., Kirpich, A., Rothenberg, R., Hyman, J. M., Chowell, G. (2020). Real-time
forecasts of the COVID-19 epidemic in China from February 5th to February 24th, 2020. Infectious Disease
Modelling, 5, 256–263.
30. Roscoe, S., Subramanian, N., Jabbour, C. J. C., & Chong, T. (2019). Green human resource management and
the enablers of green organisational culture: nhancing a firm’s environmental erformance for sustainable
development. Business Strategy and the Environment.
31. Schein, E. H. (1992). Organizational culture and leadership. San Francisco, CA: Jossey‐Bass.
Amini, M., Bienstock, C. C., & Narcum, J. A. (2018). Status of corporate sustainability: A content analysis
of Fortune 500 companies. Business Strategy and the Environment, 0(0), 27, 1450–1461.
32. Taylor, S., Osland, J., & Egri, ,C. 2012. Introduction to HRM's role in sustainability: Systems, strategies, and
practices. Human Resource Management, 51: 789–798.
33. Ulrich W.L. 98 ) ‘ an Culture: istory itual an yth ’ uman esource anagement
117– 128.
34. UNITED, N. (2020). Goal 11: Sustainable Development Knowledge Platform. Sustainabledevelopment.
un.org. Retrieved on June 19th 2020, from https:// sustainabledevelopment.un.org/sdg11.
35. Wang, D., Su, Z. and Yang, D. (2011), "Organizational culture and knowledge creation capability", Journal
of Knowledge Management, Vol. 15 No. 3, pp. 363-373.
36. Zahra, S. A., & George, G. (2002). Absorptive capacity: A review, reconceptuasization, and extension.
Academy of Management Review, 27(2), 185–203.
Sustainability Mindset: Micro-foundation of Dynamic Capabilities for
Innovation for Sustainability
Asha K S Nair 1
Som Sekhar Bhattacharyya2
NITIE
Economics and Strategy Department
Abstract
This study explores the key components of a sustainability mindset for innovation for sustainability
based on the perspectives of dynamic capabilities view of strategic management and cognitive psychology
stream of mindset theory. In an organization, a sustainability mindset is a driving factor for positive
organizational outcomes such as innovations for sustainability. A sustainability mindset is conceptualized
as a comprehensive set of psychological competencies, and entrepreneurial action capabilities for
innovation for sustainability. A theoretically developed Sustainability Mindset (SM) framework for
innovation for sustainability is presented, which consist of five critical components: sustainability
intelligence, sustainability sensitivity, sustainability interactions, ethical capital, and sustainability actions.
The practical implications of the study concerned the management of managerial level competencies and
capabilities for enhancing innovation outcomes for organizational sustainability initiatives.
Keywords- Sustainability Mindset (SM), Innovation in organizational sustainability initiatives, Cognitive
abilities, Emotional abilities, Dynamic capabilities
Introduction
Innovation for sustainability incorporates social and environmental dimensions alongside
economic ones and thus has much bigger challenges which include the requirement of more
integrated thinking, reconsideration of existing capabilities, stakeholder relationships, knowledge
management, leadership, and culture (Larson, 2000; Adams et al., 2016). In the recent literature
there seems to be an increased interest in the study of managerial competencies and capabilities
that drive innovation for sustainability (Amui et al., 2017; Mousavi et al., 2019). This is largely
driven by the empirical support for the effects of individual-level factors on corporate
sustainability (Pappagiannakis et al., 2014).
Elkington (1997) posits that it is imminent for organizations to change the paradigm to
become sustainable. This requires an overall value reorientation from the current economic
rationality to the sustainability-oriented rationality focused on long-term survival (Shrivastava,
1995) shaped by managerial mindsets and dispositions (Ardichvili, 2013). In this study, we
address the question of "what is a sustainability mindset that drives innovation towards potentially
transformational sustainability initiatives in an organization?". We use the lenses of dynamic
capabilities view (Teece et al., 1997; Teece 2007a) and the cognitive psychology stream of
mindset theory (Gollwitzer 1990; 2012) to conceptualize the sustainability mindset as a set of
managerial psychological competencies and managerial capabilities that drive innovation for
sustainability in organizations. The study of different mindsets in organizational literature like the
entrepreneurial mindset is a nascent field (Keane et al., 2019) apart from the extensive inquiry on
a global mindset (Levy et al., 2007; Andresen and Bergdolt, 2017). In the context of innovation
for sustainability, Cezarino et al. (2018) and Mousavi et al. (2019) had called for studying
managerial mindset and capabilities that drive innovations in sustainability. The current study
addresses these research gaps identified in the literature.
Theoretical foundation for a sustainability mindset for innovation for sustainability
Understanding innovation for sustainability
Innovation for sustainability is defined as the innovation that is developed to achieve the
sustainability objectives of a firm and results in the renewal or improvement of products, services,
technological or organizational processes to deliver not only economic value but also an enhanced
environmental and social performance, both in the short and the long term (Bos-Brouwers, 2010a).
Firms innovate for sustainability to transform themselves into higher levels of sustainability
(Baumgartner and Ebner, 2010). Sustainability innovations refer to novelty not only in
technology, but also in processes, procedures and practices, business models, systems and thinking
(Szekely and Strebel, 2013).
Managerial competencies for innovation for sustainability
In the extant literature, different managerial psychological competencies such as managerial
environmental awareness (Peng and Liu, 2016) environmental leadership (Chen & Chang 2013),
environmental attitudes (Dibrell et al., 2011), eco-centric beliefs (Papagiannakis 2014), ecological
concern (Bossle et al., 2016) and sustainable environmental orientation (Criado-Gomis et al.,
2018) have been studied as driving factors for innovation for sustainability. Mousavi et al., (2019)
highlights that when the manager's hold sustainability as a guiding mental principle, it drives the
dynamic capabilities (Teece, 2007) for innovation in sustainability.
Managerial capabilities for innovation for sustainability
Managers are found to be an important resource for managing sustainability strategically
(Aragón-Correa and Sharma 2003; Christmann 2000; Stead and Stead 2008). Organizations in
which managers are committed to sustainability, there is a strong imperative to develop strategic
leadership and management capabilities to meet the challenge of working effectively to promote
both social and environmental forms of sustainable development (Gloet, 2006). Manager's
dynamic capability has a positive impact on sustainability (del Mar Alonso-Almeida et al., 2017),
and helps them detect changes in the market earlier and promote a greater social and
environmental commitment (Buil-Fabregà et al., 2017). Lampikoski (2012) discovers three
dynamic managerial capabilities for green innovation which are: making sense of the paradigm
through curiosity, identifying partners and stakeholders, and connecting the strategy, leadership,
and vision termed as research, recognize and revolutionize capabilities respectively.
Sustainability Mindset
Mindset captures a particular way of thinking or processing information. In an organization,
mindset carries the collective thoughts and values of its employees into action (Goodpaster, 2006).
Mindset research is grounded and conceptualized in the literature streams of cognitive
psychology, social psychology, organizational leadership, and positive psychology (French II,
2016). Mindset is intrinsic to a person as it occurs in a person's head but also has the power to
regulate the attitude and influence the behavior (Fang et al., 2004). In the cognitive psychology
literature, mindset is a specific cognitive process or a specific grouping of cognitive processes to
facilitate a given task (Torelli and Kaikati, 2009). Mindset theory identifies both a task and the
cognitive mechanisms that get activated to successfully perform the given task (Gollwitzer and
Bayer, 1999, Gollwitzer, 2012).
Borland et al. (2016) has highlighted that a transformational strategy for sustainability
requires both a managerial mindset and a set of differential and augmented capabilities. In the
context of innovation, Tollin and Vej (2012) and Metz et al. (2016) have put forth the need for
establishing a sustainability mindset in organizations to drive sustainability-driven innovation.
Kalish et al. (2018) have identified a sustainability mindset as a fundamental building block of
new product development. We propose a concept of sustainability mindset as a comprehensive set
of managerial psychological competencies and managerial capabilities that drives innovation for
sustainability initiatives of a firm combining the mindset theory of cognitive psychology and
dynamic capabilities view of strategic management. The sustainability mindset of the managers
embodies the cognitive, emotional, ethical, and relational capabilities, and managerial action
capabilities that enable the development of innovation for sustainability in organizations. The
sustainability mindset concept we propose has similarities to the dimensions of a global mindset,
which comprises of intellectual capital, psychological capital and relational capital (Beechler and
Javidan, 2007) and orientation, knowledge, and behavior (Cseh et al., 2013). In the literature of
globalization, Nielsen (2014) argues that a global mindset is a meta competence and
organizational capability. Rimanoczy & Laszlo (2017) conceptualizes a sustainability mindset
comprising three critical components of knowing, being, and doing.
Cognitive capital for managing innovation for sustainability
The cognitive capital of managers reflected sustainability-related knowledge skills. Hahn et
al. (2014) propose that managers with more complex cognitive frames will have a more inclusive
understanding of sustainability and adopt more proactive responses. Managerial cognitive
capabilities are the capacity of managers to perform mental activities such as attention, perception,
reasoning, and problem-solving (Helfat & Peteraf, 2015). The manager's perception of
institutional pressures positively impacts proactive environmental strategy (Yang et al., 2019) and
greater attention to emerging technologies (Eggers and Kaplan, 2009) fosters the development of
innovation capability. Similarly, a long-term perception has a significant and positive effect on
promoting effect on environmental product innovation and environmental process innovation
(Liao, 2016). For innovating sustainability, managers needed to think holistically (Heiskanen,
2002). This life cycle thinking offers a holistic perspective by embracing all stakeholder
considerations, the environmental impact of products and services (Bocken and Short; 2015).
According to Halbesleben et al. (2003), the temporal complexity of leadership was linked to
creativity and innovation and has a significant impact on the leader competency set that is critical
to lead people effectively in innovation-focused projects. We name the cognitive capital of
managers as sustainability intelligence. The sustainability intelligence representing managerial
cognitive capabilities are micro foundations of dynamic managerial capabilities (Helfat and
Peteraf, 2015) for innovation for sustainability.
Emotional capital for managing innovation for sustainability
Managing sustainably also requires emotional abilities such as passion, sensitiveness,
empathy, and environmental values (Montiel et al., 2018). Shrivastava (2010) stated that
sustainability-related behavioral changes require emotional skills like passionate commitment and
emotional engagement. Huy and Zott (2019) elucidates that managerial emotion regulation
behaviors could be construed as an important micro-foundation of dynamic managerial capability.
Arnaud and Sekerka (2010) illustrated positive emotions are linked to innovation for
sustainability. We name the positive emotional capital as sustainability sensitivity, which is the
affect component of the sustainability mindset. These emotional capabilities are micro foundations
of dynamic managerial capabilities (Huy and Zott, 2019) for innovation for sustainability.
Ethical capital for managing innovation for sustainability
The managers require strong ethical reasoning abilities as part of their cognitive skills to
facilitate innovation for sustainability. The ethical values (Alas et al., 2006) upheld by the
managers provide a strong ground for them to make normative assessments of activities of the
organization about its rightness regardless of costs or benefits to the organization. Such
managerial value assessment and an organizational climate grounded in ethics (Arnaud and
Sekerka, 2010) of a firm's activities and moral reasoning whether it is the right thing to do
(George, 2003) are linked to innovations in sustainability (Thomas and Lamm, 2012). Ethical
capital corresponds to ability of managers to reason and justify sustainability initiatives based on
the fact that it is the right thing to do (Margolis and Walsh 2003) and could be construed as a
micro foundation of dynamic managerial capabilities for innovation (Haney, 2017).
Social capital for managing innovation for sustainability
The managers has to possess competencies in dialogues and persuasive and positive
communications that enabled new understanding, insight, and actions (Smith et al., 2012).
According to Helfat and Peteraf (2015), language and communication was a dynamic cognitive
capability, which is a means for raising awareness, encouraging collaboration, and enhancing
collective actions (Roper et al. 2004). Institutional dialogues were found to drive innovation for
sustainability (Mousavi and Bossink, 2017). Bansal (2002) enumerated that by engaging in
dialogue, the organization and societal actors can identify worthwhile activities and suitable
measures of sustainable development. In addition to interactional and persuasive skills, manager's
social skills of care and empathy (van Kleef and Roome, 2009) and compassionate conduct
(Baucus et al., 2008) facilitated collaboration and cooperation to pursue novel and sustainable
products and services. We name the social capital of managers as sustainability interactions,
which are the capabilities related to the language and social interactions and their positive support
for stakeholders and they form the micro foundations (Helfat and Peteraf, 2015) of dynamic
managerial capabilities for innovation for sustainability.
Managerial innovation for sustainability capabilities
Managerial capabilities for innovations for sustainability are the capabilities with which
managers manage the creativity and innovativeness for sustainability (Helfat and Martin, 2015).
Innovation for sustainability required managers to gather sustainability-related data and insights
from the business environment through internal procedures to identify and evaluate the
sustainability impact on the environment (Mousavi et al., 2019). Innovation for sustainability was
driven by managers through their knowledge integration capability (Albort-Morant et al. 2016),
environmental scanning capability (Chang, 2018) and green knowledge capability (Fernandez-
Mesa et al., 2011). The managers had to possess information sharing capability, and joint sense-
making capability (Albort-Morant et al. 2016) to provide sustainability-related inputs to the entire
organization including the cross-functional teams and the R&D teams. The managers had to
collaborate with highly diverse teams both internally and externally to solve sustainability-related
problems (van Kleefe and Roome, 2009). Dangelico and Pujari (2013) and Hartmann and
Germain (2015) elaborated on the internal and external integration capability such as cross-
functional integration and the creation of collaborative networks along the supply chain for
innovation for sustainability. The managerial routines and capabilities to maintain trust, solve
problems collectively, and the capabilities to form and maintain strong relationships were found to
be significant for driving innovation for sustainability (Van Kleef and Roome, 2009). As per
Ayuso et al. (2006), stakeholder dialogue and communication capability are crucial for innovation
for sustainability. We name the managerial capabilities for innovation for sustainability as
sustainability actions, which are the entrepreneurial activities (Ambrosini and Altintas, 2019) such
as knowledge management and stakeholder management capabilities that are micro foundation of
dynamic capabilities (Schneckenberg et al., 2015; Castiaux, 2012) for innovation for
sustainability.
We propose a Sustainability Mindset (SM) framework for managing innovation for
sustainability (Refer to Figure 1) to theorize our findings.
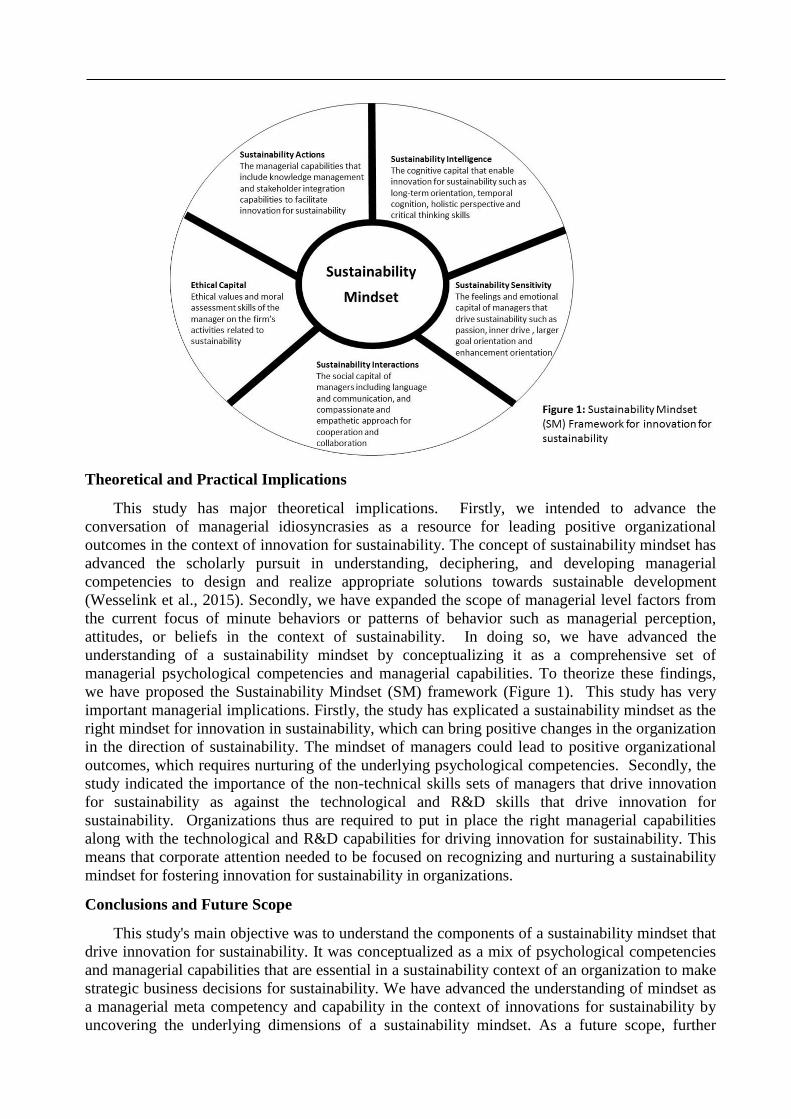
Theoretical and Practical Implications
This study has major theoretical implications. Firstly, we intended to advance the
conversation of managerial idiosyncrasies as a resource for leading positive organizational
outcomes in the context of innovation for sustainability. The concept of sustainability mindset has
advanced the scholarly pursuit in understanding, deciphering, and developing managerial
competencies to design and realize appropriate solutions towards sustainable development
(Wesselink et al., 2015). Secondly, we have expanded the scope of managerial level factors from
the current focus of minute behaviors or patterns of behavior such as managerial perception,
attitudes, or beliefs in the context of sustainability. In doing so, we have advanced the
understanding of a sustainability mindset by conceptualizing it as a comprehensive set of
managerial psychological competencies and managerial capabilities. To theorize these findings,
we have proposed the Sustainability Mindset (SM) framework (Figure 1). This study has very
important managerial implications. Firstly, the study has explicated a sustainability mindset as the
right mindset for innovation in sustainability, which can bring positive changes in the organization
in the direction of sustainability. The mindset of managers could lead to positive organizational
outcomes, which requires nurturing of the underlying psychological competencies. Secondly, the
study indicated the importance of the non-technical skills sets of managers that drive innovation
for sustainability as against the technological and R&D skills that drive innovation for
sustainability. Organizations thus are required to put in place the right managerial capabilities
along with the technological and R&D capabilities for driving innovation for sustainability. This
means that corporate attention needed to be focused on recognizing and nurturing a sustainability
mindset for fostering innovation for sustainability in organizations.
Conclusions and Future Scope
This study's main objective was to understand the components of a sustainability mindset that
drive innovation for sustainability. It was conceptualized as a mix of psychological competencies
and managerial capabilities that are essential in a sustainability context of an organization to make
strategic business decisions for sustainability. We have advanced the understanding of mindset as
a managerial meta competency and capability in the context of innovations for sustainability by
uncovering the underlying dimensions of a sustainability mindset. As a future scope, further
research should investigate the organizational context, cultural contexts, and individual-level
factors that foster a sustainability mindset. It would be a future area of study to identify the
relationship between the different dimensions of a sustainability mindset and their influence on
each other. Finally, it is required to develop a scale for a sustainability mindset to undertake large
scale quantitative studies and generalize the findings of the study.
References
1. Adams, R., Jeanrenaud, S., Bessant, J., Denyer, D., & Overy, P. (2016). Sustainability‐oriented
innovation: A systematic review. International Journal of Management Reviews, 18(2), 180-205.
2. Alas, R., Ennulo, J., & Türnpuu, L. (2006). Managerial values in the institutional context. Journal
of business ethics, 65(3), 269-278.
3. Albort-Morant, G., & Ribeiro-Soriano, D. (2016). A bibliometric analysis of international impact
of business incubators. Journal of Business Research, 69(5), 1775-1779.
4. Alonso‐Almeida, M. D. M., Perramon, J., & Bagur‐Femenias, L. (2017). Leadership styles and
corporate social responsibility management: Analysis from a gender perspective. Business Ethics:
A European Review, 26(2), 147-161.
5. Ambrosini, V., & Altintas, G. (2019). Dynamic Managerial Capabilities. In Oxford Research
Encyclopedia of Business and Management.
6. Amui, L. B. L., Jabbour, C. J. C., de Sousa Jabbour, A. B. L., & Kannan, D. (2017). Sustainability
as a dynamic organizational capability: a systematic review and a future agenda toward a
sustainable transition. Journal of Cleaner Production, 142, 308-322.
7. Andresen, M., & Bergdolt, F. (2017). A systematic literature review on the definitions of global
mindset and cultural intelligence–merging two different research streams. The International Journal
of Human Resource Management, 28(1), 170-195.
8. Aragón-Correa, J. A., & Sharma, S. (2003). A contingent resource-based view of proactive
corporate environmental strategy. Academy of management review, 28(1), 71-88.
9. Ardichvili, A. (2013). The role of HRD in CSR, sustainability, and ethics: A relational
model. Human Resource Development Review, 12(4), 456-473.
10. Arnaud, A., & Sekerka, L. E. (2010). Positively ethical: The establishment of innovation in support
of sustainability. International Journal of Sustainable Strategic Management, 2(2), 121-137.
11. Ayuso, S. (2006). Adoption of voluntary environmental tools for sustainable tourism: Analysing
the experience of Spanish hotels. Corporate social responsibility and environmental
management, 13(4), 207-220.
12. Bansal, P. (2002). The corporate challenges of sustainable development. Academy of Management
Perspectives, 16(2), 122-131.
13. Baucus, M. S., Norton, W. I., Baucus, D. A., & Human, S. E. (2008). Fostering creativity and
innovation without encouraging unethical behavior. Journal of Business Ethics, 81(1), 97-115.
14. Baumgartner, R. J., & Ebner, D. (2010). Corporate sustainability strategies: sustainability profiles
and maturity levels. Sustainable Development, 18(2), 76-89.
15. Beechler, S., & Javidan, M. (2007). Leading with a global mindset. Advances in international
management, 19(7), 131-169.
16. Borland, H., Ambrosini, V., Lindgreen, A., & Vanhamme, J. (2016). Building theory at the
intersection of ecological sustainability and strategic management. Journal of Business
Ethics, 135(2), 293-307.
17. Bos‐Brouwers, H. E. J. (2010). Corporate sustainability and innovation in SMEs: evidence of
themes and activities in practice. Business strategy and the environment, 19(7), 417-435.
18. Bossle, M. B., de Barcellos, M. D., Vieira, L. M., & Sauvée, L. (2016). The drivers for adoption of
eco-innovation. Journal of Cleaner production, 113, 861-872.
19. Buil-Fabregà, M., del Mar Alonso-Almeida, M., & Bagur-Femenías, L. (2017). Individual dynamic
managerial capabilities: Influence over environmental and social commitment under a gender
perspective. Journal of Cleaner Production, 151, 371-379.
20. Castiaux, A. (2012). Developing dynamic capabilities to meet sustainable development
challenges. International Journal of Innovation Management, 16(06), 1240013.
21. Cezarino, L. O., Alves, M. F. R., Caldana, A. C. F., & Liboni, L. B. (2019). Dynamic Capabilities
for Sustainability: Revealing the Systemic Key Factors. Systemic Practice and Action
Research, 32(1), 93-112.
22. Chang, C. H. (2018). How to enhance green service and green product innovation performance?
The roles of inward and outward capabilities. Corporate Social Responsibility and Environmental
Management, 25(4), 411-425.
23. Chen, Y. S., & Chang, C. H. (2013). The determinants of green product development performance:
Green dynamic capabilities, green transformational leadership, and green creativity. Journal of
business ethics, 116(1), 107-119.
24. Christmann, P. (2000). Effects of “best practices” of environmental management on cost
advantage: The role of complementary assets. Academy of Management journal, 43(4), 663-680.
25. Criado-Gomis, A., Iniesta-Bonillo, M. Á., & Cervera-Taulet, A. (2018). Sustainable
entrepreneurial orientation within an intrapreneurial context: Effects on business
performance. International Entrepreneurship and Management Journal, 14(2), 295-308.
26. Cseh, M., Davis, E. B., & Khilji, S. E. (2013). Developing a global mindset: Learning of global
leaders. European Journal of Training and Development.
27. Dangelico, R. M., Pontrandolfo, P., & Pujari, D. (2013). Developing sustainable new products in
the textile and upholstered furniture industries: Role of external integrative capabilities. Journal of
Product Innovation Management, 30(4), 642-658.
28. Dibrell, C., Craig, J. B., & Hansen, E. N. (2011). How managerial attitudes toward the natural
environment affect market orientation and innovation. Journal of Business Research, 64(4), 401-
407.
29. Eggers, J. P., & Kaplan, S. (2009). Cognition and renewal: Comparing CEO and organizational
effects on incumbent adaptation to technical change. Organization Science, 20(2), 461-477.
30. Elkington, J. (1997). The triple bottom line. Environmental management: Readings and cases, 2.
31. Fang, F., Kang, S. P., & Liu, S. (2004). Measuring Mindset Change in the Systemic
Transformation of Education. Association for Educational Communications and Technology.
32. Fernández-Mesa, A., Safón, V., & Iborra, M. (2011). Dynamics of Organizational Ambidexterity
in SMEs: The role of the CEO and the Top Managment Team.
33. French II, R. P. (2016). The fuzziness of mindsets. International Journal of Organizational
Analysis.
34. George, B. (2003). Authentic leadership: Rediscovering the secrets to creating lasting value. John
Wiley & Sons.
35. Gloet, M. (2006). Knowledge management and the links to HRM. Management Research News.
36. Gollwitzer, P. (2012). Mindset theory of action phases (pp. 526-545).
37. Gollwitzer, P. M. (1990). Action phases and mind-sets. Handbook of motivation and cognition:
Foundations of social behavior, 2, 53-92.
38. Gollwitzer, P. M., & Bayer, U. (1999). Deliberative versus implemental mindsets in the control of
action. Dual-process theories in social psychology, 403-422.
39. Goodpaster, K. E. (2006). Conscience and corporate culture.
40. Hahn, T., Preuss, L., Pinkse, J., & Figge, F. (2014). Cognitive frames in corporate sustainability:
Managerial sensemaking with paradoxical and business case frames. Academy of management
review, 39(4), 463-487.
41. Halbesleben, J. R., Novicevic, M. M., Harvey, M. G., & Buckley, M. R. (2003). Awareness of
temporal complexity in leadership of creativity and innovation: A competency-based model. The
Leadership Quarterly, 14(4-5), 433-454.
42. Haney, A. B. (2017). Threat interpretation and innovation in the context of climate change: An
ethical perspective. Journal of Business Ethics, 143(2), 261-276.
43. Hartmann, J., & Germain, R. (2015). Understanding the relationships of integration capabilities,
ecological product design, and manufacturing performance. Journal of Cleaner Production, 92,
196-205.
44. Heiskanen, E. (2002). The institutional logic of life cycle thinking. Journal of Cleaner
Production, 10(5), 427-437.
45. Helfat, C. E., & Martin, J. A. (2015). Dynamic managerial capabilities: A perspective on the
relationship between managers, creativity, and innovation. The Oxford handbook of creativity,
innovation, and entrepreneurship, 421.
46. Helfat, C. E., & Peteraf, M. A. (2015). Managerial cognitive capabilities and the microfoundations
of dynamic capabilities. Strategic management journal, 36(6), 831-850.
47. Huy, Q., & Zott, C. (2019). Exploring the affective underpinnings of dynamic managerial
capabilities: How managers' emotion regulation behaviors mobilize resources for their
firms. Strategic Management Journal, 40(1), 28-54.
48. Kalish, D., Burek, S., Costello, A., Schwartz, L., & Taylor, J. (2018). Integrating Sustainability
into New Product Development: Available tools and frameworks can help companies ensure that
sustainability is embedded as a fundamental building block of new product
development. Research-Technology Management, 61(2), 37-46.
49. Lampikoski, T. (2012). Green, Innovative, and Profitable: A Case Study of Managerial Capabilities
at Interface Inc. Technology Innovation Management Review, 2(11).
50. Larson, A. L. (2000). Sustainable innovation through an entrepreneurship lens. Business strategy
and the environment, 9(5), 304-317.
51. Levy, O., Beechler, S., Taylor, S., & Boyacigiller, N. A. (2007). What we talk about when we talk
about ‘global mindset’: Managerial cognition in multinational corporations. Journal of
International Business Studies, 38(2), 231-258.
52. Liao, Z. (2016). Temporal cognition, environmental innovation, and the competitive advantage of
enterprises. Journal of cleaner production, 135, 1045-1053.
53. Margolis, J. D., & Walsh, J. P. (2003). Misery loves companies: Rethinking social initiatives by
business. Administrative science quarterly, 48(2), 268-305.
54. Metz, P., Burek, S., Hultgren, T. R., Kogan, S., & Schwartz, L. (2016). The Path to Sustainability-
Driven Innovation: Environmental sustainability can be the foundation for increasing competitive
advantage and the basis for effective innovation. Research-Technology Management, 59(3), 50-61.
55. Montiel, I., Antolin-Lopez, R., & Gallo, P. J. (2018). Emotions and sustainability: A literary genre-
based framework for environmental sustainability management education. Academy of
Management Learning & Education, 17(2), 155-183.
56. Mousavi, S., & Bossink, B. A. (2017). Firms’ capabilities for sustainable innovation: The case of
biofuel for aviation. Journal of Cleaner Production, 167, 1263-1275.
57. Mousavi, S., Bossink, B., & van Vliet, M. (2019). Microfoundations of companies' dynamic
capabilities for environmentally sustainable innovation: Case study insights from high‐tech
innovation in science‐based companies. Business Strategy and the Environment, 28(2), 366-387.
58. Nielsen, R. K. (2014). Global Mindset as Managerial Meta-competence and Organizational
Capability: Boundary-crossing Leadership Cooperation in the MNC The Case of ‘Group
Mindset’in Solar A/S. Frederiksberg: Copenhagen Business School (CBS).
59. Papagiannakis, G., Voudouris, I., & Lioukas, S. (2014). The road to sustainability: Exploring the
process of corporate environmental strategy over time. Business Strategy and the
Environment, 23(4), 254-271.
60. Peng, X., & Liu, Y. (2016). Behind eco-innovation: Managerial environmental awareness and
external resource acquisition. Journal of Cleaner Production, 139, 347-360.
61. Rimanoczy, I., & Laszlo, E. (2017). Big bang being: Developing the sustainability mindset.
Routledge.
62. Roper, J., Zorn, T. E., & Weaver, C. K. (2004). The communicative properties of science and
technology dialogue: A project for the Ministry of Research, Science and Technology.
63. Schneckenberg, D., Truong, Y., & Mazloomi, H. (2015). Microfoundations of innovative
capabilities: The leverage of collaborative technologies on organizational learning and knowledge
management in a multinational corporation. Technological Forecasting and Social Change, 100,
356-368.
64. Shrivastava, P. (2010). Pedagogy of passion for sustainability. Academy of Management Learning
& Education, 9(3), 443-455.
65. Smith, P. A., Wals, A. E., & Schwarzin, L. (2012). Fostering organizational sustainability through
dialogic interaction. The Learning Organization.
66. Stead, J. G., & Stead, W. E. (2008). Sustainable strategic management: an evolutionary
perspective. International Journal of Sustainable Strategic Management, 1(1), 62-81.
67. Szekely, F., & Strebel, H. (2013). Incremental, radical and game-changing: strategic innovation for
sustainability. Corporate Governance: International Journal of Business in Society, 13(5), 467-481.
68. Teece, D. J. (2007). Explicating dynamic capabilities: the nature and microfoundations of
(sustainable) enterprise performance. Strategic management journal, 28(13), 1319-1350.
69. Teece, D. J., Pisano, G., & Shuen, A. (1997). Dynamic capabilities and strategic
management. Strategic management journal, 18(7), 509-533.
70. Thomas, T. E., & Lamm, E. (2012). Legitimacy and organizational sustainability. Journal of
business ethics, 110(2), 191-203.
71. Tollin, K., & Vej, J. (2012). Sustainability in business: understanding meanings, triggers and
enablers. Journal of Strategic Marketing, 20(7), 625-641.
72. Torelli, C. J., & Kaikati, A. M. (2009). Values as predictors of judgments and behaviors: The role
of abstract and concrete mindsets. Journal of personality and social psychology, 96(1), 231.
73. Van Kleef, J. A., & Roome, N. J. (2007). Developing capabilities and competence for sustainable
business management as innovation: a research agenda. Journal of cleaner production, 15(1), 38-
51.
74. Wesselink, R., Blok, V., van Leur, S., Lans, T., & Dentoni, D. (2015). Individual competencies for
managers engaged in corporate sustainable management practices. Journal of Cleaner
Production, 106, 497-506.
75. Yang, D., Wang, A. X., Zhou, K. Z., & Jiang, W. (2019). Environmental strategy, institutional
force, and innovation capability: A managerial cognition perspective. Journal of Business
Ethics, 159(4), 1147-1161.
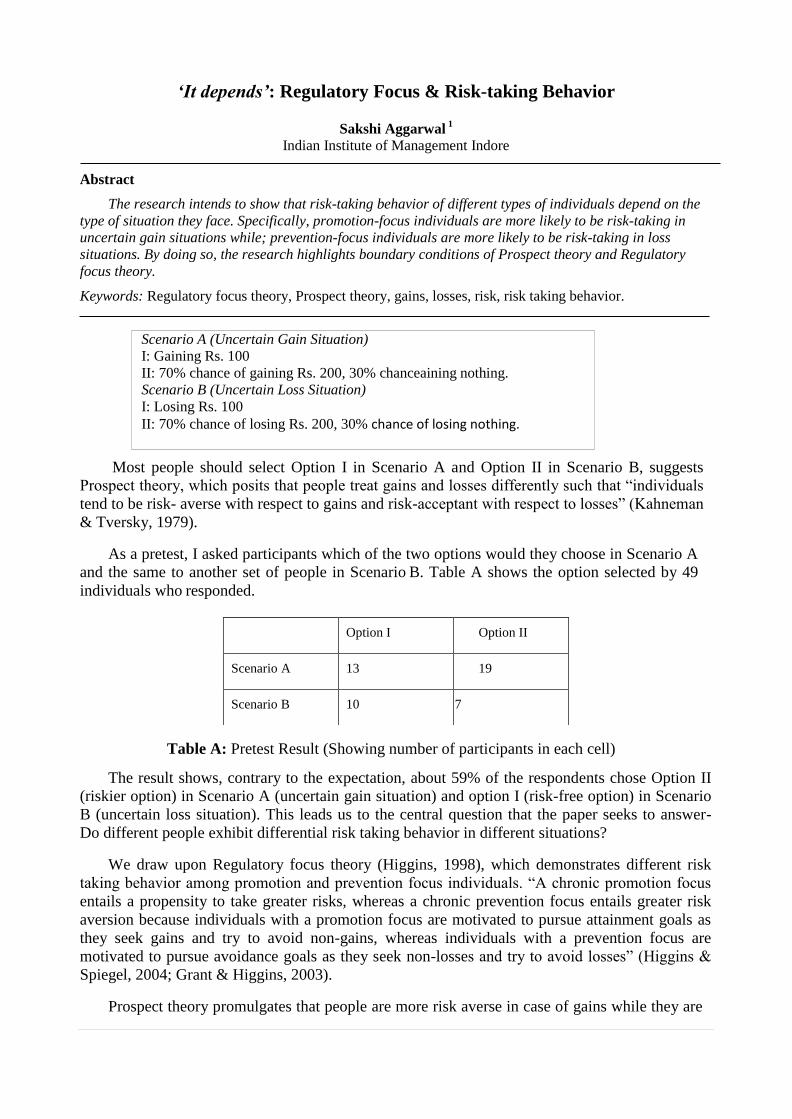
Scenario A (Uncertain Gain Situation)
I: Gaining Rs. 100
II: 70% chance of gaining Rs. 200, 30% chanceaining nothing.
Scenario B (Uncertain Loss Situation)
I: Losing Rs. 100
II: 70% chance of losing Rs. 200, 30% chance of losing nothing.
‘It depends’: Regulatory Focus & Risk-taking Behavior
Sakshi Aggarwal 1
Indian Institute of Management Indore
Abstract
The research intends to show that risk-taking behavior of different types of individuals depend on the
type of situation they face. Specifically, promotion-focus individuals are more likely to be risk-taking in
uncertain gain situations while; prevention-focus individuals are more likely to be risk-taking in loss
situations. By doing so, the research highlights boundary conditions of Prospect theory and Regulatory
focus theory.
Keywords: Regulatory focus theory, Prospect theory, gains, losses, risk, risk taking behavior.
Most people should select Option I in Scenario A and Option II in Scenario B, suggests
Prospect theory, which posits that people treat gains and losses differently such that “individuals
tend to be risk- averse with respect to gains and risk-acceptant with respect to losses” (Kahneman
& Tversky, 1979).
As a pretest, I asked participants which of the two options would they choose in Scenario A
and the same to another set of people in Scenario B. Table A shows the option selected by 49
individuals who responded.
Table A: Pretest Result (Showing number of participants in each cell)
The result shows, contrary to the expectation, about 59% of the respondents chose Option II
(riskier option) in Scenario A (uncertain gain situation) and option I (risk-free option) in Scenario
B (uncertain loss situation). This leads us to the central question that the paper seeks to answer-
Do different people exhibit differential risk taking behavior in different situations?
We draw upon Regulatory focus theory (Higgins, 1998), which demonstrates different risk
taking behavior among promotion and prevention focus individuals. “A chronic promotion focus
entails a propensity to take greater risks, whereas a chronic prevention focus entails greater risk
aversion because individuals with a promotion focus are motivated to pursue attainment goals as
they seek gains and try to avoid non-gains, whereas individuals with a prevention focus are
motivated to pursue avoidance goals as they seek non-losses and try to avoid losses” (Higgins &
Spiegel, 2004; Grant & Higgins, 2003).
Prospect theory promulgates that people are more risk averse in case of gains while they are
Option I Option II
Scenario A 13 19
Scenario B 10 7
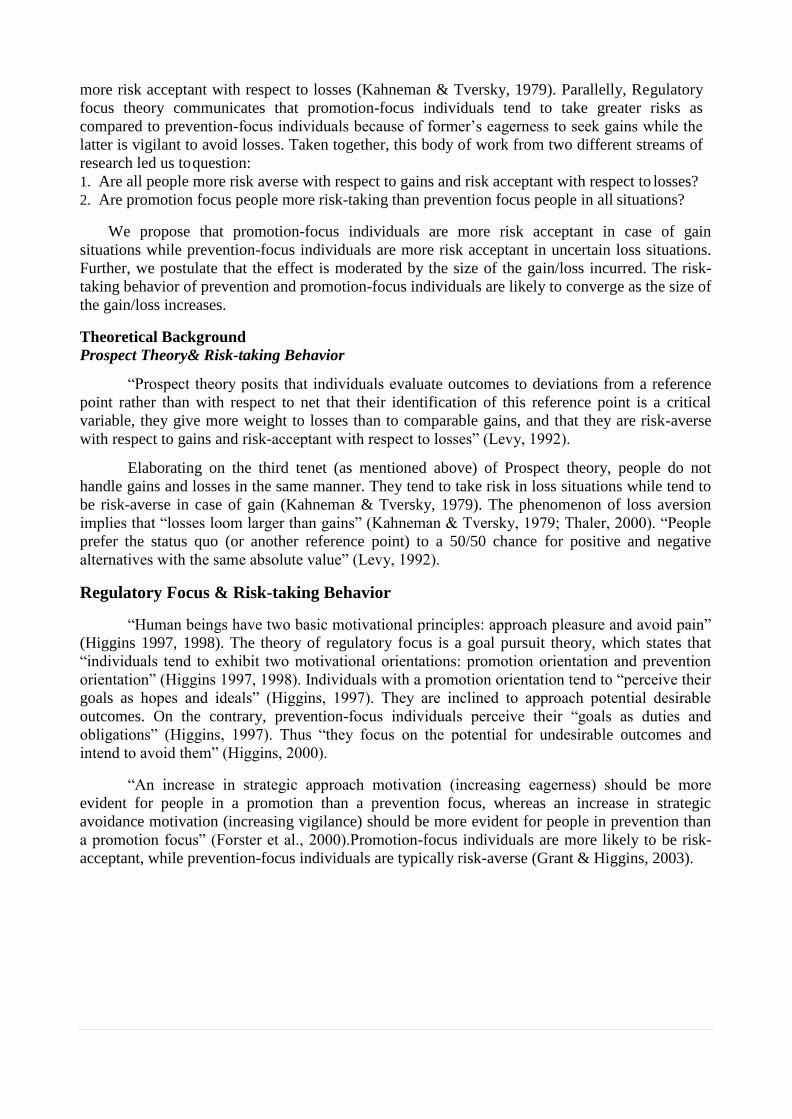
more risk acceptant with respect to losses (Kahneman & Tversky, 1979). Parallelly, Regulatory
focus theory communicates that promotion-focus individuals tend to take greater risks as
compared to prevention-focus individuals because of former’s eagerness to seek gains while the
latter is vigilant to avoid losses. Taken together, this body of work from two different streams of
research led us to question:
1. Are all people more risk averse with respect to gains and risk acceptant with respect to losses?
2. Are promotion focus people more risk-taking than prevention focus people in all situations?
We propose that promotion-focus individuals are more risk acceptant in case of gain
situations while prevention-focus individuals are more risk acceptant in uncertain loss situations.
Further, we postulate that the effect is moderated by the size of the gain/loss incurred. The risk-
taking behavior of prevention and promotion-focus individuals are likely to converge as the size of
the gain/loss increases.
Theoretical Background
Prospect Theory& Risk-taking Behavior
“Prospect theory posits that individuals evaluate outcomes to deviations from a reference
point rather than with respect to net that their identification of this reference point is a critical
variable, they give more weight to losses than to comparable gains, and that they are risk-averse
with respect to gains and risk-acceptant with respect to losses” (Levy, 1992).
Elaborating on the third tenet (as mentioned above) of Prospect theory, people do not
handle gains and losses in the same manner. They tend to take risk in loss situations while tend to
be risk-averse in case of gain (Kahneman & Tversky, 1979). The phenomenon of loss aversion
implies that “losses loom larger than gains” (Kahneman & Tversky, 1979; Thaler, 2000). “People
prefer the status quo (or another reference point) to a 50/50 chance for positive and negative
alternatives with the same absolute value” (Levy, 1992).
Regulatory Focus & Risk-taking Behavior
“Human beings have two basic motivational principles: approach pleasure and avoid pain”
(Higgins 1997, 1998). The theory of regulatory focus is a goal pursuit theory, which states that
“individuals tend to exhibit two motivational orientations: promotion orientation and prevention
orientation” (Higgins 1997, 1998). Individuals with a promotion orientation tend to “perceive their
goals as hopes and ideals” (Higgins, 1997). They are inclined to approach potential desirable
outcomes. On the contrary, prevention-focus individuals perceive their “goals as duties and
obligations” (Higgins, 1997). Thus “they focus on the potential for undesirable outcomes and
intend to avoid them” (Higgins, 2000).
“An increase in strategic approach motivation (increasing eagerness) should be more
evident for people in a promotion than a prevention focus, whereas an increase in strategic
avoidance motivation (increasing vigilance) should be more evident for people in prevention than
a promotion focus” (Forster et al., 2000).Promotion-focus individuals are more likely to be risk-
acceptant, while prevention-focus individuals are typically risk-averse (Grant & Higgins, 2003).
Consistent with these theories, we propose that the type of situation at hand moderates the
relationship between regulatory focus of individuals and their risk taking behavior. For the
purpose of this research, by ‘type of situation’, we mean uncertain gain or loss situation. Since
“promotion-focus individuals seek gains and avoid non-gains” while “prevention-focus people
seek non-losses and avoid losses” (Higgins & Spiel, 2004), we posit that promotion-focus
individuals, being eager and hopeful of attaining desirable outcomes, are more risk acceptant in
case of uncertain gain situations to maximize gains; while prevention-focus individuals, with their
focus on avoidance of undesirable outcomes, are more risk acceptant in uncertain loss situations to
minimize losses. Promotion focus individuals experience a regulatory fit when they take risk in
order to attain gains while prevention focus individuals experience a regulatory fit when they take
risk to avoid losses. Therefore, this is our first hypothesis:
H1: Type of situation moderates the relationship between regulatory focus and risk taking
behavior. When facing an uncertain loss (vs. gain) situation, prevention (vs. promotion)
focus individuals are more risk-taking.
Promotion-focus orientation finds “success in achieving a maximal goal”, whereas success in
prevention-focus orientation is in “achieving a minimal goal”. Similarly, failure in prevention-
focus orientation is “failure to achieve a minimal goal”, while that in promotion-orientation is
“failure to achieve a maximal goal” (Idson, 1999). Research suggests that prevention-focus
individuals tend to be more loss averse as compared to promotion-focus individuals (Idson et al.,
2000; Liberman et al., 2005). Therefore, Prevention-focus individuals will take risk in uncertain
loss situations, as they will want to avoid loss, whereas will not take risk in uncertain gain
situations as there is nothing to lose in such situations, moreover by taking risk they may lose the
confirmed gain. On the other hand, promotion-focus individuals will take risk in uncertain gain
situations, as they will want to maximize gains but their risk-taking propensity in uncertain loss
situations will be lower, as there is nothing to gain in such situations. By taking risk, they might
end up losing nothing i.e. a non-loss, but that’s still considered a failure by promotion-focus
individuals and therefore, they will not want to take a risk in such a situation.
H2: Prevention-focus individuals (vs. Promotion-focus individuals) are more risk-taking in
uncertain loss (vs. gain) situations in order to minimize loss (vs. maximize gain).
“Loss aversion occurs for large outcomes because the negative feelings associated
with large anticipated negative outcomes are harder to discount” (Harinck et al., 2007). As
the size of the loss increases in an uncertain loss situation, promotion-focus individuals
should also be willing to take risk, as they might not find much merit in taking a risk to
avoid a small loss, it may be more difficult to bear a large loss. On the other hand, when the size of the gain is big (vs. small) in an uncertain gain
situation, even promotion-focus individuals should be less willing to take risk to gain more, as
its more difficult to give up a large sure gain than a small sure gain.
H3: Size of the loss/gain moderates the relationship between regulatory focus of
individuals and their risk taking behavior in uncertain loss/gain situations. As size of loss/gain
increases in an uncertain loss/gain situation respectively, risk taking behavior of promotion and
prevention focus individuals converge such that in case of a large-sized (vs. small-sized)
uncertain loss situation, both prevention and promotion- focus individuals are more likely to take
risk to avoid incurring the large loss whereas in case of a large-sized (vs. small-sized) uncertain
gain situation, both promotion and prevention-focus individuals are less likely to take risk to
attain still larger gains.
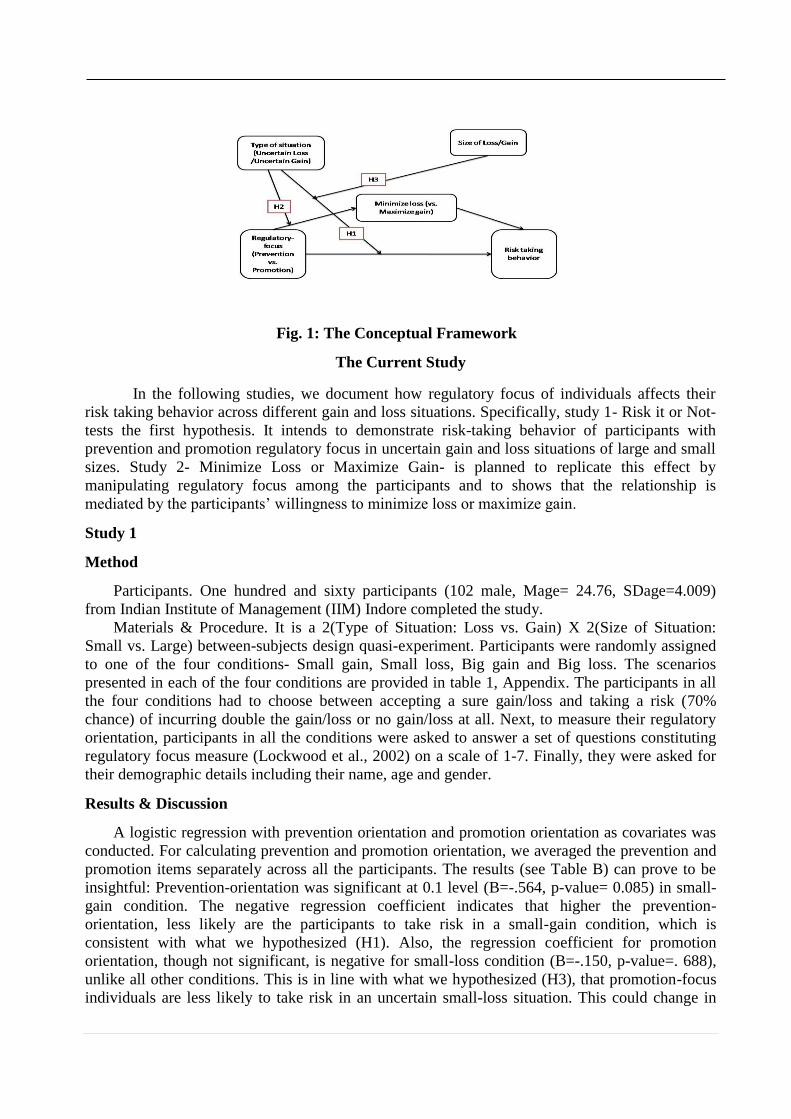
Fig. 1: The Conceptual Framework
The Current Study
In the following studies, we document how regulatory focus of individuals affects their
risk taking behavior across different gain and loss situations. Specifically, study 1- Risk it or Not-
tests the first hypothesis. It intends to demonstrate risk-taking behavior of participants with
prevention and promotion regulatory focus in uncertain gain and loss situations of large and small
sizes. Study 2- Minimize Loss or Maximize Gain- is planned to replicate this effect by
manipulating regulatory focus among the participants and to shows that the relationship is
mediated by the participants’ willingness to minimize loss or maximize gain.
Study 1
Method
Participants. One hundred and sixty participants (102 male, Mage= 24.76, SDage=4.009)
from Indian Institute of Management (IIM) Indore completed the study.
Materials & Procedure. It is a 2(Type of Situation: Loss vs. Gain) X 2(Size of Situation:
Small vs. Large) between-subjects design quasi-experiment. Participants were randomly assigned
to one of the four conditions- Small gain, Small loss, Big gain and Big loss. The scenarios
presented in each of the four conditions are provided in table 1, Appendix. The participants in all
the four conditions had to choose between accepting a sure gain/loss and taking a risk (70%
chance) of incurring double the gain/loss or no gain/loss at all. Next, to measure their regulatory
orientation, participants in all the conditions were asked to answer a set of questions constituting
regulatory focus measure (Lockwood et al., 2002) on a scale of 1-7. Finally, they were asked for
their demographic details including their name, age and gender.
Results & Discussion
A logistic regression with prevention orientation and promotion orientation as covariates was
conducted. For calculating prevention and promotion orientation, we averaged the prevention and
promotion items separately across all the participants. The results (see Table B) can prove to be
insightful: Prevention-orientation was significant at 0.1 level (B=-.564, p-value= 0.085) in small-
gain condition. The negative regression coefficient indicates that higher the prevention-
orientation, less likely are the participants to take risk in a small-gain condition, which is
consistent with what we hypothesized (H1). Also, the regression coefficient for promotion
orientation, though not significant, is negative for small-loss condition (B=-.150, p-value=. 688),
unlike all other conditions. This is in line with what we hypothesized (H3), that promotion-focus
individuals are less likely to take risk in an uncertain small-loss situation. This could change in
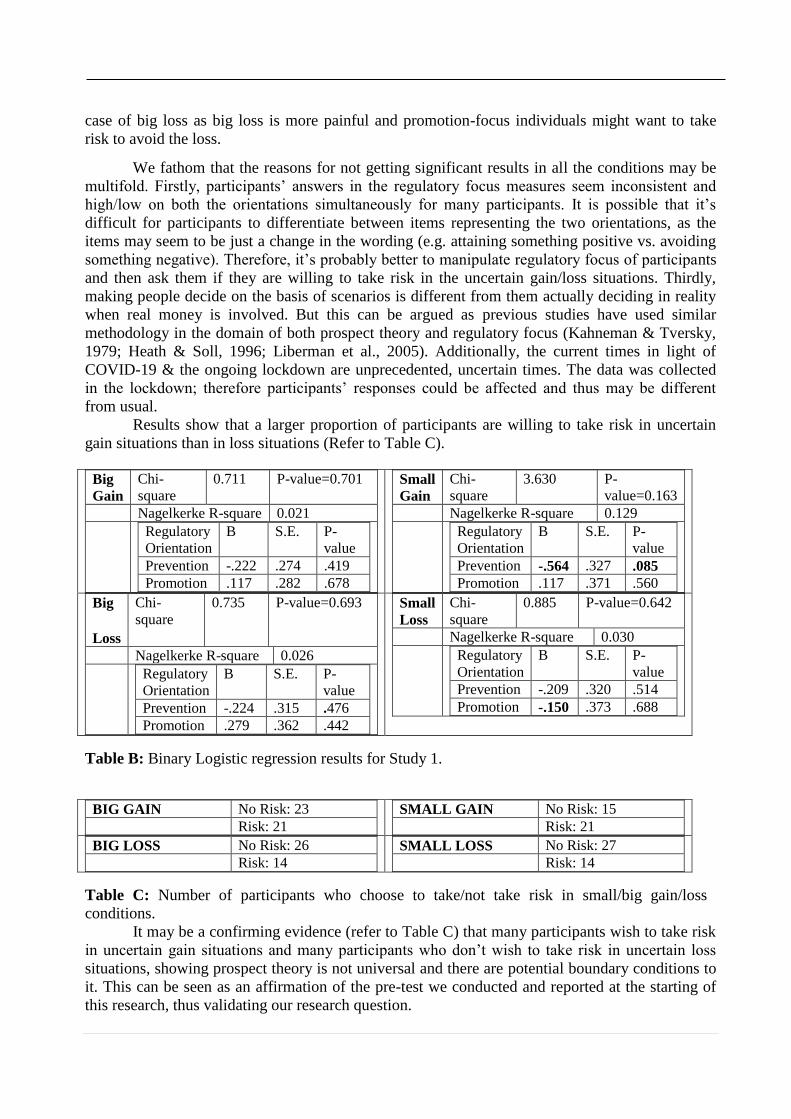
case of big loss as big loss is more painful and promotion-focus individuals might want to take
risk to avoid the loss.
We fathom that the reasons for not getting significant results in all the conditions may be
multifold. Firstly, participants’ answers in the regulatory focus measures seem inconsistent and
high/low on both the orientations simultaneously for many participants. It is possible that it’s
difficult for participants to differentiate between items representing the two orientations, as the
items may seem to be just a change in the wording (e.g. attaining something positive vs. avoiding
something negative). Therefore, it’s probably better to manipulate regulatory focus of participants
and then ask them if they are willing to take risk in the uncertain gain/loss situations. Thirdly,
making people decide on the basis of scenarios is different from them actually deciding in reality
when real money is involved. But this can be argued as previous studies have used similar
methodology in the domain of both prospect theory and regulatory focus (Kahneman & Tversky,
1979; Heath & Soll, 1996; Liberman et al., 2005). Additionally, the current times in light of
COVID-19 & the ongoing lockdown are unprecedented, uncertain times. The data was collected
in the lockdown; therefore participants’ responses could be affected and thus may be different
from usual.
Results show that a larger proportion of participants are willing to take risk in uncertain
gain situations than in loss situations (Refer to Table C).
Big
Gain
Chi-
square
0.711 P-value=0.701
Nagelkerke R-square 0.021
Regulatory
Orientation
B S.E. P-
value
Prevention -.222 .274 .419
Promotion .117 .282 .678
Small
Gain
Chi-
square
3.630 P-
value=0.163
Nagelkerke R-square 0.129
Regulatory
Orientation
B S.E. P-
value
Prevention -.564 .327 .085
Promotion .117 .371 .560
Big
Loss
Chi-
square
0.735 P-value=0.693
Nagelkerke R-square 0.026
Regulatory
Orientation
B S.E. P-
value
Prevention -.224 .315 .476
Promotion .279 .362 .442
Small
Loss
Chi-
square
0.885 P-value=0.642
Nagelkerke R-square 0.030
Regulatory
Orientation
B S.E. P-
value
Prevention -.209 .320 .514
Promotion -.150 .373 .688
Table B: Binary Logistic regression results for Study 1.
BIG GAIN No Risk: 23
Risk: 21
SMALL GAIN No Risk: 15
Risk: 21
BIG LOSS No Risk: 26
Risk: 14
SMALL LOSS No Risk: 27
Risk: 14
Table C: Number of participants who choose to take/not take risk in small/big gain/loss
conditions.
It may be a confirming evidence (refer to Table C) that many participants wish to take risk
in uncertain gain situations and many participants who don’t wish to take risk in uncertain loss
situations, showing prospect theory is not universal and there are potential boundary conditions to
it. This can be seen as an affirmation of the pre-test we conducted and reported at the starting of
this research, thus validating our research question.
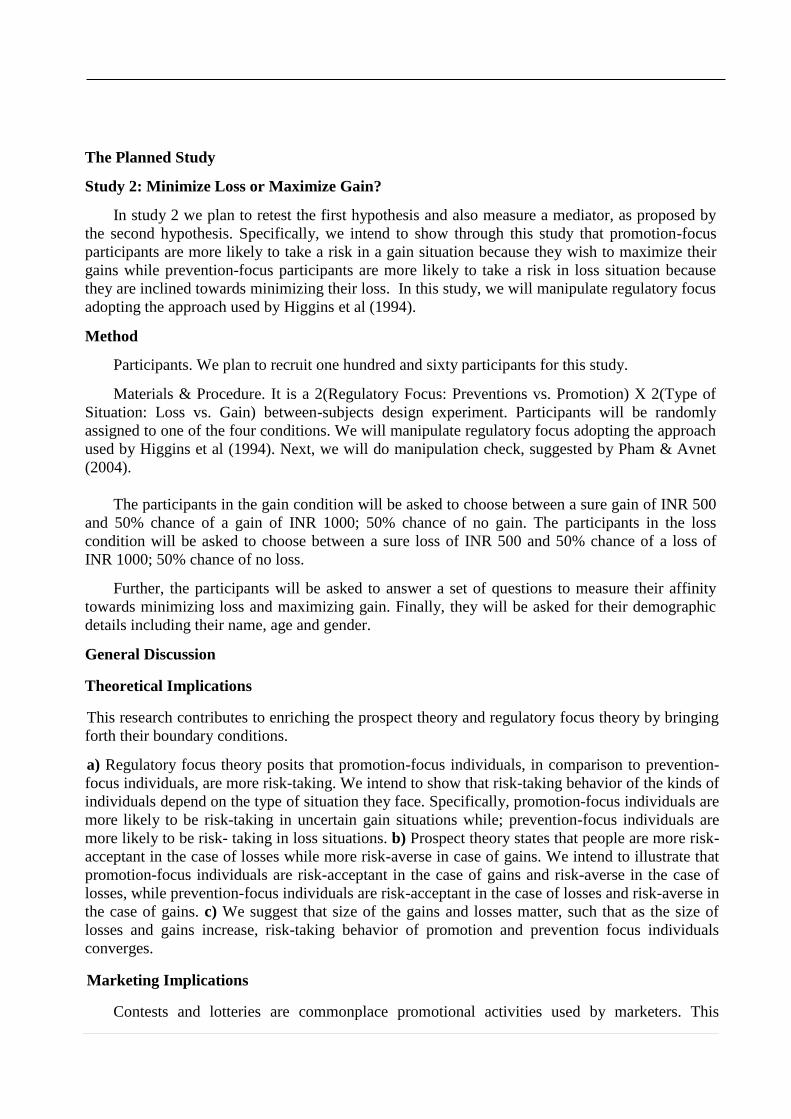
The Planned Study
Study 2: Minimize Loss or Maximize Gain?
In study 2 we plan to retest the first hypothesis and also measure a mediator, as proposed by
the second hypothesis. Specifically, we intend to show through this study that promotion-focus
participants are more likely to take a risk in a gain situation because they wish to maximize their
gains while prevention-focus participants are more likely to take a risk in loss situation because
they are inclined towards minimizing their loss. In this study, we will manipulate regulatory focus
adopting the approach used by Higgins et al (1994).
Method
Participants. We plan to recruit one hundred and sixty participants for this study.
Materials & Procedure. It is a 2(Regulatory Focus: Preventions vs. Promotion) X 2(Type of
Situation: Loss vs. Gain) between-subjects design experiment. Participants will be randomly
assigned to one of the four conditions. We will manipulate regulatory focus adopting the approach
used by Higgins et al (1994). Next, we will do manipulation check, suggested by Pham & Avnet
(2004).
The participants in the gain condition will be asked to choose between a sure gain of INR 500
and 50% chance of a gain of INR 1000; 50% chance of no gain. The participants in the loss
condition will be asked to choose between a sure loss of INR 500 and 50% chance of a loss of
INR 1000; 50% chance of no loss.
Further, the participants will be asked to answer a set of questions to measure their affinity
towards minimizing loss and maximizing gain. Finally, they will be asked for their demographic
details including their name, age and gender.
General Discussion
Theoretical Implications
This research contributes to enriching the prospect theory and regulatory focus theory by bringing
forth their boundary conditions.
a) Regulatory focus theory posits that promotion-focus individuals, in comparison to prevention-
focus individuals, are more risk-taking. We intend to show that risk-taking behavior of the kinds of
individuals depend on the type of situation they face. Specifically, promotion-focus individuals are
more likely to be risk-taking in uncertain gain situations while; prevention-focus individuals are
more likely to be risk- taking in loss situations. b) Prospect theory states that people are more risk-
acceptant in the case of losses while more risk-averse in case of gains. We intend to illustrate that
promotion-focus individuals are risk-acceptant in the case of gains and risk-averse in the case of
losses, while prevention-focus individuals are risk-acceptant in the case of losses and risk-averse in
the case of gains. c) We suggest that size of the gains and losses matter, such that as the size of
losses and gains increase, risk-taking behavior of promotion and prevention focus individuals
converges.
Marketing Implications
Contests and lotteries are commonplace promotional activities used by marketers. This
research contributes to helping marketers in making more people to participate in them willingly.
Since we posit that promotion-focus individuals tend to take risk in gain situations while
prevention-focus individuals tend to do so in loss situations, it would be better if contests and
lotteries, which are usually worded “Get a chance to win prizes/free trip/cash”, can be worded
differently for prevention-focus consumers. For instance, ‘participate and avoid losing xyz’.
Lotteries and contests involving high stakes and/or high- ticket items should be designed
differently from the ones involving lower stakes/low-ticket items.
Limitations & Directions for Future Research
In all the studies, we make the participants decide on the basis of scenarios presented to them.
We believe making the participants actually take decisions by providing them some
money/artificial money/points, could generate interesting and more accurate insights. In this
research, we discussed about individuals’ risk-taking behavior in uncertain situations preceded by
a loss/gain. In the paper, these losses and gains were absolute losses and gains (imagined by
participants). It would be interesting to examine individuals’ risk taking behavior in a subsequent
situation, on incurring a relative/perceived loss or gain. For instance, getting a lower/higher
discount than expected in a scratch-and-save offer or a tensile price claim, a bad/good deal etc. It
would be intriguing to look at other psychological and situational factors that could potentially
explain the risk taking behavior of individuals and thus enrich prospect and regulatory focus
theories.
References
1. Förster, J., Higgins, E. T., & Idson, L. C. (1998). Approach and avoidance strength during goal
attainment: regulatory focus and the" goal looms larger" effect. Journal of personality and social
psychology, 75(5), 1115.
2. Förster, J., Grant, H., Idson, L. C., & Higgins, E. T. (2001). Success/failure feedback, expectancies,
and approach/avoidance motivation: How regulatory focus moderates classic relations. Journal of
Experimental Social Psychology, 37(3), 253-260.
3. Grant, H., & Higgins, E. T. (2003). Optimism, promotion pride, and prevention pride as predictors
of quality of life. Personality and Social Psychology Bulletin, 29(12), 1521-1532.
4. Harinck, F., Van Dijk, E., Van Beest, I., & Mersmann, P. (2007). When gains loom larger than
losses: Reversed loss aversion for small amounts of money. Psychological science, 18(12), 1099-
1105.
5. Higgins, E. T., Roney, C. J., Crowe, E., & Hymes, C. (1994). Ideal versus ought predilections for
approach and avoidance distinct self-regulatory systems. Journal of personality and social
psychology, 66(2), 276.
6. Higgins, E. T. (1997). Beyond pleasure and pain. American psychologist, 52(12), 1280.
7. Higgins, E. T. (1998). Promotion and prevention: Regulatory focus as a motivational principle.
Advances in experimental social psychology, 30, 1-46.
8. Higgins, E. T. (2000). Making a good decision: value from fit. American psychologist, 55(11),
1217.
9. Higgins, E. T. (2002). How self-regulation creates distinct values: The case of promotion and
prevention decision making. Journal of Consumer Psychology, 12(3), 177-191.
10. Higgins, E. T., & Spiegel, S. (2004). Promotion and prevention strategies for self-regulation.
Handbook of self-regulation: Research, theory, and applications, 171-187.
11. Idson, L. C., Liberman, N., & Higgins, E. T. (2000). Distinguishing gains from nonlosses and losses
from nongains: A regulatory focus perspective on hedonic intensity. Journal of experimental social
psychology, 36(3), 252-274.
12. Idson, L. C., Liberman, N., & Higgins, E. T. (2000). Distinguishing gains from nonlosses and losses
from nongains: A regulatory focus perspective on hedonic intensity. Journal of experimental social
psychology, 36(3), 252-274.
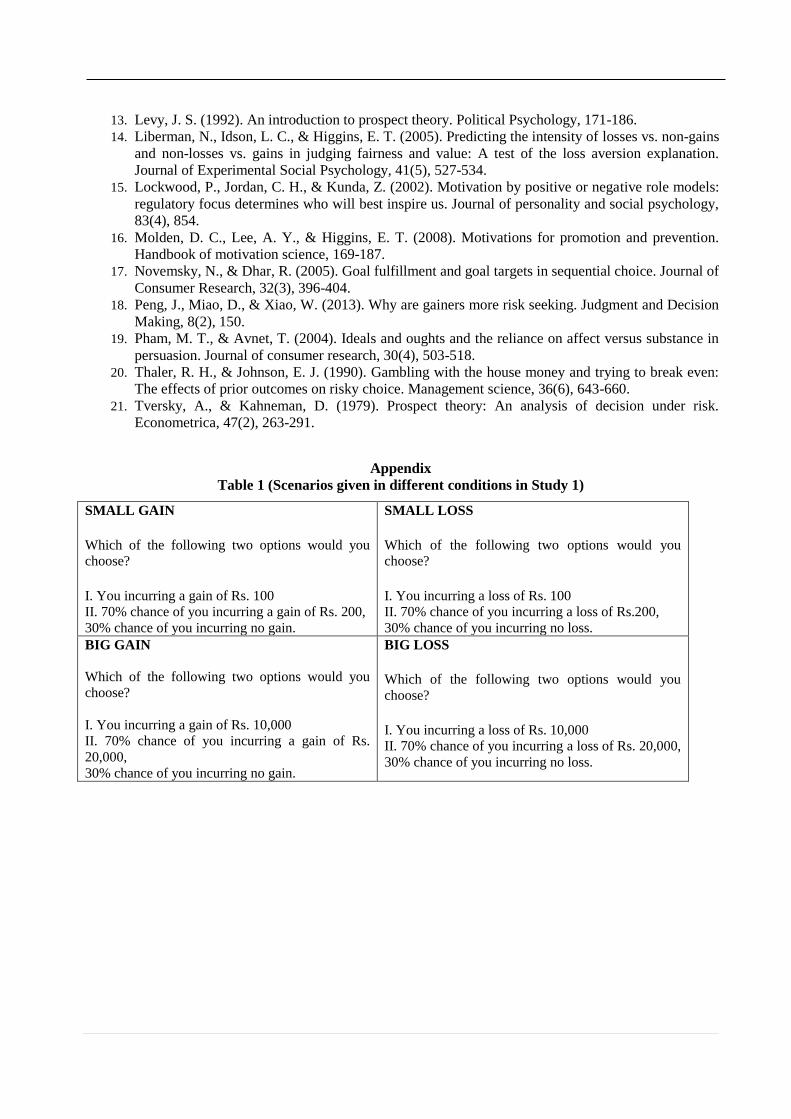
13. Levy, J. S. (1992). An introduction to prospect theory. Political Psychology, 171-186.
14. Liberman, N., Idson, L. C., & Higgins, E. T. (2005). Predicting the intensity of losses vs. non-gains
and non-losses vs. gains in judging fairness and value: A test of the loss aversion explanation.
Journal of Experimental Social Psychology, 41(5), 527-534.
15. Lockwood, P., Jordan, C. H., & Kunda, Z. (2002). Motivation by positive or negative role models:
regulatory focus determines who will best inspire us. Journal of personality and social psychology,
83(4), 854.
16. Molden, D. C., Lee, A. Y., & Higgins, E. T. (2008). Motivations for promotion and prevention.
Handbook of motivation science, 169-187.
17. Novemsky, N., & Dhar, R. (2005). Goal fulfillment and goal targets in sequential choice. Journal of
Consumer Research, 32(3), 396-404.
18. Peng, J., Miao, D., & Xiao, W. (2013). Why are gainers more risk seeking. Judgment and Decision
Making, 8(2), 150.
19. Pham, M. T., & Avnet, T. (2004). Ideals and oughts and the reliance on affect versus substance in
persuasion. Journal of consumer research, 30(4), 503-518.
20. Thaler, R. H., & Johnson, E. J. (1990). Gambling with the house money and trying to break even:
The effects of prior outcomes on risky choice. Management science, 36(6), 643-660.
21. Tversky, A., & Kahneman, D. (1979). Prospect theory: An analysis of decision under risk.
Econometrica, 47(2), 263-291.
Appendix
Table 1 (Scenarios given in different conditions in Study 1)
SMALL GAIN
Which of the following two options would you
choose?
I. You incurring a gain of Rs. 100
II. 70% chance of you incurring a gain of Rs. 200,
30% chance of you incurring no gain.
SMALL LOSS
Which of the following two options would you
choose?
I. You incurring a loss of Rs. 100
II. 70% chance of you incurring a loss of Rs.200,
30% chance of you incurring no loss.
BIG GAIN
Which of the following two options would you
choose?
I. You incurring a gain of Rs. 10,000
II. 70% chance of you incurring a gain of Rs.
20,000,
30% chance of you incurring no gain.
BIG LOSS
Which of the following two options would you
choose?
I. You incurring a loss of Rs. 10,000
II. 70% chance of you incurring a loss of Rs. 20,000,
30% chance of you incurring no loss.
Synergistic Combination of Constructivist Grounded Theory and
Analytic Autoethnography: A Novel Hybrid Research Paradigm to
Develop Indigenous Theories
Awanish Kumar Chaudhary1
1 Indian Institute of Management Lucknow
Abstract
The wealth of knowledge in the traditional Indian thought needs to be discovered by indigenous research.
This paper proposes synergistic combination of Constructivist Grounded Theory and Analytic
Autoethnography as a novel hybrid research paradigm for conducting indigenous studies. The proposed
hybrid qualitative research paradigm - Constructivist GT in the first phase followed by Analytic
Autoethnography in the second phase, shall allow indigenous researchers to maximize the advantages and
minimize the shortcomings of both these methodologies, and illuminate the studied phenomena
comprehensively - with high reliability, validity and generalizability of research findings; thus facilitating
development of indigenous theories having better predictability and accuracy. This in turn shall help realize
high performance work organizations with the potential to drive sustainable development.
Keywords: Indigenous Research, Hybrid Qualitative Research, Constructivist Grounded Theory,
Autoethnography
Introduction
There is wealth of knowledge in the traditional Indian thought, with the right potential to
guide the world on the path of sustainable development. The Indian philosophy and culture
consciously as well as sub-consciously subsume many such processes, practices and traditions
which are deeply rooted in well considered thoughts, aimed at ‘maximum good for the maximum’.
However, over the past few centuries, theories originating in the western contexts have dominated
the knowledge front - a case in point could be theories in the contemporary Organizational,
Behavioral and Social Sciences which have mostly originated in the North American or the West
European contexts, and have been adopted universally – including in the Indian context. There has
been insufficient effort to discover indigenous theories and propagate the ab-original Indian
thought. With a view to aid discovery of indigenous theories, this paper very briefly reviews the
qualitative research methodologies ‘Constructivist Grounded Theory’ and ‘Analytic
Autoethnography’, and proposes the combination of the two as a novel hybrid research paradigm -
which can yield effective results in indigenous studies and facilitate discovery of indigenous
theories.
Indigenous Research
Indian academicians, scholars and practitioners have realized that straight forward application
of western management literature doesn’t work in the Indian context, and often compromises
results leading to frustration (Panda, & Gupta, 2007). Tsui (2004), Panda and Gupta (2007) have
suggested that rather than testing an existing theory from some other context, a high quality
indigenous research derives theories afresh in their specific context. Adair (1996) has defined
indigenous research as “research that emanates from, adequately represents, and reflects back
upon the cultural context in which behaviour is observed.” Tsui (2004) has emphasized upon the
use of local language, local subjects and locally meaningful constructs for high quality indigenous
research; this suggests that ideally, indigenous research should be steered by indigenous
researchers, who belong to and understand the context. Panda and Gupta (2007) have strongly
advocated the use of qualitative research techniques for ground-up discovery of original theories
for accurate predictability.
A Novel Hybrid Qualitative Approach for Indigenous Research:
Combination of Constructivist Grounded Theory and Analytic Autoethnography
Grounded Theory
Grounded Theory (GT) is defined as: “The discovery of theory from data systematically
obtained from social research” (Glaser, & Straus, 1967).
Strength of Grounded Theory
The strength of GT lies in Theory Building – it is aimed at discovering theory ground-up. GT
is very effective in finding answers to the three Ws – ‘What, When and Where’ of the studied
phenomena in new contexts.
Constructivist Grounded Theory
Charmaz’s Constructivist GT is characterized by relativist ontology, which assumes the
existence of multiple social realities. The methodology acknowledges researcher’s subjectivity
and biases. Constructivist epistemological position endorses that the researcher and the participant
co-construct knowledge and interpret meaning mutually (Charmaz, 2000). Constructivist GT
allows for a flexible coding scheme (Charmaz, 2006). In Constructivist GT the researcher gets an
active role – to use own interpretation, background knowledge and understanding to steer research
work.
Constructivist GT and Indigenous Researcher Complement Each Other. Being an indigenous
researcher can be put to advantage only when the chosen research methodology allows flexibility
and active role for the researcher, where the researcher can make use of own interpretation and
background knowledge. Constructivist GT offers flexibility and active role to the researchers. On
the other hand, indigenous researcher makes the process of conducting GT faster and accurate.
An indigenous researcher can derive maximum benefits out of Constructivist GT and add much
more value to research work by taking on the active role offered by the methodology. By virtue of
enjoying the trust of fellow community members, indigenous researchers can get going with data
collection easily and quickly – without the requirement of a ‘rapport building phase’. Having same
language and ‘lingo’, and having been a co-participant in the experiences of interviewees,
indigenous researchers can quickly assimilate large volumes of data – and that too without
‘desirability biases’. By using their insight and inherent knowledge of context, indigenous
researchers can bypass unnecessary data, make meaningful interpretation of elicited data quickly,
formulate questions that guide the interview more accurately, proceed in the right direction with
accurate theoretical sampling and finally graduate to abstract/ theoretical levels of coding and
theory building in much lesser time, making the research work faster, accurate, efficient and
effective.
Limitation of Grounded Theory
Unlike Autoethnography, while using GT indigenous researcher themself cannot become the
source of data, even though the researcher is a valid sample point by virtue of belonging to the
community being researched. For instance, while collecting data for GT, an indigenous researcher
cannot interview self! Indigenous researcher may not be able to share own experiences and stories
while using GT. Thus, using only GT could devoid the research work of the vast repository of data
that the indigenous researcher themself is. Also, as compared to GT, Ethnography (or
Autoethnography) is naturally and inherently more attuned to rendering thick descriptions of the
observed phenomena, which can bring out the ‘How’ of the phenomena in greater detail.
Autoethnography
Hayano (1979) questioned whether any ethnographic researcher has the right to represent the
life of others, and conceptualized the idea of Autoethnography. Autoethnography developed as a
method of undertaking ethnographic research on one’s own community. As per Van Manen
(1995), in Autoethnography a native reveals own group. “Autoethnography places emphasis on
exploring the nature of particular social phenomenon, and increasingly in recent times working
primarily with unstructured data, investigating small number of cases (maybe even a single case)
in depth and detail” (Atkinson, & Hammersely, 1998). These studies can be represented in variety
of creative ways, including art, photography and other audio and visual means (Ellis, 1995).
Strength of Autoethnography
The strength of Autoethnography lies in its potential to render thick description of various
social/ cultural phenomena of one’s own community. Thick description by Autoethnography can
be effective in finding answers to ‘H’ - the ‘How’ of studied phenomena. In addition,
Autoethnography allows the indigenous researcher to enrich the research work by culling out own
(personal) data and experiences (researcher can interview themself while undertaking
Autoethnography, but not so in the case of other methods!)
Analytic Autoethnography
Off late, ‘Autoethnography’ has assumed two different connotations: ‘Analytic
Autoethnography’ which refers to ethnography of one’s own group, and ‘Evocative
Autoethnography’ which refers to autobiographical writing which has some ethnographical
interest as well (Fletcher, 2011). Five key features of Analytic Autoethnography as suggested by
Anderson (2006) are:- complete member researcher status, analytic reflexivity, narrative visibility
of the researcher’s self, dialogue with informants beyond the self, and commitment to theoretical
analysis. For the second phase both ‘Analytic Autoethnography’ and ‘Evocative
Autoethnography’ are suitable - as both have the potential to render thick description of the
phenomena under study (which answers the ‘How’ of the phenomena), however given an option it
would be preferable to adopt ‘Analytic Autoethnography’ - as the larger intent is to undertake
‘theoretical analysis’, using ethnography as the research approach, while also indulging in
‘dialogue with informants beyond the self’.
Limitation of Autoethnography
Autoethnography can get biased by the perspective and personal data of the researcher. Also,
unless a careful and focused approach is taken, the researcher may end up building mountains of
unconnected data, without a research outcome which can be theorized.
Combining Constructivist GT and Autoethnography
Pettigrew (2000) has suggested that “Grounded Theory and Ethnography when combined
may produce a level of detail and interpretation that is unavailable from other methodologies”.
Charmaz (2006) has used the term ‘Grounded Theory Ethnography’, as a hybrid research
methodology which “gives priority to the studied phenomenon or process-rather than to a
description of a setting”. As Autoethnography (Analytic-Autoethnography) is one of the forms of
Ethnography, it is but natural that a combination of Grounded Theory and Analytic
Autoethnography shall be equally advantageous, in terms of eliciting data, interpretation and
theory building.
Hughes and Pennington (2017) have mentioned that Autoethnography is a hybrid research
methodology – it can be applied as a complementary method for assembling data from the
traditional approaches to qualitative research, including GT. Pace (2012) has suggested that,
“Grounded Theory analytic strategies can be used successfully within autoethnographic studies,
that is, when researchers treat them as flexible strategies rather than as a set of prescriptive
procedures and rules”.
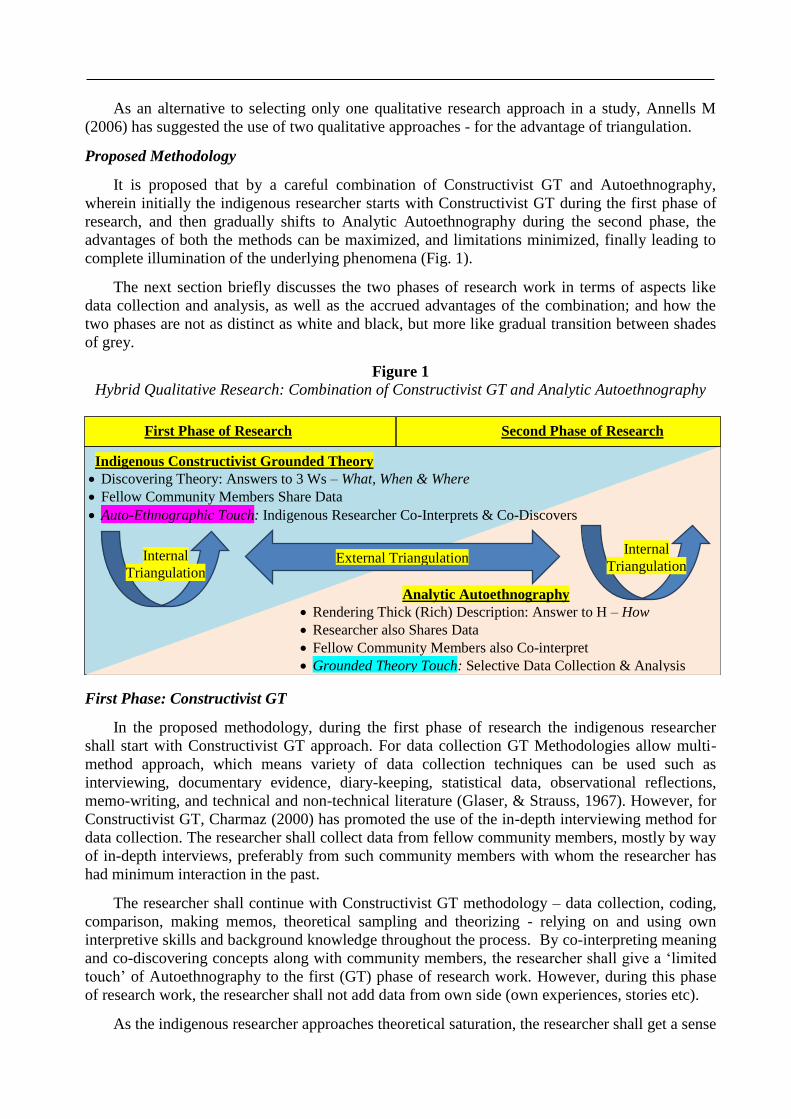
As an alternative to selecting only one qualitative research approach in a study, Annells M
(2006) has suggested the use of two qualitative approaches - for the advantage of triangulation.
Proposed Methodology
It is proposed that by a careful combination of Constructivist GT and Autoethnography,
wherein initially the indigenous researcher starts with Constructivist GT during the first phase of
research, and then gradually shifts to Analytic Autoethnography during the second phase, the
advantages of both the methods can be maximized, and limitations minimized, finally leading to
complete illumination of the underlying phenomena (Fig. 1).
The next section briefly discusses the two phases of research work in terms of aspects like
data collection and analysis, as well as the accrued advantages of the combination; and how the
two phases are not as distinct as white and black, but more like gradual transition between shades
of grey.
Figure 1
Hybrid Qualitative Research: Combination of Constructivist GT and Analytic Autoethnography
First Phase: Constructivist GT
In the proposed methodology, during the first phase of research the indigenous researcher
shall start with Constructivist GT approach. For data collection GT Methodologies allow multi-
method approach, which means variety of data collection techniques can be used such as
interviewing, documentary evidence, diary-keeping, statistical data, observational reflections,
memo-writing, and technical and non-technical literature (Glaser, & Strauss, 1967). However, for
Constructivist GT, Charmaz (2000) has promoted the use of the in-depth interviewing method for
data collection. The researcher shall collect data from fellow community members, mostly by way
of in-depth interviews, preferably from such community members with whom the researcher has
had minimum interaction in the past.
The researcher shall continue with Constructivist GT methodology – data collection, coding,
comparison, making memos, theoretical sampling and theorizing - relying on and using own
interpretive skills and background knowledge throughout the process. By co-interpreting meaning
and co-discovering concepts along with community members, the researcher shall give a ‘limited
touch’ of Autoethnography to the first (GT) phase of research work. However, during this phase
of research work, the researcher shall not add data from own side (own experiences, stories etc).
As the indigenous researcher approaches theoretical saturation, the researcher shall get a sense
Internal
Triangulation External Triangulation Internal
Triangulation
First Phase of Research Second Phase of Research
Analytic Autoethnography
Rendering Thick (Rich) Description: Answer to H – How
Researcher also Shares Data
Fellow Community Members also Co-interpret
Grounded Theory Touch: Selective Data Collection & Analysis
Indigenous Constructivist Grounded Theory
Discovering Theory: Answers to 3 Ws – What, When & Where
Fellow Community Members Share Data
Auto-Ethnographic Touch: Indigenous Researcher Co-Interprets & Co-Discovers
of reality from neutral perspective. It is the right time for the indigenous researcher to shift to the
second phase of research work – the Autoethnography Phase.
Second Phase: Autoethnography
During the second phase of research which is the Autoethnography phase, the researcher shall
start culling out own data as well. The indigenous researcher may have a large amount of data to
share – own (personal) stories of several incidents, experiences, understanding of different
artefacts etc, which they may not have been able to share, had they been limited to Grounded
Theory only.
However, while culling out and analyzing own data during Autoethnography, the researcher
shall follow the concept of GT for data collection and analysis, i.e. using Theoretical Sampling,
Coding and Memos to selectively elicit and analyze data. The researcher shall cull out limited and
relevant data only, with the aim to validate/ triangulate the findings of the first phase, and to
understand the ‘How’ of the underlying phenomena by rendering a thick description of it. Thus the
researcher gives a touch of Grounded Theory approach even during the Autoethnography Phase.
Autoethnographers retrospectively and selectively write about epiphanies that arise from by
being part of a culture. They discern patterns of cultural experience, make field notes, interview
cultural members and thus produce ‘thick descriptions’ of their experience, mostly using facets of
storytelling (e.g., character and plot development) (Ellis et al., 2011). Autoethnographers are also
required to analyze these experiences along with other pertinent cultural artifacts (Denzin, 2006).
They are required to compare their analysis with existing research as well as with the experience
and views of other cultural members (Ellis et al., 2011).
Accordingly, during the Autoethnography phase of research, the researcher shall use reflexive
musings, journals etc; and remember such stories and personal experiences which either
substantiate or contradict the findings of the first phase. In addition, during this phase of research
also, the researcher shall be free to collect additional data in the form of texts, documents,
photographs, literature etc, including additional interviews of fellow community members, if
required.
Advantages of Proposed Hybrid Methodology
Apt Methodologies for Indigenous Researchers. ‘Flexibility and active role’ offered by
Constructivist GT and ‘inherent knowledge of context’ of indigenous researchers complement
each other and result in fast, efficient and effective research work. Similarly, Autoethnography as
a research methodology is also centered around indigenous researchers.
Complete Illumination of Underlying Phenomena. GT with its strength in theory building helps
discovering answers for ‘What, When and Where’ of the underlying phenomena;
Autoethnography with its strength in rendering thick description of the setting and the underlying
phenomena, helps understanding the ‘How’ of it, thus illuminating the phenomena completely.
Researcher as Source of Data. Indigenous researchers may not be able to add their own
(personal) repository of data to the research work if they stick with GT only; however
Autoethnography allows that opportunity to indigenous researchers.
Autoethnography with Focused Approach. Charmaz (2006) has suggested that when used in
Ethnography, Constructivist GT with its interpretivist approach dispels the positivist notion of
passive observers in Ethnography, who merely absorb their surrounding scenes: “Grounded
theorists (with interpretivist approach) select the scenes they observe and direct their gaze within
them”. Focused approach towards theory building borrowed from Constructivist GT solves the
potential problem with ethnographic studies (including autoethnography) of “seeing data
everywhere (and nowhere) and gathering everything (and nothing), inadvertently leading to
mountains of unconnected data, un-integrated categories and low level description”.
Autoethnography with Minimized Researcher Bias. In Autoethnography the researcher can
start eliciting own experiences first, and then the researcher may proceed ahead with theoretical
sampling to collect data from selective fellow community members in line with the emerging
theory. In doing so, the researcher may leave the research work biased. Instead, by first collecting
data from a large number of fellow community members using GT, and not culling out own data,
the indigenous researcher shall be able to develop a more neutral perspective towards the
phenomena under study - overcoming personal biases, before switching to Autoethnography.
Internal Triangulation. By increasing the sample size of community members from whom data
is collected, beyond the point of theoretical saturation, the researcher can have internal
triangulation during the GT phase of research. For incorporating internal triangulation in the
Autoethnography phase, the researcher can share own stories/ artefacts, analysis, and
understanding of concepts with fellow community members for independent verification and
validation.
External Triangulation. Post completion of the second phase of research, the findings of second
phase (Autoethnography) are compared with the findings of the first phase (GT), for external
triangulation. If the findings of both the phases are similar, the research work gets fully
triangulated; in case the findings of second phase contradict the findings of the first phase then the
researcher needs to go back to the first phase of research and re-indulge in theoretical sampling
and theorizing.
Reliability, Validity and Generalizability. In case of Qualitative Studies, ‘trustworthiness’ of
research work holds the key for validity as well as reliability (Golafshani, 2003; Johnson, 1997;
Lincoln, & Guba, 1985). It is envisaged that by undertaking a ground-up indigenous research,
combining two qualitative research methodologies which complement each other, minimizing the
bias that an indigenous researcher may get in, and having internal triangulation for each of the
methodologies followed by overall external triangulation, the hybrid research paradigm proposed
in the paper adds up the overall trustworthiness, rigor and quality of the research work, thus
rendering a high level of reliability, validity and generalizability.
Conclusion
The hybrid qualitative research paradigm proposed in this paper, comprising of combination
of ‘Constructivist Grounded Theory’ and ‘Analytic Autoethnography’ in a phased manner, is a
promising approach to discover indigenous theories. Especially for the Indian context - where
there are many cultures, subcultures and a wealth of traditional knowledge in the form of
scriptures, cultural practices and many other artefacts, indigenous research can lead to discovery
of rich indigenous theories, which may form the basis for sustainable development.
References
1. Adair, J.G. (1996). The indigenous psychology bandwagon: Cautions and considerations. In J.
Pandey, D. Sinha & D.P.S. Bhawuk (Eds.), Asian contributions to cross-cultural psychology (pp.
50–58). Sage Publications.
2. Anderson, L. (2006). Analytic autoethnography. Journal of Contemporary Ethnography, 35(4), 373-
395.
3. Annells, M. (2006). Triangulation of qualitative approaches: Hermeneutical phenomenology and
grounded theory. Journal of Advanced Nursing, 56(1), 55-61.
4. Atkinson, P., & Hammersley, M. (1998). Ethnography and Participant Observation. In N.K.
Denzin, and Y.S. Lincoln, (Eds.), Strategies of qualitative inquiry (pp. 110-136). Sage
Publications.
5. Charmaz, K. (2000). Grounded theory: Objectivist and constructivist methods. In N. Denzin, & Y.
Lincoln (Eds.), The handbook of qualitative research (2nd Ed., pp. 509-536). Sage Publications.
6. Charmaz, K. (2006). Constructing grounded theory: A practical guide through qualitative analysis.
Sage Publications.
7. Denzin, N. K. (2006). Mother and Mickey. The South Atlantic Quarterly, 105(2), 391-395.
8. Ellis, C. (1995). Final negotiations: A story of love, loss, and chronic illness. Temple University
Press.
9. Ellis, C., Adams, T. E., & Bochner, A.P. (2011). Autoethnography: An overview. Qualitative
Social Research, 12 (1), Art. 10.
10. Fletcher, D. E. (2011). A curiosity for contexts: Entrepreneurship, enactive research and
autoethnography. Entrepreneurship & Regional Development, 23 (1-2), 65-76.
11. Glaser, B., & Strauss, A. (1967). The discovery of grounded theory: Strategies for qualitative
research (Reprinted 2006 ed.). Aldine Transaction.
12. Golafshani, N. (2003). Understanding reliability and validity in qualitative research. The
Qualitative Report, 8(4), 597-606.
13. Hayano, D. (1979). Auto-ethnography: Paradigms, problems, and prospects. Human Organization,
38, 99-104.
14. Hughes, S.A. & Pennington, J. L. (2017). Autoethnography: process, product and possibility for
critical social research. SAGE Publications, Inc.
15. Johnson, B. R. (1997). Examining the validity structure of qualitative research. Education, 118(3), 282-
292.
16. Lincoln, Y. S., & Guba, E. G. (1985). Naturalistic inquiry. Sage Publications.
17. Pace, S. (2012). Writing the self into research: Using grounded theory analytic strategies in
autoethnography. In N. McLoughlin, & D.L. Brien (Eds.), Creativity: Cognitive, social and
cultural perspectives (Special Issue). https://www.textjournal.com.au/speciss/issue13/Pace.pdf
18. Panda, A., & Gupta, R. (2007). Call for developing indigenous organisational theories in India:
Setting agenda for future. International Journal of Indian Culture and Business Management, 1(1),
205-243.
19. Pettigrew, S. F. (2000). Ethnography and Grounded Theory: A happy marriage? Advances in
Consumer Research, 27, 256-260.
20. Tsui, A.S. (2004). Contributing to global management knowledge: A case for high quality
indigenous research. Asia Pacific Journal of Management, 21,491–513.
21. Van Maanen, J. (1995). An end to innocence: The ethnography of ethnography. In J. Van Maanen
(Ed.), Representation in ethnography: In other worlds (pp. 1-35). Sage Publications.
Workplace Spirituality and Remote-Cyberloafing: A Conceptual View in the
Context of Distributed Work Environments
Sauvik Kumar Batabyal1
Kanika Tandon Bhal2
1&2Indian Institute of Technology, Delhi
Abstract
Cyberloafing or personal internet use during working hours has been mostly studied in the context of
centralized offices or workplaces. During COVID-19 world, organizations have been forced to adopt work
from home or distributed work arrangements at a much larger scale, on an urgent basis. This will probably
remain as the new normal even in the post-pandemic scenario for the safety and convenience of the
employees. Based on O’Neill et al (2014a, 2014b)’s work, this paper throws light on a counterproductive
behavior in the teleworking scenario, described as remote-cyberloafing. The authors propose the possibility
of promoting and facilitating workplace spirituality among the employees to regulate remote-cyberloafing
in an organic and non-invasive manner, based on the firm grounds of social control theory and social
exchange theory.
Keywords: cyberloafing, remote-cyberloafing, work from home, workplace spirituality
Introduction
The emergence and the rapid spread of COVID-19 pandemic have transformed the way
business organizations run their operations. Distributed work environment, which gives the
employees the facility of working fully or partially from home or from a convenient location other
than the compulsory centralized workplaces (O’Neill et al, 2014b), is no more a matter of choice.
It has become a compulsive reality for the safety and convenience of the stakeholders. O’Neill et
al (2014a)’s study has shown that working from home opens up the possibility of cyberslacking or
cyberloafing which is described as a behavior of utilizing working hours online for personal
reasons. Lim (2002) defined cyberloafing in the context of utilizing the ‘internet provided at the
workplace’ for personal reasons ‘during office hours’. Over the period of time, with the advent of
mobile phones and accessible personal-internet connection, the usage of smartphones and internet-
enabled wearable devices for non-job purposes during working hours at workplaces has also been
brought in the purview of cyberloafing with terms like mobile-cyberloafing (Sheikkh et al, 2015)
and personal-mobile internet loafing (Batabyal and Bhal, 2020). The COVID-19 situation has
extended or at times, has diluted the term ‘workplace’ by compelling a significant portion of the
workforce to work from home. Backed by the experience of contemporary times, it can be fairly
assumed that in the near future, companies will increasingly allow employees to work from
centralized locations along with working from home few days per week. In that scenario, present
and the future, the description of ‘cyberloafing’ becomes a complex one. O’Neill et al (2014a,
2014b) described the utilization of working time by going online for personal reasons as
‘cyberslacking’, while specifically focusing on the matter of employees working at a ‘remote
location’ or ‘work from home’. The concept of ‘space’ or ‘location’ was still not predominant in
the discussion till few years back but cyberslacking or cyberloafing mostly meant in the purview
of ‘at the workplace’ only (Luqman et al, 2020). However, with the teleworking and work from
home facility, the circumference of ‘space’ or ‘workplace’ has become bigger in scope. In this
paper, the authors refer to the cyberloafing behavior while working from home or any other
convenient location other than centralized office spaces as ‘remote-cyberloafing’. This distinction
is necessary to keep it separate from traditional cyberloafing (Lim, 2002).
Literature suggests that a significant portion of working hours gets utilized for cyberloafing
(Batabyal and Bhal, 2020), which can also expose organizations to various risks (Jiang et al,
2020). It has the potential to cause distraction (O’Neill et al, 2014a) and fatigue (Wu et al, 2020),
negatively impact performance (Askew et al, 2019) and productivity of employees and can
entangle the organizations with legal matters (Cheng, 2014). Weatherbee and Kelloway (2006)
and Lim (2002) have described cyberloafing as a deviant behavior at workplace which is
counterproductive in nature. Though cyberloafing might also have some benefits like providing
relief and respite (Lim and Chen, 2012), invoking creativity (Sawitri and Mayasari, 2018) but in
this paper, the authors have concentrated on the harmful aspects of cyberloafing and looked at the
possibility of careful regulation of the same. Companies have been increasingly exploring various
workplace internet surveillance tools (Burdin et al, 2020) to monitor and control cyberloafing but
research suggests that it can influence commitment, motivation, satisfaction of the employees
negatively (Jiang et al, 2020). In this paper, the authors throw lights on the possibility of
reducing the remote-cyberloafing behavior in a much more non-invasive and organic manner by
adopting, promoting and facilitating workplace spirituality among the employees.
1. Hypotheses Development
1.1. Workplace Spirituality: Brief Description
Spirituality at workplace is increasingly finding its place in contemporary management
literature (Zhang, 2020; Otaye-Ebede et al., 2019; Bhaskar and Mishra, 2019; Petchsawang and
Mclean, 2017) along with organizational spirituality (Pfaltzgraff-Carlson, 2020; Rocha and
Pinheiro, 2020; Khari and Sinha, 2018). However, the elements of workplace spirituality have not
been explored in the domain related to cyberloafing behavior. Ashmos and Duchon (2000) defined
“spirituality at work” as the “recognition of an inner life that nourishes and is nourished by
meaningful work that takes place in the context of community” (p. 139). They segregated the
factors in three parts; “individual level”, “work unit level” and “organizational level” (Ashmos
and Duchon, 2000, p. 143). First part consists of three factors namely “conditions for community”,
“meaning at work” and “inner life” (Ashmos and Duchon, 2000, p. 139). The “work unit level” is
comprised of “work unit community” and “positive work unit values” (Ashmos and Duchon,
2000, p. 142). “Organizational values” and “individual and the organization” are said to be the two
components of “organizational level” (Ashmos and Duchon, 2000, p. 143). In order to ensure
parsimony and conscious exclusion of transcendental nature of spirituality at work, backed by the
extant literature, Milliman, Czaplewski and Ferguson (2003) concentrated on three aspects of
workplace spirituality namely “meaningful work at individual level”, “sense of community at
group level” and “alignment with organizational values at organizational level” (p. 428).
Giacalone and Jurkiewicz (2010) have put forward the importance of transcendence in the
conceptualization of spirituality at workplace. This was subsequently supported by Saks (2011),
who showed that there are three dimensions of workplace spirituality; “transcendence”, “sense of
community” and “spiritual values” (p. 330).
1.2. Significance of Workplace Spirituality
Research has shown workplace spirituality’s significance for better performance in the
organizations and also for promoting organizational citizenship behavior (Garg, 2020). This has
echoed similar findings from earlier research which exhibited strong association between
spirituality at work and organizational citizenship behavior (Sholikhah et al, 2019; Houghton,
2016; Kutcher et al, 2010). It has also been revealed that spirituality at work shares strong
positive association with work engagement (Baker and Lee, 2020; Petchsawang and McLean,
2017), employee loyalty (Aboobaker, 2020), job satisfaction (Chawla and Guda, 2010), ethical
climate, moral judgment and prosocial motivation (Otaye-Ebede et al, 2019) and negative
association with intention to leave (Chawla and Guda, 2010) and loneliness at work (Ghadi,
2017). Literature also suggests negative association between spirituality at workplace and
counterproductive behavior or deviant behavior at workplaces (Eliyana and Sridadi, 2020).
Ahmad and Omar (2014) and Chawla (2014) have also proposed on theoretical grounds that
deviant behavior in organizations can be controlled through adopting workplace spirituality. James
(2011) study has shown that when workplace spirituality is high, there exists a negative
association between trait cynicism and counterproductive behavior at workplace.
1.3. Workplace Spirituality and Cyberloafing Behavior
In the case of distributed work environments, remote-cyberloafing becomes easier and more
convenient due to the absence of the possible detection by immediate supervisors or co-workers
(O’Neill et al, 2014a). As monitoring personal online activities during work from home is either
not feasible or not effective, or at times bring negative results (Jiang et al, 2020), it is worthwhile
to look for alternative options which can control remote-cyberloafing. Research has shown that
counterproductive work behaviors can be curbed down by workplace spirituality (Eliyana and
Sridadi, 2020) and logically, it can be utilized for the purpose of regulating remote-cyberloafing as
cyberloafing has been termed as one of the counterproductive and deviant behaviors (O’Neill,
2014b). Cyberloafing has also been seen as withholding effort or a kind of withdrawal from work
(Mercado et al, 2017). Drawing from Jurkiewicz and Jurkiewicz and Giacalone (2004)’s value
structure of workplace spirituality, Chawla (2014) proposed that promoting sense of
‘responsibility’ can lead to lesser deviant behaviors.
In this regard, the authors have adapted workplace spirituality construct as used by Milliman,
Czaplewski and Ferguson (2003) to propose the regulatory impact of meaningful work, sense of
community and alignment with organizational values on remote-cyberloafing. Research has
shown negative association between meaningful work and cyberloafing (Usman et al, 2019). As
far as the sense of the community is concerned, drawing from the Theory of Social Control
(Hirschi, 1969), strong social bonding can result to lesser deviant behavior at the workplaces
(Hollinger, 1986). Based on this framework, Luqman (2020) found negative association between
social bonding and cyberloafing. It can be fairly assumed that strong sense of community through
virtual meetings and teamwork during remote working scenario can open up the possibility of
bringing down remote-cyberloafing. Alignment with organizational values, the third aspect of
spirituality at workplace, is a function of employees’ perceived belief that the organization thinks
and acts for the welfare of its workers and community (Ashmos and Duchon, 2000). On the firm
grounds of Blau (1964)’s Social-Exchange Theory, it has been found that employees’ perception
of high organizational justice can bring down the magnitude of cyberloafing with high self-control
(Restunog et al, 2011). Taking cues from the mentioned literature, the authors propose that the
three layers of workplace spirituality will share a negative association with remote-cyberloafing.
H1: Meaningful work will share a negative association with remote-cyberloafing.
H2: Sense of community will share a negative association with remote-cyberloafing.
H3: Alignment with organizational values will share a negative association with remote-
cyberloafing.
2. Conclusion:
There is a considerable gap in the literature in terms of covering the counterproductive
behaviors like remote-cyberloafing in a distributed work environment scenario. This paper is the
first one to propose the utility of workplace spirituality to regulate remote-cyberloafing.
Organizations need to focus on creating avenues to acknowledge, facilitate and strengthen
employees’ perception of meaningfulness at work, sense of community and alignment with
organizational values to control possible remote-cyberloafing.
References
1. Aboobaker, N., Edward, M. and Zakkariya, K.A. (2020) ‘Workplace spirituality and employee
loyalty: an empirical investigation among millennials in India’, Journal of Asia Business Studies,
14(2), pp. 211-225.
2. Ahmad, A. and Omar, Z. (2014) ‘Reducing deviant behavior through workplace spirituality and job
satisfaction’, Asian Social Science, 10(19), pp.107-112.
3. Alharthi, S., Levy, Y., Wang, L. and Hur, I. (2019) ‘Employees’ Mobile Cyberslacking and Their
Commitment to the Organization’, Journal of Computer Information Systems (online) Available at
10.1080/08874417.2019.1571455 (Accessed on 10th June, 2020 at 15:20 hours)
4. Baker, B.D. and Lee, D.D. (2020) ‘Spiritual formation and workplace engagement: prosocial
workplace behaviors’, Journal of Management, Spirituality & Religion, 17(2), pp.107-138.
5. Batabyal, S. and Bhal, K. (2020) ‘Traditional cyberloafing, mobile cyberloafing and personal
mobile-internet loafing in business organizations: Exploring cognitive ethical logics’, Journal of
Information, Communication and Ethics in Society (online) Available at
https://doi.org/10.1108/JICES-07-2019-0081 (Accessed on 1st July, 2020 at 18:45 hours)
6. Bhaskar, A. U., & Mishra, B. (2019) ‘Putting workplace spirituality in context’, Personnel Review,
48(7), pp.1848-1865.
7. Blau, P. M. (1964) Exchange and power in social life. New York: Wiley
8. Burdin, G., Halliday, S. and Landini, F. (2020) Why using technology to spy on home-working
employees may be a bad idea. LSE Business Review (online) Available at
http://eprints.lse.ac.uk/105379/1/businessreview_2020_06_17_why_using_technology_to_spy_on_
home_working.pdf (Accessed on 30th June, 2020 at 10:30 hours)
9. Chawla, V. (2014) ‘The effect of workplace spirituality on salespeople's organisational deviant
behaviours: research propositions and practical implications’, Journal of Business & Industrial
Marketing, 29(3), pp.199-208
10. Cheng, L., Li, W., Zhai, Q. and Smyth, R. (2014) ‘Understanding personal use of the Internet at
work: An integrated model of neutralization techniques and general deterrence theory’. Computers
in Human Behavior, 38, pp.220-228.
11. Eliyana, A. and Sridadi, A. (2020) ‘Workplace spirituality and job satisfaction toward job
performance: The mediation role of workplace deviant behavior and workplace
passion’, Management Science Letters, 10(11), pp.2507-2520.
12. Friedman, W. H. (2000) ‘Is the Answer to Internet Addiction Internet Interdiction?’ AMCIS 2000
Proceedings, p. 226.
13. Garg, N. (2018) ‘Promoting organizational performance in Indian insurance industry: The roles of
workplace spirituality and organizational citizenship behaviour’, Global Business Review, 21(3),
pp.834-849
14. Ghadi, M.Y. (2017) ‘The impact of workplace spirituality on voluntary turnover intentions through
loneliness in work’, Journal of Economic and Administrative Sciences, 33(1), pp.81-110.
15. Giacalone, R. A., & Jurkiewicz, C. L. (2003) Toward a science of workplace spirituality. in R. A.
Giacalone & C. L. Jurkiewicz (Eds.), The handbook of workplace spirituality and organizational
performance, Armonk: ME Sharpe, pp.3-28.
16. Hirschi, Travis. (1969) Causes of Delinquency, Berkeley: University of California Press.
17. Hollinger, R.C. (1986) ‘Acts against the workplace: Social bonding and employee deviance;
Deviant Behavior, 7(1), pp.53-75.
18. Houghton, J.D., Neck, C.P. and Krishnakumar, S. (2016) ‘The what, why, and how of spirituality
in the workplace revisited: A 14-year update and extension’, Journal of Management, Spirituality
& Religion, 13(3), pp.177-205.
19. Jiang, H., Tsohou, A., Siponen, M., & Li, Y. (2020) ‘Examining the side effects of organizational
Internet monitoring on employees’, Internet Research (online) Available at
https://doi.org/10.1108/INTR-08-2019-0360 Accessed on 2nd July, 2020 at 19:45 hours.
20. Jurkiewicz, C.L. and Giacalone, R.A. (2004) ‘A values framework for measuring the impact of
workplace spirituality on organizational performance’, Journal of Business Ethics, 49(2), pp.129-
142.
21. Khari, C. and Sinha, S. (2018) ‘Organizational spirituality and knowledge sharing: A model of
multiple mediation’, Global Journal of Flexible Systems Management, 19(4), pp.337-348.
22. Lim, V.K. (2002) ‘The IT way of loafing on the job: Cyberloafing, neutralizing and organizational
justice’, Journal of organizational behavior: the international journal of industrial, occupational
and Organizational Psychology and Behavior, 23(5), pp.675-694.
23. Lim, V.K. and Chen, D.J. (2012) ‘Cyberloafing at the workplace: gain or drain on
work?’, Behaviour & Information Technology, 31(4), pp.343-353.
24. Luqman, A., Masood, A., Shahzad, F., Imran Rasheed, M. and Weng, Q. (2020) ‘Enterprise Social
Media and Cyber-slacking: An Integrated Perspective’, International Journal of Human–Computer
Interaction, 36(15), pp.1426-1436.
25. O’Neill, T.A., Hambley, L.A. and Bercovich, A. (2014a) ‘Prediction of cyberslacking when
employees are working away from the office’, Computers in Human Behavior, 34, pp.291-298.
26. O’Neill, T.A., Hambley, L.A. and Chatellier, G.S. (2014b) ‘Cyberslacking, engagement, and
personality in distributed work environments’, Computers in Human Behavior, 40, pp.152-160.
27. Otaye-Ebede, L., Shaffakat, S., & Foster, S. (2019) ‘A Multilevel Model Examining the
Relationships Between Workplace Spirituality, Ethical Climate and Outcomes: A Social Cognitive
Theory Perspective’, Journal of Business Ethics, 1-16.
28. Petchsawang, P., & McLean, G. N. (2017) ‘Workplace spirituality, mindfulness meditation, and
work engagement’, Journal of Management, Spirituality & Religion, 14(3), 216-244.
29. Pfaltzgraff-Carlson, R. (2020) ‘Reconceptualizing organizational spirituality: theological roots for
scientific and practical fruits’, Journal of Management, Spirituality & Religion, 17(3), pp.249-269.
30. Restubog, S.L.D., Garcia, P.R.J.M., Toledano, L.S., Amarnani, R.K., Tolentino, L.R. and Tang,
R.L., (2011) ‘Yielding to (cyber)-temptation: Exploring the buffering role of self-control in the
relationship between organizational justice and cyberloafing behavior in the workplace’, Journal of
Research in Personality, 45(2), pp.247-251.
31. Saks, A. M. (2011) ‘Workplace spirituality and employee engagement’, Journal of management,
spirituality & religion, 8(4), pp.317-340.
32. Sawitri, H.S.R. and Mayasari, D. (2017) ‘Keeping up with the cyberloafer: how do cyberloafing
and creative self-efficacy bear with creativity?’,. Journal for Global Business Advancement, 10(6),
pp.652-670.
33. Sheikh, A., Atashgah, M.S. and Adibzadegan, M. (2015) ‘The antecedents of cyberloafing: A case
study in an Iranian copper industry’, Computers in Human Behavior, 51, pp.172-179.
34. Sholikhah, Z., Wang, X. and Li, W., 2019. The role of spiritual leadership in fostering
discretionary behaviors. International Journal of Law and Management, 61(1), pp.232-249.
35. Usman, M., Javed, U., Shoukat, A. and Bashir, N.A. (2019) ‘Does meaningful work reduce
cyberloafing? Important roles of affective commitment and leader-member exchange’, Behaviour
& Information Technology, pp.1-15.
36. Weatherbee, T. and Kelloway, E.K. (2006) ‘A case of cyber deviancy: cyber aggression in the
workplace”, in Kelloway, E.K., Barling, J. and Hurrell, J.J., Jr (Eds), Handbook of Workplace
Violence, Sage Publications, Thousand Oaks, CA, pp. 445-487
37. Wu, J., Mei, W., Liu, L. and Ugrin, J.C. (2020) ‘The bright and dark sides of social cyberloafing:
Effects on employee mental health in China’, Journal of Business Research, 112, pp.56-64.
38. Zhang, S. (2020) ‘Workplace spirituality and unethical pro-organizational behavior: the mediating
effect of job satisfaction’, Journal of Business Ethics, 161(3), 687-705.
‘An Analytical Study on Privatization of Oil Industry in Kuwait:
Challenges and Opportunities
Hanan A-Hashash1
Prof. Raphael Heffron2
1&2University of Dundee, Nethergate, Dundee, Scotland, U.K.
Abstract
This research paper aims to critically analyse the “oil sector” (Kuwait Petroleum Corporation (KPC) & its
subsidiaries) given the peculiarity of this vital sector in Kuwait’s national economy, as there is a dearth of
researches for this special sector. The several explanations and drivers which reveal reasons for State of
Kuwait, which is heading towards privatization and related forms of the participation of the private
partnerships are being discussed.
The systematic review of published literature on the topic of privatization in oil sector of Kuwait over a 30-
year period (1991-2020) by critically examining the methodological, conceptual, and empirical aspects has
been carried-out. This research comprised the analysis and significance of Privatization Law #37 of 2010 in
Kuwait and Decree # 38 (2015) issuing the Executive Regulations of Law # 37 of 2010, and also
implications on Kuwait’s oil sector at the present, or should PPP or other initiatives be pursued, including
the legal, economic, political and social challenges.
Keywords : Oil Industry in Kuwait, Kuwait Petroleum Corporation (KPC), Privatization Law #37 in Kuwait,
Challenges & Prospects
1. INTRODUCTION & RATIONALE FOR THE STUDY
The overview of Oil Industry in Gulf Cooperation Council (GCC) states is covered, including
Kuwait Oil Industry, evolving models of increased private-sector participation and public-
private partnerships (PPPs), Kuwait Petroleum Corporation (KPC), PESTEL (Political,
Economic, Social, Technological, Environmental and Legal) analysis.
The recent academic literature contains several explanations, drivers to reveal why the State
of Kuwait “in general” is heading towards privatization and related forms of the participation of
the private partnerships.
Kuwait when privatized, as many of the academic community did not include the “oil
sector” {Kuwait Petroleum Corporation (KPC) and its subsidiaries} in their research scope,
not realizing the peculiarity of this vital sector and not taking its special nature into consideration
in its review, or they omitted to address important aspects when researching the topic. Hence, it is
considered that there is a dearth of researches for this special sector.
2. REVIEW OF LITERATURE & RESEARCH GAP / PROBLEM
To understand how the current literature understand the issue of privatization, the oil sector of
Kuwait, the methodological tool of a critical systematic review was employed.
The Gulf States viz., Kuwait, Saudi Arabia, UAE and Qatar and neighbors Iran, Iraq are
producing about 65-70% of global oil reserves, thereby offering energy supply to global economy.
However, the Middle East countries are confronted with on-going wars, conflicts (like Arab-
Israel, Arab-Iran, Gulf-US, etc.) and also recently emerging terrorist attacks. In this context, there
is increased need for enhanced peace, harmony and cooperation on energy supply security, not the
unhealthy competition (Samil Sen & Tuncay Babalı, 2007; Estrin and Pelletier, 2018; Gross &
Ghafar 2019).
The technological developments in oil and gas industry have impacted the structure and also
influencing the supply and demand in transport in OECD Countries. This has resulted in lesser
dependency on oil supplies by Middle East countries to US and European region (John V.
Mitchell and Beth Mitchell, 2014).
2.1 Comprehensive and systematic review of the relevant literature: The Approach
A comprehensive review of the relevant literature including a computer assisted search was
initiated to develop an understanding of privatization and related aspects and collect sources that is
thought to be useful and available in providing an insight into the research topic. Materials have
been selected based on the objective of the study, time period was applied to the search, from
1991 to date. Ten search strings were utilized using the “Title, Abstract, and Keywords”
(Privatization, PPP, Oil Sector, Financial challenges, Social Challenges, Legal Challenges,
Political Challenges, Risks, Energy Industry, Advantages and Disadvantages of Privatization).
This review has selected books and articles written by leading experts and other academic
accredited sources, which are mentioned later, presenting the topic theme for the review, then
analysing the chosen books or articles thoroughly before summing them up briefly at the end.
This section includes study of OECD Countries and Gulf States viz., Kuwait, Saudi Arabia,
UAE, Qatar, Iran, Iraq, etc. which are producing about 65-70% of global oil reserves.
2.2 Comprehensive and systematic review of the relevant literature: The preliminary findings
A comprehensive and systematic review of the relevant literature is carried out using the
published sources like books, journals, literature of doctoral research, case studies, laws related
to privatization, etc of about 150, from which 74 relevant literature have been considered for the
analysis/study herein by the researcher (Table 1).
• Systematic review of the relevant literature is carried out during 1991 to 2020 (30 years).
• Ten search strings were utilized using the “Title, Abstract, and Keywords” (Privatization,
PPP, Oil Sector, Financial challenges, Social Challenges, Legal Challenges, Political Challenges,
Risks, Energy Industry, Advantages and Disadvantages of Privatization).
Coding
Category
Dimension of Review of the literature,
which is relevant to the topic of Doctoral Research
Number of papers
addressing the
dimension (s) (How where they distributed
from 9 areas)
1 Published books which focus on privatization in developed
and developing countries;
3
2 Published books which focus on privatization and energy 14
3 Published journal articles in renowned legal and economic
databases
19
4 Documents from policymaking organizations like the World
Bank and UNCTAD
10
5 Laws governing the oil sector in Kuwait, privatization in
Kuwait and relevant cases
2
6 Review of the relevant literature, including government
documents
4
7 Case studies on Kuwait 4
8 Electronic sources 10
9 PhD & Doctoral research 1
10 Consultancy commentary, and Practitioner research 2, 8 (the 8 can be considered
from code 10 and also it was
distributed into different codes).
Table 1: Summary of Systematic Review of Literature (Source: Compiled by the Researcher)
2.3 Research Gap and Key Research Questions
This research is also expected to argue that the literature available is incomplete and by
providing relevant evidences supporting the line of analysis and/ or arguments , regarding the
privatization of Kuwait’s oil sector, which faces multiple challenges that were not fully tackled
and should be evaluated accordingly, leading to important research questions such as:
1) Whether the preliminary measures and appropriate studies been taken in Kuwait, before
making the policy decision of privatization?
2) Is privatization the best way forward for Kuwait’s oil sector at the present, or should
PPP or other initiatives be pursued?
3) What are the key challenges facing the PPP and Privatization processes of Kuwait’s
Oil sector?Regulatory burdens: what is the level of eventual state sovereignty over oil
and gas resources in Kuwait, what restrictions on foreign ownership in privatized
companies will exist, and what are the international interests?
4) What is the recommended form: full privatization, partial, joint venture arrangements
between the public and private sectors of Kuwait’s oil sector?
The researcher shall discuss the privatization issue from multiple perspectives as follows, and
it has been chosen these headings and subjects based on a notable available body of academic
literature and published reports concerning them, and present the critical analysis related to the
subject matter based on what the privatization process in Kuwait has suffered and where the
essential required factors for its success have not yet been fulfilled, trial and error - in most cases
due to lack of experience and a significant lack of enthusiasm by the government to give up hold
over Public Enterprises and many other reasons as will be discussed.
The research paper further explicates that there are four main underlying challenges to the
Kuwait's privatization energy process, namely legal, economic, political and social.
2.4 OBJECTIVES OF THE STUDY
Given the context of above mentioned background, a research (based on both the secondary
research from published resources and also the primary industry research) is being planned to be
undertaken with the following primary objectives:
1) To understand and undertake a systematic analysis of the preliminary measures and
appropriate studies/ research undertaken already, regarding the privatization of Oil
Industry in Kuwait.
2) To evaluate the best-feasible and practically-applicable strategy for the scientific
privatization and internationalization for the Kuwait’s oil sector, including
evaluation of PPP (Public Private Partnership) model, legal amendments & other
initiatives.
3) To examine the challenges and opportunities for the privatization of Kuwait’s Oil
industry, with maximization and leveraging benefits to the all the stakeholders, while
protecting the national interests of Kuwait Government & its citizens.
3. RESEARCH METHODOLOGY
This is an analytical & descriptive study consisting of both secondary and primary
research. This analytical research paper has presented the anaysis of status, influencing factors
and growth trends in respect of emergence of Kuwait’s Oil Industry’s privatization and it is a
Work in Progress (WIP) Doctoral Research in the 1st year of PhD program.
The primary research work is in progress on the topic of study, as an integral part of the
Doctoral Research work.
4. RESULTS & FINDINGS OF THE STUDY
Based on the research undertaken during the 1st year of PhD program, the preliminary
research findings are presented here below in sub-topics:
4.1 Privatization Law is Kuwait
The Privatization Law is enacted as #37 of 2010, which has paved the way for the process
of privatization in the state of Kuwait. The summary of Privatization #37 of 2010 is enumerated here
below in Table 2:
Chapter # Title of the Chapter Articles covered
Definitions Article 1
1 General Rules Article 2, 3, 4
2 The Supreme Council of Privatization Articles 5, 6, 7, 8, 9 and 10
3 Privatization Operations Articles 11, 12, 13, 14, 15, 16, 17
4 Protection of Employees Rights Articles 18, 19, 20, 21, 22
5 Penalties Articles 23, 24, 24, 25, 26, 27
6 Final Rules Articles 28
Table 2: Summary of the Privatization Law #37 of 2010 in the State of Kuwait
(Source: Prince of Kuwait, Issued at Al Seif Palace, on 16th
Gomadi Al Akhera, 1431, Hijri, dated
30th
May 2010, A.D., pages 1-12)
It may further be noted that Decree # 38 for the 2015 issuing the Executive Regulations of
Law # 37 of 2010 regarding the Organization of Privatization’s Programs and Operations has been
released and is enumerated in Table 3 here below:
Chapter # Title of the Chapter Articles covered
Definitions
1 General Rules Article 1
2 Jurisdictions the Supreme Council of Privatization Article 2
3 Rules and procedures of the Evaluation
Branch One: Procedures of selecting Evaluation Entities Article 3
Branch Two: Rules for Evaluation of the Public project of the
establishment of a Public Joint Stock Company in a public
auction
Article 4
Branch Three: Rules of Evaluation of the Joint stock Owned by
the State that replaced the public project
Article 5
4 Procedures for the selection of the Winner Investor Article 6, 7, 8
5 Training Programs of the Employees Transferred to Public Stock
Company
Article 9, 10
6 Conflicts of Interest Articles 11, 12, 13,
14, 15, 16, 17, 18,
19, 20
7 Penalties applied to Joint Stock Companies violating the
Provisions of the Law, the decisions of the Council, the Articles
& Memorandum of Association of the Joint Stock Companies
Articles 21, 22, 23
8 Usufruct property of State’s Real Estate Articles 25, 26, 27
9 General Provisions Articles 28, 29
Table # 3: Summary of Decree # 38 for the 2015 issuing the Executive Regulations of Law # 37 of
2010 regarding the Organization of Privatization’s Programs & Operations
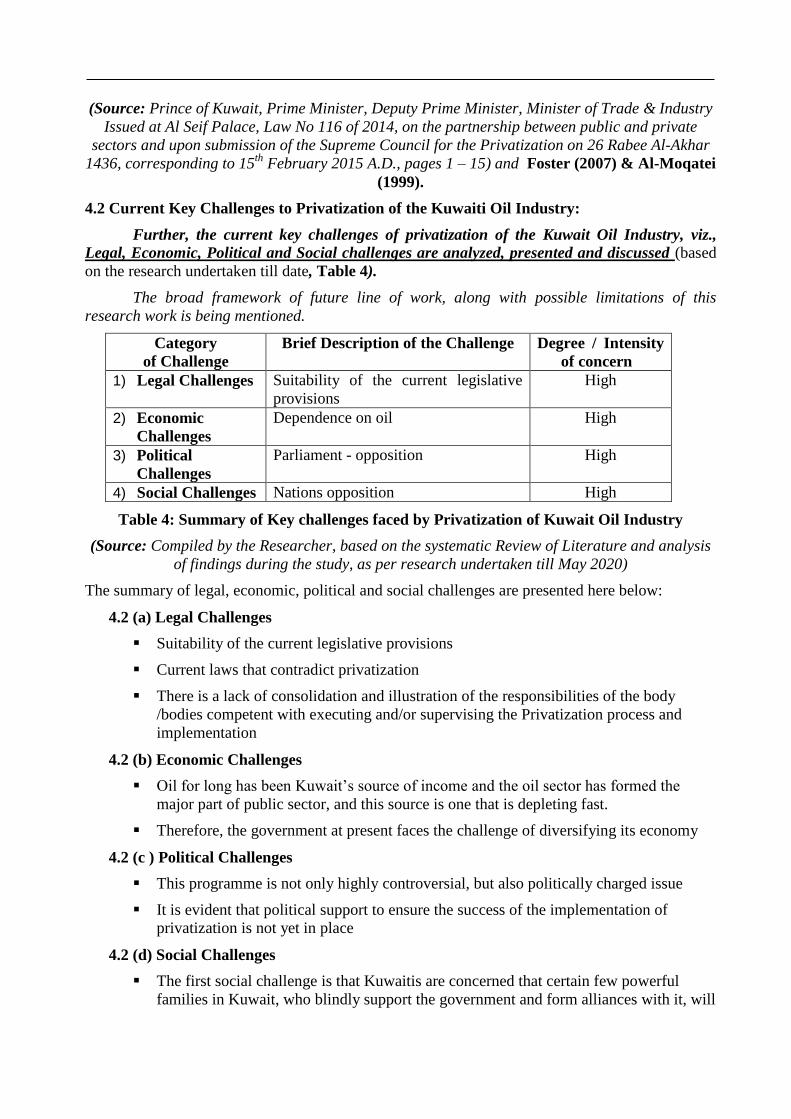
(Source: Prince of Kuwait, Prime Minister, Deputy Prime Minister, Minister of Trade & Industry
Issued at Al Seif Palace, Law No 116 of 2014, on the partnership between public and private
sectors and upon submission of the Supreme Council for the Privatization on 26 Rabee Al-Akhar
1436, corresponding to 15th
February 2015 A.D., pages 1 – 15) and Foster (2007) & Al-Moqatei
(1999).
4.2 Current Key Challenges to Privatization of the Kuwaiti Oil Industry:
Further, the current key challenges of privatization of the Kuwait Oil Industry, viz.,
Legal, Economic, Political and Social challenges are analyzed, presented and discussed (based
on the research undertaken till date, Table 4).
The broad framework of future line of work, along with possible limitations of this
research work is being mentioned.
Category
of Challenge
Brief Description of the Challenge Degree / Intensity
of concern
1) Legal Challenges Suitability of the current legislative
provisions
High
2) Economic
Challenges
Dependence on oil High
3) Political
Challenges
Parliament - opposition High
4) Social Challenges Nations opposition High
Table 4: Summary of Key challenges faced by Privatization of Kuwait Oil Industry
(Source: Compiled by the Researcher, based on the systematic Review of Literature and analysis
of findings during the study, as per research undertaken till May 2020)
The summary of legal, economic, political and social challenges are presented here below:
4.2 (a) Legal Challenges
Suitability of the current legislative provisions
Current laws that contradict privatization
There is a lack of consolidation and illustration of the responsibilities of the body
/bodies competent with executing and/or supervising the Privatization process and
implementation
4.2 (b) Economic Challenges
Oil for long has been Kuwait’s source of income and the oil sector has formed the
major part of public sector, and this source is one that is depleting fast.
Therefore, the government at present faces the challenge of diversifying its economy
4.2 (c ) Political Challenges
This programme is not only highly controversial, but also politically charged issue
It is evident that political support to ensure the success of the implementation of
privatization is not yet in place
4.2 (d) Social Challenges
The first social challenge is that Kuwaitis are concerned that certain few powerful
families in Kuwait, who blindly support the government and form alliances with it, will
control and exploit privatized sectors to increase their wealth, and gain more
dominance in the country
Kuwaiti citizens are worried that privatization will affect public finances drastically,
with widespread fears of job losses being the main worry
It could be said that essential factors required for the success of privatization in Kuwait
must be fulfilled.
4.3 Impact and implications of Privatization on the Kuwaiti Oil Industry
Furthermore, there is an acute and pervasive fear that privatization leads to layoffs,
1) Firstly in the short-term in the firms divested, and then in the longer-run and
2) Secondly in the economy at large.
3) Thirdly it is widely believed that even if privatization improves efficiency, the
bulk of its benefits accrue to a few privileged shareholders, managers and those
with political associations, while the costs are borne by workers and consumers.
Moreover, there is much concern that
4) lack of transparency and corruption within the privatization process itself has
diminished its intended gains and
5) have further led to wider and more severe problems of governance.
This data has been presented the detailed discussion on the process of privatization of
Kuwait’s Oil Industry. The discussion of findings, including the arguments “in favor” of
privatization (‘for’ the privatization) and “not in favor” the privatization (‘against’ the
privatization) are presented.
4.4 Most research papers that support the objectives of Privatization to be remedies for the
problems of public sector, these objectives can be summarized as follows:
1) Higher rates of performance (sufficiency) in national economic (Dr. Ibrahim Alessawy,
1992), increasing the quality of goods and services, due to allowing the competitive forces
among units of private sector, effective management, financial planning and the most
accurate marketing in this sector, as it aims at profit maximization (Attiat F. OTT and
Keith Hartley, 1995).
2) Reducing the deficit in public budget of national economy (Figure 1) as per Budget 2018-
19.
3) Reducing open and hidden unemployment, due to increasing the utilization of labor in
governmental sector, creating new employment opportunities in private sector (Maged
Saleh Aldaihany, Wafa Mohammed Alkhaneny, 1994; Gamal El-Din, 1996).
4) Allow the foreign ownership of companies, dealing with foreign companies similar to
national companies, which creates a pull-factor for foreign investments, and resulting of
applying techniques which owned by foreign companies and assistance in opening new
markets, and strengthening international relations (International Bank Report).
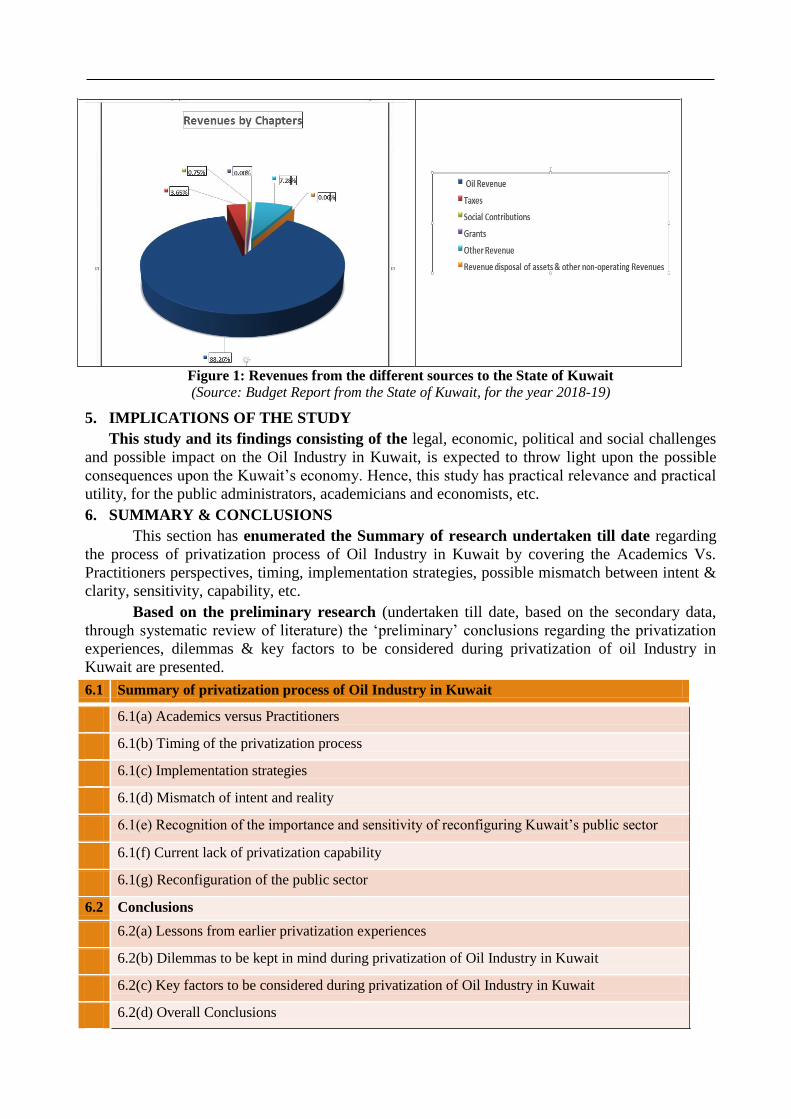
Figure 1: Revenues from the different sources to the State of Kuwait
(Source: Budget Report from the State of Kuwait, for the year 2018-19)
5. IMPLICATIONS OF THE STUDY
This study and its findings consisting of the legal, economic, political and social challenges
and possible impact on the Oil Industry in Kuwait, is expected to throw light upon the possible
consequences upon the Kuwait’s economy. Hence, this study has practical relevance and practical
utility, for the public administrators, academicians and economists, etc.
6. SUMMARY & CONCLUSIONS
This section has enumerated the Summary of research undertaken till date regarding
the process of privatization process of Oil Industry in Kuwait by covering the Academics Vs.
Practitioners perspectives, timing, implementation strategies, possible mismatch between intent &
clarity, sensitivity, capability, etc.
Based on the preliminary research (undertaken till date, based on the secondary data,
through systematic review of literature) the ‘preliminary’ conclusions regarding the privatization
experiences, dilemmas & key factors to be considered during privatization of oil Industry in
Kuwait are presented.
6.1 Summary of privatization process of Oil Industry in Kuwait
6.1(a) Academics versus Practitioners
6.1(b) Timing of the privatization process
6.1(c) Implementation strategies
6.1(d) Mismatch of intent and reality
6.1(e) Recognition of the importance and sensitivity of reconfiguring Kuwait’s public sector
6.1(f) Current lack of privatization capability
6.1(g) Reconfiguration of the public sector
6.2 Conclusions
6.2(a) Lessons from earlier privatization experiences
6.2(b) Dilemmas to be kept in mind during privatization of Oil Industry in Kuwait
6.2(c) Key factors to be considered during privatization of Oil Industry in Kuwait
6.2(d) Overall Conclusions
6.2 (a) Lessons from earlier privatization experiences: is being compiled upon
6.2 (b) Dilemmas to be kept in mind during privatization of Oil Industry in Kuwait
a) Difficulty of translating earlier privatization experiences
b) Lessons of earlier failures and absence of an appropriate institutional framework
c) Structural challenges
d) Need for clearly defined objectives
e) The efficiency fallacy
6.2 (c) Key factors to be considered during privatization of Oil Industry in Kuwait
a) Changes to the legal and regulatory context
b) Calculation and calibration of the national and international economic environment
c) Communicating and engaging with key stakeholders
d) Educating and informing the Kuwaiti national audience
6.2 (d) Overall Conclusions For understandable reasons given the rapidly changing social, political and economic
contexts in the region in relation to PPP projects and their governing legal frameworks, there is a
substantial legal and economic consultancy commentary (Arabian Business, 2017; Hart Energy,
2016; King & Spalding, 2017; PwC, 2015; Sattout & Batwala, 2018; Stevens, 2016; Energy
Information Administration, 1996).
However, the researchers need to consider the challenges and implications of Kuwait’s
changing privatization agenda and PPP legal contexts post-2007, particularly in relation to the oil
sector if the country proceeds in this direction.
7. BIBLIOGRAPHY
1. Al-Moqatei, M. (1999). ‘The Kuwaiti National Assembly and the Targeted Legislation in the
Privatization Process’. Arab Law Quarterly, 14(16), 132-147.
2. Arabian Business (2017). ‘Kuwait oil company pushes ahead with privatisation plans: KPC
announces investment opportunities for private sector’ (November 27).
ttps://www.arabianbusiness.com/industries/energy/384483-kuwait-oil-company-pushes-ahead-
with-privatisation-plans
3. Energy Information Administration, (1996). Privatization and the Globalization of Energy
Markets, Washington, D.C.: Office of Energy Markets and End Use, U.S. Department of Energy,
retrieved 2 June 2009, <tonto.eia.doe.gov/FTPROOT/financial/060996.pdf>.
4. Estrin, S., and Pelletier, A. (2018). Privatization in Developing Countries: What Are the Lessons
of Recent Experience? The World Bank Research Observer, 33(1), 65–102.
https://academic.oup.com/wbro/article/33/1/65/4951686
5. Foster, N. (2007), ‘Comparative Commercial Law: Rules of Context?’ in E. Orucu and D. Nelken
(eds.), Comparative Law: A Handbook. London: Hart Publishing, pp.263-286.
6. Gamal El-Din A. (1996), “Employment and Privatization in Egypt’’, Cairo, June 1996, cited in
‘Privatization and Economic Development: Study on the Effect of privatization on the economic
efficiency in Developing Countries: Egypt-As a Case Study under Law No. 203 for 1991’’, Dr.
Safwat A Awadalla, 18 Arab L.Q., 2003.
7. Gross, S., and A.A. Ghafar (2019). The shifting energy landscape and the Gulf economies’
diversification challenge. Foreign Policy at Brookings. December, 2019,
https://www.brookings.edu/wp-
content/uploads/2019/12/FP_20191210_gcc_energy_ghafar_gross.pdf
8. Hart Energy (2016). ‘Kuwait studies Privatization of oil services’ (July 12).
https://www.epmag.com/kuwait-studies-Privatization-oil-services-1018756
9. Hvidt, M. (2013). Economic Diversification in GCC Countries: Past Record and Future Trends.
Kuwait Programme on Development, Governance and Globalisation in the Gulf States/LSE
Department of Government, Jan. (No. 27).
http://eprints.lse.ac.uk/55252/1/Hvidt%20final%20paper%2020.11.17_v0.2.pdf

10. John V. Mitchell and Beth Mitchell (2014), Structural crisis in the oil and gas industry, Energy
Policy 64 (2014) 36–42
11. King and Spalding (2017). ‘Middle East Vision 2030: PPP Legal Report 2017’ (June).
https://www.kslaw.com/attachments/000/005/226/original/Middle_East_Vision_2030_PPP_Legal_
Report.pdf?1502830269
12. PriceWaterhouseCooper (PwC) (2015). Kuwait: Public Private Partnership Law. An
introduction (October). Kuwait: PwC Middle East Tax and Legal
13. Samil Sen and Tuncay Babalı (2007), Security concerns in the Middle East for oil supply:
Problems and solutions Energy Policy 35 (2007) 1517–1524
Founder Ownership and the Readability of Management Discussion and
Analysis section of the annual report
Somya Arora1
Prof. Yogesh Chauhan2
1&2Indian Institute of Management, Cheriya, Naya Raipur, Chhattisgarh
Abstract
We examine the influence of business groups and promoter shareholdings on the readability of the
Management Discussion and Analysis section of the annual report amongst the Indian firms. Using the Fog
index, length of the document as indicators of readability, we show that promoters tend to make reports
more readable in order to project a better picture of the firm. However, business groups tend to make
statements challenging to read. Using sub-sample analysis, we further report that promoters in a standalone
firm are more inclined to make annual reports more readable. Collectively, our results indicate that textual
content plays a vital role in the decision of the users of these statements and hence, serves as a tool for the
managers to obfuscate information.
Keywords: Business Groups, Readability Index, Promoter Shareholding, Incomplete Revelation
Introduction
The growing complexity of financial statements has attracted the attention of accounting
researchers. With rare disagreement among the researchers regarding the ever-increasing
complexity of financial documents, it is inevitable to address the readability of financial reports in
an emerging market like India. The Companies Act, 2013, mandated the preparation of financial
documents following accounting standards under Section 133 to present a fair picture of the firm.
Thus, the readable financial reports will help investors make an informed judgment, assist
analysts, and other advisors make recommendations, enable firms to build better relationships with
the existing and prospective stakeholders and further acquire resources at a lower rate. The
growing importance is credited to the increasing amount of information transmitted through the
financial documents (Lahart, 2014; Loughran & Mcdonald, 2014). The disclosure by the firm
incorporates numerical and textual information. Standard setters provide a standardized format for
numerical information transmission; however, there are no guidelines for the reports’ text
portions. Further, there has been a substantial rise in textual content (Chen & Li, 2015).
The textual component of financial documents affects investors’ decisions (De Franco, Hope,
Vyas, & Zhou, 2015). Also, prior research suggests that the investors find these documents
complex to understand (Li, 2008), requiring advanced processing capabilities. The complexity
affects the ability to search and incorporate necessary information in investment decisions.
Consequently, the Securities and Exchange Commission (SEC) issued a handbook on plain
English disclosures guidelines in the year 1998, motivating all firms to use plain English measures
to prepare the documents for disseminating the information to the outside parties1. Moreover, the
management usually makes an effort to complicate the financial reports for the information they
do not wish to communicate; at the same time, the remaining data is easily communicable. Thus,
readability can be regarded as a strategic choice by the firm’s managers to disclose selective
information.
In this study, we examine the determinants of readability among Indian firms. Prior research
on readability focused on developed markets like the USA, the UK, which is characterized by
diffused ownership and healthy regulatory norms for investor protection. In contrast, Indian firms
1Plain Writing Act, 2010, superseded the disclosure guidelines.
are characterized by concentrated ownership and prominence of business groups, inadequate
investor protection, weaker institutional settings, and legal enforcement. Thus, it serves as a new
setting to analyse financial documents’ readability. Besides, business groups are common in India
(Khanna & Palepu, 2000). With poor governance and disclosure practices, the business groups fill
the institutional gap due to weaker institutional settings, equipping group firms to take
diversification and reputational benefits, fill in the resource constraints. However, business group
membership comes at the cost of conflict between the controlling and minority shareholders,
misallocation of resources amongst the groups, and biased compensation schemes (Khanna &
Palepu, 2000). Thus, it would be significant to see the impact of business groups on the readability
of financial documents. Hence, we hypothesize that business groups may be motivated to make
annual financial reports less readable for the minority shareholders’ expropriation.
This study takes the horizon of existing literature a step ahead. The readability concept in
accounting and finance is at an emerging stage in India. The research on readability has identified
various determinants of readability and its impact on returns to firms in different developed
countries. However, prior studies lack identifying the effect of the readability of financial
documents in the Indian context. The remainder of the article is organized as follows: Section 2
discusses the literature for readability and the hypothesis; Section 3 discusses the data description
and the methodology; Section 4 presents the results and discussion for the hypothesis, and Section
5 concludes.
Literature Review and Hypothesis Development:
As a measure of text complexity, readability allows the users to understand the document and
realize the real value and risk characteristics of the reporting entity. (You & Zhang, 2011) provide
evidence that complex financial statements pose a concern as it delays the investors’ reaction to
the information; therefore, slowing information incorporation into the stock prices. (R. J.
Bloomfield, 2002) mention that difficulty level of comprehension of the annual reports has
increased over time. With the growing importance of the readability of financial statements,
various studies document the economic outcomes of readability. (Smith & Smith, 1971), using the
readability index on footnotes of 50 random fortune companies, consider the reports restrictive.
They further show that only 19.3% of the US population has the requisite education, limiting the
financial reports’ understandability. A large sample study by (Li, 2008), have reported that firms
with meagre earnings are more inclined to file challenging to read annual reports. (Miller, 2010)
show that the less readable records lead to reduced trading by the small investors, having
relatively less impact on the large investors. Moreover, (Lo et al., 2017), in his study presents that
the earnings management practices in the firm lead to complex annual reports. (Nelson &
Pritchard, 2011) show an asymmetric sensitivity of a firm’s cautious language because of the
litigation risk. Further, firms avoid boilerplate warnings, provide more critical details about the
risk factors, and use cautious language to reduce litigation costs. In contrast, no evidence is found
of firms not using cautious language when litigation risks reduce. (Callen, Khan, & Lu, 2013; You
& Zhang, 2011) associate less readable financial reports of firms to stock price crash risk and
stock price delay, respectively; consistent with (R. J. Bloomfield, 2002) “Incomplete Revelation
Hypothesis,” suggesting that investors underreact to the complex and challenging information
extracted from the financial reports.
Thus, the readability of financial documents affects investors’ decisions (De Franco et al.,
2015), and the investors find these documents complex to understand (Li, 2008), requiring better
and advanced processing capabilities. (Lehavy, Li, & Merkley, 2011) find that investors’ demand
for analyst’s services increases with increasing complexity in the financial reports. These studies
clearly emphasize the need for improved readability in making information more accessible to the
users of financial documents.
Hypothesis:
Concentrated ownership is a common phenomenon in an emerging market like India. The
conflict of interest between minority and the majority shareholders (Shleifer & Vishny, 1997)
remains a significant concern for the regulatory authority. In our study, we consider the readability
of financial documents, which serves as a vital avenue with the management to expropriate
minority shareholders. Further, prior research on readability considers annual financial reports by
the firms to be unreadable. To sum, a firm’s management often practices lower readability to
present a better picture of a firm. (Rennekamp, 2012), using an experiment, show that investors
react firmly to more readable documents.
Promoter Holding: Among Indian firms, concentrated ownership plays a dominant role.
Promoters with significant stake holding have substantial decision-making power and have a
significant influence on the firm’s management. With direct rewards associated with firm
performance, promoters have incentives to improve firms’ governance. The founders manage the
conflict between the owner-manager and minority-majority shareholders in an efficient manner
(Mitton, 2002). Further, prior research suggests that family firms perform better than their
counterparts (Anderson & Reeb, 2003; Barontini & Caprio, 2006). The promoters can potentially
affect the firm’s disclosure quality by influencing the readability of financial reports positively.
Hypothesis 1: There is a significant positive relation between promoter holding and readability of
financial reports.
With a flawed regulatory framework, institutional voids, and inefficient contract enforcement
(Khanna & Palepu, 2000), Indian business groups serve as essential intermediaries for the firms.
Moreover, the expropriation of minority shareholders by controlling shareholders remains a
significant concern. Thus, the business groups may use complex language in their financial reports
to misrepresent the minority shareholders.
Hypothesis 2: Business groups will prepare the Management discussion and analysis report less
readable in nature
Further, we add control variables for various factors. The definition can be obtained from Table 1.
Data and Methodology:
Centre for Monitoring Indian Economy (CMIE) and Ace knowledge portal is used to collect
the data for the financial variables and Management Discussion and Analysis section reports. We
use a sample of
1890 firms listed on the National Stock Exchange (NSE) and the Bombay Stock Exchange
(BSE); for the period 2015 to 2019. Our final sample has a total of 5680 observations, excluding
firms with missing data. We winsorize all financial variables to reduce the effect of outliers at 1%
(top and bottom).
Readability Measures:
In this study, to evaluate the readability, we consider widely used measures like the Fog
Index, length of MD&A, the number of characters in the MD&A, and the number of pages. The
second measure is the length of the document. The length of the report is the logarithm of the
number of words. Length as a measure of readability is easy to calculate and emphasizes the
concern of higher processing costs associated with lengthy documents. Further, the number of
characters and the number of pages help us associated with lengthy documents. Further, the
number of characters and the number of pages help us measure the possible information overload
to obscure the information. To examine the determinants of readability, we use equation 1. In
equation 1, the firm and year are listed as i and t, respectively. The firm and year fixed effects
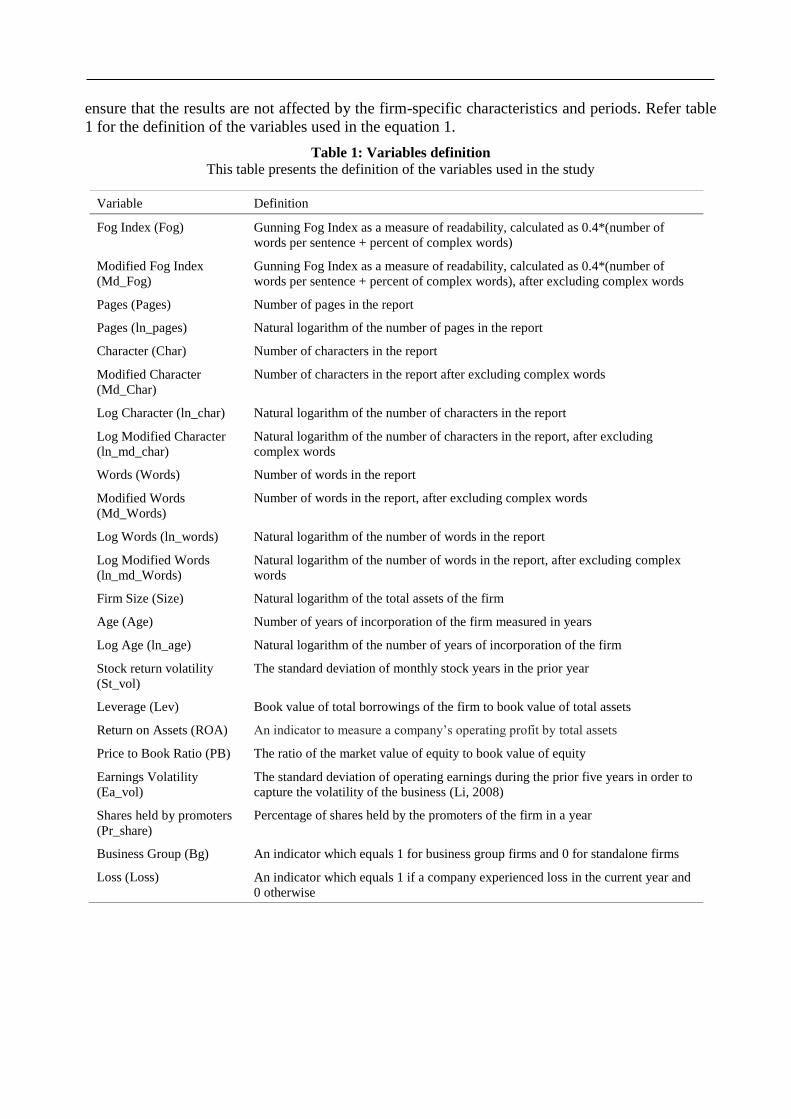
ensure that the results are not affected by the firm-specific characteristics and periods. Refer table
1 for the definition of the variables used in the equation 1.
Table 1: Variables definition
This table presents the definition of the variables used in the study
Variable Definition
Fog Index (Fog) Gunning Fog Index as a measure of readability, calculated as 0.4*(number of
words per sentence + percent of complex words)
Modified Fog Index
(Md_Fog)
Gunning Fog Index as a measure of readability, calculated as 0.4*(number of
words per sentence + percent of complex words), after excluding complex words
Pages (Pages) Number of pages in the report
Pages (ln_pages) Natural logarithm of the number of pages in the report
Character (Char) Number of characters in the report
Modified Character
(Md_Char)
Number of characters in the report after excluding complex words
Log Character (ln_char) Natural logarithm of the number of characters in the report
Log Modified Character
(ln_md_char)
Natural logarithm of the number of characters in the report, after excluding
complex words
Words (Words) Number of words in the report
Modified Words
(Md_Words)
Number of words in the report, after excluding complex words
Log Words (ln_words) Natural logarithm of the number of words in the report
Log Modified Words
(ln_md_Words)
Natural logarithm of the number of words in the report, after excluding complex
words
Firm Size (Size) Natural logarithm of the total assets of the firm
Age (Age) Number of years of incorporation of the firm measured in years
Log Age (ln_age) Natural logarithm of the number of years of incorporation of the firm
Stock return volatility
(St_vol)
The standard deviation of monthly stock years in the prior year
Leverage (Lev) Book value of total borrowings of the firm to book value of total assets
Return on Assets (ROA) An indicator to measure a company’s operating profit by total assets
Price to Book Ratio (PB) The ratio of the market value of equity to book value of equity
Earnings Volatility
(Ea_vol)
The standard deviation of operating earnings during the prior five years in order to
capture the volatility of the business (Li, 2008)
Shares held by promoters
(Pr_share)
Percentage of shares held by the promoters of the firm in a year
Business Group (Bg) An indicator which equals 1 for business group firms and 0 for standalone firms
Loss (Loss) An indicator which equals 1 if a company experienced loss in the current year and
0 otherwise
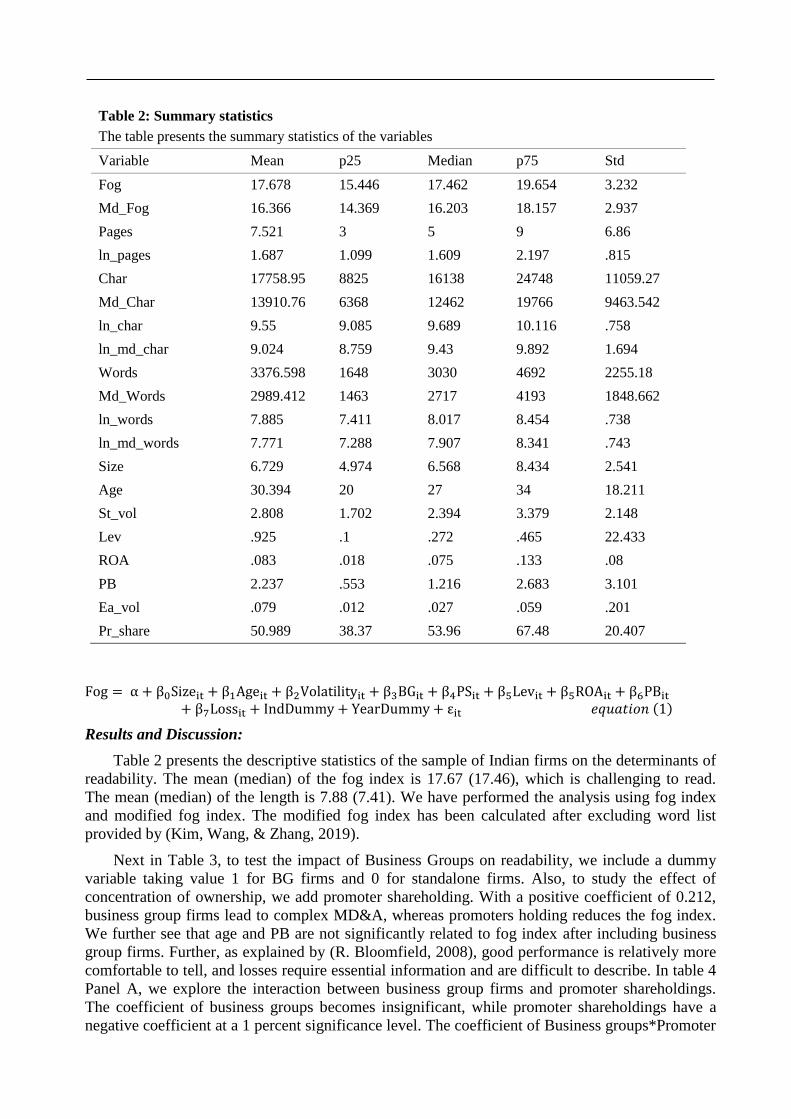
( )
Results and Discussion:
Table 2 presents the descriptive statistics of the sample of Indian firms on the determinants of
readability. The mean (median) of the fog index is 17.67 (17.46), which is challenging to read.
The mean (median) of the length is 7.88 (7.41). We have performed the analysis using fog index
and modified fog index. The modified fog index has been calculated after excluding word list
provided by (Kim, Wang, & Zhang, 2019).
Next in Table 3, to test the impact of Business Groups on readability, we include a dummy
variable taking value 1 for BG firms and 0 for standalone firms. Also, to study the effect of
concentration of ownership, we add promoter shareholding. With a positive coefficient of 0.212,
business group firms lead to complex MD&A, whereas promoters holding reduces the fog index.
We further see that age and PB are not significantly related to fog index after including business
group firms. Further, as explained by (R. Bloomfield, 2008), good performance is relatively more
comfortable to tell, and losses require essential information and are difficult to describe. In table 4
Panel A, we explore the interaction between business group firms and promoter shareholdings.
The coefficient of business groups becomes insignificant, while promoter shareholdings have a
negative coefficient at a 1 percent significance level. The coefficient of Business groups*Promoter
Table 2: Summary statistics
The table presents the summary statistics of the variables
Variable Mean p25 Median p75 Std
Fog 17.678 15.446 17.462 19.654 3.232
Md_Fog 16.366 14.369 16.203 18.157 2.937
Pages 7.521 3 5 9 6.86
ln_pages 1.687 1.099 1.609 2.197 .815
Char 17758.95 8825 16138 24748 11059.27
Md_Char 13910.76 6368 12462 19766 9463.542
ln_char 9.55 9.085 9.689 10.116 .758
ln_md_char 9.024 8.759 9.43 9.892 1.694
Words 3376.598 1648 3030 4692 2255.18
Md_Words 2989.412 1463 2717 4193 1848.662
ln_words 7.885 7.411 8.017 8.454 .738
ln_md_words 7.771 7.288 7.907 8.341 .743
Size 6.729 4.974 6.568 8.434 2.541
Age 30.394 20 27 34 18.211
St_vol 2.808 1.702 2.394 3.379 2.148
Lev .925 .1 .272 .465 22.433
ROA .083 .018 .075 .133 .08
PB 2.237 .553 1.216 2.683 3.101
Ea_vol .079 .012 .027 .059 .201
Pr_share 50.989 38.37 53.96 67.48 20.407
Shareholding is positive and significant at 5 percent. It suggests that the promoter holdings in
business groups tend to make financial reports challenging to read. Our results concerning the
other determinants are by the prior studies. The loss firms prepare MD&A more challenging to
read (Li, 2008).
Subsample Analysis of Business groups vs. standalone firms:
In addition to the above analysis, we examine the difference in the readability of the
standalone firms and business group firms. The results in Table 5, Panel B presents the results for
the standalone firms, and results for business groups. Consistent with the prior results, we find that
promoters for standalone firms make MD&A easier to read. The results imply the role of
promoters in standalone firms who make every effort to portray a better picture of the firm.
Business firms being self-sufficient can afford poor readability.
Conclusion:
With the growing literature on the determinants of readability and its economic consequences,
it is of utmost importance to study the determinants of readability in an emerging market like
India. The concentration of ownership is a common feature among Indian firms. Thus, it serves as
a valuable setting to examine the impact of textual content on the decisionmakers in an
environment primarily governed by business groups with weak legal enforcement and inadequate
investor protection. Using the Ace knowledge portal for extracting the Management Discussion
and Analysis section of the annual report from 2015 to 2019, we find these documents challenging
for an average reader. Using the Fog index, as a measure of readability, we find that it requires an
average of 17.672 years of education to comprehend the annual reports.
Further, we study the impact of business groups amongst Indian firms. We find that business
groups make annual reports harder to read. With a large percentage of business groups in India,
our study provides insight and understanding of the management perspective in such a setting and
the preparation of the annual report narratives. Thus, this study provides evidence that the
management of the firms in India obfuscate information and present a better picture of the firm.
This study is likely to be of interest to the regulators (the Securities and Exchange Board of
India), the standard setters (the Institute of Chartered Accountants of India), the investors, and the
firms at large. There is scope for additional research on readability among Indian firms’ using
more sophisticated measures.
References:
1. Anderson, R. C., & Reeb, D. M. (2003). Founding-family ownership and firm performance:
evidence from the S&P 500. The Journal of Finance, 58(3), 1301–1328.
2. Barontini, R., & Caprio, L. (2006). The effect of family control on firm value and performance:
Evidence from continental Europe. European Financial Management, 12(5), 689–723.
https://doi.org/10.1111/j.1468-036X.2006.00273.x
3. Bloomfield, R. (2008). Discussion of “annual report readability, current earnings, and earnings
persistence.” Journal of Accounting and Economics, 45(2–3), 248–252.
4. Bloomfield, R. J. (2002). The’incomplete revelation hypothesis’ and financial reporting.
5. Callen, J. L., Khan, M., & Lu, H. (2013). Accounting quality, stock price delay, and future stock
returns. Contemporary Accounting Research, 30(1), 269–295. https://doi.org/10.1111/j.1911-
3846.2011.01154.x
6. Chen, J. V., & Li, F. (2015). Discussion of “Textual analysis and international financial reporting:
Large sample evidence.” Journal of Accounting and Economics, 60(2–3), 181–186.
2 At the same time, the gross enrolment rate in the year 2015-16 for higher education was 24.5% (Data Source:
Department of Higher Education, MHRD, Government of India)
https://doi.org/10.1016/j.jacceco.2015.10.003
7. Dale, E., & Chall, J. S. (1948). A formula for predicting readability: Instructions. Educational
Research Bulletin, 27(2), 37–54. https://doi.org/10.2753/JEI0021-3624440403
8. De Franco, G., Hope, O. K., Vyas, D., & Zhou, Y. (2015). Analyst report readability.
Contemporary Accounting Research, 32(1), 76–104. https://doi.org/10.1111/1911-3846.12062
9. Guay, W., Samuels, D., & Taylor, D. (2016). Guiding through the fog: Financial statement
complexity and voluntary disclosure. Journal of Accounting and Economics, 62(2–3), 234–269.
10. Khanna, T., & Palepu, K. (2000). Is group affiliation profitable in emerging markets? an analysis
of diversified Indian business groups. Journal of Finance, 55(2), 867–891.
https://doi.org/10.1111/0022-1082.00229
11. Kim, C., Wang, K., & Zhang, L. (2019). Readability of 10-K Reports and Stock Price Crash Risk.
Contemporary Accounting Research, 36(2), 1184–1216. https://doi.org/10.1111/1911-3846.12452
12. Lahart, J. (2014). Stop throwing the book at investors. Wall Street Journal, 23.
13. Li, F. (2008). Annual report readability, current earnings, and earnings persistence. Journal of
Accounting and Economics, 45(2–3), 221–247. https://doi.org/10.1016/j.jacceco.2008.02.003
14. Lo, K., Ramos, F., & Rogo, R. (2017). Earnings management and annual report readability.
Journal of Accounting and Economics, 63(1), 1–25. https://doi.org/10.1016/j.jacceco.2016.09.002
15. Loughran, T., & Mcdonald, B. (2014). Measuring readability in financial disclosures. Journal of
Finance, 69(4), 1643–1671. https://doi.org/10.1111/jofi.12162
16. Loughran, T., & Mcdonald, B. (2016). Textual Analysis in Accounting and Finance: A Survey.
Journal of Accounting Research, 54(4), 1187–1230. https://doi.org/10.1111/1475-679X.12123
17. Miller, B. P. (2010). The effects of reporting complexity on small and large investor trading.
Accounting Review, 85(6), 2107–2143. https://doi.org/10.2308/accr.00000001
18. Mitton, T. (2002). A cross-firm analysis of the impact of corporate governance on the East Asian
financial crisis. Journal of Financial Economics, 64(2), 215–241.
19. Nelson, K. K., & Pritchard, A. C. (2011). Litigation Risk and Voluntary Disclosure: The Use of
Meaningful Cautionary Language. SSRN Electronic Journal. https://doi.org/10.2139/ssrn.998590
20. Rennekamp, K. (2012). Processing Fluency and Investors’ Reactions to Disclosure Readability.
Journal of Accounting Research, 50(5), 1319–1354. https://doi.org/10.1111/j.1475-
679X.2012.00460.x
21. Shleifer, A., & Vishny, R. W. (1997). A survey of corporate governance. The Journal of Finance,
52(2), 737–783.
22. Smith, J. E., & Smith, N. P. (1971). Readability: A Measure of the Performance of the
Communication Function of Financial Reporting. The Accounting Review, 46(3), 552–561.
https://doi.org/10.2307/244524
23. Tekfi, C. (1987). Readability formulas: An overview. Journal of Documentation.
24. You, H., & Zhang, X. J. (2011). Limited attention and stock price drift following earnings
announcements and 10-K filings. China Finance Review International, 1(4), 358–387.
https://doi.org/10.1108/20441391111167487
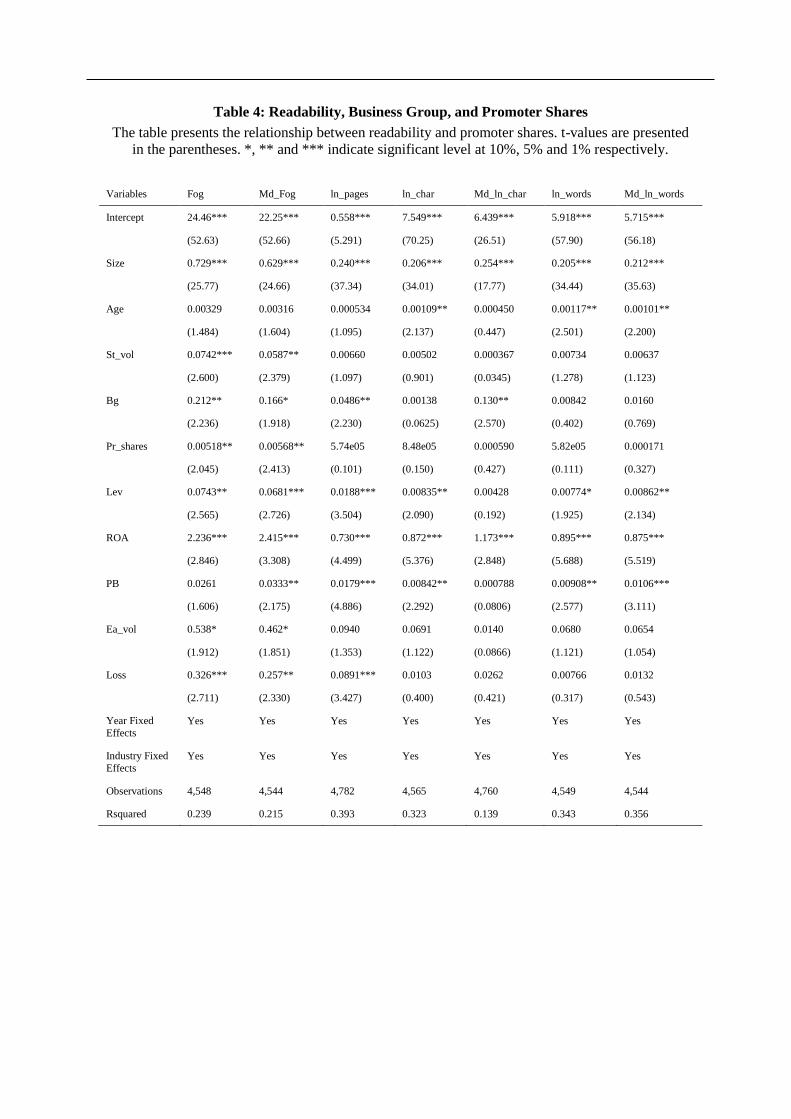
Table 4: Readability, Business Group, and Promoter Shares
The table presents the relationship between readability and promoter shares. t-values are presented
in the parentheses. *, ** and *** indicate significant level at 10%, 5% and 1% respectively.
Variables Fog Md_Fog ln_pages ln_char Md_ln_char ln_words Md_ln_words
Intercept 24.46*** 22.25*** 0.558*** 7.549*** 6.439*** 5.918*** 5.715***
(52.63) (52.66) (5.291) (70.25) (26.51) (57.90) (56.18)
Size 0.729*** 0.629*** 0.240*** 0.206*** 0.254*** 0.205*** 0.212***
(25.77) (24.66) (37.34) (34.01) (17.77) (34.44) (35.63)
Age 0.00329 0.00316 0.000534 0.00109** 0.000450 0.00117** 0.00101**
(1.484) (1.604) (1.095) (2.137) (0.447) (2.501) (2.200)
St_vol 0.0742*** 0.0587** 0.00660 0.00502 0.000367 0.00734 0.00637
(2.600) (2.379) (1.097) (0.901) (0.0345) (1.278) (1.123)
Bg 0.212** 0.166* 0.0486** 0.00138 0.130** 0.00842 0.0160
(2.236) (1.918) (2.230) (0.0625) (2.570) (0.402) (0.769)
Pr_shares 0.00518** 0.00568** 5.74e05 8.48e05 0.000590 5.82e05 0.000171
(2.045) (2.413) (0.101) (0.150) (0.427) (0.111) (0.327)
Lev 0.0743** 0.0681*** 0.0188*** 0.00835** 0.00428 0.00774* 0.00862**
(2.565) (2.726) (3.504) (2.090) (0.192) (1.925) (2.134)
ROA 2.236*** 2.415*** 0.730*** 0.872*** 1.173*** 0.895*** 0.875***
(2.846) (3.308) (4.499) (5.376) (2.848) (5.688) (5.519)
PB 0.0261 0.0333** 0.0179*** 0.00842** 0.000788 0.00908** 0.0106***
(1.606) (2.175) (4.886) (2.292) (0.0806) (2.577) (3.111)
Ea_vol 0.538* 0.462* 0.0940 0.0691 0.0140 0.0680 0.0654
(1.912) (1.851) (1.353) (1.122) (0.0866) (1.121) (1.054)
Loss 0.326*** 0.257** 0.0891*** 0.0103 0.0262 0.00766 0.0132
(2.711) (2.330) (3.427) (0.400) (0.421) (0.317) (0.543)
Year Fixed
Effects Yes Yes Yes Yes Yes Yes Yes
Industry Fixed
Effects Yes Yes Yes Yes Yes Yes Yes
Observations 4,548 4,544 4,782 4,565 4,760 4,549 4,544
Rsquared 0.239 0.215 0.393 0.323 0.139 0.343 0.356
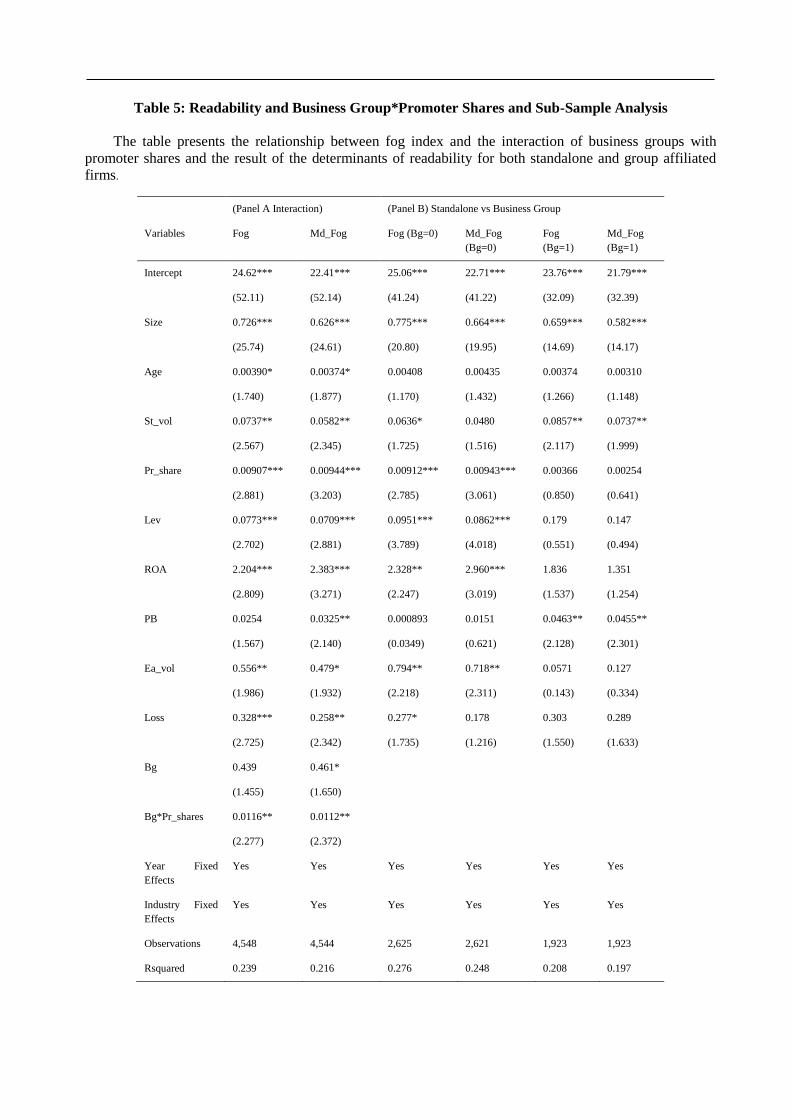
Table 5: Readability and Business Group*Promoter Shares and Sub-Sample Analysis
The table presents the relationship between fog index and the interaction of business groups with
promoter shares and the result of the determinants of readability for both standalone and group affiliated
firms.
(Panel A Interaction) (Panel B) Standalone vs Business Group
Variables Fog Md_Fog Fog (Bg=0) Md_Fog
(Bg=0)
Fog
(Bg=1)
Md_Fog
(Bg=1)
Intercept 24.62*** 22.41*** 25.06*** 22.71*** 23.76*** 21.79***
(52.11) (52.14) (41.24) (41.22) (32.09) (32.39)
Size 0.726*** 0.626*** 0.775*** 0.664*** 0.659*** 0.582***
(25.74) (24.61) (20.80) (19.95) (14.69) (14.17)
Age 0.00390* 0.00374* 0.00408 0.00435 0.00374 0.00310
(1.740) (1.877) (1.170) (1.432) (1.266) (1.148)
St_vol 0.0737** 0.0582** 0.0636* 0.0480 0.0857** 0.0737**
(2.567) (2.345) (1.725) (1.516) (2.117) (1.999)
Pr_share 0.00907*** 0.00944*** 0.00912*** 0.00943*** 0.00366 0.00254
(2.881) (3.203) (2.785) (3.061) (0.850) (0.641)
Lev 0.0773*** 0.0709*** 0.0951*** 0.0862*** 0.179 0.147
(2.702) (2.881) (3.789) (4.018) (0.551) (0.494)
ROA 2.204*** 2.383*** 2.328** 2.960*** 1.836 1.351
(2.809) (3.271) (2.247) (3.019) (1.537) (1.254)
PB 0.0254 0.0325** 0.000893 0.0151 0.0463** 0.0455**
(1.567) (2.140) (0.0349) (0.621) (2.128) (2.301)
Ea_vol 0.556** 0.479* 0.794** 0.718** 0.0571 0.127
(1.986) (1.932) (2.218) (2.311) (0.143) (0.334)
Loss 0.328*** 0.258** 0.277* 0.178 0.303 0.289
(2.725) (2.342) (1.735) (1.216) (1.550) (1.633)
Bg 0.439 0.461*
(1.455) (1.650)
Bg*Pr_shares 0.0116** 0.0112**
(2.277) (2.372)
Year Fixed
Effects
Yes Yes Yes Yes Yes Yes
Industry Fixed
Effects
Yes Yes Yes Yes Yes Yes
Observations 4,548 4,544 2,625 2,621 1,923 1,923
Rsquared 0.239 0.216 0.276 0.248 0.208 0.197
Career Success of Women: Role of Family Responsibilities, Mentoring And
Perceived Organizational Support
Jyoti Chauhan1
Dr. Geeta Mishra2
Dr. Suman Bhakri3
1&2Amity College of Commerce and Finance, Amity University, Noida
3SRCC, University of Delhi, Delhi
Abstract
Women are under-represented at top level positions despite increasing women empowerment, participation
and decelerating gender discrimination in India. Women have to go through various obstacles in order to
reach to senior or top-level positions in their professional life. Since, there are many barriers that a woman
has to go through to get career success this study focuses on the barriers that women face due to
organizational and family barriers. The current research paper aims to test whether lack of mentoring,
perceived organizational support (POS), and family responsibilities impact the perceived career success
(PCS) of women in the Indian IT sector. Data in this regard has been collected using a structured
questionnaire and a total of 292 respondents have been analysed. In order to examine the impact of these
barriers on the perceived career success of women, the method of SEM i.e. Structural Equation Modeling
has been used. Findings of the study reveal that each of the independent variable significantly impacts the
perceived career success of women which works as a wake-up call for women executives that they must
overcome these barriers to advance their career smoothly.
Keywords: Perceived Career Success (PCS), Barriers, Information Technology (IT) sector, Career Success,
Family Responsibilities, Mentoring, Perceived Organizational Support (POS).
Introduction
When one talks about senior managerial positions, the picture that strikes in an individual’s
mind is usually male and the reason behind it is that most of the industries are male-dominated
and in every industry women found at managerial positions are very less as compared to men.
While there is an increase in women's ranks in organizations over the past decade, most of the
organizations are still male-dominated (O'Neil et al., 2008). Scott (2014), stated that women
representation in senior-level positions has been trapped at 24 percent. Schein (2001) stated that
challenges for women in managerial positions exist across the world. Involvement of women in
professional jobs, namely, engineering, technical work, and construction has been low (Fernando
et al., 2014; Powell et al., 2009). As per report of Catalyst (2017), women only held 24 percent of
top managerial positions around the globe in 2016 and one third of businesses do not have any
women at senior level positions, it was also concluded that even by the year 2060, women will not
achieve equality with men.
Indian Context
Gupta et al. (1998), established that when it comes to Indian men, they find themselves more
comfortable in supervising women rather than being supervised by women as it clashes with their
ego. Universally, women capture approximately 10 percent of the top management positions in
Fortune 500 companies (Chadha, 2002). Women's career progression encounters social biases
against them which restrain them from reaching the middle or top-level management (Budhwar et
al., 2005). Database of Directors’ (2007) revealed that only 4.9 percent of the board seats were
held by women in 1993 public companies (Buddhapriya, 2009).
Indian culture and practices acts as the main hurdles hindering women to reach to leadership
positions (Kulkarni, 2002; Desai et al., 2011). According to report of Catalyst (2013), only 15.7
percent of women hold supervisory roles, 18.1 percent of senior positions and 14.8 percent of
board positions, and only 4 percent of executive positions in Fortune 500 companies. In the years
2004 – 2011, India grew at an average rate of approximately 7 percent, however, there was a fall
in the contribution of women in the workforce from 35 percent to 25 percent (ILO Report, 2015).
Bharathi et al. (2015), revealed that the main obstacle that a woman has to go through is
maintaining the work-life balance in IT/ITes sector, and it becomes difficult to balance due to long
working hours, travel time, additional jobs and then feeling guilty for not taking care of children
and elders at home. ILO report states that women acquire less than four percent of top
management positions in BSE 100 companies (The Hindu 2015). The issue is that there are only a
few women found in the board of directors in Indian organizations and women are under-
represented at managerial levels and at decision-making stages (Bhattacharya et al., 2018). In a
study by Rath et al. (2019), preventers to the career advancement of women were identified,
namely, marriage, gender discrimination, Indian culture, and lack of networking and mentoring.
2. Research Gaps and Hypotheses
It has been surprising to find that gender discrimination plays a vital role in the IT sector,
women are usually found at lower or middle-level jobs and the majority of senior and technical
management level jobs are occupied by men. Even in other sectors, women are found to occupy
low paying and unskilled jobs, and out of all working women, 55 percent of women are found to
do the jobs of these categories (Indecon, 2002).This study is done with a purpose to test women’s
perception on every level of management. Majority of the studies done in the past to identify the
barriers to career success of women have been of qualitative nature. In the past, researchers have
conducted interviews to understand and capture the real picture of barriers to career success of
women in any industry. Empirical studies focused on the career success of women have been
limited. Also, Tharenou (1999) disclosed that female executives encounter more barriers in their
career success than male executives. To work on the research gaps, researcher identified the
barriers that impact the career success of women from qualitative studies. Keeping in mind the
same challenges that women have to go through for their career progression, this research has
been carried out using the quantitative methods to identify the impact of those barriers (namely,
family responsibilities, mentoring, and perceived organizational support) on the career success of
women in Indian IT sector.
Hypothesis 1: There is a significant impact of family responsibilities on the perceived career
success of women.
Hypothesis 2: There is a significant impact of mentoring on the perceived career success of
women.
Hypothesis 3: There is a significant impact of perceived organizational support (POS) on the
perceived career success of women.
3. Research Methodology
Present study is entirely focused on working Indian women and the challenges they face in
their career success. Respondents considered for the study has been the women executives
appointed at different roles at different levels of management in Indian IT sector. Data collection
has been done with the help of an online survey. For keeping the study's relevance specific to
women, the questionnaire was floated using Google Forms' link only to the female professionals
of the Indian IT sector and a total of 292 respondents have been taken into consideration for final
analysis. The questionnaire used for the study was divided into two sections. The former section
collected the demographic profile of the respondents, namely, age, marital status, parental status,
number of dependents, the highest degree of qualification, total experience, and managerial
position. Using descriptive frequency analysis, the demographic profile of respondents has been
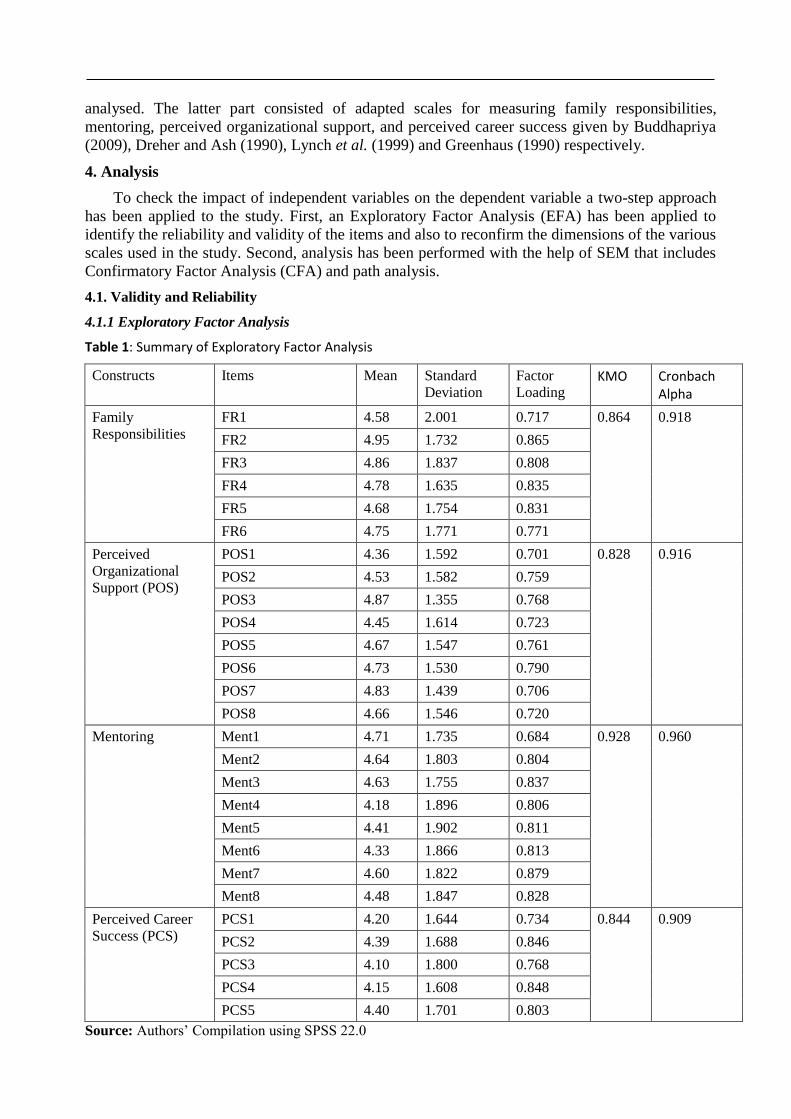
analysed. The latter part consisted of adapted scales for measuring family responsibilities,
mentoring, perceived organizational support, and perceived career success given by Buddhapriya
(2009), Dreher and Ash (1990), Lynch et al. (1999) and Greenhaus (1990) respectively.
4. Analysis
To check the impact of independent variables on the dependent variable a two-step approach
has been applied to the study. First, an Exploratory Factor Analysis (EFA) has been applied to
identify the reliability and validity of the items and also to reconfirm the dimensions of the various
scales used in the study. Second, analysis has been performed with the help of SEM that includes
Confirmatory Factor Analysis (CFA) and path analysis.
4.1. Validity and Reliability
4.1.1 Exploratory Factor Analysis
Table 1: Summary of Exploratory Factor Analysis
Constructs Items Mean Standard
Deviation
Factor
Loading KMO Cronbach
Alpha
Family
Responsibilities
FR1 4.58 2.001 0.717 0.864 0.918
FR2 4.95 1.732 0.865
FR3 4.86 1.837 0.808
FR4 4.78 1.635 0.835
FR5 4.68 1.754 0.831
FR6 4.75 1.771 0.771
Perceived
Organizational
Support (POS)
POS1 4.36 1.592 0.701 0.828 0.916
POS2 4.53 1.582 0.759
POS3 4.87 1.355 0.768
POS4 4.45 1.614 0.723
POS5 4.67 1.547 0.761
POS6 4.73 1.530 0.790
POS7 4.83 1.439 0.706
POS8 4.66 1.546 0.720
Mentoring Ment1 4.71 1.735 0.684 0.928 0.960
Ment2 4.64 1.803 0.804
Ment3 4.63 1.755 0.837
Ment4 4.18 1.896 0.806
Ment5 4.41 1.902 0.811
Ment6 4.33 1.866 0.813
Ment7 4.60 1.822 0.879
Ment8 4.48 1.847 0.828
Perceived Career
Success (PCS)
PCS1 4.20 1.644 0.734 0.844 0.909
PCS2 4.39 1.688 0.846
PCS3 4.10 1.800 0.768
PCS4 4.15 1.608 0.848
PCS5 4.40 1.701 0.803
Source: Authors’ Compilation using SPSS 22.0
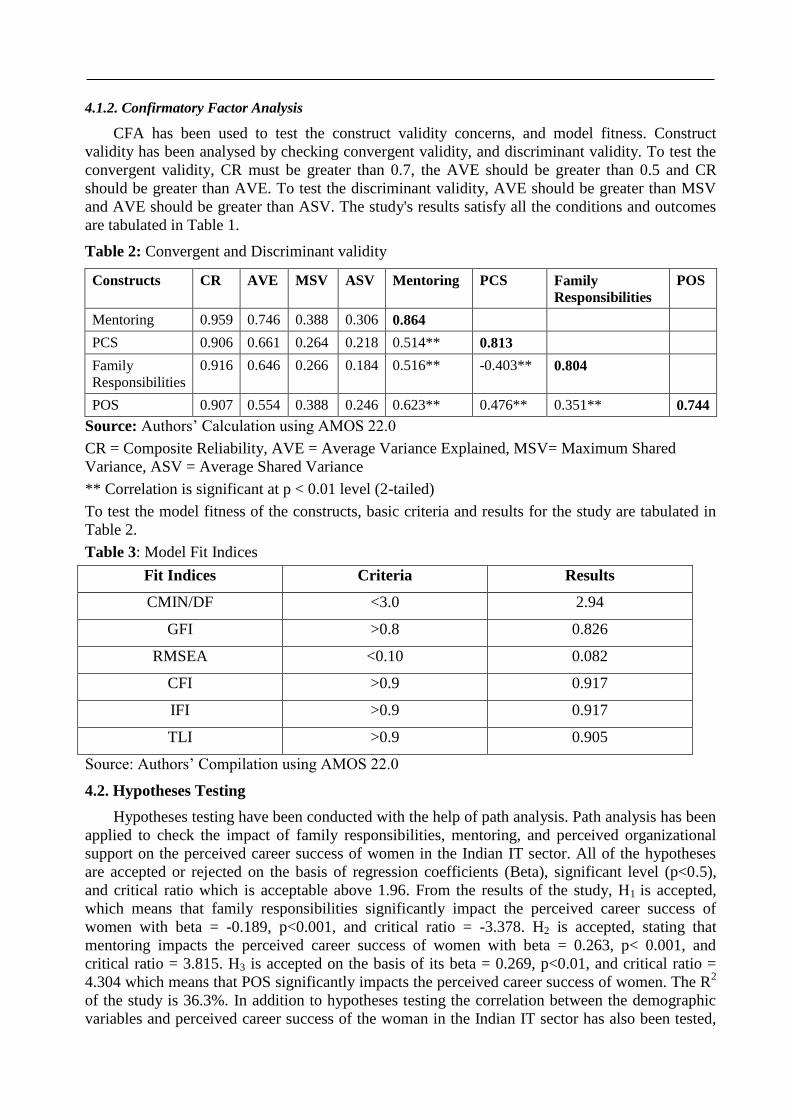
4.1.2. Confirmatory Factor Analysis
CFA has been used to test the construct validity concerns, and model fitness. Construct
validity has been analysed by checking convergent validity, and discriminant validity. To test the
convergent validity, CR must be greater than 0.7, the AVE should be greater than 0.5 and CR
should be greater than AVE. To test the discriminant validity, AVE should be greater than MSV
and AVE should be greater than ASV. The study's results satisfy all the conditions and outcomes
are tabulated in Table 1.
Table 2: Convergent and Discriminant validity
Constructs CR AVE MSV ASV Mentoring PCS Family
Responsibilities
POS
Mentoring 0.959 0.746 0.388 0.306 0.864
PCS 0.906 0.661 0.264 0.218 0.514** 0.813
Family
Responsibilities
0.916 0.646 0.266 0.184 0.516** -0.403** 0.804
POS 0.907 0.554 0.388 0.246 0.623** 0.476** 0.351** 0.744
Source: Authors’ Calculation using AMOS 22.0
CR = Composite Reliability, AVE = Average Variance Explained, MSV= Maximum Shared
Variance, ASV = Average Shared Variance
** Correlation is significant at p < 0.01 level (2-tailed)
To test the model fitness of the constructs, basic criteria and results for the study are tabulated in
Table 2.
Table 3: Model Fit Indices
Fit Indices Criteria Results
CMIN/DF <3.0 2.94
GFI >0.8 0.826
RMSEA <0.10 0.082
CFI >0.9 0.917
IFI >0.9 0.917
TLI >0.9 0.905
Source: Authors’ Compilation using AMOS 22.0
4.2. Hypotheses Testing
Hypotheses testing have been conducted with the help of path analysis. Path analysis has been
applied to check the impact of family responsibilities, mentoring, and perceived organizational
support on the perceived career success of women in the Indian IT sector. All of the hypotheses
are accepted or rejected on the basis of regression coefficients (Beta), significant level (p<0.5),
and critical ratio which is acceptable above 1.96. From the results of the study, H1 is accepted,
which means that family responsibilities significantly impact the perceived career success of
women with beta = -0.189, p<0.001, and critical ratio = -3.378. H2 is accepted, stating that
mentoring impacts the perceived career success of women with beta = 0.263, p< 0.001, and
critical ratio = 3.815. H3 is accepted on the basis of its beta = 0.269, p<0.01, and critical ratio =
4.304 which means that POS significantly impacts the perceived career success of women. The R2
of the study is 36.3%. In addition to hypotheses testing the correlation between the demographic
variables and perceived career success of the woman in the Indian IT sector has also been tested,
this is done in order to check how the demographic profile of women is related to their career
success. The results of the correlation reflected that each of the demographic variable is found to
be significantly correlated with PCS at significance level of 0.05.
5. Conclusion
Firstly, the study analyzed the impact of family responsibilities on the perceived career
success of women. As a result, it has been seen that family responsibilities brings a negative and
significant variance in the perceived career success of women in the Indian IT sector. Secondly,
mentoring is always taken as a positive technique that helps everyone but especially women in
improving their performance and guides them in the right direction to reach to the senior or top-
level management in their career ladder. But lack of mentoring acts like an obstacle to their career
success. In the same way, findings of the present study suggests that when women get enough
amount of mentoring in their career ladder in Indian IT sector, they are more likely to achieve the
career success than the ones who do not receive the same. Thirdly, it has been tested, whether POS
brings a significant variance to the career success of women or not. On the basis of the results, it is
concluded that POS has a positive and significant effect on the perceived career success of women
in the Indian IT industry. An organization has a great role in providing opportunities and support
to its employees that can help them achieve a great height of success in their career and it is said to
be more true about women as they have to go through more barriers in order to achieve their
career success than their male counterpart.
6. Implications of the Study
The results of the study are useful for the Indian IT industry. Women, especially in the IT
sector, have to go through lots of challenges in order to achieve a good career or career success. It
has been seen in the results that mentoring, family responsibilities, and perceived organizational
support all of these 3 barriers impact the perceived career success of the woman in the IT industry
which works as a wake-up call for women executives that they must overcome these barriers to
advance their career smoothly. Every woman understands that she has to play a dual role, as a
responsible family member as well as a responsible employee but they believe that the same roles
should not act as barriers to their career advancement. Therefore, to promote the advancement of
women, a change in the mindset of family, society, and organization is required, such as spousal
support and organizational support can help women in overcoming the barriers to their career
advancement to a good extent.
There is finite literature for women in managerial positions in the IT sector of India. This
study provides and contributes to academic concepts about women’s career progression and the
barriers that they face in their career ladder. Also, by providing HRD executives with the current
scenario it becomes useful and helpful for them, as they can plan and implement their policies and
initiatives accordingly in order to remove or atleast reduce the barriers that come in the way of
women’s career progression. The organization should try to create an environment by providing
them with the support that helps women in their career advancement, such as flexible and part-
time working hours, childcare rooms to manage family and work simultaneously. It is also
suggested to make sure that women executives do not lack mentoring and organizational support.
To make sure of it, women should be provided with the opportunities to receive mentoring and to
mentor as well, keeping in mind that the organizational support does not vary on the basis of the
gender of the employee. These initiatives are also important for each level of management to keep
good talent in the organization.
7. Limitations and Future Scope of the Study
Even after taking all the precautionary measures to keep the relevancy and objectivity of the
study, few limitations have been identified. This study is focussed on Indian IT sector, further it
can be comprehensively tested for various other sectors of India. The proportion of women
working at senior level management has been low in the present study. Other researchers may
work on this point in future studies by involving a higher proportion of women working at senior
or top level management. The study has been limited when it comes to the sample and variables
included. Other researchers can test the same barriers on a larger sample and including various
other barriers like networks, glass ceiling, international assignments and opportunities, gender
discrimination and many more. Also, this study is focussed only on the barriers to career success
of women, in future one can work on the facilitators to the career success of women.
References
1. Bharathi, V., & Bhattacharya, S. (2015). Work life balance of women employees in the information
technology industry. Asian Journal of Management Research, ISSN, 2229-3795.
2. Bhattacharya, S., Bhattacharya, S., & Mohapatra, S. (2018). Enablers for Advancement of Women
into Leadership Position: A Study Based on IT/ITES Sector in India. International Journal of
Human Capital and Information Technology Professionals (IJHCITP), 9(4), 1-22.
3. Buddhapriya, S. (2009). Work-family challenges and their impact on career decisions: A study of
Indian women professionals. Vikalpa, 34(1), 31-46.
4. Budhwar, P. S., Saini, D. S., & Bhatnagar, J. (2005). Women in management in the new economic
environment: The case of India. Asia Pacific Business Review, 11(2), 179-193.
5. Catalyst (2013), available at: www.catalyst.org/knowledge/statistical-overview-women-workplace,
accessed on Jan 8, 2014.
6. Catalyst. (2017). Quick take: Women in management. New York: Catalyst. Retrieved from
http://www.catalyst.org/knowledge/women-management
7. Chadha, R. (2002) Of Mars and Venus, Businessline. Available at
http://proquest.umi.com/pqdweb?Did ¼ 0000000270062871&Fmt
8. Fernando, N. G., Amaratunga, D., & Haigh, R. (2014). The career advancement of the professional
women in the UK construction industry. Journal of Engineering, Design and Technology, 12 (1),
53-70.
9. Desai, M., Majumdar, B., Chakraborty, T., & Ghosh, K. (2011). The second shift: working women
in India. Gender in Management: An International Journal, 26(6), 432-450.
10. Gupta, A., Koshal, M., & Koshal, R. K. (1998). Women managers in India: Challenges and
opportunities. Equal Opportunities International, 17(8), 14-26.
11. ILO Report (2015). As India economy grows, female participation in work force declines.available
at http://www.hindustantimes.com/business/as-india-economy grows-female-participation-in-work-
force-declines-ilo/story-pGjf3zWf0VpnWfevajMUsM.
12. Indecon (2002), Study of the Gender Pay Gap at Sectoral Level in Ireland, Indecon International
Economic Consultants, Dublin.
13. Kulkarni, S. S. (2002). Women and professional competency–a survey report. Indian Journal of
Training and Development, 32(2), 11-16.
14. O’Neil, D. A., Hopkins, M. M., & Bilimoria, D. (2008). Women’s careers at the start of the 21st
century: Patterns and paradoxes. Journal of Business Ethics, 80(4), 727-743.
15. Powell, A., Hassan, T. M., Dainty, A. R., & Carter, C. (2009). Note: Exploring gender differences
in construction research: a European perspective. Construction Management and Economics, 27(9),
803-807.
16. Rath, T. S., Mohanty, M., & Pradhan, B. B. (2019). An alternative career progression model for
Indian women bank managers: A labyrinth approach. In Women's Studies International
Forum (Vol. 73, pp. 24-34). Pergamon.
17. Schein, V. E. (2001). A global look at psychological barriers to women's progress in
management. Journal of Social issues, 57(4), 675-688.
18. Scott, M. E. (2014). Number of women in senior management stagnant at 24%. Retrieved from:
http://forbes.com/sites/forbesasia/2014/03/06/number-of-women-in-senior-management-stagnant
at-24/
19. Tharenou, P., (1999). Gender differences in advancing to the top. International Journal of
Management Reviews, 1(2), pp.111-132.

20. The Hindu (2015) Women Make Only Four Per Cent of Top BSE 100 Executives: ILO Report, The
Hindu, PT, 14 January, pp.16A.
Reinvigorating Green Bond as an Alternative Energy Investment amidst
Foreseeable Funding Crisis due to the Great Lockdown
Suvajit Banerjee1
Spandan Chowdhury2
1 Vidya-Bhavana, Visva-Bharati University, Santiniketan, West Bengal
2 Reserve Bank of India, Kolkata
Abstract
The Great Lockdown due to the outbreak of COVID-19 pandemic has exasperated the prevailing situation
beyond a mere health crisis and its economic impact is anticipated to be risking the prospect of the
sustainability of the energy sector. Conducting a time-series analysis with five major countries, chosen in
terms of their renewable-energy consumption and issuance of the green bond, this study imprecates that the
lockdown would severely harm the investments in renewable energy, whereas, the long-term asset
financing is less vulnerable to economic slowdowns compared to the gross investment. The study
represents Green Bond as a rapidly growing long-term financial instrument for the private investors and
capable of absorbing macroeconomic disturbances, hence, more propitious as a rescuer for the renewable
energy sector for the future.
Key-words: Great Lockdown; Energy Investment; Renewable Energy; Green Bond; Time Series
Econometrics; Long-term Asset Financing
1. Introduction
According to a scenario-based projection of the World Energy Outlook (IEA 2018), under the
current policies scenario, the global energy demand will grow by more than 25 per cent in 2040
from the 2018 level, which would require an annual average investment of more than USD 2
billion to satisfy this demand. In the face of growing concerns and commitments to reduce the
energy-related carbon emissions, the sector of renewable energies is expected to become the most
important source and would meet almost half of this increased energy demand (BP Energy
Outlook 2019).
The entire world is presently experiencing an exceptional situation stemming from the
outbreak of the Corona Virus that led to a public health crisis all over the globe. To contain the
spread of this infection, the maximum number of countries are maintaining lighter to stricter forms
of prolonged lockdown measures to avoid and restrict the social contamination, such that these
unprecedented restrictions are hammering on the macroeconomic spontaneity all across the globe.
In these circumstances, this present research is based on the foreknowledge on the prospect of
investment for the clean energy and other climate initiatives. The world may find the pandemic-
stricken developed countries concentrating their priorities into reviving national economies and
the policies with emission-reduction efforts to finance the climate development projects both in
their homeland and in developing countries could be side-lined such that the flow of investment
for the growth of clean energy generation capacity is expected to be hugely disrupted. In a forecast
for the period of 2019 to 2024, by the International Energy Agency (IEA), several months before
the announcement of the Pandemic by the WHO, the year 2020 has been described as an excellent
year for the renewable electricity additions, such that the global installations of solar PV and wind
turbines were expected to outpace 2018 level by more than 20 % through the rapid expansion of
capacities in China, the EU, the USA and India (IEA 2019). However, the pandemic shock not
only dismantled the supply chain of environmental goods and instruments, but also slowed down
the construction activity of the renewable energy generation projects, which is alarmingly
derailing the progress in the clean energy sector (Bahar 2020).
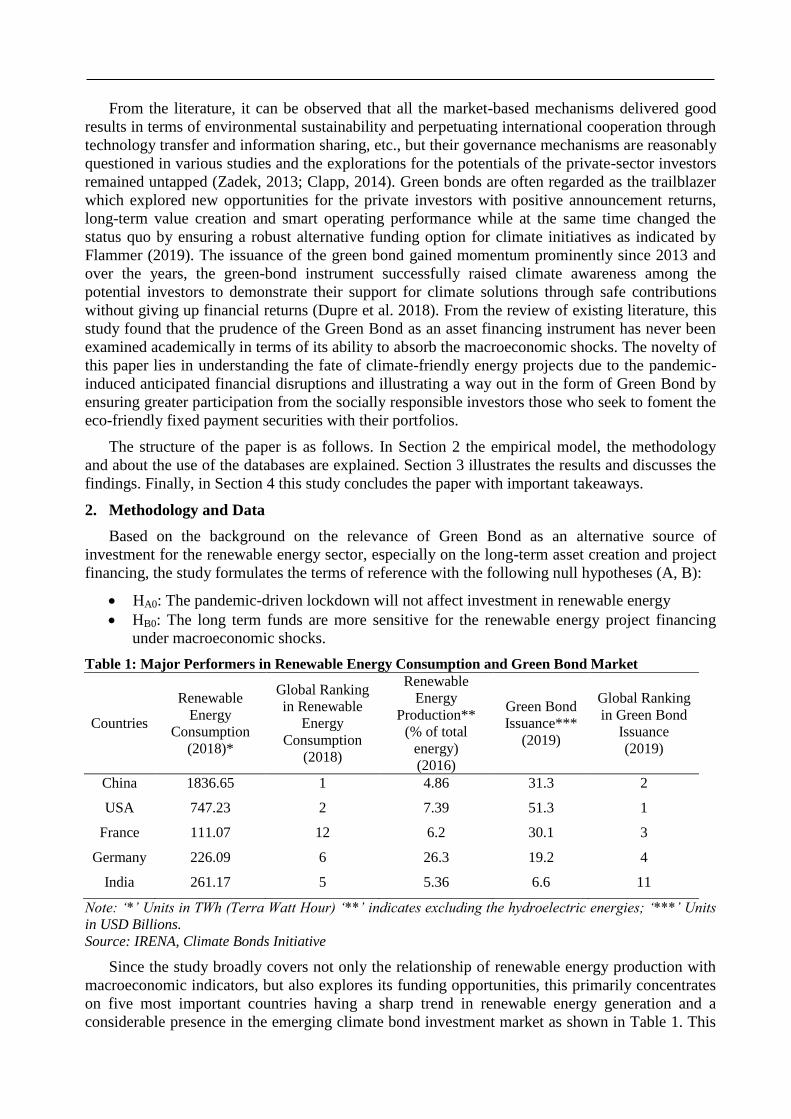
From the literature, it can be observed that all the market-based mechanisms delivered good
results in terms of environmental sustainability and perpetuating international cooperation through
technology transfer and information sharing, etc., but their governance mechanisms are reasonably
questioned in various studies and the explorations for the potentials of the private-sector investors
remained untapped (Zadek, 2013; Clapp, 2014). Green bonds are often regarded as the trailblazer
which explored new opportunities for the private investors with positive announcement returns,
long-term value creation and smart operating performance while at the same time changed the
status quo by ensuring a robust alternative funding option for climate initiatives as indicated by
Flammer (2019). The issuance of the green bond gained momentum prominently since 2013 and
over the years, the green-bond instrument successfully raised climate awareness among the
potential investors to demonstrate their support for climate solutions through safe contributions
without giving up financial returns (Dupre et al. 2018). From the review of existing literature, this
study found that the prudence of the Green Bond as an asset financing instrument has never been
examined academically in terms of its ability to absorb the macroeconomic shocks. The novelty of
this paper lies in understanding the fate of climate-friendly energy projects due to the pandemic-
induced anticipated financial disruptions and illustrating a way out in the form of Green Bond by
ensuring greater participation from the socially responsible investors those who seek to foment the
eco-friendly fixed payment securities with their portfolios.
The structure of the paper is as follows. In Section 2 the empirical model, the methodology
and about the use of the databases are explained. Section 3 illustrates the results and discusses the
findings. Finally, in Section 4 this study concludes the paper with important takeaways.
2. Methodology and Data
Based on the background on the relevance of Green Bond as an alternative source of
investment for the renewable energy sector, especially on the long-term asset creation and project
financing, the study formulates the terms of reference with the following null hypotheses (A, B):
HA0: The pandemic-driven lockdown will not affect investment in renewable energy
HB0: The long term funds are more sensitive for the renewable energy project financing
under macroeconomic shocks.
Table 1: Major Performers in Renewable Energy Consumption and Green Bond Market
Countries
Renewable
Energy
Consumption
(2018)*
Global Ranking
in Renewable
Energy
Consumption
(2018)
Renewable
Energy
Production**
(% of total
energy)
(2016)
Green Bond
Issuance***
(2019)
Global Ranking
in Green Bond
Issuance
(2019)
China 1836.65 1 4.86 31.3 2
USA 747.23 2 7.39 51.3 1
France 111.07 12 6.2 30.1 3
Germany 226.09 6 26.3 19.2 4
India 261.17 5 5.36 6.6 11
Note: ‘*’ Units in TWh (Terra Watt Hour) ‘**’ indicates excluding the hydroelectric energies; ‘***’ Units
in USD Billions.
Source: IRENA, Climate Bonds Initiative
Since the study broadly covers not only the relationship of renewable energy production with
macroeconomic indicators, but also explores its funding opportunities, this primarily concentrates
on five most important countries having a sharp trend in renewable energy generation and a
considerable presence in the emerging climate bond investment market as shown in Table 1. This
table is showing that the USA, China, France and Germany ranks the top four positions in terms of
global ranking in Green Bond issuance, whereas India ranks only 11th
. However, as per the
consumption of renewable energies, India ranks 5th
, while China and the USA ranks first and
second respectively.
2.1. Testing the First Hypothesis
To test the first hypothesis, this study frames the contribution of renewable energy as a
percentage of total energy generation, the GDP growth rate and the cost of capital measured in
terms of easy lending rates (LR) in a time-series structure as shown in equation (1) and equation
(2) below, which depict the renewable energy variable by excluding and including the
hydroelectric energy ( and ) respectively. In this course of analysis, the study first
checks the non-stationarity of the underlying variables for all the five countries mentioned in
Table 1 by applying the Augmented Dickey-Fuller (ADF) unit-root test. After the unit-root tests,
this study conducts the Johansen cointegration test discussed by Johansen (1988) and Johansen
and Juselius (1990). The Vector Autoregression (VAR) procedure, under this Johansen test,
allows simultaneous evaluation of multiple relationships and imposes no prior restrictions on the
cointegration space. The basic Vector Auto Regressions (VARs), of order p based on the present
multivariate models are as follows:
(1)
(2)
Here, and are the k-vectors of non-stationary I(1) variables, and are the d-
vectors of deterministic variables and εt are the vectors of innovations.
As this study embarked on ascertaining the possible relationship between the variables, the
pair-wise Granger causality test is conducted to examine the causal directions (Granger 1969).
However, the Granger causality assumes only the precedence of the past value of one time series
to predict the future value of another time series but does not by itself indicate causality in the
more common use of the term. Once any said variables found to Granger-cause another variable,
this study performs the VAR lag exclusion test to assess the importance of the VAR lag order for
representing the variables. For each lag, the χ2 (Wald) statistics for the joint significance of all
endogenous variables at that lag are checked for each equation separately and jointly. Once the lag
orders are identified with relevant significance, this study reveals the relationships among
variables. To make the analysis robust, this study ventures into finding structural break with Chow
Breakpoint test, if any, in the dependent variable.
2.2. Testing the Second Hypothesis
While testing the second hypothesis, this study considers two variables, namely the total
investment in renewable energy ( ) and the long-term asset financing within the total
investment in renewable energy ( ). The study initially checks the presence of unit root by
ADF test and subsequently tests the possibility of autocorrelation separately among the variables.
Therefore, the study estimates the variables, INV and ASSET separately with simple first order
autoregression equations as follows:
(3)
(4)
The paper tests the variables with structural breaks by applying the Chow Breakpoint test.
The idea of the Chow breakpoint test is to fit the equation separately for each subsample and to
see whether there are significant differences in the estimated equations. A significant difference
indicates a structural change in the relationship and reveals the pattern of responsiveness of the
variable against exogenous events which may influence its value. Since this study is trying to
understand the credibility of the Green Bond as an alternative asset financing instrument for
investment in renewable energy during the expected foreseeable financial crunch, the detection of
the structural break, in the absence of long time-series data points, exposes the consistency and
strength to absorb exogenous shocks and helps to analyse the impacts of the COVID-19 pandemic
in the best possible way.
2.3. Source of Data
The primary data of renewable energy production and consumption with its contribution to
total energy share is obtained from the CEIC Insights database and open access statistics of the
International Renewable Energy Agency. GDP growth and lending rate data are collected from
the World Bank open data source. The investment data on renewable energy is collected from the
International Renewable Energy Agency investment database. The labelled Green Bond and
certified issuance data are picked up from the Climate Bonds Initiative data library.
3. Results and Discussions
3.1. Economic Growth, Cost of Capital and Renewable Energy
The results from the unit root test reveal that all the underlying variables of equations (1) and
(2) are integrated with the same order at I(1) level and significantly confirmed the non-stationarity
of the time series. The Johansen Cointegration test reveals one or multiple cointegrating equations
for all the five countries at highly significant 5 per cent level. For the USA, France, Germany and
India both the Trace and Maximum Eigen Value Rank Test confirms the presence of one
cointegrating equation, whereas in the case of China the presence of cointegrating equation found
three and one respectively. Hence, this can be said that the linear combinations of the underlying
variables for all these five countries are capable of generating stationarity and postulating a long-
run equilibrium relationship. After confirming the long-run relationship, the study tests for the
predictive causality among the underlying variables using the pair-wise Granger Causality test that
found the GDP growth rate Granger-causes the REN (and RENH) for the USA and Germany at 5
% significant level, whereas for China and India at 10 % significant level. Therefore, the test
results signify bidirectional causality for the USA and unidirectional causality for China, India and
Germany.
With the VAR analysis, the study found the variables significant up to second-order lag. Lag-
exclusion Wald test justifies the significance of the lag orders in the said multivariate model
signifying the relevance of the model in forecasting the future results. For the USA, India and
Germany, the lag orders 1 and 2 are found significant at 2 per cent level whereas lag order 1 is
found significant for China and France. These tests establish the relevance of GDP growth and
lending rates on the growth potential of renewable energy backed by sustainable investment in this
sector with easy credit availability. This evidence of a strong dependence for all the key
economies has resulted in prima facie rejection of the first null hypothesis of the study which
states that the pandemic driven lockdown will not affect investment in renewable energy.
3.2. Reinstating Global Lockdown with Structural Break and Renewable Energy
To test the consistency of the dependence of investment in renewable energy on the decisive
macroeconomic indicators namely GDP growth and cost of credit (easy lending rate), the study
reiterates the fact that major global macroeconomic shocks may impact on the investment in green
energy. Considering the global recession and decelerated economic trend in and around the year
2008, the study performs the Chow Breakpoint test and the structural break-point locations are
established for the USA, China, India and Germany in 2008, 2009, 2009 and 2007 respectively.
The study verifies the significance of the break by incorporating a dummy variable (DUM)
considering its pre and post break values as 0 and 1 respectively. These dummy variables are
found significant at the 5 % level for the USA, Germany and China whereas at 6 % level for India.
Therefore, the results from the Chow Breakpoint test, followed by the evidence of the significance
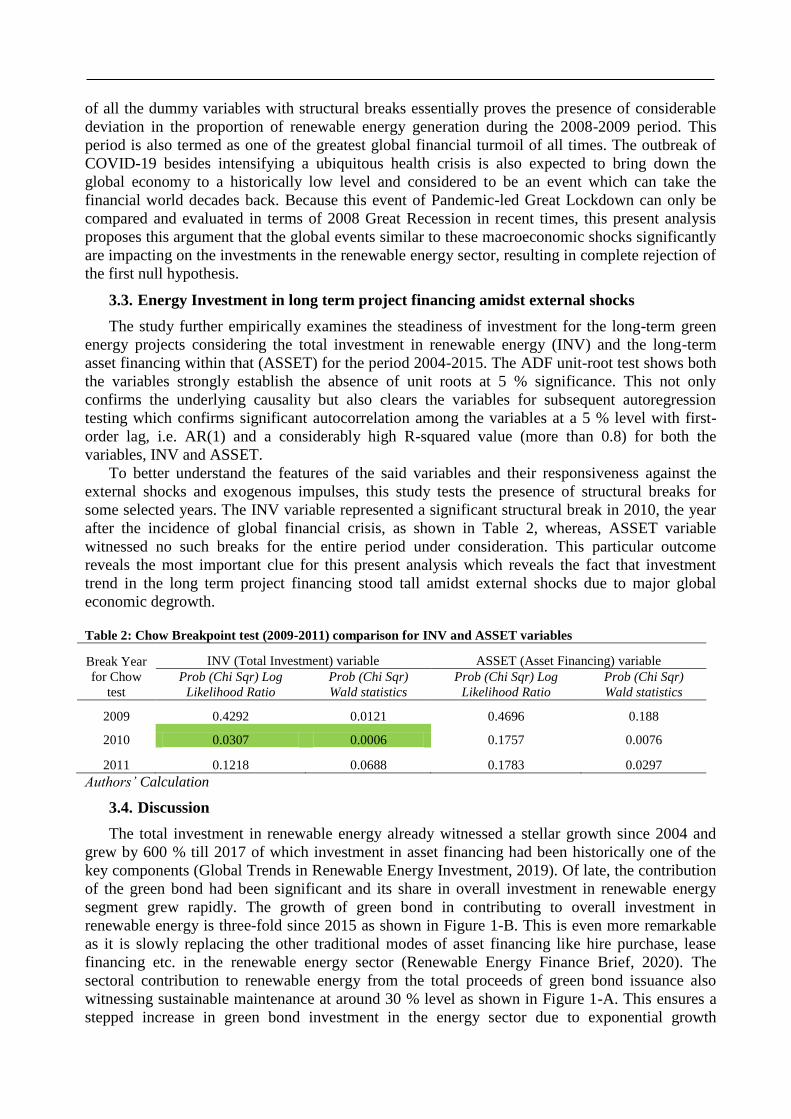
of all the dummy variables with structural breaks essentially proves the presence of considerable
deviation in the proportion of renewable energy generation during the 2008-2009 period. This
period is also termed as one of the greatest global financial turmoil of all times. The outbreak of
COVID-19 besides intensifying a ubiquitous health crisis is also expected to bring down the
global economy to a historically low level and considered to be an event which can take the
financial world decades back. Because this event of Pandemic-led Great Lockdown can only be
compared and evaluated in terms of 2008 Great Recession in recent times, this present analysis
proposes this argument that the global events similar to these macroeconomic shocks significantly
are impacting on the investments in the renewable energy sector, resulting in complete rejection of
the first null hypothesis.
3.3. Energy Investment in long term project financing amidst external shocks
The study further empirically examines the steadiness of investment for the long-term green
energy projects considering the total investment in renewable energy (INV) and the long-term
asset financing within that (ASSET) for the period 2004-2015. The ADF unit-root test shows both
the variables strongly establish the absence of unit roots at 5 % significance. This not only
confirms the underlying causality but also clears the variables for subsequent autoregression
testing which confirms significant autocorrelation among the variables at a 5 % level with first-
order lag, i.e. AR(1) and a considerably high R-squared value (more than 0.8) for both the
variables, INV and ASSET.
To better understand the features of the said variables and their responsiveness against the
external shocks and exogenous impulses, this study tests the presence of structural breaks for
some selected years. The INV variable represented a significant structural break in 2010, the year
after the incidence of global financial crisis, as shown in Table 2, whereas, ASSET variable
witnessed no such breaks for the entire period under consideration. This particular outcome
reveals the most important clue for this present analysis which reveals the fact that investment
trend in the long term project financing stood tall amidst external shocks due to major global
economic degrowth.
Table 2: Chow Breakpoint test (2009-2011) comparison for INV and ASSET variables
Break Year
for Chow
test
INV (Total Investment) variable ASSET (Asset Financing) variable
Prob (Chi Sqr) Log
Likelihood Ratio
Prob (Chi Sqr)
Wald statistics
Prob (Chi Sqr) Log
Likelihood Ratio
Prob (Chi Sqr)
Wald statistics
2009 0.4292 0.0121 0.4696 0.188
2010 0.0307 0.0006 0.1757 0.0076
2011 0.1218 0.0688 0.1783 0.0297
Authors’ Calculation
3.4. Discussion
The total investment in renewable energy already witnessed a stellar growth since 2004 and
grew by 600 % till 2017 of which investment in asset financing had been historically one of the
key components (Global Trends in Renewable Energy Investment, 2019). Of late, the contribution
of the green bond had been significant and its share in overall investment in renewable energy
segment grew rapidly. The growth of green bond in contributing to overall investment in
renewable energy is three-fold since 2015 as shown in Figure 1-B. This is even more remarkable
as it is slowly replacing the other traditional modes of asset financing like hire purchase, lease
financing etc. in the renewable energy sector (Renewable Energy Finance Brief, 2020). The
sectoral contribution to renewable energy from the total proceeds of green bond issuance also
witnessing sustainable maintenance at around 30 % level as shown in Figure 1-A. This ensures a
stepped increase in green bond investment in the energy sector due to exponential growth
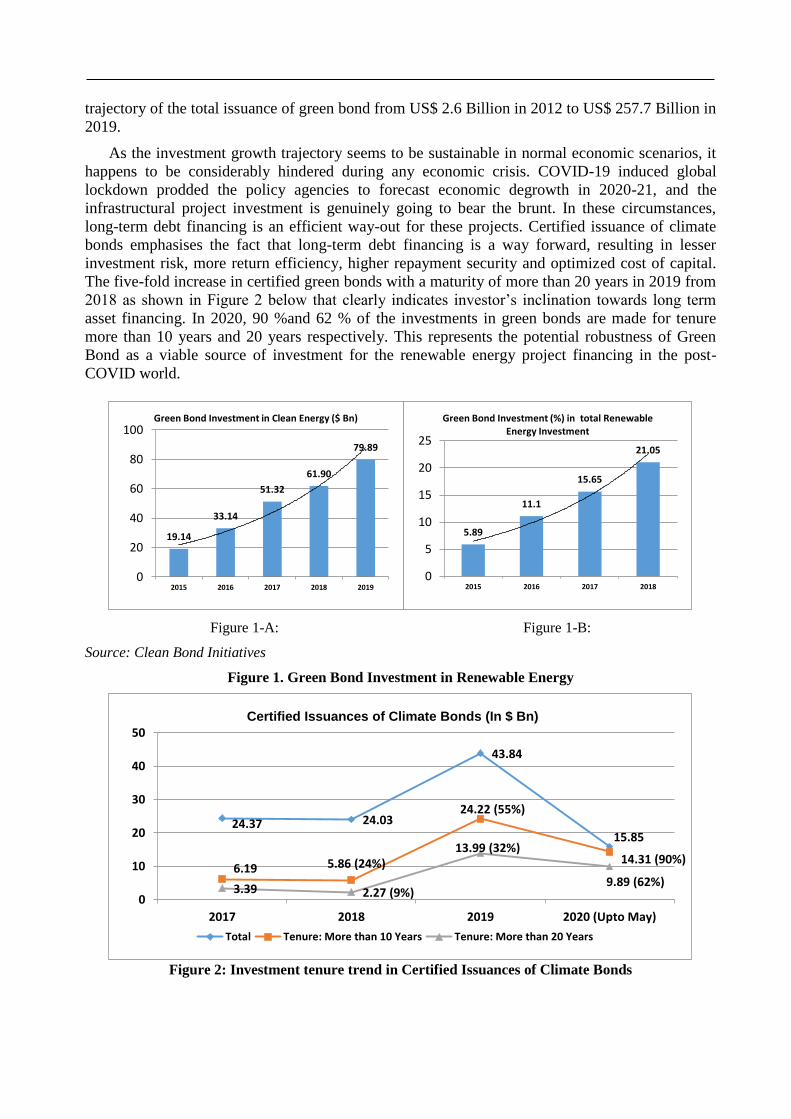
trajectory of the total issuance of green bond from US$ 2.6 Billion in 2012 to US$ 257.7 Billion in
2019.
As the investment growth trajectory seems to be sustainable in normal economic scenarios, it
happens to be considerably hindered during any economic crisis. COVID-19 induced global
lockdown prodded the policy agencies to forecast economic degrowth in 2020-21, and the
infrastructural project investment is genuinely going to bear the brunt. In these circumstances,
long-term debt financing is an efficient way-out for these projects. Certified issuance of climate
bonds emphasises the fact that long-term debt financing is a way forward, resulting in lesser
investment risk, more return efficiency, higher repayment security and optimized cost of capital.
The five-fold increase in certified green bonds with a maturity of more than 20 years in 2019 from
2018 as shown in Figure 2 below that clearly indicates investor’s inclination towards long term
asset financing. In 2020, 90 %and 62 % of the investments in green bonds are made for tenure
more than 10 years and 20 years respectively. This represents the potential robustness of Green
Bond as a viable source of investment for the renewable energy project financing in the post-
COVID world.
Figure 1-A: Figure 1-B:
Source: Clean Bond Initiatives
Figure 1. Green Bond Investment in Renewable Energy
Figure 2: Investment tenure trend in Certified Issuances of Climate Bonds
19.14
33.14
51.32
61.90
79.89
0
20
40
60
80
100
2015 2016 2017 2018 2019
Green Bond Investment in Clean Energy ($ Bn)
5.89
11.1
15.65
21.05
0
5
10
15
20
25
2015 2016 2017 2018
Green Bond Investment (%) in total Renewable Energy Investment
24.37 24.03
43.84
15.85
6.19 5.86 (24%)
24.22 (55%)
14.31 (90%)
3.39 2.27 (9%)
13.99 (32%)
9.89 (62%)
0
10
20
30
40
50
2017 2018 2019 2020 (Upto May)
Total Tenure: More than 10 Years Tenure: More than 20 Years
Certified Issuances of Climate Bonds (In $ Bn)
4. Conclusion
The paper aimed at studying the impact of the Great Lockdown across the globe on the
renewable energy generation and it subsequently motivates further researches that may intend to
unveil the effectiveness of the Green Bond as an alternative investment medium to contribute in
the area of generations and distributions of green energy. The analysis done in this paper divulges
a wide range of factors in financing renewable energy that includes, inter alia, the correlation of
investment potential with proportionate production in renewable energy, the trend in investment in
renewable energy with structural breaks, the steep growth of investment in the green energy
sector, both in terms of volume and share in total green bond issuance and the exponentially
increasing trend of investing through long-term debt financing in renewable energy projects. The
gradual shift in investment trend in green energy towards climate bonds found more prominent in
the recent years which again promulgates its popularity and acceptance among the potential
investors. Therefore, this study reiterates the importance of Green Bond as a saviour for the
investments in renewable energy projects for a sustainable future.
References
1. Bahar, H. (2020). The Corona Virus Pandemic could derail Renewable Energy’s Progress:
Governments can help. International Energy Agency.
2. British Petroleum Energy Outlook (2019). BP Energy Outlook: 2019 Edition. London. Web:
https://www.bp.com/content/dam/bp/business-sites/en/global/corporate/pdfs/energy-
economics/energy-outlook/bp-energy-outlook-2019.pdf (Accessed on 04.05.2020)
3. Clapp, C. (2014). Climate finance: capitalising on green investment trends. In The Way Forward in
International Climate Policy: Key Issues and New Ideas 2014, Ed(s). Heleen de Coninck, Richard
Lorch and Ambuj D. Sagar, Climate Strategies, 44-48. London.
4. Climate Bond Initiative (2019). 2019 Green Bond Market Summary. London. Web:
https://www.climatebonds.net/resources/reports/2019-green-bond-market-summary (Accessed on
04.05.2020)
5. Dupree, S., Posey, T., Wang, T. & Jamison, T. (2018) Shooting for the Moon in a hot air balloon?:
Measuring how green bonds contribute to scaling up investments in green projects (Paris: 2°
Investing Initiative)
6. Global Trends in Renewable Energy Investment (2019). Frankfurt School-UNEP Centre/BNEF.
2019.
7. IEA (2019), Renewables 2019, IEA, Paris https://www.iea.org/reports/renewables-2019
8. International Energy Agency (2018). World Energy Outlook 2018, IEA, Paris
https://www.iea.org/reports/world-energy-outlook-2018 (Accessed on 04.05.2020)
9. International Energy Agency (2020). Global Energy Review, IEA, Paris
https://www.iea.org/reports/global-energy-review-2020
10. Zadek, S. (2013) ‘Beyond climate fi nance: from accountability to productivity in addressing the
climate challenge’, in E. Haites (ed.), International climate finance. Abingdon: Routledge.
Nature of Internal Labor Migration in India: Do Education and
Digitalization Matter
Sana Tabassum
1
Prof. Leena Mary Eapen2
1&2Indian Institute of Management Kozhikode
Abstract
Migration is a temporary or permanent change of residence within a country or across borders. The
inclusion of Migration as a Sustainable Development Goal (SDGs) has established the fact that migration
has garnered attention from all over the world. International Migrants are no doubt a bone of contention at
the global level; internal migration is far more significant as they are estimated to be four times as many as
the international migrants (UNDP,2009).The study finds that there is a steady decline in out-migration and
recently internal migration of degree holders rise in comparison to less educated ones who migrate earlier.
The study also shed light on the fact that ICT development in the state has no significant impact on out-
migration.
Key Words: - ICT, education, internal migration, Kerala
Introduction
The term migration creates visions of heroic movements of the human population over long
distances in the quest for a good life. Migrant moves across an international border or within a
country itself to settle down permanently or temporarily (IOM,2004). The forces driving migration
are search for economic opportunities, better academic prospects, fleeing from conflict and
climate change disasters being the significant drivers of migration. International migration is
recognized as a global phenomenon with the publication of World Migration Reports by the
International Organization on Migration (IOM), a UN wing on Migration. The World Migration
Report 2020, estimated 150 million international migrants in the year 2000 and this number has
grown by 81.3percent to 272 million in the last two decades with international migrants
accounting for 3.5percent of the world’s population in 2019 (IOM,2020). The World Migration
Report 2020 throws light on key features of international migration. High Income countries are
home to two-thirds of international migrants in 2019 (IOM,2020). Asian and European countries
are the most preferred destinations of migration that host 61 percent of international between 2005
and 2019. USA, Germany, Saudi Arabia, the Russian Federation, and the United Kingdom are the
top five preferred destinations of migration. The South Asian countries of India, Pakistan,
Bangladesh, and Afghanistan account for a whopping 40 percent or 112 million international
migrants in 2019.
The Indian subcontinent bagged the first position with a total of 17.6 million international
migrants in 2019 (IOM,2020). Remittance data shows that India has consistently been the top
receiver of international migrants since the year 2010 and remittances have increased by 47
percent in the last decade (IOM,2020). India is not just the world leader in international migrants;
internal migrants in India are also equally important. Internal migrants in the year 2011 are 454
million, with a considerable increase of 45 percent over 309 million migrants in the year
2001(Census,2011)
Trends and Pattern of Internal Migration in India
One-third of the Indian population are internal migrants. The National Sample Survey
Organization (NSSO) is a government agency entrusted with the responsibility of conducting
household surveys across the country. The NSSO estimates reveal a steady increase in internal
migration from 24.8 percent in 1992-93 to 28.5 percent in 2007-08. The last published report of
NSSO corresponds to the year 2007-08. These estimates suggest that internal migration has been
continuously increasing and the pace of increase is high (Rajan and Sumeetha,2020). The growth
rate of internal migrants doubled during the decade of 2001-2011 at 4.5 percent as compared to
the previous decade estimates of 2.4 percent during the period 1991- 2001(Economic
Survey,2016). Table 1 shows category wise migration rates in India from 1983 to 2007. Both rural
and urban total migration has been steadily increasing except in the 49th
round (1993) as both
migration rates show a downward trend. However, rural and urban male migration shows a
consistent declining trend during 1983-2007. On the other hand, both rural and urban women
migration shows increasing trends except during 1993 that shows a fall in urban women migration
Table 1: Category wise Migration Rates in India
All India NSSO Rounds Rural Urban
Male Female Total Male Female Total
38th(January- December 1983) 7.2 35.1 20.9 27 36.6 31.6
43rd (July 1987-June 1988) 7.4 39.8 23.2 26.8 39.6 32.9
49th (January-June 1993) 6.5 40.1 22.8 23.9 38.2 30.7
55th (July 1999-June 2000) 6.9 42.6 24.4 25.7 41.8 33.4
64th July 2007-June 2008) 5.4 47.7 26.1 25.9 45.6 35.4
(Source: Malhotra and Devi, 2017)
Thus, it is evident that internal migration patterns differ concerning gender and the rural-urban
classification and female migration has been showing an upward trend since the first round of the
survey. The State Wise Migration Rates shed light on the fact that the top five out-migration states
of India are Uttar Pradesh, Maharashtra, Kerala, Sikkim, and Punjab (see Table 2). The primary
destination states are Delhi, Maharashtra, Tamil Nadu, Gujarat, Andhra Pradesh, and Kerala
(Economic Survey, 2016). Kerala had always been the hub of emigration which had resulted in a
shortage of labor force. This mismatch converted Kerala into an attractive state for internal
migrants from other states (Rajan and Mishra, 2018). As per the NSSO data Mumbai, Chennai,
and other metropolitan cities being the most preferred migration destinations (Rajan and
Sumeetha, 2020). In terms of demographics, internal migrants are mostly youth leaving their place
of residence in search of better livelihood. The role of gender is also gaining momentum in terms
of migration as the feminization of labor continues. There is an increasing share of women on the
move owing to better awareness and women empowerment (Rajan and Sumeetha, 2020).
Literature Review
Based on the literature, different factors are responsible for facilitating migration. The
prominent theory of migration that throws light on the determinants of migration is Lee’s Push-
Pull Theory. According to this theory, the negative factors that force people to leave their origin
states are the push factors, and the positive aspects that lure people to migrate to host states are the
pull factors (Lee,1966). In other words, push factors are those that compel a person to leave the
place and look for new places to settle, and pull factors are those that encourage people to migrate
(Lee,1966).
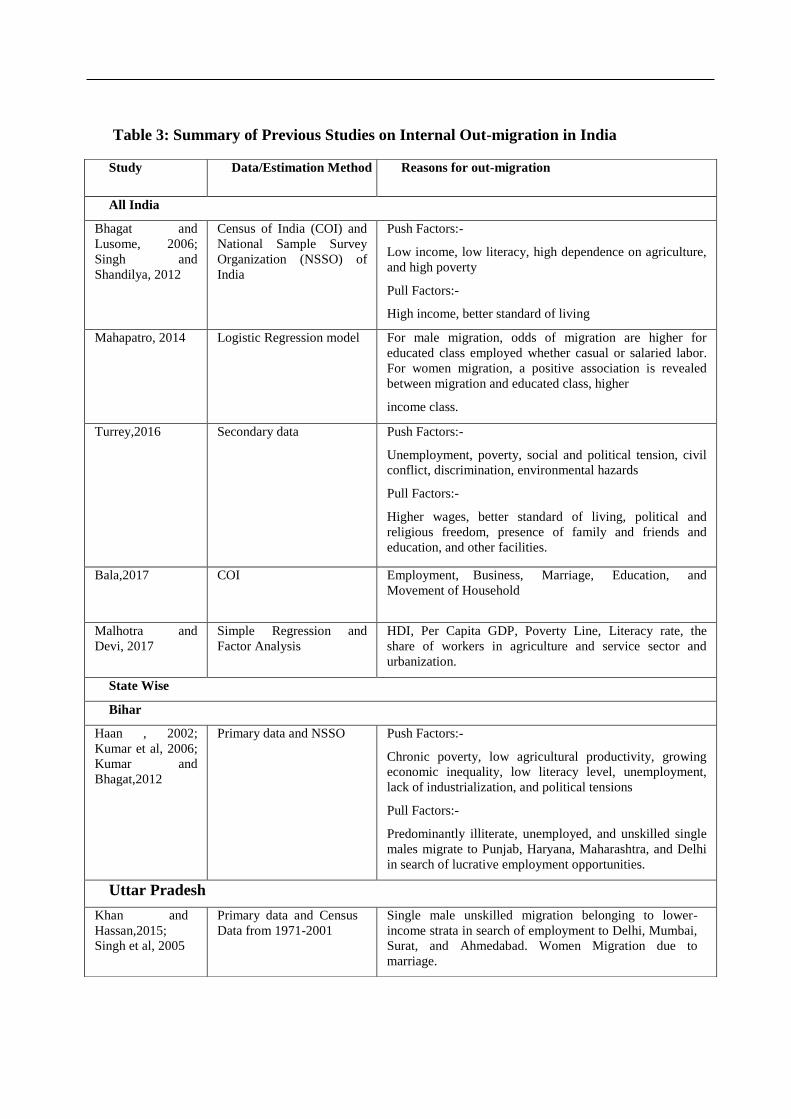
Table 3: Summary of Previous Studies on Internal Out-migration in India
Study Data/Estimation Method Reasons for out-migration
All India
Bhagat and
Lusome, 2006;
Singh and
Shandilya, 2012
Census of India (COI) and
National Sample Survey
Organization (NSSO) of
India
Push Factors:-
Low income, low literacy, high dependence on agriculture,
and high poverty
Pull Factors:-
High income, better standard of living
Mahapatro, 2014 Logistic Regression model For male migration, odds of migration are higher for
educated class employed whether casual or salaried labor.
For women migration, a positive association is revealed
between migration and educated class, higher
income class.
Turrey,2016 Secondary data Push Factors:-
Unemployment, poverty, social and political tension, civil
conflict, discrimination, environmental hazards
Pull Factors:-
Higher wages, better standard of living, political and
religious freedom, presence of family and friends and
education, and other facilities.
Bala,2017 COI Employment, Business, Marriage, Education, and
Movement of Household
Malhotra and
Devi, 2017
Simple Regression and
Factor Analysis
HDI, Per Capita GDP, Poverty Line, Literacy rate, the
share of workers in agriculture and service sector and
urbanization.
State Wise
Bihar
Haan , 2002;
Kumar et al, 2006;
Kumar and
Bhagat,2012
Primary data and NSSO Push Factors:-
Chronic poverty, low agricultural productivity, growing
economic inequality, low literacy level, unemployment,
lack of industrialization, and political tensions
Pull Factors:-
Predominantly illiterate, unemployed, and unskilled single
males migrate to Punjab, Haryana, Maharashtra, and Delhi
in search of lucrative employment opportunities.
Uttar Pradesh
Khan and
Hassan,2015;
Singh et al, 2005
Primary data and Census
Data from 1971-2001
Single male unskilled migration belonging to lower-
income strata in search of employment to Delhi, Mumbai,
Surat, and Ahmedabad. Women Migration due to
marriage.
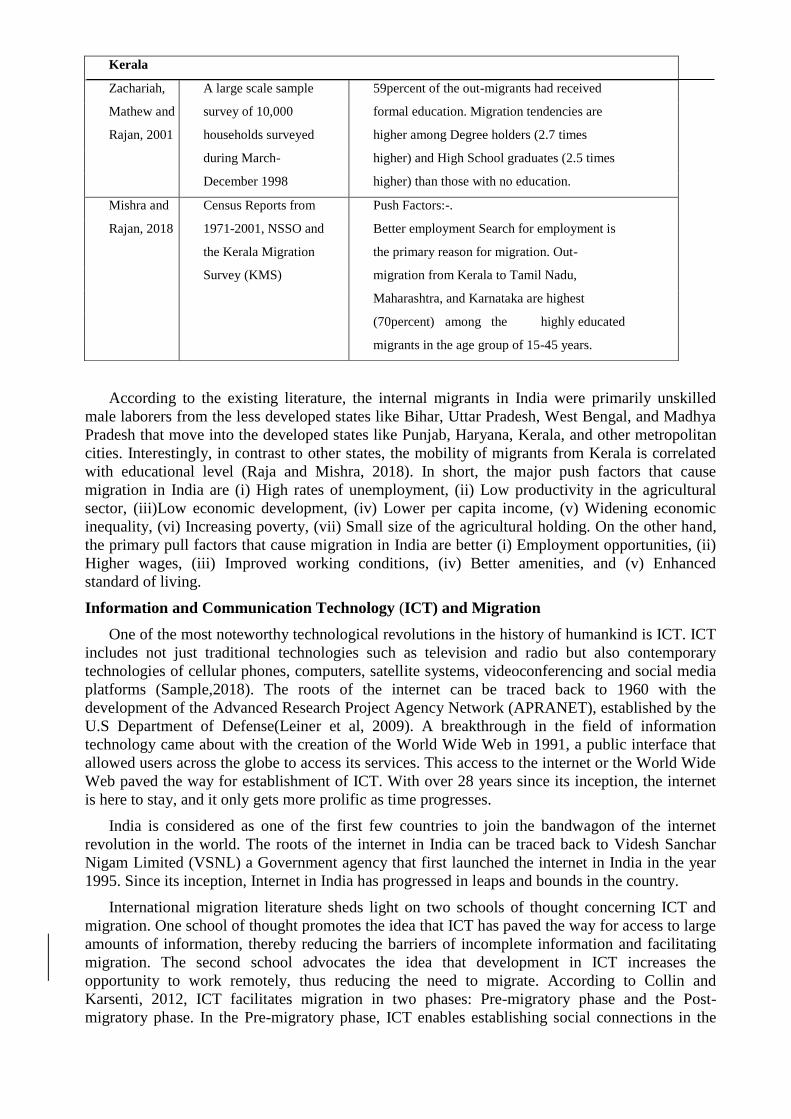
According to the existing literature, the internal migrants in India were primarily unskilled
male laborers from the less developed states like Bihar, Uttar Pradesh, West Bengal, and Madhya
Pradesh that move into the developed states like Punjab, Haryana, Kerala, and other metropolitan
cities. Interestingly, in contrast to other states, the mobility of migrants from Kerala is correlated
with educational level (Raja and Mishra, 2018). In short, the major push factors that cause
migration in India are (i) High rates of unemployment, (ii) Low productivity in the agricultural
sector, (iii)Low economic development, (iv) Lower per capita income, (v) Widening economic
inequality, (vi) Increasing poverty, (vii) Small size of the agricultural holding. On the other hand,
the primary pull factors that cause migration in India are better (i) Employment opportunities, (ii)
Higher wages, (iii) Improved working conditions, (iv) Better amenities, and (v) Enhanced
standard of living.
Information and Communication Technology (ICT) and Migration
One of the most noteworthy technological revolutions in the history of humankind is ICT. ICT
includes not just traditional technologies such as television and radio but also contemporary
technologies of cellular phones, computers, satellite systems, videoconferencing and social media
platforms (Sample,2018). The roots of the internet can be traced back to 1960 with the
development of the Advanced Research Project Agency Network (APRANET), established by the
U.S Department of Defense(Leiner et al, 2009). A breakthrough in the field of information
technology came about with the creation of the World Wide Web in 1991, a public interface that
allowed users across the globe to access its services. This access to the internet or the World Wide
Web paved the way for establishment of ICT. With over 28 years since its inception, the internet
is here to stay, and it only gets more prolific as time progresses.
India is considered as one of the first few countries to join the bandwagon of the internet
revolution in the world. The roots of the internet in India can be traced back to Videsh Sanchar
Nigam Limited (VSNL) a Government agency that first launched the internet in India in the year
1995. Since its inception, Internet in India has progressed in leaps and bounds in the country.
International migration literature sheds light on two schools of thought concerning ICT and
migration. One school of thought promotes the idea that ICT has paved the way for access to large
amounts of information, thereby reducing the barriers of incomplete information and facilitating
migration. The second school advocates the idea that development in ICT increases the
opportunity to work remotely, thus reducing the need to migrate. According to Collin and
Karsenti, 2012, ICT facilitates migration in two phases: Pre-migratory phase and the Post-
migratory phase. In the Pre-migratory phase, ICT enables establishing social connections in the
Kerala
Zachariah, A large scale sample 59percent of the out-migrants had received
Mathew and survey of 10,000 formal education. Migration tendencies are
Rajan, 2001 households surveyed higher among Degree holders (2.7 times
during March- higher) and High School graduates (2.5 times
December 1998 higher) than those with no education.
Mishra and Census Reports from Push Factors:-.
Rajan, 2018 1971-2001, NSSO and Better employment Search for employment is
the Kerala Migration the primary reason for migration. Out-
Survey (KMS) migration from Kerala to Tamil Nadu,
Maharashtra, and Karnataka are highest
(70percent) among the highly educated
migrants in the age group of 15-45 years.
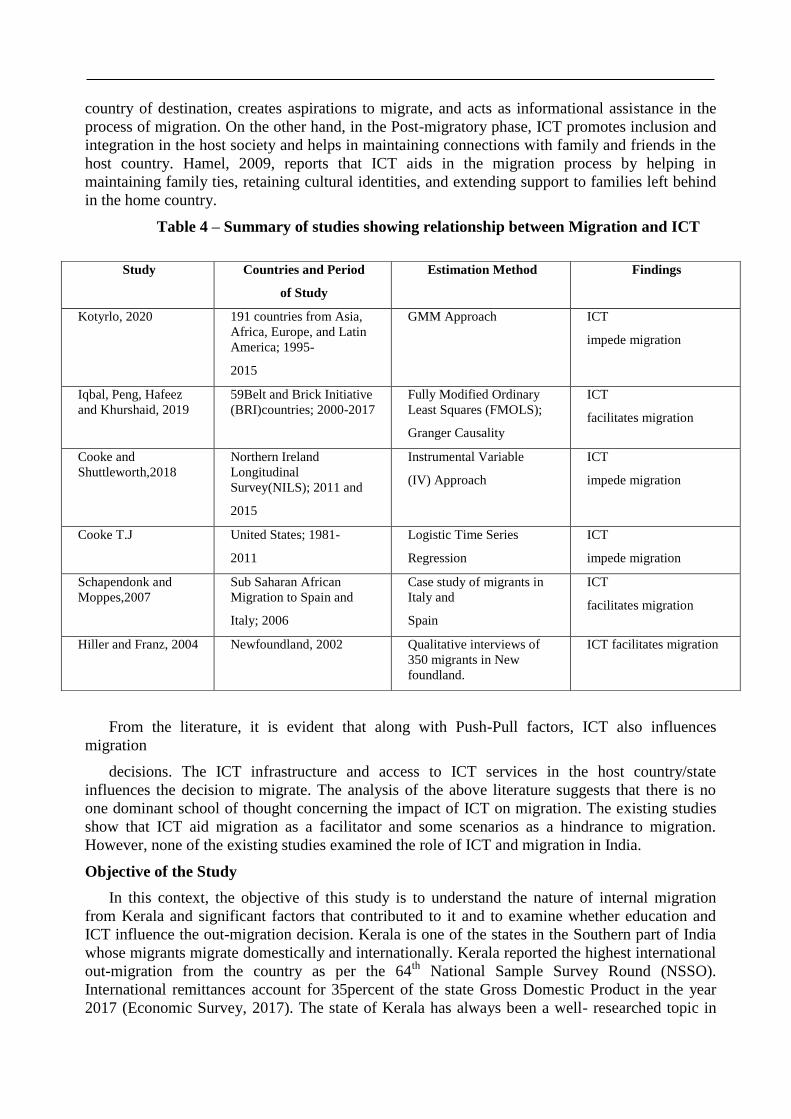
country of destination, creates aspirations to migrate, and acts as informational assistance in the
process of migration. On the other hand, in the Post-migratory phase, ICT promotes inclusion and
integration in the host society and helps in maintaining connections with family and friends in the
host country. Hamel, 2009, reports that ICT aids in the migration process by helping in
maintaining family ties, retaining cultural identities, and extending support to families left behind
in the home country.
Table 4 – Summary of studies showing relationship between Migration and ICT
From the literature, it is evident that along with Push-Pull factors, ICT also influences
migration
decisions. The ICT infrastructure and access to ICT services in the host country/state
influences the decision to migrate. The analysis of the above literature suggests that there is no
one dominant school of thought concerning the impact of ICT on migration. The existing studies
show that ICT aid migration as a facilitator and some scenarios as a hindrance to migration.
However, none of the existing studies examined the role of ICT and migration in India.
Objective of the Study
In this context, the objective of this study is to understand the nature of internal migration
from Kerala and significant factors that contributed to it and to examine whether education and
ICT influence the out-migration decision. Kerala is one of the states in the Southern part of India
whose migrants migrate domestically and internationally. Kerala reported the highest international
out-migration from the country as per the 64th
National Sample Survey Round (NSSO).
International remittances account for 35percent of the state Gross Domestic Product in the year
2017 (Economic Survey, 2017). The state of Kerala has always been a well- researched topic in
Study Countries and Period
of Study
Estimation Method Findings
Kotyrlo, 2020 191 countries from Asia,
Africa, Europe, and Latin
America; 1995-
2015
GMM Approach ICT
impede migration
Iqbal, Peng, Hafeez
and Khurshaid, 2019
59Belt and Brick Initiative
(BRI)countries; 2000-2017
Fully Modified Ordinary
Least Squares (FMOLS);
Granger Causality
ICT
facilitates migration
Cooke and
Shuttleworth,2018
Northern Ireland
Longitudinal
Survey(NILS); 2011 and
2015
Instrumental Variable
(IV) Approach
ICT
impede migration
Cooke T.J United States; 1981-
2011
Logistic Time Series
Regression
ICT
impede migration
Schapendonk and
Moppes,2007
Sub Saharan African
Migration to Spain and
Italy; 2006
Case study of migrants in
Italy and
Spain
ICT
facilitates migration
Hiller and Franz, 2004 Newfoundland, 2002 Qualitative interviews of
350 migrants in New
foundland.
ICT facilitates migration
terms of international migration. But there is a shortage of studies concerning internal migration
from Kerala, and none of the studies examines the impact of education and ICT on migration.
Data and Methodology
The data used for the study are internal migrants from Kerala state, internet subscriptions in
the host state of Kerala, control variables of per capita state gross domestic product, state
unemployment rate, and state consumer price index. Internal migration data collected from Kerala
Migration Survey (KMS), a longitudinal study initiated by the Centre of Development Studies,
Thiruvananthapuram an Autonomous Research Centre established by the Government of India
and Indian Council for Social Science Research. KMS is a scientifically designed household
survey based on the census sampling frame. KMS records the information on the different states
and countries that the residents have migrated to and the demographic characteristics of the
migrants such as age, educational qualification, occupational status, and Monthly income before
and after migration. KMS has completed seven rounds of migration spanning over the last two
decades namely, 1998, 2003, 2007, 2011, 2013, 2016, and 2018. The data for the rest of the years
between 1998-2018 has been computed by authors using the Interpolation Method.
The internet subscription statistics gathered from the Telecom Statistics Reports published by
the Department of Telecommunications, Government of India. The control variables of per capita
State Gross Domestic Product (SGDP) and State Consumer Price Index (SCPI) for the period
2011-18 collected from Centre for Monitoring of Indian Economy (CMIE), and earlier years from
Labor Bureau Consumer Price Index Reports. Unemployment rates gathered from the Labor
Bureau Survey on Employment and Unemployment in India. We have also conducted the time
series analysis using the data from 1998-2018 to examine the push factors that facilitated
migration from the state of Kerala. The model used for the study is as follows:-
Y= β1X1 + β2X2 + β3X3 + β4X4 + β5X5 + β6X6 +€
Y= Log of Labor Migrants from Kerala
X1 = Log SGDP
X2 = Log SCPI
X3 = State Unemployment Rate
X4 = Log of Number of Degree Holder Migrants
X5 = Log of Number of Skilled Migrants
X6 = Log of Number of Unemployed Migrants.
Findings of the Study
The overall internal labor out-migration from Kerala over two decades, 1998 to 2018 shows
different trends across time (Figure 1). The migrants chosen for study are those in the working-
age group of 15-64 as defined by the World Bank. It is evident from the figure that labor
migration was rising from 1998 to 2003 and the four years following 2003 witnessed a decline
with a sharp dip in the year 2008. There was a rising trend in labor out-migration from 2009 to
2013. But from 2014-18 saw a steady decrease in out-migration. The decline is due to
demographic contraction of the working-age population in the state, competition from other states,
fall in wages in states of destination, better employment opportunities in the host state, a boost in
the economy of Kerala (Devasia, 2018).
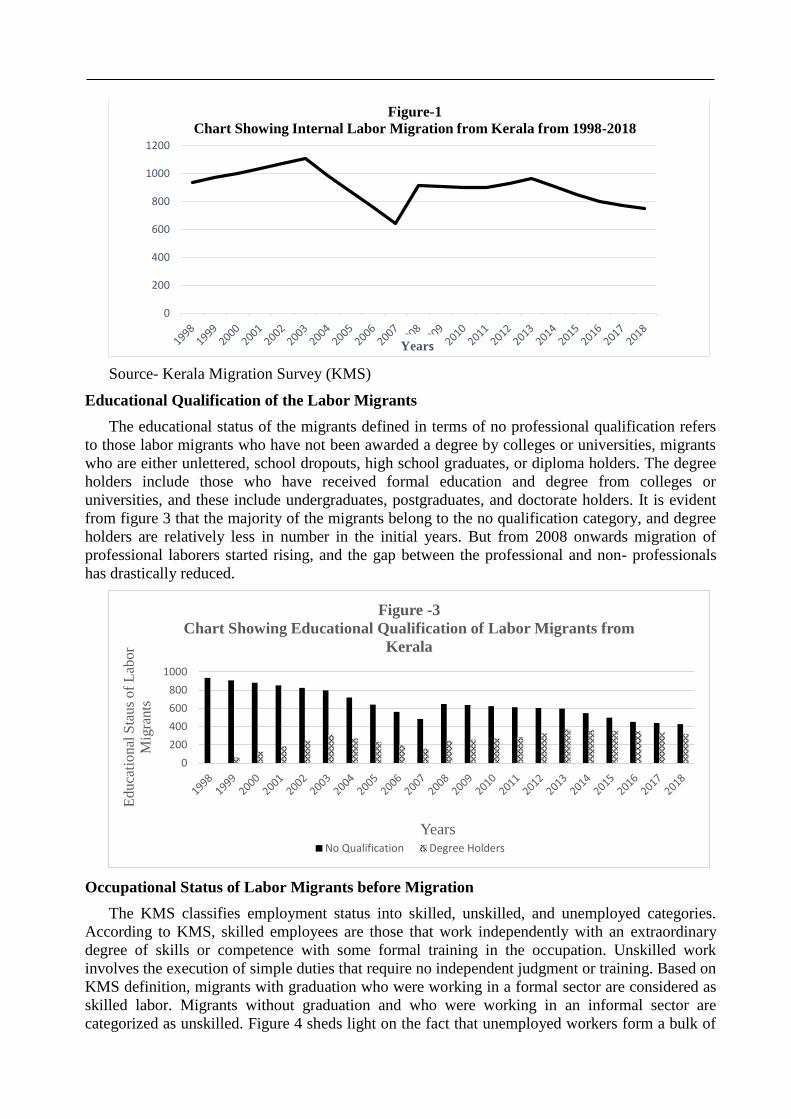
Source- Kerala Migration Survey (KMS)
Educational Qualification of the Labor Migrants
The educational status of the migrants defined in terms of no professional qualification refers
to those labor migrants who have not been awarded a degree by colleges or universities, migrants
who are either unlettered, school dropouts, high school graduates, or diploma holders. The degree
holders include those who have received formal education and degree from colleges or
universities, and these include undergraduates, postgraduates, and doctorate holders. It is evident
from figure 3 that the majority of the migrants belong to the no qualification category, and degree
holders are relatively less in number in the initial years. But from 2008 onwards migration of
professional laborers started rising, and the gap between the professional and non- professionals
has drastically reduced.
Occupational Status of Labor Migrants before Migration
The KMS classifies employment status into skilled, unskilled, and unemployed categories.
According to KMS, skilled employees are those that work independently with an extraordinary
degree of skills or competence with some formal training in the occupation. Unskilled work
involves the execution of simple duties that require no independent judgment or training. Based on
KMS definition, migrants with graduation who were working in a formal sector are considered as
skilled labor. Migrants without graduation and who were working in an informal sector are
categorized as unskilled. Figure 4 sheds light on the fact that unemployed workers form a bulk of
0
200
400
600
800
1000
1200
Years
Figure-1
Chart Showing Internal Labor Migration from Kerala from 1998-2018
0
200
400
600
800
1000
Ed
uca
tional
Sta
us
of
Lab
or
Mig
rants
Years
Figure -3
Chart Showing Educational Qualification of Labor Migrants from
Kerala
No Qualification Degree Holders
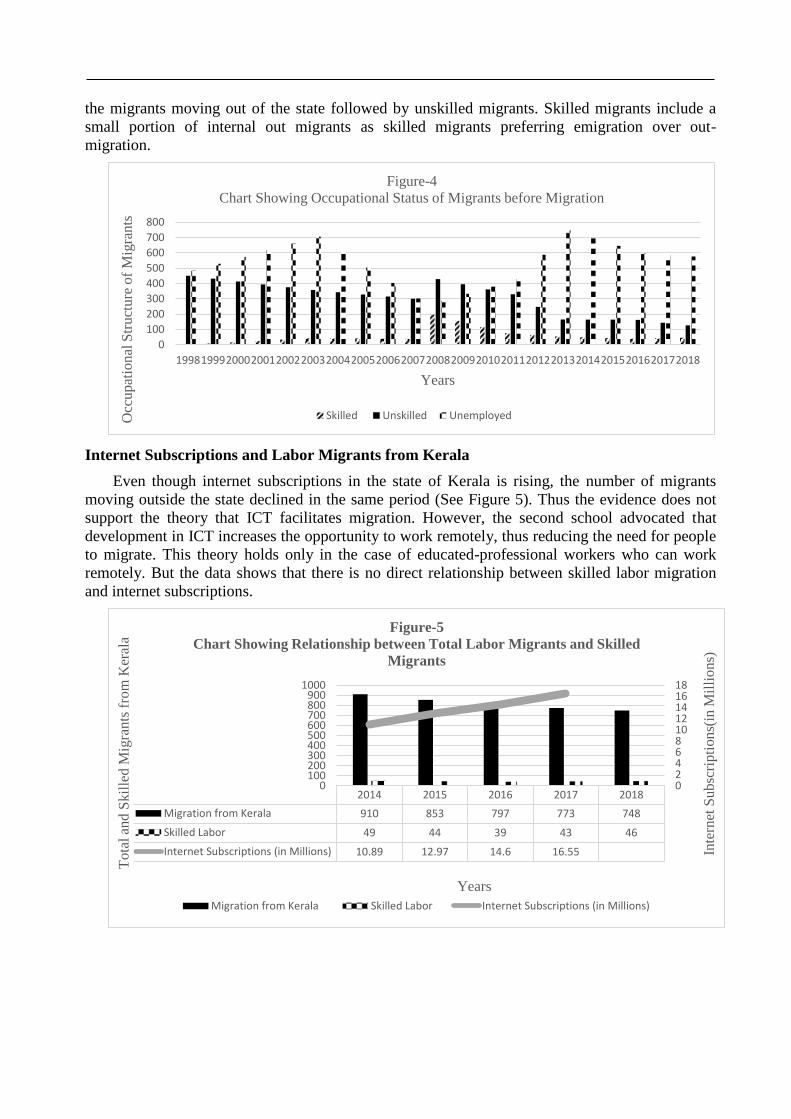
the migrants moving out of the state followed by unskilled migrants. Skilled migrants include a
small portion of internal out migrants as skilled migrants preferring emigration over out-
migration.
Internet Subscriptions and Labor Migrants from Kerala
Even though internet subscriptions in the state of Kerala is rising, the number of migrants
moving outside the state declined in the same period (See Figure 5). Thus the evidence does not
support the theory that ICT facilitates migration. However, the second school advocated that
development in ICT increases the opportunity to work remotely, thus reducing the need for people
to migrate. This theory holds only in the case of educated-professional workers who can work
remotely. But the data shows that there is no direct relationship between skilled labor migration
and internet subscriptions.
0
100
200
300
400
500
600
700
800
199819992000200120022003200420052006200720082009201020112012201320142015201620172018
Occ
up
atio
nal
Str
uct
ure
of
Mig
ran
ts
Years
Figure-4
Chart Showing Occupational Status of Migrants before Migration
Skilled Unskilled Unemployed
2014 2015 2016 2017 2018
Migration from Kerala 910 853 797 773 748
Skilled Labor 49 44 39 43 46
Internet Subscriptions (in Millions) 10.89 12.97 14.6 16.55
024681012141618
0100200300400500600700800900
1000
Inte
rnet
Su
bsc
ripti
ons(
in M
illi
ons)
To
tal
and
Skil
led M
igra
nts
fro
m K
eral
a
Years
Figure-5
Chart Showing Relationship between Total Labor Migrants and Skilled
Migrants
Migration from Kerala Skilled Labor Internet Subscriptions (in Millions)
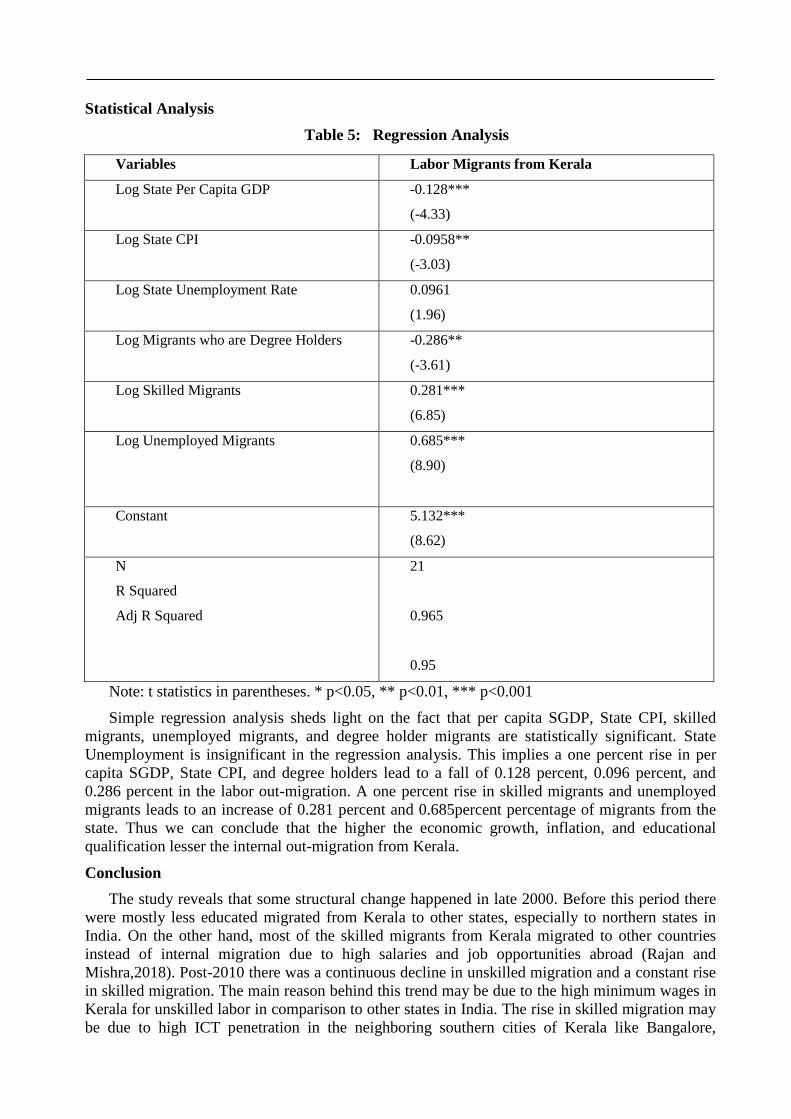
Statistical Analysis
Table 5: Regression Analysis
Note: t statistics in parentheses. * p<0.05, ** p<0.01, *** p<0.001
Simple regression analysis sheds light on the fact that per capita SGDP, State CPI, skilled
migrants, unemployed migrants, and degree holder migrants are statistically significant. State
Unemployment is insignificant in the regression analysis. This implies a one percent rise in per
capita SGDP, State CPI, and degree holders lead to a fall of 0.128 percent, 0.096 percent, and
0.286 percent in the labor out-migration. A one percent rise in skilled migrants and unemployed
migrants leads to an increase of 0.281 percent and 0.685percent percentage of migrants from the
state. Thus we can conclude that the higher the economic growth, inflation, and educational
qualification lesser the internal out-migration from Kerala.
Conclusion
The study reveals that some structural change happened in late 2000. Before this period there
were mostly less educated migrated from Kerala to other states, especially to northern states in
India. On the other hand, most of the skilled migrants from Kerala migrated to other countries
instead of internal migration due to high salaries and job opportunities abroad (Rajan and
Mishra,2018). Post-2010 there was a continuous decline in unskilled migration and a constant rise
in skilled migration. The main reason behind this trend may be due to the high minimum wages in
Kerala for unskilled labor in comparison to other states in India. The rise in skilled migration may
be due to high ICT penetration in the neighboring southern cities of Kerala like Bangalore,
Variables Labor Migrants from Kerala
Log State Per Capita GDP -0.128***
(-4.33)
Log State CPI -0.0958**
(-3.03)
Log State Unemployment Rate 0.0961
(1.96)
Log Migrants who are Degree Holders -0.286**
(-3.61)
Log Skilled Migrants 0.281***
(6.85)
Log Unemployed Migrants 0.685***
(8.90)
Constant 5.132***
(8.62)
N
R Squared
Adj R Squared
21
0.965
0.95
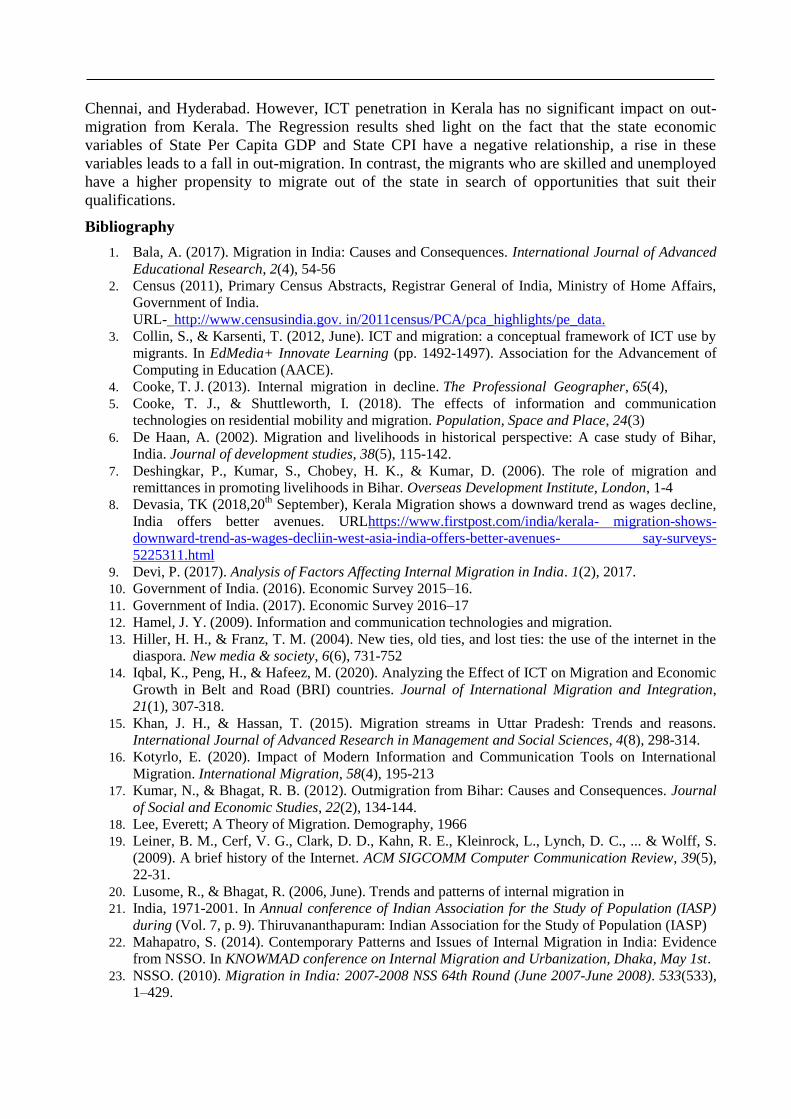
Chennai, and Hyderabad. However, ICT penetration in Kerala has no significant impact on out-
migration from Kerala. The Regression results shed light on the fact that the state economic
variables of State Per Capita GDP and State CPI have a negative relationship, a rise in these
variables leads to a fall in out-migration. In contrast, the migrants who are skilled and unemployed
have a higher propensity to migrate out of the state in search of opportunities that suit their
qualifications.
Bibliography
1. Bala, A. (2017). Migration in India: Causes and Consequences. International Journal of Advanced
Educational Research, 2(4), 54-56
2. Census (2011), Primary Census Abstracts, Registrar General of India, Ministry of Home Affairs,
Government of India.
URL- http://www.censusindia.gov. in/2011census/PCA/pca_highlights/pe_data.
3. Collin, S., & Karsenti, T. (2012, June). ICT and migration: a conceptual framework of ICT use by
migrants. In EdMedia+ Innovate Learning (pp. 1492-1497). Association for the Advancement of
Computing in Education (AACE).
4. Cooke, T. J. (2013). Internal migration in decline. The Professional Geographer, 65(4),
5. Cooke, T. J., & Shuttleworth, I. (2018). The effects of information and communication
technologies on residential mobility and migration. Population, Space and Place, 24(3)
6. De Haan, A. (2002). Migration and livelihoods in historical perspective: A case study of Bihar,
India. Journal of development studies, 38(5), 115-142.
7. Deshingkar, P., Kumar, S., Chobey, H. K., & Kumar, D. (2006). The role of migration and
remittances in promoting livelihoods in Bihar. Overseas Development Institute, London, 1-4
8. Devasia, TK (2018,20th September), Kerala Migration shows a downward trend as wages decline,
India offers better avenues. URLhttps://www.firstpost.com/india/kerala- migration-shows-
downward-trend-as-wages-decliin-west-asia-india-offers-better-avenues- say-surveys-
5225311.html
9. Devi, P. (2017). Analysis of Factors Affecting Internal Migration in India. 1(2), 2017.
10. Government of India. (2016). Economic Survey 2015–16.
11. Government of India. (2017). Economic Survey 2016–17
12. Hamel, J. Y. (2009). Information and communication technologies and migration.
13. Hiller, H. H., & Franz, T. M. (2004). New ties, old ties, and lost ties: the use of the internet in the
diaspora. New media & society, 6(6), 731-752
14. Iqbal, K., Peng, H., & Hafeez, M. (2020). Analyzing the Effect of ICT on Migration and Economic
Growth in Belt and Road (BRI) countries. Journal of International Migration and Integration,
21(1), 307-318.
15. Khan, J. H., & Hassan, T. (2015). Migration streams in Uttar Pradesh: Trends and reasons.
International Journal of Advanced Research in Management and Social Sciences, 4(8), 298-314.
16. Kotyrlo, E. (2020). Impact of Modern Information and Communication Tools on International
Migration. International Migration, 58(4), 195-213
17. Kumar, N., & Bhagat, R. B. (2012). Outmigration from Bihar: Causes and Consequences. Journal
of Social and Economic Studies, 22(2), 134-144.
18. Lee, Everett; A Theory of Migration. Demography, 1966
19. Leiner, B. M., Cerf, V. G., Clark, D. D., Kahn, R. E., Kleinrock, L., Lynch, D. C., ... & Wolff, S.
(2009). A brief history of the Internet. ACM SIGCOMM Computer Communication Review, 39(5),
22-31.
20. Lusome, R., & Bhagat, R. (2006, June). Trends and patterns of internal migration in
21. India, 1971-2001. In Annual conference of Indian Association for the Study of Population (IASP)
during (Vol. 7, p. 9). Thiruvananthapuram: Indian Association for the Study of Population (IASP)
22. Mahapatro, S. (2014). Contemporary Patterns and Issues of Internal Migration in India: Evidence
from NSSO. In KNOWMAD conference on Internal Migration and Urbanization, Dhaka, May 1st.
23. NSSO. (2010). Migration in India: 2007-2008 NSS 64th Round (June 2007-June 2008). 533(533),
1–429.
24. Paris, T., Singh, A., Luis, J., & Hossain, M. (2005). Labour outmigration, the livelihood of rice
farming households and women left behind: a case study in Eastern Uttar Pradesh. Economic and
political weekly, 2522-2529.
25. Perruchoud, R. (2004). International migration law: Glossary on migration (No. 1). International
Organization for Migration.
26. Rajan, Irudaya.; M, Sumeetha. (2020). Handbook of Internal Migration in India. Sage Publications
Pvt. Limited.
27. Rajan, S. I., & Mishra, U. S. (2018). Internal Migration Udaya S Mishra S Irudaya Rajan. ILO
Thematic Paper, 1–24.
28. Sample,I(2018,Oct,22). What is the Internet? 13 Key Questions Answered. Retrieved URL
https://www.theguardian.com/technology/2018/oct/22/what-is-the-internet-13- key-questions-
answered
29. Schapendonk, J., & Van Moppes, D. (2007). Migration and information. Images of Europe,
migration encouraging factors, and en-route information sharing. Working Paper Migration and
Development Series, Report 16, Radboud University, Nijmegen. Nijmegen, The Netherlands:
Radboud University.
30. Singh, M., & Shandilya, S. (2012). Internal migration in India. Journal of Business Management &
Social Sciences Research (JBM&SSR) Volume, 1, 66-69.
31. Turrey, A. A. (2016). An analysis of internal migration types in India in purview of its social and
economic impacts. EPRA International Journal of Economic and Business Review, 4(1), 157-164.
32. UNDP (2009).Human Development Report. New York, NY: Oxford University Press
33. World Migration Report (20200, International Organisation for Migration
Related Documents