Probeware Laboratory Manual

Welcome message from author
This document is posted to help you gain knowledge. Please leave a comment to let me know what you think about it! Share it to your friends and learn new things together.
Transcript

Probeware Laboratory Manual

A Glencoe Program
Copyright © by The McGraw-Hill Companies, Inc. All rights reserved. Permission is granted to reproduce the material contained herein on the condition that such material be repro-duced only for classroom use; be provided to students, teachers, and families without charge; and be used solely in conjunction with the Physics: Principles and Problemsprogram. Any other reproduction, for use or sale, is prohibited without prior written permission of the publisher.
The terms CBL 2, TI-Graph Link, TI Connect and TI InterActive! are either registered trademarks of, trademarks of, or copyrighted by Texas Instruments, Inc. Vernier LabPro is a registered trademark of, and Graphical Analysis Logger Pro and DataMate are copyrighted by Vernier Software & Technology. Macintosh is a registered trademark of Apple Computer, Inc.Windows is a registered trademark of Microsoft Corporation in the United States and/or other countries.
Send all inquiries to:Glencoe/McGraw-Hill8787 Orion PlaceColumbus, Ohio 43240
ISBN 0-07-865891-8
Printed in the United States of America
1 2 3 4 5 6 7 8 9 045 09 08 07 06 05 04

Physics: Principles and Problems Contents iii
To the Student . . . . . . . . . . . . . . . . . . . . . . . . . . . . . . . . . . . iv
Organization of Activities . . . . . . . . . . . . . . . . . . . . . . . . . . . iv
Sending Data to Graphical Analysis . . . . . . . . . . . . . . . . . . . v
CBL Equipment . . . . . . . . . . . . . . . . . . . . . . . . . . . . . . . . . . . v
Safety in the Laboratory . . . . . . . . . . . . . . . . . . . . . . . . . . . . vi
Safety Symbols . . . . . . . . . . . . . . . . . . . . . . . . . . . . . . . . . . . vii
Properties of Common Substances . . . . . . . . . . . . . . . . . . viii
Laboratory Activities
2-1 How fast is it going? . . . . . . . . . . . . . . . . . . . . . . . . . . 1
3-1 How does a tossed ball move? . . . . . . . . . . . . . . . . . 5
3-2 How fast is it accelerating? . . . . . . . . . . . . . . . . . . . . 9
4-1 Terminal Velocity . . . . . . . . . . . . . . . . . . . . . . . . . . . 13
5-1 When will an object slide? . . . . . . . . . . . . . . . . . . . 17
9-1 Is momentum conserved in a collision? . . . . . . . . . 21
12-1 How efficient are solar collectors? . . . . . . . . . . . . . 25
15-1 How fast does sound move in air? . . . . . . . . . . . . . 29
16-1 How does light intensity depend on distance? . . . 33
18-1 Measuring Ultraviolet Light . . . . . . . . . . . . . . . . . . . 37
22-1 Current, Resistance, and Potential Difference in Circuits . . . . . . . . . . . . . . . . . . . . . . . . . . . . . . . . . 41
23-1 What happens to voltage across a resistor in a series circuit? . . . . . . . . . . . . . . . . . . . . . . . . . . . . . . 45
ContentsC
opy
righ
t ©
Gle
nco
e/M
cGra
w-H
ill,
a d
ivis
ion
of
The
McG
raw
-Hil
l C
om
pan
ies,
In
c.

iv To the Student Physics: Principles and Problems
Physics is the science of matter and energy andtheir interactions. In your classroom work inphysics, you will learn a great deal about the infor-mation that has been gathered by scientists aboutmatter and energy. But physics is not just informa-tion. It is also a process for finding out more aboutmatter and energy and their interactions. Laborato-ry activities are the primary means that physicistsuse to learn about matter. The activities in theProbeware Laboratory Manual require that youform and test hypotheses, measure and record data and observations, analyze those data, anddraw conclusions based on those data and yourknowledge of physics. These processes are the sameas those used by professional physicists and allother scientists.
CBL (computer-based laboratory) activities usegraphing calculators to collect and analyze real-world data using different probes or sensors. TheCBL™ system is an interface that collects data fromthe probes and sends the information to the calcu-lator. The calculator, in turn, runs stored data col-lection and processing programs, which interpretand plot data obtained from the CBL system.
ORGANIZATION OF ACTIVITIES
Introduction Following the title and num-ber of each activity, an introduction providesa background discussion about the problemyou will study in the activity.
Problem The problem to be studied in thisactivity is clearly stated.
Objectives The objectives are statements ofwhat you should accomplish by doing theinvestigation. Recheck this list when you havefinished the activity.
Materials The materials list shows the ap-paratus you need to have on hand for theactivity.
Safety Precautions Safety symbols andstatements warn you of potential hazards in the laboratory. Before beginning any activity, refer to page vii to see what thesesymbols mean.
Procedure The numbered steps of the procedure tell you how to carry out the activity and sometimes offer hints to help yoube successful in the laboratory. Some activitieshave CAUTION statements in the procedureto alert you to hazardous substances or techniques.
Data and Observations This section pre-sents a suggested table or form for collectingyour laboratory data. Always record data andobservations in an organized way as you dothe activity.
Analyze and Conclude The Analyze andConclude section shows you how to performthe calculations necessary for you to analyzeyour data and reach conclusions. It providesquestions to aid you in interpreting data andobservations in order to reach an experimen-tal result. You are also asked to form a scien-tific conclusion based on what you actuallyobserved, not what “should have happened.”Opportunities to analyze possible errors inthese activities also are given.
To the StudentC
opyrigh
t © Glen
coe/M
cGraw
-Hill, a d
ivision
of Th
e McG
raw-H
ill Co
mp
anies, In
c.

If using a TI-83 graphing calculator:
1. On the TI calculator, press 2nd Link, then selectList…from the SEND menu.
2. Use the down arrow to locate the lists on theSELECT menu. Position the arrow in front of alist you want to send to GRAPHICAL ANALYSISand press to select that particular list.More than one list may be selected in this man-ner. A filled box will appear beside each list thatwill be sent. To deselect, press . Thefilled-in box will disappear.
3. Press the right arrow on the calculator, thenselect TRANSMIT. The lists will appear incolumns in the data table window of GRAPHI-CAL ANALYSIS. They will be labeled with sim-ple list names from the calculator. If you wantto rename the lists or add units, double-click onthe column heading and enter a new name orlabel in the dialog box.
ENTER
ENTER
If using another type of graphing calculator witha PC computer:
1. Connect the TI-Graph Link cable to a free serialport of the Windows computer and to the porton the bottom edge of the TI calculator.
2. With GRAPHICAL ANALYSIS running, chooseImport from the TI Calculator under the FILEMENU. If the TI-Graph Link cable is not con-nected to the serial port designated in the statusbox, click on SELECT PORT and choose the cor-rect port for the TI-Graph Link cable.
CBL EQUIPMENT
This diagram shows the basic equipment in mostof these CBL activities. Such equipment includesthe CBL unit, a graphing calculator, link cable, ACadaptor for the CBL unit, DIN adapter (needed forsome probes), and a probe or sensor.
Physics: Principles and Problems Sending Data to Graphical Analysis v
Co
pyri
ght
© G
len
coe/
McG
raw
-Hil
l, a
div
isio
n o
f Th
e M
cGra
w-H
ill
Co
mp
anie
s, I
nc.
Sending Data to Graphical Analysis
Motion detector
Marker
CBL2Lab Pro Unit
TI graphingcalculator
Link cable

vi Safety in the Laboratory Physics: Principles and Problems
If you follow instructions exactly and understandthe potential hazards of the equipment and theprocedure used in an experiment, the physics labo-ratory is a safe place for learning and applyingyour knowledge. You must assume responsibilityfor the safety of yourself, your fellow students, andyour teacher. Here are some rules to guide you inprotecting yourself and others from injury and inmaintaining a safe environment for learning.
1. The physics laboratory is to be used for seriouswork.
2. Never bring food, beverages, or makeup intothe laboratory. Never taste anything in the lab-oratory. Never remove lab glassware from thelaboratory, and never use this glassware foreating or drinking.
3. Do not perform experiments that are unautho-rized. Always obtain your teacher’s permissionbefore beginning an activity.
4. Study your laboratory assignment before youcome to the lab. If you are in doubt about anyprocedure, ask your teacher.
5. Keep work areas and the floor around youclean, dry, and free of clutter.
6. Use the safety equipment provided for you.Know the location of the fire extinguisher,safety shower, fire blanket, eyewash station,and first-aid kit.
7. Report any accident, injury, or incorrect proce-dure to your teacher at once.
8. Keep all materials away from open flames.When using any heating element, tie backlong hair and loose clothing. If a fire shouldbreak out in the lab, or if your clothing shouldcatch fire, smother it with a blanket or coat oruse a fire extinguisher. Never run.
9. Handle toxic, combustible, or radioactive substances only under the direction of yourteacher. If you spill acid or another corrosivechemical, wash it off with water immediately.
10. Place broken glass and solid substances in des-ignated containers. Keep insoluble water mate-rial out of the sink.
11. Use electrical equipment only under the super-vision of your teacher. Be sure your teacherchecks electric circuits before you activatethem. Do not handle electric equipment with wet hands or when you are standing indamp areas.
12. When your investigation is completed, be sureto turn off the water and gas and disconnectelectrical connections. Clean your work area.Return all materials and apparatus to theirproper places. Wash your hands thoroughlyafter working in the laboratory.
The Physics: Principles and Problems program usessafety symbols to alert you to possible laboratorydangers. These symbols are provided in your text-book in Appendix D and are explained on the nextpage. Be sure you understand each symbol beforeyou begin an activity that displays a symbol.
Safety in the LaboratoryC
opyrigh
t © Glen
coe/M
cGraw
-Hill, a d
ivision
of Th
e McG
raw-H
ill Co
mp
anies, In
c.
Physics: Principles and Problems Safety Symbols vii
Safety Symbols
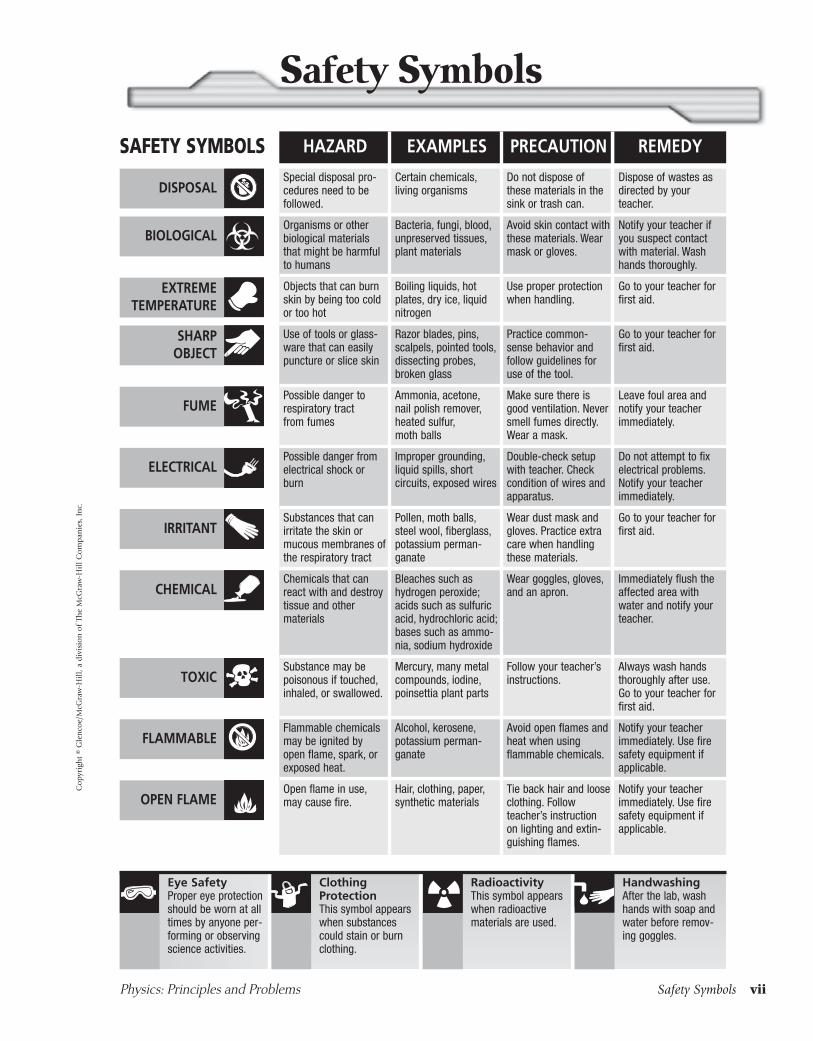
Eye SafetyProper eye protectionshould be worn at alltimes by anyone per-forming or observingscience activities.
ClothingProtectionThis symbol appearswhen substancescould stain or burnclothing.
RadioactivityThis symbol appearswhen radioactivematerials are used.
HandwashingAfter the lab, washhands with soap andwater before remov-ing goggles.
Special disposal pro-cedures need to befollowed.
Certain chemicals,living organisms
Do not dispose ofthese materials in thesink or trash can.
Dispose of wastes asdirected by yourteacher.
Objects that can burnskin by being too coldor too hot
Boiling liquids, hotplates, dry ice, liquidnitrogen
Use proper protectionwhen handling.
Go to your teacher forfirst aid.
Organisms or otherbiological materialsthat might be harmfulto humans
Bacteria, fungi, blood,unpreserved tissues,plant materials
Avoid skin contact withthese materials. Wearmask or gloves.
Notify your teacher ifyou suspect contactwith material. Washhands thoroughly.
Use of tools or glass-ware that can easilypuncture or slice skin
Razor blades, pins,scalpels, pointed tools,dissecting probes,broken glass
Practice common-sense behavior andfollow guidelines foruse of the tool.
Go to your teacher forfirst aid.
Possible danger to respiratory tract from fumes
Ammonia, acetone,nail polish remover,heated sulfur,moth balls
Make sure there isgood ventilation. Neversmell fumes directly.Wear a mask.
Leave foul area andnotify your teacherimmediately.
Possible danger fromelectrical shock orburn
Improper grounding,liquid spills, short circuits, exposed wires
Double-check setupwith teacher. Checkcondition of wires andapparatus.
Do not attempt to fixelectrical problems.Notify your teacherimmediately.
Substances that canirritate the skin ormucous membranes ofthe respiratory tract
Pollen, moth balls,steel wool, fiberglass,potassium perman-ganate
Wear dust mask andgloves. Practice extracare when handlingthese materials.
Go to your teacher forfirst aid.
Chemicals that canreact with and destroytissue and other materials
Bleaches such ashydrogen peroxide;acids such as sulfuricacid, hydrochloric acid;bases such as ammo-nia, sodium hydroxide
Wear goggles, gloves,and an apron.
Immediately flush theaffected area withwater and notify yourteacher.
Substance may be poisonous if touched,inhaled, or swallowed.
Mercury, many metalcompounds, iodine,poinsettia plant parts
Follow your teacher’sinstructions.
Always wash handsthoroughly after use.Go to your teacher forfirst aid.
Flammable chemicalsmay be ignited byopen flame, spark, orexposed heat.
Alcohol, kerosene,potassium perman-ganate
Avoid open flames andheat when using flammable chemicals.
Notify your teacherimmediately. Use firesafety equipment ifapplicable.
Open flame in use,may cause fire.
Hair, clothing, paper,synthetic materials
Tie back hair and looseclothing. Followteacher’s instructionon lighting and extin-guishing flames.
Notify your teacherimmediately. Use firesafety equipment ifapplicable.
BIOLOGICAL
EXTREMETEMPERATURE
DISPOSAL
SAFETY SYMBOLS
SHARPOBJECT
FUME
ELECTRICAL
IRRITANT
CHEMICAL
TOXIC
FLAMMABLE
OPEN FLAME
PRECAUTION REMEDYHAZARD EXAMPLES
Co
pyri
ght
© G
len
coe/
McG
raw
-Hil
l, a
div
isio
n o
f Th
e M
cGra
w-H
ill
Co
mp
anie
s, I
nc.

viii Properties of Common Substances Physics: Principles and Problems
RESISTOR COLOR CODE
Suppose that a resistor has the following color bands:
1st band 2nd band 3rd band 4th bandbrown black yellow gold
1 0 4 5%
The value of this resistor is 10 10,000 5% or it has a range of 80,000 to120,000 .
Properties of Common SubstancesC
opyrigh
t © Glen
coe/M
cGraw
-Hill, a d
ivision
of Th
e McG
raw-H
ill Co
mp
anies, In
c.
Substance Specific Heat Density(J/kgK)
Alcohol 2450 0.8Aluminum 903 2.7Brass 376 8.5 varies by contentCarbon 710 1.7–3.5Copper 385 8.9Glass 664 2.2–2.6Gold 129 19.3Ice 2060 0.92Iron (steel) 450 7.1–7.8Lead 130 11.3Mercury 138 13.6Nickel 444 8.8Platinum 433 21.4Silver 235 10.5Steam 2020 —Tungsten 133 19.3Water 4180 1.0 at 4°C, 0.99 at 0°CZinc 388 7.1
Specific Heat and Density
Resistance Color Codes (resistance given in ohms)
Color Digit Multiplier Tolerance (%)
Black 0 1Brown 1 10Red 2 100Orange 3 1000Yellow 4 10,000Green 5 100,000Blue 6 1,000,000Violet 7 10,000,000Gray 8White 9Gold 0.1 5Silver 0.01 10No color 20

How fast is it going?In this activity, you will be investigating the motion of a moving vehicleto determine its velocity. The CBL 2 or LabPro interface with a motiondetector will measure time intervals and the vehicle’s displacement. Themotion detector emits short pulses of ultrasonic sound waves and thenlistens for a reflected echo of the pulse. The interface uses the speed of theultrasonic sound waves and the time it took to return to the detector todetermine the distance to the object from which the waves were reflected.
The CBL 2 or LabPro interface will collect data of time and associateddistances of the moving vehicle from the detector. The average velocity
can be determined by v .
Objectives Calculate the average velocity for a series of intervals.
Classify displacement: time ratio as uniform or nonuniform motion.
Analyze the relationship between total displacement and time, andvelocity and time.
Define operationally constant velocity.
Interpret data to establish trends in events.
Procedure1. With your lab partner, set up the motion detector and vehicle as
shown in Figure A. Place the vehicle about 0.5 m from the motiondetector.
Motion detector
Vehiclemotion
df ditf ti
dt
Date Period Name
Physics: Principles and Problems Probeware Laboratory Manual 1
2 Probeware Lab 2-1CHAPTER
Co
pyri
ght
© G
len
coe/
McG
raw
-Hil
l, a
div
isio
n o
f Th
e M
cGra
w-H
ill
Co
mp
anie
s, I
nc.
Figure A
Materials
• constant-velocity vehicle
• metric ruler
• C-clamp
• CBL 2 or LabPro interface
• graphing calculator
• link cable
• motion detector
• graph paper
Materials
Safety Precautions

Often targets are not directly in front of the motion detector. Move the detector so that the tar-get is directly in front of the motion detector. In using the motion detector, it is important to real-ize that the ultrasound is emitted in a cone about 30 wide. Anything within the cone of ultra-sound can cause a reflection and possibly an accidental measurement. A common problem inusing motion detectors is getting unintentional reflections from a desk, chair, or table in the room.
Tilting the motion detector slightly can minimize unintended reflections. The motion detectordoes not properly detect objects closer than 0.4 m. The maximum range is about 6 m, but strayobjects in the wide detection cone can be problematic at this distance. If the velocity graphs arenoisy, try to increase the strength of the ultrasonic reflection from the target by increasing the tar-get’s area.
2. Connect the CBL 2 or LabPro interface unit to the calculator using the unit-to-unit link cable andthe link ports on the calculator and interface. Press the cable ends in firmly. Connect the motiondetector to the DIG/SONIC (or DIG/SONIC 1 on the LabPro) port of the interface.
3. Turn on the calculator and start the DataMate program. Press to reset the program.
4. If the motion detector is working properly, the top line of the main screen will display DIG:MOTION(M) and a reading of the distance (in meters) from the vehicle to the motion detector.
5. Select SETUP from the main screen. Press and then press to choose MODE. SelectTIME GRAPH and then select CHANGE TIME SETTINGS. Type “0.1” as the time between samplesin seconds. Press . Type “100” as the number of samples. Press . Select OK twice toreturn to the main screen.
6. You are ready to begin the experiment. One student should select START on the main screen of thecalculator. When the motion detector begins to click, wait 1–2 s, and then another student shouldturn on the vehicle and release it so it moves across the table away from the motion detector.
7. When the motion detector has stopped clicking, press to display the DISTANCE graph.
8. Use the arrows keys to trace along the curve. On the far left, the curve represents the position ofthe vehicle before its motion began. The middle section of the curve represents the motion of themoving vehicle. Copy this graph into your laboratory report.
9. Chose a point on the curve at the beginning of the middle section of the graph. Record the time(x-value) and the distance (y-value) into your data table. Press three times to move toanother point along the curve. Record the new time and distance values in your data table. Contin-ue moving along the curve in increments of three steps and recording data until ten sets of datahave been recorded. Press to return to the graph selection screen.
10. Press , and then press to display the VELOCITY graph. Observe how the velocity ofthe vehicle changed during the experiment. Sketch this graph in your laboratory report. Press
to return to the graph selection screen.ENTER
ENTER
ENTER
ENTER
ENTERENTER
ENTER
CLEAR
continuedProbeware Lab 2-12Name
2 Probeware Laboratory Manual Physics: Principles and Problems
Co
pyright © G
lenco
e/McG
raw-H
ill, a divisio
n o
f The M
cGraw
-Hill C
om
pan
ies, Inc.

Physics: Principles and Problems Probeware Laboratory Manual 3
continued Probeware Lab 2-1 2Name
Co
pyri
ght
© G
len
coe/
McG
raw
-Hil
l, a
div
isio
n o
f Th
e M
cGra
w-H
ill
Co
mp
anie
s, I
nc.
Distance v. Time Graph Velocity v. Time Graph
Data Table 1
Time Total Displacement Interval Displacement Average Velocity(s) (m) (m) (m/s)
Data and Observations

Analysis and Conclusions1. In the graph selection screen, cursor to the the DISTANCE graph, and then choose SELECT
REGION. Cursor to the left part of the graph where the distance graph just starts to becomesloped. Press . Cursor to the right part of the sloped distance line. Select Enter. Return toMAIN SCREEN. Go to ANALYZE. Choose CURVE FIT. Choose LINEAR (DIST VS TIME). Record Aand B for the equation Y Ax B. Press ENTER to view the curve fit. If A is the slope of thegraph, what does it represent?
2. Using your distance versus time graph, describe the motion of the vehicle.
3. Using Data Table 1, calculate the displacement during each time interval.
4. Using Data Table 1, calculate the average velocity between each set of displacements.
5. Using Data Table 1, calculate the vehicle’s average velocity for the entire trip. Compare this valueto the velocities during each interval and with the slope of the distance versus time graph.
6. Are there any time intervals on the velocity versus time curve where the velocity of the vehicleappears to be changing? Describe the graph at these points.
7. Are there any time intervals on the velocity versus time curve where velocity appears to be constant? Why?
Extension and Application1. Analyze the motion of a basketball rolling along the floor. Design the experiment so that the ball
moves with a constant velocity. Challenge your classmates to a constant-velocity challenge.
2. Suppose that a constant-velocity vehicle could double its average velocity. How would this changeaffect the distance during a given interval of time? How would this change the overall displace-ment of the vehicle in the same time?
ENTER
continuedProbeware Lab 2-12Name
4 Probeware Laboratory Manual Physics: Principles and Problems
Co
pyright © G
lenco
e/McG
raw-H
ill, a divisio
n o
f The M
cGraw
-Hill C
om
pan
ies, Inc.

How does a tossed ball move?Toss a ball into the air. How would you describe its motion? As the ballgoes up, it appears to slow down until it stops. Then it increases speed asit falls down. What types of mathematical relationships are involved?
In this experiment, you will use a motion detector to collect distance,velocity, and acceleration data for a ball thrown straight upward. You willthen analyze the graphs of these data.
Objectives Collect distance, velocity, and acceleration data as a ball travels straight
up and down.
Analyze the distance v. time, velocity v. time, and acceleration v. timegraphs.
Determine the best-fit equations for the distance v. time and velocity v.time graphs.
Determine the mean acceleration from the acceleration v. time graph.
Procedure1. Place the motion detector on the floor and protect it by placing a
wire basket over it.
Often targets are not directly in front of the motion detector.Move the detector so that the target is directly in front of the motiondetector. In using the motion detector, it is important to realize thatthe ultrasound is emitted in a cone about 30 wide. Anything withinthe cone of ultrasound can cause a reflection and possibly an acci-dental measurement. A common problem in using motion detectorsis getting unintentional reflections from a desk, chair, or table in theroom.
Tilting the motion detector slightly can minimize unintendedreflections. The motion detector does not properly detect objectscloser than 0.4 m. The maximum range is about 6 m, but strayobjects in the wide detection cone can be problematic at this dis-tance. If the velocity graphs are noisy, try to increase the strength ofthe ultrasonic reflection from the target by increasing the target’sarea.
Date Period Name
Physics: Principles and Problems Probeware Laboratory Manual 5
3 Probeware Lab 3-1CHAPTER
Co
pyri
ght
© G
len
coe/
McG
raw
-Hil
l, a
div
isio
n o
f Th
e M
cGra
w-H
ill
Co
mp
anie
s, I
nc.
Materials
• LabPro or CBL 2 interface
• TI graphing calculator
• DataMate program
• motion detector
• volleyball or basketball
• wire basket
Materials
Safety Precautions

2. Plug the motion detector into the DIG/SONIC 1 port of the LabPro or DIG/SONIC port of theCBL 2 interface. Use the link cable to connect the TI graphing calculator to the interface. Firmlypress in the cable ends.
3. Turn on the calculator and start the DataMate program. Press to reset the program.
4. In this step, you will toss the ball straight upward above the motion detector and let it fall backtoward the motion detector. This step may require some practice. Data will be collected for 5 s. Holdthe ball directly above and about 0.5 m from the motion detector. Use two hands. Be sure to pullyour hands away from the ball after it starts moving so that your hands are not picked up by themotion detector. Select START to begin data collection. You will notice a clicking sound from themotion detector. Wait one second, then toss the ball straight upward. Be sure to move your handsout of the way after you release it. A toss of 0.5 to 1.0 m above the motion detector works well. Youwill get best results if you catch and hold the ball when it is about 0.5 m above the motion detector.
5. Press to display the DISTANCE graph.
6. Examine the distance v. time graph. Repeat step 4 if your distance v. time graph does not show anarea of smoothly changing distance. Check with your teacher if you are not sure whether you needto repeat the data collection. To repeat data collection, press to return to the graph selec-tion screen, and select MAIN SCREEN. Select START to begin data collection.
Data and Observations1. Print or sketch the three motion graphs. You can see the other graphs by pressing to return
to the graph selection screen; use the cursor keys to select DISTANCE, VELOCITY or ACCELERATION and press to display the graph.ENTER
ENTER
ENTER
ENTER
CLEAR
Motiondetector
Interface
continuedProbeware Lab 3-13Name
6 Probeware Laboratory Manual Physics: Principles and Problems
Co
pyright © G
lenco
e/McG
raw-H
ill, a divisio
n o
f The M
cGraw
-Hill C
om
pan
ies, Inc.
Curve fit parameters: A B C
Distance (Ax2 + Bx + C)
Velocity (Ax + B)
Average acceleration
Figure A
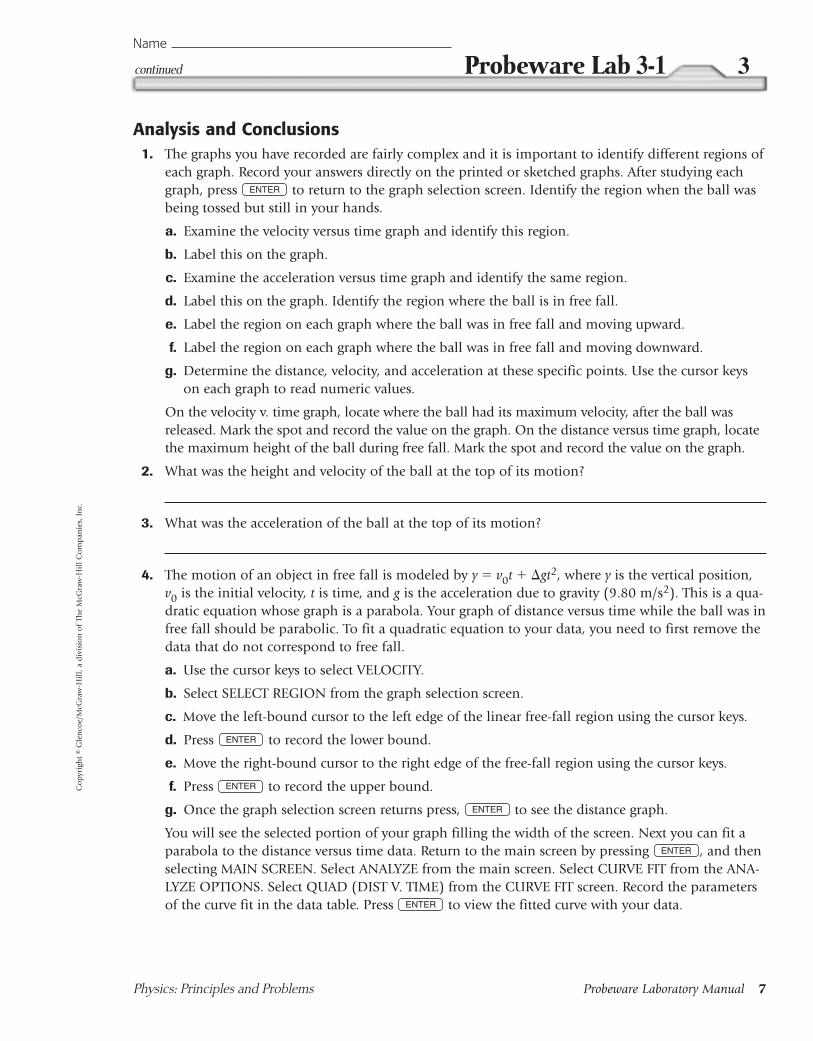
Analysis and Conclusions1. The graphs you have recorded are fairly complex and it is important to identify different regions of
each graph. Record your answers directly on the printed or sketched graphs. After studying eachgraph, press to return to the graph selection screen. Identify the region when the ball wasbeing tossed but still in your hands.
a. Examine the velocity versus time graph and identify this region.
b. Label this on the graph.
c. Examine the acceleration versus time graph and identify the same region.
d. Label this on the graph. Identify the region where the ball is in free fall.
e. Label the region on each graph where the ball was in free fall and moving upward.
f. Label the region on each graph where the ball was in free fall and moving downward.
g. Determine the distance, velocity, and acceleration at these specific points. Use the cursor keyson each graph to read numeric values.
On the velocity v. time graph, locate where the ball had its maximum velocity, after the ball wasreleased. Mark the spot and record the value on the graph. On the distance versus time graph, locatethe maximum height of the ball during free fall. Mark the spot and record the value on the graph.
2. What was the height and velocity of the ball at the top of its motion?
3. What was the acceleration of the ball at the top of its motion?
4. The motion of an object in free fall is modeled by y v0t gt2, where y is the vertical position,v0 is the initial velocity, t is time, and g is the acceleration due to gravity (9.80 m/s2). This is a qua-dratic equation whose graph is a parabola. Your graph of distance versus time while the ball was infree fall should be parabolic. To fit a quadratic equation to your data, you need to first remove thedata that do not correspond to free fall.
a. Use the cursor keys to select VELOCITY.
b. Select SELECT REGION from the graph selection screen.
c. Move the left-bound cursor to the left edge of the linear free-fall region using the cursor keys.
d. Press to record the lower bound.
e. Move the right-bound cursor to the right edge of the free-fall region using the cursor keys.
f. Press to record the upper bound.
g. Once the graph selection screen returns press, to see the distance graph.
You will see the selected portion of your graph filling the width of the screen. Next you can fit aparabola to the distance versus time data. Return to the main screen by pressing , and thenselecting MAIN SCREEN. Select ANALYZE from the main screen. Select CURVE FIT from the ANA-LYZE OPTIONS. Select QUAD (DIST V. TIME) from the CURVE FIT screen. Record the parametersof the curve fit in the data table. Press to view the fitted curve with your data.ENTER
ENTER
ENTER
ENTER
ENTER
ENTER
Physics: Principles and Problems Probeware Laboratory Manual 7
continued Probeware Lab 3-1 3Name
Co
pyri
ght
© G
len
coe/
McG
raw
-Hil
l, a
div
isio
n o
f Th
e M
cGra
w-H
ill
Co
mp
anie
s, I
nc.

5. How closely does the coefficient of the x2 term in the curve fit compare to g?
6. The graph of velocity versus time should be linear during free fall.
a. Return to the analyze screen by pressing .
b. Select CURVE FIT from ANALYZE OPTIONS.
c. Select LINEAR (VELO V. TIME) from the CURVE FIT screen.
d. Record the parameters of the curve fit in the data table.
e. Press to view the fitted curve with your data.
7. How closely does the coefficient of the x-term compare to the accepted value for g? The graph ofacceleration vs. time during free fall should appear to be more or less constant. Note that becausethe graph is automatically scaled to fill the screen vertically, small variations may appear large.Inspect the values as you scroll across the screen.
a. Return to the analyze screen by pressing .
b. Select STATISTICS from ANALYZE OPTIONS.
c. Select ACCELERATION from the SELECT GRAPH screen. Since you want the average of the entireinterval you have already selected, leave the lower bound at the left edge by pressing .
d. Move the upper bound to the far right side of the graph using the cursor keys, and pressto set the upper bound. Record the average value of the acceleration in the data table.
8. List some reasons why your values for the ball’s acceleration may be different from the acceptedvalue for g.
Extension and Applications1. The ball used in this lab is large enough and light enough that a buoyant force and air resistance
may affect the acceleration. Perform the same curve fitting and statistical analysis techniques, butthis time analyze each half of the motion separately. How do the fitted curves for the upwardmotion compare to the downward motion? Explain any differences.
2. Perform the same lab using a beach ball or other very light, large ball. Answer the same questionsas in problem 2 above.
3. Use a smaller, denser ball where buoyant force and air resistance will not be a factor. Compare theresults to your results with the larger, less dense ball.
ENTER
ENTER
ENTER
ENTER
ENTER
continuedProbeware Lab 3-13Name
8 Probeware Laboratory Manual Physics: Principles and Problems
Co
pyright © G
lenco
e/McG
raw-H
ill, a divisio
n o
f The M
cGraw
-Hill C
om
pan
ies, Inc.

How fast is it accelerating?The motion detector can record the movement of a small cart pulledacross a table by a falling mass. The resulting data measures the displace-ment of the moving cart per time. In Chapter 2, you found that averagevelocity equals displacement for a given interval of time. Also recall thatthe ratio of a change in velocity to a change in time is acceleration,
a
and that this is the equation for the slope of a graph of velocity versus time.
(v2 v1)(t2 t1)
Date Period Name
Physics: Principles and Problems Probeware Laboratory Manual 9
3 Probeware Lab 3-2CHAPTER
Co
pyri
ght
© G
len
coe/
McG
raw
-Hil
l, a
div
isio
n o
f Th
e M
cGra
w-H
ill
Co
mp
anie
s, I
nc.
Motion detector
C-clamp
500-g mass
PulleyString
Cart
Objectives Measure the dispalcement of a moving object in a set time interval.
Calculate the velocity of a moving object.
Analyze motion, using graphs of the relationship between displace-ment and time, velocity and time, and acceleration and time.
Procedure1. Set up the apparatus, as shown in Figure A except for the 100-g
mass. Put the motion detector about 1–1.5 m from the pulley. Tie1–1.5 m of string to the opposite end of the cart and thread thestring through the pulley.
Often targets are not directly in front of the motion detector.Move the detector so that the target is directly in front of the motiondetector. In using the motion detector, it is important to realize that
Figure A
Materials
• laboratory cart
• CBL 2 or LabPro interface
• motion detector
• link cable
• TI graphing calculator
• 100-g mass
• masking tape
• heavy string, 1.5 m
• pulley
• C-clamp
Materials
Safety Precautions

the ultrasound is emitted in a cone about 30 wide. Anything within the cone of ultrasound cancause a reflection and possibly an accidental measurement. A common problem in using motiondetectors is getting unintentional reflections from a desk, chair, or table in the room.
Tilting the motion detector slightly can minimize unintended reflections. The motion detectordoes not properly detect objects closer than 0.4 m. The maximum range is about 6 m, but strayobjects in the wide detection cone can be problematic at this distance. If the velocity graphs arenoisy, try to increase the strength of the ultrasonic reflection from the target by increasing the tar-get’s area.
2. With your lab partner, set up the motion detector and vehicle, as shown in Figure A. Place the cartabout 0.5 m from the motion detector.
3. Connect the CBL 2 or LabPro interface to the calculator using the unit-to-unit link cable and thelink ports on the calculator and interface. Press the cable ends in firmly. Connect the motiondetector to the DIG/SONIC (or DIG/SONIC 1 on the LabPro) port of the interface.
4. Turn on the calculator and start the DataMate program. Press to reset the program.
5. If the motion detector is working properly, the top line of the main screen will display DIG:MOTION (M), and a reading of the distance (in meters) from the vehicle to the motion detector.
6. You are ready to begin the experiment. One student should hold the cart in place while the otherstudent starts the data collection by selecting START on the main screen of the calculator. The stu-dent holding the cart should not release it until about 1 s after the motion detector has begunclicking. Upon release, the cart will be pulled along by the 100-g mass. Catch the cart at the edgeof the table to prevent it from knocking the pulley loose or plunging to the floor.
7. When the motion detector has stopped clicking, press to display the DISTANCE graph.
8. The displacement graph initially will show a horizontal line until the cart began to move. Copythis graph in the space provided.
9. Use the right arrow key to go to the point on the curve where the cart began to move, and thenback up one point. Record the distance (y-value) and the time (x-value) into your data table. Pressthe right arrow key two times to move to another point along the curve. Record the new time anddistance values in Data Table 1. Continue moving along the curve in increments of two steps andrecording data. Collect as many data points as possible in this manner, but stop at ten points.Press to return to the graph selection screen.
10. Press , and then press to display the VELOCITY graph. Observe how the velocity ofthe vehicle changed during the experiment. Sketch this graph in the space provided. Repeat step 9to record data in the Data Table 1 for the points along the velocity-time graph until the slope lev-els off. Press to return to the graph selection screen. Display the ACCELERATION graphand sketch it below. Do not turn off the calculator until you have done the Analysis and Conclusion section.
Data and ObservationsSketch graphs of displacement v. time, velocity v. time, acceleration v. time
ENTER
ENTER
ENTER
ENTER
CLEAR
continuedProbeware Lab 3-23Name
10 Probeware Laboratory Manual Physics: Principles and Problems
Co
pyright © G
lenco
e/McG
raw-H
ill, a divisio
n o
f The M
cGraw
-Hill C
om
pan
ies, Inc.

Analysis and Conclusion1. Return to the graph screen. Cursor to the VELOCITY graph. Choose SELECT REGION. Set the left
bound to the point where the graph begins an upward slope. Press at this point. Move thecursor to the point where the upward slope ends. this point. The graph should now showa straight line with a positive slope. Draw a sketch of the graph. Return to MAIN SCREEN. ChooseANALYZE. Go to FIT CURVE. Choose LINEAR (VELO VS TIME). Use the data from Y AX B tofind the slope of the line. What does this slope of the velocity versus time line represent?
ENTER
ENTER
Physics: Principles and Problems Probeware Laboratory Manual 11
continued Probeware Lab 3-2 3Name
Co
pyri
ght
© G
len
coe/
McG
raw
-Hil
l, a
div
isio
n o
f Th
e M
cGra
w-H
ill
Co
mp
anie
s, I
nc.
Data Table 1
Time (s) Total Displacement (m) Average Velocity (m/s)

2. Return to the graph screen. Look at the ACCELERATION graph. Draw a sketch of the graph. Go toMain Screen. Choose ANALYZE. Go to STATISTICS. Select DIG-ACCELERATION. Select LEFTBOUND and RIGHT BOUND. Record the MEAN. What does the mean of this graph tell you?
3. Return to the graph screen. Look at the DISTANCE graph. Describe this graph. Go to the MAINSCREEN. Choose ANALYZE. Go to CURVE FIT. Choose MORE. Choose QUAD (DIST VS TIME).Record A, B, and C for Y AX2 BX C. Press . Draw a sketch of the graph. What does this graph mean? How does this data for Y AX2 BX C represent the equation: df di vit .5 at2?
4. How does your calculated acceleration of the cart compare to the acceleration due to gravity?
Extension and Application1. How would the graphs look if the cart was pulled by a bigger mass?
2. What would be the advantage of building an interplanetary spacecraft that could accelerate at 1 g(9.80 m/s2) for a year?
ENTER
continuedProbeware Lab 3-23Name
12 Probeware Laboratory Manual Physics: Principles and Problems
Co
pyright © G
lenco
e/McG
raw-H
ill, a divisio
n o
f The M
cGraw
-Hill C
om
pan
ies, Inc.

Terminal VelocityOften in physics discussions, you are told to ignore air resistance and toassume the acceleration is constant. In reality, air resistance causes objectsnot to fall indefinitely with constant acceleration. This is observed bycomparing the fall of a baseball and a sheet of paper when dropped fromthe same height. The baseball is still accelerating when it hits the floor.The paper does not accelerate very long before air resistance reduces theacceleration so that it moves at an almost constant velocity. When anobject is falling with a constant velocity, we describe it with the term terminal velocity, or vT. The paper reaches terminal velocity very quickly,but on a short drop to the floor, the baseball does not.
Air resistance is often referred to as a drag force. Many experiments havebeen done with various objects falling in air. These experiments show thatsometimes the drag force is proportional to the velocity and that some-times the drag force is proportional to the square of the velocity. In eithercase, the direction of the drag force is opposite to the direction of motion.Mathematically, the drag force can be described using Fdrag bv or Fdrag cv2. The constants b and c are called the drag coefficients that dependon the size and shape of the object.
When falling, there are two forces acting on an object: the weight, mg,and air resistance, bv or cv2. At terminal velocity, the downward forceis equal to the upward force, so mg bv or mg cv2, depending onwhether the drag force follows the first or second relationship. In eithercase, since g and, b or c, are constants, the terminal velocity is affected bythe mass of the object. When you take out the constants, you see thateither terminal velocity is proportional to mass or the square of terminalvelocity is proportional to the mass. A plot of mass versus vT or vT
2 candetermine which relationship is more appropriate.
In this experiment, terminal velocity as a function of mass for fallingcoffee filters will be measured. You will use the data to choose betweenthe two models for the drag force. Coffee filters were chosen because theyare light enough to reach terminal velocity in a short distance.
Objectives Describe the effect of air resistance on falling coffee filters.
Determine how air resistance and mass affect the terminal velocity of afalling object.
Choose between two competing force models for the air resistance onfalling coffee filters.
Date Period Name
Physics: Principles and Problems Probeware Laboratory Manual 13
4 Probeware Lab 4-1CHAPTER
Co
pyri
ght
© G
len
coe/
McG
raw
-Hil
l, a
div
isio
n o
f Th
e M
cGra
w-H
ill
Co
mp
anie
s, I
nc.
Materials
• LabPro or CBL 2 interface
• TI graphing calculator
• DataMate program
• motion detector
• five basket-style coffee filters
Materials
Safety Precautions

Procedure 1. Support the motion detector about 2 m above the floor, pointing down, as shown in Figure A. If
possible, place the motion detector as high as you safely can.
Often targets are not directly in front of the motion detector. Move the detector so that the tar-get is directly in front of the motion detector. In using the motion detector, it is important to real-ize that the ultrasound is emitted in a cone about 30 wide. Anything within the cone of ultra-sound can cause a reflection and possibly an accidental measurement. A common problem inusing motion detectors is getting unintentional reflections from a desk, chair, or table in the room.
Tilting the motion detector slightly can minimize unintended reflections. The motion detectordoes not properly detect objects closer than 0.4 m. The maximum range is about 6 m, but strayobjects in the wide detection cone can be problematic at this distance. If the velocity graphs arenoisy, try to increase the strength of the ultrasonic reflection from the target by increasing the tar-get’s area.
continuedProbeware Lab 4-14Name
14 Probeware Laboratory Manual Physics: Principles and Problems
Co
pyright © G
lenco
e/McG
raw-H
ill, a divisio
n o
f The M
cGraw
-Hill C
om
pan
ies, Inc.
Figure A
Motiondetector
Interface
2. Connect the motion detector to the DIG/SONIC or DIG/SONIC 1 port of the LabPro or CBL 2interface. Use the black link cable to connect the TI graphing calculator to the interface. Firmlypress in the cable ends.
3. Turn on the calculator and start the DataMate program. Press on the calculator to reset theprogram.
4. Place a coffee filter in the palm of your hand and hold it about 0.5 m under the motion detector.Do not hold the filter closer than 0.4 m.
5. Select START to begin data collection. After the interface beeps, release the coffee filter directlybelow the motion detector so that it falls toward the floor. Move your hand out of the beam of themotion detector as quickly as possible so that only the motion of the filter is recorded on thegraph.
6. View your distance graph by pressing . If the motion of the filter was too erratic to get asmooth graph, you will need to repeat the measurement. With practice, the filter will fall almost
ENTER
CLEAR

straight down with little sideways motion. Press and select MAIN SCREEN. Repeat datacollection as necessary.
7. The velocity of the coffee filter can be determined from the slope of the distance v. time graph. Atthe start of the graph, there should be a region of increasing slope (increasing velocity), and thenthe plot should become linear. Since the slope of this line is velocity, the linear portion indicatesthat the filter was falling with a constant or terminal velocity, vT, during that time. To fit a line tothe linear region, you first need to select that portion of your data.
a. Select GRAPH from the main screen.
b. To select just the linear portion of the distance graph, select SELECT REGION.
c. Move the flashing cursor with the and keys to the left edge of the linear region corresponding to the filter in motion at constant speed and press .
d. Move the flashing cursor to the right edge of the linear region, and press .
e. View your abbreviated graph by pressing . You should see only the linear region.
f. Select MAIN SCREEN to return to the main screen.
8. Fit a straight line to the region you just selected.
a. Select ANALYZE from the main screen.
b. Select CURVE FIT from ANALYZE OPTIONS.
c. Select LINEAR (DIST VS TIME) from the CURVE FIT screen.
d. Record the slope in the data table (a velocity in m/s).
e. Press to see the fit along with your data.
f. Press , and select RETURN TO MAIN SCREEN.
9. Repeat steps 4–8 for two, three, four, and five coffee filters. (Optionally, extend to six, seven, andeight filters, but be sure to use sufficient fall distance so that a clear velocity can be measured.)
Data and Observations
Data Table
ENTER
ENTER
ENTER
ENTER
ENTER
ENTER
Physics: Principles and Problems Probeware Laboratory Manual 15
continued Probeware Lab 4-1 4Name
Co
pyri
ght
© G
len
coe/
McG
raw
-Hil
l, a
div
isio
n o
f Th
e M
cGra
w-H
ill
Co
mp
anie
s, I
nc.
Number of Terminal (TerminalFilters Velocity Velocity)2
vT (m/s) vT2 (m2/s2)
1
2
3
4
5

Analysis and Conclusions1. If there is no air resistance, how would the rate of fall of a coffee filter compare to that of a brick?
2. When the coffee filter reaches terminal velocity, what is the net force acting on it?
3. To help choose between the two models for the drag force, plot terminal velocity v. number of filters (mass) on your calculator. On a separate graph, plot vT
2 v. number of filters. Scale each axisfrom the origin (0, 0).
4. During terminal velocity the drag force is equal to the weight, mg, of the filter. If the drag force isproportional to velocity, then vT is proportional to mass. Or, if the drag force is proportional to thesquare of velocity, then vT
2 is proportional to mass. From your graphs, which proportionality is con-sistent with your data; that is, which graph is closer to a straight line that goes through the origin?
5. From the choice of proportionalities in the previous step, which of the drag force relationships,bv or cv2, appears to model the real data better? Notice that you are choosing between two different descriptions of air resistance—one or both might not correspond to what you observed.
Extension and Application1. Make a small parachute and use the motion detector to analyze the air resistance and terminal
velocity as the weight suspended from the chute increases.
2. Draw a free-body diagram of a falling coffee filter. There are only two forces acting on the filter.Once the terminal velocity vT has been reached, the acceleration is zero, so the net force, F ma 0, must also be zero, thus, F mg bvT 0 or F mg cvT 0 depending onwhich drag force model you use. Given this, sketch plots for the terminal velocity (y-axis) as afunction of filter weight for each model (x-axis). Hint: Solve for vT first.
continuedProbeware Lab 4-14Name
16 Probeware Laboratory Manual Physics: Principles and Problems
Co
pyright © G
lenco
e/McG
raw-H
ill, a divisio
n o
f The M
cGraw
-Hill C
om
pan
ies, Inc.
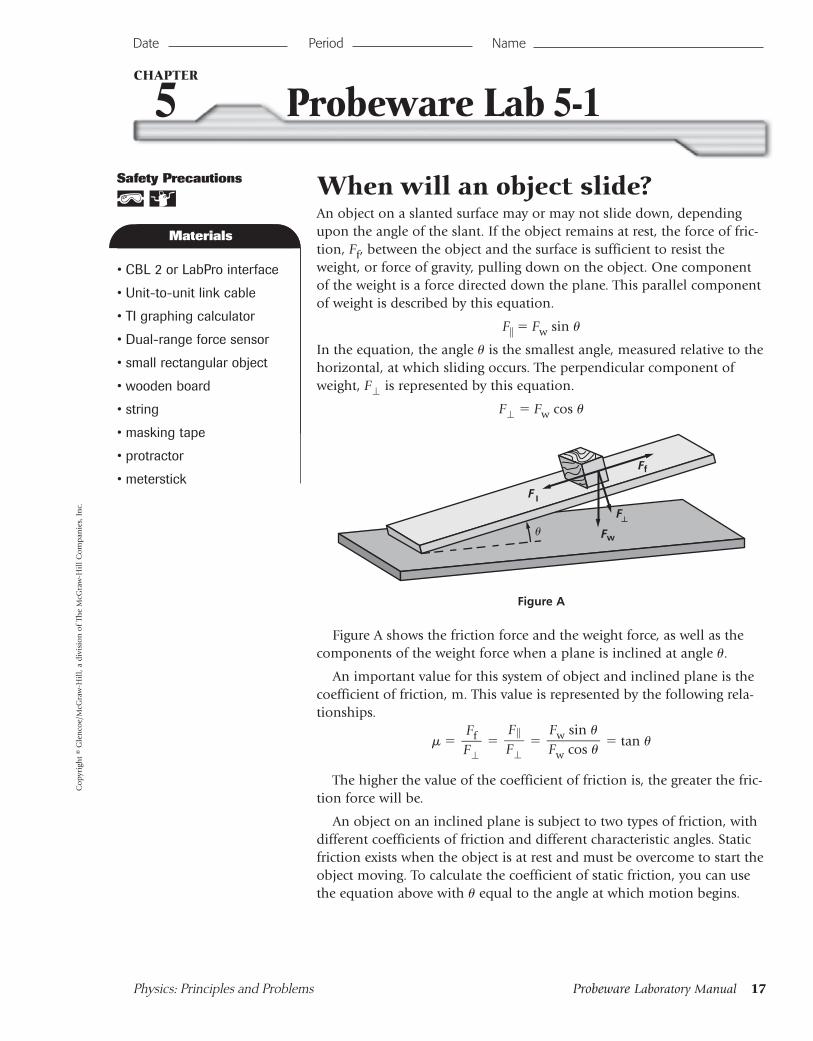
When will an object slide?An object on a slanted surface may or may not slide down, dependingupon the angle of the slant. If the object remains at rest, the force of fric-tion, Ff, between the object and the surface is sufficient to resist theweight, or force of gravity, pulling down on the object. One componentof the weight is a force directed down the plane. This parallel componentof weight is described by this equation.
F Fw sin
In the equation, the angle is the smallest angle, measured relative to thehorizontal, at which sliding occurs. The perpendicular component ofweight, F is represented by this equation.
F Fw cos
Date Period Name
Physics: Principles and Problems Probeware Laboratory Manual 17
5 Probeware Lab 5-1CHAPTER
Co
pyri
ght
© G
len
coe/
McG
raw
-Hil
l, a
div
isio
n o
f Th
e M
cGra
w-H
ill
Co
mp
anie
s, I
nc.
Materials
• CBL 2 or LabPro interface
• Unit-to-unit link cable
• TI graphing calculator
• Dual-range force sensor
• small rectangular object
• wooden board
• string
• masking tape
• protractor
• meterstick
Materials
Safety Precautions
Ff
Fw
F
F
Figure A
Figure A shows the friction force and the weight force, as well as thecomponents of the weight force when a plane is inclined at angle .
An important value for this system of object and inclined plane is thecoefficient of friction, m. This value is represented by the following rela-tionships.
tan
The higher the value of the coefficient of friction is, the greater the fric-tion force will be.
An object on an inclined plane is subject to two types of friction, withdifferent coefficients of friction and different characteristic angles. Staticfriction exists when the object is at rest and must be overcome to start theobject moving. To calculate the coefficient of static friction, you can usethe equation above with equal to the angle at which motion begins.
Fw sin Fw cos
FF
FfF

If the object is already moving down the plane, sliding friction acts to resist the downward motion.To calculate the coefficient of sliding friction, use the equation above with equal to the angle at whichthe downward motion is at constant speed.
In this lab, you will design a procedure to measure the angle at which an object begins to slide downan inclined plane and, once already in motion, the angle at which it slides at constant speed. Findingthose angles will give you the information you need to calculate the coefficients of static friction andsliding friction.
Objectives Measure the angle at which an object at rest begins to slide down an inclined plane.
Measure the angle at which an object, already in motion, slides down an inclined plane at constantspeed.
Calculate the coefficients of static friction and sliding friction.
ProblemWhat are the coefficients of static friction and sliding friction for an object on an inclined plane?
HypothesisFormulate a hypothesis about the angles at which an object will begin to slide and slide at constantspeed on an inclined plane, and about the relative magnitudes of the coefficients of static friction andsliding friction.
Plan the Experiment1. Decide on a procedure that uses the suggested materials (or others of your choosing) to measure
the force of sliding friction, which is the force needed to pull the object along the board at con-stant speed when the board is horizontal; the angle at which an object at rest begins to slide downan inclined plane; and the angle at which the same object, already in motion, slides at constantspeed down an inclined plane.
2. Decide what data to collect and how to analyze it. You can record your data and calculated resultsin the table at the end of this lab. Make the appropriate columns.
3. Write your procedure on another sheet of paper or in your notebook.
4. Check the Plan Have your teacher approve your plan before you proceed with your experiment.
Analyze and Conclude1. Interpreting Data Calculate the coefficient of sliding friction, using only data on weight and aver-
age force of sliding friction. Then calculate it using the angle of tilt in the equation involving thetangent of . Are the coefficients equal? Give reasons for any difference.
continuedProbeware Lab 5-15Name
18 Probeware Laboratory Manual Physics: Principles and Problems
Co
pyright © G
lenco
e/McG
raw-H
ill, a divisio
n o
f The M
cGraw
-Hill C
om
pan
ies, Inc.

2. Interpreting Data Calculate the coefficient of static friction. How does this coefficient compare tothe coefficient of sliding friction that you found?
3. Checking Your Hypothesis Suppose you put a brick with its largest surface in contact with aninclined plane. You tilt the plane until the brick just begins to slide and measure the angle of theplane above the horizontal. Then you turn the brick on one of its narrow edges, tilt the plane, andmeasure the tilt angle. Will these measured angles be different? Explain your answer in terms ofthe equation for the force of friction.
4. Checking Your Hypothesis You put a brick on an inclined plane and tilt the plane until the brickjust begins to slide. You measure the angle of the plane with respect to the horizontal. You wrapthe brick in wax paper and put it on the plane, tilt the plane, and measure the tilt angle. Will thesemeasured angles be different? Give a reason for your answer.
5. Inferring Based on your answers to questions 3 and 4, describe the factors that influence the forceof friction.
Apply1. While looking for a set of new tires for your car, you find an ad that offers two brands of tires at
the same price. Brand X has a coefficient of friction of 0.90 on dry pavement and of 0.15 on wetpavement. Brand Y has a coefficient of friction of 0.88 on dry pavement and of 0.45 on wet pave-ment. If you live in a rainy area, which tire would give you better performance? Give a reason foryour answer.
Physics: Principles and Problems Probeware Laboratory Manual 19
continued Probeware Lab 5-1 5Name
Co
pyri
ght
© G
len
coe/
McG
raw
-Hil
l, a
div
isio
n o
f Th
e M
cGra
w-H
ill
Co
mp
anie
s, I
nc.

Data and Observations
continuedProbeware Lab 5-15Name
20 Probeware Laboratory Manual Physics: Principles and Problems
Co
pyright © G
lenco
e/McG
raw-H
ill, a divisio
n o
f The M
cGraw
-Hill C
om
pan
ies, Inc.
Data Table

Is momentum conserved in acollision?The law of conservation of momentum states: The momentum of anyclosed, isolated system does not change. This law is true regardless of thenumber of objects or directions of the objects before and after they col-lide. In a collision or interaction, the momentum before the collisionequals the momentum after the collision.
The change in an object’s momentum is equal to the product of theforce acting on the object and the interval of time within which the forceacts. In this investigation, two carts will be pushing away from each other.Thus, from Newton’s third law of motion, each cart will give the other anequal, but opposite, impulse. The change of momentum from the firstcart will equal the change of momentum of the second cart. The two cartsin this investigation will have unequal masses. The two carts will beplaced together, compressing a spring in one of the carts. The carts willmove apart when the spring is released.
Date Period Name
Physics: Principles and Problems Probeware Laboratory Manual 21
9 Probeware Lab 9-1CHAPTER
Co
pyri
ght
© G
len
coe/
McG
raw
-Hil
l, a
div
isio
n o
f Th
e M
cGra
w-H
ill
Co
mp
anie
s, I
nc.
Motion detector
Ring stand
Index card
Index card
Masking tape
Collision carts
mass set
Marker
Objectives Measure the masses and velocities of two carts.
Calculate the momentum of the two carts.
Apply conservation of momentum to a system.
Demonstrate conservation of momentum for an interaction.
Materials
• two collision carts, one witha spring mechanism
• balance
• meterstick
• CBL 2 or LabPro interface
• motion detector
• link cable
• TI graphing calculator
• set of masses
• masking tape
• 5-in 7-in index cards
• ring stand
• clamp
Materials
Safety Precautions
Figure A
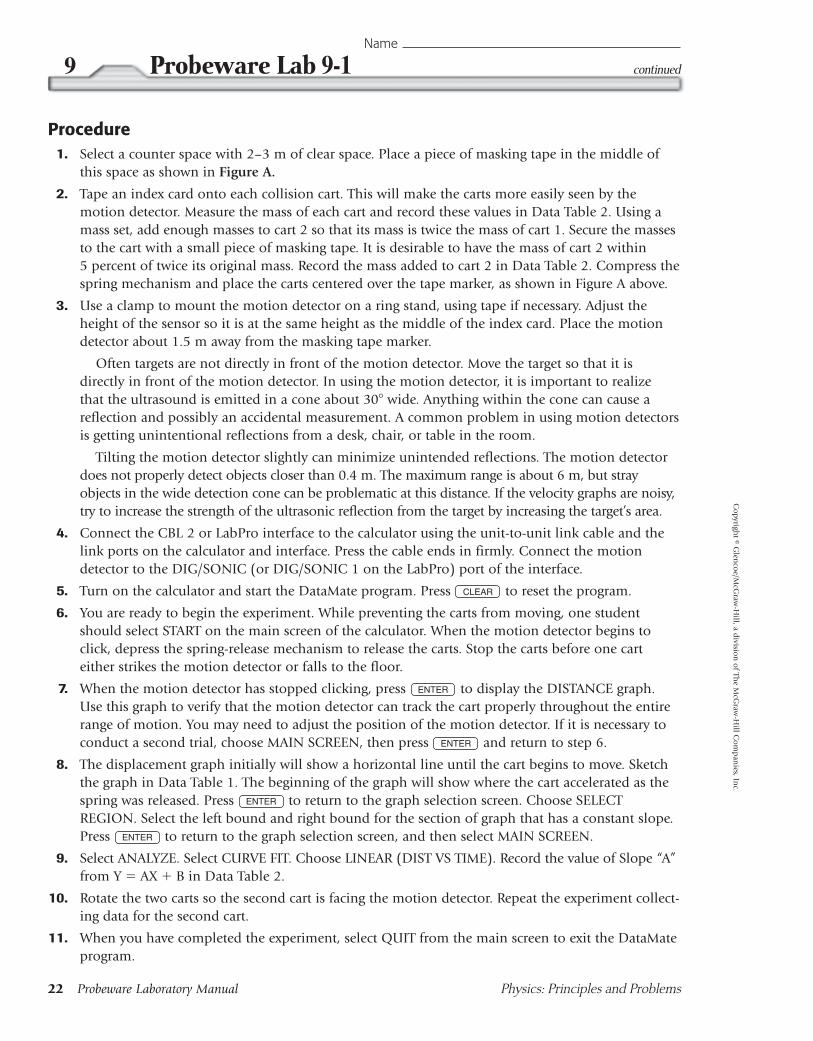
Procedure1. Select a counter space with 2–3 m of clear space. Place a piece of masking tape in the middle of
this space as shown in Figure A.
2. Tape an index card onto each collision cart. This will make the carts more easily seen by themotion detector. Measure the mass of each cart and record these values in Data Table 2. Using amass set, add enough masses to cart 2 so that its mass is twice the mass of cart 1. Secure the massesto the cart with a small piece of masking tape. It is desirable to have the mass of cart 2 within 5 percent of twice its original mass. Record the mass added to cart 2 in Data Table 2. Compress thespring mechanism and place the carts centered over the tape marker, as shown in Figure A above.
3. Use a clamp to mount the motion detector on a ring stand, using tape if necessary. Adjust theheight of the sensor so it is at the same height as the middle of the index card. Place the motiondetector about 1.5 m away from the masking tape marker.
Often targets are not directly in front of the motion detector. Move the target so that it isdirectly in front of the motion detector. In using the motion detector, it is important to realize that the ultrasound is emitted in a cone about 30 wide. Anything within the cone can cause areflection and possibly an accidental measurement. A common problem in using motion detectorsis getting unintentional reflections from a desk, chair, or table in the room.
Tilting the motion detector slightly can minimize unintended reflections. The motion detector does not properly detect objects closer than 0.4 m. The maximum range is about 6 m, but strayobjects in the wide detection cone can be problematic at this distance. If the velocity graphs are noisy,try to increase the strength of the ultrasonic reflection from the target by increasing the target’s area.
4. Connect the CBL 2 or LabPro interface to the calculator using the unit-to-unit link cable and thelink ports on the calculator and interface. Press the cable ends in firmly. Connect the motiondetector to the DIG/SONIC (or DIG/SONIC 1 on the LabPro) port of the interface.
5. Turn on the calculator and start the DataMate program. Press to reset the program.
6. You are ready to begin the experiment. While preventing the carts from moving, one studentshould select START on the main screen of the calculator. When the motion detector begins toclick, depress the spring-release mechanism to release the carts. Stop the carts before one carteither strikes the motion detector or falls to the floor.
7. When the motion detector has stopped clicking, press to display the DISTANCE graph.Use this graph to verify that the motion detector can track the cart properly throughout the entirerange of motion. You may need to adjust the position of the motion detector. If it is necessary toconduct a second trial, choose MAIN SCREEN, then press and return to step 6.
8. The displacement graph initially will show a horizontal line until the cart begins to move. Sketchthe graph in Data Table 1. The beginning of the graph will show where the cart accelerated as thespring was released. Press to return to the graph selection screen. Choose SELECTREGION. Select the left bound and right bound for the section of graph that has a constant slope.Press to return to the graph selection screen, and then select MAIN SCREEN.
9. Select ANALYZE. Select CURVE FIT. Choose LINEAR (DIST VS TIME). Record the value of Slope “A”from Y AX B in Data Table 2.
10. Rotate the two carts so the second cart is facing the motion detector. Repeat the experiment collect-ing data for the second cart.
11. When you have completed the experiment, select QUIT from the main screen to exit the DataMateprogram.
ENTER
ENTER
ENTER
ENTER
CLEAR
continuedProbeware Lab 9-19Name
22 Probeware Laboratory Manual Physics: Principles and Problems
Co
pyright © G
lenco
e/McG
raw-H
ill, a divisio
n o
f The M
cGraw
-Hill C
om
pan
ies, Inc.

Data and Observations
Physics: Principles and Problems Probeware Laboratory Manual 23
continued Probeware Lab 9-1 9Name
Co
pyri
ght
© G
len
coe/
McG
raw
-Hil
l, a
div
isio
n o
f Th
e M
cGra
w-H
ill
Co
mp
anie
s, I
nc.
Data Table 1
Sketch distance v. time graphs
Cart 1 Cart 2
Data Table 2
Slope “A” Mass (kg) Mass Added (kg)
Cart 1 NA
Cart 2
Analysis and Conclusions1. What is the velocity of each cart? How do the velocities of the carts compare?
2. Calculate the momentum of each cart after they were released.

3. What is the total momentum of the two carts before they were released?
4. What is the total momentum after the carts are released?
5. What assumptions are being made in performing step 10?
Extension and Application1. While playing baseball or softball with your friends, your hand begins to sting after you catch sev-
eral fast throws. What method of catching the ball might prevent this stinging sensation?
2. If an incident ball, A, hits two target balls, B and C, at an angle, predict what would happen to thetotal momentum of the system after the collision. Give a reason for your answer and write anequation that proves your answer.
3. When an incident ball, A, collides at an angle with a target ball, B, of equal mass that is initially atrest, the two balls always move off at right angles to each other after the collision. Use a familiarequation for a right triangle to show that this statement is true. Hint: Since the collision is elastic,kinetic energy is conserved.
continuedProbeware Lab 9-19Name
24 Probeware Laboratory Manual Physics: Principles and Problems
Co
pyright © G
lenco
e/McG
raw-H
ill, a divisio
n o
f The M
cGraw
-Hill C
om
pan
ies, Inc.

How efficient are solar collectors?When fossil fuels such as coal and oil are used up, they cannot bereplaced. Harnessing other energy sources becomes increasingly impor-tant as nonrenewable resources disappear. Solar power is a promisingrenewable energy source. Solar collectors gather the sun’s energy in aform that people can easily use. In this lab, you will design and build asimple solar collector. You will use a CBL 2 or LabPro system to measureand compare the heat collected by four cover materials: plastic wrap, waxpaper, polyethylene, and glass. Then you can check the cover materials’efficiency.
Objectives Design a procedure for investigating heat collection.
Measure temperatures and times.
Compare the heat-collecting abilities of four materials.
ProblemHow do four materials compare in their ability to collect and trap heatfrom solar energy?
HypothesisFormulate a hypothesis about the relative efficiencies of plastic wrap, waxpaper, polyethylene, and glass in collecting and trapping heat from solarenergy.
Plan the Experiment1. Work in a small group. Decide on a procedure that uses the suggested
materials (or others of your choosing) to gather data on how wellthe four materials (plastic wrap, wax paper, polyethylene, glass) collect heat from sunlight.
2. Decide what kind of data to collect and how to analyze it. You canrecord your data in the table on the next page. Label the columnsappropriately.
3. Write your procedure on another sheet of paper or in your note-book. On the next page, draw the setup you plan to use.
4. Check the Plan Have your teacher approve your plan before youproceed with your experiment. Make sure that you understand howto operate the CBL 2 or LabPro unit, graphing calculator, and tem-perature probe. Be careful with the electric power source.
Date Period Name
Physics: Principles and Problems Probeware Laboratory Manual 25
12 Probeware Lab 12-1CHAPTER
Co
pyri
ght
© G
len
coe/
McG
raw
-Hil
l, a
div
isio
n o
f Th
e M
cGra
w-H
ill
Co
mp
anie
s, I
nc.
Materials
• large coffee can with lid
• small coffee can with lid
• sheet of plastic wrap
• sheet of wax paper
• piece of polyethylene
• small pane of glass
• shredded newspapers
• CBL 2 or LabPro unit
• TI graphing calculator withunit-to-unit link cable
• TI temperature probe
• TI-Graph Link
• colored pencils
Possible Materials
Safety Precautions

Setup
continuedProbeware Lab 12-112Name
26 Probeware Laboratory Manual Physics: Principles and Problems
Co
pyright © G
lenco
e/McG
raw-H
ill, a divisio
n o
f The M
cGraw
-Hill C
om
pan
ies, Inc.
Data and Observations
Data Table

Analyze and Conclude1. Graphing Data Use the grid below to graph temperature and time data from your table. How do
your plots compare with the graphs on the TI graphing calculator?
2. Analyzing Data Which cover material is most efficient at collecting heat? Which is least efficient?Cite your data to support your answers.
3. Checking Your Hypothesis Suppose you were stranded on a sunny but cold island in the ArcticOcean. Luckily you have a supply of glass, polyethylene, wax paper, and plastic wrap and all thetools and structural supports that you need to use them. Which material would you use to build ashelter? Give reasons for your answer.
Physics: Principles and Problems Probeware Laboratory Manual 27
continued Probeware Lab 12-1 12Name
Co
pyri
ght
© G
len
coe/
McG
raw
-Hil
l, a
div
isio
n o
f Th
e M
cGra
w-H
ill
Co
mp
anie
s, I
nc.
Tem
per
atu
reTime

Apply1. If you wanted to build an inexpensive greenhouse, would you use glass or less-expensive polyethyl-
ene in the roof and sides? Why? How could you further improve the efficiency of the structure?
continuedProbeware Lab 12-112Name
28 Probeware Laboratory Manual Physics: Principles and Problems
Co
pyright © G
lenco
e/McG
raw-H
ill, a divisio
n o
f The M
cGraw
-Hill C
om
pan
ies, Inc.

How fast does sound move in air?You are at a football game in a very large stadium. As the drummersmarch in you see the drums being hit by sticks, but you don’t hear thesound right away. The same thing happens when you see a lightning bolt,but don’t hear the thunder until moments later. Compared to mostobjects, sound waves travel very fast. It is fast enough that measuring thespeed of sound is a technical challenge. One method you could usewould be to time an echo. For example, if you were in an open field witha large building one-fourth of a kilometer away, you could start a stop-watch when a loud noise was made and stop it when you heard the echo.You could then calculate the speed of sound.
To use the same technique over short distances, you need a faster tim-ing system, such as a LabPro or CBL 2 interface. In this experiment youwill use this technique with a microphone connected to an interface todetermine the speed of sound at room temperature. The microphone willbe placed next to the opening of a hollow tube, as in Figure A. When youmake a sound by hitting two sticks together next to the opening, theinterface will begin collecting data. After the sound reflects off the oppo-site end of the tube, a graph will be displayed showing the initial soundand the echo. You will then be able to determine the round trip time andcalculate the speed of sound.
Date Period Name
Physics: Principles and Problems Probeware Laboratory Manual 29
15 Probeware Lab 15-1CHAPTER
Co
pyri
ght
© G
len
coe/
McG
raw
-Hil
l, a
div
isio
n o
f Th
e M
cGra
w-H
ill
Co
mp
anie
s, I
nc.
Microphone
1-m tube
Closed end
Objectives Measure how long it takes sound to travel down and back in a long
tube.
Calulate the speed of sound.
Compare the speed of sound in air to the accepted value at a giventemperature.
Procedure1. Use the temperature probe to measure the air temperature of the
classroom. To do this, connect a Temperature Probe to the Channel 1input on the LabPro or CBL 2 interface. Use the black link cable toconnect the interface to the TI graphing calculator. Firmly press inthe cable ends.
Figure A
Materials
• LabPro or CBL 2 interface
• TI graphing calculator
• DataMate program
• Vernier microphone
• temperature probe
• tube, 0.5-2 m long, 6–10 cmin diameter
• book or plug to cover endof tube
• meterstick or tape measure
• two pieces of wood, suchas drumsticks
Materials
Safety Precautions

2. Turn on the calculator and start the DATAMATE program. Press to reset the program.
3. If the calculator displays a temperature probe in CH 1, proceed directly to step 4. Otherwise, set upthe calculator and interface for the temperature probe.
a. Select SETUP from the main screen.
b. Press to select CH 1.
c. Select TEMPERATURE from the SELECT SENSOR menu.
d. Select the Temperature Probe you are using (in C) from the TEMPERATURE menu.
e. Select OK to return to the main screen.
4. The temperature will be displayed on the calculator screen. With the tip of the temperature probein open air, away from sunlight, wait until the readings become stable. Variations in the tenths digit are not important. Record the room temperature in your data table.
5. Disconnect the temperature probe and connect the Vernier microphone to the channel 1 input onthe interface. Press to reset the program.
6. Set up the calculator and interface for the microphone.
a. Select SETUP from the main screen.
b. If the calculator displays a microphone in CH 1, proceed directly to the following step. If it doesnot, continue with this step to set up your sensor manually.
c. Press to select CH 1.
d. Choose MICROPHONE from the SELECT SENSOR list.
e. Select CBL, ULI, or MPLI, according to the type of microphone you are using.
7. Set up the interface to trigger on the first loud sound the microphone detects.
a. Press once to select MODE and press .
b. Select TIME GRAPH from the SELECT MODE screen.
c. Select ADVANCED from TIME GRAPH SETTINGS.
d. Select CHANGE TRIGGERING from ADV. TIME GRAPH SETTINGS.
e. Select CH1-MICROPHONE from SELECT TRIGGERING.
f. Select INCREASING from TRIGGER TYPE.
g. Enter “0.1” for a trigger threshold. End this and all other numeric entries by pressing .(Use “2.6” if you are using a ULI or CBL microphone.)
h. Enter “0” for the prestore.
i. Select OK three times to return to the main screen.
8. Close the end of the tube. This can be done by inserting a plug or standing a book against the endso it is sealed. Measure the length of the tube and record in the data table.
9. Place the microphone as close to the end of the long tube as possible. Position the microphone sothat it can detect the initial sound and the echo coming back down the tube.
10. Select START to begin data collection. Snap your fingers near the opening of the tube. Or you canclap your hands at the opening of the tube. This sharp sound will trigger the interface to begin col-lecting data.
ENTER
ENTER
ENTER
CLEAR
ENTER
CLEAR
continuedProbeware Lab 15-115Name
30 Probeware Laboratory Manual Physics: Principles and Problems
Co
pyright © G
lenco
e/McG
raw-H
ill, a divisio
n o
f The M
cGraw
-Hill C
om
pan
ies, Inc.

11. If you are successful, the graph will resemble the one in Figure B. You may not see a third reflec-tion. In this figure each of three highest peaks corresponds to the same point on a waveform. Thefirst peak is the initial sound, the second is the first reflection, and the third is a second reflection.Repeat your run if necessary by pressing and returning to the previous step. Use the cursorkeys to trace across the graph. Determine the time interval between the start of the first vibrationand the start of the echo vibration. Record these two times in your data table.
12. Repeat the measurement for a total of five trials.
Data and Observations
Data Table
ENTER
Physics: Principles and Problems Probeware Laboratory Manual 31
continued Probeware Lab 15-1 15Name
Co
pyri
ght
© G
len
coe/
McG
raw
-Hil
l, a
div
isio
n o
f Th
e M
cGra
w-H
ill
Co
mp
anie
s, I
nc.
Length of tube m
Temperature of room C
Trial Time of Direct Time of Echo Time IntervalSound Start (s) Start (s) (s)
1
2
3
4
5
Average
Speed (m/s)
Figure B

Analysis and Conclusions1. From the time-pairs you recorded in the data table, calculate the differences to find the time inter-
val, and then calculate the average time interval.
2. Calculate the speed of sound. Remember that your average time interval represents the time forsound to travel down the tube and back.
3. The accepted speed of sound at atmospheric pressure and 0C is 331.5 m/s. The speed of soundincreases 0.607 m/s for every Celsius degree. Calculate the speed of sound at the temperature ofyour room and compare your measured value to the accepted value. Calculate the percent error.
Extension and Application1. Repeat this experiment, but collect data using a tube with an open end. How do the reflected
waves for the closed-end tube compare to the reflections with an open-end tube? It might be easierto see any changes by striking a rubber stopper held next to the opening instead of snapping yourfingers. Explain any differences. Calculate the speed of sound and compare it to the results with atube with a closed end.
2. This experiment can be performed without a tube. You need an area with a smooth surface. Multi-ple reflections may result (floor, ceiling, windows, etc.), adding to the complexity of the recordeddata.
3. Fill a tube with another gas, such as carbon dioxide or helium. Be sure to flush the air out with theexperimental gas. For gases that are heavier than air, such as carbon dioxide, orient the tube verti-cally and use a sealed lower end. Invert the tube for gases that are lighter than air.
4. Use this technique to measure the speed of sound in air at different temperatures.
5. Develop a method for measuring the speed of sound in a medium that is not a gas.
continuedProbeware Lab 15-115Name
32 Probeware Laboratory Manual Physics: Principles and Problems
Co
pyright © G
lenco
e/McG
raw-H
ill, a divisio
n o
f The M
cGraw
-Hill C
om
pan
ies, Inc.

How does light intensity depend ondistance?You may have studied in another science class that the brightness of a stardepends on how big it is and how far away it is. If this page is illuminat-ed by a single lightbulb, more light will strike the page the closer you getto the lightbulb. Using the light sensor, the brightness of a lightbulb canbe measured as the distance from the bulb is changed. Since there aremany ways to measure light brightness (luminuous flux, illuminance,luminous intensity, irradiance, etc.), and many different types of lightsensors can be used, the term intensity will be used during this experiment,even though this term is not appropriate for your sensor. This is possiblebecause the relative changes in distance will be measured as compared tothe relative amounts of intensity at these distances. After you have mea-sured light intensities at various distances from the light source, you willdetermine the mathematical relationship of these variables using thegraphing calculator.
Objectives Predict the effect of distance on light’s intensity.
Determine the relationship between intensity and distance from alight source.
Procedures1. Attach the light sensor to channel 1 on the LabPro or CBL 2 inter-
face. If the sensor has a range switch, set it to 6000 lux. Use theblack link cable to connect the interface to the TI graphing calcula-tor. Firmly press in the cable ends.
2. Turn on the calculator and start the DataMate program. Pressto reset the program.
3. If CH 1 displays the Light Sensor and its current reading, skip theremainder of this step. If it does not, manually set up DataMate forthe sensor. To do this,
a. Select SETUP from the main screen.
b. Press to select CH 1.
c. Choose LIGHT from the SELECT SENSOR list.
d. Choose 6000 LUX from the LIGHT list. The sensor will read inunits of lux.
e. Select OK to return to the main screen.
f. Set up the calculator and the interface for the appropriate datacollection mode.
ENTER
CLEAR
Date Period Name
Physics: Principles and Problems Probeware Laboratory Manual 33
16 Probeware Lab 16-1CHAPTER
Co
pyri
ght
© G
len
coe/
McG
raw
-Hil
l, a
div
isio
n o
f Th
e M
cGra
w-H
ill
Co
mp
anie
s, I
nc.
Materials
• LabPro or CBL 2 interface
• TI graphing calculator
• DataMate program
• light sensor
• meterstick
• mini-flashlight
Materials
Safety Precautions

4. Select SETUP from the main screen.
5. Press to select MODE and press .
6. Select EVENTS WITH ENTRY from the SELECT MODE menu to collect light intensity data as afunction of distance. In this mode you will trigger the interface to record the light intensity foreach position you choose. Select OK to return to the main screen.
7. Make sure that the filament axis of the lightbulb is horizontal and pointing directly at the lightsensor. This makes the lightbulb look more like a point source of light as seen by the light sensor.See an example of the set-up in Figure A.
8. The filament and light sensor should be at the same vertical height. Place the end of the filament(not the glass) at the 0.0-cm mark of the meterstick.
9. Turn down the lights to darken the room. A very dark room is critical to obtaining good results.There should be no reflective surfaces behind, beside, or below the bulb.
10. Place the light sensor 10 cm from the lightbulb filament. Move the sensor away from the bulb andwatch the displayed intensity values on the calculator screen. What is your prediction for the rela-tionship between intensity and the distance to a light source?
11. Again place the light sensor 10 cm from the lightbulb filament. The distance must be measuredcarefully. Be sure you measure from the filament of the lamp to the sensor tip on the light sensor.
12. Select START from the main screen to prepare for data collection. (Data will be collected onlywhen you press .)
13. Wait for the value displayed on the calculator to stabilize. Press , and then enter the distance between the light sensor and the light source on the calculator. Press to concludeyour entry.
14. Move the light sensor 1 cm farther away from the light source and repeat step 13.
15. Continue moving the sensor in 1-cm increments until the light sensor is 20 cm from the lightsource, collecting data as before. After the final data point, press to end data collection.
ENTER
ENTER
ENTER
Mini light Light sensorMeter stick
LabPro orCBL Calculator
ENTER
continuedProbeware Lab 16-116Name
34 Probeware Laboratory Manual Physics: Principles and Problems
Co
pyright © G
lenco
e/McG
raw-H
ill, a divisio
n o
f The M
cGraw
-Hill C
om
pan
ies, Inc.
Figure A
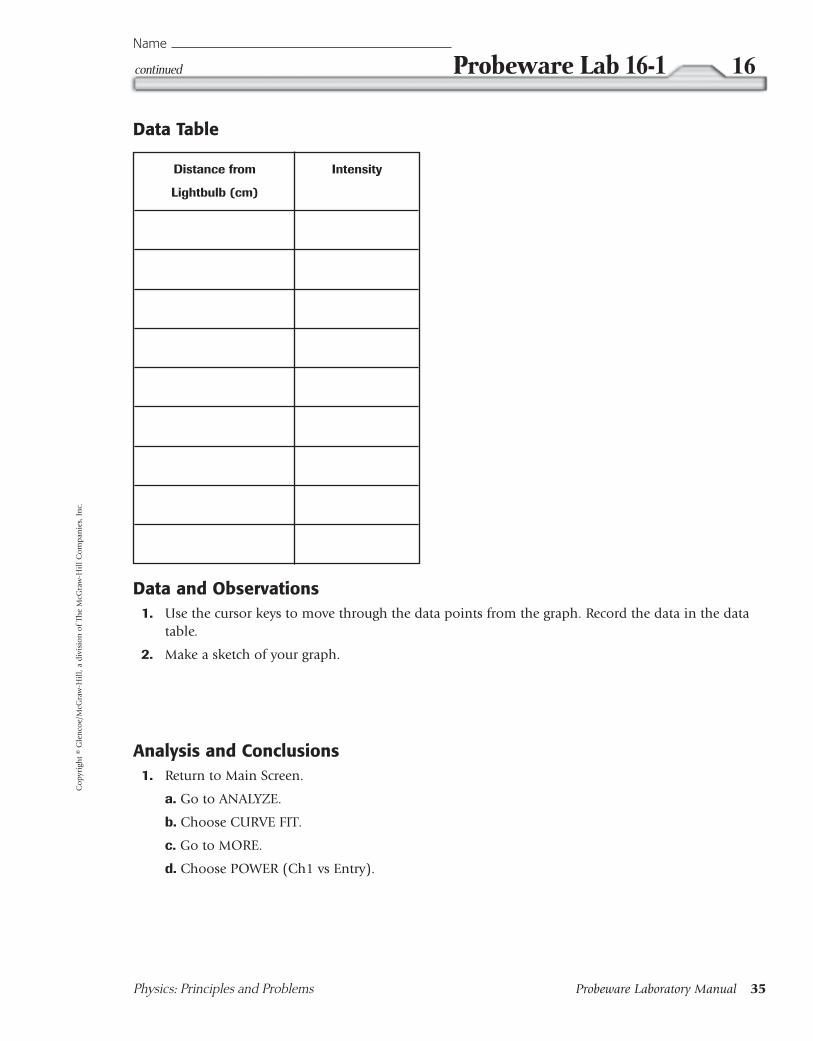
Data Table
Physics: Principles and Problems Probeware Laboratory Manual 35
continued Probeware Lab 16-1 16Name
Co
pyri
ght
© G
len
coe/
McG
raw
-Hil
l, a
div
isio
n o
f Th
e M
cGra
w-H
ill
Co
mp
anie
s, I
nc.
Distance from Intensity
Lightbulb (cm)
Data and Observations1. Use the cursor keys to move through the data points from the graph. Record the data in the data
table.
2. Make a sketch of your graph.
Analysis and Conclusions1. Return to Main Screen.
a. Go to ANALYZE.
b. Choose CURVE FIT.
c. Go to MORE.
d. Choose POWER (Ch1 vs Entry).

e. Write down the power equation in the form Y AX^B
f. Sketch the graph shown on the calculator screen.
2. What does the value of B tell you about the relationship between the intensity of the light bulbversus the distance from it?
3. How does your graph of light intensity v. distance compare to your prediction made in step 10?
4. What are some reasons your experimental setup did not exactly match the relationship you pre-dicted in step 10 concerning intensity and distance?
Extension and Application1. To confirm the relationship between light intensity and distance, find the linear plot of I k1/d2.
Use your calculator to verify the inverse square relationship between intensity and distance. Enterdata so that intensity v. 1/distance2 can be graphed. How can you tell if the inverse square rela-tionship holds for your data?
2. Use the light sensor to test other light sources. For example, how does intensity vary as you moveaway from a fluorescent bulb?
continuedProbeware Lab 16-116Name
36 Probeware Laboratory Manual Physics: Principles and Problems
Co
pyright © G
lenco
e/McG
raw-H
ill, a divisio
n o
f The M
cGraw
-Hill C
om
pan
ies, Inc.

Measuring Ultraviolet LightWhat causes you to get sunburn? The wavelength of light responsible foryour red and blistering skin is ultraviolet (UV) light. It turns out that UVlight is also responsible for many other health concerns, some wellknown, and others not so well known.
Ultraviolet light is broken down into three types identified as UVA,UVB, and UVC, as shown in Figure A. The most harmful of these is UVC(100–250 nm). It usually does not reach the Earth’s surface because ozonein the upper atmosphere absorbs it long before it can damage things onthe Earth’s surface. UVB light (250–320 nm) is responsible for many skinproblems, such as sunburns and several forms of skin cancer. It is also acause of cataracts and other types of eye damage. The longer wavelength,UVA (320–400 nm), was thought to be the most benign form of UV, butit can deeply penetrate the skin, causing tanning, wrinkles, and someforms of skin cancer. Over time, UVA also can lead to some forms of eyedamage.
In this experiment, a black light will be used to produce UVA wave-lengths. A tube black light is basically a fluorescent lamp with a differenttype of phosphor coating. This coating absorbs harmful shortwave UVBand UVC light and emits UVA light (in the same basic way the phosphorin a fluorescent lamp absorbs UV light and emits visible light). The“black” glass tube itself blocks most visible light, so in the end onlybenign long-wave UVA light and some blue and violet visible light passthrough. You will study what types of materials can absorb or transmitUVA light. Using this data, you can determine the relative safety of howto decrease your exposure to UVA light.
Radio IR Visible UV X Rays
UVA UVB UVC400 nm
400 nm 100 nm
320 nm 290 nm 100 nm
Date Period Name
Physics: Principles and Problems Probeware Laboratory Manual 37
18 Probeware Lab 18-1CHAPTER
Co
pyri
ght
© G
len
coe/
McG
raw
-Hil
l, a
div
isio
n o
f Th
e M
cGra
w-H
ill
Co
mp
anie
s, I
nc.
Figure A
Materials
• Logger Pro or CBL 2 interface
• TI graphing calculator
• DataMate program
• link cable
• tube black light
• UVA sensor
• UVB sensor
• selection of eyeglass andsunglass lenses
• selection of glass platesand plastic materials
• polarizing filters
Materials
Safety Precautions

Objectives Compare absorption and transmission of UV light through glass, plastic, and various filters.
Calculate the ability of a material, such as sunglasses, polarizing filters, and glass to filter UV light.
Discuss safety concerns of UV light.
Procedure1. Firmly connect the link cable from the calculator to the LabPro or CBL2. Plug the UVA sensor into
Channel 1 of the LabPro or CBL2.
2. Turn on the calculator and start the DataMate program. Press to reset the program. Theprogram should set up the UVA probe. You will be able to monitor the level of UV on the calcula-tor screen throughout the experiment.
3. Next, zero the UVA probe. From the main screen choose SETUP. Go to ZERO. Select CH1. Makingsure the end of the probe is blocked from any UV source, press to zero the probe.
4. Place the UVA probe about 15 cm from a tube black light. Turn on the black light. Take a readingof UVA intensity from the calculator screen. Wait for reading to stabilize. Enter your value in DataTable 1.
5. Leaving the UVA probe in the same position from the black light, place a glass plate between theblack light and the probe. Take a reading of UVA intensity from the calculator screen and recordthe data in Data Table 1. Next, place two pieces of glass plates together and take a reading. Then,try three pieces of glass and take a reading.
6. Repeat step 5, except use a polarizing filter between the black light and the probe. Rotate the filter.Record the UVA intensity in Data Table 1.
7. Repeat step 5, except use various types of eyeglass and sunglass lenses. Record UVA intensity foreach in Data Table 1.
8. Repeat step 5, except use various types of colored filters. Record UVA intensity for each in DataTable 1.
9. Repeat step 5, except use various types of plastics. Record UVA intensity for each in Data Table 1.
ENTER
CLEAR
continuedProbeware Lab 18-118Name
38 Probeware Laboratory Manual Physics: Principles and Problems
Co
pyright © G
lenco
e/McG
raw-H
ill, a divisio
n o
f The M
cGraw
-Hill C
om
pan
ies, Inc.

Data and Observations
Physics: Principles and Problems Probeware Laboratory Manual 39
continued Probeware Lab 18-1 18Name
Co
pyri
ght
© G
len
coe/
McG
raw
-Hil
l, a
div
isio
n o
f Th
e M
cGra
w-H
ill
Co
mp
anie
s, I
nc.
Data Table 1
Type of Filter UVA (mW/m2) for UVA (mW/m2) for UVA (mW/m2) forSample 1 Sample 2 Sample 3
No filter
Glass plate
Polarizing
Eyeglass lens
Sunglass lens
Colored filters
Plastics
Analysis and Conclusions1. Calculate the percent UVA blockage of each type of filter used. Use the formula: % UVA blockage
(UVA of bulb UVA with filter) 100 %/UVA of bulb.
2. From your data, what types of materials appear to effectively block UVA?
3. If you had tested the tube black light with a UVB probe, what results would you have gotten in thisexperiment?

4. If a regular fluorescent lamp is available, test for UVA intensity. How does this compare to theblack light?
Extension and Application1. Compare ultraviolet intensity (A or B) on cloudy and sunny days. This can be done outside as a
long term investigation.
2. Test for UVA and UVB sunglass protection from the sun. Determine how sunglass lenses are ratedfor UVA and UVB protection.
3. Investigate the latest research into UVA health concerns for skin and eyes.
4. Investigate the types of bulbs used in tanning booths.
continuedProbeware Lab 18-118Name
40 Probeware Laboratory Manual Physics: Principles and Problems
Co
pyright © G
lenco
e/McG
raw-H
ill, a divisio
n o
f The M
cGraw
-Hill C
om
pan
ies, Inc.

Current, Resistance, and PotentialDifference in CircuitsOhm’s law is a statement of the relationship between potential difference(commonly called voltage), current, and resistance. As electrons flowthrough ordinary conductors, they encounter forces that oppose theirmotion. This opposition to electron flow is called resistance. The forcethat moves the electrons is potential difference (voltage). The quantity ofelectrons that move is the current.
Every electronics company must use Ohm’s law to design its products.Electric companies use this law when they design high-voltage powerlines. A wire must be able to carry enough current at a given voltage, andOhm’s law is used to determine how much resistance that wire can have.Ohm’s law applies not only to direct-current circuits, but to any circuitwhere current is carried through a resistor, including alternating current.
Objectives Measure the current flowing through a resistor and the potential
difference across a resistor.
Calculate resistance from the measured values.
Analyze the relationship between potential difference and current for aresistor.
ProblemWhat is the relationship between current, resistance, and potential differ-ence in a circuit?
HypothesisFormulate a hypothesis about the relationship between current, resis-tance, and potential difference in a circuit.
Plan the Experiment1. Decide on a procedure that uses the suggested materials (or others
of your choosing) to measure voltages. Using the relationship I V/R, predict the relationship between the current through thecircuit and the voltage across the resistor in the circuit.
2. On the next page, draw a circuit with the resistor that you will usefor the experiment. Indicate position where you will place the volt-age and current probes. Remember that a voltage probe must bewired in parallel and that the current probe must be wired in series.
Date Period Name
Physics: Principles and Problems Probeware Laboratory Manual 41
22 Probeware Lab 22-1CHAPTER
Co
pyri
ght
© G
len
coe/
McG
raw
-Hil
l, a
div
isio
n o
f Th
e M
cGra
w-H
ill
Co
mp
anie
s, I
nc.
Materials
• power supply or battery:two 1.5-V cells
• connecting wire
• knife switch
• 100-Ω, 150-Ω, and 220-Ωresistors
• CBL 2 or LabPro interface
• link cable
• Vernier current probe
• voltage probe
• TI graphing calculator
Materials
Safety Precautions

3. Decide what kind of data to collect and how to analyze it. You can record your data in the tablebelow. Label the columns appropriately.
4. Write your procedure on another sheet of paper or in your notebook.
5. Check the Plan Have your teacher approve your plan before you proceed with your experiment.
Current, Resistance, and Potential Difference in Circuits
continuedProbeware Lab 22-122Name
42 Probeware Laboratory Manual Physics: Principles and Problems
Co
pyright © G
lenco
e/McG
raw-H
ill, a divisio
n o
f The M
cGraw
-Hill C
om
pan
ies, Inc.
Data Table

Analysis and Conclusions1. Why can you use the slope of the graph of potential difference versus current to find the value of
the resistor?
2. Compare the printed values of the resistors you used with your “A” slope values. Determine therelative error for each resistor.
3. If your values were not within the tolerance range of the printed values, suggest some reasons forthe discrepancy.
4. Describe the proper placement of an ammeter in a circuit.
5. Describe the proper placement of a voltmeter in a circuit.
6. What is the relationship between current through a circuit, the potential difference, and the resis-tance of the circuit?
Physics: Principles and Problems Probeware Laboratory Manual 43
continued Probeware Lab 22-1 22Name
Co
pyri
ght
© G
len
coe/
McG
raw
-Hil
l, a
div
isio
n o
f Th
e M
cGra
w-H
ill
Co
mp
anie
s, I
nc.

Apply1. Obtain a resistor of unknown value from your teacher. Use the procedure above to determine its
resistance in ohms.
2. A lightbulb, after it has reached its operating temperature, has a potential difference of 120 Vapplied across it, while 0.50 A of current passes through it. What is the resistance of the light bulb?
3. The lightbulb in question 2 has a resistance of 21 Ω when cold. What is the current, in amperes, atthe instant the bulb is connected to a potential difference of 120 V?
continuedProbeware Lab 22-122Name
44 Probeware Laboratory Manual Physics: Principles and Problems
Co
pyright © G
lenco
e/McG
raw-H
ill, a divisio
n o
f The M
cGraw
-Hill C
om
pan
ies, Inc.

What happens to voltage across a resistor in a series circuit?A series circuit has two or more devices connected so that all the currentin the circuit flows through each device in turn. When all the devices areresistors, you have a series resistance circuit. In a properly constructedseries circuit, all devices have the same amount of current through them.Think of a series circuit as if it were several pieces of hose with differentdiameters, connected end-to-end. The volume of water that flows out ofthe hose must be the same as the volume that enters the hose, no matterwhat the diameter. Each resistance in a series circuit can be analyzedusing the relationship I V/R. The voltage across the entire series circuitmust be equal to the sum of the voltages across each part of the circuit.
Series resistance circuits have many electric and electronic applications.They are most often used to divide a voltage into two or more smallervoltages, such as allowing one battery or power supply to provide morethan one value of voltage. Series circuits can also reduce a large voltage toa smaller one, which is how it is possible for a multimeter to measure awide range of voltages.
Objectives Measure the voltage across each resistor in a series circuit.
Measure the current in a series circuit.
Observe the voltage drop across a resistor and the total voltage dropacross the series circuit.
Determine the relationship between the voltage drop across a resistorand its reference.
ProblemWhat is the relationship between the voltage drops across resistors in aseries circuit and the total voltage across the circuit?
HypothesisFormulate a hypothesis about the relationship between voltage acrossresistors in a circuit and the circuit’s total resistance.
Plan the Experiment1. Decide on a procedure that uses the suggested materials (or others
of your choosing) to measure voltages in a series resistance circuitthat includes a source of voltage. Using the relationship I V/R,predict the relationship between the current through the circuit andthe voltage across each resistor in the circuit.
Date Period Name
Physics: Principles and Problems Probeware Laboratory Manual 45
23 Probeware Lab 23-1CHAPTER
Co
pyri
ght
© G
len
coe/
McG
raw
-Hil
l, a
div
isio
n o
f Th
e M
cGra
w-H
ill
Co
mp
anie
s, I
nc.
Materials
• power supply with variablevoltage
• wires with clips
• resistors, 100 , 150 , 220 , 470
• voltage probe
• current probe
• knife switch
• CBL 2 or LabPro unit
• unit-to-unit link cable
• TI graphing calculator
Materials
Safety Precautions
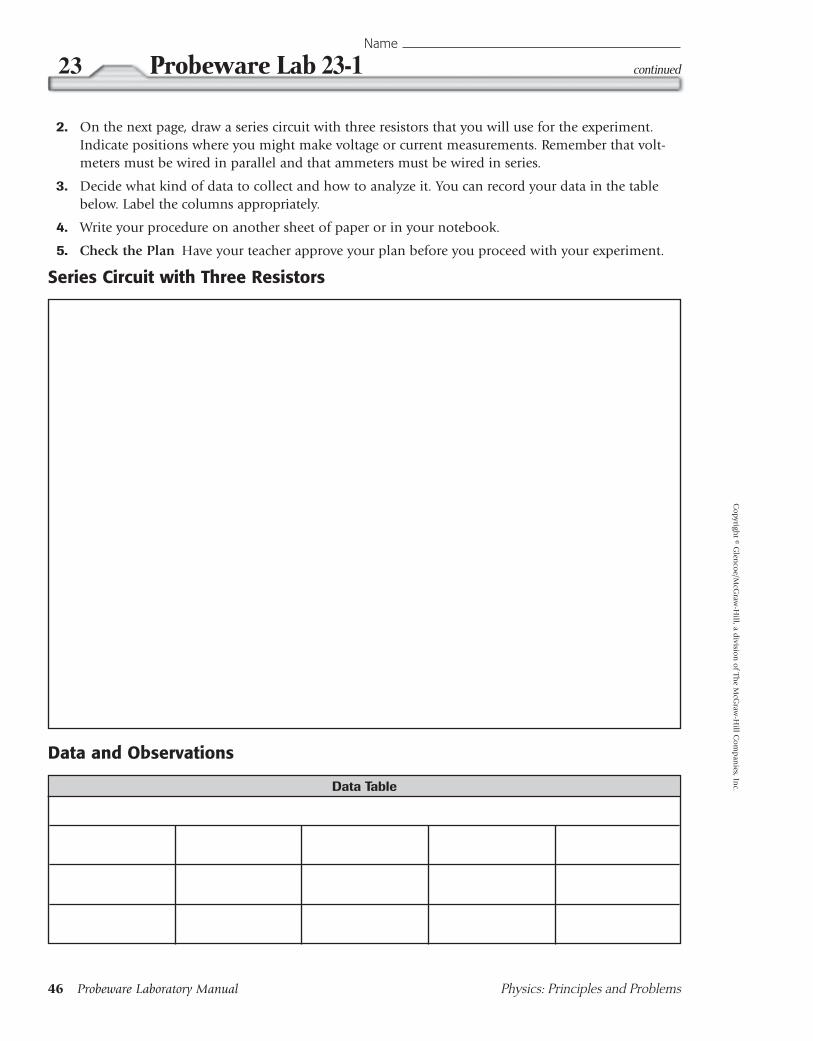
2. On the next page, draw a series circuit with three resistors that you will use for the experiment.Indicate positions where you might make voltage or current measurements. Remember that volt-meters must be wired in parallel and that ammeters must be wired in series.
3. Decide what kind of data to collect and how to analyze it. You can record your data in the tablebelow. Label the columns appropriately.
4. Write your procedure on another sheet of paper or in your notebook.
5. Check the Plan Have your teacher approve your plan before you proceed with your experiment.
Series Circuit with Three Resistors
continuedProbeware Lab 23-123Name
46 Probeware Laboratory Manual Physics: Principles and Problems
Co
pyright © G
lenco
e/McG
raw-H
ill, a divisio
n o
f The M
cGraw
-Hill C
om
pan
ies, Inc.Data Table
Data and Observations

Analyze and Conclude1. Analyzing Results What is the relationship between the voltage drop across the individual resis-
tors in the circuit and the power-supply voltage?
2. Analyzing Results Is the voltage drop across each resistor related to the value of the resistor? Givea reason for your answer.
3. Checking Your Hypothesis Would removing a resistor affect the voltage drops across the remain-ing resistors in a series resistance circuit? Give a reason for your answer.
4. Checking Your Hypothesis Describe the total current in a series resistance circuit in relation tothe total resistance and to the voltage applied to the circuit.
5. Predicting Predict the equivalent resistance of a circuit when the circuit consists of resistors inseries. Use several resistors and an ohmmeter to check your prediction.
Physics: Principles and Problems Probeware Laboratory Manual 47
continued Probeware Lab 23-1 23Name
Co
pyri
ght
© G
len
coe/
McG
raw
-Hil
l, a
div
isio
n o
f Th
e M
cGra
w-H
ill
Co
mp
anie
s, I
nc.

Apply1. A set of 100 lightbulbs wired in series lines a sidewalk. The set of lights is designed to operate on
120 V. If the set uses 0.5 A of current, what is the average resistance of each individual bulb? Whatis the average voltage across each lightbulb?
2. You are asked to determine the resistance value of an unmarked resistor. You have a voltmeter, abattery, and several resistors of known value. Explain the method you would use to determine thevalue of the unmarked resistor using only these items.
continuedProbeware Lab 23-123Name
Co
pyright © G
lenco
e/McG
raw-H
ill, a divisio
n o
f The M
cGraw
-Hill C
om
pan
ies, Inc.
Related Documents