For use with: • Glencoe Mathematics Courses 1-3 • Glencoe Pre-Algebra • Glencoe Algebra 1 • Glencoe Algebra 2

Welcome message from author
This document is posted to help you gain knowledge. Please leave a comment to let me know what you think about it! Share it to your friends and learn new things together.
Transcript

For use with:• Glencoe Mathematics Courses 1-3• Glencoe Pre-Algebra• Glencoe Algebra 1• Glencoe Algebra 2

Copyright © by the McGraw-Hill Companies, Inc. All rights reserved.Permission is granted to reproduce the material contained herein on the conditionthat such material be reproduced only for classroom use; be provided to students,teacher, and families without charge; and be used solely in conjunction withGlencoe Mathematics product. Any other reproduction, for use or sale, is prohibitedwithout prior written permission of the publisher.
Send all inquiries to:Glencoe/McGraw-Hill8787 Orion PlaceColumbus, OH 43240
ISBN 13: 978-0-07-876070-9
ISBN: 0-07-876070-4 Science and Mathematics Lab Manual
Printed in the United States of America
1 2 3 4 5 6 7 8 9 10 079 13 12 11 10 09 08 07 06
Texas Instrument Calculators LabsEight of the labs in this booklet are written for use with the TexasInstrument calculators and either the CBR2™ (Calculator-BasedRanger) or CBL2™ (Calculator-Based Laboratory). TI-83/84 versionsof graphing calculator programs required for some of these labs canbe found on pages 207–209 of this book.
Centimeter Grid MastersSome of the labs in this booklet require centimeter grid paper. A mas-ter for making this paper is available on page 210 of this book.

Teacher’s Guide to Using the Science and Mathematics Lab Manual .....................................vGuide to Using the Science and Mathematics Labs with Glencoe Textbooks.........................vi
Type ofLab Science* Title Page
1 L Digestion of Fats...........................................................................................001
2 L Measuring Heartbeat ....................................................................................005
3 L Ponds are Cities of Life ................................................................................009
4 L Sea Stars: Size, Shape, and Symmetry .......................................................013
5 E Living Space .................................................................................................017
6 E Density and Buoyancy ..................................................................................021
7 P The Period of a Pendulum............................................................................025
8 E Air Particulate Sampling ...............................................................................029
9 P Distance, Velocity, and Time.........................................................................033
10 E Using a Clinometer .......................................................................................037
11 P Chemical Solutions .......................................................................................041
12 P The Bicycle: A Well-Engineered Machine.....................................................045
13 E Sun and Temperature ...................................................................................049
14 E Getting Gas From Water...............................................................................053
15 P The Force of a Bean.....................................................................................057
16 P The Way the Ball Bounces ...........................................................................061
17 P Simulating Radioactive Decay ......................................................................065
18 E Smoke Pollution ............................................................................................069
19 L Genetic Traits................................................................................................073
20 E It’s Raining, It’s Pouring ................................................................................077
21 P Pulleys ..........................................................................................................081
22 E Scientific Notation and Astronomical Distances ...........................................085
23 L The Gender of Children ................................................................................089
24 E Electrical Charges.........................................................................................093
25 L Plant Growth .................................................................................................097
26 L Classification by Traits ..................................................................................101
27 E Predicting Earthquakes.................................................................................107
28 L Caloric Content and Box-and-Whisker Plots.................................................111
29 P Speed and Acceleration ................................................................................117
30 P Reflection of Light .........................................................................................121
31 L, E Physical Factors of Soil ................................................................................125
* E = Earth Science L = Life Science P = Physical Science
Contents
iii

iv
Type ofLab Science* Title Page
32 P Graphing Relationships.................................................................................129
33 P Using Physical Properties.............................................................................135
34 L, E The Law of Probability ..................................................................................139
35 P Variation in the Strength of Electromagnets .................................................145
36 P Determining Percent Acetic Acid in Vinegar .................................................149
37 E, P Projectile Motion ...........................................................................................153
38 E Tracking Hurricanes......................................................................................159
39 L A Mathematical Look at Cell Size .................................................................165
40 P The Effect of a Solute on Freezing Point......................................................171
41 P Rates of Diffusion of Gases..........................................................................177
42 P Determining the Order of a Chemical Reaction............................................183
43 L Symmetry in Parabolas and Animals............................................................187
44 P Measuring the Densities of Pennies .............................................................193
45 L How Does Temperature Affect Mealworm Metamorphosis...........................197
46 E Wind Power and Box-and-Whisker Plots......................................................203
Appendix: TI-83/84 Programs ............................................................................................................207
Master: Centimeter Grid Paper...........................................................................................................210
* E = Earth Science L = Life Science P = Physical Science

Overview This booklet contains 46labs designed to allow students to exploretopics in life science, earth science,physical science, biology, and chemistrythrough a stimulating, yet straightforwardapproach. In each lab, students use thetools of mathematics to analyze data theyhave collected or to explore concepts inscience.
The labs are correlated for use withGlencoe Mathematics, Courses 1, 2, and 3,Glencoe Pre-Algebra, Glencoe Algebra 1,and Glencoe Algebra 2. Tables on the nextfour pages summarize which labs are to beused at each level.
Use of Technology Eight labs in thisbooklet are written for use with the TexasInstruments Calculator-Based Ranger 2™(CBR2) System or the Texas InstrumentsCalculator-Based Laboratory 2™ (CBL 2)System. These systems allow students togather data, retrieve it directly into anyCBR- or CBL-compatible graphingcalculator, and then analyze the data usingthe calculator’s data modeling andgraphing features.
When to Use the Science andMathematics Lab Manual Theselabs are an enrichment to the classroomexperience. They act as follow-up activitiesto lessons rather than introductoryactivities for mathematical concepts. Someof the labs might be assigned as outsideprojects while others require in-class time(mostly because of the materials needed).The labs also provide an opportunity toteam teach with your science colleagues.
Collaborative Teaching You maywish to consult with the science teachersat your school to do these labscooperatively as students study conceptsused in both their mathematics andscience classes. Some of the labs requirematerials that would be common to mostscience classrooms.
Cooperative Learning Most of thelabs recommend that students work ingroups. The emphasis of teamwork anddesignation of duties helps students towork more efficiently in the given timeframe.
Lab Structure Each lab containsTeaching Suggestions and StudentWorksheet pages.
The Teaching Suggestions pages include anoverview or the objectives, time required,list of materials needed and preparationinstructions, teaching tips, answers, andsuggestions for extending the lab, asappropriate.
The Student Worksheets provide all theinformation needed for students tocomplete the lab without additionalresearch.
The Student Worksheets have six sections:
• Introduction
• Objectives
• Materials
• Procedure
• Data and Observations
• Analysis
The Introduction, Objectives, and Materialslist prepares students for intent of the laband what they will be using.
The Procedure provides step-by-stepinstructions for the activity. The Data andObservations section includes graphs,charts, and tables to facilitate datacollection and recording. Thisorganizational section helps students inassimilating what they are observing asthey prepare to analyze the data. Thequestions in the Analyze section requirestudents to make conjectures about whatthey have observed. Frequently, they mayhave to use a formula or equation to arriveat the correct conclusions.
v
Teacher’s Guide to Using theScience and Mathematics Lab Manual
vi
Guide to Using the Science and MathematicsLabs with Glencoe Textbooks
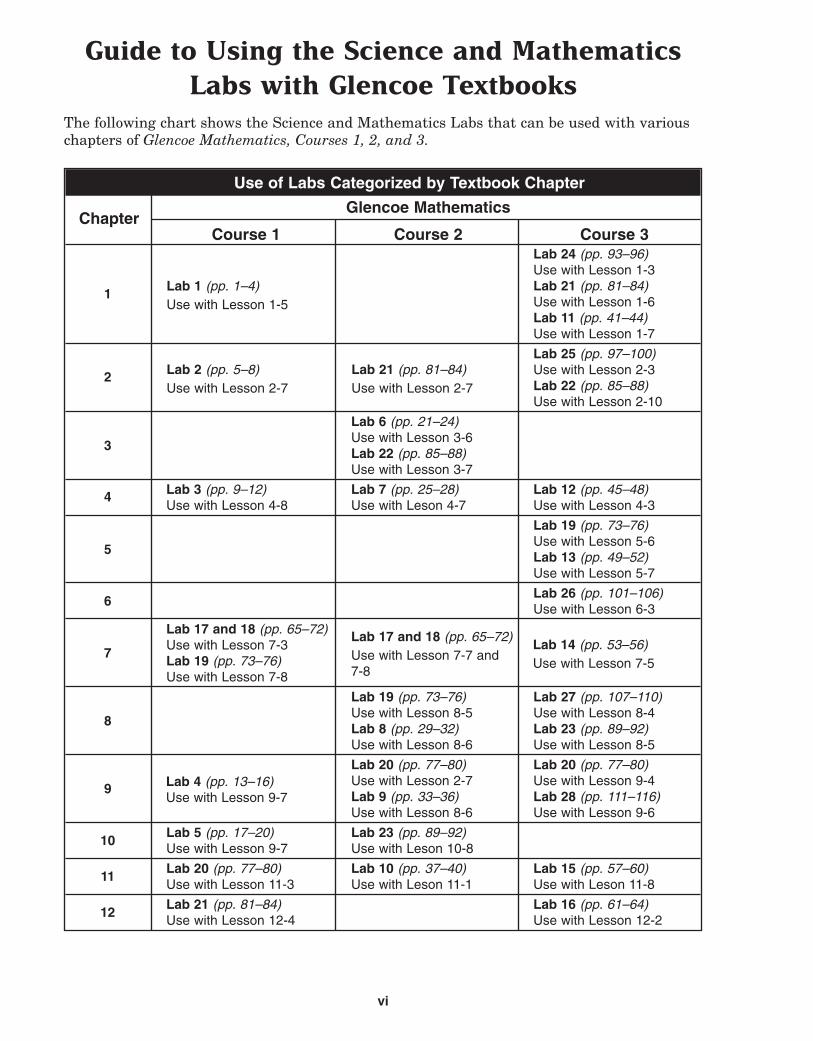
The following chart shows the Science and Mathematics Labs that can be used with variouschapters of Glencoe Mathematics, Courses 1, 2, and 3.
Use of Labs Categorized by Textbook Chapter
Glencoe MathematicsChapter
Course 1 Course 2 Course 3Lab 24 (pp. 93–96)Use with Lesson 1-3Lab 21 (pp. 81–84)Use with Lesson 1-6Lab 11 (pp. 41–44)Use with Lesson 1-7
Lab 25 (pp. 97–100)Use with Lesson 2-3Lab 22 (pp. 85–88)Use with Lesson 2-10
Lab 6 (pp. 21–24)Use with Lesson 3-6Lab 22 (pp. 85–88)Use with Lesson 3-7
Lab 3 (pp. 9–12) Lab 7 (pp. 25–28) Lab 12 (pp. 45–48)Use with Lesson 4-8 Use with Leson 4-7 Use with Lesson 4-3
Lab 19 (pp. 73–76)Use with Lesson 5-6Lab 13 (pp. 49–52)Use with Lesson 5-7
Lab 26 (pp. 101–106)Use with Lesson 6-3
Lab 17 and 18 (pp. 65–72)Use with Lesson 7-3Lab 19 (pp. 73–76)Use with Lesson 7-8
Lab 19 (pp. 73–76) Lab 27 (pp. 107–110)Use with Lesson 8-5 Use with Lesson 8-4Lab 8 (pp. 29–32) Lab 23 (pp. 89–92)Use with Lesson 8-6 Use with Lesson 8-5
Lab 20 (pp. 77–80) Lab 20 (pp. 77–80)Use with Lesson 2-7 Use with Lesson 9-4Lab 9 (pp. 33–36) Lab 28 (pp. 111–116)Use with Lesson 8-6 Use with Lesson 9-6
Lab 5 (pp. 17–20) Lab 23 (pp. 89–92)Use with Lesson 9-7 Use with Leson 10-8
Lab 20 (pp. 77–80) Lab 10 (pp. 37–40) Lab 15 (pp. 57–60)Use with Lesson 11-3 Use with Leson 11-1 Use with Leson 11-8
Lab 21 (pp. 81–84) Lab 16 (pp. 61–64)Use with Lesson 12-4 Use with Lesson 12-2
Lab 17 and 18 (pp. 65–72)Use with Lesson 7-7 and 7-8
Lab 1 (pp. 1–4)Use with Lesson 1-5
Lab 2 (pp. 5–8)Use with Lesson 2-7
Lab 21 (pp. 81–84)Use with Lesson 2-7
Lab 14 (pp. 53–56)Use with Lesson 7-5
1
2
3
4
6
5
7
8
9
10
11
12
Lab 4 (pp. 13–16)Use with Lesson 9-7

vii
The following chart shows the Science and Mathematics Labs that can be used with variouschapters of Glencoe Pre-Algebra, Glencoe Algebra 1, and Glencoe Algebra 2.
Use of Labs Categorized by Textbook Chapter
Chapter Pre-Algebra Algebra 1 Algebra 2Lab 29 (pp. 117–120)Use with Lesson 1-5Lab 15 (pp. 57–60)Use with Lesson 1-7
Lab 24 (pp. 93–96) Lab 30 (pp. 121–124) Lab 40 (pp. 171–176)Use with Lesson 2-1 Use with Lesson 2-4 Use with Lesson 2-5
Lab 30 (pp. 121–124) Lab 34 (pp. 139–144) Lab 36 (pp. 149–152)Use with Lesson 3-5 Use with Lesson 3-2 Use with Lesson 3-2
Lab 22 (pp. 85–88) Lab 35 (pp. 145–148)Use with Lesson 4-7 Use with Lesson 4-2
Lab 25 (pp. 97–100) Lab 36 (pp. 149–152)Use with Lesson 5-3 Use with Lesson 5-2
Lab 12 (pp. 45–48)Use with Lesson 6-3Lab 13 (pp. 49–52)Use with Lesson 6-6Lab 31 (pp. 125–128)Use with Lesson 6-6
Lab 32 (pp. 129–134)Use with Lesson 7-2
Lab 37 (pp. 153–158) Lab 41 (pp. 177–180)Use with Lesson 8-5 Use with Lesson 8-4
Lab 16 (pp. 61–64) Lab 42 (pp. 181–186)Use with Lesson 9-1 Use with Lesson 9-5
Lab 26 (pp. 101–106) Lab 38 (pp. 159–164) Lab 43 (pp. 187–190)Use with Lesson 10-3 Use with Lesson 10-5 Use with Lesson 10-2
Lab 14 (pp. 53–56) Lab 31 (pp. 125–128) Lab 44 (pp. 191–196)Use with Lesson 11-2 Use with Lesson 11-2 Use with Lesson 11-2
Lab 28 (pp. 111–116) Lab 45 (pp. 197–200)Use with Lesson 12-3 Use with Lesson 12-6Lab 27 (pp. 107–110) Lab 46 (pp. 201–206)Use with Lesson 12-10 use with Lesson 12-9
Lab 16 (pp. 61–64)Use with Lesson 13-6
Lab 39 (pp. 167–170)Use with Lesson 1-1
Lab 37 (pp. 153–158)Use with Lesson 6-4
Lab 33 (pp. 135–138)Use with Lesson 1-3
1
2
3
4
6
5
7
8
9
10
11
12
13
viii
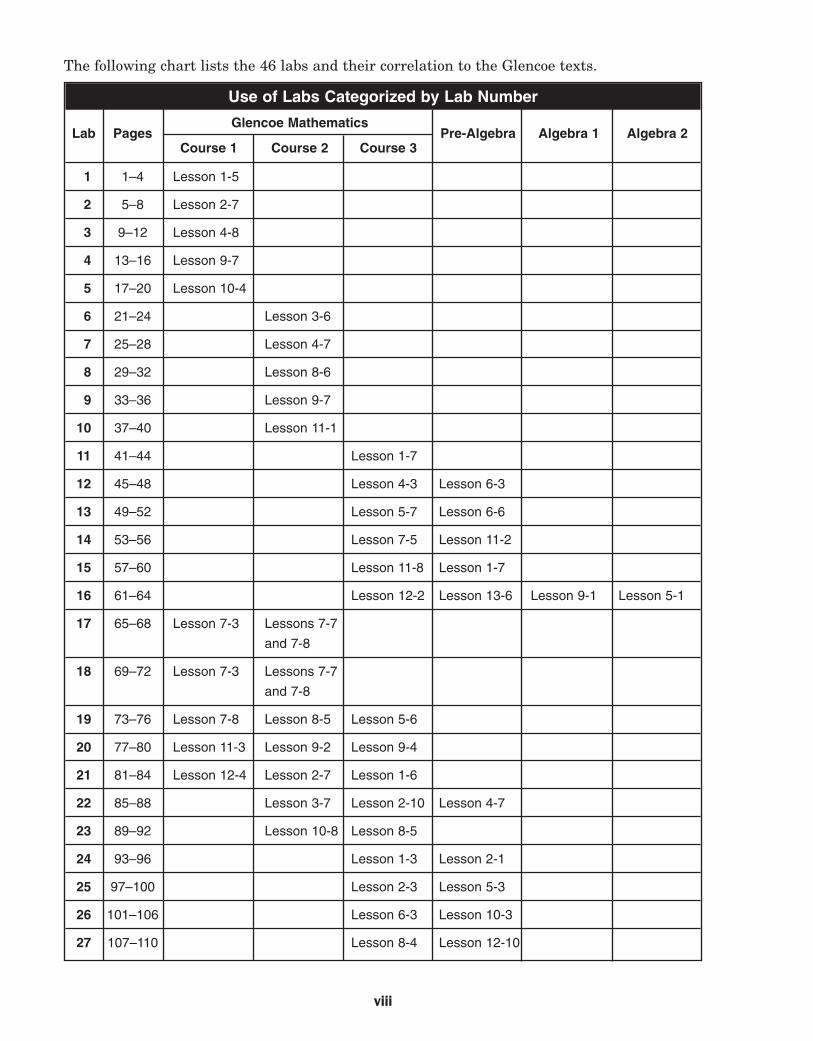
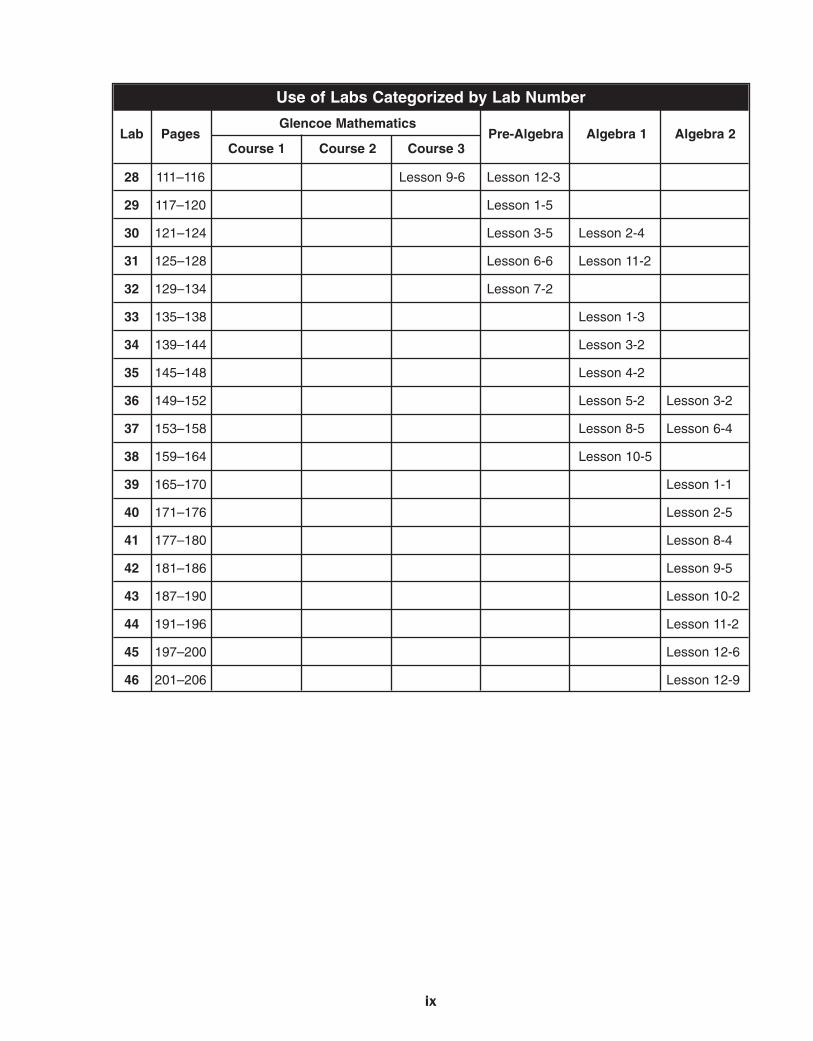
The following chart lists the 46 labs and their correlation to the Glencoe texts.
Use of Labs Categorized by Lab Number
Glencoe MathematicsLab Pages
Course 1 Course 2 Course 3Pre-Algebra Algebra 1 Algebra 2
21 21–42 Lesson 1-5
22 25–82 Lesson 2-7
23 29–122 Lesson 4-8
24 13–16 Lesson 9-7
25 17–20 Lesson 10-4
26 21–24 Lesson 3-6
27 25–28 Lesson 4-7
28 29–32 Lesson 8-6
29 33–36 Lesson 9-7
10 37–40 Lesson 11-1
11 41–44 Lesson 1-7
12 45–48 Lesson 4-3 Lesson 6-3
13 49–52 Lesson 5-7 Lesson 6-6
14 53–56 Lesson 7-5 Lesson 11-2
15 57–60 Lesson 11-8 Lesson 1-7
16 61–64 Lesson 12-2 Lesson 13-6 Lesson 9-1 Lesson 5-1
17 65–68 Lesson 7-3 Lessons 7-7
and 7-8
18 69–72 Lesson 7-3 Lessons 7-7
and 7-8
19 73–76 Lesson 7-8 Lesson 8-5 Lesson 5-6
20 77–80 Lesson 11-3 Lesson 9-2 Lesson 9-4
21 81–84 Lesson 12-4 Lesson 2-7 Lesson 1-6
22 85–88 Lesson 3-7 Lesson 2-10 Lesson 4-7
23 89–92 Lesson 10-8 Lesson 8-5
24 93–96 Lesson 1-3 Lesson 2-1
25 97–100 Lesson 2-3 Lesson 5-3
26 101–106 Lesson 6-3 Lesson 10-3
27 107–110 Lesson 8-4 Lesson 12-10
ix
Use of Labs Categorized by Lab Number
Glencoe MathematicsLab Pages
Course 1 Course 2 Course 3Pre-Algebra Algebra 1 Algebra 2
28 111–116 Lesson 9-6 Lesson 12-3
29 117–120 Lesson 1-5
30 121–124 Lesson 3-5 Lesson 2-4
31 125–128 Lesson 6-6 Lesson 11-2
32 129–134 Lesson 7-2
33 135–138 Lesson 1-3
34 139–144 Lesson 3-2
35 145–148 Lesson 4-2
36 149–152 Lesson 5-2 Lesson 3-2
37 153–158 Lesson 8-5 Lesson 6-4
38 159–164 Lesson 10-5
39 165–170 Lesson 1-1
40 171–176 Lesson 2-5
41 177–180 Lesson 8-4
42 181–186 Lesson 9-5
43 187–190 Lesson 10-2
44 191–196 Lesson 11-2
45 197–200 Lesson 12-6
46 201–206 Lesson 12-9


Overview
Lab 1 1 Science and Math Lab Manual
NAME ________________________________________ DATE ______________ PERIOD _____
Lab
1
Cop
yrig
ht ©
Gle
ncoe
/McG
raw
-Hill
, a
divi
sion
of T
he M
cGra
w-H
ill C
ompa
nies
, In
c.
Teaching the Lab
Preparations
Materials
Recommended Time
Digestion of FatsTeaching Suggestions
Lab
1
Lab 1
This activity is designed to demonstrate one of the ways math isapplied in science. Students will see how recording observations byusing numerical values creates a data set of numbers. They will usethe numbers to interpret the results of the experiment. They willdraw conclusions based on their numerical totals.
1 class period
• bile, 5% solution • vegetable oil• alcohol • metric ruler• 5 droppers • 4 stoppers to fit test tubes• lemon juice • 4 test tubes, 18 � 150 mm• masking tape • test tube rack
Bile must be obtained before the class period and can be purchasedfrom any biological supply company or may be available in the schoolchemistry or biology laboratory. It is a good idea to try the experimentbefore class to anticipate the results students are likely to achieve.
1. Have students work in groups of three. Each group member shouldwork with the test tubes and take measurements for some of thedata.
2. Stress precision in measuring all liquid amounts. It is importantthat students understand that a scientific variable is somethingthat can change. All other parts of the experiment must be equalor remain the same. If not, it is impossible to see how the changein the variable affects the results. In this experiment, if theamounts of water and oil greatly vary, the action of the bile andalcohol may not be as visible.

Analysis
Lab 1 2 Science and Math Lab Manual
NAME ________________________________________ DATE ______________ PERIOD ____C
opyright ©G
lencoe/McG
raw-H
ill, a division of The M
cGraw
-Hill C
ompanies, Inc.
Copyright ©
Glencoe/M
cGraw
-Hill, a division of T
he McG
raw-H
ill Com
panies, Inc.
Digestion of FatsTeaching Suggestions (continued)
3. To help students determine which mixture appears cloudy or clear,point out that they should hold each test tube in front of theirworksheet. They can make their decision based on how clearly theycan see the print through each solution. Also, point out that todetermine relative cloudiness, they should compare each test tubeto tube 1 by holding both tubes against the worksheet backgroundat the same time.
4. Once students have familiarized themselves with the mechanics ofthe exercise, have them summarize the objective of theexperiment. Be sure they understand what they are trying toanalyze and how they will do it.
1. No. The mixture in tube 1 did not appear cloudy after shaking.
2. The chemicals with the highest number totals will be the best atbreaking down fats.
3. bile, alcohol, and lemon juice
4. water and oil
5. The lemon juice did not break down the oils.
6. It is the tube in which no chemical was added and is the lowestpossible number.
7. Numbers are more precise than words. It is easier to comparethings with numbers.
Lab 1

Procedure
Materials
Introduction
Objectives
Lab 1 3 Science and Math Lab Manual
NAME ________________________________________ DATE ______________ PERIOD _____
Lab
1
Cop
yrig
ht ©
Gle
ncoe
/McG
raw
-Hill
, a
divi
sion
of T
he M
cGra
w-H
ill C
ompa
nies
, In
c.
NAME ________________________________________ DATE ______________ PERIOD _____
Digestion of FatsStudent Worksheet
Lab
X
Lab 1
Lab
1
A chemical compound called bile in your liver helps to break downfats and oils so that digestion can occur more easily. Eventually, thefat and oil are changed into a form that can be used by the body forenergy.In a scientific experiment, a variable is something that can change.There are three variables in this experiment. A constant is somethingthat does not change. There are two constants in this experiment.
In this lab, you will:• perform an experiment to see if fats (oils) mix with water.• see if certain chemicals help to mix fat with water.• learn how scientists use variables and constants.• write your observations as numbers.• use your numbers to make conclusions.• think of a better way to use numbers in the experiment.
• bile, 5% solution • vegetable oil• alcohol • metric ruler• 5 droppers • 4 stoppers to fit test tubes• lemon juice • 4 test tubes, 18 � 150 mm• masking tape • test tube rack
1. Use tape to label four test tubes 1, 2, 3, and 4 and place them in atest tube rack.
2. Add water to a height of 4 centimeters in each test tube.
3. With a dropper, place four drops of vegetable oil into each testtube. Observe whether the oil remains on the top or the bottom ofthe water.

Lab 1 4 Science and Math Lab Manual
NAME ________________________________________ DATE ______________ PERIOD ____C
opyright ©G
lencoe/McG
raw-H
ill, a division of The M
cGraw
-Hill C
ompanies, Inc.
Analysis
Data and Observations
NAME ________________________________________ DATE ______________ PERIOD ____C
opyright ©G
lencoe/McG
raw-H
ill, a division of The M
cGraw
-Hill C
ompanies, Inc.
Lab 1 Digestion of FatsStudent Worksheet (continued)
Test Tube Chemical Added Appearance Appearance TotalNumber of Mixture of Line
1 (water, oil)
2 (water, oil)
3 (water, oil)
4 (water, oil)
1. Does water mix with fats (oils)? How can you tell?
2. How can you tell if fats are broken down so that they mix withwater?
3. Which three chemicals are the variables?
4. What are the two constants in this experiment?
5. According to your totals, which chemical(s) did not break down oil?
6. Why is the number total for tube 1 important?
7. Attaching numbers to scientific observations is very important.Why do you think that this is so?
4. Add nothing to tube 1, add five drops of bile to tube 2, add fivedrops of alcohol to tube 3, and add five drops of lemon juice to tube4. Use a different dropper for each substance. CAUTION: Bile willstain.
5. Stopper each test tube and shake it vigorously five times.
6. Replace the tubes in the test tube rack and allow them to remainundisturbed. After ten minutes, examine each tube. If a mixture iscloudy, some of the fat has broken down and mixed with the water.
7. Record your results as clear (0), slightly cloudy (1), or very cloudy (2).
8. Some oil will remain on top of the water in each test tube.Determine whether the line that forms between the oil and wateris sharp (3) or fuzzy (4). Record your answers on the table.

Overview
Teaching the Lab
Preparations
Materials
Recommended Time
Lab 2 5 Science and Math Lab Manual
NAME ________________________________________ DATE ______________ PERIOD _____
Measuring HeartbeatTeaching Suggestions
Lab
2
Cop
yrig
ht ©
Gle
ncoe
/McG
raw
-Hill
, a
divi
sion
of T
he M
cGra
w-H
ill C
ompa
nies
, In
c.
Lab 2
In this activity, students will learn how to take and record a pulse.They will also measure and record a pulse for several minutes afterphysical exercise and graph the changes in pulse rate over time.
1 class period
• clock or watch with second hand
No special preparation is needed.
1. Have students work in pairs. Students should be shown how totake their own neck pulse and then be able to take the neck pulseof another student.
2. Point out that the second and third fingers are best for taking apulse. Make sure to explain not to use the thumb to take a pulse,since the thumb’s own pulse will interfere.
3. On the graph of pulse rate versus recovery time, the line for eachstudent should rise sharply to somewhere between 130 and 180 atone minute, and then gradually fall until it reaches the averagepulse rate at rest.

NAME ________________________________________ DATE ______________ PERIOD ____C
opyright ©G
lencoe/McG
raw-H
ill, a division of The M
cGraw
-Hill C
ompanies, Inc.
Lab 2 Measuring HeartbeatTeaching Suggestions (continued)
Analysis
Lab 2 6 Science and Math Lab Manual
NAME ________________________________________ DATE ______________ PERIOD ____
1. Answers will vary. The measurements should not be exactly equalto each other, but both should be between 70 and 90.
2. Running speeds up the pulse.
3. Answers will vary according to student condition, but should take6–8 minutes to return to normal.
4. Answers will vary according to student condition, but should take6–8 minutes to return to normal.
5. Not necessarily; pulse rate depends on the student’s physicalcondition, gender, fatigue level, and whether they have recentlyeaten.
6. No; a pulse rate of zero indicates the heart is no longer beating.

NAME ________________________________________ DATE ______________ PERIOD _____
Measuring HeartbeatStudent Worksheet
Cop
yrig
ht ©
Gle
ncoe
/McG
raw
-Hill
, a
divi
sion
of T
he M
cGra
w-H
ill C
ompa
nies
, In
c.
Lab 2
Materials
Procedure
Introduction
Objectives
Lab 2 7 Science and Math Lab Manual
NAME ________________________________________ DATE ______________ PERIOD _____
Lab
2
Your heart is a powerful muscle that pumps blood throughout yourbody. It is a muscle that never rests. The force with which your heartcontracts is so strong that by applying gentle pressure to yourarteries you can feel the blood surging in these vessels. This regularsurge of blood is your pulse. When you increase or decrease physicalactivity, your heart rate, as shown by your pulse, changes according toyour body’s needs.
In this lab, you will: • learn how to take your own pulse and that of your classmates.• measure and record changes in pulse before and after physical
activity.• construct a graph of your information or data.
• clock or watch with second hand
Part 1 Measuring the pulse at rest
1. Place your second and third fingers a few centimeters below yourearlobe and slightly toward the front of your throat. Gently pressin this area until you feel a pulse. This is the carotid (ka-RA-tid)artery, one of the major vessels that brings oxygen and blood toyour brain.
2. Take a classmate’s pulse for one minute. Record your results in Data Table 1.
3. Repeat this procedure three more times and find the mean of theresults.
4. Let your classmate measure your pulse. Follow Steps 2 and 3.Record the results in Data Table 1.
Part 2 Changing the pulse
1. Ask your classmate to run in place for one minute.
2. Count and record in Data Table 2 your classmate’s pulse eachminute for eight consecutive minutes after he or she stops running.
3. Let your classmate measure your pulse for eight minutes after yourun in place for one minute. Record the results in Data Table 2.
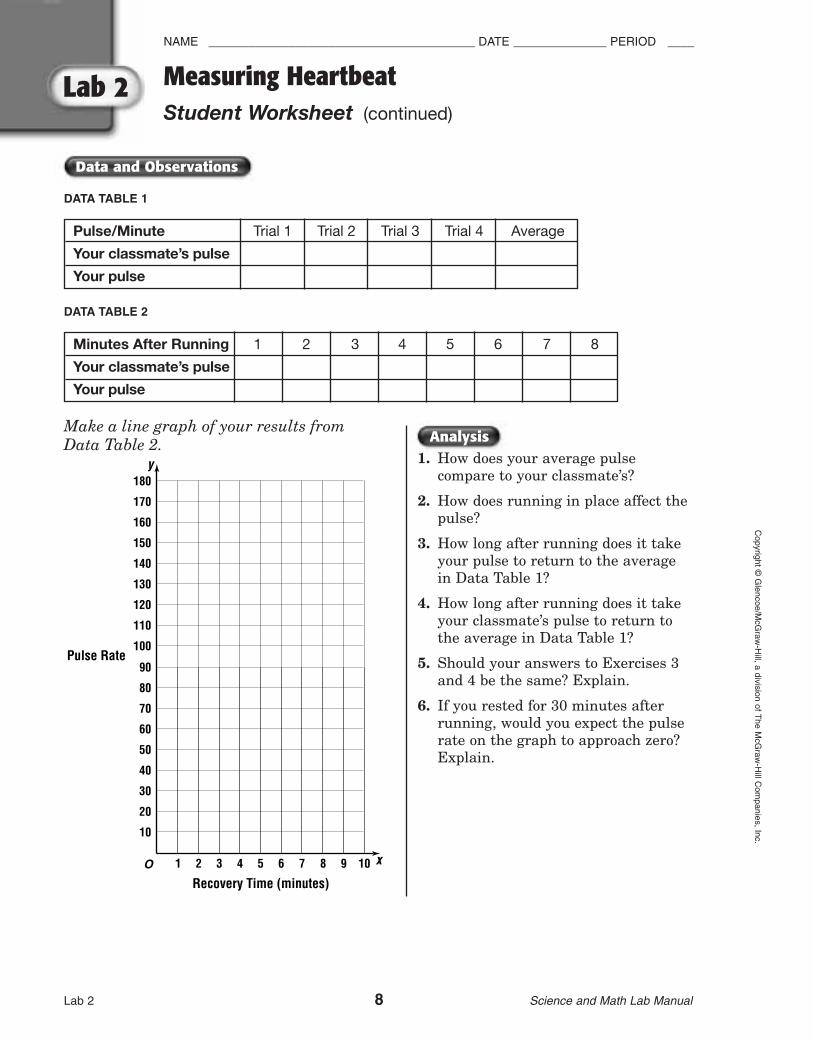
Data and Observations
Analysis
Pulse/Minute Trial 1 Trial 2 Trial 3 Trial 4 Average
Your classmate’s pulse
Your pulse
Minutes After Running 1 2 3 4 5 6 7 8
Your classmate’s pulse
Your pulse
1. How does your average pulsecompare to your classmate’s?
2. How does running in place affect thepulse?
3. How long after running does it takeyour pulse to return to the average in Data Table 1?
4. How long after running does it takeyour classmate’s pulse to return tothe average in Data Table 1?
5. Should your answers to Exercises 3and 4 be the same? Explain.
6. If you rested for 30 minutes afterrunning, would you expect the pulserate on the graph to approach zero?Explain.
Lab 2 8 Science and Math Lab Manual
NAME ________________________________________ DATE ______________ PERIOD ____C
opyright ©G
lencoe/McG
raw-H
ill, a division of The M
cGraw
-Hill C
ompanies, Inc.
Lab 2 Measuring HeartbeatStudent Worksheet (continued)
DATA TABLE 1
DATA TABLE 2
Make a line graph of your results from Data Table 2.
10
1 2 3 4
Recovery Time (minutes)
Pulse Rate
5 6
20
30
40
50
60
90
7 8 9 10
70
80
O x
100
110
120
130
140
150
180
160
170
y

Lab 3 9 Science and Math Lab Manual
NAME ________________________________________ DATE ______________ PERIOD _____
Ponds are Cities of LifeTeaching Suggestions
Lab
3
Cop
yrig
ht ©
Gle
ncoe
/McG
raw
-Hill
, a
divi
sion
of T
he M
cGra
w-H
ill C
ompa
nies
, In
c.
Lab 3
Overview
Teaching the Lab
Preparations
Materials
Recommended Time
In this activity, students will identify the organisms present in asample of pond water. They will count the number of each type oforganism and determine the total number of organisms. They willthen use this information to find the fraction of each type of organismpresent in their sample and convert that fraction to a decimal.
1 class period
• microscope • droppers• box of microscope slides • pond water• box of coverslips
Before class, obtain a box of microscope slides, a box of coverslips, onedropper for each student, and a small bucket of pond water.
1. Give each student a microscope slide of pond water. Students mayhave to share microscopes.
2. Use the diagrams to help students identify the organisms.

Lab 3 10 Science and Math Lab Manual
NAME ________________________________________ DATE ______________ PERIOD ____C
opyright ©G
lencoe/McG
raw-H
ill, a division of The M
cGraw
-Hill C
ompanies, Inc.
Lab 3 Ponds are Cities of LifeTeaching Suggestions (continued)
Further Explorations
Analysis
NAME ________________________________________ DATE ______________ PERIOD ____
1. Answers will vary. Fractions will depend on the total number oforganisms and the type of organisms present.
2. Decimals will vary with the individual pond sample.
3. Answers will vary. The most common organism should be the samefor every dropper sample.
4. Answers will vary. The least common organism should be the samefor every dropper sample.
The fractional values and decimal values will differ from student tostudent because the total number and type of organisms will varyfrom sample to sample.
Lab 3 11 Science and Math Lab Manual
NAME ________________________________________ DATE ______________ PERIOD _____
Ponds are Cities of LifeStudent Worksheet
Lab
3
Cop
yrig
ht ©
Gle
ncoe
/McG
raw
-Hill
, a
divi
sion
of T
he M
cGra
w-H
ill C
ompa
nies
, In
c.
Lab 3
Introduction
Materials
Objectives
Procedure
Lab
3
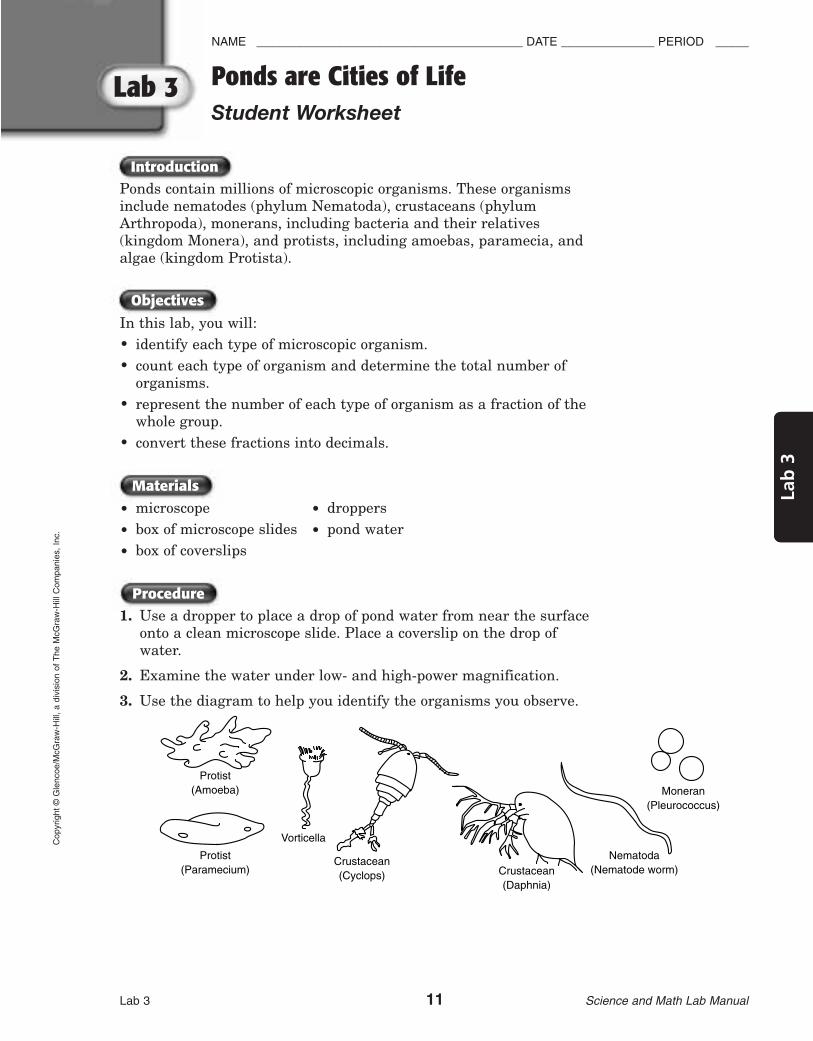
Ponds contain millions of microscopic organisms. These organismsinclude nematodes (phylum Nematoda), crustaceans (phylumArthropoda), monerans, including bacteria and their relatives(kingdom Monera), and protists, including amoebas, paramecia, andalgae (kingdom Protista).
In this lab, you will:• identify each type of microscopic organism.• count each type of organism and determine the total number of
organisms.• represent the number of each type of organism as a fraction of the
whole group.• convert these fractions into decimals.
• microscope • droppers
• box of microscope slides • pond water
• box of coverslips
1. Use a dropper to place a drop of pond water from near the surfaceonto a clean microscope slide. Place a coverslip on the drop ofwater.
2. Examine the water under low- and high-power magnification.
3. Use the diagram to help you identify the organisms you observe.
Protist(Amoeba)
Protist(Paramecium)
Vorticella
Crustacean(Cyclops) Crustacean
(Daphnia)
Nematoda(Nematode worm)
Moneran(Pleurococcus)

Further Explorations
Analysis
Lab 3 12 Science and Math Lab Manual
NAME ________________________________________ DATE ______________ PERIOD ____C
opyright ©G
lencoe/McG
raw-H
ill, a division of The M
cGraw
-Hill C
ompanies, Inc.
Lab 3 Ponds are Cities of LifeStudent Worksheet (continued)
4. Record the name and number of each type of organism in the DataTable.
5. Find the total number of organisms you observed.
1. Write the number of each type of organism over the total numberof organisms. Enter these fractions in the Data Table.
2. Convert these fractions into decimals. Enter the decimals in theData Table.
3. Which organism is most common in your sample of pond water?How did you determine your answer?
4. Which type of organism is least common in your sample of pondwater? How did you determine your answer?
Compare your fractions and decimals with those of a classmate. Arethey the same? different? Why?
Data and Observations
FractionType of Number (number of DecimalOrganism organisms/total
number of organisms)
Total Number ofOrganisms:

Overview
Lab 4 13 Science and Math Lab Manual
NAME ________________________________________ DATE ______________ PERIOD _____
Lab
4
Cop
yrig
ht ©
Gle
ncoe
/McG
raw
-Hill
, a
divi
sion
of T
he M
cGra
w-H
ill C
ompa
nies
, In
c.
Teaching the Lab
Preparations
Materials
Recommended Time
Sea Stars: Size, Shape, and SymmetryTeaching Suggestions
Lab 4
In this activity, students will determine the symmetry of a sea star.They will also measure arm length and the angles between the armsof a sea star, and record this information. Finally, they will use thisinformation to draw similar and congruent sea stars.
1 class period
• sea star, dried
• protractor
• ruler
Obtain dried sea star specimens before the class period. They may beavailable in the school biology laboratory, or they can be purchasedfrom a biological supply company.
1. Have students work in pairs.
2. Review the steps for measuring angles with a protractor andfinding lines of symmetry.

Further Explorations
Lab 4 14 Science and Math Lab Manual
NAME ________________________________________ DATE ______________ PERIOD ____C
opyright ©G
lencoe/McG
raw-H
ill, a division of The M
cGraw
-Hill C
ompanies, Inc.
NAME ________________________________________ DATE ______________ PERIOD ____
Lab 4 Sea Stars: Size, Shape, and SymmetryTeaching Suggestions (continued)
Analysis1. Drawings will vary.
2. Drawings will vary. The angles formed by the ridges of adjacentarms of the sea stars should be the same as those in the firstdrawing, but the arms should be half as long.
3. Sample answer: The measurements of the angles between thearms were the same. The measurements of arm length and sizeare different.
4. Sea stars have five lines of symmetry (pentameral symmetry). Onedrawing should show these five lines of symmetry.
The measurements of the angles of all specimens may be close but notnecessarily the same. The sum of the five angles is always 360°,because the angles form a full circle when they are put together.

Lab 4 15 Science and Math Lab Manual
NAME ________________________________________ DATE ______________ PERIOD _____
Lab
4
Cop
yrig
ht ©
Gle
ncoe
/McG
raw
-Hill
, a
divi
sion
of T
he M
cGra
w-H
ill C
ompa
nies
, In
c.
Procedure
Materials
Introduction
Objectives
NAME ________________________________________ DATE ______________ PERIOD _____
Sea Stars: Size, Shape, and SymmetryStudent Worksheet
Lab 4
Sea stars (or starfish) are in the phylum Echinodermata (echinos �spiny; derm � skin). They can be found in shallow tidal pools alongthe Pacific coast of North America. They are often brightly colored,and they move slowly. Most species have five arms. If an arm is cutoff, the animal simply grows another one.
In this lab, you will:
• measure the angles formed by the arms of the sea star.
• measure the length of the arms of the sea star.
• describe the symmetry of a sea star.
• draw two sea stars, one similar to and one congruent to yourspecimen.
• sea star, dried
• protractor
• ruler
1. Place your sea star flat on a piece of paper with its under sidefacing up. You should see a ridge running down the middle of eacharm.
2. On the piece of paper, number the arms from 1–5.
3. Measure the angle formed by the ridges of adjacent arms usingyour protractor. Record this information in the Data Table.
4. Repeat Step 3 until you have found the angle measurements for allfive arms.
5. Measure the length of each arm. Record this information in theData Table.

Further Explorations
Analysis
Data and Observations
Lab 4 16 Science and Math Lab Manual
NAME ________________________________________ DATE ______________ PERIOD ____C
opyright ©G
lencoe/McG
raw-H
ill, a division of The M
cGraw
-Hill C
ompanies, Inc.
Lab 4 Sea Stars: Size, Shape, and SymmetryStudent Worksheet (continued)
1. Using only the measurements in the Data Table, draw a sea starcongruent to your specimen. Show all your work. When you arefinished, check your work by laying the specimen on your drawing. Use another piece of paper if you need more space to draw.
2. Draw a sea star similar to your specimen, but about 50% smaller.
3. What measurements in your two drawings are the same? What measurements are different?
4. How many lines of symmetry does a sea star have? Sketch thelines of symmetry on one drawing.
Are the measurements of the angles formed by the arms of yourspecimen the same as specimens of other groups in your class? Findthe sum of the five angles. Is the sum of the angles the same as that ofother groups? If so, why?
Between Arms Angle Measure
1 and 2
2 and 3
3 and 4
4 and 5
5 and 1
Arm Length
1
2
3
4
5

Materials
Recommended Time
Overview
Teaching the Lab
Preparations
This activity provides students with the opportunity to measuretriangular area and observe the relationship between area andpopulation density. Students will be given the opportunity to calculatearea in an active way while learning a basic ecological concept.
1 class period
• meterstick
Before class, you may want to measure the classroom and calculatethe area of the triangular portions to check students’ math. Studentswill calculate the area of the classroom by measuring its length andwidth. In a later exercise, the room will be divided diagonally.Students will calculate the area of one of the resulting triangles byusing their previous measurements.
1. Students will need to work together. Have students take turnsmeasuring the length and width of the classroom.
2. Show students how to measure the room with a meterstick. Forbetter accuracy, demonstrate how to mark to the end of the stickbefore moving it. Remind them to keep track of the number oftimes the stick is moved in order to calculate the total length.
Lab 5 17 Science and Math Lab Manual
NAME ________________________________________ DATE ______________ PERIOD _____
Lab
5
Cop
yrig
ht ©
Gle
ncoe
/McG
raw
-Hill
, a
divi
sion
of T
he M
cGra
w-H
ill C
ompa
nies
, In
c.
Lab 5
NAME ________________________________________ DATE ______________ PERIOD _____
Living SpaceTeaching Suggestions

Lab 5 18 Science and Math Lab Manual
NAME ________________________________________ DATE ______________ PERIOD ____C
opyright ©G
lencoe/McG
raw-H
ill, a division of The M
cGraw
-Hill C
ompanies, Inc.
Lab xx Living SpaceTeaching Suggestions (continued)
Analysis
NAME ________________________________________ DATE ______________ PERIOD ____
Lab 5
1. The population density would be twice as great.
2. Sample answer: Students became noisy, restless, and fidgety.Because all students did not have enough room to sit down, theybecame tired and then irritated.
3. Answers may vary, but will indicate an area greater than, lessthan, or equal to the area of the classroom, depending on studentobservations.
4. Answers may vary. Sample answers may include removing some ofthe furniture or assigning each student a particular time andspace to sit down.
5. 1.8 persons per square meter

Introduction
Procedure
Materials
Objectives
Lab 5 19 Science and Math Lab Manual
NAME ________________________________________ DATE ______________ PERIOD _____
Living SpaceStudent Worksheet
Lab
X
Cop
yrig
ht ©
Gle
ncoe
/McG
raw
-Hill
, a
divi
sion
of T
he M
cGra
w-H
ill C
ompa
nies
, In
c.
Lab 5
NAME ________________________________________ DATE ______________ PERIOD _____
Lab
5
Some animals, like elephants, people, and ants, need to have others oftheir own species around. Other animals, like male chimpanzees andmale lions, live by themselves. All of these factors have an effect onthe amount of space that an animal needs to live. What is the best population density—the number of individuals livingin an area—for a particular animal? What happens when thepopulation density for an animal is too high?
In this lab, you will:
• calculate the area, population, and population density of yourclassroom.
• determine the effect of decreased area and increased population on population density.
• determine the effects of high population density on people.
• meterstick
1. Use a meterstick to measure the length and width of yourclassroom. Then calculate the area of the classroom in squaremeters (m2).
Length (m) � Width (m) � Area (m2) Record the data in the Data Table.
2. Count the number of people in your class today. Then calculate thepopulation density in your classroom.
� Population Density (people/m2)
Record the data in the table.
3. Your teacher will draw an imaginary line from one corner of theclassroom to another, dividing the room in half. The class willmove into one half of the room and stay there.
Population (no. people)����Area (m2)

Analysis
Lab 5 20 Science and Math Lab Manual
NAME ________________________________________ DATE ______________ PERIOD ____C
opyright ©G
lencoe/McG
raw-H
ill, a division of The M
cGraw
-Hill C
ompanies, Inc.
Lab 5 Living SpaceStudent Worksheet (continued)
4. Determine the area of the populated half of the classroom. Recordit in the table. Calculate the population density in that half of theroom. Record it in the table.
5. Observe the behavior of your classmates when the class is confinedto one half of the room. Notice the noise, where people stand or sit,what people do, and how the area looks.
6. Your teacher will draw another imaginary line dividing theclassroom into fourths. The class will move into one fourth of theroom and stay there.
7. Determine the area of one fourth of the classroom. Record it in thetable. Calculate the population density in that fourth of the room.Record it in the table.
8. Observe the behavior of your classmates again when the class isconfined to one fourth of the room.
1. How would population density change if there were twice as manystudents in your class?
2. Describe what happened when the population density increased.What did people do?
3. How much space does your class need?
4. If you had time to plan before your class made the move, howwould you reduce the negative results of high population density?
5. Most people in the United States live in urban areas. One hundredand sixty-five million people live on about 91,605,000 squaremeters of land. What is the average population density in U.S.urban areas?
Data and Observations
Base Height Area PopulationClassroom (m) (m) (m2) Density
(No. People/m2)
Full
Half
Fourth

Teaching the Lab
Overview
Preparations
Materials
Recommended Time
Lab 6 21 Science and Math Lab Manual
NAME ________________________________________ DATE ______________ PERIOD _____
Density and BuoyancyTeaching Suggestions
Lab
6
Cop
yrig
ht ©
Gle
ncoe
/McG
raw
-Hill
, a
divi
sion
of T
he M
cGra
w-H
ill C
ompa
nies
, In
c.
Lab 6
This activity provides students with the opportunity to combinemeasurements of mass (g) and volume (cm3) into a single measurement of density � �, a fraction that is usually expressed as
a decimal. Students will be required to compare decimals in order todraw conclusions about buoyancy.
1 class period
• balance scale • salt• beakers (250 mL and 1,500 mL) • spoon• egg • stirring rod• graduated cylinder (100 mL) • water (room temperature)• measuring tray
You may want to have some students bring in eggs and salt.
1. Have students work in groups of three. Each group member shouldwork with the balance scale and beakers to take measurements forsome of the data.
2. Students may need to be shown how to measure the volume of theegg using water displacement. Pour water into the large beakerand record the level. Place several eggs in the water and record thechange in the water level. The amount of water displaced is equalto the volume of the eggs. Because beakers are not very accurate,it is better to measure several eggs at once and calculate theaverage. This will provide an approximate volume for an egg.
g�cm3

Analysis
Lab 6 22 Science and Math Lab Manual
NAME ________________________________________ DATE ______________ PERIOD ____C
opyright ©G
lencoe/McG
raw-H
ill, a division of The M
cGraw
-Hill C
ompanies, Inc.
Lab 6 Density and BuoyancyTeaching Suggestions (continued)
3. Demonstrate how to add the fresh water to the salt water withoutmixing the two. Pour water from a graduated cylinder into abeaker using a stirring rod. Place the rod against the side of thebeaker and gently pour the water on the rod. The water shouldflow down the rod to the side of the beaker. This will help preventmixing.
4. Remind students that when weighing 100 milliliters of water theymust subtract the weight of the container from the overall weight.It is best to weigh the container first and then add an additional100 milliliters of water.
1. Answers may vary with the accuracy of the measurements. Thedensity of an object is determined by dividing its mass by itsvolume, D � �mV�. The density of fresh water is approximately 1, ofsalt water approximately 1.1, and of an egg approximately 1.1.
2. Sample answer: The egg sank below the fresh water but floated inthe salt water.
3. The density of the egg is greater than the density of fresh waterand about the same density as the salt water.
4. The egg sank to the bottom.
5. Sample answer: Buoyancy increases as the density of the liquidincreases.
6. A person is less dense than the water.
7. It is easier to float in seawater because it is denser than freshwater.
8. 1,30500 , 3.5%
9. The density of the helium is less than the density of the air, so theballoon floats.

Objectives
Materials
Procedure
Introduction
Lab 6 23 Science and Math Lab Manual
NAME ________________________________________ DATE ______________ PERIOD _____
Density and BuoyancyStudent Worksheet
Lab
6
Cop
yrig
ht ©
Gle
ncoe
/McG
raw
-Hill
, a
divi
sion
of T
he M
cGra
w-H
ill C
ompa
nies
, In
c.
Lab 6
The density of something is defined as the mass, m, per unit volume, V. To calculate the density, � (Greek letter rho), you divide the mass by the volume �� � �mV��. Buoyancy also involves mass and volume. An object will float in a liquid because of the buoyant force acting on it.The buoyant force is the upward push of a liquid against an object.When the mass of the liquid displaced by the object is equal to themass of the object, the object floats.
In this lab, you will:• determine the densities of fresh water, salt water, and an egg.• understand the relationship between density and buoyancy.
• balance scale • salt• beakers (250 mL and 1,500 mL) • spoon• egg • stirring rod• graduated cylinder (100 mL) • water (room temperature)• measuring tray
1. Weigh 125 grams of salt into the measuring tray on the balancescale.
2. Pour a liter of water into the 1,500-mL beaker. Add the salt to thewater and stir until the salt dissolves.
3. Find the mass of 100 mL of the salt water. Record it in the DataTable. Pour the salt water back into the beaker.
4. Find the mass of 100 mL of fresh water at room temperature.Record it in the table.
5. Find the mass of the egg. Record it in the table.
6. Find the volume of the egg. Record it in the table. Recall that 1 mL � 1 cm3.

Analysis
Data and Observations
Lab 6 24 Science and Math Lab Manual
NAME ________________________________________ DATE ______________ PERIOD ____C
opyright ©G
lencoe/McG
raw-H
ill, a division of The M
cGraw
-Hill C
ompanies, Inc.
Lab 6 Density and BuoyancyStudent Worksheet (continued)
7. Slip the egg into the beaker of salt water using the spoon. Observe andrecord its position on a sheet of paper. Remove the egg.
8. If the egg sinks to the bottom, add another 25 grams of salt to the saltwater and repeat Steps 3 and 7.
9. Carefully pour 250 mL of fresh water on top of the salt water. Pourthe water down the side of the beaker using the stirring rod. Do notmix.
10. Slip the egg into the beaker using the spoon. Observe and record itsposition on a sheet of paper.
11. Stir the solution, and observe what happens to the egg.
1. What are the densities of the fresh water, salt water, and the egg?Show the densities as fractions and as decimals. Record thedensities as fractions and decimals in the table.
2. What happened to the egg when you added it to the fresh water? the salt water?
3. How would you compare the density of the egg to that of freshwater and salt water?
4. What happened to the egg after you mixed the salt water and freshwater together?
5. What is the relationship between density and buoyancy?
6. Explain, in terms of density, why a person is able to float in water.
7. Is it easier for a person to float in seawater or in fresh water?
8. In every 1,000 grams of actual seawater, there are 35 grams ofsalt. What fraction of seawater is salt? What percent of seawater issalt?
9. Explain how a balloon inflated with helium floats in air.
Substance Mass (g) Volume (cm3) Density (g/cm3)
Salt Water 100 cm3
Fresh Water 100 cm3
Egg

Preparations
Materials
Recommended Time
Overview
Lab 7 25 Science and Math Lab Manual
NAME ________________________________________ DATE ______________ PERIOD _____
The Period of a PendulumTeaching Suggestions
Lab
7
Cop
yrig
ht ©
Gle
ncoe
/McG
raw
-Hill
, a
divi
sion
of T
he M
cGra
w-H
ill C
ompa
nies
, In
c.
Lab 7
This activity illustrates the graphing of functions from ordered pairs.It also relates time and distance to the period of a pendulum.Students will collect data on the movement of a pendulum and createa graph of this motion with a graphing calculator. Students willdetermine the periodic function that represents the motion andidentify the factors that affect this motion.
1 class period
• stopwatch or watch with a second hand • ring stand• Calculator-Based Ranger (CBR2) • meterstick• TI graphing calculator • masking tape• yo-yo
Before starting this exercise, consult your owner’s manual aboutusing the CBR2 with your particular TI graphing calculator.
On the calculator, press and change the mode to RADIAN.Follow the instructions to connect your calculator to the CBR2 andaccess its programming.
MODE

Analysis
Lab 7 26 Science and Math Lab Manual
NAME ________________________________________ DATE ______________ PERIOD ____C
opyright ©G
lencoe/McG
raw-H
ill, a division of The M
cGraw
-Hill C
ompanies, Inc.
Lab 7 The Period of a PendulumTeaching Suggestions (continued)
Teaching the Lab
Curve Time (x � L1) Distance (y � L2)
1 1.099 1.084
2 2.598 1.083
3 4.298 1.084
4 5.697 1.083
5 7.296 1.083
6 8.695 1.069
1. Have students work in small groups.
2. Set up the ring stand.
3. Review the steps required to create distance-time graphs. On thecalculator, press and select SET UP/SAMPLE from theMain Menu. Position the cursor to the right of REALTIME. Press
until NO appears. Move the cursor down to TIME bypressing the arrow buttons on the calculator. Enter 5 to changeTIME to 5 seconds. Position the cursor at DISPLAY and selectDIST for distance. Continue in this manner to set the defaults asfollows: BEGIN ON: ENTER, SMOOTHING: LIGHT, UNITS:METERS. Position the cursor at START NOW and press .
Sample Data for Time and Distance of Pendulum
1. Sample answer: 1.099 seconds
2. The y-value remains relatively constant because the period doesnot change much in such a short time. The x-value increasesbecause time is passing.
3. The curves correspond to movement towards and away from theCBR2.
4. Answers will vary. The time required to complete one period willdecrease as the distance of displacement decreases.
ENTER
ENTER
ENTER

Procedure
Materials
Objectives
Introduction
Lab 7 27 Science and Math Lab Manual
NAME ________________________________________ DATE ______________ PERIOD _____
The Period of a PendulumStudent Worksheet
Lab
7
Cop
yrig
ht ©
Gle
ncoe
/McG
raw
-Hill
, a
divi
sion
of T
he M
cGra
w-H
ill C
ompa
nies
, In
c.
Lab 7
Pendulums have been used in clocks for centuries because they swingback and forth at a very regular rate. The time it takes for apendulum to make one complete back-and-forth swing is called theperiod of the pendulum. A pendulum’s period depends on severalfactors: gravity, time, distance, and mass. A period can be identifiedon a graph of several curves as the distance from one peak to the nextor one trough (low point) to the next.
In this lab, you will:• measure the distance of displacement of a pendulum.• collect data on the motion of a pendulum.• graph the function of the movement of a pendulum.• determine the period of a pendulum.
• stopwatch or watch with a second hand • ring stand• Calculator-Based Ranger (CBR2) • meterstick• TI graphing calculator • masking tape• yo-yo
1. Unroll the yo-yo to the end of its string.
2. Attach the end of the string to the crossbar of the ring stand.
3. Hold the yo-yo straight down to keep it from swinging. Mark theposition of the yo-yo at rest on the table with masking tape.
4. Place the CBR2 0.5 meter in front of the yo-yo so that the yo-yowill swing directly away from and back towards the CBR2 sensor.
5. Pull the yo-yo 0.25 meter back from its resting position, away fromthe CBR2, and mark this position on the table.

Data and Observations
Analysis
Copyright ©
Glencoe/M
cGraw
-Hill, a division of T
he McG
raw-H
ill Com
panies, Inc.
Lab 7 28 Science and Math Lab Manual
6. Press on the calculator to start the CBR2. Release the yo-yo. A graph of the results will be displayed on the calculator.
7. Move the cursor to the right until it reaches the end of the firstcurve. Write the time for curve 1 in the Data Table. The number ofseconds will be marked by small ticks on the x-axis. Position thecursor at the end of the second curve and record the time in theData Table. Repeat until the time of each curve is recorded.
8. Press . Enter your time data in the column marked L1. Enter your distance data in the column marked L2.
9. Press . Enter settings that are appropriate for your data. For example, if your distance data range from 0.418 to 1.126, set the Ymin at 0, the Ymax at 1.5, and the Yscl at 0.5.
10. Finally, press [STAT PLOT]
. The calculator will display the graph of the function created by your ordered pairs.
1. How long does it take for the yo-yo to complete the first period?
2. Which value of your ordered pairs remains fairly constant? Why?
3. Why does the movement of the pendulum result in a line that is curved?
4. Do the periods of the pendulum increase or decrease as timepasses?
GRAPH
ENTERENTERENTER2nd
WINDOW
ENTERSTAT
ENTER
NAME ________________________________________ DATE ______________ PERIOD ____
The Period of a PendulumStudent Worksheet (continued)
Curve Time (x � L1) Distance (y � L2)
1
2
3
4
5
6
Lab 7

Teaching the Lab
Preparations
Materials
Overview
Recommended Time
Lab 8 29 Science and Math Lab Manual
NAME ________________________________________ DATE ______________ PERIOD _____
Air Particulate SamplingTeaching Suggestions
Lab
8
Cop
yrig
ht ©
Gle
ncoe
/McG
raw
-Hill
, a
divi
sion
of T
he M
cGra
w-H
ill C
ompa
nies
, In
c.
Lab 8
In this lab, students collect data about air particulate pollution intheir neighborhood and use statistics to predict air particulatepollution over a larger area.
2 class periods
• clear contact paper (14 cm square) • cellophane tape• grid paper (1-cm grid) • magnifying glass• cardboard or �14�-inch plywood (40 cm square) • number cubes
Cut the cardboard or plywood to the size of your sheet of grid paper. A master for this grid can be found on page 210.You may want to pre-test this activity to find out how long studentsneed to expose their samplers to collect an adequate particulatesample. Twenty-four hours will be sufficient in most areas; six hoursmay be sufficient in areas with a high number of particles. In areaswith low particulate levels, 48 hours or a weekend may be required.
1. Have students work individually, in pairs, or in small groups. Youmay want to set up a sampler at your school to demonstrate thetechnique.
2. Help students randomly choose the grid to count on their sampler.They can devise a system using number cubes such as: the numbercube that lands on the left is the horizontal; the number cube onthe right is the vertical. Students should always begin at the samecorner.
Analysis
NAME ________________________________________ DATE ______________ PERIOD ____C
opyright ©G
lencoe/McG
raw-H
ill, a division of The M
cGraw
-Hill C
ompanies, Inc.
Lab xx Air Particulate SamplingTeaching Suggestions (continued)
1. Answers will vary depending on the sample area. Check students’math.
2. Answers will vary. Check that students multiplied by 10,000 toobtain the count.
3. Answers will vary. Check that students multiplied by 1,000,000 toobtain the count.
4. Answers will vary. Check that students multiplied by 100 to obtainthe count.
Lab 8 30 Science and Math Lab Manual
NAME ________________________________________ DATE ______________ PERIOD ____
Lab 8
NAME ________________________________________ DATE ______________ PERIOD ____
Lab 8 31 Science and Math Lab Manual
NAME ________________________________________ DATE ______________ PERIOD _____
Air Particulate SamplingStudent Worksheet
Lab
X
Cop
yrig
ht ©
Gle
ncoe
/McG
raw
-Hill
, a
divi
sion
of T
he M
cGra
w-H
ill C
ompa
nies
, In
c.
Lab 8
Procedure
Materials
Objectives
Introduction
NAME ________________________________________ DATE ______________ PERIOD _____
Lab
8
The haze that we associate with air pollution is created whenparticles in the air scatter light coming through the atmosphere fromthe Sun. The wind lifts dust particles into the air. Other particles inthe air are the products of the combustion that takes place invehicles, fireplaces, factories, volcanic eruptions, and other sources. The Environmental Protection Agency (EPA) sets standards for theamount of particulates allowed by law in a given area. It is importantthat these standards are not exceeded. If they are, the health of theliving organisms in the area may suffer.
In this lab, you will:• measure particulate pollution in your neighborhood.• predict the amount of particulate pollution in the surrounding area.
• clear contact paper (14 cm square) • cellophane tape• grid paper (1-cm grid) • magnifying glass• cardboard or �14�-inch plywood (40 cm square) • number cubes
1. To make your “pollution sampler,” tape the contact paper on top ofthe cardboard or plywood with the sticky side up. Keep theprotective backing on the contact paper.
2. Place the sampler outside your home on a flat surface, preferablyat least a meter or two above the ground. Anchor the sampler if itis windy. Make sure the contact paper is taped firmly onto thecardboard, then remove the protective backing.
3. After the sampler has been exposed for an amount of time yourteacher will specify, place the grid paper over the collecting surfacegrid side down. Bring the sampler to class.
NAME ________________________________________ DATE ______________ PERIOD _____

Lab 8 32 Science and Math Lab Manual
NAME ________________________________________ DATE ______________ PERIOD ____C
opyright ©G
lencoe/McG
raw-H
ill, a division of The M
cGraw
-Hill C
ompanies, Inc.
Lab 8 Air Particulate SamplingStudent Worksheet (continued)
Data and Observations
Sample Square Particle Count Count total:
Average count per square:
Analysis
4. Remove the sampler from the cardboard and observe the particlesthrough the clear contact paper. Using a magnifying glass, countthe number of particles found in ten randomly selected squares onthe grid paper. Select the squares by tossing the number cubes. Ifthe numbers come up two and five, for example, count the square inthe fifth column, second row. Record your counts in the Data Table.
5. Divide the total number of particles you counted by 10 to get anaverage number per square.
1. Add together the average counts for all the samplers in your class.Divide this number by the number of samplers to obtain a regionalaverage for the 1-centimeter square. What is the regional average?
2. Use your regional 1-centimeter square average to predict thenumber of particles in 1 square meter. (1 m = 100 cm)
3. Use your regional average for 1 square meter to predict thenumber of particles in 1 square kilometer. (1 km = 1,000 m)
4. Use your regional average for 1 square kilometer to predict thenumber of particles in 10 square kilometers.
In this activity, students will determine the distance traveled by a person walking at a constant velocity. Students will use the CBR to detect their own motion. They will use a calculator to generate a velocity-time graph of the motion. Students will use this graph to determine the distance traveled. Students will predict the distance that would be traveled in a greater length of time.
1 class period
• masking tape• Calculator-Based Ranger (CBR2)• TI graphing calculator• meterstick
Before starting this exercise, consult your user’s manual about how to use the CBR2 with your TI-graphing calculator.Connect your calculator to the CBR2 and access its programming.
Materials
Recommended Time
Lab 9 33 Science and Math Lab Manual
NAME ________________________________________ DATE ______________ PERIOD _____
Distance, Velocity, and TimeTeaching Suggestions
Cop
yrig
ht ©
Gle
ncoe
/McG
raw
-Hill
, a
divi
sion
of T
he M
cGra
w-H
ill C
ompa
nies
, In
c.
Lab 9
Overview
Preparations
033-036 Lab9-876070.qxd 6/29/06 2:47 PM Page 33

Lab 9 34 Science and Math Lab Manual
NAME ________________________________________ DATE ______________ PERIOD ____C
opyright ©G
lencoe/McG
raw-H
ill, a division of The M
cGraw
-Hill C
ompanies, Inc.
Lab 9 Distance, Velocity, and TimeTeaching Suggestions (continued)
1. Have students work in groups of four.
2. Mark distances on the floor with masking tape. Start 0.5 meter from a table and place a piece of tape every 0.5 meter for 3 meters.
3. Review the steps required to create velocity-time graphs. On thecalculator, press and select SET UP/SAMPLE from the Main Menu. Position the cursor to the right of REALTIME. Press until NO appears. Move the cursor down to TIME by pressing the arrow buttons on the calculator. Enter 5 to change TIME to 5 seconds.Position the cursor at DISPLAY and select VEL for velocity. Continue in this manner to set the defaults as follows: BEGIN ON:TRIGGER, SMOOTHING: LIGHT, UNITS: METERS. Position the cursor at START NOW and press .
Sample data:
1. Sample answer: 0.3158 m/s
2. Sample answer: 0.285 m; 17.08 m
3. Sample answer: 1,025 m
4. Sample answer: about 90 hours
The amount of time it takes one person to travel a particular distance may differ from another person if their average velocities differ from each other.
ENTER
ENTER
ENTER
Teaching the Lab
Extension
Analysis
X (Time) D (Distance) Y (Velocity)
1 0.298 0.187
2 0.604 0.368
3 0.962 0.375
4 1.311 0.363
5 1.423 0.286
033-036 Lab9-876070.qxd 6/29/06 2:47 PM Page 34

Lab 9 35 Science and Math Lab Manual
NAME ________________________________________ DATE ______________ PERIOD _____
Distance, Velocity, and TimeStudent Worksheet
Cop
yrig
ht ©
Gle
ncoe
/McG
raw
-Hill
, a
divi
sion
of T
he M
cGra
w-H
ill C
ompa
nies
, In
c.
Lab 9
Velocity is speed in a given direction. You may not think there is muchdifference between speed and velocity, but the direction indicated byvelocity can be very important. Air-traffic controllers and pilots mustuse velocity to prevent accidents. They must not only know the speed of airplanes, they must also know the direction in which the planes areflying. This helps them to predict where and when a particular planewill be at any given time.
In this lab, you will: • create a graph of the movement of a member of your group using
the CBR.• measure the distance traveled by this person.• determine several pairs of coordinates from your graph.• determine the average velocity.• predict the distance this person could travel in a given amount of time.
• masking tape• Calculator-Based Ranger (CBR2)• TI graphing calculator• meterstick
1. Place the CBR2 on a table and point it in the direction that one of thegroup members will walk. Mark the starting position of this personwith a piece of tape on the floor. The person walking should moveslowly and steadily away from the CBR2. Press on theCBR2 as soon as the person begins to walk. When the CBR2 stopsclicking, tell the person to stop. Mark his or her final position on thefloor with a piece of tape. Write the person’s name on the tape. Press
on the calculator until your data appear in graph form. Thisgraph will display distance in meters over time. Move the cursoralong the line and record the distance traveled at each second in thetable below.
ENTER
TRIGGER
Procedure
Introduction
Materials
Objectives
033-036 Lab9-876070.qxd 6/29/06 2:47 PM Page 35

Lab 9 36 Science and Math Lab Manual
NAME ________________________________________ DATE ______________ PERIOD ____C
opyright ©G
lencoe/McG
raw-H
ill, a division of The M
cGraw
-Hill C
ompanies, Inc.
Lab 9 Distance, Velocity, and TimeStudent Worksheet (continued)
2. Measure the actual distance this person traveled with a meterstick.Record this distance to check the accuracy of your data.
3. Press again and choose 2: VEL–TIME by pressing .
Press again to display the graph of velocity in meters/second.
4. Determine the velocity at each second from the graph on the calculator by moving the cursor along the line. Record these numbers in the Data Table.
1. Calculate the average velocity based on these data.
2. Determine the average distance traveled per second. Predict how far this person would travel in 60 seconds.
3. Predict how far this person would travel in 1 hour.
4. Predict how long it would take this person to travel 100 km.
Compare the answers to Question 4 for people in different groups. Are they different? Why or why not?
ENTER
ENTER
Lab
9
Extension
Data and Observations
Analysis
X (Time) D (Distance) Y (Velocity)
1
2
3
4
5
033-036 Lab9-876070.qxd 6/29/06 2:47 PM Page 36

Lab 10 37 Science and Math Lab Manual
NAME ________________________________________ DATE ______________ PERIOD _____
Using a ClinometerTeaching Suggestions
Cop
yrig
ht ©
Gle
ncoe
/McG
raw
-Hill
, a
divi
sion
of T
he M
cGra
w-H
ill C
ompa
nies
, In
c.
Lab 10
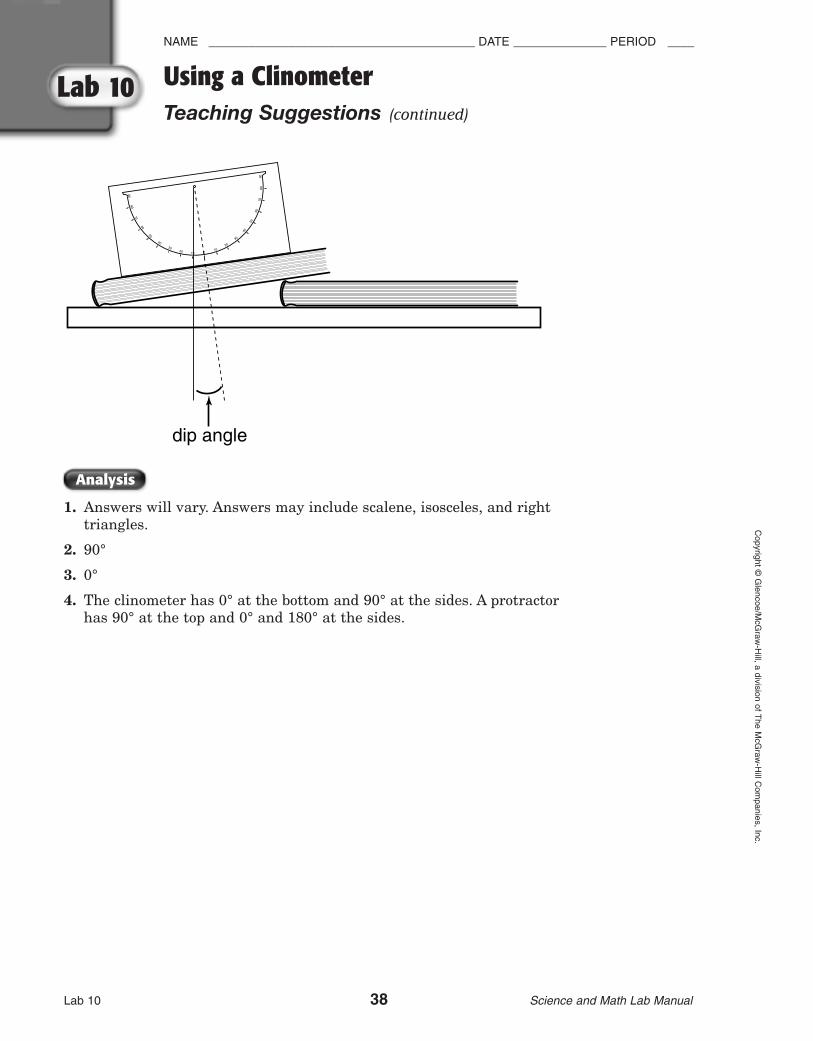
This activity provides students with an opportunity to apply themeasurement of angles to the dip angle of a geologic bedding plane. Students will be required to construct a clinometer and measure dip angles. They will also practice classifying angles.
1 class period
• books (several) • brass fastener• cardboard (stiff) • scissors• pin or nail • string, 10 cm• glue or paste • washer (heavy)
You may want to photocopy the clinometer onto heavy card stock.
1. Have students work individually or in pairs.
2. Demonstrate to students how to arrange the books to simulate the dip of rock layer. Place a book on the desk. Tilt another book so that it rests on the first book at an angle. Suggest to students that they place the books at the edge of the desk so that they can easily measure the dip. (You may want to photocopy the diagram on page 42 for each student.)
Teaching the Lab
Preparations
Materials
Recommended Time
Overview
037-040 Lab10-876070.qxd 6/29/06 2:49 PM Page 37
Lab 10 38 Science and Math Lab Manual
NAME ________________________________________ DATE ______________ PERIOD ____C
opyright ©G
lencoe/McG
raw-H
ill, a division of The M
cGraw
-Hill C
ompanies, Inc.
Lab 10 Using a ClinometerTeaching Suggestions (continued)
1. Answers will vary. Answers may include scalene, isosceles, and righttriangles.
2. 90°
3. 0°
4. The clinometer has 0° at the bottom and 90° at the sides. A protractor has 90° at the top and 0° and 180° at the sides.
01020
30
40
50
60
70
8090
1020
3040
50
6070
8090
dip angle
Analysis
037-040 Lab10-876070.qxd 6/29/06 2:49 PM Page 38

Lab 10 39 Science and Math Lab Manual
NAME ________________________________________ DATE ______________ PERIOD _____
Using a ClinometerStudent Worksheet
Cop
yrig
ht ©
Gle
ncoe
/McG
raw
-Hill
, a
divi
sion
of T
he M
cGra
w-H
ill C
ompa
nies
, In
c.
Lab 10
Most sedimentary rocks were originally deposited in horizontal layers. Over long periods of geologic time, the layers were often lifted, lowered, or tilted. These changes from the horizontal resulted from geologic processes such as faulting, mountain building, and continental drift.Geologists measure the amount of tilt or dip in rock layers with aninstrument called a clinometer. The clinometer measures the dip angle in degrees.
In this lab, you will:• construct a clinometer.• use a clinometer to measure dip angles.
• books (several) • brass fastener• cardboard (stiff) • scissors• pin or nail • string, 10 cm• glue or paste • washer (heavy)
1. Photocopy and enlarge the clinometer until it is 6 �12� inches wide. Then cut it out along the dashed lines. Glue the pattern to an equal-sized piece of cardboard. Make a small hole at the center with a pin or nail.
2. Tie the string securely around the brass fastener, push the fastenerthrough the hole, and open the prongs of the fastener. Tie the washer to the other end of the string.
3. Test the clinometer by placing it upright on the edge of a flat desk. The string should hang over the 0° position.
4. Place one of the books on a desk. Tilt the book and support it with asecond book. Place the clinometer upright on the tilted book. Measure and record the dip angle. Then sketch a diagram of the “rocks.”
5. Repeat Step 4 for several different tilts.
6. Classify the type of angle you create as acute, obtuse, or right.
Introduction
Procedure
Materials
Objectives
037-040 Lab10-876070.qxd 6/29/06 2:49 PM Page 39

Lab 10 40 Science and Math Lab Manual
NAME ________________________________________ DATE ______________ PERIOD ____C
opyright ©G
lencoe/McG
raw-H
ill, a division of The M
cGraw
-Hill C
ompanies, Inc.
Lab 10 Using a ClinometerStudent Worksheet (continued)
1. Draw your angles and close them with a third line so they form triangles. Identify what kind of triangles you have drawn.
2. If a bed is vertical, how many degrees of dip does it have?
3. If a bed is horizontal, what is the dip angle?
4. How does the clinometer differ from a protractor?
01020
30
40
50
60
7080
90
1020
30
40
50
6070
8090
Center hole
Str
ing
Analysis
Data and Observations
Rock Diagram Dip Angle Type of Angle
037-040 Lab10-876070.qxd 6/29/06 2:49 PM Page 40

Lab 11 41 Science and Math Lab Manual
NAME ________________________________________ DATE ______________ PERIOD _____
Chemical SolutionsTeaching Suggestions
Lab
11
Cop
yrig
ht ©
Gle
ncoe
/McG
raw
-Hill
, a
divi
sion
of T
he M
cGra
w-H
ill C
ompa
nies
, In
c.
Lab 11
Overview
Teaching the Lab
Preparations
Materials
Recommended Time
This activity provides students with an opportunity to learn somebasic chemistry, to become familiar with chemical symbols, and torecognize how some atoms interact with each other. It also allowsstudents to practice reading word problems and to write algebraicequations from the information provided. Students will be required tosolve these equations.
1 class period
• Styrofoam balls of various sizes• colored markers• toothpicks• drinking straws
Obtain the materials and experiment with molecule building.Although atoms occupy certain positions within a molecule, thisaspect of chemistry will not be stressed in this activity.
1. Quiz students on chemical names and symbols to help thembecome familiar with the language of chemistry.
2. Remind students that chemical equations are similar to algebraicequations in that each must always balance.
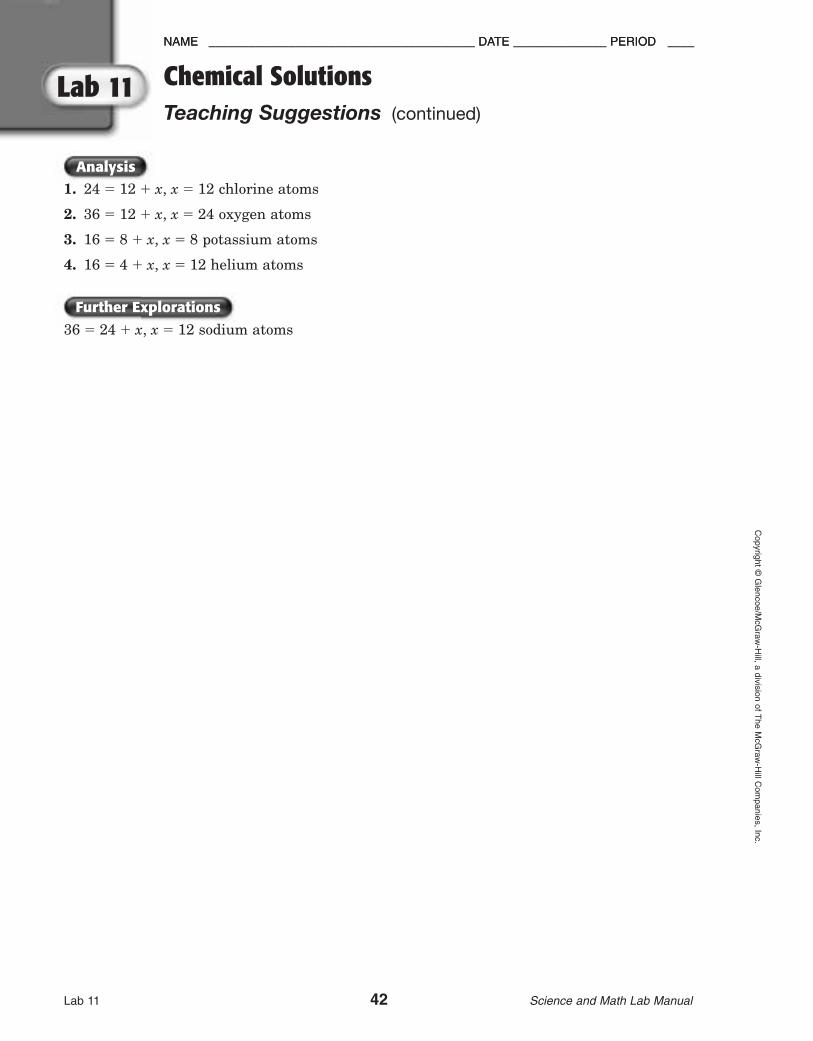
Lab 11 42 Science and Math Lab Manual
NAME ________________________________________ DATE ______________ PERIOD ____C
opyright ©G
lencoe/McG
raw-H
ill, a division of The M
cGraw
-Hill C
ompanies, Inc.
Lab 11 Chemical SolutionsTeaching Suggestions (continued)
Analysis
NAME ________________________________________ DATE ______________ PERIOD ____
1. 24 � 12 � x, x � 12 chlorine atoms
2. 36 � 12 � x, x � 24 oxygen atoms
3. 16 � 8 � x, x � 8 potassium atoms
4. 16 � 4 � x, x � 12 helium atoms
36 � 24 � x, x � 12 sodium atoms
Further Explorations

Lab 11 43 Science and Math Lab Manual
NAME ________________________________________ DATE ______________ PERIOD _____
Chemical SolutionsStudent Worksheet
Lab
X
Cop
yrig
ht ©
Gle
ncoe
/McG
raw
-Hill
, a
divi
sion
of T
he M
cGra
w-H
ill C
ompa
nies
, In
c.
Lab 11
Introduction
Objectives
Procedure
Materials
NAME ________________________________________ DATE ______________ PERIOD _____
Lab
11
All matter is made of atoms. Atoms are pure substances that cannotbe broken down into simpler substances by chemical reactions. Atomsare composed of an inner nucleus of protons and neutrons and anouter shell of electrons. When atoms combine, they form molecules.Every molecule has a specific number of different types of atoms. Forexample, water is made of two atoms of hydrogen and one of oxygen.It is written in chemical symbols as H2O.
In this lab, you will:• determine the numbers of different atoms that make up certain
molecules.• write algebraic equations and solve them for different molecules.
• Styrofoam balls of various sizes • toothpicks• colored markers • drinking straws
1. Color the Styrofoam balls according to the table below.
Atomic Name Symbol Color
Hydrogen H Yellow
Helium He Green
Carbon C Blue
Nitrogen N Black
Oxygen O Red
Sodium Na Brown
Chlorine Cl Orange
Potassium K Pink

Lab 11 44 Science and Math Lab Manual
Copyright ©
Glencoe/M
cGraw
-Hill, a division of T
he McG
raw-H
ill Com
panies, Inc.
Lab 11 Chemical SolutionsStudent Worksheet (continued)
NAME ________________________________________ DATE ______________ PERIOD _____
Analysis
2. Use toothpicks to assemble molecules of water (H2O), salt (NaCl),sodium hydroxide (NaOH), nitrate (NO3), carbon dioxide (CO2),hydrochloric acid (HCl), and ammonia (NH3).
3. Now use your straws to connect your molecules and atoms intocrystals of sodium chloride, NaCl (use 4 molecules); ammoniumchloride, NH4Cl (use 2 molecules of HCl and 2 molecule of NH3);and carbon tetrachloride (Hint: tetra means 4).
4. Now that you have an idea of how atoms make up molecules,which in turn make up larger molecules or crystals, you will writeand solve some algebraic equations about chemical formulas.
For example, if a crystal composed of hydrogen and oxygen has 15atoms and 5 of these are oxygen, how many atoms are hydrogen?
15 � 5 � x
15 – 5 � x
10 � x
What kind of crystal do you think this is? Answer: an ice crystalmade of 5 molecules of H2O
1. Write and solve an equation for a crystal of salt (NaCl) that has 24atoms, 12 of which are sodium.
2. Write and solve an equation for a crystal of dry ice (CO2) that has36 atoms, 12 of which are carbon.
3. How many atoms of potassium are in a solution of potassiumchloride (KCl) that has a total of 16 atoms?
4. A balloon is usually filled with helium (He). If the helium gas in a balloon is contaminated with �14� nitrogen and a sample of the gashas 16 atoms, how many atoms are helium?
A solution of sodium hydroxide (NaOH) will neutralize a solution ofhydrochloric acid (HCl). One molecule of NaOH will neutralize 1molecule of HCl. If you have a neutral solution of these 2 molecules inwhich there are 24 atoms of hydrogen, how many sodium atoms doyou have?
Further Explorations

In this activity, students will use proportions to explain therelationship between force and speed in a bicycle with multiple gears.They will determine the mechanical advantage of a standard ten-speed bicycle and describe the functions of gears.
1 class period
• ten-speed bicycle
• block of wood
No special preparation is needed.
1. Have students work in pairs.
2. Warn students that bicycle gears and chains are greasy.
3. Use the diagram below to show students how to set up and holdthe bicycle.
Teaching the Lab
Preparations
Materials
Overview
Recommended Time
Lab 12 45 Science and Math Lab Manual
NAME ________________________________________ DATE ______________ PERIOD _____
The Bicycle: A Well-Engineered MachineTeaching Suggestions
Lab
12
Cop
yrig
ht ©
Gle
ncoe
/McG
raw
-Hill
, a
divi
sion
of T
he M
cGra
w-H
ill C
ompa
nies
, In
c.
Lab 12
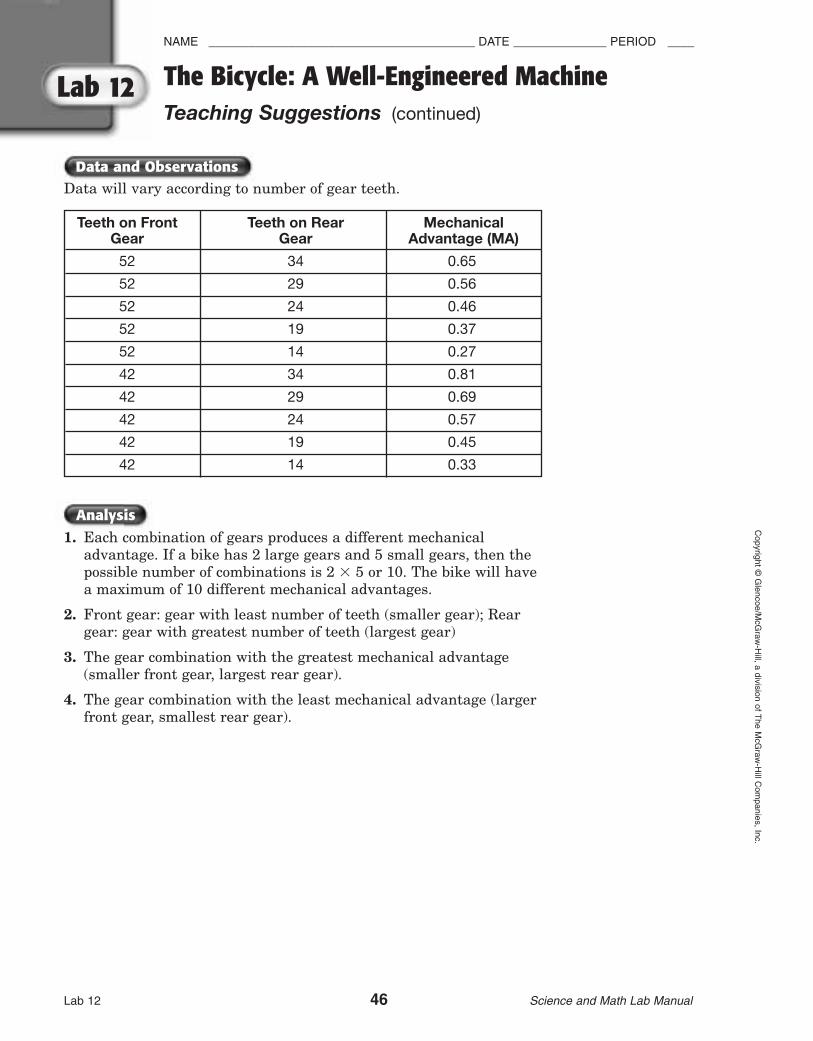
Analysis
Data and Observations
Lab 12 46 Science and Math Lab Manual
NAME ________________________________________ DATE ______________ PERIOD ____C
opyright ©G
lencoe/McG
raw-H
ill, a division of The M
cGraw
-Hill C
ompanies, Inc.
Lab 12 The Bicycle: A Well-Engineered MachineTeaching Suggestions (continued)
Data will vary according to number of gear teeth.
1. Each combination of gears produces a different mechanicaladvantage. If a bike has 2 large gears and 5 small gears, then thepossible number of combinations is 2 � 5 or 10. The bike will havea maximum of 10 different mechanical advantages.
2. Front gear: gear with least number of teeth (smaller gear); Reargear: gear with greatest number of teeth (largest gear)
3. The gear combination with the greatest mechanical advantage(smaller front gear, largest rear gear).
4. The gear combination with the least mechanical advantage (largerfront gear, smallest rear gear).
Teeth on Front Teeth on Rear MechanicalGear Gear Advantage (MA)
52 34 0.65
52 29 0.56
52 24 0.46
52 19 0.37
52 14 0.27
42 34 0.81
42 29 0.69
42 24 0.57
42 19 0.45
42 14 0.33

Procedure
Materials
Introduction
Objectives
Lab 12 47 Science and Math Lab Manual
NAME ________________________________________ DATE ______________ PERIOD _____
The Bicycle: A Well-Engineered MachineStudent Worksheet
Lab
12
Cop
yrig
ht ©
Gle
ncoe
/McG
raw
-Hill
, a
divi
sion
of T
he M
cGra
w-H
ill C
ompa
nies
, In
c.
Lab 12
When you ride a bicycle on level ground, the gears increase or decreasethe force that you need to exert on the pedals to keep the bike moving.This change of force results in faster or slower speeds. The mechanicaladvantage (MA) is the number of times the effort force (the force fromyour legs) is multiplied by the machine. Mechanical advantagedecreases or increases with the changing of the gears. The speedadvantage (SA) is the number of times that the machine multiplies thespeed at which the effort force is applied. If a bicycle multiplies theforce of your legs by two, the speed is reduced by one-half.
In this lab, you will:• determine the mechanical and speed advantages of a ten-speed
bicycle.• describe the functions of the gears on a ten-speed bicycle.
• ten-speed bicycle
• block of wood
1. Place the block of wood under the bottom bracket of the frame.Have your lab partner steady the bicycle by holding the seat andthe handle bars. Now the rear wheel can turn freely when thepedals are turned.
2. Turn the pedals with one of your hands to make the rear wheelturn. While the wheel is turning, shift the gears so that the bicycleis in first gear. While turning the pedal at a constant rate, slowlyshift through the ten gears. CAUTION: Do not shift gears whenthe rear wheel is not turning. Avoid placing your hand near therear wheel, drive chain, or gears. Observe the speed of the rearwheel as you shift through the gears. Observe how the chainmoves across the gears when you shift.
3. Remove the bicycle from the block of wood and lay it on its side.
4. Count the number of teeth on the front gear and rear gear for eachcombination of gears. Record these values in the table.
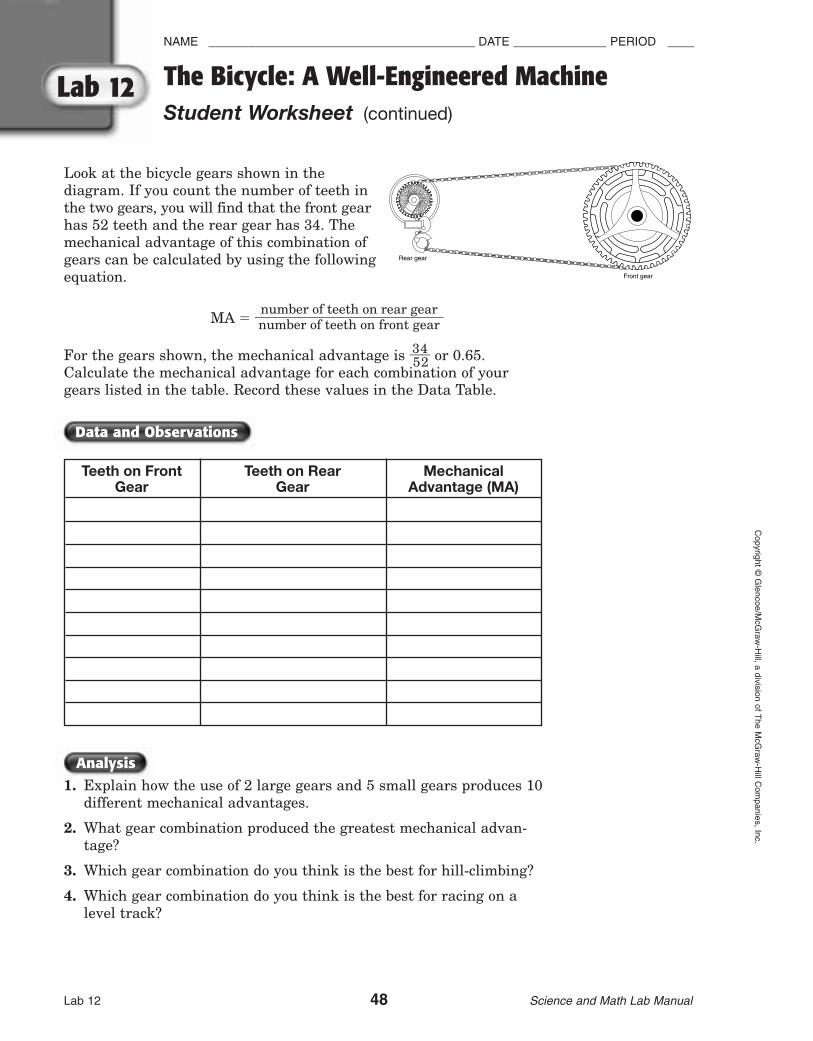
Analysis
Data and Observations
Lab 12 48 Science and Math Lab Manual
NAME ________________________________________ DATE ______________ PERIOD ____C
opyright ©G
lencoe/McG
raw-H
ill, a division of The M
cGraw
-Hill C
ompanies, Inc.
Lab 12 The Bicycle: A Well-Engineered MachineStudent Worksheet (continued)
Look at the bicycle gears shown in the diagram. If you count the number of teeth inthe two gears, you will find that the front gear has 52 teeth and the rear gear has 34. The mechanical advantage of this combination of gears can be calculated by using the following equation.
MA �
For the gears shown, the mechanical advantage is �3542� or 0.65.
Calculate the mechanical advantage for each combination of yourgears listed in the table. Record these values in the Data Table.
1. Explain how the use of 2 large gears and 5 small gears produces 10different mechanical advantages.
2. What gear combination produced the greatest mechanical advan-tage?
3. Which gear combination do you think is the best for hill-climbing?
4. Which gear combination do you think is the best for racing on alevel track?
number of teeth on rear gear����number of teeth on front gear
Teeth on Front Teeth on Rear MechanicalGear Gear Advantage (MA)
Front gear
Rear gear

Overview
Materials
Preparations
Teaching the Lab
Recommended Time
Lab 13 49 Science and Math Lab Manual
NAME ________________________________________ DATE ______________ PERIOD _____
Sun and TemperatureTeaching Suggestions
Lab
13
Cop
yrig
ht ©
Gle
ncoe
/McG
raw
-Hill
, a
divi
sion
of T
he M
cGra
w-H
ill C
ompa
nies
, In
c.
Lab 13
This activity is designed to show students how the angle of the Sun’s rays affects the temperature at different times of the day. They will estimate the Sun’s intensity rates by experimenting and measuring.
1 class period
• flashlight • ruler
• grid paper (cm) master on p. 210 • pencil
• paper • tape
• protractor
Medium-sized hand-held flashlights work best. You may wish to purchase inexpensive plastic ones from a hardware store, or have students bring their own.
1. Explain how this lab shows how the intensity of sunlight changes with the time of day. Remind students that their measurements are only an estimation, not a true calculation, because of many factors: Earth is round, not flat; the Sun is not always exactly overhead at noon; and so on.
2. Demonstrate how to prepare the flashlight. Show the class how to make the focusing hood and attach it to the flashlight.
3. Show the class how the focusing hood makes the beam’s edge clearlyvisible on a flat surface. Also show students how to use a protractor to measure the angle of the flashlight to the flat surface. Tell the students that this is the angle at which the light rays hit the surface.
4. Have students work in groups of at least two.
5. You may need to dim the lights or turn them off while students areworking with the flashlights.
049-052 Lab13-876070.qxd 6/29/06 2:53 PM Page 49

Lab 13 50 Science and Math Lab Manual
NAME ________________________________________ DATE ______________ PERIOD ____C
opyright ©G
lencoe/McG
raw-H
ill, a division of The M
cGraw
-Hill C
ompanies, Inc.
Sun and TemperatureStudent Worksheet (continued)
1. The percent of lit area increases as the angles decrease.
2. The intensity decreases as the area covered increases.
3. The temperature is higher when the energy is spread over a smaller area.
4. The Sun’s angle at 9 A.M. and 3 P.M. is 45°.
5. Sample answer: The temperature rises until midday and then it begins to fall.
Lab 13
Analysis
049-052 Lab13-876070.qxd 6/29/06 2:53 PM Page 50

Introduction
Energy from the Sun is important for life on Earth. During the day, the total amount of energy from the Sun remains about the same, but the intensity changes. Sunlight intensity is a measure of energy per unit area. The intensity of the Sun is one of the reasons why thetemperature changes during the day.
In this lab, you will:
• simulate the amount of sunlight striking Earth’s surface at different angles.
• estimate the percent of the surface covered by sunlight.
• investigate the relationship between sunlight intensity and temperature.
• flashlight • ruler
• grid paper (cm) • pencil
• paper • tape
• protractor
Part 1 Making a focusing hood for your artificial Sun
1. Wrap the piece of paper around the bulb end of your flashlight to make a tube with the same diameter at both ends. The paper shouldextend at least 3 inches beyond the flashlight.
2. Tape the tube securely to the flashlight. When you turn on the flashlight and shine it on your desk, you should see the edge of the beam clearly.
Part 2 Simulating solar intensity
1. Place your grid paper on a flat surface. Have a classmate hold the flashlight directly above the grid paper. The end of the paper hood should be 2 inches above the paper. The flashlight and hood should make a 90° angle with the paper. Check the angle measure with yourprotractor.
Lab 13 51 Science and Math Lab Manual
NAME ________________________________________ DATE ______________ PERIOD _____
Sun and TemperatureStudent Worksheet
Cop
yrig
ht ©
Gle
ncoe
/McG
raw
-Hill
, a
divi
sion
of T
he M
cGra
w-H
ill C
ompa
nies
, In
c.
Lab 13
Lab
13
Materials
Procedure
Objectives
049-052 SM L13-876070 6/30/06 7:59 AM Page 51
Lab 13 52 Science and Math Lab Manual
NAME ________________________________________ DATE ______________ PERIOD ____C
opyright ©G
lencoe/McG
raw-H
ill, a division of The M
cGraw
-Hill C
ompanies, Inc.
Lab 13 Sun and TemperatureStudent Worksheet (continued)
2. Have the other lab partner carefully trace the outline of light on thepaper. Label this circle 90°.
3. Estimate the percent of the grid paper covered by the sunlight. Record this percent next to the circle.
4. Tilt the flashlight until it makes a 75° angle with the paper. Use aprotractor to measure the angle. Trace the outline of the light and label the outline 75°. Estimate the percent of the paper covered bysunlight and record this number.
5. Repeat the procedure for 60°, 45°, 30°, and 15°. If the light shines off the edge of the grid paper, move the flashlight so that as much of the light as possible is on the paper.
1. What happens to the percent of lit area as the angles decrease?
2. The intensity of sunlight is a measure of energy per unit area. Since the energy from the Sun remains consistent, what do you think happens to the intensity as the area covered by sunlight increases?
3. Is the temperature higher when the energy is spread over a large area or small area?
4. Assume that the Sun rises about 15° each hour and reaches 90° at noon, when it begins decreasing about 15° each hour. What is the Sun’s angle at 9 A.M.? 3 P.M.?
5. Explain what happens to the temperature during the day based on your data.
Analysis
049-052 Lab13-876070.qxd 6/29/06 2:53 PM Page 52

Overview
Lab 14 53 Science and Math Lab Manual
NAME ________________________________________ DATE ______________ PERIOD _____
Getting Gas from WaterTeaching Suggestions
Lab
14
Cop
yrig
ht ©
Gle
ncoe
/McG
raw
-Hill
, a
divi
sion
of T
he M
cGra
w-H
ill C
ompa
nies
, In
c.
Lab 14
Lab
14
Teaching the Lab
Preparations
Materials
Recommended Time
This activity provides students with the opportunity to measure,calculate, and compare volumes.
1 class period
• 250-mL beaker • 2 test tubes or small cylindrical vials
• 6-V lantern battery • acidified water
• 2 pieces of wire, 15 cm long • metric ruler
Add 10–20 drops of sulfuric acid, H2SO4, to a liter of water to prepare the acidified water. The acidity enables the water to conduct electricitybetter. Wear safety goggles, a lab apron, and gloves when working withsulfuric acid.
1. In this lab, students calculate the total volume of a test tube and estimate the volume of hydrogen and oxygen produced by the electrolysis of water.
2. Have students work in pairs. Each student should measure the gasgenerated in the tubes.
3. Make sure each student wears safety goggles when working with the acidified water. Do not allow students to work with sulfuric acid.
4. Demonstrate the correct way of putting a completely filled test tube or vial into a beaker of water. First, completely fill the test tube withwater. Then place your finger over the top of the test tube, invert the tube, and insert it into the beaker. There should be little or no air in the test tube.
5. Remind students to wash their hands thoroughly after placing the tubes into the beaker and after they have finished the lab.
053-056 SM L14-876070.qxd 6/29/06 2:41 PM Page 53

Lab 14 54 Science and Math Lab Manual
NAME ________________________________________ DATE ______________ PERIOD ____C
opyright ©G
lencoe/McG
raw-H
ill, a division of The M
cGraw
-Hill C
ompanies, Inc.
Lab 14 Getting Gas from WaterTeaching Suggestions (continued)
1. Sample answer: The volume of each test tube is 17.7 cm3.
2. test tube A
3. Answers will vary, but students should say they will get about two times as much hydrogen.
4. Answers will vary, but students should get twice as much hydrogen as oxygen.
5. Answers will vary, but students should report about 4 times each volume they collected.
Analysis
053-056 SM L14-876070.qxd 6/29/06 2:41 PM Page 54

Lab 14 55 Science and Math Lab Manual
NAME ________________________________________ DATE ______________ PERIOD _____
Getting Gas from WaterStudent Worksheet
Lab
14
Cop
yrig
ht ©
Gle
ncoe
/McG
raw
-Hill
, a
divi
sion
of T
he M
cGra
w-H
ill C
ompa
nies
, In
c.
Lab 14
Introduction
Procedure
Materials
Objectives
Hydrogen and oxygen atoms are some of the most abundant atoms on Earth. Both of these elements occur as gases in the atmosphere. However,when hydrogen and oxygen are chemically combined, they form water(H2O)—a liquid essential for life. Water can be broken down into gaseoushydrogen and oxygen by passing an electric current through it. This typeof reaction is known as electrolysis.
In this lab, you will:• separate water into hydrogen and oxygen gases and calculate the
volume produced by each.
• compare the volumes of hydrogen and oxygen produced by the reaction.
• 250-mL beaker • 2 test tubes or small cylindrical vials
• 6-V lantern battery • acidified water
• 2 pieces of wire, 15 cm long • metric ruler
1. Put on safety goggles. Work with a partner to fill the 250-mL beakerabout two-thirds full of acidified water.
2. Label one test tube A and the other B.
3. Completely fill the two test tubes with acidified water. Hold your fingerover the top of one of the test tubes, invert the tube, and place it into the beaker. Do not remove your finger until the mouth of the test tube is under water. If your test tube has air bubbles in it, remove it and repeat the procedure with the other test tube.
4. Connect a wire to the positive terminal of the battery. Bend the wire so that you can place it in the beaker and into the mouth of test tube A.Repeat the procedure for the negative terminal and place the wire into test tube B. You should see a stream of bubbles coming from each wire.
053-056 SM L14-876070.qxd 6/29/06 2:41 PM Page 55
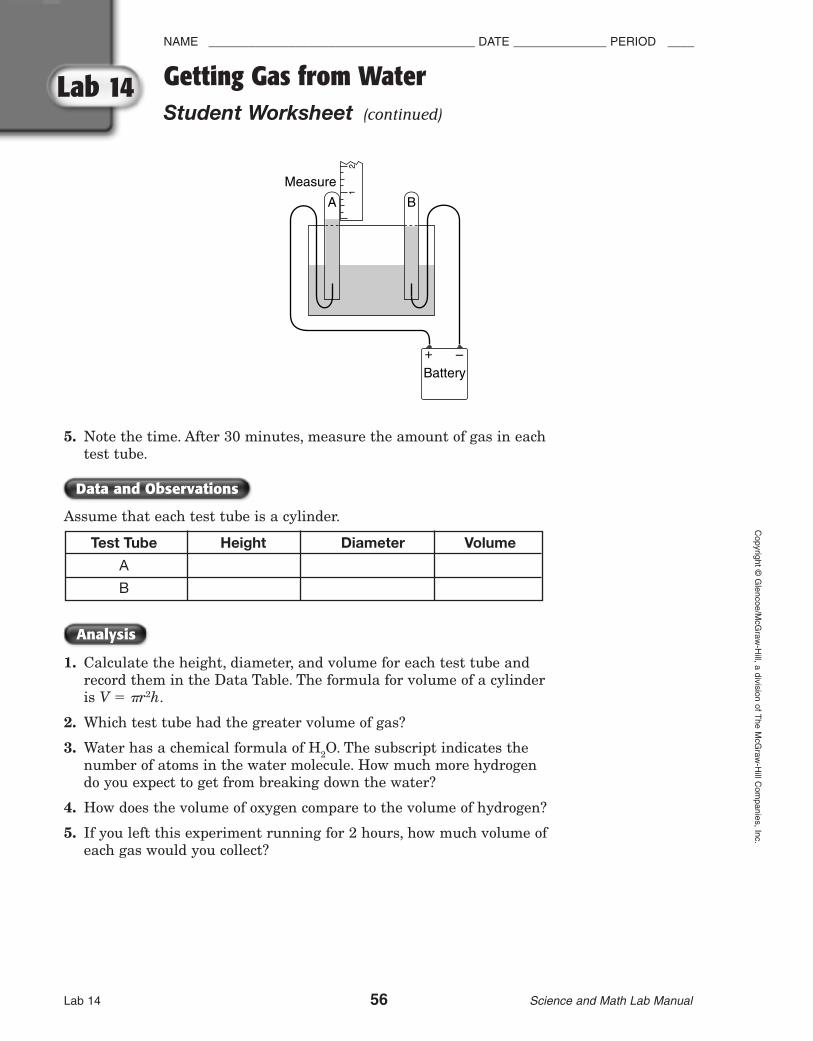
Lab 14 56 Science and Math Lab Manual
NAME ________________________________________ DATE ______________ PERIOD ____C
opyright ©G
lencoe/McG
raw-H
ill, a division of The M
cGraw
-Hill C
ompanies, Inc.
Lab 14 Getting Gas from WaterStudent Worksheet (continued)
Analysis
Data and Observations
Test Tube Height Diameter Volume
A
B
5. Note the time. After 30 minutes, measure the amount of gas in each test tube.
Assume that each test tube is a cylinder.
1. Calculate the height, diameter, and volume for each test tube and record them in the Data Table. The formula for volume of a cylinder is V � �r2h.
2. Which test tube had the greater volume of gas?
3. Water has a chemical formula of H2O. The subscript indicates the number of atoms in the water molecule. How much more hydrogen do you expect to get from breaking down the water?
4. How does the volume of oxygen compare to the volume of hydrogen?
5. If you left this experiment running for 2 hours, how much volume of each gas would you collect?
Battery
12
Measure
A B
+ –
053-056 SM L14-876070 6/30/06 8:12 AM Page 56

Preparations
Materials
Recommended Time
Overview
Lab 15 57 Science and Math Lab Manual
NAME ________________________________________ DATE ______________ PERIOD _____
The Force of a BeanTeaching Suggestions
Lab
15
Cop
yrig
ht ©
Gle
ncoe
/McG
raw
-Hill
, a
divi
sion
of T
he M
cGra
w-H
ill C
ompa
nies
, In
c.
In this activity, students will explore the relationship between forceand distance. Students will create five graphs displaying the distanceof displacement of a bowl under the weight of different numbers ofkidney beans. They will determine coordinate pairs from each graphand use them to create a composite graph. Finally, students will usethe composite graph to predict the distance of displacement underthe weight of certain numbers of beans.
1 class period
• Calculator-Based Ranger (CBR2) • 16-oz bag of dried kidneybeans
• TI graphing calculator • heavy paper bowl• spring • straightedge• ring stand and hook
Before beginning this exercise, consult your user’s manual about howto use the CBR2 with your particular TI graphing calculator.
Connect the calculator to the CBR2 and access its programming.
Attach the center of the paper bowl to one end of the spring. Hang thespring from the crossbar of the ring stand with the hook.
Lab 15

Lab 15 58 Science and Math Lab Manual
NAME ________________________________________ DATE ______________ PERIOD ____C
opyright ©G
lencoe/McG
raw-H
ill, a division of The M
cGraw
-Hill C
ompanies, Inc.
Lab 15 The Force of a BeanTeaching Suggestions (continued)
1. Have students work in small groups.
2. Review the steps required to create distance-time graphs with theCBR2. Press and select SET UP/SAMPLE from the MainMenu. Position the cursor to the right of REALTIME. Press until NO appears. Move the cursor down to TIME by pressing thearrow buttons on the calculator. Enter 5 to change TIME to 5seconds. Position the cursor at DISPLAY and select DIST fordistance. Continue in this manner to set the defaults as follows:BEGIN ON: ENTER, SMOOTHING: LIGHT, UNITS: METERS.Position the cursor at START NOW and press .
1. Graphs will vary.
2. Answers will vary. The line will probably not be straight becausebeans vary in weight and size.
3. Answers will vary.
4. Answers will vary. The actual distance is not likely to match theprediction exactly because the straight line is not an exact tracethrough the points. Beans also vary in size and weight.
Cooked beans weigh more because they have absorbed water. Theslope of the graph would be greater.
ENTER
ENTER
ENTER
Analysis
Teaching the Lab
Further Explorations

Introduction
Procedure
Materials
Objectives
Lab 15 59 Science and Math Lab Manual
NAME ________________________________________ DATE ______________ PERIOD _____
The Force of a BeanStudent Worksheet
Lab
15
Cop
yrig
ht ©
Gle
ncoe
/McG
raw
-Hill
, a
divi
sion
of T
he M
cGra
w-H
ill C
ompa
nies
, In
c.
Lab 15
Can a bean have force? What is force? The energy required toaccomplish a task is one definition of force. Gravity is a type of energythat exerts force. The direct measurement of gravity is not always aneasy task. However, force can be determined indirectly by usingmeasurements of weight and distance. In general, the weight of anobject and the force of gravity determine the distance the object canmove. Force is proportional to this distance. So, a bean can have force.How much? That is what you will find out in this lab.
In this lab, you will:• create graphs of the movement of a bowl under the weight of dried
kidney beans.• determine the distance the bowl moves when different numbers of
beans are added.• use coordinates from each graph to create a composite graph.• predict the distance the bowl would move under the weight of
certain numbers of beans.
• Calculator-Based Ranger (CBR2) • 16-oz bag of dried kidneybeans
• TI graphing calculator • heavy paper bowl• spring • straightedge• ring stand and hook
1. Place the CBR2 on the floor beneath the bowl with the detectorplate pointed upward.
2. Press on the calculator.
3. Quickly place 5 beans in the bowl all at once.
ENTER
Data and Observations
Lab 15 60 Science and Math Lab Manual
NAME ________________________________________ DATE ______________ PERIOD ____C
opyright ©G
lencoe/McG
raw-H
ill, a division of The M
cGraw
-Hill C
ompanies, Inc.
Lab 15 The Force of a BeanStudent Worksheet (continued)
4. Determine a pair of coordinates from the graph by moving thecursor along the line to any position. Enter the coordinate valuesfrom the graph in the Data Table.
5. Return to the Main Menu by pressing and select REPEATSAMPLE. Add 10 beans to the bowl all at once. Repeat thisprocedure with 25, 40, and 50 beans. Enter coordinate pairs fromthese graphs in the Data Table.
6. Press and select QUIT. Disconnect the CBR from thecalculator.
7. Enter the data from your table into lists in the calculator. First, clear all of the data that are in the lists by pressing [MEM] 4
. Press to get to the lists window. Enter thenumber of beans under L1. Enter the distance (Y) in the L2column. Create a composite graph of these points with the calculator. Press [STAT PLOT] . Press 9.
1. Sketch your composite graph on a separate sheet of paper.
2. Connect the points in the graph. Is your line straight? Why or whynot?
3. Use a straightedge and draw a line that passes through the centerof the group of data points. What is the slope of this line?
4. Use your graph and the slope of your line to predict how far 100beans would displace the bowl. If you were to measure this withthe spring and the bowl, would the distance match your predictionexactly? Why or why not?
How would your composite graph differ if you used cooked beans?
ZOOM
ENTERENTERENTER2nd
ENTERSTATENTER
2nd
ENTER
ENTER
Number of Beans X (Time) Y (Distance)
5
10
25
40
50
Analysis
Further Explorations
Teaching the Lab
Overview
Preparations
Materials
Recommended Time
Lab 16 61 Science and Math Lab Manual
NAME ________________________________________ DATE ______________ PERIOD _____
The Way the Ball BouncesTeaching Suggestions
Lab
16
Cop
yrig
ht ©
Gle
ncoe
/McG
raw
-Hill
, a
divi
sion
of T
he M
cGra
w-H
ill C
ompa
nies
, In
c.
Lab 16
This activity will involve students in graphing quadratic equations.They will be asked to make predictions and to use information fromthe graphs to learn about constants.
1 class period
• TI graphing calculator • grid paper• Calculator-Based Ranger (CBR2) • ball (racquetball or
basketball)
Before starting this exercise, consult your user’s manual about usingthe CBR2 with your particular TI graphing calculator.Follow the instructions to connect your calculator to the CBR2 andaccess its programming.
1. Have students work in groups of three. One student should releasethe ball, one should hold the CBR2 unit, and one should record thedata from the calculator.

Analysis
Lab 16 62 Science and Math Lab Manual
NAME ________________________________________ DATE ______________ PERIOD ____C
opyright ©G
lencoe/McG
raw-H
ill, a division of The M
cGraw
-Hill C
ompanies, Inc.
Lab 16 The Way the Ball BouncesTeaching Suggestions (continued)
2. It will be necessary to show the students how to use the CBR2.The student holding the unit will need to press to initiatedata collection. Emphasize the importance of holding the unitsteady while it is collecting data.
3. For best results, do not use a soft or felt-covered ball. The studentwho releases the ball should be reminded to remove his or herhands quickly.
1. Students should graph the following points and draw a parabola toconnect them.
y � –1(x – 3)2 � 5
2. Students should graph the following points and draw a parabola toconnect them.
y � 1(x – 3) 2 � 5
Changing the sign of A inverts the parabola.
3. Answers should be either positive or negative.
4. Answers may vary; no change, increase, or decrease.
5. Answers may vary, but should be approximately –4.9.
6. gravity
TRIGGER
x y
1 9
2 6
3 5
4 6
5 9
x y
1 1
2 4
3 5
4 4
5 1

Introduction
Procedure
Materials
Objectives
Lab 16 63 Science and Math Lab Manual
NAME ________________________________________ DATE ______________ PERIOD _____
The Way the Ball BouncesStudent Worksheet
Lab
16
Cop
yrig
ht ©
Gle
ncoe
/McG
raw
-Hill
, a
divi
sion
of T
he M
cGra
w-H
ill C
ompa
nies
, In
c.
Lab 16
The motion of a bouncing ball can be described by a quadraticequation. The curve that results from a graph of the height of the ballover time is called a parabola. How quickly the ball accelerates andthe maximum height that the ball bounces will affect the shape of theparabola. These variables are factors in the quadratic equation.
In this lab, you will:• graph the distance of a ball from the floor over time as it bounces.• compare the equations for different bounces to see how they
change.
• TI graphing calculator • grid paper• Calculator-Based Ranger (CBR2) • ball (racquetball or
basketball)
1. Before collecting any data, answer Questions 1–4.
2. Have one person hold the CBR2 at waist-height. Another personshould hold the ball 0.5 meter below the CBR2. The person withthe calculator should press .
3. When the person with the CBR2 presses , the CBR2 willclick as it collects data. The person with the ball should release itand quickly remove his or her hands.
4. If necessary, resample by repeating Steps 2–3. When you havefinished collecting data, press . The calculator should showa height-time graph of the bouncing ball.
5. Using the arrow keys, find the x- and y-coordinates near the lowerleft and lower right of the first complete parabola and thecoordinates for the vertex, or highest point, of the parabola. Besure that the cursor is on the parabola for the lower data points.Record the data in Table 1.
ENTER
TRIGGER
ENTER

Data and Observations
Analysis
Lab 16 64 Science and Math Lab Manual
NAME ________________________________________ DATE ______________ PERIOD ____C
opyright ©G
lencoe/McG
raw-H
ill, a division of The M
cGraw
-Hill C
ompanies, Inc.
Lab 16 The Way the Ball BouncesStudent Worksheet (continued)
6. Press and select 5: REPEAT SAMPLE from the PLOTmenu.
Press again. Repeat Steps 2–5, holding the CBR2 atshoulder-height. Record the data in Table 2.
TABLE 1 TABLE 2
1. The quadratic equation for the height of a bouncing ball overtime is y � A(x – H)2 � K (x is time and y is height). Calculatethe following y values from the given x values if A � –1, H � 3,and K � 5. First rewrite the equation, substituting in the A, H,and K values. Graph the points and connect them with asmooth curve on a separate piece of grid paper.
2. What effect does changing the sign of A have? Repeat Question 1using A � 1. Compare the two graphs and describe thedifference.
3. What do you predict the sign of A will be for the bouncing ball?
4. A is related to the acceleration of the ball, in other words, how quickly it speeds up. If you drop the ball from different heights, will A change? If yes, how will it change?
5. Using the calculator and the formula A � (y – K)/(x – H)2, calculate A from the data in Table 1 and calculate A from the data in Table 2. Use the vertex (H, K) and the lower left point (x, y).
A for Table 1 � A for Table 2 �
6. What physical force is responsible for the rate at which the heightof the ball decreases?
ENTER
ENTER
Location x y
lower left
vertex (H, K)
lower right
Location x y
lower left
vertex (H, K)
lower right
x y
1
2
3
4
5
x y
1
2
3
4
5

Analysis
Overview
Teaching the Lab
Preparations
Materials
Recommended Time
This activity provides students with the opportunity to explore theconcept of radioactive decay. Students will be required to predict andmeasure exponential decay in a simulation of radioactivity.
1 class period
• small bag of dried split peas • bag of dried lima beans
• 250-mL beaker • large baking tray
• grid paper
No special preparation is needed.
1. Have students work individually or in pairs.
2. Have students compare their results. You may want to find anaverage half-life by using the data of the entire class.
1. Answers will vary slightly. The half-life is about 5.1 minutes.
2. Each atomic nucleus of the parent that decayed became a stablenucleus of the daughter element. As the number of parent nucleidecreased, the number of daughter nuclei increased.
3. Only Question c can be answered. It is impossible to predict whichsplit pea will fall flat side up or when a particular split pea will fallflat side up. However, one can predict the number of split peasremaining after 3 observations. (About 34 split peas should beremaining after 3 half-lives.)
Lab 17 65 Science and Math Lab Manual
NAME ________________________________________ DATE ______________ PERIOD _____
Simulating Radioactive DecayTeaching Suggestions
Lab
17
Cop
yrig
ht ©
Gle
ncoe
/McG
raw
-Hill
, a
divi
sion
of T
he M
cGra
w-H
ill C
ompa
nies
, In
c.
Lab 17

Procedure
Materials
Introduction
Objectives
Lab 17 66 Science and Math Lab Manual
NAME _________________________________________ DATE ______________ PERIOD ____C
opyright ©G
lencoe/McG
raw-H
ill, a division of The M
cGraw
-Hill C
ompanies, Inc.
Lab 17 Simulating Radioactive DecayStudent Worksheet
Certain elements are made up of atoms whose nuclei are naturallyunstable. These elements are said to be radioactive. The nucleuswithin an atom of a radioactive element will decay into the stableatomic nucleus of another element by emitting or capturing atomicparticles. The unstable element is called the “parent” element and thestable element is called the “daughter” element. It is impossible topredict when the nucleus of an individual radioactive atom will decay.However, if a large number of nuclei are present in a sample, it ispossible to predict how much time it would take for half of the nucleiin the sample to decay. This time period is called the half-life of theelement.Atoms are too small to see with our eyes. Special laboratoryequipment is needed to count atomic nuclei in elements. To eliminatethis problem, you will simulate the decay of unstable nuclei by usingmaterials that are easy to observe. In this lab, you will use dried splitpeas to represent the unstable nuclei of the parent element. Driedlima beans will represent the stable nuclei of the daughter element.Your observations will allow you to model how the atomic nuclei ofradioactive elements decay.
In this lab, you will:
• simulate the decay of a radioactive element.
• graph the results of the simulated decay.
• determine the half-life of the element.
• small bag of dried split peas • bag of dried lima beans
• 250-mL beaker • large baking tray
• grid paper
1. Count out 200 dried split peas and place them in a beaker.

Data and Observations
Lab 17 67 Science and Math Lab Manual
NAME ________________________________________ DATE ______________ PERIOD _____
Simulating Radioactive DecayStudent Worksheet (continued)
Lab
17
Cop
yrig
ht ©
Gle
ncoe
/McG
raw
-Hill
, a
divi
sion
of T
he M
cGra
w-H
ill C
ompa
nies
, In
c.
Lab 17
2. Place the baking tray on a flat surface.
3. Hold the beaker over the tray and sprinkle all of the split peas ontothe tray. Try to produce a single layer of split peas on the tray.
4. Remove all the split peas that have not landed flat side down.Count the split peas that you have removed from the tray andreturn them to the bag. Replace the number of peas that you haveremoved from the tray with an equal number of lima beans.
5. Count the number of peas and the number of lima beans on thetray. Record these values in the Data Table as Observation 1.
6. Scoop the peas and beans from the tray and place them into thebeaker.
7. Predict how many split peas you will remove if you repeat Steps3–5.
8. Repeat Steps 3 through 6, recording your data in the Data Tableas Observation 2.
9. Predict how many observations you will have to make until thereare no split peas remaining.
10. Repeat Steps 4 through 6 until there are no split peas remaining.
Observation Time (Minutes) No. of Split Peas No. of Lima Beans
0 0 200 0
1 5
2 10

Lab 17 68 Science and Math Lab Manual
NAME _________________________________________ DATE ______________ PERIOD ____C
opyright ©G
lencoe/McG
raw-H
ill, a division of The M
cGraw
-Hill C
ompanies, Inc.
Lab 17 Simulating Radioactive DecayStudent Worksheet (continued)
AnalysisIn this experiment, each split pea represents the nucleus of an atomof the radioactive parent element. A split pea that has landed flat sidedown represents the nucleus of an atom of the parent element thathas not yet decayed. Each split pea that has not landed flat side downrepresents the nucleus of an atom of the parent element that hasdecayed. When the parent element decays, it forms a new elementcalled a daughter, which is represented by a lima bean.Assume that the time period between each observation was 5 minutes. Observation 1 will have been made at 5 minutes,Observation 2 at 10 minutes, and so on. Complete the time column inyour data table.
1. Use graph paper to graph the results of your experiment. Plot onthe vertical y-axis the number of parent atoms remaining aftereach observation. Plot the observation number on the horizontal x-axis.
2. Use your graph to construct another graph. Plot on the vertical y-axis the number of daughter atoms remaining after each observation. Plot the time of the observation on the horizontal x-axis.
3. Determine the half-life of the parent element from your graph.
Questions and Conclusions
1. What is the half-life of the parent element?
2. The two graphs you constructed are mirror images. Explain why thisis so.
3. Suppose you are given 400 dried split peas to do this experiment.Explain which of the following questions you could answer beforestarting this experiment.
a. Can you identify which split peas will fall flat side up?
b. Can you predict when an individual split pea will fall flat side up?
c. Can you predict how many split peas will be remaining after 3observations?

Overview
Teaching the Lab
Preparations
Materials
Recommended Time
Lab 18 69 Science and Math Lab Manual
NAME ________________________________________ DATE ______________ PERIOD _____
Smoke PollutionTeaching Suggestions
Lab
18
Cop
yrig
ht ©
Gle
ncoe
/McG
raw
-Hill
, a
divi
sion
of T
he M
cGra
w-H
ill C
ompa
nies
, In
c.
Lab 18
This activity provides students with the opportunity to learn howenvironmental scientists identify sources of air pollution byestimating the visual percent density of smoke. Students will berequired to estimate the percent density of smoke from photographsand from burning incense.
1 class period
• 10-cm � 20-cm piece of cardboard (thin) • scissors
• glue or paste • incense
• Ringelmann Chart • matches
Look in magazines for photographs of forest fires, building fires, oilwell fires, and smokestacks. Find a variety of photos of smokeemission for students to examine.
1. Have students work individually.
2. You may need to explain that adding black to white results in gray.One way to demonstrate this is by adding black ink or watercolorpaint to a glass of water. Add the paint or ink drop by drop whilestirring to show how the water darkens as more black is added.
3. Light the incense and allow students to observe the smoke.Caution students not to hold their Ringelmann Charts too close tothe burning incense.
4. Caution students not to inhale the smoke.

1. The relative amount of pollution entering the atmosphere is 70%.
2. Sample answer: Wind usually disperses smoke and may carry it toa location that has clean air.
3. Sample answer: oil refineries; power plants
4. Yes, some gases are colorless and can cause injury in smallamounts and over short periods of time.
Lab 18 70 Science and Math Lab Manual
NAME ________________________________________ DATE ______________ PERIOD ____C
opyright ©G
lencoe/McG
raw-H
ill, a division of The M
cGraw
-Hill C
ompanies, Inc.
Lab xx Smoke PollutionTeaching Suggestions (continued)
NAME ________________________________________ DATE ______________ PERIOD ____
Lab 18
Analysis

Introduction
Lab 18 71 Science and Math Lab Manual
NAME ________________________________________ DATE ______________ PERIOD _____
Smoke PollutionStudent Worksheet
Lab 18
Procedure
Materials
Objectives
Lab
18
The U.S. Bureau of Mines has adopted the Ringelmann Chart as itsbasic scale for measuring smoke pollution. The Ringelmann Chart isoften used in making visual estimates of the amount of solid matteremitted by smokestacks. The observer compares the color of thesmoke with a series of shaded columns. The shaded columnsrepresent increasing percent densities of smoke as visually measuredagainst a white background. Using an adapted version of this chart,you can identify sources of smoke pollution.
In this lab, you will:
• observe a smoke source and estimate the visual percent density ofthe smoke.
• 10-cm � 20-cm piece of cardboard (thin) • scissors
• glue or paste • incense
• Ringelmann Chart
Part 1
1. Cut out the Ringelmann Chart and glue it to the cardboard.Ringelmann Chart
0.10 0.20 0.30
Cut out
0.40 0.70
Cop
yrig
ht ©
Gle
ncoe
/McG
raw
-Hill
, a
divi
sion
of T
he M
cGra
w-H
ill C
ompa
nies
, In
c.

Lab 18 72 Science and Math Lab Manual
NAME ________________________________________ DATE ______________ PERIOD ____C
opyright ©G
lencoe/McG
raw-H
ill, a division of The M
cGraw
-Hill C
ompanies, Inc.
Lab 18 Smoke PollutionStudent Worksheet (continued)
2. When the glue is dry, cut out the center window by cutting alongthe dotted lines.
3. Hold up your card and view the smoke from the burning incensethrough the center window.
4. Match the color of the darkest part of the smoke plume to one ofthe columns on your Ringelmann Chart.
5. Record the percent density in the Data Table.
Part 2
1. Observe the smoke in three different color photographs.
2. Place your card over the darkest part of the smoke in thephotograph.
3. Match the color of the darkest part of the smoke plume to one ofthe columns on your chart.
4. Record the percent density in the Data Table.
1. The 0.20 on the Ringelmann Chart indicates that the relativeamount of pollution entering the atmosphere is 20%. What doesthe 0.70 value indicate about the relative amount of pollutionentering the atmosphere?
2. How do you think wind would affect smoke pollution?
3. What types of industries produce the air pollutants in your localarea?
4. Some companies emit invisible gases. Might these gases also bepollutants? Explain.
Description of Smoke Source Percent Density
Analysis
Data and Observations

Preparations
Lab 19 73 Science and Math Lab Manual
NAME ________________________________________ DATE ______________ PERIOD _____
Genetic TraitsTeaching Suggestions
Lab
19
Cop
yrig
ht ©
Gle
ncoe
/McG
raw
-Hill
, a
divi
sion
of T
he M
cGra
w-H
ill C
ompa
nies
, In
c.
Overview
Teaching the Lab
Materials
Recommended Time
Lab 19
This activity provides students with the opportunity to combineobservation and data collection with the calculation of percent.Students will be required to correctly identify forms of commonphysical genetic traits and to find the percent of each form of thesetraits in the class.
1 class period
• none
You may wish to familiarize yourself with the different traits andtheir forms before the lab begins.
1. Have students work with a partner to identify their own forms ofeach trait and then compare the results as a whole class.
2. Help students identify the different genetic traits.

Lab 19 74 Science and Math Lab Manual
NAME ________________________________________ DATE ______________ PERIOD ____C
opyright ©G
lencoe/McG
raw-H
ill, a division of The M
cGraw
-Hill C
ompanies, Inc.
Lab 19 Genetic TraitsTeaching Suggestions (continued)
1. Sample answer: Handedness: Left, 30%; Right, 70%, and so on
2. Percents should add up to 100%. Answers other than 100% may bea rounding error.
3. Sample answer: tongue rollers
4. Sample answer: freckles
Analysis

Lab 19 75 Science and Math Lab Manual
NAME ________________________________________ DATE ______________ PERIOD _____
Lab
19
Cop
yrig
ht ©
Gle
ncoe
/McG
raw
-Hill
, a
divi
sion
of T
he M
cGra
w-H
ill C
ompa
nies
, In
c.
Lab xx
Introduction
Procedure
Materials
Objectives
Lab 19
Genetic traits are characteristics that are passed from parents to off-spring. Children receive half of their traits from their mother and halffrom their father. Traits such as eye color and hair color can have awide range of variation, while other traits have only two possibleforms. In this activity, you will identify some common genetic traitsand find the percent of students in your class that possess each formof the traits.
In this lab, you will:• collect data on the number of students expressing certain forms of
genetic traits.• find the percent of students who express each form of the traits.
• none
1. Work with a partner during the first part of this activity. Completethe column labeled “You” in the Data Table for each of the genetictraits listed. Ask your partner to help you describe the traits youcannot see. Refer to the figure for an explanation of traits withwhich you are not familiar.
2. After completing the data table for yourself and your partner,record the totals of each trait for the entire class and calculate thepercents for each.
Roller Non-rollerStraight Peaked
Hairline
Hair view across forehead
Tongue
Edges of tongue can or cannot be rolled up.
Hair whorl
ClockwiseFree Attatched
Counterclockwise
Hair view at back of head
Ear lobe
Side view of ear lobe shape
Genetic TraitsStudent Worksheet

Lab 19 76 Science and Math Lab Manual
NAME ________________________________________ DATE ______________ PERIOD ____C
opyright ©G
lencoe/McG
raw-H
ill, a division of The M
cGraw
-Hill C
ompanies, Inc.
Data and Observations
Analysis
*See the illustrations on page 75.
1. Find the percent of each trait in the class. Enter the percents inthe Data Table below.
Total number of students:
2. Do the percents of each trait add up to 100%? Explain why or why not.
3. What is the most common form of trait in your class?
4. Do any of the traits have evenly distributed forms in your class?
Lab 19 Genetic TraitsStudent Worksheet (continued)
Trait Class Percents
Handedness Left � Right �
Hairline Straight � Peaked �
Dimples Yes � No �
Freckles Present � Absent �
Hair Whorl Clockwise � Counterclockwise �
Ear Lobe Free � Attached �
Tongue Roller � Non-roller �
Trait Description (Form) You Class Totals
Handedness Left or Right
Hairline* Straight or Peaked
Dimples Yes or No
Freckles Present or Absent
Hair Whorl* Clockwise or Counterclockwise
Ear Lobe* Free or Attached
Tongue* Roller or Non-roller

Recommended Time
Overview
Teaching the Lab
Preparations
Materials
Lab 20 77 Science and Math Lab Manual
NAME ________________________________________ DATE ______________ PERIOD _____
It’s Raining, It’s PouringTeaching Suggestions
Lab
20
Cop
yrig
ht ©
Gle
ncoe
/McG
raw
-Hill
, a
divi
sion
of T
he M
cGra
w-H
ill C
ompa
nies
, In
c.
Lab 20
This activity provides students with the opportunity to interpret data by graphing and averaging decimal numbers. Students will graph localmonthly rainfall totals, find the total annual rainfall, and calculate seasonal rainfall averages.
1 class period
• local rainfall data for each month of the previous year• average annual local rainfall• current local rainfall total for this month
Obtain rainfall data from your local newspaper office, television station,or the Internet.
1. Have students work individually.
2. You may wish to have advanced students find rainfall data on their own.
077-080 SM L20-876070 6/29/06 3:46 PM Page 77

Data and Observations
Analysis
Extension
Lab 20 78 Science and Math Lab Manual
NAME _________________________________________ DATE ______________ PERIOD ____C
opyright ©G
lencoe/McG
raw-H
ill, a division of The M
cGraw
-Hill C
ompanies, Inc.
Lab 20 It’s Raining, It’s PouringTeaching Suggestions (continued)
Sample Rainfall Data for 1997
1. Sample answer: May
2. Sample answer: March
3. Sample answer: greatest—spring; least—winter
4. Sample answer: 29.6 in.
5. Sample answer: 2.46 in.
6. Sample answer: The area has received more than the average monthly rainfall by 0.34 inches.
Sample answer: The 10-year monthly averages are slightly higher except in February, April, and May. The 10-year data show a slightly higher yearly total.
Month Rainfall (in.)
January 1.8
February 1.9
March 1.1
April 3.0
May 5.2
June 4.7
July 1.5
August 1.3
September 2.1
October 2.8
November 2.2
December 2.0
Total 29.6
Rainfall(inches)
Winter Spring Summer Fall
10-Year Monthly Average Rainfall
0
Jan
1
2
3
5
6
4
Feb
Mar
Apr
May
Jun
Jul
Aug
Nov
Dec
Sep
Oct
077-080 SM L20-876070 6/29/06 3:46 PM Page 78
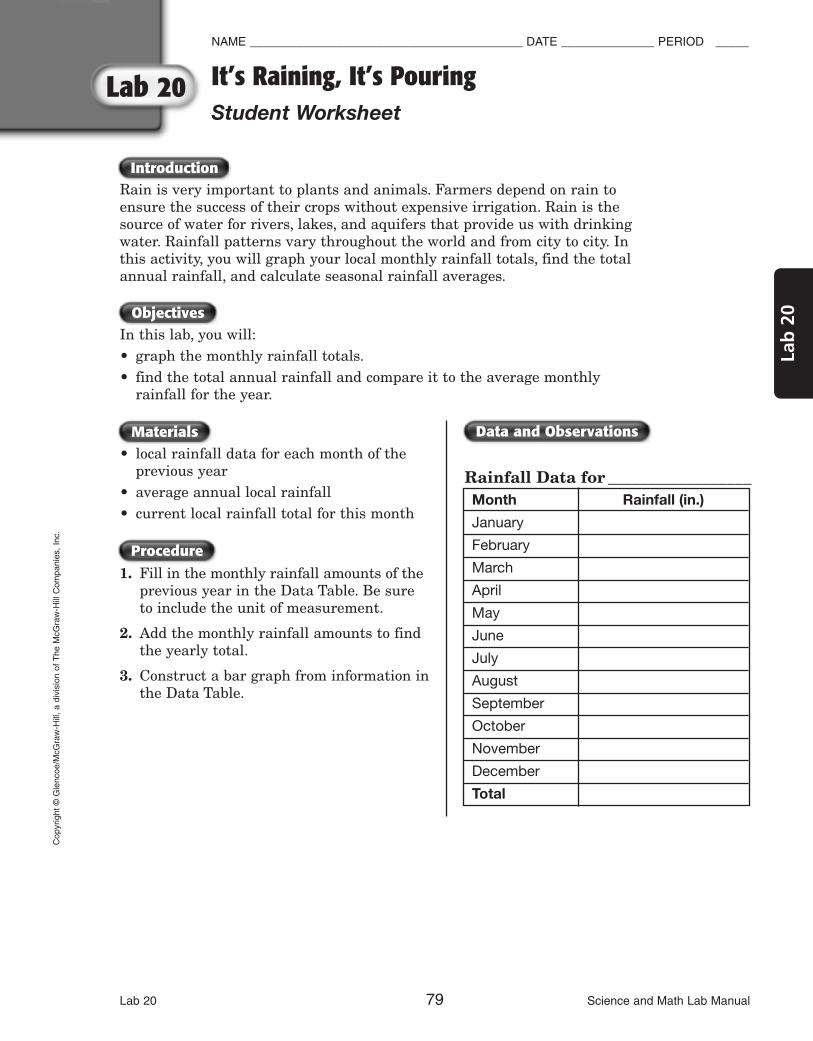
Introduction
Data and Observations
Procedure
Materials
Objectives
Lab 20 79 Science and Math Lab Manual
NAME _________________________________________ DATE ______________ PERIOD _____
It’s Raining, It’s PouringStudent Worksheet
Lab
20
Cop
yrig
ht ©
Gle
ncoe
/McG
raw
-Hill
, a
divi
sion
of T
he M
cGra
w-H
ill C
ompa
nies
, In
c.
Lab 20
Rain is very important to plants and animals. Farmers depend on rain toensure the success of their crops without expensive irrigation. Rain is thesource of water for rivers, lakes, and aquifers that provide us with drinkingwater. Rainfall patterns vary throughout the world and from city to city. Inthis activity, you will graph your local monthly rainfall totals, find the totalannual rainfall, and calculate seasonal rainfall averages.
In this lab, you will:• graph the monthly rainfall totals.• find the total annual rainfall and compare it to the average monthly
rainfall for the year.
• local rainfall data for each month of the previous year
• average annual local rainfall• current local rainfall total for this month
1. Fill in the monthly rainfall amounts of theprevious year in the Data Table. Be sureto include the unit of measurement.
2. Add the monthly rainfall amounts to findthe yearly total.
3. Construct a bar graph from information inthe Data Table.
Rainfall Data for __________________Month Rainfall (in.)
January
February
March
April
May
June
July
August
September
October
November
December
Total
077-080 SM L20-876070 6/29/06 3:46 PM Page 79

Analysis
Extension
Lab 20 80 Science and Math Lab Manual
NAME _________________________________________ DATE ______________ PERIOD ____C
opyright ©G
lencoe/McG
raw-H
ill, a division of The M
cGraw
-Hill C
ompanies, Inc.
Lab 20 It’s Raining, It’s PouringStudent Worksheet (continued)
1. Which month received the greatest rainfall?
2. Which month received the least rainfall?
3. Examine the graph and Data Table. Which season had the greatestaverage rainfall? Which season had the least average rainfall?
4. What was the total rainfall for the year?
5. What is the average monthly rainfall for the year?
6. Ask your teacher for the current rainfall total for this month. Has your area received more or less than the average monthly rainfallcalculated in Question 5? by how much?
Find the monthly rainfall data for the past 10 years. Calculate the average rainfall for each month over this 10-year period. Graph theseaverages on a bar graph. Compare this graph with the graph above.How do last year’s data compare with the 10-year monthly averages?
Winter Spring Summer Fall
Rainfall Graph for __________
Jan
Feb
Mar
Apr
May
Jun
Jul
Aug
Nov
Dec
Sep
Oct
077-080 SM L20-876070 6/29/06 3:46 PM Page 80

Overview
Analysis
Teaching the Lab
Preparations
Materials
Recommended Time
Lab 21 81 Science and Math Lab Manual
NAME ________________________________________ DATE ______________ PERIOD _____
PulleysTeaching Suggestions
Lab
21
Cop
yrig
ht ©
Gle
ncoe
/McG
raw
-Hill
, a
divi
sion
of T
he M
cGra
w-H
ill C
ompa
nies
, In
c.
Lab 21
This activity provides students with the opportunity to explore thework efficiency of simple machines. Students will be required tomeasure force and distance to calculate the work required to lift amass. Students will calculate the efficiency of both a single pulley anda block and tackle.
1 class period
• 1-m length of cotton string • utility clamp• 0.5-kg standard mass • masking tape• 2 plastic-coated wire ties, 10 cm and 30 cm long • 2 pulleys• metric spring scale (calibrated in newtons) • ring stand• meterstick
No special preparation is needed.
Have students work in pairs or small groups.
1. Sample answer:Work input for the single Work input for the block pulley is 0.78 J. and tackle is 0.90 J.Work output for the single Work output for the block pulley is 0.75 J. and tackle is 0.75 J.
2. Sample answer:Efficiency of the single Efficiency of the block pulley is 0.96. and tackle is 0.83.
3. Sample answer: The work input for the single pulley is less thanthat for the block and tackle.

Introduction
Materials
Objectives
A simple machine, such as a pulley, changes the direction of a forceand increases either the size of the effort force or the distance theresistance moves. If you have ever raised or lowered a flag or aslatted window blind, you have used a pulley. A single fixed pulley isone that cannot move up or down. A series of pulleys is called a blockand tackle. You may have seen a block and tackle in an auto repairshop, where it is used to lift car engines.
In this lab, you will:• perform work using a single fixed pulley.• construct a block and tackle and use it to perform work.• compare the properties of a single fixed pulley and a block and
tackle.
• 1-m length of cotton string • utility clamp• 0.5-kg standard mass • masking tape• 2 plastic-coated wire ties, 10 cm and 30 cm long • 2 pulleys• metric spring scale (calibrated in newtons) • ring stand• meterstick
MeterstickSpring scale
Effort
Resistance
0.5-kg mass
Blo
ck a
nd ta
ckle
Block and Tackle
Meterstick
Ring stand
Utility clamp
Wire tie
Pulley
Effort
Resistance
Single Fixed Pulley
Lab 21 82 Science and Math Lab Manual
NAME ________________________________________ DATE ______________ PERIOD ____C
opyright ©G
lencoe/McG
raw-H
ill, a division of The M
cGraw
-Hill C
ompanies, Inc.
Lab 21 PulleysStudent Worksheet

PulleysStudent Worksheet (continued)
Lab 21 83 Science and Math Lab Manual
NAME ________________________________________ DATE ______________ PERIOD _____
Lab
21
Cop
yrig
ht ©
Gle
ncoe
/McG
raw
-Hill
, a
divi
sion
of T
he M
cGra
w-H
ill C
ompa
nies
, In
c.
Lab 21
NAME ________________________________________ DATE ______________ PERIOD _____
Procedure
Part 1 Single Fixed Pulley
1. Attach the utility clamp to the top of the ring stand. Attach one of the pulleys to the utility clamp with the 10-cm long wire tie.
2. Tie a small loop at each end of the 1-m length of string. Thenthread the string through the pulley.
3. Tightly wind the 30-cm wire tie to the 0.5-kg mass. Use the tie to attach the 0.5-kg mass to the spring scale. Record its weight in newtons (N) under Resistance Force in the Data Table.
4. Remove the mass from the spring scale and attach it to one loop of the pulley string. Attach the other loop of the string to thespring scale.
5. Pull the spring scale straight down and measure the force neededto lift the mass 15 cm. Record this value as Effort Force in theData Table.
6. Measure the length of string required to lift the mass 15 cm.Record this value as Effort Distance in the Data Table.
Part 2 Block and Tackle
1. Remove the 0.5-kg mass and spring scale from the string.
2. Attach the string to the second pulley and thread the stringthrough the pulleys as shown in the figure on page 72.
3. Measure the weight of the 0.5-kg mass by attaching the mass to the spring scale. Record this value in the Data Table underResistance Force.
4. Attach the mass to the second pulley and then attach the springscale to the loop on the free end of the string. Pull the scalestraight up.
5. Measure the force needed to lift the mass 15 cm and record it inthe Data Table.
6. Measure the distance the scale moved to lift the mass 15 cm andrecord it in the Data Table as Effort Distance.

Analysis
Lab 21 84 Science and Math Lab Manual
NAME ________________________________________ DATE ______________ PERIOD ____C
opyright ©G
lencoe/McG
raw-H
ill, a division of The M
cGraw
-Hill C
ompanies, Inc.
PulleysStudent Worksheet (continued)
1. Work is calculated in joules (J) by multiplying force in newtons (N) and distance in meters (m). Be sure to convert distance valuesfrom centimeters to meters. Work input is the work done by you.Work input can be calculated by using the following equation.
Work input (J) � Effort force (N) � Effort distance (m)
Your work input for the single pulley is:
Your work input for the block and tackle is:
Work output is the work done by the pulley. Work output can becalculated by using the following equation.
Work output (J) � Resistance force (N) � Resistance distance (m)
Your work output for the single pulley is:Your work output for the block and tackle is:
2. The efficiency of a machine is a measure of how work outputcompares with work input. The efficiency can be calculated byusing the following equation.
Efficiency �
Efficiency of the single pulley is:Efficiency of the block and tackle is:
3. Why is the efficiency of the single pulley less than the efficiency ofthe block and tackle?
Work output��Work input
Lab 21
Data and Observations
Type Resistance Resistance Effort Force Effort DistanceDistance (cm) Force (N) (N) (cm)
Single Pulley
Block and Tackle

Objectives
Data and Observations
Teaching the Lab
Preparations
Materials
Recommended Time
Lab 22 85 Science and Math Lab Manual
NAME ________________________________________ DATE ______________ PERIOD _____
Scientific Notation and Astronomical DistancesTeaching Suggestions
Lab
22
Cop
yrig
ht ©
Gle
ncoe
/McG
raw
-Hill
, a
divi
sion
of T
he M
cGra
w-H
ill C
ompa
nies
, In
c.
Lab 22
• Use scientific notation to express the distances in the solar system.• Choose a scale to represent the distances in the solar system.• Make a model to visually illustrate the distances between the sun
and each of the planets.
1 class period
• adding machine tape (15 rolls)• meterstick (15)• felt tip pen (15)• scissors
Gather materials.
• Have students work with partners.• Suggest that students look at the maximum distance first when
they are trying to choose a scale.
DATA TABLE
Planet Average distance
Average distance
Scale distance from sun (km)
from sun (km)
from sun (cm)expressed in scientific notation
Mercury 4 58 000 000 445.8 � 107 445.8
Venus 4 108 000 000 41.08 � 108 410.8
Earth 4 150 000 000 41.50 � 108 415.0
Mars 4 229 000 000 42.29 � 108 422.9
Jupiter 4 777 000 000 47.77 � 108 477.7
Saturn 1 426 000 000 1.426 � 109 142.6
Uranus 2 876 000 000 2.876 � 109 287.6
Neptune 4 490 000 000 44.49 � 109 449.0
Pluto 5 914 000 000 5.914 � 109 591.4
Scale of distances 1 cm � 10 000 000 km

Analysis
Further Explorations
Lab 22 86 Science and Math Lab Manual
NAME ________________________________________ DATE ______________ PERIOD ____C
opyright ©G
lencoe/McG
raw-H
ill, a division of The M
cGraw
-Hill C
ompanies, Inc.
Lab 22 Scientific Notation and Astronomical DistancesTeaching Suggestions (continued)
5. Answers will vary, but students should mention that expressinglarge distances in scientific notation makes relative distances moreobvious. Students can estimate a reasonable scale by looking firstat the exponents.
6. The model can help students understand relative distances; themagnitude of the distances is not shown on the model.
7. Answers will vary, but should describe a scale that results in amodel that shows distances between the planets and the sunwithout being impractically long.
8. About 2.6 � 107 years
Have students use their models to draft maps of the solar system ongrid paper. Their maps should have a scale, which may be differentfrom the scale they used for their models.

Introduction
Procedure
Materials
Objectives
Astronomers work with very large numbers in calculating distancesin the universe. Light from our sun takes 8 minutes to reach Earth.Light emitted by the next closest star, Alpha Centauri, takes 4.3years. How far is Alpha Centauri? The distance light travels in oneyear is about 9 � 1012 miles. The distance to Alpha Centauri is about3.87 � 1013 miles. Can you imagine how far this distance is? Makinga model is a good way to start.
• Use scientific notation to express the distances in the solar system.• Choose a scale to represent the distances in the solar system.• Make a model to visually illustrate the distances between the sun
and each of the planets.
• adding machine tape• meter stick (1)• felt tip pen (1)• scissors
1. Convert into scientific notation the distances between each planetand the sun. Add your answers to the Data Table.
2. Choose a scale to use in your model of the distances between theplanets and the sun. (By expressing the distances in scientificnotation, you will make it easier to decide on a scale.) Determinethe scale distance for each planet. Record your answers in theData Table.
3. Place a dot at one end of the adding machine tape to represent thesun. Figure out how long your piece of tape needs to be to fit theplanets to scale. Cut the correct amount of adding machine tapefrom the roll.
4. Use the scale distance to find the position of each planet on theadding machine tape. Place a dot along the tape for each planet.Label each dot with the name of the planet it represents.
Lab 22 87 Science and Math Lab Manual
NAME ________________________________________ DATE ______________ PERIOD _____
Scientific Notation and Astronomical DistancesStudent Worksheet
Lab
22
Cop
yrig
ht ©
Gle
ncoe
/McG
raw
-Hill
, a
divi
sion
of T
he M
cGra
w-H
ill C
ompa
nies
, In
c.
Lab 22
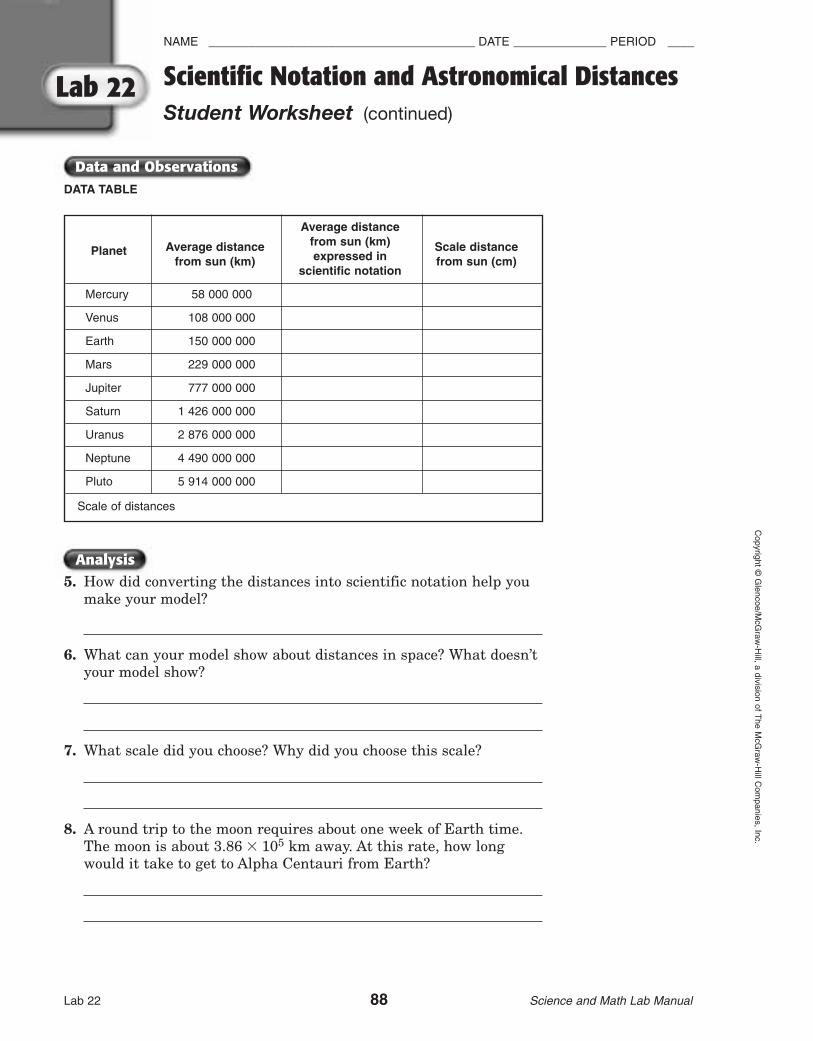
Data and Observations
Analysis
Lab 22 88 Science and Math Lab Manual
NAME ________________________________________ DATE ______________ PERIOD ____C
opyright ©G
lencoe/McG
raw-H
ill, a division of The M
cGraw
-Hill C
ompanies, Inc.
Lab 22 Scientific Notation and Astronomical DistancesStudent Worksheet (continued)
DATA TABLE
5. How did converting the distances into scientific notation help youmake your model?
6. What can your model show about distances in space? What doesn’tyour model show?
7. What scale did you choose? Why did you choose this scale?
8. A round trip to the moon requires about one week of Earth time.The moon is about 3.86 � 105 km away. At this rate, how longwould it take to get to Alpha Centauri from Earth?
Planet Average distance
Average distance
Scale distance from sun (km)
from sun (km)
from sun (cm)expressed in scientific notation
Mercury 4 58 000 000 4
Venus 4 108 000 000
Earth 4 150 000 000 4
Mars 4 229 000 000
Jupiter 4 777 000 000
Saturn 1 426 000 000
Uranus 2 876 000 000
Neptune 4 490 000 000
Pluto 5 914 000 000
Scale of distances

Overview
Teaching the Lab
Preparations
Materials
Recommended Time
Lab 23 89 Science and Math Lab Manual
NAME ________________________________________ DATE ______________ PERIOD _____
The Gender of ChildrenTeaching Suggestions
Lab
23
Cop
yrig
ht ©
Gle
ncoe
/McG
raw
-Hill
, a
divi
sion
of T
he M
cGra
w-H
ill C
ompa
nies
, In
c.
Lab 23
This activity provides students with the opportunity to exploreindependent events. Students will simulate the determination ofgender in offspring as an independent event.
1 class period
• coin
No special preparation is needed.
1. Have students work individually.
2. After each student has completed his or her simulation, comparethe results of the class simulations.
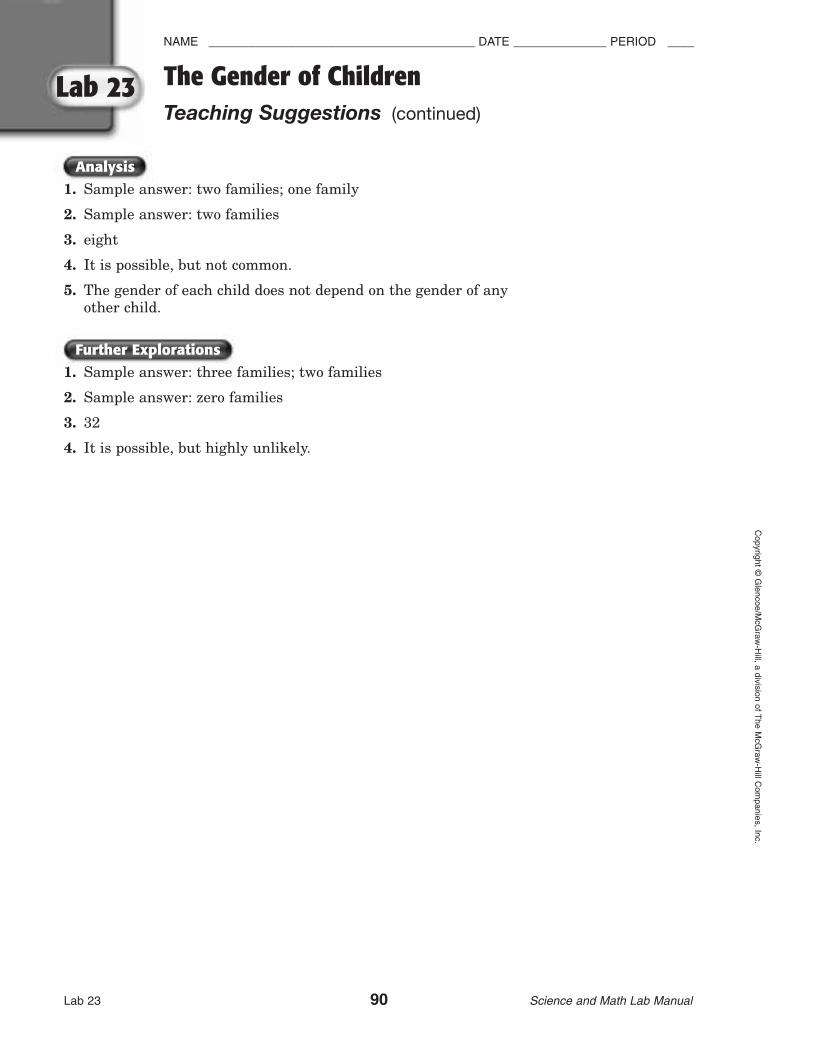
Further Explorations
Lab 23 90 Science and Math Lab Manual
NAME ________________________________________ DATE ______________ PERIOD ____C
opyright ©G
lencoe/McG
raw-H
ill, a division of The M
cGraw
-Hill C
ompanies, Inc.
Lab 23 The Gender of ChildrenTeaching Suggestions (continued)
1. Sample answer: two families; one family
2. Sample answer: two families
3. eight
4. It is possible, but not common.
5. The gender of each child does not depend on the gender of anyother child.
1. Sample answer: three families; two families
2. Sample answer: zero families
3. 32
4. It is possible, but highly unlikely.
Analysis
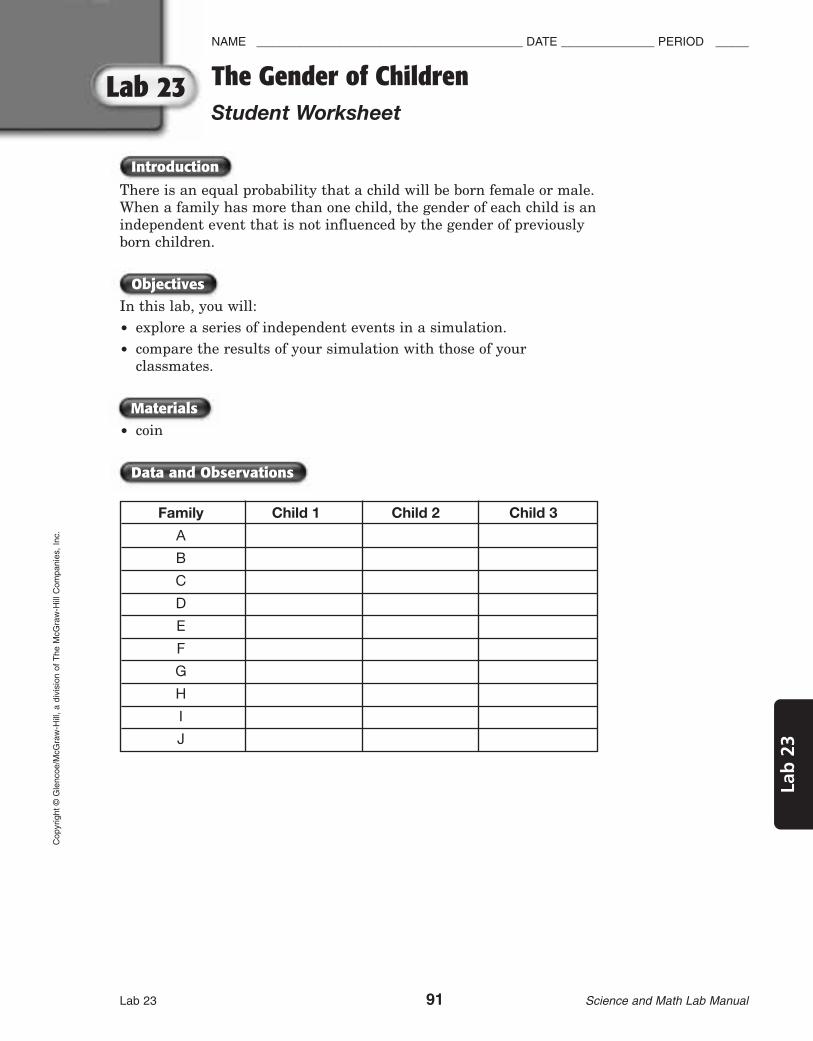
Introduction
Lab 23 91 Science and Math Lab Manual
NAME ________________________________________ DATE ______________ PERIOD _____
The Gender of ChildrenStudent Worksheet
Lab
23
Cop
yrig
ht ©
Gle
ncoe
/McG
raw
-Hill
, a
divi
sion
of T
he M
cGra
w-H
ill C
ompa
nies
, In
c.
Lab 23
Data and Observations
Materials
Objectives
Family Child 1 Child 2 Child 3
A
B
C
D
E
F
G
H
I
J
There is an equal probability that a child will be born female or male.When a family has more than one child, the gender of each child is anindependent event that is not influenced by the gender of previouslyborn children.
In this lab, you will:
• explore a series of independent events in a simulation.
• compare the results of your simulation with those of your classmates.
• coin
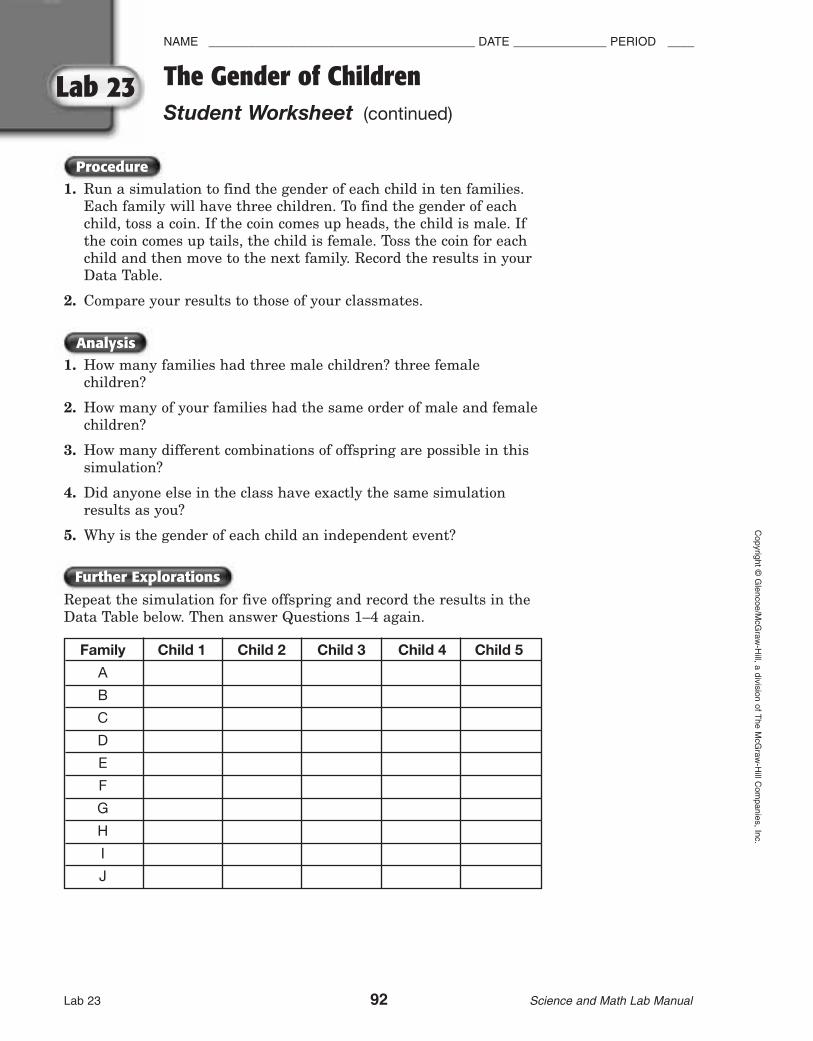
Lab 23 92 Science and Math Lab Manual
NAME ________________________________________ DATE ______________ PERIOD ____C
opyright ©G
lencoe/McG
raw-H
ill, a division of The M
cGraw
-Hill C
ompanies, Inc.
Lab 23 The Gender of ChildrenStudent Worksheet (continued)
Analysis
Family Child 1 Child 2 Child 3 Child 4 Child 5
A
B
C
D
E
F
G
H
I
J
Procedure
Further Explorations
1. Run a simulation to find the gender of each child in ten families.Each family will have three children. To find the gender of eachchild, toss a coin. If the coin comes up heads, the child is male. Ifthe coin comes up tails, the child is female. Toss the coin for eachchild and then move to the next family. Record the results in yourData Table.
2. Compare your results to those of your classmates.
1. How many families had three male children? three femalechildren?
2. How many of your families had the same order of male and femalechildren?
3. How many different combinations of offspring are possible in thissimulation?
4. Did anyone else in the class have exactly the same simulationresults as you?
5. Why is the gender of each child an independent event?
Repeat the simulation for five offspring and record the results in theData Table below. Then answer Questions 1–4 again.

Lab 24 93 Science and Math Lab Manual
NAME ________________________________________ DATE ______________ PERIOD _____
Electrical ChargesTeaching Suggestions
Lab
24
Cop
yrig
ht ©
Gle
ncoe
/McG
raw
-Hill
, a
divi
sion
of T
he M
cGra
w-H
ill C
ompa
nies
, In
c.
Lab 24
Objectives
Data and Observations
Materials
Teaching the Lab
Preparations
Recommended Time
• Use friction to produce electrical charges.• Demonstrate that opposite electrical charges attract while similar
electrical charges repel.
30 minutes
• 2 balloons• glass stirring rod• silk scarf• string (70 cm long)• running water
Have students bring in balloons, string, and silk scarves. Glass rodsmight be borrowed from your school’s science department. If a sink isnot available, you can have students pour water from a gallon jug intoanother container.
• Have students work in groups of 3 or 4. Each member should takeon a task such as recorder or experiment participant.
• Summarize what students are going to be doing in the lab so theywill be better prepared to use the time wisely.
• In writing their observations, encourage studentsto include drawings of what is happening.
Part AThe balloons repel each other when hanging free.
The scarf and the balloon attract each otherenabling the balloon to be raised from thefloor for a short distance.
balloonrepel
balloon
scarf
balloon
floor

Lab 24 94 Science and Math Lab Manual
NAME ________________________________________ DATE ______________ PERIOD ____C
opyright ©G
lencoe/McG
raw-H
ill, a division of The M
cGraw
-Hill C
ompanies, Inc.
Lab 24 Electrical ChargesTeaching Suggestions (continued)
Further Explorations
Analysis
Part BThe stream of water will appear to bend toward theglass rod, indicating attraction.
Sample answers are given.
1. negative
2. positive
3. They have similar charges.
4. The balloon has a positive charge and the scarfhas a negative charge. Opposite charges attractmaking the balloon stick to the scarf as the scarfis lifted.
5. positive
6. The stream appeared to bend toward the glass. The normal causeof the bending of the water is the attraction between charged anduncharged objects. Stuents should observe the same results witha negatively charged object.
There are examples of positive and negative charges easily found athome. Ask students if they have ever walked across a wool carpet in avery dry room and touched a metal surface or another person. Whathappens? You sometimes see “sparks.” What are the sparks? Sparks arestatic electricity, which is the exchange of ions from onesource to another. It might be described as small scalelightning.
bends toward glass
water
rod

Lab 24 95 Science and Math Lab Manual
NAME ________________________________________ DATE ______________ PERIOD _____
Electrical ChargesStudent Worksheet
Lab
24
Cop
yrig
ht ©
Gle
ncoe
/McG
raw
-Hill
, a
divi
sion
of T
he M
cGra
w-H
ill C
ompa
nies
, In
c.
Lab 24
Introduction
Data and Observations
Procedure
Materials
Objectives
In 1733, a French investigator, DuFay, found that all substances withelectrical charges behave either like glass, which DuFay called positive, orlike hard rubber, which DuFay called negative. Rubbing glass and rubberwith silk or wool causes the glass to lose electrons and rubber to gainelectrons. Bodies with the same charge repel one another, and bodies withopposite charges attract one another. Friction causes the substancesrubbed together to gain opposite electrical charges. So, silk or wool maybe positive if used to rub hard rubber or negative if used to rub glass.
• Use friction to produce electrical charges.• Demonstrate that opposite electrical charges attract while similar
electrical charges repel.
• 2 balloons • silk scarf • running water• glass stirring rod • string (70 cm long)
Part A
1. Blow up the balloons and tie a balloon to each end of the string.
2. Rub each balloon with the scarf. Hold the string in the center andlet the balloons hang free. Record your observations.
3. Cut the string close to one balloon. Rub that balloon with the scarfagain and place it on the floor.
4. Let the scarf touch the balloon. Lift the balloon as high as possible.Record your observations.
Part B
5. Turn the water on in the sink to run in a gentle stream.
6. Rub the stirring rod with the scarf. Bring the glass close to thestream of water. Record your observations.
Part AWhat happens when the balloons hang free?
SKETCH:

Lab 24 96 Science and Math Lab Manual
NAME ________________________________________ DATE ______________ PERIOD ____C
opyright ©G
lencoe/McG
raw-H
ill, a division of The M
cGraw
-Hill C
ompanies, Inc.
Lab 24 Title of LabStudent Worksheet (continued)
Analysis
What happens with the balloon on the floor?
Part BWhat happens with the running water and the glassrod?
7. If the scarf gains electrons from the balloons, what kind of electri-cal charge does the scarf have?
8. What kind of electrical charge do the balloons have?
9. Why do the balloons repel each other?
10. Why can you pick up the balloon with the scarf?
11. What electrical change did the glass rod have after it was rubbedwith the scarf?
12. What happened to the stream of water when the glass rod wasbrought close to it? Explain.
SKETCH:
SKETCH:

Lab 25 97 Science and Math Lab Manual
NAME ________________________________________ DATE ______________ PERIOD _____
Plant GrowthTeaching Suggestions
Lab
25
Cop
yrig
ht ©
Gle
ncoe
/McG
raw
-Hill
, a
divi
sion
of T
he M
cGra
w-H
ill C
ompa
nies
, In
c.
Lab 25
Analysis
Data and Observations
Teaching the Lab
Preparations
Materials
Recommended Time
Objectives
• Build a growth chamber for bean seeds.• Measure and record the height of your plants.• Prepare a bar graph of your results.
30 minutes first day, 5 minutes for next 10 days
• corrugated cardboard • paper towels • 5 pinto bean seeds per• graph paper • zipper plastic bag person/group• labels • scissors • stapler• metric ruler
Pinto bean seeds should be soaked overnight. Some plastic bags canbewritten on, eliminating the need for labels.
• Have students work in groups of 2 or 3. After the first day, haveteam members share the responsibility of taking measurements.
• Make sure students understand how to find the average of a set of data.
• In recording the growth, make sure that students record the actualheight day by day and not the increase in height per day.
Data in the table will vary depending on temperature, moisture, andamount of sunlight.
You may wish to have teams exchange data and graphs. Then haveteams evaluate the accuracy of the averages and graphed data.
13. roots
14. More growth usually occurs during Days 1–5.
15. usually Day 2
16. Answers will vary. Plants usually do not grow at the same dailyrate because of various stages of the growth process and environ-ment factors that change from day to day.

Lab 25 98 Science and Math Lab Manual
NAME ________________________________________ DATE ______________ PERIOD ____C
opyright ©G
lencoe/McG
raw-H
ill, a division of The M
cGraw
-Hill C
ompanies, Inc.
Lab 25 Plant GrowthStudent Worksheet
Introduction
Objectives
Procedure
Materials
Figure 1 Figure 2 Figure 3 Figure 4
24 cm
Fold line
10 cm Paper towel
Staples
Cardboard
Paper towel10 cm � 2 cm Staples
Have you ever attempted to measure your change in height from oneday to the next? Difficult or almost impossible, isn’t it? Plants are idealfor measuring growth changes because a single day may result in 1 or 2centimeters of change in height.
• Build a growth chamber for bean seeds.• Measure and record the height of your plants.• Prepare a bar graph of your results.
• corrugated cardboard • paper towels • 5 pinto bean seeds • graph paper • gallon-size zipper (soaked overnight)• labels plastic bag • stapler• metric ruler • scissors
Building a Growth Chamber1. Cut a piece of cardboard that is 10 cm wide and 24 cm long. Fold the
cardboard in half. (See Figure 1.)
2. Staple a paper towel to one side of the folded cardboard.(See Figure 2.)
3. Cut a piece of paper towel that is 10 cm long and 4 cm wide. Fold it inhalf lengthwise and punch 6 small holes near the fold with the point ofthe scissors. Use care when using the point of the scissors! (See Figure 3.)
4. Staple the paper towel strip onto the paper towel already attached to thecardboard near the top. (See Figure 4.)
5. Print your name and today’s date on a label and attach it to theplastic bag.
6. Stand the folded cardboard inside the plastic bag.

Lab 25 99 Science and Math Lab Manual
NAME ________________________________________ DATE ______________ PERIOD _____
Plant GrowthStudent Worksheet (continued)
Lab
25
Cop
yrig
ht ©
Gle
ncoe
/McG
raw
-Hill
, a
divi
sion
of T
he M
cGra
w-H
ill C
ompa
nies
, In
c.
Lab 25
Recording Plant Growth
7. Place 5 pinto bean seeds into the folded strip of paper towel.
8. Add water to the bottom of the plastic bag and close it. Place the growthchamber near a window.
9. Examine the seeds each day for 10 days. Open the plastic bag and addwater as needed.
10. Measure the height of each stem that appears. Record the height incentimeters in Table 1.
11. Total the heights of all 5 plants each day and determine the averagestem height. Record this in the last line of Table 1.
12. Use the grid below to prepare a bar graph that will show the averagestem height each day (along the y-axis) for 10 days (time along thex-axis).
1 2 3 4 5 6 7 8 9 10
Ave
rage
Ste
m H
eigh
t
Day
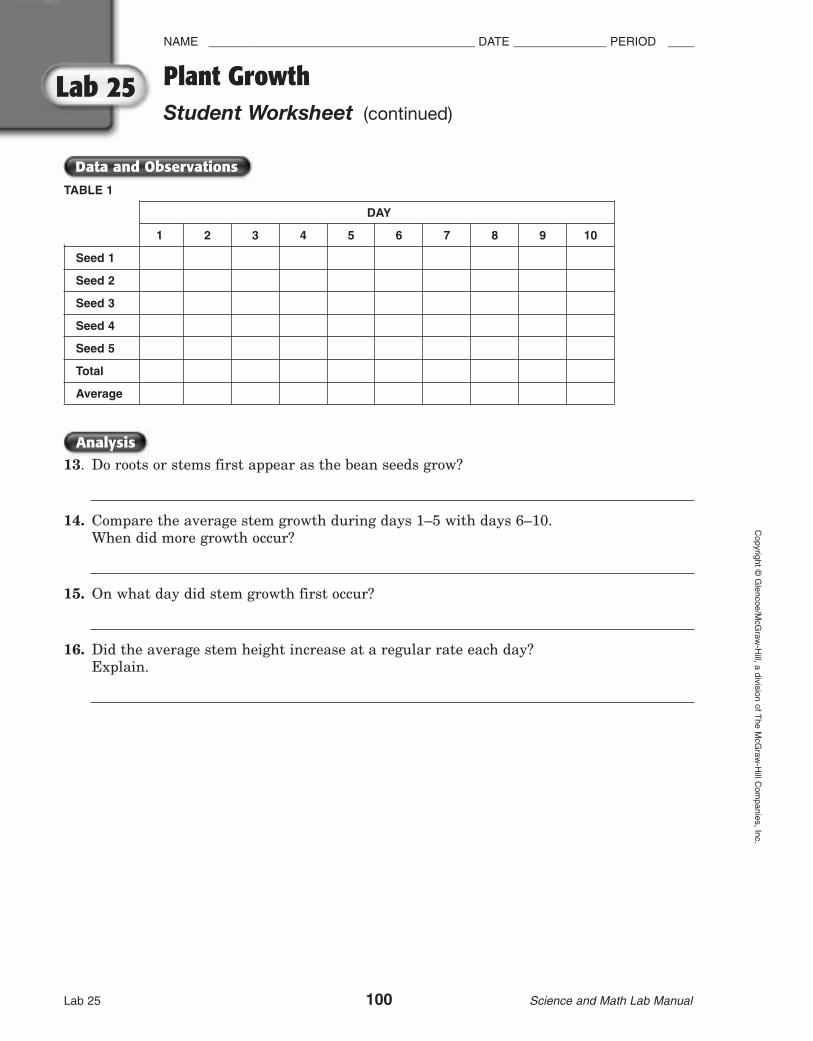
Data and Observations
NAME ________________________________________ DATE ______________ PERIOD ____
Lab 25 100 Science and Math Lab Manual
Copyright ©
Glencoe/M
cGraw
-Hill, a division of T
he McG
raw-H
ill Com
panies, Inc.
Lab 25 Plant GrowthStudent Worksheet (continued)
Analysis
TABLE 1
DAY
1 2 3 4 5 6 7 8 9 10
Seed 1
Seed 2
Seed 3
Seed 4
Seed 5
Total
Average
13. Do roots or stems first appear as the bean seeds grow?
14. Compare the average stem growth during days 1–5 with days 6–10.When did more growth occur?
15. On what day did stem growth first occur?
16. Did the average stem height increase at a regular rate each day?Explain.

Data and Observations
Lab 26 101 Science and Math Lab Manual
NAME ________________________________________ DATE ______________ PERIOD _____
Classification by TraitTeaching Suggestions
Lab
26
Cop
yrig
ht ©
Gle
ncoe
/McG
raw
-Hill
, a
divi
sion
of T
he M
cGra
w-H
ill C
ompa
nies
, In
c.
Lab 26
Objectives
Materials
Teaching the Lab
Preparations
Recommended Time
• Classify geometric shapes.• Use the words kingdom, phylum, and class in your classification system.• Determine the characteristics you are using to create you
classification categories.
30-40 minutes
• shape worksheet• 2 sheets of paper• scissors
To save time, have students cut out the shapes as homework beforedoing this activity. This would eliminate the need for sets of scissors.
• Before beginning this lab, engage students in a discussion of somecommon classification techniques with nonscientific terms. Example:dogs can be divided into different types. Two types might beLabradors and collies. Labradors can include black, chocolate, andyellow. Collies have numerous breeds as divisions of the collie line.
• Have students work in pairs. • Encourage students to look at the shapes and study their
characteristics before beginning the activity. Some patterns in theshapes may become apparent to students immediately.
Kingdom 1
Phylum Phylum Phylum
6, 9 1110 3, 4, 7
Phylum Phylum
1, 8, 13 5, 12 2
Kingdom 2
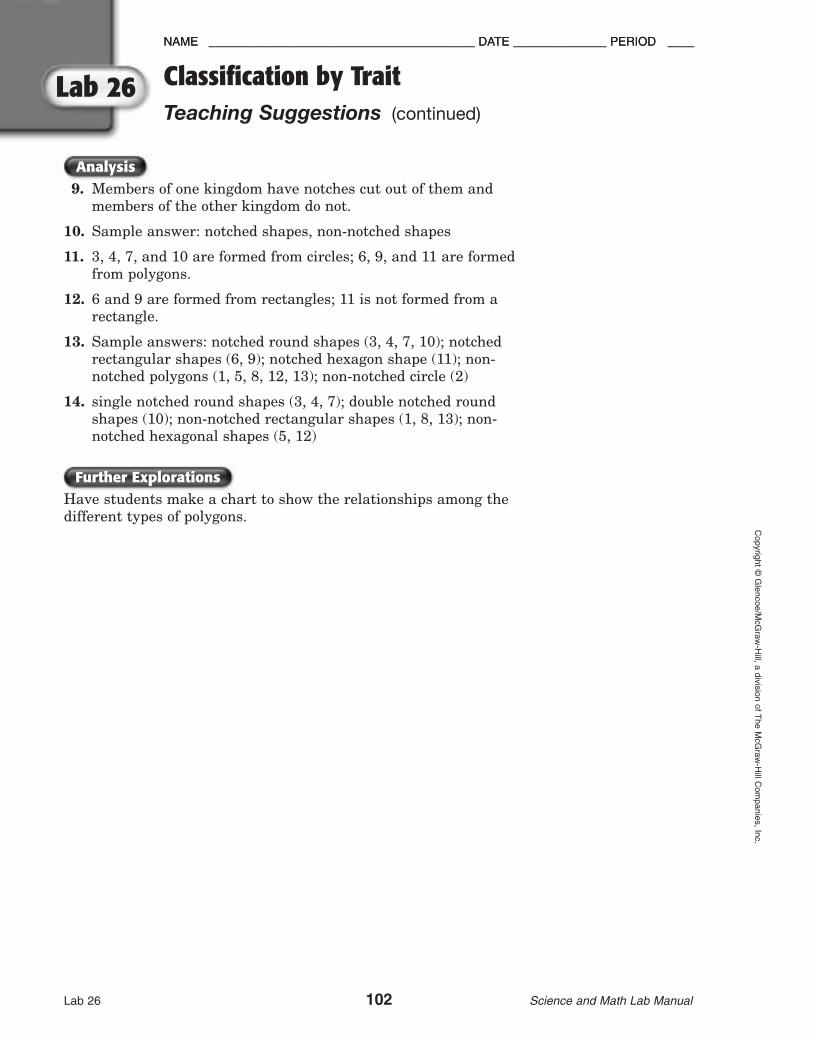
Lab 26 102 Science and Math Lab Manual
NAME ________________________________________ DATE ______________ PERIOD ____C
opyright ©G
lencoe/McG
raw-H
ill, a division of The M
cGraw
-Hill C
ompanies, Inc.
Lab 26 Classification by Trait Teaching Suggestions (continued)
NAME ________________________________________ DATE ______________ PERIOD ____
Analysis
Further Explorations
9. Members of one kingdom have notches cut out of them andmembers of the other kingdom do not.
10. Sample answer: notched shapes, non-notched shapes
11. 3, 4, 7, and 10 are formed from circles; 6, 9, and 11 are formedfrom polygons.
12. 6 and 9 are formed from rectangles; 11 is not formed from arectangle.
13. Sample answers: notched round shapes (3, 4, 7, 10); notchedrectangular shapes (6, 9); notched hexagon shape (11); non-notched polygons (1, 5, 8, 12, 13); non-notched circle (2)
14. single notched round shapes (3, 4, 7); double notched roundshapes (10); non-notched rectangular shapes (1, 8, 13); non-notched hexagonal shapes (5, 12)
Have students make a chart to show the relationships among thedifferent types of polygons.

Lab 26 103 Science and Math Lab Manual
NAME ________________________________________ DATE ______________ PERIOD _____
Classification by Trait Student Worksheet
Lab
26
Cop
yrig
ht ©
Gle
ncoe
/McG
raw
-Hill
, a
divi
sion
of T
he M
cGra
w-H
ill C
ompa
nies
, In
c.
Lab 26
Introduction
Procedure
Materials
Objectives
If you were asked to classify objects, you would probably group thingstogethe r that have some common characteristics. Scientists havedeveloped a system of classification for living things based on thatsame principle. Within each larger group, there are subgroups thathave even more characteristics in common. Each group and subgrouphave been given a name to help simplify the scientists’ work.
• Classify geometric shapes.• Use the words kingdom, phylum, and class in your classification
system.• Determine the characteristics you are using to create your
classification categories.
• shape worksheet• 2 sheets of paper• scissors
Sorting by Kingdom
1. Cut out the 13 shapes shown on the shape worksheet.2. Let each piece of paper represent a kingdom. Study the figures and
determine what characteristic(s) you could use to separate the 13figures into two kingdoms. Record those characteristics.
3. Place each figure onto its proper kingdom according to yourcharacteristic(s). Record which figures you have in each of yourkingdoms. Let the kingdom with shape 3 be Kingdom 1.
Sorting by Phylum
4. Study the kingdom that contains shape 3. Determine whatcharacteristic(s) you could use to separate the pieces of thiskingdom into 3 subgroups called phyla (plural of phylum). Recordthose characteristics.
5. Record which figures you place in each phylum.6. Repeat steps 4 and 5 to separate the second kingdom into 2 phyla.
Sorting by Class
7. Study each of your phyla. Determine if any of them can besubdivided into two or more classes.
8. If a phylum can be subdivided into classes, use letters of thealphabet, beginning with A, to categorize each shape in thatphylum into a class. Record your classes.

Lab 26 104 Science and Math Lab Manual
NAME ________________________________________ DATE ______________ PERIOD ____C
opyright ©G
lencoe/McG
raw-H
ill, a division of The M
cGraw
-Hill C
ompanies, Inc.
Lab 26 Classification by Trait Student Worksheet (continued)
Shape Worksheet Cut out each figure. Handle scissors with care.
1
2 3
4 5 6
7 8 9
1011 12
13

Sorting by kingdomFigures in Kingdom 1:
Figures in Kingdom 2:
Sorting by phylumKingdom 1
Phylum 1 Phylum 2 Phylum 3
characteristic(s): characteristic(s): characteristic(s):
shapes: shapes: shapes:
Kingdom 2
Phylum 1 Phylum 2
characteristic(s): characteristic(s):
figures: figures:
Sorting by class
Phylum 1
Kingdom 1 Phylum 2
Phylum 3
Phylum 1
Kingdom 2
Phylum 2
Lab 26 105 Science and Math Lab Manual
NAME ________________________________________ DATE ______________ PERIOD _____
Classification by Trait Student Worksheet (continued)
Lab
26
Cop
yrig
ht ©
Gle
ncoe
/McG
raw
-Hill
, a
divi
sion
of T
he M
cGra
w-H
ill C
ompa
nies
, In
c.
Lab 26
Data and Observations
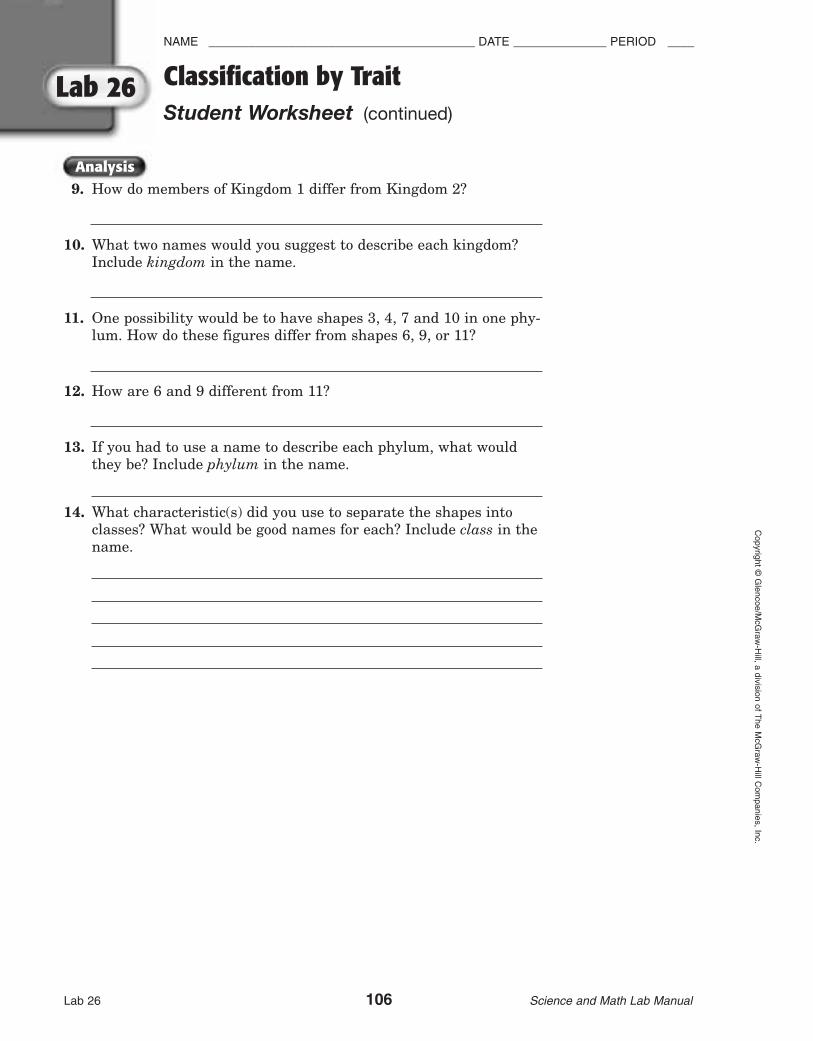
Lab 26 106 Science and Math Lab Manual
NAME ________________________________________ DATE ______________ PERIOD ____C
opyright ©G
lencoe/McG
raw-H
ill, a division of The M
cGraw
-Hill C
ompanies, Inc.
Lab 26 Classification by Trait Student Worksheet (continued)
Analysis9. How do members of Kingdom 1 differ from Kingdom 2?
10. What two names would you suggest to describe each kingdom?Include kingdom in the name.
11. One possibility would be to have shapes 3, 4, 7 and 10 in one phy-lum. How do these figures differ from shapes 6, 9, or 11?
12. How are 6 and 9 different from 11?
13. If you had to use a name to describe each phylum, what wouldthey be? Include phylum in the name.
14. What characteristic(s) did you use to separate the shapes intoclasses? What would be good names for each? Include class in thename.

NAME ________________________________________ DATE ______________ PERIOD _____
Lab
27
Cop
yrig
ht ©
Gle
ncoe
/McG
raw
-Hill
, a
divi
sion
of T
he M
cGra
w-H
ill C
ompa
nies
, In
c.
Objectives
Analysis
Data and Observations
Teaching the Lab
Preparations
Materials
Recommended Time
Lab 27 107 Science and Math Lab Manual
Lab 27 Predicting EarthquakesTeaching Suggestions
• Make a seismic-risk map of the United States.• Study the occurrence of earthquakes in the United States.• Determine which areas are earthquake-prone.
30 minutes
• outline map of United States (See p. 110.)• colored pencils or markers
Have students bring colored pencils or markers.
• This activity can be done individually or in small groups. • Suggest that each member of the group color his/her own map, but the
discussion in the Analysis section be done as a consensus of the group.• Ask students to determine what they think is a damaging
earthquake. Would a damaging earthquake in California be ofdifferent strength than a damaging earthquake in Ohio? Yes,because building codes in California require quakeproofconstruction, whereas those in Ohio would not.
See students’ maps.
5. Alaska, California, Hawaii, Illinois, Missouri, Montana, Nevada,Utah, Washington; all have had 9 or more damaging earthquakes.
6. west of the Rocky Mountains; from California to Alaska
7. There are active faults in the underlying rock layers.
8. While the probability of an earthquake occurring in certain areasis low, every state has had at least one earthquake. It just mightnot be a damaging one.
9. Scientists can use mappings of earthquake occurrences andseverity to predict where another earthquake may be more likelyand how severe it might be. However, they cannot predict theexact occurrence of such a quake.
10. The population of Alaska is concentrated in relatively fewlocations in comparison to the landmass of the entire state. Whilesevere earthquakes may occur, they frequently don’t occur inpopulated areas. Thus, no structural damage is recorded.

Copyright ©
Glencoe/M
cGraw
-Hill, a division of T
he McG
raw-H
ill Com
panies, Inc.
Lab xx
Introduction
Analysis
Data and Observations
Procedure
Materials
Objectives
Lab 27 108 Science and Math Lab Manual
Predicting EarthquakesStudent Worksheet
Lab 27
There are certain areas of the United States that are earthquake-prone.The risk of disturbances in these areas is great because they lie overactive geologic faults, or moving cracks in Earth’s crust. While Californiahas the most frequently reported earthquakes, every state in the UnitedStates has had at least one earthquake. Seismologists believe that theoccurrence of one earthquake indicates another may be possible.
• Make a seismic-risk map of the United States.• Study the occurrence of earthquakes in the United States• Determine which areas are earthquake-prone.
• outline map of United States (See page 110.)• colored pencils or markers
1. Choose a color to represent each of the risk zones in the legend of the U.S. map. Color the legend accordingly.
2. Write how many earthquakes and high intensity earthquakes on the map for each state. Enclose the number of high intensityearthquakes in parentheses.
3. Study the data in Table 1. From that information determine yourown guidelines for what number of earthquakes qualifies as zone0, 1, 2, or 3. Record your definitions.
4. Use your color legend to color the map according to the guidelinesyou defined in step 3.
(See page 109.)
5. In what 10 states have damaging earthquakes occurred the most? Explain your choices.
6. In what section of the United States have damaging earthquakes been concentrated?
7. What does a concentration of damaging earthquakes indicate about the underlying rock structure of the area?
NAME ________________________________________ DATE ______________ PERIOD ____

NAME ________________________________________ DATE ______________ PERIOD _____
Lab
27
Cop
yrig
ht ©
Gle
ncoe
/McG
raw
-Hill
, a
divi
sion
of T
he M
cGra
w-H
ill C
ompa
nies
, In
c.
Data and Observations
Lab 27 109 Science and Math Lab Manual
Lab 27 Predicting EarthquakesStudent Worksheet (continued)
8. Sam states that the chance of an earthquake occurring in hishometown is 0%. Is that a reasonable statement? Why?
9. How do you think scientists use seismic occurrence maps topredict the probability of future quakes?
10. Why do you think Alaska, which has more earthquakes than theother 49 states combined, has so few damaging quakes listed inthe table?
TABLE 1
Damaging Earthquakes Damaging EarthquakesState Recorded State Recorded
Alabama 2 Montana 10 (3 high intensity)
Alaska 12 (2 high intensity) Nebraska 3
Arizona 4 Nevada 12 (3 high intensity)
Arkansas 3 New Hampshire 0
California over 150 (8 high intensity) New Jersey 2 (1 high intensity)
Colorado 1 New Mexico 5
Connecticut 2 New York 5 (1 high intensity)
Delaware 0 North Carolina 2
Florida 1 North Dakota 0
Georgia 2 Ohio 6 (1 high intensity)
Hawaii 12 (2 high intensity) Oklahoma 2
Idaho 4 Oregon 1
Illinois 10 Pennsylvania 1
Indiana 3 Rhode Island 0
Iowa 0 South Carolina 6 (1 high intensity)
Kansas 2 South Dakota 1
Kentucky 5 Tennessee 7
Louisiana 1 Texas 3 (1 high intensity)
Maine 4 Utah 9 (2 high intensity)
Maryland 0 Vermont 0
Massachusetts 4 (1 high intensity) Virginia 5
Michigan 1 Washington 11 (2 high intensity)
Minnesota 0 West Virginia 1
Mississippi 1 Wisconsin 1
Missouri 9 (2 high intensity) Wyoming 3
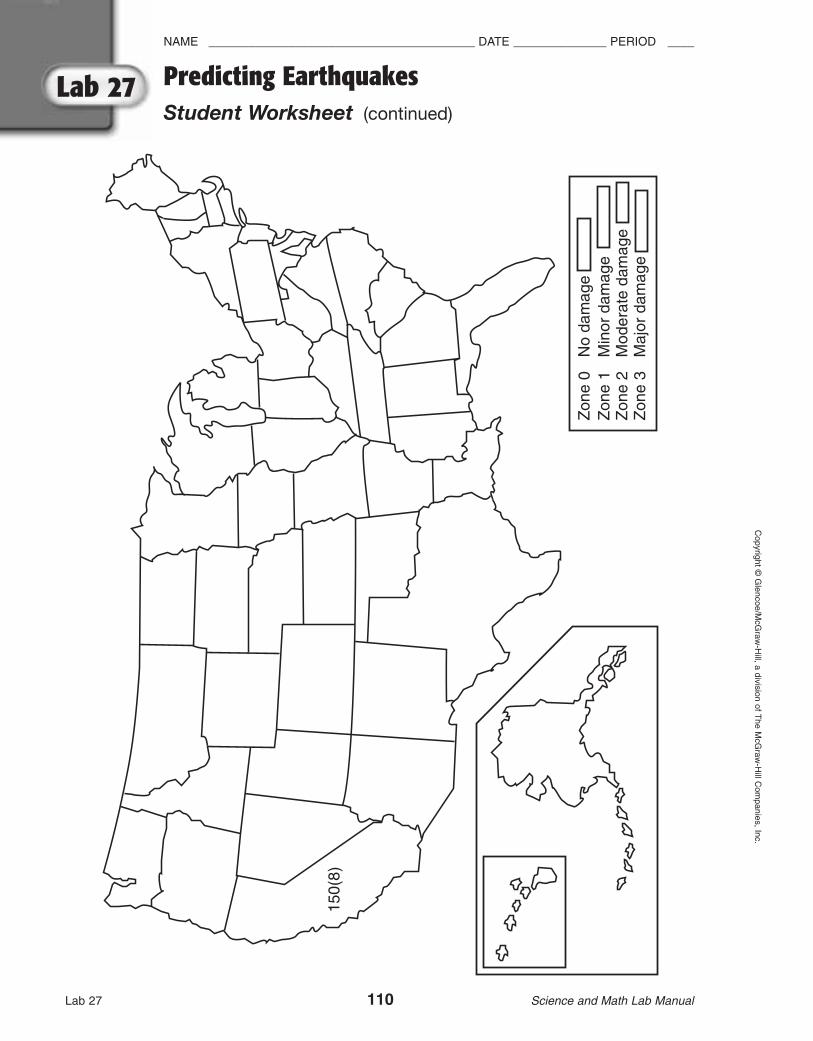
NAME ________________________________________ DATE ______________ PERIOD ____C
opyright ©G
lencoe/McG
raw-H
ill, a division of The M
cGraw
-Hill C
ompanies, Inc.
Lab xx
Lab 27 110 Science and Math Lab Manual
Predicting EarthquakesStudent Worksheet (continued)
Lab 27
Zon
e 0
No
dam
age
Zon
e 1
Min
or d
amag
eZ
one
2M
oder
ate
dam
age
Zon
e 3
Maj
or d
amag
e
150(
8)

Lab 28 111 Science and Math Lab Manual
NAME ________________________________________ DATE ______________ PERIOD _____
Caloric Content and Box-and-Whisker Plots Teaching Suggestions
Lab
28
Cop
yrig
ht ©
Gle
ncoe
/McG
raw
-Hill
, a
divi
sion
of T
he M
cGra
w-H
ill C
ompa
nies
, In
c.
Lab 28
Objectives
Data and Observations
Teaching the Lab
Recommended Time
• Calculate the number of Calories and grams of carbohydrates, fats,and proteins for two meals.
• Compare the nutritional value for each meal by plotting data onbox-and-whisker plots.
1 class period
• Have students work in pairs. Each student should participate incalculating the Calories for each food item and plotting the data.
• If you don’t have enough food tables, students can share copies.• You may want to review the difference between a food Calorie and
a scientific calorie. A food Calorie is actually a kilocalorie and isthus spelled with a capital C.
• Students can use calculators to speed up calculations.• If necessary, you may want to review how to use the food table and
calculate the Caloric values.
TABLE 2
Calories and Nutrients of Two Sample Meals
Food Serving size Calories Carbohydrates Fats Proteins (grams) (grams) (grams)
Meal 1
Spaghetti w/meat sauce 1 serving 396 39.4 20.7 12.7
Green beans 1 cup 31 6.8 .2 2.0
Garlic bread 2 slices 116 21.8 1.2 3.6
Butter 1 Tbsp 100 trace 11.4 trace
Gelatin 1 cup 163.5 39.6 trace 3.3
Total 806.5 107.6 33.5 21.6
Meal 2
Hamburger bun 1 89 15.9 1.7 2.5
Ground beef �14
� lb 224 0 14.5 21.8
Cheese (American) 1 oz 107 .5 8.4 6.5
Catsup 2 Tbsp 36 8.6 .2 .6
French fries 24 528 80.88 20.16 8.64
Cola-type beverage 10 oz 97.5 25.5 0 0
Total 1081.5 131.38 44.96 40.04
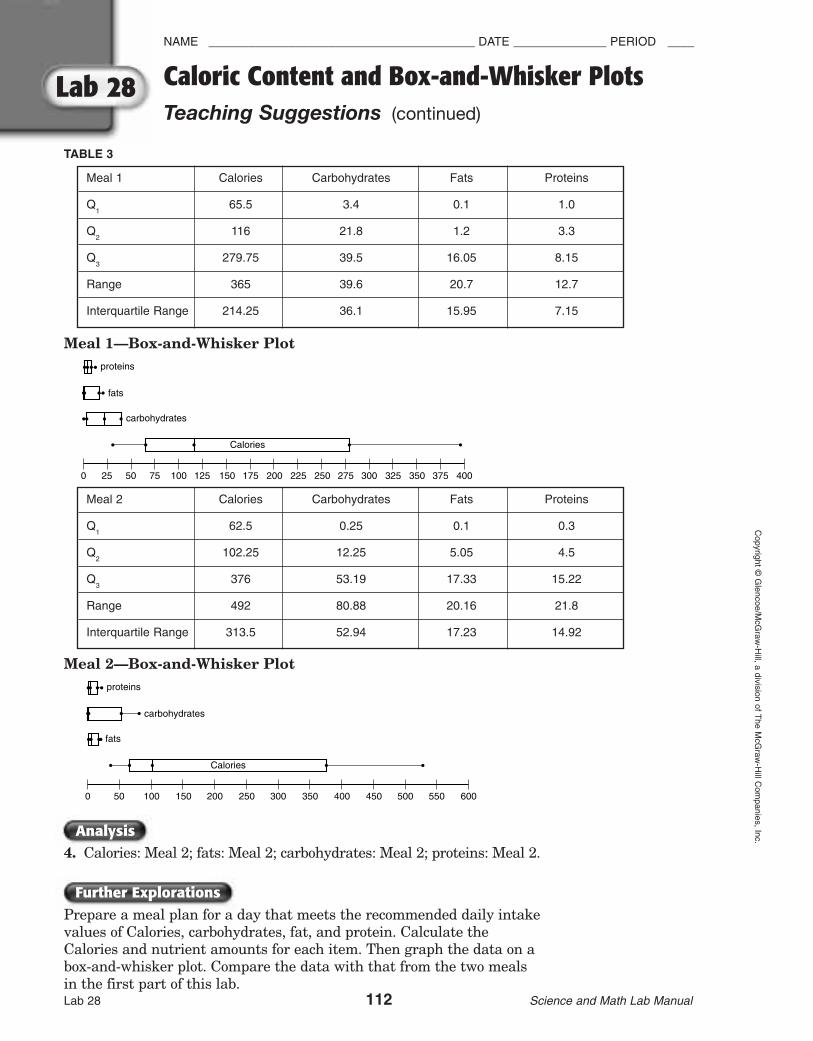
Lab 28 112 Science and Math Lab Manual
NAME ________________________________________ DATE ______________ PERIOD ____C
opyright ©G
lencoe/McG
raw-H
ill, a division of The M
cGraw
-Hill C
ompanies, Inc.
Lab 28 Caloric Content and Box-and-Whisker Plots Teaching Suggestions (continued)
Further Explorations
Analysis
Meal 1 Calories Carbohydrates Fats Proteins
Q1
65.5 3.4 0.1 1.0
Q2
116 21.8 1.2 3.3
Q3
279.75 39.5 16.05 8.15
Range 365 39.6 20.7 12.7
Interquartile Range 214.25 36.1 15.95 7.15
Meal 2 Calories Carbohydrates Fats Proteins
Q1
62.5 0.25 0.1 0.3
Q2
102.25 12.25 5.05 4.5
Q3
376 53.19 17.33 15.22
Range 492 80.88 20.16 21.8
Interquartile Range 313.5 52.94 17.23 14.92
0 25 50 75 100 125 150 175
Calories
carbohydrates
fats
proteins
200 225 250 275 300 325 350 375 400
0 50 100 150 200 250 300 350 400 450 500
Calories
fats
carbohydrates
proteins
600550
TABLE 3
Meal 1—Box-and-Whisker Plot
Meal 2—Box-and-Whisker Plot
4. Calories: Meal 2; fats: Meal 2; carbohydrates: Meal 2; proteins: Meal 2.
Prepare a meal plan for a day that meets the recommended daily intakevalues of Calories, carbohydrates, fat, and protein. Calculate theCalories and nutrient amounts for each item. Then graph the data on abox-and-whisker plot. Compare the data with that from the two mealsin the first part of this lab.

Lab 28 113 Science and Math Lab Manual
NAME ________________________________________ DATE ______________ PERIOD _____
Caloric Content and Box-and-Whisker PlotsStudent Worksheet
Lab
28
Cop
yrig
ht ©
Gle
ncoe
/McG
raw
-Hill
, a
divi
sion
of T
he M
cGra
w-H
ill C
ompa
nies
, In
c.
Lab 28
Introduction
Procedure
Objectives
How do the foods you eat compare in nutrients such as carbohydrates,protein, and fat? By using a food table, you can calculate the nutritionin your daily meals.
Nutrients supply your body with raw materials for the manufacturingof new tissues and energy for daily functions. The energy stored infood is measured in Calories. One way to compare the amounts ofnutrients in your meals is by using box-and-whisker plots.
• Calculate the number of Calories and grams of carbohydrates, fats,and proteins for two meals.
• Compare the nutritional value for each meal by plotting data onbox-and-whisker plots.
1. Table 2 presents two separate lunch plans. Use Table 1 todetermine the number of Calories in each food item listed. If Table1 and Table 2 list different serving sizes, you will have to calculatethe correct number of Calories for the serving in your meal plan.
2. Record your information, including the totals, in Table 2.
3. Compare the caloric and nutritional values of each meal using a box-and-whisker plot. Calculate Q1, Q2, Q3, the range, and theinterquartile range for each of the graphs. Record the data inTable 3. Make two plots, one for each meal, for each of thefollowing: Calories, carbohydrates, fats, and proteins. If you havenutrient amounts listed as “Trace,” substitute zero for the amountwhen making plots. Draw your plots on a separate sheet of paper.

Lab 28 114 Science and Math Lab Manual
NAME ________________________________________ DATE ______________ PERIOD ____C
opyright ©G
lencoe/McG
raw-H
ill, a division of The M
cGraw
-Hill C
ompanies, Inc.
Lab 28 Caloric Content and Box-and-Whisker Plots Student Worksheet (continued)
Food Values of Common Serving Sizes
Food Serving size Calories Carbohydrates Fats Proteins (grams) (grams) (grams)
Cola beverage 1 glass 8 oz 78 20.4 -- --
Toasted French bread 1 slice 58 10.9 .6 1.8
Spaghetti with 1 serving 396 39.4 20.7 12.7meat sauce
Hamburger roll 1 89 15.9 1.7 2.5
Butter, dairy Tbsp 50 trace 5.7 trace
Cheese, American 1 oz 107 .5 8.4 6.5
Cooked green beans 1 cup 31 6.8 .2 2.0
Gelatin, Lemon cup 109 26.4 trace 2.2
Ground beef lb 224 0 14.5 21.8
French fries 10 220 33.7 8.4 3.6
Tomato catsup 1 Tbsp 18 4.3 .1 .3
12
23
14
TABLE 1

Lab 28 115 Science and Math Lab Manual
NAME ________________________________________ DATE ______________ PERIOD _____
Caloric Content and Box-and-Whisker Plots Student Worksheet (continued)
Lab
28
Cop
yrig
ht ©
Gle
ncoe
/McG
raw
-Hill
, a
divi
sion
of T
he M
cGra
w-H
ill C
ompa
nies
, In
c.
Lab 28
Data and ObservationsTABLE 2
Calories and Nutrients of Two Sample Meals
Food Serving size Calories Carbohydrates Fats Proteins (grams) (grams) (grams)
Meal 1
Spaghetti w/meat sauce 6 oz
Green beans 4 oz
Garlic bread 2 slices
Butter 1 Tbsp
Gelatin 4 oz
Total
Meal 2
Hamburger bun 1
Ground beef 4 oz
Cheese (American) 1 oz
Catsup 2 Tbsp
French fries 24
Cola-type beverage 10 oz
Total

Lab 28 116 Science and Math Lab Manual
NAME ________________________________________ DATE ______________ PERIOD ____C
opyright ©G
lencoe/McG
raw-H
ill, a division of The M
cGraw
-Hill C
ompanies, Inc.
Lab 28 Caloric Content and Box-and-Whisker Plots Student Worksheet (continued)
Analysis
TABLE 3
4. Which of the two meal samples in Table 2 is higher in:
Calories? fats? carbohydrates? proteins?
5. How does the data characterize the meals?
6. Look at each graph. Is the data concentrated over a narrow rangeof values or is the data more diverse?
7. Mark any outliers on the graph by circling the points. What dothey represent?
Meal 1 Calories Carbohydrates Fats Proteins
Q1
Q2
Q3
Range
Interquartile Range
Meal 2 Calories Carbohydrates Fats Proteins
Q1
Q2
Q3
Range
Interquartile Range

Lab 29 117 Science and Math Lab Manual
NAME ________________________________________ DATE ______________ PERIOD _____
Speed and AccelerationTeaching Suggestions
Lab
29
Cop
yrig
ht ©
Gle
ncoe
/McG
raw
-Hill
, a
divi
sion
of T
he M
cGra
w-H
ill C
ompa
nies
, In
c.
Lab 29
Objectives
Further Explorations
Analysis
Data and Observations
Materials
Teaching the Lab
Preparations
Recommended Time
• Determine the average speed of a small toy car.• Observe deceleration of the car.• Determine the conditions that affect or do not affect the speed of a
moving object.
30 minutes
• stack of books • meterstick• wood ramp (about 50 cm long) • pen or pencil• masking tape • toy car or ball• stopwatch or watch with a second hand
Have students bring in toy cars or balls. Stopwatches and metersticksmight be borrowed from your school’s science department.
• Have students work in groups of 3 or 4. Each member should takeon a task of recorder, timer, or distance observer.
• Have students find 20 cm on their metersticks to determine howhigh the stacks of books should be.
• Remind students that an average is the sum of the data divided bythe number of data.
See students’ work for answers.
Sample answers are given.
9. The car slowed (or decelerated).10. friction between the wheels of the car and the floor and the tape
on the floor11. The graph should indicate that the speed decreased with each
distance marker. No, if the car traveled at a constant speed, thegraph of speed versus distance would be a horizontal line.
12. Do the experiment on carpet or on an uphill grade.13. Increase the height of the books or do it on a floor that slopes
downward.
If you were designing an experiment, explain how you could get thetoy car to travel without accelerating or decelerating.

Lab 29 118 Science and Math Lab Manual
NAME ________________________________________ DATE ______________ PERIOD ____C
opyright ©G
lencoe/McG
raw-H
ill, a division of The M
cGraw
-Hill C
ompanies, Inc.
Lab 29 Speed and Acceleration Student Worksheet
Introduction
Procedure
Materials
Objectives
Speed is defined as the distance an object travels per unit time. Speedis often expressed in kilometers per hour (km/h) and meters persecond (m/s). The speed of a car is usually expressed in miles per hour(mph). In most cases, moving objects do not travel at a constantspeed. The speed of an object usually increases and decreases as theobject moves. Therefore, the average speed is used to describe motion.The formula for average speed is:
average speed ��to
ttoatladlitsitman
ece
�
Acceleration is the rate at which an object’s speed increases, anddeceleration is the rate at which an object’s speed decreases. Accelerationand deceleration are expressed as meters per second per second (m/s2).When a car is at constant speed, the acceleration and deceleration are zero.
• Determine the average speed of a small toy car.• Observe deceleration of the car.• Determine the conditions that affect or do not affect the speed of a
moving object.
• stack of books • meterstick• wood ramp (about 50 cm long) • pen or pencil• masking tape • toy car or ball• stopwatch or watch with a second hand
Find Average Speed
1. Clear a “runway,” preferably not carpeted that is about 6 meters long.
2. Set up a launching ramp using a stack of books (about 20 cm tall),the wood ramp.
3. Use masking tape to label where the ramp touches thefloor as 0 meters. Use the meterstick to make labels at1 meter, 2 meters, 3 meters, 4 meters, 5 meters, and6 meters from the end of the ramp.
4. Practice releasing the car down the ramp. Observe thecar’s motion and path. Add or remove books from theramp so that the car will travel at least 5 meters fromthe bottom of the ramp.
5. Measure the time the car takes to travel 5 meters. Record the time anddistance in Table 1. Calculate the average speed for each trial. Thencalculate the average of the speeds.
0 m
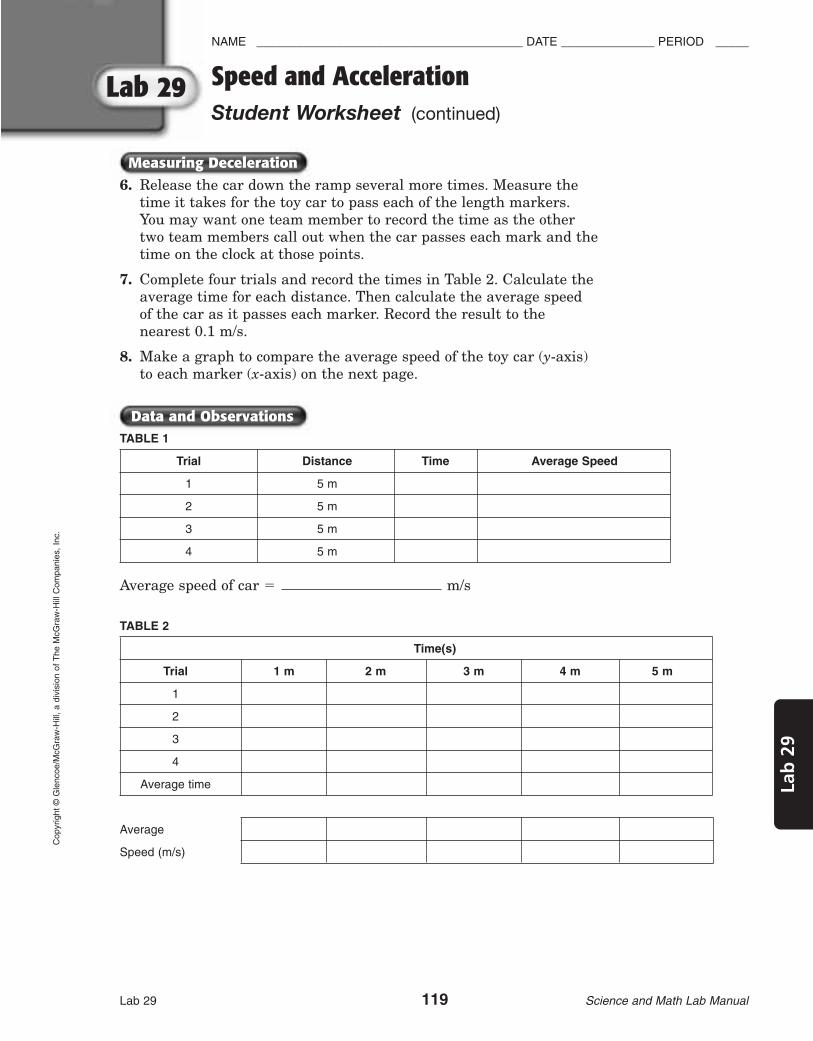
Lab 29 119 Science and Math Lab Manual
NAME ________________________________________ DATE ______________ PERIOD _____
Speed and Acceleration Student Worksheet (continued)
Lab
29
Cop
yrig
ht ©
Gle
ncoe
/McG
raw
-Hill
, a
divi
sion
of T
he M
cGra
w-H
ill C
ompa
nies
, In
c.
Lab 29
Measuring Deceleration
Data and Observations
6. Release the car down the ramp several more times. Measure thetime it takes for the toy car to pass each of the length markers.You may want one team member to record the time as the othertwo team members call out when the car passes each mark and thetime on the clock at those points.
7. Complete four trials and record the times in Table 2. Calculate theaverage time for each distance. Then calculate the average speedof the car as it passes each marker. Record the result to thenearest 0.1 m/s.
8. Make a graph to compare the average speed of the toy car (y-axis)to each marker (x-axis) on the next page.
TABLE 1
Trial Distance Time Average Speed
1 5 m
2 5 m
3 5 m
4 5 m
Average speed of car � m/s
TABLE 2
Time(s)
Trial 1 m 2 m 3 m 4 m 5 m
1
2
3
4
Average time
Average
Speed (m/s)

Lab 29 120 Science and Math Lab Manual
NAME ________________________________________ DATE ______________ PERIOD ____C
opyright ©G
lencoe/McG
raw-H
ill, a division of The M
cGraw
-Hill C
ompanies, Inc.
Lab 29 Speed and Acceleration Student Worksheet (continued)
Graph:
Analysis9. Describe the motion of the car as it moved across the floor.
10. What caused the car to slow down and stop?
11. What patterns do you observe in the graph of the data points?Did the toy car travel at a constant speed? How do you know this?
12. How could you change this experiment to make the toy cardecelerate at a faster rate?
13. How could you change this experiment to make the toy caraccelerate at a faster rate?
marker distance
aver
age
spee
d of
car

Lab 30 121 Science and Math Lab Manual
NAME ________________________________________ DATE ______________ PERIOD _____
Reflection of Light Teaching Suggestions
Lab
30
Cop
yrig
ht ©
Gle
ncoe
/McG
raw
-Hill
, a
divi
sion
of T
he M
cGra
w-H
ill C
ompa
nies
, In
c.
Lab 30
Objectives
Data and Observations
Teaching the Lab
Materials
Recommended Time
• Observe that light travels in straight lines.• Identify the angles of incidence and reflection of reflected light.• Find the complements of the angle of incidence and the angle of
reflection.• Describe the relationship between the angle of incidence and the
angle of reflection.
1 class period
• hardcover book (15) • pen or pencil (15)• comb (15) • protractor (15)• flashlight or projector (15) • plane mirror (15)• masking tape (15) • white paper, 45 sheets
• Have students work in groups of two.
Observation of light rays in step 2 of the procedure: The light formsstraight parallel lines behind the teeth of the comb.
Data Table Data depend on angles used.
Trial Angle of Supplement Complement
Angle of Supplement Complement
incidenceof the angle of the angle
reflectionof the angle of the angle
of incidence of incidence of reflection of reflection
A 30° 150° 60° 30° 150° 60°
B 41° 139° 49° 41° 139° 49°
C 60° 120° 30° 60° 120° 30°

Lab 30 122 Science and Math Lab Manual
NAME ________________________________________ DATE ______________ PERIOD ____C
opyright ©G
lencoe/McG
raw-H
ill, a division of The M
cGraw
-Hill C
ompanies, Inc.
Lab 30 Reflection of Light Teaching Suggestions (continued)
Analysis
Further Explorations
10. Because the bright areas behind the comb are straight and parallel, thelight rays passing between the teeth that form these areas must betraveling in straight and parallel lines.
11. The angle of reflection increased.
12. The angle of incidence equals the angle of reflection for any reflectedlight ray.
1. Design an experiment to investigate the reflection of light from a curvedmirror. Form a hypothesis relating the angles of incidence and reflectionof a light ray reflected from this type of mirror. Test your hypothesis.
2. Investigate the use of plane mirrors in periscopes. Build your ownperiscope.

Lab 30 123 Science and Math Lab Manual
NAME ________________________________________ DATE ______________ PERIOD _____
Reflection of LightStudent Worksheet
Lab
30
Cop
yrig
ht ©
Gle
ncoe
/McG
raw
-Hill
, a
divi
sion
of T
he M
cGra
w-H
ill C
ompa
nies
, In
c.
Lab 30
Introduction
Procedure
Materials
Objectives
Light travels in straight lines called rays. When a light ray strikes asmooth surface, such as polished metal or still water, it is reflected.The angle between the incoming ray and an imaginary perpendicularline that forms a right angle with the reflecting surface is called theangle of incidence. See Figure 1. The angle between the reflected rayand the imaginary perpendicular line is called the angleof reflection.
• Observe that light travels in straight lines.• Identify the angles of incidence and reflection of
reflected light.• Find the complements of the angle of incidence and
the angle of reflection.• Describe the relationship between the angle of
incidence and the angle of reflection.
• hardcover book • pen or pencil• comb • protractor• flashlight or projector • plane mirror• masking tape • white paper, 3 sheets
1. Use masking tape to attach one sheet of white paper to the cover ofthe book. Tape the comb to the edge of the book. The teeth of thecomb should extend above the edge of the book as shown in Figure 2.
2. Darken the room. Holding the flashlight as far from the book aspossible, shine the flashlight through the comb onto the paper. Support the flashlight on a table or stack of books. Observe therays of light on the paper. Record your observations in theData and Observations section.
3. Stand the plane mirror at a right angle to the surface of thebook cover. Position the mirror at a distance of about two thirdsof the width of the book away from the comb. Adjust the mirrorso that the light rays hit it at right angles. See Figure 3.
4. Rotate the mirror so that the light rays strike it at various angles ofincidence. As you turn the mirror, observe the reflected rays of light.
5. With the mirror turned so the incident rays strike it at an angle ofabout 30°, study a single incident ray. One partner should hold themirror while the other traces the path of the ray on the white sheet ofpaper. Be careful not to change the angle of the mirror while tracing theray. Label the incident ray I and the reflected ray R. Draw a line alongthe edgeof the back of the mirror. Label the sheet of paper Trial A.
Incidentlight ray
Reflectedlight ray
Angleof incidence
Angleof reflection
Teeth extend above edge of book.
Mirror
Figure 1
Figure 2
Figure 3

Lab 30 124 Science and Math Lab Manual
NAME ________________________________________ DATE ______________ PERIOD ____C
opyright ©G
lencoe/McG
raw-H
ill, a division of The M
cGraw
-Hill C
ompanies, Inc.
Lab 30 Reflection of Light Student Worksheet (continued)
Analysis
Data and Observations
6. Repeat step 5 using a new sheet of paper on the book. Hold themirror at a greater angle and trace the ray and the edge of theback of the mirror. Label this sheet Trial B. Repeat step 5 for a third time and label the sheet of paper Trial C.
7. Use the protractor to draw a dotted line that forms a rightangle to the line drawn along the back edge of the mirror.The dotted line should pass through the junction of rays Iand R. See Figure 4.
8. Using the protractor, measure the angle of incidence for TrialA. Record this value in the Data Table. Measure the angle ofreflection and record this value in the Data Table. Measure and record the angles for Trials B and C in the same way.
9. Find the supplements and complements to the angles ofincidence and reflection for Trial A, Trial B, and Trial C. Recordthe supplements and complements in the Data Table.
Observation of light rays in step 2 of the procedure:
Data Table
10. Explain how your observations of light passing between the teethof a comb support the statement that light travels in straight lines.
11. As you increased the angle of incidence, what happened to theangle of reflection?
12. Explain the relationship between the angle of incidence and theangle of reflection.
Trial Angle of Supplement Complement
Angle of Supplement Complement
incidenceof the angle of the angle
reflectionof the angle of the angle
of incidence of incidence of reflection of reflection
A
B
C
Figure 4

Objectives
Teaching the Lab
Preparations
Materials
Recommended Time
• Determine the amounts of various particle types in three soilsamples.
• Use formulas to calculate the water contents and water-holdingcapacities of three soil samples.
2 class periods
• soil samples (30) • masking tape (10 rolls)• balances (several) • scoops (10)• metric rulers (10) • pins (30)• 20-cm cloth squares (30) • water• specimen jars with lids (30) • beakers (30)
Have each student bring a soil sample in a plastic bag. Explain to thestudents that soil water will not be lost if samples are sealed inplastic bags.
• Have students work in groups of three, with each student collectingdata on one sample.
• If 100-mL graduated cylinders are available, add 50 mL of loose soiltothe cylinder. Add 50 mL of water and shake as directed. Theamount of various mineral particles can be determined by directreading.
• Soil samples can be dried in a warm oven for several hours or in anincubator overnight.
• In Parts B and C, students actually measure the water-holdingcapacity and water content of the soil and the cloth, but the watercontent and water-holding capacity of the cloth is small and so itcan be ignored.
• To keep the pan of the balance dry when massing a wet soil sample,have students place the sample in a cup made from aluminum foil.The mass of the aluminum foil will be negligible compared with thesoil and can be ignored.
Lab 31 125 Science and Math Lab Manual
NAME _________________________________________ DATE ______________ PERIOD _____
Physical Factors of SoilTeaching Suggestions
Lab
31
Cop
yrig
ht ©
Gle
ncoe
/McG
raw
-Hill
, a
divi
sion
of T
he M
cGra
w-H
ill C
ompa
nies
, In
c.
Lab 31

Data and Observations
Further Explorations
Analysis
Lab 31 126 Science and Math Lab Manual
NAME _________________________________________ DATE ______________ PERIOD ____C
opyright ©G
lencoe/McG
raw-H
ill, a division of The M
cGraw
-Hill C
ompanies, Inc.
Lab 31 Physical Factors of SoilTeaching Suggestions (continued)
Sample Tables:
TABLE 1
TABLE 2
10. a.–b. Answers will vary with soil sample used.
11. a. clay and silt
b. sand and gravel
12. Loosely packed soil allows water to drain through it. Closelypacked soil does not drain as well.
• Research the procedure for calculating the organic-matter contentof a soil sample.
• Prepare a chart showing the predominant soil types in variousparts of the United States. Show how soil types affect thecommercial activities of an area.
Soil Particle Size Data
Amount of each particle type (in mm)
Soil location Gravel Coarse sand Fine sand Silt Clay
1. Oak forest 20 10 8 40 12
2. Garden soil 46 11 21 16 12
3. Cow pasture 20 12 9 35 10
Water Content and Water-holding Capacity
Mass of PercentageSoil location Mass of soil Mass of dried saturated soil Percentage water-holding
and cloth soil and cloth and cloth water content capacity
1. Oak forest 125 g 95 g 250 g 31.6% 163%
2. Garden soil 150 g 105 g 175 g 42.9% 66.7%
3. Cow pasture 135 g 120 g 145 g 12.5% 20.8%

Introduction
Procedure
Materials
Objectives
Lab 31 127 Science and Math Lab Manual
NAME _________________________________________ DATE ______________ PERIOD _____
Physical Factors of SoilStudent Worksheet
Lab
31
Cop
yrig
ht ©
Gle
ncoe
/McG
raw
-Hill
, a
divi
sion
of T
he M
cGra
w-H
ill C
ompa
nies
, In
c.
Lab 31
Soil is a major factor influencing the survival of many living things.Many organisms live in the soil. Others are anchored in soil andobtain water and minerals from it. Still other organisms depend onthese soil-dependent organisms for food. The physical properties of aparticular kind of soil determine the kinds of plants that grow in thesoil and the kinds of animals that live in or on it.
• Determine the amounts of various particle types in three soil samples.• Use formulas to calculate the water contents and water-holding
capacities of three soil samples.
• soil samples (3) • specimen jars with • masking tape • pins (3)• beakers (3) lids (3) • water • scoop• balance • 20-cm cloth squares (3) • metric ruler
A. Particle Size1. Label three specimen jars with the locations of the soil
samples. Fill each jar halfway with soil. Add water,allowing it to soak into the soils, until the jars are full.
2. Cover the jars with lids and shake until the large soilparticles break apart. Set the jars aside and let theparticles settle overnight.
3. Using a ruler, measure the depth of each particle type ineach jar.
4. Record in Table 1 the amounts of gravel, coarse sand, finesand, silt, and clay in the settled soil samples. See thedrawing at the right.
B. Water Content5. Soak the cloth squares in water. Attach labels identifying
the samples with pins.6. Place a scoop of soil in each cloth. Wrap the soil samples
in the wet cloths. Determine and record their masses inTable 2. Place the wrapped samples where they will drycompletely, then redetermine and record their masses.Calculate the water content of each sample as apercentage of the dry mass of soil.
percentage water content � � 100
mass of�
mass of driedsoil and cloth soil and cloth
mass of dried soil and cloth

Data and Observations
Analysis
Lab 31 128 Science and Math Lab Manual
NAME _________________________________________ DATE ______________ PERIOD ____C
opyright ©G
lencoe/McG
raw-H
ill, a division of The M
cGraw
-Hill C
ompanies, Inc.
Lab 31 Physical Factors of SoilStudent Worksheet (continued)
C. Water-Holding Capacity7. Place each dried soil sample and
cloth from Part B in a beaker ofwater for five to ten minutes oruntil the soil is saturated.
8. Remove the wrapped samples from thebeakers and allow excess water to drain from them through thecloths. Find and record the masses of the saturated samples.
9. Calculate the water-holding capacity of each sample as apercentage of the dry mass.
TABLE 1
TABLE 2
10. Which type of soil particle made up:a. the greatest amount of each soil sample? b. the least amount?
11. Which type of soil particle was:a. most closely packed? b. least closely packed?
12. How does the type of soil particles affect water drainage?
Soil Particle Size Data
Amount of each particle type (in mm)
Soil location Gravel Coarse sand Fine sand Silt Clay
1.
2.
3.
Water Content and Water-holding Capacity
Mass of PercentageSoil location Mass of soil Mass of dried saturated soil Percentage water-holding
and cloth soil and cloth and cloth water content capacity
1.
2.
3.
percentagewater-holding � � 100
capacity
mass of mass ofsaturated soil – dried soil
and cloth and cloth
mass of driedsoil and cloth
Objectives
Analysis
Data and Observations
Teaching the Lab
Materials
Preparations
Recommended Time
Lab 32 129 Science and Math Lab Manual
NAME _________________________________________ DATE ______________ PERIOD _____
Graphing RelationshipsTeaching Suggestions
Lab
32
Cop
yrig
ht ©
Gle
ncoe
/McG
raw
-Hill
, a
divi
sion
of T
he M
cGra
w-H
ill C
ompa
nies
, In
c.
Lab 32
• Measure the effect of increasing forces on the length of a rubber band.• Graph the results of the experiment on a coordinate grid.• Interpret the graph.
45 minutes
• several heavy books• 100-g, 200-g, and 500-g masses• metric ruler• 2 plastic-coated wire ties, 10 cm and 30 cm long• ring clamp• ring stand• 3 rubber bands (equal length, different widths)• colored pencils
Acquire gram masses, ring clamp, and ring stand from the scienceteacher. Have students bring in the three different widths of rubberbands. If you want to consolidate data for a class average, make surethat each group has identical rubber bands.
• Have students work in groups of 3 or 4. • You may want to suggest that team members work in pairs. While
one pair is conducting a part of the trial, another pair can berecording information and graphing. Then the job tasks can switch.
See students’ work for tables and graphs. The data should lie in afairly linear pattern.
Sample answers are given.14. The graphs describe how much each rubber band stretches as the
mass applied increases.
15. It measures the stretchiness or flexibility for the rubber band.
16. The steepness decreases as the widths of the rubber bands increase.
17. The flexibility of a rubber band decreases as its width increases.

Further Explorations
Lab 32 130 Science and Math Lab Manual
NAME _________________________________________ DATE ______________ PERIOD ____C
opyright ©G
lencoe/McG
raw-H
ill, a division of The M
cGraw
-Hill C
ompanies, Inc.
Lab 32 Graphing RelationshipsTeaching Suggestions (continued)
18. The length that corresponds to 0 g mass is the original length ofthe rubber band.
19. Answers will vary. The value will be approximately halfwaybetween 300 g and 500 g values.
20. Suspend the object from the rubber band and measure the lengthof the stretched rubber band. Use the graph for that rubber band,locate the length, and trace down to find the approximate mass ofthe unknown object.
You may want to add another aspect to this experiment. Ask studentsto make a conjecture as to whether the rubber band returns to itsoriginal length after each stretching. Then have them verify theirconjectures. They could also make conjectures about how heat andcold affect the stretchiness of a rubber band.

Introduction
Procedure
Materials
Objectives
Lab 32 131 Science and Math Lab Manual
NAME _________________________________________ DATE ______________ PERIOD _____
Graphing RelationshipsStudent Worksheet
Lab
32
Cop
yrig
ht ©
Gle
ncoe
/McG
raw
-Hill
, a
divi
sion
of T
he M
cGra
w-H
ill C
ompa
nies
, In
c.
Lab 32
Most students agree that test grades seem to be related to theamount of time spent studying. If two variables are related, one’svalue depends on the other’s. Test grades are dependent on timestudied so test grades would be the dependent variable while timestudied represents the independent variable.
Some relationships, when graphed, form a linear pattern. In thisexperiment, you will investigate how a graph can be used to describethe relationship between the stretch of a rubber band and the forcestretching it.
• Measure the effect of increasing forces on the length of a rubber band.• Graph the results of the experiment on a coordinate grid.• Interpret the graph.
• several heavy books • ring clamp• 100-g, 200-g, and 500-g masses • ring stand• metric ruler • 3 rubber bands (equal length,• 2 plastic-coated wire ties, different widths)
10 cm and 30 cm long • colored pencils
1. Set up the ring stand, ring clamp, and books as shown.
Trial 1
2. Choose the narrowest rubber band.
3. Securely attach the rubber band to the ringclamp with the 10-cm plastic-coated wire tie.
4. Measure the width of the rubber band.Record this in the table in the Data andObservations section. Measure the lengthof the rubber band as it hangs from thering clamp. Record this length as thelength value for 0 mass.
5. Attach the 100-g mass to the bottom ofthe rubber band with the second wire tie.Measure the length of the stretchedrubber band. Record this value in the table.
6. Remove the mass and attach the 200-g mass to the bottom of therubber band. Measure the length of the stretched rubber band.Record this value in the table.

Data and Observations
Lab 32 132 Science and Math Lab Manual
NAME _________________________________________ DATE ______________ PERIOD ____C
opyright ©G
lencoe/McG
raw-H
ill, a division of The M
cGraw
-Hill C
ompanies, Inc.
Lab 32 Graphing RelationshipsStudent Worksheet (continued)
7. Remove the 200-g mass from the rubber band. Securely wrap the100-g and 200-g masses together with the wire ties and attachthis to the rubber band. Measure the length of the stretchedrubber band and record this value in the table for the 300-g mass.
8. Continue this process of using the various masses to create eachmass in the table, measuring the stretched rubber band, andrecording the length.
Trial 29. Replace the rubber band with a slightly wider one. Make a
conjecture about how the stretching of the wider rubber band willdiffer from that of the narrowest one. Record your conjecture.
10. Repeat steps 3–8 to complete the second column in the table.
Trial 311. Replace the rubber band with the widest one. Make a conjecture
about how the stretching of this rubber band will differ from theprevious two bands. Record your conjecture.
12. Repeat steps 3–8 to complete the third column in the table.
13. Graph the data for all three rubber bands on the same coordinateplane, using a different color pencil for each rubber band.
Make a conjecture.For Step 9, how will the stretching of the slightly wider band differfrom that of the narrowest one?
For Step 11, how will the stretching of the widest band differ fromthat of the other two?

Lab 32 133 Science and Math Lab Manual
NAME ________________________________________ DATE ______________ PERIOD _____
Graphing RelationshipsStudent Worksheet (continued)
Lab
32
Cop
yrig
ht ©
Gle
ncoe
/McG
raw
-Hill
, a
divi
sion
of T
he M
cGra
w-H
ill C
ompa
nies
, In
c.
Lab 32
TABLE Length of Rubber Band (cm)
Trial 1 (narrowest) Trial 2 Trial 3 (widest)
Mass (g) mm width mm width mm width
0
100
200
300
500
600
700
800
Graph
leng
th o
f ru
bber
ban
d (c
m)
mass (g)
Key to colors used in graph:
� � rubber band mm long
� � rubber band mm long
� � rubber band mm long

Analysis
Lab 32 134 Science and Math Lab Manual
NAME ________________________________________ DATE ______________ PERIOD ____C
opyright ©G
lencoe/McG
raw-H
ill, a division of The M
cGraw
-Hill C
ompanies, Inc.
Lab 32 Graphing RelationshipsStudent Worksheet (continued)
14. What information do the graphs portray?
15. What does the steepness of the graph measure?
16. How is the steepness of each of the three graphs related to thewidth of the rubber band?
17. How is the flexibility of these rubber bands related to theirwidths?
18. Explain how someone looking at the graph could determine thelength of each unstretched rubber band.
19. Use the graph to predict the length of each rubber band if a massof400 g is used to stretch it.
20. How could you use the stretching of one rubber band to measurethe mass of an unknown object?
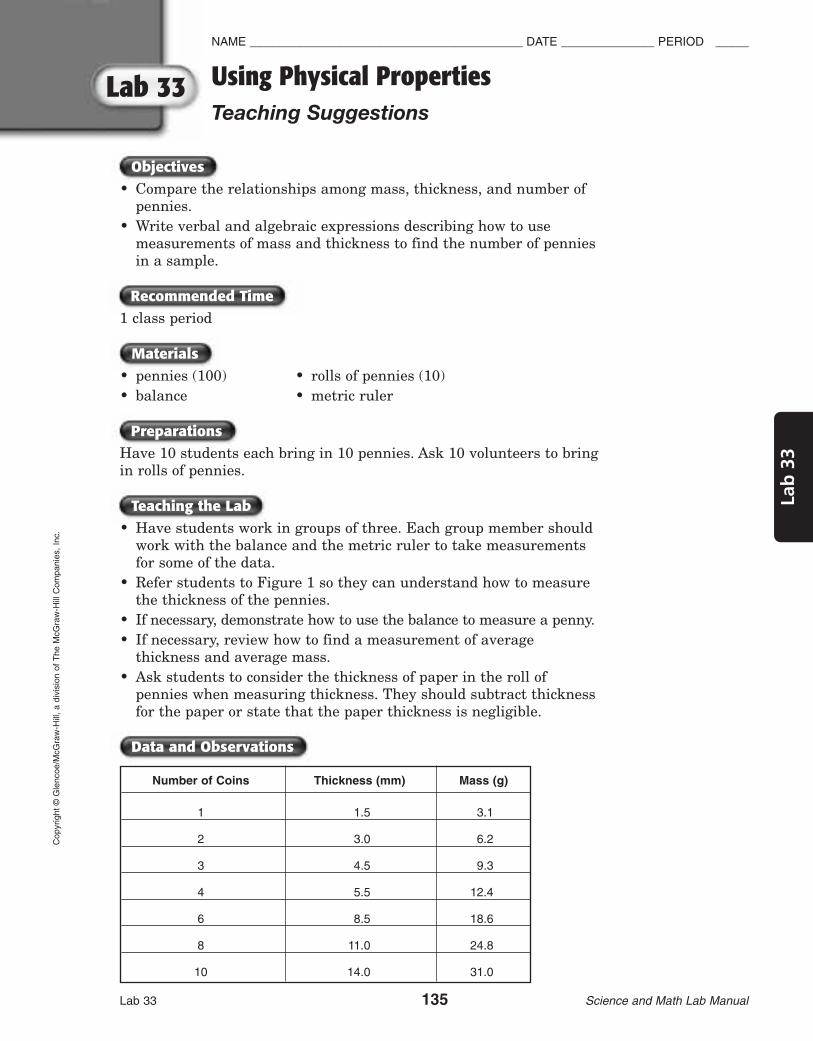
Objectives
Materials
Data and Observations
Teaching the Lab
Preparations
Recommended Time
Lab 33 135 Science and Math Lab Manual
NAME _________________________________________ DATE ______________ PERIOD _____
Using Physical PropertiesTeaching Suggestions
Lab
33
Cop
yrig
ht ©
Gle
ncoe
/McG
raw
-Hill
, a
divi
sion
of T
he M
cGra
w-H
ill C
ompa
nies
, In
c.
Lab 33
• Compare the relationships among mass, thickness, and number ofpennies.
• Write verbal and algebraic expressions describing how to usemeasurements of mass and thickness to find the number of penniesin a sample.
1 class period
• pennies (100) • rolls of pennies (10)• balance • metric ruler
Have 10 students each bring in 10 pennies. Ask 10 volunteers to bringin rolls of pennies.
• Have students work in groups of three. Each group member shouldwork with the balance and the metric ruler to take measurementsfor some of the data.
• Refer students to Figure 1 so they can understand how to measurethe thickness of the pennies.
• If necessary, demonstrate how to use the balance to measure a penny.• If necessary, review how to find a measurement of average
thickness and average mass.• Ask students to consider the thickness of paper in the roll of
pennies when measuring thickness. They should subtract thicknessfor the paper or state that the paper thickness is negligible.
Number of Coins Thickness (mm) Mass (g)
1 1.5 3.1
2 3.0 6.2
3 4.5 9.3
4 5.5 12.4
6 8.5 18.6
8 11.0 24.8
10 14.0 31.0

Analysis
Further Explorations
Lab 33 136 Science and Math Lab Manual
NAME _________________________________________ DATE ______________ PERIOD ____C
opyright ©G
lencoe/McG
raw-H
ill, a division of The M
cGraw
-Hill C
ompanies, Inc.
Lab 33 Using Physical PropertiesTeaching Suggestions (continued)
6. Persons reading the ruler could be inconsistent in judgingfractions of millimeters. The surface on which the ruler and thepennies rest could be uneven. Lines on ruler are thick incomparison with measurements.
7. Persons using the scale could be inconsistent in judgingmeasurements. Pennies that have oxidized would have a greatermass than they originally had.
8. Because there could be error in the measurement of a singlepenny, or because individual pennies could have worn unevenly,using a larger sample will give a better measurement for theaverage penny.
9. Use the value you came up with for the mass of one penny anddivide that into the mass of the pile of pennies to get the numberof pennies in the pile.
10. Use the thickness you got for one penny and divide that into thethickness of the stack, or 4.5 cm.
11. Let n � number of pennies.
Let n � mass of pennies � mass of one penny
12. Let n � number of pennies.
Let n � 4.5 cm � the thickness of one penny
Describe how you would estimate the number of nickels remaining ina roll of nickels. Assume you can use the same equipment as you didwhen measuring the pennies.

Introduction
Materials
Procedure
Objectives
Lab 33 137 Science and Math Lab Manual
NAME _________________________________________ DATE ______________ PERIOD _____
Using Physical PropertiesStudent Worksheet
Lab
33
Cop
yrig
ht ©
Gle
ncoe
/McG
raw
-Hill
, a
divi
sion
of T
he M
cGra
w-H
ill C
ompa
nies
, In
c.
Lab 33
Suppose you’ve been collecting pennies in a huge milk jug. You’recurious to know what your collection is worth, but you don’t have thetime—or the energy—to count each coin. How can algebra and dataabout physical properties save you time?
• Measure thickness and mass of pennies using a metric ruler and abalance.
• Compare relationships among thickness, mass, and number ofpennies.
• Write verbal descriptions and algebraic equations for calculatingmass, length, or number of pennies given two other measurements.
• pennies (10)• balance• metric ruler• roll of pennies
A. Measuring Thickness
1. Use the metric ruler to find the thicknesses of 1 penny, 2 pennies,3 pennies, 4 pennies, 6 pennies, 8 pennies, and 10 pennies.(See Figure 1.) Measure each thickness to the nearest 0.5 mm.Record the thicknesses in the Data Table.
2. Record in the table the number of pennies in the roll. Measure thelength of the roll. Record that value in the table.
B. Measuring Mass
3. Use the balance to determine the mass of 1 penny, 2 pennies, 3pennies, 4 pennies, 6 pennies, 8 pennies, and 10 pennies to thenearest 0.1 g. Record the masses in the Data Table.
4. Use the balance to find the mass of the roll of coins. Record thevalues in the Data Table.
5. Find the average thickness of one penny. Record the value in theData Table.
Figure 1

Data and Observations
Analysis
DATA TABLE
Average Mass = Average Thickness =
6. What errors could exist in your measurement of the thickness of the coins?
7. What errors could exist in your measurement of the mass of the coins?
8. Why is it helpful to have more than one measurement for thethickness and the mass of the coins?
9. Write a sentence describing one way that you could use the data aboutmass to find the number of pennies in a milk jug.
10. Write a sentence describing one way you could use the data aboutthickness to find the number of pennies in a stack 4.5 cm tall.
11. Write an algebraic equation describing how you would find the numberof pennies in a pile that weighs x grams.
12. Write an algebraic equation describing how you would find the numberof pennies in a 4.5 cm stack.
Number of Pennies Thickness (mm) Mass (g)
1
2
3
4
6
8
10
Lab 33 138 Science and Math Lab Manual
NAME _________________________________________ DATE ______________ PERIOD ____C
opyright ©G
lencoe/McG
raw-H
ill, a division of The M
cGraw
-Hill C
ompanies, Inc.
Lab 33 Using Physical PropertiesStudent Worksheet (continued)

Objectives
Teaching the Lab
Preparations
Materials
Recommended Time
Lab 34 139 Science and Math Lab Manual
NAME _________________________________________ DATE ______________ PERIOD _____
The Law of ProbabilityTeaching Suggestions
Lab
34
Cop
yrig
ht ©
Gle
ncoe
/McG
raw
-Hill
, a
divi
sion
of T
he M
cGra
w-H
ill C
ompa
nies
, In
c.
Lab 34
• Use a spinner to determine direction and distance of a movement.• Use the law of probability to analyze the random movements
described by the spinner.
1 class period (Students may need additional time to complete thequestions in the Analysis section.)
• cardboard (10) • metric rulers (10)• scissors (10 pairs) • colored pencils (30 total, 3 different colors)• glue or paste • shirt buttons (10)• grid paper (90 sheets) • straight pins (10)
Gather materials.
• Have students work in groups of three, with each student doing onetrial.
• Students will need to define a successful outcome in order to usethe formulas.
• If cardboard is unavailable, the styrofoam flat trays used incafeterias may be substituted. If straight pins are unavailable,substitute unfolded paper clips.

Data and Observations
Lab 34 140 Science and Math Lab Manual
NAME _________________________________________ DATE ______________ PERIOD ____C
opyright ©G
lencoe/McG
raw-H
ill, a division of The M
cGraw
-Hill C
ompanies, Inc.
Lab 34 The Law of ProbabilityTeaching Suggestions (continued)
SAMPLE TABLE 1
Trial 1 Trial 2 Trial 3Turns
Direction Spaces Direction Spaces Direction Spaces
1 N 2 N 1 SE 6
2 SE 3 S 6 SE 6
3 N 4 E 2 S 5
4 S 2 W 1 E 4
5 SW 5 NW 3 N 3
6 W 6 SE 3 NW 1
7 E 2 NE 5 NW 1
8 SE 1 SW 5 NE 4
9 SE 1 SW 5 SW 5
10 NW 4 NE 2 W 2
11 W 5 SE 4 S 2
12 NE 6 NW 3 E 6
13 E 2 W 6 N 6
14 W 3 E 1 SE 1
15 N 1 S 1 SW 4
16 NW 5 N 6 NE 3
17 NE 4 N 3 NW 2
18 E 4 S 4 W 5
19 SE 5 E 2 N 5
20 S 6 W 5 E 3
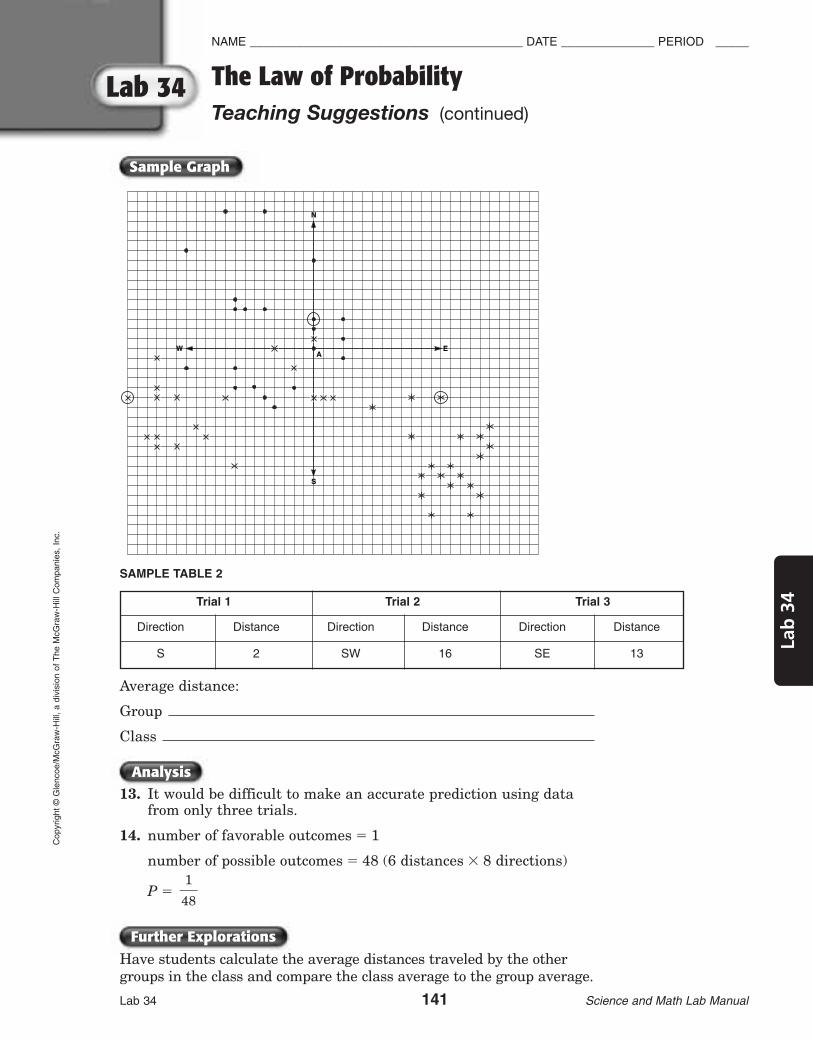
Sample Graph
Further Explorations
Analysis
NAME _________________________________________ DATE ______________ PERIOD _____
The Law of ProbabilityTeaching Suggestions (continued)
Lab
34
Cop
yrig
ht ©
Gle
ncoe
/McG
raw
-Hill
, a
divi
sion
of T
he M
cGra
w-H
ill C
ompa
nies
, In
c.
Lab 34
SAMPLE TABLE 2
Average distance:
Group
Class
13. It would be difficult to make an accurate prediction using datafrom only three trials.
14. number of favorable outcomes � 1
number of possible outcomes � 48 (6 distances � 8 directions)
P �
Have students calculate the average distances traveled by the othergroups in the class and compare the class average to the group average.
1�48
Trial 1 Trial 2 Trial 3
Direction Distance Direction Distance Direction Distance
S 2 SW 16 SE 13
LM23-2
N
W E
Graph 1 Sample Data
A
S
Lab 34 141 Science and Math Lab Manual

Introduction
Procedure
Materials
Objectives
Lab 34 142 Science and Math Lab Manual
NAME _________________________________________ DATE ______________ PERIOD ____C
opyright ©G
lencoe/McG
raw-H
ill, a division of The M
cGraw
-Hill C
ompanies, Inc.
Lab 34 The Law of ProbabilityStudent Worksheet
Are there surprises in nature? While many natural events occur in predictablepatterns, other events or behaviors are less predictable. Take the behavior ofgas particles as an example. Gas particles move haphazardly, bumping intoobstacles and bouncing back again. To make predictions about events such asthe movements of gas particles, scientists use probability. Use a spinner andthe law of probability to make predictions about random movement.
• Use a spinner to determine direction and distance of a movement.• Use the law of probability to analyze the random movements described
by the spinner.
• cardboard (1) • glue or paste • shirt button (1)• colored pencils • metric ruler (1) • straight pin (1)
(3 different colors) • scissors • grid paper (3 sheets)
A. Making the Spinner1. Paste the spinner and pointer in Figure 1 onto the cardboard.2. Cut out the spinner and pointer.3. Push the straight pin up through the center dot of the spinner. 4. Place the button on the pin and push the pin through the center dot of
the arrow.B. Spinner5. Spin the arrow. When it
stops, read from the outerdial the direction in whichyou are to move. Recordthe direction in Table 1 inthe Data andObservations section.
6. Spin the arrow again.When it stops, read fromthe inner dial the numberof spaces you are to move.Record the number ofspaces in Table 1. This isTrial 1, Turn 1.
7. Record a total of 20 turns(two spins each turn) forTrial 1.
Cut here
Cut here
Cut
alo
ng th
is li
ne a
fter
past
ing
shee
t on
card
boar
d
Cut
her
e
Cut
alo
ng s
olid
line
s
Cut
her
eE
3
2
16
5
4 3
2
16
5
4
NE
N
NW
W
SW
S
SE
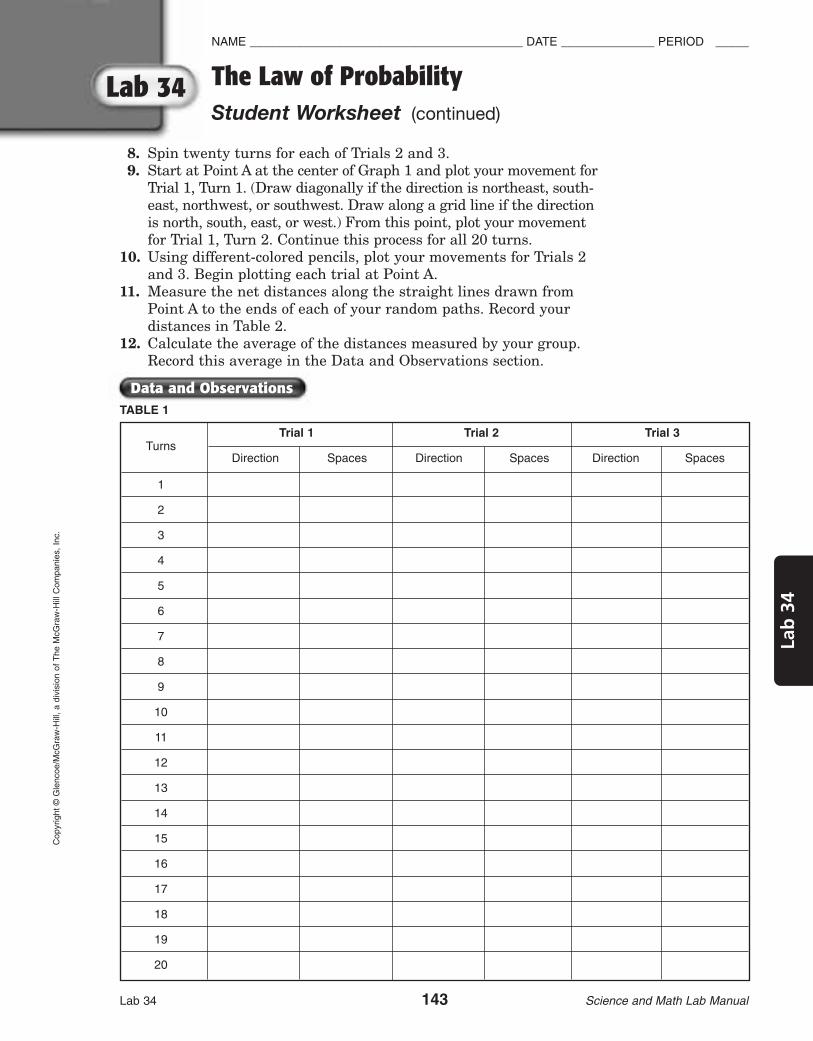
Data and Observations
Lab 34 143 Science and Math Lab Manual
NAME _________________________________________ DATE ______________ PERIOD _____
The Law of ProbabilityStudent Worksheet (continued)
Lab
34
Cop
yrig
ht ©
Gle
ncoe
/McG
raw
-Hill
, a
divi
sion
of T
he M
cGra
w-H
ill C
ompa
nies
, In
c.
Lab 34
8. Spin twenty turns for each of Trials 2 and 3.9. Start at Point A at the center of Graph 1 and plot your movement for
Trial 1, Turn 1. (Draw diagonally if the direction is northeast, south-east, northwest, or southwest. Draw along a grid line if the directionis north, south, east, or west.) From this point, plot your movementfor Trial 1, Turn 2. Continue this process for all 20 turns.
10. Using different-colored pencils, plot your movements for Trials 2and 3. Begin plotting each trial at Point A.
11. Measure the net distances along the straight lines drawn fromPoint A to the ends of each of your random paths. Record yourdistances in Table 2.
12. Calculate the average of the distances measured by your group.Record this average in the Data and Observations section.
TABLE 1
Trial 1 Trial 2 Trial 3Turns
Direction Spaces Direction Spaces Direction Spaces
1
2
3
4
5
6
7
8
9
10
11
12
13
14
15
16
17
18
19
20

Graph 1
Analysis
Lab 34 144 Science and Math Lab Manual
NAME _________________________________________ DATE ______________ PERIOD ____C
opyright ©G
lencoe/McG
raw-H
ill, a division of The M
cGraw
-Hill C
ompanies, Inc.
Lab 34 The Law of ProbabilityStudent Worksheet (continued)
TABLE 2
Average distance:
Group
Class
13. Based on your three trials, what prediction can you make aboutthe distance and direction of future paths? How accurate do youthink your prediction would be?
14. Use the definition of probability to find the probability of travelinga particular distance and direction in one turn (two spins).
Trial 1 Trial 2 Trial 3
Direction Distance Direction Distance Direction Distance
N
W EA
S

Teaching the Lab
Preparations
Materials
Recommended Time
Objectives
Lab 35 145 Science and Math Lab Manual
NAME _________________________________________ DATE ______________ PERIOD _____
Variation in the Strength of ElectromagnetsTeaching Suggestions
Lab
35
Cop
yrig
ht ©
Gle
ncoe
/McG
raw
-Hill
, a
divi
sion
of T
he M
cGra
w-H
ill C
ompa
nies
, In
c.
Lab 35
Caution: Students must use care when handling BBs. Any that acci-dentally fall during the experiment must be immediately retrieved sostudents do not slip on them.
• Construct electromagnets that vary in strength.• Compare the strength of the magnetic force of four electromagnets.• Use direct variation and proportion to state the relationship
between the strength of the magnetic force and the number oftimes the wire is coiled around the electromagnet.
1 class period
• BBs, iron (10 cups of 20 BBs)• 1.5 V dry cell (10)• drinking cups (20)• insulated wire (10)• iron bolts of the same size, at least 5 cm long (40)• marking pen (10)• masking tape (10 rolls)
Gather materials.
• Have students work in groups of three.• Students should wind the wire tightly and evenly around the bolts.• If necessary, review direct and indirect variations, their equations,
and their relation to proportions.• Instruct students to round their prediction for the number of BBs
picked up with 50 coils. Explain that it does not make sense forthem to predict that the electromagnet with 50 coils will pick up23.5 BBs, for example.

Data and Observations
Further Explorations
Analysis
Lab 35 146 Science and Math Lab Manual
NAME _________________________________________ DATE ______________ PERIOD ____C
opyright ©G
lencoe/McG
raw-H
ill, a division of The M
cGraw
-Hill C
ompanies, Inc.
Lab 35 Variation in the Strength of ElectromagnetsTeaching Suggestions (continued)
SAMPLE TABLE:
7. As the number of turns of wire increases, the strength of themagnetic force increases.
8. y � kx
9. The values for k should be approximately equivalent and willdepend upon the type of bolt used. The value of k for the sampledata would be approximately 2.
10. Identical bolts are used so that the value of k remains constant.The size and the material of the bolt affect the strength of themagnetic force.
11. �10
5tBuBrns
s� � �
50 txurns�
Students’ predictions should correspond to their data.
Have students design an experiment to determine how the strength ofthe magnetic force of an electromagnet is affected by the amount ofcurrent in the coil of the electromagnet. Have them test their predic-tions and express their results in a direct or indirect variation equa-tion or proportion.
Electromagnet Number of Turns Number of BBs Value of kof Wire Picked Up
A 10 5 �150� � 2
B 20 8 �280� � 2.5
C 30 13 �3103� � 2.3
D 40 19 �4109� � 2.1

Introduction
Procedure
Materials
Objectives
Lab 35 147 Science and Math Lab Manual
NAME _________________________________________ DATE ______________ PERIOD _____
Variation in the Strength of ElectromagnetsStudent Worksheet
Lab
35
Cop
yrig
ht ©
Gle
ncoe
/McG
raw
-Hill
, a
divi
sion
of T
he M
cGra
w-H
ill C
ompa
nies
, In
c.
Lab 35
A magnetic force exists around any wire that carries an electric cur-rent. A wire-wound bolt or nail will become an electromagnet if thewire is connected to a battery or other source of current. The morecoils around a bolt or nail, the more the strength of the magnetic forcewill increase. Using your knowledge about variations, you can makepredictions about the strength of an electromagnet.
• Construct electromagnets that vary in strength.• Compare the strength of the magnetic force of four electromagnets.• Use direct variation and proportion to state the relationship
between the strength of the magnetic force and the number oftimes the wire is coiled around the electromagnet.
• BBs, iron• 1.5 V dry cell• drinking cups (2)• insulated wire• iron bolts of the same size, at least 5 cm long (4)• marking pen• masking tape
1. Place masking tape on the heads of the bolts. Label the bolts A, B,C, and D.
2. Put all the BBs in one cup.
3. Wrap 10 full turns of wire around bolt A. Wrap 20 turns of wirearound bolt B, 30 turns around bolt C, and 40 turns around bolt D.
4. Connect the ends of the wires of bolt A to the dry cell as shown inFigure 1. Carefully use your electromagnet to pick up as many BBsas possible. Hold the electromagnet with BBs over the empty cupand disconnect the wire to the dry cell. Make sure all the BBs fallinto the cup. Count the number of BBs in the cup. Record thisvalue in the Data Table.
5. Return all the BBs to the first cup.
6. Repeat steps 4 and 5 using bolts B, C, and D.
Figure 1
BBs
Dry Cell Bolt

Data and Observations
Analysis
Lab 35 148 Science and Math Lab Manual
NAME _________________________________________ DATE ______________ PERIOD ____C
opyright ©G
lencoe/McG
raw-H
ill, a division of The M
cGraw
-Hill C
ompanies, Inc.
Lab 35 Variation in the Strength of ElectromagnetsStudent Worksheet (continued)
Data Table
7. How are both the strength of the magnetic force of an electromag-net and the number of turns of wire in direct variation?
8. If x is the number of BBs, y is the number of turns of wire, and kis the constant of variation, write an equation that shows how the number of turns of wire and the number of BBs are in directvariation.
9. Use the equation to find values of k for each of your bolts and record these in the Data Table. What do you notice about the values?
10. Why are identical bolts used in this experiment?
11. Use a proportion to predict how many BBs a bolt wrapped with 50 turns of wire will pick up.
Electromagnet Number of Turns Number of BBs Value of kof Wire Picked Up
A 10
B 20
C 30
D 40
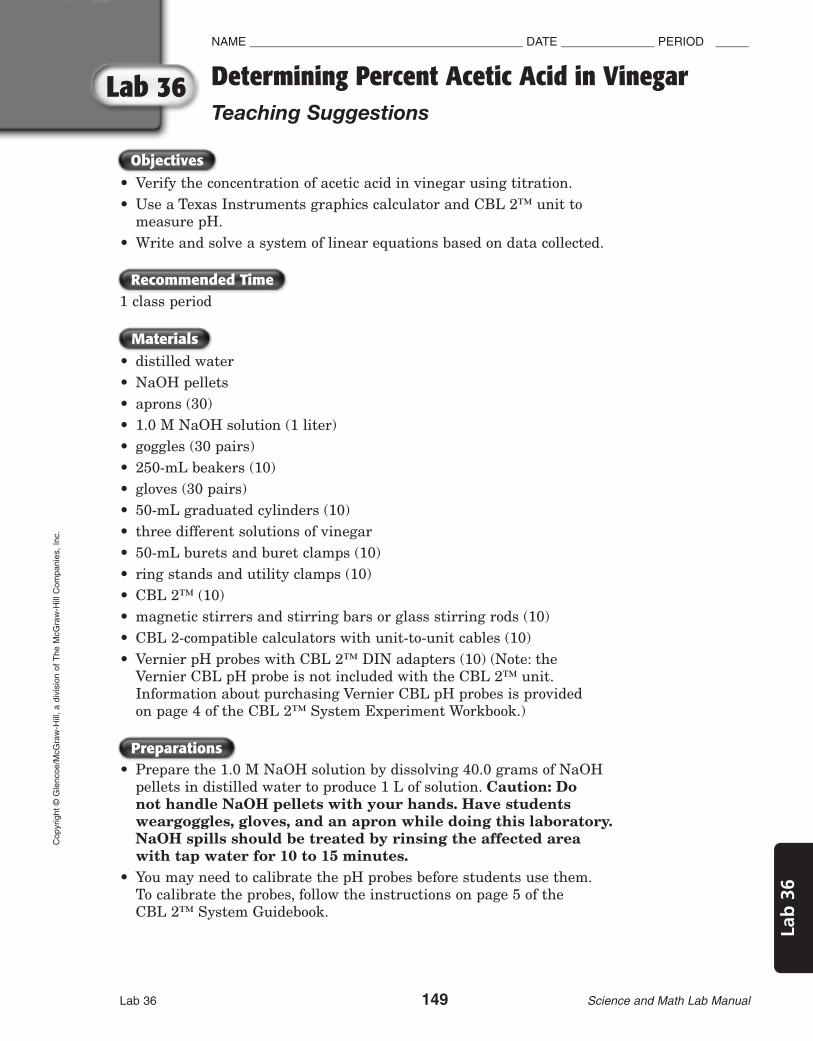
Objectives
Preparations
Materials
Recommended Time
Lab 36 149 Science and Math Lab Manual
NAME _________________________________________ DATE ______________ PERIOD _____
Determining Percent Acetic Acid in VinegarTeaching Suggestions
Lab
36
Cop
yrig
ht ©
Gle
ncoe
/McG
raw
-Hill
, a
divi
sion
of T
he M
cGra
w-H
ill C
ompa
nies
, In
c.
Lab 36
• Verify the concentration of acetic acid in vinegar using titration.• Use a Texas Instruments graphics calculator and CBL 2™ unit to
measure pH.• Write and solve a system of linear equations based on data collected.
1 class period
• distilled water• NaOH pellets• aprons (30)• 1.0 M NaOH solution (1 liter)• goggles (30 pairs)• 250-mL beakers (10)• gloves (30 pairs)• 50-mL graduated cylinders (10)• three different solutions of vinegar• 50-mL burets and buret clamps (10)• ring stands and utility clamps (10)• CBL 2™ (10)• magnetic stirrers and stirring bars or glass stirring rods (10)• CBL 2-compatible calculators with unit-to-unit cables (10)• Vernier pH probes with CBL 2™ DIN adapters (10) (Note: the
Vernier CBL pH probe is not included with the CBL 2™ unit.Information about purchasing Vernier CBL pH probes is provided on page 4 of the CBL 2™ System Experiment Workbook.)
• Prepare the 1.0 M NaOH solution by dissolving 40.0 grams of NaOHpellets in distilled water to produce 1 L of solution. Caution: Do not handle NaOH pellets with your hands. Have students weargoggles, gloves, and an apron while doing this laboratory.NaOH spills should be treated by rinsing the affected area with tap water for 10 to 15 minutes.
• You may need to calibrate the pH probes before students use them.To calibrate the probes, follow the instructions on page 5 of the CBL 2™ System Guidebook.
149-152 SM L36-876070 6/29/06 3:47 PM Page 149

Teaching the Lab
Further Explorations
Analysis
Data and Observations
Lab 36 150 Science and Math Lab Manual
NAME _________________________________________ DATE ______________ PERIOD ____C
opyright ©G
lencoe/McG
raw-H
ill, a division of The M
cGraw
-Hill C
ompanies, Inc.
Lab 36 Determining Percent Acetic Acid in VinegarTeaching Suggestions (continued)
• Students work in groups of three.
Sample Data Table. Data is approximate, based on vinegar solutions of 3%, 4%, and 5%.
15. 2.81 liters of the 3% solution and .19 liters of the 10% solution
16. Students should have graphed the line y � x. It takes one mole of NaOH to neutralize one mole of CH3OOH.
Vitamin C is the common name for ascorbic acid. Design an experiment to determine the amount of ascorbic acid in a Vitamin C tablet.
Brand or type of vinegar A B C
Amount of vinegar used 35 mL 35 mL 35 mL
mL of NaOH used to reach a pH of 9 21.9 mL 30 mL 36.5 mL
Molarity (mol/l) of acetic acid in vinegar 0.6257 M 0.857 M 1.0427 M
Percentage of acetic acid in vinegar 3% 4% 5%
149-152 SM L36-876070 6/29/06 3:47 PM Page 150

Introduction
Procedure
Materials
Objectives
Lab 36 151 Science and Math Lab Manual
NAME _________________________________________ DATE ______________ PERIOD _____
Determining Percent Acetic Acid in VinegarStudent Worksheet
Lab
36
Cop
yrig
ht ©
Gle
ncoe
/McG
raw
-Hill
, a
divi
sion
of T
he M
cGra
w-H
ill C
ompa
nies
, In
c.
Lab 36
In a titration, a known amount of a substance of known concentration is added to a known amount of asubstance of unknown concentration. In most cases, a base is added to a sample of an acid, or the knownsolution is an acid, which is added to a base of unknown concentration. Small quantities of the knownsolution are added until the other solution has been neutralized completely.In this experiment, you will determine the concentration of a solution of vinegar by titration.Vinegar is a dilutesolution of acetic acid (CH3CHOOH).The base used in this titration is sodium hydroxide, NaOH.The titration ofthis particular acid and base can be written:
CH3COOH � NaOH → NaCH3COO � H20
• Verify the concentration of acetic acid in vinegar using titration.• Use a Texas Instruments graphics calculator and CBL™ unit to measure pH.• Write and solve a system of linear equations based on data collected.
• apron • 1.0 M NaOH solution • three different brands of vinegar• goggles • 250-mL beaker • 50-mL buret and buret clamp• gloves • 50-mL graduated cylinder • ring stand and utility clamp• Texas Instruments CBL2™ unit• magnetic stirrer and stirring bar or glass stirring rod• CBL2™ compatible calculator with unit-to-unit cable• Vernier pH probe with CBL2™ DIN adapter (not included in the CBL2™ unit)
Caution: Strong bases such as NaOH can cause severe burns. Wear goggles, gloves, and anapron while doing this laboratory! If NaOH spills on your skin or gets into your eyes, notifyyour teacher immediately and rinse the affected area with tap water for 10 to 15 minutes.
A. Set Up
1. Set up your CBL 2™ system. Use the unit-to-unit link cable to connect the CBL 2™ unit to yourcalculator. Use the I/O ports located on the bottom edge of each unit.
2. Attach the buret clamp to the ring stand. Place a buret in the clamp.
3. Use a utility clamp to attach the pH probe to the ring stand below the buret. Connect the other endof the pH probe to channel 1 (CH1) on the top edge of the CBL 2™ unit. Turn on the CBL 2™ unitand the calculator.
4. Download or enter the PH program from the disk accompanying your CBL 2™ ExperimentWorkbook or from the TI Web site.
5. Rinse the buret and tip with a small quantity of NaOH. Then, fill the buret to the 0.0 mL markwith 1.0 M of the NaOH solution.
6. Measure 35 mL of vinegar using a 50-mL graduated cylinder. Pour the vinegar into a 250-mL beaker.Record the brand of vinegar used in the Data Table of the Data and Observations section.
7. If you are using a magnetic stirrer, place the beaker on the stirrer. Then, place the beaker under theburet. Make sure that the pH probe is deep in the solution and does not touch the stirring bar.
149-152 SM L36-876070 6/29/06 3:47 PM Page 151

Analysis
Data and Observations
Lab 36 152 Science and Math Lab Manual
NAME _________________________________________ DATE ______________ PERIOD ____C
opyright ©G
lencoe/McG
raw-H
ill, a division of The M
cGraw
-Hill C
ompanies, Inc.
Lab 36 Determining Percent Acetic Acid in VinegarStudent Worksheet (continued)
B. Data Collection8. Start the PH program on the calculator. The program will prompt you for the number of the
channel the probe is connected to (1) and for the number of readings to take (enter 30).
9. At the ML? prompt, enter zero. Zero is the number of mL of NaOH that you have added to thevinegar so far. Press TRIGGER on the CBL 2™ to take a pH reading.
10. Each time the program prompts you with the ML? prompt, add 3–5 mL NaOH to the vinegar. Recordon a sheet of paper the amount added. Enter the amount into the calculator. (Stir the vinegar brieflywith the glass stirrer at this point if you are not using a magnetic stirrer.) Wait a few seconds to allowthe reading to stabilize, and then press TRIGGER to take a pH reading.
11. After 18–20 mL of NaOH have been added, or the solution has reached a pH of about 5, decrease theamount of NaOH that you add to the vinegar to 1–2 mL per reading. Be sure to record the amountadded for each reading. When the display shows that the pH � 9, the NaOH has neutralized theacetic acid in the vinegar. In Table 1, record the amount of NaOH you have added up to this point.
12. Discard the solution in the beaker and wash the beaker. Rinse the pH probe and set theequipment back in place. Repeat steps 5–12 for the two additional brands of vinegar.
DATA TABLE
13. Determine the molar concentration of CH3OOH in each solution of vinegar using the equation:M1V1 � M2V2. Record your answers in the Data Table.
M1 � 1.00 M NaOH M2 � molar concentration of CH3OOHV1 � volume (in mL) of NaOH used V2 � volume (in mL) of vinegar used in
in the titration to reach a pH of 9 each titration
14. Use the molar concentration of CH3OOH in the solution to determine the amount of moles ofCH3OOH in the 35 mL sample of vinegar. Then, convert the moles of acetic acid to grams using
the formula moles CH3OOH � � grams CH3OOH.
(Forty-eight is the gram formula mass of CH3OOH.) Convert grams of CH3OOH to mL by using vinegar’s density:1.001 gram/mL.Then divide your result by 35 mL to calculate the percentage of CH3OOH in the vinegar. Record youranswers in the Data Table.
15. Sometimes chemists test levels of acidity in solutions because they need a solution with a particular level ofacidity to use in an experiment. Suppose that you tested two vinegar solutions and found them to haveacidity levels of 3% and 10%. But you need three liters of 6% acetic acid solution. Write a system ofequations and solve it to find out how many liters of each solution you should mix to make the 6% solution.
16. How many moles of NaOH does it take to neutralize one mole of CH3OOH? Using the data for two of thesolutions of vinegar, find the number of moles per liter of NaOH (x) and the number of moles per liter ofCH3OOH (y) used at the point of neutralization. Graph a line based on these data points. The slope of theline should equal the number of moles of NaOH it takes to neutralize one mole of CH3OOH.
481 mol CH3OOH
Brand or type of vinegar
Amount of vinegar used 35 mL 35 mL 35 mL
mL of NaOH used to reach a pH of 9
Molarity (mol/l) of acetic acid in vinegar
Percentage of acetic acid in vinegar
149-152 SM L36-876070 6/29/06 3:47 PM Page 152

Objectives
Teaching the Lab
Preparations
Materials
Recommended Time
Lab 37 153 Science and Math Lab Manual
NAME _________________________________________ DATE ______________ PERIOD _____
Projectile MotionTeaching Suggestions
Lab
37
Cop
yrig
ht ©
Gle
ncoe
/McG
raw
-Hill
, a
divi
sion
of T
he M
cGra
w-H
ill C
ompa
nies
, In
c.
Lab 37
• Use the Texas Instruments Calculator-Based Laboratory System (CBL 2™)to measure flight time and height of a projectile.
• Model a projectile’s motion algebraically using a quadratic equation.• Analyze the trajectory of a projectile in motion using quadratic equations.
1 class period
• buckets of water (15)• goggles (15 pairs)• toy water rockets and launchers (15)• CBL 2™ and compatible calculator with a unit-to-unit cable (15)• Vernier CBL motion detectors (15) (Note: the Vernier CBL motion detector
is not included with the CBL 2™ unit. Information about purchasingVernier CBL motion detectors is provided on the TI Web site.
Toy water rockets are available at most toy shops and hobby shops.
• Have students work in pairs.• If possible, the rockets should be launched straight up, not at an angle,
because the motion detector detects motion in a limited range and becausestudents are collecting data on height and time.
• Students may need to repeat flights of the rocket if they have difficultylaunching the rocket so that it will remain in range of the motion detector.
• You may wish to have students download their graphs into a computerand print them out.
• If students need help in assembling the CBL 2™ system, you can referthem to the CBL 2™ System Guidebook.
153-158 SM L37-876070 6/29/06 3:48 PM Page 153

Data and Observations
Further Explorations
Analysis
Lab 37 154 Science and Math Lab Manual
NAME _________________________________________ DATE ______________ PERIOD ____C
opyright ©G
lencoe/McG
raw-H
ill, a division of The M
cGraw
-Hill C
ompanies, Inc.
Lab 37 Projectile MotionTeaching Suggestions (continued)
11. Answers will vary.
highest height: several feet
time elapsed: 2–3 seconds
time elapsed from beginning to end of flight: 4–5 seconds
12. Answers will vary. Students should recognize that the time up and thetime down were almost equal to each other.
13. Answers will vary, but students should recognize that the velocity of therocket is included in their equations in the same position that thevariable b appears in the equation y � ax2 � bx � c.
14. Answers will vary, but students should algebraically reach the sameanswers they recorded in their data collection. Students should showtheir work.
15. Answers will vary, but students should reach the same answer usingboth methods. Students should show their work.
Will a projectile continue to fall faster and faster toward Earth? Does thesize or shape of a projectile affect its motion? How does the air affect aprojectile moving through it? Choose a question and answer it usingreference materials and through experimentation. Write a brief reportexplaining the answer to the question.
153-158 SM L37-876070 6/29/06 3:48 PM Page 154

Introduction
Materials
Objectives
Lab 37 155 Science and Math Lab Manual
NAME _________________________________________ DATE ______________ PERIOD _____
Projectile MotionStudent Worksheet
Lab
37
Cop
yrig
ht ©
Gle
ncoe
/McG
raw
-Hill
, a
divi
sion
of T
he M
cGra
w-H
ill C
ompa
nies
, In
c.
Lab 37
What do a baseball, a jumping ballerina, and a rockethave in common? Each goes up into the air and comesback down again. At least temporarily, anything thatis thrown or launched into the air is a projectile.
The path followed by a projectile is called a trajectory.Figure 1 shows the shape of the trajectory of a toyrocket. The motion of the projectile is up and thendown. Figure 2 shows the size and direction of thevertical velocity of a toy rocket at different momentsalong its trajectory. The rocket’s upward velocitybegins to decrease immediately after launch and therocket begins to slow down. Then, for an instant atthe highest point of its trajectory, it stops movingbecause its upward velocity is zero. The rocketimmediately begins to fall and its downward velocityincreases as it falls.
As you can see, the downward trajectory of the rocketmirrors the shape of the upward trajectory. The entiretrajectory forms the shape of a parabola. (Baseballsflying through the air also follow a parabola-shapedpath.) In this experiment, you will collect data aboutthe motion of projectiles and use your data to model aprojectile’s motion algebraically.
• Use the Texas Instruments Calculator-BasedLaboratory 2 System (CBL 2™) to measure flighttime and height of a projectile.
• Model a projectile’s motion algebraically using aquadratic equation.
• Analyze the trajectory of a projectile in motion usingquadratic equations.
• bucket of water• toy water rocket and launcher• CBL 2-compatible calculator with a unit-to-unit
cable• Vernier CBL motion detector• goggles• CBL 2™ unit
Figure 1
Figure 2
153-158 SM L37-876070 6/29/06 3:48 PM Page 155

Procedure
Lab 37 156 Science and Math Lab Manual
NAME _________________________________________ DATE ______________ PERIOD ____C
opyright ©G
lencoe/McG
raw-H
ill, a division of The M
cGraw
-Hill C
ompanies, Inc.
Lab 37 Projectile MotionStudent Worksheet (continued)
A. Set Up
1. Read through the procedure and decide who will be responsible for eachstep. One person must operate the rocket, and one person must operatethe CBL 2 and calculator. Both partners must wear goggles during thisexperiment.
2. Set up your CBL 2™ system. Use the unit-to-unit link cable to connectthe CBL 2™ unit to your calculator. Use the I/O ports located on thebottom edge of each unit.
3. Connect the motion detector to the SONIC port on the left side of the CBL 2, and place the motion detector on the ground in an open area,facing up.
4. Download or enter the HIKER program from the disk accompanying yourCBL 2™ Experiment Workbook or from the TI Web site.
5. Fill the water rocket to the level line shown on the rocket’s body.Make sure to fill the rocket to the same level during each flight in theexperiment.
6. Attach the pump/launcher to the rocket as shown in themanufacturer’s directions.
B. Rocket Launch
7. Pump the pump/launcher 10 times. Caution: do not exceed 20 pumpsor the maximum number suggested by the manufacturer,whichever is lower. Be sure to hold the rocket and pump/launcherso that the rocket is not directed toward yourself or anotherperson. While the rocket operator is pumping, the CBL 2 operator shouldturn on the CBL 2 and start the program HIKER on the CBL 2-compatiblecalculator.
8. At the prompt, the CBL 2 operator should press ENTER to start thegraph. The motion detector will start clicking. The rocket operator shouldthen launch the rocket over the motion detector, being careful to keep therocket in the motion detector’s beam.
9. Observe the flight of the rocket. If the falling rocket seems likely to hitthe motion detector, move the motion detector out of the way—but don’tmove the motion detector until the rocket has clearly begun to fall.Retrieve the rocket and repeat steps 5–9 if necessary.
153-158 SM L37-876070 6/29/06 3:48 PM Page 156

Data and Observations
Analysis
Lab 37 157 Science and Math Lab Manual
NAME _________________________________________ DATE ______________ PERIOD _____
Projectile MotionStudent Worksheet (continued)
Lab
37
Cop
yrig
ht ©
Gle
ncoe
/McG
raw
-Hill
, a
divi
sion
of T
he M
cGra
w-H
ill C
ompa
nies
, In
c.
Lab 37
10. The HIKER program will save the time and height (distance) data tolists L2 and L3 on the calculator. When the program is finished, it willgenerate a graph of the data.
11. Your graph will contain a downward-facing parabola. Trace the parabolaby pressing TRACE and moving the cursor with the arrow keys. Find thehighest height the rocket reached and the time it took to reach thatheight. Then find the time elapsed from the beginning of the flight to theend. Remember that x � time elapsed in seconds, while y � height infeet.
highest height:
time elapsed:
time elapsed from beginning to end of flight:
12. Did your graph support the statement that the time for a projectile toreach its highest point is equal to the time for the projectile to fall backto Earth? Explain.
13. The flight of a projectile can be described by the equationh � vt � 16t2, where h � height (distance), t � time, and v � initialupward velocity. What was the initial upward velocity of the rocket?
14. Use the formula h � vt � 16t2 to determine how long the rocket shouldhave stayed in the air and what its height should have been at themiddle of its flight. Show your work on the lines below. Then check yourwork against your data of how long the rocket actually stayed in the airand what its height actually was at the middle of its flight.
153-158 SM L37-876070 6/29/06 3:48 PM Page 157

Lab 37 158 Science and Math Lab Manual
NAME ________________________________________ DATE ______________ PERIOD ____C
opyright ©G
lencoe/McG
raw-H
ill, a division of The M
cGraw
-Hill C
ompanies, Inc.
Lab 37 Projectile MotionStudent Worksheet (continued)
15. The height of the rocket can also be described by the function h(t) � vt � 16t2. Find the height of the rocket after 3 seconds.Then, divide the polynomial in the function by t � 3 to illustrate the remainder theorem. Show your work on the lines below. Then checkyour work by tracing your graph on the calculator to find the value y when x � 3.
153-158 SM L37-876070 6/29/06 3:48 PM Page 158

Objectives
Data and Observations
Teaching the Lab
Materials
Recommended Time
Lab 38 159 Science and Math Lab Manual
NAME _________________________________________ DATE ______________ PERIOD _____
Tracking HurricanesTeaching Suggestions
Lab
38
Cop
yrig
ht ©
Gle
ncoe
/McG
raw
-Hill
, a
divi
sion
of T
he M
cGra
w-H
ill C
ompa
nies
, In
c.
Lab 38
• Plot the paths of two hurricanes.• Compare the paths of two hurricanes.• Use the distance formula to find the distance between the starting
and ending points of the hurricanes.
1 class period
• red and blue pencils (15–30 of each)
• This activity could be assigned as an independent assignment,homework, or as a cooperative project done with two students ineach group.
Sample map:
LM13-1
4545°
4040°
NorfolkNorfolk
3535°N
orth
latit
ude
Nor
th la
titud
e
3030°
West longitudeWest longitude
Hurricane Tracking ChartHurricane Tracking Chart
8585° 8080° 7575° 7070° 6565° 6060° 5555° 5050°9090°
2525°
2020°
MiamiMiami
New OrleansNew Orleans
Cape HatterasCape Hatteras
Hurricane A
Hurricane B
(x2, y2)
(x2', y2' )
(x1', y1' )
(x1, y1)

Analysis
Further Explorations
Lab 38 160 Science and Math Lab Manual
NAME _________________________________________ DATE ______________ PERIOD ____C
opyright ©G
lencoe/McG
raw-H
ill, a division of The M
cGraw
-Hill C
ompanies, Inc.
Lab 38 Tracking HurricanesTeaching Suggestions (continued)
4. Coordinates may vary slightly. 38°N, 75°W; 36°N, 75°W
5. Coordinates may vary slightly. 25.5°N, 77°W; 26°N, 80°W; 29.5°N,90°W
6. North
7. Hurricane A: d � 9.05°, about 1,005 km
Hurricane B: d � 31.5°, about 3,497 km
8. Hurricanes do not generally move in a straight path. Using thedistance formula only gives you the distance between two points.Because the hurricanes turn and change direction, the actualdistance traveled is greater than the distance between thebeginning and end points.
Have students do research to find the coordinates of a more recenthurricane. They can add the path of the more recent hurricane totheir maps.

Introduction
Procedure
Materials
Objectives
Lab 38 161 Science and Math Lab Manual
NAME _________________________________________ DATE ______________ PERIOD _____
Tracking HurricanesStudent Worksheet
Lab
38
Cop
yrig
ht ©
Gle
ncoe
/McG
raw
-Hill
, a
divi
sion
of T
he M
cGra
w-H
ill C
ompa
nies
, In
c.
Lab 38
Hurricanes are violent storms that form over water in the zone of theTrade Winds. Hurricanes produce strong winds, high seas, and heavyrain. If they reach land, they do great damage.
It’s important to follow the path of a hurricane. The U.S. WeatherBureau begins to report a hurricane watch when a hurricane reaches aposition where it seems likely to endanger land areas. The watchbegins a few days before the hurricane is expected to reach land. Ahurricane warning is different—in a hurricane warning, allprecautions should be taken immediately to protect life and property.In this activity, you will use a coordinate grid to keep track of twohurricanes. Then you will use the distance formula to find the distancebetween the starting points and ending points of the hurricanes.
• Plot the paths of two hurricanes.• Compare the paths of two hurricanes.• Use the distance formula to find the distance between the starting
and ending points of the hurricanes.
• pencils (red, blue)
1. On the hurricane tracking chart in the Data and Observationssection, use the red pencil to plot the path of Hurricane A for eachday. Use the data in Table 1.
2. On the same tracking chart, plot the path of Hurricane B for eachday. Plot the path with the blue pencil. Use the data in Table 2.
3. Circle the beginning and the end point on the path of eachhurricane.

Data and Observations
Lab 38 162 Science and Math Lab Manual
NAME _________________________________________ DATE ______________ PERIOD ____C
opyright ©G
lencoe/McG
raw-H
ill, a division of The M
cGraw
-Hill C
ompanies, Inc.
Lab 38 Tracking HurricanesStudent Worksheet (continued)
TABLE 1. Hurricane A
TABLE 2. Hurricane B
Date Position (at 7:00 A.M.)
(September, 1967) Latitude Longitude
9 27.5°N 79°W
10 30.5°N 77.5°W
11 36°N 71°W
12 36°N 66°W
13 36.5°N 64.5°W
14 37.5°N 65.5°W
15 38.5°N 68°W
16 38°N 74.5°W
17 36°N 76°W
Date Position (at 7:00 A.M.)
(August–September, 1965) Latitude Longitude
29 19.5°N 63.5°W
30 22.5°N 65.5°W
31 23°N 66.5°W
1 21°N 67°W
2 23.5°N 70°W
3 26°N 73°W
4 28°N 75°W
5 28.5°N 76°W
6 29.5°N 76°W
7 25.5°N 78°W
8 25.5°N 81°W
9 26.5°N 87°W
10 29.5°N 90.5°W
11 33°N 92°W

Analysis
Lab 38 163 Science and Math Lab Manual
NAME ________________________________________ DATE ______________ PERIOD _____
Tracking HurricanesStudent Worksheet (continued)
Lab
38
Cop
yrig
ht ©
Gle
ncoe
/McG
raw
-Hill
, a
divi
sion
of T
he M
cGra
w-H
ill C
ompa
nies
, In
c.
Lab 38
4. At which coordinates did Hurricane A hit land? (Note: There maybe more than one pair of coordinates.)
5. At which coordinates did Hurricane B hit land? (Note: There maybe more than one pair of coordinates.)
6. In which general direction, north or south, do hurricanes move?
7. Use the distance formula to calculate the distance between thestarting and ending points of each hurricane. Multiply youranswer in degrees by 111 km per degree to determine the distancein kilometers.
8. Is the distance formula helpful for analyzing how far a hurricanetravels? Why or why not?

45°
40°
Nor
folk
35°
North latitude
30°
Wes
t lon
gitu
de
Hur
rican
e T
rack
ing
Cha
rt
85°
80°
75°
70°
65°
60°
55°
50°
90°
25°
20°
Mia
mi
New
Orle
ans
Cap
e H
atte
ras
Lab 38 164 Science and Math Lab Manual
NAME ________________________________________ DATE ______________ PERIOD ____C
opyright ©G
lencoe/McG
raw-H
ill, a division of The M
cGraw
-Hill C
ompanies, Inc.
Lab 38 Tracking HurricanesStudent Worksheet (continued)
Objectives
Materials
Teaching the Lab
Preparations
Recommended Time
Lab 39 165 Science and Math Lab Manual
NAME _________________________________________ DATE ______________ PERIOD _____
A Mathematical Look at Cell SizeTeaching Suggestions
Lab
39
Cop
yrig
ht ©
Gle
ncoe
/McG
raw
-Hill
, a
divi
sion
of T
he M
cGra
w-H
ill C
ompa
nies
, In
c.
Lab 39
• Build cell models.• Use formulas to determine the surface area, volume, and mass of
each cell model.• Use ratios to determine the relationship between the surface area
and volume of each cell model.• Use ratios to determine the relationship between the surface area
and mass of each cell model.
1 class period
• photocopies of 3 cell models (included in student pages (15))• white glue (15 bottles)• scissors (30)• balance (several)• coarse sand (1 bag)• small scoops (several)
• If possible, photocopy the cell models on heavy paper. The heavierthe paper, the sturdier the models will be and the less likely theywill be to break when filled with sand.
• Have students work in pairs. Each member of the pair shouldparticipate in assembling the models, calculating measurementsand ratios, and recording data.
• Refer students to the figure on page 64 so that they know how toassemble the models. Remind students that they should imaginethat there is a sixth side to the models.
• Encourage students to carefully fold and glue their cell model, asthis will affect the accuracy of their mass measurement.

Data and Observations
Further Explorations
Analysis
Lab 39 166 Science and Math Lab Manual
NAME _________________________________________ DATE ______________ PERIOD ____C
opyright ©G
lencoe/McG
raw-H
ill, a division of The M
cGraw
-Hill C
ompanies, Inc.
Lab 39 A Mathematical Look at Cell SizeTeaching Suggestions (continued)
TABLE 1
TABLE 2
7. The paper represents the cell membrane. The sand represents thecytoplasm.
8. As a cell grows larger and accumulates more contents, it willneed more surface area to accommodate the growth. It will needmore cell membrane to get materials into and out of the cell.
9. As cells grow larger, surface-area-to-volume ratio gets smaller.
10. While answers for the surface-area-to-mass ratio will vary amongstudents depending on their mass measurements, studentsshould find the ratio also gets smaller.
11. the smallest cell
12. 27
13. 27 cells, each with s � 1.
Investigate actual cell sizes by using a microscope. Use a micrometerto measure the cell diameter, or estimate cell size from the size of themicroscope’s field of view.
Measurements of Cell Models
Cell size Area for one face:
Total surface area of cell:Volume of cell: Mass of cell (length of
A = s2(area of one face) �
A = s3 (grams)one side, s) (the total number of faces)
1 1 6 1 Answers
2 4 24 8 will
4 16 96 64 vary.
Ratios of Cell Model Measurements
Cell size (length of one side) Total surface area to volume Total surface area to mass
1 1.6:1 Answers will vary.
2 1.3:1 Surface-area-to-mass ratio
4 1.5:1 will decrease as size increases.
Introduction
Materials
Objectives
Lab 39 167 Science and Math Lab Manual
NAME _________________________________________ DATE ______________ PERIOD _____
A Mathematical Look at Cell SizeStudent Worksheet
Lab
39
Cop
yrig
ht ©
Gle
ncoe
/McG
raw
-Hill
, a
divi
sion
of T
he M
cGra
w-H
ill C
ompa
nies
, In
c.
Lab 39
Like all cells, the cells in your body are continuously dividing to makenew cells. This process allows your body to continue growth, formreproductive cells, and repair tissues. Cells generally grow until theyreach a certain size and then divide. Why don’t cells continue to growindefinitely? To answer this question, apply formulas about surfacearea, volume, and mass to cell models of various sizes.
• Build cell models.• Use formulas to determine the surface area, volume, and mass of
each cell model.• Use ratios to determine the relationship between the surface area
and volume of each cell model.• Use ratios to determine the relationship between the surface area
and mass of each cell model.
• photocopy of 3 cell models• white glue• scissors• balance • coarse sand• small scoop

Procedure
Lab 39 168 Science and Math Lab Manual
NAME _________________________________________ DATE ______________ PERIOD ____C
opyright ©G
lencoe/McG
raw-H
ill, a division of The M
cGraw
-Hill C
ompanies, Inc.
Lab 39 A Mathematical Look at Cell SizeStudent Worksheet (continued)
1. Work with a partner to build models of cells. Cut out the three cellmodels. Fold and glue together all sides of each model. You willhave three structures that resemble open boxes, as shown below.Imagine that each cell model has a sixth side and is a closed box.These models represent a cell at three different stages of growth.The model that is1 unit to a side represents the earliest stage ofgrowth. The model that is 4 units to a side represents the lateststage in growth.
2. Use the formulas in Table 1 to calculate the area for one face, thetotal surface area, and the volume for each cell model. In eachformula, s represents the length in number of units of one side ofyour model. Record your calculations in Table 1.
3. Carefully fill each cell with sand.
4. Determine the mass of each sand-filled cell model by using thebalance. Record the masses in the last column of Table 1.
5. Calculate the ratio of total surface area to volume for each cellmodel. To do this, divide the cell’s total surface area by its volume.Record your answers in Table 2.
6. Calculate the ratio of total surface area to mass for each modelcell. To do this, divide the cell’s total surface area by its mass.Record your answers in Table 2.
top open
gluesides

Data and Observations
Lab 39 169 Science and Math Lab Manual
NAME ________________________________________ DATE ______________ PERIOD _____
A Mathematical Look at Cell SizeStudent Worksheet (continued)
Lab
39
Cop
yrig
ht ©
Gle
ncoe
/McG
raw
-Hill
, a
divi
sion
of T
he M
cGra
w-H
ill C
ompa
nies
, In
c.
Lab 39
TABLE 1
TABLE 2
Measurements of Cell Models
Cell size Area for one face:
Total surface area of cell:Volume of cell: Mass of cell(length of
A = s2(area of one face) �
A = s3 (grams)one side, s) (the total number of faces)
1
2
4
Ratios of Cell Model Measurements
Cell size (length of one side) Total surface area to volume Total surface area to mass
1
2
4
1 unit4 units
2 units
Cell Models

Analysis
Lab 39 170 Science and Math Lab Manual
NAME ________________________________________ DATE ______________ PERIOD ____C
opyright ©G
lencoe/McG
raw-H
ill, a division of The M
cGraw
-Hill C
ompanies, Inc.
Lab 39 A Mathematical Look at Cell SizeStudent Worksheet (continued)
7. What parts of your cell model represent parts of an actual cell?
8. As a cell grows larger and accumulates more contents, will itneed more or less cell membrane to survive? Explain your answer.
9. As a cell grows larger, does the surface-area-to-volume ratio getlarger, get smaller, or remain the same?
10. As a cell grows larger, what happens to the surface-area-to-massratio?
11. Which cell model has the greatest surface-area-to-volume andsurface-area-to-mass ratios?
12. How many cells with s � 1 fit into a cell with s � 3?
13. Which has more total surface area, one cell with s � 3 or 27 cells,each with s � 1?
Objectives
Materials
Recommended Time
Preparations
Teaching the Lab
Lab 40 171 Science and Math Lab Manual
NAME _________________________________________ DATE ______________ PERIOD _____
The Effect of a Solute on Freezing PointTeaching Suggestions
Lab
40
Cop
yrig
ht ©
Gle
ncoe
/McG
raw
-Hill
, a
divi
sion
of T
he M
cGra
w-H
ill C
ompa
nies
, In
c.
Lab 40
• Use the Texas Instruments Calculator-Based Laboratory 2 System(CBL 2™) to measure temperature.
• Determine the effect of solute concentration on the freezing point of a solute.
• Show the relationship between amount of solute in a solution andfreezing point by graphing data points in a scatter plot and drawing a line of best fit, or regression line, using a CBL 2™ compatiblecalculator.
• Write a prediction equation based on data points.
1 class period
• aprons (30) • rubber bands (15)• goggles (30) • ketchup cups (30) with lids (15)• notebook paper (75 sheets cut in half) • paper punches (15)• shaved or crushed ice • balances (15)• NaCl • CBL 2™ units (15)• TI temperature probes (15) • TI-GRAPH LINK (optional) (15)• CBL 2™ compatible calculator with unit-to-unit cable (15)
Use shaved or crushed ice, not ice cubes.
• Have students work in pairs.• Make sure that students have read and understood the purpose,
procedure, and safety precautions for this laboratory before theyproceed.
• Remind students not to overload the calorimeter with ice. The topmust fit securely on the calorimeter.
• Remind students that they must work quickly with the ice/calorimetercombination. If they work too slowly so that no ice remains in thecalorimeter, the addition of more NaCl will not give the expecteddecrease in temperature.
171-176 SM L40-876070.qxd 6/29/06 2:44 PM Page 171
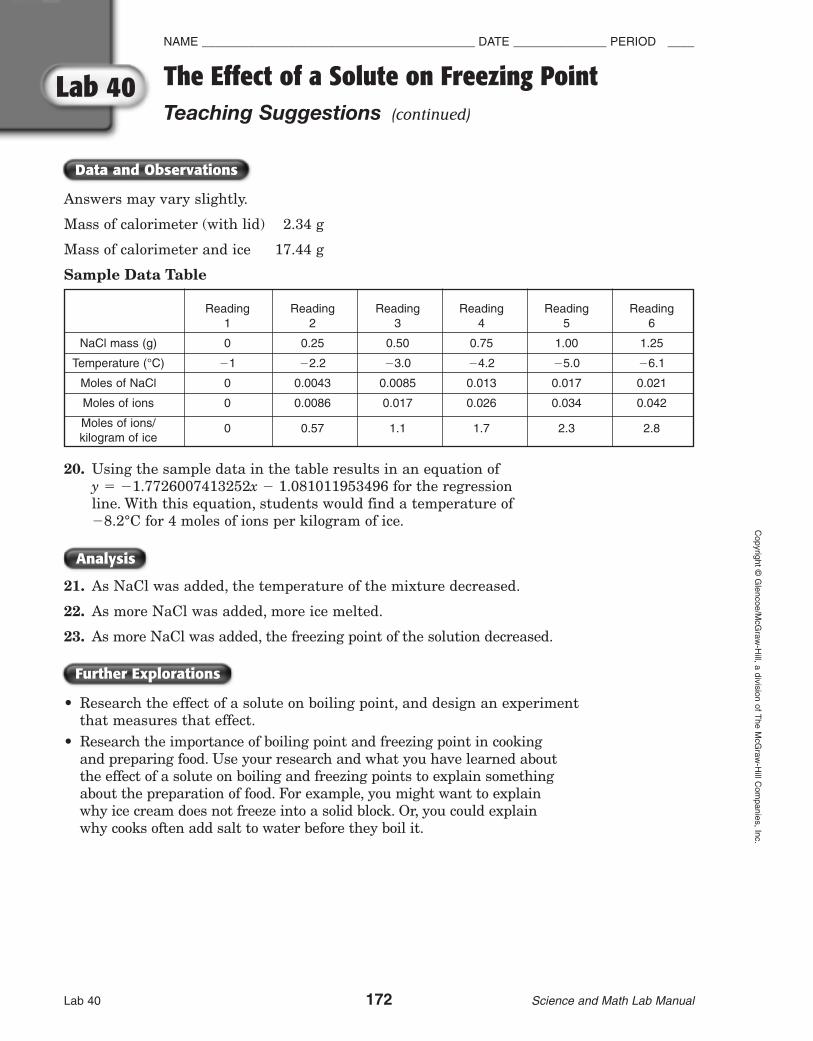
Data and Observations
Further Explorations
Analysis
Lab 40 172 Science and Math Lab Manual
NAME _________________________________________ DATE ______________ PERIOD ____C
opyright ©G
lencoe/McG
raw-H
ill, a division of The M
cGraw
-Hill C
ompanies, Inc.
Lab 40 The Effect of a Solute on Freezing PointTeaching Suggestions (continued)
Answers may vary slightly.
Mass of calorimeter (with lid) 2.34 g
Mass of calorimeter and ice 17.44 g
Sample Data Table
20. Using the sample data in the table results in an equation of y � �1.7726007413252x � 1.081011953496 for the regression line. With this equation, students would find a temperature of �8.2°C for 4 moles of ions per kilogram of ice.
21. As NaCl was added, the temperature of the mixture decreased.
22. As more NaCl was added, more ice melted.
23. As more NaCl was added, the freezing point of the solution decreased.
• Research the effect of a solute on boiling point, and design an experimentthat measures that effect.
• Research the importance of boiling point and freezing point in cooking and preparing food. Use your research and what you have learned about the effect of a solute on boiling and freezing points to explain somethingabout the preparation of food. For example, you might want to explain why ice cream does not freeze into a solid block. Or, you could explain why cooks often add salt to water before they boil it.
Reading Reading Reading Reading Reading Reading 1 2 3 4 5 6
NaCl mass (g) 0 0.25 0.50 0.75 1.00 1.25
Temperature (°C) �1 �2.2 �3.0 �4.2 �5.0 �6.1
Moles of NaCl 0 0.0043 0.0085 0.013 0.017 0.021
Moles of ions 0 0.0086 0.017 0.026 0.034 0.042
Moles of ions/ 0 0.57 1.1 1.7 2.3 2.8kilogram of ice
171-176 SM L40-876070.qxd 6/29/06 2:44 PM Page 172

Introduction
Materials
Objectives
Procedure
Pure water freezes at 0°C at standard atmospheric pressure. At thispoint, the vapor pressures of liquid water and solid water are the same.If there is a nonvolatile compound—a compound that will not evaporateunless it is boiled—dissolved in the water, however, the solution will not freeze until the temperature is lower than 0°C. Only at a lowertemperature will the vapor pressure of the solid equal the lowered vapor pressure of the liquid. Freezing point lowering, like boiling pointelevation, is dependent only on the concentration of solute particles, noton the kind of solute that is used.
• Use the Texas Instruments Calculator-Based Laboratory System(CBL 2™) to measure temperature.
• Determine the effect of solute concentration on the freezing point of asolute.
• Show the relationship between amount of solute in a solution andfreezing point by graphing data points in a scatter plot and drawing aline of best fit, or regression line, using a CBL 2™ compatible calculator.
• Write a prediction equation based on data points.
• apron • rubber band• goggles • ketchup cups (2) with lid (1)• 5 half sheets of notebook paper • paper punch• shaved or crushed ice • balance• NaCl • CBL 2 unit• TI temperature probe • TI-GRAPH LINK (optional)• CBL 2-compatible calculator with a unit-to-unit cable
A. Calorimeter
1. Prepare five samples of NaCl. Use thebalance to measure each sample. Makesure that each sample has a mass of 0.25 g, and place the samples on separate piecesof paper.
2. Construct a plastic calorimeter—a device formeasuring heat changes. Put a rubber bandaround the middle of one ketchup cup and thenplace this cup inside a second ketchup cup. SeeFigure 1 at right. Use a paper punch to make ahole in the lid of a ketchup cup.
Lab 40 173 Science and Math Lab Manual
NAME _________________________________________ DATE ______________ PERIOD _____
The Effect of a Solute on Freezing PointStudent Worksheet
Lab
40
Cop
yrig
ht ©
Gle
ncoe
/McG
raw
-Hill
, a
divi
sion
of T
he M
cGra
w-H
ill C
ompa
nies
, In
c.
Lab 40
hole madeby hole puncher
ketchup cup lid
inner ketchup cup
rubber band
outer ketchup cup
171-176 SM L40-876070.qxd 6/29/06 2:44 PM Page 173

Lab 40 174 Science and Math Lab Manual
NAME _________________________________________ DATE ______________ PERIOD ____C
opyright ©G
lencoe/McG
raw-H
ill, a division of The M
cGraw
-Hill C
ompanies, Inc.
Lab 40 The Effect of a Solute on Freezing PointStudent Worksheet (continued)
3. Use the balance to measure the mass of the empty calorimeter and its lid. Record the mass in the Data and Observations section.
4. Set up your CBL 2™ system. Use the unit-to-unit link cable to connectthe CBL 2™ unit to your calculator. Use the I/O port located on thebottom edge of the unit.
5. Connect the temperature probe to Channel 1 (CH1) on the top edgeof the CBL 2 unit. Download or enter the HEAT program from thedisk accompanying your CBL 2™ Experiment Workbook or from theTI Web site.
B. Temperature Changes
6. From this point on, you must work quickly. Read through steps 8–13before beginning the next step so that you will be prepared for action.Decide with your partner how you will work together to complete eachstep smoothly.
7. Fill the calorimeter with crushed ice and replace the lid. Remove someice if the top does not fit snugly.
8. Measure the mass of the calorimeter with its lid and ice. Record thismass in the Data and Observations section.
9. Insert the temperature probe through the hole in the calorimeter top.Start the program HEAT on the calculator. Enter 10 when theprogram prompts you for the amount of time to wait between eachreading. After you enter the time between points, wait to press again until the program prompts you to do so. After you press ,the CBL 2 will collect data every ten seconds for six minutes. Observethe variations in temperature on the calculator display as data iscollected. Record the first temperature in the Data Table under Reading 1.
10. After the CBL 2 has taken six temperature readings, open thecalorimeter and add one of the prepared NaCl samples. Replace thecover and the temperature probe. Swirl the calorimeter to mix thecontents until the NaCl is completely dissolved. Remove the cover very briefly to check.
11. After every sixth temperature reading, repeat step 10 with another NaCl sample. Because the CBL 2 will take six readings per minute,you must add NaCl once every minute. Observe the ice as more NaCl is added.
12. The calculator will save the temperature data in list L4. View the list of temperature data by pressing 1. Use the arrow keys to move to list L4 and to move up and down. Record the lowesttemperature reading for each change in NaCl mass in the Data Table.
STAT
ENTER
ENTER
171-176 SM L40-876070.qxd 6/29/06 2:44 PM Page 174

Lab 40 175 Science and Math Lab Manual
NAME ________________________________________ DATE ______________ PERIOD _____
The Effect of a Solute on Freezing PointStudent Worksheet (continued)
Lab
40
Cop
yrig
ht ©
Gle
ncoe
/McG
raw
-Hill
, a
divi
sion
of T
he M
cGra
w-H
ill C
ompa
nies
, In
c.
Lab 40
13. For each reading, convert grams of NaCl to the number of moles of NaCl and record the results in the Data Table. Use the formula
grams NaCl � � mol NaCl
Gfm refers to gram formula mass. The gram formula mass for NaCl is 68.5.
14. For each reading, calculate the number of moles of ions(moles NaCl � 2 ions/mole). Record the results.
15. Calculate the mass, in grams, of ice you started with and convert to kilograms.
16. Complete the Data Table for moles of ions per kilogram of ice in each reading.
17. Enter the six readings for temperature and moles of ions/kilogram of ice into the STAT list editor. (Be sure to clear the existing lists first.)Use column L1 for moles of ions/kilogram of ice and column L2 fortemperature.
18. Draw a scatter plot using the data you entered in step 17. First,change the window parameters. Use a viewing window of [0, 3] by [�6.5, �0.5] with Xscl � .5 and Yscl � .5. Then press [STAT PLOT]. Press 1 to select Plot 1. After checking to be sure that the Xlist is L1 and the Ylist is L2, press and .
19. Draw a line of best fit. Press and then select the CALC menu.Select LinReg (ax � b) and then press . The variable a displayed on the calculator is the slope of the line of best fit. Press and .Select Statistics (5) and then use the right arrow key to highlight EQ.Select RegEQ and press and .
20. Use the TRACE feature to predict the temperature of the mixture for 4 moles of ions/kilogram of ice. (You will need to adjust the viewing window first.)
GRAPHENTER
VARSY=
ENTER
STAT
GRAPHENTER
2nd
1 mol NaCl��gfm NaCl
171-176 SM L40-876070.qxd 6/29/06 2:44 PM Page 175

Data and Observations
Analysis
Lab 40 176 Science and Math Lab Manual
NAME ________________________________________ DATE ______________ PERIOD ____C
opyright ©G
lencoe/McG
raw-H
ill, a division of The M
cGraw
-Hill C
ompanies, Inc.
Lab 40 The Effect of a Solute on Freezing PointStudent Worksheet (continued)
Mass of calorimeter (with lid): g
Mass of calorimeter and ice: g
DATA TABLE
21. What happened to the temperature of the mixture as NaCl was added?
22. What happened to the amount of ice remaining as NaCl was added?
23. What conclusion can you draw from the answers you gave toquestions 21 and 22?
Reading Reading Reading Reading Reading Reading 1 2 3 4 5 6
NaCl mass (g) 0 0.25 0.50 0.75 1.00 1.25
Temperature (°C)
Moles of NaCl
Moles of ions
Moles of ions/kilogram of ice
171-176 SM L40-876070.qxd 6/29/06 2:44 PM Page 176

Objectives
Materials
Recommended Time
Preparations
Teaching the Lab
Lab 41 177 Science and Math Lab Manual
NAME _________________________________________ DATE ______________ PERIOD _____
Rates of Diffusion of GasesTeaching Suggestions
Lab
41
Cop
yrig
ht ©
Gle
ncoe
/McG
raw
-Hill
, a
divi
sion
of T
he M
cGra
w-H
ill C
ompa
nies
, In
c.
Lab 41
• Measure the distances two gases move.• Use inverse relations to calculate the masses and velocities of two
gases.• Compare the two ratios.
1 class period
• concentrated HCl • concentrated NH3• test tubes (30) • solid stoppers (30)• goggles (30 pairs) • aprons (30)• clear plastic straws (30) • double-ended cotton swabs (15)• one-hole rubber stoppers (30) • 250-mL beakers (15)• metric rulers (15) • clear tape• scissors (15 pairs)
• Have students work in pairs.• Do not allow students to handle the supply bottles of concentrated
acid and base. Instead, for each pair, prepare 0.5-mL samples insmall, stoppered test tubes.
• Keep samples in a fume hood to prevent escape of vapor into theroom.
• Plastic straws must be clear. Students will not be able to observethe white ring through an opaque straw.
• Prepare proper waste receptacles for solutions and disposableequipment before the lab begins.
• Caution: Have students put on goggles and aprons beforebeginning the lab. Both HCl and NH3 can cause skin burns;irritate eyes, nose, and lungs; and damage clothing.
• You may want to point out to students that while all particles ofmatter are in motion, gas molecules exhibit the greatest amount ofmotion.
• Air currents can affect the results of this experiment. Make surewindows are closed and no fans are running.
• Have on hand a bottle of NaHCO3 to neutralize an HCl spill. Have2M acetic acid for NH3 spills.

Further Explorations
Analysis
Data and Observations
Lab 41 178 Science and Math Lab Manual
NAME _________________________________________ DATE ______________ PERIOD ____C
opyright ©G
lencoe/McG
raw-H
ill, a division of The M
cGraw
-Hill C
ompanies, Inc.
Lab 41 Rates of Diffusion of GasesTeaching Suggestions (continued)
• Disposal: All solutions, water, and excess acid should be mixedtogether to neutralize. The waste solution should be collected in apolyethylene dishpan or similar container devoted to that purpose.Retain the solutions until the end of the period or day. In the fumehood, set up a hot plate with a 1-L or 2-L beaker. Pour the collectedsolutions into the beaker. Turn the hot plate on low and allow thebeaker to heat with the hood running and the hood door closed. Theliquids and volatiles in the mixture will evaporate, leaving driedchemicals. Allow the beaker to cool. Continue to add solutions andwaste until the beaker is �
23
� full. Treat the waste as heavy metalwaste. Dispose of the beaker and its dry contents in an approvedmanner. Soak the swabs in water before disposing of them. Thestraws can be discarded without any treatment.
• Provide students with the molecular mass of HCl and NH3 listed below.
1. Distance NH3 moved 18 cm 2. Distance HCl moved 11 cm3. Molecular mass of NH3 17 g/mole 4. Molecular mass of HCl
36 g/mole
(Sample data are used.)
5. The ratio is , or 1.64.
� � �1181 c
cmm
� � 1.64�6. Using the information from #1, ��� 1.64. Thus,
� 1.642 � 2.7.
Using the known values, � �3167� � 2.1.
7. (Students should be able to hypothesize that the lighter gas, NH3,will diffuse faster than the heavier gas, HCl.) The molecules of NH3had the greater velocity. The molecules of HCl have the greatermass. Lighter molecules move faster than more massive ones.
8. The distance a gas moves is inversely proportional to the square rootof the mass of gas molecules; the greater the mass of the molecules,the smaller the distance the molecules move in a given time.
Hydrogen gas is the most abundant element in the universe. Oxygengas is a relatively rare element in the universe. On Earth, hydrogenis never found uncombined. Oxygen makes up about one-fifth ofEarth’s atmosphere. Use Graham’s law to explain this differencebetween the two gases on Earth.
m2(HCl)��m1(NH3)
m2(HCl)��m1(NH3)
m2(HCl)��m1(NH3)
distance NH3 moved���distance HCl moved
18�11
d1�d2

Introduction
Materials
Objectives
Procedure
Lab 41 179 Science and Math Lab Manual
NAME _________________________________________ DATE ______________ PERIOD _____
Rates of Diffusion of GasesStudent Worksheet
Lab
41
Cop
yrig
ht ©
Gle
ncoe
/McG
raw
-Hill
, a
divi
sion
of T
he M
cGra
w-H
ill C
ompa
nies
, In
c.
Lab 41
Even if you are in another room, you can tell when someone has sliced alemon or an onion in the kitchen because particles of the lemon or onionmove through the air. This movement of particles of one substancethrough another medium (in this case, lemon or onion particles throughair) is called diffusion. While all particles have the same kinetic energy(KE) at a given temperature, not all particles diffuse at the same rate.Heavier particles move more slowly than lighter particles.
KE � mv2
where m equals mass and v equals velocity.
Graham’s law states that if two gases are under the sametemperature and pressure, the rates of diffusion of those gases will beinversely proportional to the square root of the ratio of their masses.
� ��In this lab, you will observe a reaction between two gases and useinverse relations to determine the relationship between molecularmass and rate of diffusion.
• Measure the distances two gases move.• Use inverse relations to calculate the masses and velocities of two
gases.• Compare the two ratios.
• goggles • tightly stoppered test tube with HClsolution
• apron • tightly stoppered test tube with NH3 solution
• clear plastic straws (2) • double-ended cotton swab (1)• one-hole rubber stoppers (2) • 250-mL beaker (1)• metric ruler (1) • clear tape• scissors
1. Be sure to wear safety goggles and a lab apronduring this experiment. Caution: ConcentratedHCl and NH3 burn the skin and damage clothing. NH3turns the skin black. Handle both liquids with care.If spills occur, notify your teacher immediately.
2. Cut one straw and push it into the other asshown at the right. Cover the joint of the strawswith clear tape.
3. Fill a 250-mL beaker half full with tap water.
m2�m1
v1�v2
1�2
Cut
Join by pushing together. Then tape.
Tape

Analysis
Data and Observations
Lab 41 180 Science and Math Lab Manual
NAME _________________________________________ DATE ______________ PERIOD ____C
opyright ©G
lencoe/McG
raw-H
ill, a division of The M
cGraw
-Hill C
ompanies, Inc.
Lab 41 Rates of Diffusion of GasesStudent Worksheet (continued)
4. Cut a double-ended cotton swab in half and mounteach half in a one-hole rubber stopper as shown atthe right. Make sure both swabs extend the samelength from the stoppers.
5. Attach the joined straws to the lab table with twopieces of clear tape. Label one end HCl and theother end NH3.
6. Remove the stoppers from test tubes. Replace thesolid stoppers with the one-hole stoppers holding the swabs.
7. Gently swirl the tubes to wet the tips of the swabs. Be careful notto wet the stoppers. Remove stoppers with swabs from the testtubes and replace them with the solid stoppers.
8. Hold the swabs by the stoppers and insert the swabs into oppositeends of the joined straws at the same time. Be sure you matcheach swab with the appropriate label at the end of the straw.
9. Do not disturb the straw or the swabs while the reaction takesplace. (It may take 3 to 5 minutes.) When the HCl and NH3 com-bine, they react to form a white substance. You will observe a whitering at the point on the straws where the HCl and NH3 meet.
10. Use a marker to mark the straw at the site of the reaction.11. Mark the straw to locate the tip of each cotton swab.12. Remove the swabs from the straw and place them in the beaker
of water.13. Measure the distances from the point of the end of each swab to
the mark for the reaction ring. Record these distances in the Dataand Observations section.
14. Check with your teacher on the disposal of all materials.
1. Distance NH3 moved cm 2. Distance HCl moved cm
3. Molecular mass of NH3 g/mole 4. Molecular mass of HCl g/mole
5. Since both gases moved through the straw in the same amount oftime, substitute the distance (d) each gas moves for the velocity ofthe gas,
� ��. Calculate the ratio of the rates of diffusion.
6. What is the ratio of the mass of HCl and NH3? Compare yourexperimental ratio with the ratio of molecular mass. How close isyour experimental value?
7. Which molecules had the greater velocity? greater mass?
8. Describe in words how m and d are in inverse variation.
m2�m1
d1�d2
Cut
Objectives
Materials
Recommended Time
Teaching the Lab
Lab 42 181 Science and Math Lab Manual
NAME _________________________________________ DATE ______________ PERIOD _____
Determining the Order of a Chemical ReactionTeaching Suggestions
Lab
42
Cop
yrig
ht ©
Gle
ncoe
/McG
raw
-Hill
, a
divi
sion
of T
he M
cGra
w-H
ill C
ompa
nies
, In
c.
Lab 42
• Measure the effect of a reactant concentration on the reaction rate.• Calculate the natural logarithms and inverses of a reactant’s
concentration.• Graph data for one reactant and use them to deduce the reaction
order.
2 class periods
• 0.15M Na2S2O3 (Dissolve 37.2 g of Na2S2O3 � 5H2O in enough waterto give 1 L of solution.)
• 6M HCl (Add 500 mL of concentrated HCl to 400 mL of distilledwater and then dilute to give 1 L of solution.)
• aprons (30)• goggles (30)• 96-well microplates (15)• microtip pipets (45)• distilled water
• Caution students to be very careful when handling HCl—itis extremely corrosive! Do not allow the solution to comeinto contact with skin or clothing. If contact does occur,rinse with plenty of water. If the acid contacts skin, applysolid NaHCO3 to neutralize the acid.
• Before proceeding, be sure students have read and understood thepurpose, procedure, and safety precautions for this laboratory activity.
• Have students work in pairs. The lab should take 2 class periods,but students will likely need additional time to complete thecalculations and graphs.
• One or more of the lower concentrations of thiosulfate solution inPart 1 (wells A1 through A3) may be skipped to save time. Thereactions in these wells often take 10–12 minutes to showobliteration of the x.
• Remind students to remove the reacted solutions from the wellsimmediately after the reaction has been timed. Remind them not towait until the entire experiment has been completed to remove theused reaction mixtures. If they wait, it will be impossible to get thereaction mixture out of the microplate.
• Collect pipets students have used to withdraw liquid from eachwell. Dispose of chemicals in accordance with local, state, andfederal regulations.
• white paper• clock or watch with second hand,
or stopwatch• paper towels• solid NaHCO3
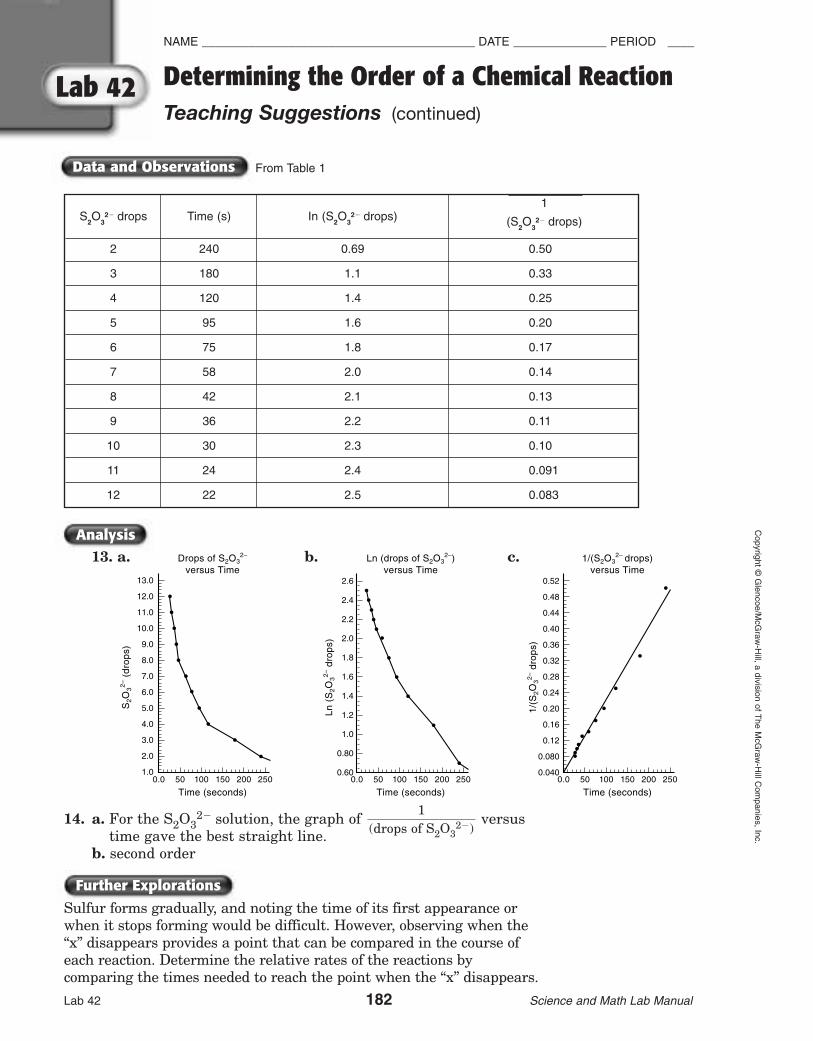
Data and Observations
Further Explorations
Analysis
Lab 42 182 Science and Math Lab Manual
NAME _________________________________________ DATE ______________ PERIOD ____C
opyright ©G
lencoe/McG
raw-H
ill, a division of The M
cGraw
-Hill C
ompanies, Inc.
Lab 42 Determining the Order of a Chemical ReactionTeaching Suggestions (continued)
0.0
13.0
12.0
11.0
10.0
9.0
8.0
7.0
6.0
5.0
4.0
3.0
2.0
1.050 100 150 200 250
S2O
32– (
drop
s)
Time (seconds)
Drops of S2O32–
versus Time
0.0
2.6
2.4
2.2
2.0
1.8
1.6
1.4
1.2
1.0
0.80
0.6050 100 150 200 250
Ln (
S2O
32– d
rops
)
Time (seconds)
Ln (drops of S2O32–)
versus Time
0.0
0.52
0.48
0.44
0.40
0.36
0.32
0.28
0.24
0.20
0.16
0.12
0.080
0.04050 100 150 200 250
1/(S
2O32–
dro
ps)
Time (seconds)
1/(S2O32– drops)
versus Time
S2O
32� drops Time (s) In (S
2O
32� drops)
1
(S2O
32� drops)
2 240 0.69 0.50
3 180 1.1 0.33
4 120 1.4 0.25
5 95 1.6 0.20
6 75 1.8 0.17
7 58 2.0 0.14
8 42 2.1 0.13
9 36 2.2 0.11
10 30 2.3 0.10
11 24 2.4 0.091
12 22 2.5 0.083
Sulfur forms gradually, and noting the time of its first appearance orwhen it stops forming would be difficult. However, observing when the“x” disappears provides a point that can be compared in the course ofeach reaction. Determine the relative rates of the reactions bycomparing the times needed to reach the point when the “x” disappears.
13. a. b. c.
14. a. For the S2O32� solution, the graph of versus
time gave the best straight line. b. second order
1���(drops of S2O3
2�)
From Table 1

Introduction
Materials
Objectives
Procedure
Lab 42 183 Science and Math Lab Manual
NAME _________________________________________ DATE ______________ PERIOD _____
Determining the Order of a Chemical ReactionStudent Worksheet
Lab
42
Cop
yrig
ht ©
Gle
ncoe
/McG
raw
-Hill
, a
divi
sion
of T
he M
cGra
w-H
ill C
ompa
nies
, In
c.
Lab 42
In most cases, the concentrations of the reactants in a chemicalreaction affect how quickly the reaction takes place. The followingexpression describes the reaction rate in many reactions:
reaction rate � K(A)m(B)n
reaction rate � K(concentration of A)m(concentration of B)n
The order of the reaction, indicated by the exponents m and n,describes how the concentration of each reactant affects the rate. Theonly way to determine the order of a reaction is to experiment. Eachreactant must be tested separately. In this lab, you will test just onereactant in the following reaction:
S2O22�
(aq) � 2H�(aq)→ S(cr) � SO2(g) � H2O(l)
You will vary the concentration of S2O32� and keep the concentration
of H� constant. Then you will calculate natural logarithms andinverses of the concentrations of S2O3 against the time it takes for thereaction to occur. You will graph your data and use the shape of thegraph to determine the order of the reaction with respect to S2O3
2�.
• Measure the effect of a reactant concentration on the reaction rate.• Calculate the natural logarithms and inverses of a reactant’s
concentration.• Graph data for one reactant and use them to deduce the reaction
order.
• apron• goggles• 96-well microplate• microtip pipets (3)• distilled water• white paper• clock or watch with second hand, or stopwatch• paper towel• 0.15M Na2S2O3• 6M HCl
Caution: HCl is extremely corrosive. Wear goggles and anapron while completing this laboratory. Do not allow thissolution to come into contact with your skin or clothing. Ifcontact does occur, rinse the affected area with plenty ofwater. If the acid comes into contact with skin, apply solidNaHCO3 to neutralize the acid.

Lab 42 184 Science and Math Lab Manual
NAME _________________________________________ DATE ______________ PERIOD ____C
opyright ©G
lencoe/McG
raw-H
ill, a division of The M
cGraw
-Hill C
ompanies, Inc.
Lab 42 Determining the Order of a Chemical ReactionStudent Worksheet (continued)
1. Arrange your microplate so that the lettered rows are to the leftand the numbered columns are at the top. A series of increasinglymore concentrated S2O3
2� solutions will be prepared in row A.Wells in row B will contain a constant concentration of H�.
2. Add 1 drop of S2O32� to well A1. Add 2 drops of S2O3
2� solutionto well A2. Continue to add S2O3
2� solution to the wells in row A,increasing the amount added to each well by 1 drop, until you’veadded 12 drops to well A12.
3. Add 11 drops of distilled water to well A1. Continue to adddistilled water to the wells in row A, decreasing the amountadded to each well by 1 drop, until you’ve added 1 drop ofdistilled water to well A11. Do not add water to well A12.
4. Add 5 drops of HCl solution to each well in row B (wells B1through B12).
5. Write a small “x” on a sheet of white paper. Place well A12 overthe “x.” Be prepared to observe the well over the “x” and starttiming the reaction in seconds the moment the solution from rowB is added.
6. Draw up in a microtip pipet all of the solution in well B12. Addthe solution from well B12 to well A12. Start timing immediatelybut go on to step 7.
7. To thoroughly mix the two solutions, draw up the mixture in wellA12 and immediately return it to well A12.
8. Observe the mixture in well A12 from above. When the “x” is nolonger visible through the liquid, stop timing and record the timeelapsed in Table 1 in the Data and Observations section.
9. Withdraw all the liquid from well A12 in a pipet and give thepipet to your teacher to discard. Empty the well immediately, orclean-up will be impossible. Rinse well A12 with distilled waterfrom the pipet and discard the rinse water in the same way thatyou discarded the first solution.
10. Repeat steps 6 through 9 for each pair of wells A11–B11 throughA1–B1. Be sure to place the well with the reacting solutionsdirectly over the “x.”
11. Rinse the microplate with distilled water and dry it with a papertowel.

Data and Observations
Analysis
Lab 42 185 Science and Math Lab Manual
NAME ________________________________________ DATE ______________ PERIOD _____
Determining the Order of a Chemical ReactionStudent Worksheet (continued)
Lab
42
Cop
yrig
ht ©
Gle
ncoe
/McG
raw
-Hill
, a
divi
sion
of T
he M
cGra
w-H
ill C
ompa
nies
, In
c.
Lab 42
TABLE 1
12. Set up and complete Table 2, which should look like the examplebut have 12 rows. (For purposes of this experiment, take all datato two significant digits.)
Varying S2O32� with Constant H+
Well Number: A1 A2 A3 A4 A5 A6 A7 A8 A9 A10 A11 A12
S2O32� drops
Time (seconds)
Data from Table 1
S2O
32� drops Time (s) In (S
2O
32� drops)
1
S2O
32� drops
1
2
TABLE 2
13. Prepare the following graphs and draw the best-fitting line for each.
a. Plot time in seconds on the x-axis and drops of S2O32� solution on
the y-axis.
b. Plot time in seconds on the x-axis and the natural logarithm ofdrops of S2O3
2� solution on the y-axis.
c. Plot time in seconds on the x-axis and on they-axis.
1��drops of S2O3
2�

Lab 42 186 Science and Math Lab Manual
NAME ________________________________________ DATE ______________ PERIOD ____C
opyright ©G
lencoe/McG
raw-H
ill, a division of The M
cGraw
-Hill C
ompanies, Inc.
Lab 42 Determining the Order of a Chemical ReactionStudent Worksheet (continued)
14. Use the table below to deduce the order of the reaction forS2O3
2�.
a. Which of the three graphs for the S2O32� solution provided the
best straight line as its best-fit line?
b. What is the order of the reaction with respect to S2O32�?
Straight-line Graph Order
Drops vs. time Zero order
Natural log drops vs. time First order
1/drops vs. time Second order
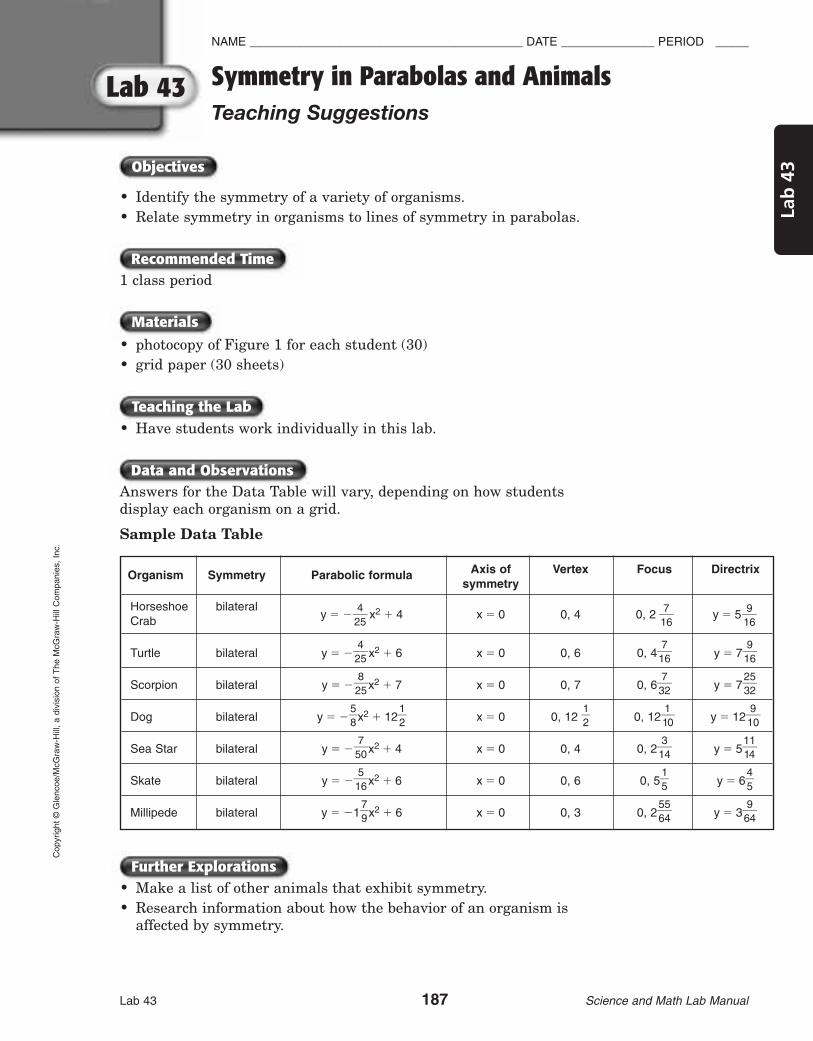
Objectives
Further Explorations
Data and Observations
Materials
Recommended Time
Teaching the Lab
Lab 43 187 Science and Math Lab Manual
NAME _________________________________________ DATE ______________ PERIOD _____
Symmetry in Parabolas and AnimalsTeaching Suggestions
Lab
43
Cop
yrig
ht ©
Gle
ncoe
/McG
raw
-Hill
, a
divi
sion
of T
he M
cGra
w-H
ill C
ompa
nies
, In
c.
Lab 43
• Identify the symmetry of a variety of organisms.• Relate symmetry in organisms to lines of symmetry in parabolas.
1 class period
• photocopy of Figure 1 for each student (30)• grid paper (30 sheets)
• Have students work individually in this lab.
Answers for the Data Table will vary, depending on how studentsdisplay each organism on a grid.
Sample Data Table
• Make a list of other animals that exhibit symmetry.• Research information about how the behavior of an organism is
affected by symmetry.
Organism Symmetry Parabolic formula Axis of Vertex Focus Directrixsymmetry
Horseshoe bilateraly � �2 2x2 � 4 x � 0 0, 4 0, 22 2 y � 52 2Crab
Turtle bilateral y � ��245�x2 � 6 x � 0 0, 6 0, 4�
176� y � 7�
196�
Scorpion bilateral y � ��285�x2 � 7 x � 0 0, 7 0, 6�
372� y � 7�
2352�
Dog bilateral y � ��58
�x2 � 12�12
� x � 0 0, 12 �12
� 0, 12�110� y � 12�
190�
Sea Star bilateral y � ��570�x2 � 4 x � 0 0, 4 0, 2�
134� y � 5�
1141�
Skate bilateral y � ��156�x2 � 6 x � 0 0, 6 0, 5�
15
� y � 6�45
�
Millipede bilateral y � �1�79
�x2 � 6 x � 0 0, 3 0, 2�5654� y � 3�
694�
�176� �
196��
245�
Introduction
Materials
Objectives
Procedure
Lab 43 188 Science and Math Lab Manual
NAME ________________________________________ DATE ______________ PERIOD ____C
opyright ©G
lencoe/McG
raw-H
ill, a division of The M
cGraw
-Hill C
ompanies, Inc.
Lab 43 Symmetry in Parabolas and AnimalsStudent Worksheet
Think of an imaginary line beginning at the top of your head, runningbetween your eyes, and continuing down the center of your body. Thepart of your body that is to the right of this line mirrors the part ofyour body to the left of it. Organisms that can be divided into mirror-image halves along a central plane are bilaterally symmetrical.Organisms with parts that radiate from a central point or from acentral axis have radial symmetry.
You can find many examples of symmetry in nature. You’veencountered symmetry in mathematics. Take another look atsymmetry as you do this lab.
• Identify the symmetry of a variety of organisms.• Relate symmetry in organisms to lines of symmetry in parabolas.
• photocopy of Figure 1 (1)• grid paper (1)
1. Study the organisms drawn in Figure 1. Identify the type ofsymmetry that characterizes each organism’s body plan and recordit in the Data Table. Draw a line through the center of eachorganism to help you make the identifications.
2. Use the following information to categorize the organisms. Thenrecord your observations in the Data Table.
• Can the organism be divided along any plane into roughly equalhalves? If so, classify the organism as radially symmetrical.
• Can the organism be divided along only one line going throughits center to form mirror-image halves? Then the organism isbilaterally symmetrical.
3. Display each of the organisms in Figure 1 as a parabola. Carefullycut out each drawing and place it on grid paper. Place theorganism’s line of symmetry along the y-axis with the widesthorizontal part along the x-axis. Label the uppermost point on they-axis the vertex, and draw a parabola that curves around theorganism. Repeat this procedure for the rest of the organisms inFigure 1.
4. Determine a formula for the parabolas and record each formula inthe Data Table. Identify the axis of symmetry, the vertex, thefocus, and the directrix.

Lab 43 189 Science and Math Lab Manual
NAME ________________________________________ DATE ______________ PERIOD _____
Symmetry in Parabolas and AnimalsStudent Worksheet (continued)
Lab
43
Cop
yrig
ht ©
Gle
ncoe
/McG
raw
-Hill
, a
divi
sion
of T
he M
cGra
w-H
ill C
ompa
nies
, In
c.
Lab 43
Lab
43
horseshoe crab
skate
millipede
turtle
sea star
dog
scorpion
Figure 1

Data and Observations
Lab 43 190 Science and Math Lab Manual
NAME _________________________________________ DATE ______________ PERIOD ____C
opyright ©G
lencoe/McG
raw-H
ill, a division of The M
cGraw
-Hill C
ompanies, Inc.
Lab 43 Symmetry in Parabolas and AnimalsStudent Worksheet (continued)
DATA TABLE
Organism Symmetry Parabolic formula Axis of Vertex Focus Directrixsymmetry
HorseshoeCrab
Turtle
Scorpion
Dog
Sea Star
Skate
Millipede
Objectives
Materials
Recommended Time
Preparations
Teaching the Lab
Lab 44 191 Science and Math Lab Manual
NAME _________________________________________ DATE ______________ PERIOD _____
Measuring Densities of PenniesTeaching Suggestions
Lab
44
Cop
yrig
ht ©
Gle
ncoe
/McG
raw
-Hill
, a
divi
sion
of T
he M
cGra
w-H
ill C
ompa
nies
, In
c.
Lab 44
• Use arithmetic series to predict the densities of groups of pennies.• Determine the densities of pennies minted before 1982.• Compare the densities of pennies minted before 1982 and after 1982.
1 class period
• 40 pre-1982 pennies (400)• balances (10)• 50-mL graduated cylinders (10)• paper towels (various amount available for drying and spills)• 20 colored pencils (2 different colors per group)
• Have students work in groups of three.• The zinc-core penny was minted for the first time in 1982, but not
all pennies of that year had the new composition. To ensure that all the more recent coins have the zinc core, avoid using 1982 and1983 coins.
• If you are unable to find 40 pre-1982 pennies for each group, youmight want to make up sets with fewer pennies or have groupsexchange coins.
• Masses of pennies will vary. Students should not evaluate densityon the basis of one determination of mass and one determination of volume.
• Volume should be measured with the smallest graduated cylinderthat has an internal diameter great enough to allow free passage of the coins.
• If necessary, remind students that the value they obtain for theslope of each graph line is equivalent to the value for density.
�Density � �vmolu
asmse
� � g/mL�• Inaccuracy in measuring volume is most likely when few coins are
used. This is the reason that no fewer than five coins are used atonetime. If a graphing program is available, its use in preparinggraphs and finding the slope of graph lines will help to minimizethe effects of measurement errors.
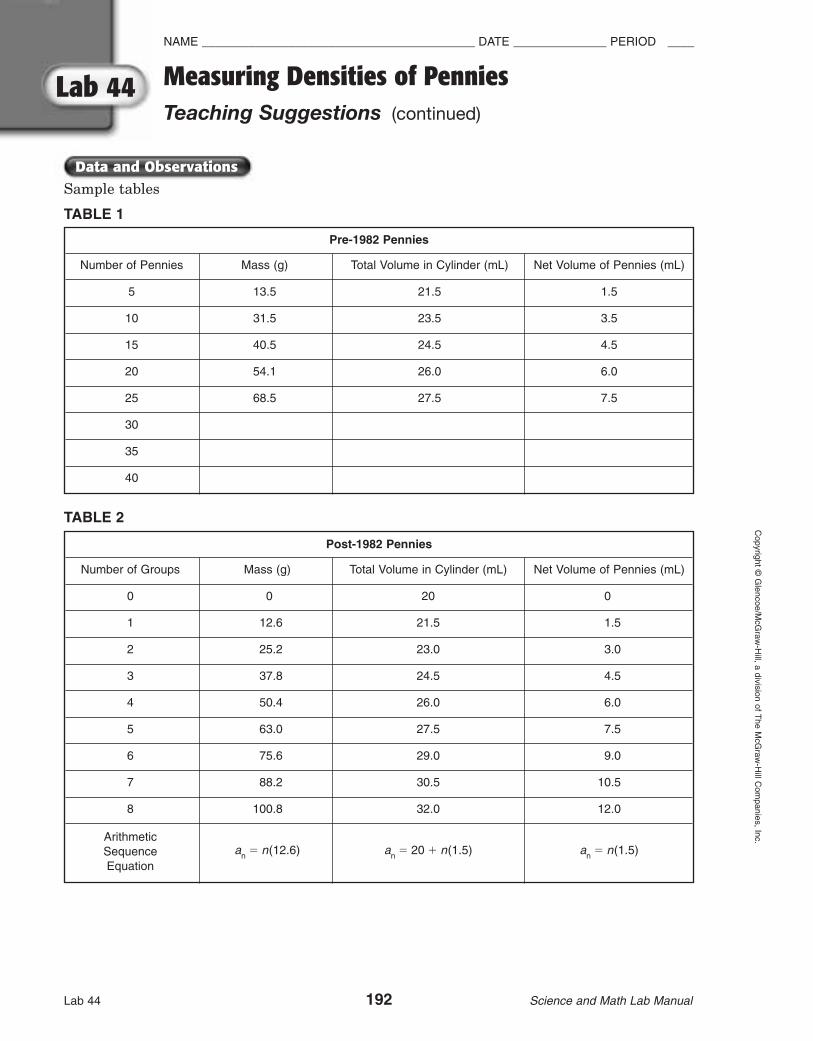
Data and Observations
Lab 44 192 Science and Math Lab Manual
NAME _________________________________________ DATE ______________ PERIOD ____C
opyright ©G
lencoe/McG
raw-H
ill, a division of The M
cGraw
-Hill C
ompanies, Inc.
Lab 44 Measuring Densities of PenniesTeaching Suggestions (continued)
Sample tables
TABLE 1
TABLE 2
Pre-1982 Pennies
Number of Pennies Mass (g) Total Volume in Cylinder (mL) Net Volume of Pennies (mL)
5 13.5 21.5 1.5
10 31.5 23.5 3.5
15 40.5 24.5 4.5
20 54.1 26.0 6.0
25 68.5 27.5 7.5
30
35
40
Post-1982 Pennies
Number of Groups Mass (g) Total Volume in Cylinder (mL) Net Volume of Pennies (mL)
0 0 20 0
1 12.6 21.5 1.5
2 25.2 23.0 3.0
3 37.8 24.5 4.5
4 50.4 26.0 6.0
5 63.0 27.5 7.5
6 75.6 29.0 9.0
7 88.2 30.5 10.5
8 100.8 32.0 12.0
ArithmeticSequence an � n(12.6) an � 20 � n(1.5) an � n(1.5)Equation

Analysis
Further Explorations
Lab 44 193 Science and Math Lab Manual
NAME ________________________________________ DATE ______________ PERIOD _____
Measuring Densities of PenniesTeaching Suggestions (continued)
Lab
44
Cop
yrig
ht ©
Gle
ncoe
/McG
raw
-Hill
, a
divi
sion
of T
he M
cGra
w-H
ill C
ompa
nies
, In
c.
Lab 44
Lab
44
1.–2.
3. Both graphs give a linear relationship between the mass of thepennies and the volume of the pennies. The graphs differ in theslopes of the lines.
4. Answers will vary but the slope of the line for the pre-1982 penniesshould approximate the value for the density of copper (8.92 g/mL).Using the sample data, the slope is 9.17. The slope of the line forthe post-1982 pennies should approximate the value for the densityof zinc (7.14 g/mL). Using the sample data, the slope is 7.83.
5. The values represent the mass of the coins per unit volume (mL),or density.
6. The density of copper is 8.92 g/mL. The slopes students find forthis line will vary but should be closer to the density of copperthan the slopes they find for the post-1982 coins.
Archimedes, a Greek mathematician and inventor of the second century b.c., was commissioned by the king of Syracuse to find outwhether a crown that had been made for the king was fashioned frompure gold or from a mixture of gold and silver, a less expensive metal.Archimedes could not use chemical tests, for they would damage thecrown, yet he was able to find the answer to the king’s question. Howdid he carry out the king’s request?
(Knowing that gold is denser than silver, Archimedes reasoned that agiven mass of gold would have a smaller volume than would an equalmass of silver or mixture of gold and silver. Suddenly realizing thatwater displacement is a means of determining volume, Archimedesused this method to compare the volume of the crown with the volumeof an equal mass of gold. Because the crown displaced more waterthan pure gold, Archimedes knew the crown was not pure gold.)
0 1 2 3 4 5 6 7 8 90
10
20
30
40
50
60
70
Mas
s (g
)
Volume (mL)
Pre-1982 coins
Post-1983 coins

Introduction
Materials
Objectives
Procedure
Lab 44 194 Science and Math Lab Manual
NAME ________________________________________ DATE ______________ PERIOD ____C
opyright ©G
lencoe/McG
raw-H
ill, a division of The M
cGraw
-Hill C
ompanies, Inc.
Lab 44 Measuring Densities of PenniesStudent Worksheet
NAME _________________________________________ DATE ______________ PERIOD ____
Today’s penny is quite different from the penny of a decade ago. Before1982, pennies were made of an alloy of copper. Since then, they havebeen made with an outside coating of copper and an inner core of adifferent metal. Differences in the composition of the pennies haveresulted in different characteristics, including density, or mass per unitof volume. In this experiment, you will determine and compare thedensities of pennies minted before and after 1982, and use your data totry to identify the metal used in the core of pennies minted after 1982.
• Use arithmetic series to predict the densities of groups of pennies.• Determine the densities of pennies minted before 1982.• Compare the densities of pennies minted before 1982 and after 1982.
• 40 pre-1982 pennies • 50-mL graduated cylinder• paper towels • 2 different colored pencils• balance
A. Mass1. Find the mass of 5 pennies. Record the mass in Table 1 in the
Data and Observations Section.2. Add 5 more pennies to the first group and obtain the mass of
these 10 pennies. Record the mass.3. Repeat step 2, each time adding 5 more pennies to those already
on the balance, until you have used all 40 pennies.B. Volume4. Fill a 50-mL graduated cylinder to the 20-mL mark with water. Be
sure to use the bottom of the meniscus to measure the water level.5. Still working with the same set of 40 pennies, gently drop 5 of the
pennies into the graduated cylinder. Record the new water levelin Column 2 of Table 1.
6. Add 5 more pennies to the graduated cylinder, making a total of10 pennies. Record the water level in the table.
7. Add 5 more pennies to the cylinder and record the water level.8. Repeat step 7 until you have added all 40 pennies of the set to the
cylinder. Record the volume after each addition.9. Discard the water. Dry the pennies with a paper towel and either
pass them to another group to use or give them to your teacher.10. Find the net volume of each group of pennies by subtracting 20
mL from the total volume recorded for each group (column 3).Enter the net volume for each group in column 4 of Table 1.

Data and Observations
11. Table 2 lists information for post-1982 pennies. The data incolumns 2–4 follow an arithmetic sequence. For each column,determine the equation that represents the arithmetic sequenceshown. Record the equations at the bottom of Table 2.
12. Using the data in Table 2, predict the mass, total volume, and netvolume for 6, 7, and 8 groups of pennies. Record your data in Table 2.
TABLE 1
TABLE 2
Post-1982 Pennies
Number of Groups Mass (g) Total Volume in Cylinder (mL) Net Volume of Pennies (mL)
0 0 20 0
1 12.6 21.5 1.5
2 25.2 23.0 3.0
3 37.8 24.5 4.5
4 50.4 26.0 6.0
5 63.0 27.5 7.5
6
7
8
ArithmeticSequence Equation
Pre-1982 Pennies
Number of Pennies Mass (g) Total Volume in Cylinder (mL) Net Volume of Pennies (mL)
5
10
15
20
25
30
35
40
Lab 44 195 Science and Math Lab Manual
NAME ________________________________________ DATE ______________ PERIOD _____
Measuring Densities of PenniesStudent Worksheet (continued)
Lab
44
Cop
yrig
ht ©
Gle
ncoe
/McG
raw
-Hill
, a
divi
sion
of T
he M
cGra
w-H
ill C
ompa
nies
, In
c.
Lab 44

Analysis
Lab 44 196 Science and Math Lab Manual
NAME ________________________________________ DATE ______________ PERIOD ____C
opyright ©G
lencoe/McG
raw-H
ill, a division of The M
cGraw
-Hill C
ompanies, Inc.
Measuring Densities of PenniesStudent Worksheet (continued)
1. Construct a graph of your results. Using a colored pencil, plot thedata for the pre-1982 pennies first. Let the y-axis reflect the massof the pennies. Plot the net volume of the pennies on the x-axis.Then draw the best-fitting straight line (the straight line that connects as many points as possible).
2. On the same graph, plot the data for the post-1982 pennies using a different colored pencil. Draw the best-fitting straight line.
3. How do the graphs compare? Describe their similarities anddifferences.
4. Find the slope of each line.
Slope: pre-1982 pennies
Slope: post-1982 pennies
5. What do the slope values represent?
6. The density of copper is 8.92 g/mL. How does this value comparewith the slope of the line for the pre-1982 pennies?
Lab 44

Objectives
Materials
Recommended Time
Preparations
Teaching the Lab
Lab 45 197 Science and Math Lab Manual
NAME _________________________________________ DATE ______________ PERIOD _____
How Does Temperature Affect MealwormMetamorphosis?Teaching Suggestions
Lab
45
Cop
yrig
ht ©
Gle
ncoe
/McG
raw
-Hill
, a
divi
sion
of T
he M
cGra
w-H
ill C
ompa
nies
, In
c.
Lab 45
• Observe the four stages of the life cycle of the mealworm, Tenebrio.• Use the Texas Instruments Calculator-Based Laboratory 2 System
(CBL 2™) to measure temperature.• Conduct an experiment to test the effect of temperature on the
development of a mealworm from the pupa to the adult stage.• Determine the standard deviation for the number of days it takes an
adult mealworm to emerge at room temperature and at 30°C.
• 1 class period, then five minutes a day until all adult mealworms have emerged (about two weeks)
• samples of mealworms (egg, larva, pupa, adult) (8 of each)• CBL 2™ and compatible calculator with a unit-to-unit cable• mealworm pupae (of same age) (32) • stereomicroscopes (8)• wax marking pencils (8) • plastic vials (32)• foam plugs (32) • incubator (at 30°C)• TI temperature probe
• Start a large mealworm culture in a five-gallon bucket. Fill the bucket �12
� to �23
� full of bran meal. Place 25 to 30 mealworms, acquired from apet shop or biological supply house, in the bucket on top of the bran meal.Crinkle paper towels to cover the bran. Place 4 to 5 apple or potato slices on top of the paper towels. Change the slices every week or so.
• To ensure that each student’s pupae are the same age, culture the larvae until they pupate and collect the pupae daily. New pupae are white; they turn yellowish-brown as they mature.
• If you prefer, purchase mealworm larvae or pupae from a biological supply house.
• Have students work in groups of four.• After adult mealworms emerge and are recorded, students can add them
to the culture pail.• Students may be confused by the different names used for mealworms.
Tenebrio is the genus name. Mealworm and darkling beetle are commonnames for the same insect.
• If students need help in assembling the CBL 2™ system, you can referthem to the CBL 2™ System Guidebook.
197-200 SM L45-876070 6/30/06 1:56 PM Page 197
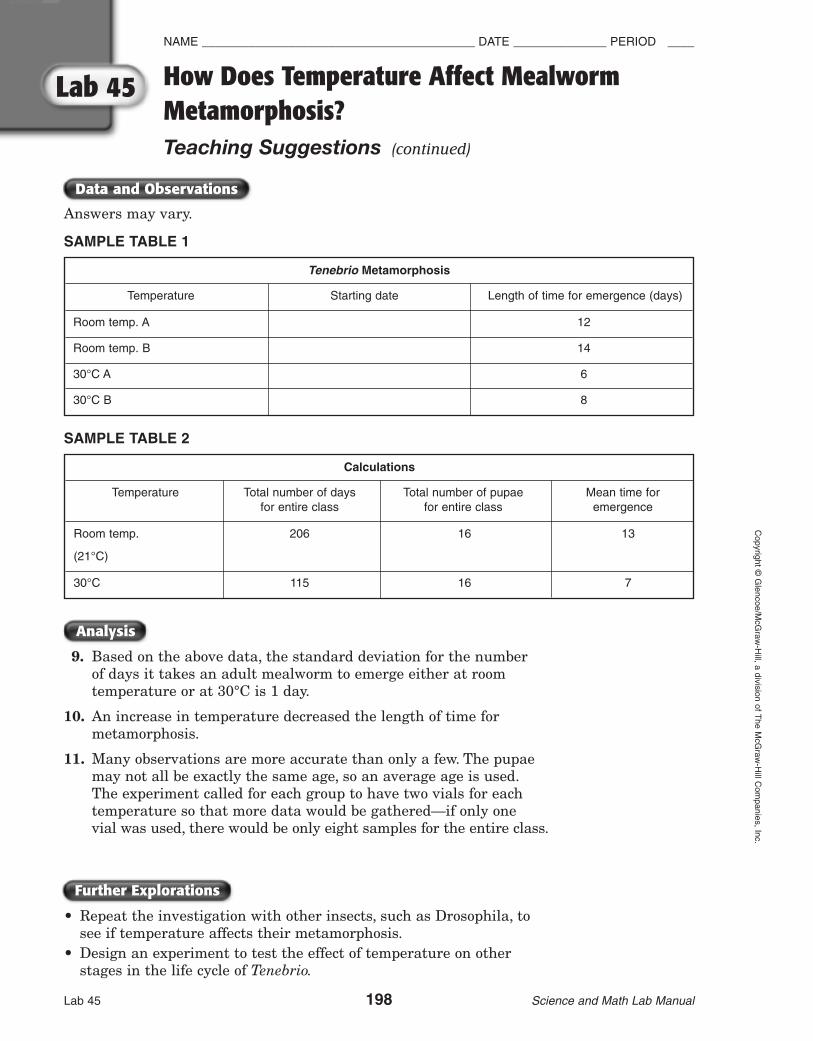
Further Explorations
Analysis
Data and Observations
Lab 45 198 Science and Math Lab Manual
NAME _________________________________________ DATE ______________ PERIOD ____C
opyright ©G
lencoe/McG
raw-H
ill, a division of The M
cGraw
-Hill C
ompanies, Inc.
Lab 45
Answers may vary.
SAMPLE TABLE 1
SAMPLE TABLE 2
9. Based on the above data, the standard deviation for the numberof days it takes an adult mealworm to emerge either at roomtemperature or at 30°C is 1 day.
10. An increase in temperature decreased the length of time formetamorphosis.
11. Many observations are more accurate than only a few. The pupaemay not all be exactly the same age, so an average age is used.The experiment called for each group to have two vials for eachtemperature so that more data would be gathered—if only onevial was used, there would be only eight samples for the entire class.
• Repeat the investigation with other insects, such as Drosophila, to see if temperature affects their metamorphosis.
• Design an experiment to test the effect of temperature on other stages in the life cycle of Tenebrio.
Tenebrio Metamorphosis
Temperature Starting date Length of time for emergence (days)
Room temp. A 12
Room temp. B 14
30°C A 6
30°C B 8
Calculations
Temperature Total number of days Total number of pupae Mean time for for entire class for entire class emergence
Room temp. 206 16 13
(21°C)
30°C 115 16 7
How Does Temperature Affect MealwormMetamorphosis?Teaching Suggestions (continued)
197-200 SM L45-876070 6/30/06 1:56 PM Page 198

Lab 45 199 Science and Math Lab Manual
NAME ________________________________________ DATE ______________ PERIOD _____
Lab
45
Cop
yrig
ht ©
Gle
ncoe
/McG
raw
-Hill
, a
divi
sion
of T
he M
cGra
w-H
ill C
ompa
nies
, In
c.
Lab 45
Introduction
Materials
Objectives
Procedure
Many living things exist in different forms throughout their life cycles.Metamorphosis is the process of changing from one form to another.Some insects, such as moths, mealworms, and beetles, undergocomplete metamorphosis, existing as egg, larva, pupa, and adult forms.The mealworm, Tenebrio, is an excellent insect for the study ofcomplete metamorphosis.
• Observe the four stages of the life cycle of the mealworm, Tenebrio.• Use the Texas Instruments Calculator-Based Laboratory 2 System
(CBL 2™) to measure temperature.• Conduct an experiment to test the effect of temperature on the
development of a mealworm from the pupa to the adult stage.• Determine the standard deviation for the number of days it takes an
adult mealworm to emerge at room temperature and at 30°C.
• samples of mealworms (egg, larva, pupa, adult)• mealworm pupae (of same age) (4)• wax marking pencil• stereomicroscope• plastic vials (4)• foam plugs (4)• incubator (at 30°C)• CBL 2™ compatible calculator with
a unit-to-unit cable• TI temperature probe
1. Examine samples of the four stages of mealworms under the stereomicroscope. Identifyeach sample using the chart of the life cycle of Tenebrio.
2. With your marking pencil, label the four plastic vials Room Temp. A, Room Temp. B, 30°CA, and 30°C B. These labels indicate the temperature at which the pupae will be stored.Label them also with your name (or group name) and the date.
3. Place one pupa in each of the four vials and stopper with foam rubber plugs. The foamplugs will allow the insects to breathe.
4. Store your vials at their proper temperatures with those of the rest of the class. Recordthe starting date in Table 1.
5. Set up your CBL 2™ system. Use the unit-to-unit link cable to connect the CBL 2™ unitto your calculator. Use the I/O port located on the bottom edge of the unit.
Egg
Adult
Larva
Pupa
How Does Temperature Affect MealwormMetamorphosis?Student Worksheet
197-200 SM L45-876070 6/30/06 1:56 PM Page 199

Lab 45 200 Science and Math Lab Manual
NAME ________________________________________ DATE ______________ PERIOD ____C
opyright ©G
lencoe/McG
raw-H
ill, a division of The M
cGraw
-Hill C
ompanies, Inc.
Lab xx
Lab
45
Data and Observations
Lab 45
6. Connect the temperature probe to Channel 1 (CH1) on the top edge of the CBL 2unit, and turn on the CBL unit and the calculator. Download or enter the HEATprogram from the disk accompanying the CBL 2™ Experiment Workbook orfrom the TI Web site. Take the room temperature and record it in Table 2.
7. Check your vials daily for the presence of adult mealworms. When you observe anadult in a vial, record in Table 1 the number of days needed for metamorphosis.Follow your teacher’s directions for disposing of mealworms.
8. When metamorphosis of all the mealworms is complete, compile the class dataand complete Table 2. Calculate the average time for emergence by dividing thetotal number of days by the total number of pupae.
TABLE 1
TABLE 2
9. Determine the standard deviation for the number of days it takes an adult mealworm to emerge at room temperature and at 30°C.
10. How did an increase in temperature affect the time needed for metamorphosis?
11. Why might the class mean be a more accurate measurement of the time for metamorphosis than your data alone? Why did the experimentcall for you to use two vials for each temperature?
Tenebrio Metamorphosis
Temperature Starting date Length of time for emergence (days)
Room temp. A
Room temp. B
30°C A
30°C B
Calculations
Temperature Total number of days Total number of pupae Mean time for for entire class for entire class emergence
Room temp. ( °C)
30°C
How Does Temperature Affect MealwormMetamorphosis?Student Worksheet (continued)
197-200 SM L45-876070 6/30/06 1:57 PM Page 200
Objectives
Materials
Recommended Time
Preparations
Teaching the Lab
Lab 46 201 Science and Math Lab Manual
NAME _________________________________________ DATE ______________ PERIOD _____
Wind Power and Box-and-Whisker PlotsTeaching Suggestions
Lab
46
Cop
yrig
ht ©
Gle
ncoe
/McG
raw
-Hill
, a
divi
sion
of T
he M
cGra
w-H
ill C
ompa
nies
, In
c.
Lab 46
• Construct a device to measure wind speed.• Measure the wind speed at different times during the day for a week.• Display measurements in a box-and-whisker plot.• Determine if wind is a good source of energy in your area.
2 class periods; students collect data three times a day over a one-week time period.
• stiff cardboard (10 sheets)• glue or paste• sheet of grid paper (10)• magic marker, any color (10)• needle, long enough to go through ball (10)• nylon line (10 pieces, 30 cm each)• table tennis ball (10)• scissors (10 pairs)
• Gather materials.• Check the area around the school building to find the best place for
students to take their measurements of wind speed.
• Have students work in groups of three or four, with students sharing thedata collection task.
• Students should work together to construct the wind speed device. Allgroup members should take the first set of measurements together so theyeach use the same technique in subsequent measurements. Verify thatstudents are holding their devices level when they collect their first set ofdata.
• Students should use care when coloring the nylon line so that they don’tinadvertently color the protractor.
201-206 SM L46-876070 6/30/06 2:03 PM Page 201

Data and Observations
Further Explorations
Analysis
Lab 46 202 Science and Math Lab Manual
NAME _________________________________________ DATE ______________ PERIOD ____C
opyright ©G
lencoe/McG
raw-H
ill, a division of The M
cGraw
-Hill C
ompanies, Inc.
Lab 46 Wind Power and Box-and-Whisker PlotsTeaching Suggestions (continued)
SAMPLE DATA TABLE
Sample responses
8. 13 13 13 13 13 13 16 16 16 16 19.2 19.2 19.2
9. 16
10. upper quartile, x � 17.6
lower quartile, x � 13
11. GV � 19.2
LV � 13
12.
13. Answers will vary. For the sample data provided, wind power would be apractical source of electricity because the speed of wind is constantlyabove 12.8 km/hr.
Have students find out more about how wind energy is converted to electricenergy. Ask them to research whether or not wind is a practical source ofenergy for your area.
Date/Time Wind Speed Wind Speed Date/Time Wind Speed Wind Speed (°) (km/hr) (°) (km/hr)
10 13 10 13
20 19.2 10 13
15 16 10 13
15 16 15 16
20 19.2 15 16
20 19.2 15 16
10 13 10 13
LVQ1 Q2 Q3 GV
14 15 16 17 18 19 19.213
201-206 SM L46-876070 6/30/06 2:03 PM Page 202
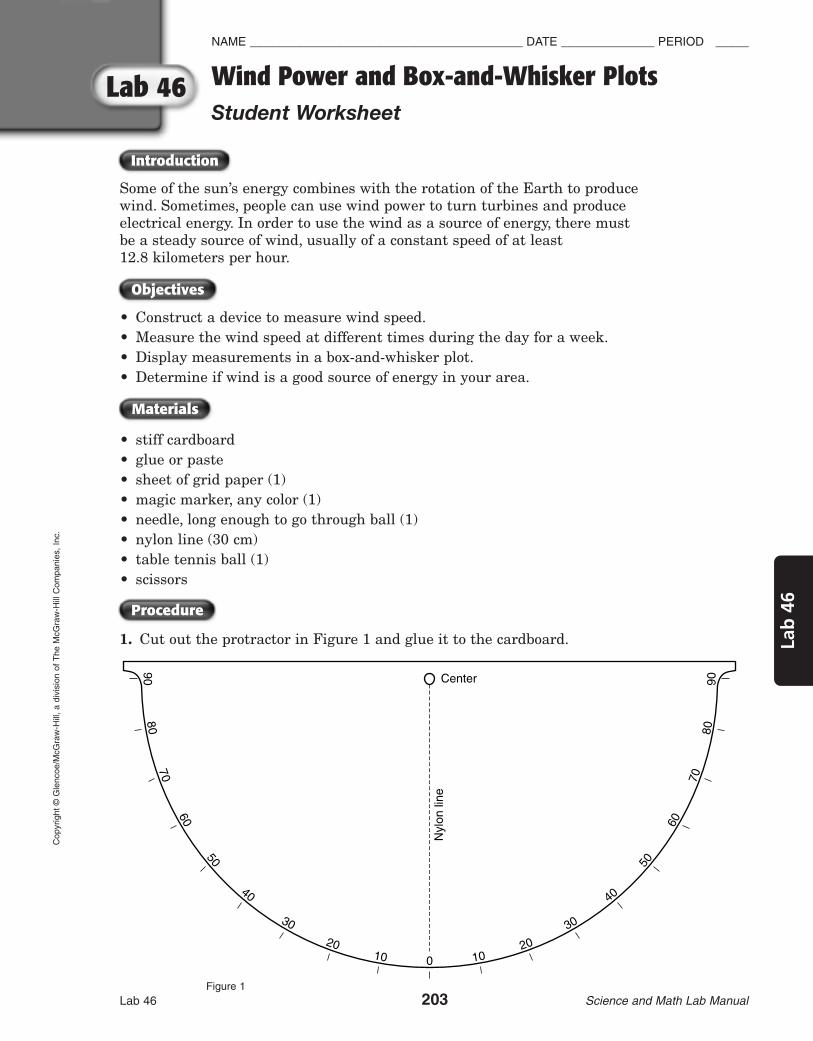
Introduction
Materials
Objectives
Procedure
Lab 46 203 Science and Math Lab Manual
NAME _________________________________________ DATE ______________ PERIOD _____
Wind Power and Box-and-Whisker PlotsStudent Worksheet
Lab
46
Cop
yrig
ht ©
Gle
ncoe
/McG
raw
-Hill
, a
divi
sion
of T
he M
cGra
w-H
ill C
ompa
nies
, In
c.
Lab 46
Some of the sun’s energy combines with the rotation of the Earth to producewind. Sometimes, people can use wind power to turn turbines and produceelectrical energy. In order to use the wind as a source of energy, there mustbe a steady source of wind, usually of a constant speed of at least12.8 kilometers per hour.
• Construct a device to measure wind speed.• Measure the wind speed at different times during the day for a week.• Display measurements in a box-and-whisker plot.• Determine if wind is a good source of energy in your area.
• stiff cardboard• glue or paste• sheet of grid paper (1)• magic marker, any color (1)• needle, long enough to go through ball (1)• nylon line (30 cm)• table tennis ball (1)• scissors
1. Cut out the protractor in Figure 1 and glue it to the cardboard.
0
Center
Nyl
on li
ne
1020
30
40
50
60
7080
90
1020
30
40
50
60
7080
90
Figure 1
201-206 SM L46-876070 6/30/06 2:03 PM Page 203

Lab 46 204 Science and Math Lab Manual
NAME _________________________________________ DATE ______________ PERIOD ____C
opyright ©G
lencoe/McG
raw-H
ill, a division of The M
cGraw
-Hill C
ompanies, Inc.
Lab 46 Wind Power and Box-and-Whisker PlotsStudent Worksheet (continued)
2. Thread the nylon line through the needle and pull the thread through thecenter of the table tennis ball.
3. Tie a knot in the end of the nylon line and glue it to the ball. Glue thefree end of the nylon line to the spot marked center on the protractor.
4. Color the nylon line with the magic marker.
5. Test the device by setting it alongside the edge of a flat surface. If it islevel, the line should cover the 0° mark.
6. Select the windiest area around the school to measure the wind speed.Hold the device level and face the wind. Allow the wind to move the tabletennis ball. See Figure 2. The angle made by the nylon line will be thewind speed in degrees. Measure the angle to the nearest 5° and record itin the Data Table.
7. Use the Conversion Table to convert your angle measure to km/hr. Write the converted measure in the Data Table.
Wind direction
Figure 2
201-206 SM L46-876070 6/30/06 2:03 PM Page 204

Data and Observations
Lab 46 205 Science and Math Lab Manual
NAME ________________________________________ DATE ______________ PERIOD _____
Wind Power and Box-and-Whisker PlotsStudent Worksheet (continued)
Lab
46
Cop
yrig
ht ©
Gle
ncoe
/McG
raw
-Hill
, a
divi
sion
of T
he M
cGra
w-H
ill C
ompa
nies
, In
c.
Lab 46
DATA TABLE
CONVERSION TABLE
Angle km/hr
0 0.0
5 9.6
10 13.0
15 16.0
20 19.2
25 20.8
30 24.0
35 25.6
40 28.8
45 32.0
50 33.6
55 36.8
60 41.6
65 46.4
70 52.8
Date/Time Wind Speed Wind Speed Date/Time Wind Speed Wind Speed (°) (km/hr) (°) (km/hr)
201-206 SM L46-876070 6/30/06 2:03 PM Page 205

Analysis
Lab 46 206 Science and Math Lab Manual
NAME ________________________________________ DATE ______________ PERIOD ____C
opyright ©G
lencoe/McG
raw-H
ill, a division of The M
cGraw
-Hill C
ompanies, Inc.
Lab 46 Wind Power and Box-and-Whisker PlotsStudent Worksheet (continued)
8. Arrange your data in numerical order.
9. Find the median for your data.
10. Find the quartiles for your data.
11. Find the upper and lower extreme values for your data.
12. Draw a box-and-whisker plot for your data.
13. Use your data to analyze whether or not your area would be a good areafor using wind to produce electricity.
201-206 SM L46-876070 6/30/06 2:03 PM Page 206

© Glencoe/McGraw-Hill 207 Science and Mathematics Lab Manual
PROGRAM:PH{6,0/}→L1:Send(L1)1→Xmin:2→Xmax:1→Ymin:2→YmaxGridOffAxesOffLabelOffPlotsOff FnOff ClrDrawText(1,16,"TEXAS INSTRUMENTS")Text(8,30/,"CBL SYSTEM")Text(15,10/,"EXPERIMENT WORKBOOK")Text(29,36,"PH V2.0/")Text(36,3,"(EXPERIMENT C1,C2,C4,C5)")Text(50/,6,"PRESS [ENTER] ON TI-83"Pause ClrHomeDisp "TURN ON THE CBL."Output(4,10/,"[ENTER]")Pause FullClrHomeDisp "NOW CHECKING THE"Disp "CALCULATOR-CBL"Disp "LINK CONNECTION."Disp "PLEASE WAIT...."{1,0/}→L1
Send(L1){0/}→L2
Lbl M{7}→L1
Send(L1)Get(L2)If dim(L2)�1 and L2(1)�0/ThenClrHomeDisp "***LINK ERROR***"Disp "PUSH IN THE LINK"Disp "CORD CONNECTORS"Disp "FIRMLY THEN HIT"Disp "[ENTER]."Pause Goto MEndDisp ""Output(6,1," STATUS: O.K."Output(8,10/,"[ENTER]")Pause FuncClrHomeClrDraw
AxesOn�5→Xmin50/→Xmax5→Xscl�2→Ymin14→Ymax1→YsclClrList L4,L5
ClrHome{6,0/}→L1
Send(L1){1,0/}→L1
Send(L1){4,1,1,1,13.662,�3.80/7}→L1
Send(L1){1,1,1,0/,0/,1}→L1
Send(L1)ClrDrawLbl LClrHomeDisp "ENTER NUMBER"Disp "OF SAMPLES"Input CIf C � 1 or C ≠ int(C):Goto LC→dim(L4
ClrHome{3,0/,�1,6}→L1
Send(L1)Disp "PLEASE ALLOW"Disp "SYSTEM 30/"Disp "SECONDS TO"Disp "WARM UP"Output(6,10/,"[ENTER]")Pause ClrHomeDisp "PRESS TRIGGER"Disp "TO COLLECT"Disp "PH READINGS"For(I,1,C,1)Get(L4(I))Disp "ML?"Input DD→L5(I)Pt-On(L5(I),L4(I))Endmax(L5)→Xmax(�.1)*Xmax→XminPlot1(xyLine,L5,L4�)Text(7,1,"P")Text(14,1,"H")Text(55,78,"ML")
Appendix: TI-83/84 Programs
207-214 SM APP-876070 6/30/06 2:00 PM Page 207
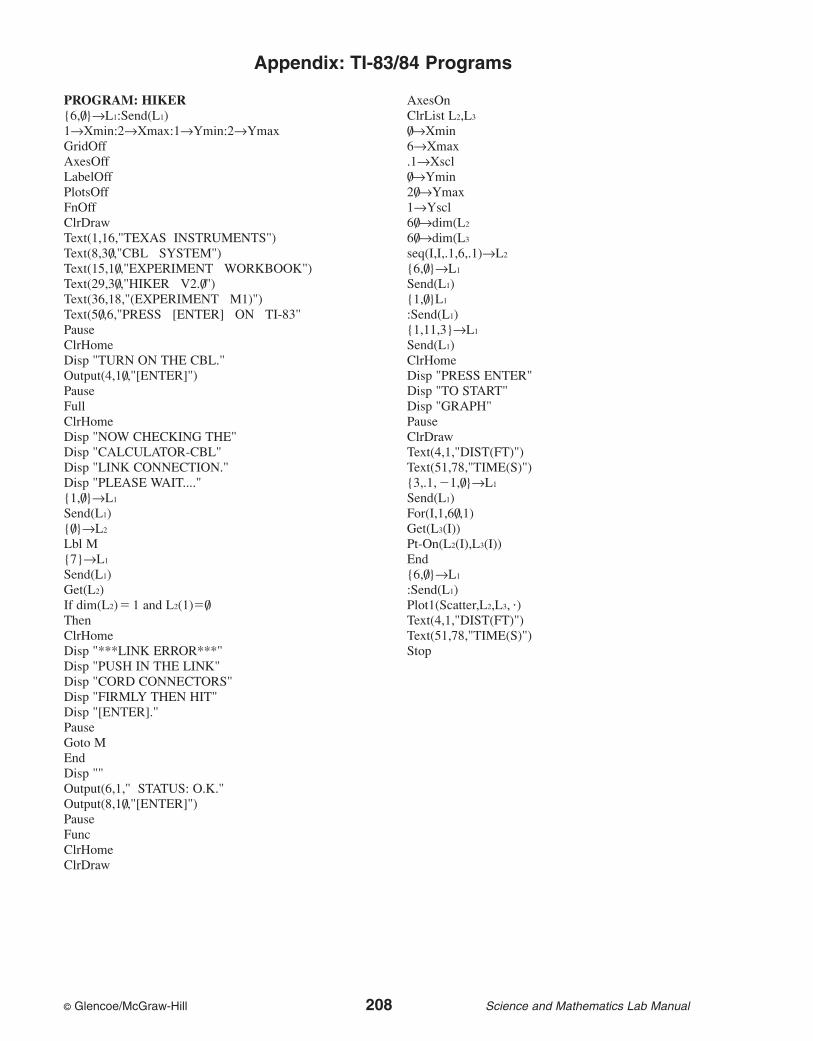
PROGRAM: HIKER{6,0/}→L1:Send(L1)1→Xmin:2→Xmax:1→Ymin:2→YmaxGridOffAxesOffLabelOffPlotsOff FnOff ClrDrawText(1,16,"TEXAS INSTRUMENTS")Text(8,30/,"CBL SYSTEM")Text(15,10/,"EXPERIMENT WORKBOOK")Text(29,30/,"HIKER V2.0/")Text(36,18,"(EXPERIMENT M1)")Text(50/,6,"PRESS [ENTER] ON TI-83"Pause ClrHomeDisp "TURN ON THE CBL."Output(4,10/,"[ENTER]")Pause FullClrHomeDisp "NOW CHECKING THE"Disp "CALCULATOR-CBL"Disp "LINK CONNECTION."Disp "PLEASE WAIT...."{1,0/}→L1
Send(L1){0/}→L2
Lbl M{7}→L1
Send(L1)Get(L2)If dim(L2)� 1 and L2(1)�0/ThenClrHomeDisp "***LINK ERROR***"Disp "PUSH IN THE LINK"Disp "CORD CONNECTORS"Disp "FIRMLY THEN HIT"Disp "[ENTER]."Pause Goto MEndDisp ""Output(6,1," STATUS: O.K."Output(8,10/,"[ENTER]")Pause FuncClrHomeClrDraw
AxesOnClrList L2,L3
0/→Xmin6→Xmax.1→Xscl0/→Ymin20/→Ymax1→Yscl60/→dim(L2
60/→dim(L3
seq(I,I,.1,6,.1)→L2
{6,0/}→L1
Send(L1){1,0/}L1
:Send(L1){1,11,3}→L1
Send(L1)ClrHomeDisp "PRESS ENTER"Disp "TO START"Disp "GRAPH"Pause ClrDrawText(4,1,"DIST(FT)")Text(51,78,"TIME(S)"){3,.1, �1,0/}→L1
Send(L1)For(I,1,60/,1)Get(L3(I))Pt-On(L2(I),L3(I))End{6,0/}→L1
:Send(L1)Plot1(Scatter,L2,L3, �)Text(4,1,"DIST(FT)")Text(51,78,"TIME(S)")Stop
© Glencoe/McGraw-Hill 208 Science and Mathematics Lab Manual
Appendix: TI-83/84 Programs
207-214 SM APP-876070 6/30/06 2:00 PM Page 208

© Glencoe/McGraw-Hill 209 Science and Mathematics Lab Manual
PROGRAM: HEAT{6,0/}→L1:Send(L1)1→Xmin:2→Xmax:1→Ymin:2→YmaxGridOffAxesOffLabelOffPlotsOff FnOff ClrDrawText(1,16,"TEXAS INSTRUMENTS")Text(8,30/,"CBL SYSTEM")Text(15,10/,"EXPERIMENT WORKBOOK")Text(29,32,"HEAT V2.0/")Text(36,18,"(EXPERIMENTM5)")Text(50/,6,"PRESS [ENTER] ON TI-83"Pause ClrHomeDisp "TURN ON THE CBL."Output(4,10/,"[ENTER]")Pause FullClrHomeDisp "NOW CHECKING THE"Disp "CALCULATOR-CBL"Disp "LINK CONNECTION."Disp "PLEASE WAIT...."{1,0}→L1
Send(L1){0/}→L2
Lbl M{7}→L1
Send(L1)Get(L2)If dim(L2)=1 and L2(1)=0/ThenClrHomeDisp "***LINK ERROR***"Disp "PUSH IN THE LINK"Disp "CORD CONNECTORS"Disp "FIRMLY THEN HIT"Disp "[ENTER]."Pause Goto MEndDisp ""Output(6,1," STATUS: O.K."Output(8,10/,"[ENTER]")Pause FuncClrHomeClrDraw
AxesOnClrDrawClrList L3,L4
�10/→Ymin90/→Ymax10/→Yscl{6,0}→L1
Send(L1){1,0/}→L1
Send(L1){1,1,1}→L1
Send(L1)36→dim(L3
36→dim(L4
Lbl LClrHomeDisp "HOW MUCH TIME"Disp "BETWEEN POINTS"Disp "IN SECONDS?"Input TIf T ≤ 0/:Goto L�2*T→Xmin36*T→XmaxT→Xsclseq(I,I,T,36*T,T)→L3
ClrHomeDisp "PRESS ENTER"Disp "TO START"Pause ClrHome{3,T,�1,0/}→L1
Send(L1)For(I,1,36,1)Get(L4(I))Pt-On(L3(I),L4(I))EndClrHomePlot1(Scatter,L3,L4, � )DispGraphStop
Appendix: TI-83/84 Programs
207-214 SM APP-876070 6/30/06 2:00 PM Page 209

© Glencoe/McGraw-Hill 210 Science and Mathematics Lab Manual
Centimeter Grid
207-214 SM APP-876070 6/30/06 2:00 PM Page 210

207-214 SM APP-876070 6/30/06 2:00 PM Page 211

207-214 SM APP-876070 6/30/06 2:00 PM Page 212

207-214 SM APP-876070 6/30/06 2:00 PM Page 213

207-214 SM APP-876070 6/30/06 2:00 PM Page 214
Related Documents