UNITED STATES SECURITIES AND EXCHANGE COMMISSION Washington, D.C. 20549 FORM 10-K Í ANNUAL REPORT PURSUANT TO SECTION 13 OR 15(d) OF THE SECURITIES EXCHANGE ACT OF 1934 FOR THE FISCAL YEAR ENDED JUNE 30, 2013 OR ‘ TRANSITION REPORT PURSUANT TO SECTION 13 OR 15(d) OF THE SECURITIES EXCHANGE ACT OF 1934 FOR THE TRANSITION PERIOD FROM TO Commission file number 1-8300 WMS INDUSTRIES INC. (Exact name of registrant as specified in its charter) Delaware 36-2814522 (State or other jurisdiction of incorporation or organization) (I.R.S. Employer Identification Number) 800 South Northpoint Blvd., Waukegan, Illinois 60085 (Address of principal executive offices) (Zip Code) Registrant’s telephone number, including area code: (847) 785-3000 Securities registered pursuant to Section 12(b) of the Act: Title of each class Name of each Exchange on which registered Common Stock, $0.50 par value New York Stock Exchange Securities registered pursuant to Section 12(g) of the Act: None. Indicate by check mark if the registrant is a well-known seasoned issuer, as defined in Rule 405 of the Securities Act. Yes Í No ‘ Indicate by check mark if the registrant is not required to file reports pursuant to Section 13 or Section 15(d) of the Act. Yes ‘ No Í Indicate by check mark whether the registrant: (1) has filed all reports required to be filed by Section 13 or 15(d) of the Securities Exchange Act of 1934 during the preceding 12 months (or for such shorter period that the registrant was required to file such reports), and (2) has been subject to such filing requirements for the past 90 days. Yes Í No ‘ Indicate by check mark whether the registrant has submitted electronically and posted on its corporate website, if any, every Interactive Data File required to be submitted and posted pursuant to Rule 405 of Regulation S-T (§232.405 of this chapter) during the preceding 12 months (or for such shorter period that the registrant was required to submit and post such files). Yes Í No ‘ Indicate by check mark if disclosure of delinquent filers pursuant to Item 405 of Regulation S-K (§229.405 of this chapter) is not contained herein, and will not be contained, to the best of registrant’s knowledge, in definitive proxy or information statements incorporated by reference in Part III of this Form 10-K or any amendment to this Form 10-K. Í Indicate by check mark whether the registrant is a large accelerated filer, an accelerated filer, a non-accelerated filer, or a smaller reporting company. See the definitions of “large accelerated filer”, “accelerated filer” and “smaller reporting company” in Rule 12b-2 of the Exchange Act. (Check one): Large accelerated filer Í Accelerated filer ‘ Non-accelerated filer ‘ (Do not check if a smaller reporting company) Smaller reporting company ‘ Indicate by check mark whether the registrant is a shell company (as defined in Rule 12b-2 of the Exchange Act). Yes ‘ No Í The aggregate market value of the shares of common stock held by non-affiliates of the registrant as of the last business day of the second fiscal quarter ended December 31, 2012 was $939,716,707 based on the closing price of the common stock as reported on the New York Stock Exchange of $17.50 per share. For the purposes of this calculation, it is assumed that directors and executive officers of the registrant are affiliates. On August 26, 2013, the number of shares of common stock outstanding was 54,872,067 shares. Documents Incorporated By Reference: Portions of the Registrant’s definitive proxy statement for the annual meeting of stockholders to be held in 2013 are incorporated by reference in Part III of this Report.

Welcome message from author
This document is posted to help you gain knowledge. Please leave a comment to let me know what you think about it! Share it to your friends and learn new things together.
Transcript
UNITED STATESSECURITIES AND EXCHANGE COMMISSION
Washington, D.C. 20549
FORM 10-KÍ ANNUAL REPORT PURSUANT TO SECTION 13 OR 15(d) OF THE SECURITIES EXCHANGE
ACT OF 1934FOR THE FISCAL YEAR ENDED JUNE 30, 2013
OR‘ TRANSITION REPORT PURSUANT TO SECTION 13 OR 15(d) OF THE SECURITIES
EXCHANGE ACT OF 1934FOR THE TRANSITION PERIOD FROM TO
Commission file number 1-8300
WMS INDUSTRIES INC.(Exact name of registrant as specified in its charter)
Delaware 36-2814522(State or other jurisdiction of
incorporation or organization)(I.R.S. Employer
Identification Number)
800 South Northpoint Blvd., Waukegan, Illinois 60085(Address of principal executive offices) (Zip Code)
Registrant’s telephone number, including area code: (847) 785-3000
Securities registered pursuant to Section 12(b) of the Act:Title of each class Name of each Exchange on which registered
Common Stock, $0.50 par value New York Stock Exchange
Securities registered pursuant to Section 12(g) of the Act: None.
Indicate by check mark if the registrant is a well-known seasoned issuer, as defined in Rule 405 of the SecuritiesAct. Yes Í No ‘
Indicate by check mark if the registrant is not required to file reports pursuant to Section 13 or Section 15(d) of theAct. Yes ‘ No Í
Indicate by check mark whether the registrant: (1) has filed all reports required to be filed by Section 13 or 15(d) of the SecuritiesExchange Act of 1934 during the preceding 12 months (or for such shorter period that the registrant was required to file such reports), and(2) has been subject to such filing requirements for the past 90 days. Yes Í No ‘
Indicate by check mark whether the registrant has submitted electronically and posted on its corporate website, if any, everyInteractive Data File required to be submitted and posted pursuant to Rule 405 of Regulation S-T (§232.405 of this chapter) during thepreceding 12 months (or for such shorter period that the registrant was required to submit and post such files). Yes Í No ‘
Indicate by check mark if disclosure of delinquent filers pursuant to Item 405 of Regulation S-K (§229.405 of this chapter) is notcontained herein, and will not be contained, to the best of registrant’s knowledge, in definitive proxy or information statementsincorporated by reference in Part III of this Form 10-K or any amendment to this Form 10-K. Í
Indicate by check mark whether the registrant is a large accelerated filer, an accelerated filer, a non-accelerated filer, or a smallerreporting company. See the definitions of “large accelerated filer”, “accelerated filer” and “smaller reporting company” in Rule 12b-2 ofthe Exchange Act. (Check one):
Large accelerated filer Í Accelerated filer ‘
Non-accelerated filer ‘ (Do not check if a smaller reporting company) Smaller reporting company ‘
Indicate by check mark whether the registrant is a shell company (as defined in Rule 12b-2 of the Exchange Act). Yes ‘ No Í
The aggregate market value of the shares of common stock held by non-affiliates of the registrant as of the last business day of thesecond fiscal quarter ended December 31, 2012 was $939,716,707 based on the closing price of the common stock as reported on the NewYork Stock Exchange of $17.50 per share. For the purposes of this calculation, it is assumed that directors and executive officers of theregistrant are affiliates.
On August 26, 2013, the number of shares of common stock outstanding was 54,872,067 shares.
Documents Incorporated By Reference: Portions of the Registrant’s definitive proxy statement for the annual meeting ofstockholders to be held in 2013 are incorporated by reference in Part III of this Report.
TABLE OF CONTENTS
PART I . . . . . . . . . . . . . . . . . . . . . . . . . . . . . . . . . . . . . . . . . . . . . . . . . . . . . . . . . . . . . . . . . . . . . . . . . . . . . . . . 3Item 1. Business . . . . . . . . . . . . . . . . . . . . . . . . . . . . . . . . . . . . . . . . . . . . . . . . . . . . . . . . . . . . . . . . . . . . . . 3Item 1A. Risk Factors . . . . . . . . . . . . . . . . . . . . . . . . . . . . . . . . . . . . . . . . . . . . . . . . . . . . . . . . . . . . . . . . . . . . 22Item 1B. Unresolved Staff Comments . . . . . . . . . . . . . . . . . . . . . . . . . . . . . . . . . . . . . . . . . . . . . . . . . . . . . . . 32Item 2. Properties . . . . . . . . . . . . . . . . . . . . . . . . . . . . . . . . . . . . . . . . . . . . . . . . . . . . . . . . . . . . . . . . . . . . . 32Item 3. Legal Proceedings . . . . . . . . . . . . . . . . . . . . . . . . . . . . . . . . . . . . . . . . . . . . . . . . . . . . . . . . . . . . . . . 32Item 4. Mine Safety Disclosures . . . . . . . . . . . . . . . . . . . . . . . . . . . . . . . . . . . . . . . . . . . . . . . . . . . . . . . . . . 32
PART II . . . . . . . . . . . . . . . . . . . . . . . . . . . . . . . . . . . . . . . . . . . . . . . . . . . . . . . . . . . . . . . . . . . . . . . . . . . . . . . . 33Item 5. Market for Registrant’s Common Equity, Related Stockholder Matters and Issuer Purchases of
Equity Securities . . . . . . . . . . . . . . . . . . . . . . . . . . . . . . . . . . . . . . . . . . . . . . . . . . . . . . . . . . . . . . . . 33Item 6. Selected Financial Data . . . . . . . . . . . . . . . . . . . . . . . . . . . . . . . . . . . . . . . . . . . . . . . . . . . . . . . . . . . 36Item 7. Management’s Discussion and Analysis of Financial Condition and Results of Operations . . . . . . 37Item 7A. Quantitative and Qualitative Disclosures About Market Risk . . . . . . . . . . . . . . . . . . . . . . . . . . . . . 71Item 8. Financial Statements and Supplementary Data . . . . . . . . . . . . . . . . . . . . . . . . . . . . . . . . . . . . . . . . . 72Item 9. Changes in and Disagreements with Accountants on Accounting and Financial Disclosure . . . . . . 72Item 9A. Controls and Procedures . . . . . . . . . . . . . . . . . . . . . . . . . . . . . . . . . . . . . . . . . . . . . . . . . . . . . . . . . . 72Item 9B. Other Information . . . . . . . . . . . . . . . . . . . . . . . . . . . . . . . . . . . . . . . . . . . . . . . . . . . . . . . . . . . . . . . 73
PART III . . . . . . . . . . . . . . . . . . . . . . . . . . . . . . . . . . . . . . . . . . . . . . . . . . . . . . . . . . . . . . . . . . . . . . . . . . . . . . . 74Item 10. Directors, Executive Officers and Corporate Governance . . . . . . . . . . . . . . . . . . . . . . . . . . . . . . . . 74Item 11. Executive Compensation . . . . . . . . . . . . . . . . . . . . . . . . . . . . . . . . . . . . . . . . . . . . . . . . . . . . . . . . . . 74Item 12. Security Ownership of Certain Beneficial Owners and Management and Related Stockholder
Matters . . . . . . . . . . . . . . . . . . . . . . . . . . . . . . . . . . . . . . . . . . . . . . . . . . . . . . . . . . . . . . . . . . . . . . . 74Item 13. Certain Relationships and Related Transactions, and Director Independence . . . . . . . . . . . . . . . . . 74Item 14. Principal Accounting Fees and Services . . . . . . . . . . . . . . . . . . . . . . . . . . . . . . . . . . . . . . . . . . . . . . 74
PART IV . . . . . . . . . . . . . . . . . . . . . . . . . . . . . . . . . . . . . . . . . . . . . . . . . . . . . . . . . . . . . . . . . . . . . . . . . . . . . . . 75Item 15. Exhibits, Financial Statement Schedules . . . . . . . . . . . . . . . . . . . . . . . . . . . . . . . . . . . . . . . . . . . . . 75
CAUTIONARY NOTE
This report contains statements that do not relate to historical or current facts, but are “forward-looking”statements within the meaning of the Private Securities Litigation Reform Act of 1995. These statements relate toanalyses and other information based on forecasts of future results and estimates of amounts not yetdeterminable. These statements may also relate to future events or trends, our future prospects and proposed newproducts, services, developments or business strategies, among other things. These statements can generally(although not always) be identified by their use of terms and phrases such as anticipate, appear, believe,continue, could, estimate, expect, indicate, intend, may, plan, possible, predict, project, pursue, will, would, andother similar terms and phrases, as well as the use of the future tense. Forward-looking statements in this AnnualReport on Form 10-K speak only as of the date hereof, and forward looking statements in documentsincorporated by reference speak only as the date of those documents. Unless otherwise required by law, weundertake no obligation to publicly update or revise these forward-looking statements, whether as a result of newinformation, future events or otherwise.
Examples of forward-looking statements in this report include, but are not limited to, the following categories ofexpectations about:
➣ The impact of the pending acquisition of WMS Industries Inc. (“WMS” or the “Company”) byScientific Games Corporation (“Scientific Games”) on our global business, our strategy, ourmanagement and employees and our ability to adequately complete the conditions precedent to close theacquisition;
➣ The impact of the economy on our global business;
➣ Gaming growth, expansion and market opportunities;
➣ Industry replacement demand and demand from new casino openings and expansions;
➣ Further market penetration of our products;
➣ Legislative or regulatory developments and related market opportunities;
➣ Expanding our product lines and improving our position in related markets;
➣ Our ability to introduce new products that perform well in the relevant market;
➣ The timing, features, benefits and expected success of new product introductions;
➣ The advantages offered to customers by our products and product features;
➣ Our market share, competitive advantages and relative leadership position;
➣ The timing of the introduction, market penetration, growth, revenues and profits from networkedgaming systems and applications and interactive gaming products and services;
➣ Increasing growth or contributions from certain non-gaming machine products and services;
➣ Our ability to acquire, develop or protect intellectual property;
➣ Our ability to benefit from and effectively integrate and utilize licensed or acquired intellectual propertyand technologies;
➣ Financial results or expectations for fiscal year 2014 and future periods, including capital spending anduses of cash;
➣ Factors impacting future operating margins and expectations about future tax rates;
➣ Demand for operating leases by customers;
➣ Future costs of restructuring or realigning our business;
➣ Our access to and the availability of capital and credit resources to fund future operating requirements,capital expenditures and payment obligations;
1
➣ The impact of recently adopted accounting pronouncements;
➣ Mergers and acquisitions, including the expected benefits of completed acquisitions; and
➣ The outcome and expense of litigation.
Actual results could differ materially from those expressed or implied in our forward-looking statements.Our future financial condition and results of operations, as well as any forward-looking statements, are subject tochange and to inherent known and unknown risks and uncertainties. See Item 1A. Risk Factors in this report for adiscussion of these and other risks and uncertainties. Although we believe that the expectations reflected in ourforward-looking statements are reasonable, any or all of our forward-looking statements may prove to beincorrect. Consequently, no forward-looking statements are guaranteed.
Certain forward-looking statements contained herein reflect our current expectations, plans and strategies(including, without limitation, with respect to new products and services, entry into new markets, levels ofanticipated spending or investment, and expectations as to shipments or the cost of products), all of which speakonly as of the date of this document and any of which may change materially in the future. In particular, in theevent the Merger is completed, our current expectations, plans and strategies may change as WMS is integratedinto Scientific Games. There can be no assurance that Scientific Games’ expectations, plans and strategies withrespect to WMS or the combined company following the Merger will be consistent with our current expectations,plans and strategies. Moreover, we cannot predict the impact of any changes to our current expectations, plans orstrategies on the financial condition or results of operations of WMS or the combined company.
2
PART I
ITEM 1. BUSINESS
General
WMS is a leading supplier of innovative gaming entertainment products and services worldwide. Wedesign, develop, manufacture, distribute and market casino games and gaming machines, video lottery terminals(“VLTs”), video gaming terminals (“VGTs”) and interactive gaming products and services. As regulated marketslegalize interactive gaming, we intend to enter and do business in those markets. Our fiscal year begins on July 1and ends on June 30.
On January 30, 2013, WMS entered into an Agreement and Plan of Merger (the “Merger Agreement”) withScientific Games, Scientific Games International, Inc., a wholly owned subsidiary of Scientific Games, andSG California Merger Sub, Inc., a wholly owned subsidiary of Scientific Games (“Merger Sub”). The MergerAgreement provides for the merger of Merger Sub with and into WMS, with WMS surviving as a wholly ownedsubsidiary of Scientific Games (the “Merger”). The Merger Agreement was unanimously approved by our Boardof Directors. At the effective time of the Merger, each share of WMS’ common stock issued and outstandingimmediately prior to such time, other than our treasury shares, shares owned by Scientific Games or Merger Sub,and shares with respect to which appraisal rights are properly exercised and not withdrawn under Delaware law,will be automatically cancelled and converted into the right to receive $26.00 in cash, without interest, on theterms and subject to the conditions set forth in the Merger Agreement. None of our stockholders exercisedappraisal rights.
Consummation of the Merger is subject to customary conditions, which at this point include withoutlimitation (i) receipt and effectiveness of specified licenses, permits, and other approvals, issued by certaingovernmental authorities in relation to our business and (ii) other customary closing conditions. On March 11,2013, we received notice from the Federal Trade Commission of the early termination of the waiting periodapplicable to the consummation of the Merger under the Hart-Scott-Rodino Antitrust Improvements Act of 1974,as amended. In addition on May 10, 2013, WMS stockholders approved the Merger Agreement. At this time, weexpect to consummate the Merger in the fall of calendar 2013. The Merger Agreement contains certainlimitations on the operations of WMS during the period prior to the effective time of the Merger, including aprohibition on share repurchases by the Company. During the fiscal year ended June 30, 2013, we incurredapproximately $13.5 million of pre-tax charges, which are recorded in selling and administrative expenses,related to the process our Board of Directors utilized in the sale of the Company, plus completing the closingconditions and the integration efforts prior to the effective time of the pending Merger.
Following consummation of the Merger, there will be no public market for our common stock which willcease to be traded on the New York Stock Exchange (“NYSE”), and we will no longer be required to fileperiodic reports with the Securities and Exchange Commission (“SEC”).
A description of the Merger Agreement and the Merger is contained in our definitive proxy statement datedApril 8, 2013, which was first mailed to our stockholders on or about April 11, 2013.
Our gaming machine products are installed in all of the major regulated gaming jurisdictions in the UnitedStates, as well as in approximately 161 international gaming jurisdictions. We either sell our products outright,which we include in product sales revenues, or we lease our participation gaming machine products, which weinclude in our gaming operations revenues. We offer our customers a wide range of leasing options. We alsoderive product sales revenues from the sale of parts and conversion kits. We also earn gaming operation revenuesfrom licensing our game themes and other intellectual property to third parties, and beginning in fiscal 2011,providing a networked gaming system and applications to casinos and, also beginning in fiscal 2011, onlinegaming and in fiscal 2012, social, casual and mobile gaming. In July 2012, we grouped together all of ourworldwide online social, casual and mobile gaming initiatives to focus on their growth, development and
3
operational execution and to optimize the expected benefits of interactive gaming initiatives for casino operatorsand their players. We expect to facilitate the continued expansion, investment, evolution and extension of ourinteractive gaming products and services and increase our focus on this rapidly evolving growth area.
We seek to develop games and gaming machines that offer high entertainment value to casino patrons andgenerate greater revenues for casinos and other gaming machine operators than the games and gaming machinesoffered by our competitors. We port the games we develop for casinos onto the platforms we use to provide ourinteractive gaming products and services as well as to VLTs. Our gaming products feature advanced graphics,digital sound and engaging games, and most games incorporate secondary bonus rounds. Certain games are basedon licensed, well-recognized brands such as MONOPOLYTM, THE WIZARD OF OZTM, THE LORD OF THERINGSTM and CLUE™ themes and substantially all of our games and gaming machines utilize technologies andintellectual property licensed from third parties. In designing our games and gaming machines, our designers,engineers, artists and development personnel build upon our more than 60 years of experience in designing anddeveloping novel and entertaining products from jukeboxes and pinball games to video and arcade games and,now, games and gaming machines for the global gaming industry. We utilize our unique Player DrivenInnovationTM approach in the development of new games and technologies to create innovative products.
Our primary manufacturing facility is located in the United States, with development or distribution officeslocated in the United States, Argentina, Australia, Canada, China, India, Mexico, South Africa and Spain. Wealso have an online gaming operations center in the United Kingdom; with our acquisition of Jadestone GroupAB and Jadestone Networks (Malta) Ltd. (“Jadestone”) in late fiscal 2012, we have a development, operationscenter and administrative office in Sweden (see “Acquisitions” below); and with our acquisition of GenesisCommunications, Inc., d/b/a Phantom EFX, LLC (“Phantom”) in late fiscal 2012, we have a development,distribution and administrative office in Iowa (see “Acquisitions” below). The acquisitions of both Jadestone andPhantom, individually and collectively, are not significant subsidiaries as defined in Regulation S-X promulgatedunder the U.S. Federal Securities laws, and are immaterial to our Consolidated Balance Sheets, ConsolidatedStatements of Income and Consolidated Statements of Cash Flows. We conduct our business through oursubsidiaries, including WMS Gaming Inc. (“WMS Gaming”), Williams Interactive LLC, Jadestone and Phantom,which market our products under the WMS, WMS Gaming, Jadestone and Phantom trademarks. For informationabout our revenues and assets outside of the United States, see Note 17. “Information on Geographic Areas” toour Consolidated Financial Statements.
We have only one business segment. Data for product sales and gaming operations is only maintained on aconsolidated basis as presented in our Consolidated Financial Statements, with no additional separate datamaintained for product sales and gaming operations (other than the revenue and cost of revenues informationincluded in our Consolidated Statements of Income and gaming operations equipment and related accumulateddepreciation included in our Consolidated Balance Sheets). For information about our revenues, net income,assets, liabilities, stockholders equity and cash flows, see our Consolidated Financial Statements andItem 7. “Management’s Discussion and Analysis of Financial Condition and Results of Operations.”
WMS was incorporated in Delaware on November 20, 1974 under the name Williams Electronics, Inc.WMS succeeded to the amusement game business that had been conducted for almost 30 years prior to 1974 byour predecessors and entered the gaming machine market beginning in the 1990’s. Our principal executiveoffices are located at 800 South Northpoint Blvd. Waukegan, Illinois 60085, and our telephone number is(847) 785-3000. Our Internet website address is www.wms.com. Information contained on our website is not partof this Report. Through our Internet website, we make available, free of charge, our Annual Report onForm 10-K, quarterly reports on Form 10-Q, current reports on Form 8-K and amendments to those reports, assoon as reasonably practical after the information has been filed with or furnished to the SEC. We will alsoprovide electronic or paper copies of these reports free of charge upon request to our principal executiveoffice, Attention: Investor Relations. Additionally, the following WMS information is available through theInvestor Relations link of our website: code of conduct, corporate governance guidelines, by-laws and chartersfor our Audit and Ethics Committee, Compensation Committee, and Nominating and Corporate GovernanceCommittee. Copies of any materials we file with the SEC are also available at the SEC’s Public Reference Roomat 100 F Street, N.E. Washington, D.C. 20549. Information on the operation of the Public Reference Room may
4
be obtained by calling the SEC at 1-800-SEC-0330. In addition, the SEC maintains an Internet site that containsreports, proxy and information statements and other information regarding issuers that file electronically with theSEC at www.sec.gov.
Company and Product and Services Overview
Our products consist of innovative and differentiated games, video gaming machines, mechanical reelgaming machines, VLTs, VGTs, online gaming products and services and social, casual and mobile gamingproducts and services. We were one of the original developers and pioneers of video gaming machines in theU.S. market and through a continued focus on creativity and innovation, we have introduced a variety of new anddifferentiated products to the gaming machine market. We strive to develop highly entertaining games thatincorporate engaging game play, themes, intellectual properties and advanced technologies, exciting winningcombinations, advanced graphics and digital music and sound effects. A gaming machine, a VLT and a VGTconsist of three primary elements: (1) the gaming machine cabinet hardware; (2) the operating system software;and (3) the game theme software. Each gaming machine contains operating system software, which we refer to asa “game platform”. The game platform manages the software needed to operate the gaming machine. Gameplatforms and the related computer systems are constantly updated and revised to keep pace with the ever-increasing complexity of modern game play, technology and regulatory requirements. The change in theserequirements is driven by, among other things, changes in consumer demand, capacity, security and regulation.CPU-NXT® and CPU-NXT2 operating systems are the primary game platforms for substantially all of our videoand mechanical reel gaming machine, VLT and VGT products in casinos today. We introduced our next-generation CPU-NXT3 platform in the June 2012 quarter for two of our new participation games and it also is theplatform used in all of our new Blade™ and Gamefield xD™ cabinets that we introduced in the March 2013quarter. We intend to transition all of our game development to this new platform over the next few years whilecontinuing to support previous platforms.
Our games typically integrate secondary bonus rounds as additions to the primary game to create a game-within-a-game for more exciting and interactive play. If players attain certain winning combinations on theprimary game, they continue on to play a secondary game for a chance at winning additional bonuses withoutadditional wagering. The player can win in both the primary game and the secondary game. In our secondarybonus games, the player often has various choices to make regarding the bonus features. For example, in somegames the player can select from a variety of tokens or characters to obtain or reveal the bonus and, in othergames, the player is awarded free spins. Amusing, entertaining and familiar graphics and musical themes add tothe player appeal of our games.
We generate revenues in two principal ways: product sales and gaming operations. In product sales, we sellto casinos and other gaming machine operators new and used gaming machines, VLTs and VGTs, conversionkits (including game, hardware or operating system conversions) and parts. In gaming operations, we license ourgame content and intellectual property to third parties for distribution; we earn revenues from operating an onlinegaming site, offering non-wagering social games on Facebook® and on the Apple® iOs system for iPhone® andiPad® platforms, and the Android® platform; offering our games on third-party online gaming platforms that areinteroperable with our game servers and selling select WMS games that have been ported to operate on mobiledevices and PC’s; we earn revenues from placing our networked gaming system and applications, which is asystem that links groups of networked-enabled gaming machines to a server in the casino data center, and welease gaming machines and VLTs to casinos and other licensed gaming machine operators under operating leaseswhere the lease payments are based upon: (1) a percentage of the casino’s net win, which is the earningsgenerated by casino patrons playing the gaming machine; (2) fixed daily fees or; (3) a percentage of the amountwagered (“coin-in”) or a combination of a fixed daily fee and a percentage of the coin-in. We categorize ourlease arrangements into five groups: wide-area progressive (“WAP”) participation gaming machines; local-areaprogressive (“LAP”) participation gaming machines; standalone participation gaming machines; casino-owneddaily fee games; and gaming machine, VLT, VGT and other leases. We refer to WAP, LAP and standaloneparticipation gaming machines as “participation games”.
5
Our interactive gaming products and services currently include: (i) our social gaming pursuits that began asa joint co-development effort to create our Lucky Cruise™ social casino for Facebook and also includes JackpotParty® Social Casino on Facebook; (ii) our UK-based JackpotParty.com online casino; (iii) providing a fullymanaged, end-to-end online casino site in Belgium in collaboration with Groupe Partouche; (iv) the integrationof Jadestone’s game servers with customers’ online gaming platforms for broader distribution of our gamelibrary online; (v) mobile online and social gaming that has extended our gaming content distribution into thesocial, casual and mobile channels; and (vi) our award-winning, cloud-based Player’s Life® Web Services thatlinks casino-based entertainment with non-wagering entertainment features at home or on mobile devices.
Given the continuing lower levels of capital spending by casinos over the three years ended June 30, 2011and with no leading indicators suggesting that demand will increase in the near-term, we conducted a thoroughreview of our product plans and business strategies at the end of fiscal 2011 and the beginning of fiscal 2012. Westill believe our long-term vision is intact but, as a result of this review, we refined our product plans andrestructured our organization. Specifically, we streamlined our product management and product developmentfunctions, simplified our product plans and further prioritized on-time commercialization of new game themes,products and portal applications. Some of the product, operational and other decisions made in this review led toimpairment, restructuring, asset write-downs and other charges, net of $24.0 million pre-tax, or $0.26 per dilutedshare, recorded in the June 2011 quarter and for fiscal 2011 we recorded $27.8 million pre-tax, or $0.28 perdiluted share, for such net charges.
In addition, we implemented a broader restructuring, and recorded additional impairment, restructuring andother charges in the September 2011 quarter amounting to $14.0 million pre-tax, or $0.17 per diluted share andfor fiscal 2012, we recorded $13.3 million pre-tax, or $0.16 per diluted share for such net charges. Theserestructuring actions were expected to better direct resources, focus on near-term revenue opportunities andreduced our overall organizational staffing by approximately 10% to a level that better correlated with theexisting operating environment, while maintaining our ability to create great games that engage current playersand attract new players.
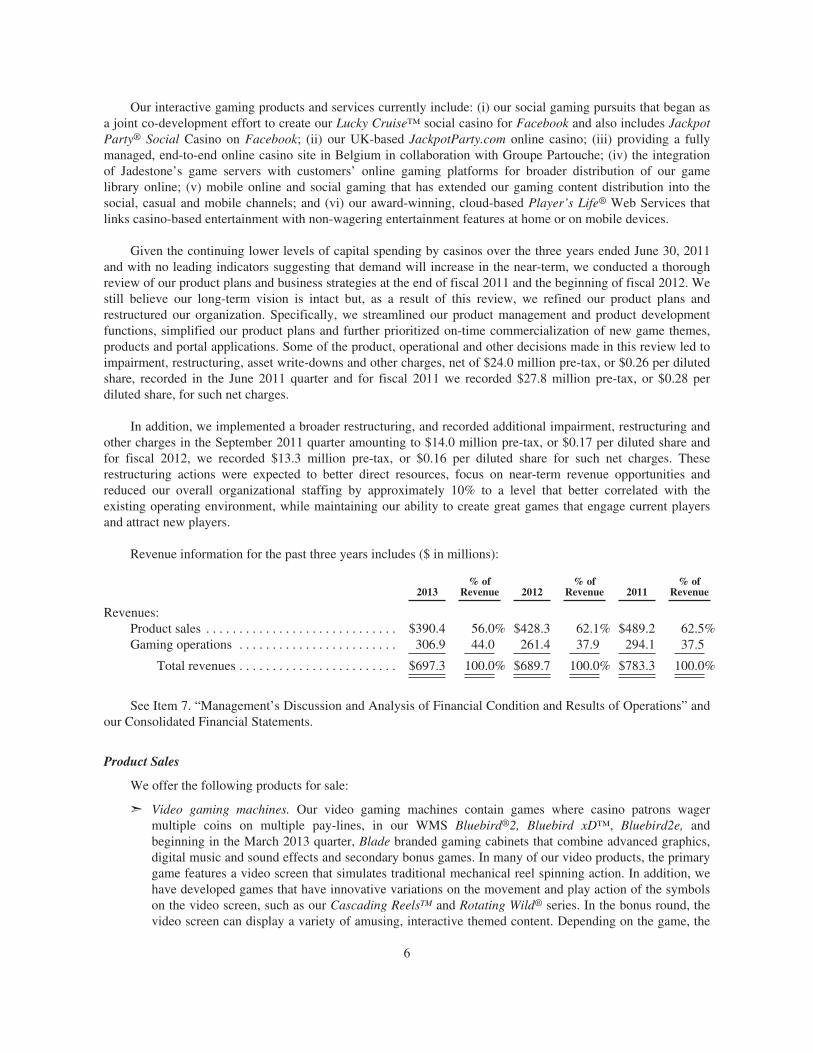
Revenue information for the past three years includes ($ in millions):
2013% of
Revenue 2012% of
Revenue 2011% of
Revenue
Revenues:Product sales . . . . . . . . . . . . . . . . . . . . . . . . . . . . . $390.4 56.0% $428.3 62.1% $489.2 62.5%Gaming operations . . . . . . . . . . . . . . . . . . . . . . . . 306.9 44.0 261.4 37.9 294.1 37.5
Total revenues . . . . . . . . . . . . . . . . . . . . . . . . $697.3 100.0% $689.7 100.0% $783.3 100.0%
See Item 7. “Management’s Discussion and Analysis of Financial Condition and Results of Operations” andour Consolidated Financial Statements.
Product Sales
We offer the following products for sale:
➣ Video gaming machines. Our video gaming machines contain games where casino patrons wagermultiple coins on multiple pay-lines, in our WMS Bluebird®2, Bluebird xD™, Bluebird2e, andbeginning in the March 2013 quarter, Blade branded gaming cabinets that combine advanced graphics,digital music and sound effects and secondary bonus games. In many of our video products, the primarygame features a video screen that simulates traditional mechanical reel spinning action. In addition, wehave developed games that have innovative variations on the movement and play action of the symbolson the video screen, such as our Cascading ReelsTM and Rotating Wild® series. In the bonus round, thevideo screen can display a variety of amusing, interactive themed content. Depending on the game, the
6
player can wager hundreds of coins per play. We have a strong player following in this product segmentsince the successful introduction of our Reel ‘em In® game in 1997. We introduced 48 new video gamesfor sale during fiscal 2013 and 52 new video games in fiscal 2012.
➣ Mechanical reel gaming machines. Our product line of mechanical reel gaming machines in ourBluebird2, Bluebird xD and Bluebird2e cabinets include five-reel and three-reel; single-line and multi-line; multi-coin games that are powered by the same CPU-NXT and CPU-NXT2 operating systems asour video gaming machines. Our mechanical reel products feature state-of-the-art lighting and soundelements that make our gaming machines stand out on a casino floor. With the launch of our Bluebird2mechanical reel gaming machines in fiscal 2009, all of our mechanical reel gaming machines nowfeature our Transmissive Reels® technology, which combines both traditional mechanical reel spinningtechnology with video technology in a single gaming machine. We introduced 8 new mechanical reelgames in fiscal 2013 and 18 mechanical reel games in fiscal 2012.
➣ Parts sales, conversion kits and used games. We sell replacement parts and game conversion kits for ourBluebird, Bluebird2, Bluebird xD, Bluebird2e and Blade gaming machines. We also sell CPU-NXT2hardware and operating system conversion kits, which enable casinos to upgrade Bluebird gamingmachines to obtain all the features and functionality of the CPU-NXT2 operating system and thenetworked gaming functionality for a lesser price compared to the purchase of a Bluebird2, Bluebird xDor Bluebird2e networked-enabled gaming machine. An active market exists mostly outside of NorthAmerica for used gaming machines. When we receive a gaming machine on trade-in, we estimate acarrying value for the gaming machine based on the condition of the gaming machine, as well as ourexperience in selling used gaming machines and such estimates could change due to changes in demandin general for used gaming machines. We sell these trade-ins as-is or refurbish the used gamingmachines before resale. We also sell participation gaming machines, after refurbishment, as usedgaming machines when we no longer need them in gaming operations and we also harvest parts fromBluebird participation gaming machines to sell to customers as spare parts to support the estimated over50,000 of such gaming machines still in casinos today. We expect that our revenues from these sourceswill increase in the future to the extent our installed base of sold gaming machines continues to grow.
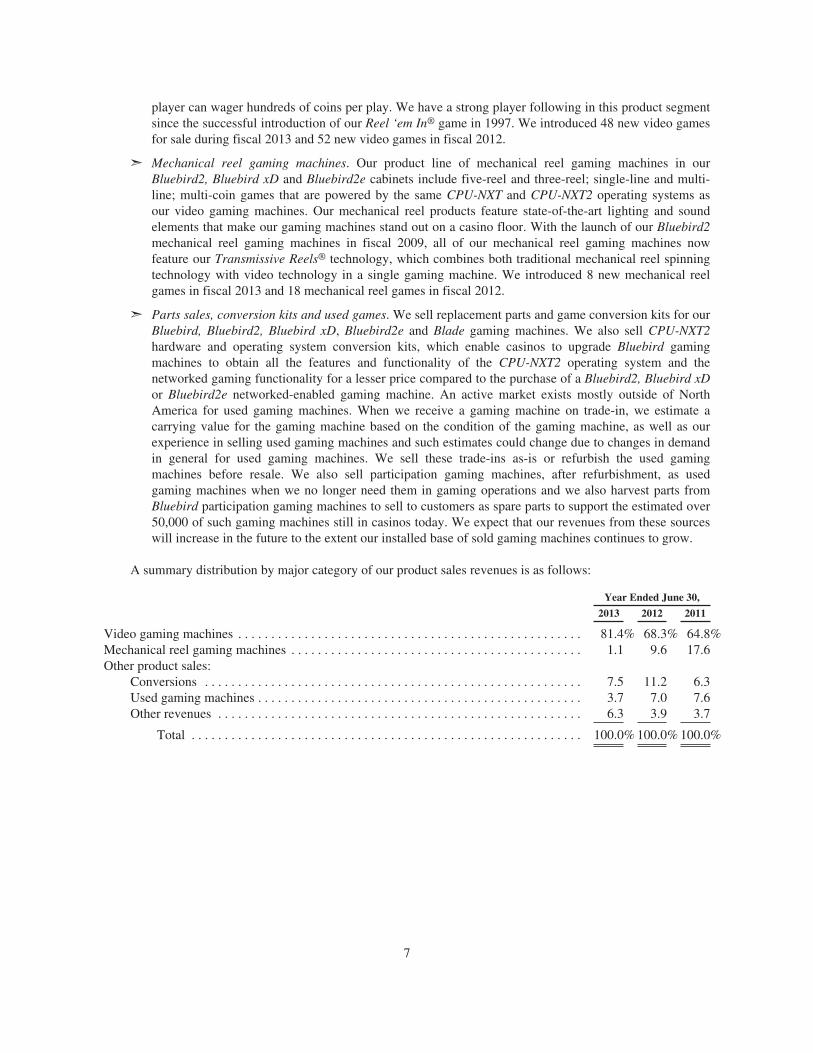
A summary distribution by major category of our product sales revenues is as follows:
Year Ended June 30,
2013 2012 2011
Video gaming machines . . . . . . . . . . . . . . . . . . . . . . . . . . . . . . . . . . . . . . . . . . . . . . . . . . . . 81.4% 68.3% 64.8%Mechanical reel gaming machines . . . . . . . . . . . . . . . . . . . . . . . . . . . . . . . . . . . . . . . . . . . . 1.1 9.6 17.6Other product sales:
Conversions . . . . . . . . . . . . . . . . . . . . . . . . . . . . . . . . . . . . . . . . . . . . . . . . . . . . . . . . . 7.5 11.2 6.3Used gaming machines . . . . . . . . . . . . . . . . . . . . . . . . . . . . . . . . . . . . . . . . . . . . . . . . . 3.7 7.0 7.6Other revenues . . . . . . . . . . . . . . . . . . . . . . . . . . . . . . . . . . . . . . . . . . . . . . . . . . . . . . . 6.3 3.9 3.7
Total . . . . . . . . . . . . . . . . . . . . . . . . . . . . . . . . . . . . . . . . . . . . . . . . . . . . . . . . . . . 100.0% 100.0% 100.0%
7
Gaming Operations
Gaming operations includes the following:
➣ Participation games. Participation games, which are gaming machines owned by us that we lease basedupon any of the following payment methods: (1) a percentage of the casino’s net win; (2) fixed dailyfees; or (3) a percentage of the coin-in or a combination of a fixed daily fee plus a percentage of thecoin-in. We have the ability to lease these gaming machines on a participation basis because of thesuperior performance of the game and/or the popularity of the brand, which generates higher wageringand net win to the casinos or gaming machine operators than the gaming machines we sell outright. Ourparticipation games include the following categories:
➣ WAP participation games. WAP games are electronically linked gaming machines that are locatedacross multiple casinos within a single gaming jurisdiction, or across Native American gamingjurisdictions. The linked gaming machines contribute to and compete for large, system-wideprogressive jackpots and are designed to increase gaming machine play for participating casinos bygiving the players the opportunity to win a larger jackpot than on a non-linked gaming machine. Wecreate WAP games using our proprietary brands and licensed brands such as MONOPOLY, THEWIZARD OF OZ, SPIDER-MAN™, THE LORD OF THE RINGS and WILLY WONKA and THECHOCOLATE FACTORY™ themes. We operate WAP systems in Arizona, Colorado, Mississippi,Missouri, Nevada and New Jersey and in Native American casinos. We often leverage our WAPgames by also using them on local-area progressive systems or standalone participation gamingmachines in those jurisdictions where we do not operate a WAP system. WAP participation gamestypically are leased where the lease payment is based on a percentage of the amount wagered or acombination of a fixed daily fee plus a percentage of the amount wagered. WAP participation gamesgenerate our highest daily lease rate; however, we are responsible for funding the WAP jackpotaward. Effective July 1, 2011, to comply with an Accounting Standard Update (“ASU”) issued bythe Financial Accounting Standards Board (“FASB”), we no longer record any expense for the basejackpot liability for the progressive jackpots on our WAP gaming machines until the progressivejackpot liability is won by the casino patron.
➣ LAP participation games. A LAP system electronically links gaming machines that are locatedwithin a single casino to a progressive jackpot for that specific casino. Our LAP gaming machinesfeature games using our proprietary brands such as Jackpot Party Progressive®, Life of Luxury®
Progressive, Reel ‘em In: Greatest Catch™, Kingdom of the Titans®, Treasures of the World™themes, as well as licensed brands such as THE GODFATHER® theme. Our LAP products leverageboth exclusive brand names and game play intellectual property, and typically offer players thechance to win multiple progressive jackpots, all of which tend to result in a higher average bet onthese games. Net win per gaming machine on LAP systems is generally similar to non-linkedstandalone gaming machines on a casino floor. LAP participation games are leased where we earnrevenue based on a percentage of the daily net win of the gaming machine or a fixed daily fee.
➣ Standalone participation games. We lease certain participation games on a non-linked basis, whichwe call standalone games. Our standalone games feature titles, among others, under theMONOPOLY brand and, in those jurisdictions where we do not operate a WAP system, THEWIZARD OF OZ, THE PRICE IS RIGHT®, CHEERS™, THE GAME OF LIFE™ and KISS™games. Our standalone gaming machines generally feature larger, more elaborate top-boxes andprovide game play experiences not possible on a single screen game or on gaming machines that wesell. Standalone participation games are leased and we earn revenue based on a percentage of thedaily net win of the gaming machine or a fixed daily fee, or for our games utilizing our AdaptiveGaming® technology, on a percentage of the amount wagered on the game.
8
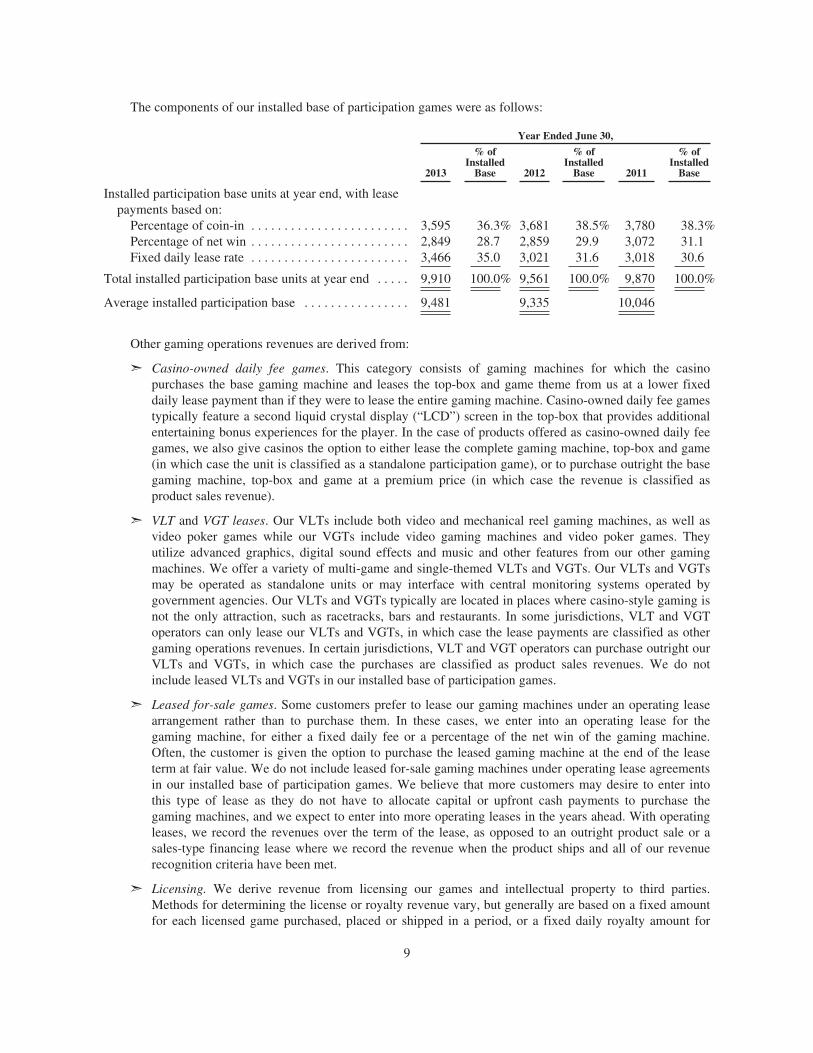
The components of our installed base of participation games were as follows:
Year Ended June 30,
2013
% ofInstalled
Base 2012
% ofInstalled
Base 2011
% ofInstalled
Base
Installed participation base units at year end, with leasepayments based on:
Percentage of coin-in . . . . . . . . . . . . . . . . . . . . . . . . 3,595 36.3% 3,681 38.5% 3,780 38.3%Percentage of net win . . . . . . . . . . . . . . . . . . . . . . . . 2,849 28.7 2,859 29.9 3,072 31.1Fixed daily lease rate . . . . . . . . . . . . . . . . . . . . . . . . 3,466 35.0 3,021 31.6 3,018 30.6
Total installed participation base units at year end . . . . . 9,910 100.0% 9,561 100.0% 9,870 100.0%
Average installed participation base . . . . . . . . . . . . . . . . 9,481 9,335 10,046
Other gaming operations revenues are derived from:
➣ Casino-owned daily fee games. This category consists of gaming machines for which the casinopurchases the base gaming machine and leases the top-box and game theme from us at a lower fixeddaily lease payment than if they were to lease the entire gaming machine. Casino-owned daily fee gamestypically feature a second liquid crystal display (“LCD”) screen in the top-box that provides additionalentertaining bonus experiences for the player. In the case of products offered as casino-owned daily feegames, we also give casinos the option to either lease the complete gaming machine, top-box and game(in which case the unit is classified as a standalone participation game), or to purchase outright the basegaming machine, top-box and game at a premium price (in which case the revenue is classified asproduct sales revenue).
➣ VLT and VGT leases. Our VLTs include both video and mechanical reel gaming machines, as well asvideo poker games while our VGTs include video gaming machines and video poker games. Theyutilize advanced graphics, digital sound effects and music and other features from our other gamingmachines. We offer a variety of multi-game and single-themed VLTs and VGTs. Our VLTs and VGTsmay be operated as standalone units or may interface with central monitoring systems operated bygovernment agencies. Our VLTs and VGTs typically are located in places where casino-style gaming isnot the only attraction, such as racetracks, bars and restaurants. In some jurisdictions, VLT and VGToperators can only lease our VLTs and VGTs, in which case the lease payments are classified as othergaming operations revenues. In certain jurisdictions, VLT and VGT operators can purchase outright ourVLTs and VGTs, in which case the purchases are classified as product sales revenues. We do notinclude leased VLTs and VGTs in our installed base of participation games.
➣ Leased for-sale games. Some customers prefer to lease our gaming machines under an operating leasearrangement rather than to purchase them. In these cases, we enter into an operating lease for thegaming machine, for either a fixed daily fee or a percentage of the net win of the gaming machine.Often, the customer is given the option to purchase the leased gaming machine at the end of the leaseterm at fair value. We do not include leased for-sale gaming machines under operating lease agreementsin our installed base of participation games. We believe that more customers may desire to enter intothis type of lease as they do not have to allocate capital or upfront cash payments to purchase thegaming machines, and we expect to enter into more operating leases in the years ahead. With operatingleases, we record the revenues over the term of the lease, as opposed to an outright product sale or asales-type financing lease where we record the revenue when the product ships and all of our revenuerecognition criteria have been met.
➣ Licensing. We derive revenue from licensing our games and intellectual property to third parties.Methods for determining the license or royalty revenue vary, but generally are based on a fixed amountfor each licensed game purchased, placed or shipped in a period, or a fixed daily royalty amount for
9
each game. Licensing revenues have declined since fiscal 2009 as our licensing agreements reachedtheir termination dates and we elected not to renew these agreements and we have now directly enteredthe markets covered by these agreements.
➣ Class II and centrally determined systems. In fiscal 2010, we began offering video and mechanical reelgaming machines and VLTs for Class II and certain VLT markets where the game outcome isdetermined on a central server system which we provided through an agreement with Bluberi GamingTechnologies Inc. (“Bluberi”), a Canadian-based technology firm. In fiscal 2011, we purchased a copyof the central system software from Bluberi and further developed the software, and we are nowoperating the system ourselves, although we have continuing payment obligations to Bluberi. In latefiscal 2012, we received approval of a CPU-NXT2 based operating system for the Class II markets usingour Bluebird2 gaming cabinet and shipped our first gaming machines operating on this new system inthe June 2012 quarter. These Class II systems primarily operate in Native American casinos inWashington, Florida and Oklahoma. In certain of these jurisdictions, our customers rent the gamingmachine through an operating lease arrangement, in which case the lease payments are shown as gamingoperations revenues and in other jurisdictions customers purchase the gaming machines in which casethe revenues are shown as product sales revenues. In each case, for the use of the central determinationsystem, we receive either a fixed daily fee or a percentage of the net win generated by the gamingmachines or VLTs connected to the system.
➣ Networked gaming. We believe that server-enabled networked gaming (“NG”) will be one of the nextsignificant technologies deployed in the gaming machine industry. NG refers to a networked gamingsystem that links groups of server-enabled gaming machines to a remote server or servers in eachcasino’s data center. Once the gaming machines are connected to the server-enabled network, data cantransfer between the servers and the gaming machines in real time and new applications, gamefunctionality and system-wide features can be enabled on the gaming machines from the remote server.These networks will require regulatory approval in gaming jurisdictions prior to any implementation.We have been introducing the foundational technologies and hardware for NG to the market through ournew participation product lines since the September 2006 quarter. In the June 2011 quarter, we receivedthe first regulatory approval for our WAGE-NET® networked gaming system, the first family of portalapplications, the Ultra Hit Progressive® (“UHP”) family, and the first game in the UHP family, theJackpot Explosion® theme, and since then we have received additional approvals for these products andother networked gaming products in other gaming jurisdictions. At June 30, 2013, we hadapproximately 2,600 networked gaming machines, which we do not include in our participationfootprint, functioning, primarily on a commercial basis, at 115 casino properties globally.
➣ Interactive gaming.
➣ Online Operations: In the December 2010 quarter, we launched a business-to-consumer (“B2C”),online casino website for residents in the United Kingdom, although we did not begin to market thesite until February 2011. Our Jackpotparty.com online casino offers a variety of our popular slotgames and certain card and table games. We believe the success of our gaming content, technologyfoundation and interactive capabilities will allow us to provide online capabilities to consumers inother jurisdictions.
➣ Managed Services: In fiscal 2012, we also launched our efforts to provide business-to-business(“B2B”) online gaming services. We entered into an agreement with Groupe Partouche, the largestland-based casino operator in Belgium and one of the largest land-based casino operators in Europe,and beginning in the June 2013 quarter now provide a fully managed, end-to-end online casino sitein Belgium.
➣ Game Server: In May 2012 we acquired Jadestone (see “Acquisitions” below) to accelerate andbroaden the distribution of our game library to legalized, online gaming operators via integration ofthe Jadestone game server with operators’ online gaming platforms.
10
➣ Social Gaming: In fiscal 2012, we began earning revenues from our Lucky Cruise social game onFacebook and revenues from the sale of select WMS games that have been ported to operate onmobile devices and PC’s. In June 2012, we further expanded our social, casual and mobile presencethrough the acquisition of Phantom (see “Acquisitions” below) and in July 2012 we launchedJackpot Party Social Casino on Facebook. In the March 2013 quarter, we launched this applicationon the Apple iOs system for iPhone and iPad platforms, and in the June 2013 quarter on the Androidplatform, all of which enhanced our revenue earning opportunities.
➣ General: In July 2012, we entered into a strategic alliance with Dragonfish, the independent B2Bdivision of 888 Holdings, which expands our B2B online product offering in the United States withone of the world’s leading online poker platforms. We will focus on the growth, development andoperational execution of our worldwide online, social, casual and mobile gaming initiatives tooptimize the benefits of interactive products and services for casino operators and their players. Inthe United States, the States of Nevada, Delaware and New Jersey have adopted legislation tolegalize certain forms of online gaming. Federal legislators and certain other state legislators, aswell as governments in Canada and Europe are considering legalizing certain forms of onlinegaming, which, if passed, could expand our revenue opportunities depending on the type of onlinegaming approved. The breadth and timing of these opportunities remain uncertain due to thepolitical process in each of these jurisdictions, as well as the difficult credit environment facing ourcustomers and the risk of continued economic uncertainty. Currently revenues earned, total assetsand cash flows from our interactive gaming products and services are not material to ourConsolidated Financial Statements.
Acquisitions
On May 21, 2012, we acquired Jadestone, a Sweden-based company that develops, publishes and distributesonline gaming content and entertainment for online gaming companies in a B2B business model. The acquisitionis of a strategic technology enabler that augments our content distribution capabilities for customers looking toexpand their brand with online interactive offerings.
On June 15, 2012, we acquired Phantom, an Iowa based company that is a leading publisher and developerof interactive casino and slot-based games for social, casual and mobile gaming entertainment. The acquisitionfurther expands our capabilities in online content development and distribution across the rapidly growing social,casual and mobile channels.
These two acquisitions, individually and in the aggregate, are not material to our Consolidated FinancialStatements.
Business Development
We have been very active in licensing and acquiring intellectual properties, technologies and brands fromthird parties, investing $18.3 million, $13.4 million and $24.9 million in fiscal 2013, 2012 and 2011,respectively. See Note 15. “Commitments, Contingencies and Indemnifications” to our Consolidated FinancialStatements.
Industry Overview
The gaming industry is a large and dynamic worldwide marketplace, subject to extensive local jurisdictionalregulations. Casino and other legal gaming operators continuously seek to increase their revenue growth andprofitability. The importance of gaming machine revenue to casino operators’ profitability has created demandfor gaming machines that have the ability to generate superior daily net win. As a result, gaming equipmentmanufacturers have increasingly focused on enhancing the overall entertainment value and appeal of games andgaming machines, which drives the demand for the replacement of older games and gaming machines. We
11
believe that earnings performance of our products is the primary driver of customer demand. See “Overview”included in Item 7. “Management’s Discussion and Analysis of Financial Condition and Results of Operations.”
Demand for our products and services is also driven by:
➣ The replacement cycle of gaming machines at existing casinos;
➣ Casino expansions and new casino openings;
➣ Opening of new gaming jurisdictions;
➣ Expansion of our product line and introduction of new technologies;
➣ Entering new distribution channels and markets not previously served; and
➣ Our reputation, reliability and after-sales service support.
The recession and financial market crisis that began in 2008 has continued to disrupt the economyworldwide, reduced consumer discretionary spending and has led to a weakened global economic environment,all of which have been significant challenges for our industry. In calendar 2008 and 2009, some gaming operatorsdelayed or canceled construction projects, resulting in fewer new casino openings and expansions in fiscal 2010and 2011, coupled with many customers reducing their annual capital budgets for replacing gaming machines.New unit demand for new casino openings and casino expansions increased in fiscal 2012; however, decreased infiscal 2013. The economic crisis has reduced disposable income for casino patrons and resulted in fewer patronsvisiting casinos and lower spending by those patrons who did visit casinos. The economic crisis and operationalchallenges led to the review of our product plans and business strategies at the end of fiscal 2011 and beginningof fiscal 2012. Additionally, increased competition from our competitors lowered the number of new units weshipped over the last three fiscal years, resulting in lower revenues in fiscal 2012 than in fiscal 2011 and 2010.While our revenues for the year ended June 30, 2013, increased from the prior year period, this resulted fromincreased revenues from our interactive gaming products and services more than offsetting the decline in productsales and participation revenues.
In the United States, Native American casinos represent a significant portion of the gaming market. NativeAmerican gaming differs from the traditional commercial casino market in that it is regulated under the IndianGaming Regulatory Act of 1988, which classifies legalized gaming as follows:
➣ Class I gaming includes traditional Native American social and ceremonial games. Class I gaming isregulated exclusively at the Native American tribe level. We do not compete in the Class I industry;
➣ Class II gaming includes bingo, electronic aids to bingo, and, if played at the same location where bingois offered, pull-tabs and other games similar to bingo. Class II gaming is regulated by individual NativeAmerican tribes, with the National Indian Gaming Commission having concurrent jurisdiction; and
➣ Class III gaming includes all other forms of gaming that are not included in either Class I or Class II,including our traditional gaming machines and is permissible only pursuant to either (1) a compactagreement entered into between the tribe and the host state, where such compact has been approved bythe Secretary of the Interior and published in the Federal Register; or (2) Class III Procedures issued bythe Secretary of the Interior.
We believe the most significant technology changes and developments during the last decade that drove thedemand for the past gaming machine replacement cycles were: (1) the development of video gaming machinesthat simulate mechanical reel gaming machines, (2) the introduction of gaming machines with secondary bonusrounds, (3) printed ticket payouts instead of coin payouts and (4) low denomination wagering coupled with local-area and wide-area progressive jackpots. We expect technology to continue to be a significant element that drivesdemand, along with the emphasis for casinos on the types of gaming products that deliver higher net win pergaming machine. Once the gaming machines are connected to a networked gaming system, data can pass in real
12
time between the servers and the gaming machines, which will enable new applications, game functionality andsystem-wide features. These networks will require regulatory approval in each gaming jurisdiction prior to anyimplementation and will represent an important addition to our existing portfolio of product offerings.
Business Strategy
In order to continue to grow revenues, profits and cash flow, we have been executing on key businessstrategic priorities throughout the last three fiscal years; however, given the continuing lower levels of capitalspending by casinos over the three years ended June 30, 2011, and with no leading indicators that demand willincrease in the near-term, we conducted a thorough review of our product plans and business strategies at the endof fiscal 2011 and the beginning of fiscal 2012. We still believe our long-term vision is intact but, as a result ofthis review, we refined our business strategies in fiscal 2012 as discussed below. For further discussion of ourfiscal 2013 results related to these business strategies – See “Our Focus” included in Item 7. “Management’sDiscussion and Analysis of Financial Condition and Results of Operations.”
Our four business strategic priorities are as follows:
Strategic Priority One: Continue to grow our installed participation product base and improve our dailyaverage revenue. Certain of our games and products are only available through lease arrangements where weearn a daily lease rate that is based on either a percentage of the net win, a percentage of the coin-in or a fixeddaily lease rate. We invest our capital in the placement of these leased gaming machines; our business strategyhas been to maximize our return on invested capital for our participation installed base. A key element of oursuccess has been to limit the number of units of each game theme installed in each casino. The result is that dueto the popularity of the games, with a limited supply, the performance of the games has remained high for alonger period. We have also removed participation gaming machines from lower performing casinos and placedthem in higher performing casinos to enhance our return on investment. Most of our new participation gamethemes that we launched during the last three fiscal years resulted in replacing existing participation gamingmachines, as during this period, we also upgraded a major portion of our installed base from Bluebird gamingmachines to Bluebird2, Bluebird xD and Gamefield xD gaming machines. We experienced delays in gettingapprovals for certain of our new participation game themes in fiscal 2011 and the first half of fiscal 2012 and, bynot having new game themes to replace some of our older game themes, we experienced a higher level ofremovals of participation gaming machines than in the prior two years. In mid-fiscal 2013, we began to seeincreases in the installed base of participation games and in fiscal 2013, we began seeing increases in the averagerevenues per day over prior year quarterly periods.
Our revenues from the installed base of participation gaming machines, along with the return on capitaldeployed also are key contributors to the cash flow provided by our operating activities. In the June 2012 quarter,we introduced the first two participation games using our next-generation CPU-NXT3 platform: Aladdin & theMagic Quest® and Super Team® themes. We believe the enhanced capabilities of this new platform will enableus to develop games with higher earnings performance. We expect to migrate development of all of ourparticipation games to this new platform over the next several years, while we will continue to support previousplatforms. In March 2013, we launched our new Gamefield xD gaming cabinet, using the CPU-NXT3 platform.By continuing to focus on return on invested capital in our participation installed base and introducing innovativenew participation games and cabinets we intend to continue to grow our participation revenues, profitability andcash flows.
Strategic Priority Two: Garner increased ship share in our global product sales by leveraging our productdevelopment expertise and developing differentiated, high-earning games, game content and products for ourcustomers worldwide. During the past nine years, we have enhanced our product development efforts by addingkey management, design personnel and software engineers to our product development group. We addedfacilities and organized our game development group into a studio team structure that continues to promoteinnovation while driving a more focused development approach. We place substantial emphasis on our Player
13
Driven Innovation process that incorporates player feedback and market research into our development processto create game content and gaming experiences that appeal to casino patrons. We develop, acquire and licenseintellectual property and advanced technologies that we believe enable innovative and appealing games which,coupled with a focused product portfolio management plan, allows us to expand our selection of differentiatedproducts to casino operators. We offer our products in several different cabinet styles, which help increaseoverall demand and substantially all of the games we have developed over the last two years are designed to beused on our Bluebird2, Bluebird xD, Bluebird2e and Blade cabinet styles. The major areas of hardwaredevelopment include cabinet style, technical capability, circuit board design and related programming and buttonpanel decks and displays.
We are dependent, in part, on innovative new products, new casino openings, casino expansions,replacement of older gaming machines, continued market penetration, new market opportunities and newdistribution channels to generate growth in product sales. Each gaming machine requires a game softwareplatform to manage the gaming machine hardware and deliver the game theme software. Gaming softwareplatforms are constantly updated to keep pace with the increasing complexity of game play requirements,regulatory requirements and expected future game theme software releases. In March 2013, we launched our newBlade gaming cabinet, using the latest version of our operating system software, the CPU-NXT3 platform, whichwe believe will enable us to offer games with higher earnings performance.
While different cabinet styles can enhance the player’s gaming experience, we continue to believe that thegame itself is the key factor that determines the popularity and earnings performance of the gaming machine. Weconduct extensive market research with casino players to determine what they want, whether the products we aredeveloping meet with their expectations and to identify brands we should attempt to license and technologies weshould develop, license or acquire to enhance the player’s experience. After the restructuring we announced inthe September 2011 quarter, we now have seven game development studios, which are based around the globe,that utilize the results of the market research in the ongoing development of new games and gaming experiences.
In December 2012, we launched our My Poker® video poker games, our first new video poker games inseveral years, which is on our Bluebird xD cabinet with a new button panel designed specifically for pokerplayers. My Poker games demonstrate our product development team’s commitment to deliver next-generationinnovative products through our Player Driven Innovation focus on enhancing players’ gaming experiences,which includes Player’s Life Web Services that enables players to save their personal settings, so that when theyreturn to the casino and log in, the game automatically restores their personal poker experience. By offering thisnew product line, we believe we will increase our share of poker game shipments, which should help increase ourshare of new unit shipments.
For the United States and Canada, we believe that WMS and four of its largest competitors, InternationalGame Technology Inc. (“IGT”), Bally Technologies, Inc. (“Bally”), Aristocrat Leisure Ltd (“Aristocrat”) andKonami Co. Ltd. (“Konami”), account for approximately 90% of all new units shipped. Based on informationpublicly available from each of these companies, we believe that our annual share of total units shipped amongstthese five companies shrank from just over 25% in fiscal 2011 to just over 20% in fiscal 2012 and shrank toapproximately 16% in fiscal 2013. We believe these fluctuations in ship share relate to the popularity of ourproducts with players and the resulting earnings performance that our products have generated for casinooperators. For the first eight months of fiscal 2013, we had the oldest gaming cabinet amongst our competitorsuntil we launched the new Blade gaming cabinet in March 2013. We did not compete in the Illinois VGT marketfor half of the fiscal year due to the Illinois law that existed and shipped a smaller share of Canadian VLTreplacement units than some of our competitors. Beginning in March 2013, we now have one of the newestplatforms and gaming cabinets amongst our competitors and that has resulted in a positive momentum in shipshare in the second half of fiscal 2013.
We are authorized to sell and lease our gaming machines in approximately 161 international gamingjurisdictions. We continue to achieve benefits from the opening of new international offices and the addition ofnew geographically dispersed sales account executives. We have international sales and distribution offices inArgentina, Canada, China, Mexico, South Africa and Spain.
14
In fiscal 2014, we expect that demand from new casino openings and expansions to be slightly higher andreplacement demand will be flat as a result of much lower demand from the Canadian VLT operators who hadbegun a cyclical replacement of all of their VLTs in fiscal 2013 will be offset by higher U.S. replacementdemand. We expect to ship a larger number of VGTs to Illinois in fiscal 2014 than we did in fiscal 2013. Weexpect to grow our global product sales revenues, profits and cash flow and increase our ship share as a result ofour continued focus on creating innovative new games and products, our direct launch into new marketsworldwide, the expansion of existing casinos and opening of new casinos and new jurisdictions and continuedpenetration of existing markets and entering new distribution channels and by offering a new poker product line.
Strategic Priority Three: Invest in the establishment, development and operation of our interactive gamingproducts and services. In the December 2010 quarter, we launched a business-to-consumer, online casino websitefor residents in the United Kingdom, although we did not begin to market the site until February 2011. OurJackpotparty.com online casino offers a variety of our popular slot games and certain card and table games. Webelieve the success of our gaming content, technology foundation and interactive capabilities allows us toprovide online capabilities to consumers in other jurisdictions.
In fiscal 2012, we began earning revenues from our Lucky Cruise non-wagering social game on Facebookand revenues from the sale of select WMS games that have been ported to operate on mobile devices and PC’s.We further expanded our online, social, casual and mobile gaming presence through the acquisitions of Jadestoneand Phantom for $33.6 million in late fiscal 2012. We paid $16.4 million at closing, $0.5 million in theSeptember 2012 quarter, $2.1 in the December 2012 quarter and $3.2 million in the June 2013 quarter, and haveadditional consideration of a maximum of $10.7 million in the future for both acquisitions. In addition, werecorded a $1.0 million gain which was included in interest income and other income and expense, net in fiscal2013; partially offset by an increase in goodwill of $0.3 million in fiscal 2013 relating to other items. Theseacquisitions individually and in the aggregate were not material to our Consolidated Financial Statements.Additionally, in fiscal 2012 we entered into an agreement to provide an end-to-end B2B online casino site inBelgium in collaboration with Groupe Partouche, and beginning in the June 2013 quarter now provide a fullymanaged, end-to-end casino site in Belgium. Early in fiscal 2013, we entered into a strategic alliance withDragonfish, the independent B2B division of 888 Holdings plc, which expands our B2B online product offeringin the United States with one of the world’s leading online poker solutions. In the United States, the States ofNevada, New Jersey, Delaware and New Jersey have adopted legislation to legalize certain forms of onlinegaming. Federal legislators and certain other state legislators, as well as, governments in Canada and Europehave legalized or are considering legalizing certain forms of online gaming, which, if passed, could expand ourrevenue opportunities depending on the type of online gaming approved. The breadth and timing of theseopportunities remain uncertain due to the political process in each of these jurisdictions, as well as the difficultcredit environment facing our customers and the risk of continued economic uncertainty. In July 2012, welaunched Jackpot Party Social Casino on Facebook and in the March 2013 quarter, we launched this applicationon the Apple iOs system for iPhone and iPad platforms and in the June 2013 quarter, we launched thisapplication on the Android platform, all of which enhanced our revenue earning opportunities. In the March 2013quarter, we launched the first WMS games on Jadestone’s servers to several of Jadestone’s customers. We willfocus on the revenue growth, development and market efficiencies of our worldwide online, social, casual andmobile gaming products and services to optimize the benefits of our interactive gaming products and services forcasino operators and their players. As regulated markets legalize interactive online gaming, we intend to enterand do business in those markets.
Strategic Priority Four: Drive Margin Improvements. We have cross-functional teams focused on marginimprovement and several of our strategy deployment projects focus on different aspects of margin improvement.We continue to implement lean sigma initiatives (i.e. processes which help us focus on improving quality andeliminating non-value added steps) to further our process improvement initiatives and improve the flow of ourbusiness transactional processes. We also benefit from raw material sourcing initiatives and, once thereplacement cycle shortens, we expect to benefit from an expanded volume of business, which should result ingreater volume discounts of raw material component parts from our suppliers and enable us to spread ourmanufacturing overhead cost over a larger number of units thereby reducing cost per unit. We believe theseinitiatives will continue to drive margin improvement in future years, especially with the margin improvement
15
progress on our Bluebird xD, Bluebird2e and Blade product lines, where we expect to improve margins to bemore comparable to our Bluebird2 product line.
Design, Research and Product Development
We are continually developing new games to refresh the installed base of our gaming machines andimplementing new hardware, operating system and software technologies and functionality to enhance playerentertainment. We utilize our unique Player Driven Innovation approach to develop new games andtechnologies, which has resulted in the creation of innovative products. We also perform market tests of ourproducts with the cooperation of casino operators to assess reliability and player appeal of new games, newhardware, new operating system and software technologies. Our gaming machines and games are usuallydesigned and programmed by our internal engineering staff and game development studios. Our game designteams operate in a studio environment that encourages creativity, productivity and cooperation among designers.
Our Chicago research and development facility is a state-of-the-art technology campus that houses most ofour research and development team, including four game development studios and in July 2012, we completedconstruction of a new 120,000 square foot facility to provide for further growth. We have additional gamedevelopment studios in Las Vegas, Sydney and Pune with additional research and development staff in Atlanta,Las Vegas and Reno. Each of our game development studios works concurrently on multiple games and isstaffed with producers, software developers, graphic artists, mathematicians, composers and game designers. Insome cases, we may outsource testing and graphic design functions to independent firms under contract to us. Inaddition, we have a defined process to review new game ideas submitted by third parties for consideration by usto license, develop and commercialize.
During fiscal 2013, 2012 and 2011, we expensed $114.5 million, $94.5 million and $117.0 million,respectively, of design, research and product development costs, including $3.0 million in fiscal 2011 related tothe write-down of intellectual property assets. In fiscal 2014, based on our current plans, we expect to increaseour spending to grow our interactive gaming products and services and also increase spending to accelerateproduct innovation efforts but we expect that research and development expenses to decrease to 15% to 16% ofrevenues.
Sales and Marketing
We are authorized to sell or lease our gaming machines to casinos in 217 tribal jurisdictions, 33 statejurisdictions and 161 international gaming jurisdictions worldwide. See “Government Regulation” below. Inmost gaming jurisdictions, we sell our gaming machines directly, rather than through distributors, which webelieve allows us to provide superior customer service and enhances profitability. We also distribute WMSgames that are ported to online, social, casual and mobile gaming platforms. No single customer, includingcorporate customers with multiple casino properties, accounted for 10% or more of our revenues in fiscal 2013,2012 or 2011.
We sell and lease our gaming machines through 32 salespeople in offices in several United States locations,and 21 salespeople in international locations. Our salespeople earn a salary and commissions on both productsales and gaming operations revenues generated. The sale and lease of gaming machines takes place throughoutour fiscal year and the order sizes typically range from a small quantity of units to several hundred units. Weconduct one-on-one meetings with our customers to demonstrate our products at their locations, host customersat private demonstrations in our offices and at other locations and participate in various trade shows domesticallyand internationally each year. In certain cases, we respond to competitive requests for proposals from private andpublic entities who are seeking to purchase gaming machines. We advertise in trade and consumer publicationsthat appeal to casino operators, their employees and casino patrons. Usually, with the launch of a featuredproduct or product category, we will design web-based learning experiences for both employees and customers.
16
We use thematic and interactive web-based micro sites as a means to educate our customers and players aboutour products, and allow them to learn and explore different aspects of our products at their convenience, whilealso providing instant win and sweepstakes prizes.
Our field service team is a customer-focused organization, responsible for attending to the needs of ourcustomers. Our field service technicians install, remove and convert gaming machines at the customer’s request,work with our customers in performing routine maintenance on participation gaming machines owned by us thatare located at our customers’ casinos, initiate sales of replacement parts and conversion kits and assist withgeneral maintenance of gaming machines owned by our customers. We also have a centralized call center thatallows us to be even more responsive to our customers’ needs.
For international markets, we have translated our most popular games into Spanish, Portuguese, French,Italian and Mandarin Chinese. In fiscal 2013, Canada accounted for approximately 13%, or $88.7 million, of ourtotal revenues. No single country outside of the United States accounted for 10% or more of our revenues infiscal 2012 or 2011. Revenues derived from customers outside of the United States accounted for approximately$232 million, including the $88.7 million from Canada for fiscal 2013 and revenues derived from customersoutside of the United States accounted for approximately $209 million and $260 million for fiscal 2012 and2011, respectively. Geographic revenue information is determined by country of destination. Substantially allinternational sales are made in United States dollars. Revenue from participation games has been primarilylimited to Canada and the United States, and we expect this trend to continue. See Note 17. “Information onGeographic Areas,” to our Consolidated Financial Statements.
About half of our product sales revenues are sold on normal payment terms of 30 to 120 days and half aresold with extended payment terms for periods up to one year and beyond, and in some cases for terms up to threeyears, with interest at market rates in excess of our borrowing rate recognized for terms greater than twelvemonths. Our international expansion has required us to provide, in certain jurisdictions, a greater amount offinancing terms of 18 to 36 months.
Also, as a result of the financial market crisis, which began in 2008 and led to reduced consumerdiscretionary spending and a weakened global economic environment, beginning in the March 2009 quarter webegan and have continued to provide a greater amount of extended payment terms to customers. This expandedextended payment term program is expected to continue for the foreseeable future, until the global economy andconsumer discretionary spending improve and customer demand for extended payment terms abates. Typically,these sales result in a higher selling price which provides added profitability to the sale. We believe ourcompetitors have also expanded their use of extended payment terms to finance customer receivables. Inaggregate, we believe that by expanding our use of extended payment terms, we have provided a competitiveresponse in our market and that our revenues have been favorably impacted. We are unable to estimate theimpact of this program on our revenues.
We have 3 sales people for our interactive gaming products and services. Our marketing activity relating tointeractive gaming products and services is unique to each distribution channel:
➣ Operating our own, proprietary B2C website in the UK branded as Jackpotparty.com. Our marketingactivities are primarily focused on online advertising and use of affiliates in order to increase traffic toour website. Additionally, we utilize bonusing and promotions much like a traditional casino.
➣ Operating a white-label, B2B website on behalf of a licensed casino operator. Depending on theparticular agreement, we may conduct marketing activities much like we do for business-to-consumerwebsite.
➣ Providing WMS games to legalized online gaming operators. As we do not operate the online gamingwebsites, and are just a content provider, we typically do not spend a significant amount on marketingour products directly to operators or players.
17
➣ Operating a social casino game on Facebook and various mobile platforms. We currently have onesocial casino game, Jackpot Party Social Casino, that players can access via Facebook and variousmobile platforms. A majority of our marketing spend is with Facebook, in which we design ads that arethen seen by Facebook desktop and mobile users.
Competition
The gaming machine and interactive gaming products and services markets are highly competitive and thesemarkets are characterized by the continuous introduction of new games and new technologies, and for the gamingmachines market, new gaming machines. Our ability to compete successfully in these markets is based, in largepart, upon our ability to:
➣ Develop and offer games and gaming machines with higher earnings performance than the games andgaming machines offered by our competitors;
➣ Create an expanding and constantly refreshed portfolio of games;
➣ Identify and develop or obtain rights to commercially marketable intellectual properties;
➣ Adapt our products for use with new technologies;
➣ Implement product innovation;
➣ Offer mechanical and electronic reliability;
➣ Generate brand recognition;
➣ Implement effective marketing and customer support; and
➣ Offer competitive prices, payment terms and lease terms.
We estimate that about 25 companies in the world manufacture gaming machines, VLTs and VGTs forlegalized gaming markets. Of these companies, we believe that Aristocrat, Bally, IGT, Konami, Lottomatica’sG-Tech Holdings subsidiaries Atronic Casino Technology and SPEILO International, Multimedia Games, Inc.,the Novomatic Group of Companies, Ainsworth Game Technology, Aruze Gaming America, Inc. and WMS havethe preponderance of this worldwide market. In the categories of video and mechanical reel gaming machines,we compete with market leader IGT, as well as Ainsworth Game Technology, Aristocrat, Aruze GamingAmerica, Inc., Lottomatica’s Atronic Casino Technology subsidiary, Bally, Franco Gaming Ltd., Konami,Multimedia Games, Inc. and the Novomatic Group of Companies. In the VLT and VGT category, we competeprimarily with Bally, IGT, Lottomatica’s G-Tech Holdings and SPEILO subsidiaries and Scientific Games.
Our competitors vary in size from small companies with limited resources to a few large multi-nationalcorporations with greater financial, marketing and product development resources than ours. The largercompetitors, particularly IGT, have an advantage in being able to spend greater amounts than us to develop newtechnologies, games, products and invest in online, social, casual and mobile gaming. In addition, some of ourcompetitors have developed, sell or otherwise provide to customers security, centralized player tracking andaccounting systems, which allow casino operators to accumulate accounting and performance data about theoperation of gaming machines, and we do not offer such products.
Our interactive gaming products and services competitors are as follows:
➣ Business-to-consumer and managed services: Our primary competition is other operators that offeronline gaming to UK residents. While there are hundreds of such operators, we estimate the largestcompetitors to be: Playtech, William Hill, Redfinger Trading Ltd., Mandalay Gaming Holdings Ltd.,Ladbrokes, Mr. Green & Co. and SPEILO International.
18
➣ Game Server: Our primary competition is other operators that offer online gaming to players throughoutEurope, and we believe the largest competitors to be: Playtech, Net Entertainment, MicrogamingSoftware Systems Ltd., IGT, NYX Gaming Group and SPEILO International.
➣ Jackpot Party Social Casino: Our primary competition is other operators offering casino-based gameson Facebook or mobile platforms, and consist of: the DoubleDown Interactive subsidiary of IGT,Caesars Entertainment Corporation, Big Fish Games Inc., Playtika Ltd., Blue Shell Games LLC. andZynga Inc.
Manufacturing
We currently manufacture substantially all of our gaming machines at our facility in Waukegan, Illinois. Weare continuously reconfiguring our assembly lines in order to lower our manufacturing lead times, eliminatewasteful activities, improve productivity and effectively increase our production capacity. We also refurbish usedgaming machines at our Las Vegas facility. We implemented a few finishing lines in both our Las Vegas andBarcelona offices in fiscal 2012 that will allow us to be more responsive to customer demand. These lines willallow for the completion and testing of our gaming machine assemblies, which will be mostly assembled in ourWaukegan facility.
Manufacturing commitments are generally based on expected quarterly sales orders from customers. Due touneven order flow from customers, component parts common to all gaming machines are purchased andassembled into a partial product that are inventoried to be able to quickly fill final customer orders. Ourmanufacturing processes generally consist of assembling component parts and sub-assemblies into a completegaming machine. Through the use of lean sigma processes in the design of our Bluebird2, Bluebird xD,Bluebird2e, Blade and Gamefield xD gaming machines and setting up the supply chain processes for thesegaming machines, we expect to achieve our operating and strategic sourcing initiatives, and we currently can shipa standard black Bluebird2 gaming machine within less than two weeks of receiving the signed customer order,which is less than the lead time for our original Bluebird cabinet product.
We generally warrant our new gaming machines sold in the U.S. for a period of 365 days, while we warrantour gaming machines sold internationally for a period of 180 days to one year. Our warranty costs have not beensignificant. We provide several after-sale services to our customers including customer education programs,24-hour customer service telephone hot line, a website for technical support, field service support programs andspare parts programs. We also sell used gaming machines, including products made by us as well as thoseproduced by our competitors which we have taken back as trade-ins from our customers. Generally, we acquireused gaming machines as trade-ins toward the purchase of new gaming machines. We also sell participationgaming machines, after refurbishment, as used gaming machines when we no longer need them in our gamingoperations and we also harvest parts from Bluebird participation gaming machines to sell to customers as spareparts to support the estimated over 50,000 of such gaming machines still in casinos today. While a smallsecondary market exists in the United States, used gaming machines are typically sold direct by us internationallyor to United States-based distributors and then resold in international markets where the higher price point of anew gaming machine may be too costly. Where appropriate, we incur costs to recondition our used gamingmachines for resale or we may elect to destroy the used gaming machines. We also sell used gaming machines inlots on an “as is” basis to licensed used equipment brokers and customers.
The raw materials used in manufacturing our gaming machines include various metals, plastics, wood, glassand numerous component parts, including electronic subassemblies, computer boards and LCD screens. Webelieve that our sources of supply of component parts and raw materials are generally adequate and we have fewsole-sourced parts.
We continue to implement cost savings and efficiency initiatives and focus on best practices, including leansigma, to improve the efficiency of our manufacturing processes and reduce time to fulfill orders. We continue tomake improvements in sourcing and supply management, in inventory and warehouse management and other
19
manufacturing processes. We are implementing a new sales operations strategy in an effort to produce gamingmachines more ratably throughout the quarter, with the goal of significantly reducing quarter-end compression inmanufacturing. We also have ongoing initiatives, such as new product introduction, enhanced strategic sourcingand supplier management, value engineering the products and designing products for both ease ofmanufacturability and installation, that we expect will help improve margins in future years.
Patent, Trademark, Licenses, Copyright and Product Protection
Each game, gaming machine and associated equipment embodies a number of separately protectedintellectual property rights, including trademarks, copyrights and patents. We believe these intellectual propertyrights are significant assets to our business in the aggregate. During fiscal 2013, 2012 and 2011, we utilized threetechnologies licensed from two separate third parties in substantially all of our gaming machine products we soldor leased.
We seek to protect our investment in research and development and the unique and distinctive features ofour products and services by maintaining and enforcing our intellectual property rights. Our capitalized patents,trademarks and licenses have remaining useful lives of up to 10, 5 and 10 years, respectively. We believe that theexpiration of those patents, trademarks and licenses with expiration dates in the near future will not have amaterial impact on our business. See Note 9. “Intangible Assets” to our Consolidated Financial Statements.
We have obtained patent protection covering many of our products. We were granted 230 U.S. patentsduring fiscal 2013, 124 during fiscal 2012 and 44 during fiscal 2011, and continue to apply for many patents inthe United States and elsewhere to protect inventions in our products and resulting from our research anddevelopment efforts. We have approximately 700 patent applications pending in the United States as well as inmany foreign countries. We generally seek to obtain trademark protection in the U.S. for the names or symbolsunder which we market and license our significant products and game concepts. We also rely on our copyrights,trade secrets and proprietary know-how. In addition, some of our most popular gaming machines are based ontrademarks and other intellectual property licensed from third parties. We file for patent rights and trademarkprotection internationally in a number of key countries, based upon the nature of the patent or trademark, thelaws of the given country and our anticipated product placements in that country.
Brand Licenses and Technology
We believe that our use of licensed brand names and related intellectual property contributes to the appealand success of our products, and that our future ability to license, acquire or develop new brand names isimportant to our continued success. Therefore, we continue to invest in the market positioning of WMS and theawareness and recognition of our brand names and brand names that we license. WMS’ portfolio of licensesincludes industry leading WMS brands such as Jackpot Party, Life of Luxury and Reel ‘em In.
Certain of our games are based on popular brands licensed from third parties, such as Hasbro International,Inc. (“Hasbro”), Fremantle Media North America, CBS Studios Inc., Turner Entertainment Co. and Warner Bros.Consumer Products Inc. (“Warner Bros.”). Typically, we are obligated to make minimum guaranteed royaltypayments over the term of the license agreement and to make advance payments against those commitments. Thelicensor typically must inspect and approve any use of the licensed property.
On June 11, 2009, we entered into a new long-term license agreement with Hasbro whereby we agreed tolicense certain intellectual property and proprietary rights owned or controlled by Hasbro in titles such asMONOPOLY, BATTLESHIP™, YAHTZEE™, THE GAME OF LIFE and CLUE brands for use in our gamingmachines. The agreement was effective April 1, 2009 and has an initial term through December 31, 2016. Wehave the right to extend the license for an additional three-year term if certain conditions are satisfied. Wecurrently have approvals for more than 60 MONOPOLY branded games, including 20 MONOPOLY WAP games.
20
On October 31, 2006, we entered into a long-term license agreement with Warner Bros. under which welicense certain intellectual property owned or controlled by Warner Bros. for the 1939 motion picture “TheWizard of Oz” for use in our gaming machines. We amended this agreement in July 2011 so that it now runsthrough 2020. Other licensed brands we use in our products include: an exclusive agreement to develop, marketand distribute games using the brands THE PRICE IS RIGHT; THE LORD OF THE RINGS; HAPPY DAYS™and STAR TREK™ brands, among others.
The following three licensed technologies are utilized in substantially all of our gaming machine products:
Several of our competitors have pooled their intellectual property patents that provide cashless gamingcapabilities, specifically ticket-in ticket-out technology. Using this technology, when casino patrons cash outfrom a gaming machine they receive a printed ticket instead of coins. We have a non-exclusive, royalty-bearinglicense for certain patents related to this technology with IGT through the expiration date of the relevant patentsand we pass through the license fee to our customers for product sales.
The original operating system for our Bluebird gaming machines, the CPU-NXT platform, was developed in2003 by Sierra Design Group Inc. We have a perpetual license to use this technology and have no continuingpayment obligation for this license. Our CPU-NXT2 and CPU-NXT3 operating systems were developedinternally and are based on the CPU-NXT platform.
In February 2008, we entered into a ten-year non-exclusive, royalty-bearing patent cross-license agreementwith IGT. This agreement provides for a cross license of intellectual property evidenced by certain patents ownedby each of us relating to computing and networked gaming infrastructures.
Government Gaming Regulation
General
We sell our games and gaming machines in legal gaming jurisdictions worldwide. The manufacture anddistribution of gaming equipment and related software is subject to regulation and approval by various city,county, state, provincial, federal, tribal and foreign agencies.
We believe we hold all of the licenses and permits necessary to conduct our business. In all, we areauthorized to sell or lease our gaming machines to casinos, including jurisdictions that do not require licensing,in 411 jurisdictions worldwide, including approximately 161 international gaming jurisdictions.
We and our key personnel have obtained or applied for all approvals necessary to maintain compliance withthese regulatory agency requirements. The regulatory requirements vary among jurisdictions, but the majority ofjurisdictions require licenses, permits or findings of suitability for our company, individual officers, directors,major stockholders and key employees, and documentation of qualification. We must satisfy all conditions foreach gaming license or permit. Our gaming equipment and software also must be approved either by a gamingagency laboratory or a private laboratory authorized by the gaming authority.
In some jurisdictions, regulators monitor not only the activities within their own jurisdiction but alsoactivities that occur in other jurisdictions to ensure that the entities it licenses are in compliance with localstandards on a worldwide basis. Nevada is such a jurisdiction. The Nevada gaming authorities require us and ourgaming subsidiary, WMS Gaming, to maintain Nevada standards of conduct for all of our gaming activities andoperations worldwide. To make our compliance efforts more efficient, we have centralized all licensing,compliance and non-product approval gaming regulatory matters, including the shipment of gaming equipmentand related software worldwide.
The gaming industry is complex and constantly evolving, particularly in new jurisdictions. We continue todevote significant resources to ensure regulatory compliance throughout our company. Additionally, we have an
21
active gaming compliance committee consisting of one outside consultant and two members of our board ofdirectors that works in concert with our regulatory compliance department to avoid any appearances ofimpropriety as a result of a business relationship or new market opportunity. We have never been denied agaming-related license, nor have our licenses ever been suspended or revoked.
Since the gaming law requirements of many jurisdictions are similar, we are not including descriptions of alljurisdictions due to the number of jurisdictions to which we are subject. For more information concerning theregulatory schemes to which we are subject, we have filed as an exhibit to this Annual Report on Form 10-K adescription of the Nevada regulations. The description of the Nevada regulations is a representative example ofthe gaming regulations to which we are subject. See Exhibit 99. “Gaming Regulations.”
Seasonality
See Item 7. “Management’s Discussion Analysis of Financial Condition and Results of Operations—Resultsof Operations—Seasonality.”
Employees
As of June 30, 2013, we employed 1,894 persons, including 309 that are internationally based.Approximately 205 of our domestic employees are represented by the International Brotherhood of ElectricalWorkers (the “IBEW”). Our collective bargaining agreement with the IBEW relates to our Waukegan, Illinoismanufacturing facility and expires on June 30, 2014. We believe that our relations with our employees aresatisfactory.
As a result of the restructuring we announced in the September 2011 quarter, we have streamlined ourproduct management and product development functions, simplified product plans and further prioritized on-timecommercialization of new game themes, products and portal gaming applications. As part of our restructuring, infiscal 2012 we implemented a 10% reduction in our workforce, most of which occurred in the September 2011quarter. We continue to review our costs and organizational structure to maximize efficiency and align expenseswith the current and long-term business outlook.
ITEM 1A.RISK FACTORS
We urge you to carefully review the following discussion of the specific risks and uncertainties that affectour business. These include, but are not limited to, the following:
We may not be able to obtain satisfaction of all conditions to complete our Merger with a subsidiary ofScientific Games in the anticipated timeframe:
➣ As previously announced, on January 30, 2013, WMS, Scientific Games and two subsidiaries ofScientific Games entered into the Merger Agreement, pursuant to which, subject to the satisfaction orwaiver of certain conditions, a subsidiary of Scientific Games will merge with and into WMS, withWMS surviving the Merger as a wholly owned subsidiary of Scientific Games. On March 11, 2013, wereceived notice from the Federal Trade Commission of the early termination of the waiting periodapplicable to the consummation of the Merger under the Hart-Scott-Rodino Antitrust Improvements Actof 1974, as amended. Approval of WMS’ stockholders was obtained on May 10, 2013. There are anumber of risks and uncertainties associated with the Merger, and completion of the Merger iscontingent upon customary closing conditions, including receipt of required regulatory approvals. Therecan be no assurance that the required regulatory approvals will be obtained or that such approvals willbe obtained without conditions that are not anticipated, that the other conditions of the Merger will be
22
satisfied or waived or that other events will not intervene to delay or result in the termination of theMerger. Furthermore, certain lawsuits have been filed challenging the Merger. These lawsuits couldresult in the Merger not being completed or in a delay in the completion of the Merger. We can give noassurance that the conditions to the Merger will be satisfied. Failure to complete the Merger mayadversely affect WMS.
While the Merger is pending, we are subject to business uncertainties and contractual restrictions that coulddisrupt our business:
➣ As we have already experienced and whether or not the pending Merger is completed, the pendingMerger may disrupt the current plans and operations of WMS, which has had and could continue to havean adverse effect on our business and financial results. Our employees and other key personnel mayhave uncertainties about the effect of the pending Merger and the uncertainties may impact our ability toretain, recruit and hire key personnel while the Merger is pending or if it fails. We have incurred andmay continue to incur unexpected costs, charges or expenses while the Merger is pending or resultingfrom the Merger. Furthermore, we cannot predict how our suppliers, customers and other businesspartners will view or react to the pending Merger and some have been and may in the future be hesitantto do business with us in light of uncertainties about our ability to perform due to the pending Merger. Ifwe are unable to reassure our customers, suppliers and other business partners to continue transactingbusiness with us, our financial results may be adversely affected.
➣ The pursuit of the Merger and preparations for integration have placed and will continue to place asignificant burden on many employees and internal resources. If, despite our efforts, key personneldepart because of these uncertainties and burdens, or because they do not wish to remain with acombined company, our business and financial results may be adversely affected.
➣ In addition, the Merger Agreement generally requires WMS to operate our business in the ordinarycourse of business pending consummation of the Merger and it also restricts WMS from taking certainactions with respect to its business and financial affairs without Scientific Games’ pre-approval, andthese restrictions could be in place for an extended period of time if the consummation of the Merger isdelayed. For these and other reasons, the pendency of the Merger could adversely affect our businessand financial results.
In the event that the pending Merger is not completed, the trading price of WMS common stock and WMS’future business and financial results may be negatively affected:
➣ The conditions to the completion of the Merger may not be satisfied as noted above. If the Merger is notcompleted for any reason, we would still remain liable for significant transaction costs and the focus ofour management would have been diverted from seeking other potential strategic opportunities, in eachcase without realizing any benefits of a completed Merger. Depending on the reasons for not completingthe Merger, we could also be required to pay a termination fee of $44.3 million. For these and otherreasons, a failed Merger could adversely affect our business and financial results. Furthermore, if we donot complete the Merger, the price of our common stock may decline significantly from the currentmarket price which may reflect a market assumption that the Merger will be completed withstockholders receiving $26.00 for each share of WMS common stock held.
Gaming licenses, regulatory approvals and gaming legislation impact the ability to operate our business andsell and lease our products:
➣ The manufacture and distribution of gaming machines, games, the operation of our online casino andremote game servers is subject to extensive federal, state, local and foreign regulations and taxes. Mostof the jurisdictions in which we operate require licenses, permits, documentation of qualification,including evidence of financial stability and other forms of approval of our company and our officers,directors, major security holders and key personnel, along with our products. Licenses, approvals or
23
findings of suitability may be revoked, suspended or conditioned. The loss of a license in onejurisdiction could trigger the loss of a license or affect our eligibility for a license in another jurisdiction.In addition, gaming authorities may levy fines against us or seize our assets if we violate gaming laws orregulations. We cannot assure you that we will be able to obtain or maintain all necessary registrations,licenses, permits or approvals, that the licensing process will not result in delays or adversely affect ouroperations and our ability to maintain key personnel, that we can comply with any new requirements orregulations adopted, or that complying with these regulations will not increase our costs.
➣ The laws and regulations governing gaming in various jurisdictions evolve and change over time. Thesechanges may require us to make changes to our gaming machines and games, levy additional taxes andfees on our revenues, increase our cost of compliance, or could cause restrictions on operations andreduce our profitability in certain jurisdictions. Changes in regulations may also create uncertainty andcause our customers to delay purchasing decisions. We cannot guarantee that we will not be adverselyimpacted by changes in gaming regulations.
➣ The gaming authorities in some jurisdictions may investigate companies or individuals who have amaterial relationship with us or our security holders to determine whether the selected individual orsecurity holder is acceptable to those gaming authorities. Any such investigated company, individual orsecurity holder must pay the costs of the investigation and such an investigation may be time consumingand distracting to our operations. Failure of companies, individuals or security holders to cooperate withany such investigation could negatively impact our ability to obtain or maintain our licenses.Additionally the regulatory review process and licensing requirements may preclude access to newthird-party technologies if those parties either are not willing to subject themselves to review or do notmeet regulatory requirements.
➣ Each of our games and gaming machine hardware and software and our interactive gaming products andservices must, when required, be approved in the jurisdictions in which it is operated, and we cannotassure you that a particular game and gaming machines, hardware, software or our interactive gamingproducts and services will be approved in any jurisdiction. Our networked gaming technology requiresregulatory approval in gaming jurisdictions prior to any shipment or implementation and, although wehave received approvals from some jurisdictions, we cannot assure you that we will receive theadditional approvals we would need to offer the product or service in other gaming jurisdictions.
➣ To expand into new jurisdictions, we may need to be licensed, obtain approvals of our products and/orseek licensure of our officers, directors, major security holders, key personnel or business partners. If wefail to seek, do not receive or receive a revocation of a license in a particular jurisdiction for our games,gaming machines, hardware, software or interactive gaming products and services, we cannot operate,sell or place on a participation or leased basis our products in that jurisdiction.
➣ Delays in, amendments to or repeals of legislation approving gaming or the expansion of gaming injurisdictions in which we operate or plan to commence operations may adversely affect our operations.Delays in approvals of our customers’ operations or expansions of their operations may adversely affectour operations.
➣ Some jurisdictions require gaming manufacturers to obtain regulatory approval before engaging incertain transactions, such as business combinations, reorganizations, borrowings, stock offerings andshare repurchases. Obtaining regulatory approvals can be time consuming and costly. We cannot assureyou that we will be able to obtain or maintain all necessary approvals or that the approval process willnot result in delays or changes to our business plans.
Our business is vulnerable to changing economic conditions and current unfavorable economic conditionshave impacted and could continue to negatively impact our business:
➣ Demand for our products and services depends largely upon favorable conditions in the gamingindustry, which is highly sensitive to players’ disposable incomes and gaming activities. Existingunfavorable general economic conditions reduce disposable income of casino patrons and result in fewer
24
patrons visiting casinos and lower amounts spent per casino visit. This decline in disposable incomecould result in reduced play levels on our participation gaming machines, causing our cash flows andrevenues from these products to decline. Additionally, higher airfares, gasoline prices and other costsmay adversely affect the number of players visiting our customers’ casinos. Current unfavorableeconomic conditions have also resulted in a tightening in the credit markets, decreased liquidity in manyfinancial markets and resulted in significant volatility in the credit and equity markets. Any significantor prolonged decrease in consumer spending on leisure activities could greatly affect the casinoindustry, causing some or all of our customers to decrease spending or ultimately declare bankruptcy,each of which would adversely affect our business.
➣ A decline in the relative health of the gaming industry and the difficulty or inability of our customers toobtain adequate levels of capital to finance their ongoing operations reduces their resources available topurchase our products and services, which adversely affects our revenues. If we experience a significantunexpected decrease in demand for our products, we could incur losses and also be required to increaseour inventory obsolescence charges.
➣ Furthermore, current unfavorable economic conditions have and could continue to impact the ability ofour customers to make timely payments to us. In mid-fiscal 2009, we began implementing a program toprovide a greater than historical amount of extended payment term financing arrangements to ourcustomers, which could increase our collection risk. We have continued this program throughout fiscal2013 and this program will likely continue until the economy and consumer discretionary spendingimproves. Our bad debt expense decreased by $3.1 million to $3.6 million as our total accounts andnotes receivable, net in fiscal 2013 increased by $4.7 million compared to fiscal 2012. We experiencedfewer customers filing for protection under the bankruptcy laws in fiscal 2013 than in fiscal 2012. Wedid however experience a higher level of customer refinancings in fiscal 2013 than in fiscal 2012.Financing to customers in connection with sales also increased in fiscal 2012 and 2013 as a result of acompetitive marketplace and a slow, challenging economic recovery. If customers are not able to payus, we may incur additional provisions for bad debt related to lack of collectability of certainreceivables.
➣ In fiscal 2012, we reduced our global workforce by approximately 10% and incurred pre-tax charges of$9.7 million primarily for cash severance costs and other expenses. The workforce reduction and anyfuture workforce or other expense reductions may have an adverse impact on our developmentactivities, costs and our ability to attract and retain key personnel.
Our revenue and profitability depend on our ability to continue to timely develop new technologies and highearning products and services that appeal to the player and are free from hardware or software anomalies andcannot be fraudulently manipulated:
➣ The gaming business is characterized by the rapid development of new technologies and theintroduction of new products using such technologies. We must continually adapt our products toincorporate new technologies and if we cannot adapt, or do not timely adapt new technologies, ouroperations may be adversely impacted.
➣ The success of a newly introduced technology is dependent on our customers’ acceptance of a dynamicchange in the way they manage their business and such acceptance may nevertheless only buildgradually over time. Delays in acceptance by our customers of new technologies have and may continueto adversely affect our operations.
➣ Our success depends upon our ability to adapt our manufacturing capabilities and processes to meet thedemands of producing new and innovative products. Because our newer products are generally moretechnologically sophisticated than those we have produced in the past, we must continually refine ourproduction capabilities to meet the needs of our product innovation. If we cannot efficiently adapt ourmanufacturing infrastructure to meet the needs of our product innovations, or if we are unable to makeupgrades to our production capacity in a timely manner, our business could be negatively impacted.
25
➣ Our success also depends on continually developing and successfully marketing new games, gamingmachines and our interactive gaming products and services with strong and sustained player appeal. Weare under continuous pressure to anticipate player preferences to gain acceptance of our new products,avoid jackpot fatigue (declining play levels on smaller jackpots) and continue to provide successfulproducts which garner a high level of play. A new game or gaming machine will be accepted by ourcustomers only if we can show that it is likely to produce more revenue and net win to a casino operatoror player appeal to an interactive customer than our existing products and services or our competitors’products and services in some cases. Gaming machines can be installed in casinos on a trial basis, andonly after a successful trial period are the gaming machines purchased by the casinos. Additionally, weare at risk that customers may cancel pending orders for products that are not performing to expectationsat other casinos. If a new product does not achieve significant market acceptance, we may not recoverour development, regulatory approval and promotion costs.
➣ Participation gaming machines are replaced on short notice by casino operators if the gaming machinesdo not meet and sustain revenue and profitability expectations. Therefore, these gaming machines areparticularly susceptible to pressure from competitors, declining popularity, changes in economicconditions and increased taxation and are at risk of replacement by the casinos, which would end ourrecurring revenues from these gaming machines unless they can be placed with another customer orrepurposed.
➣ Our success depends on our ability to avoid, detect, replicate and correct software and hardwareanomalies and fraudulent manipulation of our gaming machines and our interactive gaming productsand services. All of our games are designed with security features to prevent fraudulent activity.However, we cannot guarantee that these features will effectively stop all fraudulent activities. If oursecurity features do not prevent fraud, we could adversely be affected.
➣ Our gaming machines have experienced anomalies and fraudulent manipulation in the past. Games andgaming machines may be replaced by casinos and other gaming machine operators if they do notperform according to expectations, or may be shut down by regulators. The occurrence of anomalies in,or fraudulent manipulation of, our gaming machines and our interactive gaming products and servicesmay give rise to claims for lost revenues and earnings and related litigation by our customers and maysubject us to investigation or other action by gaming regulatory authorities including suspension orrevocation of our gaming licenses, or other disciplinary action. Additionally, in the event of such issueswith our gaming machines and our interactive gaming products and services, substantial engineeringand marketing resources may be diverted from other projects to correct these issues, which may delayour other projects.
➣ In the past, we have experienced delays in launching new products due to the complexity or innovativetechnologies imbedded in our products. Especially in our gaming operations, such delays can cause adecrease in our revenue. As a result of not having as many new participation game themes approved aswe anticipated, performance of some of our older game themes have lagged resulting in a higher level ofremovals of participation gaming machines, which can cause a reduction in the installed base and ourrevenues and profits. We cannot assure you that we will be able to obtain or maintain all necessaryapprovals or that the approval process will not result in delays or changes to our business plans.
➣ Our network gaming applications interface with each gaming machine operating system software thatwe refer to as a “game platform.” The game platform manages the software needed to operate thegaming machine. Our network gaming applications, game platforms and the related computer systemsare constantly updated and revised to keep pace with the ever-increasing complexity of modern gameplay, technology and regulatory requirements. We cannot assure you that we will be able to obtain,maintain or manage the level of complexities arising from network gaming applications and gamingplatforms and obtain all necessary approvals or that the approval process will not result in costly delays,lost network gaming application revenue or changes to our business plans.
26
We are dependent on our intellectual property and trade secrets and must ensure we are licensed to useintellectual property and trade secrets owned by others:
➣ Our competitors have been granted patents covering, among other items, numerous gaming machinefeatures, bonusing techniques and related technologies. If our products use processes or other subjectmatter that is claimed under our competitors’ patents, or if other companies obtain patents claimingsubject matter that we use, those companies may bring infringement actions against us. We might thenbe forced to discontinue the affected products or be required to obtain licenses from the companyholding the patent, if it is willing to give us a license, to continue to develop, manufacture or market ourproducts. We might also be found liable for treble damage claims relating to past use of the patentedsubject matter if the infringement is found to be willful.
➣ Substantially all of our gaming machines and our interactive gaming products and services utilizetrademarks, technologies and other intellectual properties licensed from third parties. Our future successmay depend upon our ability to obtain, retain and/or expand licenses for popular technologies andintellectual properties in a competitive market. In the event that we cannot renew and/or expand existinglicenses, we may be required to discontinue or limit our use of the games or gaming machines that usethe licensed technology or intellectual property or bear the licensed marks.
➣ Our success may depend in part on our ability to obtain trademark protection for the names or symbolsunder which we market our products and to obtain copyright protection and patent protection of ourproprietary technologies, intellectual property and other game innovations. We cannot assure you thatwe will be able to build and maintain goodwill in our trademarks or obtain trademark or patentprotection, that any trademark, copyright or issued patent will provide competitive advantages for us orthat our intellectual properties will not be successfully challenged or circumvented by competitors.
➣ We also rely on trade secrets and proprietary know-how. We enter into confidentiality agreements withour employees and independent contractors regarding our trade secrets and proprietary information, butwe cannot assure you that the obligation to maintain the confidentiality of our trade secrets orproprietary information will be honored. Despite various confidentiality agreements and other tradesecret protections, our trade secrets and proprietary know-how could become known to, orindependently developed by, competitors.
➣ We have entered into multiple agreements to license intellectual property and technologies that, as ofJune 30, 2013, had a net book value of $106.4 million and total potential future commitment of $60.8million. We also have other finite-lived intangible assets, including patents and trademarks, withaggregate net book value of $25.5 million as of June 30, 2013. If we determine that we may not realizethe value of any of the finite-lived intangible assets, net or commitments, we would record an immediatecharge against earnings up to the full amount of these net assets or commitments in the period in whichsuch determination is made. See Note 9. “Intangible Assets” to our Consolidated Financial Statementsfor further information on the amount of intangible assets recorded on our Consolidated Balance Sheetsand Note 15. “Commitments, Contingencies and Indemnifications” to our Consolidated FinancialStatements for further information on total potential future commitments.
Our future profits may be limited or reduced due to the slow growth of new gaming jurisdictions or additionalcasinos in existing jurisdictions, declines in the replacement cycle of gaming machines, and ownershipchanges and consolidation in the casino industry:
➣ Demand for our products is driven by the establishment of new land-based or online gamingjurisdictions, the opening of additional casinos in existing jurisdictions or expansion of existing casinosand the replacement of existing gaming machines. Governments usually require a public referendumand legislative action before establishing or expanding gaming, whether in a land-based or onlinejurisdiction. The debate over gaming is extensive with various organizations actively opposing gaming.Opposition to gaming could restrict or prohibit the approval, continuation or expansion of our gamingoperations and thereby limit or reduce our future profits.
27
➣ The opening or expansion of casinos fluctuates with demand, economic conditions and the availabilityof financing. Slow growth in the opening or expansion of casinos, or low levels of demand for gamingmachine replacements, could reduce the demand for our products and our future profits. Moreover,because repeat customers represent a substantial part of our sales, our business and profits could beaffected if our customers are sold to or merge with other entities. Such entities may purchase moreproducts and services of our competitors, or reduce spending on our products, or cause downwardpricing pressures. The consolidation among casino operators could result in order cancellations, aslowing in the replacement cycle for existing gaming machines, or require our current customers topurchase our competitors’ products, any of which could negatively impact our business.
Our industry is competitive:
➣ The gaming business is intensely competitive. We compete on price, pricing models, financing terms,and the content, features and functionality of our hardware and software products and services. Some ofour competitors are large companies with greater financial, marketing and product developmentresources than ours. In addition, new competitors may enter our key markets, as evidenced by an influxof small gaming equipment companies that have entered the market over the last few years. Thisincrease in equipment companies has increased competition in recent years. Additionally, theconsolidation of casino operators, and reduction in capital expenditures by casino operators resultingfrom the economic downturn and decreased player activity has significantly increased the level ofcompetition among both casino operators and equipment companies. This increased level of competitionhas caused more customers to focus on price in addition to performance, longevity, and playeracceptance when selecting gaming equipment.
➣ Another competitive factor in our industry is the competition to obtain space and favorable placementon casino gaming floors. Competitors with a larger installed base of gaming machines and game themesthan ours have an advantage in obtaining and retaining the most space and best positions in casinos andestablished online casinos have the advantage of an established player network.
➣ In addition, some of our competitors have developed and sell or otherwise provide to customerscentralized player tracking and accounting systems, which allow casino operators to accumulateaccounting and performance data about the operation of gaming machines. By not having such systems,we are at a competitive disadvantage.
➣ Our profitability is somewhat dependent on our ability to successfully enter into new markets and newchannels of distribution, such as networked gaming software applications and interactive gaming. Wecurrently operate an online casino and offer other interactive gaming products and services, but wecannot guarantee user acceptance, expansion of markets or profitability for our interactive gamingproducts and services. While we have expanded into social gaming, several of our competitors and othercompanies have also entered the market and we expect to see more companies explore this opportunityin the coming years. We cannot assure you that our interactive gaming products and services willcontinue to be popular or that we will be able to attract the attention of players as the market becomesflooded with new offerings.
➣ In certain sales of new gaming machines and placement of participation gaming machines we haveoffered free gaming machines and/or free conversion kits, while at the same time we continue to chargeour customers for gaming machines and conversion kits, including CPU-NXT and CPU-NXT2 operatingsystem upgrade kits. We cannot be sure that competitive pressure will not cause us to increase thenumber of free gaming machines and conversion kits that we are expected to offer to our customers,which would decrease the revenue we expect to receive.
➣ We have expanded our use of extended payment term financing of customer’s purchases over the lastfour years and expect to continue providing a higher level of extended payment term financing until theeconomy improves and demand from our customers for such financings abates. We believe that ourcompetitors have also increased the amount of extended payment term financings offered to customers.
28
As some of our competitors are larger than we are they may be able to provide a greater amount orbetter terms than we can and that may impact demand for our products. In addition, both extendedpayment term financing and operating leases result in a delay in our receipt of cash, which reduces ourcash balance and financial flexibility to respond to changing economic events.
Our business is subject to political, market and financial risks:
➣ The gaming industry can be affected by public opinion of gaming. In the event that there is a decline inpublic acceptance of gaming, either through unfavorable legislation affecting the introduction of gaminginto emerging markets, or through legislative and regulatory changes, including tax increases in existinggaming markets, our ability to continue to sell and lease our gaming machines and operate ourinteractive gaming products and services in those markets and jurisdictions would be adversely affected.We cannot assure you that public opinion will continue to support legalized gaming. In addition, oursocial gaming efforts, including our Jackpot Party Social Casino, are currently not regulated and wecannot assure you that if regulations were to be implemented for social gaming that our revenues, profitsand cash flow from such revenue sources would not significantly decline.
➣ Our operating income is impacted by decreases to our selling prices, average daily revenue andinteractive gaming products and services daily revenues and increases to our costs of products sold andcost of gaming operations, including higher material costs due to the fluctuating commodities markets,higher labor costs, increased freight charges reflecting escalating gas prices or increased fees to operateour social games on Facebook or mobile devices. We may experience lower operating income in thefuture if any of these events occurs.
➣ We face risks associated with doing business in international markets related to political and economicinstability, terrorist activity and related foreign currency fluctuations. Unstable governments andterrorist activity may adversely affect the number of patrons visiting casinos, which in turn may reducedemand for our products and the financial ability of our casino customers to pay outstandingobligations. Changes in regulatory enforcement, treaties and legislation may affect the internationalgaming market with respect to gaming regulation, taxation, tariffs and import duties and the legality ofgaming in some markets. Other developments in international markets could also adversely affect ourfinancial condition and results of operations, including for example the effect of data privacy regulationson our online business, foreign government or U.S. regulations relating to exports or imports (asoccurred in fiscal 2012 and 2013 in Argentina), adverse changes in the creditworthiness of casinocustomers with which we have considerable receivables, and the expropriation, nationalization andrestrictions on repatriation of assets or funds (as occurred in fiscal 2012 and 2013 in Argentina).Additionally, we may have increased costs in connection with complying with international laws.
➣ Foreign governments can impose restrictions on currency movements that might make it costly orimpossible to transfer money to the U.S. In fiscal 2012, the governmental authorities in Argentinamodified the rules related to importing product and limiting the exchange of pesos into dollars and thetransfer of funds from Argentina. This has been a dynamic situation and we continue to monitor itclosely. Currently our legal entity in Argentina cannot directly import our gaming machines, and if thegovernmental authorities do not change their rules, or we are unable to continue to utilize the alternativemethods to import product into Argentina and are then unable to find other alternative methods toimport product into Argentina, our revenues from customers in Argentina will be lower in fiscal 2014than in fiscal 2013. Our accounts and notes receivable, net in Argentina at June 30, 2013, was $46.3million, which is denominated in U.S. dollars, although customers pay us in pesos at the spot exchangerate between the peso and the U.S. dollar on date of payment. At June 30, 2013, we held approximately28.9 million pesos, or $5.4 million, of cash and cash equivalents in our bank accounts in Argentina,down in pesos from 58.0 million pesos, or $12.8 million, at June 30, 2012. During the twelve monthsended June 30, 2013, we were able to convert pesos to dollars and transferred $28.7 million to our U.S.bank accounts, although this reduced our net income due to increased foreign currency losses. If thegovernment in Argentina decides to devalue the peso, we would record charges in our Consolidated
29
Statements of Income based on the amount of pesos in our bank account and our customers would berequired to pay us a greater amount of pesos when paying our invoices in the future and we cannotguarantee that customers will be able to pay such higher amounts. Without any changes in the Argentinegovernment’s current restrictions on currency transfer, we expect the amount of pesos in ourArgentinian bank account to grow as we collect our Argentinian accounts and notes receivable in fiscal2014 and beyond which would increase our exposure to any currency devaluation.
➣ Compliance with applicable environmental, health and safety laws and regulations, including newregulations requiring higher standards, may increase our costs, limit our ability to utilize our currentsupply chain and force design changes to our products. These changes could reduce the net realizablevalue of our inventory, which would result in an immediate charge to our Consolidated Statements ofIncome. Non-compliance could negatively impact our operations and financial position as a result offines, penalties and the cost of mandated remediation or delays to our manufacturing.
➣ If we cannot maintain and execute adequate internal control over financial reporting or implementrequired new or improved controls that provide reasonable assurance of the reliability of the financialreporting and preparation of our Consolidated Financial Statements for external use, we may sufferharm to our reputation, fail to meet our public reporting requirements on a timely basis or be unable toproperly report on our business and the results of our operations. Additionally, the inherent limitationsof internal control over financial reporting may not prevent or detect all misstatements or fraud,regardless of the adequacy of those controls.
➣ Our credit facility contains financial covenants which may restrict our ability to, among other things,make certain levels of capital expenditures; incur additional debt; incur liens; change the nature of ourbusiness; merge with or acquire other companies; liquidate or dissolve; limit share repurchases; and sell,transfer, lease or dispose of all or substantially all of our assets.
New products may be subject to complex revenue recognition standards, which could materially affect ourfinancial results:
➣ As we introduce new products and our commercial transactions become increasingly complex,additional analysis and judgment is required to account for them and to recognize revenues inaccordance with generally accepted accounting principles. Transactions may include multiple elementarrangements and/or software components and applicable accounting principles or regulatory productapproval delays could change the timing of revenue recognition and could adversely affect our financialresults for any given period. Fluctuations may occur in our revenues and related deferred revenues andreflect our continued shift toward more multiple element contracts that include systems and software.
We are dependent on our employees:
➣ The loss or unavailability of one or more of our executive officers or the inability to attract or retain keyemployees in the future could have an adverse effect on our operations. Such losses may accelerate priorto, at or after the closing of our pending acquisition by Scientific Games.
➣ Our ability to continue to develop new technologies and create innovative products depends on ourability to recruit and retain talented employees. A lack of skilled technical workers or hesitancy to joinour company prior to, at or after the closing of our pending acquisition by Scientific Games could delayor negatively impact our business plans.
➣ Our manufacturing facility in the United States is dependent on union employees that are represented bythe IBEW under a collective bargaining agreement that was renegotiated in June 2011 and expires onJune 30, 2014. While we believe our relations with our employees are satisfactory, we cannot predictwhether we will be successful in negotiating a new collective bargaining agreement without anydisruptions in our manufacturing. Any disruption in our manufacturing could have an adverse effect onour revenues and expenses.
30
We substantially completed a major upgrade to our enterprise resource planning system (“ERP”), whichprocess presents a number of significant operational risks:
➣ From time to time, it becomes necessary for us to upgrade our ERP system and other managementinformation systems which are critical to our operational, accounting and financial functions. Duringfiscal 2013, we substantially completed a major upgrade to our enterprise-wide Oracle ERP system.While the upgrade is substantially complete, the implementation included system revisions, processmodifications, integration with other systems, data verification, training of and adaption by ouremployees. This still continues and requires significant management attention and resources to support.The implementation of an upgrade of this significance carries certain risks, including the risks ofinaccurate data or reporting and significant design errors that could have a negative effect on ouroperating results and impact our ability to manage our business. As a consequence, there is a risk thatundetected deficiencies may exist currently and in the future and that they could constitute materialweaknesses.
Information technology failures or attacks on our computer systems and databases could have an adverseeffect on our business:
➣ We rely on information technology to process, transmit and store electronic information. Any failures inour computer systems or telecommunications services could affect our ability to operate our linkedgames or otherwise conduct business. Our computer systems and databases of business or customerinformation are susceptible to outages due to fire, floods, power loss, break-ins, cyber-attacks, networkpenetration, denial of service attacks, and similar events. While we have and will continue to implementnetwork security measures and data protection safeguards, our servers and other computer systems arevulnerable to viruses, malicious software, hacking, break-ins or theft, data privacy or security breaches,third-party security breaches, employee error or malfeasance, and similar events. Failures in our systemsor services, and unauthorized access to or tampering with our systems and databases, could have amaterial adverse effect on our business, reputation, financial condition, liquidity or results of operations.
The existence of our preferred stock could adversely affect the market price of our common stock:
➣ Our certificate of incorporation authorizes the issuance of five million shares of preferred stock withdesignations, rights and preferences that may be determined from time to time by the board of directors.Under the terms of our Merger Agreement with Scientific Games, we are not permitted to issue anyshares of preferred stock without their consent. However, if the Merger Agreement terminates and theMerger does not close, (i) our board has broad power, without stockholder approval, to issue preferredstock with dividend, liquidation, conversion, voting or other rights that could adversely affect the votingpower or other rights of the holders of our common stock, (ii) our board could use preferred stock todiscourage, delay or prevent a change in control, and (iii) the existence of the preferred stock couldadversely affect the market price of our common stock.
Our online, social, casual and mobile products and services are part of a new and evolving industry, whichpresents significant uncertainty and business risks:
➣ Online, social, casual and mobile gaming is a relatively new industry that continues to evolve. Thesuccess of this industry and our interactive gaming products and services will be affected by futuredevelopments in social networks, mobile platforms, regulatory developments, data privacy laws andregulations, and other factors that we are unable to predict, and are beyond our control. Also, ifFacebook or mobile providers were to increase the fees that they charge us, our results would benegatively affected. Additionally, if users were to limit our ability to use their personal information, ifFacebook or mobile providers were to have competitive offerings, or if Facebook or mobile providerswere to alter their operating platform, our growth prospects would be impacted. We expect that we willincrease our investment in these products and services as they grow. This environment can make it
31
difficult to plan strategically and can provide opportunities for competitors to grow revenues at ourexpense. Consequently, our future operating results relating to our interactive gaming products andservices may be difficult to predict and we cannot provide assurance that our interactive gamingproducts and services will grow at the rates we expect, or be successful in the long term.
ITEM 1B. UNRESOLVED STAFF COMMENTS
None.
ITEM 2. PROPERTIES
Manufacturing Facility & Corporate Headquarters
Our main manufacturing facility and corporate headquarters is located in Waukegan, Illinois, a suburb ofChicago, where we own a 350,000 square feet facility that houses our manufacturing, corporate administrativepersonnel and warehouse space. This facility was built in 1995 and expanded and improved in both 1998 and2007. We believe our Waukegan facility will be adequate in capacity and condition to satisfy our expected futuregrowth requirements.
Chicago Technology Campus
Our engineering and game development headquarters is located at our technology campus in Chicago,Illinois, which consists of six owned facilities totaling more than 350,000 square feet. The campus houses ourChicago-based engineering and game development personnel and our marketing and commercial operationsteams. Our main Chicago facility was renovated into a research and development center in 2001 and we haveacquired other additional properties to house our expanding workforce. Included in the 350,000 square feet is anew five story 120,000 square foot building, which we moved into in August 2012. This new facility achieved aLEED (Leadership in Energy and Environmental Design) Platinum Certification designation, which is thehighest level of sustainability awarded by the U.S. Green Building Council (USGBC) and is contiguous to ourmain Chicago facility. The Chicago technology campus supports the global leadership of our game developmentand technology efforts and engineering and game development for all North American markets and certaininternational markets.
Reno
In fiscal 2011, we completed the construction of an approximately 53,000 square foot facility that we ownwhich was occupied in December 2010. This facility allows all of our Reno-based employees to be located in onefacility and provides for future expansion.
Leased Facilities
In addition to the physical properties described above that we own, we maintain leased space worldwide,none of which is material to our operations or our Consolidated Financial Statements.
ITEM 3. LEGAL PROCEEDINGS
See Note 16. “Litigation” to our Consolidated Financial Statements.
ITEM 4. MINE SAFETY DISCLOSURES
Not applicable
32
PART II
Product names mentioned in this Report are trademarks of WMS Gaming Inc., except for the followingmarks: ANDROID is a trademark of Google Inc.; APPLE, iPAD and iPHONE are registered trademarks ofApple Inc.; BATTLESHIP, CLUE, MONOPOLY, THE GAME OF LIFE and YAHTZEE are trademarks ofHasbro.; FACEBOOK is a registered trademark of Facebook, Inc.; CHEERS, HAPPY DAYS and STAR TREKare trademarks of CBS Studios Inc.; KISS® & © 2013 Kiss Catalog Ltd.; SPIDER-MAN TM & © 2002-2007Marvel Entertainment, Inc. and its subsidiaries.; THE PRICE IS RIGHT is a trademark of FremantleMediaOperations BV; THE GODFATHER is a trademark of Paramount Pictures; THE LORD OF THE RINGS is atrademark of The Saul Zaentz Company d/b/a Middle-earth Enterprises under license to New Line Productions,Inc.; THE WIZARD OF OZ is a trademark of Turner Entertainment Co.; WILLY WONKA™ & © Warner Bros.Entertainment.
ITEM 5. MARKET FOR REGISTRANT’S COMMON EQUITY, RELATED STOCKHOLDERMATTERS AND ISSUER PURCHASES OF EQUITY SECURITIES
Our common stock, par value $0.50, trades publicly on the NYSE under the symbol “WMS.” On August 26,2013, there were approximately 564 holders of record of our common stock.
The high and low sale prices of our common stock for the two most recent fiscal years, as reported on theNYSE, are as follows:
High Low
Fiscal Year Ended June 30, 2013First Quarter . . . . . . . . . . . . . . . . . . . . . . . . . . . . . . . . . . . $20.67 $13.90Second Quarter . . . . . . . . . . . . . . . . . . . . . . . . . . . . . . . . . 17.53 14.53Third Quarter . . . . . . . . . . . . . . . . . . . . . . . . . . . . . . . . . . . 25.34 16.31Fourth Quarter . . . . . . . . . . . . . . . . . . . . . . . . . . . . . . . . . . 25.72 25.07
Fiscal Year Ended June 30, 2012First Quarter . . . . . . . . . . . . . . . . . . . . . . . . . . . . . . . . . . . $30.85 $17.30Second Quarter . . . . . . . . . . . . . . . . . . . . . . . . . . . . . . . . . 22.90 16.24Third Quarter . . . . . . . . . . . . . . . . . . . . . . . . . . . . . . . . . . . 25.30 19.97Fourth Quarter . . . . . . . . . . . . . . . . . . . . . . . . . . . . . . . . . . 25.10 18.80
Following consummation of the Merger, there will be no public market for our common stock which willcease to be traded on the NYSE, and we will no longer be required to file periodic reports with the SEC.
Dividend Policy
No cash dividends were declared or paid on our common stock during fiscal 2013 or 2012. Our ability topay future cash dividends will depend upon, among other things, our earnings, anticipated expansion, capitalrequirements, compliance with limitations under our revolving credit facility and financial condition. We do notexpect to pay cash dividends in the foreseeable future. Pursuant to the Merger Agreement with Scientific Games,we cannot pay any dividends prior to the effective time of the Merger.
Revolving Credit Facility
See Note 12. “Revolving Credit Facility” to our Consolidated Financial Statements.
Issuance of Unregistered Securities
None
33
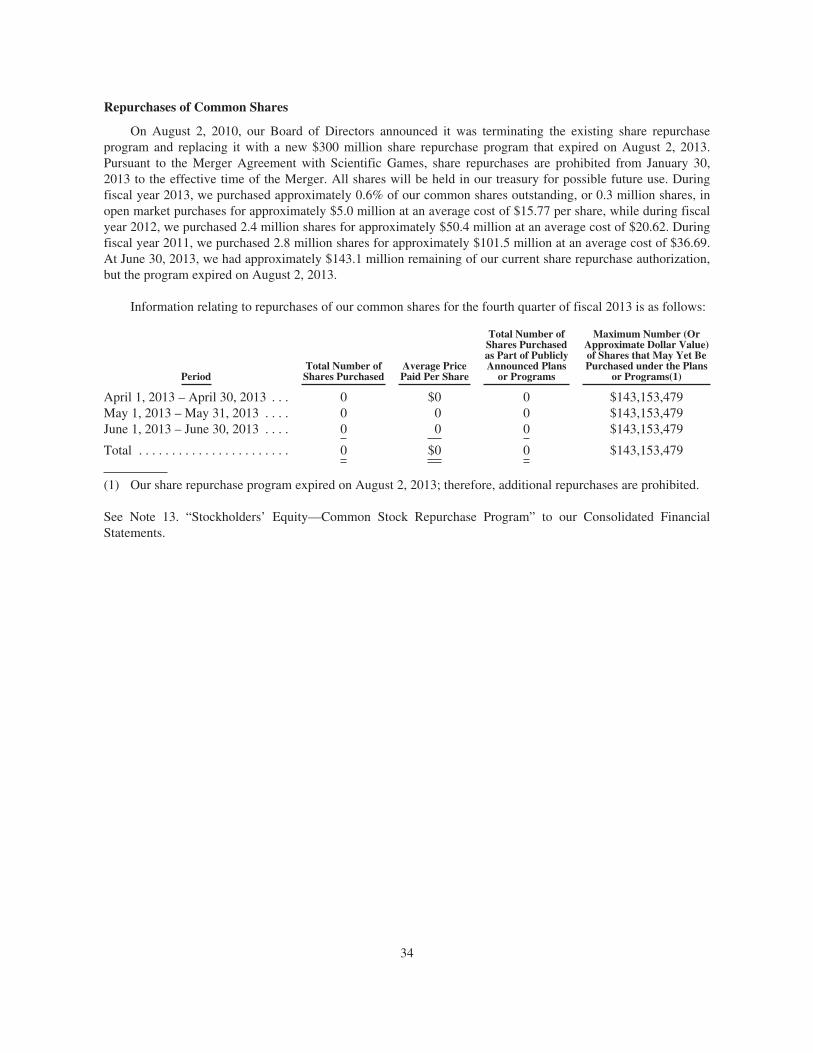
Repurchases of Common Shares
On August 2, 2010, our Board of Directors announced it was terminating the existing share repurchaseprogram and replacing it with a new $300 million share repurchase program that expired on August 2, 2013.Pursuant to the Merger Agreement with Scientific Games, share repurchases are prohibited from January 30,2013 to the effective time of the Merger. All shares will be held in our treasury for possible future use. Duringfiscal year 2013, we purchased approximately 0.6% of our common shares outstanding, or 0.3 million shares, inopen market purchases for approximately $5.0 million at an average cost of $15.77 per share, while during fiscalyear 2012, we purchased 2.4 million shares for approximately $50.4 million at an average cost of $20.62. Duringfiscal year 2011, we purchased 2.8 million shares for approximately $101.5 million at an average cost of $36.69.At June 30, 2013, we had approximately $143.1 million remaining of our current share repurchase authorization,but the program expired on August 2, 2013.
Information relating to repurchases of our common shares for the fourth quarter of fiscal 2013 is as follows:
PeriodTotal Number ofShares Purchased
Average PricePaid Per Share
Total Number ofShares Purchasedas Part of PubliclyAnnounced Plans
or Programs
Maximum Number (OrApproximate Dollar Value)of Shares that May Yet BePurchased under the Plans
or Programs(1)
April 1, 2013 – April 30, 2013 . . . 0 $0 0 $143,153,479May 1, 2013 – May 31, 2013 . . . . 0 0 0 $143,153,479June 1, 2013 – June 30, 2013 . . . . 0 0 0 $143,153,479
Total . . . . . . . . . . . . . . . . . . . . . . . 0 $0 0 $143,153,479
(1) Our share repurchase program expired on August 2, 2013; therefore, additional repurchases are prohibited.
See Note 13. “Stockholders’ Equity—Common Stock Repurchase Program” to our Consolidated FinancialStatements.
34
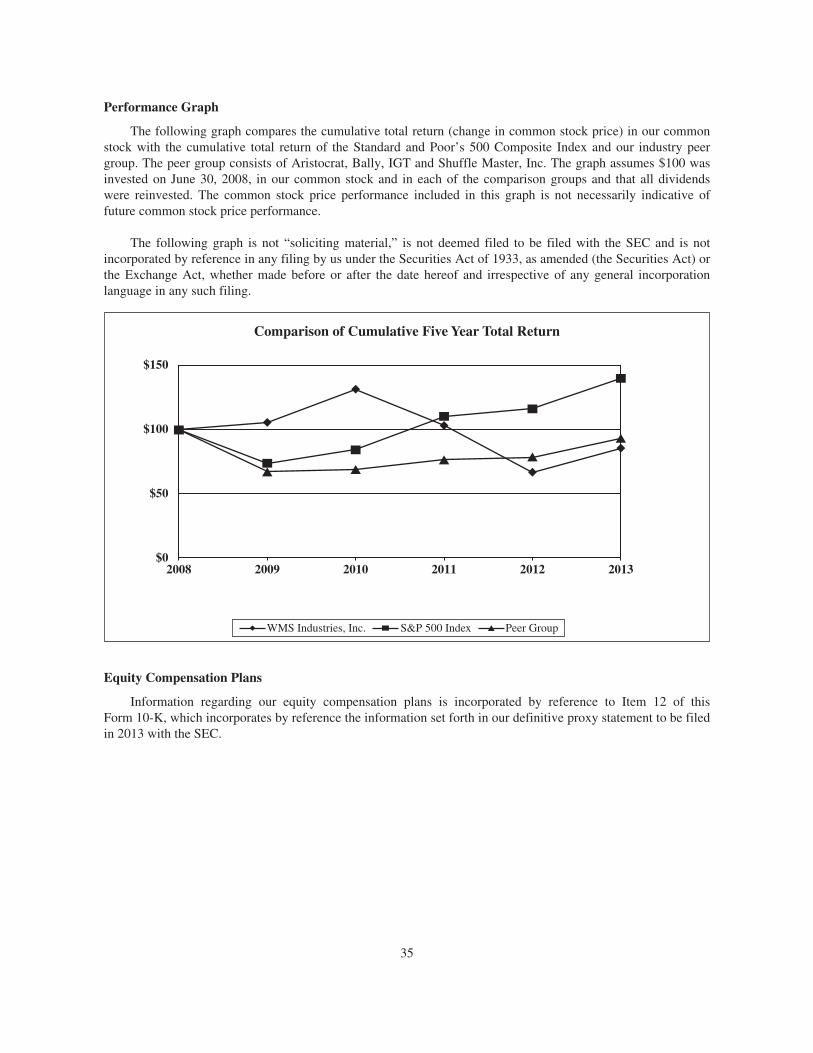
Performance Graph
The following graph compares the cumulative total return (change in common stock price) in our commonstock with the cumulative total return of the Standard and Poor’s 500 Composite Index and our industry peergroup. The peer group consists of Aristocrat, Bally, IGT and Shuffle Master, Inc. The graph assumes $100 wasinvested on June 30, 2008, in our common stock and in each of the comparison groups and that all dividendswere reinvested. The common stock price performance included in this graph is not necessarily indicative offuture common stock price performance.
The following graph is not “soliciting material,” is not deemed filed to be filed with the SEC and is notincorporated by reference in any filing by us under the Securities Act of 1933, as amended (the Securities Act) orthe Exchange Act, whether made before or after the date hereof and irrespective of any general incorporationlanguage in any such filing.
$150
$100
Comparison of Cumulative Five Year Total Return
$50
2008 20132009
WMS Industries, Inc. S&P 500 Index Peer Group
2010 2011 2012$0
Equity Compensation Plans
Information regarding our equity compensation plans is incorporated by reference to Item 12 of thisForm 10-K, which incorporates by reference the information set forth in our definitive proxy statement to be filedin 2013 with the SEC.
35
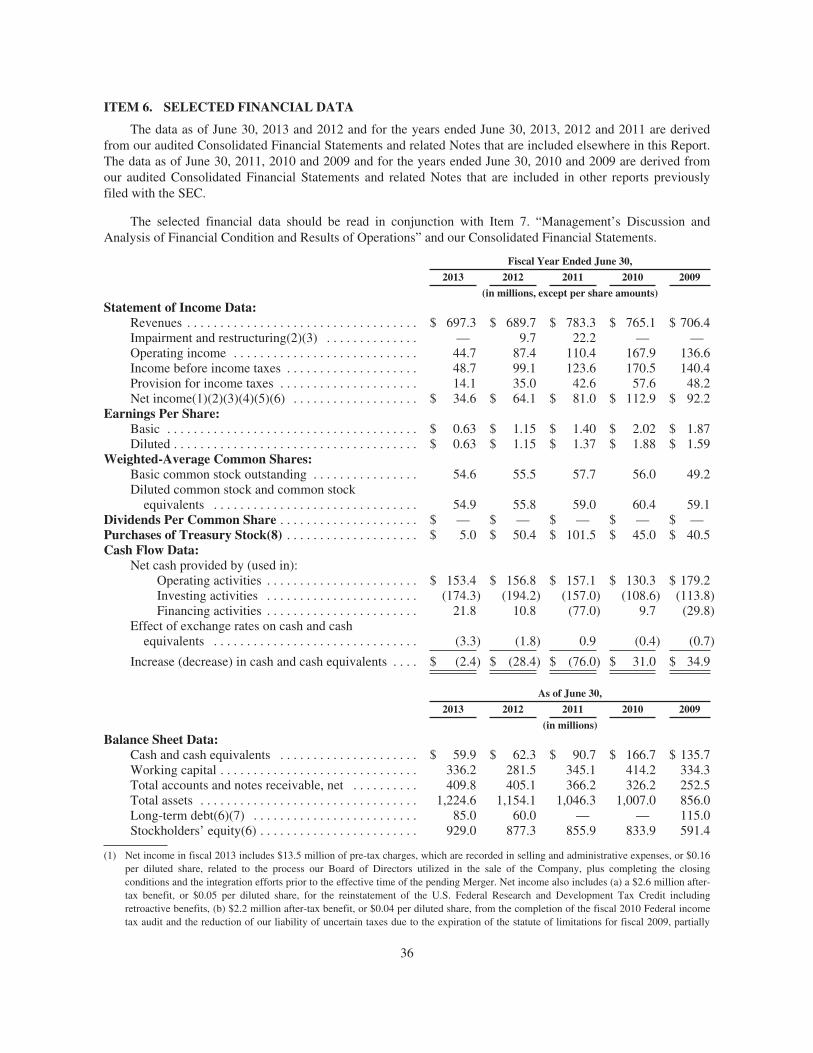
ITEM 6. SELECTED FINANCIAL DATA
The data as of June 30, 2013 and 2012 and for the years ended June 30, 2013, 2012 and 2011 are derivedfrom our audited Consolidated Financial Statements and related Notes that are included elsewhere in this Report.The data as of June 30, 2011, 2010 and 2009 and for the years ended June 30, 2010 and 2009 are derived fromour audited Consolidated Financial Statements and related Notes that are included in other reports previouslyfiled with the SEC.
The selected financial data should be read in conjunction with Item 7. “Management’s Discussion andAnalysis of Financial Condition and Results of Operations” and our Consolidated Financial Statements.
Fiscal Year Ended June 30,
2013 2012 2011 2010 2009
(in millions, except per share amounts)Statement of Income Data:
Revenues . . . . . . . . . . . . . . . . . . . . . . . . . . . . . . . . . . . $ 697.3 $ 689.7 $ 783.3 $ 765.1 $ 706.4Impairment and restructuring(2)(3) . . . . . . . . . . . . . . — 9.7 22.2 — —Operating income . . . . . . . . . . . . . . . . . . . . . . . . . . . . 44.7 87.4 110.4 167.9 136.6Income before income taxes . . . . . . . . . . . . . . . . . . . . 48.7 99.1 123.6 170.5 140.4Provision for income taxes . . . . . . . . . . . . . . . . . . . . . 14.1 35.0 42.6 57.6 48.2Net income(1)(2)(3)(4)(5)(6) . . . . . . . . . . . . . . . . . . . $ 34.6 $ 64.1 $ 81.0 $ 112.9 $ 92.2
Earnings Per Share:Basic . . . . . . . . . . . . . . . . . . . . . . . . . . . . . . . . . . . . . . $ 0.63 $ 1.15 $ 1.40 $ 2.02 $ 1.87Diluted . . . . . . . . . . . . . . . . . . . . . . . . . . . . . . . . . . . . . $ 0.63 $ 1.15 $ 1.37 $ 1.88 $ 1.59
Weighted-Average Common Shares:Basic common stock outstanding . . . . . . . . . . . . . . . . 54.6 55.5 57.7 56.0 49.2Diluted common stock and common stock
equivalents . . . . . . . . . . . . . . . . . . . . . . . . . . . . . . . 54.9 55.8 59.0 60.4 59.1Dividends Per Common Share . . . . . . . . . . . . . . . . . . . . . $ — $ — $ — $ — $ —Purchases of Treasury Stock(8) . . . . . . . . . . . . . . . . . . . . $ 5.0 $ 50.4 $ 101.5 $ 45.0 $ 40.5Cash Flow Data:
Net cash provided by (used in):Operating activities . . . . . . . . . . . . . . . . . . . . . . . $ 153.4 $ 156.8 $ 157.1 $ 130.3 $ 179.2Investing activities . . . . . . . . . . . . . . . . . . . . . . . (174.3) (194.2) (157.0) (108.6) (113.8)Financing activities . . . . . . . . . . . . . . . . . . . . . . . 21.8 10.8 (77.0) 9.7 (29.8)
Effect of exchange rates on cash and cashequivalents . . . . . . . . . . . . . . . . . . . . . . . . . . . . . . . (3.3) (1.8) 0.9 (0.4) (0.7)
Increase (decrease) in cash and cash equivalents . . . . $ (2.4) $ (28.4) $ (76.0) $ 31.0 $ 34.9
As of June 30,
2013 2012 2011 2010 2009
(in millions)Balance Sheet Data:
Cash and cash equivalents . . . . . . . . . . . . . . . . . . . . . $ 59.9 $ 62.3 $ 90.7 $ 166.7 $ 135.7Working capital . . . . . . . . . . . . . . . . . . . . . . . . . . . . . . 336.2 281.5 345.1 414.2 334.3Total accounts and notes receivable, net . . . . . . . . . . 409.8 405.1 366.2 326.2 252.5Total assets . . . . . . . . . . . . . . . . . . . . . . . . . . . . . . . . . 1,224.6 1,154.1 1,046.3 1,007.0 856.0Long-term debt(6)(7) . . . . . . . . . . . . . . . . . . . . . . . . . 85.0 60.0 — — 115.0Stockholders’ equity(6) . . . . . . . . . . . . . . . . . . . . . . . . 929.0 877.3 855.9 833.9 591.4
(1) Net income in fiscal 2013 includes $13.5 million of pre-tax charges, which are recorded in selling and administrative expenses, or $0.16per diluted share, related to the process our Board of Directors utilized in the sale of the Company, plus completing the closingconditions and the integration efforts prior to the effective time of the pending Merger. Net income also includes (a) a $2.6 million after-tax benefit, or $0.05 per diluted share, for the reinstatement of the U.S. Federal Research and Development Tax Credit includingretroactive benefits, (b) $2.2 million after-tax benefit, or $0.04 per diluted share, from the completion of the fiscal 2010 Federal incometax audit and the reduction of our liability of uncertain taxes due to the expiration of the statute of limitations for fiscal 2009, partially
36
offset by (c) a $1.3 million, or $0.02 per diluted share, valuation allowance against certain foreign deferred tax assets relating to foreignnet operating losses and (d) a $2.7 million after-tax charge, or $0.05 per diluted share, relating to a non-U.S. tax charge and other taxcharges. In fiscal 2013, we recorded after-tax realized and unrealized foreign currency losses of $3.3 million, or $0.06 per diluted share,primarily related to the devaluation of the Argentina peso against the U.S. dollar. In fiscal 2012, we recorded after-tax realized andunrealized foreign currency losses of $0.3 million, or $0.01 per diluted share, related to the movement of foreign currencies against theU.S. dollar.
(2) Net income in fiscal 2012 includes $9.2 million of net after-tax charges, or $0.16 per diluted share, principally recorded in theSeptember 2011 quarter, which includes $6.7 million net after-tax of impairment and restructuring charges, including $3.8 million netafter-tax of separation-related costs and $2.9 million net after-tax of costs related to the decision to close two facilities; $2.5 million netafter-tax, or $0.04 per diluted share, of non-cash charges to write-down receivables following government enforcement actions at certaincasinos in Mexico; and $1.3 million net after-tax, or $0.02 per diluted share, of costs for legal settlements. Net income also includes a netafter-tax cash benefit of $1.3 million from litigation settlement recorded in the December 2011 period. See Note 5. “Impairment andRestructuring Charges” to our Consolidated Financial Statements.
(3) Net income in fiscal 2011 includes $16.6 million of net after-tax charges, or $0.28 per diluted share, which includes $14.3 million, or$0.24 per diluted share, of net after-tax impairment and restructuring charges comprised of $11.8 million, or $0.20 per diluted share, fornet after-tax non-cash asset impairments (including $6.8 million net of taxes for impairment of technology licenses, $2.1 million net oftaxes for impairment of the Orion™ brand name, $1.9 million net of taxes for an impairment charge to write-down the value of the OrionGaming facility in the Netherlands to fair value upon closing the facility, $0.9 million net of taxes for impairment of receivables relatedto government action to close casinos in Venezuela and $0.1 million net of taxes of other impairment charges); and $2.5 million or$0.04 per diluted share for after-tax restructuring charges (primarily separation costs); along with $5.9 million of after-tax charges, or$0.10 per diluted share, for asset write-downs and other charges (including charges for inventory write-downs related to winding downthe Orion and original Bluebird cabinet product lines); partially offset by $2.5 million or $0.04 per diluted share from after-tax cashproceeds of litigation settlement and $0.02 per diluted share benefit recorded in income taxes related to the period January 1, 2010through June 30, 2010 from the retroactive reinstatement of the Federal research and development tax credit. See Note 5. “Impairmentand Restructuring Charges” to our Consolidated Financial Statements.
(4) Net income in fiscal 2010 includes a $3.6 million net tax benefit from a lower effective income tax rate resulting from discrete tax items,primarily the favorable completion of federal income tax audits through fiscal 2007.
(5) Net income in fiscal 2009 includes a $3.1 million after-tax gain from a cash settlement of trademark litigation and a $1.1 million incometax benefit related to the period January 1, 2008 through June 30, 2008 due to the retroactive reinstatement of the Federal research anddevelopment tax credit.
(6) On October 18, 2011, we entered into an amended and restated revolving credit agreement with a group of eight banks. This agreementprovides for borrowings up to $400 million through October 18, 2016, with the ability to expand the facility to $500 million from theexisting lenders willing to increase their commitments or from additional lenders with the consent of the administrative agent. AtJune 30, 2013, $85.0 million was outstanding under the amended and restated revolving credit facility. After consideration of $1.0million outstanding letters of credit, there was approximately $314.0 million of available borrowings under the revolving credit facility atJune 30, 2013.
(7) In fiscal 2010, we issued 8.7 million of our common shares upon the early conversion to common stock of $115.0 million principalamount of our 2.75% Convertible Subordinated Notes (“Notes”). As a result of the conversion of all of our Notes, our stockholdersequity was increased by $115.0 million. See Note 12. “Revolving Credit Facility” to our Consolidated Financial Statements.
(8) Pursuant to the Merger Agreement with Scientific Games, share repurchases are prohibited from January 30, 2013 to the effective time ofthe Merger.
ITEM 7. MANAGEMENT’S DISCUSSION AND ANALYSIS OF FINANCIAL CONDITION ANDRESULTS OF OPERATIONS
The following discussion and analysis should be read in conjunction with our Consolidated FinancialStatements and Notes thereto included elsewhere in this Report. This discussion and analysis also containsforward-looking statements and should also be read in conjunction with the disclosures and informationcontained in “Cautionary Note” and Item 1A. “Risk Factors” in this Report. The following discussion andanalysis is intended to enhance the reader’s understanding of our business environment.
The following discussion is based on our current expectations, plans and strategies (including, withoutlimitation, with respect to new products and services, entry into new markets, levels of anticipated spending orinvestment, and expectations as to shipments or the cost of products), any of which may change materially in thefuture. In particular, in the event the Merger is completed, our current expectations, plans and strategies may changeas WMS is integrated into Scientific Games. There can be no assurance that Scientific Games’ expectations, plansand strategies with respect to WMS or the combined company following the Merger will be consistent with ourcurrent expectations, plans and strategies. Moreover, we cannot predict the impact of any changes to our currentexpectations, plans or strategies on the financial condition or results of operations of WMS or the combined company.
37
As used in this Report, the terms “we”, “us”, “our”, “the Company” and “WMS” mean WMS IndustriesInc., a Delaware corporation, and its subsidiaries. All references to years, unless otherwise noted, refer to ourfiscal year, which ends on June 30. All references to quarters, unless otherwise noted, refer to the quarters of ourfiscal year.
OVERVIEW
Our mission is: through imagination, talent and technology, we create and provide the world’s mostcompelling gaming experiences. We are a leading supplier of innovative gaming entertainment products andservices worldwide. We design, develop, manufacture, distribute and market casino games and gaming machines,VLTs, VGTs and interactive gaming products and services. As regulated markets legalize interactive gaming, weintend to enter and do business in those markets. Our gaming machine products are installed in all of the majorregulated gaming jurisdictions in the United States, as well as in approximately 161 international gamingjurisdictions.
On January 30, 2013, WMS entered into the Merger Agreement with Scientific Games, Scientific GamesInternational, Inc., a wholly owned subsidiary of Scientific Games, and Merger Sub. The Merger Agreementprovides for the Merger of Merger Sub with and into WMS, with WMS surviving as a wholly-owned subsidiaryof Scientific Games. The Merger Agreement was unanimously approved by our Board of Directors. At theeffective time of the Merger, each share of WMS’ common stock issued and outstanding immediately prior tosuch time, other than our treasury shares, shares owned by Scientific Games or Merger Sub, and shares withrespect to which appraisal rights are properly exercised and not withdrawn under Delaware law, will beautomatically cancelled and converted into the right to receive $26.00 in cash, without interest, on the terms andsubject to the conditions set forth in the Merger Agreement. None of our stockholders exercised appraisal rights.
Consummation of the Merger is subject to customary conditions, which at this point include withoutlimitation (i) receipt and effectiveness of specified licenses, permits, and other approvals, issued by certaingovernmental authorities in relation to our business and (ii) other customary closing conditions. On March 11,2013, we received notice from the Federal Trade Commission of the early termination of the waiting periodapplicable to the consummation of the Merger under the Hart-Scott-Rodino Antitrust Improvements Act of 1974,as amended. In addition on May 10, 2013, WMS stockholders approved the Merger Agreement. At this time, weexpect to consummate the Merger in the fall of calendar 2013. The Merger Agreement contains certainlimitations on the operations of WMS during the period prior to the effective time of the Merger, including aprohibition on share repurchases by the Company. During the fiscal year ended June 30, 2013, we incurredapproximately $13.5 million of pre-tax charges, which are recorded in selling and administrative expenses,related to the process our Board of Directors utilized in the sale of the Company, plus completing the closingconditions and the integration efforts prior to the effective time of the pending Merger.
Following consummation of the Merger, there will be no public market for our common stock which willcease to be traded on the NYSE, and we will no longer be required to file periodic reports with the SEC.
A description of the Merger Agreement and the Merger is contained in our definitive proxy statement datedApril 8, 2013, which was first mailed to our stockholders on or about April 11, 2013.
We generate revenue in two principal ways: product sales and gaming operations, as further describedbelow. In fiscal 2012, we expanded our interactive gaming products and services with the launch of our first non-wagering social game on Facebook and the sale of select WMS games for mobile devices and PC’s and in July2012, we grouped together all of our worldwide online wagering, social, casual and mobile gaming products andservices in order to focus on their revenue growth, development and market efficiencies and to optimize thebenefits of interactive gaming products and services for casino operators and their players. Also, in July 2012 welaunched a second non-wagering social game on Facebook titled Jackpot Party Social Casino. We expect tofacilitate the continued expansion, investment, evolution and extension of our interactive gaming products and
38
services and increase our focus on this rapidly evolving growth area. In fiscal 2014, we expect to furtherpenetrate each of the new markets and distribution channels we have entered over the last few years and look tofurther expand our distribution channels.
The recession and financial market crisis that began in 2008 has continued to disrupt the economyworldwide, has reduced consumer discretionary spending and has led to a weakened global economicenvironment, all of which have been significant challenges for our industry. In calendar 2008 and 2009, somegaming operators delayed or canceled construction projects, resulting in fewer new casino openings andexpansions in fiscal 2010 and 2011, coupled with many customers reducing their annual capital budgets forreplacing gaming machines. New unit demand for new casino openings and casino expansions increased in fiscal2012; however, demand for new casino openings and expansions decreased in fiscal 2013. The economic crisishas reduced disposable income for casino patrons and resulted in fewer patrons visiting casinos and lowerspending by those patrons who did visit casinos. The economic crisis and operational challenges led to the reviewof our product plans and business strategies at the end of fiscal 2011 and beginning of fiscal 2012 as furtherdescribed below. Additionally, increased competition from our competitors lowered the number of new units weshipped over the last three fiscal years, resulting in lower revenues in fiscal 2012 than in fiscal 2011 and 2010.While our revenues for the year ended June 30, 2013, increased from the prior year period, this resulted fromincreased revenues from our interactive gaming products and services more than offsetting the decline in productsales and participation revenues.
In late fiscal 2011 and early fiscal 2012, with no leading indicators showing any significant increase inreplacement demand, we conducted a thorough review of our business strategies and product plans. As a result ofthe strategic review, we announced that we would refine our product plans and restructure our organization tosharpen emphasis on our game content and product development strengths. Specifically, we have streamlined ourproduct management and product development functions, simplified product plans and further prioritized on-timecommercialization of new game themes, products and portal gaming applications. As part of our restructuring,we implemented a 10% reduction in our workforce.
Based upon our decisions stemming from our product, strategy and cost structure reviews, in the three-month period ended June 30, 2011, we recorded $24.0 million of net pre-tax charges, or $0.26 per diluted share,which included $18.4 million, or $0.20 per diluted share, of pre-tax impairment and restructuring charges. Thesecharges were comprised of $16.0 million or $0.17 per diluted share for non-cash asset impairments (including$11.0 million for impairment of technology licenses, $3.4 million for impairment of the Orion™ brand name,$1.4 million of impairment of receivables related to government action to close casinos in Venezuela and$0.2 million of other impairment charges) and $2.4 million, or $0.03 per diluted share, for restructuring charges(primarily separation-related costs), along with $9.6 million of pre-tax charges, or $0.10 per diluted share, forasset write-downs and other charges (including inventory charges related to winding down the Orion and originalBluebird cabinet product lines), partially offset by $4.0 million or $0.04 per diluted share from cash proceeds oflitigation settlement. For the twelve months ended June 30 2011, impairment and restructuring charges alsoinclude the $3.8 million of pre-tax charges, or $0.04 per diluted share, incurred in the September 2010 quarterrelated to closing our main Netherlands facility, of which $2.4 million was a non-cash, pre-tax charge for thewrite-down to fair market value of property, plant and equipment and $1.4 million was pre-tax separationcharges. The twelve-month period ended June 30, 2011 also includes a $0.02 per diluted share benefit recordedin income taxes in the December 2010 quarter related to the period January 1, 2010 through June 30, 2010 fromthe retroactive reinstatement of the Federal research and development tax credit.
Also as part of the plan, in fiscal 2012, we recorded an additional $9.7 million of net pre-tax impairment andrestructuring charges or $0.12 per diluted share, which includes $9.1 million, or $0.11 per diluted share of cash-based restructuring charges, primarily separation-related charges and costs related to the decision to close twofacilities, along with $0.6 million, or $0.01 per diluted share, of non-cash impairment charges related to closingtwo facilities. In addition, during the year ended June 30, 2012, we recorded $3.6 million or $0.04 per dilutedshare of non-cash charges to write-down receivables following government enforcement actions at certain
39
casinos in Mexico. After an attack that burned down a casino in the Monterrey province in late August 2011,various Mexican government agencies began inspecting fire and safety preparations, import paperwork ongaming machines and other facets of casino operations. As a result, some casinos have closed permanently andsome temporarily, and some gaming machines were seized until the proper paperwork has been submitted andapproved. Because of these actions, fewer people have been visiting the Mexican casinos and overall demand fornew units has declined. This situation has been very dynamic and while government actions continued todiminish, we continue to closely monitor the situation. In fiscal 2012, we also received proceeds from litigationsettlement for $2.1 million, or $0.02 per diluted share and incurred charges of $2.1 million, or $0.02 per dilutedshare, for legal settlements.
Net income in fiscal 2013 includes $13.5 million of pre-tax charges, which are recorded in selling andadministrative expenses, or $0.16 per diluted share, related to the process our Board of Directors utilized in thesale of the Company, plus completing the closing conditions and the integration efforts prior to the effective timeof the pending Merger. Net income also includes (a) a $2.6 million after-tax benefit, or $0.05 per diluted share,for the reinstatement of the U.S. Federal Research and Development Tax Credit, including retroactive benefits,(b) $2.2 million after-tax benefit, or $0.04 per diluted share, from the completion of the fiscal 2010 Federalincome tax audit and the reduction of our liability of uncertain taxes due to the expiration of the statute oflimitations for fiscal 2009, partially offset by (c) a $1.3 million, or $0.02 per diluted share, valuation allowanceagainst certain foreign deferred tax assets relating to foreign net operating losses and (d) a $2.7 million after-taxcharge, or $0.05 per diluted share, relating to a non-U.S. tax charge and other tax charges. In fiscal 2013, werecorded after-tax realized and unrealized foreign currency losses of $3.3 million, or $0.06 per diluted share,,primarily related to the devaluation of the Argentina peso against the U.S. dollar. In fiscal 2012, we recordedafter-tax realized and unrealized foreign currency losses of $0.3 million, or $0.01 per diluted share, related to themovement of foreign currencies against the U.S. dollar.
We had expected that with our launch of the network gaming-enabled Bluebird2 gaming machines in theDecember 2008 quarter, concurrent with certain of our competitors launching their networked gaming-enabledproducts, the industry would experience an improvement in the replacement cycle, which has been at anabnormally low level for the past few years. However, as discussed above, the economy slowed just as the newgaming machines were being launched, so we did not see the expected improvement in the replacement cycle.Even with the adverse economic environment and its impact on our industry causing customers to constrain theircapital budgets, we launched our Bluebird2 gaming machines in the December 2008 quarter with premiumfeatures at a significantly higher price, and demand outpaced our expectations. In late June 2010, we launchedanother new networked-enabled gaming machine, the Bluebird xD cabinet, as the replacement for our originalBluebird slant cabinets and it too had a significantly higher price, and once again demand outpaced ourexpectations. In the March 2012 quarter, we launched our new Bluebird2e gaming machine as an upgrade to ourBluebird2 gaming machines. The Bluebird2e gaming machines contain the emotive lighting feature that welaunched with the Bluebird xD cabinet. In the December 2012 quarter, we launched the initial placements of MyPoker xD cabinets to address a segment of the casino floor in which we have little presence. In March 2013, welaunched our new Blade upright cabinet for product sales and new Gamefield xD cabinet for our participationinstalled base, and both utilize our next-generation CPU-NXT3 operating system platform. We believe that as theeconomy improves and gaming operators see meaningful improvements in their profitability and cash flows, theywill increase their annual capital budgets for replacement units, which will improve the replacement demand infuture years, although we cannot predict when this will occur or the rate of increase in their capital budgets.
We believe several recent developments fueled by the challenging economic situation could expand ourrevenue opportunities over the long term. In the United States, legislators have passed or are consideringenabling new or expanded gaming legislation in Ohio, Illinois, Kansas, Iowa, Maryland, California, NewHampshire, New York, Florida, and Massachusetts. Internationally, Singapore opened as a new market in fiscal2010. In addition, legislation has been passed or discussed in Greece, Bolivia, Brazil, Japan, Spain and Taiwanthat could open new market or expansion opportunities. In the United States, the States of Nevada, Delaware andNew Jersey have adopted legislation to legalize certain forms of online gaming and federal legislators and certain
40
other state legislators and governments in Canada and Europe have legalized or are considering legalizing certainforms of online gaming, which if passed could expand our revenue opportunities. The breadth and timing of theseopportunities remain uncertain due to the political process in each of these jurisdictions, as well as the difficultcredit environment facing our customers and the risk of continued economic uncertainty.
We review certain financial measures in assessing our financial condition and operating performance notonly in connection with creating our forecasts and in making comparisons to financial results from prior periods,but also in making comparisons to our competitors’ financial results and our internal plans. We focus onfluctuations in revenue, number of new units sold, average selling price, average participation installed base andaverage revenue per day, cost on both products sales and gaming operations and also pay close attention to ouroperating income, operating margin, net income, diluted earnings per share, total cash, total accounts and notesreceivable, inventories and accounts payable, cash flows provided by or used in operating activities, investingactivities and financing activities and free cash flows (cash flows from operating activities less capitalexpenditures) as they are key indicators of our performance. We also measure changes in selling andadministrative expenses as a percent of revenue, which indicate management’s ability to control costs, as well asresearch and development costs as a percent of revenue, which demonstrate investment in technology andproduct development. Finally, we measure depreciation and amortization expense as a percentage of revenues asan indicator of the current cost of capital expenditures, primarily in gaming operations. The measures listedabove are not a comprehensive list of all factors considered by us in assessing our financial condition andoperating performance, and we may consider other individual measures as required by trends and discrete eventsarising in a specific period, but they are the key indicators and these measures are discussed herein.
The priorities for the utilization of our cash flow are to: continue to enhance stockholder value byemphasizing internal and external investments to create and license advanced technologies and intellectualproperty; seek acquisitions or licensing deals that can extend our presence and product lines, increase ourdistribution channels and enhance our intellectual property portfolio and expand our earnings potential. As aresult of our Merger Agreement with Scientific Games, we no longer can repurchase shares in the open market orin privately negotiated transactions. For the year ended June 30, 2013, our research and development spendingincreased $20.0 million from the prior-year period. In addition, we spent $65.4 million on property, plant andequipment, $90.6 million on additions to gaming operations equipment, we made payment of $18.3 million toacquire or license intangible and other non-current assets and prior to the start of the sale process of WMSinitiated by our Board of Directors in fall 2012, we funded approximately $5.0 million of common stockrepurchases in the September 2012 quarter. We also had $25.0 million net borrowings on our credit facility andhad $85.0 million long-term debt outstanding at June 30, 2013 and after consideration of $1.0 millionoutstanding letters of credit, there was approximately $314.0 million of available borrowings under the revolvingcredit facility. At June 30, 2013, we had total cash, cash equivalents and restricted cash of $69.7 million,including $9.8 million of restricted cash.
See “Product Sales” and “Gaming Operations” included in Item 1. Business for discussion of our productsales and gaming operations revenue streams.
OUR FOCUS
We continue to operate in a challenging economic environment and the combination of economicuncertainty, lower demand for replacement products and reduced opportunities from new or expanded casinoshas negatively impacted our industry. We expect to benefit from certain new and expansion projects currently inprocess in fiscal 2014, but the breadth and timing of such opportunities remains uncertain due to the difficultcredit environment facing our customers and the risk of continued economic uncertainty.
As we navigate these macroeconomic challenges, we are focused on four key strategic priorities: 1)Continue to grow our installed participation base and improve our average daily revenues; 2) Garner increasedship share in our global product sales by leveraging our product development expertise and developing
41
differentiated, high-earning games, game content and products for our customers worldwide; 3) Invest in theestablishment, development and operation of our interactive gaming products and services; and 4) Drive marginimprovements:
Strategic Priority: Continue to grow our installed participation base and improve our average dailyrevenues:
Fiscal 2013 Result: During the year ended June 30, 2013, our average installed base of participationgaming machines increased 1.6% over the prior-year and, at June 30, 2013, our total installedparticipation footprint stood at 9,910 units, up 3.7% compared to 9,561 units at June 30, 2012. Ouraverage revenue per day decreased 3.7% in fiscal 2013 from fiscal 2012 to $66.00. Our focus in fiscal2013 was to increase the installed base, increase the average revenue per day and increase thepercentage of the installed base that were coin-in gaming machines, as they generate the highest profitof our three lease models. One of our strategies to accomplish these goals was to continue to convert aportion of our installed base from Bluebird gaming machines to Bluebird2, Bluebird xD and our newGamefield xD gaming machines. The percentage of coin-in gaming machines in our installed base was36.3% of the installed base at June 30, 2013, compared to 38.5% of the installed base at June 30, 2012and 38.3% of the installed base at June 30, 2011. The coin-in gaming machines decrease was in ournon-WAP gaming machines as our WAP installed base was 3,493 units at June 30, 2013, compared to3,248 units at June 30, 2012 and 3,238 at June 30, 2011. We have successfully convertedapproximately 80% of the participation installed base to Bluebird2, Bluebird xD and Gamefield xDgaming machines, although this required a higher capital investment over the last two years. Weinvested $90.6 million in gaming operations capital in fiscal 2013 and $83.0 million in fiscal 2012compared to $65.9 million in fiscal 2011. Based on our current plans, we expect that the amount ofcapital invested in participation gaming machines will decline modestly for the next two years as alower amount of capital spent on our participation gaming machines will be partially offset byincreased capital spent on gaming machines for operating leases. We expect that with an anticipatedincrease in participation game themes that our installed base will grow in fiscal 2014.
Strategic Priority: Garner increased ship share in our global product sales by leveraging our productdevelopment expertise and developing differentiated, high-earning games and products for ourcustomers worldwide.
Fiscal 2013 Result: The replacement cycle for gaming machines has been abnormally low for severalyears and the challenges facing our industry and the overall global economy have continued, all ofwhich have reduced overall industry demand for gaming machines from previous levels. With theexception of the Canadian VLT business in fiscal 2013, we believe capital budgets for replacinggaming machines were relatively flat for calendar 2010 and 2011 and increased modestly in fiscal 2012and fiscal 2013. We believe demand from new casino openings and casino expansions declined fromfiscal 2010 to fiscal 2011 but grew in fiscal 2012 and declined in fiscal 2013. In addition, we lostrevenue in the March and June 2013 quarters in the new Illinois VGTs market. At that time, Illinoislaw prohibited the supplier of the state monitoring system (currently Scientific Games) from alsoselling VGTs, which will be the case upon the closing of the Merger. As a result, customer’squestioned our ability to continue to serve the market long-term. New legislation which was signed bythe governor of Illinois on June 24, 2013, now enables us to ship VGT units after the Merger and werestarted shipments into this market late in the June 2013 quarter. For fiscal 2013, we shipped 647VGTs into the new Illinois market. We shipped 2,412 replacement VLTs into the Canadian VLTmarket in fiscal 2013. The average selling price on both VLTs and VGTs is lower than a Class IIIgaming machines and this, along with a very competitive marketplace, and until the launch of the newBlade cabinet in March 2013, our current line-up of gaming cabinets being amongst the oldest in theindustry resulted in an overall lowering of our average selling price in fiscal 2013 by 2.5% to $15,553.In this challenging environment, our fiscal 2013 new unit shipments on which we recognized revenuewere down 0.9% from the prior-year period due to the decrease in demand of gaming machine sales for
42
new casino openings and expansions which totaled 1,694 units compared 4,105 units in the year-agoperiod being offset by the increase in replacement VLT demand driven by higher Canadian VLTshipments. In fiscal 2014, we expect that demand from new casino openings and expansions to beslightly higher and replacement demand will be flat as a result of much lower demand from theCanadian VLT operators who had begun a cyclical replacement of all of their VLTs in fiscal 2013which will be offset by higher U.S. replacement demand. We expect to ship a larger amount of VGTsto Illinois in fiscal 2014 than we did in fiscal 2013.
International new unit shipments increased 12.2% from the prior-year to 7,117 units from 6,344 unitsin fiscal 2012 and represented 34.4% of global shipments in fiscal 2013, compared to 30.3% in fiscal2012 and 38.6% in fiscal 2011 primarily reflecting increased shipments of our new Bluebird2 litecabinet for select international markets. Overall, international new unit shipments increased in fiscal2011 but shrank in fiscal 2012, as in fiscal 2011 the growth in Mexico, New South Wales, Australiaand Singapore coupled with modest growth in Asia and Latin America, more than offset lowershipments to Europe, which remains impacted by the challenging economic environment. In fiscal2012, demand from Mexico and New South Wales, Australia abated due to unique circumstances ineach country and demand from Europe continued to be lower. Demand from Mexican customers waslower following government enforcement actions at certain casinos in Mexico that began in theSeptember 2011 quarter and demand from Australian customers was lower as customers awaitenablement of new national vs. state gaming standards. Also, we believe the higher-priced Bluebird2,Bluebird xD and Bluebird2e units had an impact on the unit volume customers were able to buy withfixed capital budgets. Demand from customers in Mexico has increased modestly in fiscal 2013 and werecently received approvals in New South Wales, Australia for our products that comply with the newnational standards so we expect units sales will increase in the coming quarters. Revenues fromcustomers in Argentina were lower in the year ended June 30, 2013, as government authoritiesmodified rules related to importing product. We expect international demand in fiscal 2014 to be flatwith fiscal 2013. We are still preparing to launch our products in the new VLT market in Italy in thefuture. Although much effort is still needed before the first revenue-earning WMS gaming machinesare placed in Italy and we will have additional development work to complete as a result of newrequirements that the regulator has mandated in Italy that will be effective after a transition period. Inaddition, we continue to achieve benefits from the opening of new international offices and the additionof new geographically dispersed sales account executives.
To further diversify our revenue streams, we directly entered the Class II and central determinantmarket in fiscal 2010 following expiration of our previous licensing agreements for those markets. Weshipped our first gaming machines to a Class II market in the September 2009 quarter, and we havecontinued to penetrate this market in subsequent quarters. In June 2012, we received approval of aCPU-NXT2 based operating system on our Bluebird2 cabinet for the Class II markets and shipped ourfirst gaming machines operating on this new system in the June 2012 quarter. We expect that shipmentsto these markets in fiscal 2014 will exceed shipments in fiscal 2013.
We launched our Bluebird xD gaming machine late in the June 2010 quarter and, given customerresponse, we achieved strong demand for this product throughout fiscal 2012 and 2011. For the yearended June 30, 2013, Bluebird xD gaming machines accounted for 22.8% of our global new unit saleswhich compares to 31.2% in fiscal 2012. We launched an enhanced version of our Bluebird2 product,the Bluebird2e cabinet with an emotive lighting feature in the March 2012 quarter. During fiscal 2013,the majority of the global Bluebird2 product line new unit sales were Bluebird2e units and we wouldexpect this to also occur in future periods. We launched our Bluebird2 lite cabinet in the September2012 quarter which is a lower cost cabinet for select international markets. In March 2013, welaunched our new Blade gaming cabinet, using the latest version of our operating system software, theCPU-NXT3 platform, and Blade units accounted for 16.5%, or 3,412 units, of total unit shipments infiscal 2013, even though the product was not approved in certain gaming jurisdictions in the UnitedStates or any gaming jurisdictions outside of the United States. We expect that the percentage of our
43
quarterly shipments that are Blade units will increase in future quarters while the percentage ofBluebird2e and Bluebird2 lite units will decrease.
We are dependent, in part, on innovative new products, casino openings and expansions, continuedmarket penetration and new market opportunities to generate growth of our gaming machine revenues.We have continued to invest in research and development activities to be able to offer creative and highearning products to our customers and in the year ended June 30, 2013, such expenses totaled 16.4% ofrevenues, or $114.5 million, in fiscal 2013, and the aggregate amount spent was up $20.0 million, or21.2%, compared to the prior-year period. Expansion and new market opportunities may come frompolitical action as governments look to gaming to provide tax revenues in support of public programsand view gaming as a key driver for tourism.
Strategic Priority: Invest in the establishment, development and operation of our interactive gamingproducts and services.
Fiscal 2013 Result: In the December 2010 quarter, we launched a business-to-consumer, online casinowebsite for residents in the United Kingdom, although we did not begin to market the site untilFebruary 2011. Our Jackpotparty.com online casino offers a variety of our popular slot games andcertain card and table games. We believe the success of our gaming content, technology foundation andinteractive capabilities allows us to provide online capabilities to consumers in other jurisdictionsprimarily on a business-to-business (“B2B”) basis. For example, in the United States, the States ofNevada, New Jersey and Delaware have adopted legislation to legalize certain forms of online gaming.Federal legislators and certain other state legislators, as well as, governments in Canada and Europehave legalized or are considering legalizing certain forms of online gaming, which, if passed, couldexpand our revenue opportunities depending on the type of online gaming approved. The breadth andtiming of these opportunities remain uncertain due to the political process in each of these jurisdictions,as well as the difficult credit environment facing our customers and the risk of continued economicuncertainty.
In fiscal 2012, we began earning revenues from our Lucky Cruise non-wagering social game on Facebookand revenues from the sale of select WMS games that have been ported to operate on mobile devices andPC’s. We further expanded our online, social, casual and mobile gaming presence through theacquisitions of Jadestone and Phantom for $33.6 million in late fiscal 2012. We paid $16.4 million atclosing, $0.5 million in the September 2012 quarter, $2.1 in the December 2012 quarter and $3.2 millionin the June 2013 quarter and have additional consideration of a maximum of $10.7 million in the futurefor both acquisitions. In addition, we recorded a $1.0 million gain which was included in interest incomeand other income and expense, net in fiscal 2013; partially offset by an increase in goodwill of $0.3million in fiscal 2013 relating to other items. These acquisitions individually and in the aggregate werenot material to our Consolidated Financial Statements. Additionally, in fiscal 2012 we entered into anagreement to provide an end-to-end B2B online casino site in Belgium in collaboration with GroupePartouche, which went live in the March 2013 quarter. Early in fiscal 2013 we entered into a strategicalliance with Dragonfish, the independent B2B division of 888 Holdings plc, that expands our B2B onlineproduct offering in the United States with one of the world’s leading online poker solutions. In July 2012,we launched Jackpot Party Social Casino on Facebook and in the March 2013 quarter, we launched thisapplication on the Apple® iOs system for iPhone® and iPad® platforms, and in the June 2013 quarter,launched on the Android™ platform, all of which enhanced our revenue earning opportunities. In theMarch 2013 quarter, we launched the first WMS games on Jadestone’s servers to several of Jadestone’scustomers. Total revenues from interactive gaming products and services grew dramatically to $57.0million for the year ended June 30, 2013 up from $4.1 million in the prior year. We will focus on therevenue growth, development and market efficiencies of our worldwide interactive gaming products andservices to optimize the benefits for casino operators and their players. As regulated markets legalizeinteractive gaming products and services, we intend to enter and do business in those markets.
Strategic Priority: Drive margin improvements.
44
Fiscal 2013 Result: Our operating margin decreased 630 basis points to 6.4% for the year endedJune 30, 2013, from 12.7% for the prior-year and included $13.5 million of pre-tax charges, which arerecorded in selling and administrative expenses, related to the process our Board of Directors utilizedin the sale of the Company, plus completing the closing conditions and the integration efforts prior tothe effective time of the pending Merger.
Our research and development costs increased as a percentage of revenues to 16.4% in fiscal 2013 from13.7% of revenues in fiscal 2012 and 14.9% of revenues in fiscal 2011 and in total increased $20.0million, or 21.2%, over the prior year. The increase is primarily caused by higher development costs tore-engineer and re-purpose our library of slot gaming content for distribution as our interactive gamingproducts and services, the impact of the Phantom and Jadestone acquisitions in the June 2012 quarter,along with an increase in spending for our innovative new casino gaming products and higher payrolland incentive compensation costs. Our selling and administrative expenses increased as a percentage ofrevenue to 24.3% in fiscal 2013 from 21.0% of revenues in fiscal 2012 and 19.2% of revenues in fiscal2011. The increase is primarily caused by $13.5 million of pre-tax charges, which are recorded inselling and administrative expenses, related to the process our Board of Directors utilized in the sale ofthe Company, plus completing the closing conditions and the integration efforts prior to the effectivetime of the pending Merger, the increase in online marketing costs to expand the player base forinteractive gaming products and services, the impact of the Phantom and Jadestone acquisitions in theJune 2012 quarter, the incremental expenses related to our implementation of an upgraded enterprise-wide ERP system and higher payroll and incentive compensation cost, partially offset by ongoing costsavings initiatives. Our depreciation and amortization expense increased as a percentage of revenue to17.4% in fiscal 2013 from 13.4% of revenues in fiscal 2012 and 9.1% in fiscal 2011 and increased$29.0 million, or 31.5%, over the prior year due to the higher level of capital spent in fiscal 2013, 2012and 2011 to upgrade the installed base of our participation gaming machines to new Bluebird2,Bluebird xD and Gamefield xD gaming machines, depreciation on a new facility that was placed inservice in August 2012, depreciation on capitalized costs related to an upgrade of our Oracle ERPsystem as we have now gone live with the new system and from amortization of finite-lived intangibleassets from our two acquisitions in the June 2012 quarter. By driving margin improvements in futureperiods, we believe we will be able to increase net income and generate the necessary capital to fundthe other elements of our business strategy.
We are still implementing our lean sigma and strategic sourcing initiatives, and we continue to realizepositive results. We believe these initiatives will continue to drive margin improvement in future yearsthrough disciplined cost management, especially with the Bluebird xD, Bluebird2e and Blade productlines, where we expect to improve margins to be more comparable to our Bluebird2 product line.Longer term, we expect to benefit from an expanded volume of business that should result in greatervolume discounts from our raw material suppliers and enable us to spread our manufacturing overheadcosts over a larger number of units thereby reducing the cost per unit. We also expect our gamingoperations will continue to expand with both the installed base and revenue per day increasing in fiscal2014 and fiscal 2015.
We believe our product development capabilities, combined with additional functionalities andenhanced features of our advanced technologies and gaming platforms, enable us to optimize theentertainment value of our products and improve our operating margins. In fiscal 2014, based on ourcurrent plans, we expect to increase our spending to grow our interactive gaming products and servicesand also increase spending to accelerate product innovation efforts and as a result research anddevelopment expenses are expected to be approximately 15% to 16% of revenues. Excluding theimpacts of the sales process and the Merger transaction, based on our current plans, we expect sellingand administrative expenses to grow modestly as a percentage of revenues in fiscal 2014 primarily dueto increased spending to grow our interactive gaming products and services and as we grow andsupport our increased overall revenues. Due to higher capital spending in our gaming operations overthe past three years and the completion of two major property, plant and equipment projects in early
45
fiscal 2013, we expect that depreciation and amortization expense will increase as a percentage ofrevenues in fiscal 2014 and fiscal 2015 in comparison to fiscal 2013.
OTHER KEY FISCAL 2013 ACTIVITIES
Common Stock Repurchase Program
See Note 13. “Stockholders’ Equity—Common Stock Repurchase Program” to our Consolidated FinancialStatements.
CRITICAL ACCOUNTING ESTIMATES
Our Consolidated Financial Statements were prepared in conformity with accounting principles generallyaccepted in the United States. Accordingly, we are required to make estimates incorporating judgments andassumptions we believe are reasonable based on our experience, contract terms, trends in our company and theindustry as a whole, as well as information available from other outside sources. Our estimates affect amountsrecorded in our Consolidated Financial Statements and actual results may differ from initial estimates. Ouraccounting policies, including those involving critical accounting estimates, are more fully described in Note 2.“Principal Accounting Policies” to our Consolidated Financial Statements.
We consider the following accounting estimates to be the most critical to fully understand and evaluate ourreported financial results. They require us to make subjective or complex judgments about matters that areinherently uncertain or variable. Senior management discussed the development, selection and disclosure of thefollowing accounting estimates, considered most sensitive to changes from external factors, with the Audit andEthics Committee of our Board of Directors.
Revenue Recognition
General
We evaluate the recognition of revenue based on the criteria set forth in the following accounting guidance:Financial Accounting Standards Board (“FASB”) Accounting Standards Codification (“ASC”) Topic 605,“Revenue Recognition” (“Topic 605”) and FASB Topic 985, “Software” (“Topic 985”), as updated byAccounting Standards Update (“ASU”) No. 2009-13, “Multiple-Deliverable Revenue Arrangements”(“ASU 2009-13”) and ASU No. 2009-14 “Certain Revenue Arrangements That Include Software Elements”(“ASU 2009-14”).
ASU 2009-13 defines multiple-deliverable revenue arrangements and requires that the arrangementconsideration be allocated, at the inception of the arrangement, to all deliverables based on their relative sellingprice (the “relative selling price method”). When applying the relative selling price method, a hierarchy is usedfor estimating the selling price based first on vendor specific objective evidence (“VSOE”), then third-partyevidence (“TPE”) and finally management’s estimated selling price (“ESP”).
Our product sales revenues are recorded pursuant to ASU 2009-14, as the software and non-softwarecomponents of our gaming machines function together to deliver the product’s essential functionality.
Our revenue recognition policy for both product sales and gaming operations is to record revenue when allthe following criteria are met:
➣ Persuasive evidence of an agreement exists;
➣ The price to the customer is fixed or determinable;
➣ Delivery has occurred, title has been transferred and any acceptance terms have been fulfilled;
46
➣ No significant contractual obligations remain; and
➣ Collectability is reasonably assured.
We recognize revenue when all of the criteria listed above are met and do not recognize revenue if all of thecriteria are not met. The application of our revenue recognition policy and changes in our assumptions orjudgments also affect the timing and amounts of revenues and costs recognized. We defer revenue for anyundelivered units of accounting for multiple deliverable arrangements. Deliverables are divided into separateunits of accounting if:
➣ Each item has value to the customer on a standalone basis; and
➣ Delivery of any undelivered item is considered probable and substantially in our control.
Considerable judgment is required to determine whether an arrangement consists of multiple deliverables,whether the delivered item has value to the customer on a standalone basis and to determine the relative sellingprice used to allocate the arrangement fee to each deliverable. The fair value of the undelivered elements isdeferred and the remaining portion of the arrangement fee is allocated to the delivered element and is recognizedas revenue. Such determination affects the amount and timing of revenue recognition. We evaluate the primaryuse and functionality of each deliverable in determining whether a delivered item has standalone value andqualifies as a separate unit of accounting.
Considerable judgment is also necessary to determine whether certain of our products are within the scopeof software revenue recognition under Topic 985 and whether the software and non-software elements of theseproducts function together to deliver the essential functionality under ASU 2009-14. Our determination dictateswhether general revenue recognition guidance under Topic 605 or software revenue recognition guidance underTopic 985 applies and could impact the timing of revenue recognition.
The application of this policy affects the amount of our revenues, accounts and notes receivable anddeferred revenues. In fiscal 2013, 2012 and 2011, we had no material changes in the critical accounting estimatesarising from the application of this policy and we do not anticipate material changes in the near term. See Note 2.“Principal Accounting Policies—Revenue Recognition” to our Consolidated Financial Statements.
Allowances for Slow-Moving and Obsolete Inventories
We value inventories based on estimates of potentially excess and obsolete inventory after consideringhistorical and forecasted demand and historical and forecasted average selling prices. However, forecasts aresubject to revisions, cancellations and rescheduling. Actual demand may differ from anticipated demand, andsuch differences may have a material effect on our Consolidated Financial Statements. Demand for partsinventories is subject to technical obsolescence. Inventories on hand in excess of forecasted demand are writtendown to net realizable value.
An active market exists mostly outside of North America for used gaming machines. When we receive agaming machine on trade-in, we estimate a carrying value for the gaming machine based on the condition of thegaming machine, as well as our experience in selling used gaming machines and such estimates could change dueto changes in demand in general for used gaming machines. We sell these trade-ins as-is or refurbish the usedgaming machines before resale. We also sell participation gaming machines, after refurbishment, as used gamingmachines when we no longer need them in our gaming operations and we also harvest parts from Bluebirdparticipation gaming machines to sell to customers as spare parts to support the estimated over 50,000 of suchgaming machines still in casinos today. Therefore, we review our used gaming machine inventories forimpairment on a quarterly basis. Actual demand for new and used gaming machines may differ from anticipateddemand, and such differences may have a material effect on our Consolidated Financial Statements. We soldapproximately 4,500 and nearly 8,000 used gaming machines in fiscal 2013 and 2012, respectively.
47
During fiscal 2013, 2012 and 2011, we recorded provisions for inventory write-downs of $2.4 million, $5.0million and $7.1 million, respectively. Fiscal 2011 includes $4.9 million of inventory and other asset write-downs related to the wind down of our Orion and original Bluebird cabinet product lines as part of our strategicreview.
The application of this policy affects the amount of our inventories and cost of product sales. Other than the$4.9 million inventory and other asset write-downs recorded in fiscal 2011, in fiscal 2013, 2012 and 2011, wehad no material changes in the critical accounting estimates arising from the application of this policy and we donot anticipate material changes in the near term. See Note 2. “Principal Accounting Policies – Inventories” andNote 7. “Inventories” to our Consolidated Financial Statements.
Participation Gaming Machine Depreciation and Net Realizable Value
Prior to July 2011, we depreciated the Bluebird, Bluebird2 and Bluebird xD participation gaming machinesover a three-year estimated useful life to residual value, while we depreciated the participation top-boxes over aone-year estimated useful life with no residual value. In July 2011, we changed the estimated useful life of theBluebird participation gaming machines to a five-year useful life and depreciate to residual value. In January2012, we changed the estimated useful life of the Bluebird2 and Bluebird xD participation gaming machines to afour-year useful life and depreciate to residual value, while we changed the estimated useful life of ourparticipation top-boxes to a two-year useful life with no residual value. In October 2012, we changed theestimated useful life of the Bluebird2 and Bluebird xD participation gaming machines to a five-year useful lifeand depreciate to residual value. These changes in useful lives were made to reflect the longer market life andextended replacement cycle of gaming machines. None of these changes in estimated useful lives were materialto our Consolidated Financial Statements. We depreciate refurbishment costs of our gaming operationsequipment for periods from 12 months to 18 months.
A material adverse impact could occur if the actual useful life of our gaming operations equipment is lessthan what was used in estimating depreciation expense, or if actual residual value is less than the anticipatedresidual value. At June 30, 2013 and 2012, we had $140.5 million and $115.7 million net book value of gamingoperations equipment recorded in our Consolidated Balance Sheets. As our gaming operations equipment can berelocated from one customer to another customer, we review the carrying value of gaming operations equipmentfor impairment by type of equipment (for base gaming machines each of: Legacy, Bluebird mechanical reel,Bluebird video, Bluebird slant, Bluebird2 mechanical reel, Bluebird2 video, Bluebird2 widescreen, Bluebird xDmechanical reel, Bluebird xD video and Gamefield xD; for top-boxes by form factor; for signage by form factor;and other equipment by category) when events or changes in circumstances indicate that the carrying value ofany of these asset groups may not be recoverable. An impairment loss would be recognized when the presentvalue of estimated directly related future cash flows expected to result from the use of the gaming operationsequipment and its eventual disposition is less than its carrying value.
The application of this policy affects the amount of our gaming operations equipment, accumulateddepreciation on gaming operations equipment, cost of gaming operations, depreciation and amortization expense,income tax expense and deferred income tax assets and liabilities. In fiscal 2013, 2012 and 2011, we had nomaterial changes in the critical accounting estimates arising from the application of this policy and we do notanticipate material changes in the near term. See Note 2. “Principal Accounting Policies – Gaming OperationsEquipment and Property, Plant and Equipment” and Note 8. “Gaming Operations Equipment and Property, Plantand Equipment” to our Consolidated Financial Statements.
Intangible Asset Valuations
We develop, acquire and license from third parties intangible assets that we use in our games, gamingmachines and interactive gaming products and services. At June 30, 2013 and 2012, we had $131.9 million and$137.7 million, respectively, capitalized on our Consolidated Balance Sheets for such costs, along with
48
commitments not on our Consolidated Balance Sheets for an additional $60.8 million at June 30, 2013. As part ofour contracts with the licensors, we typically provide a minimum guaranteed commitment and prepay royaltiesand license fees, usually at the time the contract is signed, even though the product may not be introduced untilmonths or years later. We capitalize the royalty and license fee advances as intangible assets.
When products using the developed, acquired or licensed intangible assets begin to generate revenue, webegin amortization of the intangible asset. In cases where the intangible asset represents a patent or a paid-uplicense, the intangible asset is amortized based on the greater of the units of production methodology or thestraight-line basis over the estimated life of the intangible asset. In those cases where the intangible asset is alicense agreement that provides for a royalty to be earned by the licensor for each gaming machine sold or placedon a lease, the advance is amortized based on the royalty rates provided in the license agreement. In both cases,the amortization is included in cost of product sales if directly related to product sale revenues or cost of gamingoperations if directly related to gaming operations revenues. We regularly evaluate the estimated future benefit ofintangible assets, as well as minimum commitments not yet paid, to determine amounts unlikely to be realizedfrom forecasted product sales revenues or gaming operations revenues. If actual or revised revenue forecasts fallbelow the initial estimate, then we may need to revise the remaining useful life and/or record a charge to writedown any intangible asset recorded to net realizable value or accrue for the shortfall between the intangible assetvalue plus remaining commitments and the actual amount estimated to be earned. We review the carrying valueof our intangible assets individually when events or changes in circumstances indicate that the carrying value ofan intangible asset may not be recoverable. An impairment loss would be recognized when the present value ofestimated directly related future cash flows expected to result from the use of the intangible asset and its eventualdisposition is less than its carrying value.
We do not amortize goodwill. We evaluate goodwill for impairment annually or more frequently when anevent occurs or circumstances change that indicates the carrying value may not be recoverable. We evaluate therecoverability of goodwill using a two-step impairment test. In the first step, the fair value of each of our tworeporting units are compared to its book value including goodwill. If the fair value of the reporting units are inexcess of its book value, the related goodwill is not impaired and no further analysis is necessary. If the fair valueof the reporting units are less than its book value, there is an indication of potential impairment and a second stepis performed. When required, the second step of testing involves calculating the implied fair value of goodwillfor the reporting units. The implied fair value of goodwill is determined in the same manner as goodwillrecognized in a business combination, which is the excess of the fair value of the reporting unit determined instep one over the fair value of its net assets and identifiable intangible assets as if the reporting unit had beenacquired. If the carrying value of the reporting unit’s goodwill exceeds the implied fair value of that goodwill, animpairment loss is recognized in an amount equal to that excess.
The application of this policy affects the amount of our current assets, non-current assets, current liabilities,cost of product sales, cost of gaming operations, research and development expense, depreciation andamortization expense and selling and administrative expense. Other than the impairment and other chargesrecorded in conjunction with our strategic reassessment in the June and September 2011 quarters, in fiscal 2013,2012 and 2011, we had no material changes in the critical accounting estimates arising from the application ofthis policy and we do not anticipate material changes in the near term. See Note 2. “Principal AccountingPolicies—Costs of Computer Software Utilized in Products Sold or Leased and Intangible Assets”, Note 9.“Intangible Assets” and Note 15. “Commitments, Contingencies and Indemnifications” to our ConsolidatedFinancial Statements.
Income Tax Accounting
We account for income taxes in accordance with FASB Topic 740, “Accounting for Income Taxes” (“Topic740”). We conduct business globally and are subject to income taxes in U.S. Federal, state, local and foreignjurisdictions. Determination of the appropriate amount and classification of income taxes depends on severalfactors, including estimates of the timing and probability of realization of deferred income taxes, reserves foruncertain income tax positions and income tax payment timing.
49
We record deferred income tax assets and liabilities based on temporary differences between the financialreporting and tax bases of assets and liabilities, applying U.S., state and applicable foreign jurisdiction enactedtax rates expected to be in effect for the year in which the differences are expected to reverse. The ability torealize the deferred income tax assets is evaluated through the forecasting of taxable income, in each jurisdiction,using historical and projected future operating results, the reversal of existing temporary differences and theavailability of tax planning strategies.
We apply an estimated annual effective income tax rate to our quarterly operating results to calculate theprovision for income tax expense. In the event there is a significant, unusual or infrequent item recognized in ourquarterly operating results, the income tax attributable to that item is recorded in the interim period in which itoccurs. We modify our annual effective income tax rate if facts and circumstances change between quarters. Oureffective income tax rates for fiscal 2013, 2012 and 2011 were 29.0%, 35.3% and 34.5%, respectively.
No taxes have been provided on certain undistributed foreign earnings that are planned to be indefinitelyreinvested. If future events, including material changes in estimates of cash, working capital and long-terminvestment requirements necessitate that these earnings be distributed, an additional provision for withholdingtaxes may apply, which could materially affect our future effective income tax rate.
We apply Topic 740 to our uncertain tax positions. Under Topic 740, the benefits of income tax positions thatare more likely than not of being sustained upon audit based on the technical merits of the tax position are recognizedin our Consolidated Financial Statements and positions that do not meet this threshold are not recognized. For incometax positions that are at least more likely than not of being sustained upon audit, the largest amount of the benefit thatis more likely than not of being sustained is recognized in our Consolidated Financial Statements.
As a matter of course, we are regularly audited by various taxing authorities, and sometimes these auditsresult in proposed assessments where the ultimate resolution may result in our owing additional taxes. Weestablish reserves when, despite our belief that our tax return positions are appropriate and supportable underapplicable tax law, we believe certain positions are likely to be challenged and we may not succeed in realizingthe income tax benefit. We evaluate these reserves each quarter and adjust the reserves and the related interest inlight of changing facts and circumstances regarding the probability of realizing tax benefits, such as the progressof a tax audit or the expiration of a statute of limitations. We believe the estimates and assumptions used tosupport our evaluation of tax benefit realization are reasonable. However, final determinations of prior-yearincome tax liabilities, either by settlement with tax authorities or expiration of statutes of limitations, could bematerially different than estimates reflected in our Consolidated Balance Sheets and historical income taxprovisions in our Consolidated Statements of Income. The outcome of these final determinations could have amaterial effect on our income tax provision, net income or cash flows in the period in which that determination ismade. We believe our income tax positions comply with applicable tax law and that we have adequately providedfor any known income tax contingencies.
At June 30, 2013, we provided a valuation allowance of $1.3 million against certain foreign deferred tax assets(net operating losses). In determining the level of required valuation allowance, we considered the foreign subsidiariesprior performance, projected future taxable income and tax planning strategies in making this assessment.
At this time, we believe appropriate provisions for all outstanding tax issues have been made for alljurisdictions and all open years. We are no longer subject to any significant Federal tax examinations by taxauthorities for years before fiscal 2011, or state, local or foreign income tax examinations by tax authorities foryears before fiscal 2009.
The application of this policy affects the amount of our income tax expense, current income tax receivablesand liabilities and current and non-current deferred income tax assets and liabilities. In fiscal 2013, 2012 and2011, we had no material changes in the critical accounting estimates arising from the application of this policyand we do not anticipate material changes in the near term, other than in fiscal 2013, we recorded a $1.5 million
50
reduction in the liability for uncertain tax positions as a result of the completion of the fiscal 2010 Federalincome tax audit and an additional $0.7 million reduction due to the expiration of the statute of limitations forfiscal in 2009, in fiscal 2012, we recorded a $1.0 million reduction in the liability for uncertain tax position as aresult of the expiration of the statute of limitations for fiscal 2008 and in fiscal 2011, we recorded a $4.6 millionreduction in the liability for uncertain tax positions as a result of the completion of the Federal income tax auditof income tax returns through fiscal 2007. See Note 2. “Principal Accounting Policies—Accounting for IncomeTaxes” and Note 11. “Income Taxes” to our Consolidated Financial Statements.
Share-Based Compensation Expense
We account for share-based compensation in accordance with the provisions of FASB Topic 718, “Share-Based Payment” (“Topic 718”). Under Topic 718, the total amount of compensation cost recognized at the end ofthe requisite service period for an award of share-based compensation is based on the number of instruments forwhich the requisite service has been rendered (that is, for which the requisite service period has been completed).We base initial accruals of compensation cost on the estimated number of instruments for which the requisiteservice is expected to be rendered. We will revise our estimates if subsequent information indicates that the actualnumber of instruments is likely to differ from previous estimates. The cumulative effect on current and prior periodsof a change in the estimated number of instruments for which the requisite service is expected to be or has beenrendered is recognized in compensation cost in the period of the change. Pre-tax share-based compensation expensewas $15.9 million, $15.8 million and $18.7 million for fiscal 2013, 2012 and 2011, respectively. In fiscal 2013, wedid not record a provision for equity-based performance units granted under our long-term incentive plan that relateto the thirty-six month periods ended June 30, 2013 and 2014, based on the current assessment of achievement ofthe performance goals. We did record $1.4 million for equity-based performance units granted under our long-termincentive plan related to the thirty-six month period ended June 30, 2015. Additional charges will be recorded infuture periods depending on the assessment of achievement of the performance goals.
Under the fair value recognition provisions of Topic 718, stock-based compensation cost is estimated at thegrant date based on the fair value of the award and is recognized as expense ratably over the requisite serviceperiod of the award. We use the accelerated method to account for stock option expense. Determining theappropriate fair value model and calculating the fair value of share-based awards requires judgment, includingestimating stock price volatility, forfeiture rates and expected life. If actual results differ significantly from theseestimates, share-based compensation expense in our Consolidated Statements of Income could be materiallyimpacted.
The application of this policy affects the amount of our cost of product sales, cost of gaming operations,research and development expenses, selling and administrative expenses, additional paid-in capital and incometax expense. During fiscal 2013, 2012 and 2011, we had no material changes in the critical accounting estimatesarising from the application of this policy and we do not anticipate material changes in the near term. See Note 2.“Principal Accounting Policies—Share-Based Compensation—Stock Option Assumptions” and Note 14. “EquityCompensation Plan” to our Consolidated Financial Statements.
RECENTLY ADOPTED ACCOUNTING STANDARDS
See Note 2. “Principal Accounting Policies—Recently Adopted Accounting Standards” to our ConsolidatedFinancial Statements.
RECENTLY ISSUED ACCOUNTING STANDARDS NOT YET ADOPTED
See Note 2. “Principal Accounting Policies—Recently Issued Accounting Standards Not Yet Adopted” toour Consolidated Financial Statements.
51
RESULTS OF OPERATIONS
Seasonality
Sales of our gaming machines to casinos are generally strongest in the spring and slowest in the summermonths, while gaming operations revenues are generally strongest in the spring and summer. Typically our totalrevenues are lowest in the September quarter and build in each subsequent quarter with the June quartergenerating our highest total quarterly revenues. In addition, quarterly revenues and net income may increasewhen we receive a larger number of approvals for new games and gaming machines from regulators than in otherquarters, when a game or platform that achieves significant player appeal is introduced, if a significant number ofnew casinos open or existing casinos expand or if gaming is permitted in a significant new jurisdiction.
Impact of Inflation
During the past three fiscal years, the general level of inflation affecting us has been relatively low. Ourability to pass on future cost increases in the form of higher sales prices will depend on the prevailingcompetitive environment and the acceptance of our products in the marketplace.
Net Charges in Fiscal 2012 and 2011
Given the continuing lower levels of capital spending by casinos over the three years ended June 30, 2011and with no leading indicators suggesting that demand will increase in the near-term, we conducted a thoroughreview of our product plans and business strategies at the end of fiscal 2011 and beginning of fiscal 2012. Westill believe our long-term vision is intact but, as a result of this review, we refined our product plans andrestructured our organization. Specifically, we streamlined our product management and product developmentfunctions, simplified our product plans and further prioritized on-time commercialization of new game themes,products and portal applications. Some of the product, operational and other decisions made in this review led toimpairment, restructuring, asset write-downs and other charges, net of $24.0 million pre-tax, or $0.26 per dilutedshare, recorded in the June 2011 quarter and $27.8 million pre-tax, or $0.28 per diluted share, for fiscal 2011.
In addition, in the September 2011 quarter we implemented a broader impairment and restructuring andrecorded additional charges amounting to $14.0 million pre-tax, or $0.17 per diluted share, and for fiscal 2012such net pre-tax charges totaled $13.3 million, or $0.16 per diluted share. These product plan realignment andrestructuring actions were expected to better direct resources and focus on near-term revenue opportunities andreduce our overall organizational staffing by approximately 10% to a level that better correlates with the existingoperating environment, while maintaining our ability to create great games that engage current players and attractnew players.
52
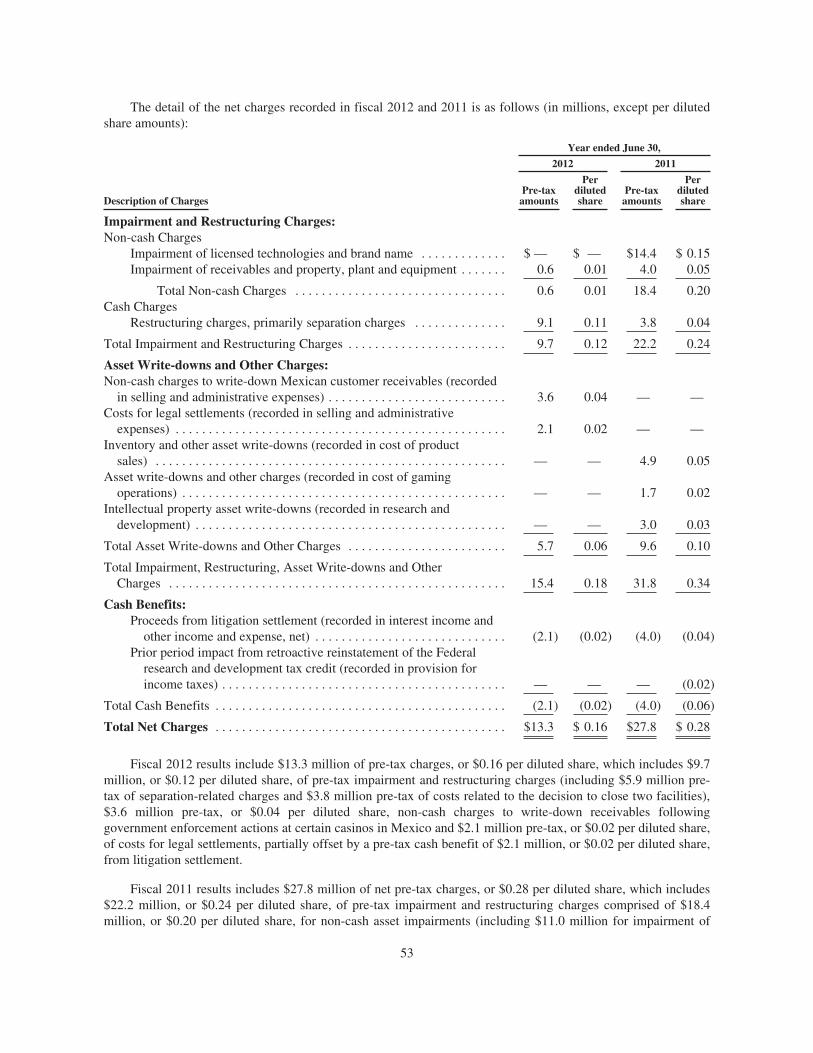
The detail of the net charges recorded in fiscal 2012 and 2011 is as follows (in millions, except per dilutedshare amounts):
Year ended June 30,
2012 2011
Description of ChargesPre-taxamounts
Perdilutedshare
Pre-taxamounts
Perdilutedshare
Impairment and Restructuring Charges:Non-cash Charges
Impairment of licensed technologies and brand name . . . . . . . . . . . . . $ — $ — $14.4 $ 0.15Impairment of receivables and property, plant and equipment . . . . . . . 0.6 0.01 4.0 0.05
Total Non-cash Charges . . . . . . . . . . . . . . . . . . . . . . . . . . . . . . . . 0.6 0.01 18.4 0.20Cash Charges
Restructuring charges, primarily separation charges . . . . . . . . . . . . . . 9.1 0.11 3.8 0.04
Total Impairment and Restructuring Charges . . . . . . . . . . . . . . . . . . . . . . . . 9.7 0.12 22.2 0.24
Asset Write-downs and Other Charges:Non-cash charges to write-down Mexican customer receivables (recorded
in selling and administrative expenses) . . . . . . . . . . . . . . . . . . . . . . . . . . . 3.6 0.04 — —Costs for legal settlements (recorded in selling and administrative
expenses) . . . . . . . . . . . . . . . . . . . . . . . . . . . . . . . . . . . . . . . . . . . . . . . . . . 2.1 0.02 — —Inventory and other asset write-downs (recorded in cost of product
sales) . . . . . . . . . . . . . . . . . . . . . . . . . . . . . . . . . . . . . . . . . . . . . . . . . . . . . — — 4.9 0.05Asset write-downs and other charges (recorded in cost of gaming
operations) . . . . . . . . . . . . . . . . . . . . . . . . . . . . . . . . . . . . . . . . . . . . . . . . . — — 1.7 0.02Intellectual property asset write-downs (recorded in research and
development) . . . . . . . . . . . . . . . . . . . . . . . . . . . . . . . . . . . . . . . . . . . . . . . — — 3.0 0.03
Total Asset Write-downs and Other Charges . . . . . . . . . . . . . . . . . . . . . . . . 5.7 0.06 9.6 0.10
Total Impairment, Restructuring, Asset Write-downs and OtherCharges . . . . . . . . . . . . . . . . . . . . . . . . . . . . . . . . . . . . . . . . . . . . . . . . . . . 15.4 0.18 31.8 0.34
Cash Benefits:Proceeds from litigation settlement (recorded in interest income and
other income and expense, net) . . . . . . . . . . . . . . . . . . . . . . . . . . . . . (2.1) (0.02) (4.0) (0.04)Prior period impact from retroactive reinstatement of the Federal
research and development tax credit (recorded in provision forincome taxes) . . . . . . . . . . . . . . . . . . . . . . . . . . . . . . . . . . . . . . . . . . . — — — (0.02)
Total Cash Benefits . . . . . . . . . . . . . . . . . . . . . . . . . . . . . . . . . . . . . . . . . . . . (2.1) (0.02) (4.0) (0.06)
Total Net Charges . . . . . . . . . . . . . . . . . . . . . . . . . . . . . . . . . . . . . . . . . . . . $13.3 $ 0.16 $27.8 $ 0.28
Fiscal 2012 results include $13.3 million of pre-tax charges, or $0.16 per diluted share, which includes $9.7million, or $0.12 per diluted share, of pre-tax impairment and restructuring charges (including $5.9 million pre-tax of separation-related charges and $3.8 million pre-tax of costs related to the decision to close two facilities),$3.6 million pre-tax, or $0.04 per diluted share, non-cash charges to write-down receivables followinggovernment enforcement actions at certain casinos in Mexico and $2.1 million pre-tax, or $0.02 per diluted share,of costs for legal settlements, partially offset by a pre-tax cash benefit of $2.1 million, or $0.02 per diluted share,from litigation settlement.
Fiscal 2011 results includes $27.8 million of net pre-tax charges, or $0.28 per diluted share, which includes$22.2 million, or $0.24 per diluted share, of pre-tax impairment and restructuring charges comprised of $18.4million, or $0.20 per diluted share, for non-cash asset impairments (including $11.0 million for impairment of
53
technology licenses, $3.4 million for impairment of the Orion brand name, $2.4 million for impairment chargesto write-down the value of the Orion facility in the Netherlands to fair value upon closing of the facility, $1.4million for impairment of receivables related to government action to close casinos in Venezuela and $0.2million of other impairment charges); and $3.8 million, or $0.04 per diluted share, for restructuring charges(primarily separation costs); along with $9.6 million of pre-tax charges, or $0.10 per diluted share, for assetwrite-downs and other charges (including charges for inventory write-downs related to winding down the Orionand original Bluebird cabinet product lines); partially offset by $4.0 million or $0.04 per diluted share from cashproceeds of litigation settlement and a $0.02 per diluted share benefit recorded in the December 2010 quarterrelated to the period January 1, 2010 through June 30, 2010 from the retroactive reinstatement of the Federalresearch and development tax credit.
54
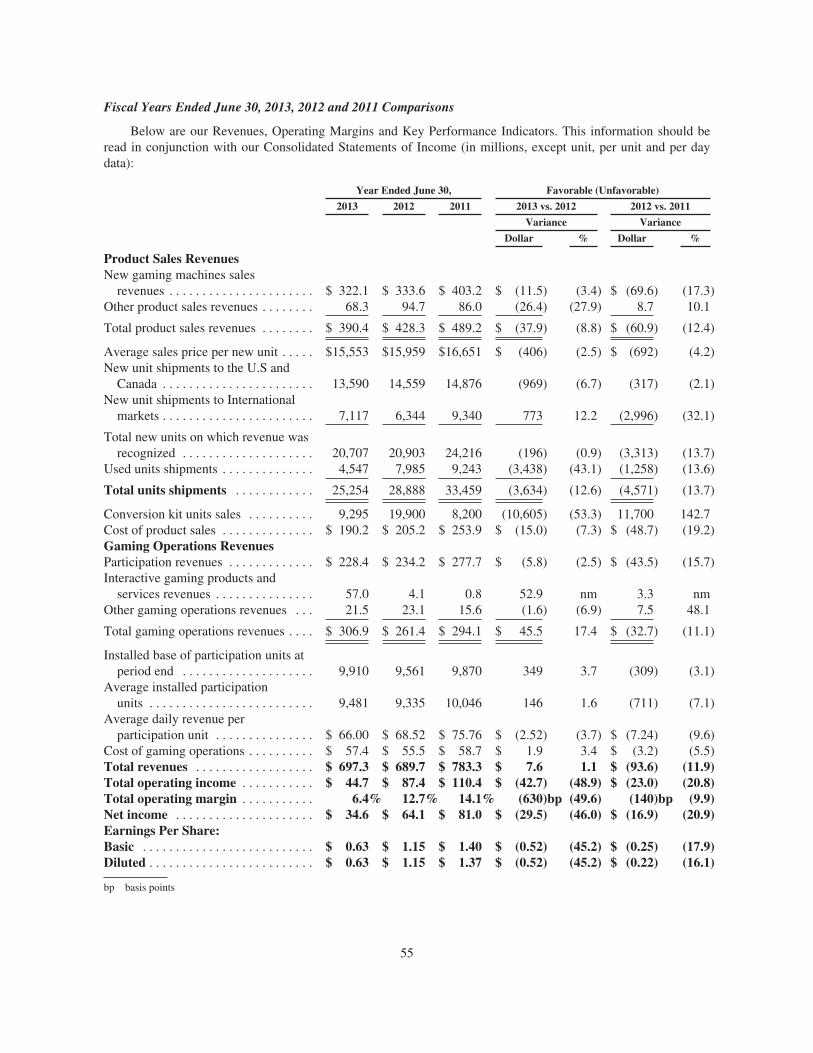
Fiscal Years Ended June 30, 2013, 2012 and 2011 Comparisons
Below are our Revenues, Operating Margins and Key Performance Indicators. This information should beread in conjunction with our Consolidated Statements of Income (in millions, except unit, per unit and per daydata):
Year Ended June 30, Favorable (Unfavorable)
2013 2012 2011 2013 vs. 2012 2012 vs. 2011
Variance Variance
Dollar % Dollar %
Product Sales RevenuesNew gaming machines sales
revenues . . . . . . . . . . . . . . . . . . . . . . $ 322.1 $ 333.6 $ 403.2 $ (11.5) (3.4) $ (69.6) (17.3)Other product sales revenues . . . . . . . . 68.3 94.7 86.0 (26.4) (27.9) 8.7 10.1
Total product sales revenues . . . . . . . . $ 390.4 $ 428.3 $ 489.2 $ (37.9) (8.8) $ (60.9) (12.4)
Average sales price per new unit . . . . . $15,553 $15,959 $16,651 $ (406) (2.5) $ (692) (4.2)New unit shipments to the U.S and
Canada . . . . . . . . . . . . . . . . . . . . . . . 13,590 14,559 14,876 (969) (6.7) (317) (2.1)New unit shipments to International
markets . . . . . . . . . . . . . . . . . . . . . . . 7,117 6,344 9,340 773 12.2 (2,996) (32.1)
Total new units on which revenue wasrecognized . . . . . . . . . . . . . . . . . . . . 20,707 20,903 24,216 (196) (0.9) (3,313) (13.7)
Used units shipments . . . . . . . . . . . . . . 4,547 7,985 9,243 (3,438) (43.1) (1,258) (13.6)
Total units shipments . . . . . . . . . . . . 25,254 28,888 33,459 (3,634) (12.6) (4,571) (13.7)
Conversion kit units sales . . . . . . . . . . 9,295 19,900 8,200 (10,605) (53.3) 11,700 142.7Cost of product sales . . . . . . . . . . . . . . $ 190.2 $ 205.2 $ 253.9 $ (15.0) (7.3) $ (48.7) (19.2)Gaming Operations RevenuesParticipation revenues . . . . . . . . . . . . . $ 228.4 $ 234.2 $ 277.7 $ (5.8) (2.5) $ (43.5) (15.7)Interactive gaming products and
services revenues . . . . . . . . . . . . . . . 57.0 4.1 0.8 52.9 nm 3.3 nmOther gaming operations revenues . . . 21.5 23.1 15.6 (1.6) (6.9) 7.5 48.1
Total gaming operations revenues . . . . $ 306.9 $ 261.4 $ 294.1 $ 45.5 17.4 $ (32.7) (11.1)
Installed base of participation units atperiod end . . . . . . . . . . . . . . . . . . . . 9,910 9,561 9,870 349 3.7 (309) (3.1)
Average installed participationunits . . . . . . . . . . . . . . . . . . . . . . . . . 9,481 9,335 10,046 146 1.6 (711) (7.1)
Average daily revenue perparticipation unit . . . . . . . . . . . . . . . $ 66.00 $ 68.52 $ 75.76 $ (2.52) (3.7) $ (7.24) (9.6)
Cost of gaming operations . . . . . . . . . . $ 57.4 $ 55.5 $ 58.7 $ 1.9 3.4 $ (3.2) (5.5)Total revenues . . . . . . . . . . . . . . . . . . $ 697.3 $ 689.7 $ 783.3 $ 7.6 1.1 $ (93.6) (11.9)Total operating income . . . . . . . . . . . $ 44.7 $ 87.4 $ 110.4 $ (42.7) (48.9) $ (23.0) (20.8)Total operating margin . . . . . . . . . . . 6.4% 12.7% 14.1% (630)bp (49.6) (140)bp (9.9)Net income . . . . . . . . . . . . . . . . . . . . . $ 34.6 $ 64.1 $ 81.0 $ (29.5) (46.0) $ (16.9) (20.9)Earnings Per Share:Basic . . . . . . . . . . . . . . . . . . . . . . . . . . $ 0.63 $ 1.15 $ 1.40 $ (0.52) (45.2) $ (0.25) (17.9)Diluted . . . . . . . . . . . . . . . . . . . . . . . . . $ 0.63 $ 1.15 $ 1.37 $ (0.52) (45.2) $ (0.22) (16.1)
bp basis points
55
Fiscal 2013 Compared to Fiscal 2012
Total revenues for fiscal 2013 increased 1.1%, or $7.6 million, over fiscal 2012, reflecting:
➣ An $11.5 million, or 3.4%, decrease in new unit sales revenue as a result of:
➣ A 196 unit, or 0.9%, decrease in new units sold as:
➣ New units sold in the United States and Canada totaled 13,590 units, a decrease of 6.7% in fiscal2013. Replacement units, inclusive of 2,412 Canadian VLT units, shipped to U.S. and Canadiancustomers increased 13.3% over the prior-year period to approximately 11,900 units, while newgaming machine sales for new casino openings and expansions totaled approximately 1,700units compared to approximately 4,100 units in the fiscal 2012. Sales of 4,717 Bluebird xD unitsaccounted for 22.8% of total new units sold in fiscal 2013 and 31.2% of total new units sold infiscal 2012 and sales of 3,412 Blade units, which were launched in March 2013, accounted for16.5% of total new units.
➣ International new units sold increased 12.2% from the prior-year to 7,117 units from 6,344 unitsin fiscal 2012 and represented 34.4% of global shipments up from 30.3% in the prior-periodprimarily reflecting increased shipments of our new Bluebird2 lite cabinet for selectinternational markets.
➣ We shipped 647 VGT units to the new market that opened in Illinois starting in the September2013 quarter. During the March and June 2013 quarters, we believe we lost revenue in thismarket due to customer concerns about our inability to serve the market long-term givenexisting Illinois law prohibited the supplier of the state monitoring system (currently ScientificGames) from also selling VGTs, which will be the case upon the closing of the acquisition.Once the governor signed a new law modifying this provision on June 24, 2013, we restartedshipments into the Illinois market.
➣ A 2.5% decrease in the average selling price of new gaming machines to $15,553, principallyreflecting the lower average selling prices associated with VLTs, VGTs and the new Bluebird2 litecabinet for select international markets, as well as the impact of the competitive marketplace anduntil the launch of the new Blade cabinet in March 2013, our current line-up of gaming cabinetsbeing amongst the oldest in the industry.
➣ A $26.4 million, or 27.9%, decrease in other product sales revenues, reflecting a decrease in gameconversion revenues, used gaming machines revenues and parts sales revenues; partially offset by anincrease in other product sales revenues.
➣ We earned revenue on 9,295 conversion kits in fiscal 2013, compared to a record 19,900 conversionkits in the prior-year period; and
➣ We sold 4,547 used gaming machines during fiscal 2013, compared to 7,985 used gaming machinesin the prior-year. The average sales price of used gaming machines decreased in fiscal 2013principally reflecting market prices declining for our used Bluebird gaming machines.
➣ Participation revenues were lower by $5.8 million, or 2.5%, due primarily to:
➣ Overall average revenue per day decreased by $2.52, or 3.7%, principally reflecting lower averagerevenue per day in our percentage of coin-in gaming machines due to lower performance of ourgames.
➣ The average installed base of participation gaming machines in fiscal 2013 increased 146 units, or1.6%, year over year. We were able to increase the ending installed base by 349 units, or 3.7%, atJune 30, 2013, from June 30, 2012.
➣ A $52.9 million increase in interactive gaming products and services revenue, primarily reflecting theJuly 2012 launch of our Jackpot Party Social Casino on Facebook and continued growth in the UK
56
online gaming revenues. Technological advances and the increasing popularity of wireless mobiletechnology, such as smart phones, tablets and social networking, have led to growth in online socialgaming.
➣ Other gaming operations revenue decreased by 6.9%, or $1.6 million, from the prior year principallyreflecting lower royalty revenues from licensing proprietary intellectual property and technologies.
We expect to generate modest revenue growth in fiscal 2014 and 2015 as we increase our global marketpenetration due to launching new products and gaming cabinets, expanding market distribution opportunities,growing our participation installed base through the introduction of new and innovative participation games andincreasing revenues from our interactive gaming products and services and networked gaming operations.Likewise in fiscal 2014 and 2015, we expect modest improvements in lowering the cost of our gaming machinesresulting from the ongoing implementation of process improvements throughout the entire organization with theutilization of lean sigma tools to improve quality and eliminate waste, improved results from our strategicsourcing initiatives and the benefits from ongoing efforts to level the production schedule throughout eachquarter, which will be partially offset by the impact of higher VLT and Bluebird2 lite sales which have a loweraverage selling price than our Class III gaming machines.
Our cost of product sales and cost of gaming operations may not be comparable to other companies as theyexclude the following amounts of depreciation and amortization, which are included in the depreciation andamortization line item, and distribution expenses included in the selling and administration line item (in millionsof dollars):
Year EndedJune 30,
Increase/(Decrease)
2013 2012 Dollar Percent
Depreciation and amortizationCost of product sales . . . . . . . . . . . . . . . . . . . . . . . . . . . . . . . . . . . . . . . . . . . $ 8.4 $ 6.4 $ 2.0 31.3%Cost of gaming operations . . . . . . . . . . . . . . . . . . . . . . . . . . . . . . . . . . . . . . . 75.0 57.6 17.4 30.2
Distribution expenses . . . . . . . . . . . . . . . . . . . . . . . . . . . . . . . . . . . . . . . . . . . . . . . 22.6 24.1 (1.5) (6.2)
Operating Expenses
Operating expenses were as follows (in millions of dollars):
Year EndedJune 30,
Increase/(Decrease)
2013 2012 Amount %
Costs and Expenses:Cost of product sales . . . . . . . . . . . . . . . . . . . . . . . . . . . . . . . . . . . . $190.2 $205.2 $(15.0) (7.3)%
As a percentage of product sales revenues . . . . . . . . . . . . . . . 48.7% 47.9% 80bp 1.7Cost of gaming operations . . . . . . . . . . . . . . . . . . . . . . . . . . . . . . . . 57.4 55.5 1.9 3.4
As a percentage of gaming operations revenues . . . . . . . . . . . 18.7% 21.2% (250)bp (11.8)Research and development expense . . . . . . . . . . . . . . . . . . . . . . . . . 114.5 94.5 20.0 21.2
As a percentage of total revenues . . . . . . . . . . . . . . . . . . . . . . 16.4% 13.7% 270bp 19.7Selling and administrative expense . . . . . . . . . . . . . . . . . . . . . . . . . 169.3 145.2 24.1 16.6
As a percentage of total revenues . . . . . . . . . . . . . . . . . . . . . . 24.3% 21.0% 330bp 15.7Depreciation and amortization expense . . . . . . . . . . . . . . . . . . . . . . 121.2 92.2 29.0 31.5
As a percentage of total revenues . . . . . . . . . . . . . . . . . . . . . . 17.4% 13.4% 400bp 29.9Impairment and restructuring charges . . . . . . . . . . . . . . . . . . . . . . . 0.0 9.7 (9.7) (100.0)
As a percentage of total revenues . . . . . . . . . . . . . . . . . . . . . . 0.0% 1.4% (140)bp (100.0)
Total costs and expenses . . . . . . . . . . . . . . . . . . . . . . . . . . . . . . . . . . . . $652.6 $602.3 $ 50.3 8.4%
57
Cost of product sales was $190.2 million, or 48.7% of product sales revenues, for fiscal 2013, compared to$205.2 million, or 47.9% of product sales revenues, for the prior-year period. Fiscal 2013 reflects: fixed overheadcosts not being fully absorbed by the lower number of new units sold, the impact of the lower-priced VLT andVGT units and Bluebird2 lite cabinets for select international markets, fewer high-margin conversion kit sales,the higher cost of the Blade cabinet compared to the Bluebird2 cabinet and the impact of the competitive industryenvironment on average selling price.
Cost of gaming operations was $57.4 million, or 18.7% of gaming operations revenues, for fiscal 2013,compared to $55.5 million, or 21.2% of gaming operations revenues for the prior-year period. Fiscal 2013primarily reflects: the significantly higher mix of interactive gaming products and services revenues which havea lower cost as a percentage of revenues; partially offset by unfavorable jackpot expense experience on wide-areaprogressive games.
Research and development expenses increased 21.2% to $114.5 million in fiscal 2013, compared to $94.5million in the prior-year period. The year-over-year increase reflects:
➣ Higher development costs for our planned expanded product development initiatives for the continuedcreation of intellectual property and the ongoing expansion of our product portfolio;
➣ Increase in spending for our interactive gaming products and services including the impact of the twoacquisitions in the June 2012 quarter; and
➣ Higher payroll and incentive compensation costs.
During fiscal 2013, we introduced 56 new games for sale and 27 new participation and casino-owned dailyfee games, compared to the introduction in fiscal 2012 of 70 new games for sale and 25 new participation andcasino-owned daily fee games.
We expect that research and development expenses will increase, however, we expect such expenses todecrease as a percentage of revenues to between 15% and 16% in fiscal 2014 and 2015 even as we increase ourspending to grow our interactive gaming products and services and accelerate our emphasis on innovative newproducts and creation of intellectual property. We will continue to spend research and development dollars onprojects to ensure we stay at the forefront of innovation and creativity in our industry.
Selling and administrative expenses increased 16.6%, or $24.1 million, to $169.3 million in fiscal 2013,compared to $145.2 million in the prior-year period while increasing by 330-basis points as a percentage ofrevenues to 24.3%. The year-over-year increase reflects:
➣ Increased spend in our marketing costs to expand the player base for interactive gaming products andservices;
➣ Incremental costs to support the growth for our networked gaming and interactive gaming products andservices including the impact of the two acquisitions in the June 2012 quarter;
➣ Incremental expenses related to our implementation of an upgraded enterprise-wide ERP system;
➣ Increased pre-tax charges of $13.5 million related to the process our Board of Directors utilized in thesale of the Company, plus completing the closing conditions and the integration efforts prior to theeffective time of the pending Merger; and
➣ Higher payroll and incentive compensation costs.
Fiscal 2012 results include $9.7 million, or $0.12 per diluted share, of pre-tax impairment and restructuringcharges including $5.9 million of separation-related charges and $3.8 million of costs related to the decision toclose two facilities.
58
Depreciation and amortization expense increased by $29.0 million, or 31.5%, to $121.2 million in fiscal2013, compared to $92.2 million in the prior-year period. The increase in depreciation and amortization expensereflects increased capital spending on gaming operations equipment throughout fiscal 2013, 2012 and 2011, toupgrade our installed base of participation gaming machines to Bluebird2, Bluebird xD and Gamefield xDgaming machines, depreciation for a new facility that was placed in service in August 2012, amortization offinite-lived intangible assets from our two acquisitions in the June 2012 quarter and depreciation on the upgradedenterprise-wide ERP system which we placed in service in October 2012.
Operating Income
Our operating income decreased by $42.7 million, or 48.9%, in fiscal 2013 on a 1.1% increase in totalrevenues. Our operating margin of 6.4% represented a 630-basis point decrease over the 12.7% operating marginachieved in the prior-year. This decrease reflects:
➣ $29.0 million of higher depreciation and amortization expense;
➣ $24.1 million of higher selling and administrative costs;
➣ $20.0 million of higher research and development costs; partially offset by
➣ $20.7 million of additional profit after subtracting cost of product sales and cost of gaming operationsfrom product sales revenues and gaming operations revenues, respectively, all as discussed above, and
➣ $9.7 million of lower impairment and restructuring charges.
For fiscal 2014 and 2015, we expect to achieve modest improvements in our operating income as anticipatedimprovements in revenue will be mostly offset by increased spending for research and development, selling andadministrative and depreciation and amortization expenses.
Interest Expense
We incurred interest expense of $3.5 million, net of amounts capitalized for construction-in-progress, forfiscal 2013 compared to $1.6 million for the prior-year.
Interest Income and Other Income and Expense, Net
Interest income and other income and expense, net was income of $7.5 million and $13.3 million for fiscal2013 and 2012, respectively. In fiscal 2013, we recorded pre-tax realized and unrealized foreign currency lossesof $5.1 million, primarily related to the devaluation of the Argentina peso against the U.S. dollar. In fiscal 2012,we recorded pre-tax realized and unrealized foreign currency losses of $0.4 million related to the movement offoreign currencies against the U.S. dollar.
Income Taxes
The effective income tax rate was 29.0% and 35.3% in fiscal 2013 and fiscal 2012, respectively.
The fiscal 2013 effective tax rate reflects:
➣ The retroactive reinstatement of the U.S. Federal Research and Development tax credit of $2.6 millionof which approximately $1.8 million related to the period July 1, 2012 through June 30, 2013 and $0.8million related to the period January 1, 2012 through June 30, 2012;
➣ A U.S. tax benefit from certain foreign losses;
➣ A reduction in our liability for uncertain taxes by $2.2 million as the statute of limitations expired onour fiscal 2009 U.S. Federal income tax return and the completion of the 2010 Federal income tax audit;partially offset by
59
➣ A decrease in pre-tax income compared to fiscal 2012;
➣ A $1.3 million valuation allowance against certain foreign deferred tax assets relating to foreign netoperating losses; and
➣ A non-U.S. tax charge and other tax charges of $2.7 million in fiscal 2013.
The fiscal 2012 effective income tax rate reflects:
➣ The expiration of the U.S. Federal research and development tax credit as of December 31, 2011; and
➣ Increased impact of foreign subsidiary startup losses without benefit and permanent tax items in fiscal2012; partially offset by
➣ A reduction in our liability for uncertain taxes as the statute of limitations expired on our fiscal 2008U.S. Federal income tax return plus other discrete tax items; and
➣ A decrease in pre-tax income compared to fiscal 2011.
At June 30, 2013, no deferred income tax provision had been recorded for United States Federal taxesrelated to approximately $45.8 million of undistributed net earnings of certain foreign subsidiaries, which areconsidered to be permanently reinvested. Determination of the deferred income tax liability on these unremittedearnings is not practicable because such liability, if any, depends on the circumstances existing if and when theremittance occurs. We have approximately $22.5 million of cash and cash equivalents in our internationalsubsidiaries at June 30, 2013, and we believe we could readily convert such cash to other currencies includingUnited States Dollars, although based on current banking and governmental regulations we cannot repatriate allof this cash, including approximately $5.4 million of cash and cash equivalents in Argentina.
We believe the impact of not being able to fully repatriate this cash and cash equivalents on the overallliquidity of the Company is immaterial, as at June 30, 2013, we had $59.9 million of unrestricted cash and cashequivalents (which includes the $22.5 million of foreign-based cash) and our annual cash flow from operations was$153.4 million in fiscal 2013. In addition, we have access to our $400 million amended and restated revolving creditfacility that expires in October 2016 of which only $85.0 million was borrowed at June 30, 2013, and, if necessary,could access additional debt or equity offerings. After consideration of $1.0 million outstanding letters of credit,there was approximately $314.0 million of available borrowings under the revolving credit facility at June 30, 2013.
Earnings Per Share
The decrease in earnings per share in fiscal 2013 is attributable to the decrease in net income for fiscal 2013,largely related to higher research and development, selling and administrative and depreciation and amortizationexpenses including the $0.16 per diluted share, of charges related to the process our Board of Directors utilized inthe sale of the Company, plus completing the closing conditions and the integration efforts prior to the effectivetime of the pending Merger; partially offset by a lower effective income tax rate due to discrete tax items of$0.01 per diluted share. In addition, in fiscal 2013, we recorded pre-tax realized and unrealized foreign currencylosses of $5.1 million, primarily related to the devaluation of the Argentina peso against the U.S. dollar. In fiscal2012, we recorded pre-tax realized and unrealized foreign currency losses of $0.4 million related to themovement of foreign currencies against the U.S. dollar. Diluted earnings per share decreased 45.2% to $0.63 forfiscal 2013, from $1.15 for prior-year period. The share repurchases over the last twelve months did notmaterially impact fiscal 2013 earnings per share.
60
Fiscal 2012 Compared to Fiscal 2011
Total revenues for fiscal 2012 decreased 11.9%, or $93.6 million, over fiscal 2011, reflecting:
➣ A $69.6 million, or 17.3%, decrease in new unit sales revenue as a result of:
➣ A 3,313 unit, or 13.7%, decrease in new units sold as:
➣ New units sold in the United States and Canada totaled 14,559 units, a decrease of 2.1%, due toa decline in our share amongst competitors of new units shipped, lower replacement marketshipments resulting from the slow economy and our customers’ lower capital budgets incalendar 2011 with only a modest increase in capital budgets in calendar 2012, partially offsetby an increase in shipments to new casino openings and expansions;
➣ International new units sold decreased 32.1% from the prior-year to 6,344 units from 9,340 unitsin fiscal 2011 and represented 30.3% of global shipments down from 38.6% in the prior-periodprimarily reflecting continued low demand in Europe, decreased industry demand in Mexicobecause of government enforcement actions that began in August 2011 against certain casinos,and lower demand in New South Wales, Australia as operators await implementation of newnational gaming standards. Both Mexico and New South Wales, Australia were new markets wefirst entered directly in fiscal 2010; and
➣ Sales of mechanical reel products totaled 2,537 units, or approximately 12.1% of total new unitssold compared to 20.7% of units sold in the prior-year.
➣ A 4.2% decrease in the average selling price of new gaming machines to $15,959, principallyreflecting the effect of higher discounts on larger-volume orders, a lower number of premium gamescompared with the prior year, a higher number of lower-priced VLT unit sales compared to the prioryear and the competitive marketplace.
➣ An $8.7 million, or 10.1%, increase in other product sales revenues, reflecting an increase in gameconversion revenues and parts sales revenues partially offset by a decrease in used gaming machinesrevenues and other product sales revenues as:
➣ We earned revenue on approximately 19,900 conversion kits in fiscal 2012, compared toapproximately 8,200 conversion kits in the prior-year period due to the higher earnings performanceof our new games; and
➣ We sold nearly 8,000 used gaming machines during fiscal 2012, compared to nearly 9,300 usedgaming machines in the prior-year. The average sales price of used gaming machines decreased infiscal 2012 principally reflecting a lower market value of our used product.
➣ Participation revenues were lower by $43.5 million, or 15.7%, due primarily to:
➣ The average installed base of participation gaming machines in fiscal 2012 decreased to 9,335 unitsin fiscal 2012, down 711 units, or 7.1%, from an average of 10,046 units in fiscal 2011. Thepercentage of coin-in units in the installed base at June 31, 2012, was 38.5% compared to 38.3% atJune 30, 2011, although the actual number of such units decreased between years. The decrease inaverage installed base for the year was driven by the decline in performance of our installed base ofgaming machines as certain older game series reached their end of life and we did not have newgame themes approved to replace those older games, which eased in the second half of fiscal 2012.The percentage of net win units decreased by 213 units, or 6.9%, and the daily lease rate units in theinstalled base as of June 30, 2012 increased slightly by 3 units, or 0.1%; and
➣ Overall average revenue per day decreased by $7.24, or 9.6%, principally reflecting lower averagerevenue per day in our percentage of coin-in gaming machines due to lower performance of ourgames.
61
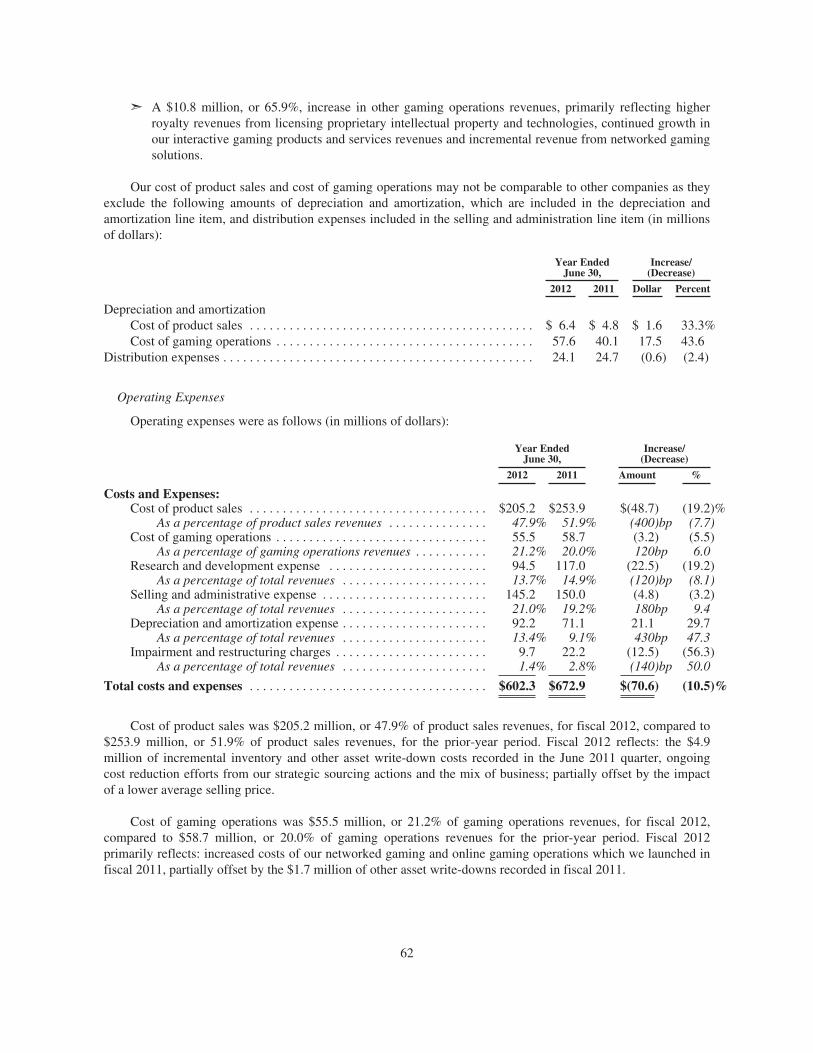
➣ A $10.8 million, or 65.9%, increase in other gaming operations revenues, primarily reflecting higherroyalty revenues from licensing proprietary intellectual property and technologies, continued growth inour interactive gaming products and services revenues and incremental revenue from networked gamingsolutions.
Our cost of product sales and cost of gaming operations may not be comparable to other companies as theyexclude the following amounts of depreciation and amortization, which are included in the depreciation andamortization line item, and distribution expenses included in the selling and administration line item (in millionsof dollars):
Year EndedJune 30,
Increase/(Decrease)
2012 2011 Dollar Percent
Depreciation and amortizationCost of product sales . . . . . . . . . . . . . . . . . . . . . . . . . . . . . . . . . . . . . . . . . . . $ 6.4 $ 4.8 $ 1.6 33.3%Cost of gaming operations . . . . . . . . . . . . . . . . . . . . . . . . . . . . . . . . . . . . . . . 57.6 40.1 17.5 43.6
Distribution expenses . . . . . . . . . . . . . . . . . . . . . . . . . . . . . . . . . . . . . . . . . . . . . . . 24.1 24.7 (0.6) (2.4)
Operating Expenses
Operating expenses were as follows (in millions of dollars):
Year EndedJune 30,
Increase/(Decrease)
2012 2011 Amount %
Costs and Expenses:Cost of product sales . . . . . . . . . . . . . . . . . . . . . . . . . . . . . . . . . . . . $205.2 $253.9 $(48.7) (19.2)%
As a percentage of product sales revenues . . . . . . . . . . . . . . . 47.9% 51.9% (400)bp (7.7)Cost of gaming operations . . . . . . . . . . . . . . . . . . . . . . . . . . . . . . . . 55.5 58.7 (3.2) (5.5)
As a percentage of gaming operations revenues . . . . . . . . . . . 21.2% 20.0% 120bp 6.0Research and development expense . . . . . . . . . . . . . . . . . . . . . . . . 94.5 117.0 (22.5) (19.2)
As a percentage of total revenues . . . . . . . . . . . . . . . . . . . . . . 13.7% 14.9% (120)bp (8.1)Selling and administrative expense . . . . . . . . . . . . . . . . . . . . . . . . . 145.2 150.0 (4.8) (3.2)
As a percentage of total revenues . . . . . . . . . . . . . . . . . . . . . . 21.0% 19.2% 180bp 9.4Depreciation and amortization expense . . . . . . . . . . . . . . . . . . . . . . 92.2 71.1 21.1 29.7
As a percentage of total revenues . . . . . . . . . . . . . . . . . . . . . . 13.4% 9.1% 430bp 47.3Impairment and restructuring charges . . . . . . . . . . . . . . . . . . . . . . . 9.7 22.2 (12.5) (56.3)
As a percentage of total revenues . . . . . . . . . . . . . . . . . . . . . . 1.4% 2.8% (140)bp 50.0
Total costs and expenses . . . . . . . . . . . . . . . . . . . . . . . . . . . . . . . . . . . . $602.3 $672.9 $(70.6) (10.5)%
Cost of product sales was $205.2 million, or 47.9% of product sales revenues, for fiscal 2012, compared to$253.9 million, or 51.9% of product sales revenues, for the prior-year period. Fiscal 2012 reflects: the $4.9million of incremental inventory and other asset write-down costs recorded in the June 2011 quarter, ongoingcost reduction efforts from our strategic sourcing actions and the mix of business; partially offset by the impactof a lower average selling price.
Cost of gaming operations was $55.5 million, or 21.2% of gaming operations revenues, for fiscal 2012,compared to $58.7 million, or 20.0% of gaming operations revenues for the prior-year period. Fiscal 2012primarily reflects: increased costs of our networked gaming and online gaming operations which we launched infiscal 2011, partially offset by the $1.7 million of other asset write-downs recorded in fiscal 2011.
62
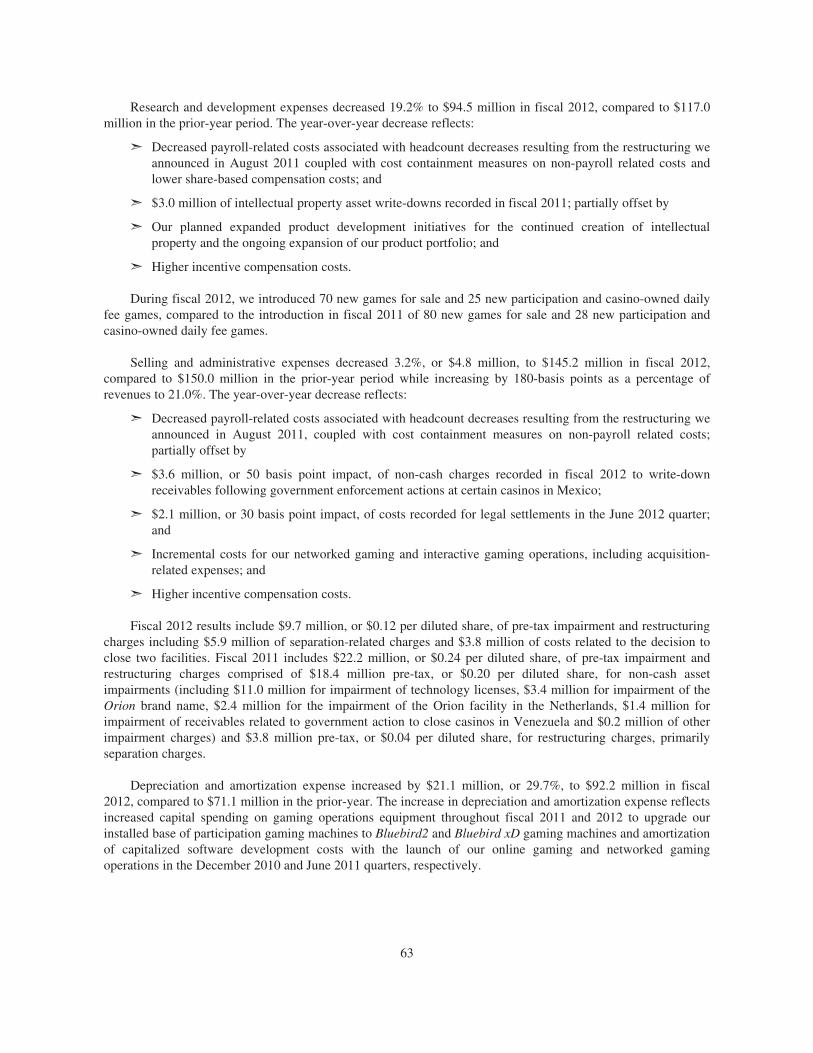
Research and development expenses decreased 19.2% to $94.5 million in fiscal 2012, compared to $117.0million in the prior-year period. The year-over-year decrease reflects:
➣ Decreased payroll-related costs associated with headcount decreases resulting from the restructuring weannounced in August 2011 coupled with cost containment measures on non-payroll related costs andlower share-based compensation costs; and
➣ $3.0 million of intellectual property asset write-downs recorded in fiscal 2011; partially offset by
➣ Our planned expanded product development initiatives for the continued creation of intellectualproperty and the ongoing expansion of our product portfolio; and
➣ Higher incentive compensation costs.
During fiscal 2012, we introduced 70 new games for sale and 25 new participation and casino-owned dailyfee games, compared to the introduction in fiscal 2011 of 80 new games for sale and 28 new participation andcasino-owned daily fee games.
Selling and administrative expenses decreased 3.2%, or $4.8 million, to $145.2 million in fiscal 2012,compared to $150.0 million in the prior-year period while increasing by 180-basis points as a percentage ofrevenues to 21.0%. The year-over-year decrease reflects:
➣ Decreased payroll-related costs associated with headcount decreases resulting from the restructuring weannounced in August 2011, coupled with cost containment measures on non-payroll related costs;partially offset by
➣ $3.6 million, or 50 basis point impact, of non-cash charges recorded in fiscal 2012 to write-downreceivables following government enforcement actions at certain casinos in Mexico;
➣ $2.1 million, or 30 basis point impact, of costs recorded for legal settlements in the June 2012 quarter;and
➣ Incremental costs for our networked gaming and interactive gaming operations, including acquisition-related expenses; and
➣ Higher incentive compensation costs.
Fiscal 2012 results include $9.7 million, or $0.12 per diluted share, of pre-tax impairment and restructuringcharges including $5.9 million of separation-related charges and $3.8 million of costs related to the decision toclose two facilities. Fiscal 2011 includes $22.2 million, or $0.24 per diluted share, of pre-tax impairment andrestructuring charges comprised of $18.4 million pre-tax, or $0.20 per diluted share, for non-cash assetimpairments (including $11.0 million for impairment of technology licenses, $3.4 million for impairment of theOrion brand name, $2.4 million for the impairment of the Orion facility in the Netherlands, $1.4 million forimpairment of receivables related to government action to close casinos in Venezuela and $0.2 million of otherimpairment charges) and $3.8 million pre-tax, or $0.04 per diluted share, for restructuring charges, primarilyseparation charges.
Depreciation and amortization expense increased by $21.1 million, or 29.7%, to $92.2 million in fiscal2012, compared to $71.1 million in the prior-year. The increase in depreciation and amortization expense reflectsincreased capital spending on gaming operations equipment throughout fiscal 2011 and 2012 to upgrade ourinstalled base of participation gaming machines to Bluebird2 and Bluebird xD gaming machines and amortizationof capitalized software development costs with the launch of our online gaming and networked gamingoperations in the December 2010 and June 2011 quarters, respectively.
63
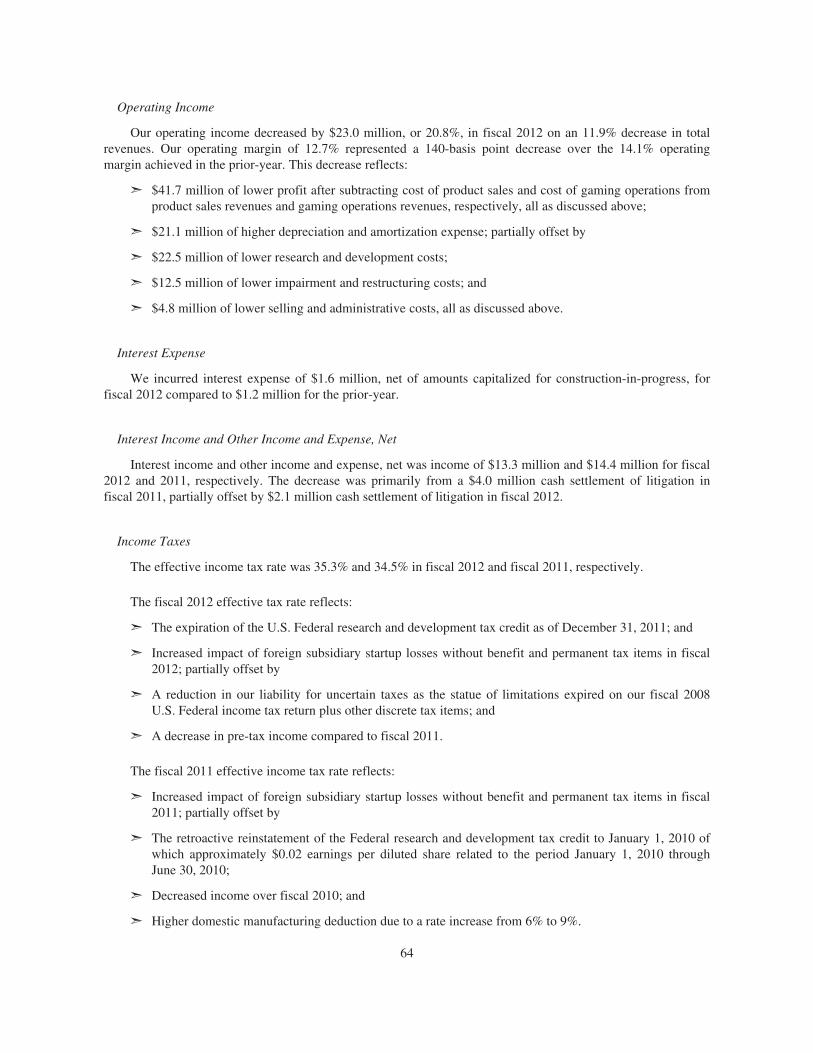
Operating Income
Our operating income decreased by $23.0 million, or 20.8%, in fiscal 2012 on an 11.9% decrease in totalrevenues. Our operating margin of 12.7% represented a 140-basis point decrease over the 14.1% operatingmargin achieved in the prior-year. This decrease reflects:
➣ $41.7 million of lower profit after subtracting cost of product sales and cost of gaming operations fromproduct sales revenues and gaming operations revenues, respectively, all as discussed above;
➣ $21.1 million of higher depreciation and amortization expense; partially offset by
➣ $22.5 million of lower research and development costs;
➣ $12.5 million of lower impairment and restructuring costs; and
➣ $4.8 million of lower selling and administrative costs, all as discussed above.
Interest Expense
We incurred interest expense of $1.6 million, net of amounts capitalized for construction-in-progress, forfiscal 2012 compared to $1.2 million for the prior-year.
Interest Income and Other Income and Expense, Net
Interest income and other income and expense, net was income of $13.3 million and $14.4 million for fiscal2012 and 2011, respectively. The decrease was primarily from a $4.0 million cash settlement of litigation infiscal 2011, partially offset by $2.1 million cash settlement of litigation in fiscal 2012.
Income Taxes
The effective income tax rate was 35.3% and 34.5% in fiscal 2012 and fiscal 2011, respectively.
The fiscal 2012 effective tax rate reflects:
➣ The expiration of the U.S. Federal research and development tax credit as of December 31, 2011; and
➣ Increased impact of foreign subsidiary startup losses without benefit and permanent tax items in fiscal2012; partially offset by
➣ A reduction in our liability for uncertain taxes as the statue of limitations expired on our fiscal 2008U.S. Federal income tax return plus other discrete tax items; and
➣ A decrease in pre-tax income compared to fiscal 2011.
The fiscal 2011 effective income tax rate reflects:
➣ Increased impact of foreign subsidiary startup losses without benefit and permanent tax items in fiscal2011; partially offset by
➣ The retroactive reinstatement of the Federal research and development tax credit to January 1, 2010 ofwhich approximately $0.02 earnings per diluted share related to the period January 1, 2010 throughJune 30, 2010;
➣ Decreased income over fiscal 2010; and
➣ Higher domestic manufacturing deduction due to a rate increase from 6% to 9%.
64
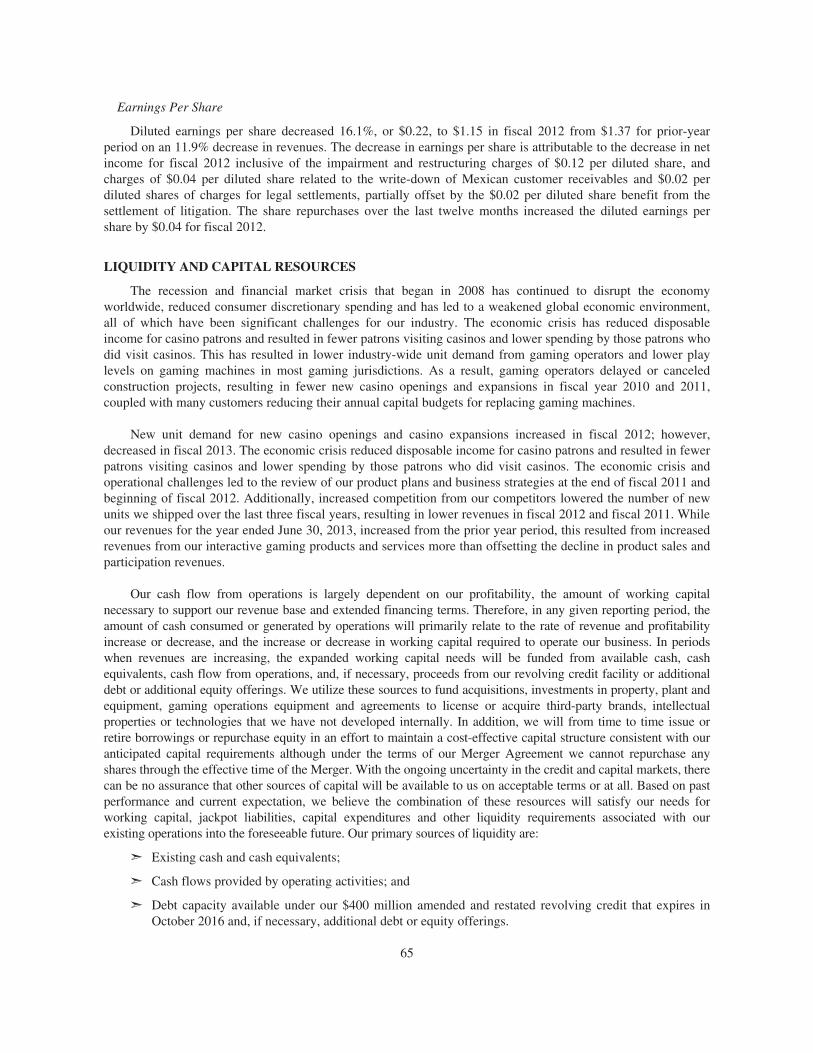
Earnings Per Share
Diluted earnings per share decreased 16.1%, or $0.22, to $1.15 in fiscal 2012 from $1.37 for prior-yearperiod on an 11.9% decrease in revenues. The decrease in earnings per share is attributable to the decrease in netincome for fiscal 2012 inclusive of the impairment and restructuring charges of $0.12 per diluted share, andcharges of $0.04 per diluted share related to the write-down of Mexican customer receivables and $0.02 perdiluted shares of charges for legal settlements, partially offset by the $0.02 per diluted share benefit from thesettlement of litigation. The share repurchases over the last twelve months increased the diluted earnings pershare by $0.04 for fiscal 2012.
LIQUIDITY AND CAPITAL RESOURCES
The recession and financial market crisis that began in 2008 has continued to disrupt the economyworldwide, reduced consumer discretionary spending and has led to a weakened global economic environment,all of which have been significant challenges for our industry. The economic crisis has reduced disposableincome for casino patrons and resulted in fewer patrons visiting casinos and lower spending by those patrons whodid visit casinos. This has resulted in lower industry-wide unit demand from gaming operators and lower playlevels on gaming machines in most gaming jurisdictions. As a result, gaming operators delayed or canceledconstruction projects, resulting in fewer new casino openings and expansions in fiscal year 2010 and 2011,coupled with many customers reducing their annual capital budgets for replacing gaming machines.
New unit demand for new casino openings and casino expansions increased in fiscal 2012; however,decreased in fiscal 2013. The economic crisis reduced disposable income for casino patrons and resulted in fewerpatrons visiting casinos and lower spending by those patrons who did visit casinos. The economic crisis andoperational challenges led to the review of our product plans and business strategies at the end of fiscal 2011 andbeginning of fiscal 2012. Additionally, increased competition from our competitors lowered the number of newunits we shipped over the last three fiscal years, resulting in lower revenues in fiscal 2012 and fiscal 2011. Whileour revenues for the year ended June 30, 2013, increased from the prior year period, this resulted from increasedrevenues from our interactive gaming products and services more than offsetting the decline in product sales andparticipation revenues.
Our cash flow from operations is largely dependent on our profitability, the amount of working capitalnecessary to support our revenue base and extended financing terms. Therefore, in any given reporting period, theamount of cash consumed or generated by operations will primarily relate to the rate of revenue and profitabilityincrease or decrease, and the increase or decrease in working capital required to operate our business. In periodswhen revenues are increasing, the expanded working capital needs will be funded from available cash, cashequivalents, cash flow from operations, and, if necessary, proceeds from our revolving credit facility or additionaldebt or additional equity offerings. We utilize these sources to fund acquisitions, investments in property, plant andequipment, gaming operations equipment and agreements to license or acquire third-party brands, intellectualproperties or technologies that we have not developed internally. In addition, we will from time to time issue orretire borrowings or repurchase equity in an effort to maintain a cost-effective capital structure consistent with ouranticipated capital requirements although under the terms of our Merger Agreement we cannot repurchase anyshares through the effective time of the Merger. With the ongoing uncertainty in the credit and capital markets, therecan be no assurance that other sources of capital will be available to us on acceptable terms or at all. Based on pastperformance and current expectation, we believe the combination of these resources will satisfy our needs forworking capital, jackpot liabilities, capital expenditures and other liquidity requirements associated with ourexisting operations into the foreseeable future. Our primary sources of liquidity are:
➣ Existing cash and cash equivalents;
➣ Cash flows provided by operating activities; and
➣ Debt capacity available under our $400 million amended and restated revolving credit that expires inOctober 2016 and, if necessary, additional debt or equity offerings.
65
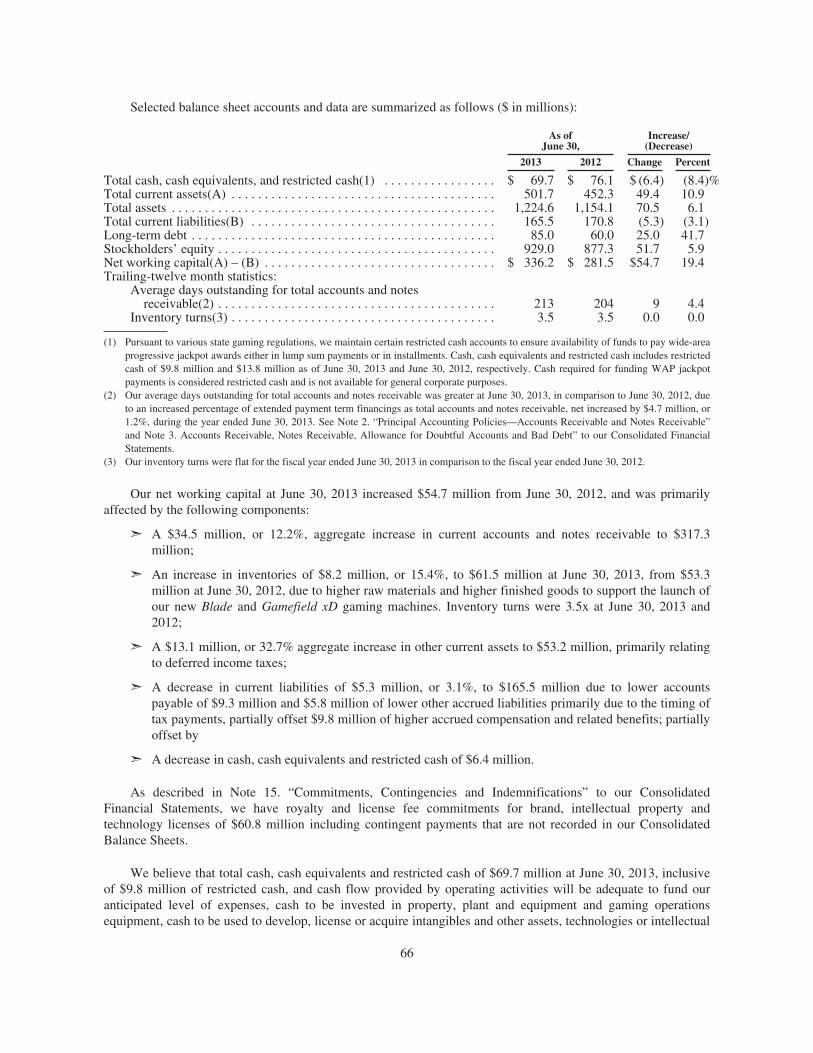
Selected balance sheet accounts and data are summarized as follows ($ in millions):
As ofJune 30,
Increase/(Decrease)
2013 2012 Change Percent
Total cash, cash equivalents, and restricted cash(1) . . . . . . . . . . . . . . . . . $ 69.7 $ 76.1 $ (6.4) (8.4)%Total current assets(A) . . . . . . . . . . . . . . . . . . . . . . . . . . . . . . . . . . . . . . . . 501.7 452.3 49.4 10.9Total assets . . . . . . . . . . . . . . . . . . . . . . . . . . . . . . . . . . . . . . . . . . . . . . . . . 1,224.6 1,154.1 70.5 6.1Total current liabilities(B) . . . . . . . . . . . . . . . . . . . . . . . . . . . . . . . . . . . . . 165.5 170.8 (5.3) (3.1)Long-term debt . . . . . . . . . . . . . . . . . . . . . . . . . . . . . . . . . . . . . . . . . . . . . . 85.0 60.0 25.0 41.7Stockholders’ equity . . . . . . . . . . . . . . . . . . . . . . . . . . . . . . . . . . . . . . . . . . 929.0 877.3 51.7 5.9Net working capital(A) – (B) . . . . . . . . . . . . . . . . . . . . . . . . . . . . . . . . . . . $ 336.2 $ 281.5 $54.7 19.4Trailing-twelve month statistics:
Average days outstanding for total accounts and notesreceivable(2) . . . . . . . . . . . . . . . . . . . . . . . . . . . . . . . . . . . . . . . . . . 213 204 9 4.4
Inventory turns(3) . . . . . . . . . . . . . . . . . . . . . . . . . . . . . . . . . . . . . . . . 3.5 3.5 0.0 0.0
(1) Pursuant to various state gaming regulations, we maintain certain restricted cash accounts to ensure availability of funds to pay wide-areaprogressive jackpot awards either in lump sum payments or in installments. Cash, cash equivalents and restricted cash includes restrictedcash of $9.8 million and $13.8 million as of June 30, 2013 and June 30, 2012, respectively. Cash required for funding WAP jackpotpayments is considered restricted cash and is not available for general corporate purposes.
(2) Our average days outstanding for total accounts and notes receivable was greater at June 30, 2013, in comparison to June 30, 2012, dueto an increased percentage of extended payment term financings as total accounts and notes receivable, net increased by $4.7 million, or1.2%, during the year ended June 30, 2013. See Note 2. “Principal Accounting Policies—Accounts Receivable and Notes Receivable”and Note 3. Accounts Receivable, Notes Receivable, Allowance for Doubtful Accounts and Bad Debt” to our Consolidated FinancialStatements.
(3) Our inventory turns were flat for the fiscal year ended June 30, 2013 in comparison to the fiscal year ended June 30, 2012.
Our net working capital at June 30, 2013 increased $54.7 million from June 30, 2012, and was primarilyaffected by the following components:
➣ A $34.5 million, or 12.2%, aggregate increase in current accounts and notes receivable to $317.3million;
➣ An increase in inventories of $8.2 million, or 15.4%, to $61.5 million at June 30, 2013, from $53.3million at June 30, 2012, due to higher raw materials and higher finished goods to support the launch ofour new Blade and Gamefield xD gaming machines. Inventory turns were 3.5x at June 30, 2013 and2012;
➣ A $13.1 million, or 32.7% aggregate increase in other current assets to $53.2 million, primarily relatingto deferred income taxes;
➣ A decrease in current liabilities of $5.3 million, or 3.1%, to $165.5 million due to lower accountspayable of $9.3 million and $5.8 million of lower other accrued liabilities primarily due to the timing oftax payments, partially offset $9.8 million of higher accrued compensation and related benefits; partiallyoffset by
➣ A decrease in cash, cash equivalents and restricted cash of $6.4 million.
As described in Note 15. “Commitments, Contingencies and Indemnifications” to our ConsolidatedFinancial Statements, we have royalty and license fee commitments for brand, intellectual property andtechnology licenses of $60.8 million including contingent payments that are not recorded in our ConsolidatedBalance Sheets.
We believe that total cash, cash equivalents and restricted cash of $69.7 million at June 30, 2013, inclusiveof $9.8 million of restricted cash, and cash flow provided by operating activities will be adequate to fund ouranticipated level of expenses, cash to be invested in property, plant and equipment and gaming operationsequipment, cash to be used to develop, license or acquire intangibles and other assets, technologies or intellectual
66
properties from third parties, the levels of inventories and receivables required in the operation of our businessand any repurchases of common stock for the upcoming fiscal year although under the terms of our MergerAgreement we cannot repurchase any shares. Foreign subsidiary operations held 37.6% of our unrestricted cashand cash equivalents at June 30, 2013 and 41.3% at June 30, 2012. At June 30, 2013, we held approximately28.9 million pesos, or $5.4 million, of cash and cash equivalents in Argentina compared to approximately58.8 million pesos, or $12.8 million, at June 30, 2012. Currently, the Argentine government is imposingrestrictions on currency movements that might make it costly or impossible to immediately convert the pesos intoU.S dollars and have those dollars transferred outside of Argentina. This creates a foreign currency risk in case ofdevaluation. We believe that we take a prudent and conservative approach to maintaining our available liquiditywhile credit market and economic conditions remain uncertain. We continue to focus on reinvesting in ourbusiness through our installed base of gaming operations machines, as well as other strategic capital deploymentobjectives to expand our geographic reach, product lines and customer base. For fiscal 2014 and 2015, we expectcash flow provided by operating activities to continue to be strong. We do not believe we will need to raise asignificant amount of additional capital in the short-term or long-term, and as a result of amending and restatingour revolving credit agreement in October 2011, we have access to our $400 million revolving credit facilitythrough October 2016. We will, however, assess market opportunities as they arise.
Total Accounts and Notes Receivable and Bad Debt Reserves
See Note 2. “Principal Accounting Policies—Accounts Receivable and Notes Receivable” and Note 3.“Accounts Receivable, Notes Receivable, Allowance for Doubtful Accounts and Bad Debt” to our ConsolidatedFinancial Statements.
Excess and Obsolete Inventories
Our inventory write-downs primarily arise from excess quantities of raw material inventories purchased forproduction of gaming machines and from raw material parts becoming obsolete when replaced by a new part andwe are unable to fully realize the value of the old part. When we discontinue support of a gaming machine style,make significant changes to an existing gaming machine design or transition to a new gaming machine style, wemay experience higher levels of inventory write-downs. We use historical usage and forecasted demand planningin both purchasing and production processes and conduct quarterly reviews for excess and obsolete inventories.Any inventory write-downs are recorded in the period they are identified to reflect any anticipated inventorylosses arising from inventory values in excess of cost or market.
As we introduce new gaming machines that utilize new raw material parts, we reduce the quantity of rawmaterial purchases for existing gaming machines based upon anticipated customer demand and expected end oflife production and support of the global installed base of the existing gaming machines. Favorable customeracceptance in excess of estimated customer demand for the new gaming machines can result in excess quantitiesof raw materials being on-hand for the existing gaming machines. In the December 2008 quarter, we introducedthe Bluebird2 gaming machine and the demand for this gaming machine exceeded our expectations, resulting infewer Bluebird gaming machines being sold. In the March 2012 quarter, we introduced the new Bluebird2eproduct and in the September 2012 quarter we introduced the Bluebird2 lite cabinet; however, these productswere an enhancement of the Bluebird2 product line using substantially all of the same parts. In March 2013, weintroduced our new Blade cabinet, which continues to utilize certain elements of the internal componentry in theBluebird2 and Bluebird2e cabinets. We seek to reduce excess raw materials through several strategies such as:(1) reselling them back to the supplier, (2) using them to maintain our installed base of leased gaming operationsmachines, (3) selling them to customers to support their existing gaming machines which are recorded as partsales, (4) using them to refurbish used gaming machines, (5) selling them to a third party or (6) scrapping them.
We have a defined process to control changes in the design of our gaming machines to reduce the possibilitythat we cannot utilize existing parts before new parts are implemented and therefore reduce the impact ofobsolete inventories. We use the same six strategies noted above to reduce the impact of inventory write-downs
67
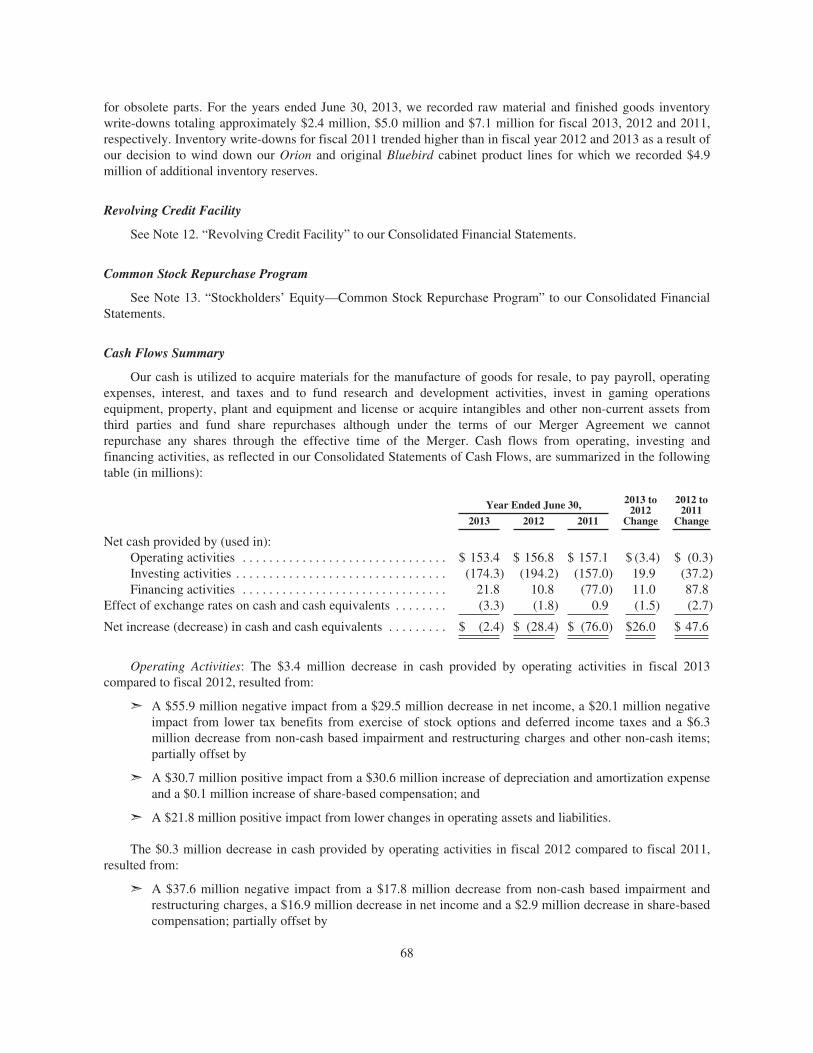
for obsolete parts. For the years ended June 30, 2013, we recorded raw material and finished goods inventorywrite-downs totaling approximately $2.4 million, $5.0 million and $7.1 million for fiscal 2013, 2012 and 2011,respectively. Inventory write-downs for fiscal 2011 trended higher than in fiscal year 2012 and 2013 as a result ofour decision to wind down our Orion and original Bluebird cabinet product lines for which we recorded $4.9million of additional inventory reserves.
Revolving Credit Facility
See Note 12. “Revolving Credit Facility” to our Consolidated Financial Statements.
Common Stock Repurchase Program
See Note 13. “Stockholders’ Equity—Common Stock Repurchase Program” to our Consolidated FinancialStatements.
Cash Flows Summary
Our cash is utilized to acquire materials for the manufacture of goods for resale, to pay payroll, operatingexpenses, interest, and taxes and to fund research and development activities, invest in gaming operationsequipment, property, plant and equipment and license or acquire intangibles and other non-current assets fromthird parties and fund share repurchases although under the terms of our Merger Agreement we cannotrepurchase any shares through the effective time of the Merger. Cash flows from operating, investing andfinancing activities, as reflected in our Consolidated Statements of Cash Flows, are summarized in the followingtable (in millions):
Year Ended June 30, 2013 to2012
Change
2012 to2011
Change2013 2012 2011
Net cash provided by (used in):Operating activities . . . . . . . . . . . . . . . . . . . . . . . . . . . . . . . $ 153.4 $ 156.8 $ 157.1 $ (3.4) $ (0.3)Investing activities . . . . . . . . . . . . . . . . . . . . . . . . . . . . . . . . (174.3) (194.2) (157.0) 19.9 (37.2)Financing activities . . . . . . . . . . . . . . . . . . . . . . . . . . . . . . . 21.8 10.8 (77.0) 11.0 87.8
Effect of exchange rates on cash and cash equivalents . . . . . . . . (3.3) (1.8) 0.9 (1.5) (2.7)
Net increase (decrease) in cash and cash equivalents . . . . . . . . . $ (2.4) $ (28.4) $ (76.0) $26.0 $ 47.6
Operating Activities: The $3.4 million decrease in cash provided by operating activities in fiscal 2013compared to fiscal 2012, resulted from:
➣ A $55.9 million negative impact from a $29.5 million decrease in net income, a $20.1 million negativeimpact from lower tax benefits from exercise of stock options and deferred income taxes and a $6.3million decrease from non-cash based impairment and restructuring charges and other non-cash items;partially offset by
➣ A $30.7 million positive impact from a $30.6 million increase of depreciation and amortization expenseand a $0.1 million increase of share-based compensation; and
➣ A $21.8 million positive impact from lower changes in operating assets and liabilities.
The $0.3 million decrease in cash provided by operating activities in fiscal 2012 compared to fiscal 2011,resulted from:
➣ A $37.6 million negative impact from a $17.8 million decrease from non-cash based impairment andrestructuring charges, a $16.9 million decrease in net income and a $2.9 million decrease in share-basedcompensation; partially offset by
68
➣ A $36.4 million positive impact from a $22.0 million positive impact from lower tax benefits fromexercise of stock options and deferred income taxes, a $14.1 million increase of depreciation andamortization expense and a $0.3 million increase of other non-cash items; and
➣ A $0.9 million positive impact from lower changes in operating assets and liabilities.
Investing Activities: The $19.9 million decrease in cash used in investing activities for fiscal 2013,compared to fiscal 2012, was primarily due to:
➣ A $16.4 million decrease in the amount invested in acquisitions of businesses due to the acquisitions ofJadestone and Phantom during fiscal 2012 and no acquisitions in fiscal 2013; and
➣ A $16.0 million decrease in the amount invested in property, plant and equipment during fiscal 2013 to$65.4 million, as we completed two large projects in early fiscal 2013. We expect that capitalexpenditures for property, plant and equipment will decrease modestly in fiscal 2014; partially offset by
➣ A $7.6 million increase in the amount invested in gaming operations machines, top-boxes and relatedequipment during fiscal 2013, to $90.6 million as we continued to update our installed base ofparticipation gaming machines to Bluebird2, Bluebird xD and Gamefield xD gaming machines. In fiscal2014, we expect the amount of capital spend on updating our participation installed base will decrease,which will be partially offset by increased capital for operating leases related to the placement of VGTsin Illinois; and
➣ A $4.9 million increase in payments to develop, license or acquire long-term intangible and other non-current assets as we invested $18.3 million in fiscal 2013.
The $37.2 million increase in cash used in investing activities for fiscal 2012, compared to fiscal 2011, wasprimarily due to:
➣ A $17.1 million increase in the amount invested in gaming operations machines, top-boxes and relatedequipment during fiscal 2012, to $83.0 million as we continued to update our installed base ofparticipation gaming machines to Bluebird2 and Bluebird xD gaming machines.
➣ A $16.4 million increase in the amount invested in acquisitions of businesses due to the acquisitions ofJadestone and Phantom during fiscal 2012; and
➣ A $15.2 million increase in the amount invested in property, plant and equipment during fiscal 2012 to$81.4 million, as we continue to invest in facility expansion, higher spending on informationtechnology, as well as investments in manufacturing tools and capitalized software development costs;partially offset by
➣ An $11.5 million decrease in payments to develop, license or acquire long-term intangible and othernon-current assets as we invested $13.4 million in fiscal 2012.
Financing Activities: The $11.0 million increase in cash provided by financing activities for fiscal 2013,compared to fiscal 2012, was primarily due to:
➣ Lower treasury stock purchases by $45.4 million in fiscal 2013, as only $5.0 million of treasury stockwas repurchased compared to $50.4 million in fiscal 2012;
➣ A $4.0 million increase in cash received and tax benefits realized from exercised stock options andemployee stock purchase plan. The amount we receive from the exercise of stock options is dependenton individuals’ choices to exercise options, which are dependent on the spread of the market price of ourstock above the exercise price of vested options; and
➣ A $2.4 million increase in cash as in fiscal 2012 we paid debt issuance costs related to our amended andrestated credit facility with no comparable costs in 2013; partially offset by
69
➣ Lower net proceeds of $35.0 million from borrowings under our revolving credit agreement in fiscal2013; and
➣ Payment of additional consideration related to prior year’s acquisitions of $5.8 million.
The $87.8 million increase in cash provided by financing activities for fiscal 2012, compared to fiscal 2011,was primarily due to:
➣ Net proceeds of $60.0 million from borrowings under our revolving credit agreement in fiscal 2012;
➣ Lower treasury stock purchases by $51.1 million in fiscal 2012, as $50.4 million of treasury stock wasrepurchased compared to $101.5 million in fiscal 2011; partially offset by
➣ A $20.9 million decrease in cash received and tax benefits realized from exercised stock options andemployee stock purchase plan. The amount we receive from the exercise of stock options is dependenton individuals’ choices to exercise options, which are dependent on the spread of the market price of ourstock above the exercise price of vested options; and
➣ Payment of debt issuance costs of $2.4 million related to our amended and restated credit facility.
OFF-BALANCE SHEET ARRANGEMENTS AND CONTRACTUAL OBLIGATIONS
We are not dependent on off-balance sheet financing arrangements to fund our operations. We utilizefinancing arrangements for operating leases of equipment and facilities, none of which are in excess of ourcurrent needs; however in the year ended June 30, 2012, we provided $3.8 million of impairment andrestructuring charges to accrue the costs of abandoning leasehold improvements and lease costs over theremaining contractual lease life of two leased facilities.
We also have minimum guaranteed royalty payments amounting to $60.8 million at June 30, 2013, forintellectual property and technologies that are not recorded on our accompanying Consolidated Balance Sheets.Typically, we are obligated to make minimum commitment royalty payments over the term of our licenses and toadvance payment against those commitments.
Our obligations under these arrangements and under other contractual obligations at June 30, 2013, were asfollows (in millions):
Contractual Obligations Total
Lessthan
1 Year1-3
Years3-5
Years
Morethan
5 Years
Operating leases . . . . . . . . . . . . . . . . . . . . . . . . . . . . . . . . . . . . . . . . . $ 24.0 $ 5.7 $ 8.7 $ 2.3 $ 7.3Royalty and license fee payments . . . . . . . . . . . . . . . . . . . . . . . . . . . . 60.8 20.0 32.5 8.2 0.1Accrued WAP jackpot liability . . . . . . . . . . . . . . . . . . . . . . . . . . . . . . 4.9 4.9 — — —Non-cancelable raw material purchase orders . . . . . . . . . . . . . . . . . . 13.8 13.8 — — —Performance bonds and other loan guarantees . . . . . . . . . . . . . . . . . . 10.7 10.7 — — —Additional consideration, including imputed interest, related to
acquisitions . . . . . . . . . . . . . . . . . . . . . . . . . . . . . . . . . . . . . . . . . . . 11.3 11.3 — — —Payment of revolving credit facility(a) . . . . . . . . . . . . . . . . . . . . . . . . 85.0 — — 85.0 —Interest on long-term debt(a) . . . . . . . . . . . . . . . . . . . . . . . . . . . . . . . . 5.9 1.8 3.6 0.5 —Other, including guaranteed minimums in employment
agreements . . . . . . . . . . . . . . . . . . . . . . . . . . . . . . . . . . . . . . . . . . . 27.3 9.8 12.5 5.0 —
Total . . . . . . . . . . . . . . . . . . . . . . . . . . . . . . . . . . . . . . . . . . . . . . . . . . $243.7 $78.0 $57.3 $101.0 $ 7.4
(a) Repayments of principal amounts of borrowings under the revolving credit facility on June 30, 2013, are assumed to occur at thematurity of our revolving credit agreement in October 2016, although under the terms of the Merger Agreement such debt will be paidoff at the effective time of the Merger. Interest on long-term debt assumes the amount of debt outstanding at June 30, 2013, remainsoutstanding through the end of term and interest is based on the effective interest rate at June 30, 2013, which was 2.1%.
70
As of June 30, 2013, we had a contingent liability relating to the fees owed to our financial advisor relatingto the Merger. Upon consummation of the transaction closing, we would have a liability of approximately $10.5million and should the transaction terminate before closing, we would have a liability of approximately $4.6million. In addition, under the Merger Agreement, WMS will be required to pay Scientific Games a terminationfee equal to $44.3 million if the Merger Agreement is terminated in certain circumstances. At the effective timeof the Merger, we would have a liability relating to the retention of employees of approximately $5.0 million andan additional $5.0 million due six months after closing of the Merger. The timing of the payout relating to theguaranteed minimums in employment agreements stated above would be accelerated at the effective time of theMerger.
The total potential royalty and license fee commitments decreased to $60.8 million at June 30, 2013, from$73.8 million at June 30, 2012, due to advances and payments made on existing commitments exceeding newagreements we entered into for brand, intellectual property and technology licenses. Potential royalty and licensefee commitments could increase in the future as we enter into new intellectual property, technology or brandlicensing agreements. See Note 15. “Commitments, Contingencies and Indemnifications” to our ConsolidatedFinancial Statements.
Non-cancelable raw material purchase orders increased to $13.8 million as of June 30, 2013, from$2.7 million as of June 30, 2012, primarily relating to an increase in materials to support the launch of the newBlade and Gamefield xD gaming machines.
We have performance bonds and other loan guarantees outstanding of $10.7 million at June 30, 2013,related to product sales, and for the performance bonds we are liable to the issuer in the event of exercise due toour non-performance under the contract. Events of non-performance do not include the financial performance ofour products.
As of June 30, 2013, we had a liability for unrecognized income tax benefits of $1.6 million. We cannotmake a reasonable estimate of the period of cash settlement for the liability for uncertain income taxes. See Note11. “Income Taxes” to our Consolidated Financial Statements.
Indemnifications, Special Purpose Entities and Derivative Instruments, Letters of Credit, WMS LicensorArrangements, Self-Insurance and Product Warranty
See Note 15. “Commitments, Contingencies and Indemnifications” to our Consolidated FinancialStatements.
ITEM 7A.QUANTITATIVE AND QUALITATIVE DISCLOSURES ABOUT MARKET RISK
We are subject to market risks in the ordinary course of our business, primarily associated with interest rateand foreign currency fluctuations. We do not currently hedge either of these risks, or utilize financial instrumentsfor trading or other speculative purposes.
Interest Rate Risk
We have exposure to interest rate risk from our amended and restated revolving credit facility as it is at avariable interest rate. The revolving credit agreement provides for $400 million of unsecured borrowing throughOctober 18, 2016, including the potential to expand the facility up to $500 million. At June 30, 2013, based uponthe leverage ratio as defined in the amended and restated revolving credit agreement, no limitations existed forrestricted payment purposes. At June 30, 2013, $85.0 million was outstanding under the amended and restatedrevolving credit facility and after consideration of $1.0 million outstanding letters of credit, there wasapproximately $314.0 million of available borrowings under the revolving credit facility. The effective interestrate on our borrowings at June 30, 2013 was 2.1%.
71
Foreign Currency Risk
We have subsidiaries or branches in Alderney, Argentina, Australia, Canada, China, India, Italy, Malta,Mexico, Peru, Spain, South Africa, Sweden and the United Kingdom. We sell substantially all of our productsand services globally in U.S. dollars to protect ourselves from foreign currency risk; therefore, we estimate that ahypothetical 10% strengthening (or weakening) of the U.S. dollar for fiscal 2013 would not have had a materialimpact on our business.
For those foreign subsidiaries in which the local currency is the functional currency, the net assets areexposed to foreign currency translation gains and losses, which are included as a component of accumulatedother comprehensive income in stockholders’ equity in our Consolidated Balance Sheets. Such translationresulted in an unrealized gain of $1.9 million for the year ended June 30, 2013, and unrealized losses of $9.9million for the year ended June 30, 2012.
For those foreign subsidiaries in which the U.S. dollar is the functional currency, in fiscal 2013, we recordedpre-tax realized and unrealized foreign currency losses of $5.1 million, primarily related to the devaluation of theArgentina peso against the U.S. dollar. In fiscal 2012, we recorded pre-tax realized and unrealized foreigncurrency losses of $0.4 million related to the movement of foreign currencies against the U.S. dollar.
In addition, foreign governments could impose restrictions on currency movements that might make itcostly or impossible to transfer money to the U.S. In fiscal 2012, the governmental authorities in Argentina beganlimiting the exchange of pesos into dollars and the transfer of funds from Argentina. This has been a dynamicsituation and we continue to monitor it closely. Our accounts and notes receivable, net in Argentina at June 30,2013 was $46.3 million, which is denominated in U.S. dollars, although customers pay us in pesos at the spotexchange rate between the peso and the U.S. dollar on date of payment. In addition, at June 30, 2013 we hadapproximately 28.9 million pesos, equal to approximately $5.4 million, in our Argentina bank account that wecannot immediately translate to U.S. dollars to transfer out of the country. If the government in Argentina decidesto devalue the peso, we would record charges in our Consolidated Statements of Income based on the amount ofpesos in our bank account and our customers would be required to pay us a greater amount of pesos when payingour invoices in the future and we cannot guarantee that customers will be able to pay such higher amounts.Without any changes in the government’s current restrictions on currency transfer, we expect the amount ofpesos in our bank account to grow as we collect accounts and notes receivable in fiscal 2014 and beyond whichwould increase our exposure to any currency devaluation.
ITEM 8. FINANCIAL STATEMENTS AND SUPPLEMENTARY DATA
Our Consolidated Financial Statements are included in this Report immediately following Part IV.
ITEM 9. CHANGES IN AND DISAGREEMENTS WITH ACCOUNTANTS ON ACCOUNTING ANDFINANCIAL DISCLOSURE
None.
ITEM 9A.CONTROLS AND PROCEDURES
Conclusion Regarding the Effectiveness of Disclosure Controls and Procedures
Under the supervision and the participation of our management, including our principal executive officerand principal financial officer, we conducted an evaluation as of June 30, 2013, of the effectiveness of the designand operation of our disclosure controls and procedures, as such term is defined under Rule 13a-15(e)promulgated under the Securities Exchange Act of 1934, as amended (the “Exchange Act”). Based on thisevaluation, our principal executive officer and our principal financial officer concluded that our disclosurecontrols and procedures were effective as of June 30, 2013.
72
Changes in Internal Control over Financial Reporting
During the quarter ended December 31, 2012, we substantially completed an upgrade to our enterprise-wideOracle ERP system from Oracle 11i to Oracle R12. The upgrade was subject to various testing and reviewprocedures prior to and after execution. We have updated our internal controls over financial reporting, asnecessary, to accommodate any modifications to our business processes or accounting procedures due to the ERPsystem upgrade. Management does not believe the ERP system upgrade has had an adverse effect on our internalcontrols over financial reporting. Other than the change described above, there have been no changes that haveoccurred during the most recent fiscal quarter that materially affected, or are reasonably likely to materiallyaffect, our internal control over financial reporting.
Management’s Report on Internal Control Over Financial Reporting
Our management is responsible for establishing and maintaining adequate internal control over financialreporting, as such term is defined in Exchange Act Rule 13a-15(f). Our internal control over financial reporting isdesigned to provide reasonable assurance regarding the preparation and fair presentation of published financialstatements. Because of its inherent limitations, internal control over financial reporting may not prevent or detectmisstatements. Therefore, even those systems determined to be effective can provide only reasonable assurancewith respect to financial statement preparation and presentation. Under the supervision and with the participationof our management, including our principal executive officer and principal financial officer, we conducted anevaluation of the effectiveness of our internal control over financial reporting based on the framework in InternalControl—Integrated Framework, issued by the Committee of Sponsoring Organizations of the TreadwayCommission. Based on our evaluation under the framework in Internal Control—Integrated Framework, ourmanagement concluded that our internal control over financial reporting was effective as of June 30, 2013.
The effectiveness of our internal control over financial reporting as of June 30, 2013 has been audited byErnst & Young LLP, an independent registered public accounting firm, as stated in their report included herein.
ITEM 9B. OTHER INFORMATION
Not Applicable.
73
PART III
ITEM 10. DIRECTORS, EXECUTIVE OFFICERS AND CORPORATE GOVERNANCE
The information required by this item is incorporated by reference from our definitive proxy statement to befiled in 2013 with the Securities and Exchange Commission (“SEC”).
ITEM 11. EXECUTIVE COMPENSATION
The information required by this item is incorporated by reference from our definitive proxy statement to befiled in 2013 with the Securities and Exchange Commission (“SEC”).
ITEM 12. SECURITY OWNERSHIP OF CERTAIN BENEFICIAL OWNERS AND MANAGEMENTAND RELATED STOCKHOLDER MATTERS
The information required by this item is incorporated by reference from our definitive proxy statement to befiled in 2013 with the Securities and Exchange Commission (“SEC”).
ITEM 13. CERTAIN RELATIONSHIPS AND RELATED TRANSACTIONS, AND DIRECTORINDEPENDENCE
The information required by this item is incorporated by reference from our definitive proxy statement to befiled in 2013 with the Securities and Exchange Commission (“SEC”).
ITEM 14. PRINCIPAL ACCOUNTING FEES AND SERVICES
The information required by this item is incorporated by reference from our definitive proxy statement to befiled in 2013 with the Securities and Exchange Commission (“SEC”).
74
PART IV
ITEM 15. EXHIBITS, FINANCIAL STATEMENT SCHEDULES
(a) (1) Financial Statements. See “Index to Financial Information” on page F-1.
(2) Financial Statement Schedule. See “Index to Financial Information” on page F-1.
(3) Exhibits.
Exhibit Description
2.1 Agreement and Plan of Merger, dated as of January 30, 2013, by and among Scientific GamesCorporation, SG California Merger Sub, Inc., Scientific Games International, Inc., and WMSIndustries Inc., incorporated by reference to WMS’ Current Report on Form 8-K filed on February 4,2013, SEC file No. 001-8300.
3.1 Restated Certificate of Incorporation of the Registrant, dated December 14, 2009, incorporated byreference to Exhibit 4.1 to WMS’ Registration Statement No. 333-163767 on Form S-8 filed onDecember 16, 2009, SEC file No. 001-8300.
3.2 Amended and Restated By-Laws of WMS, as amended and restated through May 7, 2007,incorporated by reference to WMS’ Current Report on Form 8-K, filed on May 10, 2007,SEC file No. 001-8300.
10.1 License Agreement Summary and License Agreement between WMS Gaming Inc., Hasbro, Inc. andHasbro International, Inc., dated as of April 1, 2009, incorporated by reference to WMS’ AnnualReport on Form 10-K for the year ended June 30, 2009, SEC file No. 001-8300. Portions of thisexhibit have been omitted under a request for confidential treatment filed separately with the SEC.
10.2 Warrant to purchase common stock of the Registrant, dated June 11, 2009, between WMS and HasbroInc., incorporated by reference to WMS’ Current Report on Form 8-K, filed on June 17, 2009,SEC file No. 001-8300.
10.3 Warrant modification agreement, dated as of June 11, 2009 between WMS Gaming Inc. and HasbroInc., incorporated by reference to WMS’ Current Report on Form 8-K, filed on June 17, 2009,SEC file No. 001-8300.
10.4 Warrant to purchase common stock of the Registrant, dated September 15, 2003, issued toHasbro, Inc., incorporated by reference to WMS’ Quarterly Report on Form 10-Q for the quarterended September 30, 2003, SEC file No. 001-8300.
10.5 First Amendment to Gaming Device License Agreement, dated March 12, 2013, by and amongHasbro, Inc., Hasbro International, Inc., and WMS Gaming Inc., incorporated by reference to WMS’Current Report on Form 8-K, filed on March 13, 2013, SEC File No. 001-8300. Portions of thisexhibit have been omitted under a request for confidential treatment filed separately with theCommission.
10.6 Game Manufacturer Cashless License Agreement, dated as of October 1, 2006, between IGT andWMS Gaming, Inc., incorporated by reference to WMS’ Current Report on Form 8-K, filed onOctober 3, 2006, SEC file No. 001-8300. Portions of this exhibit have been omitted under a requestfor confidential treatment filed separately with the SEC.
10.7 IGT/WMS Patent Cross License Agreement, between WMS Gaming Inc. and IGT, dated asFebruary 14, 2008, incorporated by reference to WMS’ Current Report on Form 8-K, filed onFebruary 21, 2008, SEC file No. 001-8300. Portions of this exhibit have been omitted under a requestfor confidential treatment filed separately with the SEC.
75
Exhibit Description
10.8 License and Development Agreement between WMS Gaming Inc. and Sierra Design Group, dated asof April 24, 2002, incorporated by reference to WMS’ Quarterly Report on Form 10-Q for the quarterended December 31, 2003, SEC file No. 001-8300. Portions of this exhibit have been omitted under arequest for confidential treatment filed separately with the SEC.
10.9 First Amendment to License and Development Agreement between WMS Gaming Inc. andSierra Design Group, dated June 12, 2003, incorporated by reference to WMS’ Quarterly Report onForm 10-Q for the quarter ended December 31, 2003, SEC file No. 001-8300. Portions of this exhibithave been omitted under a request for confidential treatment filed separately with the SEC.
10.10 Second Amendment to License and Development Agreement between WMS Gaming Inc. andSierra Design Group, dated July 15, 2003, incorporated by reference to WMS’ Quarterly Report onForm 10-Q for the quarter ended December 31, 2003, SEC file No. 001-8300.
10.11 Third Amendment to License and Development Agreement between WMS Gaming Inc. andSierra Design Group, dated November 7, 2003, incorporated by reference to WMS’ Quarterly Reporton Form 10-Q for the quarter ended December 31, 2003, SEC file No. 001-8300. Portions of thisexhibit have been omitted under a request for confidential treatment filed separately with the SEC.
10.12 Letter Amendment to License and Development Agreement between WMS Gaming Inc. andSierra Design Group, dated February 3, 2004, incorporated by reference to WMS’ Annual Report onForm 10-K for the year ended June 30, 2004, SEC file No. 001-8300. Portions of this exhibit havebeen omitted under a request for confidential treatment filed separately with the SEC.
10.13 License Agreement between WMS Gaming Inc. and Warner Bros. Consumer Products Inc., datedOctober 31, 2006, incorporated by reference to WMS’ Annual Report on Form 10-K for the yearended June 30, 2010, SEC File No. 001-8300. Portions of this exhibit have been omitted under arequest for confidential treatment filed separately with the SEC.
10.14 Letter Amendment to License Agreement between WMS Gaming Inc. and Warner Bros. ConsumerProducts Inc., dated May 14, 2009, incorporated by reference to WMS’ Annual Report on Form 10-Kfor the year ended June 30, 2010, SEC file No. 001-8300. Portions of this exhibit have been omittedunder a request for confidential treatment filed separately with the SEC.
10.15 Amendment No. 2 to the License Agreement between WMS Gaming Inc. and Warner Bros.Consumer Products Inc. , dated July 25, 2011, incorporated by reference to WMS’ Current Reporton Form 8-K, filed on July 29, 2011, SEC file No. 001-8300. Portions of this exhibit have beenomitted under a request for confidential treatment filed separately with the SEC.
10.16 $400 million Second Amended and Restated Credit Agreement, dated October 18, 2011, between theCorporation with JPMorgan Chase Bank, N.A., as Administrative Agent, JPMorgan Securities LLC,as Joint Bookrunner and Joint Lead Arranger, Merrill Lynch, Pierce, Fenner & Smith Incorporated, asJoint Bookrunner and Joint Lead Arranger, Bank of America, N.A., as Syndication Agent andKeybank National Association, Wells Fargo Bank, National Association and Compass Bank, asCo-Documentation Agents, and Union Bank N.A. as Senior Managing Agent, incorporated byreference to WMS’ Quarterly Report on Form 10-Q, for the quarter ended December 31, 2011,SEC file No. 001-8300.
Management Contracts and Compensatory Plans or Arrangements
10.17 WMS Industries Inc. 1998 Non-Qualified Stock Option Plan, incorporated by reference to WMS’Registration Statement No. 333-163767 on Form S-8 filed on December 16, 2009, SEC fileNo. 001-8300.
10.18 WMS Industries Inc. 2000 Non-Qualified Stock Option Plan, incorporated by reference to WMS’Registration Statement No. 333-163767 on Form S-8 filed on December 16, 2009, SEC fileNo. 001-8300.
76
Exhibit Description
10.19 WMS Industries Inc. 2000 Stock Option Plan, incorporated by reference to WMS’ RegistrationStatement No. 333-163767 on Form S-8 filed on December 16, 2009, SEC file No. 001-8300.
10.20 WMS Industries Inc. 2002 Stock Option Plan, incorporated by reference to WMS’ RegistrationStatement No. 333-163767 on Form S-8 filed on December 16, 2009, SEC file No. 001-8300.
10.21 WMS Industries Inc. Incentive Plan (2009 Restatement) as adopted on December 10, 2009,incorporated by reference to WMS’ Registration Statement No. 333-163767 on Form S-8 filed onDecember 16, 2009, SEC file No. 001-8300.
10.22 WMS Industries Inc. Incentive Plan (2012 Restatement) dated December 6, 2012, incorporated byreference to WMS’ Registration Statement No. 333-185481 on Form S-8 filed on December 14, 2012,SEC file No. 001-8300.
10.23 WMS Industries Inc. Amended and Restated 2009 Employee Stock Purchase Plan, incorporated byreference to WMS’s Quarterly Report on Form 10-Q for the quarter ended March 31, 2009,SEC file No. 001-8300.
10.24 Form of Stock Option Agreement incorporated by reference to WMS’ Quarterly Report onForm 10-Q for the quarter ended September 30, 2010, SEC file No. 001-8300.
10.25 Form of Restricted Stock Unit Agreement.
10.26 Form of Equity-Based Performance Award Agreement incorporated by reference to WMS’ QuarterlyReport on Form 10-Q for the fiscal year ended September 30, 2010, SEC file No. 001-8300.
10.27 Form of Deferred Stock Unit Agreement incorporated by reference to WMS’ Annual Report onForm 10-K for the fiscal year ended June 30, 2006, SEC file No. 001-8300.
10.28 Form of Restricted Stock Unit Agreement incorporated by reference to WMS’ Annual Report onForm 10-K for the fiscal year ended June 30, 2007, SEC file No. 001-8300.
10.29 Form of Director Stock Option Agreement incorporated by reference to WMS’ Quarterly Report onForm 10-Q for the quarter ended September 30, 2010, SEC file No. 001-8300.
10.30 Form of Performance-based Restricted Unit Agreement incorporated by reference to WMS’ AnnualReport on Form 10-K for the fiscal year ended June 30, 2008, SEC file No. 001-8300.
10.31 WMS Industries Inc. Nonqualified Deferred Compensation Plan (As Amended and Restated EffectiveJanuary 1, 2010) as approved on December 10, 2009, incorporated by reference to Exhibit 10.2 toWMS’ Current Report on Form 8-K filed on December 16, 2009, SEC file No. 001-8300.
10.32 Employment Agreement between Brian R. Gamache and WMS, dated December 27, 2004,incorporated by reference to WMS’ Current Report on Form 8-K, filed on December 30, 2004,SEC file No. 001-8300.
10.33 Letter Agreement, dated as of August 9, 2005, between WMS and Brian R. Gamache incorporated byreference to WMS’ Current Report on Form 8-K, filed on August 15, 2005, SEC file No. 001-8300.
10.34 Amendment to Executive Employment Agreement, dated July 1, 2008, between WMS and Brian R.Gamache, incorporated by reference to WMS’ Current Report on Form 8-K, filed on July 3, 2008,SEC file No. 001-8300.
10.35 Amendment to Executive Employment Agreement, dated December 21, 2012, between WMS andBrian R. Gamache incorporated by reference to WMS’ Quarterly Report on Form 10-Q for the quarterended December 31, 2012, SEC file No. 001-8300.
10.36 Employment Agreement between Orrin J. Edidin and WMS, dated February 18, 2005, incorporatedby reference to WMS’ Current Report on Form 8-K, filed on February 24, 2005, SEC fileNo. 001-8300.
77
Exhibit Description
10.37 Letter Agreement, dated as of August 9, 2005, between WMS and Orrin J. Edidin incorporated byreference to WMS’ Current Report on Form 8-K, filed on August 15, 2005, SEC file No. 001-8300.
10.38 Amendment to Executive Employment Agreement, dated July 1, 2008, between WMS and OrrinJ. Edidin, incorporated by reference to WMS’ Current Report on Form 8-K, filed on July 3, 2008,SEC file No. 001-8300.
10.39 Amendment to Executive Employment Agreement, dated December 19, 2012, between WMS andOrrin J. Edidin, incorporated by reference to WMS’ Quarterly Report on Form 10-Q for the quarterended December 31, 2012, SEC file No. 001-8300.
10.40 Employment Agreement between Scott D. Schweinfurth and WMS dated February 18, 2005,incorporated by reference to WMS’ Current Report on Form 8-K, filed on February 24, 2005,SEC file No. 001-8300.
10.41 Letter Agreement, dated as of August 9, 2005, between WMS and Scott D. Schweinfurth incorporatedby reference to WMS’ Current Report on Form 8-K, filed on August 15, 2005, SEC fileNo. 001-8300.
10.42 Amendment to Executive Employment Agreement, dated July 1, 2008, between WMS and Scott D.Schweinfurth, incorporated by reference to WMS’ Current Report on Form 8-K, filed on July 3, 2008,SEC file No. 001-8300.
10.43 Amendment to Executive Employment Agreement, dated December 19, 2012, between WMS andScott D. Schweinfurth, incorporated by reference to WMS’ Quarterly Report on Form 10-Q for thequarter ended December 31, 2012, SEC file No. 001-8300.
10.44 Employment letter, dated November 22, 2002, to Kathleen J. McJohn, Vice President, GeneralCounsel and Secretary, incorporated by reference to WMS’ Quarterly Report on Form 10-Q for thequarter ended March 31, 2003, SEC file No. 001-8300.
10.45 Amendment to Employment letter, dated December 7, 2012, between WMS Gaming Inc. andKathleen J. McJohn, incorporated by reference to WMS’ Quarterly Report on Form 10-Q for thequarter ended December 31, 2012, SEC file No. 001-8300.
10.46 Employment Agreement, dated September 7, 2005, between WMS and Larry J. Pacey, incorporatedby reference to WMS’ Current Report on Form 8-K, filed on July 3, 2008, SEC file No. 001-8300.
10.47 Amendment to Executive Employment Agreement, dated July 1, 2008, between WMS and LarryJ. Pacey, incorporated by reference to WMS’ Current Report on Form 8-K, filed on July 3, 2008,SEC file No. 001-8300.
10.48 Deferred Compensation Agreement, dated January 27, 2007, between WMS and Larry J. Pacey,incorporated by reference to WMS’ Current Report on Form 8-K, filed on July 3, 2008, SEC fileNo. 001-8300.
10.49 Amendment to Employment Agreement, dated December 7, 2012, between WMS Gaming Inc. andLarry J. Pacey, incorporated by reference to WMS’ Quarterly Report on Form 10-Q for the quarterended December 31, 2012, SEC file No. 001-8300.
10.50 Employment agreement between Ken Lochiatto and WMS Gaming Inc., dated March 11, 2010,incorporated by reference to WMS’ Current Report on Form 8-K filed March 16, 2010, SEC fileNo. 001-8300.
10.51 Amendment to Employment Agreement, dated December 7, 2012, between WMS Gaming Inc. andKen Lochiatto incorporated by reference to WMS’ Quarterly Report on Form 10-Q for the quarterended December 31, 2012, SEC file No. 001-8300.
78
Exhibit Description
10.52 Form of Officer and Director Indemnity Agreement incorporated by reference to WMS’ AnnualReport on Form 10-K for the fiscal year ended June 30, 2012, SEC file No. 001-8300.
Other
21 Subsidiaries of the Registrant.
23 Consent of Ernst & Young LLP.
31 Certifications of Chief Executive Officer and Chief Financial Officer pursuant toSection 13(a)-14(a) of the Securities Exchange Act of 1934 (Section 302 of the Sarbanes-OxleyAct of 2002).
32 Certification of the Chief Executive Officer and Chief Financial Officer Pursuant to 18 U.S.C.Section 1350 (Section 906 of the Sarbanes-Oxley Act of 2002).
99 Gaming Regulation
101.INS XBRL Instance Document
101.SCH XBRL Taxonomy Extension Schema Document
101.CAL XBRL Taxonomy Extension Calculation Linkbase Document
101.DEF XBRL Taxonomy Extension Definition Linkbase Document
101.LAB XBRL Taxonomy Extension Label Linkbase Document
101.PRE XBRL Taxonomy Extension Presentation Linkbase Document
79
WMS INDUSTRIES INC.INDEX TO FINANCIAL INFORMATION
PageNo.
Financial Statements and Financial Statement Schedule
Reports of independent registered public accounting firm . . . . . . . . . . . . . . . . . . . . . . . . . . . . . . . . . . . . F-2, F-3
Consolidated balance sheets at June 30, 2013 and June 30, 2012 . . . . . . . . . . . . . . . . . . . . . . . . . . . . . . . F-4
Consolidated statements of income for the years ended June 30, 2013, 2012 and 2011 . . . . . . . . . . . . . . F-5
Consolidated statements of comprehensive income for the years ended June 30, 2013, 2012 and2011 . . . . . . . . . . . . . . . . . . . . . . . . . . . . . . . . . . . . . . . . . . . . . . . . . . . . . . . . . . . . . . . . . . . . . . . . . . . . F-6
Consolidated statements of stockholders’ equity for the years ended June 30, 2013, 2012 and 2011 . . . F-7
Consolidated statements of cash flows for the years ended June 30, 2013, 2012 and 2011 . . . . . . . . . . . F-8
Notes to consolidated financial statements . . . . . . . . . . . . . . . . . . . . . . . . . . . . . . . . . . . . . . . . . . . . . . . . F-9
Financial statement schedule II—Valuation and Qualifying Accounts for the years ended June 30,2013, 2012 and 2011 . . . . . . . . . . . . . . . . . . . . . . . . . . . . . . . . . . . . . . . . . . . . . . . . . . . . . . . . . . . . . . . F-51
All other schedules are omitted since the required information is not present in amounts sufficient to requiresubmission of the schedule or because the information required is included in the Consolidated FinancialStatements and Notes thereto.
F-1
REPORT OF INDEPENDENT REGISTERED PUBLIC ACCOUNTING FIRM
The Board of Directors and Stockholders ofWMS Industries Inc.
We have audited the accompanying consolidated balance sheets of WMS Industries Inc. (the “Company”) asof June 30, 2013 and 2012, and the related consolidated statements of income, comprehensive income,stockholders’ equity and cash flows for each of the three years in the period ended June 30, 2013. Our audits alsoincluded the financial statement schedule listed in the Index at Item 15(a). These financial statements andschedule are the responsibility of the Company’s management. Our responsibility is to express an opinion onthese financial statements and schedule based on our audits.
We conducted our audits in accordance with the standards of the Public Company Accounting OversightBoard (United States). Those standards require that we plan and perform the audit to obtain reasonable assuranceabout whether the financial statements are free of material misstatement. An audit includes examining, on a testbasis, evidence supporting the amounts and disclosures in the financial statements. An audit also includesassessing the accounting principles used and significant estimates made by management, as well as evaluatingthe overall financial statement presentation. We believe that our audits provide a reasonable basis for ouropinion.
In our opinion, the consolidated financial statements referred to above present fairly, in all material respects,the consolidated financial position of WMS Industries Inc. at June 30, 2013 and 2012, and the consolidatedresults of its operations and its cash flows for each of the three years in the period ended June 30, 2013, inconformity with U.S. generally accepted accounting principles. Also, in our opinion, the related financialstatement schedule, when considered in relation to the basic financial statements taken as a whole, presents fairlyin all material respects the information set forth therein.
We also have audited, in accordance with the standards of the Public Company Accounting Oversight Board(United States), WMS Industries Inc.’s internal control over financial reporting as of June 30, 2013, based oncriteria established in Internal Control-Integrated Framework issued by the Committee of SponsoringOrganizations of the Treadway Commission and our report dated August 29, 2013 expressed an unqualifiedopinion thereon.
/s/ Ernst & Young LLP
Chicago, IllinoisAugust 29, 2013
F-2
REPORT OF INDEPENDENT REGISTERED PUBLIC ACCOUNTING FIRM
The Board of Directors and Stockholders ofWMS Industries Inc.
We have audited WMS Industries Inc.’s internal control over financial reporting as of June 30, 2013, basedon criteria established in Internal Control—Integrated Framework issued by the Committee of SponsoringOrganizations of the Treadway Commission (the COSO criteria). WMS Industries Inc.’s management isresponsible for maintaining effective internal control over financial reporting, and for its assessment of theeffectiveness of internal control over financial reporting included in the accompanying Management’s Report onInternal Control over Financial Reporting. Our responsibility is to express an opinion on the company’s internalcontrol over financial reporting based on our audit.
We conducted our audit in accordance with the standards of the Public Company Accounting OversightBoard (United States). Those standards require that we plan and perform the audit to obtain reasonable assuranceabout whether effective internal control over financial reporting was maintained in all material respects. Ouraudit included obtaining an understanding of internal control over financial reporting, assessing the risk that amaterial weakness exists, testing and evaluating the design and operating effectiveness of internal control basedon the assessed risk, and performing such other procedures as we considered necessary in the circumstances. Webelieve that our audit provides a reasonable basis for our opinion.
A company’s internal control over financial reporting is a process designed to provide reasonable assuranceregarding the reliability of financial reporting and the preparation of financial statements for external purposes inaccordance with generally accepted accounting principles. A company’s internal control over financial reportingincludes those policies and procedures that (1) pertain to the maintenance of records that, in reasonable detail,accurately and fairly reflect the transactions and dispositions of the assets of the company; (2) provide reasonableassurance that transactions are recorded as necessary to permit preparation of financial statements in accordancewith generally accepted accounting principles, and that receipts and expenditures of the company are being madeonly in accordance with authorizations of management and directors of the company; and (3) provide reasonableassurance regarding prevention or timely detection of unauthorized acquisition, use or disposition of thecompany’s assets that could have a material effect on the financial statements.
Because of its inherent limitations, internal control over financial reporting may not prevent or detectmisstatements. Also, projections of any evaluation of effectiveness to future periods are subject to the risk thatcontrols may become inadequate because of changes in conditions, or that the degree of compliance with thepolicies or procedures may deteriorate.
In our opinion, WMS Industries Inc. maintained, in all material respects, effective internal control overfinancial reporting as of June 30, 2013, based on the COSO criteria.
We also have audited, in accordance with the standards of the Public Company Accounting Oversight Board(United States), the consolidated balance sheets of WMS Industries Inc. as of June 30, 2013 and 2012, and therelated consolidated statements of income, comprehensive income, stockholders’ equity and cash flows for eachof the three years in the period ended June 30, 2013 of WMS Industries Inc. and our report dated August 29,2013 expressed an unqualified opinion thereon.
/s/ Ernst & Young LLP
Chicago, IllinoisAugust 29, 2013
F-3
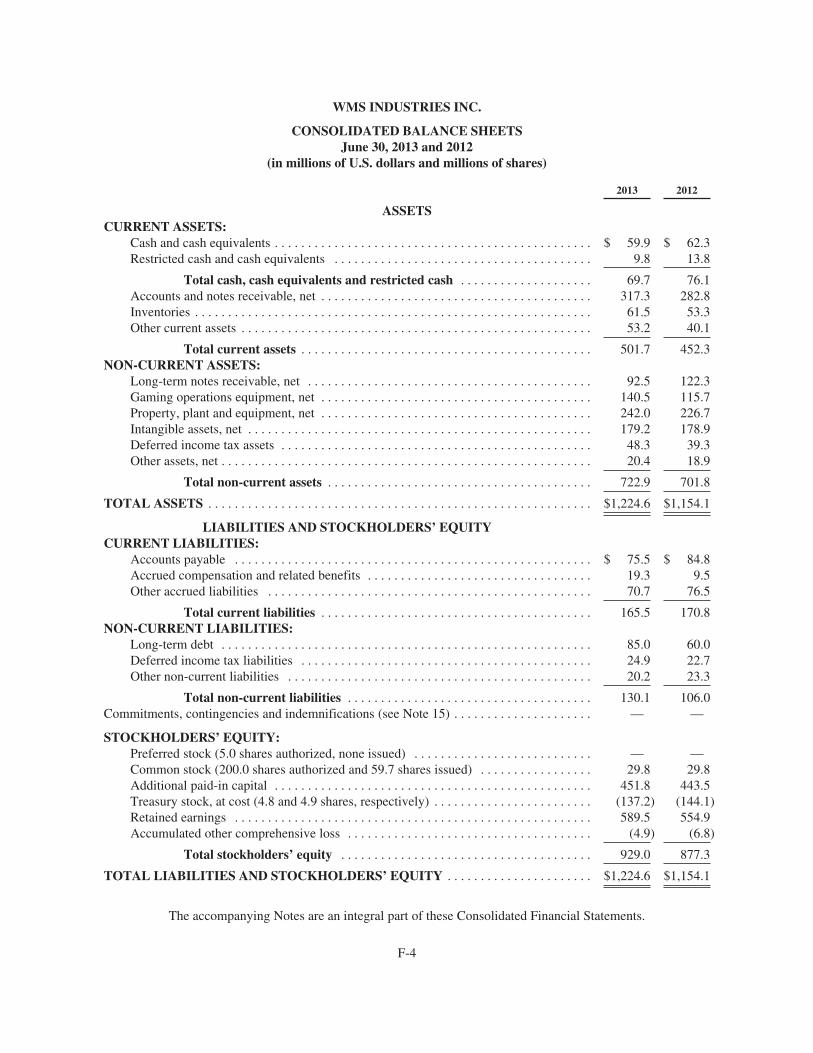
WMS INDUSTRIES INC.
CONSOLIDATED BALANCE SHEETSJune 30, 2013 and 2012
(in millions of U.S. dollars and millions of shares)
2013 2012
ASSETSCURRENT ASSETS:
Cash and cash equivalents . . . . . . . . . . . . . . . . . . . . . . . . . . . . . . . . . . . . . . . . . . . . . . . . $ 59.9 $ 62.3Restricted cash and cash equivalents . . . . . . . . . . . . . . . . . . . . . . . . . . . . . . . . . . . . . . . 9.8 13.8
Total cash, cash equivalents and restricted cash . . . . . . . . . . . . . . . . . . . . 69.7 76.1Accounts and notes receivable, net . . . . . . . . . . . . . . . . . . . . . . . . . . . . . . . . . . . . . . . . . 317.3 282.8Inventories . . . . . . . . . . . . . . . . . . . . . . . . . . . . . . . . . . . . . . . . . . . . . . . . . . . . . . . . . . . . 61.5 53.3Other current assets . . . . . . . . . . . . . . . . . . . . . . . . . . . . . . . . . . . . . . . . . . . . . . . . . . . . . 53.2 40.1
Total current assets . . . . . . . . . . . . . . . . . . . . . . . . . . . . . . . . . . . . . . . . . . . . 501.7 452.3NON-CURRENT ASSETS:
Long-term notes receivable, net . . . . . . . . . . . . . . . . . . . . . . . . . . . . . . . . . . . . . . . . . . . 92.5 122.3Gaming operations equipment, net . . . . . . . . . . . . . . . . . . . . . . . . . . . . . . . . . . . . . . . . . 140.5 115.7Property, plant and equipment, net . . . . . . . . . . . . . . . . . . . . . . . . . . . . . . . . . . . . . . . . . 242.0 226.7Intangible assets, net . . . . . . . . . . . . . . . . . . . . . . . . . . . . . . . . . . . . . . . . . . . . . . . . . . . . 179.2 178.9Deferred income tax assets . . . . . . . . . . . . . . . . . . . . . . . . . . . . . . . . . . . . . . . . . . . . . . . 48.3 39.3Other assets, net . . . . . . . . . . . . . . . . . . . . . . . . . . . . . . . . . . . . . . . . . . . . . . . . . . . . . . . . 20.4 18.9
Total non-current assets . . . . . . . . . . . . . . . . . . . . . . . . . . . . . . . . . . . . . . . . 722.9 701.8
TOTAL ASSETS . . . . . . . . . . . . . . . . . . . . . . . . . . . . . . . . . . . . . . . . . . . . . . . . . . . . . . . . . . $1,224.6 $1,154.1
LIABILITIES AND STOCKHOLDERS’ EQUITYCURRENT LIABILITIES:
Accounts payable . . . . . . . . . . . . . . . . . . . . . . . . . . . . . . . . . . . . . . . . . . . . . . . . . . . . . . $ 75.5 $ 84.8Accrued compensation and related benefits . . . . . . . . . . . . . . . . . . . . . . . . . . . . . . . . . . 19.3 9.5Other accrued liabilities . . . . . . . . . . . . . . . . . . . . . . . . . . . . . . . . . . . . . . . . . . . . . . . . . 70.7 76.5
Total current liabilities . . . . . . . . . . . . . . . . . . . . . . . . . . . . . . . . . . . . . . . . . 165.5 170.8NON-CURRENT LIABILITIES:
Long-term debt . . . . . . . . . . . . . . . . . . . . . . . . . . . . . . . . . . . . . . . . . . . . . . . . . . . . . . . . 85.0 60.0Deferred income tax liabilities . . . . . . . . . . . . . . . . . . . . . . . . . . . . . . . . . . . . . . . . . . . . 24.9 22.7Other non-current liabilities . . . . . . . . . . . . . . . . . . . . . . . . . . . . . . . . . . . . . . . . . . . . . . 20.2 23.3
Total non-current liabilities . . . . . . . . . . . . . . . . . . . . . . . . . . . . . . . . . . . . . 130.1 106.0Commitments, contingencies and indemnifications (see Note 15) . . . . . . . . . . . . . . . . . . . . . — —
STOCKHOLDERS’ EQUITY:Preferred stock (5.0 shares authorized, none issued) . . . . . . . . . . . . . . . . . . . . . . . . . . . — —Common stock (200.0 shares authorized and 59.7 shares issued) . . . . . . . . . . . . . . . . . 29.8 29.8Additional paid-in capital . . . . . . . . . . . . . . . . . . . . . . . . . . . . . . . . . . . . . . . . . . . . . . . . 451.8 443.5Treasury stock, at cost (4.8 and 4.9 shares, respectively) . . . . . . . . . . . . . . . . . . . . . . . . (137.2) (144.1)Retained earnings . . . . . . . . . . . . . . . . . . . . . . . . . . . . . . . . . . . . . . . . . . . . . . . . . . . . . . 589.5 554.9Accumulated other comprehensive loss . . . . . . . . . . . . . . . . . . . . . . . . . . . . . . . . . . . . . (4.9) (6.8)
Total stockholders’ equity . . . . . . . . . . . . . . . . . . . . . . . . . . . . . . . . . . . . . . 929.0 877.3
TOTAL LIABILITIES AND STOCKHOLDERS’ EQUITY . . . . . . . . . . . . . . . . . . . . . . $1,224.6 $1,154.1
The accompanying Notes are an integral part of these Consolidated Financial Statements.
F-4
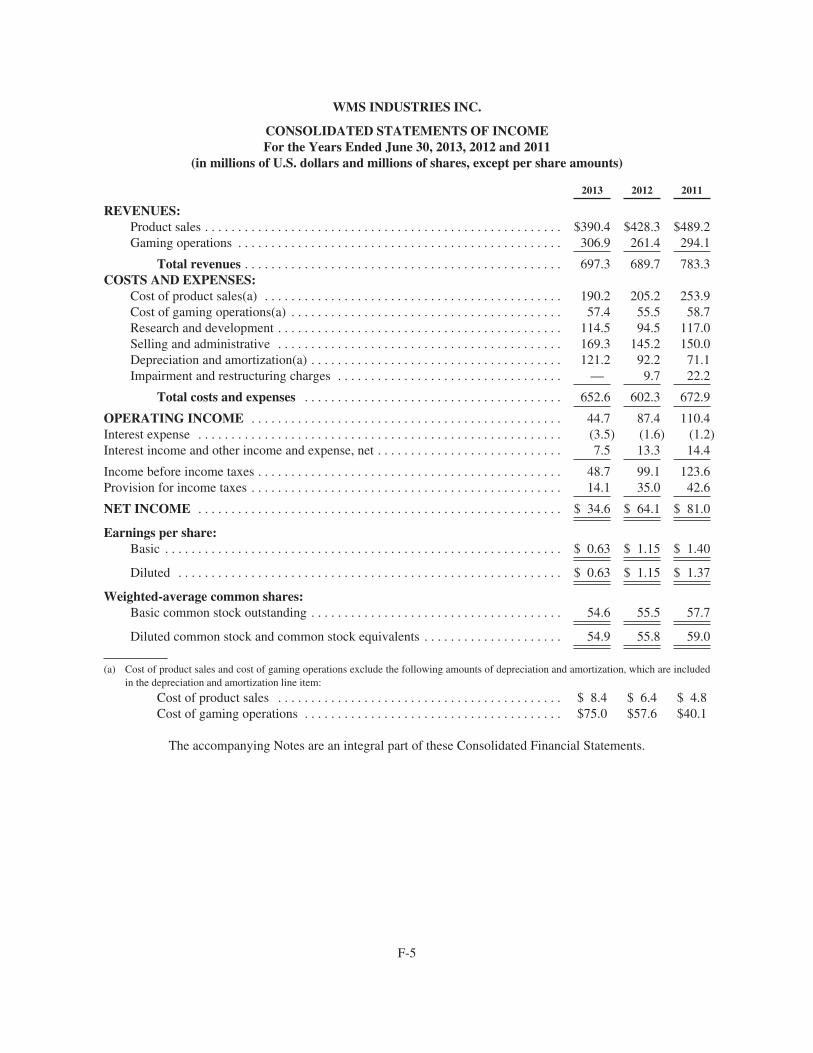
WMS INDUSTRIES INC.
CONSOLIDATED STATEMENTS OF INCOMEFor the Years Ended June 30, 2013, 2012 and 2011
(in millions of U.S. dollars and millions of shares, except per share amounts)
2013 2012 2011
REVENUES:Product sales . . . . . . . . . . . . . . . . . . . . . . . . . . . . . . . . . . . . . . . . . . . . . . . . . . . . . . $390.4 $428.3 $489.2Gaming operations . . . . . . . . . . . . . . . . . . . . . . . . . . . . . . . . . . . . . . . . . . . . . . . . . 306.9 261.4 294.1
Total revenues . . . . . . . . . . . . . . . . . . . . . . . . . . . . . . . . . . . . . . . . . . . . . . . . 697.3 689.7 783.3COSTS AND EXPENSES:
Cost of product sales(a) . . . . . . . . . . . . . . . . . . . . . . . . . . . . . . . . . . . . . . . . . . . . . 190.2 205.2 253.9Cost of gaming operations(a) . . . . . . . . . . . . . . . . . . . . . . . . . . . . . . . . . . . . . . . . . 57.4 55.5 58.7Research and development . . . . . . . . . . . . . . . . . . . . . . . . . . . . . . . . . . . . . . . . . . . 114.5 94.5 117.0Selling and administrative . . . . . . . . . . . . . . . . . . . . . . . . . . . . . . . . . . . . . . . . . . . 169.3 145.2 150.0Depreciation and amortization(a) . . . . . . . . . . . . . . . . . . . . . . . . . . . . . . . . . . . . . . 121.2 92.2 71.1Impairment and restructuring charges . . . . . . . . . . . . . . . . . . . . . . . . . . . . . . . . . . — 9.7 22.2
Total costs and expenses . . . . . . . . . . . . . . . . . . . . . . . . . . . . . . . . . . . . . . . 652.6 602.3 672.9
OPERATING INCOME . . . . . . . . . . . . . . . . . . . . . . . . . . . . . . . . . . . . . . . . . . . . . . . 44.7 87.4 110.4Interest expense . . . . . . . . . . . . . . . . . . . . . . . . . . . . . . . . . . . . . . . . . . . . . . . . . . . . . . . (3.5) (1.6) (1.2)Interest income and other income and expense, net . . . . . . . . . . . . . . . . . . . . . . . . . . . . 7.5 13.3 14.4
Income before income taxes . . . . . . . . . . . . . . . . . . . . . . . . . . . . . . . . . . . . . . . . . . . . . . 48.7 99.1 123.6Provision for income taxes . . . . . . . . . . . . . . . . . . . . . . . . . . . . . . . . . . . . . . . . . . . . . . . 14.1 35.0 42.6
NET INCOME . . . . . . . . . . . . . . . . . . . . . . . . . . . . . . . . . . . . . . . . . . . . . . . . . . . . . . . $ 34.6 $ 64.1 $ 81.0
Earnings per share:Basic . . . . . . . . . . . . . . . . . . . . . . . . . . . . . . . . . . . . . . . . . . . . . . . . . . . . . . . . . . . . $ 0.63 $ 1.15 $ 1.40
Diluted . . . . . . . . . . . . . . . . . . . . . . . . . . . . . . . . . . . . . . . . . . . . . . . . . . . . . . . . . . $ 0.63 $ 1.15 $ 1.37
Weighted-average common shares:Basic common stock outstanding . . . . . . . . . . . . . . . . . . . . . . . . . . . . . . . . . . . . . . 54.6 55.5 57.7
Diluted common stock and common stock equivalents . . . . . . . . . . . . . . . . . . . . . 54.9 55.8 59.0
(a) Cost of product sales and cost of gaming operations exclude the following amounts of depreciation and amortization, which are includedin the depreciation and amortization line item:
Cost of product sales . . . . . . . . . . . . . . . . . . . . . . . . . . . . . . . . . . . . . . . . . . . $ 8.4 $ 6.4 $ 4.8Cost of gaming operations . . . . . . . . . . . . . . . . . . . . . . . . . . . . . . . . . . . . . . . $75.0 $57.6 $40.1
The accompanying Notes are an integral part of these Consolidated Financial Statements.
F-5
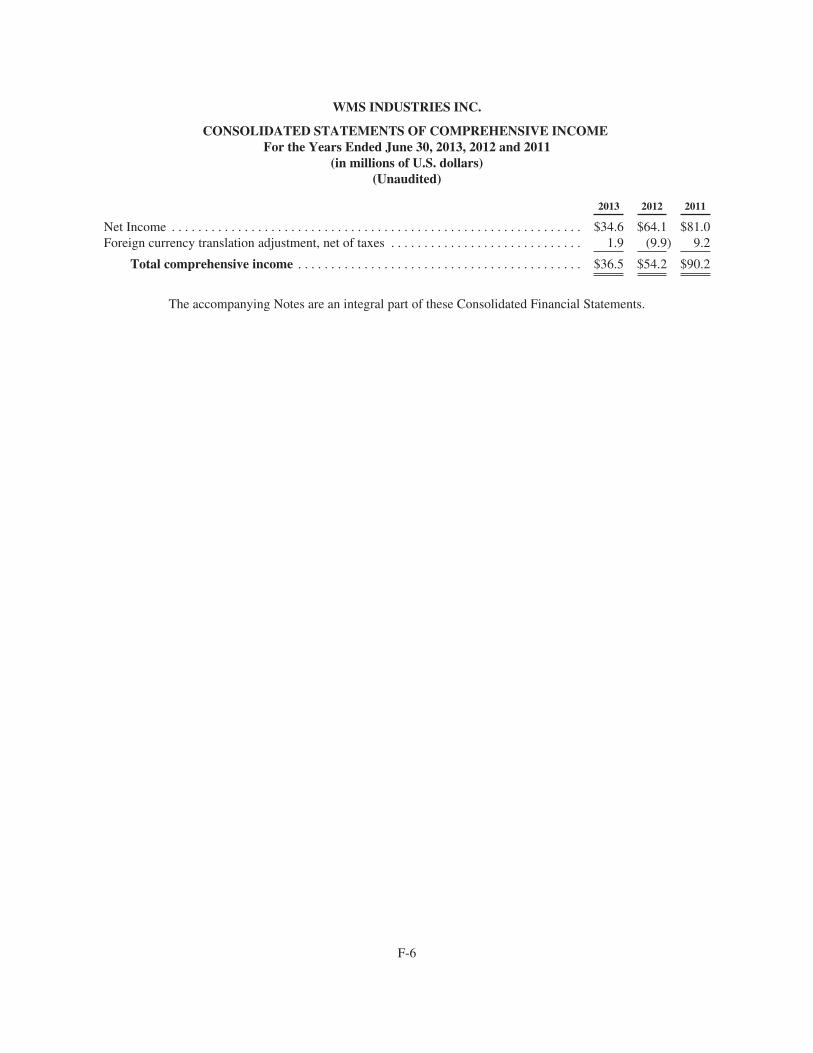
WMS INDUSTRIES INC.
CONSOLIDATED STATEMENTS OF COMPREHENSIVE INCOMEFor the Years Ended June 30, 2013, 2012 and 2011
(in millions of U.S. dollars)(Unaudited)
2013 2012 2011
Net Income . . . . . . . . . . . . . . . . . . . . . . . . . . . . . . . . . . . . . . . . . . . . . . . . . . . . . . . . . . . . . . $34.6 $64.1 $81.0Foreign currency translation adjustment, net of taxes . . . . . . . . . . . . . . . . . . . . . . . . . . . . . 1.9 (9.9) 9.2
Total comprehensive income . . . . . . . . . . . . . . . . . . . . . . . . . . . . . . . . . . . . . . . . . . . $36.5 $54.2 $90.2
The accompanying Notes are an integral part of these Consolidated Financial Statements.
F-6
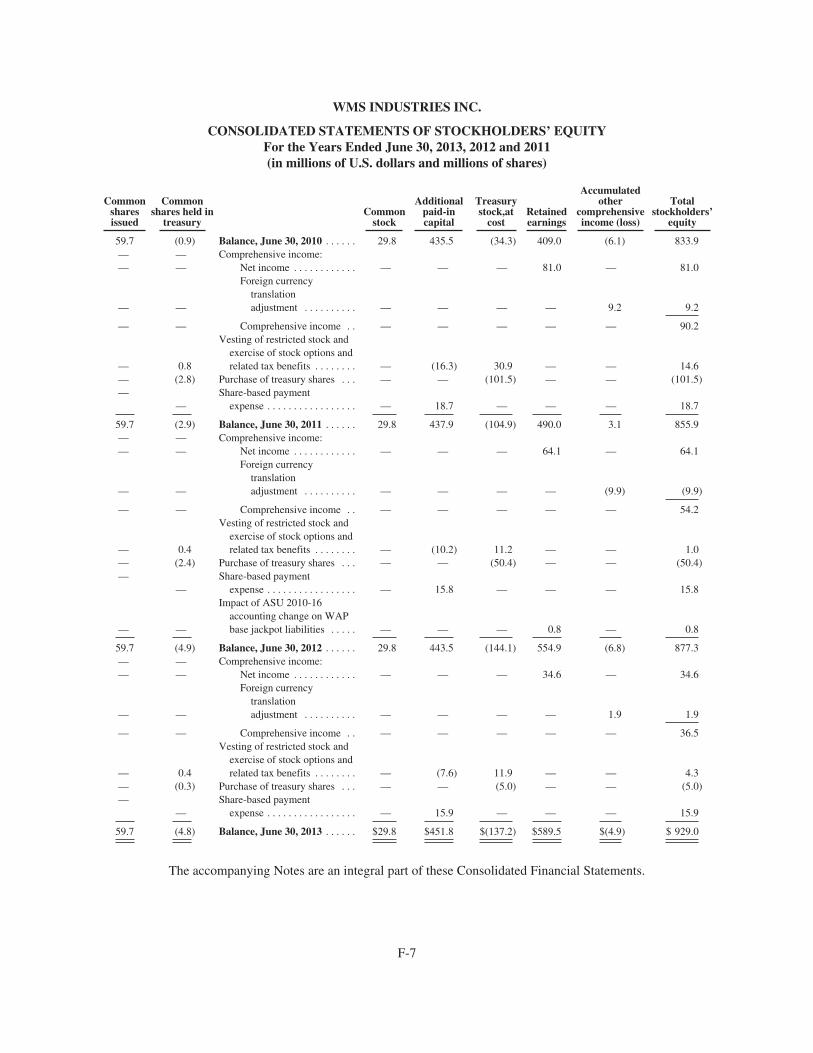
WMS INDUSTRIES INC.
CONSOLIDATED STATEMENTS OF STOCKHOLDERS’ EQUITYFor the Years Ended June 30, 2013, 2012 and 2011(in millions of U.S. dollars and millions of shares)
Commonsharesissued
Commonshares held in
treasuryCommon
stock
Additionalpaid-incapital
Treasurystock,at
costRetainedearnings
Accumulatedother
comprehensiveincome (loss)
Totalstockholders’
equity
59.7 (0.9) Balance, June 30, 2010 . . . . . . 29.8 435.5 (34.3) 409.0 (6.1) 833.9— — Comprehensive income:— — Net income . . . . . . . . . . . . — — — 81.0 — 81.0
— —
Foreign currencytranslationadjustment . . . . . . . . . . — — — — 9.2 9.2
— — Comprehensive income . . — — — — — 90.2
— 0.8
Vesting of restricted stock andexercise of stock options andrelated tax benefits . . . . . . . . — (16.3) 30.9 — — 14.6
— (2.8) Purchase of treasury shares . . . — — (101.5) — — (101.5)—
—Share-based payment
expense . . . . . . . . . . . . . . . . . — 18.7 — — — 18.7
59.7 (2.9) Balance, June 30, 2011 . . . . . . 29.8 437.9 (104.9) 490.0 3.1 855.9— — Comprehensive income:— — Net income . . . . . . . . . . . . — — — 64.1 — 64.1
— —
Foreign currencytranslationadjustment . . . . . . . . . . — — — — (9.9) (9.9)
— — Comprehensive income . . — — — — — 54.2
— 0.4
Vesting of restricted stock andexercise of stock options andrelated tax benefits . . . . . . . . — (10.2) 11.2 — — 1.0
— (2.4) Purchase of treasury shares . . . — — (50.4) — — (50.4)—
—Share-based payment
expense . . . . . . . . . . . . . . . . . — 15.8 — — — 15.8
— —
Impact of ASU 2010-16accounting change on WAPbase jackpot liabilities . . . . . — — — 0.8 — 0.8
59.7 (4.9) Balance, June 30, 2012 . . . . . . 29.8 443.5 (144.1) 554.9 (6.8) 877.3— — Comprehensive income:— — Net income . . . . . . . . . . . . — — — 34.6 — 34.6
— —
Foreign currencytranslationadjustment . . . . . . . . . . — — — — 1.9 1.9
— — Comprehensive income . . — — — — — 36.5
— 0.4
Vesting of restricted stock andexercise of stock options andrelated tax benefits . . . . . . . . — (7.6) 11.9 — — 4.3
— (0.3) Purchase of treasury shares . . . — — (5.0) — — (5.0)—
—Share-based payment
expense . . . . . . . . . . . . . . . . . — 15.9 — — — 15.9
59.7 (4.8) Balance, June 30, 2013 . . . . . . $29.8 $451.8 $(137.2) $589.5 $(4.9) $ 929.0
The accompanying Notes are an integral part of these Consolidated Financial Statements.
F-7
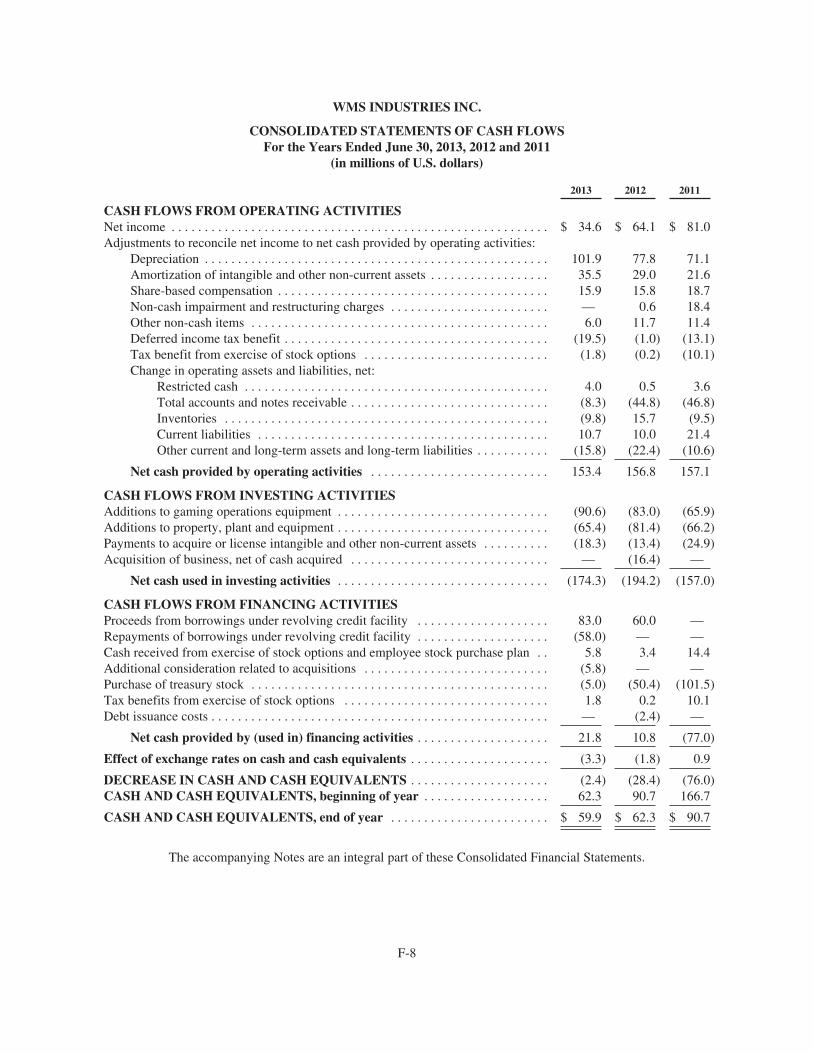
WMS INDUSTRIES INC.
CONSOLIDATED STATEMENTS OF CASH FLOWSFor the Years Ended June 30, 2013, 2012 and 2011
(in millions of U.S. dollars)
2013 2012 2011
CASH FLOWS FROM OPERATING ACTIVITIESNet income . . . . . . . . . . . . . . . . . . . . . . . . . . . . . . . . . . . . . . . . . . . . . . . . . . . . . . . . . $ 34.6 $ 64.1 $ 81.0Adjustments to reconcile net income to net cash provided by operating activities:
Depreciation . . . . . . . . . . . . . . . . . . . . . . . . . . . . . . . . . . . . . . . . . . . . . . . . . . . . 101.9 77.8 71.1Amortization of intangible and other non-current assets . . . . . . . . . . . . . . . . . . 35.5 29.0 21.6Share-based compensation . . . . . . . . . . . . . . . . . . . . . . . . . . . . . . . . . . . . . . . . . 15.9 15.8 18.7Non-cash impairment and restructuring charges . . . . . . . . . . . . . . . . . . . . . . . . — 0.6 18.4Other non-cash items . . . . . . . . . . . . . . . . . . . . . . . . . . . . . . . . . . . . . . . . . . . . . 6.0 11.7 11.4Deferred income tax benefit . . . . . . . . . . . . . . . . . . . . . . . . . . . . . . . . . . . . . . . . (19.5) (1.0) (13.1)Tax benefit from exercise of stock options . . . . . . . . . . . . . . . . . . . . . . . . . . . . (1.8) (0.2) (10.1)Change in operating assets and liabilities, net:
Restricted cash . . . . . . . . . . . . . . . . . . . . . . . . . . . . . . . . . . . . . . . . . . . . . . 4.0 0.5 3.6Total accounts and notes receivable . . . . . . . . . . . . . . . . . . . . . . . . . . . . . . (8.3) (44.8) (46.8)Inventories . . . . . . . . . . . . . . . . . . . . . . . . . . . . . . . . . . . . . . . . . . . . . . . . . (9.8) 15.7 (9.5)Current liabilities . . . . . . . . . . . . . . . . . . . . . . . . . . . . . . . . . . . . . . . . . . . . 10.7 10.0 21.4Other current and long-term assets and long-term liabilities . . . . . . . . . . . (15.8) (22.4) (10.6)
Net cash provided by operating activities . . . . . . . . . . . . . . . . . . . . . . . . . . . 153.4 156.8 157.1
CASH FLOWS FROM INVESTING ACTIVITIESAdditions to gaming operations equipment . . . . . . . . . . . . . . . . . . . . . . . . . . . . . . . . (90.6) (83.0) (65.9)Additions to property, plant and equipment . . . . . . . . . . . . . . . . . . . . . . . . . . . . . . . . (65.4) (81.4) (66.2)Payments to acquire or license intangible and other non-current assets . . . . . . . . . . (18.3) (13.4) (24.9)Acquisition of business, net of cash acquired . . . . . . . . . . . . . . . . . . . . . . . . . . . . . . — (16.4) —
Net cash used in investing activities . . . . . . . . . . . . . . . . . . . . . . . . . . . . . . . . (174.3) (194.2) (157.0)
CASH FLOWS FROM FINANCING ACTIVITIESProceeds from borrowings under revolving credit facility . . . . . . . . . . . . . . . . . . . . 83.0 60.0 —Repayments of borrowings under revolving credit facility . . . . . . . . . . . . . . . . . . . . (58.0) — —Cash received from exercise of stock options and employee stock purchase plan . . 5.8 3.4 14.4Additional consideration related to acquisitions . . . . . . . . . . . . . . . . . . . . . . . . . . . . (5.8) — —Purchase of treasury stock . . . . . . . . . . . . . . . . . . . . . . . . . . . . . . . . . . . . . . . . . . . . . (5.0) (50.4) (101.5)Tax benefits from exercise of stock options . . . . . . . . . . . . . . . . . . . . . . . . . . . . . . . 1.8 0.2 10.1Debt issuance costs . . . . . . . . . . . . . . . . . . . . . . . . . . . . . . . . . . . . . . . . . . . . . . . . . . . — (2.4) —
Net cash provided by (used in) financing activities . . . . . . . . . . . . . . . . . . . . 21.8 10.8 (77.0)
Effect of exchange rates on cash and cash equivalents . . . . . . . . . . . . . . . . . . . . . (3.3) (1.8) 0.9
DECREASE IN CASH AND CASH EQUIVALENTS . . . . . . . . . . . . . . . . . . . . . (2.4) (28.4) (76.0)CASH AND CASH EQUIVALENTS, beginning of year . . . . . . . . . . . . . . . . . . . 62.3 90.7 166.7
CASH AND CASH EQUIVALENTS, end of year . . . . . . . . . . . . . . . . . . . . . . . . $ 59.9 $ 62.3 $ 90.7
The accompanying Notes are an integral part of these Consolidated Financial Statements.
F-8
WMS INDUSTRIES INC.
NOTES TO CONSOLIDATED FINANCIAL STATEMENTS(amounts in millions of U.S. dollars and millions of shares, except per share amounts)
1. BUSINESS OVERVIEW
We are a leading supplier of innovative gaming entertainment products and services worldwide. We design,develop, manufacture, distribute and market casino games and gaming machines, video lottery terminals(“VLTs”), video gaming terminals (“VGTs”) and interactive gaming products and services. As regulated marketslegalize interactive gaming, we intend to enter and do business in those markets. We have production facilities inthe United States with development and distribution offices located in the United States, Argentina, Australia,Canada, China, India, Mexico, South Africa and Spain, an online gaming operations center in theUnited Kingdom and with our acquisition of Jadestone Group AB and Jadestone Networks (Malta) Ltd.(“Jadestone”) in late fiscal 2012, we have a development, operations center and administrative office in Sweden(see Note 4. “Business Acquisitions”). In addition, we also acquired Genesis Communications Inc., d/b/aPhantom EFX, LLC (“Phantom”) in fiscal 2012 which has a development, distribution and administrative officein Iowa (see Note 4. “Business Acquisitions”). In fiscal 2011 we closed and sold our Orion FinancementCompany B.V. (“Orion Gaming”) manufacturing facility in the Netherlands and determined that we would winddown the manufacturing of the Orion Gaming product lines over fiscal 2012. We will continue to provide supportfor spare parts related to Orion Gaming product lines for several years. Orion Gaming was immaterial to ourConsolidated Balance Sheets, Consolidated Statements of Income and Consolidated Statements of Cash Flows.In addition, the acquisition of Jadestone and Phantom were immaterial to our Consolidated Balance Sheets,Consolidated Statements of Income and Consolidated Statements of Cash Flows. In July 2012, we groupedtogether all of our worldwide online wagering, and social, casual and mobile gaming initiatives to focus on theirgrowth, development and operational execution and to optimize the benefits of interactive gaming initiatives forcasino operators and players. We expect to facilitate the continued expansion, investment, evolution andextension of WMS’ interactive gaming products and services and increase WMS’ focus on this rapidly evolvinggrowth area.
We generate revenues in two principal ways: product sales and gaming operations. In product sales, we sellto casinos and other gaming machine operators new and used gaming machines, VLTs and VGTs, conversionkits (including game, hardware or operating system conversions) and parts. In gaming operations, we license ourgame content and intellectual property to third parties for distribution; we earn revenues from operating an onlinegaming site, offering non-wagering social games on Facebook and on the Apple® iOs system for iPhone® andiPad® platforms, and the Android® platform, offering our games on third-party online gaming platforms that areinteroperable with our game servers and selling select WMS games that have been ported to operate on mobiledevices and PC’s; we earn revenues from placing our networked gaming system and applications, which is asystem that links groups of networked-enabled gaming machines to a server in the casino data center; and welease gaming machines, VLTs and VGTs to casinos and other licensed gaming machine operators underoperating leases where the lease payments are based upon: (1) a percentage of the casino’s net win, which is theearnings generated by casino patrons playing the gaming machine; (2) fixed daily fees or; (3) a percentage of theamount wagered (“coin-in”) or a combination of a fixed daily fee and a percentage of the coin-in. We categorizeour lease arrangements into five groups: wide-area progressive (“WAP”) participation gaming machines; local-area progressive (“LAP”) participation gaming machines; standalone participation gaming machines; casino-owned daily fee games; and gaming machine, VLT, VGTs and other leases. We refer to WAP, LAP andstandalone participation gaming machines as “participation games”.
On January 30, 2013, WMS entered into an Agreement and Plan of Merger (the “Merger Agreement”) withScientific Games, Scientific Games International, Inc., a wholly owned subsidiary of Scientific Games, andSG California Merger Sub, Inc., a wholly owned subsidiary of Scientific Games (“Merger Sub”). The MergerAgreement provides for the Merger of Merger Sub with and into WMS, with WMS surviving as a wholly ownedsubsidiary of Scientific Games (the “Merger”). The Merger Agreement was unanimously approved by our Boardof Directors. At the effective time of the Merger, each share of WMS’ common stock issued and outstanding
F-9
WMS INDUSTRIES INC.
NOTES TO CONSOLIDATED FINANCIAL STATEMENTS—(Continued)(amounts in millions of U.S. dollars and millions of shares, except per share amounts)
immediately prior to such time, other than our treasury shares, shares owned by Scientific Games or Merger Sub,and shares with respect to which appraisal rights are properly exercised and not withdrawn under Delaware law,will be automatically cancelled and converted into the right to receive $26.00 in cash, without interest, on theterms and subject to the conditions set forth in the Merger Agreement. None of our stockholders exercisedappraisal rights.
Consummation of the Merger is subject to customary conditions, which at this point include withoutlimitation (i) receipt and effectiveness of specified licenses, permits, and other approvals, issued by certaingovernmental authorities in relation to our business and (ii) other customary closing conditions. On March 11,2013, we received notice from the Federal Trade Commission of the early termination of the waiting periodapplicable to the consummation of the Merger under the Hart-Scott-Rodino Antitrust Improvements Act of 1974,as amended. In addition on May 10, 2013, WMS stockholders approved the Merger Agreement. At this time, weexpect to consummate the Merger in the fall of calendar 2013. The Merger Agreement contains certainlimitations on the operations of WMS during the period prior to the effective time of the Merger, including aprohibition on share repurchases by the Company. During the fiscal year ended June 30, 2013, we incurredapproximately $13.5 million of pre-tax charges, which are recorded in selling and administrative expenses,related to the process our Board of Directors utilized in the sale of the Company, plus completing the closingconditions and the integration efforts prior to the effective time of the pending Merger.
Following consummation of the Merger, there will be no public market for our common stock which willcease to be traded on the New York Stock Exchange (“NYSE”), and we will no longer be required to fileperiodic reports with the Securities and Exchange Commission (“SEC”).
A description of the Merger Agreement and the Merger is contained in our definitive proxy statement datedApril 8, 2013, which was first mailed to our stockholders on or about April 11, 2013.
We are engaged in one business segment. Consolidated operating results are reviewed by our CEO, who isour chief operating decision maker. Data for product sales and gaming operations is only maintained on aconsolidated basis as presented in our Consolidated Financial Statements, with no additional separate datamaintained for product sales and gaming operations (other than the revenues and costs of revenues informationincluded in our Consolidated Statements of Income and gaming operations equipment and related accumulateddepreciation included in our Consolidated Balance Sheets).
2. PRINCIPAL ACCOUNTING POLICIES
Basis of Presentation and Consolidation Policy
Our Consolidated Financial Statements have been prepared in accordance with U.S. generally acceptedaccounting principles and, pursuant to the rules and regulations of the SEC, include all adjustments necessary tofairly present our consolidated financial position, results of operations and cash flows for each period presented.Our Consolidated Financial Statements include the accounts of WMS Industries Inc. and its wholly ownedsubsidiaries (“WMS” or the “Company”). All significant intercompany accounts and transactions have beeneliminated.
Revenue Recognition
General
We evaluate the recognition of revenue based on the criteria set forth in the following accounting guidance:Financial Accounting Standards Board (“FASB”) Accounting Standards Codification (“ASC”) Topic 605,“Revenue Recognition” (“Topic 605”) and FASB Topic 985, “Software” (“Topic 985”), as updated by
F-10
WMS INDUSTRIES INC.
NOTES TO CONSOLIDATED FINANCIAL STATEMENTS—(Continued)(amounts in millions of U.S. dollars and millions of shares, except per share amounts)
Accounting Standards Update (“ASU”) No. 2009-13, “Multiple-Deliverable Revenue Arrangements”(“ASU 2009-13”) and ASU No. 2009-14 “Certain Revenue Arrangements That Include Software Elements”(“ASU 2009-14”).
ASU 2009-13 defines multiple-deliverable revenue arrangements and requires that the arrangementconsideration be allocated, at the inception of the arrangement, to all deliverables based on their relative sellingprice (the “relative selling price method”). When applying the relative selling price method, a hierarchy is usedfor estimating the selling price based first on vendor specific objective evidence (“VSOE”), then third-partyevidence (“TPE”) and finally management’s estimated selling price (“ESP”).
Our product sales revenues are recorded pursuant to ASU 2009-14, as the software and non-softwarecomponents of our gaming machines function together to deliver the product’s essential functionality.
Our revenue recognition policy for both product sales and gaming operations is to record revenue when allthe following criteria are met:
➣ Persuasive evidence of an agreement exists;
➣ The price to the customer is fixed or determinable;
➣ Delivery has occurred, title has been transferred and any acceptance terms have been fulfilled;
➣ No significant contractual obligations remain; and
➣ Collectability is reasonably assured.
We recognize revenue when all of the criteria listed above are met and do not recognize revenue if all of thecriteria are not met. We defer revenue for any undelivered units of accounting. Deliverables are divided intoseparate units of accounting if:
➣ Each item has value to the customer on a standalone basis; and
➣ Delivery of any undelivered item is considered probable and substantially in our control.
Product Sales
We earn product sales revenues from selling gaming machines, VLTs, VGTs, conversion kits, used gamingmachines and VLTs and spare parts. Revenues are reported net of incentive rebates, discounts, sales taxes andother taxes of a similar nature. In product sales, about half of our revenues are sold on credit terms of 30 to120 days and half are sold with extended payment terms for periods up to one year and beyond, and in somecases for terms up to three years, with interest at market rates in excess of our borrowing rate recognized forterms greater than twelve months and in some instances such longer-term obligations may be secured by therelated gaming machine, although the value of the gaming machines, if repossessed, may be less than theaccounts and notes receivable balance outstanding. For products sold under arrangements with extended paymentterms, judgment for revenue recognition is based on the revenue recognition policy stated above as well as theprobability of collection and historic collection experience.
We annually evaluate sales contracts with extended payment terms in excess of one year to determine ifthere is sufficient history to prove assurance of collectability and that pricing is fixed or determinable under theoriginal sales contract terms. In concluding that our historical payment history is based on sufficiently similararrangements, we consider the nature of our customers, our historic collection experience with the specificcustomer, the terms of the arrangement and the nature of the product being sold. In our evaluation as to whethersuch arrangement is probable of collection and contains prices that are fixed or determinable, we routinelyanalyze our domestic and foreign collection history on such arrangements and we evaluate the risk of
F-11
WMS INDUSTRIES INC.
NOTES TO CONSOLIDATED FINANCIAL STATEMENTS—(Continued)(amounts in millions of U.S. dollars and millions of shares, except per share amounts)
technological obsolescence of the underlying gaming machines. As a result of our investigation, we haveconcluded that our extended payment term arrangements with original periods of 36 months or less qualify forrevenue recognition at the time of sale because of our history of collecting all amounts due under sucharrangements, the lack of concessions given to collect amounts owed under such arrangements, including anyrefinancing arrangements, and the low risk of technological obsolescence, as our product life significantlyexceeds the payment terms. Our product sales contracts do not include specific performance, cancellation,termination or refund type provisions.
Our services for initial gaming machine installation, as well as standard warranty and technical support, arenot separately priced components of our sales arrangements and are included in our revenues when the associatedproduct sales revenue is recognized. Arrangements may also include spare parts or game content conversion kits,which enable customers to replace game content without purchasing a new gaming machine, or hardware oroperating system conversion kits, which include a new CPU board and operating system. Product salesarrangements do not include maintenance and product support fees beyond a standard warranty period. Therecognition of revenue from the sale of gaming machines occurs when delivery occurs, title and risk of loss havepassed to the customer and all other criteria described above have been satisfied. Labor costs for gaming machineinstalls are included in selling and administrative expenses and are incidental to the arrangement. We accrue forthe cost of installing gaming machines sold to our customers at the time of sale, based on the percent of suchgaming machines that we expect to install for our customers and we also provide a reserve for warranty costs.Our installation costs and warranty expense have not been material.
Gaming Operations
We earn gaming operations revenues from leasing gaming machines, VLTs, VGTs and other leasedequipment under operating leases, earn royalties from third parties under license agreements to use our gamecontent and intellectual property and, beginning in fiscal 2011, earn revenues from our online casino operationsand networked gaming operations, and beginning in fiscal 2012, earn revenues from offering social games onFacebook and in fiscal 2013 on the Apple iOs system for iPhone and iPad platforms, and the Android platform,offering our games on third-party online gaming platforms that are interoperable with our game servers andselling select WMS games that have been ported to operate on mobile devices and PC’s. We capitalize the coststo install gaming operations equipment. Labor costs associated with performing routine maintenance onparticipation gaming machines is expensed as incurred and included in selling and administrative expenses.Revenues are recognized as earned when collectability is reasonably assured.
For WAP leasing agreements, revenues are recognized for each gaming machine based upon a percentage ofcoin-in, which is the amount of coins, currency and credits wagered on the gaming machine, or a combination ofa fixed daily fee and a percentage of coin-in. WAP systems entail a configuration of numerous electronicallylinked gaming machines located in multiple casino properties within a single gaming jurisdiction, which areconnected to our central WAP computer system via a network of communications equipment. WAP gamingmachines differ from non-linked gaming machines in that they build a progressive jackpot with every wager untila player hits the top award winning combination. We pay WAP progressive jackpots won by casino patrons.Participating casinos pay a percentage of the coin-in from WAP gaming machines directly to us for servicesrelated to the design, assembly, installation, operation, maintenance and marketing of our WAP systems and toadminister the progressive jackpot funding.
A LAP system electronically links gaming machines within a single casino to a site controller which buildsa series of small progressive jackpots within that specific casino based on every wager made on the LAP system;whereas a WAP jackpot system links gaming machines in multiple casinos within a single gaming jurisdiction toa progressive jackpot. Each casino pays LAP progressive jackpots won by patrons of its casino.
F-12
WMS INDUSTRIES INC.
NOTES TO CONSOLIDATED FINANCIAL STATEMENTS—(Continued)(amounts in millions of U.S. dollars and millions of shares, except per share amounts)
We also offer participation gaming machines on a non-linked basis, which we call standalone games. Ourcasino customers are responsible for paying the jackpots won on standalone participation gaming machines.Standalone and LAP progressive participation lease payments are based on either a pre-determined percentage ofthe daily net win of each gaming machine or a fixed daily rental fee, or for several specific products, a percentageof the coin-in.
VLTs and VGTs may be operated as standalone units or may interface with central monitoring systemsoperated by government agencies. Our leased VLTs and VGTs typically are located in places where casino-stylegaming is not the only attraction, such as racetracks, bars and restaurants, and are usually operated by the lotteryorganization of the jurisdiction. Our lease revenues are based on a fixed percentage of daily net win of the VLTsand VGTs or a fixed daily lease rate. We exclude our leased VLTs and VGTs that utilize for-sale game themesfrom our installed base of participation gaming machines. Our customers are responsible for paying the jackpotswon on VLTs and VGTs.
In all cases, the lease payments entitle the customer to full use of the gaming machine and includesmaintenance, licensing of the game content software and connection to a linked progressive system, whereapplicable. In certain Class II central determination markets, we also charge a daily system connection fee for thecustomer to connect to a central determination system and/or back-office system that determines the outcome ofgaming machines. We do not consider these arrangements to have multiple revenue-generating activities as theservices offered are a comprehensive solution in exchange for a daily fee and all of the products and services aredelivered contemporaneously; therefore, revenue is recognized under general revenue recognition guidance as theproducts and services provide the customer with the right to use the gaming machines and software that isessential to the functionality of the gaming machine.
Some customers prefer to lease our standard for-sale gaming machines, VLTs and VGTs rather than topurchase them. In these cases, we lease the game and the gaming machine, VLT and VGT either for a fixed dailyfee or as a percentage of the net win of the gaming machine. We recognize the revenue from these operatingleases over the term of the lease. We do not include leased for-sale units in our installed base of participationgaming machines.
Under agreements with licensees who are generally located in geographic areas or operate in markets wherewe are not active, we license our games, artwork and other intellectual property. License royalties are recorded asearned when the licensee purchases or places the game or other intellectual property, and collectability isreasonably assured. We also earn revenues from operating an online casino for residents of the United Kingdom,offering a social game on Facebook and on the Apple iOs system for iPhone and iPad platforms, and the Androidplatform, offering our games on third-party online gaming platforms that are interoperable with our gameservers, selling select WMS games that have been ported to operate on mobile devices and PC’s and earnrevenues from networked gaming, all of which we include in our other gaming operations revenues. We accountfor the revenues we earn for our social games net of the processing fees charged by Facebook, Apple andAndroid.
Cash, Cash Equivalents and Restricted Cash
All highly liquid investments with maturities of three-months or less when purchased are considered cashequivalents. Restricted cash of $9.8 million and $13.8 million at June 30, 2013 and 2012, respectively, is requiredby gaming regulations to fund WAP jackpot payments. At June 30, 2013 and 2012, respectively, we ownedcertificates of deposit in Argentina that totaled approximately $1.7 million and zero.
F-13
WMS INDUSTRIES INC.
NOTES TO CONSOLIDATED FINANCIAL STATEMENTS—(Continued)(amounts in millions of U.S. dollars and millions of shares, except per share amounts)
As of June 30, 2013 and 2012, we maintained an aggregate cash balance of $13.5 million in non-interestbearing accounts with two of the banks in our $400 million amended and restated revolving credit agreement.
Accounts Receivable and Notes Receivable
We carry our accounts and notes receivable at face amounts less an allowance for doubtful accounts andimputed interest. For notes receivable, interest income is recognized ratably over the life of the note receivableand any related fees or costs to establish the notes are charged to selling and administrative expense as incurred,as they are considered insignificant. Actual or imputed interest, if any, is determined based on current marketrates at the time the note originated and is recorded in interest income and other income and expense, net, ratablyover the payment period. We impute interest income on all notes receivable with terms greater than one year thatdo not contain a stated interest rate. The interest rates on outstanding notes receivable ranged from 5.25% to10.0% at June 30, 2013 and 2012. Our policy is to generally recognize interest on notes receivable until the notereceivable is deemed non-performing, which we define as a note where payments have not been received within180 days of the agreed upon terms. The amount of our non-performing notes is immaterial at June 30, 2013 and2012.
The fair value of notes receivable is estimated by discounting expected future cash flows using currentinterest rates at which similar loans would be made to borrowers with similar credit ratings and remainingmaturities. At June 30, 2013 and 2012, the fair value of the accounts and notes receivable, net, approximated thecarrying value.
We file Uniform Commercial Code (UCC) liens on almost all domestic trade accounts and notes receivablewith terms greater than 90 days, which secures our interest in the gaming machines underlying the trade accountsand notes receivable until the receivable balance is fully paid, although the value of the gaming machines, ifrepossessed, may be less than the receivable balance outstanding. Most of our domestic customers are not ratedby the credit rating agencies. On international trade accounts and notes receivable, where possible we seekpayment deposits, collateral, pledge agreements, bills of exchange, foreign bank letters of credit or personalguarantees. However, the majority of our international trade accounts and notes receivable are not collateralized.Currently, we have not sold our accounts or notes receivable to third parties, so we do not have any off-balancesheet liabilities for factored receivables.
Our international expansion has necessitated us to provide, in certain jurisdictions, a greater amount offinancing terms of 18 to 36 months. In addition, as a result of the financial market crisis, which began in 2008and led to reduced consumer discretionary spending and a weakened global economic environment, beginning inthe March 2009 quarter we began and have continued to provide a greater amount of extended payment terms tocustomers. This expanded extended payment term program is expected to continue until the global economy andconsumer discretionary spending improves and customer demand for extended payment terms abates. Typically,these sales result in a higher selling price and, if financed over periods longer than one year, incur interest at ratesin excess of our borrowing rate, both of which provide added profitability to the sale.
We believe our competitors have also expanded their use of extended payment terms. In aggregate, webelieve that by expanding our use of extended payment terms, we have provided a competitive response in ourmarket and that our revenues have been favorably impacted. We are unable to estimate the impact of thisprogram on our revenues. Customers consider numerous factors in determining whether to issue a sales order tous including, among others, expected earnings performance of the gaming machines (which we believe is themost significant decision factor), selling price, the value provided for any trade-in of used gaming machines,parts and game conversion kit support and payment terms.
F-14
WMS INDUSTRIES INC.
NOTES TO CONSOLIDATED FINANCIAL STATEMENTS—(Continued)(amounts in millions of U.S. dollars and millions of shares, except per share amounts)
The expansion of our use of extended payment terms since 2009 has increased our current and long-termreceivable balances and reduced our cash provided by operating activities. Total accounts and notes receivable,net increased by $4.7 million from $405.1 million at June 30, 2012, to $409.8 million at June 30, 2013. Webelieve that the majority of this increase is due to the impact of providing an expanded amount of extendedpayment terms. The collection of these accounts and notes receivable in future periods will increase the amountof cash flow provided by operating activities and reduce our total accounts and notes receivable and increase ourcash balance.
Inventories
Inventories are valued at the lower of cost (determined by the first-in, first-out method) or market. We valueinventory quarterly based on estimates of potentially excess and obsolete inventories after considering historicaland forecasted demand and average selling prices. However, forecasts are subject to revisions, cancellations andrescheduling. Actual demand may differ from anticipated demand, and such differences may have a materialeffect on our Consolidated Financial Statements. Demand for parts inventory is subject to technologicalobsolescence. Inventories on hand in excess of forecasted demand are written down to net realizable value whensuch determination is made.
An active market exists mostly outside of North America for used gaming machines. When we receive agaming machine on trade-in, we estimate a carrying value for the gaming machine based on the condition of thegaming machine, as well as our experience in selling used gaming machines and such estimates could change dueto changes in demand in general for used gaming machines. We sell these trade-ins as-is or refurbish the gamingmachines before resale. We also sell participation gaming machines, after refurbishment, as used gamingmachines when we no longer need them in our gaming operations and we also harvest parts from Bluebirdparticipation gaming machines and trade in units to sell to customers as spare parts to support the estimated over50,000 of such gaming machines still in casinos today. We review our used gaming machine inventory forimpairment on a quarterly basis. Actual demand for new and used gaming machines may differ from anticipateddemand, and such differences may have a material effect on our Consolidated Financial Statements.
Gaming Operations Equipment and Property, Plant and Equipment
Gaming operations equipment and property, plant and equipment are stated at cost, net of accumulateddepreciation. Depreciation of these assets is computed on a straight-line basis over the following estimated usefullives:
Buildings and improvements . . . . . . . . . . . . . . . . . . . . 10 to 40 years
Leasehold improvements . . . . . . . . . . . . . . . . . . . . . . Lesser of term of lease or useful life
Machinery and equipment . . . . . . . . . . . . . . . . . . . . . . 3 to 10 years
Gaming operations equipment . . . . . . . . . . . . . . . . . . 1 to 5 years
Furniture and fixtures . . . . . . . . . . . . . . . . . . . . . . . . . 10 years
Capitalized internal use software costs . . . . . . . . . . . . 3 to 7 years
Significant replacements and improvements are capitalized. Other maintenance and repairs are expensed.
As our gaming operations equipment can be relocated from one customer to another customer, we reviewthe carrying value of gaming operations equipment for impairment by type of equipment (for base gaming
F-15
WMS INDUSTRIES INC.
NOTES TO CONSOLIDATED FINANCIAL STATEMENTS—(Continued)(amounts in millions of U.S. dollars and millions of shares, except per share amounts)
machines each of: Legacy, Bluebird mechanical reel, Bluebird video, Bluebird slant, Bluebird2 mechanical reel,Bluebird2 video, Bluebird2 widescreen, Bluebird xD mechanical reel, Bluebird xD video and Gamefield xD; fortop-boxes by form factor; for signage by form factor; and other equipment by category) when events or changesin circumstances indicate that the carrying value of any of these asset groups may not be recoverable. Animpairment loss would be recognized when the present value of estimated directly related future cash flowsexpected to result from the use of the gaming operations equipment and its eventual disposition is less than itscarrying value.
We review the carrying value of property, plant and equipment by office location and functional category,when events or changes in circumstances indicate that the carrying value of any of these asset groups may not berecoverable. An impairment loss would be recognized when the present value of estimated directly related futurecash flows expected to result from the use of the property, plant and equipment and its eventual disposition is lessthan its carrying value.
We account for costs incurred to develop computer software for internal use in accordance with FASBSubtopic 350-40 “Internal Use Software” of Topic 350, “Intangibles-Goodwill and Other (“Topic 350”).”Consequently, any costs incurred during preliminary project stages are expensed; costs incurred during theapplication development stages are capitalized and costs incurred during the post-implementation/operationstages are expensed. Once the software is placed in operation, we depreciate the capitalized asset cost over itsuseful life, which can be up to 7 years for software related to our Oracle ERP system. The net book value ofcapitalized internal use software costs placed in service was $6.5 million and $12.9 million as of June 30, 2013and 2012, respectively, which are included in capitalized internal use software costs in property, plant andequipment, plus we had an additional $40.9 million and $28.3 million as of June 30, 2013 and 2012, respectively,of capitalized costs incurred to re-implement the Oracle ERP system to the latest version of the software, whichare also included in capitalized internal use software costs after the system was placed in service in August 2012.
Intangible Assets
In accordance with Topic 350, we classify intangible assets into two categories: (1) intangible assets withfinite lives subject to amortization and (2) goodwill. We review the carrying value of our intangible assets withfinite lives individually when events or changes in circumstances indicate that the carrying value of an asset maynot be recoverable. An impairment loss would be recognized when the present value of estimated directly relatedfuture cash flows expected to result from the use of the finite-lived intangible asset and its eventual disposition isless than its carrying value.
We determine the useful lives of our identifiable finite-lived intangible assets after considering the specificfacts and circumstances related to each intangible asset. Factors we consider when determining useful livesinclude the contractual term of any agreement, the history of the asset, our long-term strategy for the use of theasset, any laws or other local regulations which could impact the useful life of the asset and other economicfactors, including competition and specific market conditions. Intangible assets that are deemed to have finitelives are amortized over the greater of the units of production methodology or on a straight-line basis. Most ofour intangible assets are amortized on a straight-line basis over their useful lives. See Note 9. “IntangibleAssets.”
We capitalize as identifiable finite-lived intangible assets advances for royalty and licensing fees made inconnection with licensing agreements we have for our use of third-party brands, intellectual property andtechnologies. When the products using the licensed intellectual property or technology begin to generate revenue,we begin expensing the amount advanced. In cases where the advance represents a paid up license, the advance is
F-16
WMS INDUSTRIES INC.
NOTES TO CONSOLIDATED FINANCIAL STATEMENTS—(Continued)(amounts in millions of U.S. dollars and millions of shares, except per share amounts)
expensed based on the estimated life of the asset. In cases where the license agreement provides for a royalty tobe earned by the licensor for each gaming machine sold or placed on a lease, the advance is expensed based onthe royalty rates provided in the license agreement. In both cases the amortization of the advances is included incost of product sales if directly related to product sale revenues, or cost of gaming operations if directly related togaming operations revenues. To the extent we determine that the products developed would not fully recover theamounts capitalized and future minimum commitments in the license agreement, we will record an immediatecharge in our Consolidated Statements of Income to write-down the book value of any asset recorded torecoverable value at the time of such determination and accrue for the shortfall between the intangible asset valueplus remaining commitments and the actual amount estimated to be earned.
We do not amortize goodwill. We evaluate goodwill for impairment annually or more frequently when anevent occurs or circumstances change that indicates the carrying value may not be recoverable. We evaluate therecoverability of goodwill using a two-step impairment test. In the first step, the fair value of each of our tworeporting units are compared to its book value including goodwill. If the fair value of the reporting units are inexcess of its book value, the related goodwill is not impaired and no further analysis is necessary. If the fair valueof the reporting units are less than its book value, there is an indication of potential impairment and a second stepis performed. When required, the second step of testing involves calculating the implied fair value of goodwillfor the reporting units. The implied fair value of goodwill is determined in the same manner as goodwillrecognized in a business combination, which is the excess of the fair value of the reporting unit determined instep one over the fair value of its net assets and identifiable intangible assets as if the reporting unit had beenacquired. If the carrying value of the reporting unit’s goodwill exceeds the implied fair value of that goodwill, animpairment loss is recognized in an amount equal to that excess.
Costs for Computer Software Utilized in Products Sold or Leased
We purchase, license and incur costs of computer software, which will be utilized in the products we sell orlease. Such costs are capitalized under FASB Topic 985, “Accounting for the Costs of Computer Software to beSold, Leased or Otherwise Marketed” (“Topic 985”). According to Topic 985, costs incurred in creatingcomputer software are charged to expense when incurred as research and development until technologicalfeasibility has been established after which such costs are then capitalized up to the date the computer software isavailable for general release to customers. Generally, the computer software we develop reaches technologicalfeasibility when a working model of the computer software is available. Computer software that we purchase orlicense for use in our products generally has been commercialized in our industry or other industries and has metthe technological feasibility criteria prior to our purchase or license and, therefore, we capitalize the paymentsmade for such purchase or license. Annual amortization of capitalized computer software costs is recorded on aproduct by product basis at the greater of the amount computed using (a) the ratio that current gross revenues fora product bear to the total of past and anticipated future gross revenues for that product or (b) the straight-linemethod over the remaining estimated economic life.
For our game themes, we have determined that such products reach technological feasibility when internaltesting is complete and the product is ready to be submitted to the gaming regulators for approval. We incurregulatory approval costs for our game themes after technological feasibility is achieved which we capitalize.Capitalized regulatory approval costs, net were $17.5 million and $14.9 million as of June 30, 2013 and 2012,respectively, which are included in other non-current assets. Amortization expense for previously capitalizedregulatory approval costs totaled $8.3 million, $8.6 million and $7.9 million in fiscal 2013, 2012 and 2011,respectively. Regulatory approval costs related to projects that are discontinued are expensed when thedetermination to discontinue is made.
F-17
WMS INDUSTRIES INC.
NOTES TO CONSOLIDATED FINANCIAL STATEMENTS—(Continued)(amounts in millions of U.S. dollars and millions of shares, except per share amounts)
Cash Generated from Sales of Used Gaming Machines
Cash generated from the remanufacture and sale of used gaming machines, including cash generated fromthe remanufacture and sale of used gaming operations machines, is included in our Consolidated Statements ofCash Flows in cash flow provided by operating activities for the periods in which such sales occur and have notbeen material in fiscal 2013, 2012 and 2011.
Cost of Product Sales, Cost of Gaming Operations and Selling and Administrative Expenses
Cost of product sales consists primarily of raw materials, labor and manufacturing overhead. The cost ofproduct sales also includes directly related licensing and royalty charges, inbound and outbound freight charges,purchasing and receiving costs, inspection costs and internal transfer costs.
Cost of gaming operations consists primarily of WAP jackpot expenses, directly related licensing androyalty charges, telephone costs, gaming operations taxes and fees and parts.
Selling and administrative expenses consist primarily of sales, marketing, distribution, installation andcorporate support functions such as administration, information technology, legal, regulatory compliance, humanresources and finance. The costs of distribution were $22.6 million, $24.1 million and $24.7 million for fiscal2013, 2012 and 2011, respectively.
WAP Jackpot Liabilities and Expenses
WAP jackpots are payable either immediately in the case of instant pay progressive jackpots or, for non-instant pay jackpots, at the jackpot winner’s choice, to receive the jackpot paid over 20 annual installments or asingle lump sum payment for the amount of the jackpot, discounted to present value at applicable interest rates,and, in our experience, substantially all winners elect the lump sum option. Prior to July 1, 2011, we recorded aWAP jackpot liability based on the actual volume of coin-in or gaming machine play plus the initial progressivemeter liability (“base jackpot”) on each WAP system in each jurisdiction, discounted to net present value fornon-instant pay jackpots, and we deferred jackpot expense for the base jackpot liability on each WAP linkedsystem, which was subsequently expensed as jackpot expense in cost of gaming operations based on thetheoretical coin-in, or gaming machine play, to win the jackpot liability. The FASB issued ASU No. 2010-16,“Accruals for Casino Jackpot Liabilities,” (“ASU 2010-16”), effective July 1, 2011, which we changed ouraccounting to not record any expense for the base jackpot liability for our progressive jackpots on our WAPgaming machines until the progressive jackpot liability is won by the casino patron. In adopting this accountingstandard effective July 1, 2011, we credited retained earnings with $0.8 million, net of related deferred incometaxes for deferred jackpot liability expense recorded in other current liabilities in our Consolidated BalanceSheets at June 30, 2011.
Research and Development Costs
We account for research and development costs in accordance with FASB Topic 730, “Accounting forResearch and Development Costs” (“Topic 730”). Accordingly, costs associated with product development areexpensed as incurred and included in research and development in our Consolidated Statements of Income.
Advertising Expense
The cost of advertising is charged to expense as incurred. The cost of advertising for fiscal 2013 was$13.4 million compared to $3.0 million in fiscal 2012 and $2.7 million in fiscal 2011. The increase in fiscal 2013relates to costs incurred to support the growth in our interactive gaming products and services.
F-18
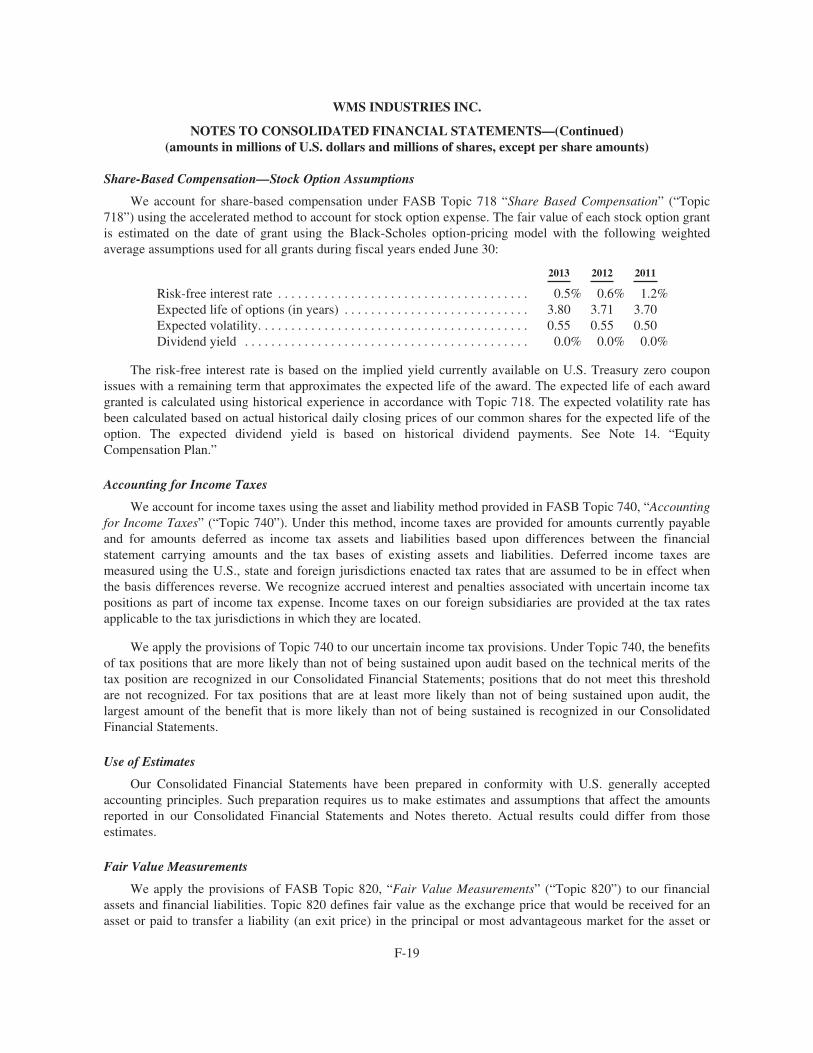
WMS INDUSTRIES INC.
NOTES TO CONSOLIDATED FINANCIAL STATEMENTS—(Continued)(amounts in millions of U.S. dollars and millions of shares, except per share amounts)
Share-Based Compensation—Stock Option Assumptions
We account for share-based compensation under FASB Topic 718 “Share Based Compensation” (“Topic718”) using the accelerated method to account for stock option expense. The fair value of each stock option grantis estimated on the date of grant using the Black-Scholes option-pricing model with the following weightedaverage assumptions used for all grants during fiscal years ended June 30:
2013 2012 2011
Risk-free interest rate . . . . . . . . . . . . . . . . . . . . . . . . . . . . . . . . . . . . . . 0.5% 0.6% 1.2%Expected life of options (in years) . . . . . . . . . . . . . . . . . . . . . . . . . . . . 3.80 3.71 3.70Expected volatility. . . . . . . . . . . . . . . . . . . . . . . . . . . . . . . . . . . . . . . . . 0.55 0.55 0.50Dividend yield . . . . . . . . . . . . . . . . . . . . . . . . . . . . . . . . . . . . . . . . . . . 0.0% 0.0% 0.0%
The risk-free interest rate is based on the implied yield currently available on U.S. Treasury zero couponissues with a remaining term that approximates the expected life of the award. The expected life of each awardgranted is calculated using historical experience in accordance with Topic 718. The expected volatility rate hasbeen calculated based on actual historical daily closing prices of our common shares for the expected life of theoption. The expected dividend yield is based on historical dividend payments. See Note 14. “EquityCompensation Plan.”
Accounting for Income Taxes
We account for income taxes using the asset and liability method provided in FASB Topic 740, “Accountingfor Income Taxes” (“Topic 740”). Under this method, income taxes are provided for amounts currently payableand for amounts deferred as income tax assets and liabilities based upon differences between the financialstatement carrying amounts and the tax bases of existing assets and liabilities. Deferred income taxes aremeasured using the U.S., state and foreign jurisdictions enacted tax rates that are assumed to be in effect whenthe basis differences reverse. We recognize accrued interest and penalties associated with uncertain income taxpositions as part of income tax expense. Income taxes on our foreign subsidiaries are provided at the tax ratesapplicable to the tax jurisdictions in which they are located.
We apply the provisions of Topic 740 to our uncertain income tax provisions. Under Topic 740, the benefitsof tax positions that are more likely than not of being sustained upon audit based on the technical merits of thetax position are recognized in our Consolidated Financial Statements; positions that do not meet this thresholdare not recognized. For tax positions that are at least more likely than not of being sustained upon audit, thelargest amount of the benefit that is more likely than not of being sustained is recognized in our ConsolidatedFinancial Statements.
Use of Estimates
Our Consolidated Financial Statements have been prepared in conformity with U.S. generally acceptedaccounting principles. Such preparation requires us to make estimates and assumptions that affect the amountsreported in our Consolidated Financial Statements and Notes thereto. Actual results could differ from thoseestimates.
Fair Value Measurements
We apply the provisions of FASB Topic 820, “Fair Value Measurements” (“Topic 820”) to our financialassets and financial liabilities. Topic 820 defines fair value as the exchange price that would be received for anasset or paid to transfer a liability (an exit price) in the principal or most advantageous market for the asset or
F-19
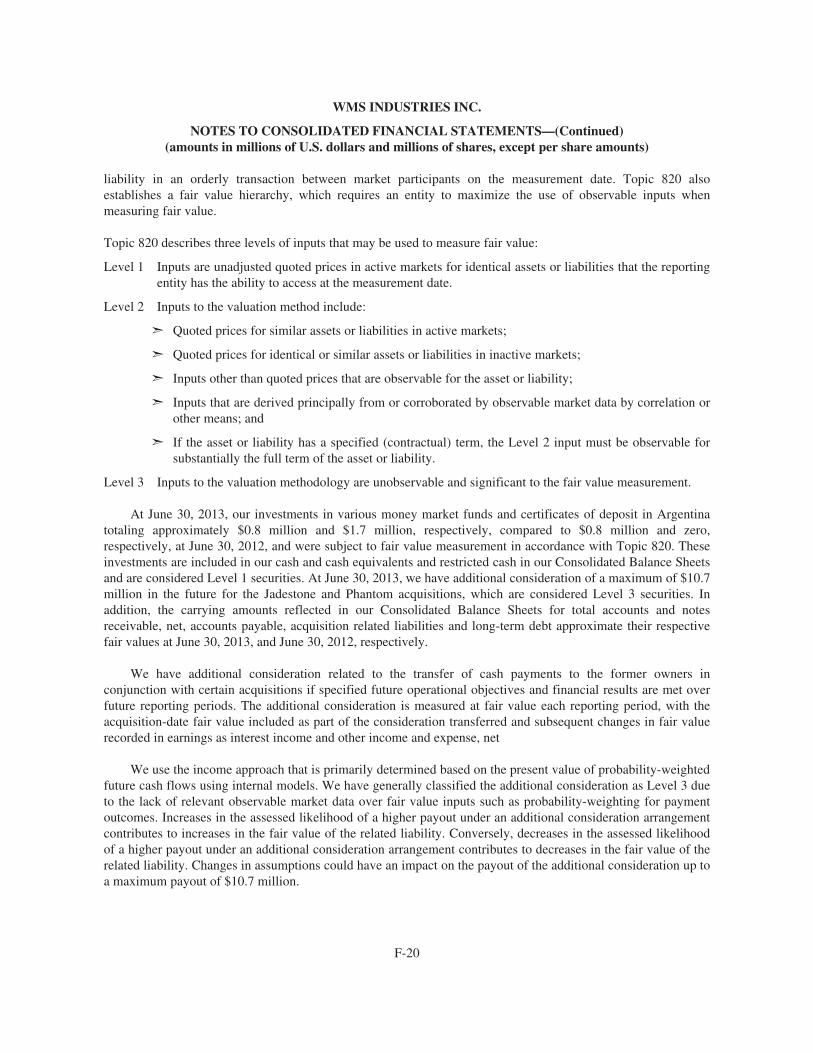
WMS INDUSTRIES INC.
NOTES TO CONSOLIDATED FINANCIAL STATEMENTS—(Continued)(amounts in millions of U.S. dollars and millions of shares, except per share amounts)
liability in an orderly transaction between market participants on the measurement date. Topic 820 alsoestablishes a fair value hierarchy, which requires an entity to maximize the use of observable inputs whenmeasuring fair value.
Topic 820 describes three levels of inputs that may be used to measure fair value:
Level 1 Inputs are unadjusted quoted prices in active markets for identical assets or liabilities that the reportingentity has the ability to access at the measurement date.
Level 2 Inputs to the valuation method include:
➣ Quoted prices for similar assets or liabilities in active markets;
➣ Quoted prices for identical or similar assets or liabilities in inactive markets;
➣ Inputs other than quoted prices that are observable for the asset or liability;
➣ Inputs that are derived principally from or corroborated by observable market data by correlation orother means; and
➣ If the asset or liability has a specified (contractual) term, the Level 2 input must be observable forsubstantially the full term of the asset or liability.
Level 3 Inputs to the valuation methodology are unobservable and significant to the fair value measurement.
At June 30, 2013, our investments in various money market funds and certificates of deposit in Argentinatotaling approximately $0.8 million and $1.7 million, respectively, compared to $0.8 million and zero,respectively, at June 30, 2012, and were subject to fair value measurement in accordance with Topic 820. Theseinvestments are included in our cash and cash equivalents and restricted cash in our Consolidated Balance Sheetsand are considered Level 1 securities. At June 30, 2013, we have additional consideration of a maximum of $10.7million in the future for the Jadestone and Phantom acquisitions, which are considered Level 3 securities. Inaddition, the carrying amounts reflected in our Consolidated Balance Sheets for total accounts and notesreceivable, net, accounts payable, acquisition related liabilities and long-term debt approximate their respectivefair values at June 30, 2013, and June 30, 2012, respectively.
We have additional consideration related to the transfer of cash payments to the former owners inconjunction with certain acquisitions if specified future operational objectives and financial results are met overfuture reporting periods. The additional consideration is measured at fair value each reporting period, with theacquisition-date fair value included as part of the consideration transferred and subsequent changes in fair valuerecorded in earnings as interest income and other income and expense, net
We use the income approach that is primarily determined based on the present value of probability-weightedfuture cash flows using internal models. We have generally classified the additional consideration as Level 3 dueto the lack of relevant observable market data over fair value inputs such as probability-weighting for paymentoutcomes. Increases in the assessed likelihood of a higher payout under an additional consideration arrangementcontributes to increases in the fair value of the related liability. Conversely, decreases in the assessed likelihoodof a higher payout under an additional consideration arrangement contributes to decreases in the fair value of therelated liability. Changes in assumptions could have an impact on the payout of the additional consideration up toa maximum payout of $10.7 million.
F-20
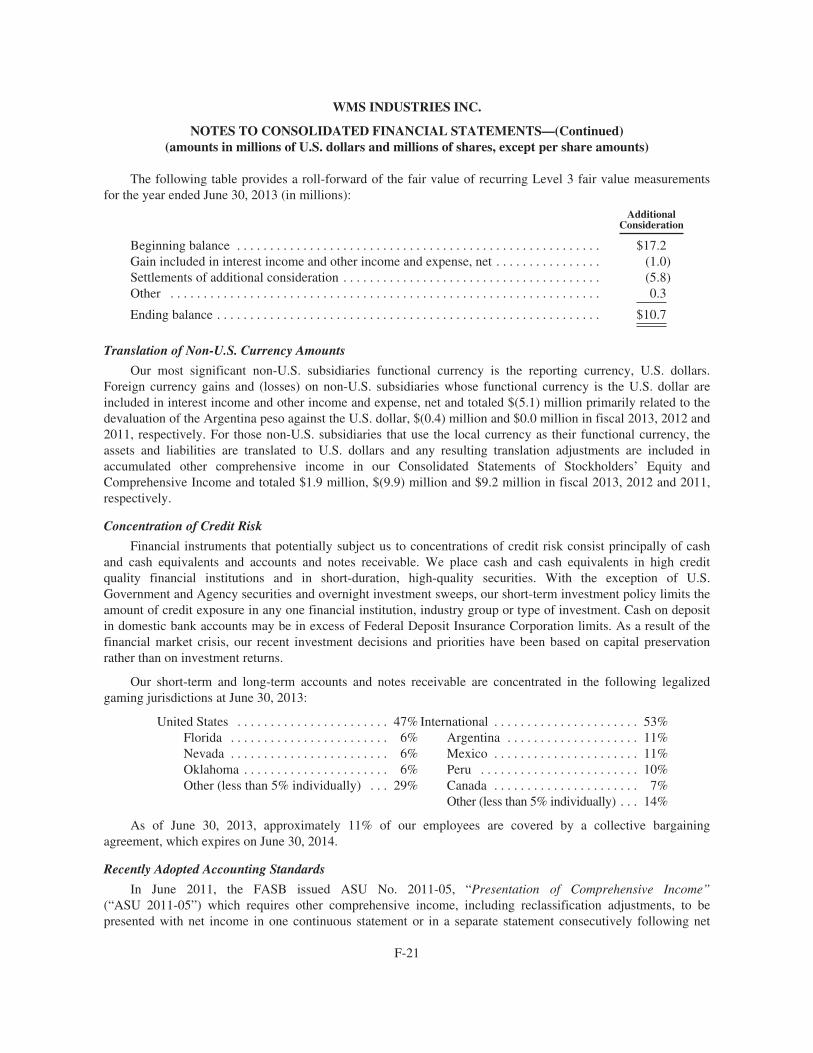
WMS INDUSTRIES INC.
NOTES TO CONSOLIDATED FINANCIAL STATEMENTS—(Continued)(amounts in millions of U.S. dollars and millions of shares, except per share amounts)
The following table provides a roll-forward of the fair value of recurring Level 3 fair value measurementsfor the year ended June 30, 2013 (in millions):
AdditionalConsideration
Beginning balance . . . . . . . . . . . . . . . . . . . . . . . . . . . . . . . . . . . . . . . . . . . . . . . . . . . . . . . $17.2Gain included in interest income and other income and expense, net . . . . . . . . . . . . . . . . (1.0)Settlements of additional consideration . . . . . . . . . . . . . . . . . . . . . . . . . . . . . . . . . . . . . . . (5.8)Other . . . . . . . . . . . . . . . . . . . . . . . . . . . . . . . . . . . . . . . . . . . . . . . . . . . . . . . . . . . . . . . . . 0.3
Ending balance . . . . . . . . . . . . . . . . . . . . . . . . . . . . . . . . . . . . . . . . . . . . . . . . . . . . . . . . . . $10.7
Translation of Non-U.S. Currency Amounts
Our most significant non-U.S. subsidiaries functional currency is the reporting currency, U.S. dollars.Foreign currency gains and (losses) on non-U.S. subsidiaries whose functional currency is the U.S. dollar areincluded in interest income and other income and expense, net and totaled $(5.1) million primarily related to thedevaluation of the Argentina peso against the U.S. dollar, $(0.4) million and $0.0 million in fiscal 2013, 2012 and2011, respectively. For those non-U.S. subsidiaries that use the local currency as their functional currency, theassets and liabilities are translated to U.S. dollars and any resulting translation adjustments are included inaccumulated other comprehensive income in our Consolidated Statements of Stockholders’ Equity andComprehensive Income and totaled $1.9 million, $(9.9) million and $9.2 million in fiscal 2013, 2012 and 2011,respectively.
Concentration of Credit Risk
Financial instruments that potentially subject us to concentrations of credit risk consist principally of cashand cash equivalents and accounts and notes receivable. We place cash and cash equivalents in high creditquality financial institutions and in short-duration, high-quality securities. With the exception of U.S.Government and Agency securities and overnight investment sweeps, our short-term investment policy limits theamount of credit exposure in any one financial institution, industry group or type of investment. Cash on depositin domestic bank accounts may be in excess of Federal Deposit Insurance Corporation limits. As a result of thefinancial market crisis, our recent investment decisions and priorities have been based on capital preservationrather than on investment returns.
Our short-term and long-term accounts and notes receivable are concentrated in the following legalizedgaming jurisdictions at June 30, 2013:
United States . . . . . . . . . . . . . . . . . . . . . . . 47% International . . . . . . . . . . . . . . . . . . . . . . 53%Florida . . . . . . . . . . . . . . . . . . . . . . . . 6% Argentina . . . . . . . . . . . . . . . . . . . . 11%Nevada . . . . . . . . . . . . . . . . . . . . . . . . 6% Mexico . . . . . . . . . . . . . . . . . . . . . . 11%Oklahoma . . . . . . . . . . . . . . . . . . . . . . 6% Peru . . . . . . . . . . . . . . . . . . . . . . . . 10%Other (less than 5% individually) . . . 29% Canada . . . . . . . . . . . . . . . . . . . . . . 7%
Other (less than 5% individually) . . . 14%
As of June 30, 2013, approximately 11% of our employees are covered by a collective bargainingagreement, which expires on June 30, 2014.
Recently Adopted Accounting Standards
In June 2011, the FASB issued ASU No. 2011-05, “Presentation of Comprehensive Income”(“ASU 2011-05”) which requires other comprehensive income, including reclassification adjustments, to bepresented with net income in one continuous statement or in a separate statement consecutively following net
F-21
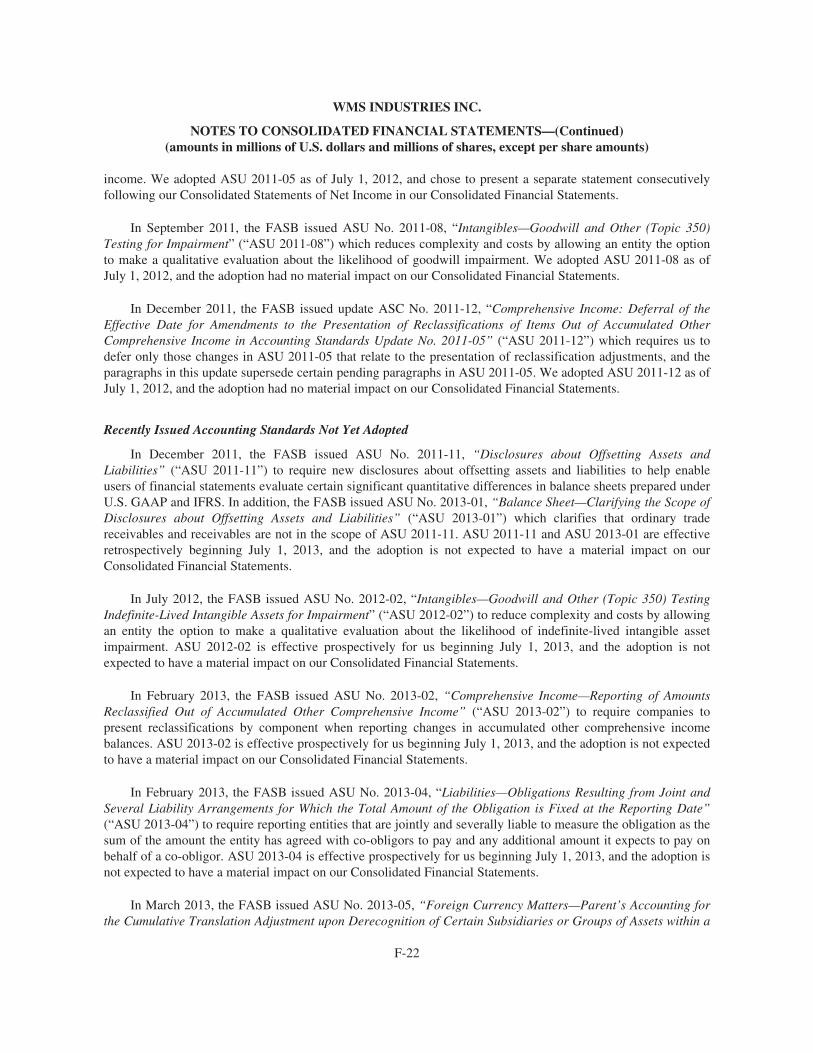
WMS INDUSTRIES INC.
NOTES TO CONSOLIDATED FINANCIAL STATEMENTS—(Continued)(amounts in millions of U.S. dollars and millions of shares, except per share amounts)
income. We adopted ASU 2011-05 as of July 1, 2012, and chose to present a separate statement consecutivelyfollowing our Consolidated Statements of Net Income in our Consolidated Financial Statements.
In September 2011, the FASB issued ASU No. 2011-08, “Intangibles—Goodwill and Other (Topic 350)Testing for Impairment” (“ASU 2011-08”) which reduces complexity and costs by allowing an entity the optionto make a qualitative evaluation about the likelihood of goodwill impairment. We adopted ASU 2011-08 as ofJuly 1, 2012, and the adoption had no material impact on our Consolidated Financial Statements.
In December 2011, the FASB issued update ASC No. 2011-12, “Comprehensive Income: Deferral of theEffective Date for Amendments to the Presentation of Reclassifications of Items Out of Accumulated OtherComprehensive Income in Accounting Standards Update No. 2011-05” (“ASU 2011-12”) which requires us todefer only those changes in ASU 2011-05 that relate to the presentation of reclassification adjustments, and theparagraphs in this update supersede certain pending paragraphs in ASU 2011-05. We adopted ASU 2011-12 as ofJuly 1, 2012, and the adoption had no material impact on our Consolidated Financial Statements.
Recently Issued Accounting Standards Not Yet Adopted
In December 2011, the FASB issued ASU No. 2011-11, “Disclosures about Offsetting Assets andLiabilities” (“ASU 2011-11”) to require new disclosures about offsetting assets and liabilities to help enableusers of financial statements evaluate certain significant quantitative differences in balance sheets prepared underU.S. GAAP and IFRS. In addition, the FASB issued ASU No. 2013-01, “Balance Sheet—Clarifying the Scope ofDisclosures about Offsetting Assets and Liabilities” (“ASU 2013-01”) which clarifies that ordinary tradereceivables and receivables are not in the scope of ASU 2011-11. ASU 2011-11 and ASU 2013-01 are effectiveretrospectively beginning July 1, 2013, and the adoption is not expected to have a material impact on ourConsolidated Financial Statements.
In July 2012, the FASB issued ASU No. 2012-02, “Intangibles—Goodwill and Other (Topic 350) TestingIndefinite-Lived Intangible Assets for Impairment” (“ASU 2012-02”) to reduce complexity and costs by allowingan entity the option to make a qualitative evaluation about the likelihood of indefinite-lived intangible assetimpairment. ASU 2012-02 is effective prospectively for us beginning July 1, 2013, and the adoption is notexpected to have a material impact on our Consolidated Financial Statements.
In February 2013, the FASB issued ASU No. 2013-02, “Comprehensive Income—Reporting of AmountsReclassified Out of Accumulated Other Comprehensive Income” (“ASU 2013-02”) to require companies topresent reclassifications by component when reporting changes in accumulated other comprehensive incomebalances. ASU 2013-02 is effective prospectively for us beginning July 1, 2013, and the adoption is not expectedto have a material impact on our Consolidated Financial Statements.
In February 2013, the FASB issued ASU No. 2013-04, “Liabilities—Obligations Resulting from Joint andSeveral Liability Arrangements for Which the Total Amount of the Obligation is Fixed at the Reporting Date”(“ASU 2013-04”) to require reporting entities that are jointly and severally liable to measure the obligation as thesum of the amount the entity has agreed with co-obligors to pay and any additional amount it expects to pay onbehalf of a co-obligor. ASU 2013-04 is effective prospectively for us beginning July 1, 2013, and the adoption isnot expected to have a material impact on our Consolidated Financial Statements.
In March 2013, the FASB issued ASU No. 2013-05, “Foreign Currency Matters—Parent’s Accounting forthe Cumulative Translation Adjustment upon Derecognition of Certain Subsidiaries or Groups of Assets within a
F-22
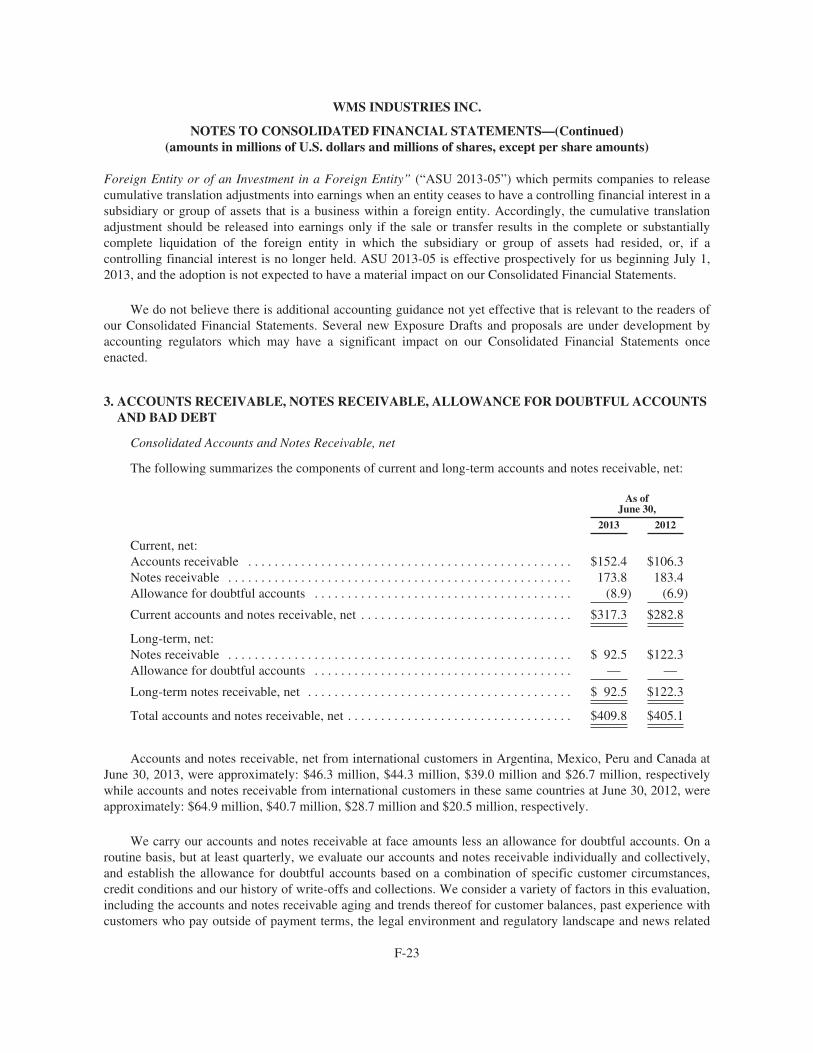
WMS INDUSTRIES INC.
NOTES TO CONSOLIDATED FINANCIAL STATEMENTS—(Continued)(amounts in millions of U.S. dollars and millions of shares, except per share amounts)
Foreign Entity or of an Investment in a Foreign Entity” (“ASU 2013-05”) which permits companies to releasecumulative translation adjustments into earnings when an entity ceases to have a controlling financial interest in asubsidiary or group of assets that is a business within a foreign entity. Accordingly, the cumulative translationadjustment should be released into earnings only if the sale or transfer results in the complete or substantiallycomplete liquidation of the foreign entity in which the subsidiary or group of assets had resided, or, if acontrolling financial interest is no longer held. ASU 2013-05 is effective prospectively for us beginning July 1,2013, and the adoption is not expected to have a material impact on our Consolidated Financial Statements.
We do not believe there is additional accounting guidance not yet effective that is relevant to the readers ofour Consolidated Financial Statements. Several new Exposure Drafts and proposals are under development byaccounting regulators which may have a significant impact on our Consolidated Financial Statements onceenacted.
3. ACCOUNTS RECEIVABLE, NOTES RECEIVABLE, ALLOWANCE FOR DOUBTFUL ACCOUNTSAND BAD DEBT
Consolidated Accounts and Notes Receivable, net
The following summarizes the components of current and long-term accounts and notes receivable, net:
As ofJune 30,
2013 2012
Current, net:Accounts receivable . . . . . . . . . . . . . . . . . . . . . . . . . . . . . . . . . . . . . . . . . . . . . . . . . $152.4 $106.3Notes receivable . . . . . . . . . . . . . . . . . . . . . . . . . . . . . . . . . . . . . . . . . . . . . . . . . . . . 173.8 183.4Allowance for doubtful accounts . . . . . . . . . . . . . . . . . . . . . . . . . . . . . . . . . . . . . . . (8.9) (6.9)
Current accounts and notes receivable, net . . . . . . . . . . . . . . . . . . . . . . . . . . . . . . . . $317.3 $282.8
Long-term, net:Notes receivable . . . . . . . . . . . . . . . . . . . . . . . . . . . . . . . . . . . . . . . . . . . . . . . . . . . . $ 92.5 $122.3Allowance for doubtful accounts . . . . . . . . . . . . . . . . . . . . . . . . . . . . . . . . . . . . . . . — —
Long-term notes receivable, net . . . . . . . . . . . . . . . . . . . . . . . . . . . . . . . . . . . . . . . . $ 92.5 $122.3
Total accounts and notes receivable, net . . . . . . . . . . . . . . . . . . . . . . . . . . . . . . . . . . $409.8 $405.1
Accounts and notes receivable, net from international customers in Argentina, Mexico, Peru and Canada atJune 30, 2013, were approximately: $46.3 million, $44.3 million, $39.0 million and $26.7 million, respectivelywhile accounts and notes receivable from international customers in these same countries at June 30, 2012, wereapproximately: $64.9 million, $40.7 million, $28.7 million and $20.5 million, respectively.
We carry our accounts and notes receivable at face amounts less an allowance for doubtful accounts. On aroutine basis, but at least quarterly, we evaluate our accounts and notes receivable individually and collectively,and establish the allowance for doubtful accounts based on a combination of specific customer circumstances,credit conditions and our history of write-offs and collections. We consider a variety of factors in this evaluation,including the accounts and notes receivable aging and trends thereof for customer balances, past experience withcustomers who pay outside of payment terms, the legal environment and regulatory landscape and news related
F-23
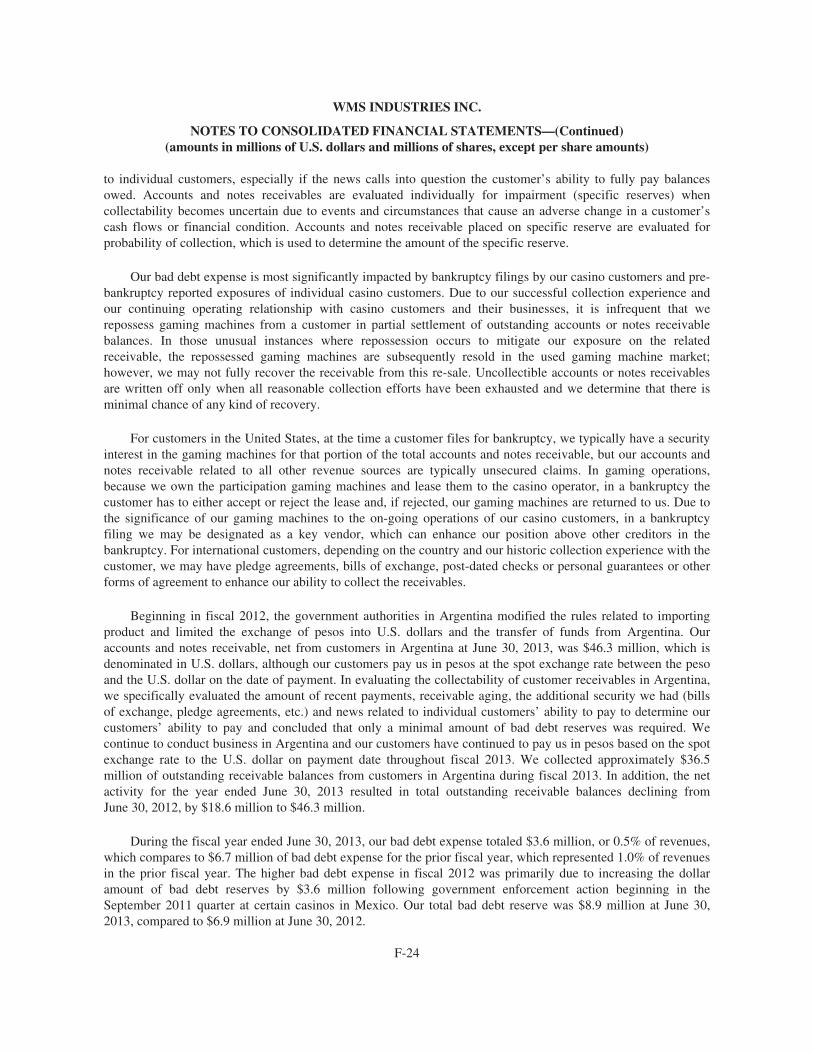
WMS INDUSTRIES INC.
NOTES TO CONSOLIDATED FINANCIAL STATEMENTS—(Continued)(amounts in millions of U.S. dollars and millions of shares, except per share amounts)
to individual customers, especially if the news calls into question the customer’s ability to fully pay balancesowed. Accounts and notes receivables are evaluated individually for impairment (specific reserves) whencollectability becomes uncertain due to events and circumstances that cause an adverse change in a customer’scash flows or financial condition. Accounts and notes receivable placed on specific reserve are evaluated forprobability of collection, which is used to determine the amount of the specific reserve.
Our bad debt expense is most significantly impacted by bankruptcy filings by our casino customers and pre-bankruptcy reported exposures of individual casino customers. Due to our successful collection experience andour continuing operating relationship with casino customers and their businesses, it is infrequent that werepossess gaming machines from a customer in partial settlement of outstanding accounts or notes receivablebalances. In those unusual instances where repossession occurs to mitigate our exposure on the relatedreceivable, the repossessed gaming machines are subsequently resold in the used gaming machine market;however, we may not fully recover the receivable from this re-sale. Uncollectible accounts or notes receivablesare written off only when all reasonable collection efforts have been exhausted and we determine that there isminimal chance of any kind of recovery.
For customers in the United States, at the time a customer files for bankruptcy, we typically have a securityinterest in the gaming machines for that portion of the total accounts and notes receivable, but our accounts andnotes receivable related to all other revenue sources are typically unsecured claims. In gaming operations,because we own the participation gaming machines and lease them to the casino operator, in a bankruptcy thecustomer has to either accept or reject the lease and, if rejected, our gaming machines are returned to us. Due tothe significance of our gaming machines to the on-going operations of our casino customers, in a bankruptcyfiling we may be designated as a key vendor, which can enhance our position above other creditors in thebankruptcy. For international customers, depending on the country and our historic collection experience with thecustomer, we may have pledge agreements, bills of exchange, post-dated checks or personal guarantees or otherforms of agreement to enhance our ability to collect the receivables.
Beginning in fiscal 2012, the government authorities in Argentina modified the rules related to importingproduct and limited the exchange of pesos into U.S. dollars and the transfer of funds from Argentina. Ouraccounts and notes receivable, net from customers in Argentina at June 30, 2013, was $46.3 million, which isdenominated in U.S. dollars, although our customers pay us in pesos at the spot exchange rate between the pesoand the U.S. dollar on the date of payment. In evaluating the collectability of customer receivables in Argentina,we specifically evaluated the amount of recent payments, receivable aging, the additional security we had (billsof exchange, pledge agreements, etc.) and news related to individual customers’ ability to pay to determine ourcustomers’ ability to pay and concluded that only a minimal amount of bad debt reserves was required. Wecontinue to conduct business in Argentina and our customers have continued to pay us in pesos based on the spotexchange rate to the U.S. dollar on payment date throughout fiscal 2013. We collected approximately $36.5million of outstanding receivable balances from customers in Argentina during fiscal 2013. In addition, the netactivity for the year ended June 30, 2013 resulted in total outstanding receivable balances declining fromJune 30, 2012, by $18.6 million to $46.3 million.
During the fiscal year ended June 30, 2013, our bad debt expense totaled $3.6 million, or 0.5% of revenues,which compares to $6.7 million of bad debt expense for the prior fiscal year, which represented 1.0% of revenuesin the prior fiscal year. The higher bad debt expense in fiscal 2012 was primarily due to increasing the dollaramount of bad debt reserves by $3.6 million following government enforcement action beginning in theSeptember 2011 quarter at certain casinos in Mexico. Our total bad debt reserve was $8.9 million at June 30,2013, compared to $6.9 million at June 30, 2012.
F-24
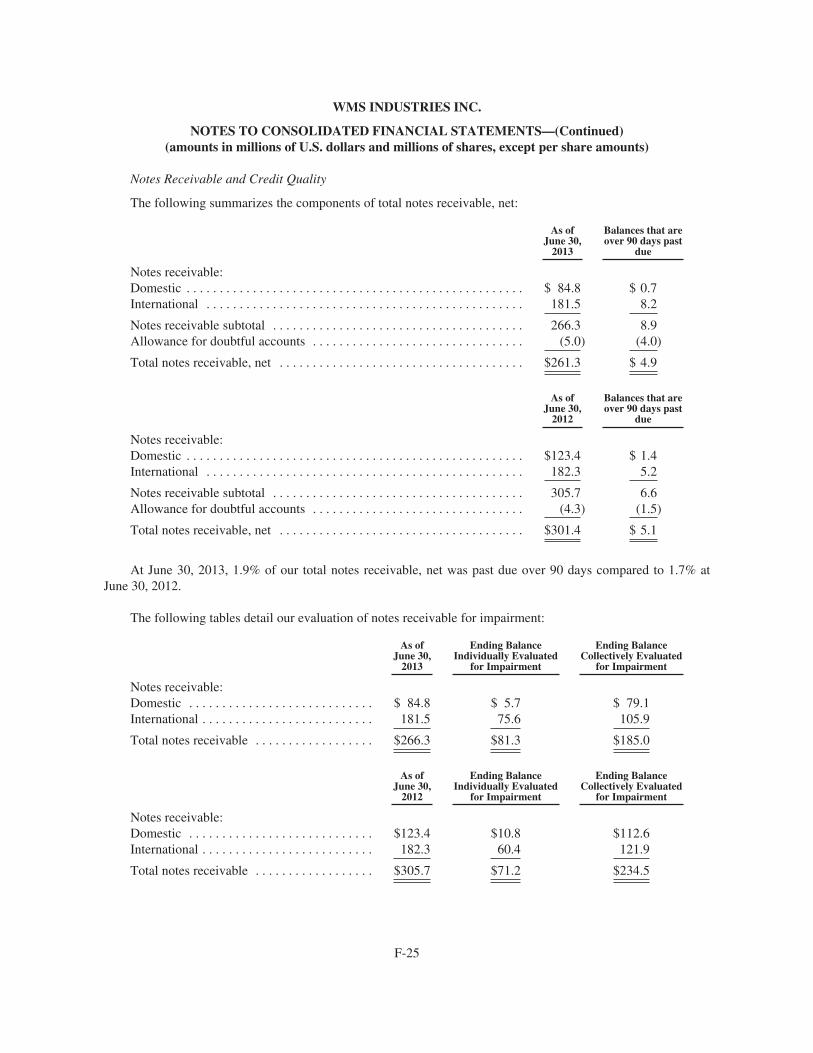
WMS INDUSTRIES INC.
NOTES TO CONSOLIDATED FINANCIAL STATEMENTS—(Continued)(amounts in millions of U.S. dollars and millions of shares, except per share amounts)
Notes Receivable and Credit Quality
The following summarizes the components of total notes receivable, net:
As ofJune 30,
2013
Balances that areover 90 days past
due
Notes receivable:Domestic . . . . . . . . . . . . . . . . . . . . . . . . . . . . . . . . . . . . . . . . . . . . . . . . . . . $ 84.8 $ 0.7International . . . . . . . . . . . . . . . . . . . . . . . . . . . . . . . . . . . . . . . . . . . . . . . . 181.5 8.2
Notes receivable subtotal . . . . . . . . . . . . . . . . . . . . . . . . . . . . . . . . . . . . . . 266.3 8.9Allowance for doubtful accounts . . . . . . . . . . . . . . . . . . . . . . . . . . . . . . . . (5.0) (4.0)
Total notes receivable, net . . . . . . . . . . . . . . . . . . . . . . . . . . . . . . . . . . . . . $261.3 $ 4.9
As ofJune 30,
2012
Balances that areover 90 days past
due
Notes receivable:Domestic . . . . . . . . . . . . . . . . . . . . . . . . . . . . . . . . . . . . . . . . . . . . . . . . . . . $123.4 $ 1.4International . . . . . . . . . . . . . . . . . . . . . . . . . . . . . . . . . . . . . . . . . . . . . . . . 182.3 5.2
Notes receivable subtotal . . . . . . . . . . . . . . . . . . . . . . . . . . . . . . . . . . . . . . 305.7 6.6Allowance for doubtful accounts . . . . . . . . . . . . . . . . . . . . . . . . . . . . . . . . (4.3) (1.5)
Total notes receivable, net . . . . . . . . . . . . . . . . . . . . . . . . . . . . . . . . . . . . . $301.4 $ 5.1
At June 30, 2013, 1.9% of our total notes receivable, net was past due over 90 days compared to 1.7% atJune 30, 2012.
The following tables detail our evaluation of notes receivable for impairment:
As ofJune 30,
2013
Ending BalanceIndividually Evaluated
for Impairment
Ending BalanceCollectively Evaluated
for Impairment
Notes receivable:Domestic . . . . . . . . . . . . . . . . . . . . . . . . . . . . $ 84.8 $ 5.7 $ 79.1International . . . . . . . . . . . . . . . . . . . . . . . . . . 181.5 75.6 105.9
Total notes receivable . . . . . . . . . . . . . . . . . . $266.3 $81.3 $185.0
As ofJune 30,
2012
Ending BalanceIndividually Evaluated
for Impairment
Ending BalanceCollectively Evaluated
for Impairment
Notes receivable:Domestic . . . . . . . . . . . . . . . . . . . . . . . . . . . . $123.4 $10.8 $112.6International . . . . . . . . . . . . . . . . . . . . . . . . . . 182.3 60.4 121.9
Total notes receivable . . . . . . . . . . . . . . . . . . $305.7 $71.2 $234.5
F-25
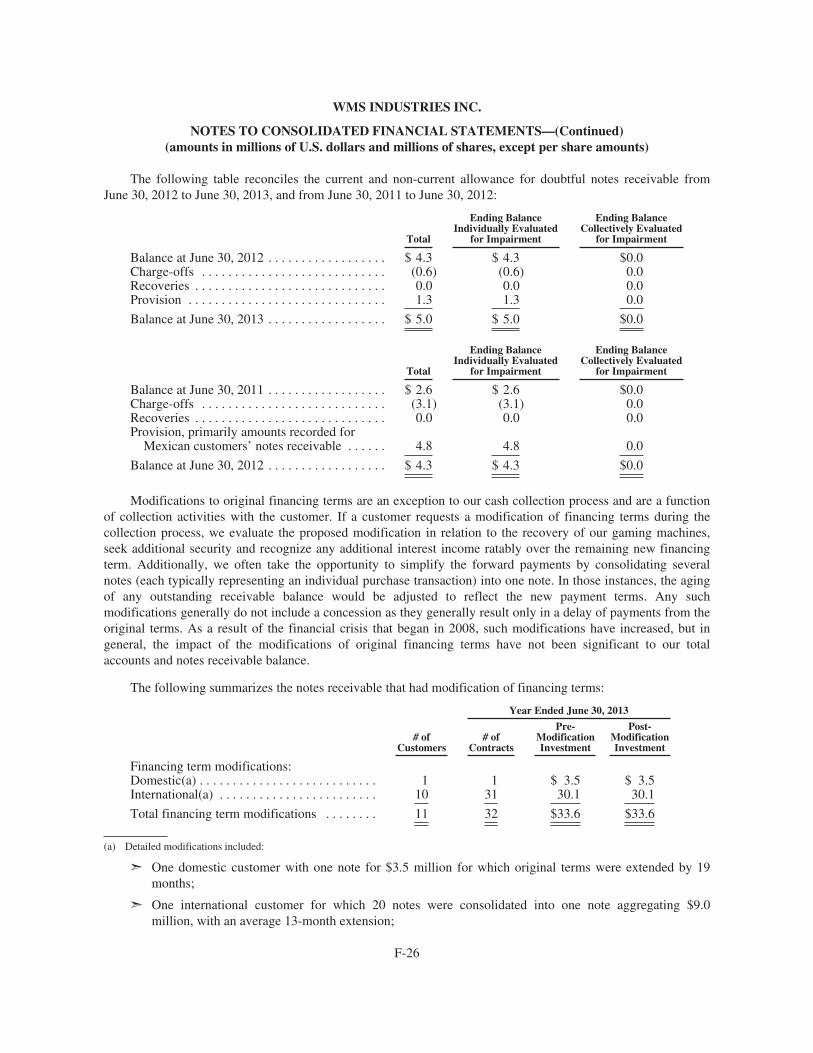
WMS INDUSTRIES INC.
NOTES TO CONSOLIDATED FINANCIAL STATEMENTS—(Continued)(amounts in millions of U.S. dollars and millions of shares, except per share amounts)
The following table reconciles the current and non-current allowance for doubtful notes receivable fromJune 30, 2012 to June 30, 2013, and from June 30, 2011 to June 30, 2012:
Total
Ending BalanceIndividually Evaluated
for Impairment
Ending BalanceCollectively Evaluated
for Impairment
Balance at June 30, 2012 . . . . . . . . . . . . . . . . . . $ 4.3 $ 4.3 $0.0Charge-offs . . . . . . . . . . . . . . . . . . . . . . . . . . . . (0.6) (0.6) 0.0Recoveries . . . . . . . . . . . . . . . . . . . . . . . . . . . . . 0.0 0.0 0.0Provision . . . . . . . . . . . . . . . . . . . . . . . . . . . . . . 1.3 1.3 0.0
Balance at June 30, 2013 . . . . . . . . . . . . . . . . . . $ 5.0 $ 5.0 $0.0
Total
Ending BalanceIndividually Evaluated
for Impairment
Ending BalanceCollectively Evaluated
for Impairment
Balance at June 30, 2011 . . . . . . . . . . . . . . . . . . $ 2.6 $ 2.6 $0.0Charge-offs . . . . . . . . . . . . . . . . . . . . . . . . . . . . (3.1) (3.1) 0.0Recoveries . . . . . . . . . . . . . . . . . . . . . . . . . . . . . 0.0 0.0 0.0Provision, primarily amounts recorded for
Mexican customers’ notes receivable . . . . . . 4.8 4.8 0.0
Balance at June 30, 2012 . . . . . . . . . . . . . . . . . . $ 4.3 $ 4.3 $0.0
Modifications to original financing terms are an exception to our cash collection process and are a functionof collection activities with the customer. If a customer requests a modification of financing terms during thecollection process, we evaluate the proposed modification in relation to the recovery of our gaming machines,seek additional security and recognize any additional interest income ratably over the remaining new financingterm. Additionally, we often take the opportunity to simplify the forward payments by consolidating severalnotes (each typically representing an individual purchase transaction) into one note. In those instances, the agingof any outstanding receivable balance would be adjusted to reflect the new payment terms. Any suchmodifications generally do not include a concession as they generally result only in a delay of payments from theoriginal terms. As a result of the financial crisis that began in 2008, such modifications have increased, but ingeneral, the impact of the modifications of original financing terms have not been significant to our totalaccounts and notes receivable balance.
The following summarizes the notes receivable that had modification of financing terms:
Year Ended June 30, 2013
# ofCustomers
# ofContracts
Pre-ModificationInvestment
Post-ModificationInvestment
Financing term modifications:Domestic(a) . . . . . . . . . . . . . . . . . . . . . . . . . . . 1 1 $ 3.5 $ 3.5International(a) . . . . . . . . . . . . . . . . . . . . . . . . 10 31 30.1 30.1
Total financing term modifications . . . . . . . . 11 32 $33.6 $33.6
(a) Detailed modifications included:
➣ One domestic customer with one note for $3.5 million for which original terms were extended by 19months;
➣ One international customer for which 20 notes were consolidated into one note aggregating $9.0million, with an average 13-month extension;
F-26
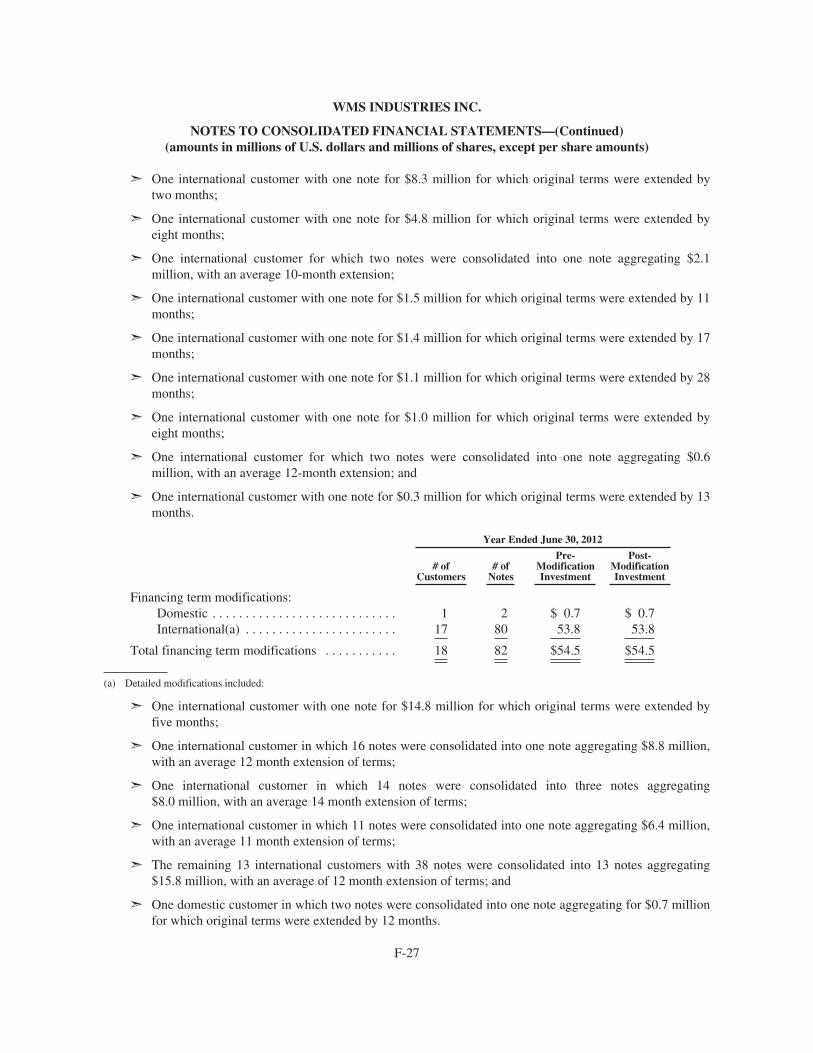
WMS INDUSTRIES INC.
NOTES TO CONSOLIDATED FINANCIAL STATEMENTS—(Continued)(amounts in millions of U.S. dollars and millions of shares, except per share amounts)
➣ One international customer with one note for $8.3 million for which original terms were extended bytwo months;
➣ One international customer with one note for $4.8 million for which original terms were extended byeight months;
➣ One international customer for which two notes were consolidated into one note aggregating $2.1million, with an average 10-month extension;
➣ One international customer with one note for $1.5 million for which original terms were extended by 11months;
➣ One international customer with one note for $1.4 million for which original terms were extended by 17months;
➣ One international customer with one note for $1.1 million for which original terms were extended by 28months;
➣ One international customer with one note for $1.0 million for which original terms were extended byeight months;
➣ One international customer for which two notes were consolidated into one note aggregating $0.6million, with an average 12-month extension; and
➣ One international customer with one note for $0.3 million for which original terms were extended by 13months.
Year Ended June 30, 2012
# ofCustomers
# ofNotes
Pre-ModificationInvestment
Post-ModificationInvestment
Financing term modifications:Domestic . . . . . . . . . . . . . . . . . . . . . . . . . . . . 1 2 $ 0.7 $ 0.7International(a) . . . . . . . . . . . . . . . . . . . . . . . 17 80 53.8 53.8
Total financing term modifications . . . . . . . . . . . 18 82 $54.5 $54.5
(a) Detailed modifications included:
➣ One international customer with one note for $14.8 million for which original terms were extended byfive months;
➣ One international customer in which 16 notes were consolidated into one note aggregating $8.8 million,with an average 12 month extension of terms;
➣ One international customer in which 14 notes were consolidated into three notes aggregating$8.0 million, with an average 14 month extension of terms;
➣ One international customer in which 11 notes were consolidated into one note aggregating $6.4 million,with an average 11 month extension of terms;
➣ The remaining 13 international customers with 38 notes were consolidated into 13 notes aggregating$15.8 million, with an average of 12 month extension of terms; and
➣ One domestic customer in which two notes were consolidated into one note aggregating for $0.7 millionfor which original terms were extended by 12 months.
F-27
WMS INDUSTRIES INC.
NOTES TO CONSOLIDATED FINANCIAL STATEMENTS—(Continued)(amounts in millions of U.S. dollars and millions of shares, except per share amounts)
4. BUSINESS ACQUISITIONS
On May 21, 2012, we completed the acquisition of 100% of the outstanding stock of privately heldJadestone, a Sweden-based company that develops, publishes and distributes online gaming content andentertainment for online gaming companies. The total cash consideration for Jadestone paid at closing, excludingacquisition costs, was approximately $2.6 million, and there is up to $6.7 million of additional considerationpayable over the next 2 years, of which $2.8 million was paid during the year ended June 30, 2013. The goodwillfor Jadestone is expected to be non-deductible for tax purposes
On June 15, 2012, we completed the acquisition of 100% of the outstanding stock of privately heldPhantom, an Iowa-based company that is a leading publisher and developer of interactive casino and slot-basedgames for social, casual and mobile gaming entertainment. The total cash consideration for Phantom paid atclosing, excluding acquisition costs, was approximately $13.8 million and there is up to $10.5 million ofadditional consideration payable over the next 3 years, of which $3.0 million was paid during the year endedJune 30, 2013. The goodwill for Phantom is expected to be deductible for tax purposes.
Pro forma financial information is not provided as these acquisitions are not material to our ConsolidatedFinancial Statements. We allocated the final aggregate purchase price, including the additional considerationacquisition liabilities, of $33.6 million to: tangible assets of $1.9 million; finite-lived intangibles assets of$7.2 million and goodwill of $27.5 million; and total liabilities of $20.2 million, including $17.2 million ofadditional consideration payable, of which $5.8 million was paid during the year ended June 30, 2013 and a $1.0million gain which was included in interest income and other income and expense, net in fiscal 2013; partiallyoffset by an increase in goodwill of $0.3 million in fiscal 2013 relating to other items.
5. IMPAIRMENT AND RESTRUCTURING CHARGES
Given the continuing lower levels of capital spending by casinos over the three years ended June 30, 2011and with no leading indicators suggesting that demand will increase in the near-term, we conducted a thoroughreview of our product plans and business strategies at the end of fiscal 2011 and beginning of fiscal 2012. Westill believe our long-term vision is intact but, as a result of this review, we refined our product plans andrestructured our organization. Specifically, we streamlined our product management and product developmentfunctions, simplified our product plans and further prioritized on-time commercialization of new game themes,products and portal applications.
Some of the product, operational and other decisions made in this review led to impairment andrestructuring, charges of $22.2 million pre-tax, or $0.24 per diluted share, recorded in fiscal 2011 comprised of$18.4 million, or $0.20 per diluted share, for pre-tax non-cash asset impairments (including $11.0 million forimpairment of technology licenses, $3.4 million for impairment of the Orion brand name, $2.4 million forimpairment charges to write-down the value of the Orion facility in the Netherlands to fair value upon closing ofthe facility, $1.4 million for impairment of receivables related to government action to close casinos inVenezuela and $0.2 million of other impairment charges), and $3.8 million pre-tax, or $0.04 per diluted share,for restructuring charges (primarily separation costs).
In addition, we implemented a broader restructuring in the September 2011 quarter and recorded a$9.7 million pre-tax charge, or $0.12 per diluted share, consisting of $5.9 million of separation-related chargesand $3.8 million of costs related to the decision to close two facilities. These restructuring actions were expectedto better direct resources and focus on near-term revenue opportunities and reduced our overall organizationalstaffing by approximately 10% to a level that better correlates with the existing industry operating environment,while maintaining our ability to create great games that engage current players and attract new players.
F-28
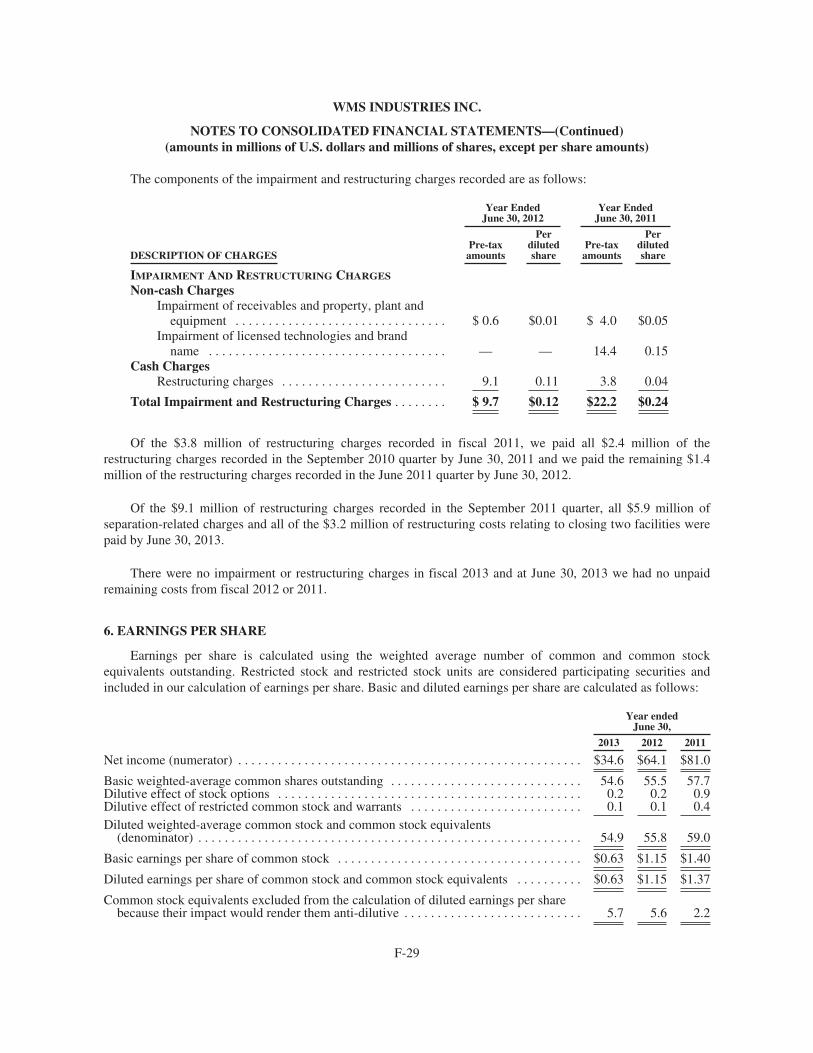
WMS INDUSTRIES INC.
NOTES TO CONSOLIDATED FINANCIAL STATEMENTS—(Continued)(amounts in millions of U.S. dollars and millions of shares, except per share amounts)
The components of the impairment and restructuring charges recorded are as follows:
Year EndedJune 30, 2012
Year EndedJune 30, 2011
DESCRIPTION OF CHARGESPre-taxamounts
Perdilutedshare
Pre-taxamounts
Perdilutedshare
IMPAIRMENT AND RESTRUCTURING CHARGES
Non-cash ChargesImpairment of receivables and property, plant and
equipment . . . . . . . . . . . . . . . . . . . . . . . . . . . . . . . . $ 0.6 $0.01 $ 4.0 $0.05Impairment of licensed technologies and brand
name . . . . . . . . . . . . . . . . . . . . . . . . . . . . . . . . . . . . — — 14.4 0.15Cash Charges
Restructuring charges . . . . . . . . . . . . . . . . . . . . . . . . . 9.1 0.11 3.8 0.04
Total Impairment and Restructuring Charges . . . . . . . . $ 9.7 $0.12 $22.2 $0.24
Of the $3.8 million of restructuring charges recorded in fiscal 2011, we paid all $2.4 million of therestructuring charges recorded in the September 2010 quarter by June 30, 2011 and we paid the remaining $1.4million of the restructuring charges recorded in the June 2011 quarter by June 30, 2012.
Of the $9.1 million of restructuring charges recorded in the September 2011 quarter, all $5.9 million ofseparation-related charges and all of the $3.2 million of restructuring costs relating to closing two facilities werepaid by June 30, 2013.
There were no impairment or restructuring charges in fiscal 2013 and at June 30, 2013 we had no unpaidremaining costs from fiscal 2012 or 2011.
6. EARNINGS PER SHARE
Earnings per share is calculated using the weighted average number of common and common stockequivalents outstanding. Restricted stock and restricted stock units are considered participating securities andincluded in our calculation of earnings per share. Basic and diluted earnings per share are calculated as follows:
Year endedJune 30,
2013 2012 2011
Net income (numerator) . . . . . . . . . . . . . . . . . . . . . . . . . . . . . . . . . . . . . . . . . . . . . . . . . . . . $34.6 $64.1 $81.0
Basic weighted-average common shares outstanding . . . . . . . . . . . . . . . . . . . . . . . . . . . . . 54.6 55.5 57.7Dilutive effect of stock options . . . . . . . . . . . . . . . . . . . . . . . . . . . . . . . . . . . . . . . . . . . . . . 0.2 0.2 0.9Dilutive effect of restricted common stock and warrants . . . . . . . . . . . . . . . . . . . . . . . . . . 0.1 0.1 0.4Diluted weighted-average common stock and common stock equivalents
(denominator) . . . . . . . . . . . . . . . . . . . . . . . . . . . . . . . . . . . . . . . . . . . . . . . . . . . . . . . . . . 54.9 55.8 59.0
Basic earnings per share of common stock . . . . . . . . . . . . . . . . . . . . . . . . . . . . . . . . . . . . . $0.63 $1.15 $1.40
Diluted earnings per share of common stock and common stock equivalents . . . . . . . . . . $0.63 $1.15 $1.37
Common stock equivalents excluded from the calculation of diluted earnings per sharebecause their impact would render them anti-dilutive . . . . . . . . . . . . . . . . . . . . . . . . . . . 5.7 5.6 2.2
F-29
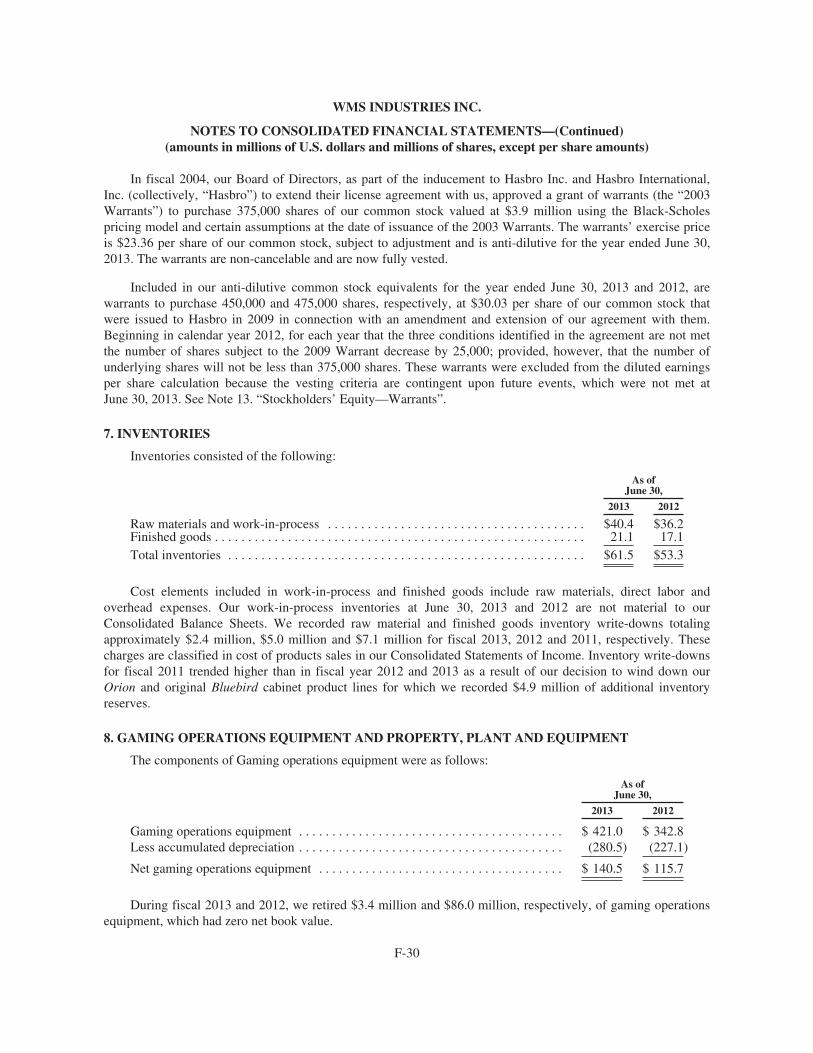
WMS INDUSTRIES INC.
NOTES TO CONSOLIDATED FINANCIAL STATEMENTS—(Continued)(amounts in millions of U.S. dollars and millions of shares, except per share amounts)
In fiscal 2004, our Board of Directors, as part of the inducement to Hasbro Inc. and Hasbro International,Inc. (collectively, “Hasbro”) to extend their license agreement with us, approved a grant of warrants (the “2003Warrants”) to purchase 375,000 shares of our common stock valued at $3.9 million using the Black-Scholespricing model and certain assumptions at the date of issuance of the 2003 Warrants. The warrants’ exercise priceis $23.36 per share of our common stock, subject to adjustment and is anti-dilutive for the year ended June 30,2013. The warrants are non-cancelable and are now fully vested.
Included in our anti-dilutive common stock equivalents for the year ended June 30, 2013 and 2012, arewarrants to purchase 450,000 and 475,000 shares, respectively, at $30.03 per share of our common stock thatwere issued to Hasbro in 2009 in connection with an amendment and extension of our agreement with them.Beginning in calendar year 2012, for each year that the three conditions identified in the agreement are not metthe number of shares subject to the 2009 Warrant decrease by 25,000; provided, however, that the number ofunderlying shares will not be less than 375,000 shares. These warrants were excluded from the diluted earningsper share calculation because the vesting criteria are contingent upon future events, which were not met atJune 30, 2013. See Note 13. “Stockholders’ Equity—Warrants”.
7. INVENTORIES
Inventories consisted of the following:
As ofJune 30,
2013 2012
Raw materials and work-in-process . . . . . . . . . . . . . . . . . . . . . . . . . . . . . . . . . . . . . . . $40.4 $36.2Finished goods . . . . . . . . . . . . . . . . . . . . . . . . . . . . . . . . . . . . . . . . . . . . . . . . . . . . . . . . 21.1 17.1Total inventories . . . . . . . . . . . . . . . . . . . . . . . . . . . . . . . . . . . . . . . . . . . . . . . . . . . . . . $61.5 $53.3
Cost elements included in work-in-process and finished goods include raw materials, direct labor andoverhead expenses. Our work-in-process inventories at June 30, 2013 and 2012 are not material to ourConsolidated Balance Sheets. We recorded raw material and finished goods inventory write-downs totalingapproximately $2.4 million, $5.0 million and $7.1 million for fiscal 2013, 2012 and 2011, respectively. Thesecharges are classified in cost of products sales in our Consolidated Statements of Income. Inventory write-downsfor fiscal 2011 trended higher than in fiscal year 2012 and 2013 as a result of our decision to wind down ourOrion and original Bluebird cabinet product lines for which we recorded $4.9 million of additional inventoryreserves.
8. GAMING OPERATIONS EQUIPMENT AND PROPERTY, PLANT AND EQUIPMENT
The components of Gaming operations equipment were as follows:
As ofJune 30,
2013 2012
Gaming operations equipment . . . . . . . . . . . . . . . . . . . . . . . . . . . . . . . . . . . . . . . . $ 421.0 $ 342.8Less accumulated depreciation . . . . . . . . . . . . . . . . . . . . . . . . . . . . . . . . . . . . . . . . (280.5) (227.1)
Net gaming operations equipment . . . . . . . . . . . . . . . . . . . . . . . . . . . . . . . . . . . . . $ 140.5 $ 115.7
During fiscal 2013 and 2012, we retired $3.4 million and $86.0 million, respectively, of gaming operationsequipment, which had zero net book value.
F-30
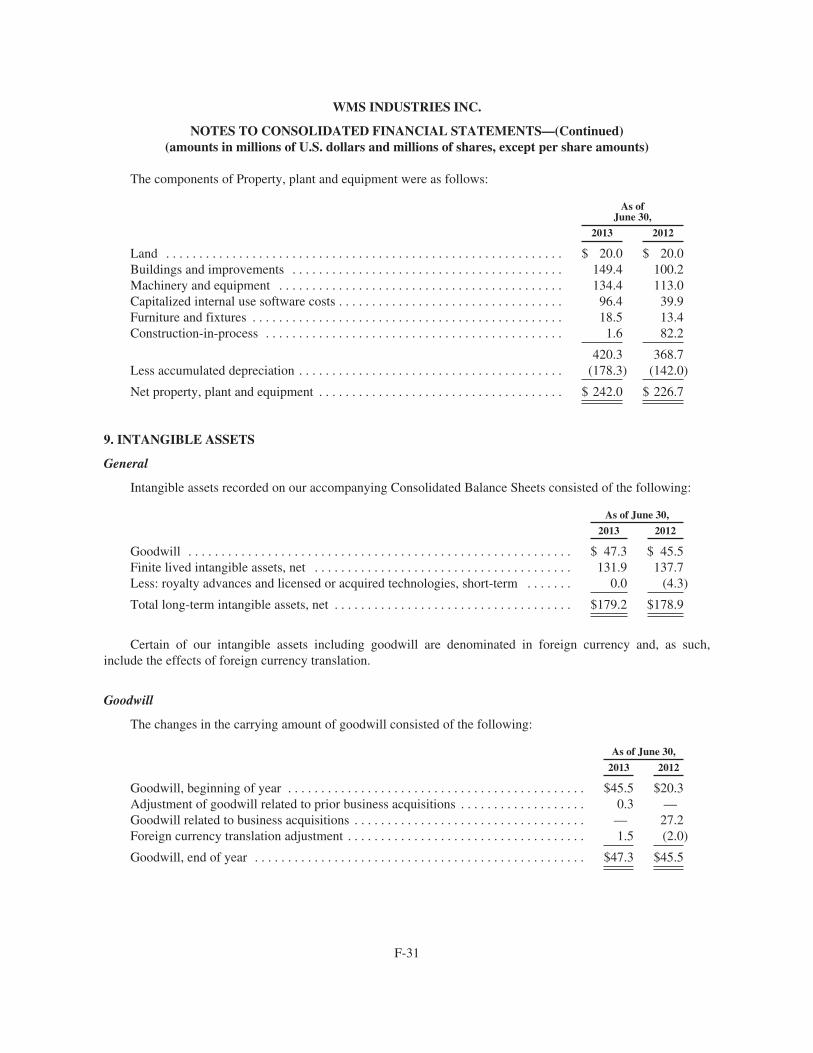
WMS INDUSTRIES INC.
NOTES TO CONSOLIDATED FINANCIAL STATEMENTS—(Continued)(amounts in millions of U.S. dollars and millions of shares, except per share amounts)
The components of Property, plant and equipment were as follows:
As ofJune 30,
2013 2012
Land . . . . . . . . . . . . . . . . . . . . . . . . . . . . . . . . . . . . . . . . . . . . . . . . . . . . . . . . . . . . $ 20.0 $ 20.0Buildings and improvements . . . . . . . . . . . . . . . . . . . . . . . . . . . . . . . . . . . . . . . . . 149.4 100.2Machinery and equipment . . . . . . . . . . . . . . . . . . . . . . . . . . . . . . . . . . . . . . . . . . . 134.4 113.0Capitalized internal use software costs . . . . . . . . . . . . . . . . . . . . . . . . . . . . . . . . . . 96.4 39.9Furniture and fixtures . . . . . . . . . . . . . . . . . . . . . . . . . . . . . . . . . . . . . . . . . . . . . . . 18.5 13.4Construction-in-process . . . . . . . . . . . . . . . . . . . . . . . . . . . . . . . . . . . . . . . . . . . . . 1.6 82.2
420.3 368.7Less accumulated depreciation . . . . . . . . . . . . . . . . . . . . . . . . . . . . . . . . . . . . . . . . (178.3) (142.0)
Net property, plant and equipment . . . . . . . . . . . . . . . . . . . . . . . . . . . . . . . . . . . . . $ 242.0 $ 226.7
9. INTANGIBLE ASSETS
General
Intangible assets recorded on our accompanying Consolidated Balance Sheets consisted of the following:
As of June 30,
2013 2012
Goodwill . . . . . . . . . . . . . . . . . . . . . . . . . . . . . . . . . . . . . . . . . . . . . . . . . . . . . . . . . . $ 47.3 $ 45.5Finite lived intangible assets, net . . . . . . . . . . . . . . . . . . . . . . . . . . . . . . . . . . . . . . . 131.9 137.7Less: royalty advances and licensed or acquired technologies, short-term . . . . . . . 0.0 (4.3)
Total long-term intangible assets, net . . . . . . . . . . . . . . . . . . . . . . . . . . . . . . . . . . . . $179.2 $178.9
Certain of our intangible assets including goodwill are denominated in foreign currency and, as such,include the effects of foreign currency translation.
Goodwill
The changes in the carrying amount of goodwill consisted of the following:
As of June 30,
2013 2012
Goodwill, beginning of year . . . . . . . . . . . . . . . . . . . . . . . . . . . . . . . . . . . . . . . . . . . . . $45.5 $20.3Adjustment of goodwill related to prior business acquisitions . . . . . . . . . . . . . . . . . . . 0.3 —Goodwill related to business acquisitions . . . . . . . . . . . . . . . . . . . . . . . . . . . . . . . . . . . — 27.2Foreign currency translation adjustment . . . . . . . . . . . . . . . . . . . . . . . . . . . . . . . . . . . . 1.5 (2.0)
Goodwill, end of year . . . . . . . . . . . . . . . . . . . . . . . . . . . . . . . . . . . . . . . . . . . . . . . . . . $47.3 $45.5
F-31
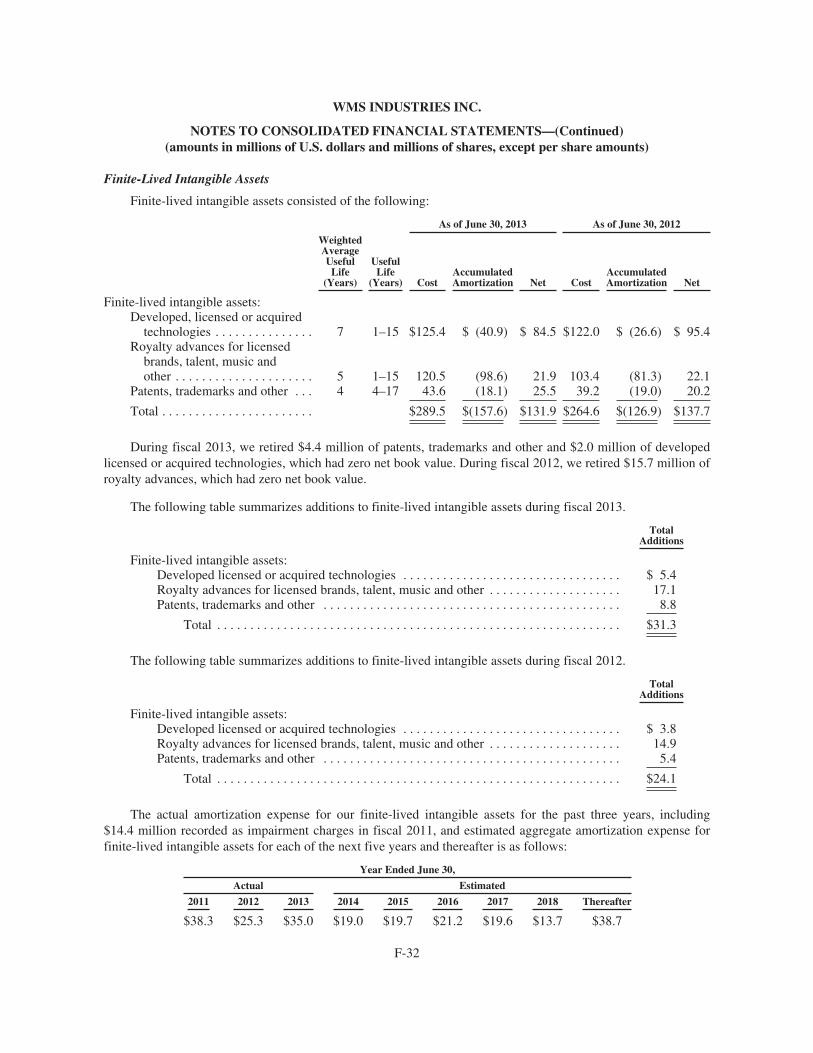
WMS INDUSTRIES INC.
NOTES TO CONSOLIDATED FINANCIAL STATEMENTS—(Continued)(amounts in millions of U.S. dollars and millions of shares, except per share amounts)
Finite-Lived Intangible Assets
Finite-lived intangible assets consisted of the following:
As of June 30, 2013 As of June 30, 2012
WeightedAverageUsefulLife
(Years)
UsefulLife
(Years) CostAccumulatedAmortization Net Cost
AccumulatedAmortization Net
Finite-lived intangible assets:Developed, licensed or acquired
technologies . . . . . . . . . . . . . . . 7 1–15 $125.4 $ (40.9) $ 84.5 $122.0 $ (26.6) $ 95.4Royalty advances for licensed
brands, talent, music andother . . . . . . . . . . . . . . . . . . . . . 5 1–15 120.5 (98.6) 21.9 103.4 (81.3) 22.1
Patents, trademarks and other . . . 4 4–17 43.6 (18.1) 25.5 39.2 (19.0) 20.2
Total . . . . . . . . . . . . . . . . . . . . . . . $289.5 $(157.6) $131.9 $264.6 $(126.9) $137.7
During fiscal 2013, we retired $4.4 million of patents, trademarks and other and $2.0 million of developedlicensed or acquired technologies, which had zero net book value. During fiscal 2012, we retired $15.7 million ofroyalty advances, which had zero net book value.
The following table summarizes additions to finite-lived intangible assets during fiscal 2013.
TotalAdditions
Finite-lived intangible assets:Developed licensed or acquired technologies . . . . . . . . . . . . . . . . . . . . . . . . . . . . . . . . . $ 5.4Royalty advances for licensed brands, talent, music and other . . . . . . . . . . . . . . . . . . . . 17.1Patents, trademarks and other . . . . . . . . . . . . . . . . . . . . . . . . . . . . . . . . . . . . . . . . . . . . . 8.8
Total . . . . . . . . . . . . . . . . . . . . . . . . . . . . . . . . . . . . . . . . . . . . . . . . . . . . . . . . . . . . . $31.3
The following table summarizes additions to finite-lived intangible assets during fiscal 2012.
TotalAdditions
Finite-lived intangible assets:Developed licensed or acquired technologies . . . . . . . . . . . . . . . . . . . . . . . . . . . . . . . . . $ 3.8Royalty advances for licensed brands, talent, music and other . . . . . . . . . . . . . . . . . . . . 14.9Patents, trademarks and other . . . . . . . . . . . . . . . . . . . . . . . . . . . . . . . . . . . . . . . . . . . . . 5.4
Total . . . . . . . . . . . . . . . . . . . . . . . . . . . . . . . . . . . . . . . . . . . . . . . . . . . . . . . . . . . . . $24.1
The actual amortization expense for our finite-lived intangible assets for the past three years, including$14.4 million recorded as impairment charges in fiscal 2011, and estimated aggregate amortization expense forfinite-lived intangible assets for each of the next five years and thereafter is as follows:
Year Ended June 30,
Actual Estimated
2011 2012 2013 2014 2015 2016 2017 2018 Thereafter
$38.3 $25.3 $35.0 $19.0 $19.7 $21.2 $19.6 $13.7 $38.7
F-32
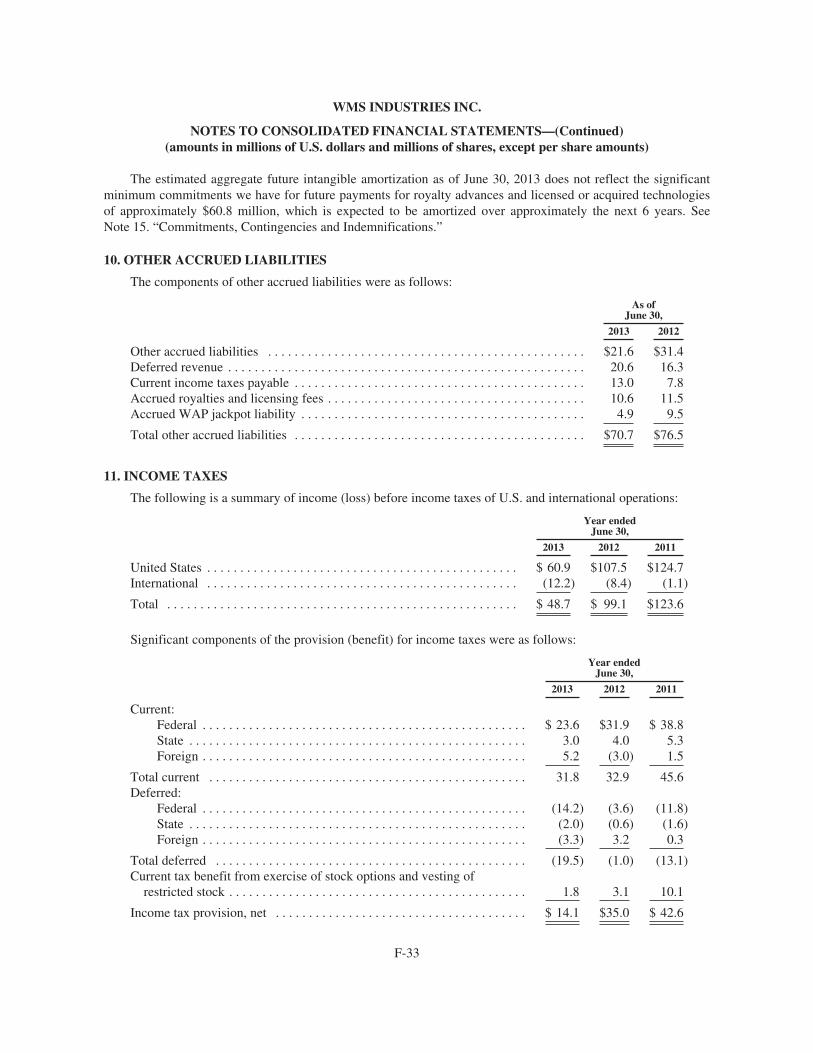
WMS INDUSTRIES INC.
NOTES TO CONSOLIDATED FINANCIAL STATEMENTS—(Continued)(amounts in millions of U.S. dollars and millions of shares, except per share amounts)
The estimated aggregate future intangible amortization as of June 30, 2013 does not reflect the significantminimum commitments we have for future payments for royalty advances and licensed or acquired technologiesof approximately $60.8 million, which is expected to be amortized over approximately the next 6 years. SeeNote 15. “Commitments, Contingencies and Indemnifications.”
10. OTHER ACCRUED LIABILITIES
The components of other accrued liabilities were as follows:
As ofJune 30,
2013 2012
Other accrued liabilities . . . . . . . . . . . . . . . . . . . . . . . . . . . . . . . . . . . . . . . . . . . . . . . . $21.6 $31.4Deferred revenue . . . . . . . . . . . . . . . . . . . . . . . . . . . . . . . . . . . . . . . . . . . . . . . . . . . . . . 20.6 16.3Current income taxes payable . . . . . . . . . . . . . . . . . . . . . . . . . . . . . . . . . . . . . . . . . . . . 13.0 7.8Accrued royalties and licensing fees . . . . . . . . . . . . . . . . . . . . . . . . . . . . . . . . . . . . . . . 10.6 11.5Accrued WAP jackpot liability . . . . . . . . . . . . . . . . . . . . . . . . . . . . . . . . . . . . . . . . . . . 4.9 9.5
Total other accrued liabilities . . . . . . . . . . . . . . . . . . . . . . . . . . . . . . . . . . . . . . . . . . . . $70.7 $76.5
11. INCOME TAXES
The following is a summary of income (loss) before income taxes of U.S. and international operations:
Year endedJune 30,
2013 2012 2011
United States . . . . . . . . . . . . . . . . . . . . . . . . . . . . . . . . . . . . . . . . . . . . . . . $ 60.9 $107.5 $124.7International . . . . . . . . . . . . . . . . . . . . . . . . . . . . . . . . . . . . . . . . . . . . . . . (12.2) (8.4) (1.1)
Total . . . . . . . . . . . . . . . . . . . . . . . . . . . . . . . . . . . . . . . . . . . . . . . . . . . . . $ 48.7 $ 99.1 $123.6
Significant components of the provision (benefit) for income taxes were as follows:
Year endedJune 30,
2013 2012 2011
Current:Federal . . . . . . . . . . . . . . . . . . . . . . . . . . . . . . . . . . . . . . . . . . . . . . . . . $ 23.6 $31.9 $ 38.8State . . . . . . . . . . . . . . . . . . . . . . . . . . . . . . . . . . . . . . . . . . . . . . . . . . . 3.0 4.0 5.3Foreign . . . . . . . . . . . . . . . . . . . . . . . . . . . . . . . . . . . . . . . . . . . . . . . . . 5.2 (3.0) 1.5
Total current . . . . . . . . . . . . . . . . . . . . . . . . . . . . . . . . . . . . . . . . . . . . . . . . 31.8 32.9 45.6Deferred:
Federal . . . . . . . . . . . . . . . . . . . . . . . . . . . . . . . . . . . . . . . . . . . . . . . . . (14.2) (3.6) (11.8)State . . . . . . . . . . . . . . . . . . . . . . . . . . . . . . . . . . . . . . . . . . . . . . . . . . . (2.0) (0.6) (1.6)Foreign . . . . . . . . . . . . . . . . . . . . . . . . . . . . . . . . . . . . . . . . . . . . . . . . . (3.3) 3.2 0.3
Total deferred . . . . . . . . . . . . . . . . . . . . . . . . . . . . . . . . . . . . . . . . . . . . . . . (19.5) (1.0) (13.1)Current tax benefit from exercise of stock options and vesting of
restricted stock . . . . . . . . . . . . . . . . . . . . . . . . . . . . . . . . . . . . . . . . . . . . . 1.8 3.1 10.1
Income tax provision, net . . . . . . . . . . . . . . . . . . . . . . . . . . . . . . . . . . . . . . $ 14.1 $35.0 $ 42.6
F-33
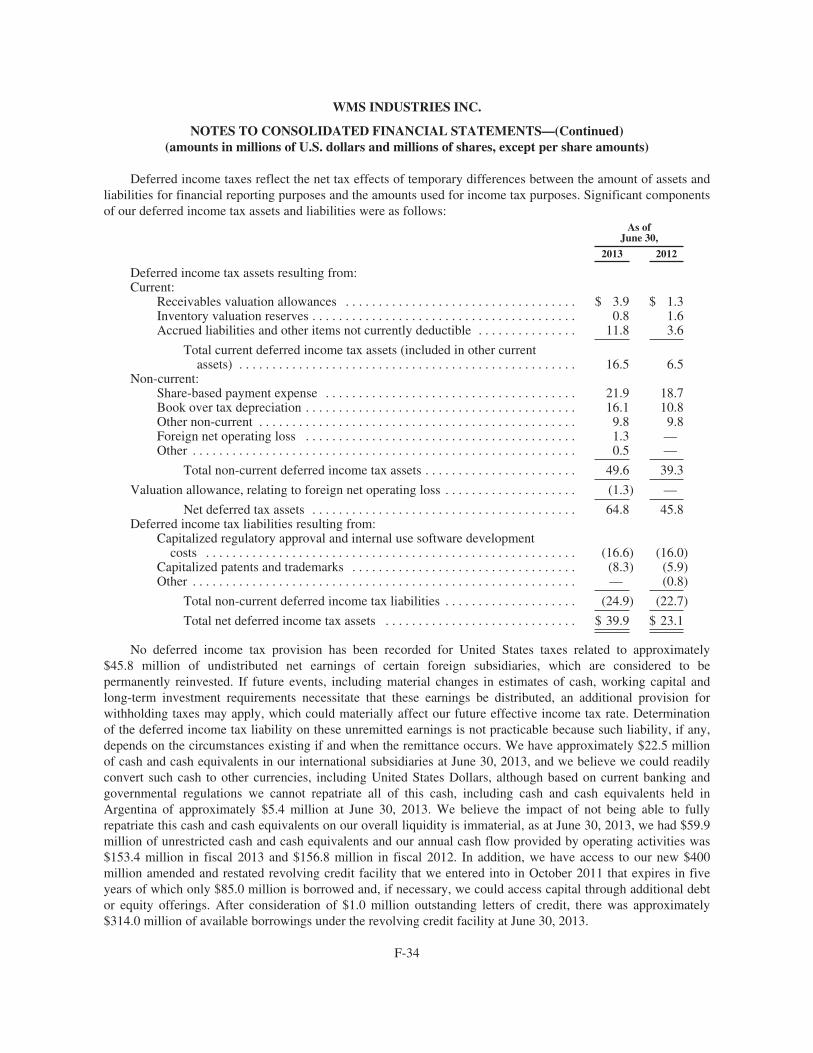
WMS INDUSTRIES INC.
NOTES TO CONSOLIDATED FINANCIAL STATEMENTS—(Continued)(amounts in millions of U.S. dollars and millions of shares, except per share amounts)
Deferred income taxes reflect the net tax effects of temporary differences between the amount of assets andliabilities for financial reporting purposes and the amounts used for income tax purposes. Significant componentsof our deferred income tax assets and liabilities were as follows:
As ofJune 30,
2013 2012
Deferred income tax assets resulting from:Current:
Receivables valuation allowances . . . . . . . . . . . . . . . . . . . . . . . . . . . . . . . . . . . $ 3.9 $ 1.3Inventory valuation reserves . . . . . . . . . . . . . . . . . . . . . . . . . . . . . . . . . . . . . . . . 0.8 1.6Accrued liabilities and other items not currently deductible . . . . . . . . . . . . . . . 11.8 3.6
Total current deferred income tax assets (included in other currentassets) . . . . . . . . . . . . . . . . . . . . . . . . . . . . . . . . . . . . . . . . . . . . . . . . . . . 16.5 6.5
Non-current:Share-based payment expense . . . . . . . . . . . . . . . . . . . . . . . . . . . . . . . . . . . . . . 21.9 18.7Book over tax depreciation . . . . . . . . . . . . . . . . . . . . . . . . . . . . . . . . . . . . . . . . . 16.1 10.8Other non-current . . . . . . . . . . . . . . . . . . . . . . . . . . . . . . . . . . . . . . . . . . . . . . . . 9.8 9.8Foreign net operating loss . . . . . . . . . . . . . . . . . . . . . . . . . . . . . . . . . . . . . . . . . 1.3 —Other . . . . . . . . . . . . . . . . . . . . . . . . . . . . . . . . . . . . . . . . . . . . . . . . . . . . . . . . . . 0.5 —
Total non-current deferred income tax assets . . . . . . . . . . . . . . . . . . . . . . . 49.6 39.3
Valuation allowance, relating to foreign net operating loss . . . . . . . . . . . . . . . . . . . . (1.3) —
Net deferred tax assets . . . . . . . . . . . . . . . . . . . . . . . . . . . . . . . . . . . . . . . . 64.8 45.8Deferred income tax liabilities resulting from:
Capitalized regulatory approval and internal use software developmentcosts . . . . . . . . . . . . . . . . . . . . . . . . . . . . . . . . . . . . . . . . . . . . . . . . . . . . . . . . (16.6) (16.0)
Capitalized patents and trademarks . . . . . . . . . . . . . . . . . . . . . . . . . . . . . . . . . . (8.3) (5.9)Other . . . . . . . . . . . . . . . . . . . . . . . . . . . . . . . . . . . . . . . . . . . . . . . . . . . . . . . . . . — (0.8)
Total non-current deferred income tax liabilities . . . . . . . . . . . . . . . . . . . . (24.9) (22.7)
Total net deferred income tax assets . . . . . . . . . . . . . . . . . . . . . . . . . . . . . $ 39.9 $ 23.1
No deferred income tax provision has been recorded for United States taxes related to approximately$45.8 million of undistributed net earnings of certain foreign subsidiaries, which are considered to bepermanently reinvested. If future events, including material changes in estimates of cash, working capital andlong-term investment requirements necessitate that these earnings be distributed, an additional provision forwithholding taxes may apply, which could materially affect our future effective income tax rate. Determinationof the deferred income tax liability on these unremitted earnings is not practicable because such liability, if any,depends on the circumstances existing if and when the remittance occurs. We have approximately $22.5 millionof cash and cash equivalents in our international subsidiaries at June 30, 2013, and we believe we could readilyconvert such cash to other currencies, including United States Dollars, although based on current banking andgovernmental regulations we cannot repatriate all of this cash, including cash and cash equivalents held inArgentina of approximately $5.4 million at June 30, 2013. We believe the impact of not being able to fullyrepatriate this cash and cash equivalents on our overall liquidity is immaterial, as at June 30, 2013, we had $59.9million of unrestricted cash and cash equivalents and our annual cash flow provided by operating activities was$153.4 million in fiscal 2013 and $156.8 million in fiscal 2012. In addition, we have access to our new $400million amended and restated revolving credit facility that we entered into in October 2011 that expires in fiveyears of which only $85.0 million is borrowed and, if necessary, we could access capital through additional debtor equity offerings. After consideration of $1.0 million outstanding letters of credit, there was approximately$314.0 million of available borrowings under the revolving credit facility at June 30, 2013.
F-34
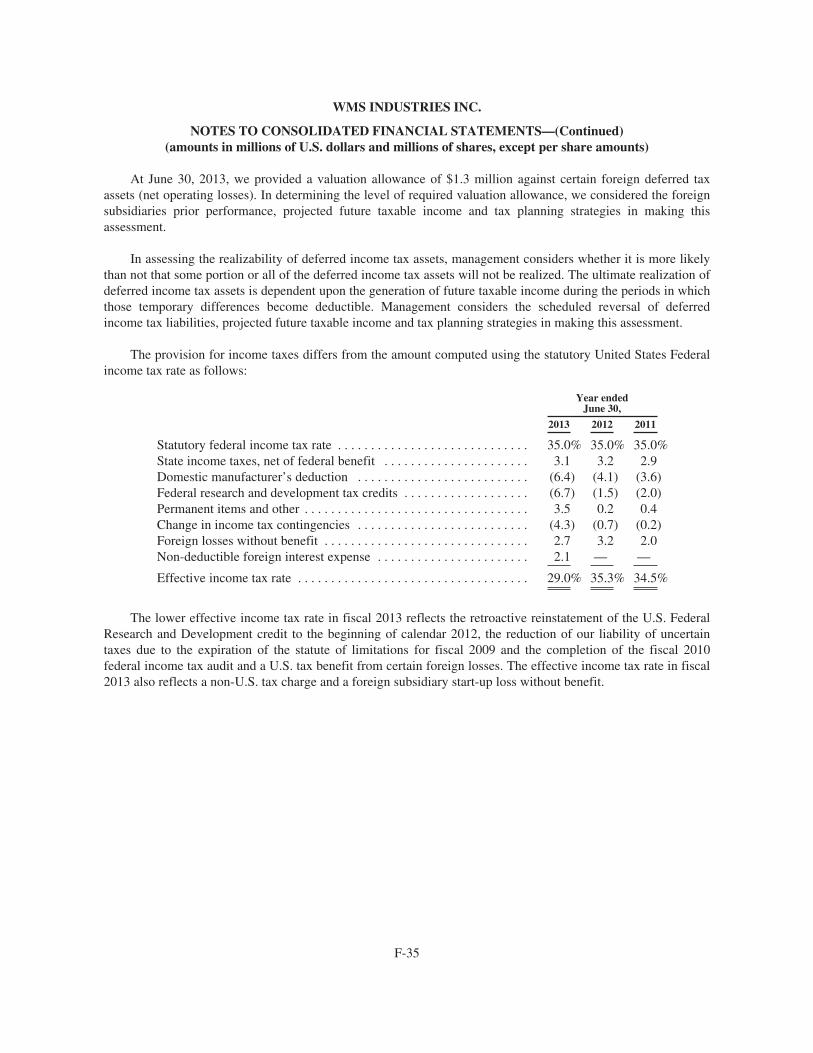
WMS INDUSTRIES INC.
NOTES TO CONSOLIDATED FINANCIAL STATEMENTS—(Continued)(amounts in millions of U.S. dollars and millions of shares, except per share amounts)
At June 30, 2013, we provided a valuation allowance of $1.3 million against certain foreign deferred taxassets (net operating losses). In determining the level of required valuation allowance, we considered the foreignsubsidiaries prior performance, projected future taxable income and tax planning strategies in making thisassessment.
In assessing the realizability of deferred income tax assets, management considers whether it is more likelythan not that some portion or all of the deferred income tax assets will not be realized. The ultimate realization ofdeferred income tax assets is dependent upon the generation of future taxable income during the periods in whichthose temporary differences become deductible. Management considers the scheduled reversal of deferredincome tax liabilities, projected future taxable income and tax planning strategies in making this assessment.
The provision for income taxes differs from the amount computed using the statutory United States Federalincome tax rate as follows:
Year endedJune 30,
2013 2012 2011
Statutory federal income tax rate . . . . . . . . . . . . . . . . . . . . . . . . . . . . . 35.0% 35.0% 35.0%State income taxes, net of federal benefit . . . . . . . . . . . . . . . . . . . . . . 3.1 3.2 2.9Domestic manufacturer’s deduction . . . . . . . . . . . . . . . . . . . . . . . . . . (6.4) (4.1) (3.6)Federal research and development tax credits . . . . . . . . . . . . . . . . . . . (6.7) (1.5) (2.0)Permanent items and other . . . . . . . . . . . . . . . . . . . . . . . . . . . . . . . . . . 3.5 0.2 0.4Change in income tax contingencies . . . . . . . . . . . . . . . . . . . . . . . . . . (4.3) (0.7) (0.2)Foreign losses without benefit . . . . . . . . . . . . . . . . . . . . . . . . . . . . . . . 2.7 3.2 2.0Non-deductible foreign interest expense . . . . . . . . . . . . . . . . . . . . . . . 2.1 — —
Effective income tax rate . . . . . . . . . . . . . . . . . . . . . . . . . . . . . . . . . . . 29.0% 35.3% 34.5%
The lower effective income tax rate in fiscal 2013 reflects the retroactive reinstatement of the U.S. FederalResearch and Development credit to the beginning of calendar 2012, the reduction of our liability of uncertaintaxes due to the expiration of the statute of limitations for fiscal 2009 and the completion of the fiscal 2010federal income tax audit and a U.S. tax benefit from certain foreign losses. The effective income tax rate in fiscal2013 also reflects a non-U.S. tax charge and a foreign subsidiary start-up loss without benefit.
F-35
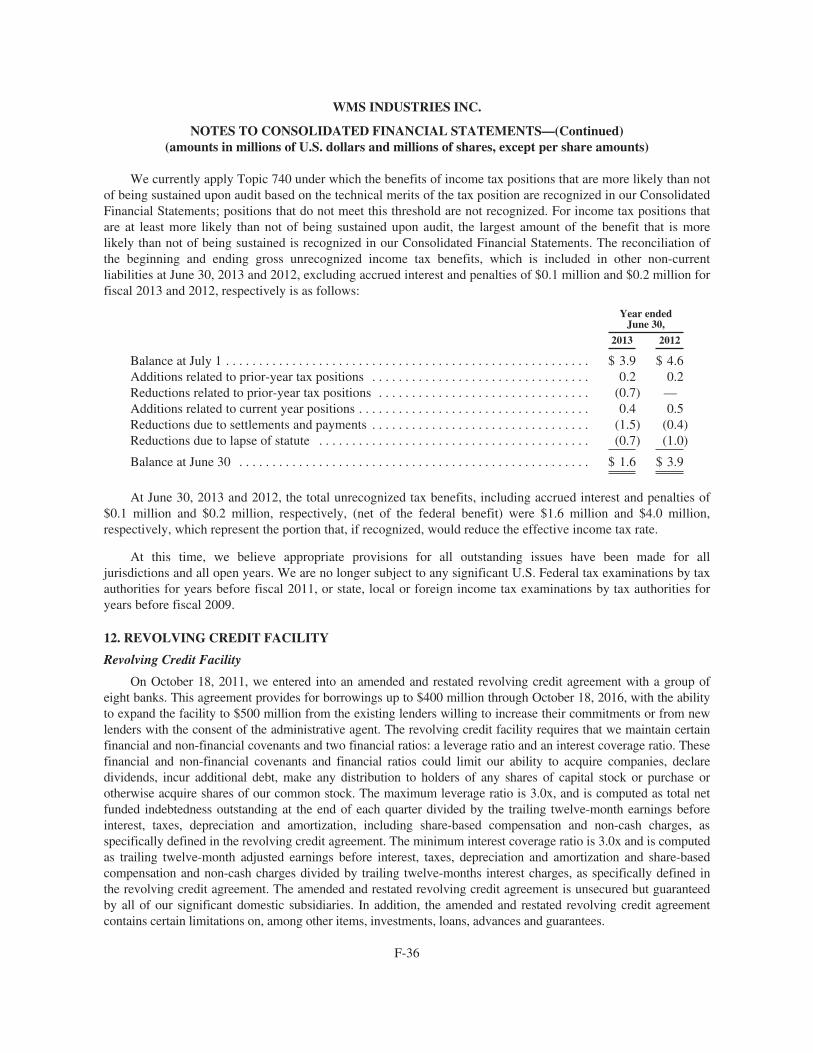
WMS INDUSTRIES INC.
NOTES TO CONSOLIDATED FINANCIAL STATEMENTS—(Continued)(amounts in millions of U.S. dollars and millions of shares, except per share amounts)
We currently apply Topic 740 under which the benefits of income tax positions that are more likely than notof being sustained upon audit based on the technical merits of the tax position are recognized in our ConsolidatedFinancial Statements; positions that do not meet this threshold are not recognized. For income tax positions thatare at least more likely than not of being sustained upon audit, the largest amount of the benefit that is morelikely than not of being sustained is recognized in our Consolidated Financial Statements. The reconciliation ofthe beginning and ending gross unrecognized income tax benefits, which is included in other non-currentliabilities at June 30, 2013 and 2012, excluding accrued interest and penalties of $0.1 million and $0.2 million forfiscal 2013 and 2012, respectively is as follows:
Year endedJune 30,
2013 2012
Balance at July 1 . . . . . . . . . . . . . . . . . . . . . . . . . . . . . . . . . . . . . . . . . . . . . . . . . . . . . . . $ 3.9 $ 4.6Additions related to prior-year tax positions . . . . . . . . . . . . . . . . . . . . . . . . . . . . . . . . . 0.2 0.2Reductions related to prior-year tax positions . . . . . . . . . . . . . . . . . . . . . . . . . . . . . . . . (0.7) —Additions related to current year positions . . . . . . . . . . . . . . . . . . . . . . . . . . . . . . . . . . . 0.4 0.5Reductions due to settlements and payments . . . . . . . . . . . . . . . . . . . . . . . . . . . . . . . . . (1.5) (0.4)Reductions due to lapse of statute . . . . . . . . . . . . . . . . . . . . . . . . . . . . . . . . . . . . . . . . . (0.7) (1.0)
Balance at June 30 . . . . . . . . . . . . . . . . . . . . . . . . . . . . . . . . . . . . . . . . . . . . . . . . . . . . . $ 1.6 $ 3.9
At June 30, 2013 and 2012, the total unrecognized tax benefits, including accrued interest and penalties of$0.1 million and $0.2 million, respectively, (net of the federal benefit) were $1.6 million and $4.0 million,respectively, which represent the portion that, if recognized, would reduce the effective income tax rate.
At this time, we believe appropriate provisions for all outstanding issues have been made for alljurisdictions and all open years. We are no longer subject to any significant U.S. Federal tax examinations by taxauthorities for years before fiscal 2011, or state, local or foreign income tax examinations by tax authorities foryears before fiscal 2009.
12. REVOLVING CREDIT FACILITY
Revolving Credit Facility
On October 18, 2011, we entered into an amended and restated revolving credit agreement with a group ofeight banks. This agreement provides for borrowings up to $400 million through October 18, 2016, with the abilityto expand the facility to $500 million from the existing lenders willing to increase their commitments or from newlenders with the consent of the administrative agent. The revolving credit facility requires that we maintain certainfinancial and non-financial covenants and two financial ratios: a leverage ratio and an interest coverage ratio. Thesefinancial and non-financial covenants and financial ratios could limit our ability to acquire companies, declaredividends, incur additional debt, make any distribution to holders of any shares of capital stock or purchase orotherwise acquire shares of our common stock. The maximum leverage ratio is 3.0x, and is computed as total netfunded indebtedness outstanding at the end of each quarter divided by the trailing twelve-month earnings beforeinterest, taxes, depreciation and amortization, including share-based compensation and non-cash charges, asspecifically defined in the revolving credit agreement. The minimum interest coverage ratio is 3.0x and is computedas trailing twelve-month adjusted earnings before interest, taxes, depreciation and amortization and share-basedcompensation and non-cash charges divided by trailing twelve-months interest charges, as specifically defined inthe revolving credit agreement. The amended and restated revolving credit agreement is unsecured but guaranteedby all of our significant domestic subsidiaries. In addition, the amended and restated revolving credit agreementcontains certain limitations on, among other items, investments, loans, advances and guarantees.
F-36
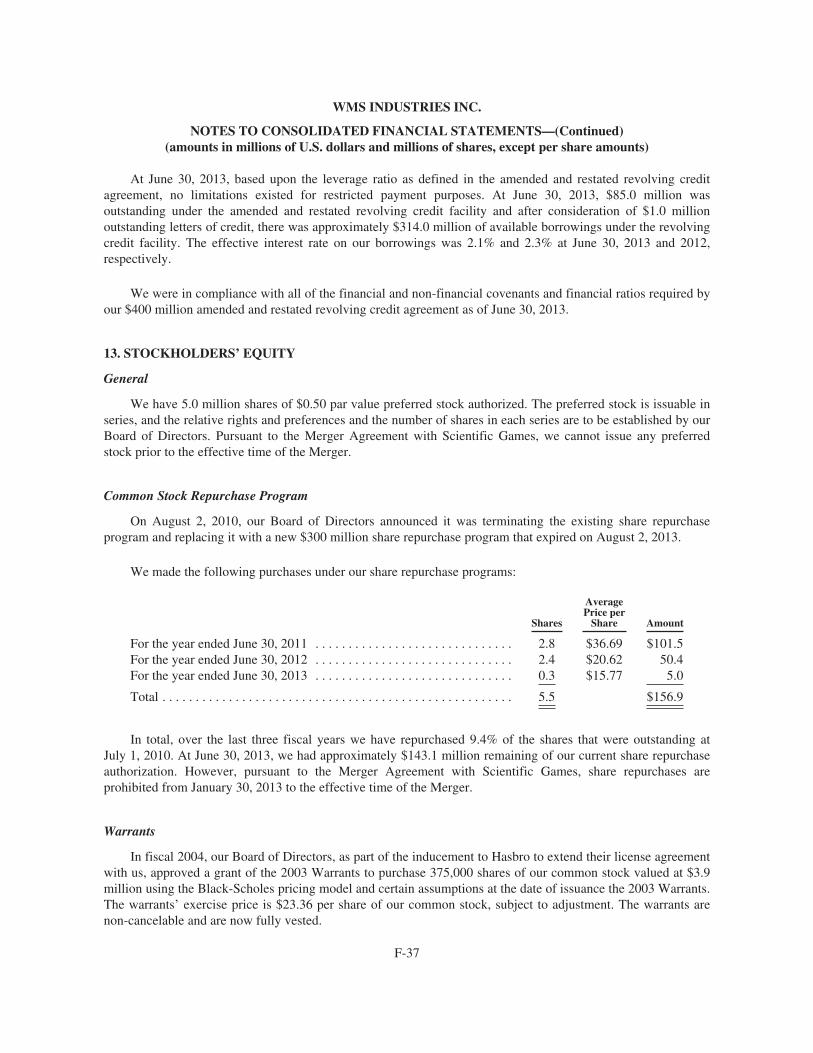
WMS INDUSTRIES INC.
NOTES TO CONSOLIDATED FINANCIAL STATEMENTS—(Continued)(amounts in millions of U.S. dollars and millions of shares, except per share amounts)
At June 30, 2013, based upon the leverage ratio as defined in the amended and restated revolving creditagreement, no limitations existed for restricted payment purposes. At June 30, 2013, $85.0 million wasoutstanding under the amended and restated revolving credit facility and after consideration of $1.0 millionoutstanding letters of credit, there was approximately $314.0 million of available borrowings under the revolvingcredit facility. The effective interest rate on our borrowings was 2.1% and 2.3% at June 30, 2013 and 2012,respectively.
We were in compliance with all of the financial and non-financial covenants and financial ratios required byour $400 million amended and restated revolving credit agreement as of June 30, 2013.
13. STOCKHOLDERS’ EQUITY
General
We have 5.0 million shares of $0.50 par value preferred stock authorized. The preferred stock is issuable inseries, and the relative rights and preferences and the number of shares in each series are to be established by ourBoard of Directors. Pursuant to the Merger Agreement with Scientific Games, we cannot issue any preferredstock prior to the effective time of the Merger.
Common Stock Repurchase Program
On August 2, 2010, our Board of Directors announced it was terminating the existing share repurchaseprogram and replacing it with a new $300 million share repurchase program that expired on August 2, 2013.
We made the following purchases under our share repurchase programs:
Shares
AveragePrice per
Share Amount
For the year ended June 30, 2011 . . . . . . . . . . . . . . . . . . . . . . . . . . . . . . 2.8 $36.69 $101.5For the year ended June 30, 2012 . . . . . . . . . . . . . . . . . . . . . . . . . . . . . . 2.4 $20.62 50.4For the year ended June 30, 2013 . . . . . . . . . . . . . . . . . . . . . . . . . . . . . . 0.3 $15.77 5.0
Total . . . . . . . . . . . . . . . . . . . . . . . . . . . . . . . . . . . . . . . . . . . . . . . . . . . . . 5.5 $156.9
In total, over the last three fiscal years we have repurchased 9.4% of the shares that were outstanding atJuly 1, 2010. At June 30, 2013, we had approximately $143.1 million remaining of our current share repurchaseauthorization. However, pursuant to the Merger Agreement with Scientific Games, share repurchases areprohibited from January 30, 2013 to the effective time of the Merger.
Warrants
In fiscal 2004, our Board of Directors, as part of the inducement to Hasbro to extend their license agreementwith us, approved a grant of the 2003 Warrants to purchase 375,000 shares of our common stock valued at $3.9million using the Black-Scholes pricing model and certain assumptions at the date of issuance the 2003 Warrants.The warrants’ exercise price is $23.36 per share of our common stock, subject to adjustment. The warrants arenon-cancelable and are now fully vested.
F-37
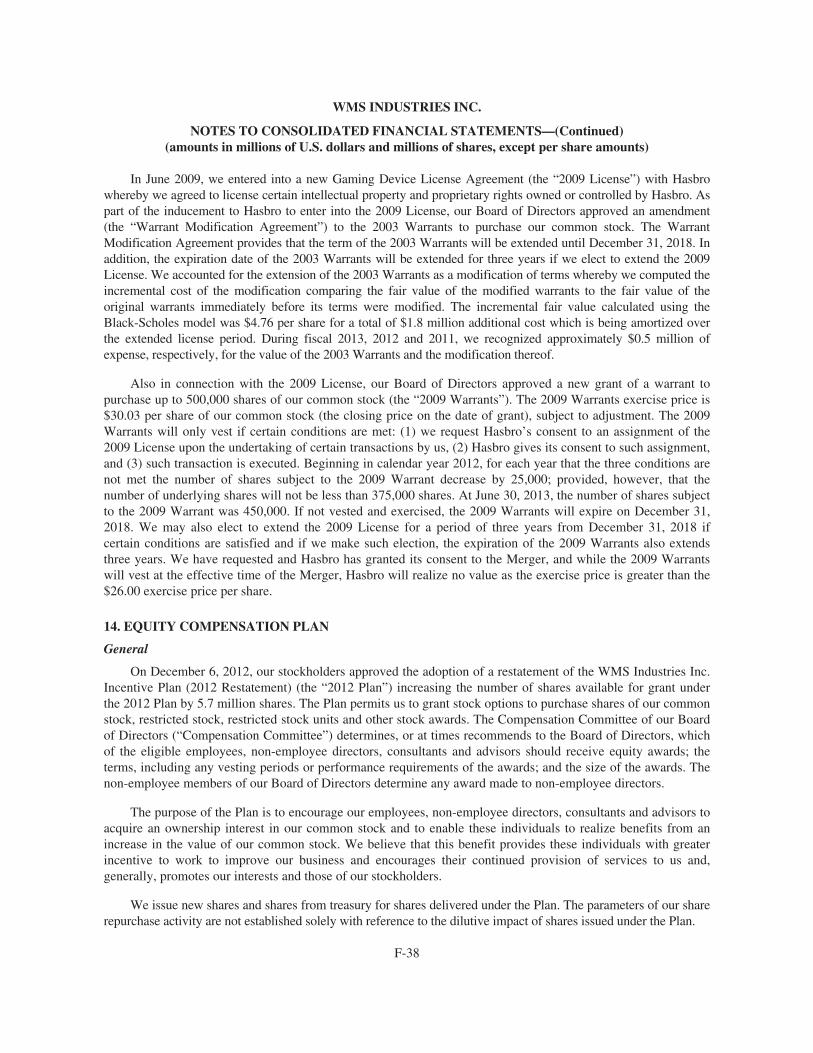
WMS INDUSTRIES INC.
NOTES TO CONSOLIDATED FINANCIAL STATEMENTS—(Continued)(amounts in millions of U.S. dollars and millions of shares, except per share amounts)
In June 2009, we entered into a new Gaming Device License Agreement (the “2009 License”) with Hasbrowhereby we agreed to license certain intellectual property and proprietary rights owned or controlled by Hasbro. Aspart of the inducement to Hasbro to enter into the 2009 License, our Board of Directors approved an amendment(the “Warrant Modification Agreement”) to the 2003 Warrants to purchase our common stock. The WarrantModification Agreement provides that the term of the 2003 Warrants will be extended until December 31, 2018. Inaddition, the expiration date of the 2003 Warrants will be extended for three years if we elect to extend the 2009License. We accounted for the extension of the 2003 Warrants as a modification of terms whereby we computed theincremental cost of the modification comparing the fair value of the modified warrants to the fair value of theoriginal warrants immediately before its terms were modified. The incremental fair value calculated using theBlack-Scholes model was $4.76 per share for a total of $1.8 million additional cost which is being amortized overthe extended license period. During fiscal 2013, 2012 and 2011, we recognized approximately $0.5 million ofexpense, respectively, for the value of the 2003 Warrants and the modification thereof.
Also in connection with the 2009 License, our Board of Directors approved a new grant of a warrant topurchase up to 500,000 shares of our common stock (the “2009 Warrants”). The 2009 Warrants exercise price is$30.03 per share of our common stock (the closing price on the date of grant), subject to adjustment. The 2009Warrants will only vest if certain conditions are met: (1) we request Hasbro’s consent to an assignment of the2009 License upon the undertaking of certain transactions by us, (2) Hasbro gives its consent to such assignment,and (3) such transaction is executed. Beginning in calendar year 2012, for each year that the three conditions arenot met the number of shares subject to the 2009 Warrant decrease by 25,000; provided, however, that thenumber of underlying shares will not be less than 375,000 shares. At June 30, 2013, the number of shares subjectto the 2009 Warrant was 450,000. If not vested and exercised, the 2009 Warrants will expire on December 31,2018. We may also elect to extend the 2009 License for a period of three years from December 31, 2018 ifcertain conditions are satisfied and if we make such election, the expiration of the 2009 Warrants also extendsthree years. We have requested and Hasbro has granted its consent to the Merger, and while the 2009 Warrantswill vest at the effective time of the Merger, Hasbro will realize no value as the exercise price is greater than the$26.00 exercise price per share.
14. EQUITY COMPENSATION PLAN
General
On December 6, 2012, our stockholders approved the adoption of a restatement of the WMS Industries Inc.Incentive Plan (2012 Restatement) (the “2012 Plan”) increasing the number of shares available for grant underthe 2012 Plan by 5.7 million shares. The Plan permits us to grant stock options to purchase shares of our commonstock, restricted stock, restricted stock units and other stock awards. The Compensation Committee of our Boardof Directors (“Compensation Committee”) determines, or at times recommends to the Board of Directors, whichof the eligible employees, non-employee directors, consultants and advisors should receive equity awards; theterms, including any vesting periods or performance requirements of the awards; and the size of the awards. Thenon-employee members of our Board of Directors determine any award made to non-employee directors.
The purpose of the Plan is to encourage our employees, non-employee directors, consultants and advisors toacquire an ownership interest in our common stock and to enable these individuals to realize benefits from anincrease in the value of our common stock. We believe that this benefit provides these individuals with greaterincentive to work to improve our business and encourages their continued provision of services to us and,generally, promotes our interests and those of our stockholders.
We issue new shares and shares from treasury for shares delivered under the Plan. The parameters of our sharerepurchase activity are not established solely with reference to the dilutive impact of shares issued under the Plan.
F-38
WMS INDUSTRIES INC.
NOTES TO CONSOLIDATED FINANCIAL STATEMENTS—(Continued)(amounts in millions of U.S. dollars and millions of shares, except per share amounts)
A maximum of 22.3 million shares were authorized for awards under our plans.
Other Information
Shares available for future issuance . . . . . . . . . . . . . . . . . . . . . . . . . . . . . . . . . . . . . . . . 5.0 millionUnrecognized cost for outstanding awards . . . . . . . . . . . . . . . . . . . . . . . . . . . . . . . . . . . $18.1 millionWeighted average future recognition period . . . . . . . . . . . . . . . . . . . . . . . . . . . . . . . . . . 2.5 years
As of June 30, 2013, there was $8.8 million of total stock option compensation expense related to non-vested stock options not yet recognized, which is expected to be recognized over a weighted average period of2.2 years, and $9.3 million of total restricted stock award, restricted stock units and equity-based performanceunit compensation expense related to non-vested awards not yet recognized, which is expected to be recognizedover a weighted average period of 2.7 years.
A summary of information with respect to share-based compensation expense included in our ConsolidatedStatements of Income are as follows:
Year endedJune 30,
2013 2012 2011
Selling and administrative . . . . . . . . . . . . . . . . . . . . . . . . . . . . . . . . . . . . . . . $10.9 $10.1 $12.1Research and development . . . . . . . . . . . . . . . . . . . . . . . . . . . . . . . . . . . . . . . 4.9 5.4 6.4Cost of product sales . . . . . . . . . . . . . . . . . . . . . . . . . . . . . . . . . . . . . . . . . . . 0.1 0.3 0.2
Share-based compensation expense included in pre-tax income . . . . . . . . . . 15.9 15.8 18.7Income tax benefit related to share-based compensation . . . . . . . . . . . . . . . . (6.0) (6.0) (7.1)
Share-based compensation expense included in net income . . . . . . . . . . . . . $ 9.9 $ 9.8 $11.6
Diluted earnings per share impact of share-based compensation expense . . $0.18 $0.18 $0.20
F-39
WMS INDUSTRIES INC.
NOTES TO CONSOLIDATED FINANCIAL STATEMENTS—(Continued)(amounts in millions of U.S. dollars and millions of shares, except per share amounts)
Stock Options
Pursuant to the Plan, for stock options, the exercise price per share with respect to each option is determinedby the Compensation Committee and is not less than the fair market value of our common stock on the date onwhich the stock option is granted. The Plan has a term of 10 years, unless terminated earlier, and stock optionsgranted under the Plan prior to December 2006 have exercise terms up to 10 years, whereas stock options grantedunder the Plan beginning in December 2006 have exercise terms up to 7 years. Vesting generally occurs equallyover one to four years on the grant-date anniversary. Compensation expense is recognized using the acceleratedmethod under Topic 718 over the requisite service period for each separately vesting portion of the award. Onoccasion, we may issue stock options that immediately vest, in which case compensation expense equal to thetotal fair value of the stock option grant is immediately recognized. At the effective time of the Merger, all stockoptions outstanding will immediately vest. For stock options granted in fiscal 2013, the range in fair value wasfrom $6.73 – $10.71 per share based on the Black-Scholes calculation using the following range of assumptionsdepending on the characteristics of the stock option grant: risk-free interest rates between 0.5% – 0.7%; expectedlife between 3.7 – 4.0 years; expected volatility of 0.55; and 0.0% dividend yield. Stock option activity was asfollows for fiscal 2013:
Numberof StockOptions
WeightedAverageExercisePrice per
Share
WeightedAverage
RemainingContractual
Term(in years)
AggregateIntrinsicValue(1)
Stock options outstanding at June 30, 2012 . . . . . . . . . . . . . . . . . . . . 5.5 $27.44Granted . . . . . . . . . . . . . . . . . . . . . . . . . . . . . . . . . . . . . . . . . . . . 1.0 17.10Exercised . . . . . . . . . . . . . . . . . . . . . . . . . . . . . . . . . . . . . . . . . . . (0.2) 17.76Expired or Cancelled . . . . . . . . . . . . . . . . . . . . . . . . . . . . . . . . . (0.1) 32.98Forfeited . . . . . . . . . . . . . . . . . . . . . . . . . . . . . . . . . . . . . . . . . . . (0.2) 26.80
Stock options outstanding at June 30, 2013 . . . . . . . . . . . . . . . . . . . . 6.0 $26.00 3.92 $21.7
Stock options exercisable at June 30, 2013 . . . . . . . . . . . . . . . . . . . . 3.6 $28.54 2.83 $ 8.1
(1) Intrinsic value is defined as the amount by which the fair value of the underlying stock exceeds the exercise price of a stock option.
Other information pertaining to stock options was as follows:
Year endedJune 30,
2013 2012 2011
Weighted average grant-date fair value per share of stock optionsgranted . . . . . . . . . . . . . . . . . . . . . . . . . . . . . . . . . . . . . . . . . . . . . . . . . . . $7.06 $8.48 $15.25
Total grant-date fair value of stock options vested . . . . . . . . . . . . . . . . . . . 11.5 10.2 8.8Total intrinsic value of stock options exercised . . . . . . . . . . . . . . . . . . . . . . 1.5 0.6 12.7
For fiscal 2013, 2012 and 2011, cash received from the exercise of stock options and shares purchased underour employee stock purchase plan was $5.8 million, $3.4 million and $14.4 million, respectively, and the incometax benefit realized from exercise of stock options was $1.8 million, $0.2 million and $10.1 million, respectively.
In fiscal 2005, our Board of Directors approved a Director Emeritus Program for directors who reach age 75or have served on the Board of Directors for at least 20 years. The Director Emeritus Program is being phased into maintain continuity and avoid losing the benefit of valuable experience. For fiscal 2013, 37,500 fully vested
F-40
WMS INDUSTRIES INC.
NOTES TO CONSOLIDATED FINANCIAL STATEMENTS—(Continued)(amounts in millions of U.S. dollars and millions of shares, except per share amounts)
five—year stock options were issued to each of the two directors upon their retirement from the Board, or 75,000stock options in the aggregate. No directors retired in fiscal 2012. For fiscal 2011, 37,500 fully vested five—yearstock options were issued to one director upon his retirement from the Board.
Restricted Stock Award Grants
Upon the recommendation of our Compensation Committee, our Board of Directors has, on occasion,granted restricted stock, restricted stock units and performance-based restricted stock units to certain employeesand non-employee directors to motivate them to devote their full energies to our success, to reward them for theirservices and to align their interests with the interests of our stockholders.
Under the Plan, participants may be granted restricted stock awards, representing an unfunded, unsecuredright, which is nontransferable except in the event of death or disability of the participant, to receive shares of ourcommon stock on the date specified in the participant’s award agreement. The restricted stock awards grantedunder this plan are subject to vesting generally from a range of two to four years on the grant-date anniversaryand the performance-based restricted shares are subject to successful completion of the performance conditions.Compensation expense for restricted stock is recognized on a straight-line basis over the vesting period for theentire award. Compensation expense for the performance-based stock is recognized as a cumulative effect oncurrent and prior periods if a change occurs in the assessment of achievement of the performance goals. At theeffective time of the Merger, all restricted stock awards outstanding will immediately vest.
Restricted stock share and restricted stock unit activity was as follows for fiscal 2013:
RestrictedStockShares
WeightedAverage
Grant- DateFairValue(1)
Nonvested balance at June 30, 2012 . . . . . . . . . . . . . . . . . . . . . . . . . . . . . 0.1 $22.30Granted . . . . . . . . . . . . . . . . . . . . . . . . . . . . . . . . . . . . . . . . . . . . . . . 0.0 0.0Vested . . . . . . . . . . . . . . . . . . . . . . . . . . . . . . . . . . . . . . . . . . . . . . . . 0.0 27.59
Nonvested balance at June 30, 2013 . . . . . . . . . . . . . . . . . . . . . . . . . . . . . 0.1 $18.49
RestrictedStock Units(Including
Performance-based Stock
Units)
WeightedAverage
Grant-DateFair Value(1)
Nonvested balance at June 30, 2012 . . . . . . . . . . . . . . . . . . . . . . . . . . . . . 0.4 $27.36Granted . . . . . . . . . . . . . . . . . . . . . . . . . . . . . . . . . . . . . . . . . . . . . . . 0.3 16.47Vested . . . . . . . . . . . . . . . . . . . . . . . . . . . . . . . . . . . . . . . . . . . . . . . . (0.2) 29.38
Nonvested balance at June 30, 2013 . . . . . . . . . . . . . . . . . . . . . . . . . . . . . 0.5 $20.63
(1) For restricted stock, grant-date fair value is equal to the closing market price of a share of our common stock on the grant date.
Equity-Based Performance Units
As of June 30, 2013, we had 587,272 equity-based performance units outstanding with a weighted averagegrant-date fair value per unit of $21.62. The equity-based performance units contain performance goals set by theBoard of Directors based on certain performance criteria over the following periods: thirty-six month period
F-41
WMS INDUSTRIES INC.
NOTES TO CONSOLIDATED FINANCIAL STATEMENTS—(Continued)(amounts in millions of U.S. dollars and millions of shares, except per share amounts)
ending June 30, 2013, for 100,961 units; thirty-six month period ending June 30, 2014, for 213,573 units; andthirty-six month period ending June 30, 2015, for 272,738 units. The number of shares of stock to be awarded toparticipants is dependent upon the achievement of the performance goals and the extent to which each goal isachieved or exceeded, requires a minimum threshold performance before any shares are issued and can result inshares issued up to 200% of the targeted number of shares under each grant. In fiscal 2013, we did not record aprovision for equity-based performance units granted under our long-term incentive plan that relate to the thirty-six month periods ended June 30, 2013 and 2014, based on the current assessment of achievement of theperformance goals. We did expense $1.4 million for equity-based performance units granted under our long-termincentive plan related to the thirty-six month period ended June 30, 2015, and in fiscal 2011, we recorded aprovision of $0.8 million related to the equity-based performance units granted under our long-term incentiveplan related to the thirty-six month period ended June 30, 2011. No provision was recorded in fiscal 2012 basedon the assessment of achievement of the performance goals. Additional charges will be recorded in future periodsdepending on the assessment of achievement of the performance goals. At the effective time of the Merger, allequity-based performance units outstanding related to thirty-six month performance periods ended June 30, 2014and 2015 will immediately vest. Equity-based performance unit activity was as follows for fiscal 2013:
Equity-basedPerformance
Units
WeightedAverage
Grant-DateFair Value(1)
Nonvested balance at June 30, 2012 . . . . . . . . . . . . . . . . . . . . . . . . . . . . . 0.4 $29.52Granted . . . . . . . . . . . . . . . . . . . . . . . . . . . . . . . . . . . . . . . . . . . . . . . 0.3 17.27Vested . . . . . . . . . . . . . . . . . . . . . . . . . . . . . . . . . . . . . . . . . . . . . . . . 0.0 0.0Forfeited . . . . . . . . . . . . . . . . . . . . . . . . . . . . . . . . . . . . . . . . . . . . . . (0.1) 41.55
Nonvested balance at June 30, 2013 . . . . . . . . . . . . . . . . . . . . . . . . . . . . . 0.6 $21.62
(1) For equity-based performance units, grant-date fair value is equal to the closing market price of a share of our common stock on the grantdate.
Deferred Stock
In fiscal 2005, non-management members of the Board of Directors were awarded an aggregate of 39,824units of deferred stock under the Plan, of which 9,959 units remain outstanding as of June 30, 2013, compared to19,915 units as of June 30, 2012. The decrease in units relate to the retirement of two members from the Board ofDirectors in the December 2012 quarter and the resulting vesting of their deferred stock. The deferred stock unitsvest immediately and shares of our common stock will be issued upon each director’s departure from the Board,assuming proper notice from the Board member. Grantees are not entitled to vote their deferred stock units or toreceive cash dividends, but they are entitled to receive make whole payments on any declared and paid dividendson our common stock. At the effective time of the Merger, the deferred stock outstanding will immediately vest.
Employee Stock Purchase Plan
Effective July 1, 2009, we adopted an Employee Stock Purchase Plan (“ESPP”) as defined underSection 423 of the Internal Revenue Code allowing eligible employees to elect to make contributions throughpayroll deductions which will be used to purchase our common stock at a purchase price equal to 85% of the fairvalue of a share of common stock on the date of purchase. We reserved 500,000 shares under the ESPP. Forfiscal year 2013, participants purchased 90,615 shares under the plan at an average cost of $17.09, for a total of$1.5 million while in fiscal 2012 participants purchased 102,538 shares under the plan at an average cost of$17.16, for a total of $1.8 million and in fiscal 2011 participants purchased 62,807 shares under the plan at an
F-42
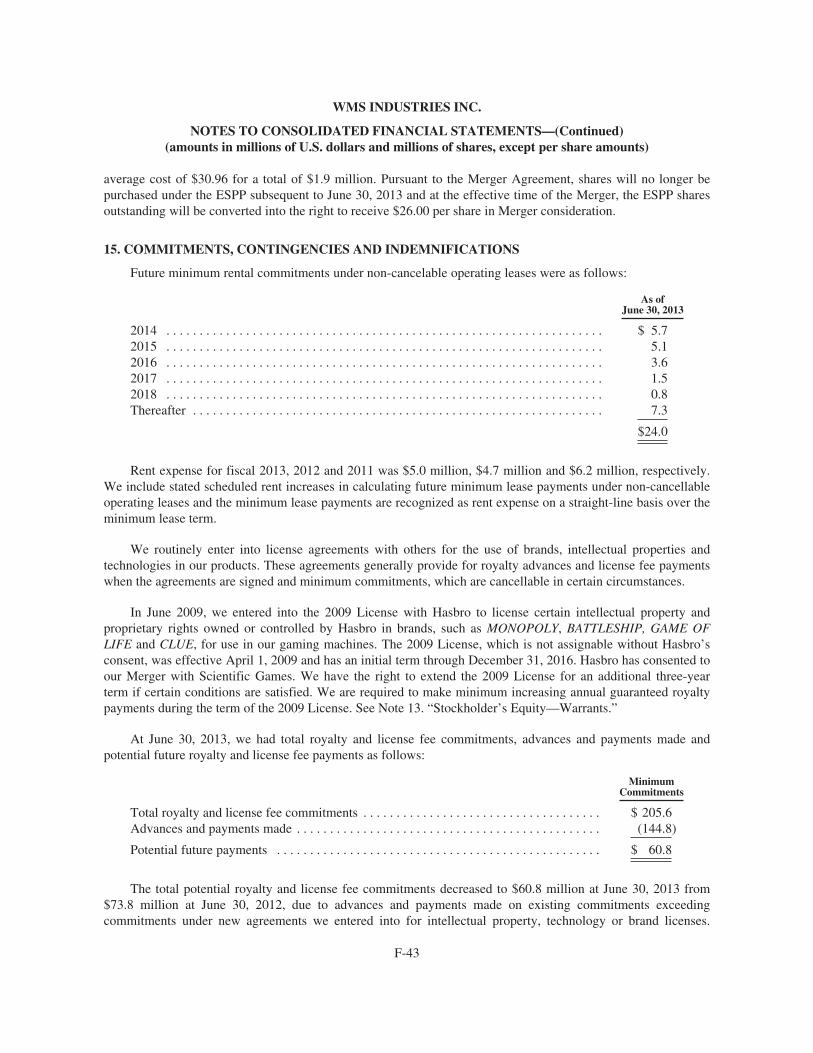
WMS INDUSTRIES INC.
NOTES TO CONSOLIDATED FINANCIAL STATEMENTS—(Continued)(amounts in millions of U.S. dollars and millions of shares, except per share amounts)
average cost of $30.96 for a total of $1.9 million. Pursuant to the Merger Agreement, shares will no longer bepurchased under the ESPP subsequent to June 30, 2013 and at the effective time of the Merger, the ESPP sharesoutstanding will be converted into the right to receive $26.00 per share in Merger consideration.
15. COMMITMENTS, CONTINGENCIES AND INDEMNIFICATIONS
Future minimum rental commitments under non-cancelable operating leases were as follows:
As ofJune 30, 2013
2014 . . . . . . . . . . . . . . . . . . . . . . . . . . . . . . . . . . . . . . . . . . . . . . . . . . . . . . . . . . . . . . . . . . $ 5.72015 . . . . . . . . . . . . . . . . . . . . . . . . . . . . . . . . . . . . . . . . . . . . . . . . . . . . . . . . . . . . . . . . . . 5.12016 . . . . . . . . . . . . . . . . . . . . . . . . . . . . . . . . . . . . . . . . . . . . . . . . . . . . . . . . . . . . . . . . . . 3.62017 . . . . . . . . . . . . . . . . . . . . . . . . . . . . . . . . . . . . . . . . . . . . . . . . . . . . . . . . . . . . . . . . . . 1.52018 . . . . . . . . . . . . . . . . . . . . . . . . . . . . . . . . . . . . . . . . . . . . . . . . . . . . . . . . . . . . . . . . . . 0.8Thereafter . . . . . . . . . . . . . . . . . . . . . . . . . . . . . . . . . . . . . . . . . . . . . . . . . . . . . . . . . . . . . . 7.3
$24.0
Rent expense for fiscal 2013, 2012 and 2011 was $5.0 million, $4.7 million and $6.2 million, respectively.We include stated scheduled rent increases in calculating future minimum lease payments under non-cancellableoperating leases and the minimum lease payments are recognized as rent expense on a straight-line basis over theminimum lease term.
We routinely enter into license agreements with others for the use of brands, intellectual properties andtechnologies in our products. These agreements generally provide for royalty advances and license fee paymentswhen the agreements are signed and minimum commitments, which are cancellable in certain circumstances.
In June 2009, we entered into the 2009 License with Hasbro to license certain intellectual property andproprietary rights owned or controlled by Hasbro in brands, such as MONOPOLY, BATTLESHIP, GAME OFLIFE and CLUE, for use in our gaming machines. The 2009 License, which is not assignable without Hasbro’sconsent, was effective April 1, 2009 and has an initial term through December 31, 2016. Hasbro has consented toour Merger with Scientific Games. We have the right to extend the 2009 License for an additional three-yearterm if certain conditions are satisfied. We are required to make minimum increasing annual guaranteed royaltypayments during the term of the 2009 License. See Note 13. “Stockholder’s Equity—Warrants.”
At June 30, 2013, we had total royalty and license fee commitments, advances and payments made andpotential future royalty and license fee payments as follows:
MinimumCommitments
Total royalty and license fee commitments . . . . . . . . . . . . . . . . . . . . . . . . . . . . . . . . . . . . $ 205.6Advances and payments made . . . . . . . . . . . . . . . . . . . . . . . . . . . . . . . . . . . . . . . . . . . . . . (144.8)
Potential future payments . . . . . . . . . . . . . . . . . . . . . . . . . . . . . . . . . . . . . . . . . . . . . . . . . $ 60.8
The total potential royalty and license fee commitments decreased to $60.8 million at June 30, 2013 from$73.8 million at June 30, 2012, due to advances and payments made on existing commitments exceedingcommitments under new agreements we entered into for intellectual property, technology or brand licenses.
F-43
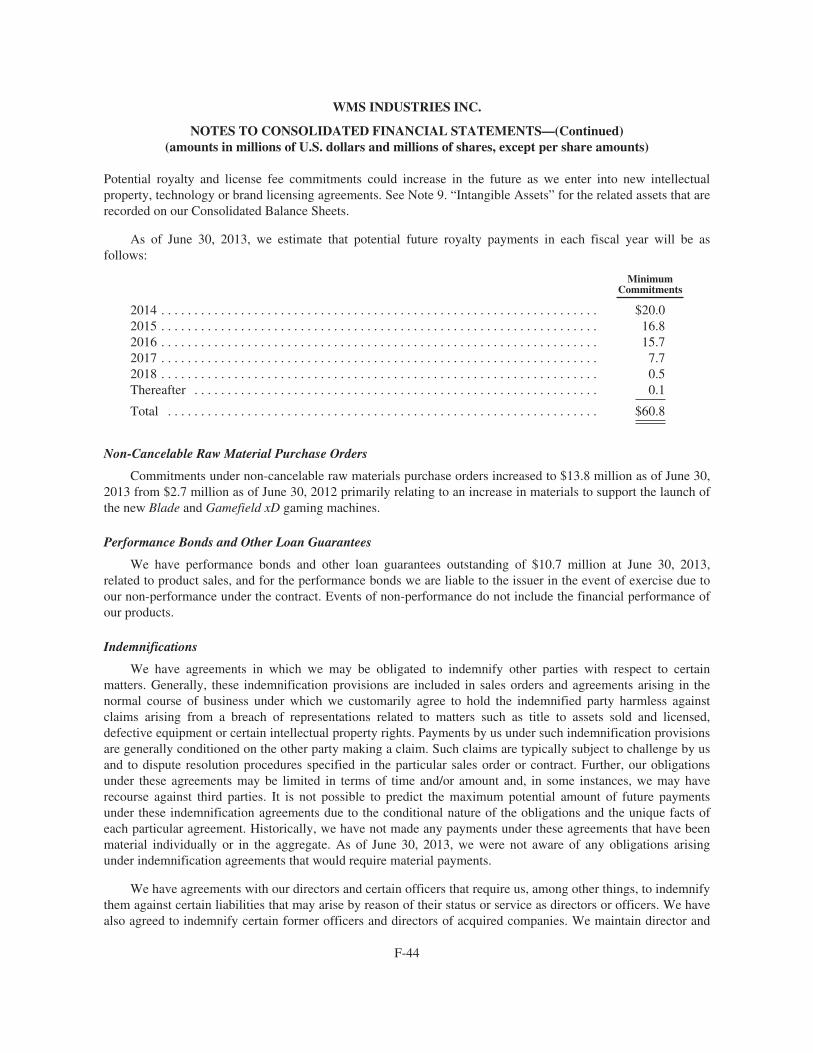
WMS INDUSTRIES INC.
NOTES TO CONSOLIDATED FINANCIAL STATEMENTS—(Continued)(amounts in millions of U.S. dollars and millions of shares, except per share amounts)
Potential royalty and license fee commitments could increase in the future as we enter into new intellectualproperty, technology or brand licensing agreements. See Note 9. “Intangible Assets” for the related assets that arerecorded on our Consolidated Balance Sheets.
As of June 30, 2013, we estimate that potential future royalty payments in each fiscal year will be asfollows:
MinimumCommitments
2014 . . . . . . . . . . . . . . . . . . . . . . . . . . . . . . . . . . . . . . . . . . . . . . . . . . . . . . . . . . . . . . . . . . $20.02015 . . . . . . . . . . . . . . . . . . . . . . . . . . . . . . . . . . . . . . . . . . . . . . . . . . . . . . . . . . . . . . . . . . 16.82016 . . . . . . . . . . . . . . . . . . . . . . . . . . . . . . . . . . . . . . . . . . . . . . . . . . . . . . . . . . . . . . . . . . 15.72017 . . . . . . . . . . . . . . . . . . . . . . . . . . . . . . . . . . . . . . . . . . . . . . . . . . . . . . . . . . . . . . . . . . 7.72018 . . . . . . . . . . . . . . . . . . . . . . . . . . . . . . . . . . . . . . . . . . . . . . . . . . . . . . . . . . . . . . . . . . 0.5Thereafter . . . . . . . . . . . . . . . . . . . . . . . . . . . . . . . . . . . . . . . . . . . . . . . . . . . . . . . . . . . . . 0.1
Total . . . . . . . . . . . . . . . . . . . . . . . . . . . . . . . . . . . . . . . . . . . . . . . . . . . . . . . . . . . . . . . . . $60.8
Non-Cancelable Raw Material Purchase Orders
Commitments under non-cancelable raw materials purchase orders increased to $13.8 million as of June 30,2013 from $2.7 million as of June 30, 2012 primarily relating to an increase in materials to support the launch ofthe new Blade and Gamefield xD gaming machines.
Performance Bonds and Other Loan Guarantees
We have performance bonds and other loan guarantees outstanding of $10.7 million at June 30, 2013,related to product sales, and for the performance bonds we are liable to the issuer in the event of exercise due toour non-performance under the contract. Events of non-performance do not include the financial performance ofour products.
Indemnifications
We have agreements in which we may be obligated to indemnify other parties with respect to certainmatters. Generally, these indemnification provisions are included in sales orders and agreements arising in thenormal course of business under which we customarily agree to hold the indemnified party harmless againstclaims arising from a breach of representations related to matters such as title to assets sold and licensed,defective equipment or certain intellectual property rights. Payments by us under such indemnification provisionsare generally conditioned on the other party making a claim. Such claims are typically subject to challenge by usand to dispute resolution procedures specified in the particular sales order or contract. Further, our obligationsunder these agreements may be limited in terms of time and/or amount and, in some instances, we may haverecourse against third parties. It is not possible to predict the maximum potential amount of future paymentsunder these indemnification agreements due to the conditional nature of the obligations and the unique facts ofeach particular agreement. Historically, we have not made any payments under these agreements that have beenmaterial individually or in the aggregate. As of June 30, 2013, we were not aware of any obligations arisingunder indemnification agreements that would require material payments.
We have agreements with our directors and certain officers that require us, among other things, to indemnifythem against certain liabilities that may arise by reason of their status or service as directors or officers. We havealso agreed to indemnify certain former officers and directors of acquired companies. We maintain director and
F-44
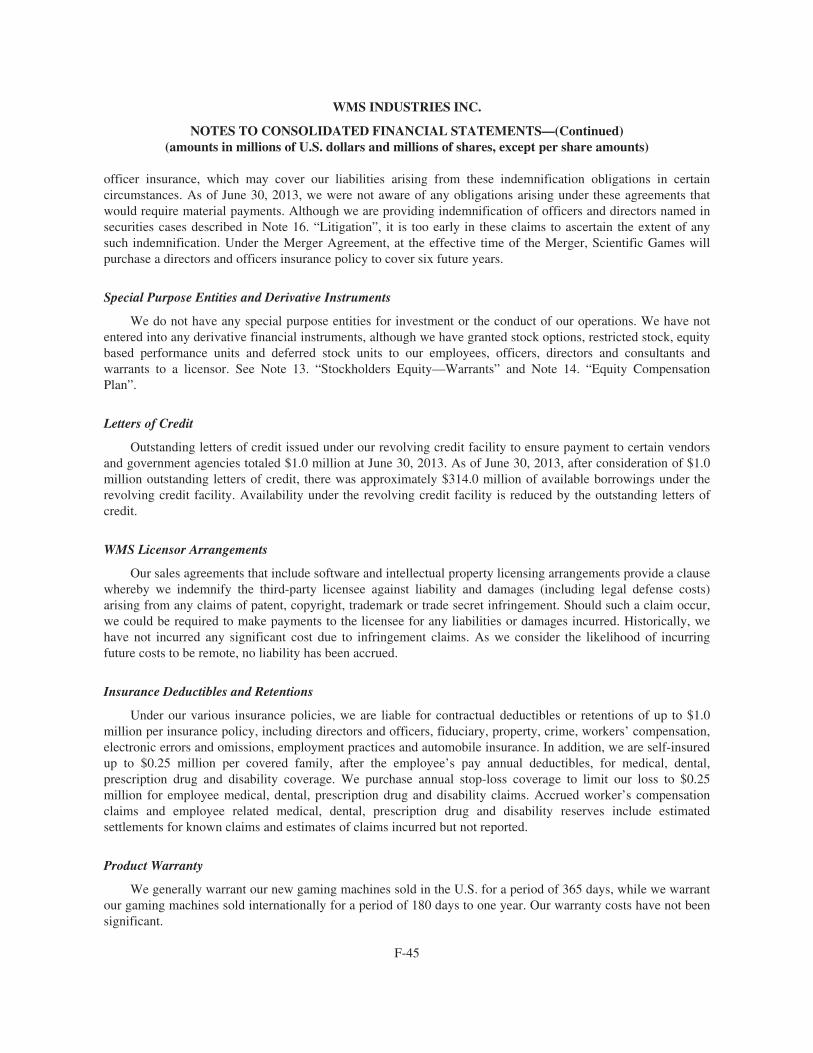
WMS INDUSTRIES INC.
NOTES TO CONSOLIDATED FINANCIAL STATEMENTS—(Continued)(amounts in millions of U.S. dollars and millions of shares, except per share amounts)
officer insurance, which may cover our liabilities arising from these indemnification obligations in certaincircumstances. As of June 30, 2013, we were not aware of any obligations arising under these agreements thatwould require material payments. Although we are providing indemnification of officers and directors named insecurities cases described in Note 16. “Litigation”, it is too early in these claims to ascertain the extent of anysuch indemnification. Under the Merger Agreement, at the effective time of the Merger, Scientific Games willpurchase a directors and officers insurance policy to cover six future years.
Special Purpose Entities and Derivative Instruments
We do not have any special purpose entities for investment or the conduct of our operations. We have notentered into any derivative financial instruments, although we have granted stock options, restricted stock, equitybased performance units and deferred stock units to our employees, officers, directors and consultants andwarrants to a licensor. See Note 13. “Stockholders Equity—Warrants” and Note 14. “Equity CompensationPlan”.
Letters of Credit
Outstanding letters of credit issued under our revolving credit facility to ensure payment to certain vendorsand government agencies totaled $1.0 million at June 30, 2013. As of June 30, 2013, after consideration of $1.0million outstanding letters of credit, there was approximately $314.0 million of available borrowings under therevolving credit facility. Availability under the revolving credit facility is reduced by the outstanding letters ofcredit.
WMS Licensor Arrangements
Our sales agreements that include software and intellectual property licensing arrangements provide a clausewhereby we indemnify the third-party licensee against liability and damages (including legal defense costs)arising from any claims of patent, copyright, trademark or trade secret infringement. Should such a claim occur,we could be required to make payments to the licensee for any liabilities or damages incurred. Historically, wehave not incurred any significant cost due to infringement claims. As we consider the likelihood of incurringfuture costs to be remote, no liability has been accrued.
Insurance Deductibles and Retentions
Under our various insurance policies, we are liable for contractual deductibles or retentions of up to $1.0million per insurance policy, including directors and officers, fiduciary, property, crime, workers’ compensation,electronic errors and omissions, employment practices and automobile insurance. In addition, we are self-insuredup to $0.25 million per covered family, after the employee’s pay annual deductibles, for medical, dental,prescription drug and disability coverage. We purchase annual stop-loss coverage to limit our loss to $0.25million for employee medical, dental, prescription drug and disability claims. Accrued worker’s compensationclaims and employee related medical, dental, prescription drug and disability reserves include estimatedsettlements for known claims and estimates of claims incurred but not reported.
Product Warranty
We generally warrant our new gaming machines sold in the U.S. for a period of 365 days, while we warrantour gaming machines sold internationally for a period of 180 days to one year. Our warranty costs have not beensignificant.
F-45
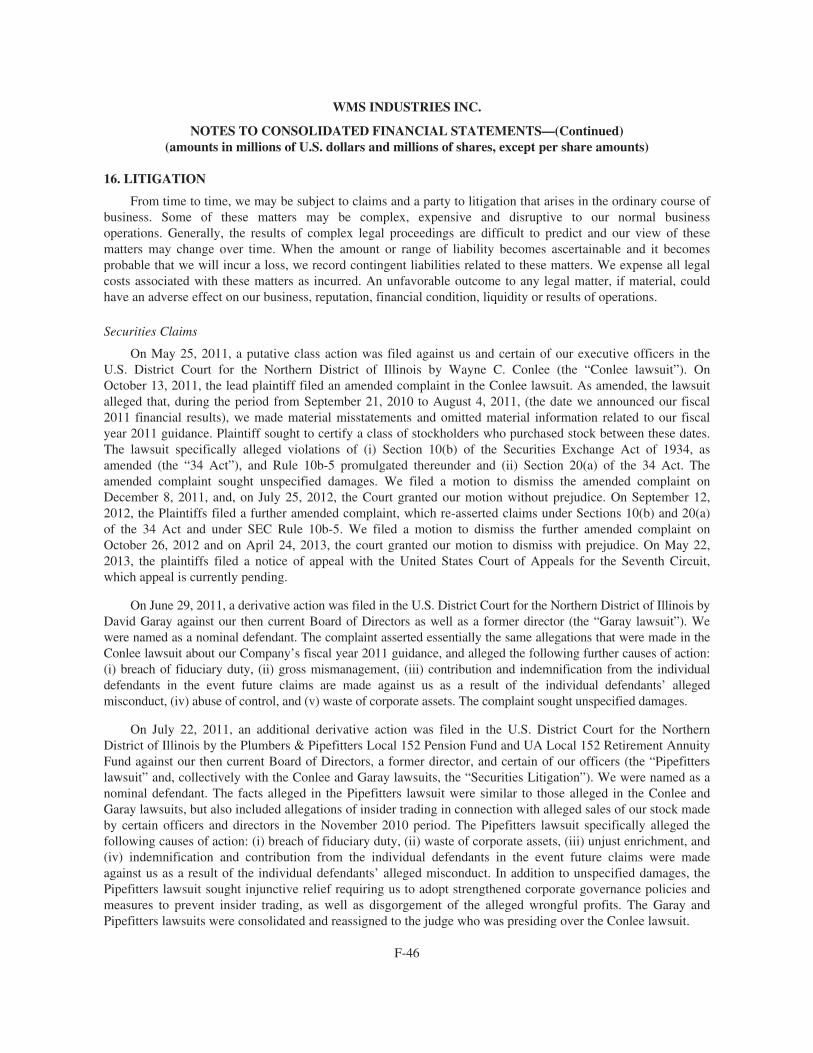
WMS INDUSTRIES INC.
NOTES TO CONSOLIDATED FINANCIAL STATEMENTS—(Continued)(amounts in millions of U.S. dollars and millions of shares, except per share amounts)
16. LITIGATION
From time to time, we may be subject to claims and a party to litigation that arises in the ordinary course ofbusiness. Some of these matters may be complex, expensive and disruptive to our normal businessoperations. Generally, the results of complex legal proceedings are difficult to predict and our view of thesematters may change over time. When the amount or range of liability becomes ascertainable and it becomesprobable that we will incur a loss, we record contingent liabilities related to these matters. We expense all legalcosts associated with these matters as incurred. An unfavorable outcome to any legal matter, if material, couldhave an adverse effect on our business, reputation, financial condition, liquidity or results of operations.
Securities Claims
On May 25, 2011, a putative class action was filed against us and certain of our executive officers in theU.S. District Court for the Northern District of Illinois by Wayne C. Conlee (the “Conlee lawsuit”). OnOctober 13, 2011, the lead plaintiff filed an amended complaint in the Conlee lawsuit. As amended, the lawsuitalleged that, during the period from September 21, 2010 to August 4, 2011, (the date we announced our fiscal2011 financial results), we made material misstatements and omitted material information related to our fiscalyear 2011 guidance. Plaintiff sought to certify a class of stockholders who purchased stock between these dates.The lawsuit specifically alleged violations of (i) Section 10(b) of the Securities Exchange Act of 1934, asamended (the “34 Act”), and Rule 10b-5 promulgated thereunder and (ii) Section 20(a) of the 34 Act. Theamended complaint sought unspecified damages. We filed a motion to dismiss the amended complaint onDecember 8, 2011, and, on July 25, 2012, the Court granted our motion without prejudice. On September 12,2012, the Plaintiffs filed a further amended complaint, which re-asserted claims under Sections 10(b) and 20(a)of the 34 Act and under SEC Rule 10b-5. We filed a motion to dismiss the further amended complaint onOctober 26, 2012 and on April 24, 2013, the court granted our motion to dismiss with prejudice. On May 22,2013, the plaintiffs filed a notice of appeal with the United States Court of Appeals for the Seventh Circuit,which appeal is currently pending.
On June 29, 2011, a derivative action was filed in the U.S. District Court for the Northern District of Illinois byDavid Garay against our then current Board of Directors as well as a former director (the “Garay lawsuit”). Wewere named as a nominal defendant. The complaint asserted essentially the same allegations that were made in theConlee lawsuit about our Company’s fiscal year 2011 guidance, and alleged the following further causes of action:(i) breach of fiduciary duty, (ii) gross mismanagement, (iii) contribution and indemnification from the individualdefendants in the event future claims are made against us as a result of the individual defendants’ allegedmisconduct, (iv) abuse of control, and (v) waste of corporate assets. The complaint sought unspecified damages.
On July 22, 2011, an additional derivative action was filed in the U.S. District Court for the NorthernDistrict of Illinois by the Plumbers & Pipefitters Local 152 Pension Fund and UA Local 152 Retirement AnnuityFund against our then current Board of Directors, a former director, and certain of our officers (the “Pipefitterslawsuit” and, collectively with the Conlee and Garay lawsuits, the “Securities Litigation”). We were named as anominal defendant. The facts alleged in the Pipefitters lawsuit were similar to those alleged in the Conlee andGaray lawsuits, but also included allegations of insider trading in connection with alleged sales of our stock madeby certain officers and directors in the November 2010 period. The Pipefitters lawsuit specifically alleged thefollowing causes of action: (i) breach of fiduciary duty, (ii) waste of corporate assets, (iii) unjust enrichment, and(iv) indemnification and contribution from the individual defendants in the event future claims were madeagainst us as a result of the individual defendants’ alleged misconduct. In addition to unspecified damages, thePipefitters lawsuit sought injunctive relief requiring us to adopt strengthened corporate governance policies andmeasures to prevent insider trading, as well as disgorgement of the alleged wrongful profits. The Garay andPipefitters lawsuits were consolidated and reassigned to the judge who was presiding over the Conlee lawsuit.
F-46
WMS INDUSTRIES INC.
NOTES TO CONSOLIDATED FINANCIAL STATEMENTS—(Continued)(amounts in millions of U.S. dollars and millions of shares, except per share amounts)
On February 26, 2013, Plaintiffs filed a joint stipulation of voluntary dismissal without prejudice in theGaray and Pipefitters lawsuits. The Court subsequently dismissed the suits without prejudice.
In the event that the plaintiffs are successful in their appeal of the court’s dismissal of the Conlee lawsuit,we believe that we have meritorious defenses to the claims and intend to contest it vigorously. It is too early topredict the outcome of the pending appeal or to reasonably estimate the range of possible loss, if any, related tothat lawsuit.
Pursuant to our Bylaws and the indemnification agreements we have entered into with each member of ourBoard of Directors and our officers, we are indemnifying and defending each of the individual defendants namedin the Securities Litigation.
License Claim
In early 2012, International Gaming Technology (“IGT”) initiated an audit by KPMG LLP (“KPMG”) forcompliance with the terms of the Game Manufacturers Cashless License Agreement dated October 1, 2006between the Company and IGT. KPMG’s initial findings have been presented to us and aggregate to $25.5million for under-payments plus $11.1 million in interest. We believe the findings are without merit. We haveheld discussions with IGT to resolve this matter but we are unable at this time to predict the outcome of the claimor to reasonably estimate the range of loss, if any, related to this claim. In the event we are unable to reach amutually acceptable resolution, we intend to fully contest the audit findings.
Merger Claims
The following complaints challenging the Merger have been filed in various jurisdictions: (i) in theDelaware Court of Chancery, Shaev v. WMS Industries, Gamache, et al., (C.A. No. 8279); (ii) in the CircuitCourt of Cook County, Illinois, Chancery Division, Gardner v. WMS Industries, Scientific Games Corp., et al.,No. 2013 CH 3540 (Ill. Cir., Cook County); (iii) in the Circuit Court of the Nineteenth Judicial Circuit of LakeCounty, Illinois, Gil v. WMS Industries, Scientific Games Corp., et al., No. 13 CH 0473 (Ill. Cir., Lake County);(iv) in the Delaware Court of Chancery, Hornsby v. Gamache, et al. (C.A. No. 8295); (v) in the Circuit Court ofthe Nineteenth Judicial Circuit of Lake County, Illinois, Sklodowski v. WMS Industries, Inc. et al., (Ill. Cir.,Lake County); (vi) in the Delaware Court of Chancery, Barresi v. WMS Industries Inc., Gamache, et al., (C.A.No. 8326); and (vii) in the Circuit Court of Cook County, Illinois, Chancery Division, Plumbers & PipefittersLocal 152 Pension Fund and UA Local 152 Retirement Annuity Fund v. WMS Industries Inc., Gamache, et al.,(Ill. Cir., Cook County). Each of the actions is a putative class action filed on behalf of the public stockholders ofWMS and names as defendants the Company, its directors and Scientific Games. The Shaev, Hornsby, Barresiand Plumbers & Pipefitters actions also name Merger Sub and Financing Sub as defendants. The complaintsgenerally allege that the individual defendants breached their fiduciary duties in connection with theirconsideration and approval of the Merger and that the entity defendants aided and abetted those alleged breaches.The complaints seek, among other relief, declaratory judgment and an injunction against the Merger.
On February 25, 2013, the Delaware Court of Chancery consolidated the Delaware actions under In re WMSIndustries Inc. Stockholder Litigation (C.A. No. 8279-VCP). On March 1, 2013, the plaintiffs in the consolidatedDelaware actions filed an amended complaint, adding allegations that the disclosures in WMS’ preliminaryproxy statement were inadequate.
On March 7, 2013, plaintiff Gardner filed a Motion for Leave to File Amended Complaint, asserting thesame claims being asserted in the consolidated Delaware action.
F-47
WMS INDUSTRIES INC.
NOTES TO CONSOLIDATED FINANCIAL STATEMENTS—(Continued)(amounts in millions of U.S. dollars and millions of shares, except per share amounts)
On March 19, 2013, plaintiffs in the consolidated Delaware action submitted a letter to the DelawareChancery Court stating that they had conferred with plaintiffs in the Illinois actions and agreed to stay theconsolidated Delaware action.
Plaintiffs in the Gardner Action and the three other Illinois actions moved for and obtained consolidation ofall the Illinois cases into the Gardner Action. On April 1, 2013, plaintiffs in the Gardner Action filed a motion fora preliminary injunction to enjoin the stockholder vote on the Merger, scheduled for May 10, 2013. On April 19,2013, plaintiffs in all other actions agreed to a stay pending resolution of the Gardner Action. On April 26, 2013,lead counsel in the Gardner Action, on behalf of counsel for all plaintiffs in all actions, agreed with counsel forall defendants in the Gardner Action to withdraw their motion for preliminary injunction and not to seek to enjointhe stockholder vote in return for the agreement by WMS to make certain supplemental disclosures related to theMerger, all of which were set forth in a Report on Form 8K that was filed with the Securities and ExchangeCommission on April 29, 2013. The agreement with lead counsel for the plaintiffs in the Gardner Action will notaffect the amount of Merger consideration that the Company’s stockholders are entitled to receive in the Mergeror any other terms of the Merger Agreement. The litigation is still pending.
The defendants deny all liability with respect to the facts and claims alleged in the Gardner Action andspecifically deny that any breach of fiduciary duty occurred, or that any further disclosure is required tosupplement the Definitive Proxy Statement under any applicable rule, statute, regulation or law.
The outcome of these lawsuits cannot be predicted with any certainty. An adverse judgment for monetarydamages could have a material adverse effect on the operations and liquidity of the Company. A preliminaryinjunction could delay or jeopardize the completion of the Merger, and an adverse judgment granting permanentinjunctive relief could indefinitely enjoin completion of the Merger. The defendants believe that the claimsasserted against them in the lawsuits are without merit and plan to defend against them vigorously. Additionallawsuits arising out of or relating to the Merger Agreement or the Merger may be filed in the future.
17. INFORMATION ON GEOGRAPHIC AREAS
Revenues derived from customers located in the United States accounted for approximately 67%, 70% and67% of our total revenues for the fiscal years ended June 30, 2013, 2012 and 2011, respectively.Approximately 90% of our total long-lived assets as of June 30, 2013 and 2012 were in the United States. Noother country in which we conduct business had greater than 10% of our total revenues, except Canada whichaccounted for 13% of total revenues in fiscal 2013, or long-lived assets for the periods presented.
Geographic revenue and operating information is determined by country of destination. Our operationsoutside the United States include: gaming operations equipment located in Canada, Europe and South Africa;sales and distribution offices in Argentina, Australia, Canada, China, Mexico, South Africa, Spain, the UnitedKingdom and through July 2011, Austria; and game development studios and operations, administrative andproduct development employees in Australia, India, Sweden and the United Kingdom. Substantially all of ourrevenues from customers outside the United States are denominated in U.S. dollars. At June 30, 2013 and 2012,approximately 53% and 54%, respectively, of total current and long-term trade accounts and notes receivablewere from customers located outside of United States.
We have operations based primarily in the United States as well as significant sales and distribution officesbased in international locations.
F-48
WMS INDUSTRIES INC.
NOTES TO CONSOLIDATED FINANCIAL STATEMENTS—(Continued)(amounts in millions of U.S. dollars and millions of shares, except per share amounts)
18. RETIREMENT PLANS
We sponsor 401(k) defined contribution plans within the United States. The plans cover full-time employeesand provide for our contributions of up to 4.5% of covered employees’ compensation as defined in the plans. Wealso provide a deferred compensation plan within the United States to certain key employees. Our expense forthese two plans totaled $5.0 million, $4.7 million and $5.7 million in fiscal 2013, 2012 and 2011, respectively.
We have two frozen defined benefit pension plans related to previously discontinued operations, which arenot material to our Consolidated Financial Statements.
19. SUPPLEMENTAL DISCLOSURE OF CASH FLOW INFORMATION
Additional cash flow information was as follows:
Year endedJune 30,
2013 2012 2011
Income taxes paid . . . . . . . . . . . . . . . . . . . . . . . . . . . . . . . . . . . . . . . . . . . . . . . . . . . . . . . . . $28.1 $50.5 $30.5Interest paid . . . . . . . . . . . . . . . . . . . . . . . . . . . . . . . . . . . . . . . . . . . . . . . . . . . . . . . . . . . . . 1.9 0.7 0.6Gaming operations equipment transferred to inventory . . . . . . . . . . . . . . . . . . . . . . . . . . . . 0.7 6.9 3.9Liabilities assumed in acquisitions . . . . . . . . . . . . . . . . . . . . . . . . . . . . . . . . . . . . . . . . . . . . — 20.2 —Business acquisitions/purchase price adjustments
Fair value of assets . . . . . . . . . . . . . . . . . . . . . . . . . . . . . . . . . . . . . . . . . . . . . . . . . . . . 0.3 — —Fair value of liabilities . . . . . . . . . . . . . . . . . . . . . . . . . . . . . . . . . . . . . . . . . . . . . . . . . 0.3 — —
Cash payments of amounts accrued as of the acquisition date are reflected in financing cash flows. Paymentsfor amounts accrued subsequent to the acquisition date, in excess of amounts accrued as part of the purchaseprice allocation, are reflected in operating cash flows within changes in accounts payable and accrued liabilities.
For other non-cash transactions related to income taxes, see Note 11. “Income Taxes.”
20. QUARTERLY FINANCIAL INFORMATION (UNAUDITED)
Summarized quarterly financial information is as follows for each quarterly period in fiscal 2013 and 2012:
Sept. 302012
Dec. 312012
Mar. 312013
Jun. 302013
Fiscal 2013 QuartersRevenues . . . . . . . . . . . . . . . . . . . . . . . . . . . . . . . . . . . . . . . . . . . . . . . . . . . . . $159.1 $157.5 $177.9 $202.8Cost of product sales . . . . . . . . . . . . . . . . . . . . . . . . . . . . . . . . . . . . . . . . . . . . 41.3 43.2 49.2 56.5Cost of gaming operations . . . . . . . . . . . . . . . . . . . . . . . . . . . . . . . . . . . . . . . . 15.2 13.7 14.8 13.7Operating income . . . . . . . . . . . . . . . . . . . . . . . . . . . . . . . . . . . . . . . . . . . . . . 12.6 7.0 5.2 19.9Net income . . . . . . . . . . . . . . . . . . . . . . . . . . . . . . . . . . . . . . . . . . . . . . . . . . . 9.3 4.3 7.5 13.5Earnings per share:
Basic . . . . . . . . . . . . . . . . . . . . . . . . . . . . . . . . . . . . . . . . . . . . . . . . . . . . $ 0.17 $ 0.08 $ 0.14 $ 0.25
Diluted . . . . . . . . . . . . . . . . . . . . . . . . . . . . . . . . . . . . . . . . . . . . . . . . . . . $ 0.17 $ 0.08 $ 0.14 $ 0.24
Weighted-average common shares:Basic common stock . . . . . . . . . . . . . . . . . . . . . . . . . . . . . . . . . . . . . . . . 54.5 54.5 54.7 54.8
Diluted common stock and common stock equivalents . . . . . . . . . . . . . 54.7 54.6 55.1 55.6
F-49
WMS INDUSTRIES INC.
NOTES TO CONSOLIDATED FINANCIAL STATEMENTS—(Continued)(amounts in millions of U.S. dollars and millions of shares, except per share amounts)
Sept. 302011
Dec. 312011
Mar. 312012
Jun. 302012
Fiscal 2012 QuartersRevenues . . . . . . . . . . . . . . . . . . . . . . . . . . . . . . . . . . . . . . . . . . . . . . . . . . . . . $155.6 $162.2 $176.0 $195.9Cost of product sales . . . . . . . . . . . . . . . . . . . . . . . . . . . . . . . . . . . . . . . . . . . . 42.8 48.7 53.3 60.4Cost of gaming operations . . . . . . . . . . . . . . . . . . . . . . . . . . . . . . . . . . . . . . . . 14.3 14.4 12.6 14.2Operating income . . . . . . . . . . . . . . . . . . . . . . . . . . . . . . . . . . . . . . . . . . . . . . 3.5 21.0 31.2 31.7Net income . . . . . . . . . . . . . . . . . . . . . . . . . . . . . . . . . . . . . . . . . . . . . . . . . . . 3.8 16.1 22.1 22.1Earnings per share:
Basic . . . . . . . . . . . . . . . . . . . . . . . . . . . . . . . . . . . . . . . . . . . . . . . . . . . . $ 0.07 $ 0.29 $ 0.40 $ 0.40
Diluted . . . . . . . . . . . . . . . . . . . . . . . . . . . . . . . . . . . . . . . . . . . . . . . . . . . $ 0.07 $ 0.29 $ 0.40 $ 0.40
Weighted-average common shares:Basic common stock . . . . . . . . . . . . . . . . . . . . . . . . . . . . . . . . . . . . . . . . 56.2 55.6 55.2 54.9
Diluted common stock and common stock equivalents . . . . . . . . . . . . . 56.6 55.8 55.5 55.2
In the quarter ended December 31, 2012, we incurred approximately $2.5 million of pre-tax charges, or$0.03 per diluted share, related to the process our Board of Directors utilized in the sale of the Company. Inaddition, we recorded a $2.0 million after-tax charge, or $0.04 per diluted share, related to a non-U.S. tax charge.
In the quarter ended March 31, 2013, we incurred approximately $7.4 million of pre-tax charges, or $0.09per diluted share, related to the process our Board of Directors utilized in the sale of the Company, pluscompleting the closing conditions and the integration efforts prior to the effective time of the pending Merger.Results also included a $2.0 million after-tax benefit, or $0.04 per diluted share, for the retroactive reinstatementof the U.S. Federal Research and Development Tax Credit and a $0.7 million after-tax benefit, or $0.01 perdiluted share, from the reduction of our liability of uncertain taxes due to the expiration of the statute oflimitations for fiscal 2009.
In the quarter ended June 30, 2013, we incurred approximately $3.6 million of pre-tax charges, or $0.04 perdiluted share, related to the process our Board of Directors utilized in the sale of the Company, plus completingthe closing conditions and the integration efforts prior to the effective time of the pending Merger. In addition,net income included a $1.3 million after-tax charge, or $0.02 per diluted share, to establish valuation allowanceagainst certain foreign deferred tax assets relating to foreign net operating losses. In addition, net incomeincluded a $1.5 million after-tax benefit, or $0.03 per diluted share, from the completion of the fiscal 2010Federal income tax audit, a $0.7 million after-tax benefit, or a $0.01 per diluted share, of other discrete tax itemsand a $0.6 million after-tax benefit, or $0.01 per diluted share, for the U.S. Federal Research and DevelopmentTax Credit.
In the quarter ended September 30, 2011, we recorded $14.0 million of pre-tax charges, or $0.17 per dilutedshare, which includes $9.7 million, or $0.12 per diluted share, of pre-tax impairment and restructuring chargesincluding $5.9 million of separation-related charges and $3.8 million of costs related to the decision to close twofacilities, and $4.3 million pre-tax, or $0.05 per diluted share, of non-cash charges to write-down receivablesfollowing government enforcement actions at certain casinos in Mexico.
In the quarter ended December 31, 2011, we recorded $2.1 million, or $0.02 per diluted share, of pre-taxproceeds from litigation settlement.
In the quarter ended June 30, 2012, we recorded a $0.7 million, or $0.01 per diluted share, pre-tax benefit todecrease the reserve for Mexican customer receivables recorded in the September 2011 quarter and recorded$2.1 million, or $0.01 per diluted share, of pre-tax charges for legal settlements.
F-50
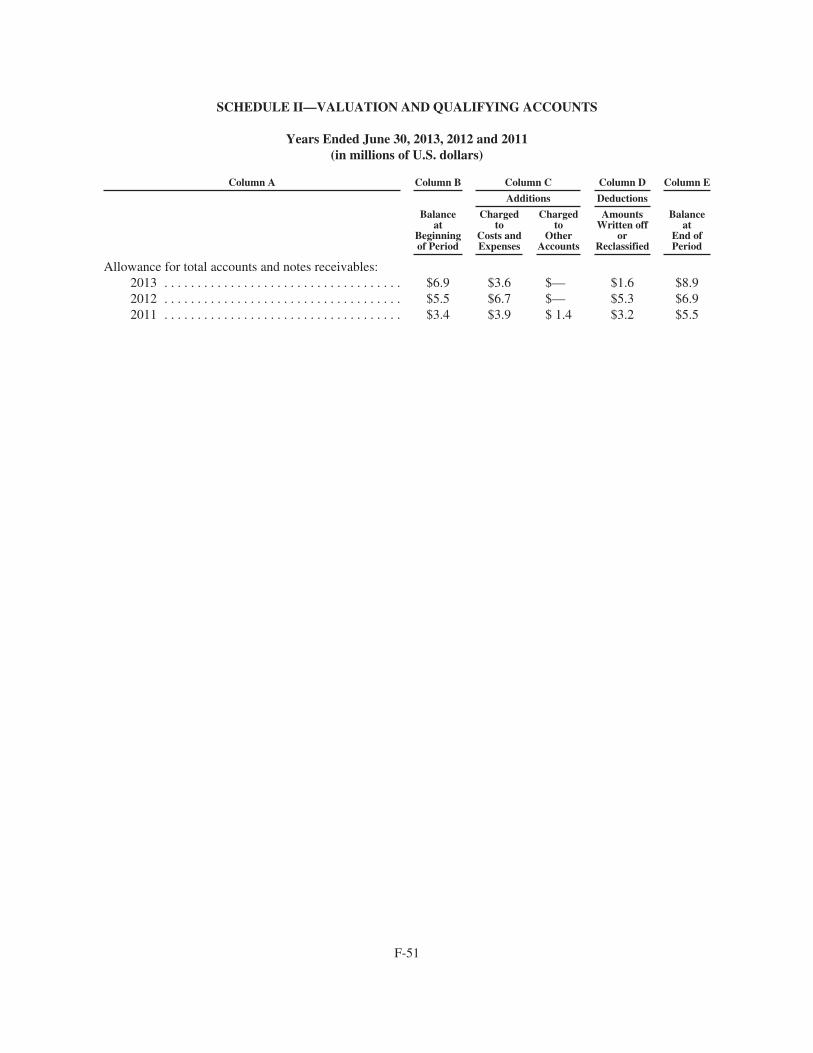
SCHEDULE II—VALUATION AND QUALIFYING ACCOUNTS
Years Ended June 30, 2013, 2012 and 2011(in millions of U.S. dollars)
Column A Column B Column C Column D Column E
Balanceat
Beginningof Period
Additions Deductions
Balanceat
End ofPeriod
Chargedto
Costs andExpenses
Chargedto
OtherAccounts
AmountsWritten off
orReclassified
Allowance for total accounts and notes receivables:2013 . . . . . . . . . . . . . . . . . . . . . . . . . . . . . . . . . . . . $6.9 $3.6 $— $1.6 $8.92012 . . . . . . . . . . . . . . . . . . . . . . . . . . . . . . . . . . . . $5.5 $6.7 $— $5.3 $6.92011 . . . . . . . . . . . . . . . . . . . . . . . . . . . . . . . . . . . . $3.4 $3.9 $ 1.4 $3.2 $5.5
F-51
SIGNATURES
Pursuant to the requirements of Section 13 or 15(d) of the Securities Exchange Act of 1934, as amended, theRegistrant has duly caused this Report to be signed on its behalf by the undersigned, thereunto duly authorized,on the 29th day of August, 2013.
WMS INDUSTRIES INC.
By: /S/ BRIAN R. GAMACHE
Brian R. GamacheChairman of the Board & Chief Executive Officer
Pursuant to the requirements of the Securities Exchange Act of 1934, as amended, this Report has been dulysigned below by the following persons on behalf of the Registrant and in the capacities and on the datesindicated.
Signature Positions Date
/S/ BRIAN R. GAMACHE
Brian R. GamacheChairman of the Board and
Chief Executive Officer(Principal Executive Officer)
August 29, 2013
/S/ SCOTT D. SCHWEINFURTH
Scott D. SchweinfurthExecutive Vice President, Chief
Financial Officer and Treasurer(Principal Financial Officer)
August 29, 2013
/S/ JOHN P. MCNICHOLAS, JR.John P. McNicholas, Jr.
Vice President, Controller andChief Accounting Officer(Principal Accounting Officer)
August 29, 2013
/S/ EDWARD W. RABIN, JR.Edward W. Rabin, Jr.
Lead Director August 29, 2013
/S/ ROBERT J. BAHASH
Robert J. BahashDirector August 29, 2013
/S/ PATRICIA M. NAZEMETZ
Patricia M. NazemetzDirector August 29, 2013
/S/ MATTHEW H. PAULL
Matthew H. PaullDirector August 29, 2013
/S/ IRA S. SHEINFELD
Ira S. SheinfeldDirector August 29, 2013
/S/ BOBBY L. SILLER
Bobby L. SillerDirector August 29, 2013
/S/ WILLIAM J. VARESCHI, JR.William J. Vareschi, Jr.
Director August 29, 2013
/S/ KEITH R. WYCHE
Keith R. WycheDirector August 29, 2013
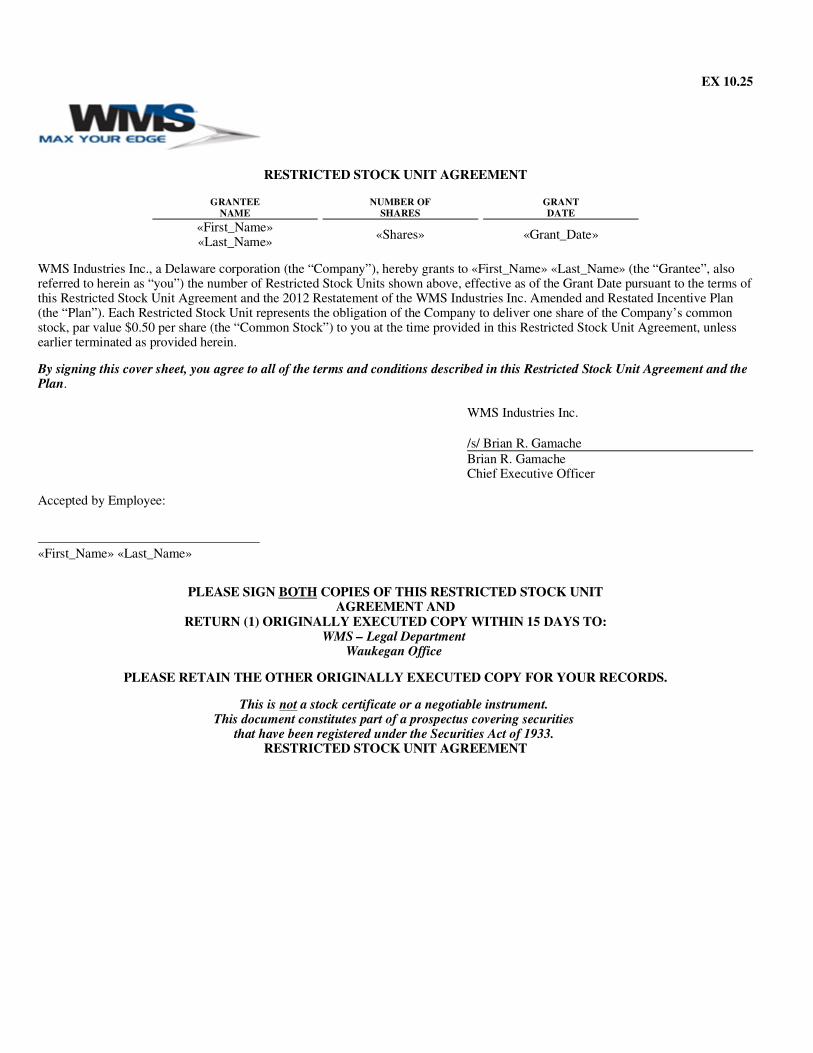
EX 10.25
RESTRICTED STOCK UNIT AGREEMENT
WMS Industries Inc., a Delaware corporation (the “Company”), hereby grants to «First_Name» «Last_Name» (the “Grantee”, also referred to herein as “you”) the number of Restricted Stock Units shown above, effective as of the Grant Date pursuant to the terms of this Restricted Stock Unit Agreement and the 2012 Restatement of the WMS Industries Inc. Amended and Restated Incentive Plan (the “Plan”). Each Restricted Stock Unit represents the obligation of the Company to deliver one share of the Company’s common stock, par value $0.50 per share (the “Common Stock”) to you at the time provided in this Restricted Stock Unit Agreement, unless earlier terminated as provided herein.
By signing this cover sheet, you agree to all of the terms and conditions described in this Restricted Stock Unit Agreement and the Plan.
Accepted by Employee:
«First_Name» «Last_Name»
PLEASE SIGN BOTH COPIES OF THIS RESTRICTED STOCK UNIT AGREEMENT AND
RETURN (1) ORIGINALLY EXECUTED COPY WITHIN 15 DAYS TO: WMS – Legal Department
Waukegan Office
PLEASE RETAIN THE OTHER ORIGINALLY EXECUTED COPY FOR YOUR RECORDS.
This is not a stock certificate or a negotiable instrument. This document constitutes part of a prospectus covering securities
that have been registered under the Securities Act of 1933. RESTRICTED STOCK UNIT AGREEMENT
GRANTEENAME
NUMBER OFSHARES
GRANT DATE
«First_Name»«Last_Name»
«Shares»
«Grant_Date»
WMS Industries Inc.
/s/ Brian R. Gamache Brian R. GamacheChief Executive Officer
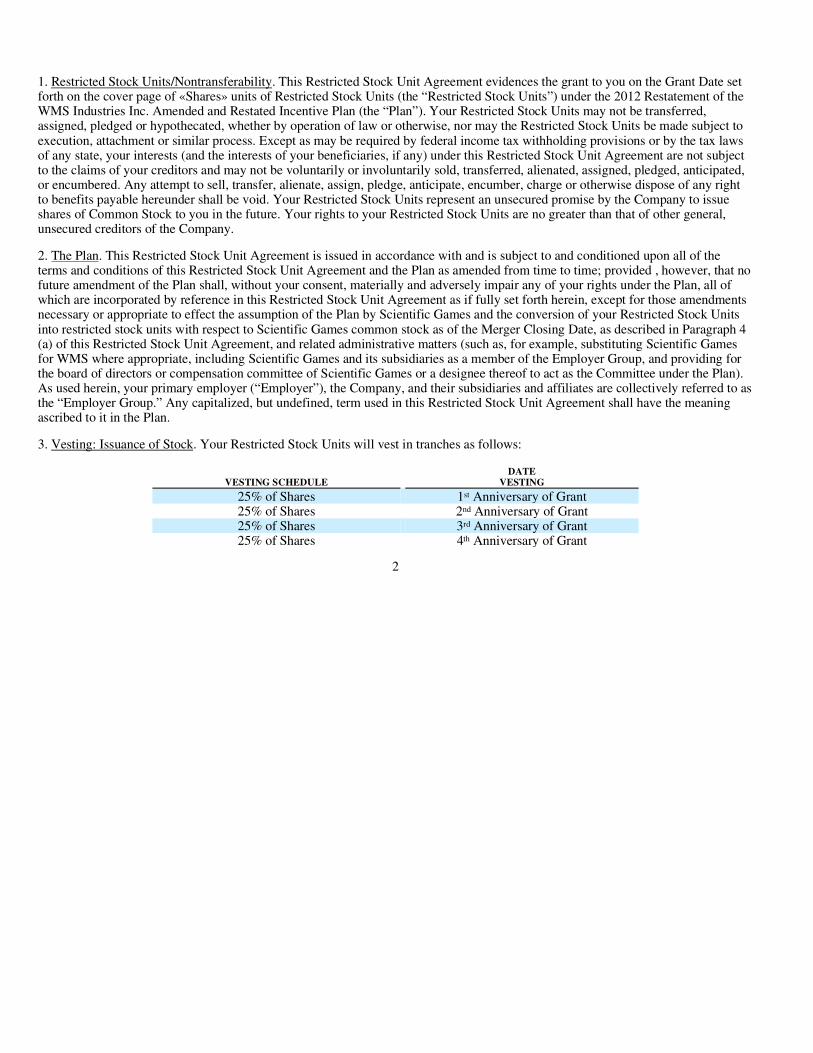
1. Restricted Stock Units/Nontransferability. This Restricted Stock Unit Agreement evidences the grant to you on the Grant Date set forth on the cover page of «Shares» units of Restricted Stock Units (the “Restricted Stock Units”) under the 2012 Restatement of the WMS Industries Inc. Amended and Restated Incentive Plan (the “Plan”). Your Restricted Stock Units may not be transferred, assigned, pledged or hypothecated, whether by operation of law or otherwise, nor may the Restricted Stock Units be made subject to execution, attachment or similar process. Except as may be required by federal income tax withholding provisions or by the tax laws of any state, your interests (and the interests of your beneficiaries, if any) under this Restricted Stock Unit Agreement are not subject to the claims of your creditors and may not be voluntarily or involuntarily sold, transferred, alienated, assigned, pledged, anticipated, or encumbered. Any attempt to sell, transfer, alienate, assign, pledge, anticipate, encumber, charge or otherwise dispose of any right to benefits payable hereunder shall be void. Your Restricted Stock Units represent an unsecured promise by the Company to issue shares of Common Stock to you in the future. Your rights to your Restricted Stock Units are no greater than that of other general, unsecured creditors of the Company.
2. The Plan. This Restricted Stock Unit Agreement is issued in accordance with and is subject to and conditioned upon all of the terms and conditions of this Restricted Stock Unit Agreement and the Plan as amended from time to time; provided , however, that no future amendment of the Plan shall, without your consent, materially and adversely impair any of your rights under the Plan, all of which are incorporated by reference in this Restricted Stock Unit Agreement as if fully set forth herein, except for those amendments necessary or appropriate to effect the assumption of the Plan by Scientific Games and the conversion of your Restricted Stock Units into restricted stock units with respect to Scientific Games common stock as of the Merger Closing Date, as described in Paragraph 4(a) of this Restricted Stock Unit Agreement, and related administrative matters (such as, for example, substituting Scientific Games for WMS where appropriate, including Scientific Games and its subsidiaries as a member of the Employer Group, and providing for the board of directors or compensation committee of Scientific Games or a designee thereof to act as the Committee under the Plan). As used herein, your primary employer (“Employer”), the Company, and their subsidiaries and affiliates are collectively referred to as the “Employer Group.” Any capitalized, but undefined, term used in this Restricted Stock Unit Agreement shall have the meaning ascribed to it in the Plan.
3. Vesting: Issuance of Stock. Your Restricted Stock Units will vest in tranches as follows:
2
VESTING SCHEDULE DATE
VESTING
25% of Shares 1 Anniversary of Grant25% of Shares 2 Anniversary of Grant25% of Shares 3 Anniversary of Grant25% of Shares 4 Anniversary of Grant
st
nd
rd
th
Promptly after your Restricted Stock Units vest, the Company will cause to be issued to you (or your beneficiary(ies) or personal representative, if you are deceased) in book-entry in the records of the Company’s transfer agent or otherwise in accordance with Scientific Games’ customary practices, shares of Common Stock equal to the number of vested Restricted Stock Units granted herein.
4. Conversion/Change in Control/Accelerated Vesting. On January 30, 2013, the Company entered into a merger agreement (the “Merger Agreement”) with Scientific Games Corporation (“Scientific Games”) pursuant to which the Company will become a wholly owned subsidiary of Scientific Games (the “Merger”).
Notwithstanding anything to the contrary set forth in the Plan, your Restricted Stock Units will continue to be subject to Section 11 of the Plan following the Merger Closing Date.
3
a. Conversion. On the “Merger Closing Date” (as defined in the Merger Agreement), 50% of each tranche of your Restricted Stock Units will not vest, but rather will be converted into a number of restricted stock units with respect to Scientific Games common stock that is equal to the number of Restricted Stock Units Stock immediately prior to the Merger Closing Date multiplied by the Incentive Award Exchange Ratio (rounded down to the nearest whole share). The “Incentive Award Exchange Ratio” is the quotient of (x) the per share closing price of the Company common stock on the Merger Closing Date (or, if such date is not a trading day, the trading day immediately preceding the Merger Closing Date) divided by (y) the per share closing price of Scientific Games common stock on the Merger Closing Date (or, if such date is not a trading day, the trading day immediately preceding the Merger Closing Date). Your restricted stock units with respect to Scientific Games common stock will represent the right to receive, in accordance with the terms of the Plan and this Restricted Stock Unit Agreement, the number of shares of Scientific Games common stock, in accordance with the vesting schedule set forth in Paragraph 3 above.
b. Change in Control. Notwithstanding paragraph 3, on the Merger Closing Date, your right to receive shares of Company common stock shall immediately vest as to the 50% of each tranche of your Restricted Stock Units that does not convert into restricted stock units with respect to Scientific Games common stock pursuant to paragraph 4(a). Notwithstanding the foregoing or anything to the contrary set forth in the Plan, you hereby agree as a condition to receiving your Restricted Stock Units, that the Merger shall not constitute a “Change in Control” under Section 10of the Plan for purposes of your Restricted Stock Units that convert pursuant to paragraph 4(a) and that vesting of such Restricted Stock Units will not accelerate on the Merger Closing Date.
“Cause” shall have the meaning assigned such term in your employment agreement or other applicable individual agreement with the Employer Group in effect on the date hereof, if such term is defined in any such agreement, or if the term “cause” is not defined in your agreement or you are not a party to any such agreement, the definition of Cause shall mean the occurrence of any one of the following events: (i) misconduct in connection with your duties, or failure or refusal to perform your responsibilities; (ii) material breach of an agreement with the Employer Group including, without limitation, any violation of any agreements concerning confidentiality, trade secrets, inventions, non-solicitation or noncompetition; (iii) violation of any material Employer Group rule, regulation, procedure or policy (including but not limited to the Company’s Code of Conduct) or any amendment thereto that the Employer Group may adopt during your employment; (iv) any action that is harmful or detrimental to the property, reputation, goodwill or business of the Employer Group monetarily or otherwise, including, without limitation, any fraud, dishonesty, misappropriation, moral turpitude, or breach of fiduciary duty which involves personal profit or other act of misconduct; (v) chronic use of alcohol, drugs or other similar substances which affects your work performance; or (vi) conduct by you, whether with respect to your employment or otherwise, which is a felony of any type or otherwise in violation of the criminal laws of the United States or any State or subdivision thereof (excluding minor violations), as allowed by law, or which is reasonably likely to result in the loss of a gaming license held by any member of the Employer Group or Scientific Games or any of its Affiliates or in any such entity’s inability to become so licensed. “Good Reason” shall mean the occurrence of any one of the following events without your written consent: (i) a material diminution in your base salary and annual bonus opportunity; (ii) a material diminution in your authority, duties or responsibility; (iii) a relocation of your place of employment by more than 50 miles from its current location; or (iv) any action or inaction that constitutes a material breach of any employment agreement between the Employer Group and you. Notwithstanding anything herein to the contrary, you shall not be treated as having resigned for Good Reason unless one of more conditions set forth in items (i) through (iv) exists and (a) you provide notice to Scientific Games within 90 days of the existence of the condition, (b) Scientific Games does not remedy the condition within 30 days of receipt of such notice and (c) you terminate your employment within two years following the initial existence of the condition.
4
c. Acceleration Upon a Termination of Service without Cause or for Good Reason. Notwithstanding paragraph 3, upon a Termination of Service without Cause or for Good Reason (as defined below), in each case, within one year following the Merger Closing Date your right to the shares of Scientific Games common stock under this Restricted Stock Unit Agreement shall immediately vest as to 100% of the total number of shares covered by this grant.
For purposes of clarification, you expressly acknowledge and agree that your Restricted Stock Units will not be covered by any accelerated vesting or payment provisions otherwise applicable under any agreement or arrangement between you and any member of the Employer Group, and the absence of any such acceleration will not constitute “Good Reason” (or similar concept) or a material breach of your employment agreement if you have one.
5. Termination. Your Restricted Stock Units will terminate immediately without vesting upon any Termination of Service (other than a Termination of Service without Cause or for Good Reason, in each case, within one year following the Merger Closing Date, or a Termination of Service on account of your death or permanent and total disability).
6. Additional Forfeiture. The Compensation Committee of the Board of Directors or, after the Merger, the board of directors or compensation committee of Scientific Games or a designee thereof may cancel, suspend, withhold or otherwise limit or restrict the delivery of shares of Common Stock under your Restricted Stock Units at any time if you (i) are not in compliance with all applicable provisions of this Restricted Stock Unit Agreement or the Plan or (ii) engage in any activity inimical, contrary or harmful to the interests of the Employer Group, including, but not limited to: (A) conduct related to your service or employment for which either criminal or civil penalties against you may be sought, (B) violation of any policies of the Employer Group, including, without limitation, insider trading policies or anti-harassment policies or (C) participating in a hostile takeover attempt against the Employer Group.
7. Restrictive Covenants. As a condition of and in consideration for your receipt of these Restricted Stock Units and in consideration for «Grant_Reason», you agree with the Company as follows:
5
d. Acceleration Upon Death or Disability. Notwithstanding Paragraph 3, your right to receive shares of WMS common stock or Scientific Games common stock under this Restricted Stock Agreement shall immediately vest as to 100% of the total number of shares covered by this grant upon the occurrence of your Termination of Service on account of your death or permanent and total disability.
(a) Acknowledgments. You acknowledge that:
(i) The Employer Group is engaged in the business of designing, developing, commercializing, promoting, operating and administering both business to business and business to customer wagering and non-wagering products and services including casino gaming products, on-line gaming products and interactive casual, social and advertising games as well as related social media games, game themes, game play concepts, gaming systems, gaming platforms, gaming websites, and online game play; manufacturing, selling, leasing and distributing gaming products and services (e.g., without limitation, video and reel spinning slot machines, video poker games,
6
video lottery terminals, local progressives, wide-area progressive systems and interactive games), related gaming systems hardware, software and platforms, as well as ancillary products associated with such gaming products and services, including without limitation marketing materials, chairs, and signage (“Business”). All of the foregoing products and services within the scope of the Business may be referred to individually as “Games” and collectively as “Gaming.”
(ii) As an integral part of its Business, the Employer Group develops and maintains proprietary, confidential and trade secret information relating to specific Games, Gaming generally, and any Games being developed, its Business, including, but not limited to, information related to design, product development plans and strategies, techniques for Game design and development, knowledge regarding and plans for the integration of hardware and software, product maintenance and operations, Game concepts, bonus concepts, product and marketing strategies, mathematical formulas, license agreements, research regarding players’ behavior and trends, Gaming and Game themes, licensed and non-licensed themes, and strategic marketing.
(iii) The Employer Group undertakes various efforts and measures to maintain the secrecy and confidentiality of its
proprietary, confidential and trade secret information.
(iv) You have or will have access to and knowledge of such proprietary, confidential and trade secret information.
(v) The scope of the covenants and restrictions on future employment set forth below, including with respect to time,
territory and industry are reasonable and fair and are necessary for the protection of the Employer Group’s proprietary, confidential and trade secret information.
(vi) The scope of the covenants and restrictions contained herein in no way limit you from utilizing in future employment your general skills and abilities as well as the general and non-proprietary, non-confidential and non-trade secret information and knowledge that you have or will obtain, acquire and develop in the course of employment with the Employer Group.
(vii) For a period of one (1) year following your Termination of Service, you would not be able to work for a competing business anywhere in the world without using or disclosing the proprietary, confidential or trade secret information of the Employer Group, regardless of any measures taken by you or a future employer to protect and preserve the Employer Group’s proprietary, confidential or trade secret information.
(viii) You have both general and specific skills and abilities that are beneficial across many industries outside of the
Business and which are located throughout the world, including throughout the United States.
8. No Stockholder Rights. You will not have any stockholder rights, such as rights to vote or to receive dividends or other distributions, with respect to any Restricted Stock Units held by you. As a holder of Restricted Stock Units, you will have only the cash dividend equivalents and adjustment rights provided in this Restricted Stock Unit Agreement.
9. Securities Laws. The Company shall not be obligated to issue any Common Stock pursuant to this Restricted Stock Unit Agreement if, in the opinion of counsel to the Company,
7
(b) Covenants. You hereby covenant and agree that during your employment by the Employer Group and for a period of one
(1) year following your Termination of Service for any reason other than death or disability:
(i) You shall not engage or participate in, or assist, advise or otherwise be connected with (including as an employee, independent contractor, owner, partner, member, shareholder, officer, director, advisor, consultant, lender, supplier, agent or otherwise) a business located anywhere in the world which is in competition with the Business; provided, however, that nothing in this Restricted Stock Unit Agreement shall prevent you from acquiring or owning, as a passive investment, up to one percent (1%) of the outstanding voting securities of an entity engaged in a competing Business which securities are publicly traded in any recognized national securities market;
(ii) You shall not solicit or attempt to solicit (i) any person, Employer Group or entity who is or has been a customer of the Employer Group during the one (1) year period prior to your Termination of Service to do business with any person, company or entity other than the Employer Group, or (ii) solicit for employment or employ any employee of the Employer Group or any person who is or was employed by the Employer Group during the one (1) year period prior to your Termination of Service, or take any actions which are calculated to persuade any such person to terminate his or her association with the Employer Group.
(c) Injunctive Relief. You acknowledge that any violation or threatened violation by you of the covenants contained in this Restricted Stock Unit Agreement would cause material and irreparable harm to the Employer Group and that the Employer Group would not have an adequate remedy at law because it will be difficult or impossible to establish the full and precise monetary value of such damage. The Employer Group agrees that, in addition to any and all other remedies available to it at law or in equity, the Employer Group shall have the right to have your violation or threatened violation of any of the covenants contained herein restrained by equitable relief, including, but not limited to, a temporary restraining order, a preliminary injunction, a permanent injunction, or such other alternative relief as may be appropriate, without the necessity of the Employer Group posting any bond. In the event you breach the covenants contained herein, the restricted period applicable to you shall be extended for the period of such breach.
(d) Indemnification. You agree to indemnify, save and hold harmless the Employer Group from and against any and all claims, damages, losses and expenses (including reasonable attorneys’ and expert witness fees) resulting from or arising out of any breach by you of this Restricted Stock Unit Agreement, or incurred by the Employer Group in enforcing this Restricted Stock Unit Agreement against you.
(e) Other Limitations. The provisions of this paragraph 7 are in addition to the award forfeiture provisions set forth in
Section 11 of the Plan and in no way modify, amend or change such Plan provisions.
the shares to be so issued are required to be registered or otherwise qualified under the United States Securities Act of 1933, as amended, or under any other applicable statute, regulation or ordinance affecting the sale of securities, unless and until such shares have been so registered or otherwise qualified.
10. Choice of Law. This Restricted Stock Unit Agreement shall be governed by and construed and interpreted in accordance with the substantive laws of the State of Delaware, without giving effect to any conflicts of law rule or principle that might require the application of the laws of another jurisdiction.
11. Income Taxes. You agree to comply with the appropriate procedures established by the Company, from time to time, to provide for payment or withholding of such income or other taxes as may be required by law to be paid or withheld with the vesting of this Restricted Stock Unit.
12. No Right to Further Grants. Restricted Stock Unit grants are within the discretion of the Plan Administrator, and no such grant entitles you to any further grants.
13. Employment Not Affected. Neither the grant of any Restricted Stock Units, nor any other action taken with respect to the Restricted Stock Units, shall confer upon the Grantee any right to continue in the employ of the Employer Group or shall interfere in any way with the right of the Employer Group to terminate Grantee’s employment at any time. Except as may be otherwise limited by another written agreement, the right of the Employer Group to terminate at will the Grantee’s employment with it at any time (whether by dismissal, discharge, retirement or otherwise) is specifically reserved.
14. Interpretations Binding. Plan Administrator interpretations and determinations are binding and conclusive.
8
EXHIBIT 21SUBSIDIARIES OF WMS INDUSTRIES INC.
The following is a list of all direct and indirect subsidiaries of the Company and their jurisdictions ofincorporation as of June 30, 2013. The name of each indirect subsidiary is indented under the name of its parentcompany.
SubsidiaryJurisdiction ofIncorporation/Formation
WMS Gaming Inc. DelawareWMS Gaming (Canada) Ltd. New Brunswick, CanadaWMS Gaming International, S.L. Spain
WMS Gaming Peru S.R.L.WMS Gaming International, S.L. Sucursal Italia (Branch)WMS Gaming International, S.L. Sucursal Argentina (Branch)
PeruItalyArgentina
WMS Gaming Australia Pty Ltd. AustraliaWMS Gaming Africa (Pty) Ltd. South AfricaWMS Gaming (UK) Limited United KingdomWMSGaming Mexico, S. de R.L. de C.V. MexicoWMSGaming Mexico Services, S. de R.L. de C.V. Mexico
Lenc-Smith Inc. DelawareWilliams Electronics Games, Inc. Delaware
WMS Finance Inc. DelawareWMS International Holdings Inc. Delaware
Orion Financement Company B.V. NetherlandsOrion Real Estate B.V. NetherlandsOrion Assembly B.V. NetherlandsMercur Holland B.V. Netherlands
Orion Gaming B.V. NetherlandsWMS Gaming Services Europe, S.L. Spain
WMS Asia Holdings Inc. DelawareWMS International (Macau) Limited MacauWMS Gaming Solutions India Private Limited India
WMS Alderney 1 Limited AlderneyWMS Alderney 2 Limited. AlderneyWMS Marketing UK Ltd. United Kingdom
Lenc Software Holdings LLC DelawareWilliams Interactive LLC Delaware
Williams Interactive (Canada) Ltd. British Columbia, CanadaWilliams Interactive (Gibraltar) Ltd. Gibraltar
Jadestone Group AB SwedenJadestone Networks (Malta) Ltd. Malta
Phantom EFX, LLC Iowa
EXHIBIT 23
CONSENT OF INDEPENDENT REGISTERED PUBLIC ACCOUNTING FIRM
We consent to the incorporation by reference in the following Registration Statements and related Prospectusesof WMS Industries Inc.:
(1) Registration Statement No. 333-57585 on Form S-8 filed June 24, 1998,
(2) Registration Statement No. 333-46726 on Form S-8 filed September 27, 2000,
(3) Registration Statement No. 333-55574 on Form S-8 filed February 14, 2001,
(4) Registration Statement No. 333-101538 on Form S-8 filed November 27, 2002,
(5) Registration Statement No. 333-107321 on Form S-3 filed July 25, 2003,
(6) Registration Statement No. 333-121199 on Form S-8 filed December 13, 2004,
(7) Registration Statement No. 333-121766 on Form S-8 filed December 30, 2004,
(8) Registration Statement No. 333-139425 on Form S-8 filed December 15, 2006,
(9) Registration Statement No. 333-158919 on Form S-8 filed April 30, 2009,
(10) Registration Statement No. 333-163767 on Form S-8 filed December 16, 2009 and
(11) Registration Statement No. 333-185481 on Form S-8 filed December 14, 2012
of our reports dated August 29, 2013, with respect to the consolidated financial statements and schedule of WMSIndustries Inc. and the effectiveness of internal control over financial reporting of WMS Industries Inc., includedin this Annual Report (Form 10-K) for the year ended June 30, 2013.
/s/ Ernst & Young LLP
Chicago, IllinoisAugust 29, 2013
EXHIBIT 31CERTIFICATIONS
I, Brian R. Gamache certify that:
1. I have reviewed this annual report on Form 10-K of WMS Industries Inc.;
2. Based on my knowledge, this report does not contain any untrue statement of a material fact or omit to state amaterial fact necessary to make the statements made, in light of the circumstances under which such statementswere made, not misleading with respect to the period covered by this report;
3. Based on my knowledge, the financial statements, and other financial information included in this report, fairlypresent in all material respects the financial condition, results of operations and cash flows of WMS IndustriesInc. as of, and for, the periods presented in this report;
4. The registrant’s other certifying officer and I are responsible for establishing and maintaining disclosurecontrols and procedures (as defined in Exchange Act Rules 13a–15(e) and 15d–15(e)) and internal control overfinancial reporting (as defined in Exchange Act Rules 13a–15(f) and 15d–15(f)) for WMS Industries Inc. andhave:
a) Designed such disclosure controls and procedures, or caused such disclosure controls and procedures tobe designed under our supervision, to ensure that material information relating to WMS Industries Inc.,including its consolidated subsidiaries, is made known to us by others within those entities, particularlyduring the period in which this report is being prepared;
b) Designed such internal control over financial reporting, or caused such internal control over financialreporting to be designed under our supervision, to provide reasonable assurance regarding the reliability offinancial reporting and the preparation of financial statements for external purposes in accordance withgenerally accepted accounting principles;
c) Evaluated the effectiveness of the registrant’s disclosure controls and procedures and presented in thisreport our conclusions about the effectiveness of the disclosure controls and procedures, as of the end of theperiod covered by this report based on such evaluation; and
d) Disclosed in this report any change in the registrant’s internal control over financial reporting thatoccurred during the registrant’s most recent fiscal quarter (the registrant’s fourth fiscal quarter in the case ofan annual report) that has materially affected, or is reasonably likely to materially affect, the registrant’sinternal control over financial reporting;
5. The registrant’s other certifying officer and I have disclosed, based on our most recent evaluation of internalcontrol over financial reporting, to WMS Industries Inc.’s auditors and the audit committee of the registrant’sboard of directors (or persons performing the equivalent functions):
a) All significant deficiencies and material weaknesses in the design or operation of internal control overfinancial reporting which are reasonably likely to adversely affect the registrant’s ability to record, process,summarize and report financial information; and
b) Any fraud, whether or not material, that involves management or other employees who have a significantrole in the registrant’s internal control over financial reporting.
August 29, 2013
/s/ Brian R. Gamache
Brian R. GamacheChief Executive Officer
I, Scott D. Schweinfurth certify that:
1. I have reviewed this annual report on Form 10-K of WMS Industries Inc.;
2. Based on my knowledge, this report does not contain any untrue statement of a material fact or omit to state amaterial fact necessary to make the statements made, in light of the circumstances under which such statementswere made, not misleading with respect to the period covered by this report;
3. Based on my knowledge, the financial statements, and other financial information included in this report, fairlypresent in all material respects the financial condition, results of operations and cash flows of WMS IndustriesInc. as of, and for, the periods presented in this report;
4. The registrant’s other certifying officer and I are responsible for establishing and maintaining disclosurecontrols and procedures (as defined in Exchange Act Rules 13a–15(e) and 15d–15(e)) and internal control overfinancial reporting (as defined in Exchange Act Rules 13a–15(f) and 15d–15(f)) for WMS Industries Inc. andhave:
a) Designed such disclosure controls and procedures, or caused such disclosure controls and procedures tobe designed under our supervision, to ensure that material information relating to WMS Industries Inc.,including its consolidated subsidiaries, is made known to us by others within those entities, particularlyduring the period in which this report is being prepared;
b) Designed such internal control over financial reporting, or caused such internal control over financialreporting to be designed under our supervision, to provide reasonable assurance regarding the reliability offinancial reporting and the preparation of financial statements for external purposes in accordance withgenerally accepted accounting principles;
c) Evaluated the effectiveness of the registrant’s disclosure controls and procedures and presented in thisreport our conclusions about the effectiveness of the disclosure controls and procedures, as of the end of theperiod covered by this report based on such evaluation; and
d) Disclosed in this report any change in the registrant’s internal control over financial reporting thatoccurred during the registrant’s most recent fiscal quarter (the registrant’s fourth fiscal quarter in the case ofan annual report) that has materially affected, or is reasonably likely to materially affect, the registrant’sinternal control over financial reporting;
5. The registrant’s other certifying officer and I have disclosed, based on our most recent evaluation of internalcontrol over financial reporting, to WMS Industries Inc.’s auditors and the audit committee of the registrant’sboard of directors (or persons performing the equivalent functions):
a) All significant deficiencies and material weaknesses in the design or operation of internal control overfinancial reporting which are reasonably likely to adversely affect the registrant’s ability to record, process,summarize and report financial information; and
b) Any fraud, whether or not material, that involves management or other employees who have a significantrole in the registrant’s internal control over financial reporting.
August 29, 2013
/s/ Scott D. Schweinfurth
Scott D. SchweinfurthChief Financial Officer
EXHIBIT 32CERTIFICATION PURSUANT TO
18 U. S. C. SECTION 1350,AS ADOPTED PURSUANT TO
SECTION 906 OF THE SARBANES-OXLEY ACT OF 2002
In connection with the Annual Report of the WMS Industries, Inc. (“the Company”) on Form 10-K for the yearending June 30, 2013 as filed with the Securities and Exchange Commission on the date hereof (“the Report”), I,Brian R. Gamache, Chief Executive Officer of the Company, certify pursuant to 18 U.S.C. Section 1350, asadopted pursuant to Section 906 of the Sarbanes-Oxley Act of 2002, that:
(1) The Report fully complies with the requirements of Section 13(a) or 15(d) of the Securities andExchange Act of 1934; and
(2) The information contained in the Report fairly presents, in all material respects, the financial conditionand results of operations of the Company.
/s/ Brian R. Gamache
Brian R. GamacheChief Executive OfficerAugust 29, 2013
CERTIFICATION PURSUANT TO18 U. S. C. SECTION 1350,
AS ADOPTED PURSUANT TOSECTION 906 OF THE SARBANES-OXLEY ACT OF 2002
In connection with the Annual Report of the WMS Industries, Inc. (“the Company”) on Form 10-K for the yearending June 30, 2013 as filed with the Securities and Exchange Commission on the date hereof (“the Report”), I,Scott D. Schweinfurth, Chief Financial Officer of the Company, certify pursuant to 18 U.S.C. Section 1350, asadopted pursuant to Section 906 of the Sarbanes-Oxley Act of 2002, that:
(1) The Report fully complies with the requirements of Section 13(a) or 15(d) of the Securities andExchange Act of 1934; and
(2) The information contained in the Report fairly presents, in all material respects, the financial conditionand results of operations of the Company.
/s/ Scott D. Schweinfurth
Scott D. SchweinfurthChief Financial OfficerAugust 29, 2013
EXHIBIT 99
GAMING REGULATIONS
Nevada Regulations
Overview of Regulatory Framework:
The manufacture, sale and distribution of gaming machines for use or play in Nevada or for use outside ofNevada are subject to extensive state and local laws, regulations and ordinances of the Nevada GamingCommission, the Nevada State Gaming Control Board, and various county and municipal regulatory authorities(collectively, the “Nevada gaming authorities”). The laws, regulations and ordinances primarily cover theresponsibility, financial stability and character of gaming equipment manufacturers, distributors and operators, aswell as persons financially interested in or involved in gaming operations. We currently hold all necessarygaming licenses to manufacture, distribute and operate a slot route or a wide-area progressive system.
The laws, regulations and supervisory procedures of the Nevada gaming authorities are based on publicpolicy and seek to:
➣ prevent unsavory or unsuitable persons from having a direct or indirect involvement with gaming at anytime or in any capacity;
➣ establish and maintain responsible accounting practices and procedures;
➣ maintain effective control over the financial practices of licensees, including establishing minimumprocedures for internal fiscal affairs and safeguarding the assets and revenues, providing reliable recordkeeping and requiring the filing of periodic reports to the Nevada gaming authorities;
➣ prevent cheating and fraudulent practices;
➣ provide a source of state and local revenues through taxation and licensing fees; and
➣ provide strict regulation of all persons, locations, practices, associations and activities relating to casinooperations and the manufacture and distribution of gaming machines and related software andequipment.
Licensing Requirements:
Of Our Security Holders
A holder of our stock or of our issued debt may be required to file an application, be investigated and besubject to a suitability hearing as a beneficial holder if the Nevada Gaming Commission has reason to believethat the holder’s ownership in our securities would be inconsistent with its public policies and those of the Stateof Nevada. As with any other gaming applicant, the holder will be required to pay all costs associated with anyinvestigation conducted by the Nevada gaming authorities.
A security holder will have to abide by the following requirements:
➣ If the holder acquires 5% or more of our securities, report acquisition of beneficial interest in oursecurities to the Nevada gaming authorities.
➣ If the holder acquires 10% or more of our securities, file a gaming application within 30 days afterreceiving written notice from the Chairman of the Nevada Gaming Control Board.
If the person holding our voting securities is a corporation, partnership or a trust, and is required to be foundsuitable, the entity will be required to submit to the Nevada gaming authorities detailed business and financialinformation, including a list of its beneficial owners.
Any person who fails or refuses to apply for a finding of suitability or a license within 30 days after beingordered to do so by the Nevada gaming authorities may be found unsuitable and may be subject to criminalpenalties. The same restrictions apply to a record owner if the record owner, after request, fails to identify thebeneficial owner. We are required to render maximum assistance to the Nevada gaming authorities indetermining the identity of our beneficial owners.
If an institutional investor holds more than 10%, but not more than 25%, of our voting securities, thatinvestor may apply to the Nevada gaming authorities for a waiver of the finding of suitability if it holds thevoting securities for investment purposes only. Under certain circumstances, an institutional investor may be ableto hold up to 29% for a limited period of time. To qualify for this waiver, the institutional investor must haveacquired the voting securities in the ordinary course of business. In addition, the institutional investor may nothold the securities for the purpose of causing (1) the election of a majority of the members of our board ofdirectors, (2) a change in our corporate charter, bylaws, management, policies or operations, or those of any ofour gaming affiliates, or (3) any other action which the Nevada gaming authorities would find inconsistent withholding our voting securities for investment purposes only.
Of Our Company:
We are registered with the Nevada Gaming Commission as a publicly traded corporation. We are required toperiodically file detailed financial and operating reports to the agency and furnish any other information, whichthe Nevada gaming authorities may require.
As a registered company, we also adhere to the following restrictions imposed by the Nevada gamingauthorities:
➣ Any individual having a material relationship or material involvement with us may be required to befound suitable and individually licensed.
➣ Our officers, directors and key employees must file license applications with the Nevada gamingauthorities and may be required to be licensed or found suitable by them. The Company pays all costs ofany such investigation.
➣ Each stockholder applicant is required to pay all costs of any investigation.
➣ Changes of an applicant’s position with us must be reported to the Nevada gaming authorities.
➣ We must sever all relationships with an officer, director or key employee that the Nevada gamingauthorities have found unsuitable and may be required to terminate the employment of any person thatrefuses to file a gaming application when requested.
➣ We are required to maintain a current stock ledger in the State of Nevada, which may be examined bythe Nevada gaming authorities at any time.
➣ The Nevada gaming authorities have the power to require that our stock certificates bear a legendindicating that the securities are subject to the Nevada Gaming Control Act (although compliance withthis requirement has not been requested to date).
➣ We may not make a public offering of our securities without the prior approval of the Nevada GamingCommission if the securities or the proceeds are intended to be used to construct, acquire or financegaming facilities in Nevada, or to retire or extend obligations incurred for these purposes or for similartransactions. We currently hold an approval to make certain public offerings through March 2016,subject to certain conditions. This shelf approval can be rescinded for good cause and does not meanthat for any offering we may make, the Nevada gaming authorities have found, recommended orapproved the issued securities or passed on the accuracy or adequacy of the prospectus or the investmentmerits of the securities offered. Any representation to the contrary is unlawful.
➣ We are subject to disciplinary action if, after we receive notice that a person is unsuitable to be asecurity holder or to have any other relationship with us, we:
➣ pay that unsuitable person any dividend, interest or other distribution on any of our securities;
➣ allow that person to exercise, directly or indirectly, any voting rights conferred through securitiesheld by that person;
➣ pay remuneration in any form to that person;
➣ fail to pursue all lawful efforts to require the unsuitable person to relinquish voting securitiesincluding, if necessary, the immediate repurchase of the voting securities for cash at fair marketvalue;
➣ fail to pursue all lawful efforts to terminate our relationship with that person; or
➣ make any payment to the unsuitable person by way of principal, redemption, conversion, exchange,liquidation or similar transaction.
➣ If we violate the Nevada gaming authorities’ rules and regulations, our gaming licenses could belimited, conditioned, suspended or revoked and we, and those involved with us, could be fined for eachseparate violation.
➣ Changes in control whether through Merger, consolidation, stock or asset acquisitions, management orconsulting agreements, or any act or conduct by a person where control of WMS is obtained, may notoccur without the prior approval of the Nevada gaming authorities. Persons seeking to acquire control ofus must satisfy the Nevada gaming authorities’ standards prior to assuming control.
Any decision made by the Nevada gaming authorities regarding a person’s suitability or licensing is notsubject to judicial review. We believe we have obtained all required licenses and/or approvals necessary to carryon our business in Nevada, including receiving the necessary findings of suitability of our officers, directors andkey personnel.
Of Our WMS Gaming Subsidiary
WMS Gaming manufactures, sells and distributes gaming machines in Nevada and for use outside Nevadaand in 2004, began to operate a wide-area progressive system in Nevada casinos. WMS Gaming holds thenecessary license to conduct this activity in addition to sharing in gaming revenue under our slot route operator’slicense, which covers our participation games.
WMS Gaming’s gaming licenses are subject to the following restrictions:
➣ The Nevada gaming authorities have broad discretion in reviewing the conduct of a licensee on acontinuing basis.
➣ The officers, directors and key employees of our gaming subsidiary must file license applications withthe Nevada Gaming Authorities and may be required to be licensed or found suitable by them.
➣ A person may not become a more than 5% stockholder of our licensed gaming subsidiary without firstobtaining licenses and approvals from the Nevada gaming authorities.
➣ We are required to report substantially all loans, leases, sales of securities and similar financingtransactions of a material nature to the Nevada Gaming Control Board and/or have them approved bythe Nevada Gaming Commission.
➣ Our gaming activity licenses are not transferable.
Changes in Control:
The Nevada legislature has declared that some corporate acquisitions opposed by management, repurchasesof voting securities and corporate defense tactics affecting Nevada gaming licensees, and publicly tradedcorporations that are affiliated with those operations, may be injurious to stable and productive corporate gaming.The Nevada Gaming Commission has established a regulatory framework to guard against the potentiallyadverse effects of these business practices upon Nevada’s gaming industry.
Approvals are, in certain circumstances, required from the Nevada Gaming Commission before we canmake exceptional repurchases of voting securities above their current market price and before a corporateacquisition opposed by management can be consummated. Nevada’s gaming laws and regulations also require
prior approval by the Nevada Gaming Commission if we were to adopt a plan of recapitalization proposed by ourboard of directors in opposition to a tender offer made directly to our stockholders for the purpose of acquiringcontrol of us.
Gaming Equipment Approvals:
Nevada has its own laboratory within its agency. Before we can sell a new gaming machine in Nevada, itmust first be approved by the Nevada agency. The agency conducts rigorous testing of the gaming machine andrelated equipment, and may require a field trial of the gaming machine and platform before determining that thegaming machines and platform meet the agency’s strict technical standards. Throughout the course of offeringour gaming machines and related software in Nevada, the Nevada gaming authorities may require subsequentmodifications and subsequent approvals.
Pursuant to legislation passed in the Nevada 2011 Legislature, the Nevada Gaming Commission has adoptedregulations that, among other things, authorize the Nevada State Gaming Control Board to utilize independenttesting laboratories for the testing of gaming machines and related equipment.
We do not have any control over the length of time that any regulatory agency or independent testinglaboratory takes to review our products. However, we work closely with the agency’s staff, or the staff of theindependent testing laboratory, as the case may be, to timely respond to inquiries and assist where possible in theprocess of evaluation, inspection and review of our products.
Taxes and License Fees:
License fees and taxes are imposed by the Nevada gaming authorities and are either payable quarterly,semiannually or annually. The fees and taxes are computed in various ways depending on the type of gaming oractivity conducted by our subsidiary and on the cities and counties in which our subsidiary conducts operations.Annual fees are payable to the Nevada State Gaming Control Board for renewal of licenses as a manufacturer,distributor, operator of a slot machine route and operator of an inter-casino linked system. Nevada law alsorequires that we pay our proportionate share of the gaming taxes from the revenue generated from ourparticipation games placed in Nevada casinos.
Any person who is licensed, required to be licensed, registered, required to be registered, or is undercommon control with any such person, and who proposes to participate in the conduct of gaming operationsoutside of Nevada, is required to deposit with the Nevada State Gaming Control Board, and thereafter maintain, arevolving fund to pay the expenses of investigation of the licensee’s participation in foreign gaming. Therevolving fund is subject to increase or decrease at the discretion of the Nevada Gaming Commission. As alicensee, we are required to comply with reporting requirements imposed by Nevada law. We are also subject todisciplinary action by the Nevada gaming authorities if we:
➣ knowingly violate any laws of the foreign jurisdiction pertaining to our foreign gaming operations;
➣ fail to conduct the foreign gaming operation in accordance with the standards of honesty and integrityrequired of Nevada gaming operations;
➣ engage in activities that are harmful to the State of Nevada or its ability to collect gaming taxes andfees; or
➣ employ, contract with or associate with a person in the foreign operation who has been denied a licenseor finding of suitability in Nevada on the grounds of personal unsuitability.
Federal Registration
WMS Gaming is required to register annually with the Criminal Division of the United States Departmentof Justice in connection with the sale, distribution or operation of gaming equipment. The Federal GamblingDevices Act of 1962 (commonly known as the Johnson Act) makes it unlawful, in general, for a person to
manufacture, transport or receive gaming machines or components across interstate lines unless that person hasfirst registered with the U.S. Attorney General of the Department of Justice. We also have various record-keepingand equipment-identification requirements imposed by this act. Violation of the Johnson Act may result inseizure and forfeiture of the equipment, as well as other penalties. Our WMS Gaming subsidiary is required toregister and renew our registration annually.
Native American Regulation
Numerous Native American tribes have become engaged in or have licensed gaming activities on NativeAmerican tribal lands as a means of generating revenue for tribal governments. Gaming on Native Americanlands, including the terms and conditions under which gaming equipment can be sold or leased to NativeAmerican tribes, is or may be subject to regulation under the laws of the tribes, the laws of the host state, and theIndian Gaming Regulatory Act of 1988, which includes regulation and oversight by the National Indian GamingCommission and the Secretary of the United States Department of the Interior. Furthermore, gaming on NativeAmerican lands may also be subject to the provisions of statutes relating to contracts with Native Americantribes, which are also administered by the Secretary of the United States Department of the Interior.
The Indian Gaming Regulatory Act of 1988 requires that the tribe and the host state enter into a writtenagreement called a tribal-state compact, that specifically authorizes Class III gaming. The compact must beapproved by the Secretary of the United States Department of the Interior, with the notice of approval publishedin the Federal Register. Tribal-state compacts vary from state to state. Many require that equipment suppliersmeet ongoing registration and licensing requirements of the state and/or the tribe and some impose backgroundcheck requirements on the officers, directors, principals and shareholders of gaming equipment suppliers. Underthe Indian Gaming Regulatory Act of 1988, tribes are required to regulate gaming on their tribal lands underordinances approved by the National Indian Gaming Commission. These ordinances may impose standards andtechnical requirements on hardware and software and may impose registration, licensing and background checkrequirements on gaming equipment suppliers and their officers, directors, principals and shareholders.
We have the required licenses to manufacture and distribute our products in the Native Americanjurisdictions in which we do business and to operate our wide-area progressive systems.
International Regulation
Many foreign jurisdictions permit the importation, sale and/or operation of gaming equipment in casino andnon-casino environments. Where importation is permitted, some countries prohibit or restrict the payout featureof the traditional gaming machine or limit the operation of gaming machines to a controlled number of casinos orcasino-like locations. Each gaming machine must comply with the individual jurisdiction’s regulations. Somejurisdictions require the licensing of gaming machine operators and manufacturers. We manufacture and supplygaming equipment, as well as license our games and intellectual property to customers in various internationalmarkets worldwide. We have the required licenses to manufacture and distribute our products in the foreignjurisdictions in which we do business.
Related Documents