UNITED STATES SECURITIES AND EXCHANGE COMMISSION Washington, D.C. 20549 FORM 10-Q È QUARTERLY REPORT PURSUANT TO SECTION 13 OR 15(d) OF THE SECURITIES EXCHANGE ACT OF 1934 For the quarterly period ended March 31, 2012 OR ‘ TRANSITION REPORT PURSUANT TO SECTION 13 OR 15(d) OF THE SECURITIES EXCHANGE ACT OF 1934 Commission File Number 1-11758 (Exact Name of Registrant as specified in its charter) Delaware (State or other jurisdiction of incorporation or organization) 1585 Broadway New York, NY 10036 (Address of principal executive offices, including zip code) 36-3145972 (I.R.S. Employer Identification No.) (212) 761-4000 (Registrant’s telephone number, including area code) Indicate by check mark whether the Registrant (1) has filed all reports required to be filed by Section 13 or 15(d) of the Securities Exchange Act of 1934 during the preceding 12 months (or for such shorter period that the Registrant was required to file such reports), and (2) has been subject to such filing requirements for the past 90 days. Yes È No ‘ Indicate by check mark whether the Registrant has submitted electronically and posted on its corporate Web site, if any, every Interactive Data File required to be submitted and posted pursuant to Rule 405 of Regulation S-T (§ 232.405 of this chapter) during the preceding 12 months (or for such shorter period that the Registrant was required to submit and post such files). Yes È No ‘ Indicate by check mark whether the Registrant is a large accelerated filer, an accelerated filer, a non-accelerated filer, or a smaller reporting company. See the definitions of “large accelerated filer,” “accelerated filer” and “smaller reporting company” in Rule 12b-2 of the Exchange Act. (Check one): Large Accelerated Filer È Accelerated Filer ‘ Non-Accelerated Filer ‘ Smaller reporting company ‘ (Do not check if a smaller reporting company) Indicate by check mark whether the Registrant is a shell company (as defined in Rule 12b-2 of the Exchange Act). Yes ‘ No È As of April 30, 2012, there were 1,977,775,881 shares of the Registrant’s Common Stock, par value $0.01 per share, outstanding.

Welcome message from author
This document is posted to help you gain knowledge. Please leave a comment to let me know what you think about it! Share it to your friends and learn new things together.
Transcript
UNITED STATES SECURITIES AND EXCHANGE COMMISSIONWashington, D.C. 20549
FORM 10-Q
È QUARTERLY REPORT PURSUANT TO SECTION 13 OR 15(d) OF THE SECURITIESEXCHANGE ACT OF 1934
For the quarterly period ended March 31, 2012
OR
‘ TRANSITION REPORT PURSUANT TO SECTION 13 OR 15(d) OF THE SECURITIESEXCHANGE ACT OF 1934
Commission File Number 1-11758
(Exact Name of Registrant as specified in its charter)
Delaware(State or other jurisdiction ofincorporation or organization)
1585 BroadwayNew York, NY 10036
(Address of principal executiveoffices, including zip code)
36-3145972(I.R.S. Employer Identification No.)
(212) 761-4000(Registrant’s telephone number,including area code)
Indicate by check mark whether the Registrant (1) has filed all reports required to be filed by Section 13 or 15(d)of the Securities Exchange Act of 1934 during the preceding 12 months (or for such shorter period that theRegistrant was required to file such reports), and (2) has been subject to such filing requirements for the past 90days. Yes È No ‘
Indicate by check mark whether the Registrant has submitted electronically and posted on its corporate Web site,if any, every Interactive Data File required to be submitted and posted pursuant to Rule 405 of Regulation S-T(§ 232.405 of this chapter) during the preceding 12 months (or for such shorter period that the Registrant wasrequired to submit and post such files). Yes È No ‘
Indicate by check mark whether the Registrant is a large accelerated filer, an accelerated filer, a non-acceleratedfiler, or a smaller reporting company. See the definitions of “large accelerated filer,” “accelerated filer” and“smaller reporting company” in Rule 12b-2 of the Exchange Act. (Check one):
Large Accelerated Filer È Accelerated Filer ‘
Non-Accelerated Filer ‘ Smaller reporting company ‘
(Do not check if a smaller reporting company)
Indicate by check mark whether the Registrant is a shell company (as defined in Rule 12b-2 of the ExchangeAct). Yes ‘ No È
As of April 30, 2012, there were 1,977,775,881 shares of the Registrant’s Common Stock, par value $0.01 pershare, outstanding.

[THIS PAGE INTENTIONALLY LEFT BLANK]
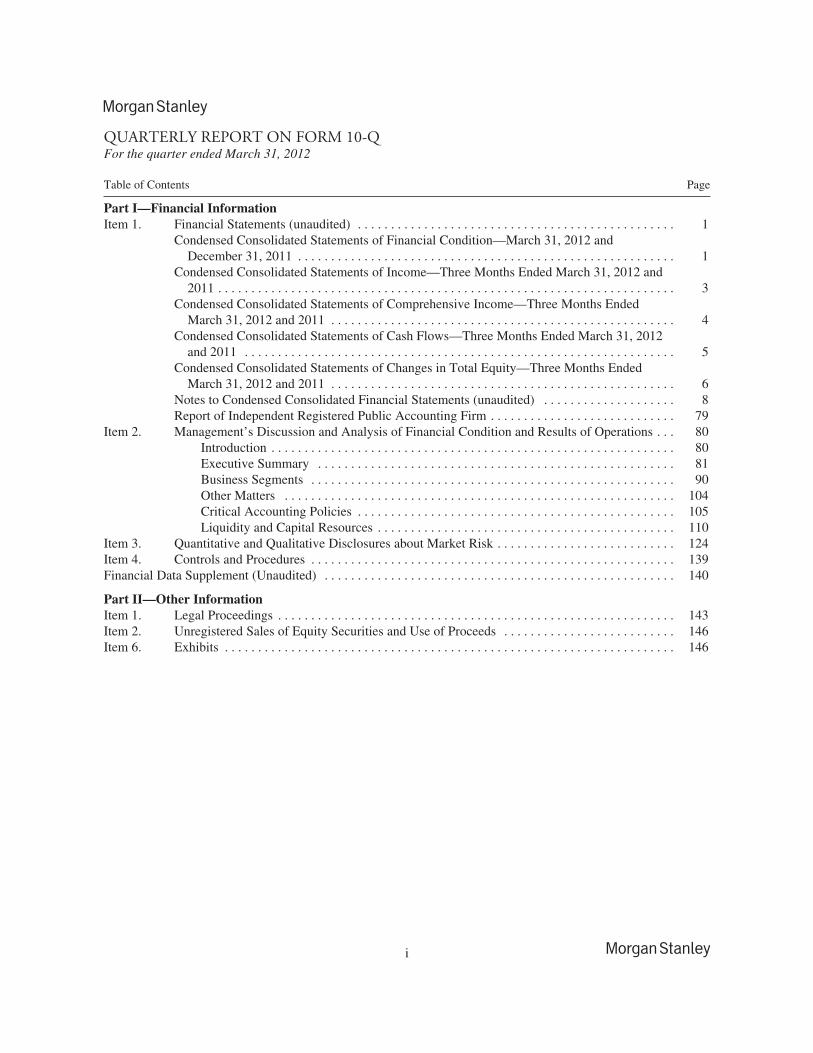
QUARTERLY REPORT ON FORM 10-QFor the quarter ended March 31, 2012
Table of Contents Page
Part I—Financial InformationItem 1. Financial Statements (unaudited) . . . . . . . . . . . . . . . . . . . . . . . . . . . . . . . . . . . . . . . . . . . . . . . . 1
Condensed Consolidated Statements of Financial Condition—March 31, 2012 andDecember 31, 2011 . . . . . . . . . . . . . . . . . . . . . . . . . . . . . . . . . . . . . . . . . . . . . . . . . . . . . . . . . 1
Condensed Consolidated Statements of Income—Three Months Ended March 31, 2012 and2011 . . . . . . . . . . . . . . . . . . . . . . . . . . . . . . . . . . . . . . . . . . . . . . . . . . . . . . . . . . . . . . . . . . . . . 3
Condensed Consolidated Statements of Comprehensive Income—Three Months EndedMarch 31, 2012 and 2011 . . . . . . . . . . . . . . . . . . . . . . . . . . . . . . . . . . . . . . . . . . . . . . . . . . . . 4
Condensed Consolidated Statements of Cash Flows—Three Months Ended March 31, 2012and 2011 . . . . . . . . . . . . . . . . . . . . . . . . . . . . . . . . . . . . . . . . . . . . . . . . . . . . . . . . . . . . . . . . . 5
Condensed Consolidated Statements of Changes in Total Equity—Three Months EndedMarch 31, 2012 and 2011 . . . . . . . . . . . . . . . . . . . . . . . . . . . . . . . . . . . . . . . . . . . . . . . . . . . . 6
Notes to Condensed Consolidated Financial Statements (unaudited) . . . . . . . . . . . . . . . . . . . . 8Report of Independent Registered Public Accounting Firm . . . . . . . . . . . . . . . . . . . . . . . . . . . . 79
Item 2. Management’s Discussion and Analysis of Financial Condition and Results of Operations . . . 80Introduction . . . . . . . . . . . . . . . . . . . . . . . . . . . . . . . . . . . . . . . . . . . . . . . . . . . . . . . . . . . . . 80Executive Summary . . . . . . . . . . . . . . . . . . . . . . . . . . . . . . . . . . . . . . . . . . . . . . . . . . . . . . 81Business Segments . . . . . . . . . . . . . . . . . . . . . . . . . . . . . . . . . . . . . . . . . . . . . . . . . . . . . . . 90Other Matters . . . . . . . . . . . . . . . . . . . . . . . . . . . . . . . . . . . . . . . . . . . . . . . . . . . . . . . . . . . 104Critical Accounting Policies . . . . . . . . . . . . . . . . . . . . . . . . . . . . . . . . . . . . . . . . . . . . . . . . 105Liquidity and Capital Resources . . . . . . . . . . . . . . . . . . . . . . . . . . . . . . . . . . . . . . . . . . . . . 110
Item 3. Quantitative and Qualitative Disclosures about Market Risk . . . . . . . . . . . . . . . . . . . . . . . . . . . 124Item 4. Controls and Procedures . . . . . . . . . . . . . . . . . . . . . . . . . . . . . . . . . . . . . . . . . . . . . . . . . . . . . . . 139Financial Data Supplement (Unaudited) . . . . . . . . . . . . . . . . . . . . . . . . . . . . . . . . . . . . . . . . . . . . . . . . . . . . . 140
Part II—Other InformationItem 1. Legal Proceedings . . . . . . . . . . . . . . . . . . . . . . . . . . . . . . . . . . . . . . . . . . . . . . . . . . . . . . . . . . . . 143Item 2. Unregistered Sales of Equity Securities and Use of Proceeds . . . . . . . . . . . . . . . . . . . . . . . . . . 146Item 6. Exhibits . . . . . . . . . . . . . . . . . . . . . . . . . . . . . . . . . . . . . . . . . . . . . . . . . . . . . . . . . . . . . . . . . . . . 146
i

[THIS PAGE INTENTIONALLY LEFT BLANK]
AVAILABLE INFORMATION
Morgan Stanley files annual, quarterly and current reports, proxy statements and other information with theSecurities and Exchange Commission (the “SEC”). You may read and copy any document we file with the SECat the SEC’s public reference room at 100 F Street, NE, Washington, DC 20549. Please call the SEC at1-800-SEC-0330 for information on the public reference room. The SEC maintains an internet site that containsannual, quarterly and current reports, proxy and information statements and other information that issuers(including Morgan Stanley) file electronically with the SEC. Morgan Stanley’s electronic SEC filings areavailable to the public at the SEC’s internet site, www.sec.gov.
Morgan Stanley’s internet site is www.morganstanley.com. You can access Morgan Stanley’s Investor Relationswebpage at www.morganstanley.com/about/ir. Morgan Stanley makes available free of charge, on or through itsInvestor Relations webpage, its proxy statements, Annual Reports on Form 10-K, Quarterly Reports onForm 10-Q, Current Reports on Form 8-K and any amendments to those reports filed or furnished pursuant to theSecurities Exchange Act of 1934, as amended (the “Exchange Act”), as soon as reasonably practicable after suchmaterial is electronically filed with, or furnished to, the SEC. Morgan Stanley also makes available, through itsInvestor Relations webpage, via a link to the SEC’s internet site, statements of beneficial ownership of MorganStanley’s equity securities filed by its directors, officers, 10% or greater shareholders and others under Section 16of the Exchange Act.
Morgan Stanley has a Corporate Governance webpage. You can access information about Morgan Stanley’scorporate governance at www.morganstanley.com/about/company/governance. Morgan Stanley posts thefollowing on its Corporate Governance webpage:
• Amended and Restated Certificate of Incorporation;
• Amended and Restated Bylaws;
• Charters for its Audit Committee; Internal Audit Subcommittee; Compensation, ManagementDevelopment and Succession Committee; Nominating and Governance Committee; and Risk Committee;
• Corporate Governance Policies;
• Policy Regarding Communication with the Board of Directors;
• Policy Regarding Director Candidates Recommended by Shareholders;
• Policy Regarding Corporate Political Contributions;
• Policy Regarding Shareholder Rights Plan;
• Code of Ethics and Business Conduct;
• Code of Conduct; and
• Integrity Hotline information.
Morgan Stanley’s Code of Ethics and Business Conduct applies to all directors, officers and employees,including its Chief Executive Officer, Chief Financial Officer and Deputy Chief Financial Officer. MorganStanley will post any amendments to the Code of Ethics and Business Conduct and any waivers that are requiredto be disclosed by the rules of either the SEC or the New York Stock Exchange LLC (“NYSE”) on its internetsite. You can request a copy of these documents, excluding exhibits, at no cost, by contacting Investor Relations,1585 Broadway, New York, NY 10036 (212-761-4000). The information on Morgan Stanley’s internet site is notincorporated by reference into this report.
ii
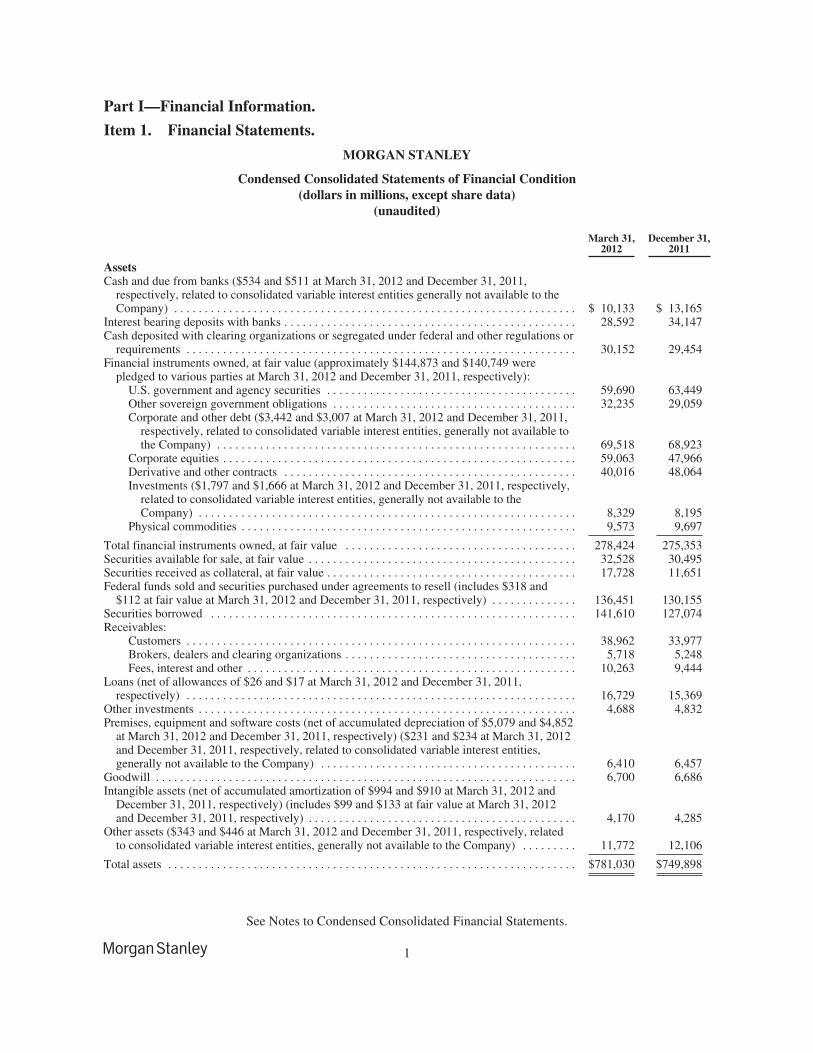
Part I—Financial Information.
Item 1. Financial Statements.
MORGAN STANLEY
Condensed Consolidated Statements of Financial Condition(dollars in millions, except share data)
(unaudited)
March 31,2012
December 31,2011
AssetsCash and due from banks ($534 and $511 at March 31, 2012 and December 31, 2011,
respectively, related to consolidated variable interest entities generally not available to theCompany) . . . . . . . . . . . . . . . . . . . . . . . . . . . . . . . . . . . . . . . . . . . . . . . . . . . . . . . . . . . . . . . . . . $ 10,133 $ 13,165
Interest bearing deposits with banks . . . . . . . . . . . . . . . . . . . . . . . . . . . . . . . . . . . . . . . . . . . . . . . . 28,592 34,147Cash deposited with clearing organizations or segregated under federal and other regulations or
requirements . . . . . . . . . . . . . . . . . . . . . . . . . . . . . . . . . . . . . . . . . . . . . . . . . . . . . . . . . . . . . . . . 30,152 29,454Financial instruments owned, at fair value (approximately $144,873 and $140,749 were
pledged to various parties at March 31, 2012 and December 31, 2011, respectively):U.S. government and agency securities . . . . . . . . . . . . . . . . . . . . . . . . . . . . . . . . . . . . . . . . . 59,690 63,449Other sovereign government obligations . . . . . . . . . . . . . . . . . . . . . . . . . . . . . . . . . . . . . . . . 32,235 29,059Corporate and other debt ($3,442 and $3,007 at March 31, 2012 and December 31, 2011,
respectively, related to consolidated variable interest entities, generally not available tothe Company) . . . . . . . . . . . . . . . . . . . . . . . . . . . . . . . . . . . . . . . . . . . . . . . . . . . . . . . . . . . 69,518 68,923
Corporate equities . . . . . . . . . . . . . . . . . . . . . . . . . . . . . . . . . . . . . . . . . . . . . . . . . . . . . . . . . . 59,063 47,966Derivative and other contracts . . . . . . . . . . . . . . . . . . . . . . . . . . . . . . . . . . . . . . . . . . . . . . . . 40,016 48,064Investments ($1,797 and $1,666 at March 31, 2012 and December 31, 2011, respectively,
related to consolidated variable interest entities, generally not available to theCompany) . . . . . . . . . . . . . . . . . . . . . . . . . . . . . . . . . . . . . . . . . . . . . . . . . . . . . . . . . . . . . . 8,329 8,195
Physical commodities . . . . . . . . . . . . . . . . . . . . . . . . . . . . . . . . . . . . . . . . . . . . . . . . . . . . . . . 9,573 9,697
Total financial instruments owned, at fair value . . . . . . . . . . . . . . . . . . . . . . . . . . . . . . . . . . . . . . 278,424 275,353Securities available for sale, at fair value . . . . . . . . . . . . . . . . . . . . . . . . . . . . . . . . . . . . . . . . . . . . 32,528 30,495Securities received as collateral, at fair value . . . . . . . . . . . . . . . . . . . . . . . . . . . . . . . . . . . . . . . . . 17,728 11,651Federal funds sold and securities purchased under agreements to resell (includes $318 and
$112 at fair value at March 31, 2012 and December 31, 2011, respectively) . . . . . . . . . . . . . . 136,451 130,155Securities borrowed . . . . . . . . . . . . . . . . . . . . . . . . . . . . . . . . . . . . . . . . . . . . . . . . . . . . . . . . . . . . 141,610 127,074Receivables:
Customers . . . . . . . . . . . . . . . . . . . . . . . . . . . . . . . . . . . . . . . . . . . . . . . . . . . . . . . . . . . . . . . . 38,962 33,977Brokers, dealers and clearing organizations . . . . . . . . . . . . . . . . . . . . . . . . . . . . . . . . . . . . . . 5,718 5,248Fees, interest and other . . . . . . . . . . . . . . . . . . . . . . . . . . . . . . . . . . . . . . . . . . . . . . . . . . . . . . 10,263 9,444
Loans (net of allowances of $26 and $17 at March 31, 2012 and December 31, 2011,respectively) . . . . . . . . . . . . . . . . . . . . . . . . . . . . . . . . . . . . . . . . . . . . . . . . . . . . . . . . . . . . . . . . 16,729 15,369
Other investments . . . . . . . . . . . . . . . . . . . . . . . . . . . . . . . . . . . . . . . . . . . . . . . . . . . . . . . . . . . . . . 4,688 4,832Premises, equipment and software costs (net of accumulated depreciation of $5,079 and $4,852
at March 31, 2012 and December 31, 2011, respectively) ($231 and $234 at March 31, 2012and December 31, 2011, respectively, related to consolidated variable interest entities,generally not available to the Company) . . . . . . . . . . . . . . . . . . . . . . . . . . . . . . . . . . . . . . . . . . 6,410 6,457
Goodwill . . . . . . . . . . . . . . . . . . . . . . . . . . . . . . . . . . . . . . . . . . . . . . . . . . . . . . . . . . . . . . . . . . . . . 6,700 6,686Intangible assets (net of accumulated amortization of $994 and $910 at March 31, 2012 and
December 31, 2011, respectively) (includes $99 and $133 at fair value at March 31, 2012and December 31, 2011, respectively) . . . . . . . . . . . . . . . . . . . . . . . . . . . . . . . . . . . . . . . . . . . . 4,170 4,285
Other assets ($343 and $446 at March 31, 2012 and December 31, 2011, respectively, relatedto consolidated variable interest entities, generally not available to the Company) . . . . . . . . . 11,772 12,106
Total assets . . . . . . . . . . . . . . . . . . . . . . . . . . . . . . . . . . . . . . . . . . . . . . . . . . . . . . . . . . . . . . . . . . . $781,030 $749,898
See Notes to Condensed Consolidated Financial Statements.
1
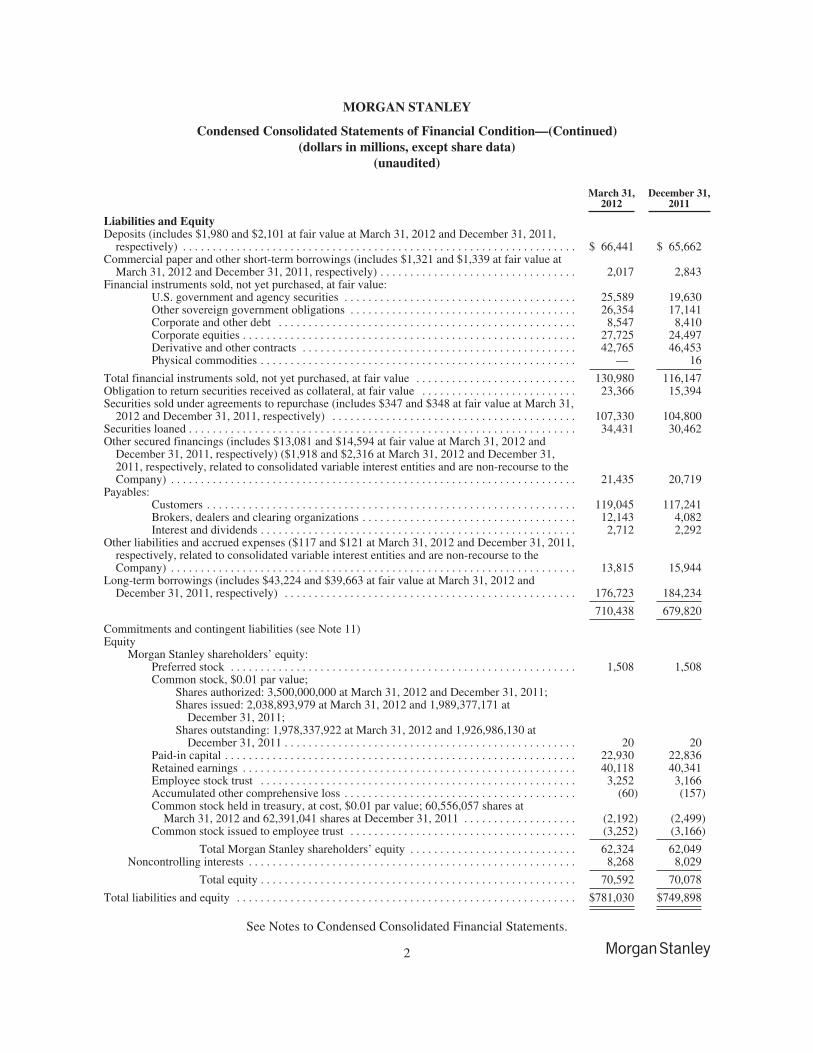
MORGAN STANLEY
Condensed Consolidated Statements of Financial Condition—(Continued)(dollars in millions, except share data)
(unaudited)
March 31,2012
December 31,2011
Liabilities and EquityDeposits (includes $1,980 and $2,101 at fair value at March 31, 2012 and December 31, 2011,
respectively) . . . . . . . . . . . . . . . . . . . . . . . . . . . . . . . . . . . . . . . . . . . . . . . . . . . . . . . . . . . . . . . . . . $ 66,441 $ 65,662Commercial paper and other short-term borrowings (includes $1,321 and $1,339 at fair value at
March 31, 2012 and December 31, 2011, respectively) . . . . . . . . . . . . . . . . . . . . . . . . . . . . . . . . . 2,017 2,843Financial instruments sold, not yet purchased, at fair value:
U.S. government and agency securities . . . . . . . . . . . . . . . . . . . . . . . . . . . . . . . . . . . . . . . 25,589 19,630Other sovereign government obligations . . . . . . . . . . . . . . . . . . . . . . . . . . . . . . . . . . . . . . 26,354 17,141Corporate and other debt . . . . . . . . . . . . . . . . . . . . . . . . . . . . . . . . . . . . . . . . . . . . . . . . . . 8,547 8,410Corporate equities . . . . . . . . . . . . . . . . . . . . . . . . . . . . . . . . . . . . . . . . . . . . . . . . . . . . . . . . 27,725 24,497Derivative and other contracts . . . . . . . . . . . . . . . . . . . . . . . . . . . . . . . . . . . . . . . . . . . . . . 42,765 46,453Physical commodities . . . . . . . . . . . . . . . . . . . . . . . . . . . . . . . . . . . . . . . . . . . . . . . . . . . . . — 16
Total financial instruments sold, not yet purchased, at fair value . . . . . . . . . . . . . . . . . . . . . . . . . . . 130,980 116,147Obligation to return securities received as collateral, at fair value . . . . . . . . . . . . . . . . . . . . . . . . . . 23,366 15,394Securities sold under agreements to repurchase (includes $347 and $348 at fair value at March 31,
2012 and December 31, 2011, respectively) . . . . . . . . . . . . . . . . . . . . . . . . . . . . . . . . . . . . . . . . . 107,330 104,800Securities loaned . . . . . . . . . . . . . . . . . . . . . . . . . . . . . . . . . . . . . . . . . . . . . . . . . . . . . . . . . . . . . . . . . 34,431 30,462Other secured financings (includes $13,081 and $14,594 at fair value at March 31, 2012 and
December 31, 2011, respectively) ($1,918 and $2,316 at March 31, 2012 and December 31,2011, respectively, related to consolidated variable interest entities and are non-recourse to theCompany) . . . . . . . . . . . . . . . . . . . . . . . . . . . . . . . . . . . . . . . . . . . . . . . . . . . . . . . . . . . . . . . . . . . . 21,435 20,719
Payables:Customers . . . . . . . . . . . . . . . . . . . . . . . . . . . . . . . . . . . . . . . . . . . . . . . . . . . . . . . . . . . . . . 119,045 117,241Brokers, dealers and clearing organizations . . . . . . . . . . . . . . . . . . . . . . . . . . . . . . . . . . . . 12,143 4,082Interest and dividends . . . . . . . . . . . . . . . . . . . . . . . . . . . . . . . . . . . . . . . . . . . . . . . . . . . . . 2,712 2,292
Other liabilities and accrued expenses ($117 and $121 at March 31, 2012 and December 31, 2011,respectively, related to consolidated variable interest entities and are non-recourse to theCompany) . . . . . . . . . . . . . . . . . . . . . . . . . . . . . . . . . . . . . . . . . . . . . . . . . . . . . . . . . . . . . . . . . . . . 13,815 15,944
Long-term borrowings (includes $43,224 and $39,663 at fair value at March 31, 2012 andDecember 31, 2011, respectively) . . . . . . . . . . . . . . . . . . . . . . . . . . . . . . . . . . . . . . . . . . . . . . . . . 176,723 184,234
710,438 679,820
Commitments and contingent liabilities (see Note 11)Equity
Morgan Stanley shareholders’ equity:Preferred stock . . . . . . . . . . . . . . . . . . . . . . . . . . . . . . . . . . . . . . . . . . . . . . . . . . . . . . . . . . 1,508 1,508Common stock, $0.01 par value;
Shares authorized: 3,500,000,000 at March 31, 2012 and December 31, 2011;Shares issued: 2,038,893,979 at March 31, 2012 and 1,989,377,171 at
December 31, 2011;Shares outstanding: 1,978,337,922 at March 31, 2012 and 1,926,986,130 at
December 31, 2011 . . . . . . . . . . . . . . . . . . . . . . . . . . . . . . . . . . . . . . . . . . . . . . . . . 20 20Paid-in capital . . . . . . . . . . . . . . . . . . . . . . . . . . . . . . . . . . . . . . . . . . . . . . . . . . . . . . . . . . . 22,930 22,836Retained earnings . . . . . . . . . . . . . . . . . . . . . . . . . . . . . . . . . . . . . . . . . . . . . . . . . . . . . . . . 40,118 40,341Employee stock trust . . . . . . . . . . . . . . . . . . . . . . . . . . . . . . . . . . . . . . . . . . . . . . . . . . . . . 3,252 3,166Accumulated other comprehensive loss . . . . . . . . . . . . . . . . . . . . . . . . . . . . . . . . . . . . . . . (60) (157)Common stock held in treasury, at cost, $0.01 par value; 60,556,057 shares at
March 31, 2012 and 62,391,041 shares at December 31, 2011 . . . . . . . . . . . . . . . . . . . (2,192) (2,499)Common stock issued to employee trust . . . . . . . . . . . . . . . . . . . . . . . . . . . . . . . . . . . . . . (3,252) (3,166)
Total Morgan Stanley shareholders’ equity . . . . . . . . . . . . . . . . . . . . . . . . . . . . 62,324 62,049Noncontrolling interests . . . . . . . . . . . . . . . . . . . . . . . . . . . . . . . . . . . . . . . . . . . . . . . . . . . . . . . 8,268 8,029
Total equity . . . . . . . . . . . . . . . . . . . . . . . . . . . . . . . . . . . . . . . . . . . . . . . . . . . . . 70,592 70,078
Total liabilities and equity . . . . . . . . . . . . . . . . . . . . . . . . . . . . . . . . . . . . . . . . . . . . . . . . . . . . . . . . . $781,030 $749,898
See Notes to Condensed Consolidated Financial Statements.
2
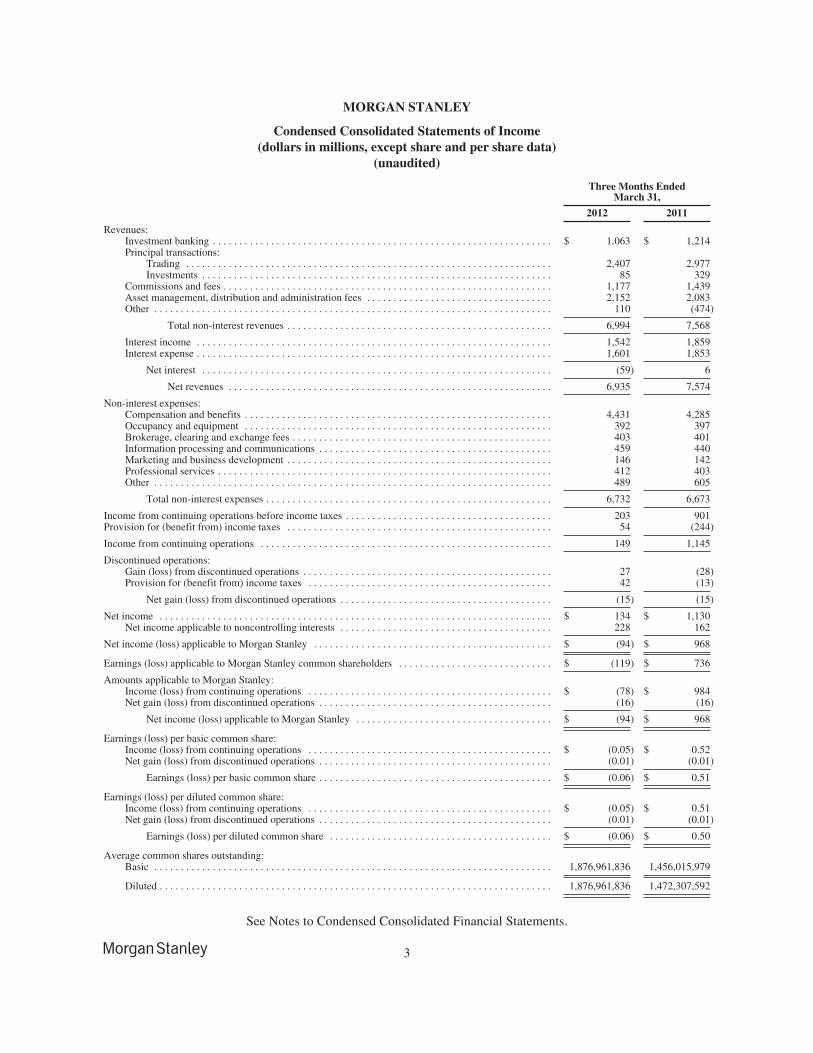
MORGAN STANLEY
Condensed Consolidated Statements of Income(dollars in millions, except share and per share data)
(unaudited)
Three Months EndedMarch 31,
2012 2011
Revenues:Investment banking . . . . . . . . . . . . . . . . . . . . . . . . . . . . . . . . . . . . . . . . . . . . . . . . . . . . . . . . . . . . . . . . $ 1,063 $ 1,214Principal transactions:
Trading . . . . . . . . . . . . . . . . . . . . . . . . . . . . . . . . . . . . . . . . . . . . . . . . . . . . . . . . . . . . . . . . . . . . . 2,407 2,977Investments . . . . . . . . . . . . . . . . . . . . . . . . . . . . . . . . . . . . . . . . . . . . . . . . . . . . . . . . . . . . . . . . . . 85 329
Commissions and fees . . . . . . . . . . . . . . . . . . . . . . . . . . . . . . . . . . . . . . . . . . . . . . . . . . . . . . . . . . . . . . 1,177 1,439Asset management, distribution and administration fees . . . . . . . . . . . . . . . . . . . . . . . . . . . . . . . . . . . 2,152 2,083Other . . . . . . . . . . . . . . . . . . . . . . . . . . . . . . . . . . . . . . . . . . . . . . . . . . . . . . . . . . . . . . . . . . . . . . . . . . . 110 (474)
Total non-interest revenues . . . . . . . . . . . . . . . . . . . . . . . . . . . . . . . . . . . . . . . . . . . . . . . . . . 6,994 7,568
Interest income . . . . . . . . . . . . . . . . . . . . . . . . . . . . . . . . . . . . . . . . . . . . . . . . . . . . . . . . . . . . . . . . . . . 1,542 1,859Interest expense . . . . . . . . . . . . . . . . . . . . . . . . . . . . . . . . . . . . . . . . . . . . . . . . . . . . . . . . . . . . . . . . . . . 1,601 1,853
Net interest . . . . . . . . . . . . . . . . . . . . . . . . . . . . . . . . . . . . . . . . . . . . . . . . . . . . . . . . . . . . . . . . . . (59) 6
Net revenues . . . . . . . . . . . . . . . . . . . . . . . . . . . . . . . . . . . . . . . . . . . . . . . . . . . . . . . . . . . . . 6,935 7,574
Non-interest expenses:Compensation and benefits . . . . . . . . . . . . . . . . . . . . . . . . . . . . . . . . . . . . . . . . . . . . . . . . . . . . . . . . . . 4,431 4,285Occupancy and equipment . . . . . . . . . . . . . . . . . . . . . . . . . . . . . . . . . . . . . . . . . . . . . . . . . . . . . . . . . . 392 397Brokerage, clearing and exchange fees . . . . . . . . . . . . . . . . . . . . . . . . . . . . . . . . . . . . . . . . . . . . . . . . . 403 401Information processing and communications . . . . . . . . . . . . . . . . . . . . . . . . . . . . . . . . . . . . . . . . . . . . 459 440Marketing and business development . . . . . . . . . . . . . . . . . . . . . . . . . . . . . . . . . . . . . . . . . . . . . . . . . . 146 142Professional services . . . . . . . . . . . . . . . . . . . . . . . . . . . . . . . . . . . . . . . . . . . . . . . . . . . . . . . . . . . . . . . 412 403Other . . . . . . . . . . . . . . . . . . . . . . . . . . . . . . . . . . . . . . . . . . . . . . . . . . . . . . . . . . . . . . . . . . . . . . . . . . . 489 605
Total non-interest expenses . . . . . . . . . . . . . . . . . . . . . . . . . . . . . . . . . . . . . . . . . . . . . . . . . . . . . . 6,732 6,673
Income from continuing operations before income taxes . . . . . . . . . . . . . . . . . . . . . . . . . . . . . . . . . . . . . . . 203 901Provision for (benefit from) income taxes . . . . . . . . . . . . . . . . . . . . . . . . . . . . . . . . . . . . . . . . . . . . . . . . . . 54 (244)
Income from continuing operations . . . . . . . . . . . . . . . . . . . . . . . . . . . . . . . . . . . . . . . . . . . . . . . . . . . . . . . 149 1,145
Discontinued operations:Gain (loss) from discontinued operations . . . . . . . . . . . . . . . . . . . . . . . . . . . . . . . . . . . . . . . . . . . . . . . 27 (28)Provision for (benefit from) income taxes . . . . . . . . . . . . . . . . . . . . . . . . . . . . . . . . . . . . . . . . . . . . . . 42 (13)
Net gain (loss) from discontinued operations . . . . . . . . . . . . . . . . . . . . . . . . . . . . . . . . . . . . . . . . (15) (15)
Net income . . . . . . . . . . . . . . . . . . . . . . . . . . . . . . . . . . . . . . . . . . . . . . . . . . . . . . . . . . . . . . . . . . . . . . . . . . $ 134 $ 1,130Net income applicable to noncontrolling interests . . . . . . . . . . . . . . . . . . . . . . . . . . . . . . . . . . . . . . . . 228 162
Net income (loss) applicable to Morgan Stanley . . . . . . . . . . . . . . . . . . . . . . . . . . . . . . . . . . . . . . . . . . . . . $ (94) $ 968
Earnings (loss) applicable to Morgan Stanley common shareholders . . . . . . . . . . . . . . . . . . . . . . . . . . . . . $ (119) $ 736
Amounts applicable to Morgan Stanley:Income (loss) from continuing operations . . . . . . . . . . . . . . . . . . . . . . . . . . . . . . . . . . . . . . . . . . . . . . $ (78) $ 984Net gain (loss) from discontinued operations . . . . . . . . . . . . . . . . . . . . . . . . . . . . . . . . . . . . . . . . . . . . (16) (16)
Net income (loss) applicable to Morgan Stanley . . . . . . . . . . . . . . . . . . . . . . . . . . . . . . . . . . . . . $ (94) $ 968
Earnings (loss) per basic common share:Income (loss) from continuing operations . . . . . . . . . . . . . . . . . . . . . . . . . . . . . . . . . . . . . . . . . . . . . . $ (0.05) $ 0.52Net gain (loss) from discontinued operations . . . . . . . . . . . . . . . . . . . . . . . . . . . . . . . . . . . . . . . . . . . . (0.01) (0.01)
Earnings (loss) per basic common share . . . . . . . . . . . . . . . . . . . . . . . . . . . . . . . . . . . . . . . . . . . . $ (0.06) $ 0.51
Earnings (loss) per diluted common share:Income (loss) from continuing operations . . . . . . . . . . . . . . . . . . . . . . . . . . . . . . . . . . . . . . . . . . . . . . $ (0.05) $ 0.51Net gain (loss) from discontinued operations . . . . . . . . . . . . . . . . . . . . . . . . . . . . . . . . . . . . . . . . . . . . (0.01) (0.01)
Earnings (loss) per diluted common share . . . . . . . . . . . . . . . . . . . . . . . . . . . . . . . . . . . . . . . . . . $ (0.06) $ 0.50
Average common shares outstanding:Basic . . . . . . . . . . . . . . . . . . . . . . . . . . . . . . . . . . . . . . . . . . . . . . . . . . . . . . . . . . . . . . . . . . . . . . . . . . . 1,876,961,836 1,456,015,979
Diluted . . . . . . . . . . . . . . . . . . . . . . . . . . . . . . . . . . . . . . . . . . . . . . . . . . . . . . . . . . . . . . . . . . . . . . . . . . 1,876,961,836 1,472,307,592
See Notes to Condensed Consolidated Financial Statements.
3
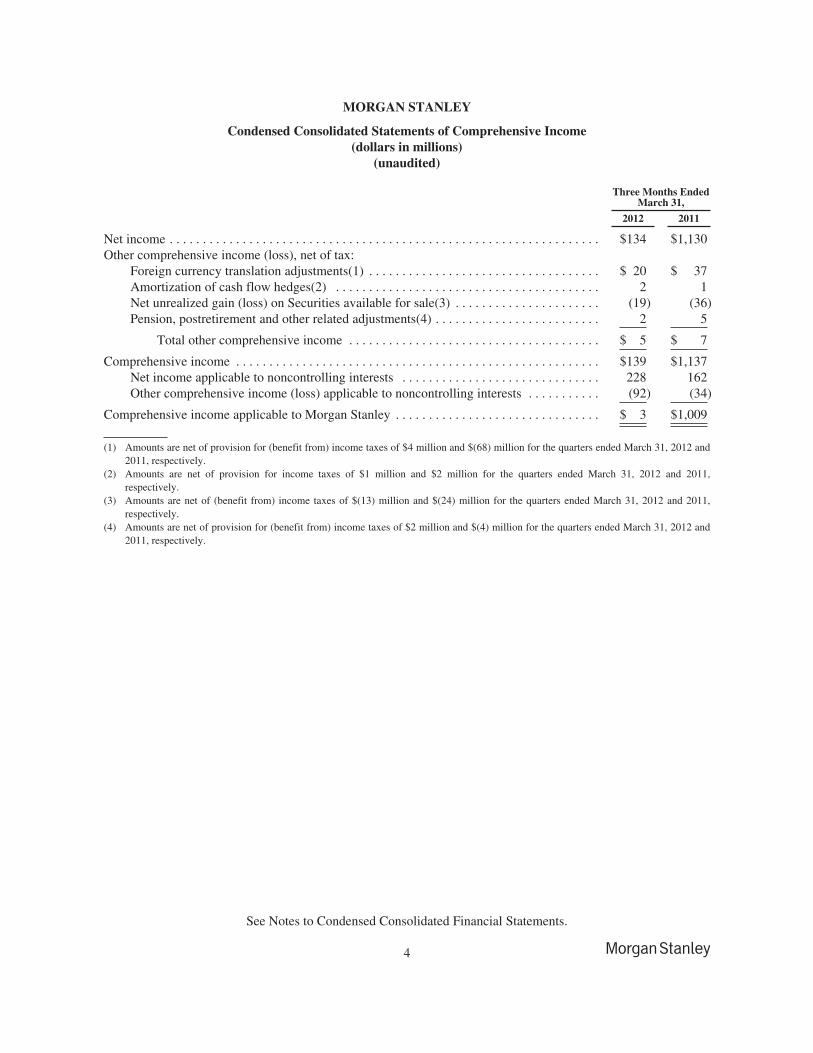
MORGAN STANLEY
Condensed Consolidated Statements of Comprehensive Income(dollars in millions)
(unaudited)
Three Months EndedMarch 31,
2012 2011
Net income . . . . . . . . . . . . . . . . . . . . . . . . . . . . . . . . . . . . . . . . . . . . . . . . . . . . . . . . . . . . . . . . . $134 $1,130Other comprehensive income (loss), net of tax:
Foreign currency translation adjustments(1) . . . . . . . . . . . . . . . . . . . . . . . . . . . . . . . . . . . $ 20 $ 37Amortization of cash flow hedges(2) . . . . . . . . . . . . . . . . . . . . . . . . . . . . . . . . . . . . . . . . 2 1Net unrealized gain (loss) on Securities available for sale(3) . . . . . . . . . . . . . . . . . . . . . . (19) (36)Pension, postretirement and other related adjustments(4) . . . . . . . . . . . . . . . . . . . . . . . . . 2 5
Total other comprehensive income . . . . . . . . . . . . . . . . . . . . . . . . . . . . . . . . . . . . . . $ 5 $ 7
Comprehensive income . . . . . . . . . . . . . . . . . . . . . . . . . . . . . . . . . . . . . . . . . . . . . . . . . . . . . . . $139 $1,137Net income applicable to noncontrolling interests . . . . . . . . . . . . . . . . . . . . . . . . . . . . . . 228 162Other comprehensive income (loss) applicable to noncontrolling interests . . . . . . . . . . . (92) (34)
Comprehensive income applicable to Morgan Stanley . . . . . . . . . . . . . . . . . . . . . . . . . . . . . . . $ 3 $1,009
(1) Amounts are net of provision for (benefit from) income taxes of $4 million and $(68) million for the quarters ended March 31, 2012 and2011, respectively.
(2) Amounts are net of provision for income taxes of $1 million and $2 million for the quarters ended March 31, 2012 and 2011,respectively.
(3) Amounts are net of (benefit from) income taxes of $(13) million and $(24) million for the quarters ended March 31, 2012 and 2011,respectively.
(4) Amounts are net of provision for (benefit from) income taxes of $2 million and $(4) million for the quarters ended March 31, 2012 and2011, respectively.
See Notes to Condensed Consolidated Financial Statements.
4
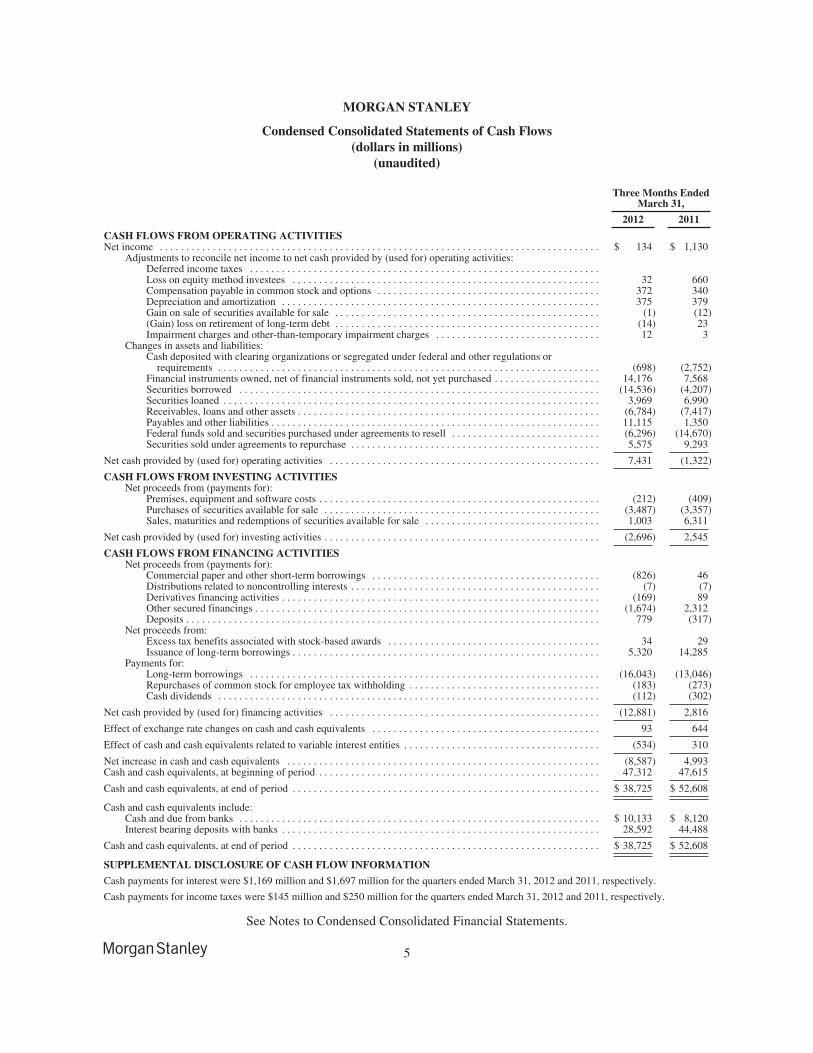
MORGAN STANLEY
Condensed Consolidated Statements of Cash Flows(dollars in millions)
(unaudited)
Three Months EndedMarch 31,
2012 2011
CASH FLOWS FROM OPERATING ACTIVITIESNet income . . . . . . . . . . . . . . . . . . . . . . . . . . . . . . . . . . . . . . . . . . . . . . . . . . . . . . . . . . . . . . . . . . . . . . . . . . . . . . . . . . . $ 134 $ 1,130
Adjustments to reconcile net income to net cash provided by (used for) operating activities:Deferred income taxes . . . . . . . . . . . . . . . . . . . . . . . . . . . . . . . . . . . . . . . . . . . . . . . . . . . . . . . . . . . . . . . . . .Loss on equity method investees . . . . . . . . . . . . . . . . . . . . . . . . . . . . . . . . . . . . . . . . . . . . . . . . . . . . . . . . . . 32 660Compensation payable in common stock and options . . . . . . . . . . . . . . . . . . . . . . . . . . . . . . . . . . . . . . . . . . 372 340Depreciation and amortization . . . . . . . . . . . . . . . . . . . . . . . . . . . . . . . . . . . . . . . . . . . . . . . . . . . . . . . . . . . . 375 379Gain on sale of securities available for sale . . . . . . . . . . . . . . . . . . . . . . . . . . . . . . . . . . . . . . . . . . . . . . . . . . (1) (12)(Gain) loss on retirement of long-term debt . . . . . . . . . . . . . . . . . . . . . . . . . . . . . . . . . . . . . . . . . . . . . . . . . . (14) 23Impairment charges and other-than-temporary impairment charges . . . . . . . . . . . . . . . . . . . . . . . . . . . . . . . 12 3
Changes in assets and liabilities:Cash deposited with clearing organizations or segregated under federal and other regulations or
requirements . . . . . . . . . . . . . . . . . . . . . . . . . . . . . . . . . . . . . . . . . . . . . . . . . . . . . . . . . . . . . . . . . . . . . . . . (698) (2,752)Financial instruments owned, net of financial instruments sold, not yet purchased . . . . . . . . . . . . . . . . . . . . 14,176 7,568Securities borrowed . . . . . . . . . . . . . . . . . . . . . . . . . . . . . . . . . . . . . . . . . . . . . . . . . . . . . . . . . . . . . . . . . . . . (14,536) (4,207)Securities loaned . . . . . . . . . . . . . . . . . . . . . . . . . . . . . . . . . . . . . . . . . . . . . . . . . . . . . . . . . . . . . . . . . . . . . . . 3,969 6,990Receivables, loans and other assets . . . . . . . . . . . . . . . . . . . . . . . . . . . . . . . . . . . . . . . . . . . . . . . . . . . . . . . . . (6,784) (7,417)Payables and other liabilities . . . . . . . . . . . . . . . . . . . . . . . . . . . . . . . . . . . . . . . . . . . . . . . . . . . . . . . . . . . . . . 11,115 1,350Federal funds sold and securities purchased under agreements to resell . . . . . . . . . . . . . . . . . . . . . . . . . . . . (6,296) (14,670)Securities sold under agreements to repurchase . . . . . . . . . . . . . . . . . . . . . . . . . . . . . . . . . . . . . . . . . . . . . . . 5,575 9,293
Net cash provided by (used for) operating activities . . . . . . . . . . . . . . . . . . . . . . . . . . . . . . . . . . . . . . . . . . . . . . . . . . . 7,431 (1,322)
CASH FLOWS FROM INVESTING ACTIVITIESNet proceeds from (payments for):
Premises, equipment and software costs . . . . . . . . . . . . . . . . . . . . . . . . . . . . . . . . . . . . . . . . . . . . . . . . . . . . . (212) (409)Purchases of securities available for sale . . . . . . . . . . . . . . . . . . . . . . . . . . . . . . . . . . . . . . . . . . . . . . . . . . . . (3,487) (3,357)Sales, maturities and redemptions of securities available for sale . . . . . . . . . . . . . . . . . . . . . . . . . . . . . . . . . 1,003 6,311
Net cash provided by (used for) investing activities . . . . . . . . . . . . . . . . . . . . . . . . . . . . . . . . . . . . . . . . . . . . . . . . . . . . (2,696) 2,545
CASH FLOWS FROM FINANCING ACTIVITIESNet proceeds from (payments for):
Commercial paper and other short-term borrowings . . . . . . . . . . . . . . . . . . . . . . . . . . . . . . . . . . . . . . . . . . . (826) 46Distributions related to noncontrolling interests . . . . . . . . . . . . . . . . . . . . . . . . . . . . . . . . . . . . . . . . . . . . . . . (7) (7)Derivatives financing activities . . . . . . . . . . . . . . . . . . . . . . . . . . . . . . . . . . . . . . . . . . . . . . . . . . . . . . . . . . . . (169) 89Other secured financings . . . . . . . . . . . . . . . . . . . . . . . . . . . . . . . . . . . . . . . . . . . . . . . . . . . . . . . . . . . . . . . . . (1,674) 2,312Deposits . . . . . . . . . . . . . . . . . . . . . . . . . . . . . . . . . . . . . . . . . . . . . . . . . . . . . . . . . . . . . . . . . . . . . . . . . . . . . . 779 (317)
Net proceeds from:Excess tax benefits associated with stock-based awards . . . . . . . . . . . . . . . . . . . . . . . . . . . . . . . . . . . . . . . . 34 29Issuance of long-term borrowings . . . . . . . . . . . . . . . . . . . . . . . . . . . . . . . . . . . . . . . . . . . . . . . . . . . . . . . . . . 5,320 14,285
Payments for:Long-term borrowings . . . . . . . . . . . . . . . . . . . . . . . . . . . . . . . . . . . . . . . . . . . . . . . . . . . . . . . . . . . . . . . . . . (16,043) (13,046)Repurchases of common stock for employee tax withholding . . . . . . . . . . . . . . . . . . . . . . . . . . . . . . . . . . . . (183) (273)Cash dividends . . . . . . . . . . . . . . . . . . . . . . . . . . . . . . . . . . . . . . . . . . . . . . . . . . . . . . . . . . . . . . . . . . . . . . . . (112) (302)
Net cash provided by (used for) financing activities . . . . . . . . . . . . . . . . . . . . . . . . . . . . . . . . . . . . . . . . . . . . . . . . . . . (12,881) 2,816
Effect of exchange rate changes on cash and cash equivalents . . . . . . . . . . . . . . . . . . . . . . . . . . . . . . . . . . . . . . . . . . . 93 644
Effect of cash and cash equivalents related to variable interest entities . . . . . . . . . . . . . . . . . . . . . . . . . . . . . . . . . . . . . (534) 310
Net increase in cash and cash equivalents . . . . . . . . . . . . . . . . . . . . . . . . . . . . . . . . . . . . . . . . . . . . . . . . . . . . . . . . . . . (8,587) 4,993Cash and cash equivalents, at beginning of period . . . . . . . . . . . . . . . . . . . . . . . . . . . . . . . . . . . . . . . . . . . . . . . . . . . . . 47,312 47,615
Cash and cash equivalents, at end of period . . . . . . . . . . . . . . . . . . . . . . . . . . . . . . . . . . . . . . . . . . . . . . . . . . . . . . . . . . $ 38,725 $ 52,608
Cash and cash equivalents include:Cash and due from banks . . . . . . . . . . . . . . . . . . . . . . . . . . . . . . . . . . . . . . . . . . . . . . . . . . . . . . . . . . . . . . . . . . . . $ 10,133 $ 8,120Interest bearing deposits with banks . . . . . . . . . . . . . . . . . . . . . . . . . . . . . . . . . . . . . . . . . . . . . . . . . . . . . . . . . . . . 28,592 44,488
Cash and cash equivalents, at end of period . . . . . . . . . . . . . . . . . . . . . . . . . . . . . . . . . . . . . . . . . . . . . . . . . . . . . . . . . . $ 38,725 $ 52,608
SUPPLEMENTAL DISCLOSURE OF CASH FLOW INFORMATION
Cash payments for interest were $1,169 million and $1,697 million for the quarters ended March 31, 2012 and 2011, respectively.
Cash payments for income taxes were $145 million and $250 million for the quarters ended March 31, 2012 and 2011, respectively.
See Notes to Condensed Consolidated Financial Statements.
5
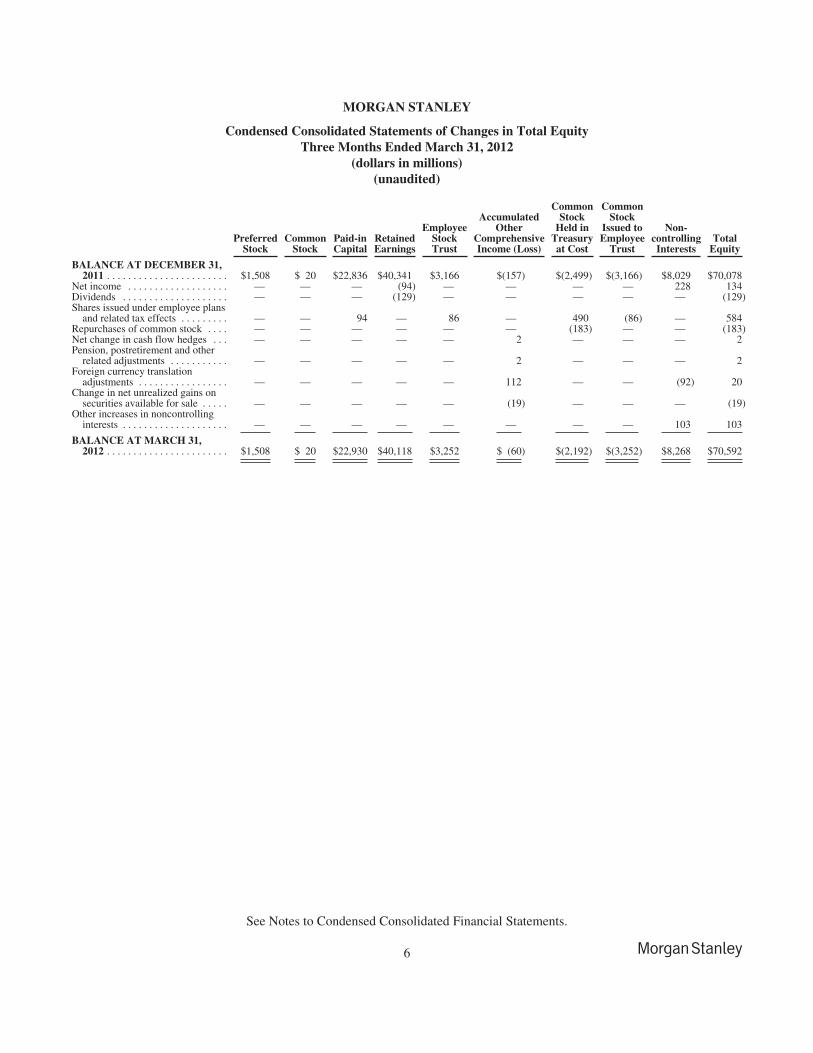
MORGAN STANLEY
Condensed Consolidated Statements of Changes in Total EquityThree Months Ended March 31, 2012
(dollars in millions)(unaudited)
PreferredStock
CommonStock
Paid-inCapital
RetainedEarnings
EmployeeStockTrust
AccumulatedOther
ComprehensiveIncome (Loss)
CommonStock
Held inTreasuryat Cost
CommonStock
Issued toEmployee
Trust
Non-controllingInterests
TotalEquity
BALANCE AT DECEMBER 31,2011 . . . . . . . . . . . . . . . . . . . . . . . $1,508 $ 20 $22,836 $40,341 $3,166 $(157) $(2,499) $(3,166) $8,029 $70,078
Net income . . . . . . . . . . . . . . . . . . . — — — (94) — — — — 228 134Dividends . . . . . . . . . . . . . . . . . . . . — — — (129) — — — — — (129)Shares issued under employee plans
and related tax effects . . . . . . . . . — — 94 — 86 — 490 (86) — 584Repurchases of common stock . . . . — — — — — — (183) — — (183)Net change in cash flow hedges . . . — — — — — 2 — — — 2Pension, postretirement and other
related adjustments . . . . . . . . . . . — — — — — 2 — — — 2Foreign currency translation
adjustments . . . . . . . . . . . . . . . . . — — — — — 112 — — (92) 20Change in net unrealized gains on
securities available for sale . . . . . — — — — — (19) — — — (19)Other increases in noncontrolling
interests . . . . . . . . . . . . . . . . . . . . — — — — — — — — 103 103
BALANCE AT MARCH 31,2012 . . . . . . . . . . . . . . . . . . . . . . . $1,508 $ 20 $22,930 $40,118 $3,252 $ (60) $(2,192) $(3,252) $8,268 $70,592
See Notes to Condensed Consolidated Financial Statements.
6
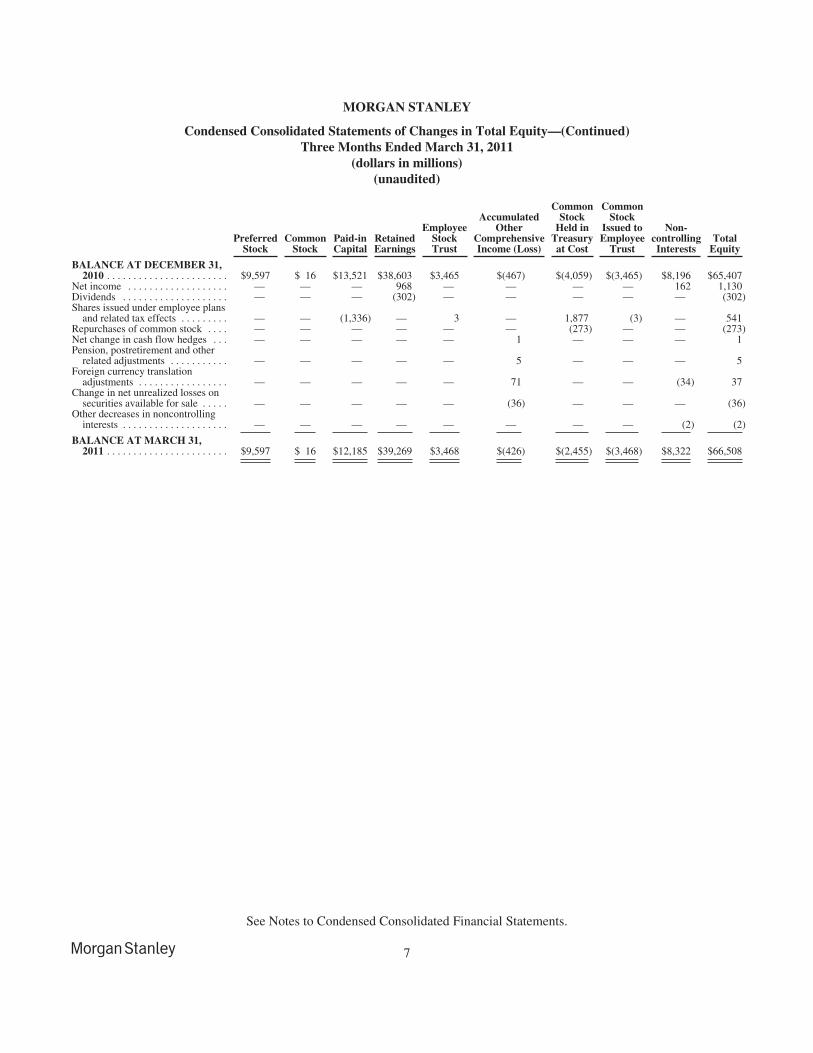
MORGAN STANLEY
Condensed Consolidated Statements of Changes in Total Equity—(Continued)Three Months Ended March 31, 2011
(dollars in millions)(unaudited)
PreferredStock
CommonStock
Paid-inCapital
RetainedEarnings
EmployeeStockTrust
AccumulatedOther
ComprehensiveIncome (Loss)
CommonStock
Held inTreasuryat Cost
CommonStock
Issued toEmployee
Trust
Non-controllingInterests
TotalEquity
BALANCE AT DECEMBER 31,2010 . . . . . . . . . . . . . . . . . . . . . . . $9,597 $ 16 $13,521 $38,603 $3,465 $(467) $(4,059) $(3,465) $8,196 $65,407
Net income . . . . . . . . . . . . . . . . . . . — — — 968 — — — — 162 1,130Dividends . . . . . . . . . . . . . . . . . . . . — — — (302) — — — — — (302)Shares issued under employee plans
and related tax effects . . . . . . . . . — — (1,336) — 3 — 1,877 (3) — 541Repurchases of common stock . . . . — — — — — — (273) — — (273)Net change in cash flow hedges . . . — — — — — 1 — — — 1Pension, postretirement and other
related adjustments . . . . . . . . . . . — — — — — 5 — — — 5Foreign currency translation
adjustments . . . . . . . . . . . . . . . . . — — — — — 71 — — (34) 37Change in net unrealized losses on
securities available for sale . . . . . — — — — — (36) — — — (36)Other decreases in noncontrolling
interests . . . . . . . . . . . . . . . . . . . . — — — — — — — — (2) (2)
BALANCE AT MARCH 31,2011 . . . . . . . . . . . . . . . . . . . . . . . $9,597 $ 16 $12,185 $39,269 $3,468 $(426) $(2,455) $(3,468) $8,322 $66,508
See Notes to Condensed Consolidated Financial Statements.
7
MORGAN STANLEY
NOTES TO CONDENSED CONSOLIDATED FINANCIAL STATEMENTS
1. Introduction and Basis of Presentation.
The Company. Morgan Stanley, a financial holding company, is a global financial services firm that maintainssignificant market positions in each of its business segments—Institutional Securities, Global WealthManagement Group and Asset Management. Unless the context otherwise requires, the terms “Morgan Stanley”and the “Company” mean Morgan Stanley and its consolidated subsidiaries.
A summary of the activities of each of the Company’s business segments is as follows:
Institutional Securities provides capital raising; financial advisory services, including advice on mergers andacquisitions, restructurings, real estate and project finance; corporate lending; sales, trading, financing andmarket-making activities in equity and fixed income securities and related products, including foreignexchange and commodities; and investment activities.
Global Wealth Management Group, which includes the Company’s 51% interest in Morgan Stanley SmithBarney Holdings LLC (“MSSB”), provides brokerage and investment advisory services to individualinvestors and small-to-medium sized businesses and institutions covering various investment alternatives;financial and wealth planning services; annuity and other insurance products; credit and other lendingproducts; cash management services; retirement services; and trust and fiduciary services and engages infixed income principal trading, which primarily facilitates clients’ trading or investments in such securities.
Asset Management provides a broad array of investment strategies that span the risk/return spectrum acrossgeographies, asset classes and public and private markets to a diverse group of clients across theinstitutional and intermediary channels as well as high net worth clients (see “Discontinued Operations—Retail Asset Management Business” herein).
Discontinued Operations.
Saxon. On October 24, 2011, the Company announced that it had reached an agreement to sell Saxon, aprovider of servicing and subservicing of residential mortgage loans, to Ocwen Financial Corporation. During thefirst quarter of 2012, the transaction was restructured as a sale of Saxon’s assets, the first phase of which wascompleted in the second quarter of 2012. The remaining operations of Saxon are expected to be wound downwithin the year. The Company expects to incur incremental wind-down costs in future periods. The results ofSaxon are reported as discontinued operations within the Institutional Securities business segment for all periodspresented.
Quilter. On April 2, 2012, the Company closed the sale of Quilter Holdings Ltd. (“Quilter”), its retail wealthmanagement business in the United Kingdom (“U.K.”). The Company has classified Quilter as held for salewithin the Global Wealth Management Group business segment and the results of its operations are presented asdiscontinued operations for all periods presented.
Prior period amounts have been recast for discontinued operations. See Note 20 for additional information ondiscontinued operations.
Basis of Financial Information. The condensed consolidated financial statements are prepared in accordancewith accounting principles generally accepted in the United States of America (“U.S.”), which require theCompany to make estimates and assumptions regarding the valuations of certain financial instruments, thevaluation of goodwill and intangible assets, compensation, deferred tax assets, the outcome of litigation and taxmatters, and other matters that affect the condensed consolidated financial statements and related disclosures.The Company believes that the estimates utilized in the preparation of the condensed consolidated financialstatements are prudent and reasonable. Actual results could differ materially from these estimates.
8
MORGAN STANLEY
NOTES TO CONDENSED CONSOLIDATED FINANCIAL STATEMENTS—(Continued)
Intercompany balances and transactions have been eliminated.
The condensed consolidated financial statements should be read in conjunction with the Company’s consolidatedfinancial statements and notes thereto included in the Company’s Annual Report on Form 10-K for the yearended December 31, 2011 (the “Form 10-K”). The condensed consolidated financial statements reflect alladjustments that are, in the opinion of management, necessary for the fair presentation of the results for theinterim period. The results of operations for interim periods are not necessarily indicative of results for the entireyear.
Consolidation. The condensed consolidated financial statements include the accounts of the Company, itswholly owned subsidiaries and other entities in which the Company has a controlling financial interest, includingcertain variable interest entities (“VIE”) (see Note 6). For condensed consolidated subsidiaries that are less thanwholly owned, the third-party holdings of equity interests are referred to as noncontrolling interests. The portionof net income attributable to noncontrolling interests for such subsidiaries is presented as Net income (loss)applicable to noncontrolling interests in the condensed consolidated statements of income, and the portion of theshareholders’ equity of such subsidiaries is presented as Noncontrolling interests in the condensed consolidatedstatements of financial condition and condensed consolidated statements of changes in total equity.
For entities where (1) the total equity investment at risk is sufficient to enable the entity to finance its activitieswithout additional support and (2) the equity holders bear the economic residual risks and returns of the entityand have the power to direct the activities of the entity that most significantly affect its economic performance,the Company consolidates those entities it controls either through a majority voting interest or otherwise. ForVIEs (i.e., entities that do not meet these criteria), the Company consolidates those entities where the Companyhas the power to make the decisions that most significantly affect the economic performance of the VIE and hasthe obligation to absorb losses or the right to receive benefits that could potentially be significant to the VIE,except for certain VIEs that are money market funds, investment companies or are entities qualifying foraccounting purposes as investment companies. Generally, the Company consolidates those entities when itabsorbs a majority of the expected losses or a majority of the expected residual returns, or both, of the entities.
For investments in entities in which the Company does not have a controlling financial interest but hassignificant influence over operating and financial decisions, the Company generally applies the equity method ofaccounting with net gains and losses recorded within Other revenues. Where the Company has elected to measurecertain eligible investments at fair value in accordance with the fair value option, net gains and losses arerecorded within Principal transactions—Investments (see Note 3).
Equity and partnership interests held by entities qualifying for accounting purposes as investment companies arecarried at fair value.
The Company’s significant regulated U.S. and international subsidiaries include Morgan Stanley & Co. LLC(“MS&Co.”), Morgan Stanley Smith Barney LLC, Morgan Stanley & Co. International plc (“MSIP”), MorganStanley MUFG Securities, Co., Ltd. (“MSMS”), Morgan Stanley Bank, N.A. and Morgan Stanley Private Bank,National Association.
Income Statement Presentation. The Company, through its subsidiaries and affiliates, provides a wide varietyof products and services to a large and diversified group of clients and customers, including corporations,governments, financial institutions and individuals. In connection with the delivery of the various products andservices to clients, the Company manages its revenues and related expenses in the aggregate. As such, whenassessing the performance of its businesses, primarily in its Institutional Securities business segment, theCompany considers its principal trading, investment banking, commissions and fees and interest income, alongwith the associated interest expense, as one integrated activity.
9
MORGAN STANLEY
NOTES TO CONDENSED CONSOLIDATED FINANCIAL STATEMENTS—(Continued)
2. Significant Accounting Policies.
For a detailed discussion about the Company’s significant accounting policies, see Note 2 to the consolidatedfinancial statements for the year ended December 31, 2011 included in the Form 10-K.
During the quarter ended March 31, 2012, other than the following, no other updates were made to theCompany’s significant accounting policies.
Financial Instruments and Fair Value—Valuation Process.
The Valuation Review Group (“VRG”) within the Financial Control Group (“FCG”) is responsible for theCompany’s fair value valuation policies, processes and procedures. VRG is independent of the business units andreports to the Chief Financial Officer (“CFO”), who has final authority over the valuation of the Company’sfinancial instruments. VRG implements valuation control processes to validate the fair value of the Company’sfinancial instruments measured at fair value including those derived from pricing models. These controlprocesses are designed to assure that the values used for financial reporting are based on observable inputswherever possible. In the event that observable inputs are not available, the control processes are designed toassure that the valuation approach utilized is appropriate and consistently applied and the assumptions arereasonable.
The Company’s control processes include:
Model Review. VRG, in conjunction with the Market Risk Department (“MRD”) and, where appropriate,the Credit Risk Management Department, both of which report to the Chief Risk Officer, independentlyreview the valuation model’s theoretical soundness, the appropriateness of the valuation methodology andcalibration techniques developed by the business units using observable inputs. Where inputs are notobservable, VRG reviews the appropriateness of the proposed valuation methodology to ensure it isconsistent with how a market participant would arrive at the unobservable input. The valuationmethodologies utilized in the absence of observable inputs may include extrapolation techniques and the useof comparable observable inputs. As part of the review, VRG develops a methodology to independentlyverify the fair value generated by the business unit’s valuation model. Before trades are executed using newvaluation models, those models are required to be independently reviewed. All of the Company’s valuationmodels are subject to an independent annual review.
Independent Price Verification. The business units are responsible for determining the fair value of financialinstruments using approved valuation models and valuation methodologies. Generally on a monthly basis,VRG independently validates the fair values of financial instruments determined using valuation models bydetermining the appropriateness of the inputs used by the business units and testing compliance with thedocumented valuation methodologies approved in the model review process described above.
VRG uses recently executed transactions, other observable market data such as exchange data, broker/dealerquotes, third-party pricing vendors and aggregation services for validating the fair values of financialinstruments generated using valuation models. VRG assesses the external sources and their valuationmethodologies to determine if the external providers meet the minimum standards expected of a third-partypricing source. Pricing data provided by approved external sources is evaluated using a number ofapproaches; for example, by corroborating the external sources’ prices to executed trades, analyzing themethodology and assumptions used by the external source to generate a price and/or by evaluating howactive the third-party pricing source (or originating sources used by the third-party pricing source) is in themarket. Based on this analysis, VRG generates a ranking of the observable market data to ensure that thehighest-ranked market data source is used to validate the business unit’s fair value of financial instruments.
10
MORGAN STANLEY
NOTES TO CONDENSED CONSOLIDATED FINANCIAL STATEMENTS—(Continued)
For financial instruments categorized within Level 3 of the fair value hierarchy, VRG reviews the businessunit’s valuation techniques to ensure these are consistent with market participant assumptions.
The results of this independent price verification and any adjustments made by VRG to the fair valuegenerated by the business units are presented to management of the three business segments (i.e.,Institutional Securities, Global Wealth Management Group and Asset Management), the CFO and the ChiefRisk Officer on a regular basis.
Review of New Level 3 Transactions. VRG reviews the model and valuation methodology used to price allnew material Level 3 transactions and both FCG and MRD management must approve the fair value of thetrade that is initially recognized.
Securities Available for Sale – Other-than-temporary Impairment.
For available for sale (“AFS”) debt securities, a credit loss exists if the present value of cash flows expected to becollected is less than the amortized cost basis of the security. When determining if a credit loss exists, theCompany considers all relevant information including the length of time and the extent to which the fair valuehas been less than the amortized cost basis; adverse conditions specifically related to the security, an industry, orgeographic area; changes in the financial condition of the issuer of the security, or in the case of an asset-backeddebt security, changes in the financial condition of the underlying loan obligors; the historical and impliedvolatility of the fair value of the security; the payment structure of the debt security and the likelihood of theissuer being able to make payments that increase in the future; failure of the issuer of the security to makescheduled interest or principal payments; any changes to the rating of the security by a rating agency andrecoveries or additional declines in fair value after the balance sheet date. When estimating the present value ofexpected cash flows, information shall include the remaining payment terms of the security, prepayment speeds,financial condition of the issuer(s), expected defaults and the value of any underlying collateral.
For AFS equity securities, the Company considers various factors including the intent and ability to hold theequity security for a period of time sufficient to allow for any anticipated recovery in market value in evaluatingwhether an other-than-temporary impairment (“OTTI”) exists. If the equity security is considered other-than-temporarily impaired, the security will be written down to fair value, with the full difference between fair valueand cost recognized in earnings.
Accounting Developments.
Reconsideration of Effective Control for Repurchase Agreements.
In April 2011, the Financial Accounting Standards Board (the “FASB”) issued accounting guidance that modifiesthe criteria that must be satisfied for a transfer of financial assets to be accounted for as a sale. If the transferormaintains effective control over the transferred assets, the transaction is to be accounted for as a financing. Thisguidance eliminates from the assessment of effective control (1) the criterion requiring the transferor to have theability to repurchase or redeem the financial assets on substantially the agreed terms, even in the event of defaultby the transferee, and (2) the collateral maintenance implementation guidance related to that criterion. Thisguidance is effective for transfers occurring on and after January 1, 2012. The adoption of this accountingguidance did not have a material impact on the Company’s condensed consolidated financial statements.
Amendments to Achieve Common Fair Value Measurement and Disclosure Requirements in U.S. GAAP andIFRS.
In May 2011, the FASB issued an accounting update that clarifies existing fair value measurement guidance andchanges certain principles or requirements for measuring fair value or disclosing information about fair value
11
MORGAN STANLEY
NOTES TO CONDENSED CONSOLIDATED FINANCIAL STATEMENTS—(Continued)
measurements. This update results in common principles and requirements for measuring fair value and fordisclosing information about fair value measurement in accordance with U.S. GAAP and International FinancialReporting Standards (“IFRS”). The guidance became effective for the Company beginning on January 1, 2012.See Note 3 for additional disclosures as required by this accounting guidance.
Goodwill Impairment Test.
In September 2011, the FASB issued accounting guidance that simplifies how entities test goodwill forimpairment. This guidance allows entities an option to first assess qualitative factors to determine whether it isnecessary to perform the two-step quantitative goodwill impairment test. Under that option, an entity no longerwould be required to calculate the fair value of a reporting unit unless the entity determines, based on thatqualitative assessment, that it is more likely than not that its fair value is less than its carrying amount. Thisguidance became effective for the Company beginning on January 1, 2012. The adoption of this accountingguidance did not have a material impact on the Company’s condensed consolidated financial statements.
3. Fair Value Disclosures.
Fair Value Measurements.
A description of the valuation techniques applied to the Company’s major categories of assets and liabilitiesmeasured at fair value on a recurring basis follows.
Financial Instruments Owned and Financial Instruments Sold, Not Yet Purchased.
U.S. Government and Agency Securities.
• U.S. Treasury Securities. U.S. Treasury securities are valued using quoted market prices. Valuationadjustments are not applied. Accordingly, U.S. Treasury securities are generally categorized in Level 1 ofthe fair value hierarchy.
• U.S. Agency Securities. U.S. agency securities are composed of three main categories consisting ofagency-issued debt, agency mortgage pass-through pool securities and collateralized mortgageobligations. Non-callable agency-issued debt securities are generally valued using quoted market prices.Callable agency-issued debt securities are valued by benchmarking model-derived prices to quotedmarket prices and trade data for identical or comparable securities. The fair value of agency mortgagepass-through pool securities is model-driven based on spreads of the comparable To-be-announced(“TBA”) security. Collateralized mortgage obligations are valued using quoted market prices and tradedata adjusted by subsequent changes in related indices for identical or comparable securities. Activelytraded non-callable agency-issued debt securities are generally categorized in Level 1 of the fair valuehierarchy. Callable agency-issued debt securities, agency mortgage pass-through pool securities andcollateralized mortgage obligations are generally categorized in Level 2 of the fair value hierarchy.
Other Sovereign Government Obligations.
• Foreign sovereign government obligations are valued using quoted prices in active markets whenavailable. To the extent quoted prices are not available, fair value is determined based on a valuationmodel that has as inputs interest rate yield curves, cross-currency basis index spreads, and country creditspreads for structures similar to the bond in terms of issuer, maturity and seniority. These bonds aregenerally categorized in Level 1 or Level 2 of the fair value hierarchy.
12
MORGAN STANLEY
NOTES TO CONDENSED CONSOLIDATED FINANCIAL STATEMENTS—(Continued)
Corporate and Other Debt.
• State and Municipal Securities. The fair value of state and municipal securities is determined usingrecently executed transactions, market price quotations and pricing models that factor in, whereapplicable, interest rates, bond or credit default swap spreads and volatility. These bonds are generallycategorized in Level 2 of the fair value hierarchy.
• Residential Mortgage-Backed Securities (“RMBS”), Commercial Mortgage-Backed Securities (“CMBS”)and other Asset-Backed Securities (“ABS”). RMBS, CMBS and other ABS may be valued based onprice or spread data obtained from observed transactions or independent external parties such as vendorsor brokers. When position-specific external price data are not observable, the fair value determinationmay require benchmarking to similar instruments and/or analyzing expected credit losses, default andrecovery rates. In evaluating the fair value of each security, the Company considers security collateral-specific attributes, including payment priority, credit enhancement levels, type of collateral, delinquencyrates and loss severity. In addition, for RMBS borrowers, Fair Isaac Corporation (“FICO”) scores and thelevel of documentation for the loan are also considered. Market standard models, such as Intex, Trepp orothers, may be deployed to model the specific collateral composition and cash flow structure of eachtransaction. Key inputs to these models are market spreads, forecasted credit losses, default andprepayment rates for each asset category. Valuation levels of RMBS and CMBS indices are also used asan additional data point for benchmarking purposes or to price outright index positions.
RMBS, CMBS and other ABS are generally categorized in Level 2 of the fair value hierarchy. If externalprices or significant spread inputs are unobservable or if the comparability assessment involvessignificant subjectivity related to property type differences, cash flows, performance and other inputs,then RMBS, CMBS and other ABS are categorized in Level 3 of the fair value hierarchy.
• Corporate Bonds. The fair value of corporate bonds is determined using recently executed transactions,market price quotations (where observable), bond spreads or credit default swap spreads obtained fromindependent external parties such as vendors and brokers adjusted for any basis difference between cashand derivative instruments. The spread data used are for the same maturity as the bond. If the spread datado not reference the issuer, then data that reference a comparable issuer are used. When position-specificexternal price data are not observable, fair value is determined based on either benchmarking to similarinstruments or cash flow models with yield curves, bond or single name credit default swap spreads andrecovery rates as significant inputs. Corporate bonds are generally categorized in Level 2 of the fair valuehierarchy; in instances where prices, spreads or any of the other aforementioned key inputs areunobservable, they are categorized in Level 3 of the fair value hierarchy.
• Collateralized Debt Obligations (“CDO”). The Company holds cash CDOs that typically reference atranche of an underlying synthetic portfolio of single name credit default swaps collateralized bycorporate bonds (“credit-linked notes”) or cash portfolio of asset-backed securities (“asset-backedCDOs”). Credit correlation, a primary input used to determine the fair value of credit-linked notes, isusually unobservable and derived using a benchmarking technique. The other credit-linked note modelinputs such as credit spreads, including collateral spreads, and interest rates are typically observable.Asset-backed CDOs are valued based on an evaluation of the market and model input parameters sourcedfrom similar positions as indicated by primary and secondary market activity. Each asset-backed CDOposition is evaluated independently taking into consideration available comparable market levels,underlying collateral performance and pricing, deal structures, as well as liquidity. Cash CDOs arecategorized in Level 2 of the fair value hierarchy when either the credit correlation input is insignificantor comparable market transactions are observable. In instances where the credit correlation input isdeemed to be significant or comparable market transactions are unobservable, cash CDOs are categorizedin Level 3 of the fair value hierarchy.
13
MORGAN STANLEY
NOTES TO CONDENSED CONSOLIDATED FINANCIAL STATEMENTS—(Continued)
• Corporate Loans and Lending Commitments. The fair value of corporate loans is determined usingrecently executed transactions, market price quotations (where observable), implied yields fromcomparable debt, and market observable credit default swap spread levels obtained from independentexternal parties such as vendors and brokers adjusted for any basis difference between cash and derivativeinstruments, along with proprietary valuation models and default recovery analysis where suchtransactions and quotations are unobservable. The fair value of contingent corporate lendingcommitments is determined by using executed transactions on comparable loans and the anticipatedmarket price based on pricing indications from syndicate banks and customers. The valuation of loans andlending commitments also takes into account fee income that is considered an attribute of the contract.Corporate loans and lending commitments are categorized in Level 2 of the fair value hierarchy except ininstances where prices or significant spread inputs are unobservable, in which case they are categorized inLevel 3 of the fair value hierarchy. Corporate loans and lending commitments are presented within Loansand lending commitments in the fair value hierarchy table.
• Mortgage Loans. Mortgage loans are valued using observable prices based on transactional data or thirdparty pricing for identical or comparable instruments, when available. Where position-specific externalprices are not observable, the Company estimates fair value based on benchmarking to prices and ratesobserved in the primary market for similar loan or borrower types or based on the present value ofexpected future cash flows using its best estimates of the key assumptions, including forecasted creditlosses, prepayment rates, forward yield curves and discount rates commensurate with the risks involvedor a methodology that utilizes the capital structure and credit spreads of recent comparable securitizationtransactions. Mortgage loans valued based on observable market data for identical or comparableinstruments are categorized in Level 2 of the fair value hierarchy. Where observable prices are notavailable, due to the subjectivity involved in the comparability assessment related to mortgage loanvintage, geographical concentration, prepayment speed and projected loss assumptions, mortgage loansare categorized in Level 3 of the fair value hierarchy. Mortgage loans are presented within Loans andlending commitments in the fair value hierarchy table.
• Auction Rate Securities (“ARS”). The Company primarily holds investments in Student Loan AuctionRate Securities (“SLARS”) and Municipal Auction Rate Securities (“MARS”) with interest rates that arereset through periodic auctions. SLARS are ABS backed by pools of student loans. MARS are municipalbonds often wrapped by municipal bond insurance. ARS were historically traded and valued as floatingrate notes, priced at par due to the auction mechanism. Beginning in fiscal 2008, uncertainties in thecredit markets have resulted in auctions failing for certain types of ARS. Once the auctions failed, ARScould no longer be valued using observations of auction market prices. Accordingly, the fair value ofARS is determined using independent external market data where available and an internally developedmethodology to discount for the lack of liquidity and non-performance risk.
Inputs that impact the valuation of SLARS are independent external market data, the underlying collateraltypes, level of seniority in the capital structure, amount of leverage in each structure, credit rating andliquidity considerations. Inputs that impact the valuation of MARS are independent external market datawhen available, the maximum rate, quality of underlying issuers/insurers and evidence of issuer calls.ARS are generally categorized in Level 2 of the fair value hierarchy as the valuation technique relies onobservable external data. SLARS and MARS are presented within Asset-backed securities and State andmunicipal securities, respectively, in the fair value hierarchy table.
14
MORGAN STANLEY
NOTES TO CONDENSED CONSOLIDATED FINANCIAL STATEMENTS—(Continued)
Corporate Equities.
• Exchange-Traded Equity Securities. Exchange-traded equity securities are generally valued based onquoted prices from the exchange. To the extent these securities are actively traded, valuation adjustmentsare not applied, and they are categorized in Level 1 of the fair value hierarchy; otherwise, they arecategorized in Level 2 or Level 3 of the fair value hierarchy.
• Unlisted Equity Securities. Unlisted equity securities are valued based on an assessment of eachunderlying security, considering rounds of financing and third-party transactions, discounted cash flowanalyses and market-based information, including comparable company transactions, trading multiplesand changes in market outlook, among other factors. These securities are generally categorized in Level 3of the fair value hierarchy.
• Fund Units. Listed fund units are generally marked to the exchange-traded price or net asset value(“NAV”) and are categorized in Level 1 of the fair value hierarchy if actively traded on an exchange or inLevel 2 of the fair value hierarchy if trading is not active. Unlisted fund units are generally marked toNAV and categorized as Level 2; however, positions which are not redeemable at the measurement dateor in the near future are categorized in Level 3 of the fair value hierarchy.
Derivative and Other Contracts.
• Listed Derivative Contracts. Listed derivatives that are actively traded are valued based on quotedprices from the exchange and are categorized in Level 1 of the fair value hierarchy. Listed derivatives thatare not actively traded are valued using the same approaches as those applied to over-the-counter(“OTC”) derivatives; they are generally categorized in Level 2 of the fair value hierarchy.
• OTC Derivative Contracts. OTC derivative contracts include forward, swap and option contracts relatedto interest rates, foreign currencies, credit standing of reference entities, equity prices or commodityprices.
Depending on the product and the terms of the transaction, the fair value of OTC derivative products canbe either observed or modeled using a series of techniques and model inputs from comparablebenchmarks, including closed-form analytic formulas, such as the Black-Scholes option-pricing model,and simulation models or a combination thereof. Many pricing models do not entail material subjectivitybecause the methodologies employed do not necessitate significant judgment, and the pricing inputs areobserved from actively quoted markets, as is the case for generic interest rate swaps, certain optioncontracts and certain credit default swaps. In the case of more established derivative products, the pricingmodels used by the Company are widely accepted by the financial services industry. A substantialmajority of OTC derivative products valued by the Company using pricing models fall into this categoryand are categorized in Level 2 of the fair value hierarchy.
Other derivative products, including complex products that have become illiquid, require more judgmentin the implementation of the valuation technique applied due to the complexity of the valuationassumptions and the reduced observability of inputs. This includes certain types of interest ratederivatives with both volatility and correlation exposure and credit derivatives including credit defaultswaps on certain mortgage-backed or asset-backed securities, basket credit default swaps andCDO-squared positions (a CDO-squared position is a special purpose vehicle that issues interests, ortranches, that are backed by tranches issued by other CDOs) where direct trading activity or quotes areunobservable. These instruments involve significant unobservable inputs and are categorized in Level 3of the fair value hierarchy.
Derivative interests in credit default swaps on certain mortgage-backed or asset-backed securities, forwhich observability of external price data is limited, are valued based on an evaluation of the market and
15
MORGAN STANLEY
NOTES TO CONDENSED CONSOLIDATED FINANCIAL STATEMENTS—(Continued)
model input parameters sourced from similar positions as indicated by primary and secondary marketactivity. Each position is evaluated independently taking into consideration available comparable marketlevels as well as cash-synthetic basis, or the underlying collateral performance and pricing, behavior ofthe tranche under various cumulative loss and prepayment scenarios, deal structures (e.g., non-amortizingreference obligations, call features, etc.) and liquidity. While these factors may be supported by historicaland actual external observations, the determination of their value as it relates to specific positionsnevertheless requires significant judgment.
For basket credit default swaps and CDO-squared positions, the correlation input between referencecredits is unobservable for each specific swap or position and is benchmarked to standardized proxybaskets for which correlation data are available. The other model inputs such as credit spread, interestrates and recovery rates are observable. In instances where the correlation input is deemed to besignificant, these instruments are categorized in Level 3 of the fair value hierarchy; otherwise, theseinstruments are categorized in Level 2 of the fair value hierarchy.
The Company trades various derivative structures with commodity underlyings. Depending on the type ofstructure, the model inputs generally include interest rate yield curves, commodity underlier price curves,implied volatility of the underlying commodities and, in some cases, the implied correlation betweenthese inputs. The fair value of these products is determined using executed trades and broker andconsensus data to provide values for the aforementioned inputs. Where these inputs are unobservable,relationships to observable commodities and data points, based on historic and/or implied observations,are employed as a technique to estimate the model input values. Commodity derivatives are generallycategorized in Level 2 of the fair value hierarchy; in instances where significant inputs are unobservable,they are categorized in Level 3 of the fair value hierarchy.
For further information on derivative instruments and hedging activities, see Note 10.
Investments.
• The Company’s investments include direct investments in equity securities as well as investments inprivate equity funds, real estate funds and hedge funds, which include investments made in connectionwith certain employee deferred compensation plans. Direct investments are presented in the fair valuehierarchy table as Principal investments and Other. Initially, the transaction price is generally consideredby the Company as the exit price and is the Company’s best estimate of fair value.
After initial recognition, in determining the fair value of non-exchange-traded internally and externallymanaged funds, the Company generally considers the NAV of the fund provided by the fund manager tobe the best estimate of fair value. For non-exchange-traded investments either held directly or held withininternally managed funds, fair value after initial recognition is based on an assessment of each underlyinginvestment, considering rounds of financing and third-party transactions, discounted cash flow analysesand market-based information, including comparable company transactions, trading multiples andchanges in market outlook, among other factors. Exchange-traded direct equity investments are generallyvalued based on quoted prices from the exchange.
Exchange-traded direct equity investments that are actively traded are categorized in Level 1 of the fairvalue hierarchy. Non-exchange-traded direct equity investments and investments in private equity andreal estate funds are generally categorized in Level 3 of the fair value hierarchy. Investments in hedgefunds that are redeemable at the measurement date or in the near future are categorized in Level 2 of thefair value hierarchy; otherwise, they are categorized in Level 3 of the fair value hierarchy.
16
MORGAN STANLEY
NOTES TO CONDENSED CONSOLIDATED FINANCIAL STATEMENTS—(Continued)
Physical Commodities.
• The Company trades various physical commodities, including crude oil and refined products, natural gas,base and precious metals and agricultural products. Fair value for physical commodities is determinedusing observable inputs, including broker quotations and published indices. Physical commodities arecategorized in Level 2 of the fair value hierarchy; in instances where significant inputs are unobservable,they are categorized in Level 3 of the fair value hierarchy.
Securities Available for Sale.
• Securities available for sale are composed of U.S. government and agency securities (e.g., U.S. Treasurysecurities, agency-issued debt, agency mortgage pass-through securities and collateralized mortgageobligations), Federal Family Education Loan Program (“FFELP”) student loan asset-backed securities,auto loan asset-backed securities, corporate bonds and equity securities. Actively traded U.S. Treasurysecurities, non-callable agency-issued debt securities and equity securities are generally categorized inLevel 1 of the fair value hierarchy. Callable agency-issued debt securities, agency mortgage pass-throughsecurities, collateralized mortgage obligations and FFELP student loan asset-backed securities, auto loanasset-backed securities and corporate bonds are generally categorized in Level 2 of the fair valuehierarchy. For further information on securities available for sale, see Note 4.
Deposits.
• Time Deposits. The fair value of certificates of deposit is determined using third-party quotations.These deposits are generally categorized in Level 2 of the fair value hierarchy.
Commercial Paper and Other Short-term Borrowings/Long-term Borrowings.
• Structured Notes. The Company issues structured notes that have coupon or repayment terms linked tothe performance of fixed income or equity securities, indices, currencies or commodities. Fair value ofstructured notes is determined using valuation models for the derivative and debt portions of the notes.These models incorporate observable inputs referencing identical or comparable securities, includingprices that the notes are linked to, interest rate yield curves, option volatility and currency, commodity orequity prices. Independent, external and traded prices for the notes are also considered. The impact of theCompany’s own credit spreads is also included based on the Company’s observed secondary bond marketspreads. Most structured notes are categorized in Level 2 of the fair value hierarchy.
Securities Purchased under Agreements to Resell, and Securities Sold under Agreements to Repurchase.
• The fair value of a reverse repurchase agreement or repurchase agreement is computed using a standardcash flow discounting methodology. The inputs to the valuation include contractual cash flows andcollateral funding spreads, which are estimated using various benchmarks, interest rate yield curvesand option volatilities. In instances where the unobservable inputs are deemed significant, reverserepurchase agreements and repurchase agreements are categorized in Level 3 of the fair value hierarchy;otherwise, they are categorized in Level 2 of the fair value hierarchy.
The following fair value hierarchy tables present information about the Company’s assets and liabilitiesmeasured at fair value on a recurring basis at March 31, 2012 and December 31, 2011.
17
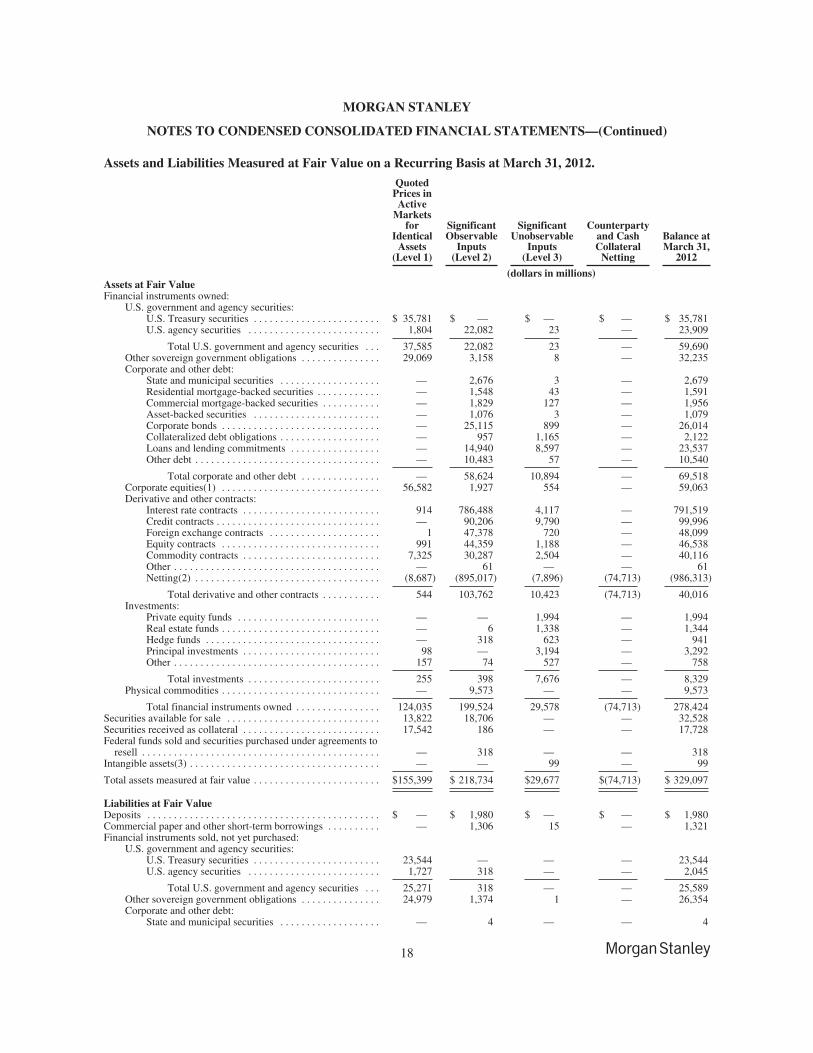
MORGAN STANLEY
NOTES TO CONDENSED CONSOLIDATED FINANCIAL STATEMENTS—(Continued)
Assets and Liabilities Measured at Fair Value on a Recurring Basis at March 31, 2012.Quoted
Prices inActive
Marketsfor
IdenticalAssets
(Level 1)
SignificantObservable
Inputs(Level 2)
SignificantUnobservable
Inputs(Level 3)
Counterpartyand CashCollateral
Netting
Balance atMarch 31,
2012
(dollars in millions)Assets at Fair ValueFinancial instruments owned:
U.S. government and agency securities:U.S. Treasury securities . . . . . . . . . . . . . . . . . . . . . . . . $ 35,781 $ — $ — $ — $ 35,781U.S. agency securities . . . . . . . . . . . . . . . . . . . . . . . . . 1,804 22,082 23 — 23,909
Total U.S. government and agency securities . . . 37,585 22,082 23 — 59,690Other sovereign government obligations . . . . . . . . . . . . . . . 29,069 3,158 8 — 32,235Corporate and other debt:
State and municipal securities . . . . . . . . . . . . . . . . . . . — 2,676 3 — 2,679Residential mortgage-backed securities . . . . . . . . . . . . — 1,548 43 — 1,591Commercial mortgage-backed securities . . . . . . . . . . . — 1,829 127 — 1,956Asset-backed securities . . . . . . . . . . . . . . . . . . . . . . . . — 1,076 3 — 1,079Corporate bonds . . . . . . . . . . . . . . . . . . . . . . . . . . . . . . — 25,115 899 — 26,014Collateralized debt obligations . . . . . . . . . . . . . . . . . . . — 957 1,165 — 2,122Loans and lending commitments . . . . . . . . . . . . . . . . . — 14,940 8,597 — 23,537Other debt . . . . . . . . . . . . . . . . . . . . . . . . . . . . . . . . . . . — 10,483 57 — 10,540
Total corporate and other debt . . . . . . . . . . . . . . . — 58,624 10,894 — 69,518Corporate equities(1) . . . . . . . . . . . . . . . . . . . . . . . . . . . . . . 56,582 1,927 554 — 59,063Derivative and other contracts:
Interest rate contracts . . . . . . . . . . . . . . . . . . . . . . . . . . 914 786,488 4,117 — 791,519Credit contracts . . . . . . . . . . . . . . . . . . . . . . . . . . . . . . . — 90,206 9,790 — 99,996Foreign exchange contracts . . . . . . . . . . . . . . . . . . . . . 1 47,378 720 — 48,099Equity contracts . . . . . . . . . . . . . . . . . . . . . . . . . . . . . . 991 44,359 1,188 — 46,538Commodity contracts . . . . . . . . . . . . . . . . . . . . . . . . . . 7,325 30,287 2,504 — 40,116Other . . . . . . . . . . . . . . . . . . . . . . . . . . . . . . . . . . . . . . . — 61 — — 61Netting(2) . . . . . . . . . . . . . . . . . . . . . . . . . . . . . . . . . . . (8,687) (895,017) (7,896) (74,713) (986,313)
Total derivative and other contracts . . . . . . . . . . . 544 103,762 10,423 (74,713) 40,016Investments:
Private equity funds . . . . . . . . . . . . . . . . . . . . . . . . . . . — — 1,994 — 1,994Real estate funds . . . . . . . . . . . . . . . . . . . . . . . . . . . . . . — 6 1,338 — 1,344Hedge funds . . . . . . . . . . . . . . . . . . . . . . . . . . . . . . . . . — 318 623 — 941Principal investments . . . . . . . . . . . . . . . . . . . . . . . . . . 98 — 3,194 — 3,292Other . . . . . . . . . . . . . . . . . . . . . . . . . . . . . . . . . . . . . . . 157 74 527 — 758
Total investments . . . . . . . . . . . . . . . . . . . . . . . . . 255 398 7,676 — 8,329Physical commodities . . . . . . . . . . . . . . . . . . . . . . . . . . . . . . — 9,573 — — 9,573
Total financial instruments owned . . . . . . . . . . . . . . . . 124,035 199,524 29,578 (74,713) 278,424Securities available for sale . . . . . . . . . . . . . . . . . . . . . . . . . . . . . 13,822 18,706 — — 32,528Securities received as collateral . . . . . . . . . . . . . . . . . . . . . . . . . . 17,542 186 — — 17,728Federal funds sold and securities purchased under agreements to
resell . . . . . . . . . . . . . . . . . . . . . . . . . . . . . . . . . . . . . . . . . . . . . — 318 — — 318Intangible assets(3) . . . . . . . . . . . . . . . . . . . . . . . . . . . . . . . . . . . . — — 99 — 99
Total assets measured at fair value . . . . . . . . . . . . . . . . . . . . . . . . $155,399 $ 218,734 $29,677 $(74,713) $ 329,097
Liabilities at Fair ValueDeposits . . . . . . . . . . . . . . . . . . . . . . . . . . . . . . . . . . . . . . . . . . . . $ — $ 1,980 $ — $ — $ 1,980Commercial paper and other short-term borrowings . . . . . . . . . . — 1,306 15 — 1,321Financial instruments sold, not yet purchased:
U.S. government and agency securities:U.S. Treasury securities . . . . . . . . . . . . . . . . . . . . . . . . 23,544 — — — 23,544U.S. agency securities . . . . . . . . . . . . . . . . . . . . . . . . . 1,727 318 — — 2,045
Total U.S. government and agency securities . . . 25,271 318 — — 25,589Other sovereign government obligations . . . . . . . . . . . . . . . 24,979 1,374 1 — 26,354Corporate and other debt:
State and municipal securities . . . . . . . . . . . . . . . . . . . — 4 — — 4
18
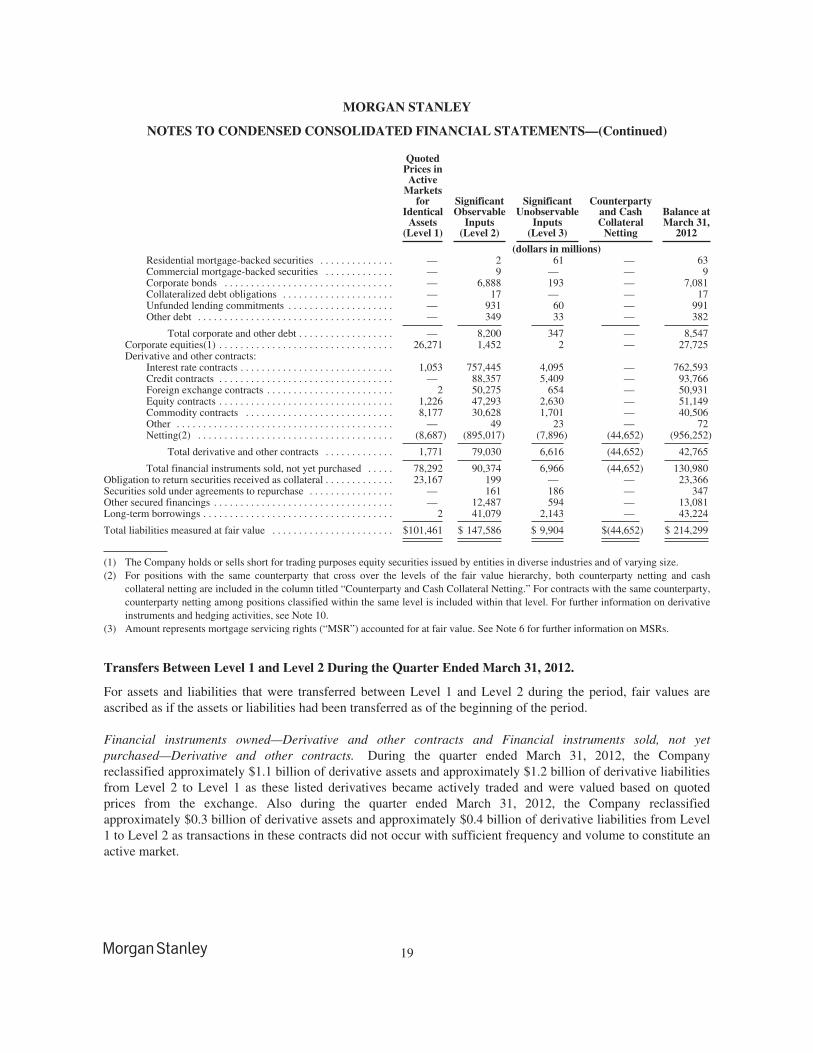
MORGAN STANLEY
NOTES TO CONDENSED CONSOLIDATED FINANCIAL STATEMENTS—(Continued)
QuotedPrices inActive
Marketsfor
IdenticalAssets
(Level 1)
SignificantObservable
Inputs(Level 2)
SignificantUnobservable
Inputs(Level 3)
Counterpartyand CashCollateral
Netting
Balance atMarch 31,
2012
(dollars in millions)Residential mortgage-backed securities . . . . . . . . . . . . . . — 2 61 — 63Commercial mortgage-backed securities . . . . . . . . . . . . . — 9 — — 9Corporate bonds . . . . . . . . . . . . . . . . . . . . . . . . . . . . . . . . — 6,888 193 — 7,081Collateralized debt obligations . . . . . . . . . . . . . . . . . . . . . — 17 — — 17Unfunded lending commitments . . . . . . . . . . . . . . . . . . . . — 931 60 — 991Other debt . . . . . . . . . . . . . . . . . . . . . . . . . . . . . . . . . . . . . — 349 33 — 382
Total corporate and other debt . . . . . . . . . . . . . . . . . . — 8,200 347 — 8,547Corporate equities(1) . . . . . . . . . . . . . . . . . . . . . . . . . . . . . . . . . 26,271 1,452 2 — 27,725Derivative and other contracts:
Interest rate contracts . . . . . . . . . . . . . . . . . . . . . . . . . . . . . 1,053 757,445 4,095 — 762,593Credit contracts . . . . . . . . . . . . . . . . . . . . . . . . . . . . . . . . . — 88,357 5,409 — 93,766Foreign exchange contracts . . . . . . . . . . . . . . . . . . . . . . . . 2 50,275 654 — 50,931Equity contracts . . . . . . . . . . . . . . . . . . . . . . . . . . . . . . . . . 1,226 47,293 2,630 — 51,149Commodity contracts . . . . . . . . . . . . . . . . . . . . . . . . . . . . 8,177 30,628 1,701 — 40,506Other . . . . . . . . . . . . . . . . . . . . . . . . . . . . . . . . . . . . . . . . . — 49 23 — 72Netting(2) . . . . . . . . . . . . . . . . . . . . . . . . . . . . . . . . . . . . . (8,687) (895,017) (7,896) (44,652) (956,252)
Total derivative and other contracts . . . . . . . . . . . . . 1,771 79,030 6,616 (44,652) 42,765
Total financial instruments sold, not yet purchased . . . . . 78,292 90,374 6,966 (44,652) 130,980Obligation to return securities received as collateral . . . . . . . . . . . . . 23,167 199 — — 23,366Securities sold under agreements to repurchase . . . . . . . . . . . . . . . . — 161 186 — 347Other secured financings . . . . . . . . . . . . . . . . . . . . . . . . . . . . . . . . . . — 12,487 594 — 13,081Long-term borrowings . . . . . . . . . . . . . . . . . . . . . . . . . . . . . . . . . . . . 2 41,079 2,143 — 43,224
Total liabilities measured at fair value . . . . . . . . . . . . . . . . . . . . . . . $101,461 $ 147,586 $ 9,904 $(44,652) $ 214,299
(1) The Company holds or sells short for trading purposes equity securities issued by entities in diverse industries and of varying size.(2) For positions with the same counterparty that cross over the levels of the fair value hierarchy, both counterparty netting and cash
collateral netting are included in the column titled “Counterparty and Cash Collateral Netting.” For contracts with the same counterparty,counterparty netting among positions classified within the same level is included within that level. For further information on derivativeinstruments and hedging activities, see Note 10.
(3) Amount represents mortgage servicing rights (“MSR”) accounted for at fair value. See Note 6 for further information on MSRs.
Transfers Between Level 1 and Level 2 During the Quarter Ended March 31, 2012.
For assets and liabilities that were transferred between Level 1 and Level 2 during the period, fair values areascribed as if the assets or liabilities had been transferred as of the beginning of the period.
Financial instruments owned—Derivative and other contracts and Financial instruments sold, not yetpurchased—Derivative and other contracts. During the quarter ended March 31, 2012, the Companyreclassified approximately $1.1 billion of derivative assets and approximately $1.2 billion of derivative liabilitiesfrom Level 2 to Level 1 as these listed derivatives became actively traded and were valued based on quotedprices from the exchange. Also during the quarter ended March 31, 2012, the Company reclassifiedapproximately $0.3 billion of derivative assets and approximately $0.4 billion of derivative liabilities from Level1 to Level 2 as transactions in these contracts did not occur with sufficient frequency and volume to constitute anactive market.
19
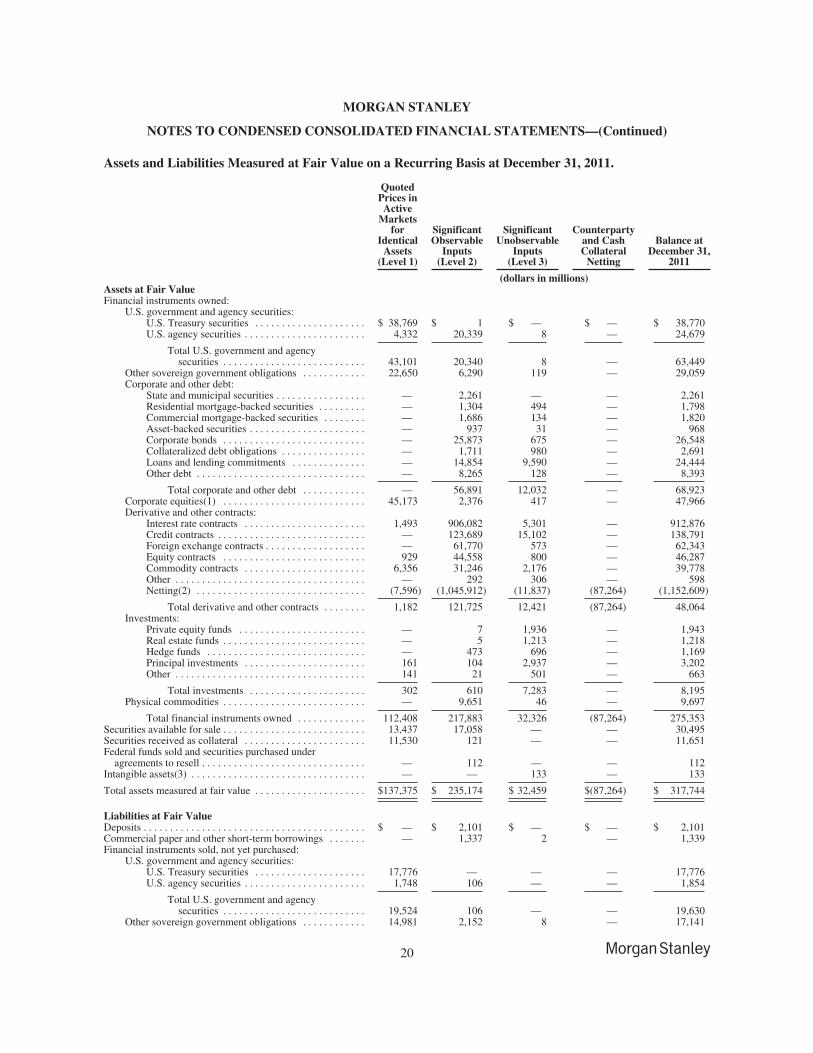
MORGAN STANLEY
NOTES TO CONDENSED CONSOLIDATED FINANCIAL STATEMENTS—(Continued)
Assets and Liabilities Measured at Fair Value on a Recurring Basis at December 31, 2011.
QuotedPrices inActive
Marketsfor
IdenticalAssets
(Level 1)
SignificantObservable
Inputs(Level 2)
SignificantUnobservable
Inputs(Level 3)
Counterpartyand CashCollateral
Netting
Balance atDecember 31,
2011
(dollars in millions)Assets at Fair ValueFinancial instruments owned:
U.S. government and agency securities:U.S. Treasury securities . . . . . . . . . . . . . . . . . . . . . $ 38,769 $ 1 $ — $ — $ 38,770U.S. agency securities . . . . . . . . . . . . . . . . . . . . . . . 4,332 20,339 8 — 24,679
Total U.S. government and agencysecurities . . . . . . . . . . . . . . . . . . . . . . . . . . . 43,101 20,340 8 — 63,449
Other sovereign government obligations . . . . . . . . . . . . 22,650 6,290 119 — 29,059Corporate and other debt:
State and municipal securities . . . . . . . . . . . . . . . . . — 2,261 — — 2,261Residential mortgage-backed securities . . . . . . . . . — 1,304 494 — 1,798Commercial mortgage-backed securities . . . . . . . . — 1,686 134 — 1,820Asset-backed securities . . . . . . . . . . . . . . . . . . . . . . — 937 31 — 968Corporate bonds . . . . . . . . . . . . . . . . . . . . . . . . . . . — 25,873 675 — 26,548Collateralized debt obligations . . . . . . . . . . . . . . . . — 1,711 980 — 2,691Loans and lending commitments . . . . . . . . . . . . . . — 14,854 9,590 — 24,444Other debt . . . . . . . . . . . . . . . . . . . . . . . . . . . . . . . . — 8,265 128 — 8,393
Total corporate and other debt . . . . . . . . . . . . — 56,891 12,032 — 68,923Corporate equities(1) . . . . . . . . . . . . . . . . . . . . . . . . . . . 45,173 2,376 417 — 47,966Derivative and other contracts:
Interest rate contracts . . . . . . . . . . . . . . . . . . . . . . . 1,493 906,082 5,301 — 912,876Credit contracts . . . . . . . . . . . . . . . . . . . . . . . . . . . . — 123,689 15,102 — 138,791Foreign exchange contracts . . . . . . . . . . . . . . . . . . . — 61,770 573 — 62,343Equity contracts . . . . . . . . . . . . . . . . . . . . . . . . . . . 929 44,558 800 — 46,287Commodity contracts . . . . . . . . . . . . . . . . . . . . . . . 6,356 31,246 2,176 — 39,778Other . . . . . . . . . . . . . . . . . . . . . . . . . . . . . . . . . . . . — 292 306 — 598Netting(2) . . . . . . . . . . . . . . . . . . . . . . . . . . . . . . . . (7,596) (1,045,912) (11,837) (87,264) (1,152,609)
Total derivative and other contracts . . . . . . . . 1,182 121,725 12,421 (87,264) 48,064Investments:
Private equity funds . . . . . . . . . . . . . . . . . . . . . . . . — 7 1,936 — 1,943Real estate funds . . . . . . . . . . . . . . . . . . . . . . . . . . . — 5 1,213 — 1,218Hedge funds . . . . . . . . . . . . . . . . . . . . . . . . . . . . . . — 473 696 — 1,169Principal investments . . . . . . . . . . . . . . . . . . . . . . . 161 104 2,937 — 3,202Other . . . . . . . . . . . . . . . . . . . . . . . . . . . . . . . . . . . . 141 21 501 — 663
Total investments . . . . . . . . . . . . . . . . . . . . . . 302 610 7,283 — 8,195Physical commodities . . . . . . . . . . . . . . . . . . . . . . . . . . . — 9,651 46 — 9,697
Total financial instruments owned . . . . . . . . . . . . . 112,408 217,883 32,326 (87,264) 275,353Securities available for sale . . . . . . . . . . . . . . . . . . . . . . . . . . . 13,437 17,058 — — 30,495Securities received as collateral . . . . . . . . . . . . . . . . . . . . . . . 11,530 121 — — 11,651Federal funds sold and securities purchased under
agreements to resell . . . . . . . . . . . . . . . . . . . . . . . . . . . . . . . — 112 — — 112Intangible assets(3) . . . . . . . . . . . . . . . . . . . . . . . . . . . . . . . . . — — 133 — 133
Total assets measured at fair value . . . . . . . . . . . . . . . . . . . . . $137,375 $ 235,174 $ 32,459 $(87,264) $ 317,744
Liabilities at Fair ValueDeposits . . . . . . . . . . . . . . . . . . . . . . . . . . . . . . . . . . . . . . . . . . $ — $ 2,101 $ — $ — $ 2,101Commercial paper and other short-term borrowings . . . . . . . — 1,337 2 — 1,339Financial instruments sold, not yet purchased:
U.S. government and agency securities:U.S. Treasury securities . . . . . . . . . . . . . . . . . . . . . 17,776 — — — 17,776U.S. agency securities . . . . . . . . . . . . . . . . . . . . . . . 1,748 106 — — 1,854
Total U.S. government and agencysecurities . . . . . . . . . . . . . . . . . . . . . . . . . . . 19,524 106 — — 19,630
Other sovereign government obligations . . . . . . . . . . . . 14,981 2,152 8 — 17,141
20
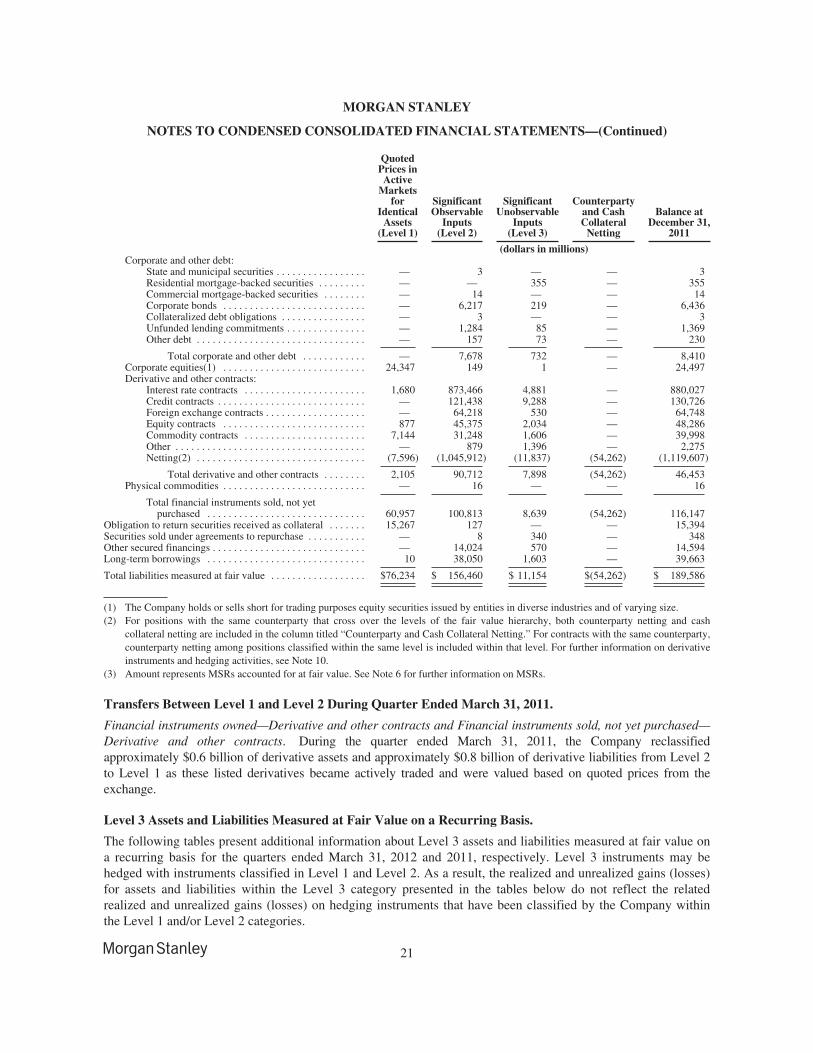
MORGAN STANLEY
NOTES TO CONDENSED CONSOLIDATED FINANCIAL STATEMENTS—(Continued)
QuotedPrices inActive
Marketsfor
IdenticalAssets
(Level 1)
SignificantObservable
Inputs(Level 2)
SignificantUnobservable
Inputs(Level 3)
Counterpartyand CashCollateral
Netting
Balance atDecember 31,
2011
(dollars in millions)Corporate and other debt:
State and municipal securities . . . . . . . . . . . . . . . . . — 3 — — 3Residential mortgage-backed securities . . . . . . . . . — — 355 — 355Commercial mortgage-backed securities . . . . . . . . — 14 — — 14Corporate bonds . . . . . . . . . . . . . . . . . . . . . . . . . . . — 6,217 219 — 6,436Collateralized debt obligations . . . . . . . . . . . . . . . . — 3 — — 3Unfunded lending commitments . . . . . . . . . . . . . . . — 1,284 85 — 1,369Other debt . . . . . . . . . . . . . . . . . . . . . . . . . . . . . . . . — 157 73 — 230
Total corporate and other debt . . . . . . . . . . . . — 7,678 732 — 8,410Corporate equities(1) . . . . . . . . . . . . . . . . . . . . . . . . . . . 24,347 149 1 — 24,497Derivative and other contracts:
Interest rate contracts . . . . . . . . . . . . . . . . . . . . . . . 1,680 873,466 4,881 — 880,027Credit contracts . . . . . . . . . . . . . . . . . . . . . . . . . . . . — 121,438 9,288 — 130,726Foreign exchange contracts . . . . . . . . . . . . . . . . . . . — 64,218 530 — 64,748Equity contracts . . . . . . . . . . . . . . . . . . . . . . . . . . . 877 45,375 2,034 — 48,286Commodity contracts . . . . . . . . . . . . . . . . . . . . . . . 7,144 31,248 1,606 — 39,998Other . . . . . . . . . . . . . . . . . . . . . . . . . . . . . . . . . . . . — 879 1,396 — 2,275Netting(2) . . . . . . . . . . . . . . . . . . . . . . . . . . . . . . . . (7,596) (1,045,912) (11,837) (54,262) (1,119,607)
Total derivative and other contracts . . . . . . . . 2,105 90,712 7,898 (54,262) 46,453Physical commodities . . . . . . . . . . . . . . . . . . . . . . . . . . . — 16 — — 16
Total financial instruments sold, not yetpurchased . . . . . . . . . . . . . . . . . . . . . . . . . . . . . . 60,957 100,813 8,639 (54,262) 116,147
Obligation to return securities received as collateral . . . . . . . 15,267 127 — — 15,394Securities sold under agreements to repurchase . . . . . . . . . . . — 8 340 — 348Other secured financings . . . . . . . . . . . . . . . . . . . . . . . . . . . . . — 14,024 570 — 14,594Long-term borrowings . . . . . . . . . . . . . . . . . . . . . . . . . . . . . . 10 38,050 1,603 — 39,663
Total liabilities measured at fair value . . . . . . . . . . . . . . . . . . $76,234 $ 156,460 $ 11,154 $(54,262) $ 189,586
(1) The Company holds or sells short for trading purposes equity securities issued by entities in diverse industries and of varying size.(2) For positions with the same counterparty that cross over the levels of the fair value hierarchy, both counterparty netting and cash
collateral netting are included in the column titled “Counterparty and Cash Collateral Netting.” For contracts with the same counterparty,counterparty netting among positions classified within the same level is included within that level. For further information on derivativeinstruments and hedging activities, see Note 10.
(3) Amount represents MSRs accounted for at fair value. See Note 6 for further information on MSRs.
Transfers Between Level 1 and Level 2 During Quarter Ended March 31, 2011.
Financial instruments owned—Derivative and other contracts and Financial instruments sold, not yet purchased—Derivative and other contracts. During the quarter ended March 31, 2011, the Company reclassifiedapproximately $0.6 billion of derivative assets and approximately $0.8 billion of derivative liabilities from Level 2to Level 1 as these listed derivatives became actively traded and were valued based on quoted prices from theexchange.
Level 3 Assets and Liabilities Measured at Fair Value on a Recurring Basis.
The following tables present additional information about Level 3 assets and liabilities measured at fair value ona recurring basis for the quarters ended March 31, 2012 and 2011, respectively. Level 3 instruments may behedged with instruments classified in Level 1 and Level 2. As a result, the realized and unrealized gains (losses)for assets and liabilities within the Level 3 category presented in the tables below do not reflect the relatedrealized and unrealized gains (losses) on hedging instruments that have been classified by the Company withinthe Level 1 and/or Level 2 categories.
21
MORGAN STANLEY
NOTES TO CONDENSED CONSOLIDATED FINANCIAL STATEMENTS—(Continued)
Additionally, both observable and unobservable inputs may be used to determine the fair value of positions thatthe Company has classified within the Level 3 category. As a result, the unrealized gains (losses) during theperiod for assets and liabilities within the Level 3 category presented in the tables below may include changes infair value during the period that were attributable to both observable (e.g., changes in market interest rates) andunobservable (e.g., changes in unobservable long-dated volatilities) inputs.
For assets and liabilities that were transferred into Level 3 during the period, gains (losses) are presented as if theassets or liabilities had been transferred into Level 3 at the beginning of the period; similarly, for assets andliabilities that were transferred out of Level 3 during the period, gains (losses) are presented as if the assets orliabilities had been transferred out at the beginning of the period.
22
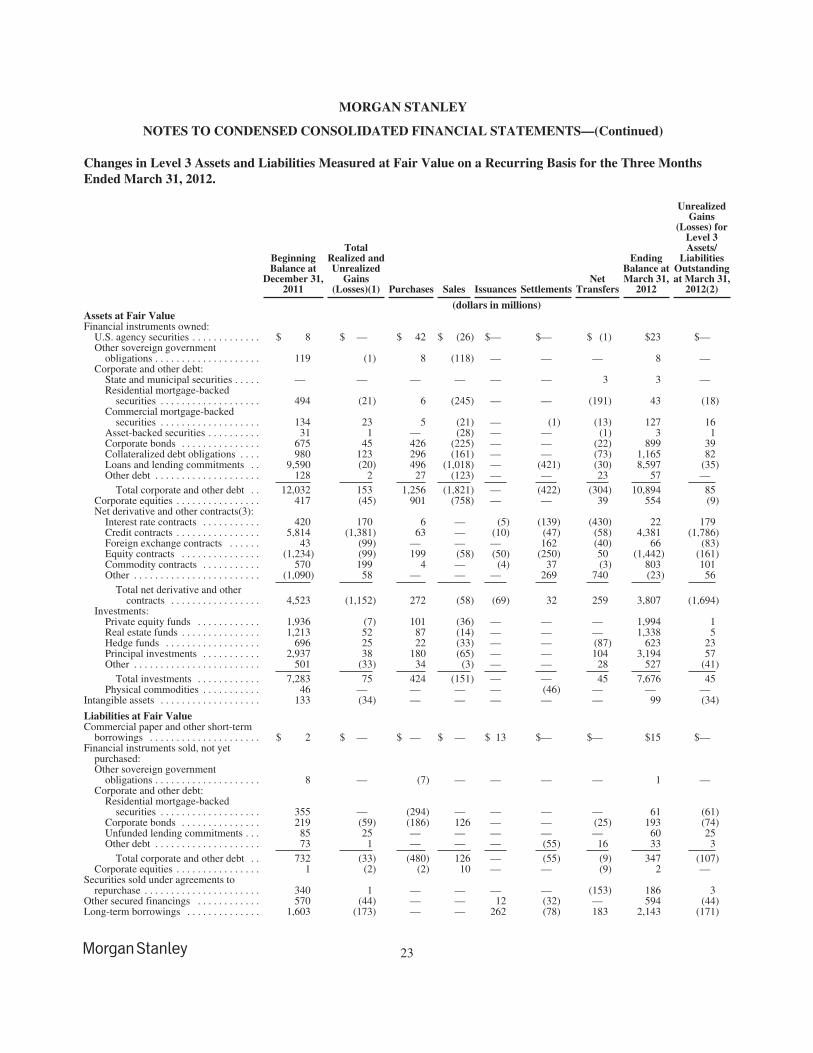
MORGAN STANLEY
NOTES TO CONDENSED CONSOLIDATED FINANCIAL STATEMENTS—(Continued)
Changes in Level 3 Assets and Liabilities Measured at Fair Value on a Recurring Basis for the Three MonthsEnded March 31, 2012.
BeginningBalance at
December 31,2011
TotalRealized andUnrealized
Gains(Losses)(1) Purchases Sales Issuances Settlements
NetTransfers
EndingBalance atMarch 31,
2012
UnrealizedGains
(Losses) forLevel 3Assets/
LiabilitiesOutstandingat March 31,
2012(2)
(dollars in millions)Assets at Fair ValueFinancial instruments owned:
U.S. agency securities . . . . . . . . . . . . . $ 8 $ — $ 42 $ (26) $— $— $ (1) $23 $—Other sovereign government
obligations . . . . . . . . . . . . . . . . . . . . 119 (1) 8 (118) — — — 8 —Corporate and other debt:
State and municipal securities . . . . . — — — — — — 3 3 —Residential mortgage-backed
securities . . . . . . . . . . . . . . . . . . . 494 (21) 6 (245) — — (191) 43 (18)Commercial mortgage-backed
securities . . . . . . . . . . . . . . . . . . . 134 23 5 (21) — (1) (13) 127 16Asset-backed securities . . . . . . . . . . 31 1 — (28) — — (1) 3 1Corporate bonds . . . . . . . . . . . . . . . 675 45 426 (225) — — (22) 899 39Collateralized debt obligations . . . . 980 123 296 (161) — — (73) 1,165 82Loans and lending commitments . . 9,590 (20) 496 (1,018) — (421) (30) 8,597 (35)Other debt . . . . . . . . . . . . . . . . . . . . 128 2 27 (123) — — 23 57 —
Total corporate and other debt . . 12,032 153 1,256 (1,821) — (422) (304) 10,894 85Corporate equities . . . . . . . . . . . . . . . . 417 (45) 901 (758) — — 39 554 (9)Net derivative and other contracts(3):
Interest rate contracts . . . . . . . . . . . 420 170 6 — (5) (139) (430) 22 179Credit contracts . . . . . . . . . . . . . . . . 5,814 (1,381) 63 — (10) (47) (58) 4,381 (1,786)Foreign exchange contracts . . . . . . 43 (99) — — — 162 (40) 66 (83)Equity contracts . . . . . . . . . . . . . . . (1,234) (99) 199 (58) (50) (250) 50 (1,442) (161)Commodity contracts . . . . . . . . . . . 570 199 4 — (4) 37 (3) 803 101Other . . . . . . . . . . . . . . . . . . . . . . . . (1,090) 58 — — — 269 740 (23) 56
Total net derivative and othercontracts . . . . . . . . . . . . . . . . . 4,523 (1,152) 272 (58) (69) 32 259 3,807 (1,694)
Investments:Private equity funds . . . . . . . . . . . . 1,936 (7) 101 (36) — — — 1,994 1Real estate funds . . . . . . . . . . . . . . . 1,213 52 87 (14) — — — 1,338 5Hedge funds . . . . . . . . . . . . . . . . . . 696 25 22 (33) — — (87) 623 23Principal investments . . . . . . . . . . . 2,937 38 180 (65) — — 104 3,194 57Other . . . . . . . . . . . . . . . . . . . . . . . . 501 (33) 34 (3) — — 28 527 (41)
Total investments . . . . . . . . . . . . 7,283 75 424 (151) — — 45 7,676 45Physical commodities . . . . . . . . . . . 46 — — — — (46) — — —
Intangible assets . . . . . . . . . . . . . . . . . . . 133 (34) — — — — — 99 (34)
Liabilities at Fair ValueCommercial paper and other short-term
borrowings . . . . . . . . . . . . . . . . . . . . . $ 2 $ — $ — $ — $ 13 $— $— $15 $—Financial instruments sold, not yet
purchased:Other sovereign government
obligations . . . . . . . . . . . . . . . . . . . . 8 — (7) — — — — 1 —Corporate and other debt:
Residential mortgage-backedsecurities . . . . . . . . . . . . . . . . . . . 355 — (294) — — — — 61 (61)
Corporate bonds . . . . . . . . . . . . . . . 219 (59) (186) 126 — — (25) 193 (74)Unfunded lending commitments . . . 85 25 — — — — — 60 25Other debt . . . . . . . . . . . . . . . . . . . . 73 1 — — — (55) 16 33 3
Total corporate and other debt . . 732 (33) (480) 126 — (55) (9) 347 (107)Corporate equities . . . . . . . . . . . . . . . . 1 (2) (2) 10 — — (9) 2 —
Securities sold under agreements torepurchase . . . . . . . . . . . . . . . . . . . . . . 340 1 — — — — (153) 186 3
Other secured financings . . . . . . . . . . . . 570 (44) — — 12 (32) — 594 (44)Long-term borrowings . . . . . . . . . . . . . . 1,603 (173) — — 262 (78) 183 2,143 (171)
23
MORGAN STANLEY
NOTES TO CONDENSED CONSOLIDATED FINANCIAL STATEMENTS—(Continued)
(1) Total realized and unrealized gains (losses) are primarily included in Principal transactions—Trading in the condensed consolidatedstatements of income except for $75 million related to Financial instruments owned—Investments, which is included in Principaltransactions—Investments.
(2) Amounts represent unrealized gains (losses) for the quarter ended March 31, 2012 related to assets and liabilities still outstanding atMarch 31, 2012.
(3) Net derivative and other contracts represent Financial instruments owned—Derivative and other contracts net of Financial instrumentssold, not yet purchased—Derivative and other contracts. For further information on derivative instruments and hedging activities, seeNote 10.
Financial instruments owned—Net derivative and other contracts. The net loss in Net derivative and othercontracts were primarily driven by tightening of credit spreads on underlying reference entities of basket creditdefault swaps.
24
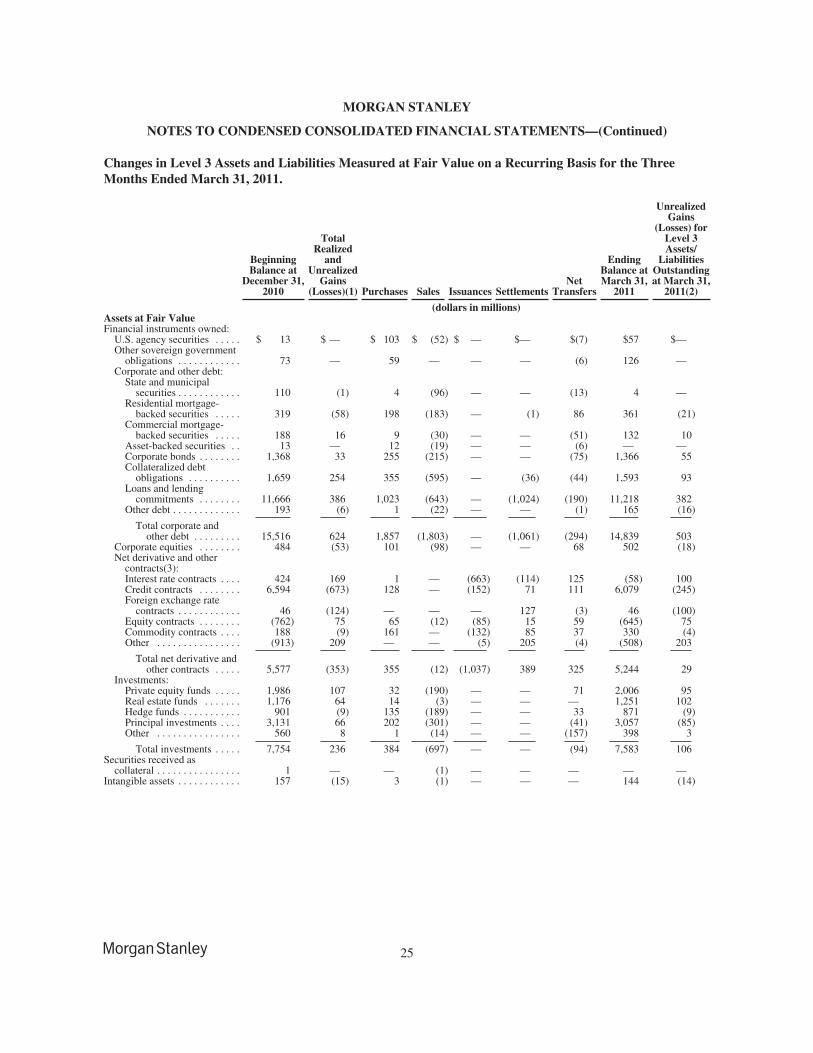
MORGAN STANLEY
NOTES TO CONDENSED CONSOLIDATED FINANCIAL STATEMENTS—(Continued)
Changes in Level 3 Assets and Liabilities Measured at Fair Value on a Recurring Basis for the ThreeMonths Ended March 31, 2011.
BeginningBalance at
December 31,2010
TotalRealized
andUnrealized
Gains(Losses)(1) Purchases Sales Issuances Settlements
NetTransfers
EndingBalance atMarch 31,
2011
UnrealizedGains
(Losses) forLevel 3Assets/
LiabilitiesOutstandingat March 31,
2011(2)
(dollars in millions)Assets at Fair ValueFinancial instruments owned:
U.S. agency securities . . . . . $ 13 $ — $ 103 $ (52) $ — $— $(7) $57 $—Other sovereign government
obligations . . . . . . . . . . . . 73 — 59 — — — (6) 126 —Corporate and other debt:
State and municipalsecurities . . . . . . . . . . . . 110 (1) 4 (96) — — (13) 4 —
Residential mortgage-backed securities . . . . . 319 (58) 198 (183) — (1) 86 361 (21)
Commercial mortgage-backed securities . . . . . 188 16 9 (30) — — (51) 132 10
Asset-backed securities . . 13 — 12 (19) — — (6) — —Corporate bonds . . . . . . . . 1,368 33 255 (215) — — (75) 1,366 55Collateralized debt
obligations . . . . . . . . . . 1,659 254 355 (595) — (36) (44) 1,593 93Loans and lending
commitments . . . . . . . . 11,666 386 1,023 (643) — (1,024) (190) 11,218 382Other debt . . . . . . . . . . . . . 193 (6) 1 (22) — — (1) 165 (16)
Total corporate andother debt . . . . . . . . . 15,516 624 1,857 (1,803) — (1,061) (294) 14,839 503
Corporate equities . . . . . . . . 484 (53) 101 (98) — — 68 502 (18)Net derivative and other
contracts(3):Interest rate contracts . . . . 424 169 1 — (663) (114) 125 (58) 100Credit contracts . . . . . . . . 6,594 (673) 128 — (152) 71 111 6,079 (245)Foreign exchange rate
contracts . . . . . . . . . . . . 46 (124) — — — 127 (3) 46 (100)Equity contracts . . . . . . . . (762) 75 65 (12) (85) 15 59 (645) 75Commodity contracts . . . . 188 (9) 161 — (132) 85 37 330 (4)Other . . . . . . . . . . . . . . . . (913) 209 — — (5) 205 (4) (508) 203
Total net derivative andother contracts . . . . . 5,577 (353) 355 (12) (1,037) 389 325 5,244 29
Investments:Private equity funds . . . . . 1,986 107 32 (190) — — 71 2,006 95Real estate funds . . . . . . . 1,176 64 14 (3) — — — 1,251 102Hedge funds . . . . . . . . . . . 901 (9) 135 (189) — — 33 871 (9)Principal investments . . . . 3,131 66 202 (301) — — (41) 3,057 (85)Other . . . . . . . . . . . . . . . . 560 8 1 (14) — — (157) 398 3
Total investments . . . . . 7,754 236 384 (697) — — (94) 7,583 106Securities received as
collateral . . . . . . . . . . . . . . . . 1 — — (1) — — — — —Intangible assets . . . . . . . . . . . . 157 (15) 3 (1) — — — 144 (14)
25
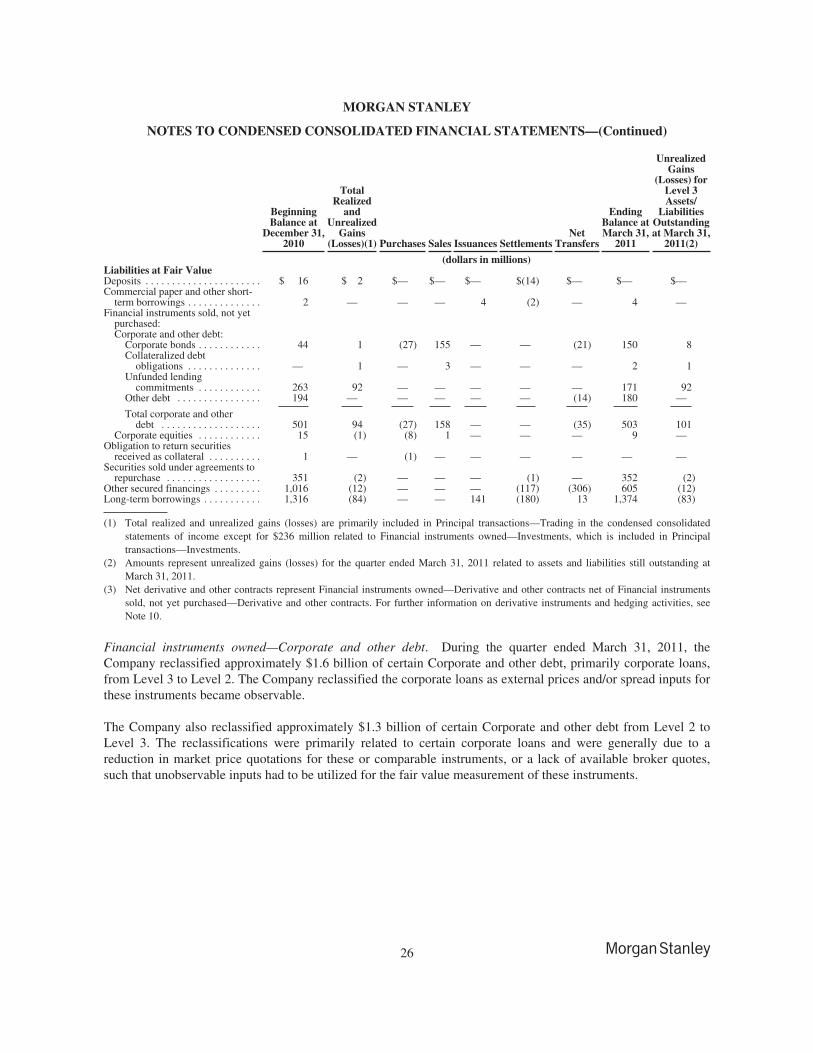
MORGAN STANLEY
NOTES TO CONDENSED CONSOLIDATED FINANCIAL STATEMENTS—(Continued)
BeginningBalance at
December 31,2010
TotalRealized
andUnrealized
Gains(Losses)(1) Purchases Sales Issuances Settlements
NetTransfers
EndingBalance atMarch 31,
2011
UnrealizedGains
(Losses) forLevel 3Assets/
LiabilitiesOutstandingat March 31,
2011(2)
(dollars in millions)Liabilities at Fair ValueDeposits . . . . . . . . . . . . . . . . . . . . . . $ 16 $ 2 $— $— $— $(14) $— $— $—Commercial paper and other short-
term borrowings . . . . . . . . . . . . . . 2 — — — 4 (2) — 4 —Financial instruments sold, not yet
purchased:Corporate and other debt:
Corporate bonds . . . . . . . . . . . . 44 1 (27) 155 — — (21) 150 8Collateralized debt
obligations . . . . . . . . . . . . . . — 1 — 3 — — — 2 1Unfunded lending
commitments . . . . . . . . . . . . 263 92 — — — — — 171 92Other debt . . . . . . . . . . . . . . . . 194 — — — — — (14) 180 —
Total corporate and otherdebt . . . . . . . . . . . . . . . . . . . 501 94 (27) 158 — — (35) 503 101
Corporate equities . . . . . . . . . . . . 15 (1) (8) 1 — — — 9 —Obligation to return securities
received as collateral . . . . . . . . . . 1 — (1) — — — — — —Securities sold under agreements to
repurchase . . . . . . . . . . . . . . . . . . 351 (2) — — — (1) — 352 (2)Other secured financings . . . . . . . . . 1,016 (12) — — — (117) (306) 605 (12)Long-term borrowings . . . . . . . . . . . 1,316 (84) — — 141 (180) 13 1,374 (83)
(1) Total realized and unrealized gains (losses) are primarily included in Principal transactions—Trading in the condensed consolidatedstatements of income except for $236 million related to Financial instruments owned—Investments, which is included in Principaltransactions—Investments.
(2) Amounts represent unrealized gains (losses) for the quarter ended March 31, 2011 related to assets and liabilities still outstanding atMarch 31, 2011.
(3) Net derivative and other contracts represent Financial instruments owned—Derivative and other contracts net of Financial instrumentssold, not yet purchased—Derivative and other contracts. For further information on derivative instruments and hedging activities, seeNote 10.
Financial instruments owned—Corporate and other debt. During the quarter ended March 31, 2011, theCompany reclassified approximately $1.6 billion of certain Corporate and other debt, primarily corporate loans,from Level 3 to Level 2. The Company reclassified the corporate loans as external prices and/or spread inputs forthese instruments became observable.
The Company also reclassified approximately $1.3 billion of certain Corporate and other debt from Level 2 toLevel 3. The reclassifications were primarily related to certain corporate loans and were generally due to areduction in market price quotations for these or comparable instruments, or a lack of available broker quotes,such that unobservable inputs had to be utilized for the fair value measurement of these instruments.
26
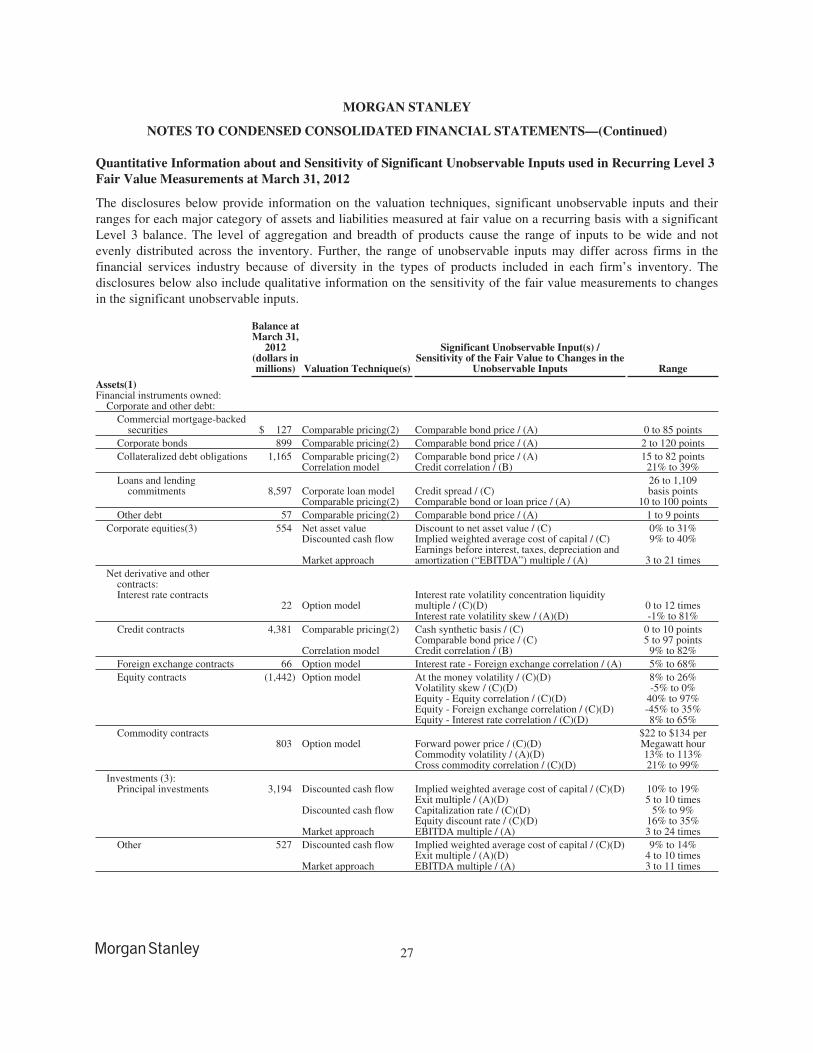
MORGAN STANLEY
NOTES TO CONDENSED CONSOLIDATED FINANCIAL STATEMENTS—(Continued)
Quantitative Information about and Sensitivity of Significant Unobservable Inputs used in Recurring Level 3Fair Value Measurements at March 31, 2012
The disclosures below provide information on the valuation techniques, significant unobservable inputs and theirranges for each major category of assets and liabilities measured at fair value on a recurring basis with a significantLevel 3 balance. The level of aggregation and breadth of products cause the range of inputs to be wide and notevenly distributed across the inventory. Further, the range of unobservable inputs may differ across firms in thefinancial services industry because of diversity in the types of products included in each firm’s inventory. Thedisclosures below also include qualitative information on the sensitivity of the fair value measurements to changesin the significant unobservable inputs.
Balance atMarch 31,
2012(dollars inmillions) Valuation Technique(s)
Significant Unobservable Input(s) /Sensitivity of the Fair Value to Changes in the
Unobservable Inputs Range
Assets(1)Financial instruments owned:
Corporate and other debt:Commercial mortgage-backed
securities $ 127 Comparable pricing(2) Comparable bond price / (A) 0 to 85 pointsCorporate bonds 899 Comparable pricing(2) Comparable bond price / (A) 2 to 120 pointsCollateralized debt obligations 1,165 Comparable pricing(2) Comparable bond price / (A) 15 to 82 points
Correlation model Credit correlation / (B) 21% to 39%Loans and lending
commitments 8,597 Corporate loan model Credit spread / (C)26 to 1,109basis points
Comparable pricing(2) Comparable bond or loan price / (A) 10 to 100 pointsOther debt 57 Comparable pricing(2) Comparable bond price / (A) 1 to 9 points
Corporate equities(3) 554 Net asset value Discount to net asset value / (C) 0% to 31%Discounted cash flow Implied weighted average cost of capital / (C) 9% to 40%
Market approachEarnings before interest, taxes, depreciation andamortization (“EBITDA”) multiple / (A) 3 to 21 times
Net derivative and othercontracts:Interest rate contracts
22 Option modelInterest rate volatility concentration liquiditymultiple / (C)(D) 0 to 12 timesInterest rate volatility skew / (A)(D) -1% to 81%
Credit contracts 4,381 Comparable pricing(2) Cash synthetic basis / (C) 0 to 10 pointsComparable bond price / (C) 5 to 97 points
Correlation model Credit correlation / (B) 9% to 82%Foreign exchange contracts 66 Option model Interest rate - Foreign exchange correlation / (A) 5% to 68%Equity contracts (1,442) Option model At the money volatility / (C)(D) 8% to 26%
Volatility skew / (C)(D) -5% to 0%Equity - Equity correlation / (C)(D) 40% to 97%Equity - Foreign exchange correlation / (C)(D) -45% to 35%Equity - Interest rate correlation / (C)(D) 8% to 65%
Commodity contracts803 Option model Forward power price / (C)(D)
$22 to $134 perMegawatt hour
Commodity volatility / (A)(D) 13% to 113%Cross commodity correlation / (C)(D) 21% to 99%
Investments (3):Principal investments 3,194 Discounted cash flow Implied weighted average cost of capital / (C)(D) 10% to 19%
Exit multiple / (A)(D) 5 to 10 timesDiscounted cash flow Capitalization rate / (C)(D) 5% to 9%
Equity discount rate / (C)(D) 16% to 35%Market approach EBITDA multiple / (A) 3 to 24 times
Other 527 Discounted cash flow Implied weighted average cost of capital / (C)(D) 9% to 14%Exit multiple / (A)(D) 4 to 10 times
Market approach EBITDA multiple / (A) 3 to 11 times
27
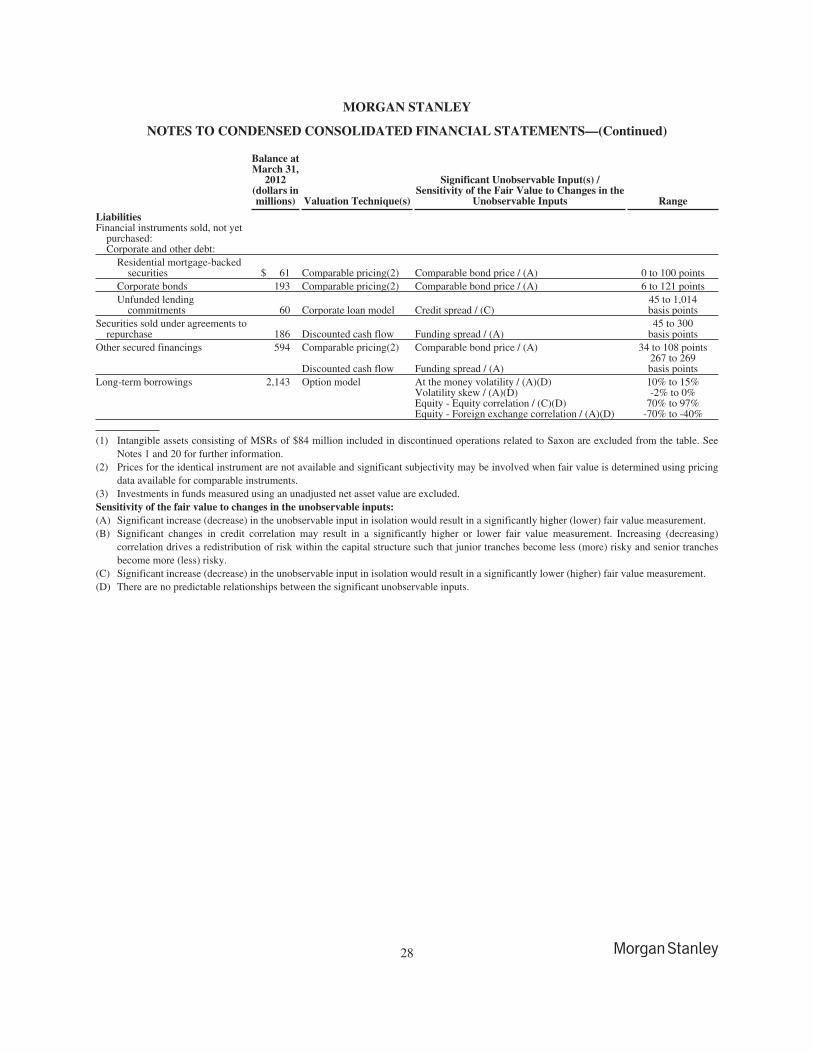
MORGAN STANLEY
NOTES TO CONDENSED CONSOLIDATED FINANCIAL STATEMENTS—(Continued)
Balance atMarch 31,
2012(dollars inmillions) Valuation Technique(s)
Significant Unobservable Input(s) /Sensitivity of the Fair Value to Changes in the
Unobservable Inputs Range
LiabilitiesFinancial instruments sold, not yet
purchased:Corporate and other debt:
Residential mortgage-backedsecurities $ 61 Comparable pricing(2) Comparable bond price / (A) 0 to 100 points
Corporate bonds 193 Comparable pricing(2) Comparable bond price / (A) 6 to 121 pointsUnfunded lending
commitments 60 Corporate loan model Credit spread / (C)45 to 1,014basis points
Securities sold under agreements torepurchase 186 Discounted cash flow Funding spread / (A)
45 to 300basis points
Other secured financings 594 Comparable pricing(2) Comparable bond price / (A) 34 to 108 points
Discounted cash flow Funding spread / (A)267 to 269basis points
Long-term borrowings 2,143 Option model At the money volatility / (A)(D) 10% to 15%Volatility skew / (A)(D) -2% to 0%Equity - Equity correlation / (C)(D) 70% to 97%Equity - Foreign exchange correlation / (A)(D) -70% to -40%
(1) Intangible assets consisting of MSRs of $84 million included in discontinued operations related to Saxon are excluded from the table. SeeNotes 1 and 20 for further information.
(2) Prices for the identical instrument are not available and significant subjectivity may be involved when fair value is determined using pricingdata available for comparable instruments.
(3) Investments in funds measured using an unadjusted net asset value are excluded.Sensitivity of the fair value to changes in the unobservable inputs:(A) Significant increase (decrease) in the unobservable input in isolation would result in a significantly higher (lower) fair value measurement.(B) Significant changes in credit correlation may result in a significantly higher or lower fair value measurement. Increasing (decreasing)
correlation drives a redistribution of risk within the capital structure such that junior tranches become less (more) risky and senior tranchesbecome more (less) risky.
(C) Significant increase (decrease) in the unobservable input in isolation would result in a significantly lower (higher) fair value measurement.(D) There are no predictable relationships between the significant unobservable inputs.
28
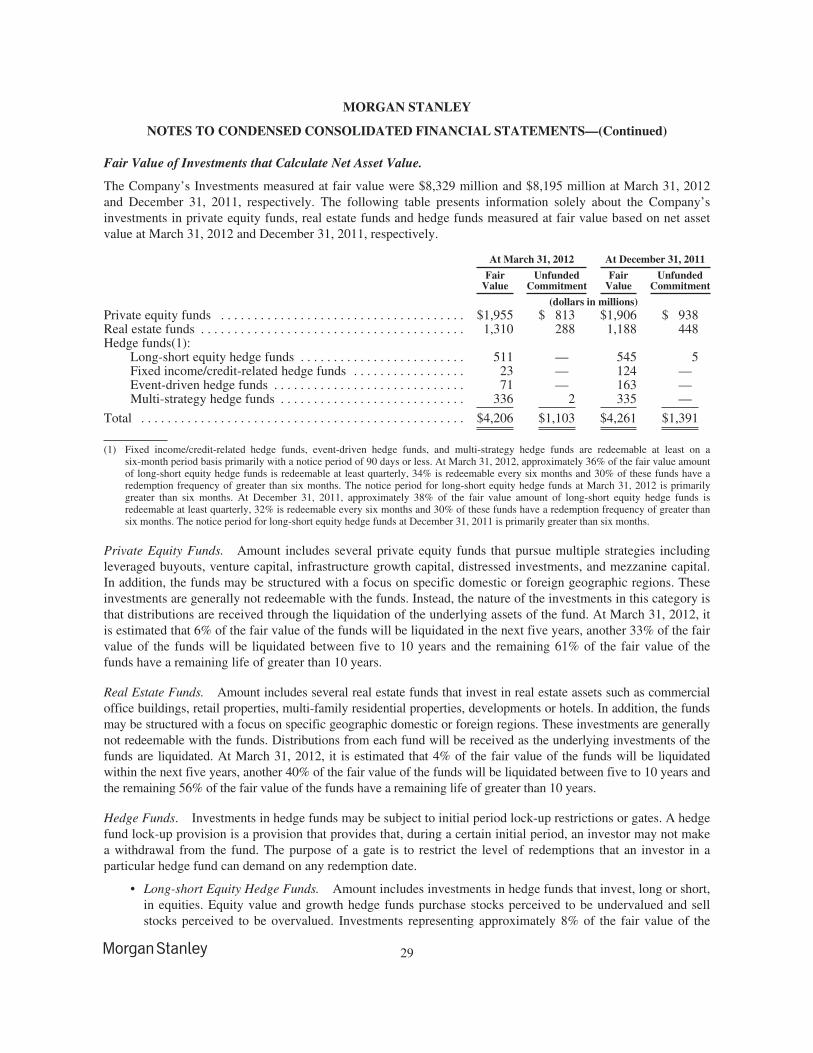
MORGAN STANLEY
NOTES TO CONDENSED CONSOLIDATED FINANCIAL STATEMENTS—(Continued)
Fair Value of Investments that Calculate Net Asset Value.
The Company’s Investments measured at fair value were $8,329 million and $8,195 million at March 31, 2012and December 31, 2011, respectively. The following table presents information solely about the Company’sinvestments in private equity funds, real estate funds and hedge funds measured at fair value based on net assetvalue at March 31, 2012 and December 31, 2011, respectively.
At March 31, 2012 At December 31, 2011
FairValue
UnfundedCommitment
FairValue
UnfundedCommitment
(dollars in millions)Private equity funds . . . . . . . . . . . . . . . . . . . . . . . . . . . . . . . . . . . . . $1,955 $ 813 $1,906 $ 938Real estate funds . . . . . . . . . . . . . . . . . . . . . . . . . . . . . . . . . . . . . . . . 1,310 288 1,188 448Hedge funds(1):
Long-short equity hedge funds . . . . . . . . . . . . . . . . . . . . . . . . . 511 — 545 5Fixed income/credit-related hedge funds . . . . . . . . . . . . . . . . . 23 — 124 —Event-driven hedge funds . . . . . . . . . . . . . . . . . . . . . . . . . . . . . 71 — 163 —Multi-strategy hedge funds . . . . . . . . . . . . . . . . . . . . . . . . . . . . 336 2 335 —
Total . . . . . . . . . . . . . . . . . . . . . . . . . . . . . . . . . . . . . . . . . . . . . . . . . $4,206 $1,103 $4,261 $1,391
(1) Fixed income/credit-related hedge funds, event-driven hedge funds, and multi-strategy hedge funds are redeemable at least on asix-month period basis primarily with a notice period of 90 days or less. At March 31, 2012, approximately 36% of the fair value amountof long-short equity hedge funds is redeemable at least quarterly, 34% is redeemable every six months and 30% of these funds have aredemption frequency of greater than six months. The notice period for long-short equity hedge funds at March 31, 2012 is primarilygreater than six months. At December 31, 2011, approximately 38% of the fair value amount of long-short equity hedge funds isredeemable at least quarterly, 32% is redeemable every six months and 30% of these funds have a redemption frequency of greater thansix months. The notice period for long-short equity hedge funds at December 31, 2011 is primarily greater than six months.
Private Equity Funds. Amount includes several private equity funds that pursue multiple strategies includingleveraged buyouts, venture capital, infrastructure growth capital, distressed investments, and mezzanine capital.In addition, the funds may be structured with a focus on specific domestic or foreign geographic regions. Theseinvestments are generally not redeemable with the funds. Instead, the nature of the investments in this category isthat distributions are received through the liquidation of the underlying assets of the fund. At March 31, 2012, itis estimated that 6% of the fair value of the funds will be liquidated in the next five years, another 33% of the fairvalue of the funds will be liquidated between five to 10 years and the remaining 61% of the fair value of thefunds have a remaining life of greater than 10 years.
Real Estate Funds. Amount includes several real estate funds that invest in real estate assets such as commercialoffice buildings, retail properties, multi-family residential properties, developments or hotels. In addition, the fundsmay be structured with a focus on specific geographic domestic or foreign regions. These investments are generallynot redeemable with the funds. Distributions from each fund will be received as the underlying investments of thefunds are liquidated. At March 31, 2012, it is estimated that 4% of the fair value of the funds will be liquidatedwithin the next five years, another 40% of the fair value of the funds will be liquidated between five to 10 years andthe remaining 56% of the fair value of the funds have a remaining life of greater than 10 years.
Hedge Funds. Investments in hedge funds may be subject to initial period lock-up restrictions or gates. A hedgefund lock-up provision is a provision that provides that, during a certain initial period, an investor may not makea withdrawal from the fund. The purpose of a gate is to restrict the level of redemptions that an investor in aparticular hedge fund can demand on any redemption date.
• Long-short Equity Hedge Funds. Amount includes investments in hedge funds that invest, long or short,in equities. Equity value and growth hedge funds purchase stocks perceived to be undervalued and sellstocks perceived to be overvalued. Investments representing approximately 8% of the fair value of the
29
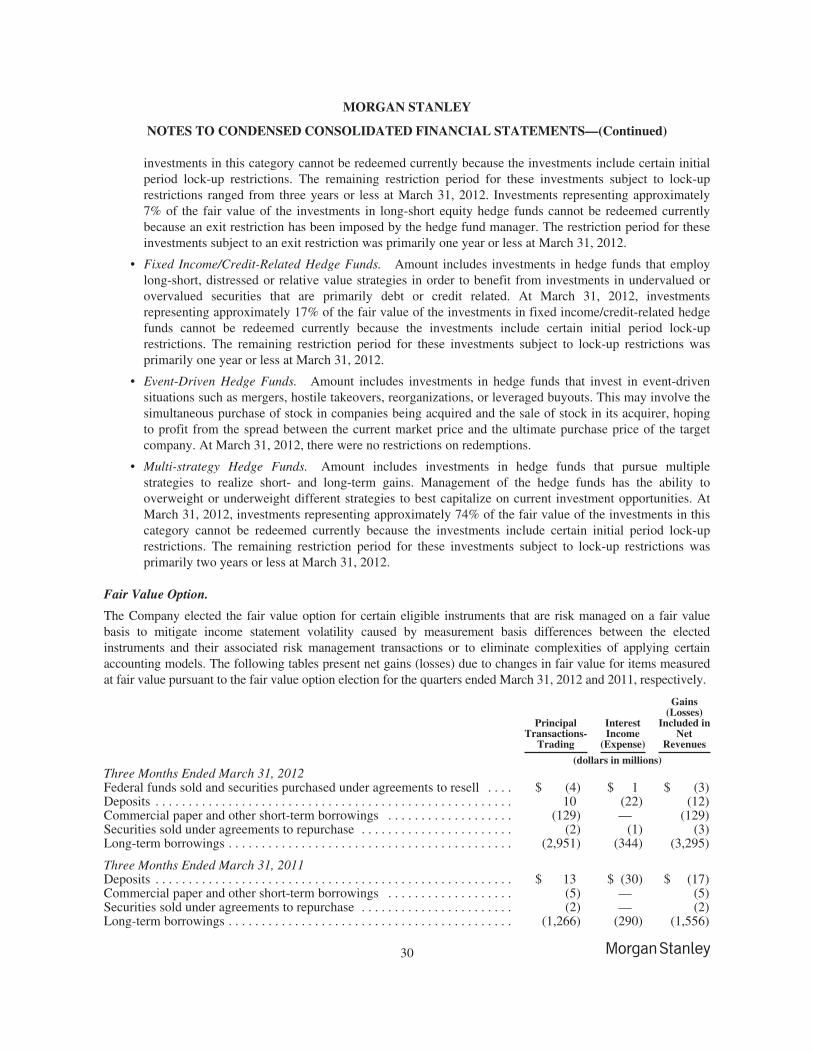
MORGAN STANLEY
NOTES TO CONDENSED CONSOLIDATED FINANCIAL STATEMENTS—(Continued)
investments in this category cannot be redeemed currently because the investments include certain initialperiod lock-up restrictions. The remaining restriction period for these investments subject to lock-uprestrictions ranged from three years or less at March 31, 2012. Investments representing approximately7% of the fair value of the investments in long-short equity hedge funds cannot be redeemed currentlybecause an exit restriction has been imposed by the hedge fund manager. The restriction period for theseinvestments subject to an exit restriction was primarily one year or less at March 31, 2012.
• Fixed Income/Credit-Related Hedge Funds. Amount includes investments in hedge funds that employlong-short, distressed or relative value strategies in order to benefit from investments in undervalued orovervalued securities that are primarily debt or credit related. At March 31, 2012, investmentsrepresenting approximately 17% of the fair value of the investments in fixed income/credit-related hedgefunds cannot be redeemed currently because the investments include certain initial period lock-uprestrictions. The remaining restriction period for these investments subject to lock-up restrictions wasprimarily one year or less at March 31, 2012.
• Event-Driven Hedge Funds. Amount includes investments in hedge funds that invest in event-drivensituations such as mergers, hostile takeovers, reorganizations, or leveraged buyouts. This may involve thesimultaneous purchase of stock in companies being acquired and the sale of stock in its acquirer, hopingto profit from the spread between the current market price and the ultimate purchase price of the targetcompany. At March 31, 2012, there were no restrictions on redemptions.
• Multi-strategy Hedge Funds. Amount includes investments in hedge funds that pursue multiplestrategies to realize short- and long-term gains. Management of the hedge funds has the ability tooverweight or underweight different strategies to best capitalize on current investment opportunities. AtMarch 31, 2012, investments representing approximately 74% of the fair value of the investments in thiscategory cannot be redeemed currently because the investments include certain initial period lock-uprestrictions. The remaining restriction period for these investments subject to lock-up restrictions wasprimarily two years or less at March 31, 2012.
Fair Value Option.
The Company elected the fair value option for certain eligible instruments that are risk managed on a fair valuebasis to mitigate income statement volatility caused by measurement basis differences between the electedinstruments and their associated risk management transactions or to eliminate complexities of applying certainaccounting models. The following tables present net gains (losses) due to changes in fair value for items measuredat fair value pursuant to the fair value option election for the quarters ended March 31, 2012 and 2011, respectively.
PrincipalTransactions-
Trading
InterestIncome
(Expense)
Gains(Losses)
Included inNet
Revenues
(dollars in millions)Three Months Ended March 31, 2012Federal funds sold and securities purchased under agreements to resell . . . . $ (4) $ 1 $ (3)Deposits . . . . . . . . . . . . . . . . . . . . . . . . . . . . . . . . . . . . . . . . . . . . . . . . . . . . . . 10 (22) (12)Commercial paper and other short-term borrowings . . . . . . . . . . . . . . . . . . . (129) — (129)Securities sold under agreements to repurchase . . . . . . . . . . . . . . . . . . . . . . . (2) (1) (3)Long-term borrowings . . . . . . . . . . . . . . . . . . . . . . . . . . . . . . . . . . . . . . . . . . . (2,951) (344) (3,295)
Three Months Ended March 31, 2011Deposits . . . . . . . . . . . . . . . . . . . . . . . . . . . . . . . . . . . . . . . . . . . . . . . . . . . . . . $ 13 $ (30) $ (17)Commercial paper and other short-term borrowings . . . . . . . . . . . . . . . . . . . (5) — (5)Securities sold under agreements to repurchase . . . . . . . . . . . . . . . . . . . . . . . (2) — (2)Long-term borrowings . . . . . . . . . . . . . . . . . . . . . . . . . . . . . . . . . . . . . . . . . . . (1,266) (290) (1,556)
30
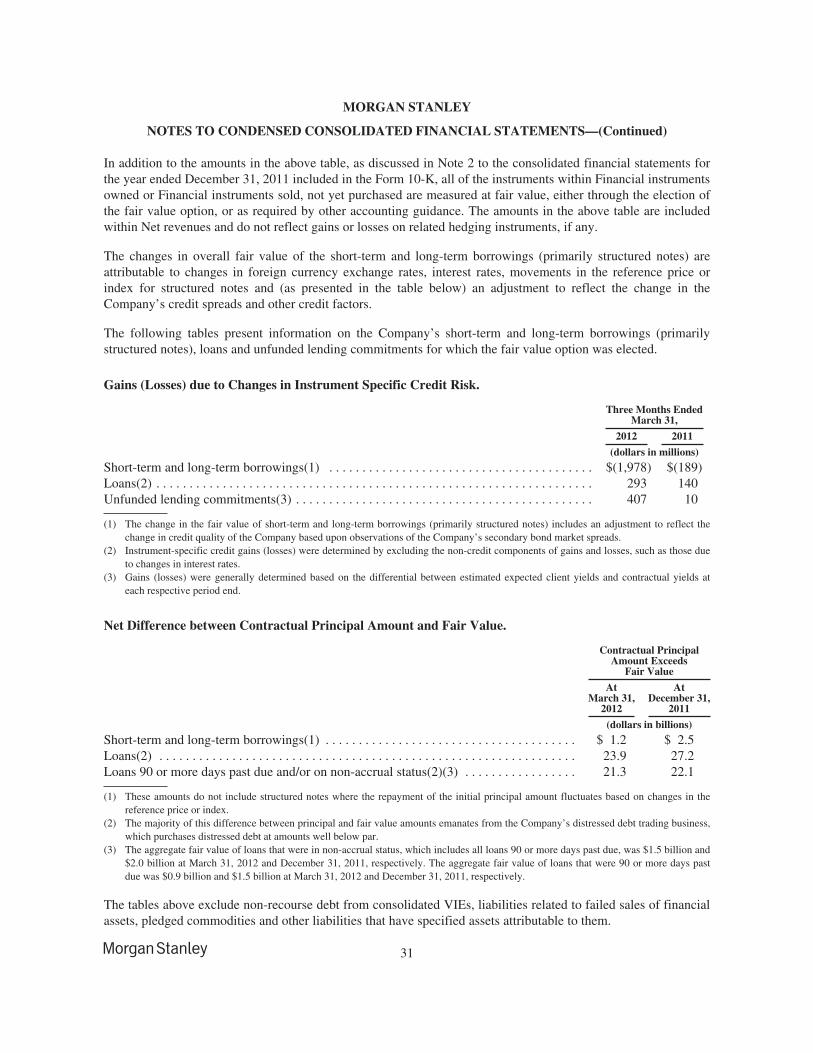
MORGAN STANLEY
NOTES TO CONDENSED CONSOLIDATED FINANCIAL STATEMENTS—(Continued)
In addition to the amounts in the above table, as discussed in Note 2 to the consolidated financial statements forthe year ended December 31, 2011 included in the Form 10-K, all of the instruments within Financial instrumentsowned or Financial instruments sold, not yet purchased are measured at fair value, either through the election ofthe fair value option, or as required by other accounting guidance. The amounts in the above table are includedwithin Net revenues and do not reflect gains or losses on related hedging instruments, if any.
The changes in overall fair value of the short-term and long-term borrowings (primarily structured notes) areattributable to changes in foreign currency exchange rates, interest rates, movements in the reference price orindex for structured notes and (as presented in the table below) an adjustment to reflect the change in theCompany’s credit spreads and other credit factors.
The following tables present information on the Company’s short-term and long-term borrowings (primarilystructured notes), loans and unfunded lending commitments for which the fair value option was elected.
Gains (Losses) due to Changes in Instrument Specific Credit Risk.
Three Months EndedMarch 31,
2012 2011
(dollars in millions)
Short-term and long-term borrowings(1) . . . . . . . . . . . . . . . . . . . . . . . . . . . . . . . . . . . . . . . . $(1,978) $(189)Loans(2) . . . . . . . . . . . . . . . . . . . . . . . . . . . . . . . . . . . . . . . . . . . . . . . . . . . . . . . . . . . . . . . . . . 293 140Unfunded lending commitments(3) . . . . . . . . . . . . . . . . . . . . . . . . . . . . . . . . . . . . . . . . . . . . . 407 10
(1) The change in the fair value of short-term and long-term borrowings (primarily structured notes) includes an adjustment to reflect thechange in credit quality of the Company based upon observations of the Company’s secondary bond market spreads.
(2) Instrument-specific credit gains (losses) were determined by excluding the non-credit components of gains and losses, such as those dueto changes in interest rates.
(3) Gains (losses) were generally determined based on the differential between estimated expected client yields and contractual yields ateach respective period end.
Net Difference between Contractual Principal Amount and Fair Value.
Contractual PrincipalAmount Exceeds
Fair Value
AtMarch 31,
2012
AtDecember 31,
2011
(dollars in billions)
Short-term and long-term borrowings(1) . . . . . . . . . . . . . . . . . . . . . . . . . . . . . . . . . . . . . . $ 1.2 $ 2.5Loans(2) . . . . . . . . . . . . . . . . . . . . . . . . . . . . . . . . . . . . . . . . . . . . . . . . . . . . . . . . . . . . . . . 23.9 27.2Loans 90 or more days past due and/or on non-accrual status(2)(3) . . . . . . . . . . . . . . . . . 21.3 22.1
(1) These amounts do not include structured notes where the repayment of the initial principal amount fluctuates based on changes in thereference price or index.
(2) The majority of this difference between principal and fair value amounts emanates from the Company’s distressed debt trading business,which purchases distressed debt at amounts well below par.
(3) The aggregate fair value of loans that were in non-accrual status, which includes all loans 90 or more days past due, was $1.5 billion and$2.0 billion at March 31, 2012 and December 31, 2011, respectively. The aggregate fair value of loans that were 90 or more days pastdue was $0.9 billion and $1.5 billion at March 31, 2012 and December 31, 2011, respectively.
The tables above exclude non-recourse debt from consolidated VIEs, liabilities related to failed sales of financialassets, pledged commodities and other liabilities that have specified assets attributable to them.
31
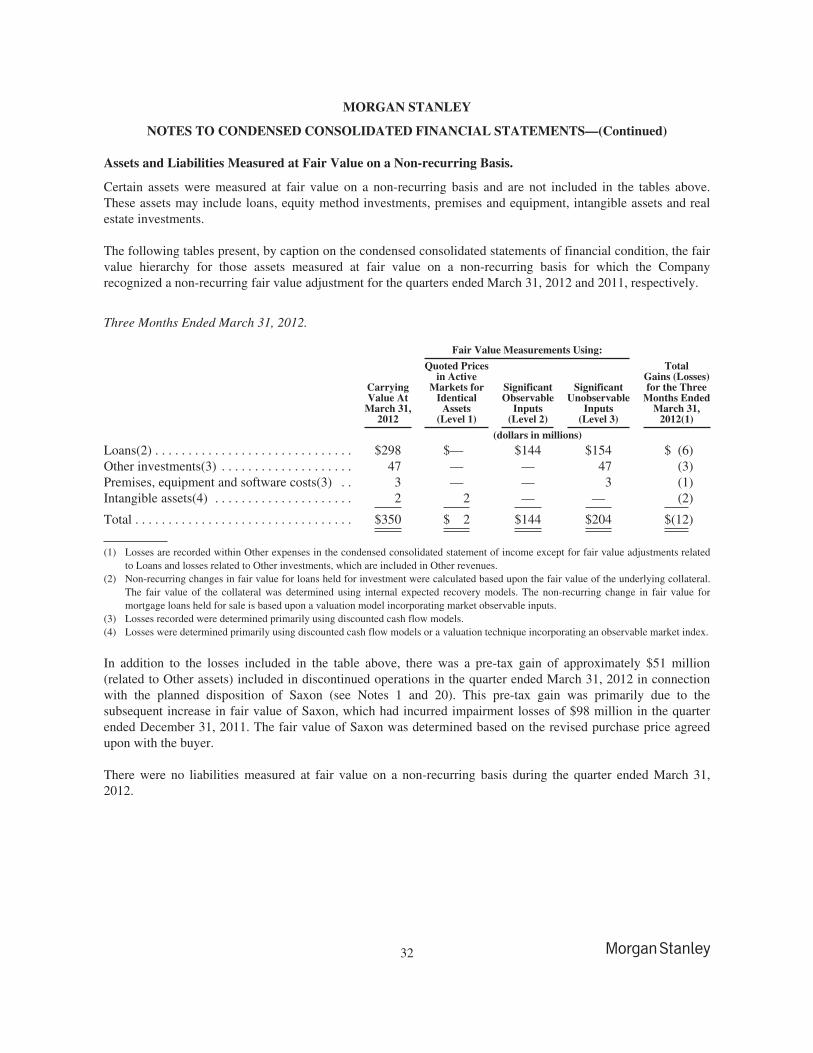
MORGAN STANLEY
NOTES TO CONDENSED CONSOLIDATED FINANCIAL STATEMENTS—(Continued)
Assets and Liabilities Measured at Fair Value on a Non-recurring Basis.
Certain assets were measured at fair value on a non-recurring basis and are not included in the tables above.These assets may include loans, equity method investments, premises and equipment, intangible assets and realestate investments.
The following tables present, by caption on the condensed consolidated statements of financial condition, the fairvalue hierarchy for those assets measured at fair value on a non-recurring basis for which the Companyrecognized a non-recurring fair value adjustment for the quarters ended March 31, 2012 and 2011, respectively.
Three Months Ended March 31, 2012.
Fair Value Measurements Using:
CarryingValue At
March 31,2012
Quoted Pricesin Active
Markets forIdentical
Assets(Level 1)
SignificantObservable
Inputs(Level 2)
SignificantUnobservable
Inputs(Level 3)
TotalGains (Losses)for the Three
Months EndedMarch 31,
2012(1)
(dollars in millions)
Loans(2) . . . . . . . . . . . . . . . . . . . . . . . . . . . . . . $298 $— $144 $154 $ (6)Other investments(3) . . . . . . . . . . . . . . . . . . . . 47 — — 47 (3)Premises, equipment and software costs(3) . . 3 — — 3 (1)Intangible assets(4) . . . . . . . . . . . . . . . . . . . . . 2 2 — — (2)
Total . . . . . . . . . . . . . . . . . . . . . . . . . . . . . . . . . $350 $ 2 $144 $204 $(12)
(1) Losses are recorded within Other expenses in the condensed consolidated statement of income except for fair value adjustments relatedto Loans and losses related to Other investments, which are included in Other revenues.
(2) Non-recurring changes in fair value for loans held for investment were calculated based upon the fair value of the underlying collateral.The fair value of the collateral was determined using internal expected recovery models. The non-recurring change in fair value formortgage loans held for sale is based upon a valuation model incorporating market observable inputs.
(3) Losses recorded were determined primarily using discounted cash flow models.(4) Losses were determined primarily using discounted cash flow models or a valuation technique incorporating an observable market index.
In addition to the losses included in the table above, there was a pre-tax gain of approximately $51 million(related to Other assets) included in discontinued operations in the quarter ended March 31, 2012 in connectionwith the planned disposition of Saxon (see Notes 1 and 20). This pre-tax gain was primarily due to thesubsequent increase in fair value of Saxon, which had incurred impairment losses of $98 million in the quarterended December 31, 2011. The fair value of Saxon was determined based on the revised purchase price agreedupon with the buyer.
There were no liabilities measured at fair value on a non-recurring basis during the quarter ended March 31,2012.
32
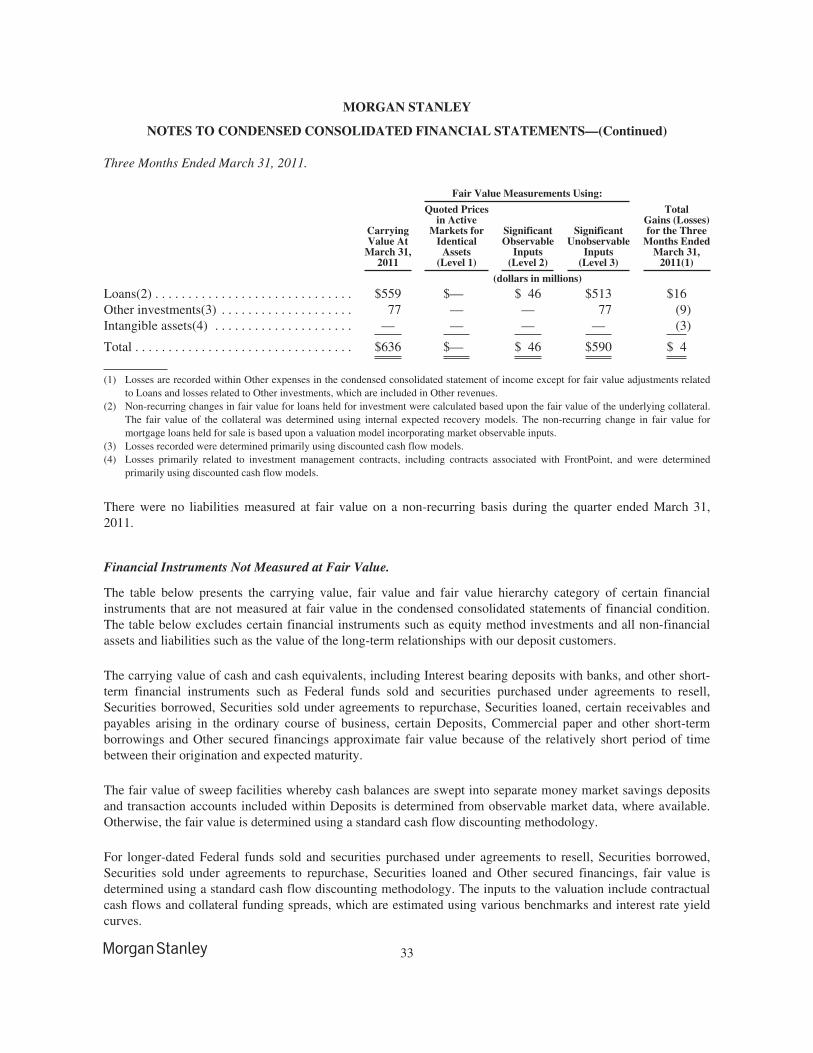
MORGAN STANLEY
NOTES TO CONDENSED CONSOLIDATED FINANCIAL STATEMENTS—(Continued)
Three Months Ended March 31, 2011.
Fair Value Measurements Using:
CarryingValue At
March 31,2011
Quoted Pricesin Active
Markets forIdentical
Assets(Level 1)
SignificantObservable
Inputs(Level 2)
SignificantUnobservable
Inputs(Level 3)
TotalGains (Losses)for the Three
Months EndedMarch 31,
2011(1)
(dollars in millions)
Loans(2) . . . . . . . . . . . . . . . . . . . . . . . . . . . . . . $559 $— $ 46 $513 $16Other investments(3) . . . . . . . . . . . . . . . . . . . . 77 — — 77 (9)Intangible assets(4) . . . . . . . . . . . . . . . . . . . . . — — — — (3)
Total . . . . . . . . . . . . . . . . . . . . . . . . . . . . . . . . . $636 $— $ 46 $590 $ 4
(1) Losses are recorded within Other expenses in the condensed consolidated statement of income except for fair value adjustments relatedto Loans and losses related to Other investments, which are included in Other revenues.
(2) Non-recurring changes in fair value for loans held for investment were calculated based upon the fair value of the underlying collateral.The fair value of the collateral was determined using internal expected recovery models. The non-recurring change in fair value formortgage loans held for sale is based upon a valuation model incorporating market observable inputs.
(3) Losses recorded were determined primarily using discounted cash flow models.(4) Losses primarily related to investment management contracts, including contracts associated with FrontPoint, and were determined
primarily using discounted cash flow models.
There were no liabilities measured at fair value on a non-recurring basis during the quarter ended March 31,2011.
Financial Instruments Not Measured at Fair Value.
The table below presents the carrying value, fair value and fair value hierarchy category of certain financialinstruments that are not measured at fair value in the condensed consolidated statements of financial condition.The table below excludes certain financial instruments such as equity method investments and all non-financialassets and liabilities such as the value of the long-term relationships with our deposit customers.
The carrying value of cash and cash equivalents, including Interest bearing deposits with banks, and other short-term financial instruments such as Federal funds sold and securities purchased under agreements to resell,Securities borrowed, Securities sold under agreements to repurchase, Securities loaned, certain receivables andpayables arising in the ordinary course of business, certain Deposits, Commercial paper and other short-termborrowings and Other secured financings approximate fair value because of the relatively short period of timebetween their origination and expected maturity.
The fair value of sweep facilities whereby cash balances are swept into separate money market savings depositsand transaction accounts included within Deposits is determined from observable market data, where available.Otherwise, the fair value is determined using a standard cash flow discounting methodology.
For longer-dated Federal funds sold and securities purchased under agreements to resell, Securities borrowed,Securities sold under agreements to repurchase, Securities loaned and Other secured financings, fair value isdetermined using a standard cash flow discounting methodology. The inputs to the valuation include contractualcash flows and collateral funding spreads, which are estimated using various benchmarks and interest rate yieldcurves.
33
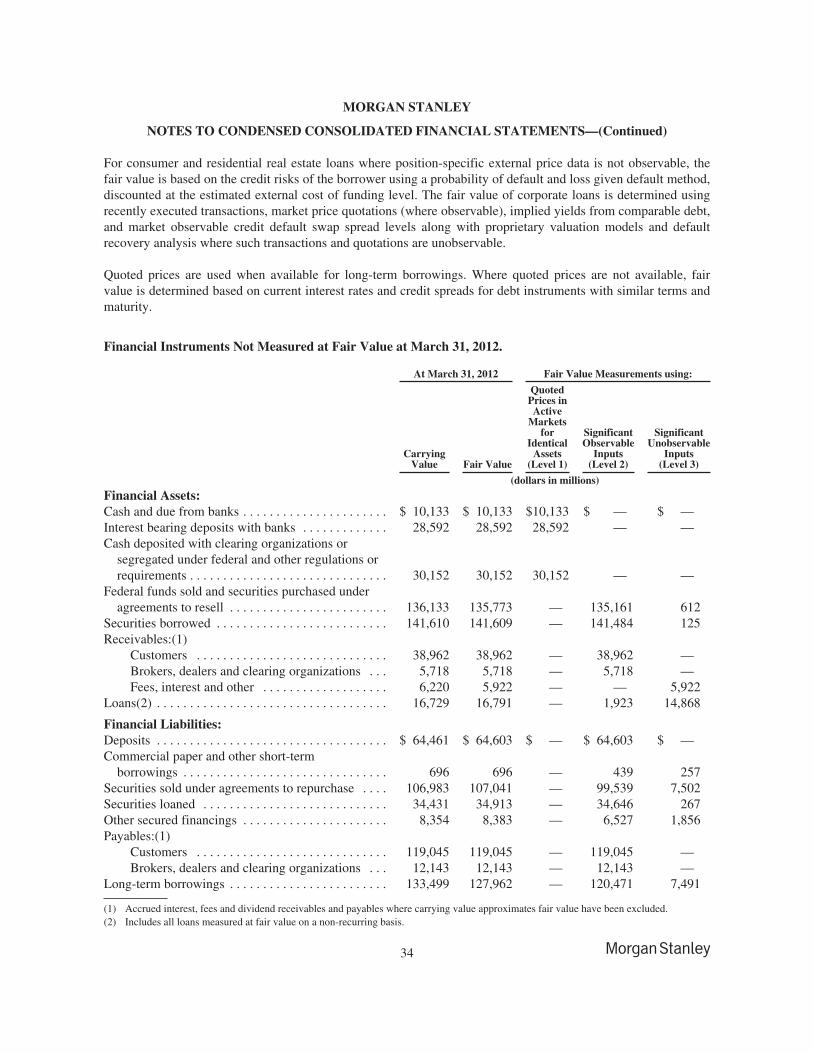
MORGAN STANLEY
NOTES TO CONDENSED CONSOLIDATED FINANCIAL STATEMENTS—(Continued)
For consumer and residential real estate loans where position-specific external price data is not observable, thefair value is based on the credit risks of the borrower using a probability of default and loss given default method,discounted at the estimated external cost of funding level. The fair value of corporate loans is determined usingrecently executed transactions, market price quotations (where observable), implied yields from comparable debt,and market observable credit default swap spread levels along with proprietary valuation models and defaultrecovery analysis where such transactions and quotations are unobservable.
Quoted prices are used when available for long-term borrowings. Where quoted prices are not available, fairvalue is determined based on current interest rates and credit spreads for debt instruments with similar terms andmaturity.
Financial Instruments Not Measured at Fair Value at March 31, 2012.
At March 31, 2012 Fair Value Measurements using:
CarryingValue Fair Value
QuotedPrices inActive
Marketsfor
IdenticalAssets
(Level 1)
SignificantObservable
Inputs(Level 2)
SignificantUnobservable
Inputs(Level 3)
(dollars in millions)
Financial Assets:Cash and due from banks . . . . . . . . . . . . . . . . . . . . . . $ 10,133 $ 10,133 $10,133 $ — $ —Interest bearing deposits with banks . . . . . . . . . . . . . 28,592 28,592 28,592 — —Cash deposited with clearing organizations or
segregated under federal and other regulations orrequirements . . . . . . . . . . . . . . . . . . . . . . . . . . . . . . 30,152 30,152 30,152 — —
Federal funds sold and securities purchased underagreements to resell . . . . . . . . . . . . . . . . . . . . . . . . 136,133 135,773 — 135,161 612
Securities borrowed . . . . . . . . . . . . . . . . . . . . . . . . . . 141,610 141,609 — 141,484 125Receivables:(1)
Customers . . . . . . . . . . . . . . . . . . . . . . . . . . . . . 38,962 38,962 — 38,962 —Brokers, dealers and clearing organizations . . . 5,718 5,718 — 5,718 —Fees, interest and other . . . . . . . . . . . . . . . . . . . 6,220 5,922 — — 5,922
Loans(2) . . . . . . . . . . . . . . . . . . . . . . . . . . . . . . . . . . . 16,729 16,791 — 1,923 14,868
Financial Liabilities:Deposits . . . . . . . . . . . . . . . . . . . . . . . . . . . . . . . . . . . $ 64,461 $ 64,603 $ — $ 64,603 $ —Commercial paper and other short-term
borrowings . . . . . . . . . . . . . . . . . . . . . . . . . . . . . . . 696 696 — 439 257Securities sold under agreements to repurchase . . . . 106,983 107,041 — 99,539 7,502Securities loaned . . . . . . . . . . . . . . . . . . . . . . . . . . . . 34,431 34,913 — 34,646 267Other secured financings . . . . . . . . . . . . . . . . . . . . . . 8,354 8,383 — 6,527 1,856Payables:(1)
Customers . . . . . . . . . . . . . . . . . . . . . . . . . . . . . 119,045 119,045 — 119,045 —Brokers, dealers and clearing organizations . . . 12,143 12,143 — 12,143 —
Long-term borrowings . . . . . . . . . . . . . . . . . . . . . . . . 133,499 127,962 — 120,471 7,491
(1) Accrued interest, fees and dividend receivables and payables where carrying value approximates fair value have been excluded.(2) Includes all loans measured at fair value on a non-recurring basis.
34
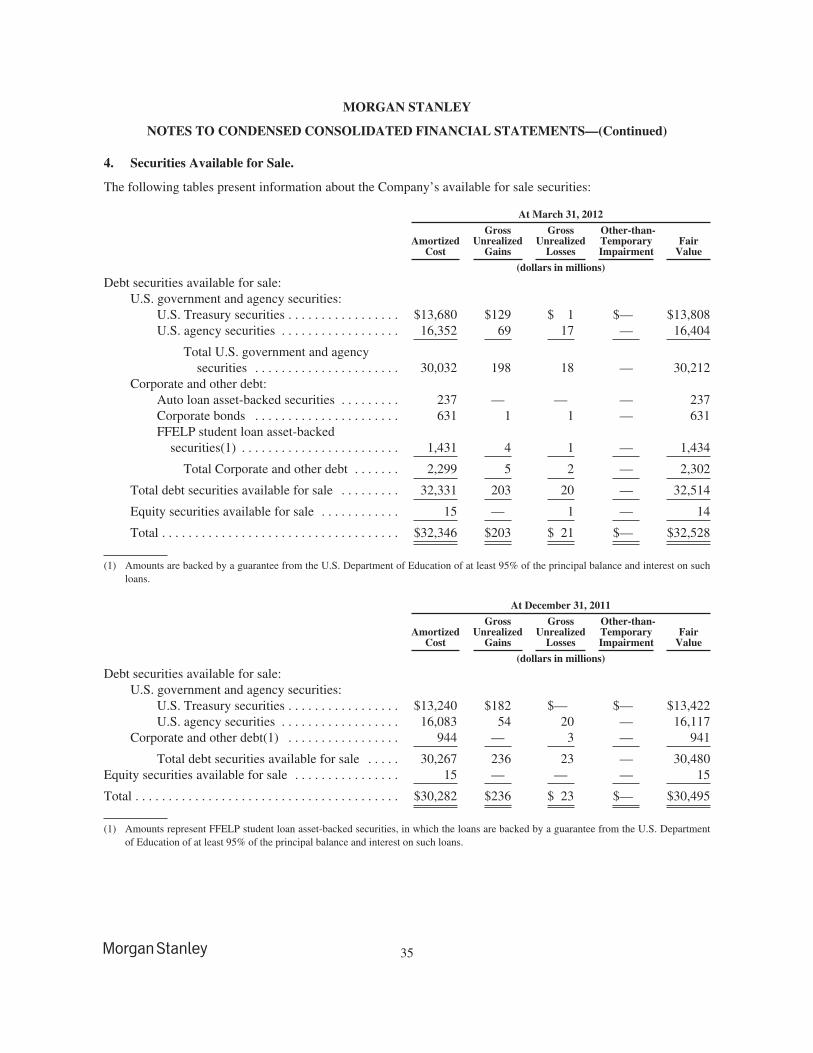
MORGAN STANLEY
NOTES TO CONDENSED CONSOLIDATED FINANCIAL STATEMENTS—(Continued)
4. Securities Available for Sale.
The following tables present information about the Company’s available for sale securities:
At March 31, 2012
AmortizedCost
GrossUnrealized
Gains
GrossUnrealized
Losses
Other-than-TemporaryImpairment
FairValue
(dollars in millions)
Debt securities available for sale:U.S. government and agency securities:
U.S. Treasury securities . . . . . . . . . . . . . . . . . $13,680 $129 $ 1 $— $13,808U.S. agency securities . . . . . . . . . . . . . . . . . . 16,352 69 17 — 16,404
Total U.S. government and agencysecurities . . . . . . . . . . . . . . . . . . . . . . 30,032 198 18 — 30,212
Corporate and other debt:Auto loan asset-backed securities . . . . . . . . . 237 — — — 237Corporate bonds . . . . . . . . . . . . . . . . . . . . . . 631 1 1 — 631FFELP student loan asset-backed
securities(1) . . . . . . . . . . . . . . . . . . . . . . . . 1,431 4 1 — 1,434
Total Corporate and other debt . . . . . . . 2,299 5 2 — 2,302
Total debt securities available for sale . . . . . . . . . 32,331 203 20 — 32,514
Equity securities available for sale . . . . . . . . . . . . 15 — 1 — 14
Total . . . . . . . . . . . . . . . . . . . . . . . . . . . . . . . . . . . . $32,346 $203 $ 21 $— $32,528
(1) Amounts are backed by a guarantee from the U.S. Department of Education of at least 95% of the principal balance and interest on suchloans.
At December 31, 2011
AmortizedCost
GrossUnrealized
Gains
GrossUnrealized
Losses
Other-than-TemporaryImpairment
FairValue
(dollars in millions)
Debt securities available for sale:U.S. government and agency securities:
U.S. Treasury securities . . . . . . . . . . . . . . . . . $13,240 $182 $— $— $13,422U.S. agency securities . . . . . . . . . . . . . . . . . . 16,083 54 20 — 16,117
Corporate and other debt(1) . . . . . . . . . . . . . . . . . 944 — 3 — 941
Total debt securities available for sale . . . . . 30,267 236 23 — 30,480Equity securities available for sale . . . . . . . . . . . . . . . . 15 — — — 15
Total . . . . . . . . . . . . . . . . . . . . . . . . . . . . . . . . . . . . . . . . $30,282 $236 $ 23 $— $30,495
(1) Amounts represent FFELP student loan asset-backed securities, in which the loans are backed by a guarantee from the U.S. Departmentof Education of at least 95% of the principal balance and interest on such loans.
35
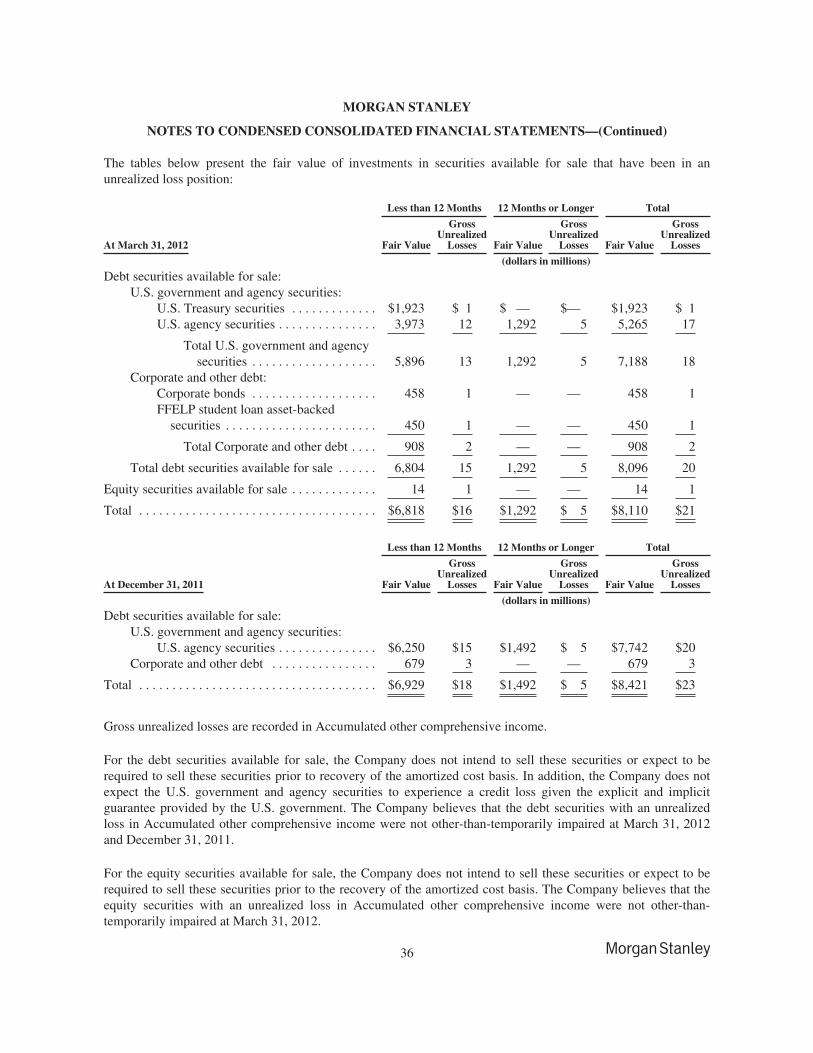
MORGAN STANLEY
NOTES TO CONDENSED CONSOLIDATED FINANCIAL STATEMENTS—(Continued)
The tables below present the fair value of investments in securities available for sale that have been in anunrealized loss position:
Less than 12 Months 12 Months or Longer Total
At March 31, 2012 Fair Value
GrossUnrealized
Losses Fair Value
GrossUnrealized
Losses Fair Value
GrossUnrealized
Losses
(dollars in millions)
Debt securities available for sale:U.S. government and agency securities:
U.S. Treasury securities . . . . . . . . . . . . . $1,923 $ 1 $ — $— $1,923 $ 1U.S. agency securities . . . . . . . . . . . . . . . 3,973 12 1,292 5 5,265 17
Total U.S. government and agencysecurities . . . . . . . . . . . . . . . . . . . 5,896 13 1,292 5 7,188 18
Corporate and other debt:Corporate bonds . . . . . . . . . . . . . . . . . . . 458 1 — — 458 1FFELP student loan asset-backed
securities . . . . . . . . . . . . . . . . . . . . . . . 450 1 — — 450 1
Total Corporate and other debt . . . . 908 2 — — 908 2
Total debt securities available for sale . . . . . . 6,804 15 1,292 5 8,096 20
Equity securities available for sale . . . . . . . . . . . . . 14 1 — — 14 1
Total . . . . . . . . . . . . . . . . . . . . . . . . . . . . . . . . . . . . $6,818 $16 $1,292 $ 5 $8,110 $21
Less than 12 Months 12 Months or Longer Total
At December 31, 2011 Fair Value
GrossUnrealized
Losses Fair Value
GrossUnrealized
Losses Fair Value
GrossUnrealized
Losses
(dollars in millions)
Debt securities available for sale:U.S. government and agency securities:
U.S. agency securities . . . . . . . . . . . . . . . $6,250 $15 $1,492 $ 5 $7,742 $20Corporate and other debt . . . . . . . . . . . . . . . . 679 3 — — 679 3
Total . . . . . . . . . . . . . . . . . . . . . . . . . . . . . . . . . . . . $6,929 $18 $1,492 $ 5 $8,421 $23
Gross unrealized losses are recorded in Accumulated other comprehensive income.
For the debt securities available for sale, the Company does not intend to sell these securities or expect to berequired to sell these securities prior to recovery of the amortized cost basis. In addition, the Company does notexpect the U.S. government and agency securities to experience a credit loss given the explicit and implicitguarantee provided by the U.S. government. The Company believes that the debt securities with an unrealizedloss in Accumulated other comprehensive income were not other-than-temporarily impaired at March 31, 2012and December 31, 2011.
For the equity securities available for sale, the Company does not intend to sell these securities or expect to berequired to sell these securities prior to the recovery of the amortized cost basis. The Company believes that theequity securities with an unrealized loss in Accumulated other comprehensive income were not other-than-temporarily impaired at March 31, 2012.
36
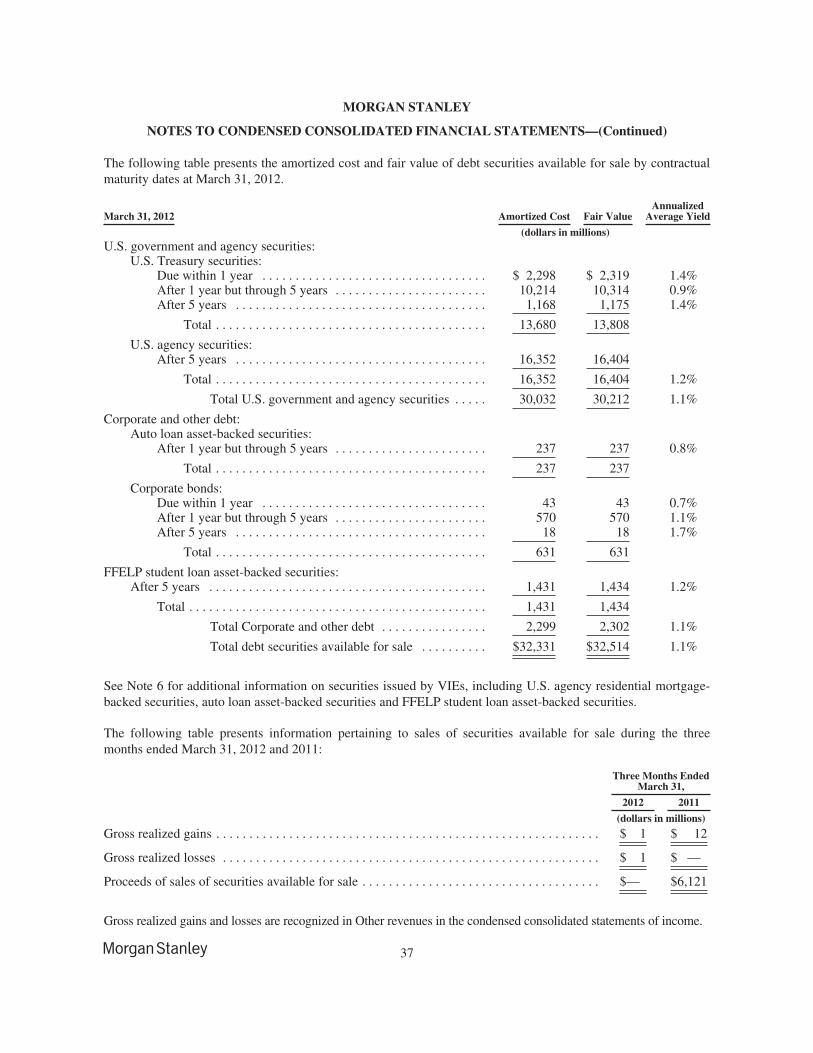
MORGAN STANLEY
NOTES TO CONDENSED CONSOLIDATED FINANCIAL STATEMENTS—(Continued)
The following table presents the amortized cost and fair value of debt securities available for sale by contractualmaturity dates at March 31, 2012.
March 31, 2012 Amortized Cost Fair ValueAnnualized
Average Yield
(dollars in millions)U.S. government and agency securities:
U.S. Treasury securities:Due within 1 year . . . . . . . . . . . . . . . . . . . . . . . . . . . . . . . . . . $ 2,298 $ 2,319 1.4%After 1 year but through 5 years . . . . . . . . . . . . . . . . . . . . . . . 10,214 10,314 0.9%After 5 years . . . . . . . . . . . . . . . . . . . . . . . . . . . . . . . . . . . . . . 1,168 1,175 1.4%
Total . . . . . . . . . . . . . . . . . . . . . . . . . . . . . . . . . . . . . . . . . 13,680 13,808
U.S. agency securities:After 5 years . . . . . . . . . . . . . . . . . . . . . . . . . . . . . . . . . . . . . . 16,352 16,404
Total . . . . . . . . . . . . . . . . . . . . . . . . . . . . . . . . . . . . . . . . . 16,352 16,404 1.2%
Total U.S. government and agency securities . . . . . 30,032 30,212 1.1%
Corporate and other debt:Auto loan asset-backed securities:
After 1 year but through 5 years . . . . . . . . . . . . . . . . . . . . . . . 237 237 0.8%
Total . . . . . . . . . . . . . . . . . . . . . . . . . . . . . . . . . . . . . . . . . 237 237
Corporate bonds:Due within 1 year . . . . . . . . . . . . . . . . . . . . . . . . . . . . . . . . . . 43 43 0.7%After 1 year but through 5 years . . . . . . . . . . . . . . . . . . . . . . . 570 570 1.1%After 5 years . . . . . . . . . . . . . . . . . . . . . . . . . . . . . . . . . . . . . . 18 18 1.7%
Total . . . . . . . . . . . . . . . . . . . . . . . . . . . . . . . . . . . . . . . . . 631 631
FFELP student loan asset-backed securities:After 5 years . . . . . . . . . . . . . . . . . . . . . . . . . . . . . . . . . . . . . . . . . . 1,431 1,434 1.2%
Total . . . . . . . . . . . . . . . . . . . . . . . . . . . . . . . . . . . . . . . . . . . . . 1,431 1,434
Total Corporate and other debt . . . . . . . . . . . . . . . . 2,299 2,302 1.1%
Total debt securities available for sale . . . . . . . . . . $32,331 $32,514 1.1%
See Note 6 for additional information on securities issued by VIEs, including U.S. agency residential mortgage-backed securities, auto loan asset-backed securities and FFELP student loan asset-backed securities.
The following table presents information pertaining to sales of securities available for sale during the threemonths ended March 31, 2012 and 2011:
Three Months EndedMarch 31,
2012 2011
(dollars in millions)
Gross realized gains . . . . . . . . . . . . . . . . . . . . . . . . . . . . . . . . . . . . . . . . . . . . . . . . . . . . . . . . . . $ 1 $ 12
Gross realized losses . . . . . . . . . . . . . . . . . . . . . . . . . . . . . . . . . . . . . . . . . . . . . . . . . . . . . . . . . $ 1 $ —
Proceeds of sales of securities available for sale . . . . . . . . . . . . . . . . . . . . . . . . . . . . . . . . . . . . $— $6,121
Gross realized gains and losses are recognized in Other revenues in the condensed consolidated statements of income.
37
MORGAN STANLEY
NOTES TO CONDENSED CONSOLIDATED FINANCIAL STATEMENTS—(Continued)
5. Collateralized Transactions.
The Company enters into reverse repurchase agreements, repurchase agreements, securities borrowed andsecurities loaned transactions to, among other things, acquire securities to cover short positions and settle othersecurities obligations, to accommodate customers’ needs and to finance the Company’s inventory positions. TheCompany’s policy is generally to take possession of Securities received as collateral, Securities purchased underagreements to resell and Securities borrowed. The Company manages credit exposure arising from reverserepurchase agreements, repurchase agreements, securities borrowed and securities loaned transactions by, inappropriate circumstances, entering into master netting agreements and collateral arrangements withcounterparties that provide the Company, in the event of a customer default, the right to liquidate collateral andthe right to offset a counterparty’s rights and obligations. The Company also monitors the fair value of theunderlying securities as compared with the related receivable or payable, including accrued interest, and, asnecessary, requests additional collateral to ensure such transactions are adequately collateralized. Where deemedappropriate, the Company’s agreements with third parties specify its rights to request additional collateral.
The Company also engages in securities financing transactions for customers through margin lending. Underthese agreements and transactions, the Company either receives or provides collateral, including U.S.government and agency securities, other sovereign government obligations, corporate and other debt, andcorporate equities. Customer receivables generated from margin lending activity are collateralized by customer-owned securities held by the Company. The Company monitors required margin levels and established creditlimits daily and, pursuant to such guidelines, requires customers to deposit additional collateral, or reducepositions, when necessary. Margin loans are extended on a demand basis and are not committed facilities.Factors considered in the review of margin loans are the amount of the loan, the intended purpose, the degree ofleverage being employed in the account, and overall evaluation of the portfolio to ensure proper diversificationor, in the case of concentrated positions, appropriate liquidity of the underlying collateral or potential hedgingstrategies to reduce risk. Additionally, transactions relating to concentrated or restricted positions require areview of any legal impediments to liquidation of the underlying collateral. Underlying collateral for marginloans is reviewed with respect to the liquidity of the proposed collateral positions, valuation of securities, historictrading range, volatility analysis and an evaluation of industry concentrations. For these transactions, adherenceto the Company’s collateral policies significantly limits the Company’s credit exposure in the event of customerdefault. The Company may request additional margin collateral from customers, if appropriate, and, if necessary,may sell securities that have not been paid for or purchase securities sold but not delivered from customers. AtMarch 31, 2012 and December 31, 2011, there were approximately $19.4 billion and $16.2 billion, respectively,of customer margin loans outstanding.
Other secured financings include the liabilities related to transfers of financial assets that are accounted for asfinancings rather than sales, consolidated VIEs where the Company is deemed to be the primary beneficiary, andcertain equity-linked notes and other secured borrowings. These liabilities are generally payable from the cashflows of the related assets accounted for as Financial instruments owned (see Note 6).
38
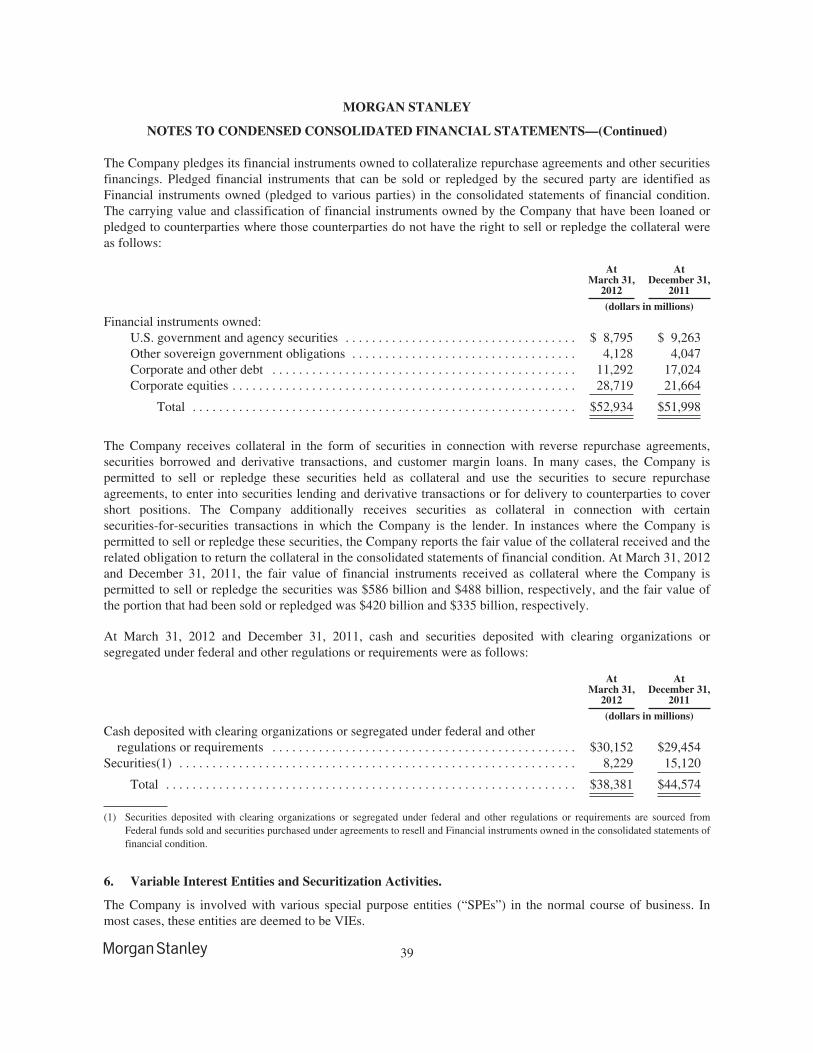
MORGAN STANLEY
NOTES TO CONDENSED CONSOLIDATED FINANCIAL STATEMENTS—(Continued)
The Company pledges its financial instruments owned to collateralize repurchase agreements and other securitiesfinancings. Pledged financial instruments that can be sold or repledged by the secured party are identified asFinancial instruments owned (pledged to various parties) in the consolidated statements of financial condition.The carrying value and classification of financial instruments owned by the Company that have been loaned orpledged to counterparties where those counterparties do not have the right to sell or repledge the collateral wereas follows:
AtMarch 31,
2012
AtDecember 31,
2011
(dollars in millions)
Financial instruments owned:U.S. government and agency securities . . . . . . . . . . . . . . . . . . . . . . . . . . . . . . . . . . . $ 8,795 $ 9,263Other sovereign government obligations . . . . . . . . . . . . . . . . . . . . . . . . . . . . . . . . . . 4,128 4,047Corporate and other debt . . . . . . . . . . . . . . . . . . . . . . . . . . . . . . . . . . . . . . . . . . . . . . 11,292 17,024Corporate equities . . . . . . . . . . . . . . . . . . . . . . . . . . . . . . . . . . . . . . . . . . . . . . . . . . . . 28,719 21,664
Total . . . . . . . . . . . . . . . . . . . . . . . . . . . . . . . . . . . . . . . . . . . . . . . . . . . . . . . . . . $52,934 $51,998
The Company receives collateral in the form of securities in connection with reverse repurchase agreements,securities borrowed and derivative transactions, and customer margin loans. In many cases, the Company ispermitted to sell or repledge these securities held as collateral and use the securities to secure repurchaseagreements, to enter into securities lending and derivative transactions or for delivery to counterparties to covershort positions. The Company additionally receives securities as collateral in connection with certainsecurities-for-securities transactions in which the Company is the lender. In instances where the Company ispermitted to sell or repledge these securities, the Company reports the fair value of the collateral received and therelated obligation to return the collateral in the consolidated statements of financial condition. At March 31, 2012and December 31, 2011, the fair value of financial instruments received as collateral where the Company ispermitted to sell or repledge the securities was $586 billion and $488 billion, respectively, and the fair value ofthe portion that had been sold or repledged was $420 billion and $335 billion, respectively.
At March 31, 2012 and December 31, 2011, cash and securities deposited with clearing organizations orsegregated under federal and other regulations or requirements were as follows:
AtMarch 31,
2012
AtDecember 31,
2011
(dollars in millions)
Cash deposited with clearing organizations or segregated under federal and otherregulations or requirements . . . . . . . . . . . . . . . . . . . . . . . . . . . . . . . . . . . . . . . . . . . . . . $30,152 $29,454
Securities(1) . . . . . . . . . . . . . . . . . . . . . . . . . . . . . . . . . . . . . . . . . . . . . . . . . . . . . . . . . . . . 8,229 15,120
Total . . . . . . . . . . . . . . . . . . . . . . . . . . . . . . . . . . . . . . . . . . . . . . . . . . . . . . . . . . . . . . $38,381 $44,574
(1) Securities deposited with clearing organizations or segregated under federal and other regulations or requirements are sourced fromFederal funds sold and securities purchased under agreements to resell and Financial instruments owned in the consolidated statements offinancial condition.
6. Variable Interest Entities and Securitization Activities.
The Company is involved with various special purpose entities (“SPEs”) in the normal course of business. Inmost cases, these entities are deemed to be VIEs.
39
MORGAN STANLEY
NOTES TO CONDENSED CONSOLIDATED FINANCIAL STATEMENTS—(Continued)
The Company applies accounting guidance for consolidation of VIEs to certain entities in which equity investorsdo not have the characteristics of a controlling financial interest. Excluding entities subject to the Deferral (asdefined in Note 2 to the consolidated financial statements included in the Form 10-K), the primary beneficiary ofa VIE is the party that both (1) has the power to direct the activities of a VIE that most significantly affect theVIE’s economic performance and (2) has an obligation to absorb losses or the right to receive benefits that ineither case could potentially be significant to the VIE. The Company consolidates entities of which it is theprimary beneficiary.
The Company’s variable interests in VIEs include debt and equity interests, commitments, guarantees, derivativeinstruments and certain fees. The Company’s involvement with VIEs arises primarily from:
• Interests purchased in connection with market-making activities, securities held in its available for saleportfolio and retained interests held as a result of securitization activities, including re-securitizationtransactions.
• Guarantees issued and residual interests retained in connection with municipal bond securitizations.
• Servicing residential and commercial mortgage loans held by VIEs.
• Loans made to and investments in VIEs that hold debt, equity, real estate or other assets.
• Derivatives entered into with VIEs.
• Structuring of credit-linked notes (“CLN”) or other asset-repackaged notes designed to meet theinvestment objectives of clients.
• Other structured transactions designed to provide tax-efficient yields to the Company or its clients.
The Company determines whether it is the primary beneficiary of a VIE upon its initial involvement with theVIE and reassesses whether it is the primary beneficiary on an ongoing basis as long as it has any continuinginvolvement with the VIE. This determination is based upon an analysis of the design of the VIE, including theVIE’s structure and activities, the power to make significant economic decisions held by the Company and byother parties, and the variable interests owned by the Company and other parties.
The power to make the most significant economic decisions may take a number of different forms in differenttypes of VIEs. The Company considers servicing or collateral management decisions as representing the powerto make the most significant economic decisions in transactions such as securitizations or CDOs. As a result, theCompany does not consolidate securitizations or CDOs for which it does not act as the servicer or collateralmanager unless it holds certain other rights to replace the servicer or collateral manager or to require theliquidation of the entity. If the Company serves as servicer or collateral manager, or has certain other rightsdescribed in the previous sentence, the Company analyzes the interests in the VIE that it holds and consolidatesonly those VIEs for which it holds a potentially significant interest of the VIE.
The structure of securitization vehicles and CDOs are driven by several parties, including loan seller(s) insecuritization transactions, the collateral manager in a CDO, one or more rating agencies, a financial guarantor insome transactions and the underwriter(s) of the transactions, who serve to reflect specific investor demand. Inaddition, subordinate investors, such as the “B-piece” buyer in commercial mortgage backed securitizations orequity investors in CDOs, can influence whether specific loans are excluded from a CMBS transaction orinvestment criteria in a CDO.
For many transactions, such as re-securitization transactions, CLNs and other asset-repackaged notes, there areno significant economic decisions made on an ongoing basis. In these cases, the Company focuses its analysis on
40
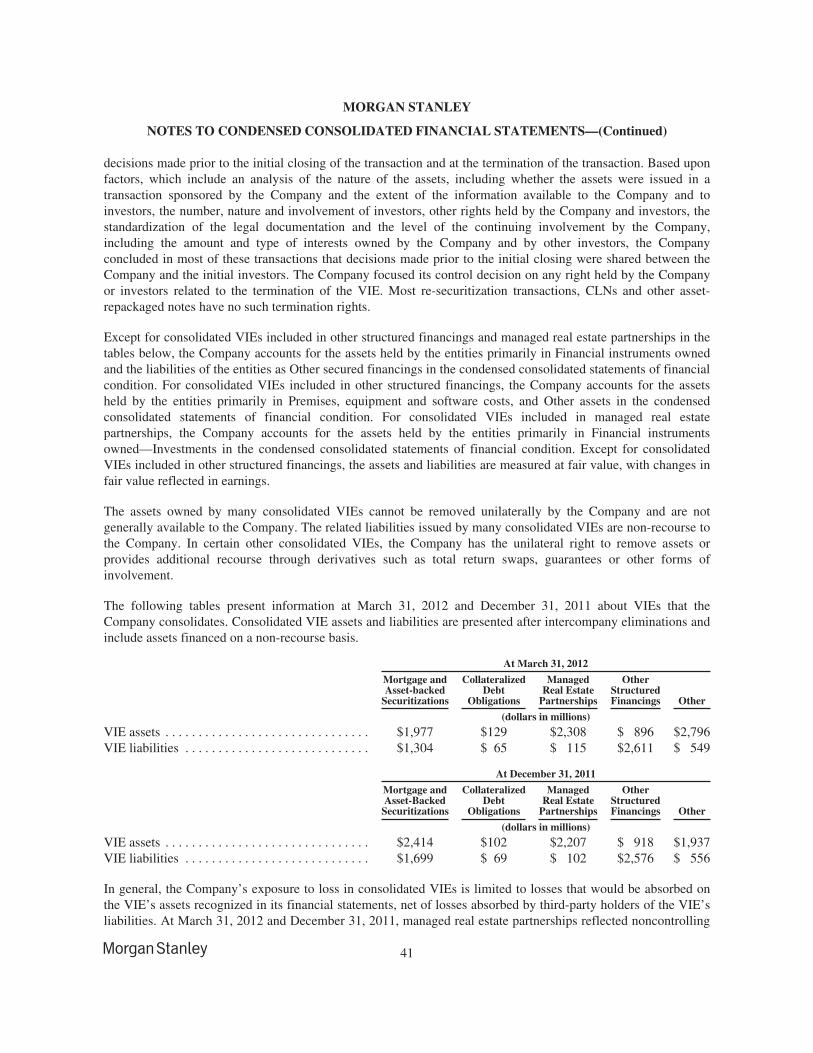
MORGAN STANLEY
NOTES TO CONDENSED CONSOLIDATED FINANCIAL STATEMENTS—(Continued)
decisions made prior to the initial closing of the transaction and at the termination of the transaction. Based uponfactors, which include an analysis of the nature of the assets, including whether the assets were issued in atransaction sponsored by the Company and the extent of the information available to the Company and toinvestors, the number, nature and involvement of investors, other rights held by the Company and investors, thestandardization of the legal documentation and the level of the continuing involvement by the Company,including the amount and type of interests owned by the Company and by other investors, the Companyconcluded in most of these transactions that decisions made prior to the initial closing were shared between theCompany and the initial investors. The Company focused its control decision on any right held by the Companyor investors related to the termination of the VIE. Most re-securitization transactions, CLNs and other asset-repackaged notes have no such termination rights.
Except for consolidated VIEs included in other structured financings and managed real estate partnerships in thetables below, the Company accounts for the assets held by the entities primarily in Financial instruments ownedand the liabilities of the entities as Other secured financings in the condensed consolidated statements of financialcondition. For consolidated VIEs included in other structured financings, the Company accounts for the assetsheld by the entities primarily in Premises, equipment and software costs, and Other assets in the condensedconsolidated statements of financial condition. For consolidated VIEs included in managed real estatepartnerships, the Company accounts for the assets held by the entities primarily in Financial instrumentsowned—Investments in the condensed consolidated statements of financial condition. Except for consolidatedVIEs included in other structured financings, the assets and liabilities are measured at fair value, with changes infair value reflected in earnings.
The assets owned by many consolidated VIEs cannot be removed unilaterally by the Company and are notgenerally available to the Company. The related liabilities issued by many consolidated VIEs are non-recourse tothe Company. In certain other consolidated VIEs, the Company has the unilateral right to remove assets orprovides additional recourse through derivatives such as total return swaps, guarantees or other forms ofinvolvement.
The following tables present information at March 31, 2012 and December 31, 2011 about VIEs that theCompany consolidates. Consolidated VIE assets and liabilities are presented after intercompany eliminations andinclude assets financed on a non-recourse basis.
At March 31, 2012
Mortgage andAsset-backed
Securitizations
CollateralizedDebt
Obligations
ManagedReal Estate
Partnerships
OtherStructuredFinancings Other
(dollars in millions)
VIE assets . . . . . . . . . . . . . . . . . . . . . . . . . . . . . . . $1,977 $129 $2,308 $ 896 $2,796VIE liabilities . . . . . . . . . . . . . . . . . . . . . . . . . . . . $1,304 $ 65 $ 115 $2,611 $ 549
At December 31, 2011
Mortgage andAsset-Backed
Securitizations
CollateralizedDebt
Obligations
ManagedReal Estate
Partnerships
OtherStructuredFinancings Other
(dollars in millions)
VIE assets . . . . . . . . . . . . . . . . . . . . . . . . . . . . . . . $2,414 $102 $2,207 $ 918 $1,937VIE liabilities . . . . . . . . . . . . . . . . . . . . . . . . . . . . $1,699 $ 69 $ 102 $2,576 $ 556
In general, the Company’s exposure to loss in consolidated VIEs is limited to losses that would be absorbed onthe VIE’s assets recognized in its financial statements, net of losses absorbed by third-party holders of the VIE’sliabilities. At March 31, 2012 and December 31, 2011, managed real estate partnerships reflected noncontrolling
41
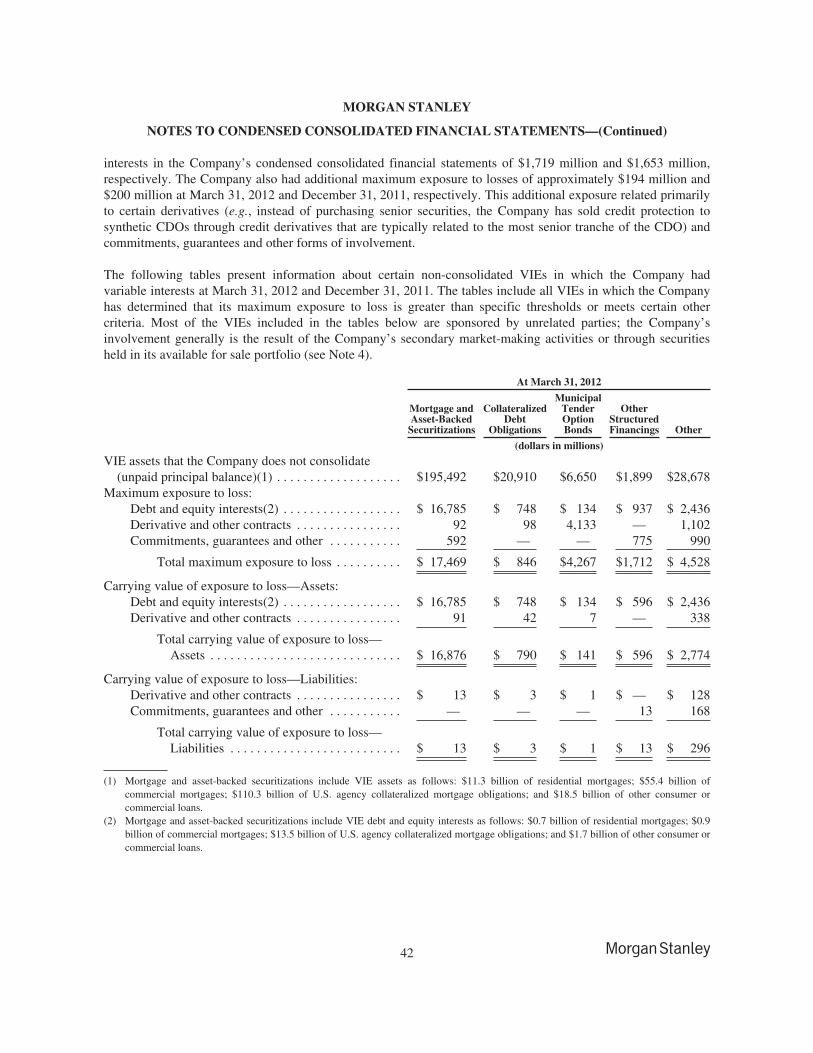
MORGAN STANLEY
NOTES TO CONDENSED CONSOLIDATED FINANCIAL STATEMENTS—(Continued)
interests in the Company’s condensed consolidated financial statements of $1,719 million and $1,653 million,respectively. The Company also had additional maximum exposure to losses of approximately $194 million and$200 million at March 31, 2012 and December 31, 2011, respectively. This additional exposure related primarilyto certain derivatives (e.g., instead of purchasing senior securities, the Company has sold credit protection tosynthetic CDOs through credit derivatives that are typically related to the most senior tranche of the CDO) andcommitments, guarantees and other forms of involvement.
The following tables present information about certain non-consolidated VIEs in which the Company hadvariable interests at March 31, 2012 and December 31, 2011. The tables include all VIEs in which the Companyhas determined that its maximum exposure to loss is greater than specific thresholds or meets certain othercriteria. Most of the VIEs included in the tables below are sponsored by unrelated parties; the Company’sinvolvement generally is the result of the Company’s secondary market-making activities or through securitiesheld in its available for sale portfolio (see Note 4).
At March 31, 2012
Mortgage andAsset-Backed
Securitizations
CollateralizedDebt
Obligations
MunicipalTenderOptionBonds
OtherStructuredFinancings Other
(dollars in millions)
VIE assets that the Company does not consolidate(unpaid principal balance)(1) . . . . . . . . . . . . . . . . . . . $195,492 $20,910 $6,650 $1,899 $28,678
Maximum exposure to loss:Debt and equity interests(2) . . . . . . . . . . . . . . . . . . $ 16,785 $ 748 $ 134 $ 937 $ 2,436Derivative and other contracts . . . . . . . . . . . . . . . . 92 98 4,133 — 1,102Commitments, guarantees and other . . . . . . . . . . . 592 — — 775 990
Total maximum exposure to loss . . . . . . . . . . $ 17,469 $ 846 $4,267 $1,712 $ 4,528
Carrying value of exposure to loss—Assets:Debt and equity interests(2) . . . . . . . . . . . . . . . . . . $ 16,785 $ 748 $ 134 $ 596 $ 2,436Derivative and other contracts . . . . . . . . . . . . . . . . 91 42 7 — 338
Total carrying value of exposure to loss—Assets . . . . . . . . . . . . . . . . . . . . . . . . . . . . . $ 16,876 $ 790 $ 141 $ 596 $ 2,774
Carrying value of exposure to loss—Liabilities:Derivative and other contracts . . . . . . . . . . . . . . . . $ 13 $ 3 $ 1 $ — $ 128Commitments, guarantees and other . . . . . . . . . . . — — — 13 168
Total carrying value of exposure to loss—Liabilities . . . . . . . . . . . . . . . . . . . . . . . . . . $ 13 $ 3 $ 1 $ 13 $ 296
(1) Mortgage and asset-backed securitizations include VIE assets as follows: $11.3 billion of residential mortgages; $55.4 billion ofcommercial mortgages; $110.3 billion of U.S. agency collateralized mortgage obligations; and $18.5 billion of other consumer orcommercial loans.
(2) Mortgage and asset-backed securitizations include VIE debt and equity interests as follows: $0.7 billion of residential mortgages; $0.9billion of commercial mortgages; $13.5 billion of U.S. agency collateralized mortgage obligations; and $1.7 billion of other consumer orcommercial loans.
42
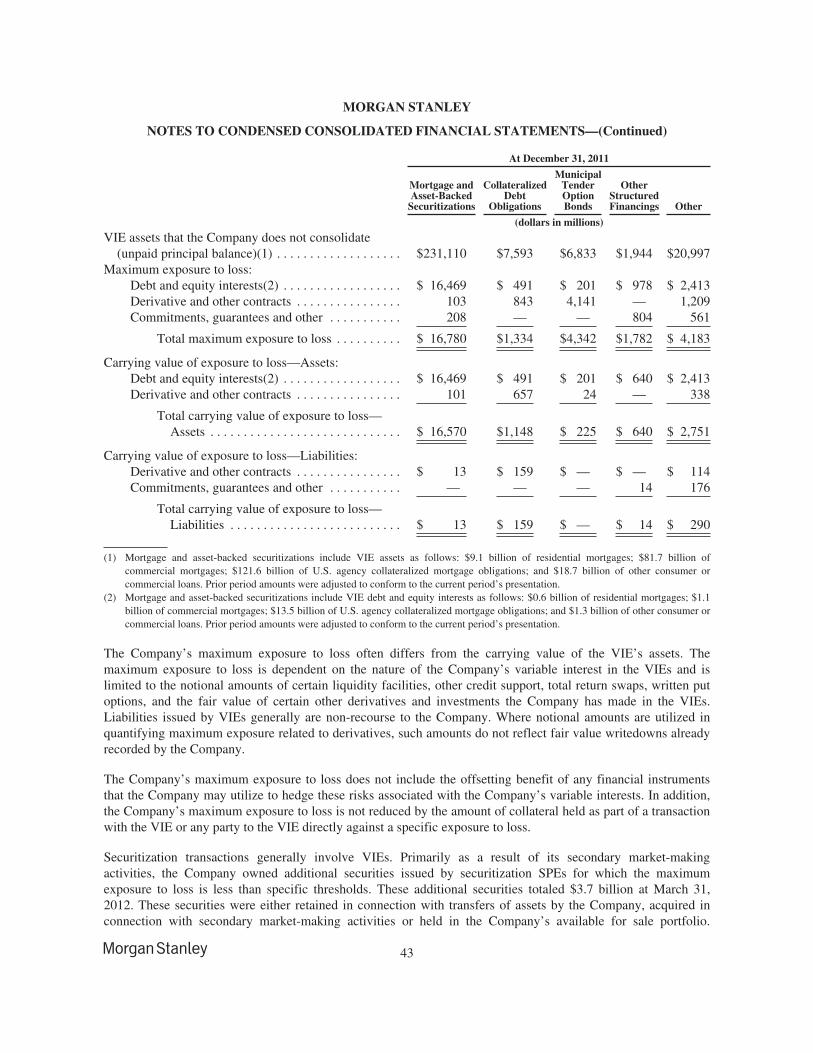
MORGAN STANLEY
NOTES TO CONDENSED CONSOLIDATED FINANCIAL STATEMENTS—(Continued)
At December 31, 2011
Mortgage andAsset-Backed
Securitizations
CollateralizedDebt
Obligations
MunicipalTenderOptionBonds
OtherStructuredFinancings Other
(dollars in millions)
VIE assets that the Company does not consolidate(unpaid principal balance)(1) . . . . . . . . . . . . . . . . . . . $231,110 $7,593 $6,833 $1,944 $20,997
Maximum exposure to loss:Debt and equity interests(2) . . . . . . . . . . . . . . . . . . $ 16,469 $ 491 $ 201 $ 978 $ 2,413Derivative and other contracts . . . . . . . . . . . . . . . . 103 843 4,141 — 1,209Commitments, guarantees and other . . . . . . . . . . . 208 — — 804 561
Total maximum exposure to loss . . . . . . . . . . $ 16,780 $1,334 $4,342 $1,782 $ 4,183
Carrying value of exposure to loss—Assets:Debt and equity interests(2) . . . . . . . . . . . . . . . . . . $ 16,469 $ 491 $ 201 $ 640 $ 2,413Derivative and other contracts . . . . . . . . . . . . . . . . 101 657 24 — 338
Total carrying value of exposure to loss—Assets . . . . . . . . . . . . . . . . . . . . . . . . . . . . . $ 16,570 $1,148 $ 225 $ 640 $ 2,751
Carrying value of exposure to loss—Liabilities:Derivative and other contracts . . . . . . . . . . . . . . . . $ 13 $ 159 $ — $ — $ 114Commitments, guarantees and other . . . . . . . . . . . — — — 14 176
Total carrying value of exposure to loss—Liabilities . . . . . . . . . . . . . . . . . . . . . . . . . . $ 13 $ 159 $ — $ 14 $ 290
(1) Mortgage and asset-backed securitizations include VIE assets as follows: $9.1 billion of residential mortgages; $81.7 billion ofcommercial mortgages; $121.6 billion of U.S. agency collateralized mortgage obligations; and $18.7 billion of other consumer orcommercial loans. Prior period amounts were adjusted to conform to the current period’s presentation.
(2) Mortgage and asset-backed securitizations include VIE debt and equity interests as follows: $0.6 billion of residential mortgages; $1.1billion of commercial mortgages; $13.5 billion of U.S. agency collateralized mortgage obligations; and $1.3 billion of other consumer orcommercial loans. Prior period amounts were adjusted to conform to the current period’s presentation.
The Company’s maximum exposure to loss often differs from the carrying value of the VIE’s assets. Themaximum exposure to loss is dependent on the nature of the Company’s variable interest in the VIEs and islimited to the notional amounts of certain liquidity facilities, other credit support, total return swaps, written putoptions, and the fair value of certain other derivatives and investments the Company has made in the VIEs.Liabilities issued by VIEs generally are non-recourse to the Company. Where notional amounts are utilized inquantifying maximum exposure related to derivatives, such amounts do not reflect fair value writedowns alreadyrecorded by the Company.
The Company’s maximum exposure to loss does not include the offsetting benefit of any financial instrumentsthat the Company may utilize to hedge these risks associated with the Company’s variable interests. In addition,the Company’s maximum exposure to loss is not reduced by the amount of collateral held as part of a transactionwith the VIE or any party to the VIE directly against a specific exposure to loss.
Securitization transactions generally involve VIEs. Primarily as a result of its secondary market-makingactivities, the Company owned additional securities issued by securitization SPEs for which the maximumexposure to loss is less than specific thresholds. These additional securities totaled $3.7 billion at March 31,2012. These securities were either retained in connection with transfers of assets by the Company, acquired inconnection with secondary market-making activities or held in the Company’s available for sale portfolio.
43
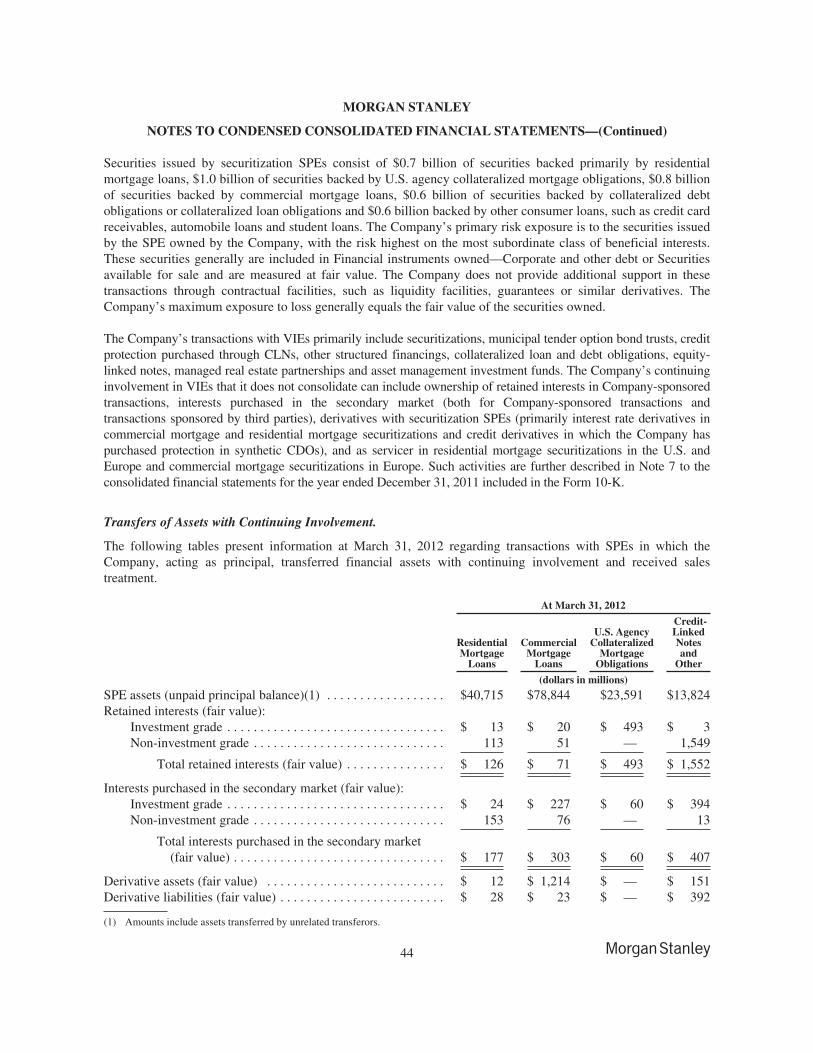
MORGAN STANLEY
NOTES TO CONDENSED CONSOLIDATED FINANCIAL STATEMENTS—(Continued)
Securities issued by securitization SPEs consist of $0.7 billion of securities backed primarily by residentialmortgage loans, $1.0 billion of securities backed by U.S. agency collateralized mortgage obligations, $0.8 billionof securities backed by commercial mortgage loans, $0.6 billion of securities backed by collateralized debtobligations or collateralized loan obligations and $0.6 billion backed by other consumer loans, such as credit cardreceivables, automobile loans and student loans. The Company’s primary risk exposure is to the securities issuedby the SPE owned by the Company, with the risk highest on the most subordinate class of beneficial interests.These securities generally are included in Financial instruments owned—Corporate and other debt or Securitiesavailable for sale and are measured at fair value. The Company does not provide additional support in thesetransactions through contractual facilities, such as liquidity facilities, guarantees or similar derivatives. TheCompany’s maximum exposure to loss generally equals the fair value of the securities owned.
The Company’s transactions with VIEs primarily include securitizations, municipal tender option bond trusts, creditprotection purchased through CLNs, other structured financings, collateralized loan and debt obligations, equity-linked notes, managed real estate partnerships and asset management investment funds. The Company’s continuinginvolvement in VIEs that it does not consolidate can include ownership of retained interests in Company-sponsoredtransactions, interests purchased in the secondary market (both for Company-sponsored transactions andtransactions sponsored by third parties), derivatives with securitization SPEs (primarily interest rate derivatives incommercial mortgage and residential mortgage securitizations and credit derivatives in which the Company haspurchased protection in synthetic CDOs), and as servicer in residential mortgage securitizations in the U.S. andEurope and commercial mortgage securitizations in Europe. Such activities are further described in Note 7 to theconsolidated financial statements for the year ended December 31, 2011 included in the Form 10-K.
Transfers of Assets with Continuing Involvement.
The following tables present information at March 31, 2012 regarding transactions with SPEs in which theCompany, acting as principal, transferred financial assets with continuing involvement and received salestreatment.
At March 31, 2012
ResidentialMortgage
Loans
CommercialMortgage
Loans
U.S. AgencyCollateralized
MortgageObligations
Credit-LinkedNotesand
Other
(dollars in millions)
SPE assets (unpaid principal balance)(1) . . . . . . . . . . . . . . . . . . $40,715 $78,844 $23,591 $13,824Retained interests (fair value):
Investment grade . . . . . . . . . . . . . . . . . . . . . . . . . . . . . . . . . $ 13 $ 20 $ 493 $ 3Non-investment grade . . . . . . . . . . . . . . . . . . . . . . . . . . . . . 113 51 — 1,549
Total retained interests (fair value) . . . . . . . . . . . . . . . $ 126 $ 71 $ 493 $ 1,552
Interests purchased in the secondary market (fair value):Investment grade . . . . . . . . . . . . . . . . . . . . . . . . . . . . . . . . . $ 24 $ 227 $ 60 $ 394Non-investment grade . . . . . . . . . . . . . . . . . . . . . . . . . . . . . 153 76 — 13
Total interests purchased in the secondary market(fair value) . . . . . . . . . . . . . . . . . . . . . . . . . . . . . . . . $ 177 $ 303 $ 60 $ 407
Derivative assets (fair value) . . . . . . . . . . . . . . . . . . . . . . . . . . . $ 12 $ 1,214 $ — $ 151Derivative liabilities (fair value) . . . . . . . . . . . . . . . . . . . . . . . . . $ 28 $ 23 $ — $ 392
(1) Amounts include assets transferred by unrelated transferors.
44
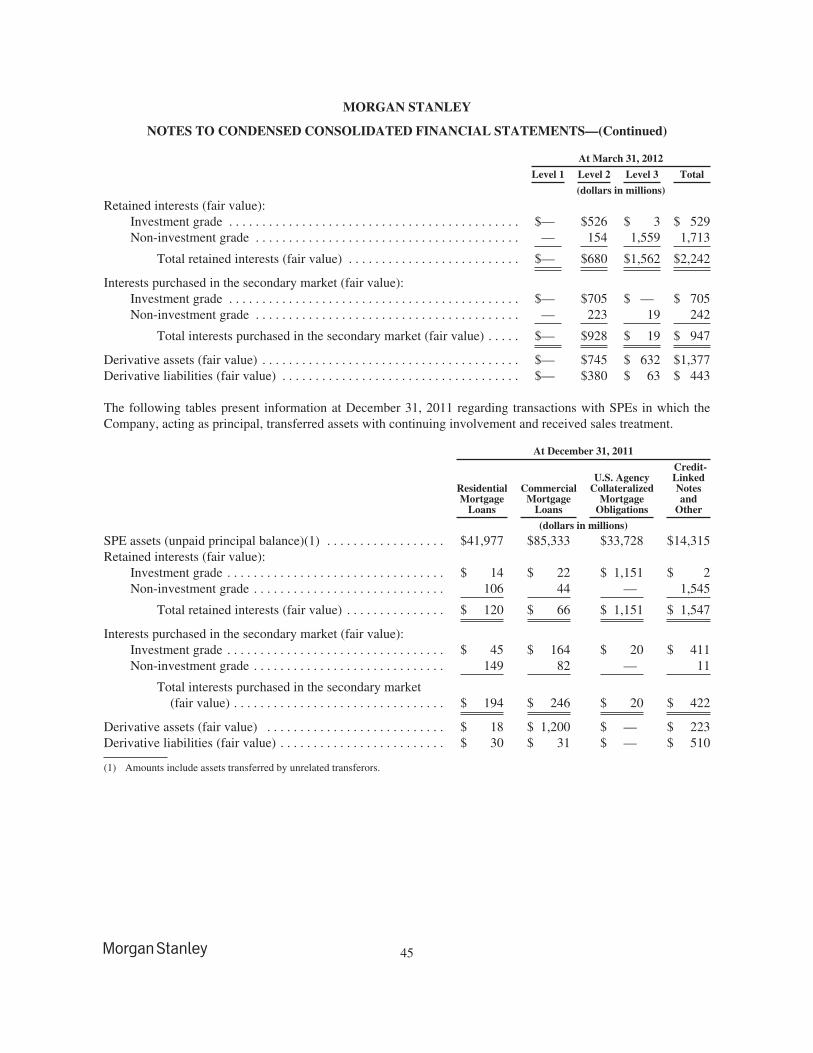
MORGAN STANLEY
NOTES TO CONDENSED CONSOLIDATED FINANCIAL STATEMENTS—(Continued)
At March 31, 2012
Level 1 Level 2 Level 3 Total
(dollars in millions)
Retained interests (fair value):Investment grade . . . . . . . . . . . . . . . . . . . . . . . . . . . . . . . . . . . . . . . . . . . . $— $526 $ 3 $ 529Non-investment grade . . . . . . . . . . . . . . . . . . . . . . . . . . . . . . . . . . . . . . . . — 154 1,559 1,713
Total retained interests (fair value) . . . . . . . . . . . . . . . . . . . . . . . . . . $— $680 $1,562 $2,242
Interests purchased in the secondary market (fair value):Investment grade . . . . . . . . . . . . . . . . . . . . . . . . . . . . . . . . . . . . . . . . . . . . $— $705 $ — $ 705Non-investment grade . . . . . . . . . . . . . . . . . . . . . . . . . . . . . . . . . . . . . . . . — 223 19 242
Total interests purchased in the secondary market (fair value) . . . . . $— $928 $ 19 $ 947
Derivative assets (fair value) . . . . . . . . . . . . . . . . . . . . . . . . . . . . . . . . . . . . . . . $— $745 $ 632 $1,377Derivative liabilities (fair value) . . . . . . . . . . . . . . . . . . . . . . . . . . . . . . . . . . . . $— $380 $ 63 $ 443
The following tables present information at December 31, 2011 regarding transactions with SPEs in which theCompany, acting as principal, transferred assets with continuing involvement and received sales treatment.
At December 31, 2011
ResidentialMortgage
Loans
CommercialMortgage
Loans
U.S. AgencyCollateralized
MortgageObligations
Credit-LinkedNotesand
Other
(dollars in millions)
SPE assets (unpaid principal balance)(1) . . . . . . . . . . . . . . . . . . $41,977 $85,333 $33,728 $14,315Retained interests (fair value):
Investment grade . . . . . . . . . . . . . . . . . . . . . . . . . . . . . . . . . $ 14 $ 22 $ 1,151 $ 2Non-investment grade . . . . . . . . . . . . . . . . . . . . . . . . . . . . . 106 44 — 1,545
Total retained interests (fair value) . . . . . . . . . . . . . . . $ 120 $ 66 $ 1,151 $ 1,547
Interests purchased in the secondary market (fair value):Investment grade . . . . . . . . . . . . . . . . . . . . . . . . . . . . . . . . . $ 45 $ 164 $ 20 $ 411Non-investment grade . . . . . . . . . . . . . . . . . . . . . . . . . . . . . 149 82 — 11
Total interests purchased in the secondary market(fair value) . . . . . . . . . . . . . . . . . . . . . . . . . . . . . . . . $ 194 $ 246 $ 20 $ 422
Derivative assets (fair value) . . . . . . . . . . . . . . . . . . . . . . . . . . . $ 18 $ 1,200 $ — $ 223Derivative liabilities (fair value) . . . . . . . . . . . . . . . . . . . . . . . . . $ 30 $ 31 $ — $ 510
(1) Amounts include assets transferred by unrelated transferors.
45
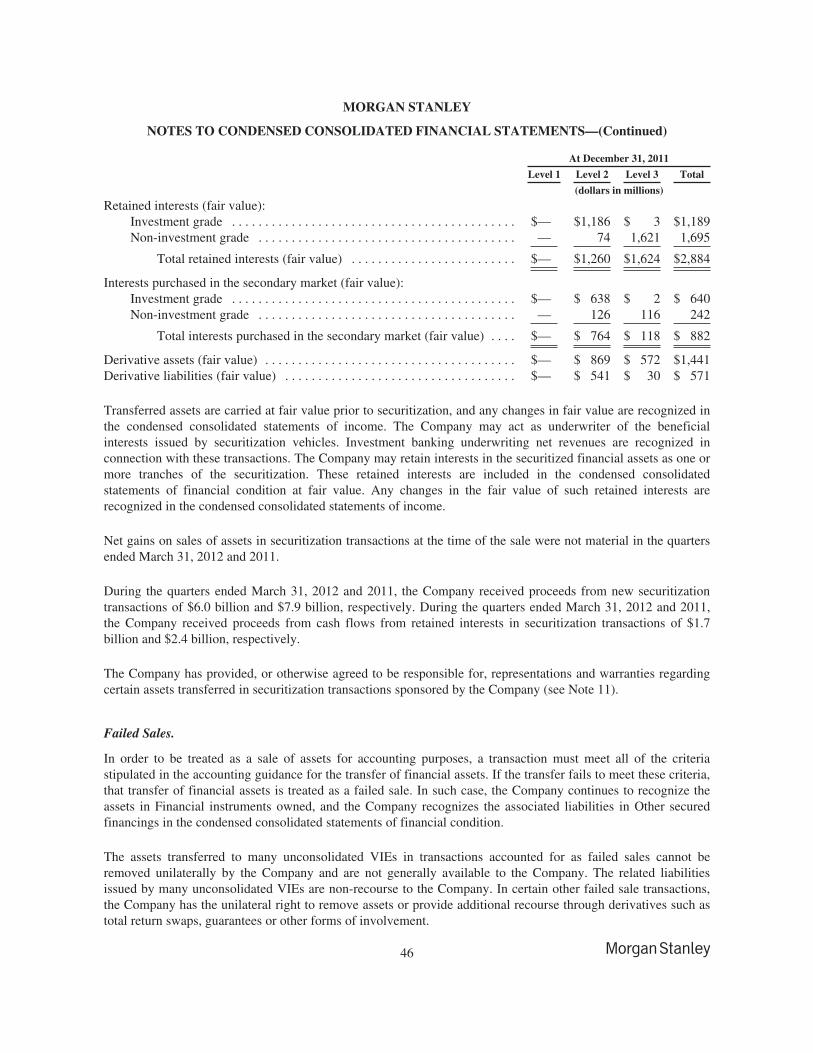
MORGAN STANLEY
NOTES TO CONDENSED CONSOLIDATED FINANCIAL STATEMENTS—(Continued)
At December 31, 2011
Level 1 Level 2 Level 3 Total
(dollars in millions)
Retained interests (fair value):Investment grade . . . . . . . . . . . . . . . . . . . . . . . . . . . . . . . . . . . . . . . . . . . $— $1,186 $ 3 $1,189Non-investment grade . . . . . . . . . . . . . . . . . . . . . . . . . . . . . . . . . . . . . . . — 74 1,621 1,695
Total retained interests (fair value) . . . . . . . . . . . . . . . . . . . . . . . . . $— $1,260 $1,624 $2,884
Interests purchased in the secondary market (fair value):Investment grade . . . . . . . . . . . . . . . . . . . . . . . . . . . . . . . . . . . . . . . . . . . $— $ 638 $ 2 $ 640Non-investment grade . . . . . . . . . . . . . . . . . . . . . . . . . . . . . . . . . . . . . . . — 126 116 242
Total interests purchased in the secondary market (fair value) . . . . $— $ 764 $ 118 $ 882
Derivative assets (fair value) . . . . . . . . . . . . . . . . . . . . . . . . . . . . . . . . . . . . . . $— $ 869 $ 572 $1,441Derivative liabilities (fair value) . . . . . . . . . . . . . . . . . . . . . . . . . . . . . . . . . . . $— $ 541 $ 30 $ 571
Transferred assets are carried at fair value prior to securitization, and any changes in fair value are recognized inthe condensed consolidated statements of income. The Company may act as underwriter of the beneficialinterests issued by securitization vehicles. Investment banking underwriting net revenues are recognized inconnection with these transactions. The Company may retain interests in the securitized financial assets as one ormore tranches of the securitization. These retained interests are included in the condensed consolidatedstatements of financial condition at fair value. Any changes in the fair value of such retained interests arerecognized in the condensed consolidated statements of income.
Net gains on sales of assets in securitization transactions at the time of the sale were not material in the quartersended March 31, 2012 and 2011.
During the quarters ended March 31, 2012 and 2011, the Company received proceeds from new securitizationtransactions of $6.0 billion and $7.9 billion, respectively. During the quarters ended March 31, 2012 and 2011,the Company received proceeds from cash flows from retained interests in securitization transactions of $1.7billion and $2.4 billion, respectively.
The Company has provided, or otherwise agreed to be responsible for, representations and warranties regardingcertain assets transferred in securitization transactions sponsored by the Company (see Note 11).
Failed Sales.
In order to be treated as a sale of assets for accounting purposes, a transaction must meet all of the criteriastipulated in the accounting guidance for the transfer of financial assets. If the transfer fails to meet these criteria,that transfer of financial assets is treated as a failed sale. In such case, the Company continues to recognize theassets in Financial instruments owned, and the Company recognizes the associated liabilities in Other securedfinancings in the condensed consolidated statements of financial condition.
The assets transferred to many unconsolidated VIEs in transactions accounted for as failed sales cannot beremoved unilaterally by the Company and are not generally available to the Company. The related liabilitiesissued by many unconsolidated VIEs are non-recourse to the Company. In certain other failed sale transactions,the Company has the unilateral right to remove assets or provide additional recourse through derivatives such astotal return swaps, guarantees or other forms of involvement.
46
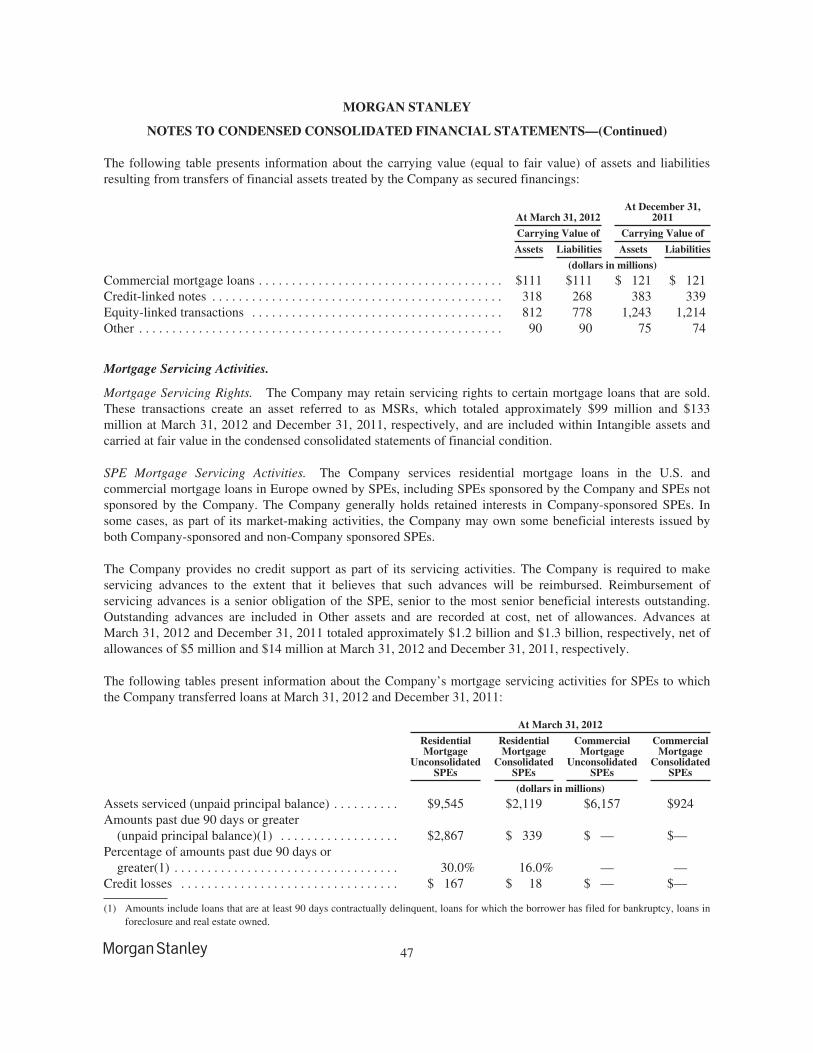
MORGAN STANLEY
NOTES TO CONDENSED CONSOLIDATED FINANCIAL STATEMENTS—(Continued)
The following table presents information about the carrying value (equal to fair value) of assets and liabilitiesresulting from transfers of financial assets treated by the Company as secured financings:
At March 31, 2012At December 31,
2011
Carrying Value of Carrying Value of
Assets Liabilities Assets Liabilities
(dollars in millions)
Commercial mortgage loans . . . . . . . . . . . . . . . . . . . . . . . . . . . . . . . . . . . . . $111 $111 $ 121 $ 121Credit-linked notes . . . . . . . . . . . . . . . . . . . . . . . . . . . . . . . . . . . . . . . . . . . . 318 268 383 339Equity-linked transactions . . . . . . . . . . . . . . . . . . . . . . . . . . . . . . . . . . . . . . 812 778 1,243 1,214Other . . . . . . . . . . . . . . . . . . . . . . . . . . . . . . . . . . . . . . . . . . . . . . . . . . . . . . . 90 90 75 74
Mortgage Servicing Activities.
Mortgage Servicing Rights. The Company may retain servicing rights to certain mortgage loans that are sold.These transactions create an asset referred to as MSRs, which totaled approximately $99 million and $133million at March 31, 2012 and December 31, 2011, respectively, and are included within Intangible assets andcarried at fair value in the condensed consolidated statements of financial condition.
SPE Mortgage Servicing Activities. The Company services residential mortgage loans in the U.S. andcommercial mortgage loans in Europe owned by SPEs, including SPEs sponsored by the Company and SPEs notsponsored by the Company. The Company generally holds retained interests in Company-sponsored SPEs. Insome cases, as part of its market-making activities, the Company may own some beneficial interests issued byboth Company-sponsored and non-Company sponsored SPEs.
The Company provides no credit support as part of its servicing activities. The Company is required to makeservicing advances to the extent that it believes that such advances will be reimbursed. Reimbursement ofservicing advances is a senior obligation of the SPE, senior to the most senior beneficial interests outstanding.Outstanding advances are included in Other assets and are recorded at cost, net of allowances. Advances atMarch 31, 2012 and December 31, 2011 totaled approximately $1.2 billion and $1.3 billion, respectively, net ofallowances of $5 million and $14 million at March 31, 2012 and December 31, 2011, respectively.
The following tables present information about the Company’s mortgage servicing activities for SPEs to whichthe Company transferred loans at March 31, 2012 and December 31, 2011:
At March 31, 2012
ResidentialMortgage
UnconsolidatedSPEs
ResidentialMortgage
ConsolidatedSPEs
CommercialMortgage
UnconsolidatedSPEs
CommercialMortgage
ConsolidatedSPEs
(dollars in millions)
Assets serviced (unpaid principal balance) . . . . . . . . . . $9,545 $2,119 $6,157 $924Amounts past due 90 days or greater
(unpaid principal balance)(1) . . . . . . . . . . . . . . . . . . $2,867 $ 339 $ — $—Percentage of amounts past due 90 days or
greater(1) . . . . . . . . . . . . . . . . . . . . . . . . . . . . . . . . . . 30.0% 16.0% — —Credit losses . . . . . . . . . . . . . . . . . . . . . . . . . . . . . . . . . $ 167 $ 18 $ — $—
(1) Amounts include loans that are at least 90 days contractually delinquent, loans for which the borrower has filed for bankruptcy, loans inforeclosure and real estate owned.
47
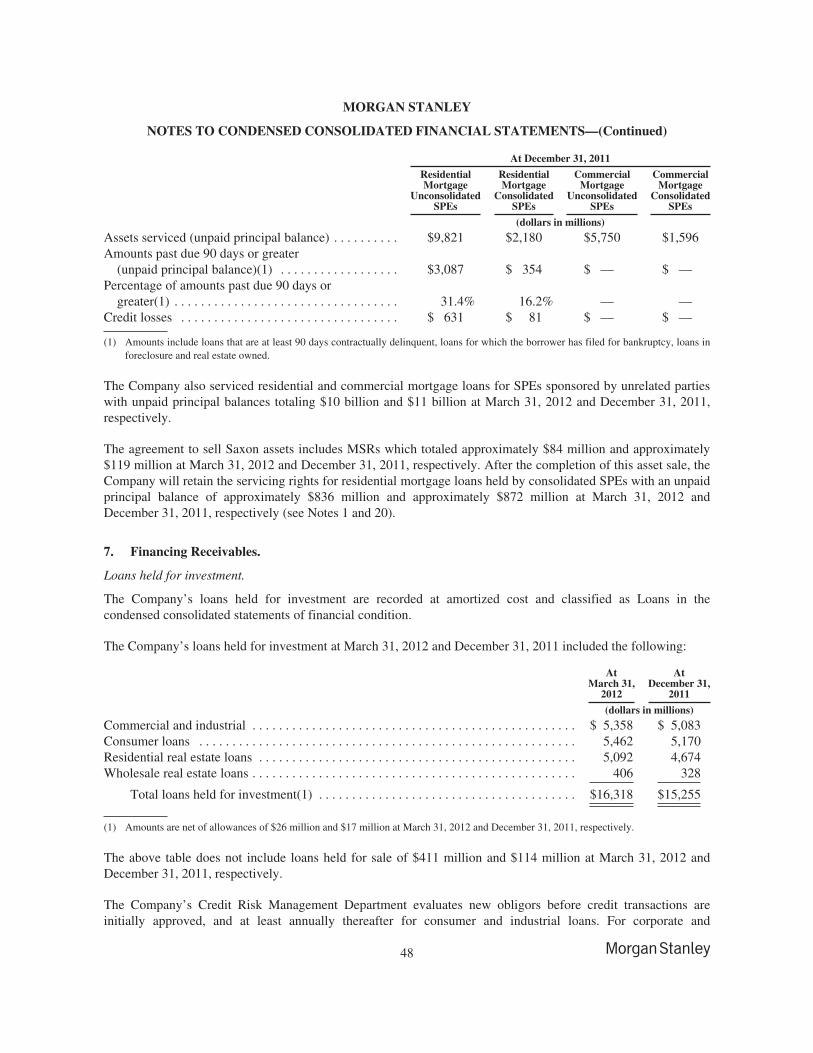
MORGAN STANLEY
NOTES TO CONDENSED CONSOLIDATED FINANCIAL STATEMENTS—(Continued)
At December 31, 2011
ResidentialMortgage
UnconsolidatedSPEs
ResidentialMortgage
ConsolidatedSPEs
CommercialMortgage
UnconsolidatedSPEs
CommercialMortgage
ConsolidatedSPEs
(dollars in millions)
Assets serviced (unpaid principal balance) . . . . . . . . . . $9,821 $2,180 $5,750 $1,596Amounts past due 90 days or greater
(unpaid principal balance)(1) . . . . . . . . . . . . . . . . . . $3,087 $ 354 $ — $ —Percentage of amounts past due 90 days or
greater(1) . . . . . . . . . . . . . . . . . . . . . . . . . . . . . . . . . . 31.4% 16.2% — —Credit losses . . . . . . . . . . . . . . . . . . . . . . . . . . . . . . . . . $ 631 $ 81 $ — $ —
(1) Amounts include loans that are at least 90 days contractually delinquent, loans for which the borrower has filed for bankruptcy, loans inforeclosure and real estate owned.
The Company also serviced residential and commercial mortgage loans for SPEs sponsored by unrelated partieswith unpaid principal balances totaling $10 billion and $11 billion at March 31, 2012 and December 31, 2011,respectively.
The agreement to sell Saxon assets includes MSRs which totaled approximately $84 million and approximately$119 million at March 31, 2012 and December 31, 2011, respectively. After the completion of this asset sale, theCompany will retain the servicing rights for residential mortgage loans held by consolidated SPEs with an unpaidprincipal balance of approximately $836 million and approximately $872 million at March 31, 2012 andDecember 31, 2011, respectively (see Notes 1 and 20).
7. Financing Receivables.
Loans held for investment.
The Company’s loans held for investment are recorded at amortized cost and classified as Loans in thecondensed consolidated statements of financial condition.
The Company’s loans held for investment at March 31, 2012 and December 31, 2011 included the following:
AtMarch 31,
2012
AtDecember 31,
2011
(dollars in millions)
Commercial and industrial . . . . . . . . . . . . . . . . . . . . . . . . . . . . . . . . . . . . . . . . . . . . . . . . . $ 5,358 $ 5,083Consumer loans . . . . . . . . . . . . . . . . . . . . . . . . . . . . . . . . . . . . . . . . . . . . . . . . . . . . . . . . . 5,462 5,170Residential real estate loans . . . . . . . . . . . . . . . . . . . . . . . . . . . . . . . . . . . . . . . . . . . . . . . . 5,092 4,674Wholesale real estate loans . . . . . . . . . . . . . . . . . . . . . . . . . . . . . . . . . . . . . . . . . . . . . . . . . 406 328
Total loans held for investment(1) . . . . . . . . . . . . . . . . . . . . . . . . . . . . . . . . . . . . . . . $16,318 $15,255
(1) Amounts are net of allowances of $26 million and $17 million at March 31, 2012 and December 31, 2011, respectively.
The above table does not include loans held for sale of $411 million and $114 million at March 31, 2012 andDecember 31, 2011, respectively.
The Company’s Credit Risk Management Department evaluates new obligors before credit transactions areinitially approved, and at least annually thereafter for consumer and industrial loans. For corporate and
48
MORGAN STANLEY
NOTES TO CONDENSED CONSOLIDATED FINANCIAL STATEMENTS—(Continued)
commercial loans, credit evaluations typically involve the evaluation of financial statements, assessment ofleverage, liquidity, capital strength, asset composition and quality, market capitalization and access to capitalmarkets, cash flow projections and debt service requirements, and the adequacy of collateral, if applicable. TheCompany’s Credit Risk Management Department will also evaluate strategy, market position, industry dynamics,obligor’s management and other factors that could affect the obligor’s risk profile. For residential real estate andconsumer loans, the initial credit evaluation includes, but is not limited to, review of the obligor’s income, networth, liquidity, collateral, loan-to-value ratio, and credit bureau information. Subsequent credit monitoring forresidential real estate loans is performed at the portfolio level. Consumer loan collateral values are monitored onan ongoing basis.
At March 31, 2012, the Company collectively evaluated for impairment, gross of the allowance, commercial andindustrial loans, consumer loans, residential real estate loans and wholesale real estate loans of $5,326 million,$5,465 million, $5,094 million and $373 million, respectively. The Company individually evaluated forimpairment, gross of the allowance, commercial and industrial loans and wholesale real estate loans of $52million and $34 million, respectively. Commercial and industrial loans of approximately $31 million andwholesale real estate loans of approximately $34 million were impaired at March 31, 2012. Approximately 99%of the Company’s loan portfolio was current at March 31, 2012.
At December 31, 2011, the Company collectively evaluated for impairment gross commercial and industrialloans, consumer loans, residential real estate loans and wholesale real estate loans of $4,934 million, $5,072million, $4,675 million and $278 million, respectively. The Company individually evaluated for impairmentgross commercial and industrial loans, consumer and wholesale real estate loans of $163 million, $100 millionand $50 million, respectively. Commercial and industrial loans of approximately $33 million and wholesale realestate loans of approximately $50 million were impaired at December 31, 2011. Approximately 99% of theCompany’s loan portfolio was current at December 31, 2011.
The Company assigned an internal grade of “doubtful” to certain commercial asset-backed and wholesale realestate loans totaling $35 million and $87 million at March 31, 2012 and December 31, 2011, respectively.Doubtful loans can be classified as current if the borrower is making payments in accordance with the loanagreement. The Company assigned an internal grade of “pass” to the majority of its remaining loan portfolio.
For a description of the Company’s loan portfolio and credit quality indicators utilized in its credit monitoringprocess, see Note 8 to the consolidated financial statements for the year ended December 31, 2011 included inthe Form 10-K.
Employee Loans.
Employee loans are granted primarily in conjunction with a program established in the Global WealthManagement Group business segment to retain and recruit certain employees. These loans are recorded inReceivables—Fees, interest and other in the consolidated statements of financial condition. These loans are fullrecourse, generally require periodic payments and have repayment terms ranging from one to 12 years. TheCompany establishes a reserve for loan amounts it does not consider recoverable from terminated employees,which is recorded in Compensation and benefits expense. At March 31, 2012, the Company had $6,053 millionof employee loans, net of an allowance of approximately $131 million. At December 31, 2011, the Company had$5,610 million of employee loans, net of an allowance of approximately $119 million.
The Company has also granted loans to other employees primarily in conjunction with certain after-tax leveragedinvestment arrangements. At March 31, 2012, the balance of these loans was $167 million, net of an allowance of
49
MORGAN STANLEY
NOTES TO CONDENSED CONSOLIDATED FINANCIAL STATEMENTS—(Continued)
approximately $131 million. At December 31, 2011, the balance of these loans was $162 million, net of anallowance of approximately $133 million. The Company establishes a reserve for non-recourse loan amounts notrecoverable from employees, which is recorded in Other expense.
Collateralized Transactions.
In certain instances, the Company enters into reverse repurchase agreements and securities borrowed transactionsto acquire securities to cover short positions, to settle other securities obligations and to accommodate customers’needs. The Company also engages in securities financing transactions for customers through margin lending (seeNote 5).
Servicing Advances.
As part of its servicing activities, the Company may make servicing advances to the extent that it believes thatsuch advances will be reimbursed (see Note 6).
8. Goodwill and Net Intangible Assets.
The Company tests goodwill for impairment on an annual basis and on an interim basis when certain events orcircumstances exist. The Company tests for impairment at the reporting unit level, which is generally at the levelof or one level below its business segments. For both the annual and interim tests, the Company has the option tofirst assess qualitative factors to determine whether the existence of events or circumstances leads to adetermination that it is more likely than not that the fair value of a reporting unit is less than its carrying amount.If after assessing the totality of events or circumstances, the Company determines it is more likely than not thatthe fair value of a reporting unit is greater than its carrying amount, then performing the two-step impairment testis not required. However, if the Company concludes otherwise, then it is required to perform the first step of thetwo-step impairment test. Goodwill impairment is determined by comparing the estimated fair value of areporting unit with its respective carrying value. If the estimated fair value exceeds the carrying value, goodwillat the reporting unit level is not deemed to be impaired. If the estimated fair value is below carrying value,however, further analysis is required to determine the amount of the impairment. Additionally, if the carryingvalue of a reporting unit is zero or a negative value and it is determined that it is more likely than not thegoodwill is impaired, further analysis is required. The estimated fair values of the reporting units are derivedbased on valuation techniques the Company believes market participants would use for each of the reportingunits.
The estimated fair values of the reporting units are generally determined utilizing methodologies that incorporateprice-to-book and price-to-earnings multiples of certain comparable companies. The Company also utilizes adiscounted cash flow methodology for certain reporting units.
The Company completed its annual goodwill impairment testing at July 1, 2011. The Company’s testing did notindicate any goodwill impairment. Due to the volatility in the equity markets, the economic outlook and theCompany’s common shares trading below book value during the quarter ended March 31, 2012, the Companyperformed additional impairment testing at March 31, 2012, which did not result in any goodwill impairment.Adverse market or economic events could result in impairment charges in future periods.
50
MORGAN STANLEY
NOTES TO CONDENSED CONSOLIDATED FINANCIAL STATEMENTS—(Continued)
Goodwill.
Changes in the carrying amount of the Company’s goodwill, net of accumulated impairment losses for thequarter ended March 31, 2012, were as follows:
InstitutionalSecurities
Global WealthManagement
GroupAsset
Management Total
(dollars in millions)Goodwill at December 31, 2011(1) . . . . . . . . . . . . . . . . . . . . . $330 $5,616 $740 $6,686Foreign currency translation adjustments and other . . . . . . . . . 14 — — 14
Goodwill at March 31, 2012(1) . . . . . . . . . . . . . . . . . . . . . . . . $344 $5,616 $740 $6,700
(1) The amount of the Company’s goodwill before accumulated impairments of $700 million, which included $673 million related to theInstitutional Securities business segment and $27 million related to the Asset Management business segment, was $7,400 million and$7,386 million at March 31, 2012 and December 31, 2011, respectively.
Net Intangible Assets.
Changes in the carrying amount of the Company’s intangible assets for the quarter ended March 31, 2012were as follows:
InstitutionalSecurities
Global WealthManagement
GroupAsset
Management Total
(dollars in millions)Amortizable net intangible assets at December 31, 2011 . . . $229 $3,641 $ 2 $3,872Mortgage servicing rights (see Note 6) . . . . . . . . . . . . . . . . . . . 122 11 — 133Indefinite-lived intangible assets . . . . . . . . . . . . . . . . . . . . . . . . — 280 — 280
Net intangible assets at December 31, 2011 . . . . . . . . . . . . . . $351 $3,932 $ 2 $4,285
Amortizable net intangible assets at December 31, 2011 . . . $229 $3,641 $ 2 $3,872Foreign currency translation adjustments and other . . . . . . . . . 3 — — 3Amortization expense . . . . . . . . . . . . . . . . . . . . . . . . . . . . . . . . (4) (80) — (84)Impairment losses(1) . . . . . . . . . . . . . . . . . . . . . . . . . . . . . . . . . (2) — — (2)Intangible assets acquired during the period . . . . . . . . . . . . . . . 2 — — 2
Amortizable net intangible assets at March 31, 2012 . . . . . . 228 3,561 2 3,791Mortgage servicing rights (see Note 6) . . . . . . . . . . . . . . . . . . . 87 12 — 99Indefinite-lived intangible assets . . . . . . . . . . . . . . . . . . . . . . . . — 280 — 280
Net intangible assets at March 31, 2012 . . . . . . . . . . . . . . . . $315 $3,853 $ 2 $4,170
(1) Impairment losses are recorded within Other expenses.
9. Long-Term Borrowings and Other Secured Financings.
The Company’s long-term borrowings included the following components:
At March 31,2012
At December 31,2011
(dollars in millions)Senior debt . . . . . . . . . . . . . . . . . . . . . . . . . . . . . . . . . . . . . . . . . . . . . . . . . . . . . . . . . $167,986 $175,471Subordinated debt . . . . . . . . . . . . . . . . . . . . . . . . . . . . . . . . . . . . . . . . . . . . . . . . . . . . 3,899 3,910Junior subordinated debentures . . . . . . . . . . . . . . . . . . . . . . . . . . . . . . . . . . . . . . . . . 4,838 4,853
Total . . . . . . . . . . . . . . . . . . . . . . . . . . . . . . . . . . . . . . . . . . . . . . . . . . . . . . . . . . $176,723 $184,234
51
MORGAN STANLEY
NOTES TO CONDENSED CONSOLIDATED FINANCIAL STATEMENTS—(Continued)
During the quarter ended March 31, 2012, the Company issued notes with a principal amount of approximately$5 billion. During the quarter ended March 31, 2012, approximately $16 billion of notes were matured or retired.
The weighted average maturity of the Company’s long-term borrowings, based upon stated maturity dates, wasapproximately 5.3 years and 5.0 years at March 31, 2012 and December 31, 2011, respectively.
FDIC’s Temporary Liquidity Guarantee Program.
At March 31, 2012 and December 31, 2011, the Company had long-term debt outstanding of $4.7 billion and$12.1 billion, respectively, under the Temporary Liquidity Guarantee Program (“TLGP”). The issuance of debtunder the TLPG expired on December 31, 2010, but the existing long-term debt outstanding is guaranteed untilJune 30, 2012. These borrowings are senior unsecured debt obligations of the Company and guaranteed by theFDIC under the TLGP. The FDIC has concluded that the guarantee is backed by the full faith and credit of theU.S. government.
Other Secured Financings.
Other secured financings include the liabilities related to transfers of financial assets that are accounted for asfinancings rather than sales, consolidated VIEs where the Company is deemed to be the primary beneficiary,pledged commodities, certain equity-linked notes and other secured borrowings. See Note 6 for furtherinformation on other secured financings related to variable interest entities and securitization activities.
The Company’s other secured financings consisted of the following:
At March 31,2012
At December 31,2011
(dollars in millions)
Secured financings with original maturities greater than one year . . . . . . . . . . . . . . $19,883 $18,696Secured financings with original maturities one year or less . . . . . . . . . . . . . . . . . . . 305 275Failed sales(1) . . . . . . . . . . . . . . . . . . . . . . . . . . . . . . . . . . . . . . . . . . . . . . . . . . . . . . 1,247 1,748
Total(2) . . . . . . . . . . . . . . . . . . . . . . . . . . . . . . . . . . . . . . . . . . . . . . . . . . . . . . . . $21,435 $20,719
(1) For more information on failed sales, see Note 6.(2) Amounts include $13,081 million and $14,594 million at fair value at March 31, 2012 and December 31, 2011, respectively.
10. Derivative Instruments and Hedging Activities.
The Company trades, makes markets and takes proprietary positions globally in listed futures, OTC swaps,forwards, options and other derivatives referencing, among other things, interest rates, currencies, investmentgrade and non-investment grade corporate credits, loans, bonds, U.S. and other sovereign securities, emergingmarket bonds and loans, credit indices, asset-backed security indices, property indices, mortgage-related andother asset-backed securities, and real estate loan products. The Company uses these instruments for trading,foreign currency exposure management and asset and liability management.
The Company manages its trading positions by employing a variety of risk mitigation strategies. These strategiesinclude diversification of risk exposures and hedging. Hedging activities consist of the purchase or sale ofpositions in related securities and financial instruments, including a variety of derivative products (e.g., futures,forwards, swaps and options). The Company manages the market risk associated with its trading activities on aCompany-wide basis, on a worldwide trading division level and on an individual product basis.
52
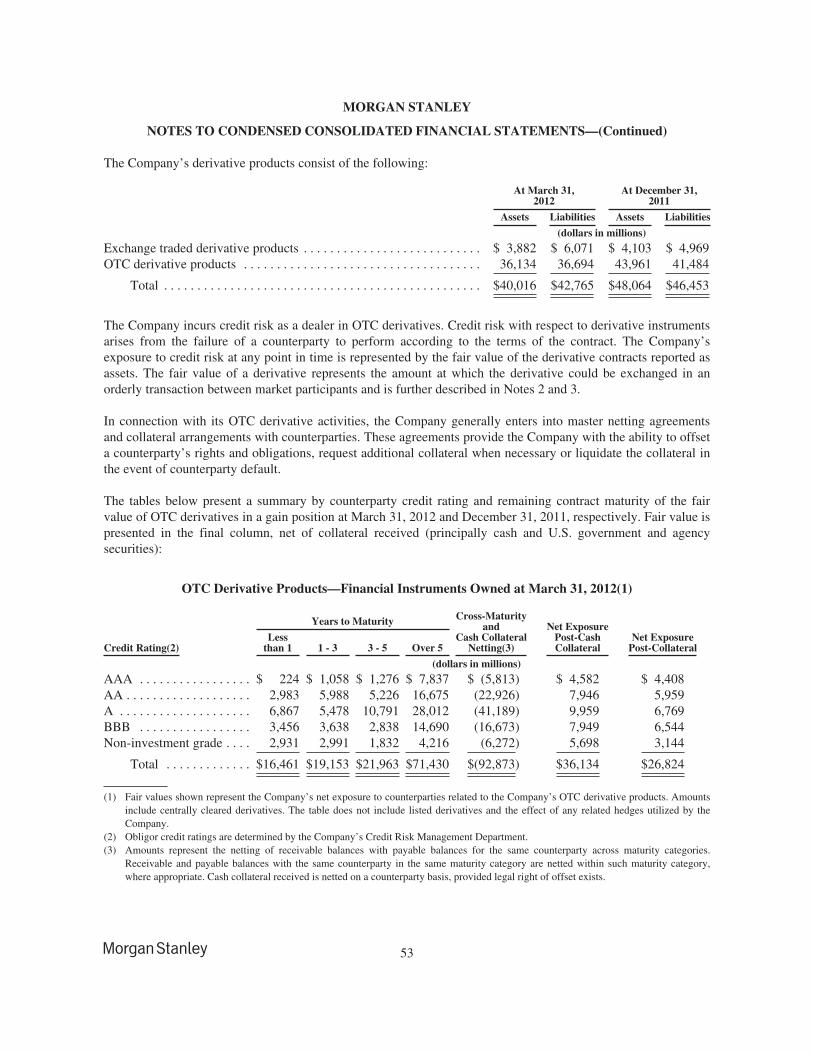
MORGAN STANLEY
NOTES TO CONDENSED CONSOLIDATED FINANCIAL STATEMENTS—(Continued)
The Company’s derivative products consist of the following:
At March 31,2012
At December 31,2011
Assets Liabilities Assets Liabilities
(dollars in millions)
Exchange traded derivative products . . . . . . . . . . . . . . . . . . . . . . . . . . . $ 3,882 $ 6,071 $ 4,103 $ 4,969OTC derivative products . . . . . . . . . . . . . . . . . . . . . . . . . . . . . . . . . . . . 36,134 36,694 43,961 41,484
Total . . . . . . . . . . . . . . . . . . . . . . . . . . . . . . . . . . . . . . . . . . . . . . . . $40,016 $42,765 $48,064 $46,453
The Company incurs credit risk as a dealer in OTC derivatives. Credit risk with respect to derivative instrumentsarises from the failure of a counterparty to perform according to the terms of the contract. The Company’sexposure to credit risk at any point in time is represented by the fair value of the derivative contracts reported asassets. The fair value of a derivative represents the amount at which the derivative could be exchanged in anorderly transaction between market participants and is further described in Notes 2 and 3.
In connection with its OTC derivative activities, the Company generally enters into master netting agreementsand collateral arrangements with counterparties. These agreements provide the Company with the ability to offseta counterparty’s rights and obligations, request additional collateral when necessary or liquidate the collateral inthe event of counterparty default.
The tables below present a summary by counterparty credit rating and remaining contract maturity of the fairvalue of OTC derivatives in a gain position at March 31, 2012 and December 31, 2011, respectively. Fair value ispresented in the final column, net of collateral received (principally cash and U.S. government and agencysecurities):
OTC Derivative Products—Financial Instruments Owned at March 31, 2012(1)
Years to Maturity Cross-Maturityand
Cash CollateralNetting(3)
Net ExposurePost-CashCollateral
Net ExposurePost-CollateralCredit Rating(2)
Lessthan 1 1 - 3 3 - 5 Over 5
(dollars in millions)
AAA . . . . . . . . . . . . . . . . . $ 224 $ 1,058 $ 1,276 $ 7,837 $ (5,813) $ 4,582 $ 4,408AA . . . . . . . . . . . . . . . . . . . 2,983 5,988 5,226 16,675 (22,926) 7,946 5,959A . . . . . . . . . . . . . . . . . . . . 6,867 5,478 10,791 28,012 (41,189) 9,959 6,769BBB . . . . . . . . . . . . . . . . . 3,456 3,638 2,838 14,690 (16,673) 7,949 6,544Non-investment grade . . . . 2,931 2,991 1,832 4,216 (6,272) 5,698 3,144
Total . . . . . . . . . . . . . $16,461 $19,153 $21,963 $71,430 $(92,873) $36,134 $26,824
(1) Fair values shown represent the Company’s net exposure to counterparties related to the Company’s OTC derivative products. Amountsinclude centrally cleared derivatives. The table does not include listed derivatives and the effect of any related hedges utilized by theCompany.
(2) Obligor credit ratings are determined by the Company’s Credit Risk Management Department.(3) Amounts represent the netting of receivable balances with payable balances for the same counterparty across maturity categories.
Receivable and payable balances with the same counterparty in the same maturity category are netted within such maturity category,where appropriate. Cash collateral received is netted on a counterparty basis, provided legal right of offset exists.
53
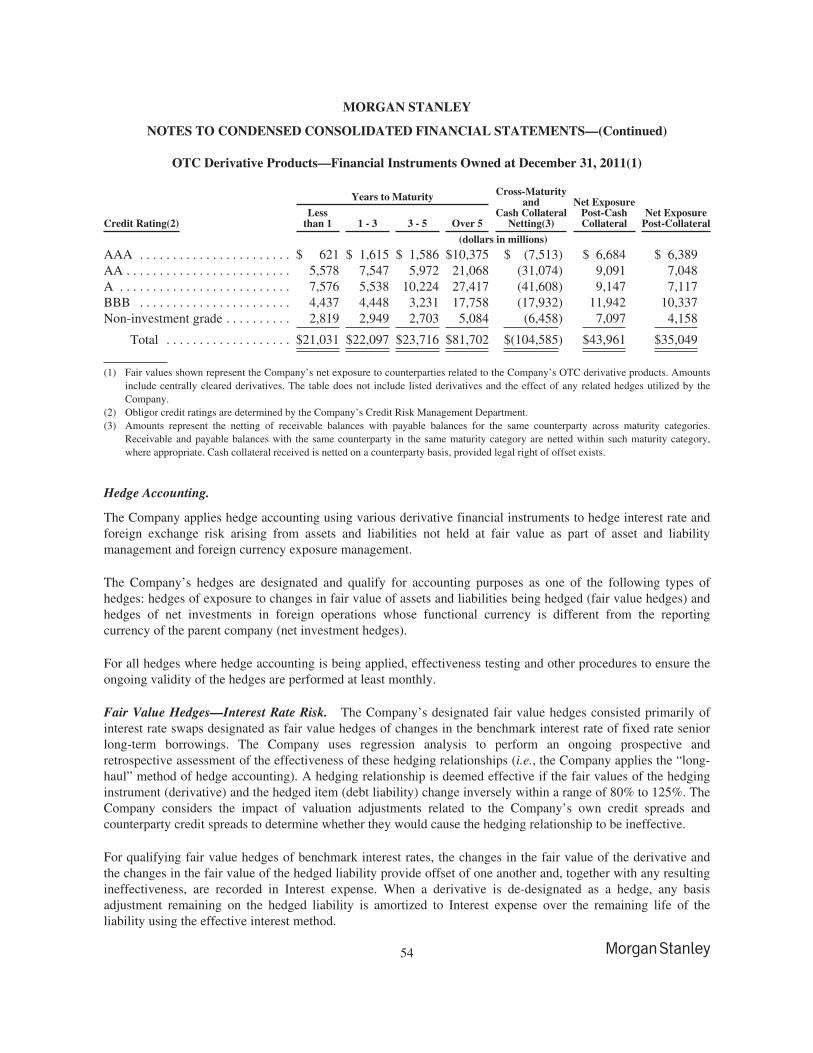
MORGAN STANLEY
NOTES TO CONDENSED CONSOLIDATED FINANCIAL STATEMENTS—(Continued)
OTC Derivative Products—Financial Instruments Owned at December 31, 2011(1)
Years to Maturity Cross-Maturityand
Cash CollateralNetting(3)
Net ExposurePost-CashCollateral
Net ExposurePost-CollateralCredit Rating(2)
Lessthan 1 1 - 3 3 - 5 Over 5
(dollars in millions)
AAA . . . . . . . . . . . . . . . . . . . . . . . $ 621 $ 1,615 $ 1,586 $10,375 $ (7,513) $ 6,684 $ 6,389AA . . . . . . . . . . . . . . . . . . . . . . . . . 5,578 7,547 5,972 21,068 (31,074) 9,091 7,048A . . . . . . . . . . . . . . . . . . . . . . . . . . 7,576 5,538 10,224 27,417 (41,608) 9,147 7,117BBB . . . . . . . . . . . . . . . . . . . . . . . 4,437 4,448 3,231 17,758 (17,932) 11,942 10,337Non-investment grade . . . . . . . . . . 2,819 2,949 2,703 5,084 (6,458) 7,097 4,158
Total . . . . . . . . . . . . . . . . . . . $21,031 $22,097 $23,716 $81,702 $(104,585) $43,961 $35,049
(1) Fair values shown represent the Company’s net exposure to counterparties related to the Company’s OTC derivative products. Amountsinclude centrally cleared derivatives. The table does not include listed derivatives and the effect of any related hedges utilized by theCompany.
(2) Obligor credit ratings are determined by the Company’s Credit Risk Management Department.(3) Amounts represent the netting of receivable balances with payable balances for the same counterparty across maturity categories.
Receivable and payable balances with the same counterparty in the same maturity category are netted within such maturity category,where appropriate. Cash collateral received is netted on a counterparty basis, provided legal right of offset exists.
Hedge Accounting.
The Company applies hedge accounting using various derivative financial instruments to hedge interest rate andforeign exchange risk arising from assets and liabilities not held at fair value as part of asset and liabilitymanagement and foreign currency exposure management.
The Company’s hedges are designated and qualify for accounting purposes as one of the following types ofhedges: hedges of exposure to changes in fair value of assets and liabilities being hedged (fair value hedges) andhedges of net investments in foreign operations whose functional currency is different from the reportingcurrency of the parent company (net investment hedges).
For all hedges where hedge accounting is being applied, effectiveness testing and other procedures to ensure theongoing validity of the hedges are performed at least monthly.
Fair Value Hedges—Interest Rate Risk. The Company’s designated fair value hedges consisted primarily ofinterest rate swaps designated as fair value hedges of changes in the benchmark interest rate of fixed rate seniorlong-term borrowings. The Company uses regression analysis to perform an ongoing prospective andretrospective assessment of the effectiveness of these hedging relationships (i.e., the Company applies the “long-haul” method of hedge accounting). A hedging relationship is deemed effective if the fair values of the hedginginstrument (derivative) and the hedged item (debt liability) change inversely within a range of 80% to 125%. TheCompany considers the impact of valuation adjustments related to the Company’s own credit spreads andcounterparty credit spreads to determine whether they would cause the hedging relationship to be ineffective.
For qualifying fair value hedges of benchmark interest rates, the changes in the fair value of the derivative andthe changes in the fair value of the hedged liability provide offset of one another and, together with any resultingineffectiveness, are recorded in Interest expense. When a derivative is de-designated as a hedge, any basisadjustment remaining on the hedged liability is amortized to Interest expense over the remaining life of theliability using the effective interest method.
54
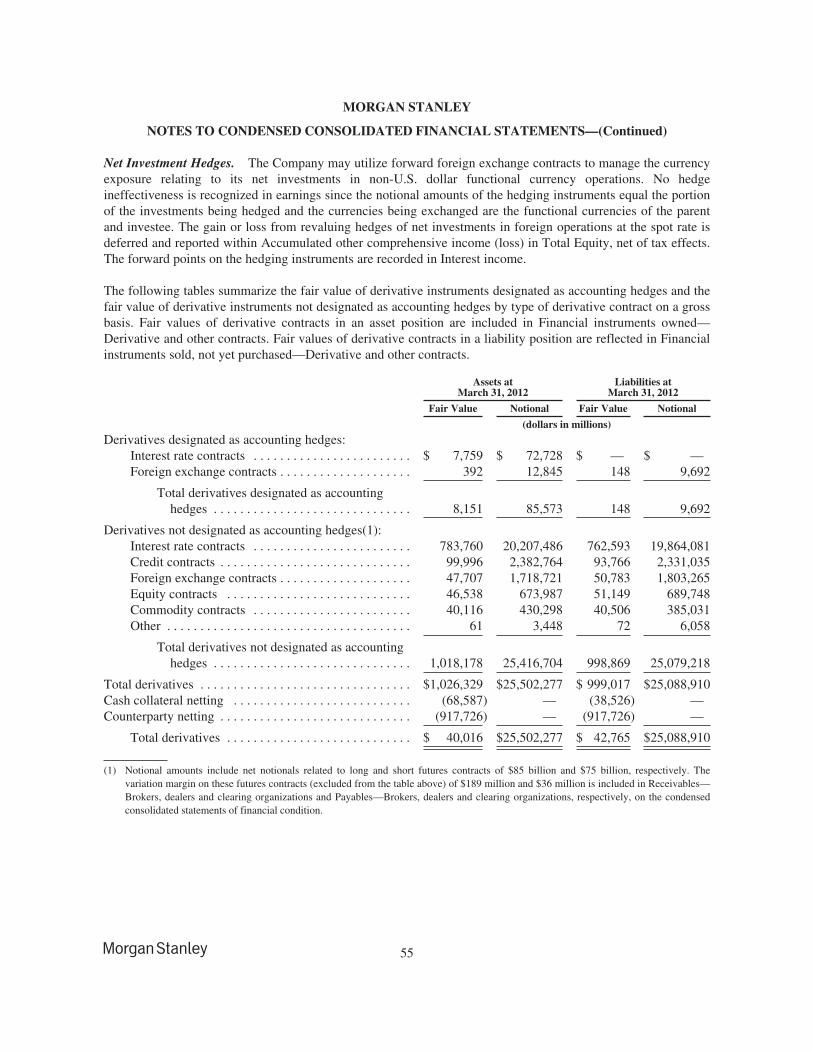
MORGAN STANLEY
NOTES TO CONDENSED CONSOLIDATED FINANCIAL STATEMENTS—(Continued)
Net Investment Hedges. The Company may utilize forward foreign exchange contracts to manage the currencyexposure relating to its net investments in non-U.S. dollar functional currency operations. No hedgeineffectiveness is recognized in earnings since the notional amounts of the hedging instruments equal the portionof the investments being hedged and the currencies being exchanged are the functional currencies of the parentand investee. The gain or loss from revaluing hedges of net investments in foreign operations at the spot rate isdeferred and reported within Accumulated other comprehensive income (loss) in Total Equity, net of tax effects.The forward points on the hedging instruments are recorded in Interest income.
The following tables summarize the fair value of derivative instruments designated as accounting hedges and thefair value of derivative instruments not designated as accounting hedges by type of derivative contract on a grossbasis. Fair values of derivative contracts in an asset position are included in Financial instruments owned—Derivative and other contracts. Fair values of derivative contracts in a liability position are reflected in Financialinstruments sold, not yet purchased—Derivative and other contracts.
Assets atMarch 31, 2012
Liabilities atMarch 31, 2012
Fair Value Notional Fair Value Notional
(dollars in millions)
Derivatives designated as accounting hedges:Interest rate contracts . . . . . . . . . . . . . . . . . . . . . . . . $ 7,759 $ 72,728 $ — $ —Foreign exchange contracts . . . . . . . . . . . . . . . . . . . . 392 12,845 148 9,692
Total derivatives designated as accountinghedges . . . . . . . . . . . . . . . . . . . . . . . . . . . . . . 8,151 85,573 148 9,692
Derivatives not designated as accounting hedges(1):Interest rate contracts . . . . . . . . . . . . . . . . . . . . . . . . 783,760 20,207,486 762,593 19,864,081Credit contracts . . . . . . . . . . . . . . . . . . . . . . . . . . . . . 99,996 2,382,764 93,766 2,331,035Foreign exchange contracts . . . . . . . . . . . . . . . . . . . . 47,707 1,718,721 50,783 1,803,265Equity contracts . . . . . . . . . . . . . . . . . . . . . . . . . . . . 46,538 673,987 51,149 689,748Commodity contracts . . . . . . . . . . . . . . . . . . . . . . . . 40,116 430,298 40,506 385,031Other . . . . . . . . . . . . . . . . . . . . . . . . . . . . . . . . . . . . . 61 3,448 72 6,058
Total derivatives not designated as accountinghedges . . . . . . . . . . . . . . . . . . . . . . . . . . . . . . 1,018,178 25,416,704 998,869 25,079,218
Total derivatives . . . . . . . . . . . . . . . . . . . . . . . . . . . . . . . . $1,026,329 $25,502,277 $ 999,017 $25,088,910Cash collateral netting . . . . . . . . . . . . . . . . . . . . . . . . . . . (68,587) — (38,526) —Counterparty netting . . . . . . . . . . . . . . . . . . . . . . . . . . . . . (917,726) — (917,726) —
Total derivatives . . . . . . . . . . . . . . . . . . . . . . . . . . . . $ 40,016 $25,502,277 $ 42,765 $25,088,910
(1) Notional amounts include net notionals related to long and short futures contracts of $85 billion and $75 billion, respectively. Thevariation margin on these futures contracts (excluded from the table above) of $189 million and $36 million is included in Receivables—Brokers, dealers and clearing organizations and Payables—Brokers, dealers and clearing organizations, respectively, on the condensedconsolidated statements of financial condition.
55
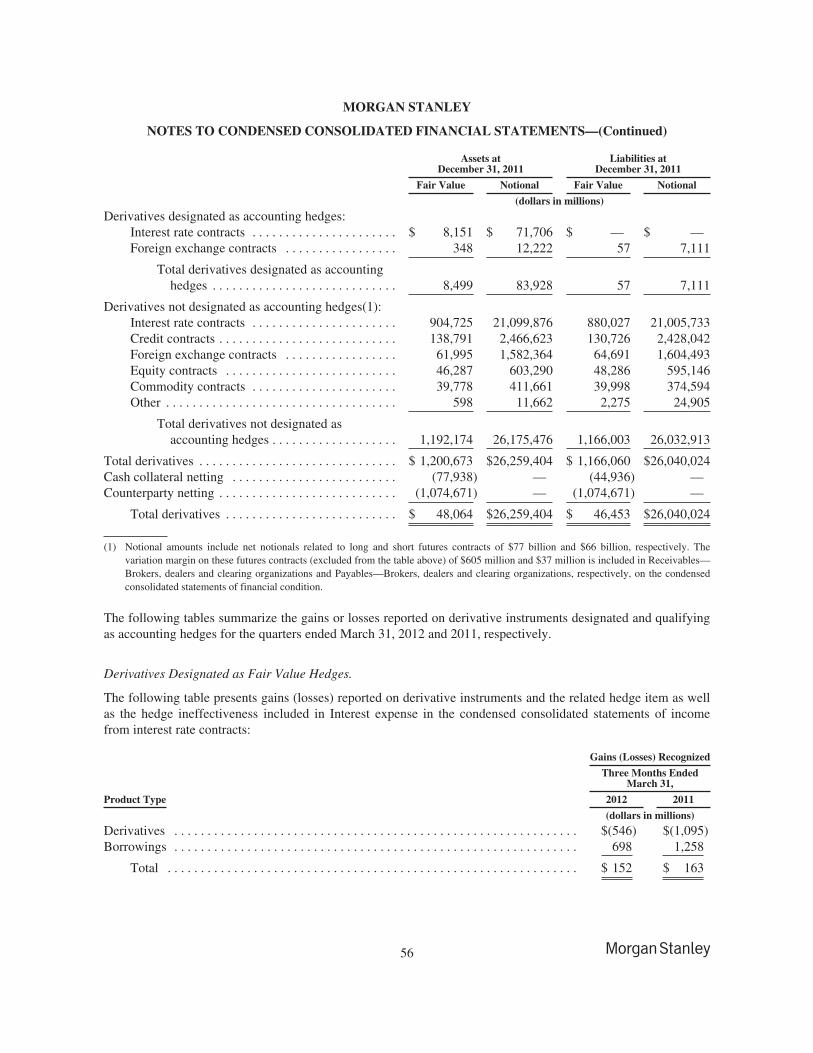
MORGAN STANLEY
NOTES TO CONDENSED CONSOLIDATED FINANCIAL STATEMENTS—(Continued)
Assets atDecember 31, 2011
Liabilities atDecember 31, 2011
Fair Value Notional Fair Value Notional
(dollars in millions)
Derivatives designated as accounting hedges:Interest rate contracts . . . . . . . . . . . . . . . . . . . . . . $ 8,151 $ 71,706 $ — $ —Foreign exchange contracts . . . . . . . . . . . . . . . . . 348 12,222 57 7,111
Total derivatives designated as accountinghedges . . . . . . . . . . . . . . . . . . . . . . . . . . . . 8,499 83,928 57 7,111
Derivatives not designated as accounting hedges(1):Interest rate contracts . . . . . . . . . . . . . . . . . . . . . . 904,725 21,099,876 880,027 21,005,733Credit contracts . . . . . . . . . . . . . . . . . . . . . . . . . . . 138,791 2,466,623 130,726 2,428,042Foreign exchange contracts . . . . . . . . . . . . . . . . . 61,995 1,582,364 64,691 1,604,493Equity contracts . . . . . . . . . . . . . . . . . . . . . . . . . . 46,287 603,290 48,286 595,146Commodity contracts . . . . . . . . . . . . . . . . . . . . . . 39,778 411,661 39,998 374,594Other . . . . . . . . . . . . . . . . . . . . . . . . . . . . . . . . . . . 598 11,662 2,275 24,905
Total derivatives not designated asaccounting hedges . . . . . . . . . . . . . . . . . . . 1,192,174 26,175,476 1,166,003 26,032,913
Total derivatives . . . . . . . . . . . . . . . . . . . . . . . . . . . . . . $ 1,200,673 $26,259,404 $ 1,166,060 $26,040,024Cash collateral netting . . . . . . . . . . . . . . . . . . . . . . . . . (77,938) — (44,936) —Counterparty netting . . . . . . . . . . . . . . . . . . . . . . . . . . . (1,074,671) — (1,074,671) —
Total derivatives . . . . . . . . . . . . . . . . . . . . . . . . . . $ 48,064 $26,259,404 $ 46,453 $26,040,024
(1) Notional amounts include net notionals related to long and short futures contracts of $77 billion and $66 billion, respectively. Thevariation margin on these futures contracts (excluded from the table above) of $605 million and $37 million is included in Receivables—Brokers, dealers and clearing organizations and Payables—Brokers, dealers and clearing organizations, respectively, on the condensedconsolidated statements of financial condition.
The following tables summarize the gains or losses reported on derivative instruments designated and qualifyingas accounting hedges for the quarters ended March 31, 2012 and 2011, respectively.
Derivatives Designated as Fair Value Hedges.
The following table presents gains (losses) reported on derivative instruments and the related hedge item as wellas the hedge ineffectiveness included in Interest expense in the condensed consolidated statements of incomefrom interest rate contracts:
Gains (Losses) Recognized
Three Months EndedMarch 31,
Product Type 2012 2011
(dollars in millions)
Derivatives . . . . . . . . . . . . . . . . . . . . . . . . . . . . . . . . . . . . . . . . . . . . . . . . . . . . . . . . . . . . . $(546) $(1,095)Borrowings . . . . . . . . . . . . . . . . . . . . . . . . . . . . . . . . . . . . . . . . . . . . . . . . . . . . . . . . . . . . . 698 1,258
Total . . . . . . . . . . . . . . . . . . . . . . . . . . . . . . . . . . . . . . . . . . . . . . . . . . . . . . . . . . . . . . $ 152 $ 163
56
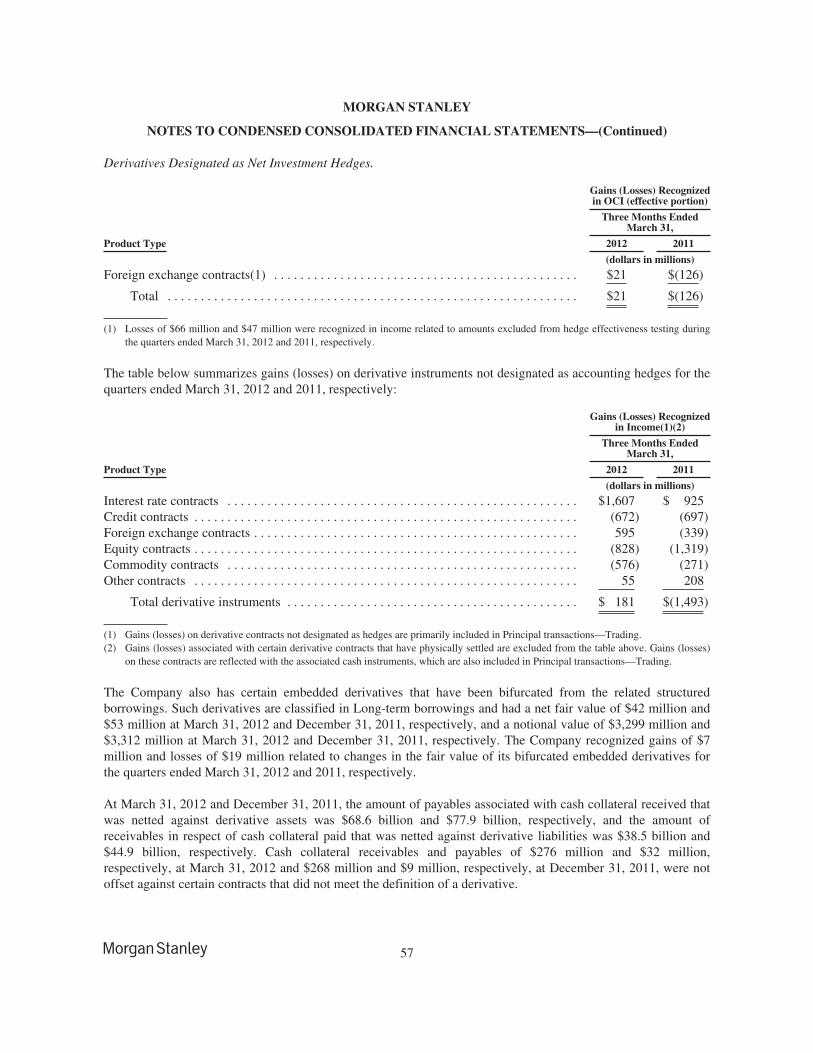
MORGAN STANLEY
NOTES TO CONDENSED CONSOLIDATED FINANCIAL STATEMENTS—(Continued)
Derivatives Designated as Net Investment Hedges.
Gains (Losses) Recognizedin OCI (effective portion)
Three Months EndedMarch 31,
Product Type 2012 2011
(dollars in millions)
Foreign exchange contracts(1) . . . . . . . . . . . . . . . . . . . . . . . . . . . . . . . . . . . . . . . . . . . . . . $21 $(126)
Total . . . . . . . . . . . . . . . . . . . . . . . . . . . . . . . . . . . . . . . . . . . . . . . . . . . . . . . . . . . . . . $21 $(126)
(1) Losses of $66 million and $47 million were recognized in income related to amounts excluded from hedge effectiveness testing duringthe quarters ended March 31, 2012 and 2011, respectively.
The table below summarizes gains (losses) on derivative instruments not designated as accounting hedges for thequarters ended March 31, 2012 and 2011, respectively:
Gains (Losses) Recognizedin Income(1)(2)
Three Months EndedMarch 31,
Product Type 2012 2011
(dollars in millions)
Interest rate contracts . . . . . . . . . . . . . . . . . . . . . . . . . . . . . . . . . . . . . . . . . . . . . . . . . . . . . $1,607 $ 925Credit contracts . . . . . . . . . . . . . . . . . . . . . . . . . . . . . . . . . . . . . . . . . . . . . . . . . . . . . . . . . . (672) (697)Foreign exchange contracts . . . . . . . . . . . . . . . . . . . . . . . . . . . . . . . . . . . . . . . . . . . . . . . . . 595 (339)Equity contracts . . . . . . . . . . . . . . . . . . . . . . . . . . . . . . . . . . . . . . . . . . . . . . . . . . . . . . . . . . (828) (1,319)Commodity contracts . . . . . . . . . . . . . . . . . . . . . . . . . . . . . . . . . . . . . . . . . . . . . . . . . . . . . (576) (271)Other contracts . . . . . . . . . . . . . . . . . . . . . . . . . . . . . . . . . . . . . . . . . . . . . . . . . . . . . . . . . . 55 208
Total derivative instruments . . . . . . . . . . . . . . . . . . . . . . . . . . . . . . . . . . . . . . . . . . . . $ 181 $(1,493)
(1) Gains (losses) on derivative contracts not designated as hedges are primarily included in Principal transactions—Trading.(2) Gains (losses) associated with certain derivative contracts that have physically settled are excluded from the table above. Gains (losses)
on these contracts are reflected with the associated cash instruments, which are also included in Principal transactions—Trading.
The Company also has certain embedded derivatives that have been bifurcated from the related structuredborrowings. Such derivatives are classified in Long-term borrowings and had a net fair value of $42 million and$53 million at March 31, 2012 and December 31, 2011, respectively, and a notional value of $3,299 million and$3,312 million at March 31, 2012 and December 31, 2011, respectively. The Company recognized gains of $7million and losses of $19 million related to changes in the fair value of its bifurcated embedded derivatives forthe quarters ended March 31, 2012 and 2011, respectively.
At March 31, 2012 and December 31, 2011, the amount of payables associated with cash collateral received thatwas netted against derivative assets was $68.6 billion and $77.9 billion, respectively, and the amount ofreceivables in respect of cash collateral paid that was netted against derivative liabilities was $38.5 billion and$44.9 billion, respectively. Cash collateral receivables and payables of $276 million and $32 million,respectively, at March 31, 2012 and $268 million and $9 million, respectively, at December 31, 2011, were notoffset against certain contracts that did not meet the definition of a derivative.
57
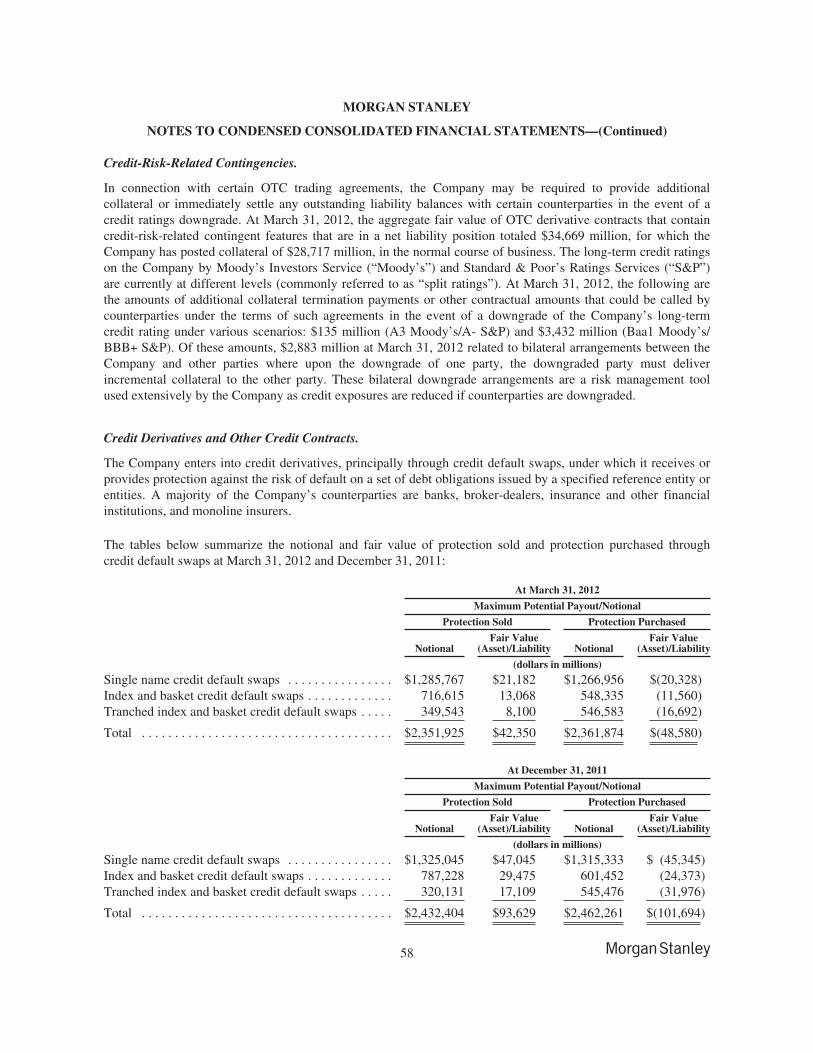
MORGAN STANLEY
NOTES TO CONDENSED CONSOLIDATED FINANCIAL STATEMENTS—(Continued)
Credit-Risk-Related Contingencies.
In connection with certain OTC trading agreements, the Company may be required to provide additionalcollateral or immediately settle any outstanding liability balances with certain counterparties in the event of acredit ratings downgrade. At March 31, 2012, the aggregate fair value of OTC derivative contracts that containcredit-risk-related contingent features that are in a net liability position totaled $34,669 million, for which theCompany has posted collateral of $28,717 million, in the normal course of business. The long-term credit ratingson the Company by Moody’s Investors Service (“Moody’s”) and Standard & Poor’s Ratings Services (“S&P”)are currently at different levels (commonly referred to as “split ratings”). At March 31, 2012, the following arethe amounts of additional collateral termination payments or other contractual amounts that could be called bycounterparties under the terms of such agreements in the event of a downgrade of the Company’s long-termcredit rating under various scenarios: $135 million (A3 Moody’s/A- S&P) and $3,432 million (Baa1 Moody’s/BBB+ S&P). Of these amounts, $2,883 million at March 31, 2012 related to bilateral arrangements between theCompany and other parties where upon the downgrade of one party, the downgraded party must deliverincremental collateral to the other party. These bilateral downgrade arrangements are a risk management toolused extensively by the Company as credit exposures are reduced if counterparties are downgraded.
Credit Derivatives and Other Credit Contracts.
The Company enters into credit derivatives, principally through credit default swaps, under which it receives orprovides protection against the risk of default on a set of debt obligations issued by a specified reference entity orentities. A majority of the Company’s counterparties are banks, broker-dealers, insurance and other financialinstitutions, and monoline insurers.
The tables below summarize the notional and fair value of protection sold and protection purchased throughcredit default swaps at March 31, 2012 and December 31, 2011:
At March 31, 2012
Maximum Potential Payout/Notional
Protection Sold Protection Purchased
NotionalFair Value
(Asset)/Liability NotionalFair Value
(Asset)/Liability
(dollars in millions)
Single name credit default swaps . . . . . . . . . . . . . . . . $1,285,767 $21,182 $1,266,956 $(20,328)Index and basket credit default swaps . . . . . . . . . . . . . 716,615 13,068 548,335 (11,560)Tranched index and basket credit default swaps . . . . . 349,543 8,100 546,583 (16,692)
Total . . . . . . . . . . . . . . . . . . . . . . . . . . . . . . . . . . . . . . $2,351,925 $42,350 $2,361,874 $(48,580)
At December 31, 2011
Maximum Potential Payout/Notional
Protection Sold Protection Purchased
NotionalFair Value
(Asset)/Liability NotionalFair Value
(Asset)/Liability
(dollars in millions)
Single name credit default swaps . . . . . . . . . . . . . . . . $1,325,045 $47,045 $1,315,333 $ (45,345)Index and basket credit default swaps . . . . . . . . . . . . . 787,228 29,475 601,452 (24,373)Tranched index and basket credit default swaps . . . . . 320,131 17,109 545,476 (31,976)
Total . . . . . . . . . . . . . . . . . . . . . . . . . . . . . . . . . . . . . . $2,432,404 $93,629 $2,462,261 $(101,694)
58
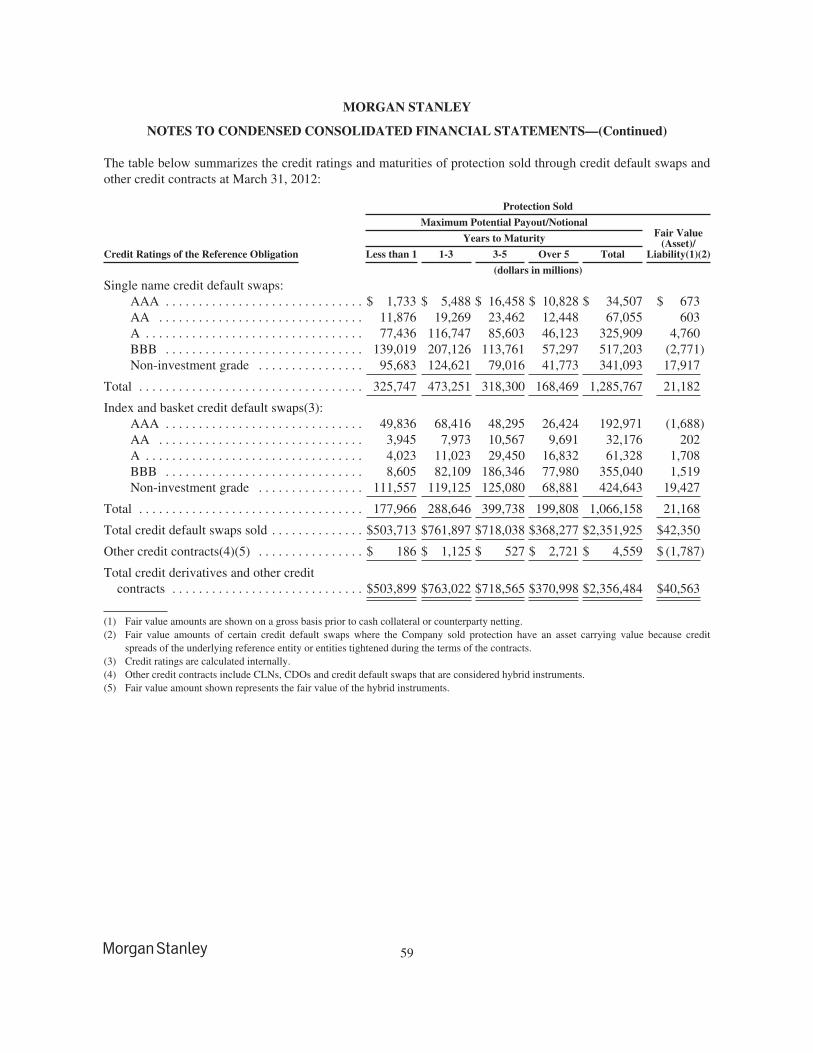
MORGAN STANLEY
NOTES TO CONDENSED CONSOLIDATED FINANCIAL STATEMENTS—(Continued)
The table below summarizes the credit ratings and maturities of protection sold through credit default swaps andother credit contracts at March 31, 2012:
Protection Sold
Maximum Potential Payout/NotionalFair Value
(Asset)/Liability(1)(2)
Years to Maturity
Credit Ratings of the Reference Obligation Less than 1 1-3 3-5 Over 5 Total
(dollars in millions)
Single name credit default swaps:AAA . . . . . . . . . . . . . . . . . . . . . . . . . . . . . . $ 1,733 $ 5,488 $ 16,458 $ 10,828 $ 34,507 $ 673AA . . . . . . . . . . . . . . . . . . . . . . . . . . . . . . . 11,876 19,269 23,462 12,448 67,055 603A . . . . . . . . . . . . . . . . . . . . . . . . . . . . . . . . . 77,436 116,747 85,603 46,123 325,909 4,760BBB . . . . . . . . . . . . . . . . . . . . . . . . . . . . . . 139,019 207,126 113,761 57,297 517,203 (2,771)Non-investment grade . . . . . . . . . . . . . . . . 95,683 124,621 79,016 41,773 341,093 17,917
Total . . . . . . . . . . . . . . . . . . . . . . . . . . . . . . . . . . 325,747 473,251 318,300 168,469 1,285,767 21,182
Index and basket credit default swaps(3):AAA . . . . . . . . . . . . . . . . . . . . . . . . . . . . . . 49,836 68,416 48,295 26,424 192,971 (1,688)AA . . . . . . . . . . . . . . . . . . . . . . . . . . . . . . . 3,945 7,973 10,567 9,691 32,176 202A . . . . . . . . . . . . . . . . . . . . . . . . . . . . . . . . . 4,023 11,023 29,450 16,832 61,328 1,708BBB . . . . . . . . . . . . . . . . . . . . . . . . . . . . . . 8,605 82,109 186,346 77,980 355,040 1,519Non-investment grade . . . . . . . . . . . . . . . . 111,557 119,125 125,080 68,881 424,643 19,427
Total . . . . . . . . . . . . . . . . . . . . . . . . . . . . . . . . . . 177,966 288,646 399,738 199,808 1,066,158 21,168
Total credit default swaps sold . . . . . . . . . . . . . . $503,713 $761,897 $718,038 $368,277 $2,351,925 $42,350
Other credit contracts(4)(5) . . . . . . . . . . . . . . . . $ 186 $ 1,125 $ 527 $ 2,721 $ 4,559 $ (1,787)
Total credit derivatives and other creditcontracts . . . . . . . . . . . . . . . . . . . . . . . . . . . . . $503,899 $763,022 $718,565 $370,998 $2,356,484 $40,563
(1) Fair value amounts are shown on a gross basis prior to cash collateral or counterparty netting.(2) Fair value amounts of certain credit default swaps where the Company sold protection have an asset carrying value because credit
spreads of the underlying reference entity or entities tightened during the terms of the contracts.(3) Credit ratings are calculated internally.(4) Other credit contracts include CLNs, CDOs and credit default swaps that are considered hybrid instruments.(5) Fair value amount shown represents the fair value of the hybrid instruments.
59
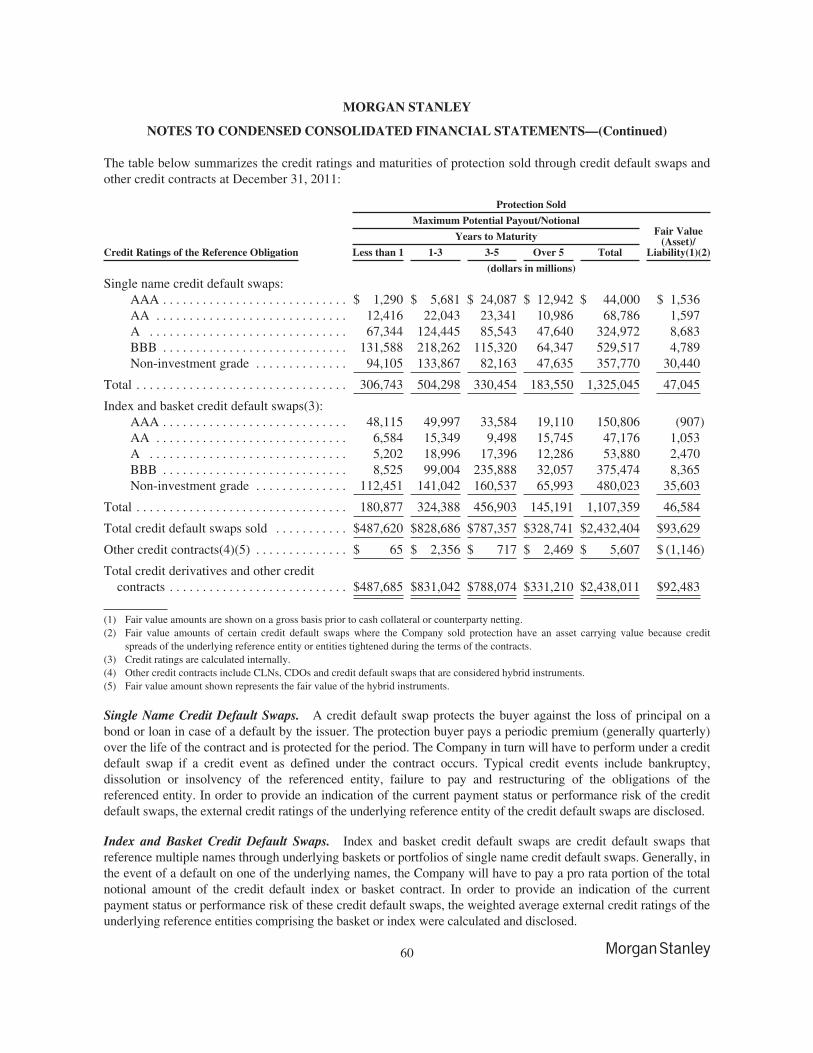
MORGAN STANLEY
NOTES TO CONDENSED CONSOLIDATED FINANCIAL STATEMENTS—(Continued)
The table below summarizes the credit ratings and maturities of protection sold through credit default swaps andother credit contracts at December 31, 2011:
Protection Sold
Maximum Potential Payout/NotionalFair Value
(Asset)/Liability(1)(2)
Years to Maturity
Credit Ratings of the Reference Obligation Less than 1 1-3 3-5 Over 5 Total
(dollars in millions)
Single name credit default swaps:AAA . . . . . . . . . . . . . . . . . . . . . . . . . . . . $ 1,290 $ 5,681 $ 24,087 $ 12,942 $ 44,000 $ 1,536AA . . . . . . . . . . . . . . . . . . . . . . . . . . . . . 12,416 22,043 23,341 10,986 68,786 1,597A . . . . . . . . . . . . . . . . . . . . . . . . . . . . . . 67,344 124,445 85,543 47,640 324,972 8,683BBB . . . . . . . . . . . . . . . . . . . . . . . . . . . . 131,588 218,262 115,320 64,347 529,517 4,789Non-investment grade . . . . . . . . . . . . . . 94,105 133,867 82,163 47,635 357,770 30,440
Total . . . . . . . . . . . . . . . . . . . . . . . . . . . . . . . . 306,743 504,298 330,454 183,550 1,325,045 47,045
Index and basket credit default swaps(3):AAA . . . . . . . . . . . . . . . . . . . . . . . . . . . . 48,115 49,997 33,584 19,110 150,806 (907)AA . . . . . . . . . . . . . . . . . . . . . . . . . . . . . 6,584 15,349 9,498 15,745 47,176 1,053A . . . . . . . . . . . . . . . . . . . . . . . . . . . . . . 5,202 18,996 17,396 12,286 53,880 2,470BBB . . . . . . . . . . . . . . . . . . . . . . . . . . . . 8,525 99,004 235,888 32,057 375,474 8,365Non-investment grade . . . . . . . . . . . . . . 112,451 141,042 160,537 65,993 480,023 35,603
Total . . . . . . . . . . . . . . . . . . . . . . . . . . . . . . . . 180,877 324,388 456,903 145,191 1,107,359 46,584
Total credit default swaps sold . . . . . . . . . . . $487,620 $828,686 $787,357 $328,741 $2,432,404 $93,629
Other credit contracts(4)(5) . . . . . . . . . . . . . . $ 65 $ 2,356 $ 717 $ 2,469 $ 5,607 $ (1,146)
Total credit derivatives and other creditcontracts . . . . . . . . . . . . . . . . . . . . . . . . . . . $487,685 $831,042 $788,074 $331,210 $2,438,011 $92,483
(1) Fair value amounts are shown on a gross basis prior to cash collateral or counterparty netting.(2) Fair value amounts of certain credit default swaps where the Company sold protection have an asset carrying value because credit
spreads of the underlying reference entity or entities tightened during the terms of the contracts.(3) Credit ratings are calculated internally.(4) Other credit contracts include CLNs, CDOs and credit default swaps that are considered hybrid instruments.(5) Fair value amount shown represents the fair value of the hybrid instruments.
Single Name Credit Default Swaps. A credit default swap protects the buyer against the loss of principal on abond or loan in case of a default by the issuer. The protection buyer pays a periodic premium (generally quarterly)over the life of the contract and is protected for the period. The Company in turn will have to perform under a creditdefault swap if a credit event as defined under the contract occurs. Typical credit events include bankruptcy,dissolution or insolvency of the referenced entity, failure to pay and restructuring of the obligations of thereferenced entity. In order to provide an indication of the current payment status or performance risk of the creditdefault swaps, the external credit ratings of the underlying reference entity of the credit default swaps are disclosed.
Index and Basket Credit Default Swaps. Index and basket credit default swaps are credit default swaps thatreference multiple names through underlying baskets or portfolios of single name credit default swaps. Generally, inthe event of a default on one of the underlying names, the Company will have to pay a pro rata portion of the totalnotional amount of the credit default index or basket contract. In order to provide an indication of the currentpayment status or performance risk of these credit default swaps, the weighted average external credit ratings of theunderlying reference entities comprising the basket or index were calculated and disclosed.
60
MORGAN STANLEY
NOTES TO CONDENSED CONSOLIDATED FINANCIAL STATEMENTS—(Continued)
The Company also enters into index and basket credit default swaps where the credit protection provided is basedupon the application of tranching techniques. In tranched transactions, the credit risk of an index or basket isseparated into various portions of the capital structure, with different levels of subordination. The most juniortranches cover initial defaults, and once losses exceed the notional of the tranche, they are passed on to the nextmost senior tranche in the capital structure.
When external credit ratings are not available, credit ratings were determined based upon an internalmethodology.
Credit Protection Sold through CLNs and CDOs. The Company has invested in CLNs and CDOs, which arehybrid instruments containing embedded derivatives, in which credit protection has been sold to the issuer of thenote. If there is a credit event of a reference entity underlying the instrument, the principal balance of the notemay not be repaid in full to the Company.
Purchased Credit Protection with Identical Underlying Reference Obligations. For single name credit defaultswaps and non-tranched index and basket credit default swaps, the Company has purchased protection with anotional amount of approximately $2.0 trillion and $1.9 trillion at March 31, 2012 and December 31, 2011,compared with a notional amount of approximately $1.8 trillion and $2.1 trillion, at March 31, 2012 andDecember 31, 2011, respectively, of credit protection sold with identical underlying reference obligations. Inorder to identify purchased protection with the same underlying reference obligations, the notional amount forindividual reference obligations within non-tranched indices and baskets was determined on a pro rata basis andmatched off against single name and non-tranched index and basket credit default swaps where credit protectionwas sold with identical underlying reference obligations.
The purchase of credit protection does not represent the sole manner in which the Company risk manages itsexposure to credit derivatives. The Company manages its exposure to these derivative contracts through a varietyof risk mitigation strategies, which include managing the credit and correlation risk across single name,non-tranched indices and baskets, tranched indices and baskets, and cash positions. Aggregate market risk limitshave been established for credit derivatives, and market risk measures are routinely monitored against theselimits. The Company may also recover amounts on the underlying reference obligation delivered to the Companyunder credit default swaps where credit protection was sold.
61
MORGAN STANLEY
NOTES TO CONDENSED CONSOLIDATED FINANCIAL STATEMENTS—(Continued)
11. Commitments, Guarantees and Contingencies.
Commitments.
The Company’s commitments associated with outstanding letters of credit and other financial guaranteesobtained to satisfy collateral requirements, investment activities, corporate lending and financing arrangements,mortgage lending and margin lending at March 31, 2012 are summarized below by period of expiration. Sincecommitments associated with these instruments may expire unused, the amounts shown do not necessarily reflectthe actual future cash funding requirements:
Years to Maturity
Total atMarch 31, 2012
Lessthan 1 1-3 3-5 Over 5
(dollars in millions)
Letters of credit and other financial guarantees obtained tosatisfy collateral requirements . . . . . . . . . . . . . . . . . . . . . . . $ 2,068 $ 12 $ 6 $ — $ 2,086
Investment activities . . . . . . . . . . . . . . . . . . . . . . . . . . . . . . . . 1,160 238 44 274 1,716Primary lending commitments—investment grade(1)(2) . . . . 10,181 9,854 31,778 1,997 53,810Primary lending commitments—non-investment grade(2) . . . 2,182 2,789 9,981 897 15,849Secondary lending commitments(3) . . . . . . . . . . . . . . . . . . . . 56 203 20 112 391Commitments for secured lending transactions . . . . . . . . . . . . 1,299 251 198 — 1,748Forward starting reverse repurchase agreements and
securities borrowing agreements(4) . . . . . . . . . . . . . . . . . . . 74,317 — — — 74,317Commercial and residential mortgage-related
commitments . . . . . . . . . . . . . . . . . . . . . . . . . . . . . . . . . . . . 1,378 26 201 450 2,055Other commitments . . . . . . . . . . . . . . . . . . . . . . . . . . . . . . . . . 1,262 248 5 1 1,516
Total . . . . . . . . . . . . . . . . . . . . . . . . . . . . . . . . . . . . . . . . . $93,903 $13,621 $42,233 $3,731 $153,488
(1) This amount includes commitments to asset-backed commercial paper conduits of $275 million at March 31, 2012, of which$138 million have maturities of less than one year and $137 million of which have maturities of one to three years.
(2) This amount includes $12.2 billion of investment grade and $3.5 billion of non-investment grade unfunded commitments accounted foras held for investment and $68 million of investment grade and $191 million of non-investment grade unfunded commitments accountedfor as held for sale at March 31, 2012. The remainder of these lending commitments are carried at fair value.
(3) These commitments are recorded at fair value within Financial instruments owned and Financial instruments sold, not yet purchased inthe condensed consolidated statements of financial condition (see Note 3).
(4) The Company enters into forward starting reverse repurchase and securities borrowing agreements (agreements that have a trade date ator prior to March 31, 2012 and settle subsequent to period-end) that are primarily secured by collateral from U.S. government agencysecurities and other sovereign government obligations. These agreements primarily settle within three business days and of the amount atMarch 31, 2012, $70.7 billion settled within three business days.
For further description of these commitments, refer to Note 13 to the consolidated financial statements for theyear ended December 31, 2011 included in the Form 10-K.
The Company sponsors several non-consolidated investment funds for third-party investors where the Companytypically acts as general partner of, and investment advisor to, these funds and typically commits to invest aminority of the capital of such funds, with subscribing third-party investors contributing the majority. TheCompany’s employees, including its senior officers, as well as the Company’s directors, may participate on thesame terms and conditions as other investors in certain of these funds that the Company forms primarily forclient investment, except that the Company may waive or lower applicable fees and charges for itsemployees. The Company has contractual capital commitments, guarantees, lending facilities and counterpartyarrangements with respect to these investment funds.
62
MORGAN STANLEY
NOTES TO CONDENSED CONSOLIDATED FINANCIAL STATEMENTS—(Continued)
Guarantees.
The table below summarizes certain information regarding the Company’s obligations under guaranteearrangements at March 31, 2012:
Maximum Potential Payout/Notional CarryingAmount(Asset)/Liability
Collateral/Recourse
Years to Maturity
Type of Guarantee Less than 1 1-3 3-5 Over 5 Total
(dollars in millions)
Credit derivative contracts(1) . . . . . . $ 503,713 $761,897 $718,038 $368,277 $2,351,925 $42,350 $ —Other credit contracts . . . . . . . . . . . . . 186 1,125 527 2,721 4,559 (1,787) —Non-credit derivative contracts(1) . . . 1,084,120 889,974 375,232 424,365 2,773,691 85,784 —Standby letters of credit and other
financial guaranteesissued(2)(3) . . . . . . . . . . . . . . . . . . 1,247 1,704 1,253 5,604 9,808 (141) 6,788
Market value guarantees . . . . . . . . . . — 51 188 553 792 13 89Liquidity facilities . . . . . . . . . . . . . . . 4,827 305 37 67 5,236 (7) 6,552Whole loan sales representations and
warranties . . . . . . . . . . . . . . . . . . . . — — — 24,366 24,366 79 —Securitization representations and
warranties . . . . . . . . . . . . . . . . . . . . — — — 78,029 78,029 35 —General partner guarantees . . . . . . . . 83 18 25 156 282 77 —
(1) Carrying amounts of derivative contracts are shown on a gross basis prior to cash collateral or counterparty netting. For furtherinformation on derivative contracts, see Note 10.
(2) Approximately $2.6 billion of standby letters of credit are also reflected in the “Commitments” table in primary and secondary lendingcommitments. Standby letters of credit are recorded at fair value within Financial instruments owned or Financial instruments sold, notyet purchased in the condensed consolidated statements of financial condition.
(3) Amounts include guarantees issued by consolidated real estate funds sponsored by the Company of approximately $225 million. Theseguarantees relate to obligations of the fund’s investee entities, including guarantees related to capital expenditures and principal andinterest debt payments. Accrued losses under these guarantees of approximately $7 million are reflected as a reduction of the carryingvalue of the related fund investments, which are reflected in Financial instruments owned—Investments on the condensed consolidatedstatement of financial condition.
For further description of these guarantees, refer to Note 13 to the consolidated financial statements for the yearended December 31, 2011 included in the Form 10-K.
63
MORGAN STANLEY
NOTES TO CONDENSED CONSOLIDATED FINANCIAL STATEMENTS—(Continued)
The Company has obligations under certain guarantee arrangements, including contracts and indemnificationagreements that contingently require a guarantor to make payments to the guaranteed party based on changes inan underlying measure (such as an interest or foreign exchange rate, security or commodity price, an index or theoccurrence or non-occurrence of a specified event) related to an asset, liability or equity security of a guaranteedparty. Also included as guarantees are contracts that contingently require the guarantor to make payments to theguaranteed party based on another entity’s failure to perform under an agreement, as well as indirect guaranteesof the indebtedness of others. The Company’s use of guarantees is described below by type of guarantee:
Other Guarantees and Indemnities.
In the normal course of business, the Company provides guarantees and indemnifications in a variety ofcommercial transactions. These provisions generally are standard contractual terms. Certain of these guaranteesand indemnifications are described below.
• Trust Preferred Securities. The Company has established Morgan Stanley Capital Trusts for the limitedpurpose of issuing trust preferred securities to third parties and lending the proceeds to the Company inexchange for junior subordinated debentures. The Company has directly guaranteed the repayment of thetrust preferred securities to the holders thereof to the extent that the Company has made payments to aMorgan Stanley Capital Trust on the junior subordinated debentures. In the event that the Company doesnot make payments to a Morgan Stanley Capital Trust, holders of such series of trust preferred securitieswould not be able to rely upon the guarantee for payment of those amounts. The Company has notrecorded any liability in the condensed consolidated financial statements for these guarantees andbelieves that the occurrence of any events (i.e., non-performance on the part of the paying agent) thatwould trigger payments under these contracts is remote. See Note 15 to the consolidated financialstatements for the year ended December 31, 2011 included in the Form 10-K for details on theCompany’s junior subordinated debentures.
• Indemnities. The Company provides standard indemnities to counterparties for certain contingentexposures and taxes, including U.S. and foreign withholding taxes, on interest and other payments madeon derivatives, securities and stock lending transactions, certain annuity products and other financialarrangements. These indemnity payments could be required based on a change in the tax laws or changein interpretation of applicable tax rulings or a change in factual circumstances. Certain contracts containprovisions that enable the Company to terminate the agreement upon the occurrence of such events. Themaximum potential amount of future payments that the Company could be required to make under theseindemnifications cannot be estimated.
• Exchange/Clearinghouse Member Guarantees. The Company is a member of various U.S. and non-U.S.exchanges and clearinghouses that trade and clear securities and/or derivative contracts. Associated with itsmembership, the Company may be required to pay a proportionate share of the financial obligations ofanother member who may default on its obligations to the exchange or the clearinghouse. While the rulesgoverning different exchange or clearinghouse memberships vary, in general the Company’s guaranteeobligations would arise only if the exchange or clearinghouse had previously exhausted its resources. Themaximum potential payout under these membership agreements cannot be estimated. The Company has notrecorded any contingent liability in the condensed consolidated financial statements for these agreementsand believes that any potential requirement to make payments under these agreements is remote.
• Merger and Acquisition Guarantees. The Company may, from time to time, in its role as investmentbanking advisor be required to provide guarantees in connection with certain European merger andacquisition transactions. If required by the regulating authorities, the Company provides a guarantee thatthe acquirer in the merger and acquisition transaction has or will have sufficient funds to complete thetransaction and would then be required to make the acquisition payments in the event the acquirer’s fundsare insufficient at the completion date of the transaction. These arrangements generally cover the time
64
MORGAN STANLEY
NOTES TO CONDENSED CONSOLIDATED FINANCIAL STATEMENTS—(Continued)
frame from the transaction offer date to its closing date and, therefore, are generally short term in nature.The maximum potential amount of future payments that the Company could be required to make cannotbe estimated. The Company believes the likelihood of any payment by the Company under thesearrangements is remote given the level of the Company’s due diligence associated with its role asinvestment banking advisor.
• Guarantees on Morgan Stanley Stable Value Program. On September 30, 2009, the Company enteredinto an agreement with the investment manager for the Stable Value Program (“SVP”), a fund within theCompany’s 401(k) plan, and certain other third parties. Under the agreement, the Company contributed$20 million to the SVP on October 15, 2009 and recorded the contribution in Compensation andbenefits expense. Additionally, the Company may have a future obligation to make a payment of $40million to the SVP following the third anniversary of the agreement, after which the SVP would bewound down over a period of time. The future obligation is contingent upon whether the market-to-bookvalue ratio of the portion of the SVP that is subject to certain book-value stabilizing contracts has fallenbelow a specific threshold and the Company and the other parties to the agreement all decline to makepayments to restore the SVP to such threshold as of the third anniversary of the agreement. The Companyhas not recorded a liability for this guarantee in the condensed consolidated financial statements.
In the ordinary course of business, the Company guarantees the debt and/or certain trading obligations (includingobligations associated with derivatives, foreign exchange contracts and the settlement of physical commodities)of certain subsidiaries. These guarantees generally are entity or product specific and are required by investors ortrading counterparties. The activities of the subsidiaries covered by these guarantees (including any related debtor trading obligations) are included in the Company’s condensed consolidated financial statements.
Contingencies.
Legal. In the normal course of business, the Company has been named, from time to time, as a defendant invarious legal actions, including arbitrations, class actions and other litigation, arising in connection with itsactivities as a global diversified financial services institution. Certain of the actual or threatened legal actionsinclude claims for substantial compensatory and/or punitive damages or claims for indeterminate amounts ofdamages. In some cases, the entities that would otherwise be the primary defendants in such cases are bankruptor are in financial distress. These actions have included, but are not limited to, residential mortgage and creditcrisis related matters. Over the last several years, the level of litigation and investigatory activity focused onresidential mortgage and credit crisis related matters has increased materially in the financial services industry.As a result, the Company expects that it may become the subject of increased claims for damages and other reliefregarding residential mortgages and related securities in the future and, while the Company has identified belowany individual proceedings where the Company believes a material loss to be reasonably possible and reasonablyestimable, there can be no assurance that material losses will not be incurred from claims that have not yet beennotified to the Company or are not yet determined to be probable or possible and reasonably estimable losses.
The Company is also involved, from time to time, in other reviews, investigations and proceedings (both formaland informal) by governmental and self-regulatory agencies regarding the Company’s business, including,among other matters, accounting and operational matters, certain of which may result in adverse judgments,settlements, fines, penalties, injunctions or other relief.
The Company contests liability and/or the amount of damages as appropriate in each pending matter. Whereavailable information indicates that it is probable a liability had been incurred at the date of the condensedconsolidated financial statements and the Company can reasonably estimate the amount of that loss, theCompany accrues the estimated loss by a charge to income. In many proceedings, however, it is inherentlydifficult to determine whether any loss is probable or even possible or to estimate the amount of any loss. In
65
MORGAN STANLEY
NOTES TO CONDENSED CONSOLIDATED FINANCIAL STATEMENTS—(Continued)
addition, even where loss is possible or an exposure to loss exists in excess of the liability already accrued withrespect to a previously recognized loss contingency, it is not always possible to reasonably estimate the size ofthe possible loss or range of loss.
For certain legal proceedings, the Company cannot reasonably estimate such losses, particularly for proceedingsthat are in their early stages of development or where plaintiffs seek substantial or indeterminate damages.Numerous issues may need to be resolved, including through potentially lengthy discovery and determination ofimportant factual matters, determination of issues related to class certification and the calculation of damages,and by addressing novel or unsettled legal questions relevant to the proceedings in question, before a loss oradditional loss or range of loss or additional loss can be reasonably estimated for any proceeding.
For certain other legal proceedings, the Company can estimate reasonably possible losses, additional losses, ranges ofloss or ranges of additional loss in excess of amounts accrued, but does not believe, based on current knowledge andafter consultation with counsel, that such losses will have a material adverse effect on the Company’s condensedconsolidated financial statements as a whole, other than the matters referred to in the following paragraphs.
On September 25, 2009, the Company was named as a defendant in a lawsuit styled Citibank, N.A. v. MorganStanley & Co. International, PLC, which was pending in the United States District Court for the Southern District ofNew York (“SDNY”). The lawsuit relates to a credit default swap referencing the Capmark VI CDO (“Capmark”),which was structured by Citibank, N.A. (“Citi N.A.”). At issue is whether, as part of the swap agreement, Citi N.A.was obligated to obtain the Company’s prior written consent before it exercised its rights to liquidate Capmark uponthe occurrence of certain contractually-defined credit events. Citi N.A. is seeking approximately $245 million incompensatory damages plus interest and costs. On October 8, 2010, the court issued an order denying Citi N.A.’smotion for judgment on the pleadings as to the Company’s counterclaim for reformation and granting Citi N.A.’smotion for judgment on the pleadings as to the Company’s counterclaim for estoppel. On May 25, 2011, the courtissued an order denying the Company’s motion for summary judgment and granting Citi N.A.’s cross motion forsummary judgment. On June 27, 2011, the court entered a judgment in favor of Citi N.A. for $269 million plus post-judgment interest and costs, and the Company filed a notice of appeal with the United States Court of Appeals for theSecond Circuit, which appeal is now pending. Based on currently available information, the Company believes itcould incur a loss of up to approximately $269 million plus post-judgment interest.
On August 25, 2008, the Company and two ratings agencies were named as defendants in a purported classaction related to securities issued by a structured investment vehicle called Cheyne Finance (the “Cheyne SIV”).The case is styled Abu Dhabi Commercial Bank, et al. v. Morgan Stanley & Co. Inc., et al. and is pending in theSDNY. The complaint alleges, among other things, that the ratings assigned to the securities issued by theCheyne SIV were false and misleading because the ratings did not accurately reflect the risks associated with thesubprime residential mortgage backed securities held by the Cheyne SIV. On September 2, 2009, the courtdismissed all of the claims against the Company except for plaintiffs’ claims for common law fraud. On June 15,2010, the court denied plaintiffs’ motion for class certification. On July 20, 2010, the court granted plaintiffsleave to replead their aiding and abetting common law fraud claims against the Company, and those claims wereadded in an amended complaint filed on August 5, 2010. On December 27, 2011, the court permitted plaintiffs toreinstate their causes of action for negligent misrepresentation and breach of fiduciary duty against the Company.The Company moved to dismiss these claims on January 10, 2012. On January 5, 2012, the court permittedplaintiffs to amend their Complaint and assert a negligence claim against the Company. The amended complaintwas filed on January 9, 2012 and the Company moved to dismiss the negligence claim on January 17, 2012. OnJanuary 23, 2012, the Company moved for summary judgment with respect to the fraud and aiding and abettingfraud claims. There are 15 plaintiffs in this action asserting claims related to approximately $983 million ofsecurities issued by the Cheyne SIV. Plaintiffs have not alleged the amount of their alleged investments and areseeking, among other things, unspecified compensatory and punitive damages. Based on currently available
66
MORGAN STANLEY
NOTES TO CONDENSED CONSOLIDATED FINANCIAL STATEMENTS—(Continued)
information, the Company believes that the defendants could incur a loss up to the amount of plaintiffs’ claimedcompensatory damages, once specified, related to their alleged purchase of approximately $983 million ofsecurities issued by the Cheyne SIV plus pre- and post-judgment interest, fees and costs.
On July 15, 2010, China Development Industrial Bank (“CDIB”) filed a complaint against the Company, whichis styled China Development Industrial Bank v. Morgan Stanley & Co. Incorporated et al. and is pending in theSupreme Court of the State of New York, New York County. The complaint relates to a $275 million creditdefault swap referencing the super senior portion of the STACK 2006-1 CDO. The complaint asserts claims forcommon law fraud, fraudulent inducement and fraudulent concealment and alleges that the Companymisrepresented the risks of the STACK 2006-1 CDO to CDIB, and that the Company knew that the assetsbacking the CDO were of poor quality when it entered into the credit default swap with CDIB. The complaintseeks compensatory damages related to the approximately $228 million that CDIB alleges it has already lostunder the credit default swap, rescission of CDIB’s obligation to pay an additional $12 million, punitivedamages, equitable relief, fees and costs. On February 28, 2011, the court presiding over this action denied theCompany’s motion to dismiss the complaint. On March 21, 2011, the Company appealed the order denying itsmotion to dismiss the complaint. On July 7, 2011, the appellate court affirmed the lower court’s decision denyingthe motion to dismiss. Based on currently available information, the Company believes it could incur a loss of upto approximately $240 million plus pre- and post-judgment interest, fees and costs.
On March 15, 2010, the Federal Home Loan Bank of San Francisco filed two complaints against the Companyand other defendants in the Superior Court of the State of California. These actions are styled Federal HomeLoan Bank of San Francisco v. Credit Suisse Securities (USA) LLC, et al., and Federal Home Loan Bank of SanFrancisco v. Deutsche Bank Securities Inc. et al., respectively. Amended complaints were filed on June 10, 2010.The complaints allege that defendants made untrue statements and material omissions in connection with the saleto plaintiff of mortgage pass through certificates backed by securitization trusts containing residential mortgageloans. The original amount of the certificates allegedly sold to plaintiff by the Company in these cases wasapproximately $980 million collectively. The complaints raise claims under both the federal securities laws andCalifornia law and seek, among other things, to rescind the plaintiff’s purchase of such certificates. On July 29,2011 and September 8, 2011, the court presiding over these cases dismissed the federal securities law claimsagainst the Company, but denied the Company’s motion to dismiss with respect to other claims. At March 31,2012, the current unpaid balance of the mortgage pass through certificates at issue in these cases wasapproximately $398 million and the certificates had not yet incurred losses. Based on currently availableinformation, the Company believes it could incur a loss up to the difference between the $398 million unpaidbalance of these certificates and their fair market value at the time of a judgment against the Company, plus pre-and post-judgment interest, fees and costs. The Company may be entitled to be indemnified for some of theselosses and would be entitled to an offset for interest received by the plaintiff prior to a judgment.
12. Regulatory Requirements.
Morgan Stanley. The Company is a financial holding company under the Bank Holding Company Act of 1956,as amended, and is subject to the regulation and oversight of the Board of Governors of the Federal ReserveSystem (the “Federal Reserve”). The Federal Reserve establishes capital requirements for the Company,including well-capitalized standards, and evaluates the Company’s compliance with such capital requirements.The Office of the Comptroller of the Currency establishes similar capital requirements and standards for theCompany’s national bank subsidiaries.
The Company calculates its capital ratios and risk-weighted assets (“RWA”) in accordance with the capitaladequacy standards for financial holding companies adopted by the Federal Reserve. These standards are basedupon a framework described in the “International Convergence of Capital Measurement and Capital Standards,”July 1988, as amended, also referred to as Basel I. In December 2007, the U.S. banking regulators published final
67
MORGAN STANLEY
NOTES TO CONDENSED CONSOLIDATED FINANCIAL STATEMENTS—(Continued)
regulation incorporating the Basel II Accord, which requires internationally active banking organizations, as wellas certain of their U.S. bank subsidiaries, to implement Basel II standards over the next several years. In July2010, the Company began reporting its capital adequacy standards on a parallel basis to its regulators under BaselI and Basel II as part of a phased implementation of Basel II.
In June 2011, the U.S. banking regulators published final regulations implementing a provision of the Dodd-FrankWall Street Reform and Consumer Protection Act requiring certain institutions supervised by the Federal Reserve,including the Company, be subject to capital requirements that are not less than the generally applicable risk-basedcapital requirements. As a result, the generally applicable capital standards, which are based on Basel I standards,but may themselves change over time, will serve as a permanent floor to minimum capital requirements calculatedunder the Basel II standards the Company is currently required to implement, as well as future capital standards.
In December 2009, the Basel Committee released proposals on risk-based capital, leverage and liquidity standards,known as “Basel III”. Basel III contains new capital standards that raise the quality of capital and strengthencounterparty credit risk capital requirements and introduces a leverage ratio as a supplemental measure to the risk-based ratio. Basel III includes a new capital conservation buffer, which imposes a common equity requirementabove the new minimum that can be depleted under stress, subject to restrictions on capital actions, a new additionalloss absorbency capital requirement for global systemically important banks (“GSIB”), such as the Company, and anew countercyclical buffer, which regulators can activate during periods of excessive credit growth in theirjurisdiction. The Basel III proposals complement an earlier proposal for revisions to the market risk framework thatincreases capital requirements for securitizations within the Company’s trading book. In 2011, the U.S. regulatorsissued proposed rules that are intended to implement certain aspects of the market risk framework proposals. Whileprecise dates for the implementation of the new requirements in the U.S. have not been announced, the U.S.regulators will require implementation of Basel III subject to an extended phase-in period.
At March 31, 2012, the Company was in compliance with Basel I capital requirements with ratios of Tier 1capital to RWAs of 16.8% and total capital to RWAs of 18.1% (6% and 10% being well-capitalized forregulatory purposes, respectively). In addition, financial holding companies are subject to a Tier 1 leverage ratioas defined by the Federal Reserve. The Company calculated its Tier 1 leverage ratio as Tier 1 capital divided byadjusted average total assets (which reflects adjustments for disallowed goodwill, certain intangible assets,deferred tax assets and financial and non-financial equity investments). The adjusted average total assets arederived using weekly balances for the year. At March 31, 2012, the Company was in compliance with thisleverage restriction, with a Tier 1 leverage ratio of 7.0% (5% being well-capitalized for regulatory purposes).
At March 31, 2012, the Company calculated its RWAs in accordance with the regulatory capital requirements ofthe Federal Reserve, which is consistent with guidelines described under Basel I. RWAs reflect both on andoff-balance sheet risk of the Company. The risk capital calculations will evolve over time as the Companyenhances its risk management methodology and incorporates improvements in modeling techniques whilemaintaining compliance with the regulatory requirements and interpretations.
The following table summarizes the capital measures for the Company:
March 31, 2012 December 31, 2011
Balance Ratio Balance Ratio
(dollars in millions)Tier 1 common capital(1)(2) . . . . . . . . . . . . . . . . . . . . . . . . . . . . . . . . . $ 42,151 13.3% $ 39,785 12.7%Tier 1 capital(2) . . . . . . . . . . . . . . . . . . . . . . . . . . . . . . . . . . . . . . . . . . . 53,527 16.8% 51,114 16.3%Total capital(2) . . . . . . . . . . . . . . . . . . . . . . . . . . . . . . . . . . . . . . . . . . . . 57,587 18.1% 54,956 17.5%RWAs(2) . . . . . . . . . . . . . . . . . . . . . . . . . . . . . . . . . . . . . . . . . . . . . . . . 317,693 — 314,055 —Adjusted average assets(2) . . . . . . . . . . . . . . . . . . . . . . . . . . . . . . . . . . . 760,071 — 769,578 —Tier 1 leverage(2) . . . . . . . . . . . . . . . . . . . . . . . . . . . . . . . . . . . . . . . . . . — 7.0% — 6.6%
68
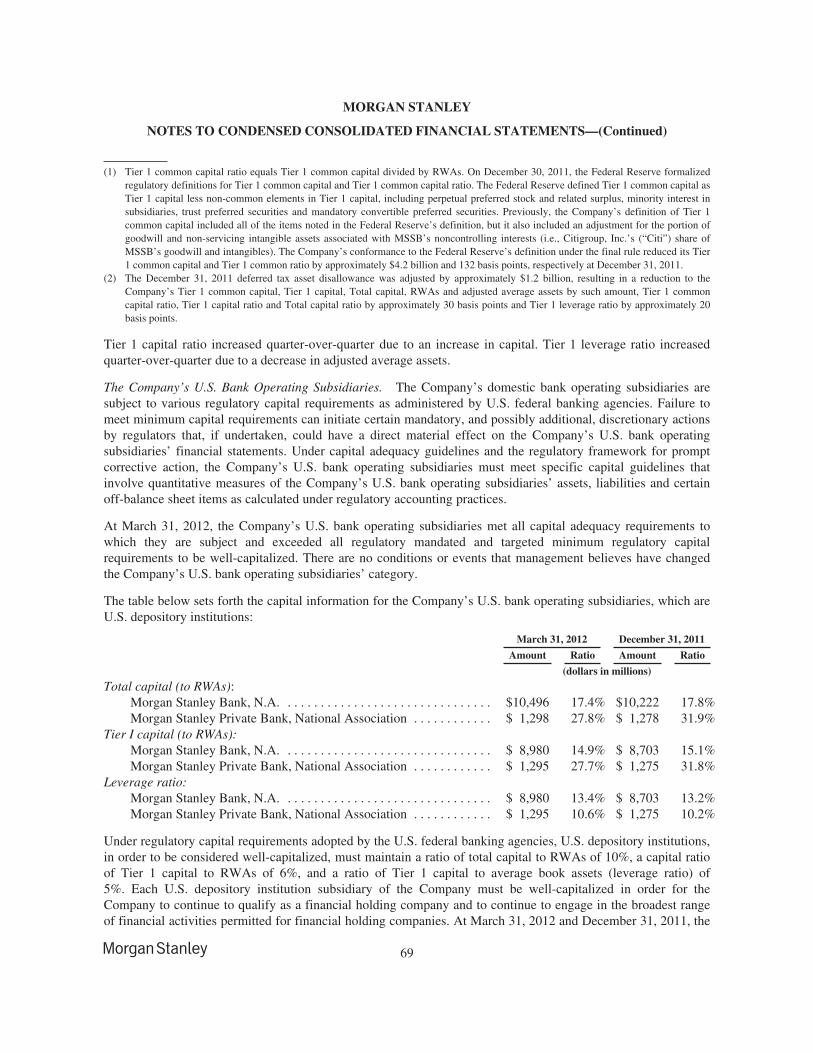
MORGAN STANLEY
NOTES TO CONDENSED CONSOLIDATED FINANCIAL STATEMENTS—(Continued)
(1) Tier 1 common capital ratio equals Tier 1 common capital divided by RWAs. On December 30, 2011, the Federal Reserve formalizedregulatory definitions for Tier 1 common capital and Tier 1 common capital ratio. The Federal Reserve defined Tier 1 common capital asTier 1 capital less non-common elements in Tier 1 capital, including perpetual preferred stock and related surplus, minority interest insubsidiaries, trust preferred securities and mandatory convertible preferred securities. Previously, the Company’s definition of Tier 1common capital included all of the items noted in the Federal Reserve’s definition, but it also included an adjustment for the portion ofgoodwill and non-servicing intangible assets associated with MSSB’s noncontrolling interests (i.e., Citigroup, Inc.’s (“Citi”) share ofMSSB’s goodwill and intangibles). The Company’s conformance to the Federal Reserve’s definition under the final rule reduced its Tier1 common capital and Tier 1 common ratio by approximately $4.2 billion and 132 basis points, respectively at December 31, 2011.
(2) The December 31, 2011 deferred tax asset disallowance was adjusted by approximately $1.2 billion, resulting in a reduction to theCompany’s Tier 1 common capital, Tier 1 capital, Total capital, RWAs and adjusted average assets by such amount, Tier 1 commoncapital ratio, Tier 1 capital ratio and Total capital ratio by approximately 30 basis points and Tier 1 leverage ratio by approximately 20basis points.
Tier 1 capital ratio increased quarter-over-quarter due to an increase in capital. Tier 1 leverage ratio increasedquarter-over-quarter due to a decrease in adjusted average assets.
The Company’s U.S. Bank Operating Subsidiaries. The Company’s domestic bank operating subsidiaries aresubject to various regulatory capital requirements as administered by U.S. federal banking agencies. Failure tomeet minimum capital requirements can initiate certain mandatory, and possibly additional, discretionary actionsby regulators that, if undertaken, could have a direct material effect on the Company’s U.S. bank operatingsubsidiaries’ financial statements. Under capital adequacy guidelines and the regulatory framework for promptcorrective action, the Company’s U.S. bank operating subsidiaries must meet specific capital guidelines thatinvolve quantitative measures of the Company’s U.S. bank operating subsidiaries’ assets, liabilities and certainoff-balance sheet items as calculated under regulatory accounting practices.
At March 31, 2012, the Company’s U.S. bank operating subsidiaries met all capital adequacy requirements towhich they are subject and exceeded all regulatory mandated and targeted minimum regulatory capitalrequirements to be well-capitalized. There are no conditions or events that management believes have changedthe Company’s U.S. bank operating subsidiaries’ category.
The table below sets forth the capital information for the Company’s U.S. bank operating subsidiaries, which areU.S. depository institutions:
March 31, 2012 December 31, 2011
Amount Ratio Amount Ratio
(dollars in millions)
Total capital (to RWAs):Morgan Stanley Bank, N.A. . . . . . . . . . . . . . . . . . . . . . . . . . . . . . . . $10,496 17.4% $10,222 17.8%Morgan Stanley Private Bank, National Association . . . . . . . . . . . . $ 1,298 27.8% $ 1,278 31.9%
Tier I capital (to RWAs):Morgan Stanley Bank, N.A. . . . . . . . . . . . . . . . . . . . . . . . . . . . . . . . $ 8,980 14.9% $ 8,703 15.1%Morgan Stanley Private Bank, National Association . . . . . . . . . . . . $ 1,295 27.7% $ 1,275 31.8%
Leverage ratio:Morgan Stanley Bank, N.A. . . . . . . . . . . . . . . . . . . . . . . . . . . . . . . . $ 8,980 13.4% $ 8,703 13.2%Morgan Stanley Private Bank, National Association . . . . . . . . . . . . $ 1,295 10.6% $ 1,275 10.2%
Under regulatory capital requirements adopted by the U.S. federal banking agencies, U.S. depository institutions,in order to be considered well-capitalized, must maintain a ratio of total capital to RWAs of 10%, a capital ratioof Tier 1 capital to RWAs of 6%, and a ratio of Tier 1 capital to average book assets (leverage ratio) of5%. Each U.S. depository institution subsidiary of the Company must be well-capitalized in order for theCompany to continue to qualify as a financial holding company and to continue to engage in the broadest rangeof financial activities permitted for financial holding companies. At March 31, 2012 and December 31, 2011, the
69
MORGAN STANLEY
NOTES TO CONDENSED CONSOLIDATED FINANCIAL STATEMENTS—(Continued)
Company’s U.S. depository institutions maintained capital at levels in excess of the universally mandated well-capitalized levels. These subsidiary depository institutions maintain capital at levels sufficiently in excess of the“well-capitalized” requirements to address any additional capital needs and requirements identified by the federalbanking regulators.
MS&Co. and Other Broker-Dealers. MS&Co. is a registered broker-dealer and registered futures commissionmerchant and, accordingly, is subject to the minimum net capital requirements of the U.S. Securities andExchange Commission (“SEC”), the Financial Industry Regulatory Authority, Inc. and the U.S. CommodityFutures Trading Commission. MS&Co. has consistently operated with capital in excess of its regulatory capitalrequirements. MS&Co.’s net capital totaled $7,842 million and $8,249 million at March 31, 2012 andDecember 31, 2011, respectively, which exceeded the amount required by $6,660 million and $7,215 million,respectively. MS&Co. is required to hold tentative net capital in excess of $1 billion and net capital in excess of$500 million in accordance with the market and credit risk standards of Appendix E of SEC Rule 15c3-1.MS&Co. is also required to notify the SEC in the event that its tentative net capital is less than $5 billion. AtMarch 31, 2012, MS&Co. had tentative net capital in excess of the minimum and the notification requirements.
Morgan Stanley Smith Barney LLC is a registered broker-dealer and registered futures commission merchantand, accordingly, is subject to the minimum net capital requirements of the SEC, the Financial IndustryRegulatory Authority, Inc. and the U.S. Commodity Futures Trading Commission. Morgan Stanley Smith BarneyLLC has consistently operated with capital in excess of its regulatory capital requirements. Morgan StanleySmith Barney LLC clears certain customer activity directly and introduces other business to MS&Co. andCitigroup, Inc. MSIP, a London-based broker-dealer subsidiary, is subject to the capital requirements of theFinancial Services Authority, and MSMS, a Tokyo-based broker-dealer subsidiary, is subject to the capitalrequirements of the Financial Services Agency. MSIP and MSMS have consistently operated in excess of theirrespective regulatory capital requirements.
Other Regulated Subsidiaries. Certain other U.S. and non-U.S. subsidiaries are subject to various securities,commodities and banking regulations, and capital adequacy requirements promulgated by the regulatory andexchange authorities of the countries in which they operate. These subsidiaries have consistently operated inexcess of their local capital adequacy requirements.
Morgan Stanley Derivative Products Inc. (“MSDP”), a derivative products subsidiary rated Aa3 by Moody’s andAAA by S&P, maintains certain operating restrictions that have been reviewed by Moody’s and S&P. MSDP isoperated such that creditors of the Company should not expect to have any claims on the assets of MSDP, unlessand until the obligations to its own creditors are satisfied in full. Creditors of MSDP should not expect to haveany claims on the assets of the Company or any of its affiliates, other than the respective assets of MSDP.
13. Total Equity.
Morgan Stanley Shareholders’ Equity.
During the quarters ended March 31, 2012 and 2011, the Company did not purchase any of its common stock aspart of its share repurchase program. At March 31, 2012, the Company had approximately $1.6 billion remainingunder its current share repurchase authorization. Share repurchases by the Company are subject to regulatoryapproval.
70
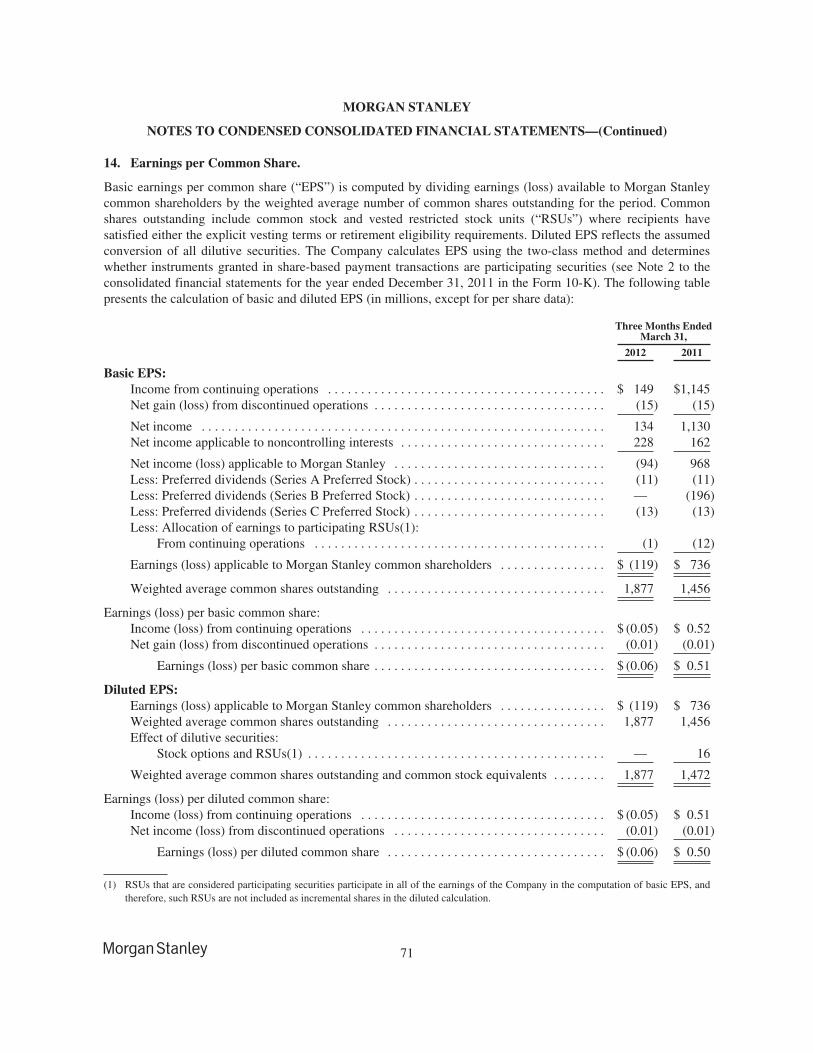
MORGAN STANLEY
NOTES TO CONDENSED CONSOLIDATED FINANCIAL STATEMENTS—(Continued)
14. Earnings per Common Share.
Basic earnings per common share (“EPS”) is computed by dividing earnings (loss) available to Morgan Stanleycommon shareholders by the weighted average number of common shares outstanding for the period. Commonshares outstanding include common stock and vested restricted stock units (“RSUs”) where recipients havesatisfied either the explicit vesting terms or retirement eligibility requirements. Diluted EPS reflects the assumedconversion of all dilutive securities. The Company calculates EPS using the two-class method and determineswhether instruments granted in share-based payment transactions are participating securities (see Note 2 to theconsolidated financial statements for the year ended December 31, 2011 in the Form 10-K). The following tablepresents the calculation of basic and diluted EPS (in millions, except for per share data):
Three Months EndedMarch 31,
2012 2011
Basic EPS:Income from continuing operations . . . . . . . . . . . . . . . . . . . . . . . . . . . . . . . . . . . . . . . . . . $ 149 $1,145Net gain (loss) from discontinued operations . . . . . . . . . . . . . . . . . . . . . . . . . . . . . . . . . . . (15) (15)
Net income . . . . . . . . . . . . . . . . . . . . . . . . . . . . . . . . . . . . . . . . . . . . . . . . . . . . . . . . . . . . . 134 1,130Net income applicable to noncontrolling interests . . . . . . . . . . . . . . . . . . . . . . . . . . . . . . . 228 162
Net income (loss) applicable to Morgan Stanley . . . . . . . . . . . . . . . . . . . . . . . . . . . . . . . . (94) 968Less: Preferred dividends (Series A Preferred Stock) . . . . . . . . . . . . . . . . . . . . . . . . . . . . . (11) (11)Less: Preferred dividends (Series B Preferred Stock) . . . . . . . . . . . . . . . . . . . . . . . . . . . . . — (196)Less: Preferred dividends (Series C Preferred Stock) . . . . . . . . . . . . . . . . . . . . . . . . . . . . . (13) (13)Less: Allocation of earnings to participating RSUs(1):
From continuing operations . . . . . . . . . . . . . . . . . . . . . . . . . . . . . . . . . . . . . . . . . . . . (1) (12)
Earnings (loss) applicable to Morgan Stanley common shareholders . . . . . . . . . . . . . . . . $ (119) $ 736
Weighted average common shares outstanding . . . . . . . . . . . . . . . . . . . . . . . . . . . . . . . . . 1,877 1,456
Earnings (loss) per basic common share:Income (loss) from continuing operations . . . . . . . . . . . . . . . . . . . . . . . . . . . . . . . . . . . . . $ (0.05) $ 0.52Net gain (loss) from discontinued operations . . . . . . . . . . . . . . . . . . . . . . . . . . . . . . . . . . . (0.01) (0.01)
Earnings (loss) per basic common share . . . . . . . . . . . . . . . . . . . . . . . . . . . . . . . . . . . $ (0.06) $ 0.51
Diluted EPS:Earnings (loss) applicable to Morgan Stanley common shareholders . . . . . . . . . . . . . . . . $ (119) $ 736Weighted average common shares outstanding . . . . . . . . . . . . . . . . . . . . . . . . . . . . . . . . . 1,877 1,456Effect of dilutive securities:
Stock options and RSUs(1) . . . . . . . . . . . . . . . . . . . . . . . . . . . . . . . . . . . . . . . . . . . . . — 16
Weighted average common shares outstanding and common stock equivalents . . . . . . . . 1,877 1,472
Earnings (loss) per diluted common share:Income (loss) from continuing operations . . . . . . . . . . . . . . . . . . . . . . . . . . . . . . . . . . . . . $ (0.05) $ 0.51Net income (loss) from discontinued operations . . . . . . . . . . . . . . . . . . . . . . . . . . . . . . . . (0.01) (0.01)
Earnings (loss) per diluted common share . . . . . . . . . . . . . . . . . . . . . . . . . . . . . . . . . $ (0.06) $ 0.50
(1) RSUs that are considered participating securities participate in all of the earnings of the Company in the computation of basic EPS, andtherefore, such RSUs are not included as incremental shares in the diluted calculation.
71
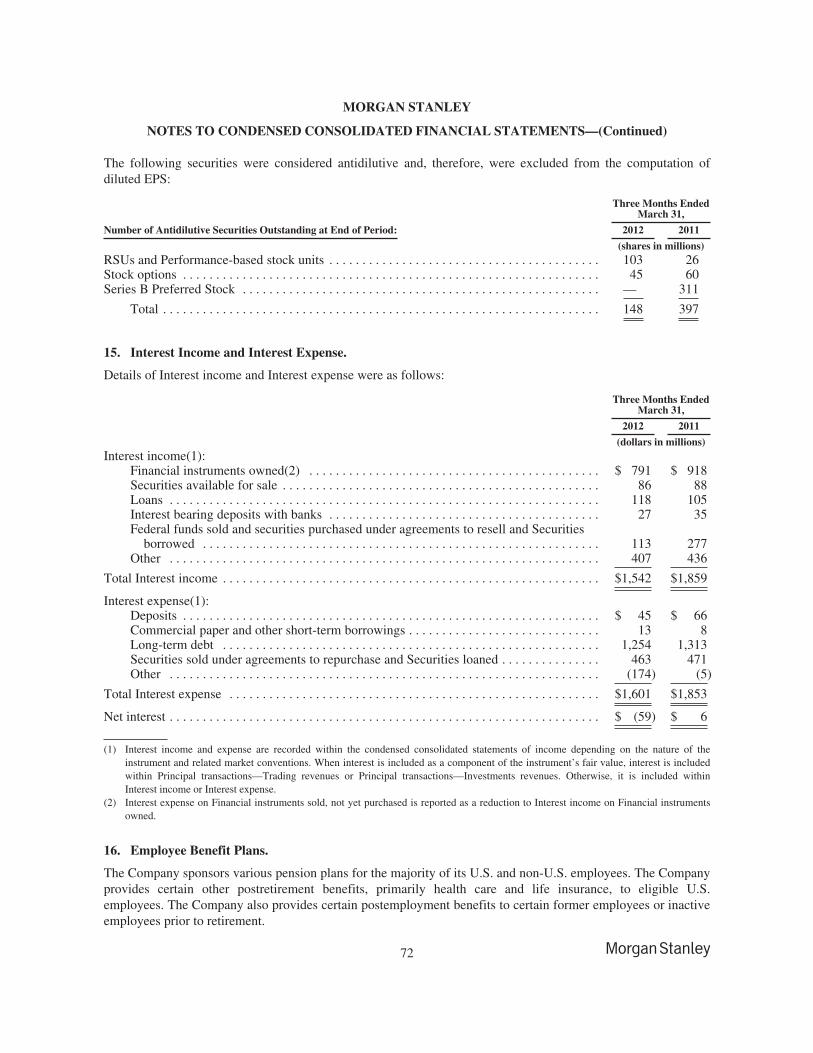
MORGAN STANLEY
NOTES TO CONDENSED CONSOLIDATED FINANCIAL STATEMENTS—(Continued)
The following securities were considered antidilutive and, therefore, were excluded from the computation ofdiluted EPS:
Three Months EndedMarch 31,
Number of Antidilutive Securities Outstanding at End of Period: 2012 2011
(shares in millions)RSUs and Performance-based stock units . . . . . . . . . . . . . . . . . . . . . . . . . . . . . . . . . . . . . . . . . 103 26Stock options . . . . . . . . . . . . . . . . . . . . . . . . . . . . . . . . . . . . . . . . . . . . . . . . . . . . . . . . . . . . . . . 45 60Series B Preferred Stock . . . . . . . . . . . . . . . . . . . . . . . . . . . . . . . . . . . . . . . . . . . . . . . . . . . . . . — 311
Total . . . . . . . . . . . . . . . . . . . . . . . . . . . . . . . . . . . . . . . . . . . . . . . . . . . . . . . . . . . . . . . . . . 148 397
15. Interest Income and Interest Expense.
Details of Interest income and Interest expense were as follows:
Three Months EndedMarch 31,
2012 2011
(dollars in millions)Interest income(1):
Financial instruments owned(2) . . . . . . . . . . . . . . . . . . . . . . . . . . . . . . . . . . . . . . . . . . . . $ 791 $ 918Securities available for sale . . . . . . . . . . . . . . . . . . . . . . . . . . . . . . . . . . . . . . . . . . . . . . . . 86 88Loans . . . . . . . . . . . . . . . . . . . . . . . . . . . . . . . . . . . . . . . . . . . . . . . . . . . . . . . . . . . . . . . . . 118 105Interest bearing deposits with banks . . . . . . . . . . . . . . . . . . . . . . . . . . . . . . . . . . . . . . . . . 27 35Federal funds sold and securities purchased under agreements to resell and Securities
borrowed . . . . . . . . . . . . . . . . . . . . . . . . . . . . . . . . . . . . . . . . . . . . . . . . . . . . . . . . . . . . 113 277Other . . . . . . . . . . . . . . . . . . . . . . . . . . . . . . . . . . . . . . . . . . . . . . . . . . . . . . . . . . . . . . . . . 407 436
Total Interest income . . . . . . . . . . . . . . . . . . . . . . . . . . . . . . . . . . . . . . . . . . . . . . . . . . . . . . . . . $1,542 $1,859
Interest expense(1):Deposits . . . . . . . . . . . . . . . . . . . . . . . . . . . . . . . . . . . . . . . . . . . . . . . . . . . . . . . . . . . . . . . $ 45 $ 66Commercial paper and other short-term borrowings . . . . . . . . . . . . . . . . . . . . . . . . . . . . . 13 8Long-term debt . . . . . . . . . . . . . . . . . . . . . . . . . . . . . . . . . . . . . . . . . . . . . . . . . . . . . . . . . 1,254 1,313Securities sold under agreements to repurchase and Securities loaned . . . . . . . . . . . . . . . 463 471Other . . . . . . . . . . . . . . . . . . . . . . . . . . . . . . . . . . . . . . . . . . . . . . . . . . . . . . . . . . . . . . . . . (174) (5)
Total Interest expense . . . . . . . . . . . . . . . . . . . . . . . . . . . . . . . . . . . . . . . . . . . . . . . . . . . . . . . . $1,601 $1,853
Net interest . . . . . . . . . . . . . . . . . . . . . . . . . . . . . . . . . . . . . . . . . . . . . . . . . . . . . . . . . . . . . . . . . $ (59) $ 6
(1) Interest income and expense are recorded within the condensed consolidated statements of income depending on the nature of theinstrument and related market conventions. When interest is included as a component of the instrument’s fair value, interest is includedwithin Principal transactions—Trading revenues or Principal transactions—Investments revenues. Otherwise, it is included withinInterest income or Interest expense.
(2) Interest expense on Financial instruments sold, not yet purchased is reported as a reduction to Interest income on Financial instrumentsowned.
16. Employee Benefit Plans.
The Company sponsors various pension plans for the majority of its U.S. and non-U.S. employees. The Companyprovides certain other postretirement benefits, primarily health care and life insurance, to eligible U.S.employees. The Company also provides certain postemployment benefits to certain former employees or inactiveemployees prior to retirement.
72
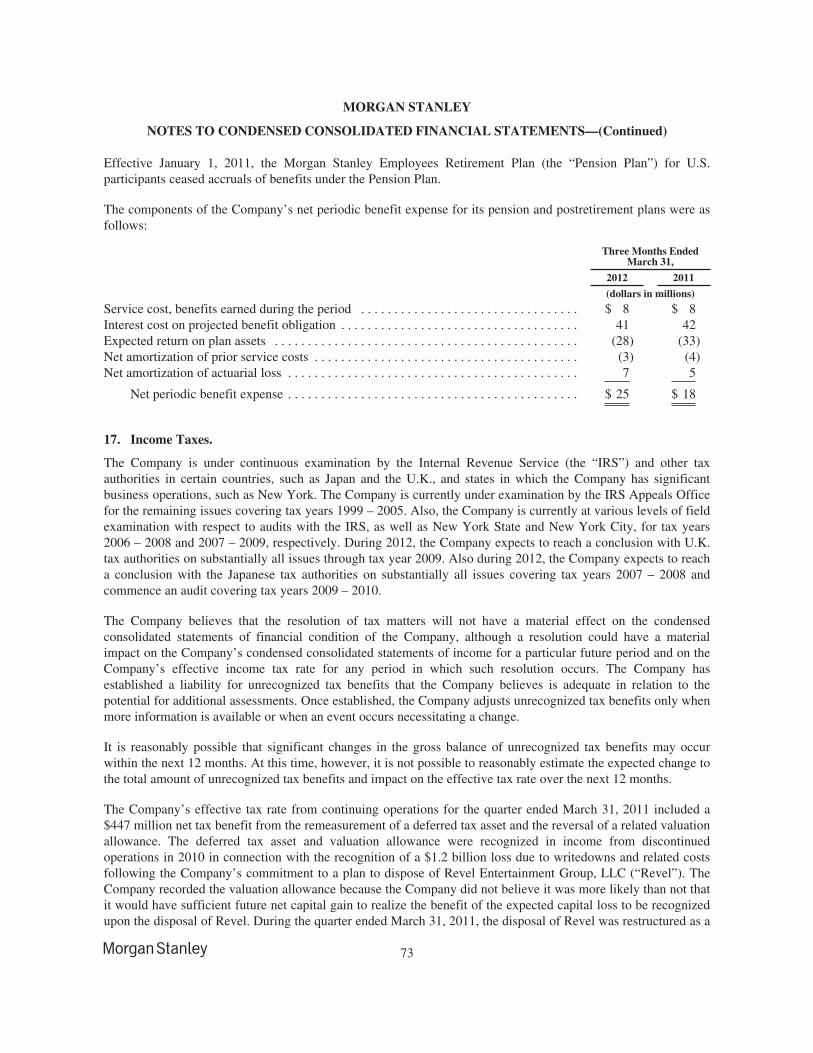
MORGAN STANLEY
NOTES TO CONDENSED CONSOLIDATED FINANCIAL STATEMENTS—(Continued)
Effective January 1, 2011, the Morgan Stanley Employees Retirement Plan (the “Pension Plan”) for U.S.participants ceased accruals of benefits under the Pension Plan.
The components of the Company’s net periodic benefit expense for its pension and postretirement plans were asfollows:
Three Months EndedMarch 31,
2012 2011
(dollars in millions)
Service cost, benefits earned during the period . . . . . . . . . . . . . . . . . . . . . . . . . . . . . . . . . $ 8 $ 8Interest cost on projected benefit obligation . . . . . . . . . . . . . . . . . . . . . . . . . . . . . . . . . . . . 41 42Expected return on plan assets . . . . . . . . . . . . . . . . . . . . . . . . . . . . . . . . . . . . . . . . . . . . . . (28) (33)Net amortization of prior service costs . . . . . . . . . . . . . . . . . . . . . . . . . . . . . . . . . . . . . . . . (3) (4)Net amortization of actuarial loss . . . . . . . . . . . . . . . . . . . . . . . . . . . . . . . . . . . . . . . . . . . . 7 5
Net periodic benefit expense . . . . . . . . . . . . . . . . . . . . . . . . . . . . . . . . . . . . . . . . . . . . $ 25 $ 18
17. Income Taxes.
The Company is under continuous examination by the Internal Revenue Service (the “IRS”) and other taxauthorities in certain countries, such as Japan and the U.K., and states in which the Company has significantbusiness operations, such as New York. The Company is currently under examination by the IRS Appeals Officefor the remaining issues covering tax years 1999 – 2005. Also, the Company is currently at various levels of fieldexamination with respect to audits with the IRS, as well as New York State and New York City, for tax years2006 – 2008 and 2007 – 2009, respectively. During 2012, the Company expects to reach a conclusion with U.K.tax authorities on substantially all issues through tax year 2009. Also during 2012, the Company expects to reacha conclusion with the Japanese tax authorities on substantially all issues covering tax years 2007 – 2008 andcommence an audit covering tax years 2009 – 2010.
The Company believes that the resolution of tax matters will not have a material effect on the condensedconsolidated statements of financial condition of the Company, although a resolution could have a materialimpact on the Company’s condensed consolidated statements of income for a particular future period and on theCompany’s effective income tax rate for any period in which such resolution occurs. The Company hasestablished a liability for unrecognized tax benefits that the Company believes is adequate in relation to thepotential for additional assessments. Once established, the Company adjusts unrecognized tax benefits only whenmore information is available or when an event occurs necessitating a change.
It is reasonably possible that significant changes in the gross balance of unrecognized tax benefits may occurwithin the next 12 months. At this time, however, it is not possible to reasonably estimate the expected change tothe total amount of unrecognized tax benefits and impact on the effective tax rate over the next 12 months.
The Company’s effective tax rate from continuing operations for the quarter ended March 31, 2011 included a$447 million net tax benefit from the remeasurement of a deferred tax asset and the reversal of a related valuationallowance. The deferred tax asset and valuation allowance were recognized in income from discontinuedoperations in 2010 in connection with the recognition of a $1.2 billion loss due to writedowns and related costsfollowing the Company’s commitment to a plan to dispose of Revel Entertainment Group, LLC (“Revel”). TheCompany recorded the valuation allowance because the Company did not believe it was more likely than not thatit would have sufficient future net capital gain to realize the benefit of the expected capital loss to be recognizedupon the disposal of Revel. During the quarter ended March 31, 2011, the disposal of Revel was restructured as a
73
MORGAN STANLEY
NOTES TO CONDENSED CONSOLIDATED FINANCIAL STATEMENTS—(Continued)
tax-free like kind exchange and the disposal was completed. The restructured transaction changed the characterof the future taxable loss to ordinary. The Company reversed the valuation allowance because the Companybelieves it is more likely than not that it will have sufficient future ordinary taxable income to recognize therecorded deferred tax asset. In accordance with the applicable accounting literature, this reversal of a previouslyestablished valuation allowance due to a change in circumstances was recognized in income from continuingoperations.
18. Segment and Geographic Information.
Segment Information.
The Company structures its segments primarily based upon the nature of the financial products and servicesprovided to customers and the Company’s management organization. The Company provides a wide range offinancial products and services to its customers in each of its business segments: Institutional Securities, GlobalWealth Management Group and Asset Management. For further discussion of the Company’s business segments,see Note 1.
Revenues and expenses directly associated with each respective segment are included in determining itsoperating results. Other revenues and expenses that are not directly attributable to a particular segment areallocated based upon the Company’s allocation methodologies, generally based on each segment’s respective netrevenues, non-interest expenses or other relevant measures.
As a result of treating certain intersegment transactions as transactions with external parties, the Company includesan Intersegment Eliminations category to reconcile the business segment results to the Company’s consolidatedresults. Intersegment eliminations also reflect the effect of fees paid by the Institutional Securities business segmentto the Global Wealth Management Group business segment related to the bank deposit program.
Selected financial information for the Company’s segments is presented below:
Three Months Ended March 31, 2012Institutional
Securities
Global WealthManagement
GroupAsset
ManagementIntersegmentEliminations Total
(dollars in millions)
Total non-interest revenues . . . . . . . . . . . . . . . . . . . . . . . $3,484 $3,004 $541 $ (35) $6,994Net interest . . . . . . . . . . . . . . . . . . . . . . . . . . . . . . . . . . . (461) 410 (8) — (59)
Net revenues(1) . . . . . . . . . . . . . . . . . . . . . . . . . . . . . . . . $3,023 $3,414 $533 $ (35) $6,935
Income (loss) from continuing operationsbefore income taxes . . . . . . . . . . . . . . . . . . . . . . . . . . . $ (312) $ 387 $128 $— $ 203
Provision for (benefit from) income taxes . . . . . . . . . . . (105) 121 38 — 54
Income (loss) from continuing operations . . . . . . . . . . . (207) 266 90 — 149
Discontinued operations(2):Gain from discontinued operations . . . . . . . . . . . . . 24 2 1 — 27Provision for income taxes . . . . . . . . . . . . . . . . . . . 41 1 — — 42
Net gain (loss) on discontinued operations . . . (17) 1 1 — (15)
Net income (loss) . . . . . . . . . . . . . . . . . . . . . . . . . . . . . . . (224) 267 91 — 134Net income applicable to noncontrolling interests . . . . . 89 74 65 — 228
Net income (loss) applicable to Morgan Stanley . . . . . . $ (313) $ 193 $ 26 $— $ (94)
74
MORGAN STANLEY
NOTES TO CONDENSED CONSOLIDATED FINANCIAL STATEMENTS—(Continued)
Three Months Ended March 31, 2011Institutional
Securities
Global WealthManagement
GroupAsset
ManagementIntersegmentEliminations Total
(dollars in millions)Total non-interest revenues . . . . . . . . . . . . . . . . . . . . . . . . $3,895 $3,063 $630 $ (20) $7,568Net interest . . . . . . . . . . . . . . . . . . . . . . . . . . . . . . . . . . . . (327) 341 (8) — 6
Net revenues(1) . . . . . . . . . . . . . . . . . . . . . . . . . . . . . . . . . $3,568 $3,404 $622 $ (20) $7,574
Income from continuing operations before incometaxes . . . . . . . . . . . . . . . . . . . . . . . . . . . . . . . . . . . . . . . . $ 432 $ 344 $125 $— $ 901
Provision for (benefit from) income taxes . . . . . . . . . . . . (363) 89 30 — (244)
Income from continuing operations . . . . . . . . . . . . . . . . . 795 255 95 — 1,145
Discontinued operations(2):Gain (loss) from discontinued operations . . . . . . . . . (38) 3 6 1 (28)Provision for (benefit from) income taxes . . . . . . . . (15) 1 — 1 (13)
Net gain (loss) on discontinued operations . . . . (23) 2 6 — (15)
Net income . . . . . . . . . . . . . . . . . . . . . . . . . . . . . . . . . . . . 772 257 101 — 1,130Net income applicable to noncontrolling interests . . . . . . 61 74 27 — 162
Net income applicable to Morgan Stanley . . . . . . . . . . . . $ 711 $ 183 $ 74 $— $ 968
(1) In certain management fee arrangements, the Company is entitled to receive performance-based fees (also referred to as incentive fees)when the return on assets under management exceeds certain benchmark returns or other performance targets. In such arrangements,performance fee revenue is accrued (or reversed) quarterly based on measuring account fund performance to date versus the performancebenchmark stated in the investment management agreement. The amount of performance-based fee revenue at risk of reversing if fundperformance falls below stated investment management agreement benchmarks was approximately $175 million at March 31, 2012 andapproximately $179 million at December 31, 2011 (see Note 2 to the consolidated financial statements for the year ended December 31,2011 included in the Form 10-K).
(2) See Notes 1 and 20 for discussion of discontinued operations.
Net InterestInstitutional
Securities
Global WealthManagement
GroupAsset
ManagementIntersegmentEliminations Total
(dollars in millions)Three Months Ended March 31 2012Interest income . . . . . . . . . . . . . . . . . . . . . . . . . . $1,145 $490 $ 3 $ (96) $1,542Interest expense . . . . . . . . . . . . . . . . . . . . . . . . . . 1,606 80 11 (96) 1,601
Net interest . . . . . . . . . . . . . . . . . . . . . . . . . $ (461) $410 $ (8) $— $ (59)
Three Months Ended March 31 2011Interest income . . . . . . . . . . . . . . . . . . . . . . . . . . $1,486 $453 $ 4 $ (84) $1,859Interest expense . . . . . . . . . . . . . . . . . . . . . . . . . . 1,813 112 12 (84) 1,853
Net interest . . . . . . . . . . . . . . . . . . . . . . . . . $ (327) $341 $ (8) $— $ 6
Total Assets(1)Institutional
Securities
Global WealthManagement
GroupAsset
Management Total
(dollars in millions)At March 31, 2012 . . . . . . . . . . . . . . . . . . . . . . . . . . . . . . . . . $670,662 $103,235 $7,133 $781,030
At December 31, 2011 . . . . . . . . . . . . . . . . . . . . . . . . . . . . . . $641,456 $101,427 $7,015 $749,898
(1) Corporate assets have been fully allocated to the Company’s business segments.
75
MORGAN STANLEY
NOTES TO CONDENSED CONSOLIDATED FINANCIAL STATEMENTS—(Continued)
Geographic Information.
The Company operates in both U.S. and non-U.S. markets. The Company’s non-U.S. business activities areprincipally conducted through European and Asian locations. The net revenues disclosed in the following tablereflect the regional view of the Company’s consolidated net revenues on a managed basis, based on the followingmethodology:
• Institutional Securities: advisory and equity underwriting—client location, debt underwriting—revenuerecording location, sales and trading—trading desk location.
• Global Wealth Management Group: global representative coverage location.
• Asset Management: client location, except for Merchant Banking and Real Estate Investing businesses,which are based on asset location.
Three Months EndedMarch 31,
Net Revenues 2012 2011
(dollars in millions)
Americas . . . . . . . . . . . . . . . . . . . . . . . . . . . . . . . . . . . . . . . . . . . . . . . . . . . . . . . . . . . . . . . . . . $4,790 $5,466Europe, Middle East, and Africa . . . . . . . . . . . . . . . . . . . . . . . . . . . . . . . . . . . . . . . . . . . . . . . . 1,154 1,667Asia . . . . . . . . . . . . . . . . . . . . . . . . . . . . . . . . . . . . . . . . . . . . . . . . . . . . . . . . . . . . . . . . . . . . . . 991 441
Net revenues . . . . . . . . . . . . . . . . . . . . . . . . . . . . . . . . . . . . . . . . . . . . . . . . . . . . . . . . . . . $6,935 $7,574
19. Equity Method Investments.
The Company has investments accounted for under the equity method of accounting (see Note 1) of $4,384million and $4,524 million at March 31, 2012 and December 31, 2011, respectively, included in Otherinvestments in the condensed consolidated statements of financial condition. Losses from these investments were$32 million and $660 million for the quarters ended March 31, 2012 and 2011, respectively and are included inOther revenues in the condensed consolidated statements of income. The loss for 2011 included the loss relatedto the Company’s 40% stake in MUMSS, as described below. See Note 24 to the consolidated financialstatements for the year ended December 31, 2011 included in the Form 10-K for further information.
Japanese Securities Joint Venture
On May 1, 2010, the Company and Mitsubishi UFJ Financial Group, Inc. (“MUFG”) formed a joint venture inJapan of their respective investment banking and securities businesses. MUFG and the Company have integratedtheir respective Japanese securities companies by forming two joint venture companies. MUFG contributed theinvestment banking, wholesale and retail securities businesses conducted in Japan by Mitsubishi UFJ SecuritiesCo., Ltd. into Mitsubishi UFJ Morgan Stanley Securities Co., Ltd. (“MUMSS”). The Company contributed theinvestment banking operations conducted in Japan by its subsidiary MSMS, formerly known as Morgan StanleyJapan Securities Co., Ltd., into MUMSS (MSMS, together with MUMSS, the “Joint Venture”). MSMS willcontinue its sales and trading and capital markets business conducted in Japan. Following the respectivecontributions to the Joint Venture and a cash payment of 23 billion yen ($247 million), from MUFG to theCompany, the Company owns a 40% economic interest in the Joint Venture and MUFG owns a 60% economicinterest in the Joint Venture.
The Company holds a 40% voting interest and MUFG holds a 60% voting interest in MUMSS, while theCompany holds a 51% voting interest and MUFG holds a 49% voting interest in MSMS. The Companycontinues to consolidate MSMS in its consolidated financial statements and, commencing on May 1, 2010,
76
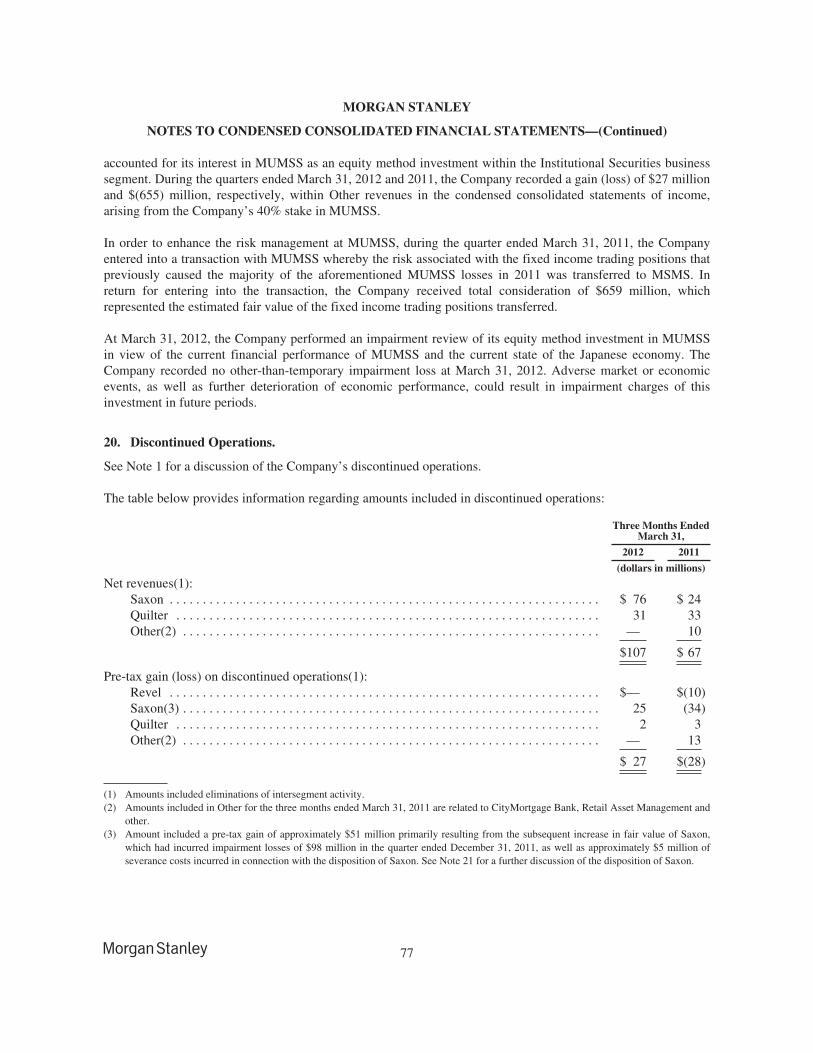
MORGAN STANLEY
NOTES TO CONDENSED CONSOLIDATED FINANCIAL STATEMENTS—(Continued)
accounted for its interest in MUMSS as an equity method investment within the Institutional Securities businesssegment. During the quarters ended March 31, 2012 and 2011, the Company recorded a gain (loss) of $27 millionand $(655) million, respectively, within Other revenues in the condensed consolidated statements of income,arising from the Company’s 40% stake in MUMSS.
In order to enhance the risk management at MUMSS, during the quarter ended March 31, 2011, the Companyentered into a transaction with MUMSS whereby the risk associated with the fixed income trading positions thatpreviously caused the majority of the aforementioned MUMSS losses in 2011 was transferred to MSMS. Inreturn for entering into the transaction, the Company received total consideration of $659 million, whichrepresented the estimated fair value of the fixed income trading positions transferred.
At March 31, 2012, the Company performed an impairment review of its equity method investment in MUMSSin view of the current financial performance of MUMSS and the current state of the Japanese economy. TheCompany recorded no other-than-temporary impairment loss at March 31, 2012. Adverse market or economicevents, as well as further deterioration of economic performance, could result in impairment charges of thisinvestment in future periods.
20. Discontinued Operations.
See Note 1 for a discussion of the Company’s discontinued operations.
The table below provides information regarding amounts included in discontinued operations:
Three Months EndedMarch 31,
2012 2011
(dollars in millions)
Net revenues(1):Saxon . . . . . . . . . . . . . . . . . . . . . . . . . . . . . . . . . . . . . . . . . . . . . . . . . . . . . . . . . . . . . . . . . $ 76 $ 24Quilter . . . . . . . . . . . . . . . . . . . . . . . . . . . . . . . . . . . . . . . . . . . . . . . . . . . . . . . . . . . . . . . . 31 33Other(2) . . . . . . . . . . . . . . . . . . . . . . . . . . . . . . . . . . . . . . . . . . . . . . . . . . . . . . . . . . . . . . . — 10
$107 $ 67
Pre-tax gain (loss) on discontinued operations(1):Revel . . . . . . . . . . . . . . . . . . . . . . . . . . . . . . . . . . . . . . . . . . . . . . . . . . . . . . . . . . . . . . . . . $— $(10)Saxon(3) . . . . . . . . . . . . . . . . . . . . . . . . . . . . . . . . . . . . . . . . . . . . . . . . . . . . . . . . . . . . . . . 25 (34)Quilter . . . . . . . . . . . . . . . . . . . . . . . . . . . . . . . . . . . . . . . . . . . . . . . . . . . . . . . . . . . . . . . . 2 3Other(2) . . . . . . . . . . . . . . . . . . . . . . . . . . . . . . . . . . . . . . . . . . . . . . . . . . . . . . . . . . . . . . . — 13
$ 27 $(28)
(1) Amounts included eliminations of intersegment activity.(2) Amounts included in Other for the three months ended March 31, 2011 are related to CityMortgage Bank, Retail Asset Management and
other.(3) Amount included a pre-tax gain of approximately $51 million primarily resulting from the subsequent increase in fair value of Saxon,
which had incurred impairment losses of $98 million in the quarter ended December 31, 2011, as well as approximately $5 million ofseverance costs incurred in connection with the disposition of Saxon. See Note 21 for a further discussion of the disposition of Saxon.
77
MORGAN STANLEY
NOTES TO CONDENSED CONSOLIDATED FINANCIAL STATEMENTS—(Continued)
21. Subsequent Events.
Common Dividend.
On April 19, 2012, the Company announced that its Board of Directors declared a quarterly dividend percommon share of $0.05. The dividend is payable on May 15, 2012 to common shareholders of record onApril 30, 2012.
Long-Term Borrowings.
Subsequent to March 31, 2012 and through April 30, 2012, the Company’s long-term borrowings (net ofissuances) decreased by approximately $1.6 billion.
Quilter.
On April 2, 2012, the Company closed the sale of Quilter, its retail wealth management business in the U.K. TheCompany has classified Quilter as held for sale within the Global Wealth Management Group business segmentand the results of its operations are presented as discontinued operations for all periods presented.
Saxon.
On October 24, 2011, the Company announced that it had reached an agreement to sell Saxon, a provider ofservicing and subservicing of residential mortgage loans, to Ocwen Financial Corporation. During the firstquarter of 2012, the transaction was restructured as a sale of Saxon’s assets, the first phase of which wascompleted in the second quarter of 2012. The remaining operations of Saxon are expected to be wound downwithin the year. The Company expects to incur incremental wind-down costs in future periods. The results ofSaxon are reported as discontinued operations within the Institutional Securities business segment for all periodspresented.
78
REPORT OF INDEPENDENT REGISTERED PUBLIC ACCOUNTING FIRM
To the Board of Directors and Shareholders of Morgan Stanley:
We have reviewed the accompanying condensed consolidated statement of financial condition of Morgan Stanleyand subsidiaries (the “Company”) as of March 31, 2012, and the related condensed consolidated statements ofincome, comprehensive income, cash flows and changes in total equity for the three-month periods endedMarch 31, 2012 and March 31, 2011. These condensed consolidated financial statements are the responsibility ofthe management of the Company.
We conducted our reviews in accordance with the standards of the Public Company Accounting Oversight Board(United States). A review of interim financial information consists principally of applying analytical proceduresand making inquiries of persons responsible for financial and accounting matters. It is substantially less in scopethan an audit conducted in accordance with the standards of the Public Company Accounting Oversight Board(United States), the objective of which is the expression of an opinion regarding the financial statements taken asa whole. Accordingly, we do not express such an opinion.
Based on our review, we are not aware of any material modifications that should be made to such condensedconsolidated financial statements for them to be in conformity with accounting principles generally accepted inthe United States of America.
We have previously audited, in accordance with the standards of the Public Company Accounting OversightBoard (United States), the consolidated statement of financial condition of the Company as of December 31,2011, and the related consolidated statements of income, comprehensive income, cash flows and changes in totalequity for the year then ended (not presented herein) included in the Company’s Annual Report on Form 10-K;and in our report dated February 27, 2012, we expressed an unqualified opinion on those consolidated financialstatements. In our opinion, the information set forth in the accompanying condensed consolidated statement offinancial condition as of December 31, 2011 is fairly stated, in all material respects, in relation to theconsolidated statement of financial condition from which it has been derived.
/s/ Deloitte & Touche LLP
New York, New YorkMay 7, 2012
79
Item 2. Management’s Discussion and Analysis of Financial Condition and Results ofOperations.
Introduction.
Morgan Stanley, a financial holding company, is a global financial services firm that maintains significantmarket positions in each of its business segments—Institutional Securities, Global Wealth Management Groupand Asset Management. The Company, through its subsidiaries and affiliates, provides a wide variety of productsand services to a large and diversified group of clients and customers, including corporations, governments,financial institutions and individuals. Unless the context otherwise requires, the terms “Morgan Stanley” and the“Company” mean Morgan Stanley and its consolidated subsidiaries.
A summary of the activities of each of the Company’s business segments is as follows:
Institutional Securities provides capital raising; financial advisory services, including advice on mergers andacquisitions, restructurings, real estate and project finance; corporate lending; sales, trading, financing andmarket-making activities in equity and fixed income securities and related products, including foreignexchange and commodities; and investment activities.
Global Wealth Management Group, which includes the Company’s 51% interest in Morgan Stanley SmithBarney Holdings LLC (“MSSB”), provides brokerage and investment advisory services to individualinvestors and small-to-medium sized businesses and institutions covering various investment alternatives;financial and wealth planning services; annuity and other insurance products; credit and other lendingproducts; cash management services; retirement services; and trust and fiduciary services and engages infixed income principal trading, which primarily facilitates clients’ trading or investments in such securities.
Asset Management provides a broad array of investment strategies that span the risk/return spectrum acrossgeographies, asset classes and public and private markets to a diverse group of clients across theinstitutional and intermediary channels as well as high net worth clients.
See Notes 1 and 20 to the condensed consolidated financial statements for a discussion of the Company’sdiscontinued operations.
The results of operations in the past have been, and in the future may continue to be, materially affected by manyfactors, including the effect of economic and political conditions and geopolitical events; the effect of marketconditions, particularly in the global equity, fixed income, credit and commodities markets, including corporateand mortgage (commercial and residential) lending and commercial real estate markets; the impact of current,pending and future legislation (including the Dodd-Frank Wall Street Reform and Consumer Protection Act (the“Dodd-Frank Act”)), regulation (including capital, leverage and liquidity requirements), and legal actions in theUnited States of America (“U.S.”) and worldwide; the level and volatility of equity, fixed income, andcommodity prices and interest rates, currency values and other market indices; the availability and cost of bothcredit and capital as well as the credit ratings assigned to the Company’s unsecured short-term and long-termdebt; investor sentiment and confidence in the financial markets; the performance of the Company’s acquisitions,joint ventures, strategic alliances or other strategic arrangements (including MSSB and with Mitsubishi UFJFinancial Group, Inc. (“MUFG”)); the Company’s reputation; inflation, natural disasters and acts of war orterrorism; the actions and initiatives of current and potential competitors as well as governments, regulators andself-regulatory organizations and technological changes; or a combination of these or other factors. In addition,legislative, legal and regulatory developments related to the Company’s businesses are likely to increase costs,thereby affecting results of operations. These factors also may have an impact on the Company’s ability toachieve its strategic objectives. For a further discussion of these and other important factors that could affect theCompany’s business, see “Business—Competition” and “Business—Supervision and Regulation” in Part I,Item 1 and “Risk Factors” in Part I, Item 1A of the Company’s Annual Report on Form 10-K for the year endedDecember 31, 2011 (the “Form 10-K”) and “Other Matters” herein.
80
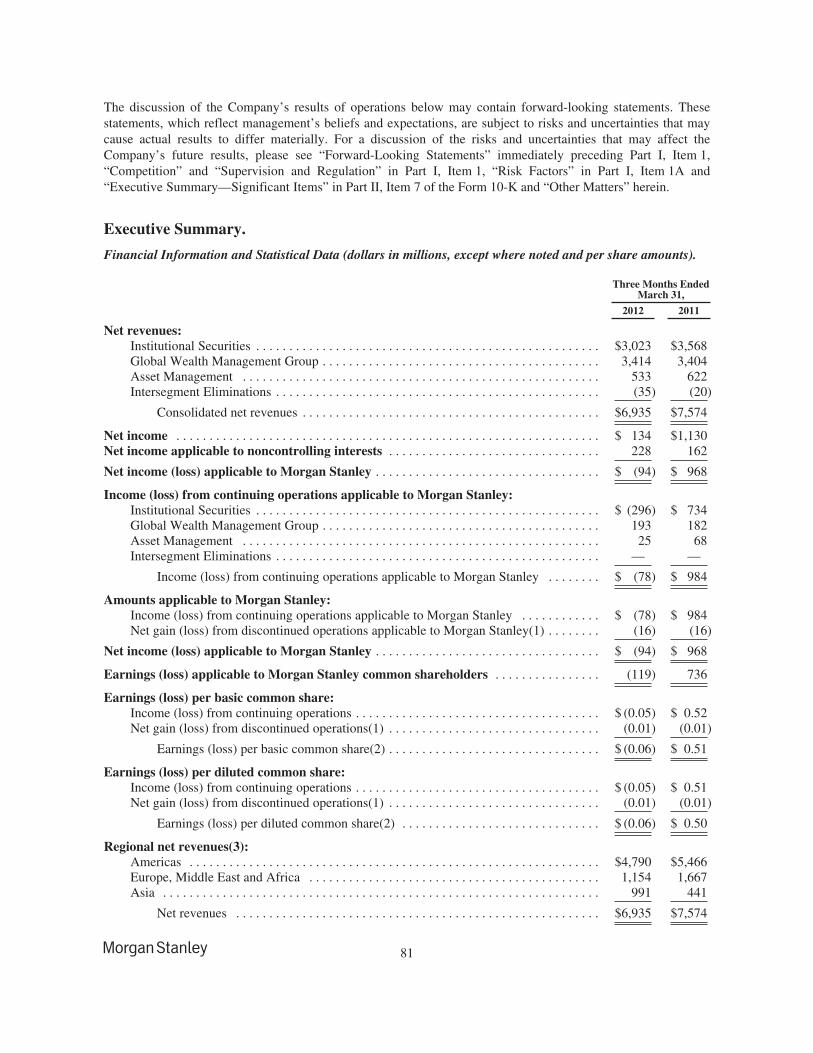
The discussion of the Company’s results of operations below may contain forward-looking statements. Thesestatements, which reflect management’s beliefs and expectations, are subject to risks and uncertainties that maycause actual results to differ materially. For a discussion of the risks and uncertainties that may affect theCompany’s future results, please see “Forward-Looking Statements” immediately preceding Part I, Item 1,“Competition” and “Supervision and Regulation” in Part I, Item 1, “Risk Factors” in Part I, Item 1A and“Executive Summary—Significant Items” in Part II, Item 7 of the Form 10-K and “Other Matters” herein.
Executive Summary.
Financial Information and Statistical Data (dollars in millions, except where noted and per share amounts).
Three Months EndedMarch 31,
2012 2011
Net revenues:Institutional Securities . . . . . . . . . . . . . . . . . . . . . . . . . . . . . . . . . . . . . . . . . . . . . . . . . . . . $3,023 $3,568Global Wealth Management Group . . . . . . . . . . . . . . . . . . . . . . . . . . . . . . . . . . . . . . . . . . 3,414 3,404Asset Management . . . . . . . . . . . . . . . . . . . . . . . . . . . . . . . . . . . . . . . . . . . . . . . . . . . . . . 533 622Intersegment Eliminations . . . . . . . . . . . . . . . . . . . . . . . . . . . . . . . . . . . . . . . . . . . . . . . . . (35) (20)
Consolidated net revenues . . . . . . . . . . . . . . . . . . . . . . . . . . . . . . . . . . . . . . . . . . . . . $6,935 $7,574
Net income . . . . . . . . . . . . . . . . . . . . . . . . . . . . . . . . . . . . . . . . . . . . . . . . . . . . . . . . . . . . . . . . $ 134 $1,130Net income applicable to noncontrolling interests . . . . . . . . . . . . . . . . . . . . . . . . . . . . . . . . 228 162
Net income (loss) applicable to Morgan Stanley . . . . . . . . . . . . . . . . . . . . . . . . . . . . . . . . . . $ (94) $ 968
Income (loss) from continuing operations applicable to Morgan Stanley:Institutional Securities . . . . . . . . . . . . . . . . . . . . . . . . . . . . . . . . . . . . . . . . . . . . . . . . . . . . $ (296) $ 734Global Wealth Management Group . . . . . . . . . . . . . . . . . . . . . . . . . . . . . . . . . . . . . . . . . . 193 182Asset Management . . . . . . . . . . . . . . . . . . . . . . . . . . . . . . . . . . . . . . . . . . . . . . . . . . . . . . 25 68Intersegment Eliminations . . . . . . . . . . . . . . . . . . . . . . . . . . . . . . . . . . . . . . . . . . . . . . . . . — —
Income (loss) from continuing operations applicable to Morgan Stanley . . . . . . . . $ (78) $ 984
Amounts applicable to Morgan Stanley:Income (loss) from continuing operations applicable to Morgan Stanley . . . . . . . . . . . . $ (78) $ 984Net gain (loss) from discontinued operations applicable to Morgan Stanley(1) . . . . . . . . (16) (16)
Net income (loss) applicable to Morgan Stanley . . . . . . . . . . . . . . . . . . . . . . . . . . . . . . . . . . $ (94) $ 968
Earnings (loss) applicable to Morgan Stanley common shareholders . . . . . . . . . . . . . . . . (119) 736
Earnings (loss) per basic common share:Income (loss) from continuing operations . . . . . . . . . . . . . . . . . . . . . . . . . . . . . . . . . . . . . $ (0.05) $ 0.52Net gain (loss) from discontinued operations(1) . . . . . . . . . . . . . . . . . . . . . . . . . . . . . . . . (0.01) (0.01)
Earnings (loss) per basic common share(2) . . . . . . . . . . . . . . . . . . . . . . . . . . . . . . . . $ (0.06) $ 0.51
Earnings (loss) per diluted common share:Income (loss) from continuing operations . . . . . . . . . . . . . . . . . . . . . . . . . . . . . . . . . . . . . $ (0.05) $ 0.51Net gain (loss) from discontinued operations(1) . . . . . . . . . . . . . . . . . . . . . . . . . . . . . . . . (0.01) (0.01)
Earnings (loss) per diluted common share(2) . . . . . . . . . . . . . . . . . . . . . . . . . . . . . . $ (0.06) $ 0.50
Regional net revenues(3):Americas . . . . . . . . . . . . . . . . . . . . . . . . . . . . . . . . . . . . . . . . . . . . . . . . . . . . . . . . . . . . . . $4,790 $5,466Europe, Middle East and Africa . . . . . . . . . . . . . . . . . . . . . . . . . . . . . . . . . . . . . . . . . . . . 1,154 1,667Asia . . . . . . . . . . . . . . . . . . . . . . . . . . . . . . . . . . . . . . . . . . . . . . . . . . . . . . . . . . . . . . . . . . 991 441
Net revenues . . . . . . . . . . . . . . . . . . . . . . . . . . . . . . . . . . . . . . . . . . . . . . . . . . . . . . . $6,935 $7,574
81
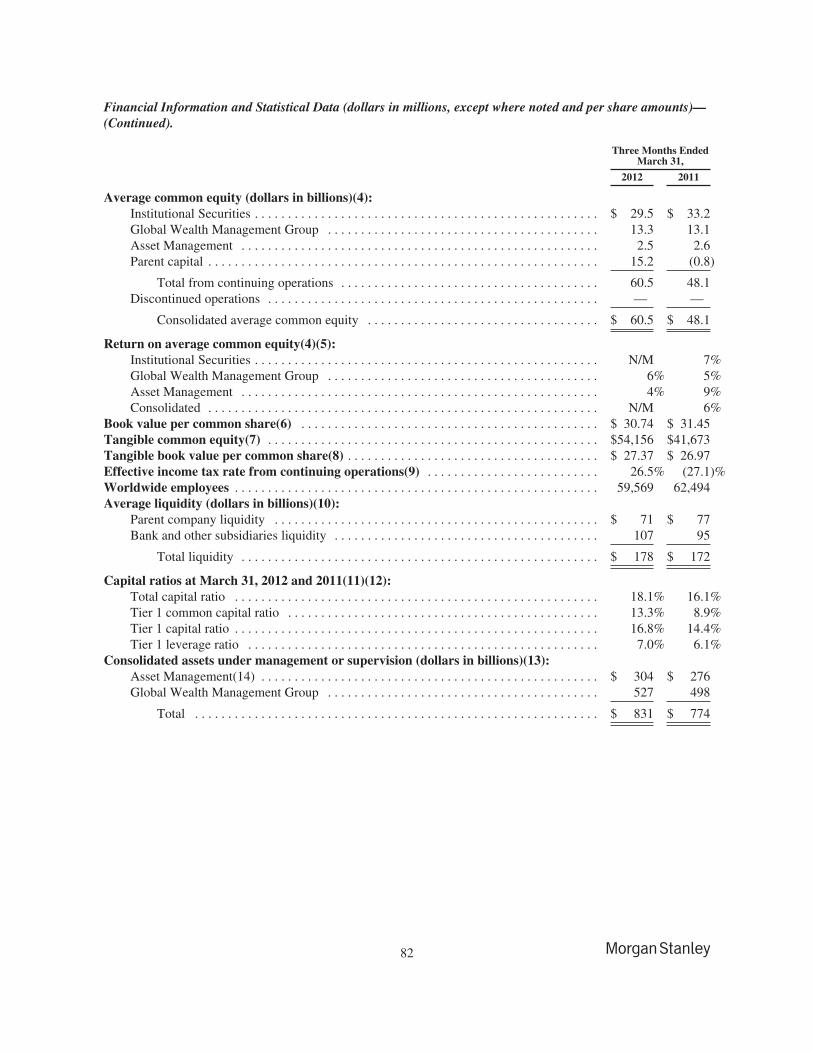
Financial Information and Statistical Data (dollars in millions, except where noted and per share amounts)—(Continued).
Three Months EndedMarch 31,
2012 2011
Average common equity (dollars in billions)(4):Institutional Securities . . . . . . . . . . . . . . . . . . . . . . . . . . . . . . . . . . . . . . . . . . . . . . . . . . . . $ 29.5 $ 33.2Global Wealth Management Group . . . . . . . . . . . . . . . . . . . . . . . . . . . . . . . . . . . . . . . . . 13.3 13.1Asset Management . . . . . . . . . . . . . . . . . . . . . . . . . . . . . . . . . . . . . . . . . . . . . . . . . . . . . . 2.5 2.6Parent capital . . . . . . . . . . . . . . . . . . . . . . . . . . . . . . . . . . . . . . . . . . . . . . . . . . . . . . . . . . . 15.2 (0.8)
Total from continuing operations . . . . . . . . . . . . . . . . . . . . . . . . . . . . . . . . . . . . . . . 60.5 48.1Discontinued operations . . . . . . . . . . . . . . . . . . . . . . . . . . . . . . . . . . . . . . . . . . . . . . . . . . — —
Consolidated average common equity . . . . . . . . . . . . . . . . . . . . . . . . . . . . . . . . . . . $ 60.5 $ 48.1
Return on average common equity(4)(5):Institutional Securities . . . . . . . . . . . . . . . . . . . . . . . . . . . . . . . . . . . . . . . . . . . . . . . . . . . . N/M 7%Global Wealth Management Group . . . . . . . . . . . . . . . . . . . . . . . . . . . . . . . . . . . . . . . . . 6% 5%Asset Management . . . . . . . . . . . . . . . . . . . . . . . . . . . . . . . . . . . . . . . . . . . . . . . . . . . . . . 4% 9%Consolidated . . . . . . . . . . . . . . . . . . . . . . . . . . . . . . . . . . . . . . . . . . . . . . . . . . . . . . . . . . . N/M 6%
Book value per common share(6) . . . . . . . . . . . . . . . . . . . . . . . . . . . . . . . . . . . . . . . . . . . . . $ 30.74 $ 31.45Tangible common equity(7) . . . . . . . . . . . . . . . . . . . . . . . . . . . . . . . . . . . . . . . . . . . . . . . . . . $54,156 $41,673Tangible book value per common share(8) . . . . . . . . . . . . . . . . . . . . . . . . . . . . . . . . . . . . . . $ 27.37 $ 26.97Effective income tax rate from continuing operations(9) . . . . . . . . . . . . . . . . . . . . . . . . . . 26.5% (27.1)%Worldwide employees . . . . . . . . . . . . . . . . . . . . . . . . . . . . . . . . . . . . . . . . . . . . . . . . . . . . . . . 59,569 62,494Average liquidity (dollars in billions)(10):
Parent company liquidity . . . . . . . . . . . . . . . . . . . . . . . . . . . . . . . . . . . . . . . . . . . . . . . . . $ 71 $ 77Bank and other subsidiaries liquidity . . . . . . . . . . . . . . . . . . . . . . . . . . . . . . . . . . . . . . . . 107 95
Total liquidity . . . . . . . . . . . . . . . . . . . . . . . . . . . . . . . . . . . . . . . . . . . . . . . . . . . . . . $ 178 $ 172
Capital ratios at March 31, 2012 and 2011(11)(12):Total capital ratio . . . . . . . . . . . . . . . . . . . . . . . . . . . . . . . . . . . . . . . . . . . . . . . . . . . . . . . 18.1% 16.1%Tier 1 common capital ratio . . . . . . . . . . . . . . . . . . . . . . . . . . . . . . . . . . . . . . . . . . . . . . . 13.3% 8.9%Tier 1 capital ratio . . . . . . . . . . . . . . . . . . . . . . . . . . . . . . . . . . . . . . . . . . . . . . . . . . . . . . . 16.8% 14.4%Tier 1 leverage ratio . . . . . . . . . . . . . . . . . . . . . . . . . . . . . . . . . . . . . . . . . . . . . . . . . . . . . 7.0% 6.1%
Consolidated assets under management or supervision (dollars in billions)(13):Asset Management(14) . . . . . . . . . . . . . . . . . . . . . . . . . . . . . . . . . . . . . . . . . . . . . . . . . . . $ 304 $ 276Global Wealth Management Group . . . . . . . . . . . . . . . . . . . . . . . . . . . . . . . . . . . . . . . . . 527 498
Total . . . . . . . . . . . . . . . . . . . . . . . . . . . . . . . . . . . . . . . . . . . . . . . . . . . . . . . . . . . . . $ 831 $ 774
82
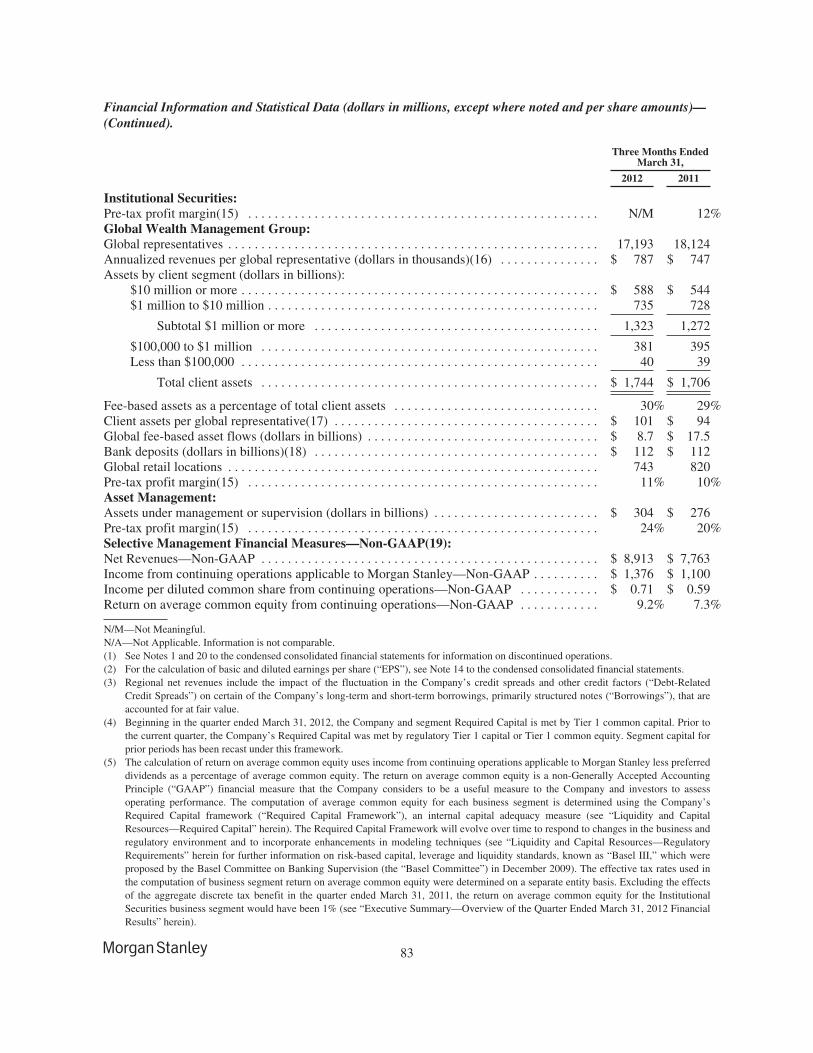
Financial Information and Statistical Data (dollars in millions, except where noted and per share amounts)—(Continued).
Three Months EndedMarch 31,
2012 2011
Institutional Securities:Pre-tax profit margin(15) . . . . . . . . . . . . . . . . . . . . . . . . . . . . . . . . . . . . . . . . . . . . . . . . . . . . . N/M 12%Global Wealth Management Group:Global representatives . . . . . . . . . . . . . . . . . . . . . . . . . . . . . . . . . . . . . . . . . . . . . . . . . . . . . . . . 17,193 18,124Annualized revenues per global representative (dollars in thousands)(16) . . . . . . . . . . . . . . . $ 787 $ 747Assets by client segment (dollars in billions):
$10 million or more . . . . . . . . . . . . . . . . . . . . . . . . . . . . . . . . . . . . . . . . . . . . . . . . . . . . . . $ 588 $ 544$1 million to $10 million . . . . . . . . . . . . . . . . . . . . . . . . . . . . . . . . . . . . . . . . . . . . . . . . . . 735 728
Subtotal $1 million or more . . . . . . . . . . . . . . . . . . . . . . . . . . . . . . . . . . . . . . . . . . . 1,323 1,272
$100,000 to $1 million . . . . . . . . . . . . . . . . . . . . . . . . . . . . . . . . . . . . . . . . . . . . . . . . . . . 381 395Less than $100,000 . . . . . . . . . . . . . . . . . . . . . . . . . . . . . . . . . . . . . . . . . . . . . . . . . . . . . . 40 39
Total client assets . . . . . . . . . . . . . . . . . . . . . . . . . . . . . . . . . . . . . . . . . . . . . . . . . . . $ 1,744 $ 1,706
Fee-based assets as a percentage of total client assets . . . . . . . . . . . . . . . . . . . . . . . . . . . . . . . 30% 29%Client assets per global representative(17) . . . . . . . . . . . . . . . . . . . . . . . . . . . . . . . . . . . . . . . . $ 101 $ 94Global fee-based asset flows (dollars in billions) . . . . . . . . . . . . . . . . . . . . . . . . . . . . . . . . . . . $ 8.7 $ 17.5Bank deposits (dollars in billions)(18) . . . . . . . . . . . . . . . . . . . . . . . . . . . . . . . . . . . . . . . . . . . $ 112 $ 112Global retail locations . . . . . . . . . . . . . . . . . . . . . . . . . . . . . . . . . . . . . . . . . . . . . . . . . . . . . . . . 743 820Pre-tax profit margin(15) . . . . . . . . . . . . . . . . . . . . . . . . . . . . . . . . . . . . . . . . . . . . . . . . . . . . . 11% 10%Asset Management:Assets under management or supervision (dollars in billions) . . . . . . . . . . . . . . . . . . . . . . . . . $ 304 $ 276Pre-tax profit margin(15) . . . . . . . . . . . . . . . . . . . . . . . . . . . . . . . . . . . . . . . . . . . . . . . . . . . . . 24% 20%Selective Management Financial Measures—Non-GAAP(19):Net Revenues—Non-GAAP . . . . . . . . . . . . . . . . . . . . . . . . . . . . . . . . . . . . . . . . . . . . . . . . . . . $ 8,913 $ 7,763Income from continuing operations applicable to Morgan Stanley—Non-GAAP . . . . . . . . . . $ 1,376 $ 1,100Income per diluted common share from continuing operations—Non-GAAP . . . . . . . . . . . . $ 0.71 $ 0.59Return on average common equity from continuing operations—Non-GAAP . . . . . . . . . . . . 9.2% 7.3%
N/M—Not Meaningful.N/A—Not Applicable. Information is not comparable.(1) See Notes 1 and 20 to the condensed consolidated financial statements for information on discontinued operations.(2) For the calculation of basic and diluted earnings per share (“EPS”), see Note 14 to the condensed consolidated financial statements.(3) Regional net revenues include the impact of the fluctuation in the Company’s credit spreads and other credit factors (“Debt-Related
Credit Spreads”) on certain of the Company’s long-term and short-term borrowings, primarily structured notes (“Borrowings”), that areaccounted for at fair value.
(4) Beginning in the quarter ended March 31, 2012, the Company and segment Required Capital is met by Tier 1 common capital. Prior tothe current quarter, the Company’s Required Capital was met by regulatory Tier 1 capital or Tier 1 common equity. Segment capital forprior periods has been recast under this framework.
(5) The calculation of return on average common equity uses income from continuing operations applicable to Morgan Stanley less preferreddividends as a percentage of average common equity. The return on average common equity is a non-Generally Accepted AccountingPrinciple (“GAAP”) financial measure that the Company considers to be a useful measure to the Company and investors to assessoperating performance. The computation of average common equity for each business segment is determined using the Company’sRequired Capital framework (“Required Capital Framework”), an internal capital adequacy measure (see “Liquidity and CapitalResources—Required Capital” herein). The Required Capital Framework will evolve over time to respond to changes in the business andregulatory environment and to incorporate enhancements in modeling techniques (see “Liquidity and Capital Resources—RegulatoryRequirements” herein for further information on risk-based capital, leverage and liquidity standards, known as “Basel III,” which wereproposed by the Basel Committee on Banking Supervision (the “Basel Committee”) in December 2009). The effective tax rates used inthe computation of business segment return on average common equity were determined on a separate entity basis. Excluding the effectsof the aggregate discrete tax benefit in the quarter ended March 31, 2011, the return on average common equity for the InstitutionalSecurities business segment would have been 1% (see “Executive Summary—Overview of the Quarter Ended March 31, 2012 FinancialResults” herein).
83
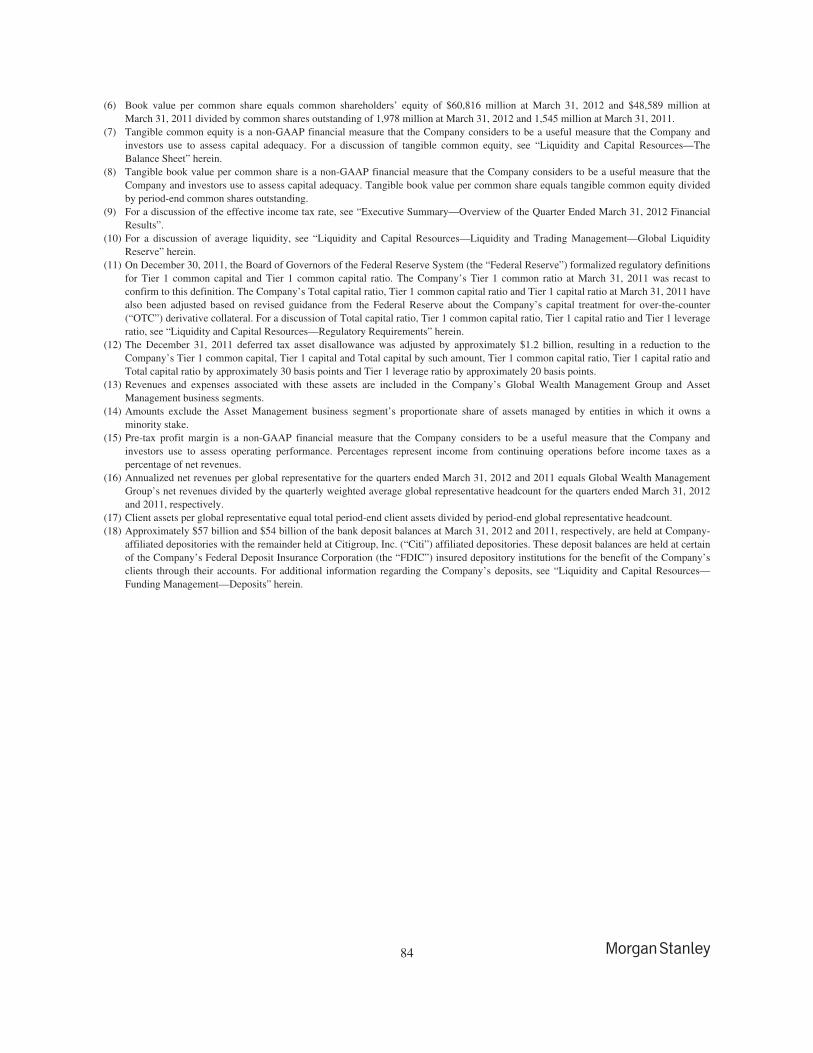
(6) Book value per common share equals common shareholders’ equity of $60,816 million at March 31, 2012 and $48,589 million atMarch 31, 2011 divided by common shares outstanding of 1,978 million at March 31, 2012 and 1,545 million at March 31, 2011.
(7) Tangible common equity is a non-GAAP financial measure that the Company considers to be a useful measure that the Company andinvestors use to assess capital adequacy. For a discussion of tangible common equity, see “Liquidity and Capital Resources—TheBalance Sheet” herein.
(8) Tangible book value per common share is a non-GAAP financial measure that the Company considers to be a useful measure that theCompany and investors use to assess capital adequacy. Tangible book value per common share equals tangible common equity dividedby period-end common shares outstanding.
(9) For a discussion of the effective income tax rate, see “Executive Summary—Overview of the Quarter Ended March 31, 2012 FinancialResults”.
(10) For a discussion of average liquidity, see “Liquidity and Capital Resources—Liquidity and Trading Management—Global LiquidityReserve” herein.
(11) On December 30, 2011, the Board of Governors of the Federal Reserve System (the “Federal Reserve”) formalized regulatory definitionsfor Tier 1 common capital and Tier 1 common capital ratio. The Company’s Tier 1 common ratio at March 31, 2011 was recast toconfirm to this definition. The Company’s Total capital ratio, Tier 1 common capital ratio and Tier 1 capital ratio at March 31, 2011 havealso been adjusted based on revised guidance from the Federal Reserve about the Company’s capital treatment for over-the-counter(“OTC”) derivative collateral. For a discussion of Total capital ratio, Tier 1 common capital ratio, Tier 1 capital ratio and Tier 1 leverageratio, see “Liquidity and Capital Resources—Regulatory Requirements” herein.
(12) The December 31, 2011 deferred tax asset disallowance was adjusted by approximately $1.2 billion, resulting in a reduction to theCompany’s Tier 1 common capital, Tier 1 capital and Total capital by such amount, Tier 1 common capital ratio, Tier 1 capital ratio andTotal capital ratio by approximately 30 basis points and Tier 1 leverage ratio by approximately 20 basis points.
(13) Revenues and expenses associated with these assets are included in the Company’s Global Wealth Management Group and AssetManagement business segments.
(14) Amounts exclude the Asset Management business segment’s proportionate share of assets managed by entities in which it owns aminority stake.
(15) Pre-tax profit margin is a non-GAAP financial measure that the Company considers to be a useful measure that the Company andinvestors use to assess operating performance. Percentages represent income from continuing operations before income taxes as apercentage of net revenues.
(16) Annualized net revenues per global representative for the quarters ended March 31, 2012 and 2011 equals Global Wealth ManagementGroup’s net revenues divided by the quarterly weighted average global representative headcount for the quarters ended March 31, 2012and 2011, respectively.
(17) Client assets per global representative equal total period-end client assets divided by period-end global representative headcount.(18) Approximately $57 billion and $54 billion of the bank deposit balances at March 31, 2012 and 2011, respectively, are held at Company-
affiliated depositories with the remainder held at Citigroup, Inc. (“Citi”) affiliated depositories. These deposit balances are held at certainof the Company’s Federal Deposit Insurance Corporation (the “FDIC”) insured depository institutions for the benefit of the Company’sclients through their accounts. For additional information regarding the Company’s deposits, see “Liquidity and Capital Resources—Funding Management—Deposits” herein.
84
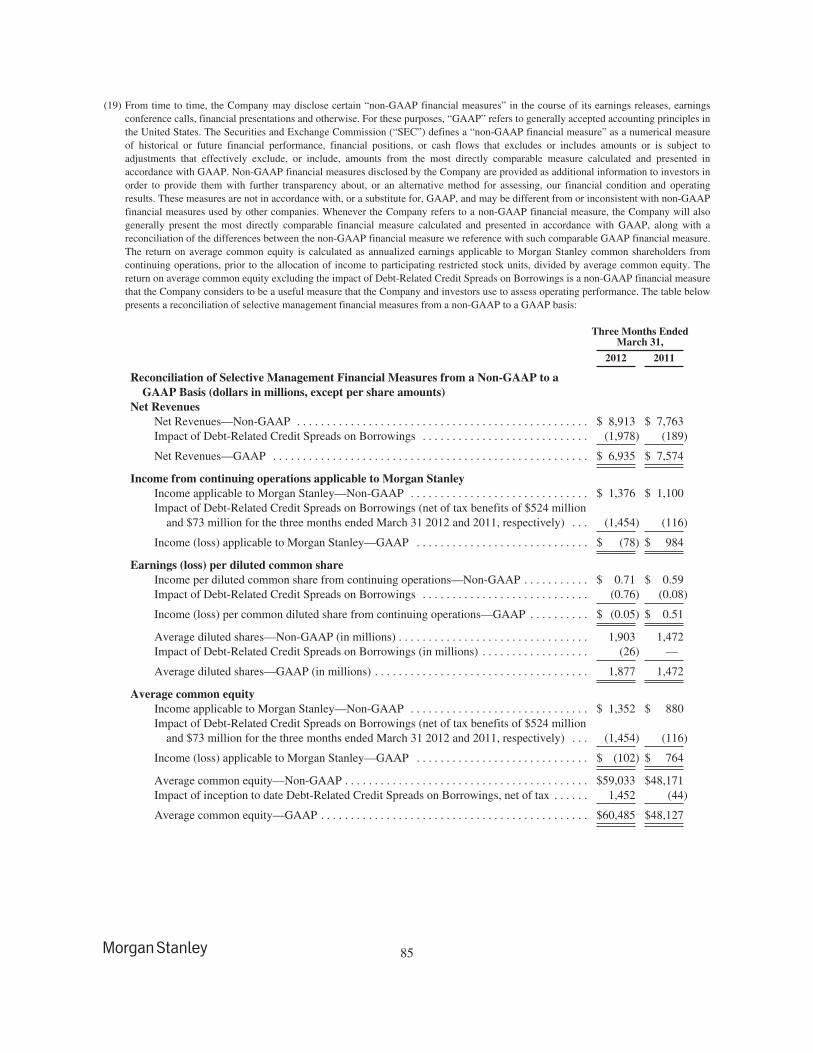
(19) From time to time, the Company may disclose certain “non-GAAP financial measures” in the course of its earnings releases, earningsconference calls, financial presentations and otherwise. For these purposes, “GAAP” refers to generally accepted accounting principles inthe United States. The Securities and Exchange Commission (“SEC”) defines a “non-GAAP financial measure” as a numerical measureof historical or future financial performance, financial positions, or cash flows that excludes or includes amounts or is subject toadjustments that effectively exclude, or include, amounts from the most directly comparable measure calculated and presented inaccordance with GAAP. Non-GAAP financial measures disclosed by the Company are provided as additional information to investors inorder to provide them with further transparency about, or an alternative method for assessing, our financial condition and operatingresults. These measures are not in accordance with, or a substitute for, GAAP, and may be different from or inconsistent with non-GAAPfinancial measures used by other companies. Whenever the Company refers to a non-GAAP financial measure, the Company will alsogenerally present the most directly comparable financial measure calculated and presented in accordance with GAAP, along with areconciliation of the differences between the non-GAAP financial measure we reference with such comparable GAAP financial measure.The return on average common equity is calculated as annualized earnings applicable to Morgan Stanley common shareholders fromcontinuing operations, prior to the allocation of income to participating restricted stock units, divided by average common equity. Thereturn on average common equity excluding the impact of Debt-Related Credit Spreads on Borrowings is a non-GAAP financial measurethat the Company considers to be a useful measure that the Company and investors use to assess operating performance. The table belowpresents a reconciliation of selective management financial measures from a non-GAAP to a GAAP basis:
Three Months EndedMarch 31,
2012 2011
Reconciliation of Selective Management Financial Measures from a Non-GAAP to aGAAP Basis (dollars in millions, except per share amounts)
Net RevenuesNet Revenues—Non-GAAP . . . . . . . . . . . . . . . . . . . . . . . . . . . . . . . . . . . . . . . . . . . . . . . . . $ 8,913 $ 7,763Impact of Debt-Related Credit Spreads on Borrowings . . . . . . . . . . . . . . . . . . . . . . . . . . . . (1,978) (189)
Net Revenues—GAAP . . . . . . . . . . . . . . . . . . . . . . . . . . . . . . . . . . . . . . . . . . . . . . . . . . . . . $ 6,935 $ 7,574
Income from continuing operations applicable to Morgan StanleyIncome applicable to Morgan Stanley—Non-GAAP . . . . . . . . . . . . . . . . . . . . . . . . . . . . . . $ 1,376 $ 1,100Impact of Debt-Related Credit Spreads on Borrowings (net of tax benefits of $524 million
and $73 million for the three months ended March 31 2012 and 2011, respectively) . . . (1,454) (116)
Income (loss) applicable to Morgan Stanley—GAAP . . . . . . . . . . . . . . . . . . . . . . . . . . . . . $ (78) $ 984
Earnings (loss) per diluted common shareIncome per diluted common share from continuing operations—Non-GAAP . . . . . . . . . . . $ 0.71 $ 0.59Impact of Debt-Related Credit Spreads on Borrowings . . . . . . . . . . . . . . . . . . . . . . . . . . . . (0.76) (0.08)
Income (loss) per common diluted share from continuing operations—GAAP . . . . . . . . . . $ (0.05) $ 0.51
Average diluted shares—Non-GAAP (in millions) . . . . . . . . . . . . . . . . . . . . . . . . . . . . . . . . 1,903 1,472Impact of Debt-Related Credit Spreads on Borrowings (in millions) . . . . . . . . . . . . . . . . . . (26) —
Average diluted shares—GAAP (in millions) . . . . . . . . . . . . . . . . . . . . . . . . . . . . . . . . . . . . 1,877 1,472
Average common equityIncome applicable to Morgan Stanley—Non-GAAP . . . . . . . . . . . . . . . . . . . . . . . . . . . . . . $ 1,352 $ 880Impact of Debt-Related Credit Spreads on Borrowings (net of tax benefits of $524 million
and $73 million for the three months ended March 31 2012 and 2011, respectively) . . . (1,454) (116)
Income (loss) applicable to Morgan Stanley—GAAP . . . . . . . . . . . . . . . . . . . . . . . . . . . . . $ (102) $ 764
Average common equity—Non-GAAP . . . . . . . . . . . . . . . . . . . . . . . . . . . . . . . . . . . . . . . . . $59,033 $48,171Impact of inception to date Debt-Related Credit Spreads on Borrowings, net of tax . . . . . . 1,452 (44)
Average common equity—GAAP . . . . . . . . . . . . . . . . . . . . . . . . . . . . . . . . . . . . . . . . . . . . . $60,485 $48,127
85
Global Market and Economic Conditions.
During the first quarter of 2012, global market and economic conditions improved modestly from 2011 year-end.The U.S. economy expanded moderately and financial stresses in Europe lessened to some degree following anumber of actions taken by European policymakers. Despite these improvements, global market and economicconditions continued to be challenged by concerns about the continuing European sovereign debt crisis, lack ofrobust economic recovery in the U.S., and slowing economic growth in emerging markets.
In the U.S., major equity market indices ended the first quarter of 2012 higher compared with the beginning ofthe year primarily due to improved investor confidence in the global economic recovery. U.S. economic activitycontinued to expand at a moderate pace in the first quarter of 2012. Conditions in the labor market continued toimprove as the unemployment rate decreased to 8.2% at March 31, 2012 from 8.5% at December 31, 2011.However, certain sectors of the residential real estate market and investments in commercial real estate projectsremained challenged in the first quarter of 2012. Consumer spending and business investments continued toimprove and concerns about crude oil supplies contributed to a rise in oil prices during the quarter, althoughoverall consumer price inflation was relatively subdued. The Federal Open Market Committee (“FOMC”) of theFederal Reserve kept key interest rates at historically low levels, and at March 31, 2012, the federal funds targetrate was between zero and 0.25%, and the discount rate was 0.75%. In the first quarter of 2012, the FOMCannounced that key interest rates will likely remain at historically low levels at least through late 2014.
In Europe, real gross domestic product growth stabilized in the first quarter of 2012. Major European equitymarket indices ended the quarter higher compared with the beginning of the year, as investors’ concerns aboutthe sovereign debt crisis, especially in Greece, Ireland, Italy, Portugal and Spain (the “European Peripherals”),and the sovereign debt exposures in the European banking system receded during the quarter. The euro areaunemployment rate increased to 10.9% at March 31, 2012 from 10.6% at December 31, 2011. At March 31,2012, the European Central Bank’s (“ECB”) benchmark interest rate was 1.00%, and the Bank of England’s(“BOE”) benchmark interest rate was 0.50%, both of which were unchanged from December 31, 2011. In thefirst quarter of 2012, the BOE increased the size of its quantitative easing program in order to inject furthermonetary stimulus into the economy in the United Kingdom (“U.K.”), and during the first quarter of 2012 theU.K. entered into a technical recession (two consecutive quarters of negative gross domestic product). During thefirst quarter of 2012, funding conditions for euro-area banks eased as the ECB conducted its second three-yearrefinancing operation and widened the pool of eligible collateral for refinancing operations. In February of 2012,European Union leaders agreed on a new bailout and debt-restructuring agreement designed to reduce Greece’sdebt. In the first four months of 2012, rating agencies downgraded the credit ratings for some Europeancountries, and Spain joined other European countries by entering into a technical recession.
In Asia, major stock markets closed out the first quarter of 2012 higher compared with the beginning of the year.Japan’s economic activity remained flat during the first quarter of 2012. To further stimulate its economy, inFebruary and April of 2012, the Bank of Japan increased the size of its quantitative easing program twice.Japan’s benchmark interest rate remained within a range of zero to 0.1% during the first quarter of 2012. China’sgross domestic product growth continued to moderate during the first quarter of 2012 as import and exportgrowth slowed sharply after domestic tightening measures and global economic turmoil impacted consumption.To stimulate the Chinese economy, the People’s Bank of China cut its bank reserve requirement by 0.5% inFebruary 2012.
Overview of the Quarter Ended March 31, 2012 Financial Results.
Consolidated Results. The Company recorded a net loss applicable to Morgan Stanley of $94 million on netrevenues of $6,935 million during the quarter ended March 31, 2012 (“current quarter”), compared with netincome applicable to Morgan Stanley of $968 million on net revenues of $7,574 million in the quarter endedMarch 31, 2011 (“prior year period”).
Net revenues in the current quarter included negative revenue of $1,978 million, or $(0.76) per diluted share, dueto the impact of the tightening of the Company’s Debt-Related Credit Spreads on Borrowings that are accounted
86
for at fair value, compared with negative revenues of $189 million in the prior year period. Non-interest expenseswere relatively flat at $6,732 million in the current quarter. Compensation expenses increased 3% in the currentquarter compared to the prior year period, and included severance expense of $138 million related to staffreductions. Non-compensation expenses decreased 4% in the current quarter.
Diluted EPS and diluted EPS from continuing operations were $(0.06) and $(0.05), respectively, in the currentquarter compared with $0.50 and $0.51, respectively, in the prior year period.
Excluding the impact of the Company’s Debt–Related Credit Spreads on Borrowings, in the current quarter, netrevenues were $8,913 million and diluted EPS from continuing operations was $0.71 per share, compared to$7,763 million and $0.59 per share, respectively, in the prior year period.
The Company’s effective tax rate from continuing operations was 26.5% and a benefit of (27.1)% for the quarterended March 31, 2012 and March 31, 2011, respectively. The results for the quarter ended March 31, 2011included a net tax benefit of $447 million, or $0.30 per diluted share, from the remeasurement of a deferred taxasset and the reversal of a related valuation allowance. Excluding this discrete tax benefit the annual effective taxrate in the quarter ended March 31, 2011 would have been 22.5%. The increase in the effective tax rate isprimarily reflective of the geographic mix of earnings. For further discussion of the prior year discrete taxbenefits, see “Executive Summary—Significant Items—Income Tax Benefits” herein.
During the current quarter, the Company announced that it reached an agreement to sell Quilter Holdings Ltd.(“Quilter”), its retail wealth management business in the U.K. This transaction, and the first phase of thepreviously announced disposition of Saxon, closed on April 2, 2012. The results of Quilter (reported in theGlobal Wealth Management Group business segment) and Saxon (reported in the Institutional Securities businesssegment) are presented as discontinued operations for all periods presented. Discontinued operations for thequarters ended March 31, 2012 and 2011 were a loss of $15 million in both periods.
Institutional Securities. Income (loss) from continuing operations before taxes was $(312) million in the currentquarter, compared with $432 million in the prior year period. Net revenues for the current quarter were $3,023million compared with $3,568 million in the prior year period. The results in the current quarter includednegative revenue of $1,978 million (fixed income and commodities: $1,597 million; equities: $381 million) dueto the impact of the tightening of the Company’s Debt-Related Credit Spreads on Borrowings that wereaccounted for at fair value compared with negative revenue of $189 million (fixed income and commodities:approximately $159 million; equities: approximately $30 million) in the prior year period. Investment bankingrevenues for the current quarter decreased 16% to $851 million from the prior year period, reflecting lowerrevenues from equity underwriting transactions and lower advisory revenues, partially offset by higher revenuesfrom fixed income underwriting transactions. The following sales and trading net revenues results exclude theimpact of Debt-Related Credit Spreads on Borrowings that are accounted for at fair value. The presentation of netrevenues excluding the impact of Debt-Related Credit Spreads on Borrowings that are accounted for at fair valueis a non-GAAP financial measure that the Company considers useful for the Company and investors to allowfurther comparability of period to period operating performance. See “Business Segments—InstitutionalSecurities—Sales and Trading Net Revenues” for more information. Excluding the impact of Debt-RelatedCredit Spreads on Borrowings that are accounted for at fair value, fixed income and commodities sales andtrading net revenues of $2,594 million increased 34% from a year ago, reflecting increased contributions frommost products, with particular strength in interest rates, currency products, commodities and corporate credit,partially offset by lower revenues in securitized products. The results in the prior year period were negativelyimpacted by losses of $318 million from Monoline Insurers (“Monolines”) (see “Executive Summary—Significant Items—Monoline Insurers” herein for further information). Equity sales and trading net revenues,excluding the impact of Debt-Related Credit Spreads on Borrowings that are accounted for at fair value, of$1,833 million increased 6% from a year ago reflecting solid performance across all regions with higher revenuesin the derivative business and notable growth in electronic and retail volumes. Other sales and trading net lossesin the current quarter were $286 million compared with losses of $460 million in the prior year period. Results inboth quarters primarily reflected losses on economic hedges related to the Company’s long-term debt and costs
87
related to the amount of liquidity held (“negative carry”). Other revenues in the current quarter were $58 millioncompared with negative revenues of $602 million in the prior year period. Results for the prior year periodincluded a loss of $655 million arising from the Company’s 40% stake in Mitsubishi UFJ Morgan StanleySecurities Co., Ltd. (“MUMSS”) (see “Executive Summary—Significant Items—Japanese Securities JointVenture” herein). Non-interest expenses increased 6% to $3,335 million in the current quarter primarily due tohigher Compensation and benefit expenses, which increased 10% to $2,108 million.
Global Wealth Management Group. Income from continuing operations before taxes was $387 million in thecurrent quarter compared with $344 million in the prior year period. Net revenues of $3,414 million in thecurrent quarter were essentially unchanged from a year ago as higher asset management and net interest revenueswere mostly offset by lower commissions. In the current quarter, Non-interest expenses of $3,027 million,including Compensation expenses of $2,105 million, were essentially unchanged from the prior year period.Total client asset balances were $1,744 billion at March 31, 2012 and client assets in fee-based accounts were$531 billion, or 30% of total client assets. Global fee based asset flows for the current quarter were $8.7 billionas compared with $17.5 billion in the prior year period.
Asset Management. Income from continuing operations before taxes was $128 million in the current quartercompared with $125 million in the prior year period. Net revenues were $533 million in the current quartercompared with $622 million in the prior year period. The decrease in net revenues primarily reflected lower gainson principal investments in the Company’s Merchant Banking business, including certain investments associatedwith the Company’s employee deferred compensation and co-investment plans, partially offset by higher netinvestment gains associated with certain consolidated real estate funds sponsored by the Company. Assetmanagement, distribution and administration fees increased 1% to $411 million in the current quarter, primarilyreflecting higher performance fees and higher fund management and administration fees, primarily due to higheraverage assets under management. This increase was partially offset by the absence of FrontPoint Partners LLC(“FrontPoint”) in the current quarter compared with two months of FrontPoint fees in the prior year period.Non-interest expenses decreased 19% to $405 million in the current quarter, reflecting decreases in compensationexpenses and non-compensation expenses.
Significant Items.
Corporate Lending. The Company recorded the following amounts primarily associated with the portion of theloans and lending commitment portfolio carried at fair value within the Institutional Securities business segment(see “Business Segments—Institutional Securities—Sales and Trading Net Revenues” herein):
Three Months EndedMarch 31,
2012(1) 2011(1)
(dollars in millions)
Gains on loans and lending commitments . . . . . . . . . . . . . . . . . . . . . . . . . . . . . . . . . . . . . . . . $ 770 $ 209Losses on hedges . . . . . . . . . . . . . . . . . . . . . . . . . . . . . . . . . . . . . . . . . . . . . . . . . . . . . . . . . . . (636) (135)
Total gains . . . . . . . . . . . . . . . . . . . . . . . . . . . . . . . . . . . . . . . . . . . . . . . . . . . . . . . . . . . . $ 134 $ 74
(1) Amounts include realized and unrealized gains (losses).
Japanese Securities Joint Venture. During the quarters ended March 31, 2012 and 2011, the Company recordeda gain (loss) of $27 million and $(655) million, respectively, within Other revenues in the condensedconsolidated statements of income, arising from the Company’s 40% stake in MUMSS (see Note 19 to thecondensed consolidated financial statements).
Income Tax Benefit. The Company’s effective tax rate from continuing operations for the quarter endedMarch 31, 2011 included a $447 million net tax benefit from the remeasurement of a deferred tax asset and thereversal of a related valuation allowance. The deferred tax asset and valuation allowance were recognized in
88
income from discontinued operations in 2010 in connection with the recognition of a $1.2 billion loss due towritedowns and related costs following the Company’s commitment to a plan to dispose of Revel EntertainmentGroup, LLC (“Revel”). The Company recorded the valuation allowance because the Company did not believe itwas more likely than not that it would have sufficient future net capital gain to realize the benefit of the expectedcapital loss to be recognized upon the disposal of Revel. During the quarter ended March 31, 2011, the disposalof Revel was restructured as a tax-free like kind exchange and the disposal was completed. The restructuredtransaction changed the character of the future taxable loss to ordinary. The Company reversed the valuationallowance because the Company believes it is more likely than not that it will have sufficient future ordinarytaxable income to recognize the recorded deferred tax asset. In accordance with the applicable accountingliterature, this reversal of a previously established valuation allowance due to a change in circumstances wasrecognized in income from continuing operations.
Monoline Insurers. The results for the quarter ended March 31, 2011 included a loss of $318 million related tothe Company’s counterparty credit exposures to Monolines, principally MBIA Insurance Corporation (“MBIA”).
89
Business Segments.Substantially all of the Company’s operating revenues and operating expenses can be directly attributed to itsbusiness segments. Certain revenues and expenses have been allocated to each business segment, generally inproportion to its respective revenues or other relevant measures.
As a result of treating certain intersegment transactions as transactions with external parties, the Companyincludes an Intersegment Eliminations category to reconcile the business segment results to the Company’sconsolidated results. Intersegment Eliminations also reflect the effect of fees paid by the Institutional Securitiesbusiness segment to the Global Wealth Management Group business segment related to the bank depositprogram. The Company did not recognize any Intersegment Elimination gains or losses in the quarters endedMarch 31, 2012 and March 31, 2011.
Net Revenues.
Principal Transactions—Trading. Principal transactions—Trading revenues include revenues from customers’purchases and sales of financial instruments in which the Company acts as principal and gains and losses on theCompany’s positions, as well as proprietary trading activities for its own account. Principal transactions—Trading revenues includes the realized gains and losses from sales of cash instruments and derivative settlements,unrealized gains and losses from ongoing fair value changes of the Company’s positions related to market-making activities, and gains and losses related to investments associated with certain employee deferredcompensation plans. In many markets, the realized and unrealized gains and losses from the purchase and saletransactions will include any spreads between bids and offers. Certain fees received on loans carried at fair valueand dividends from equity securities are also recorded in this line item since they relate to market-makingpositions. Commissions received for purchasing and selling listed equity securities and options are recordedseparately in the Commissions and fees line item. Other cash and derivative instruments typically do not havefees associated with them and fees for related services would be recorded in Commissions and fees.
Principal Transactions—Investments. The Company’s investments generally are held for long-termappreciation and generally are subject to significant sales restrictions. Estimates of the fair value of theinvestments may involve significant judgment and may fluctuate significantly over time in light of business,market, economic and financial conditions generally or in relation to specific transactions. In some cases, suchinvestments are required or are a necessary part of offering other products. The revenues recorded are the resultof realized gains and losses from sales and unrealized gains and losses from ongoing fair value changes of theCompany’s holdings as well as from investments associated with certain employee deferred compensation plans.Typically, there are no fee revenues from these investments. The sales restrictions on the investments relateprimarily to redemption and withdrawal restrictions on investments in real estate funds, hedge funds, and privateequity funds, which include investments made in connection with certain employee deferred compensation plans(see Note 3 to the condensed consolidated financial statements). Restrictions on interests in exchanges andclearinghouses generally include a requirement to hold those interests for the period of time that the Company isclearing trades on that exchange or clearinghouse. Additionally, there are certain principal investments related toassets held by consolidated real estate funds, which are primarily related to holders of noncontrolling interests.
Commissions and Fees. Commission and fee revenues primarily arise from agency transactions in listed andOTC equity securities, services related to sales and trading activities, and sales of mutual funds, futures,insurance products and options.
Asset Management, Distribution and Administration Fees. Asset management, distribution and administrationfees include fees associated with the management and supervision of assets, account services and administration,performance-based fees relating to certain funds, separately managed accounts, shareholder servicing, and thedistribution of certain open-ended mutual funds.
Asset management, distribution and administration fees in the Global Wealth Management Group businesssegment also include revenues from individual investors electing a fee-based pricing arrangement and fees for
90
investment management. Mutual fund distribution fees in the Global Wealth Management Group businesssegment are based on either the average daily fund net asset balances or average daily aggregate net fund salesand are affected by changes in the overall level and mix of assets under management or supervision.
Asset management fees in the Asset Management business segment arise from investment management servicesthe Company provides to investment vehicles pursuant to various contractual arrangements. The Companyreceives fees primarily based upon mutual fund daily average net assets or based on monthly or quarterlyinvested equity for other vehicles. Performance-based fees in the Asset Management business segment are earnedon certain funds as a percentage of appreciation earned by those funds and, in certain cases, are based upon theachievement of performance criteria. These fees are normally earned annually and are recognized on a monthlyor quarterly basis.
Net Interest. Interest income and Interest expense are a function of the level and mix of total assets andliabilities, including financial instruments owned and financial instruments sold, not yet purchased, securitiesavailable for sale, securities borrowed or purchased under agreements to resell, securities loaned or sold underagreements to repurchase, loans, deposits, commercial paper and other short-term borrowings, long-termborrowings, trading strategies, customer activity in the Company’s prime brokerage business, and the prevailinglevel, term structure and volatility of interest rates. Certain Securities purchased under agreements to resell(“reverse repurchase agreements”) and Securities sold under agreements to repurchase (“repurchaseagreements”) and Securities borrowed and Securities loaned transactions may be entered into with differentcustomers using the same underlying securities, thereby generating a spread between the interest revenue on thereverse repurchase agreements or securities borrowed transactions and the interest expense on the repurchaseagreements or securities loaned transactions.
Market Making.
As a market maker, the Company stands ready to buy, sell or otherwise transact with customers under a varietyof market conditions and provide firm or indicative prices in response to customer requests. The Company’sliquidity obligations can be explicit and obligatory in some cases, and in others, customers expect the Companyto be willing to transact with them. In order to most effectively fulfill its market-making function, the Companyengages in activities, across all of its trading businesses, that include, but are not limited to, (i) taking positions inanticipation of, and in response to customer demand to buy or sell, and—depending on the liquidity of therelevant market and the size of the position—holding those positions for a period of time; (ii) managing andassuming basis risk (risk associated with imperfect hedging) between customized customer risks and thestandardized products available in the market to hedge those risks; (iii) building, maintaining, and re-balancinginventory, through trades with other market participants, and engaging in accumulation activities toaccommodate anticipated customer demand; (iv) trading in the market to remain current on pricing and trends;and (v) engaging in other activities to provide efficiency and liquidity for markets. Interest income and expenseare also impacted by market-making activities as debt securities held by the Company earn interest and securitiesare loaned, borrowed, sold with agreement to repurchase and purchased with agreement to resell.
91
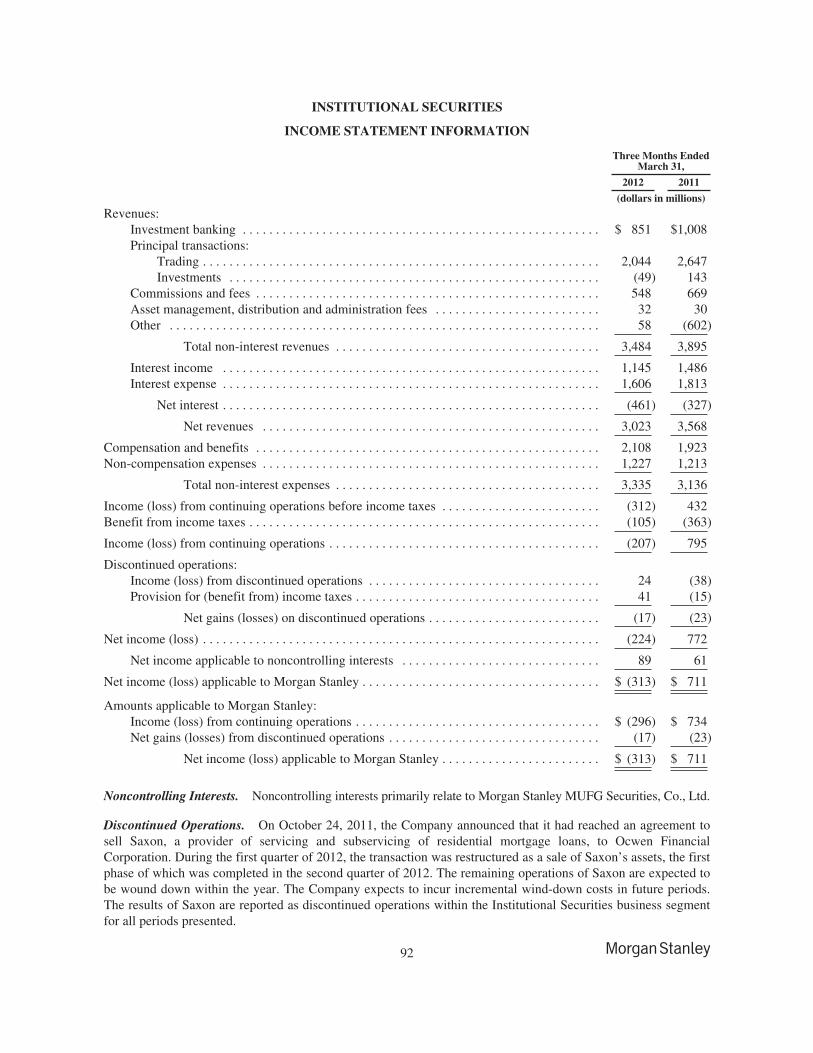
INSTITUTIONAL SECURITIES
INCOME STATEMENT INFORMATION
Three Months EndedMarch 31,
2012 2011
(dollars in millions)
Revenues:Investment banking . . . . . . . . . . . . . . . . . . . . . . . . . . . . . . . . . . . . . . . . . . . . . . . . . . . . . . $ 851 $1,008Principal transactions:
Trading . . . . . . . . . . . . . . . . . . . . . . . . . . . . . . . . . . . . . . . . . . . . . . . . . . . . . . . . . . . . 2,044 2,647Investments . . . . . . . . . . . . . . . . . . . . . . . . . . . . . . . . . . . . . . . . . . . . . . . . . . . . . . . . (49) 143
Commissions and fees . . . . . . . . . . . . . . . . . . . . . . . . . . . . . . . . . . . . . . . . . . . . . . . . . . . . 548 669Asset management, distribution and administration fees . . . . . . . . . . . . . . . . . . . . . . . . . 32 30Other . . . . . . . . . . . . . . . . . . . . . . . . . . . . . . . . . . . . . . . . . . . . . . . . . . . . . . . . . . . . . . . . . 58 (602)
Total non-interest revenues . . . . . . . . . . . . . . . . . . . . . . . . . . . . . . . . . . . . . . . . 3,484 3,895
Interest income . . . . . . . . . . . . . . . . . . . . . . . . . . . . . . . . . . . . . . . . . . . . . . . . . . . . . . . . . 1,145 1,486Interest expense . . . . . . . . . . . . . . . . . . . . . . . . . . . . . . . . . . . . . . . . . . . . . . . . . . . . . . . . . 1,606 1,813
Net interest . . . . . . . . . . . . . . . . . . . . . . . . . . . . . . . . . . . . . . . . . . . . . . . . . . . . . . . . . (461) (327)
Net revenues . . . . . . . . . . . . . . . . . . . . . . . . . . . . . . . . . . . . . . . . . . . . . . . . . . . 3,023 3,568
Compensation and benefits . . . . . . . . . . . . . . . . . . . . . . . . . . . . . . . . . . . . . . . . . . . . . . . . . . . . 2,108 1,923Non-compensation expenses . . . . . . . . . . . . . . . . . . . . . . . . . . . . . . . . . . . . . . . . . . . . . . . . . . . 1,227 1,213
Total non-interest expenses . . . . . . . . . . . . . . . . . . . . . . . . . . . . . . . . . . . . . . . . 3,335 3,136
Income (loss) from continuing operations before income taxes . . . . . . . . . . . . . . . . . . . . . . . . (312) 432Benefit from income taxes . . . . . . . . . . . . . . . . . . . . . . . . . . . . . . . . . . . . . . . . . . . . . . . . . . . . . (105) (363)
Income (loss) from continuing operations . . . . . . . . . . . . . . . . . . . . . . . . . . . . . . . . . . . . . . . . . (207) 795
Discontinued operations:Income (loss) from discontinued operations . . . . . . . . . . . . . . . . . . . . . . . . . . . . . . . . . . . 24 (38)Provision for (benefit from) income taxes . . . . . . . . . . . . . . . . . . . . . . . . . . . . . . . . . . . . . 41 (15)
Net gains (losses) on discontinued operations . . . . . . . . . . . . . . . . . . . . . . . . . . (17) (23)
Net income (loss) . . . . . . . . . . . . . . . . . . . . . . . . . . . . . . . . . . . . . . . . . . . . . . . . . . . . . . . . . . . . (224) 772
Net income applicable to noncontrolling interests . . . . . . . . . . . . . . . . . . . . . . . . . . . . . . 89 61
Net income (loss) applicable to Morgan Stanley . . . . . . . . . . . . . . . . . . . . . . . . . . . . . . . . . . . . $ (313) $ 711
Amounts applicable to Morgan Stanley:Income (loss) from continuing operations . . . . . . . . . . . . . . . . . . . . . . . . . . . . . . . . . . . . . $ (296) $ 734Net gains (losses) from discontinued operations . . . . . . . . . . . . . . . . . . . . . . . . . . . . . . . . (17) (23)
Net income (loss) applicable to Morgan Stanley . . . . . . . . . . . . . . . . . . . . . . . . $ (313) $ 711
Noncontrolling Interests. Noncontrolling interests primarily relate to Morgan Stanley MUFG Securities, Co., Ltd.
Discontinued Operations. On October 24, 2011, the Company announced that it had reached an agreement tosell Saxon, a provider of servicing and subservicing of residential mortgage loans, to Ocwen FinancialCorporation. During the first quarter of 2012, the transaction was restructured as a sale of Saxon’s assets, the firstphase of which was completed in the second quarter of 2012. The remaining operations of Saxon are expected tobe wound down within the year. The Company expects to incur incremental wind-down costs in future periods.The results of Saxon are reported as discontinued operations within the Institutional Securities business segmentfor all periods presented.
92
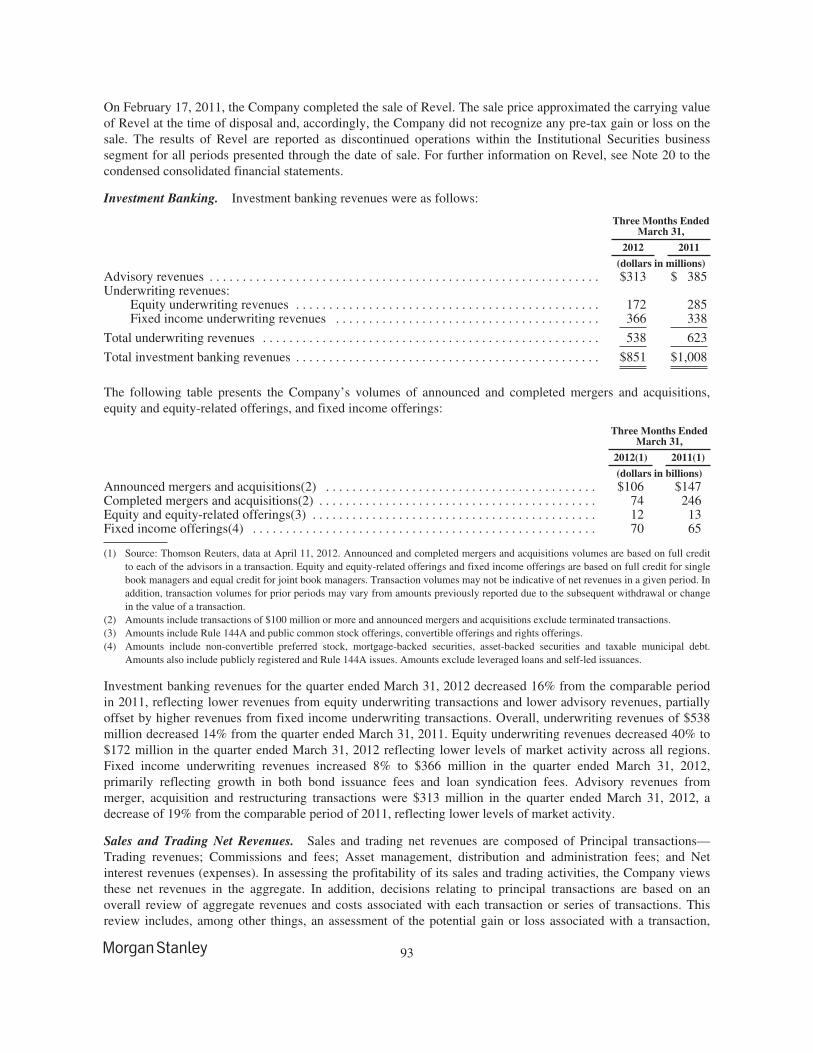
On February 17, 2011, the Company completed the sale of Revel. The sale price approximated the carrying valueof Revel at the time of disposal and, accordingly, the Company did not recognize any pre-tax gain or loss on thesale. The results of Revel are reported as discontinued operations within the Institutional Securities businesssegment for all periods presented through the date of sale. For further information on Revel, see Note 20 to thecondensed consolidated financial statements.
Investment Banking. Investment banking revenues were as follows:
Three Months EndedMarch 31,
2012 2011
(dollars in millions)Advisory revenues . . . . . . . . . . . . . . . . . . . . . . . . . . . . . . . . . . . . . . . . . . . . . . . . . . . . . . . . . . . $313 $ 385Underwriting revenues:
Equity underwriting revenues . . . . . . . . . . . . . . . . . . . . . . . . . . . . . . . . . . . . . . . . . . . . . . 172 285Fixed income underwriting revenues . . . . . . . . . . . . . . . . . . . . . . . . . . . . . . . . . . . . . . . . 366 338
Total underwriting revenues . . . . . . . . . . . . . . . . . . . . . . . . . . . . . . . . . . . . . . . . . . . . . . . . . . . 538 623
Total investment banking revenues . . . . . . . . . . . . . . . . . . . . . . . . . . . . . . . . . . . . . . . . . . . . . . $851 $1,008
The following table presents the Company’s volumes of announced and completed mergers and acquisitions,equity and equity-related offerings, and fixed income offerings:
Three Months EndedMarch 31,
2012(1) 2011(1)
(dollars in billions)Announced mergers and acquisitions(2) . . . . . . . . . . . . . . . . . . . . . . . . . . . . . . . . . . . . . . . . . $106 $147Completed mergers and acquisitions(2) . . . . . . . . . . . . . . . . . . . . . . . . . . . . . . . . . . . . . . . . . . 74 246Equity and equity-related offerings(3) . . . . . . . . . . . . . . . . . . . . . . . . . . . . . . . . . . . . . . . . . . . 12 13Fixed income offerings(4) . . . . . . . . . . . . . . . . . . . . . . . . . . . . . . . . . . . . . . . . . . . . . . . . . . . . 70 65
(1) Source: Thomson Reuters, data at April 11, 2012. Announced and completed mergers and acquisitions volumes are based on full creditto each of the advisors in a transaction. Equity and equity-related offerings and fixed income offerings are based on full credit for singlebook managers and equal credit for joint book managers. Transaction volumes may not be indicative of net revenues in a given period. Inaddition, transaction volumes for prior periods may vary from amounts previously reported due to the subsequent withdrawal or changein the value of a transaction.
(2) Amounts include transactions of $100 million or more and announced mergers and acquisitions exclude terminated transactions.(3) Amounts include Rule 144A and public common stock offerings, convertible offerings and rights offerings.(4) Amounts include non-convertible preferred stock, mortgage-backed securities, asset-backed securities and taxable municipal debt.
Amounts also include publicly registered and Rule 144A issues. Amounts exclude leveraged loans and self-led issuances.
Investment banking revenues for the quarter ended March 31, 2012 decreased 16% from the comparable periodin 2011, reflecting lower revenues from equity underwriting transactions and lower advisory revenues, partiallyoffset by higher revenues from fixed income underwriting transactions. Overall, underwriting revenues of $538million decreased 14% from the quarter ended March 31, 2011. Equity underwriting revenues decreased 40% to$172 million in the quarter ended March 31, 2012 reflecting lower levels of market activity across all regions.Fixed income underwriting revenues increased 8% to $366 million in the quarter ended March 31, 2012,primarily reflecting growth in both bond issuance fees and loan syndication fees. Advisory revenues frommerger, acquisition and restructuring transactions were $313 million in the quarter ended March 31, 2012, adecrease of 19% from the comparable period of 2011, reflecting lower levels of market activity.
Sales and Trading Net Revenues. Sales and trading net revenues are composed of Principal transactions—Trading revenues; Commissions and fees; Asset management, distribution and administration fees; and Netinterest revenues (expenses). In assessing the profitability of its sales and trading activities, the Company viewsthese net revenues in the aggregate. In addition, decisions relating to principal transactions are based on anoverall review of aggregate revenues and costs associated with each transaction or series of transactions. Thisreview includes, among other things, an assessment of the potential gain or loss associated with a transaction,
93
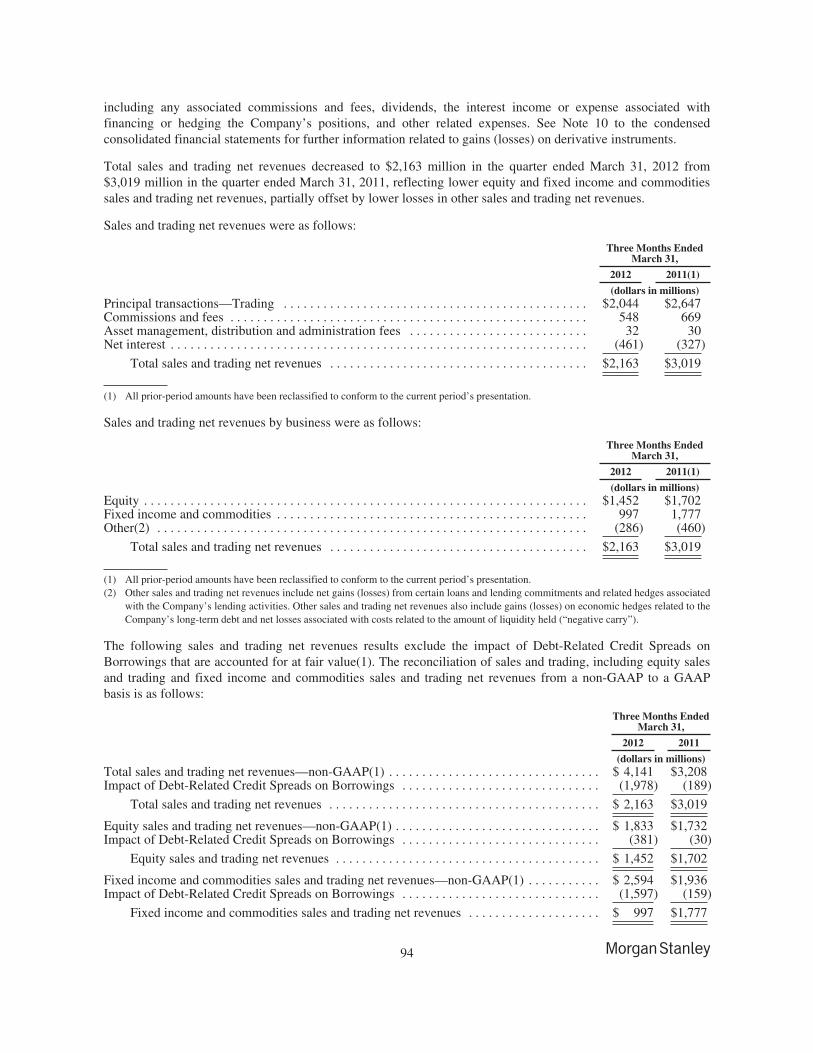
including any associated commissions and fees, dividends, the interest income or expense associated withfinancing or hedging the Company’s positions, and other related expenses. See Note 10 to the condensedconsolidated financial statements for further information related to gains (losses) on derivative instruments.
Total sales and trading net revenues decreased to $2,163 million in the quarter ended March 31, 2012 from$3,019 million in the quarter ended March 31, 2011, reflecting lower equity and fixed income and commoditiessales and trading net revenues, partially offset by lower losses in other sales and trading net revenues.
Sales and trading net revenues were as follows:
Three Months EndedMarch 31,
2012 2011(1)
(dollars in millions)Principal transactions—Trading . . . . . . . . . . . . . . . . . . . . . . . . . . . . . . . . . . . . . . . . . . . . . . $2,044 $2,647Commissions and fees . . . . . . . . . . . . . . . . . . . . . . . . . . . . . . . . . . . . . . . . . . . . . . . . . . . . . . 548 669Asset management, distribution and administration fees . . . . . . . . . . . . . . . . . . . . . . . . . . . 32 30Net interest . . . . . . . . . . . . . . . . . . . . . . . . . . . . . . . . . . . . . . . . . . . . . . . . . . . . . . . . . . . . . . . (461) (327)
Total sales and trading net revenues . . . . . . . . . . . . . . . . . . . . . . . . . . . . . . . . . . . . . . . $2,163 $3,019
(1) All prior-period amounts have been reclassified to conform to the current period’s presentation.
Sales and trading net revenues by business were as follows:
Three Months EndedMarch 31,
2012 2011(1)
(dollars in millions)Equity . . . . . . . . . . . . . . . . . . . . . . . . . . . . . . . . . . . . . . . . . . . . . . . . . . . . . . . . . . . . . . . . . . . $1,452 $1,702Fixed income and commodities . . . . . . . . . . . . . . . . . . . . . . . . . . . . . . . . . . . . . . . . . . . . . . . 997 1,777Other(2) . . . . . . . . . . . . . . . . . . . . . . . . . . . . . . . . . . . . . . . . . . . . . . . . . . . . . . . . . . . . . . . . . (286) (460)
Total sales and trading net revenues . . . . . . . . . . . . . . . . . . . . . . . . . . . . . . . . . . . . . . . $2,163 $3,019
(1) All prior-period amounts have been reclassified to conform to the current period’s presentation.(2) Other sales and trading net revenues include net gains (losses) from certain loans and lending commitments and related hedges associated
with the Company’s lending activities. Other sales and trading net revenues also include gains (losses) on economic hedges related to theCompany’s long-term debt and net losses associated with costs related to the amount of liquidity held (“negative carry”).
The following sales and trading net revenues results exclude the impact of Debt-Related Credit Spreads onBorrowings that are accounted for at fair value(1). The reconciliation of sales and trading, including equity salesand trading and fixed income and commodities sales and trading net revenues from a non-GAAP to a GAAPbasis is as follows:
Three Months EndedMarch 31,
2012 2011
(dollars in millions)Total sales and trading net revenues—non-GAAP(1) . . . . . . . . . . . . . . . . . . . . . . . . . . . . . . . . $ 4,141 $3,208Impact of Debt-Related Credit Spreads on Borrowings . . . . . . . . . . . . . . . . . . . . . . . . . . . . . . (1,978) (189)
Total sales and trading net revenues . . . . . . . . . . . . . . . . . . . . . . . . . . . . . . . . . . . . . . . . . $ 2,163 $3,019
Equity sales and trading net revenues—non-GAAP(1) . . . . . . . . . . . . . . . . . . . . . . . . . . . . . . . $ 1,833 $1,732Impact of Debt-Related Credit Spreads on Borrowings . . . . . . . . . . . . . . . . . . . . . . . . . . . . . . (381) (30)
Equity sales and trading net revenues . . . . . . . . . . . . . . . . . . . . . . . . . . . . . . . . . . . . . . . . $ 1,452 $1,702
Fixed income and commodities sales and trading net revenues—non-GAAP(1) . . . . . . . . . . . $ 2,594 $1,936Impact of Debt-Related Credit Spreads on Borrowings . . . . . . . . . . . . . . . . . . . . . . . . . . . . . . (1,597) (159)
Fixed income and commodities sales and trading net revenues . . . . . . . . . . . . . . . . . . . . $ 997 $1,777
94
(1) Sales and trading net revenues, including fixed income and commodities and equity sales and trading net revenues that excluded theimpact of Debt-Related Credit Spreads on Borrowings that are accounted for at fair value are non-GAAP financial measures that theCompany considers useful for the Company and investors to allow further comparability of period to period operating performance.
Equity. Equity sales and trading net revenues decreased 15% to $1,452 million in the quarter ended March 31,2012 from the comparable period in 2011. The results in equity sales and trading net revenues also includednegative revenue in the quarter ended March 31, 2012 of $381 million due to the impact of the tightening of theCompany’s Debt-Related Credit Spreads on Borrowings that are accounted for at fair value compared withnegative revenue of approximately $30 million in the quarter ended March 31, 2011. Equity sales and trading netrevenues, excluding the impact of the Company’s Debt-Related Credit Spreads on Borrowings that are accountedfor at fair value, in the quarter ended March 31, 2012 increased 6% over the comparable period in 2011,reflecting performance across all regions with higher revenues in the derivatives business and notable growth inelectronic and retail volumes.
In the quarter ended March 31, 2012, equity sales and trading net revenues also reflected gains of $44 millionrelated to changes in the fair value of net derivative contracts attributable to the tightening of counterparties’credit default swap spreads and other credit factors compared with gains of $12 million in the quarter endedMarch 31, 2011. The Company also recorded losses of $72 million in the quarter ended March 31, 2012 relatedto changes in the fair value of net derivative contracts attributable to the tightening of the Company’s creditdefault swap spreads and other credit factors compared with losses of $40 million in the quarter ended March 31,2011. The gains and losses on credit default swap spreads and other credit factors do not reflect any gains orlosses on related hedging instruments.
Fixed Income and Commodities. Fixed income and commodities sales and trading net revenues decreased 44%to $997 million in the quarter ended March 31, 2012 from $1,777 million in the quarter ended March 31, 2011.Results in the quarter ended March 31, 2012 included negative revenue of $1,597 million due to the impact of thetightening of the Company’s Debt-Related Credit Spreads on Borrowings that are accounted for at fair value,compared with negative revenue of approximately $159 million in the quarter ended March 31, 2011. Fixedincome and commodities sales and trading net revenues, excluding the impact of the Company’s Debt-RelatedCredit Spreads on Borrowings that are accounted for at fair value, in the quarter ended March 31, 2012 increased34% over the comparable period in 2011. Fixed income net revenues, excluding the impact of the Company’sDebt-Related Credit Spreads on Borrowings that are accounted for at fair value, in the quarter ended March 31,2012 increased 31% over the comparable period in 2011. The results in fixed income in the quarter endedMarch 31, 2012 reflected higher revenues in interest rate and currency products and corporate credit products,partially offset by lower revenues in securitized products due to lower trading volumes. Results in the quarterended March 31, 2011 also included losses of $318 million from Monolines (see “Executive Summary—Significant Items—Monoline Insurers” herein for further information). Commodity net revenues, excluding theimpact of the Company’s Debt-Related Credit Spreads on Borrowings that are accounted for at fair value,increased 30% in the quarter ended March 31, 2012, primarily due to higher levels of client activity, includingstructured transactions.
In the quarter ended March 31, 2012, fixed income and commodities sales and trading net revenues reflected netgains of $492 million related to changes in the fair value of net derivative contracts attributable to the tighteningof counterparties’ credit default swap spreads and other credit factors compared with gains of $857 million in thequarter ended March 31, 2011. The Company also recorded losses of $763 million in the quarter endedMarch 31, 2012 related to changes in the fair value of net derivative contracts attributable to the tightening of theCompany’s credit default swap spreads and other credit factors compared with losses of $156 million in thequarter ended March 31, 2011. The gains and losses on credit default swap spreads and other credit factors do notreflect any gains or losses on related hedging instruments.
Other. In addition to the equity and fixed income and commodities sales and trading net revenues discussedabove, sales and trading revenues included other trading revenues, consisting of certain activities associated withthe Company’s lending activities, gains (losses) on economic hedges related to the Company’s long-term debt
95
and negative carry. Other sales and trading net revenues reflected a net loss of $286 million in the quarter endedMarch 31, 2012 compared with a net loss of $460 million in the quarter ended March 31, 2011. The results inboth quarters primarily reflected losses on economic hedges related to the Company’s long-term debt andnegative carry. Results in the quarter ended March 31, 2012 were partially offset by net gains of $134 millionassociated with the portion of the loan and lending commitment portfolio carried at fair value (mark-to-marketvaluations and realized gains of $770 million and losses on related hedges of $636 million). Results in the prioryear quarter were partially offset by net gains of approximately $74 million associated with the portion of theloan and lending commitment portfolio carried at fair value (mark-to-market valuations and realized gains ofapproximately $209 million offset by losses on related hedges of approximately $135 million).
Effective April 1, 2012, the Company began accounting for all new “relationship-driven” and “event-driven”loans and lending commitments as either held for investment or held for sale. This corporate lending portfoliohas grown and the Company expects this trend to continue. See “Quantitative and Qualitative Disclosures aboutMarket Risk—Credit Risk—Institutional Securities Activities—Credit Exposure—Corporate Lending” in Part I,Item 3, herein.
Net Interest. Net interest expense increased to $461 million in the quarter ended March 31, 2012 from $327million in the quarter ended March 31, 2011 primarily due to lower interest revenues in reverse repurchaseagreements and stock lending transactions.
Principal Transactions—Investments. Principal transaction net investment losses of $49 million wererecognized in the quarter ended March 31, 2012 compared with net investment gains of $143 million in thequarter ended March 31, 2011. Results in the quarter ended March 31, 2012 primarily included mark-to-marketlosses on principal investments. Results in the quarter ended March 31, 2011 reflected gains in principalinvestments in real estate funds and investments associated with certain employee deferred compensation plansand co-investment plans.
Other. Other gains of $58 million were recognized in the quarter ended March 31, 2012 compared with otherlosses of $602 million in the quarter ended March 31, 2011. The results in the quarters ended March 31, 2012 and2011, primarily included a gain (loss) of $27 million and $(655) million, respectively, arising from theCompany’s 40% stake in MUMSS (see “Executive Summary—Significant Items—Japanese Securities JointVenture” herein).
Non-interest Expenses. Non-interest expenses increased 6% in the quarter ended March 31, 2012. The increasewas primarily due to higher compensation expenses. Compensation and benefits expenses increased 10% in thequarter ended March 31, 2012, primarily due to higher net revenues, excluding the impact of the Company’sDebt—Related Credit Spreads on Borrowings that are accounted for at fair value, and severance expense of $108million related to reductions in force in January 2012. Non-compensation expenses increased 1% in the quarterended March 31, 2012 compared with the prior year period. Information processing and communications expenseincreased 12% in the quarter ended March 31, 2012, primarily due to ongoing investments in technology.Professional services expenses increased 21% in the quarter ended March 31, 2012, primarily due to higherconsulting expenses. Other expenses decreased 27% in the quarter ended March 31, 2012, primarily due to lowerlitigation expenses.
96
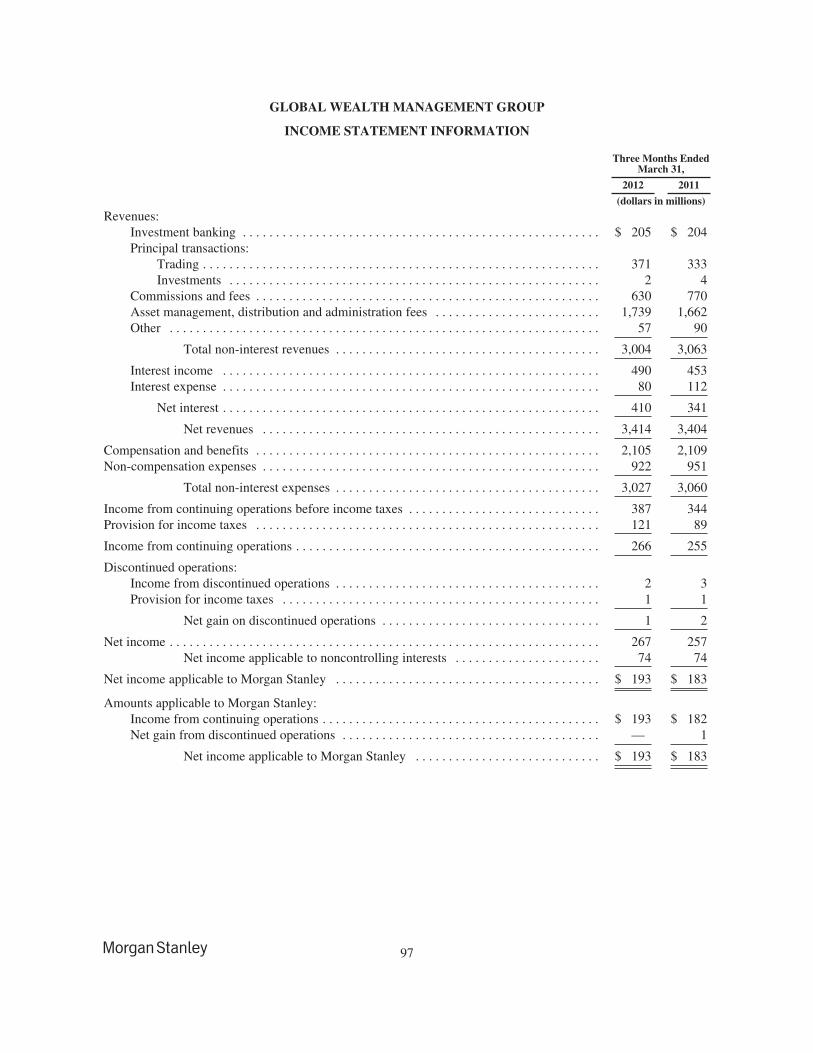
GLOBAL WEALTH MANAGEMENT GROUP
INCOME STATEMENT INFORMATION
Three Months EndedMarch 31,
2012 2011
(dollars in millions)
Revenues:Investment banking . . . . . . . . . . . . . . . . . . . . . . . . . . . . . . . . . . . . . . . . . . . . . . . . . . . . . . $ 205 $ 204Principal transactions:
Trading . . . . . . . . . . . . . . . . . . . . . . . . . . . . . . . . . . . . . . . . . . . . . . . . . . . . . . . . . . . . 371 333Investments . . . . . . . . . . . . . . . . . . . . . . . . . . . . . . . . . . . . . . . . . . . . . . . . . . . . . . . . 2 4
Commissions and fees . . . . . . . . . . . . . . . . . . . . . . . . . . . . . . . . . . . . . . . . . . . . . . . . . . . . 630 770Asset management, distribution and administration fees . . . . . . . . . . . . . . . . . . . . . . . . . 1,739 1,662Other . . . . . . . . . . . . . . . . . . . . . . . . . . . . . . . . . . . . . . . . . . . . . . . . . . . . . . . . . . . . . . . . . 57 90
Total non-interest revenues . . . . . . . . . . . . . . . . . . . . . . . . . . . . . . . . . . . . . . . . 3,004 3,063
Interest income . . . . . . . . . . . . . . . . . . . . . . . . . . . . . . . . . . . . . . . . . . . . . . . . . . . . . . . . . 490 453Interest expense . . . . . . . . . . . . . . . . . . . . . . . . . . . . . . . . . . . . . . . . . . . . . . . . . . . . . . . . . 80 112
Net interest . . . . . . . . . . . . . . . . . . . . . . . . . . . . . . . . . . . . . . . . . . . . . . . . . . . . . . . . . 410 341
Net revenues . . . . . . . . . . . . . . . . . . . . . . . . . . . . . . . . . . . . . . . . . . . . . . . . . . . 3,414 3,404
Compensation and benefits . . . . . . . . . . . . . . . . . . . . . . . . . . . . . . . . . . . . . . . . . . . . . . . . . . . . 2,105 2,109Non-compensation expenses . . . . . . . . . . . . . . . . . . . . . . . . . . . . . . . . . . . . . . . . . . . . . . . . . . . 922 951
Total non-interest expenses . . . . . . . . . . . . . . . . . . . . . . . . . . . . . . . . . . . . . . . . 3,027 3,060
Income from continuing operations before income taxes . . . . . . . . . . . . . . . . . . . . . . . . . . . . . 387 344Provision for income taxes . . . . . . . . . . . . . . . . . . . . . . . . . . . . . . . . . . . . . . . . . . . . . . . . . . . . 121 89
Income from continuing operations . . . . . . . . . . . . . . . . . . . . . . . . . . . . . . . . . . . . . . . . . . . . . . 266 255
Discontinued operations:Income from discontinued operations . . . . . . . . . . . . . . . . . . . . . . . . . . . . . . . . . . . . . . . . 2 3Provision for income taxes . . . . . . . . . . . . . . . . . . . . . . . . . . . . . . . . . . . . . . . . . . . . . . . . 1 1
Net gain on discontinued operations . . . . . . . . . . . . . . . . . . . . . . . . . . . . . . . . . 1 2
Net income . . . . . . . . . . . . . . . . . . . . . . . . . . . . . . . . . . . . . . . . . . . . . . . . . . . . . . . . . . . . . . . . . 267 257Net income applicable to noncontrolling interests . . . . . . . . . . . . . . . . . . . . . . 74 74
Net income applicable to Morgan Stanley . . . . . . . . . . . . . . . . . . . . . . . . . . . . . . . . . . . . . . . . $ 193 $ 183
Amounts applicable to Morgan Stanley:Income from continuing operations . . . . . . . . . . . . . . . . . . . . . . . . . . . . . . . . . . . . . . . . . . $ 193 $ 182Net gain from discontinued operations . . . . . . . . . . . . . . . . . . . . . . . . . . . . . . . . . . . . . . . — 1
Net income applicable to Morgan Stanley . . . . . . . . . . . . . . . . . . . . . . . . . . . . $ 193 $ 183
97
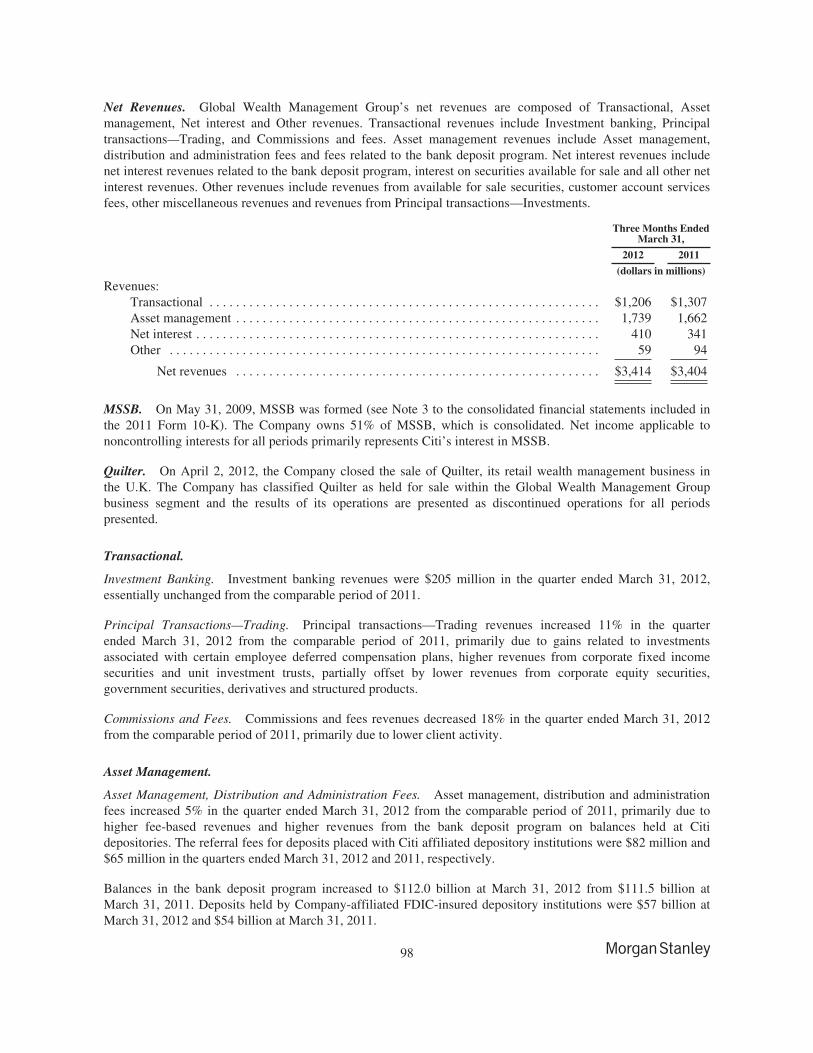
Net Revenues. Global Wealth Management Group’s net revenues are composed of Transactional, Assetmanagement, Net interest and Other revenues. Transactional revenues include Investment banking, Principaltransactions—Trading, and Commissions and fees. Asset management revenues include Asset management,distribution and administration fees and fees related to the bank deposit program. Net interest revenues includenet interest revenues related to the bank deposit program, interest on securities available for sale and all other netinterest revenues. Other revenues include revenues from available for sale securities, customer account servicesfees, other miscellaneous revenues and revenues from Principal transactions—Investments.
Three Months EndedMarch 31,
2012 2011
(dollars in millions)
Revenues:Transactional . . . . . . . . . . . . . . . . . . . . . . . . . . . . . . . . . . . . . . . . . . . . . . . . . . . . . . . . . . . $1,206 $1,307Asset management . . . . . . . . . . . . . . . . . . . . . . . . . . . . . . . . . . . . . . . . . . . . . . . . . . . . . . . 1,739 1,662Net interest . . . . . . . . . . . . . . . . . . . . . . . . . . . . . . . . . . . . . . . . . . . . . . . . . . . . . . . . . . . . . 410 341Other . . . . . . . . . . . . . . . . . . . . . . . . . . . . . . . . . . . . . . . . . . . . . . . . . . . . . . . . . . . . . . . . . 59 94
Net revenues . . . . . . . . . . . . . . . . . . . . . . . . . . . . . . . . . . . . . . . . . . . . . . . . . . . . . . . $3,414 $3,404
MSSB. On May 31, 2009, MSSB was formed (see Note 3 to the consolidated financial statements included inthe 2011 Form 10-K). The Company owns 51% of MSSB, which is consolidated. Net income applicable tononcontrolling interests for all periods primarily represents Citi’s interest in MSSB.
Quilter. On April 2, 2012, the Company closed the sale of Quilter, its retail wealth management business inthe U.K. The Company has classified Quilter as held for sale within the Global Wealth Management Groupbusiness segment and the results of its operations are presented as discontinued operations for all periodspresented.
Transactional.
Investment Banking. Investment banking revenues were $205 million in the quarter ended March 31, 2012,essentially unchanged from the comparable period of 2011.
Principal Transactions—Trading. Principal transactions—Trading revenues increased 11% in the quarterended March 31, 2012 from the comparable period of 2011, primarily due to gains related to investmentsassociated with certain employee deferred compensation plans, higher revenues from corporate fixed incomesecurities and unit investment trusts, partially offset by lower revenues from corporate equity securities,government securities, derivatives and structured products.
Commissions and Fees. Commissions and fees revenues decreased 18% in the quarter ended March 31, 2012from the comparable period of 2011, primarily due to lower client activity.
Asset Management.
Asset Management, Distribution and Administration Fees. Asset management, distribution and administrationfees increased 5% in the quarter ended March 31, 2012 from the comparable period of 2011, primarily due tohigher fee-based revenues and higher revenues from the bank deposit program on balances held at Citidepositories. The referral fees for deposits placed with Citi affiliated depository institutions were $82 million and$65 million in the quarters ended March 31, 2012 and 2011, respectively.
Balances in the bank deposit program increased to $112.0 billion at March 31, 2012 from $111.5 billion atMarch 31, 2011. Deposits held by Company-affiliated FDIC-insured depository institutions were $57 billion atMarch 31, 2012 and $54 billion at March 31, 2011.
98
Client assets in fee-based accounts increased to $531 billion and represented 30% of total client assets atMarch 31, 2012, compared with $490 billion and 29% at March 31, 2011, respectively. Total client assetbalances increased to $1,744 billion at March 31, 2012 from $1,706 billion at March 31, 2011, primarily due tothe impact of market conditions and net new asset inflows. Client asset balances in households with assets greaterthan $1 million increased to $1,323 billion at March 31, 2012 from $1,272 billion at March 31, 2011. Globalfee-based asset net inflows decreased to $8.7 billion at March 31, 2012 from $17.5 billion at March 31, 2011.
Net Interest.
Net interest increased 20% in the quarter ended March 31, 2012 from the comparable period of 2011, primarilyresulting from an increase in Interest income from the securities available for sale portfolio and higher revenuesfrom the bank deposit program.
Other.
Principal Transactions—Investments. Principal transaction net investment gains were $2 million in the quarterended March 31, 2012 compared with net investment gains of $4 million in the quarter ended March 31, 2011.The decrease primarily reflected losses related to investments associated with certain employee deferredcompensation plans compared with such investments in the prior year.
Other. Other revenues were $57 million in the quarter ended March 31, 2012, a decrease of 37% from thecomparable period of 2011, primarily due to lower gains on sales of securities available for sale, lower proxy andother fees, lower credit card revenues and a higher allowance for loan losses.
Non-interest Expenses. Non-interest expenses decreased 1% in the quarter ended March 31, 2012 from thecomparable period of 2011. Compensation and benefits expense was essentially unchanged in the quarter endedMarch 31, 2012 from the comparable period of 2011. Non-compensation expenses decreased 3% in the quarterended March 31, 2012 from the comparable period of 2011. In the quarter ended March 31, 2012, marketing andbusiness development expense increased 12% from the comparable period of 2011, primarily due to higher costsassociated with conferences and seminars. Professional services expense decreased 10% in the quarter endedMarch 31, 2012 from the comparable period of 2011, primarily due to lower technology consulting costs.
99
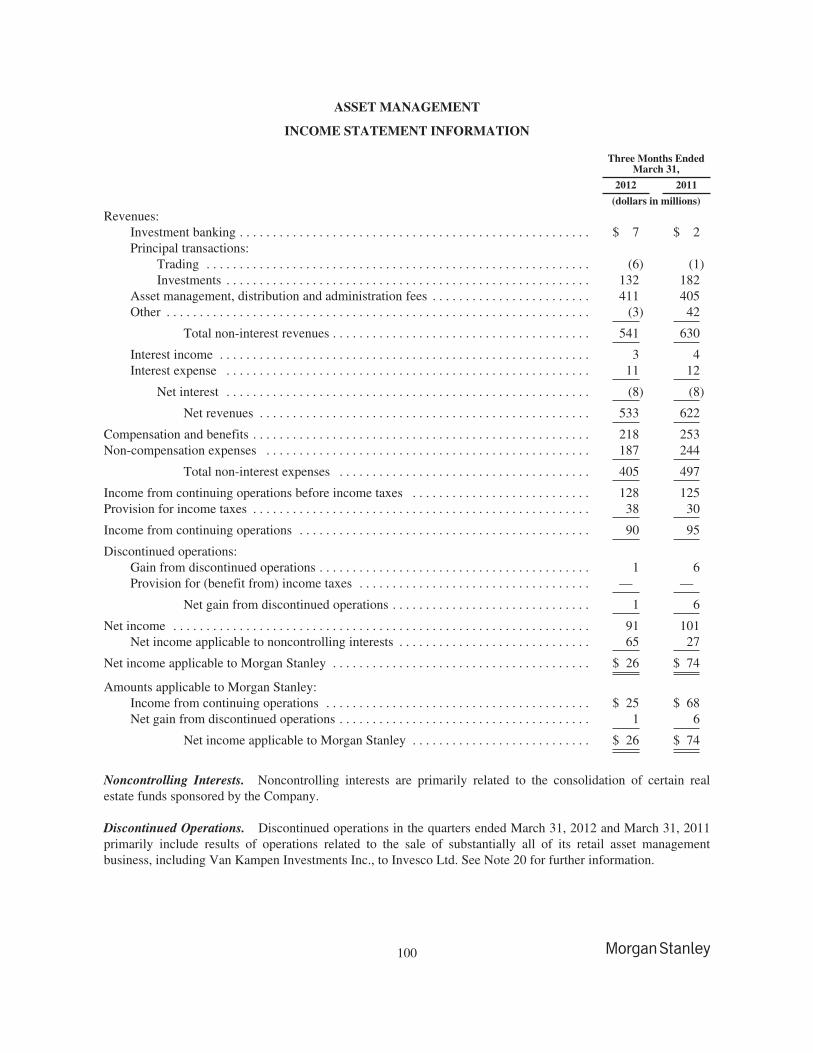
ASSET MANAGEMENT
INCOME STATEMENT INFORMATION
Three Months EndedMarch 31,
2012 2011
(dollars in millions)
Revenues:Investment banking . . . . . . . . . . . . . . . . . . . . . . . . . . . . . . . . . . . . . . . . . . . . . . . . . . . . . $ 7 $ 2Principal transactions:
Trading . . . . . . . . . . . . . . . . . . . . . . . . . . . . . . . . . . . . . . . . . . . . . . . . . . . . . . . . . . (6) (1)Investments . . . . . . . . . . . . . . . . . . . . . . . . . . . . . . . . . . . . . . . . . . . . . . . . . . . . . . . 132 182
Asset management, distribution and administration fees . . . . . . . . . . . . . . . . . . . . . . . . 411 405Other . . . . . . . . . . . . . . . . . . . . . . . . . . . . . . . . . . . . . . . . . . . . . . . . . . . . . . . . . . . . . . . . (3) 42
Total non-interest revenues . . . . . . . . . . . . . . . . . . . . . . . . . . . . . . . . . . . . . . . 541 630
Interest income . . . . . . . . . . . . . . . . . . . . . . . . . . . . . . . . . . . . . . . . . . . . . . . . . . . . . . . . 3 4Interest expense . . . . . . . . . . . . . . . . . . . . . . . . . . . . . . . . . . . . . . . . . . . . . . . . . . . . . . . 11 12
Net interest . . . . . . . . . . . . . . . . . . . . . . . . . . . . . . . . . . . . . . . . . . . . . . . . . . . . . . . (8) (8)
Net revenues . . . . . . . . . . . . . . . . . . . . . . . . . . . . . . . . . . . . . . . . . . . . . . . . . . 533 622
Compensation and benefits . . . . . . . . . . . . . . . . . . . . . . . . . . . . . . . . . . . . . . . . . . . . . . . . . . . 218 253Non-compensation expenses . . . . . . . . . . . . . . . . . . . . . . . . . . . . . . . . . . . . . . . . . . . . . . . . . 187 244
Total non-interest expenses . . . . . . . . . . . . . . . . . . . . . . . . . . . . . . . . . . . . . . 405 497
Income from continuing operations before income taxes . . . . . . . . . . . . . . . . . . . . . . . . . . . 128 125Provision for income taxes . . . . . . . . . . . . . . . . . . . . . . . . . . . . . . . . . . . . . . . . . . . . . . . . . . . 38 30
Income from continuing operations . . . . . . . . . . . . . . . . . . . . . . . . . . . . . . . . . . . . . . . . . . . . 90 95
Discontinued operations:Gain from discontinued operations . . . . . . . . . . . . . . . . . . . . . . . . . . . . . . . . . . . . . . . . . 1 6Provision for (benefit from) income taxes . . . . . . . . . . . . . . . . . . . . . . . . . . . . . . . . . . . — —
Net gain from discontinued operations . . . . . . . . . . . . . . . . . . . . . . . . . . . . . . 1 6
Net income . . . . . . . . . . . . . . . . . . . . . . . . . . . . . . . . . . . . . . . . . . . . . . . . . . . . . . . . . . . . . . . 91 101Net income applicable to noncontrolling interests . . . . . . . . . . . . . . . . . . . . . . . . . . . . . 65 27
Net income applicable to Morgan Stanley . . . . . . . . . . . . . . . . . . . . . . . . . . . . . . . . . . . . . . . $ 26 $ 74
Amounts applicable to Morgan Stanley:Income from continuing operations . . . . . . . . . . . . . . . . . . . . . . . . . . . . . . . . . . . . . . . . $ 25 $ 68Net gain from discontinued operations . . . . . . . . . . . . . . . . . . . . . . . . . . . . . . . . . . . . . . 1 6
Net income applicable to Morgan Stanley . . . . . . . . . . . . . . . . . . . . . . . . . . . $ 26 $ 74
Noncontrolling Interests. Noncontrolling interests are primarily related to the consolidation of certain realestate funds sponsored by the Company.
Discontinued Operations. Discontinued operations in the quarters ended March 31, 2012 and March 31, 2011primarily include results of operations related to the sale of substantially all of its retail asset managementbusiness, including Van Kampen Investments Inc., to Invesco Ltd. See Note 20 for further information.
100
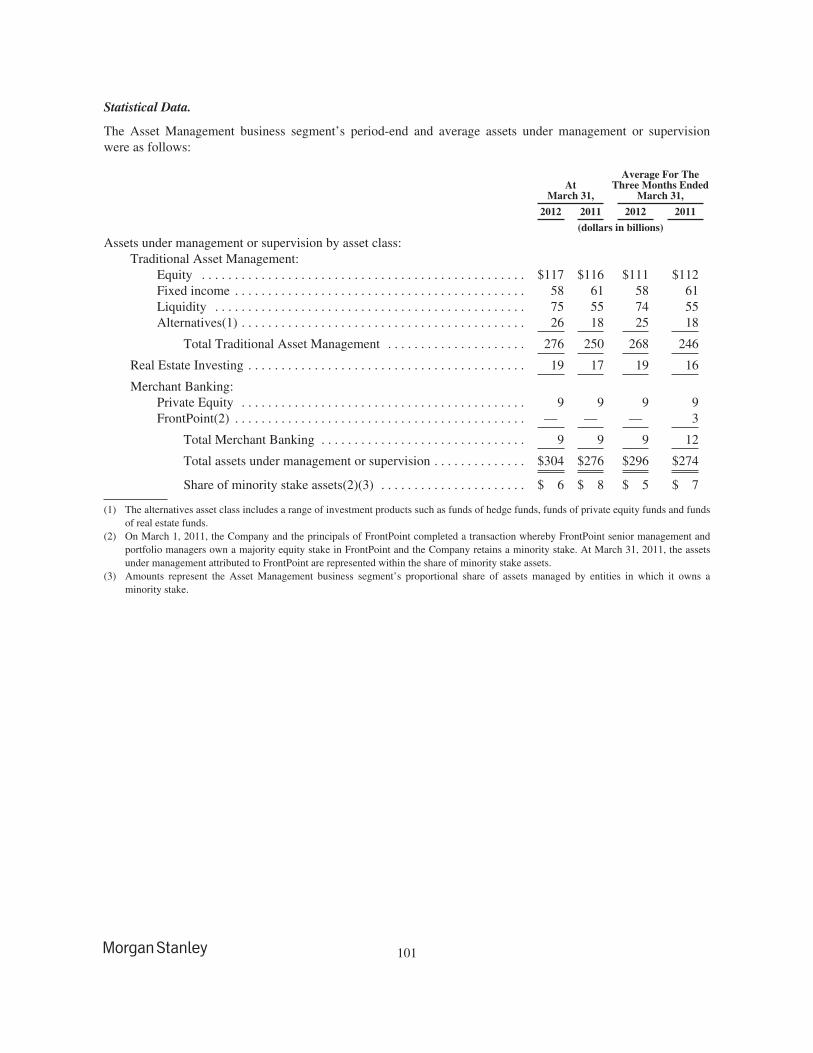
Statistical Data.
The Asset Management business segment’s period-end and average assets under management or supervisionwere as follows:
AtMarch 31,
Average For TheThree Months Ended
March 31,
2012 2011 2012 2011
(dollars in billions)
Assets under management or supervision by asset class:Traditional Asset Management:
Equity . . . . . . . . . . . . . . . . . . . . . . . . . . . . . . . . . . . . . . . . . . . . . . . . . $117 $116 $111 $112Fixed income . . . . . . . . . . . . . . . . . . . . . . . . . . . . . . . . . . . . . . . . . . . . 58 61 58 61Liquidity . . . . . . . . . . . . . . . . . . . . . . . . . . . . . . . . . . . . . . . . . . . . . . . 75 55 74 55Alternatives(1) . . . . . . . . . . . . . . . . . . . . . . . . . . . . . . . . . . . . . . . . . . . 26 18 25 18
Total Traditional Asset Management . . . . . . . . . . . . . . . . . . . . . 276 250 268 246
Real Estate Investing . . . . . . . . . . . . . . . . . . . . . . . . . . . . . . . . . . . . . . . . . . 19 17 19 16
Merchant Banking:Private Equity . . . . . . . . . . . . . . . . . . . . . . . . . . . . . . . . . . . . . . . . . . . 9 9 9 9FrontPoint(2) . . . . . . . . . . . . . . . . . . . . . . . . . . . . . . . . . . . . . . . . . . . . — — — 3
Total Merchant Banking . . . . . . . . . . . . . . . . . . . . . . . . . . . . . . . 9 9 9 12
Total assets under management or supervision . . . . . . . . . . . . . . $304 $276 $296 $274
Share of minority stake assets(2)(3) . . . . . . . . . . . . . . . . . . . . . . $ 6 $ 8 $ 5 $ 7
(1) The alternatives asset class includes a range of investment products such as funds of hedge funds, funds of private equity funds and fundsof real estate funds.
(2) On March 1, 2011, the Company and the principals of FrontPoint completed a transaction whereby FrontPoint senior management andportfolio managers own a majority equity stake in FrontPoint and the Company retains a minority stake. At March 31, 2011, the assetsunder management attributed to FrontPoint are represented within the share of minority stake assets.
(3) Amounts represent the Asset Management business segment’s proportional share of assets managed by entities in which it owns aminority stake.
101
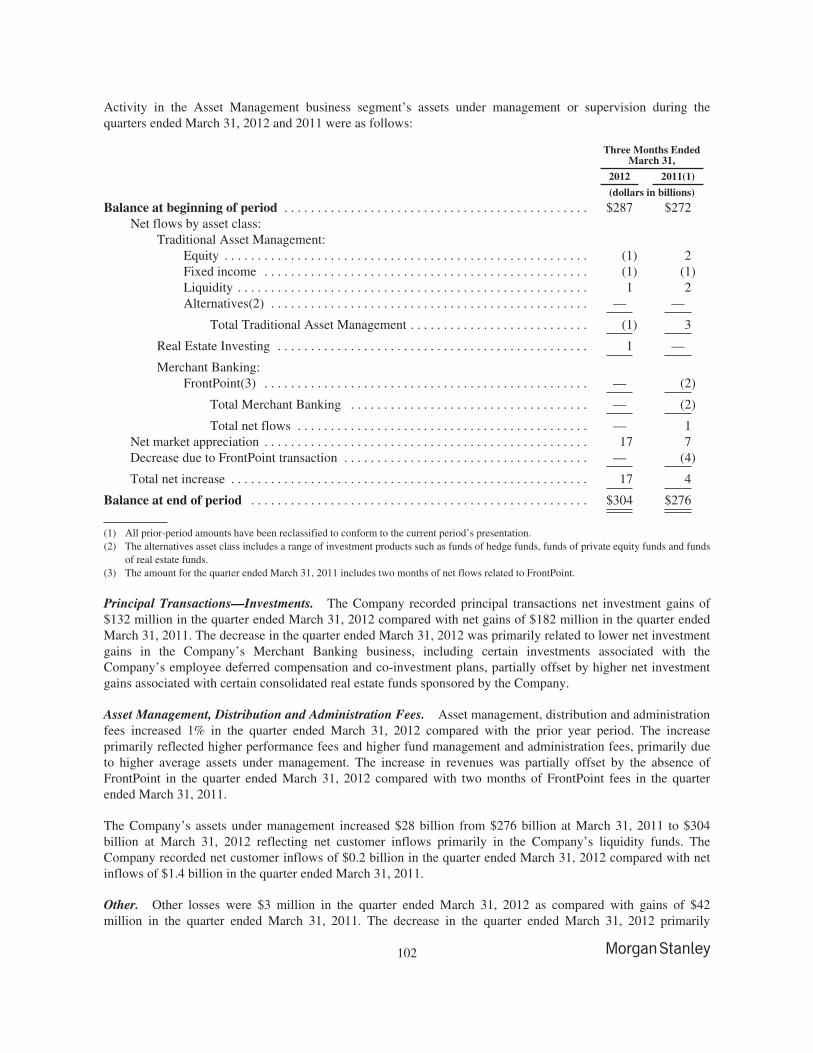
Activity in the Asset Management business segment’s assets under management or supervision during thequarters ended March 31, 2012 and 2011 were as follows:
Three Months EndedMarch 31,
2012 2011(1)
(dollars in billions)
Balance at beginning of period . . . . . . . . . . . . . . . . . . . . . . . . . . . . . . . . . . . . . . . . . . . . . . $287 $272Net flows by asset class:
Traditional Asset Management:Equity . . . . . . . . . . . . . . . . . . . . . . . . . . . . . . . . . . . . . . . . . . . . . . . . . . . . . . . (1) 2Fixed income . . . . . . . . . . . . . . . . . . . . . . . . . . . . . . . . . . . . . . . . . . . . . . . . . (1) (1)Liquidity . . . . . . . . . . . . . . . . . . . . . . . . . . . . . . . . . . . . . . . . . . . . . . . . . . . . . 1 2Alternatives(2) . . . . . . . . . . . . . . . . . . . . . . . . . . . . . . . . . . . . . . . . . . . . . . . . — —
Total Traditional Asset Management . . . . . . . . . . . . . . . . . . . . . . . . . . . (1) 3
Real Estate Investing . . . . . . . . . . . . . . . . . . . . . . . . . . . . . . . . . . . . . . . . . . . . . . . 1 —
Merchant Banking:FrontPoint(3) . . . . . . . . . . . . . . . . . . . . . . . . . . . . . . . . . . . . . . . . . . . . . . . . . — (2)
Total Merchant Banking . . . . . . . . . . . . . . . . . . . . . . . . . . . . . . . . . . . . — (2)
Total net flows . . . . . . . . . . . . . . . . . . . . . . . . . . . . . . . . . . . . . . . . . . . . — 1Net market appreciation . . . . . . . . . . . . . . . . . . . . . . . . . . . . . . . . . . . . . . . . . . . . . . . . . 17 7Decrease due to FrontPoint transaction . . . . . . . . . . . . . . . . . . . . . . . . . . . . . . . . . . . . . — (4)
Total net increase . . . . . . . . . . . . . . . . . . . . . . . . . . . . . . . . . . . . . . . . . . . . . . . . . . . . . . 17 4
Balance at end of period . . . . . . . . . . . . . . . . . . . . . . . . . . . . . . . . . . . . . . . . . . . . . . . . . . . $304 $276
(1) All prior-period amounts have been reclassified to conform to the current period’s presentation.(2) The alternatives asset class includes a range of investment products such as funds of hedge funds, funds of private equity funds and funds
of real estate funds.(3) The amount for the quarter ended March 31, 2011 includes two months of net flows related to FrontPoint.
Principal Transactions—Investments. The Company recorded principal transactions net investment gains of$132 million in the quarter ended March 31, 2012 compared with net gains of $182 million in the quarter endedMarch 31, 2011. The decrease in the quarter ended March 31, 2012 was primarily related to lower net investmentgains in the Company’s Merchant Banking business, including certain investments associated with theCompany’s employee deferred compensation and co-investment plans, partially offset by higher net investmentgains associated with certain consolidated real estate funds sponsored by the Company.
Asset Management, Distribution and Administration Fees. Asset management, distribution and administrationfees increased 1% in the quarter ended March 31, 2012 compared with the prior year period. The increaseprimarily reflected higher performance fees and higher fund management and administration fees, primarily dueto higher average assets under management. The increase in revenues was partially offset by the absence ofFrontPoint in the quarter ended March 31, 2012 compared with two months of FrontPoint fees in the quarterended March 31, 2011.
The Company’s assets under management increased $28 billion from $276 billion at March 31, 2011 to $304billion at March 31, 2012 reflecting net customer inflows primarily in the Company’s liquidity funds. TheCompany recorded net customer inflows of $0.2 billion in the quarter ended March 31, 2012 compared with netinflows of $1.4 billion in the quarter ended March 31, 2011.
Other. Other losses were $3 million in the quarter ended March 31, 2012 as compared with gains of $42million in the quarter ended March 31, 2011. The decrease in the quarter ended March 31, 2012 primarily
102
reflected lower revenues associated with the Company’s minority stake investments in Avenue Capital Group, aNew York based investment manager, and Lansdowne Partners, a London-based investment manager.
Non-interest Expenses. Non-interest expenses decreased 19% in the quarter ended March 31, 2012 comparedwith the quarter ended March 31, 2011, reflecting a decrease in compensation expenses and non-compensationexpenses. Compensation and benefits expenses decreased 14% in the quarter ended March 31, 2012 comparedwith the prior year period primarily related to lower net revenues, including the absence of FrontPoint in thequarter ended March 31, 2012 compared with two months of FrontPoint expenses in the quarter ended March 31,2011. Non-compensation expenses decreased 23% in the quarter ended March 31, 2012 compared with the prioryear period, which included indemnification losses related to the FrontPoint transaction recognized in Otherexpenses.
103
Other Matters.Real Estate.
The Company acts as the general partner for various real estate funds and also invests in certain of these funds asa limited partner. The Company’s real estate investments at March 31, 2012 and December 31, 2011 aredescribed below. Such amounts exclude investments associated with certain employee deferred compensationand co-investment plans.
At March 31, 2012 and December 31, 2011, the condensed consolidated statements of financial conditionincluded amounts representing real estate investment assets of condensed consolidated subsidiaries ofapproximately $2.1 billion and $2.0 billion, respectively, including noncontrolling interests of approximately$1.7 billion and $1.6 billion, respectively, for a net amount of $0.4 billion in both periods. This net presentationis a non-GAAP financial measure that the Company considers to be a useful measure for the Company andinvestors to use in assessing the Company’s net exposure. In addition, the Company has contractual capitalcommitments, guarantees, lending facilities and counterparty arrangements with respect to real estate investmentsof $0.7 billion at March 31, 2012.
In addition to the Company’s real estate investments, the Company engages in various real estate-relatedactivities, including origination of loans secured by commercial and residential properties. The Company alsosecuritizes and trades in a wide range of commercial and residential real estate and real estate-related wholeloans, mortgages and other real estate. In connection with these activities, the Company has provided, orotherwise agreed to be responsible for, representations and warranties. Under certain circumstances, theCompany may be required to repurchase such assets or make other payments related to such assets if suchrepresentations and warranties were breached. The Company continues to monitor its real estate-related activitiesin order to manage its exposures and potential liability from these markets and businesses. See “LegalProceedings—Residential Mortgage and Credit Crisis Related Matters” in Part II, Item 1, herein and see Note 11to the condensed consolidated financial statements.
See Note 11 to the condensed consolidated financial statements for further information.
Regulatory Outlook.
On July 21, 2010, President Obama signed the Dodd-Frank Act into law. While certain portions of the Dodd-FrankAct were effective immediately, other portions will be effective only following extended transition periods.Moreover, implementation of the Dodd-Frank Act will be accomplished through numerous rulemakings by multiplegovernmental agencies, only a portion of which have been completed. It remains difficult to assess fully the impactthat the Dodd-Frank Act will have on the Company and on the financial services industry generally. In addition,various international developments, such as the adoption of risk-based capital, leverage and liquidity standards bythe Basel Committee, known as “Basel III,” will impact the Company in the coming years.
It is likely that 2012 and subsequent years will see further material changes in the way major financialinstitutions are regulated in both the U.S. and other markets in which the Company operates, although it remainsdifficult to predict which further reform initiatives will become law, how such reforms will be implemented orthe exact impact they will have on the Company’s business, financial condition, results of operations and cashflows for a particular future period.
For a further discussion regarding the regulatory outlook for the Company, please refer to “Supervision andRegulation” in Part I, Item 1 included in the Form 10-K.
Activities Restrictions under the Volcker Rule. On April 19, 2012, the Federal Reserve issued guidanceregarding when banking entities, such as the Company, must bring their activities, investments, relationships andtransactions into compliance with the Volcker Rule. The guidance confirms that banking entities will have untilJuly 21, 2014 to bring all of their activities and investments into conformance with the Volcker Rule, subject topossible extensions. Banking entities must act in good faith and develop a conformance plan that is as specific aspossible about how they will fully conform all of their covered activities and investments by July 21, 2014,unless that period is extended by the Federal Reserve.
104
Critical Accounting Policies.
The Company’s condensed consolidated financial statements are prepared in accordance with accountingprinciples generally accepted in the U.S., which require the Company to make estimates and assumptions (seeNote 1 to the condensed consolidated financial statements). The Company believes that of its significantaccounting policies (see Note 2 to the consolidated financial statements for the year ended December 31, 2011included in the Form 10-K and Note 2 to the condensed consolidated financial statements), the following policiesinvolve a higher degree of judgment and complexity.
Fair Value.
Financial Instruments Measured at Fair Value. A significant number of the Company’s financial instrumentsare carried at fair value. The Company makes estimates regarding valuation of assets and liabilities measured atfair value in preparing the condensed consolidated financial statements. These assets and liabilities include butare not limited to:
• Financial instruments owned and Financial instruments sold, not yet purchased;
• Securities available for sale;
• Securities received as collateral and Obligation to return securities received as collateral;
• Certain Securities purchased under agreements to resell;
• Certain Deposits;
• Certain Commercial paper and other short-term borrowings, primarily structured notes;
• Certain Securities sold under agreements to repurchase;
• Certain Other secured financings; and
• Certain Long-term borrowings, primarily structured notes.
Fair value is defined as the price that would be received to sell an asset or paid to transfer a liability (i.e., the“exit price”) in an orderly transaction between market participants at the measurement date.
In determining fair value, the Company uses various valuation approaches. A hierarchy for inputs is used inmeasuring fair value that maximizes the use of observable prices and inputs and minimizes the use of unobservableprices and inputs by requiring that the relevant observable inputs be used when available. The hierarchy is brokendown into three levels, wherein Level 1 uses observable prices in active markets, and Level 3 consists of valuationtechniques that incorporate significant unobservable inputs and, therefore, require the greatest use of judgment. Inperiods of market disruption, the observability of prices and inputs may be reduced for many instruments. Thiscondition could cause an instrument to be recategorized from Level 1 to Level 2 or Level 2 to Level 3. In addition, adownturn in market conditions could lead to declines in the valuation of many instruments. For further informationon the valuation process, fair value definition, Level 1, Level 2, Level 3 and related valuation techniques, andquantitative information about and sensitivity of significant unobservable inputs used in Level 3 fair valuemeasurements, see Notes 2 and 4 to the consolidated financial statements for the year ended December 31, 2011included in the Form 10-K and Notes 2 and 3 to the condensed consolidated financial statements.
Level 3 Assets and Liabilities. The Company’s Level 3 assets before the impact of cash collateral andcounterparty netting across the levels of the fair value hierarchy were $29.7 billion and $32.5 billion at March 31,2012 and December 31, 2011, respectively, and represented approximately 9% and 10% at March 31, 2012 andDecember 31, 2011, respectively, of the assets measured at fair value (approximately 4% of total assets atMarch 31, 2012 and December 31, 2011). Level 3 liabilities before the impact of cash collateral and counterpartynetting across the levels of the fair value hierarchy were $9.9 billion and $11.2 billion at March 31, 2012 andDecember 31, 2011, respectively, and represented approximately 5% and 6%, respectively, of the Company’sliabilities measured at fair value.
105
Assets and Liabilities Measured at Fair Value on a Non-recurring Basis. At March 31, 2012, certain of theCompany’s assets were measured at fair value on a non-recurring basis, primarily relating to loans, otherinvestments, premises, equipment and software costs, and intangible assets. The Company incurs losses or gainsfor any adjustments of these assets to fair value. A downturn in market conditions could result in impairmentcharges in future periods.
For assets and liabilities measured at fair value on a non-recurring basis, fair value is determined by usingvarious valuation approaches. The same hierarchy as described above, which maximizes the use of observableinputs and minimizes the use of unobservable inputs by generally requiring that the observable inputs be usedwhen available, is used in measuring fair value for these items.
For further information on assets and liabilities that are measured at fair value on a non-recurring basis, seeNote 3 to the condensed consolidated financial statements.
Fair Value Control Processes. The Company employs control processes to validate the fair value of itsfinancial instruments, including those derived from pricing models. These control processes are designed toensure that the values used for financial reporting are based on observable inputs wherever possible. In the eventthat observable inputs are not available, the control processes are designed to assure that the valuation approachutilized is appropriate and consistently applied and that the assumptions are reasonable. For more informationregarding the Company’s valuation policies, processes and procedures, see Note 2 to the condensed consolidatedfinancial statements.
Goodwill and Intangible Assets.
Goodwill. The Company tests goodwill for impairment on an annual basis on July 1 and on an interim basiswhen certain events or circumstances exist. The Company tests for impairment at the reporting unit level, whichis generally at the level of or one level below its business segments. Goodwill no longer retains its associationwith a particular acquisition once it has been assigned to a reporting unit. As such, all of the activities of areporting unit, whether acquired or organically developed, are available to support the value of the goodwill. Forboth the annual and interim tests, the Company has the option to first assess qualitative factors to determinewhether the existence of events or circumstances leads to a determination that it is more likely than not that thefair value of a reporting unit is less than its carrying amount. If after assessing the totality of events orcircumstances, the Company determines it is more likely than not that the fair value of a reporting unit is greaterthan its carrying amount, then performing the two-step impairment test is not required. However, if the Companyconcludes otherwise, then it is required to perform the first step of the two-step impairment test. Goodwillimpairment is determined by comparing the estimated fair value of a reporting unit with its respective carryingvalue. If the estimated fair value exceeds the carrying value, goodwill at the reporting unit level is not deemed tobe impaired. If the estimated fair value is below carrying value, however, further analysis is required todetermine the amount of the impairment. Additionally, if the carrying value of a reporting unit is zero or anegative value and it is determined that it is more likely than not the goodwill is impaired, further analysis isrequired. The estimated fair values of the reporting units are derived based on valuation techniques the Companybelieves market participants would use for each of the reporting units. The estimated fair values are generallydetermined utilizing methodologies that incorporate price-to-book, price-to-earnings and assets undermanagement multiples of certain comparable companies. The Company also utilizes a discounted cash flowmethodology for certain reporting units.
Intangible Assets. Amortizable intangible assets are amortized over their estimated useful lives and arereviewed for impairment on an interim basis when certain events or circumstances exist. For amortizableintangible assets, an impairment exists when the carrying amount of the intangible asset exceeds its fair value.An impairment loss will be recognized only if the carrying amount of the intangible asset is not recoverable andexceeds its fair value. The carrying amount of the intangible asset is not recoverable if it exceeds the sum of theexpected undiscounted cash flows.
106
Indefinite-lived intangible assets are not amortized but are reviewed annually (or more frequently when certainevents or circumstances exist) for impairment. For indefinite-lived intangible assets, an impairment exists whenthe carrying amount exceeds its fair value.
For both goodwill and intangible assets, to the extent an impairment loss is recognized, the loss establishes thenew cost basis of the asset. Subsequent reversal of impairment losses is not permitted. For amortizable intangibleassets, the new cost basis is amortized over the remaining useful life of that asset. Adverse market or economicevents could result in impairment charges in future periods.
See Notes 3 and 8 to the condensed consolidated financial statements for additional information about goodwilland intangible assets.
Legal, Regulatory and Tax Contingencies.
In the normal course of business, the Company has been named, from time to time, as a defendant in variouslegal actions, including arbitrations, class actions and other litigation, arising in connection with its activities as aglobal diversified financial services institution.
Certain of the actual or threatened legal actions include claims for substantial compensatory and/or punitivedamages or claims for indeterminate amounts of damages. In some cases, the entities that would otherwise be theprimary defendants in such cases are bankrupt or in financial distress.
The Company is also involved, from time to time, in other reviews, investigations and proceedings (both formaland informal) by governmental and self-regulatory agencies regarding the Company’s business, including,among other matters, accounting and operational matters, certain of which may result in adverse judgments,settlements, fines, penalties, injunctions or other relief.
Accruals for litigation and regulatory proceedings are generally determined on a case-by-case basis. Whereavailable information indicates that it is probable a liability had been incurred at the date of the condensedconsolidated financial statements and the Company can reasonably estimate the amount of that loss, theCompany accrues the estimated loss by a charge to income. In many proceedings, however, it is inherentlydifficult to determine whether any loss is probable or even possible or to estimate the amount of any loss. Forcertain legal proceedings, the Company can estimate possible losses, additional losses, ranges of loss or ranges ofadditional loss in excess of amounts accrued. For certain other legal proceedings, the Company cannotreasonably estimate such losses, particularly for proceedings that are in their early stages of development orwhere plaintiffs seek substantial or indeterminate damages. Numerous issues may need to be resolved, includingthrough potentially lengthy discovery and determination of important factual matters, and by addressing novel orunsettled legal questions relevant to the proceedings in question, before a loss or additional loss or range of lossor additional loss can be reasonably estimated for any proceeding.
The Company is subject to the income and indirect tax laws of the U.S., its states and municipalities and those ofthe foreign jurisdictions in which the Company has significant business operations. These tax laws are complexand subject to different interpretations by the taxpayer and the relevant governmental taxing authorities. TheCompany must make judgments and interpretations about the application of these inherently complex tax lawswhen determining the provision for income taxes and the expense for indirect taxes and must also make estimatesabout when certain items affect taxable income in the various tax jurisdictions. Disputes over interpretations ofthe tax laws may be settled with the taxing authority upon examination or audit. The Company periodicallyevaluates the likelihood of assessments in each taxing jurisdiction resulting from current and subsequent years’examinations, and unrecognized tax benefits related to potential losses that may arise from tax audits areestablished in accordance with the guidance on accounting for unrecognized tax benefits. Once established,unrecognized tax benefits are adjusted when there is more information available or when an event occursrequiring a change.
107
The income of certain foreign subsidiaries earned outside of the United States has previously been excluded fromtaxation in the U.S. as a result of a provision of U.S. tax law that defers the imposition of tax on certain activefinancial services income until such income is repatriated to the United States as a dividend. This provision,which expired for taxable years beginning on or after January 1, 2012, had previously been extended by Congresson several occasions, including the most recent extension which occurred during 2010. If this provision isextended again with respect to such income earned during 2012, the overall financial impact to the Companywould depend upon the level, composition and geographic mix of earnings but could decrease the Company’s2012 annual effective tax rate and have a favorable impact on the Company’s net income, but not its cash flowsdue to utilization of tax attributes carryforwards.
Significant judgment is required in making these estimates, and the actual cost of a legal claim, tax assessment orregulatory fine/penalty may ultimately be materially different from the recorded accruals and unrecognized taxbenefits, if any. See Notes 11 and 17 to the condensed consolidated financial statements for additionalinformation on legal proceedings and tax examinations.
Special Purpose Entities and Variable Interest Entities.
The Company’s involvement with special purpose entities (“SPE”) consists primarily of the following:
• Transferring financial assets into SPEs;
• Acting as an underwriter of beneficial interests issued by securitization vehicles;
• Holding one or more classes of securities issued by, or making loans to or investments in, SPEs that holddebt, equity, real estate or other assets;
• Purchasing and selling (in both a market-making and a proprietary-trading capacity) securities issued bySPEs/variable interest entities (“VIE”), whether such vehicles are sponsored by the Company or not;
• Entering into derivative transactions with SPEs (whether or not sponsored by the Company);
• Providing warehouse financing to collateralized debt obligations and collateralized loan obligations;
• Entering into derivative agreements with non-SPEs whose value is derived from securities issued bySPEs;
• Servicing assets held by SPEs or holding servicing rights related to assets held by SPEs that are servicedby others under subservicing arrangements;
• Serving as an asset manager to various investment funds that may invest in securities that are backed, inwhole or in part, by SPEs; and
• Structuring and/or investing in other structured transactions designed to provide enhanced, tax-efficientyields to the Company or its clients.
The Company engages in securitization activities related to commercial and residential mortgage loans, U.S.agency collateralized mortgage obligations, corporate bonds and loans, municipal bonds and other types offinancial instruments. The Company’s involvement with SPEs is discussed further in Note 6 to the condensedconsolidated financial statements.
In most cases, these SPEs are deemed for accounting purposes to be VIEs. The Company applies accountingguidance for consolidation of VIEs to certain entities in which equity investors do not have the characteristics ofa controlling financial interest. Entities that previously met the criteria as qualifying SPEs that were not subject toconsolidation prior to January 1, 2010 became subject to the consolidation requirements for VIEs on that date.Excluding entities subject to the Deferral (as defined in Note 2 to the condensed consolidated financialstatements), effective January 1, 2010, the primary beneficiary of a VIE is the party that both (1) has the power todirect the activities of a VIE that most significantly affect the VIE’s economic performance and (2) has anobligation to absorb losses or the right to receive benefits that in either case could potentially be significant to theVIE. The Company consolidates entities of which it is the primary beneficiary.
108
The Company determines whether it is the primary beneficiary of a VIE upon its initial involvement with theVIE and reassesses whether it is the primary beneficiary on an ongoing basis as long as it has any continuinginvolvement with the VIE. This determination is based upon an analysis of the design of the VIE, including theVIE’s structure and activities, the power to make significant economic decisions held by the Company and byother parties and the variable interests owned by the Company and other parties.
See Note 2 to the consolidated financial statements for the year ended December 31, 2011 included in theForm 10-K for information on accounting guidance adopted on January 1, 2010 for transfers of financial assets.
109
Liquidity and Capital Resources.
The Company’s senior management establishes the liquidity and capital policies of the Company. Throughvarious risk and control committees, the Company’s senior management reviews business performance relativeto these policies, monitors the availability of alternative sources of financing, and oversees the liquidity andinterest rate and currency sensitivity of the Company’s asset and liability position. The Company’s TreasuryDepartment, Firm Risk Committee, Asset and Liability Management Committee and other control groups assistin evaluating, monitoring and controlling the impact that the Company’s business activities have on itscondensed consolidated statements of financial condition, liquidity and capital structure. Liquidity and capitalmatters are reported regularly to the Board’s Risk Committee.
The Balance Sheet.
The Company actively monitors and evaluates the composition and size of its balance sheet. A substantialportion of the Company’s total assets consists of liquid marketable securities and short-term receivables arisingprincipally from sales and trading activities in the Institutional Securities business segment. The liquid nature ofthese assets provides the Company with flexibility in managing the size of its balance sheet. The Company’s totalassets increased to $781,030 million at March 31, 2012 from $749,898 million at December 31, 2011. Theincrease in total assets was primarily due to an increase in Securities borrowed, Financial instruments owned—Corporate equities, Federal funds sold and securities purchased under agreements to resell and Securitiesreceived as collateral.
The Company’s assets and liabilities are primarily related to transactions attributable to sales and trading andsecurities financing activities. At March 31, 2012, securities financing assets and liabilities were $365 billion and$284 billion, respectively. At December 31, 2011, securities financing assets and liabilities were $332 billion and$268 billion, respectively. Securities financing transactions include repurchase and resale agreements, securitiesborrowed and loaned transactions, securities received as collateral and obligation to return securities received.Securities borrowed or purchased under agreements to resell and securities loaned or sold under agreements torepurchase are treated as collateralized financings (see Note 2 to the consolidated financial statements for theyear ended December 31, 2011 included in the Form 10-K and Note 5 to the condensed consolidated financialstatements). Securities sold under agreements to repurchase and Securities loaned were $142 billion at March 31,2012 and averaged $158 billion during the quarter ended March 31, 2012. Securities purchased under agreementsto resell and Securities borrowed were $278 billion at March 31, 2012 and averaged $283 billion during thequarter ended March 31, 2012.
Securities financing assets and liabilities also include matched book transactions with minimal market, creditand/or liquidity risk. Matched book transactions accommodate customers, as well as obtain securities for thesettlement and financing of inventory positions. The customer receivable portion of the securities financingtransactions includes customer margin loans, collateralized by customer owned securities, and customer cash,which is segregated according to regulatory requirements. The customer payable portion of the securitiesfinancing transactions primarily includes customer payables to the Company’s prime brokerage clients. TheCompany’s risk exposure on these transactions is mitigated by collateral maintenance policies that limit theCompany’s credit exposure to customers. Included within securities financing assets were $18 billion and $12billion at March 31, 2012 and December 31, 2011, respectively, recorded in accordance with accountingguidance for the transfer of financial assets that represented offsetting assets and liabilities for fully collateralizednon-cash loan transactions.
110
The following table sets forth the Company’s tangible common equity at March 31, 2012 and December 31, 2011and average balances during the quarter ended March 31, 2012:
Balance at Average Balance(1)
March 31,2012
December 31,2011
For the ThreeMonths EndedMarch 31, 2012
(dollars in millions)
Common equity . . . . . . . . . . . . . . . . . . . . . . . . . . . . . . . . . . . . . . . . . . $60,816 $60,541 $60,485Preferred equity . . . . . . . . . . . . . . . . . . . . . . . . . . . . . . . . . . . . . . . . . . 1,508 1,508 1,508
Morgan Stanley shareholders’ equity . . . . . . . . . . . . . . . . . . . . . . . . . 62,324 62,049 61,993Junior subordinated debentures issued to capital trusts . . . . . . . . . . . . 4,838 4,853 4,844Less: Goodwill and net intangible assets(2) . . . . . . . . . . . . . . . . . . . . (6,660) (6,691) (6,685)
Tangible Morgan Stanley shareholders’ equity . . . . . . . . . . . . . . . . . . $60,502 $60,211 $60,152
Common equity . . . . . . . . . . . . . . . . . . . . . . . . . . . . . . . . . . . . . . . . . . $60,816 $60,541 $60,485Less: Goodwill and net intangible assets(2) . . . . . . . . . . . . . . . . . . . . (6,660) (6,691) (6,685)
Tangible common equity(3) . . . . . . . . . . . . . . . . . . . . . . . . . . . . . . . . . $54,156 $53,850 $53,800
(1) The Company calculates its average balances based upon month-end balances.(2) The goodwill and net intangible assets deduction exclude mortgage servicing rights (net of disallowable mortgage servicing rights) of
$90 million and $120 million at March 31, 2012 and December 31, 2011, respectively, and include only the Company’s share of MSSB’sgoodwill and intangible assets.
(3) Tangible common equity, a non-GAAP financial measure, equals common equity less goodwill and net intangible assets as definedabove. The Company views tangible common equity as a useful measure to investors because it is a commonly utilized metric andreflects the common equity deployed in the Company’s businesses.
Balance Sheet and Funding Activity for the Three Months Ended March 31, 2012.
During the quarter ended March 31, 2012, the Company issued notes with a principal amount of approximately$5 billion. In connection with the note issuances, the Company generally enters into certain transactions to obtainfloating interest rates based primarily on short-term London Inter-Bank Offer Rate (“LIBOR”) trading levels.The weighted average maturity of the Company’s long-term borrowings, based upon stated maturity dates, wasapproximately 5.3 years at March 31, 2012. During the quarter ended March 31, 2012, approximately $16 billionin aggregate long-term borrowings were matured or retired. Subsequent to March 31, 2012 and through April 30,2012, the Company’s long-term borrowings (net of issuances) decreased by approximately $1.6 billion.
At March 31, 2012, the aggregate outstanding carrying amount of the Company’s senior indebtedness wasapproximately $166 billion (including guaranteed obligations of the indebtedness of subsidiaries) compared with$176 billion at December 31, 2011. The decrease in the amount of senior indebtedness was primarily due torepayments of notes, net of new issuances in long-term and short-term borrowings.
Capital Management.
The Company’s senior management views capital as an important source of financial strength. The Companyactively manages its consolidated capital position based upon, among other things, business opportunities, risks,capital availability and rates of return together with internal capital policies, regulatory requirements and ratingagency guidelines and, therefore, in the future may expand or contract its capital base to address the changingneeds of its businesses. The Company attempts to maintain total capital, on a consolidated basis, at least equal tothe sum of its operating subsidiaries’ equity.
At March 31, 2012, the Company had approximately $1.6 billion remaining under its current share repurchaseprogram out of the $6 billion authorized by the Board of Directors in December 2006. The share repurchaseprogram is for capital management purposes and considers, among other things, business segment capital needs
111
as well as equity-based compensation and benefit plan requirements. Share repurchases by the Company aresubject to regulatory approval. During the quarter ended March 31, 2012, the Company did not repurchasecommon stock as part of its capital management share repurchase program (see also “Unregistered Sales ofEquity Securities and Use of Proceeds” in Part II, Item 2).
The Board of Directors determines the declaration and payment of dividends on a quarterly basis. In April 2012,the Company announced that its Board of Directors declared a quarterly dividend per common share of $0.05. InMarch 2012, the Company also announced that the Board of Directors declared a quarterly dividend of $252.78per share of Series A Floating Rate Non-Cumulative Preferred Stock (represented by depositary shares, eachrepresenting 1/1,000th interest in a share of preferred stock and each having a dividend of $0.25278) and aquarterly dividend of $25.00 per share of Series C Non-Cumulative Non-Voting Perpetual Preferred Stock.
Required Capital.
The Company’s capital estimation is based on the Required Capital Framework, an internal capital adequacymeasure. This framework is a risk-based internal use of capital measure, which is compared with the Company’sregulatory capital to help ensure the Company maintains an amount of risk-based going concern capital afterabsorbing potential losses from extreme stress events at a point in time. The difference between the Company’sregulatory capital and aggregate Required Capital is the Company’s Parent capital. Average Tier 1 commoncapital, aggregate Required Capital and Parent capital for the quarter ended March 31, 2012 were approximately$40.9 billion, $27.0 billion and $13.9 billion, respectively. The Company generally holds Parent capital forprospective regulatory requirements, including Basel III, organic growth, acquisitions and other capital needs.
Tier 1 common capital and common equity attribution to the business segments is based on capital usagecalculated by Required Capital Framework. In principle, each business segment is capitalized as if it were anindependent operating entity with limited diversification benefit between the business segments. RequiredCapital is assessed at each business segment and further attributed to product lines. This process is intended toalign capital with the risks in each business segment in order to allow senior management to evaluate returns on arisk-adjusted basis. The Required Capital Framework will evolve over time in response to changes in thebusiness and regulatory environment and to incorporate enhancements in modeling techniques. During 2012, theCompany will continue to evaluate the framework with respect to the impact of future regulatory requirements,as appropriate.
Beginning in the quarter ended March 31, 2012, the Company and segment Required Capital is met by Tier 1common capital. Prior to the current quarter, the Company’s Required Capital was met by regulatory Tier 1capital or Tier 1 common equity. Segment capital for prior periods has been recast under this framework.
For a further discussion of the Company’s Tier 1 common capital, see “Regulatory Requirements” herein.
The following table presents the Company’s and business segments’ average Tier 1 common capital and averagecommon equity for the quarter ended March 31, 2012 and the quarter ended December 31, 2011.
Three Months EndedMarch 31, 2012
Three Months EndedDecember 31, 2011
AverageTier 1 Common
Capital
AverageCommon
Equity
AverageTier 1 Common
Capital
AverageCommon
Equity
(dollars in billions)
Institutional Securities . . . . . . . . . . . . . . . . . . . . . . . . . . . . . . $22.1 $29.5 $24.4 $31.3Global Wealth Management Group . . . . . . . . . . . . . . . . . . . . 3.6 13.3 3.3 13.0Asset Management . . . . . . . . . . . . . . . . . . . . . . . . . . . . . . . . . 1.3 2.5 1.3 2.5Parent capital . . . . . . . . . . . . . . . . . . . . . . . . . . . . . . . . . . . . . 13.9 15.2 11.6 13.8
Total . . . . . . . . . . . . . . . . . . . . . . . . . . . . . . . . . . . . . . . . $40.9 $60.5 $40.6 $60.6
112
Capital Covenants.
In October 2006 and April 2007, the Company executed replacement capital covenants in connection withofferings by Morgan Stanley Capital Trust VII and Morgan Stanley Capital Trust VIII (the “Capital Securities”),which become effective after the scheduled redemption date in 2046. Under the terms of the replacement capitalcovenants, the Company has agreed, for the benefit of certain specified holders of debt, to limitations on itsability to redeem or repurchase any of the Capital Securities for specified periods of time. For a completedescription of the Capital Securities and the terms of the replacement capital covenants, see the Company’sCurrent Reports on Form 8-K dated October 12, 2006 and April 26, 2007.
Liquidity Risk Management Framework.
The primary goal of the Company’s liquidity risk management framework is to ensure that the Company hasaccess to adequate funding across a wide range of market conditions. The framework is designed to enable theCompany to fulfill its financial obligations and support the execution of the Company’s business strategies.
The following principles guide the Company’s liquidity risk management framework:
• Sufficient liquid assets should be maintained to cover maturing liabilities;
• Maturity profile of assets and liabilities should be aligned, with limited reliance on short-term funding;
• Source, counterparty, currency, region, and term of funding should be diversified; and
• Limited access to funding should be anticipated through the Contingency Funding Plan.
The core components of the Company’s liquidity risk management framework are the Contingency Funding Plan(“CFP”), Liquidity Stress Tests and the Global Liquidity Reserve. These elements support the Company’s targetliquidity profile.
Contingency Funding Plan.
The Company maintains the CFP, which describes the data and information flows, limits and triggers, escalationprocedures, roles and responsibilities, and available mitigating actions in the event of a liquidity stress. The CFPassesses current and future funding sources and uses and establishes a plan for monitoring and managing apotential liquidity stress event. A set of escalation triggers identifies early signs of stress and activates a responseplan.
Liquidity Stress Tests.
The Company uses Liquidity Stress Tests to model liquidity outflows across multiple scenarios over a range oftime horizons. These scenarios contain various combinations of idiosyncratic and systemic stress events.
The assumptions underpinning the Liquidity Stress Tests include, but are not limited to, the following:
• No government support;
• No access to equity and unsecured debt markets;
• Repayment of all unsecured debt maturing within one year;
• Higher haircuts and significantly lower availability of secured funding;
• Additional collateral that would be required by trading counterparties and certain exchanges and clearingorganizations related to a multi-notch credit rating downgrade;
• Additional collateral that would be required due to collateral substitutions, collateral disputes anduncalled collateral;
113
• Discretionary unsecured debt buybacks;
• Drawdowns on unfunded commitments provided to third parties;
• Client cash withdrawals and reduction in customer short positions that fund long positions;
• Limited access to the foreign exchange swap markets;
• Return of securities borrowed on an uncollateralized basis; and
• Maturity roll-off of outstanding letters of credit with no further issuance.
The Liquidity Stress Tests are produced at the Parent company (“Parent”) and major operating subsidiary levels,as well as at major currency levels, to capture specific cash requirements and cash availability across theCompany. The Liquidity Stress Tests assume that subsidiaries will use their own liquidity first to fund theirobligations before drawing liquidity from the Parent. The Parent will support its subsidiaries and will not haveaccess to subsidiaries’ liquidity reserves that are subject to any regulatory, legal or tax constraints.
At March 31, 2012, the Company maintained sufficient liquidity to meet current and contingent fundingobligations as modeled in its Liquidity Stress Tests.
Global Liquidity Reserve.
The Company maintains sufficient liquidity reserves (“Global Liquidity Reserve”) to cover daily funding needsand meet strategic liquidity targets sized by the CFP and Liquidity Stress Tests. These liquidity targets are basedon the Company’s risk tolerance, balance sheet level and composition, subsidiary funding needs, and upcomingdebt maturities, which are subject to change dependent on market and firm-specific events.
The Global Liquidity Reserve is held within the Parent and operating subsidiaries. The Global Liquidity Reserveis comprised of highly liquid and diversified cash and cash equivalents and unencumbered securities. Eligibleunencumbered securities include U.S. government securities, U.S. agency securities, U.S. agency mortgage-backed securities, FDIC-guaranteed corporate debt and non-U.S. government securities.
Global Liquidity Reserve by Type of Investment.
The table below summarizes the Company’s Global Liquidity Reserve by type of investment:
At March 31, 2012
(dollars in billions)
Cash deposits with banks . . . . . . . . . . . . . . . . . . . . . . . . . . . . . . . . . . . . . . . . . . . . . . . . . . . . . . . . $ 10Cash deposits with central banks . . . . . . . . . . . . . . . . . . . . . . . . . . . . . . . . . . . . . . . . . . . . . . . . . . 24Unencumbered highly liquid securities:
U.S. Government obligations . . . . . . . . . . . . . . . . . . . . . . . . . . . . . . . . . . . . . . . . . . . . . . . . 81U.S. agency and agency mortgage-backed securities . . . . . . . . . . . . . . . . . . . . . . . . . . . . . . 36Non-U.S. sovereign obligations(1) . . . . . . . . . . . . . . . . . . . . . . . . . . . . . . . . . . . . . . . . . . . . 18Investments in money market funds . . . . . . . . . . . . . . . . . . . . . . . . . . . . . . . . . . . . . . . . . . . —Other investment grade securities . . . . . . . . . . . . . . . . . . . . . . . . . . . . . . . . . . . . . . . . . . . . . 10
Global Liquidity Reserve . . . . . . . . . . . . . . . . . . . . . . . . . . . . . . . . . . . . . . . . . . . . . . . $179
(1) Non-U.S sovereign obligations are composed of unencumbered German, French, Dutch, U.K., Brazilian and Japanese governmentobligations.
The ability to monetize assets during the start of a liquidity crisis is critical. The Company believes that the assetsheld in the Global Liquidity Reserve can be monetized within five business days in a stressed environment giventhe highly liquid and diversified nature of the reserves. The currency profile of the Global Liquidity Reserve is
114
consistent with the CFP and Liquidity Stress Tests. In addition to the Global Liquidity Reserve, the Company hasother cash and cash equivalents and other unencumbered assets that are available for monetization which are notincluded in the balances in the table above.
Global Liquidity Reserve Held by the Parent and Operating Subsidiaries.
The table below summarizes the Global Liquidity Reserve held by the Parent and operating subsidiaries:
Average Balance(1)
AtMarch 31,
2012
AtDecember 31,
2011
For the ThreeMonths EndedMarch 31, 2012
For the ThreeMonths Ended
December 31, 2011
(dollars in billions)
Parent . . . . . . . . . . . . . . . . . . . . . . . . . . . . . . . . . . . . . . $ 72 $ 75 $ 71 $ 76Non-Bank Subsidiaries:
Domestic . . . . . . . . . . . . . . . . . . . . . . . . . . . . . . . 15 18 16 16Foreign . . . . . . . . . . . . . . . . . . . . . . . . . . . . . . . . . 27 26 28 24
Total Non-Bank Subsidiaries . . . . . . . . . . . 42 44 44 40
Bank Subsidiaries:Domestic . . . . . . . . . . . . . . . . . . . . . . . . . . . . . . . 56 56 56 56Foreign . . . . . . . . . . . . . . . . . . . . . . . . . . . . . . . . . 9 7 7 7
Total Bank Subsidiaries . . . . . . . . . . . . . . . . 65 63 63 63
Total . . . . . . . . . . . . . . . . . . . . . . . . . . . $179 $182 $178 $179
(1) The Company calculates the average Global Liquidity Reserve based upon daily amounts.
The Company is exposed to intra-day settlement risk in connection with liquidity provided to its major broker-dealer subsidiaries for intra-day clearing and settlement of its securities and financing activity.
As mentioned in “Contingency Funding Plan,” the CFP assumes that the Parent will support its subsidiaries andwill not have access to subsidiaries’ liquidity reserves that are subject to any regulatory, legal or tax constraints.
Funding Management.
The Company’s funding management policies are designed to provide for financings that are executed in amanner that reduces the risk of disruption to the Company’s operations. The Company pursues a strategy ofdiversification of secured and unsecured funding sources (by product, by investor and by region) and attempts toensure that the tenor of the Company’s liabilities equals or exceeds the expected holding period of the assetsbeing financed.
The Company funds its balance sheet on a global basis through diverse sources. These sources may include theCompany’s equity capital, long-term debt, repurchase agreements, securities lending, deposits, commercialpaper, letters of credit and lines of credit. The Company has active financing programs for both standard andstructured products targeting global investors and currencies.
Secured Financing. A substantial portion of the Company’s total assets consists of liquid marketable securitiesand short-term collateralized receivables arising principally from its Institutional Securities business segment’ssales and trading activities. The liquid nature of these assets provides the Company with flexibility in fundingthese assets with secured financing. The Company’s goal is to achieve an optimal mix of durable secured andunsecured funding. The Institutional Securities business segment actively sources term secured funding. Securedfunding investors principally focus on the quality of the eligible collateral posted, which is why the Company
115
actively manages its secured financing book based on the quality of the assets being funded. The ability to fundless liquid assets may be impaired in a stress environment. To mitigate this risk, the Company obtains longer-term secured financing for less liquid assets.
The Company utilizes shorter term secured funding only for highly liquid assets and has established longer tenortargets for less liquid asset classes, for which funding may be at risk in the event of a market disruption. TheCompany defines highly liquid collateral as that which is consistent with the standards of the Global LiquidityReserve, and less liquid collateral as that which does not meet those standards. At March 31, 2012, the weightedaverage maturity of the Company’s secured financing against less liquid collateral was greater than 120 days. Tofurther minimize the refinancing risk of secured financing for less liquid collateral, the Company diversifies itsinvestor base and limits the amount of monthly maturities for secured financing of less liquid collateral. Finally,in addition to the above risk management framework, the Company holds a portion of its Global LiquidityReserve against the potential disruption to its secured financing capabilities.
Unsecured Financing. The Company views long-term debt and deposits as stable sources of funding for coreinventories and less liquid assets. Unencumbered securities and non security assets are financed with acombination of long and short term debt and deposits. When appropriate, the Company may use derivativeproducts to conduct asset and liability management and to make adjustments to the Company’s interest rate riskprofile (see Note 12 to the consolidated financial statements for the year ended December 31, 2011 included inthe Form 10-K).
Temporary Liquidity Guarantee Program (“TLGP”). In October 2008, the Secretary of the U.S. Treasuryinvoked the systemic risk exception of the FDIC Improvement Act of 1991, and the FDIC announced the TLGP.Based on the Final Rule adopted on November 21, 2008, the TLGP provides a guarantee, through the earlier ofmaturity or June 30, 2012, of certain senior unsecured debt issued by participating Eligible Entities (including theCompany) between October 14, 2008 and June 30, 2009. Of the $23.8 billion issued by the Company under theTLGP, $4.7 billion was still outstanding at March 31, 2012.
Short-Term Borrowings. The Company’s unsecured short-term borrowings consist of commercial paper, bankloans, bank notes and structured notes with maturities of 12 months or less at issuance.
The table below summarizes the Company’s short-term unsecured borrowings:
AtMarch 31, 2012
AtDecember 31, 2011
(dollars in millions)
Commercial paper(1) . . . . . . . . . . . . . . . . . . . . . . . . . . . . . . . . . . . . . . . . . . . . $ 257 $ 978Other short-term borrowings . . . . . . . . . . . . . . . . . . . . . . . . . . . . . . . . . . . . . . . 1,760 1,865
Total . . . . . . . . . . . . . . . . . . . . . . . . . . . . . . . . . . . . . . . . . . . . . . . . . . . . . $2,017 $2,843
(1) At December 31, 2011, the majority of the commercial paper balance was issued as part of client transactions and was not used for theCompany’s general funding purposes. During the quarter ended March 31, 2012, the client transactions matured and the remainingbalance at March 31, 2012 was used for the Company’s general funding purposes.
Deposits. The Company’s bank subsidiaries’ funding sources include bank deposits, repurchase agreements,federal funds purchased, certificates of deposit, money market deposit accounts, demand deposit accounts,commercial paper and Federal Home Loan Bank advances. The vast majority of deposits in Morgan StanleyBank, N.A. and Morgan Stanley Private Bank, National Association (the “Subsidiary Banks”) are sourced fromthe Company’s retail brokerage accounts and are considered to have stable, low cost funding characteristics.
116
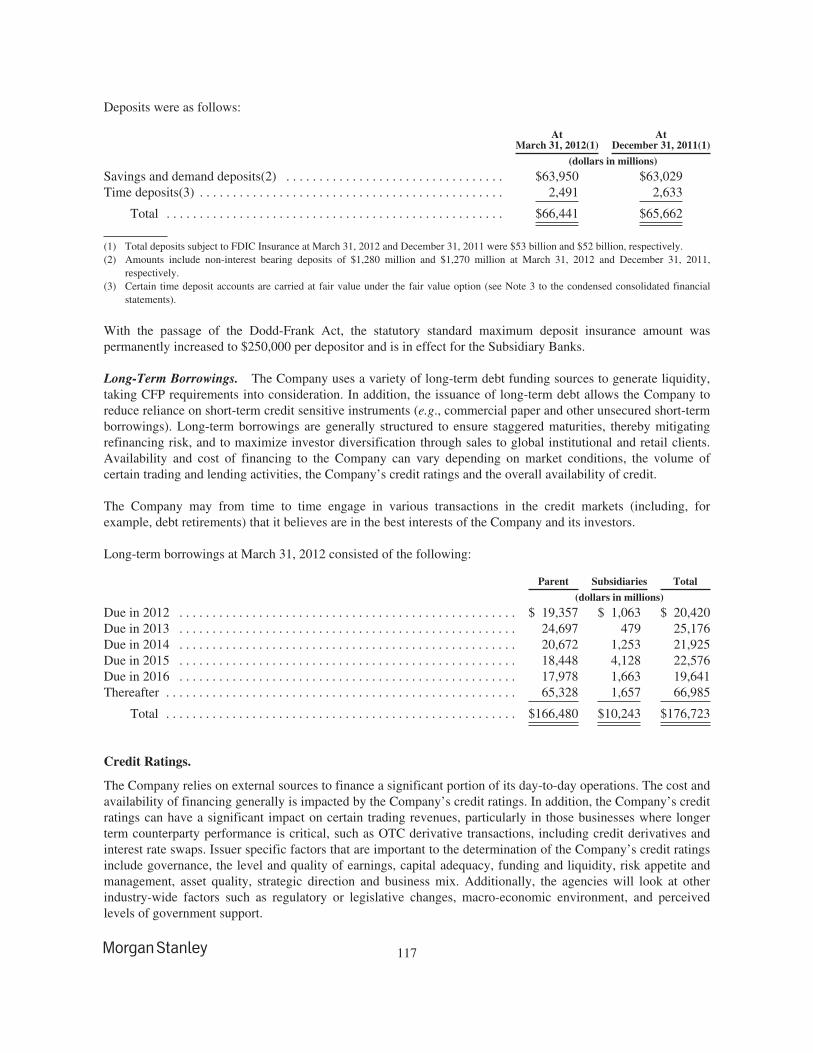
Deposits were as follows:
AtMarch 31, 2012(1)
AtDecember 31, 2011(1)
(dollars in millions)
Savings and demand deposits(2) . . . . . . . . . . . . . . . . . . . . . . . . . . . . . . . . . $63,950 $63,029Time deposits(3) . . . . . . . . . . . . . . . . . . . . . . . . . . . . . . . . . . . . . . . . . . . . . . 2,491 2,633
Total . . . . . . . . . . . . . . . . . . . . . . . . . . . . . . . . . . . . . . . . . . . . . . . . . . . $66,441 $65,662
(1) Total deposits subject to FDIC Insurance at March 31, 2012 and December 31, 2011 were $53 billion and $52 billion, respectively.(2) Amounts include non-interest bearing deposits of $1,280 million and $1,270 million at March 31, 2012 and December 31, 2011,
respectively.(3) Certain time deposit accounts are carried at fair value under the fair value option (see Note 3 to the condensed consolidated financial
statements).
With the passage of the Dodd-Frank Act, the statutory standard maximum deposit insurance amount waspermanently increased to $250,000 per depositor and is in effect for the Subsidiary Banks.
Long-Term Borrowings. The Company uses a variety of long-term debt funding sources to generate liquidity,taking CFP requirements into consideration. In addition, the issuance of long-term debt allows the Company toreduce reliance on short-term credit sensitive instruments (e.g., commercial paper and other unsecured short-termborrowings). Long-term borrowings are generally structured to ensure staggered maturities, thereby mitigatingrefinancing risk, and to maximize investor diversification through sales to global institutional and retail clients.Availability and cost of financing to the Company can vary depending on market conditions, the volume ofcertain trading and lending activities, the Company’s credit ratings and the overall availability of credit.
The Company may from time to time engage in various transactions in the credit markets (including, forexample, debt retirements) that it believes are in the best interests of the Company and its investors.
Long-term borrowings at March 31, 2012 consisted of the following:
Parent Subsidiaries Total
(dollars in millions)
Due in 2012 . . . . . . . . . . . . . . . . . . . . . . . . . . . . . . . . . . . . . . . . . . . . . . . . . . . $ 19,357 $ 1,063 $ 20,420Due in 2013 . . . . . . . . . . . . . . . . . . . . . . . . . . . . . . . . . . . . . . . . . . . . . . . . . . . 24,697 479 25,176Due in 2014 . . . . . . . . . . . . . . . . . . . . . . . . . . . . . . . . . . . . . . . . . . . . . . . . . . . 20,672 1,253 21,925Due in 2015 . . . . . . . . . . . . . . . . . . . . . . . . . . . . . . . . . . . . . . . . . . . . . . . . . . . 18,448 4,128 22,576Due in 2016 . . . . . . . . . . . . . . . . . . . . . . . . . . . . . . . . . . . . . . . . . . . . . . . . . . . 17,978 1,663 19,641Thereafter . . . . . . . . . . . . . . . . . . . . . . . . . . . . . . . . . . . . . . . . . . . . . . . . . . . . . 65,328 1,657 66,985
Total . . . . . . . . . . . . . . . . . . . . . . . . . . . . . . . . . . . . . . . . . . . . . . . . . . . . . $166,480 $10,243 $176,723
Credit Ratings.
The Company relies on external sources to finance a significant portion of its day-to-day operations. The cost andavailability of financing generally is impacted by the Company’s credit ratings. In addition, the Company’s creditratings can have a significant impact on certain trading revenues, particularly in those businesses where longerterm counterparty performance is critical, such as OTC derivative transactions, including credit derivatives andinterest rate swaps. Issuer specific factors that are important to the determination of the Company’s credit ratingsinclude governance, the level and quality of earnings, capital adequacy, funding and liquidity, risk appetite andmanagement, asset quality, strategic direction and business mix. Additionally, the agencies will look at otherindustry-wide factors such as regulatory or legislative changes, macro-economic environment, and perceivedlevels of government support.
117
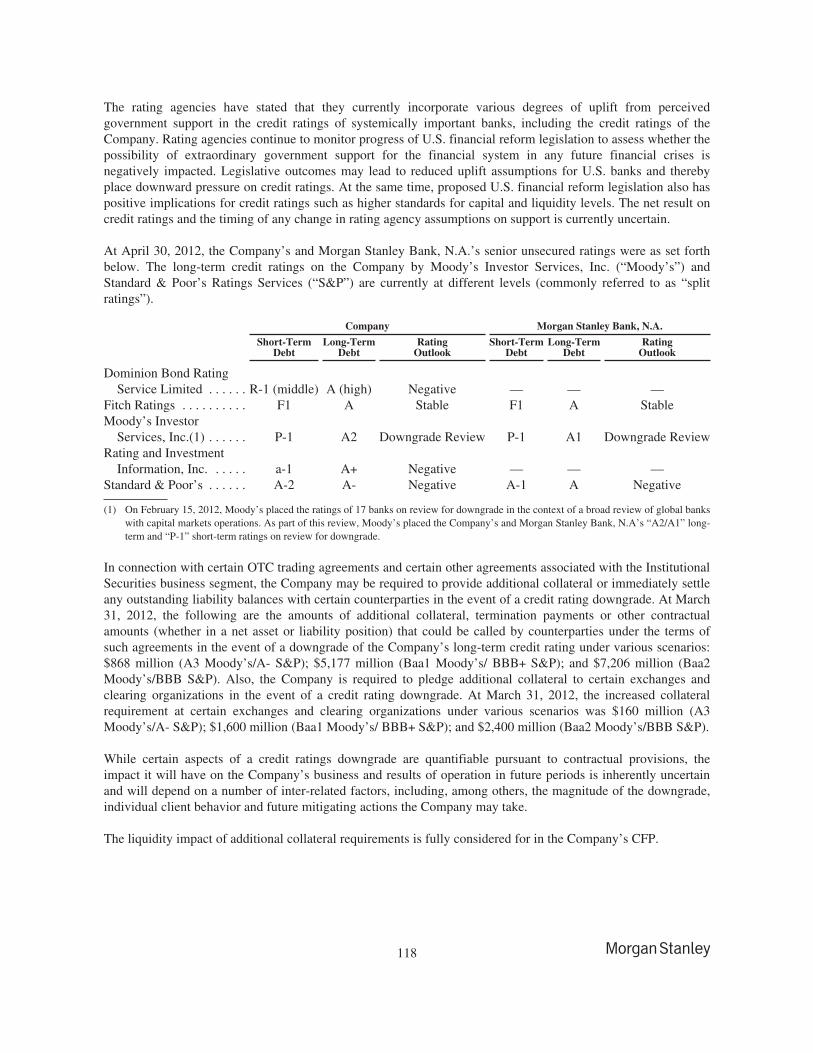
The rating agencies have stated that they currently incorporate various degrees of uplift from perceivedgovernment support in the credit ratings of systemically important banks, including the credit ratings of theCompany. Rating agencies continue to monitor progress of U.S. financial reform legislation to assess whether thepossibility of extraordinary government support for the financial system in any future financial crises isnegatively impacted. Legislative outcomes may lead to reduced uplift assumptions for U.S. banks and therebyplace downward pressure on credit ratings. At the same time, proposed U.S. financial reform legislation also haspositive implications for credit ratings such as higher standards for capital and liquidity levels. The net result oncredit ratings and the timing of any change in rating agency assumptions on support is currently uncertain.
At April 30, 2012, the Company’s and Morgan Stanley Bank, N.A.’s senior unsecured ratings were as set forthbelow. The long-term credit ratings on the Company by Moody’s Investor Services, Inc. (“Moody’s”) andStandard & Poor’s Ratings Services (“S&P”) are currently at different levels (commonly referred to as “splitratings”).
Company Morgan Stanley Bank, N.A.
Short-TermDebt
Long-TermDebt
RatingOutlook
Short-TermDebt
Long-TermDebt
RatingOutlook
Dominion Bond RatingService Limited . . . . . . R-1 (middle) A (high) Negative — — —
Fitch Ratings . . . . . . . . . . F1 A Stable F1 A StableMoody’s Investor
Services, Inc.(1) . . . . . . P-1 A2 Downgrade Review P-1 A1 Downgrade ReviewRating and Investment
Information, Inc. . . . . . a-1 A+ Negative — — —Standard & Poor’s . . . . . . A-2 A- Negative A-1 A Negative
(1) On February 15, 2012, Moody’s placed the ratings of 17 banks on review for downgrade in the context of a broad review of global bankswith capital markets operations. As part of this review, Moody’s placed the Company’s and Morgan Stanley Bank, N.A’s “A2/A1” long-term and “P-1” short-term ratings on review for downgrade.
In connection with certain OTC trading agreements and certain other agreements associated with the InstitutionalSecurities business segment, the Company may be required to provide additional collateral or immediately settleany outstanding liability balances with certain counterparties in the event of a credit rating downgrade. At March31, 2012, the following are the amounts of additional collateral, termination payments or other contractualamounts (whether in a net asset or liability position) that could be called by counterparties under the terms ofsuch agreements in the event of a downgrade of the Company’s long-term credit rating under various scenarios:$868 million (A3 Moody’s/A- S&P); $5,177 million (Baa1 Moody’s/ BBB+ S&P); and $7,206 million (Baa2Moody’s/BBB S&P). Also, the Company is required to pledge additional collateral to certain exchanges andclearing organizations in the event of a credit rating downgrade. At March 31, 2012, the increased collateralrequirement at certain exchanges and clearing organizations under various scenarios was $160 million (A3Moody’s/A- S&P); $1,600 million (Baa1 Moody’s/ BBB+ S&P); and $2,400 million (Baa2 Moody’s/BBB S&P).
While certain aspects of a credit ratings downgrade are quantifiable pursuant to contractual provisions, theimpact it will have on the Company’s business and results of operation in future periods is inherently uncertainand will depend on a number of inter-related factors, including, among others, the magnitude of the downgrade,individual client behavior and future mitigating actions the Company may take.
The liquidity impact of additional collateral requirements is fully considered for in the Company’s CFP.
118
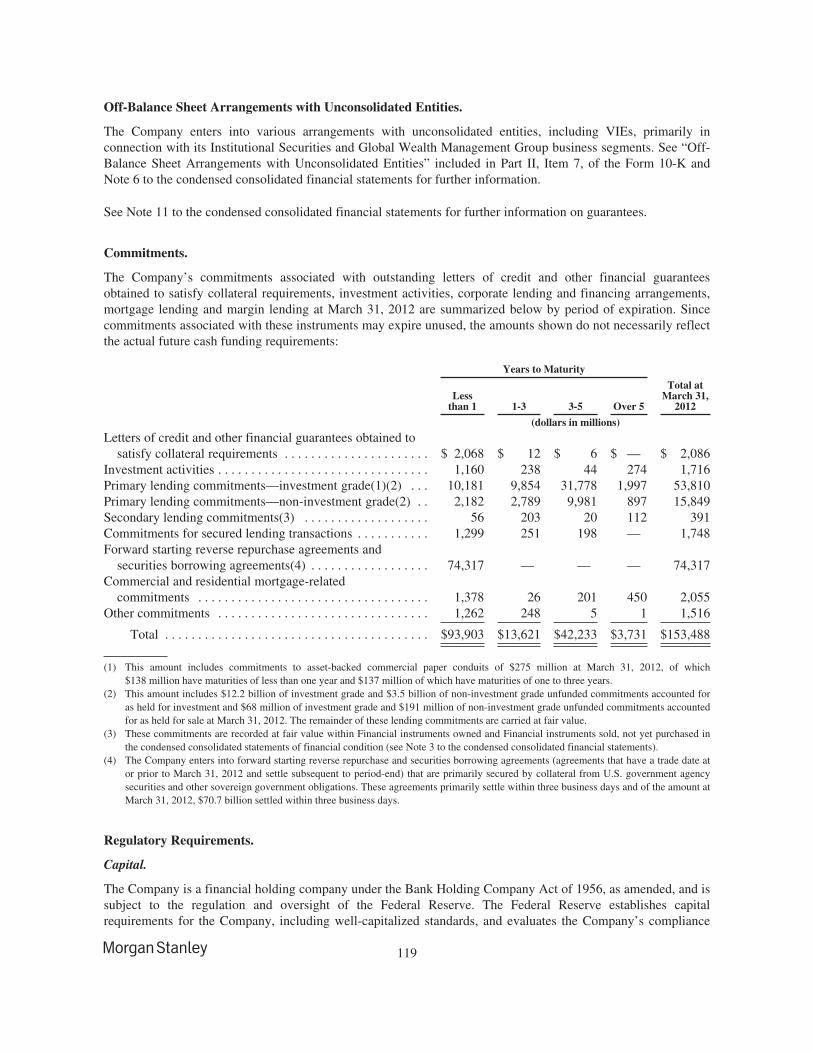
Off-Balance Sheet Arrangements with Unconsolidated Entities.
The Company enters into various arrangements with unconsolidated entities, including VIEs, primarily inconnection with its Institutional Securities and Global Wealth Management Group business segments. See “Off-Balance Sheet Arrangements with Unconsolidated Entities” included in Part II, Item 7, of the Form 10-K andNote 6 to the condensed consolidated financial statements for further information.
See Note 11 to the condensed consolidated financial statements for further information on guarantees.
Commitments.
The Company’s commitments associated with outstanding letters of credit and other financial guaranteesobtained to satisfy collateral requirements, investment activities, corporate lending and financing arrangements,mortgage lending and margin lending at March 31, 2012 are summarized below by period of expiration. Sincecommitments associated with these instruments may expire unused, the amounts shown do not necessarily reflectthe actual future cash funding requirements:
Years to Maturity
Lessthan 1 1-3 3-5 Over 5
Total atMarch 31,
2012
(dollars in millions)
Letters of credit and other financial guarantees obtained tosatisfy collateral requirements . . . . . . . . . . . . . . . . . . . . . . $ 2,068 $ 12 $ 6 $ — $ 2,086
Investment activities . . . . . . . . . . . . . . . . . . . . . . . . . . . . . . . . 1,160 238 44 274 1,716Primary lending commitments—investment grade(1)(2) . . . 10,181 9,854 31,778 1,997 53,810Primary lending commitments—non-investment grade(2) . . 2,182 2,789 9,981 897 15,849Secondary lending commitments(3) . . . . . . . . . . . . . . . . . . . 56 203 20 112 391Commitments for secured lending transactions . . . . . . . . . . . 1,299 251 198 — 1,748Forward starting reverse repurchase agreements and
securities borrowing agreements(4) . . . . . . . . . . . . . . . . . . 74,317 — — — 74,317Commercial and residential mortgage-related
commitments . . . . . . . . . . . . . . . . . . . . . . . . . . . . . . . . . . . 1,378 26 201 450 2,055Other commitments . . . . . . . . . . . . . . . . . . . . . . . . . . . . . . . . 1,262 248 5 1 1,516
Total . . . . . . . . . . . . . . . . . . . . . . . . . . . . . . . . . . . . . . . . $93,903 $13,621 $42,233 $3,731 $153,488
(1) This amount includes commitments to asset-backed commercial paper conduits of $275 million at March 31, 2012, of which$138 million have maturities of less than one year and $137 million of which have maturities of one to three years.
(2) This amount includes $12.2 billion of investment grade and $3.5 billion of non-investment grade unfunded commitments accounted foras held for investment and $68 million of investment grade and $191 million of non-investment grade unfunded commitments accountedfor as held for sale at March 31, 2012. The remainder of these lending commitments are carried at fair value.
(3) These commitments are recorded at fair value within Financial instruments owned and Financial instruments sold, not yet purchased inthe condensed consolidated statements of financial condition (see Note 3 to the condensed consolidated financial statements).
(4) The Company enters into forward starting reverse repurchase and securities borrowing agreements (agreements that have a trade date ator prior to March 31, 2012 and settle subsequent to period-end) that are primarily secured by collateral from U.S. government agencysecurities and other sovereign government obligations. These agreements primarily settle within three business days and of the amount atMarch 31, 2012, $70.7 billion settled within three business days.
Regulatory Requirements.
Capital.
The Company is a financial holding company under the Bank Holding Company Act of 1956, as amended, and issubject to the regulation and oversight of the Federal Reserve. The Federal Reserve establishes capitalrequirements for the Company, including well-capitalized standards, and evaluates the Company’s compliance
119
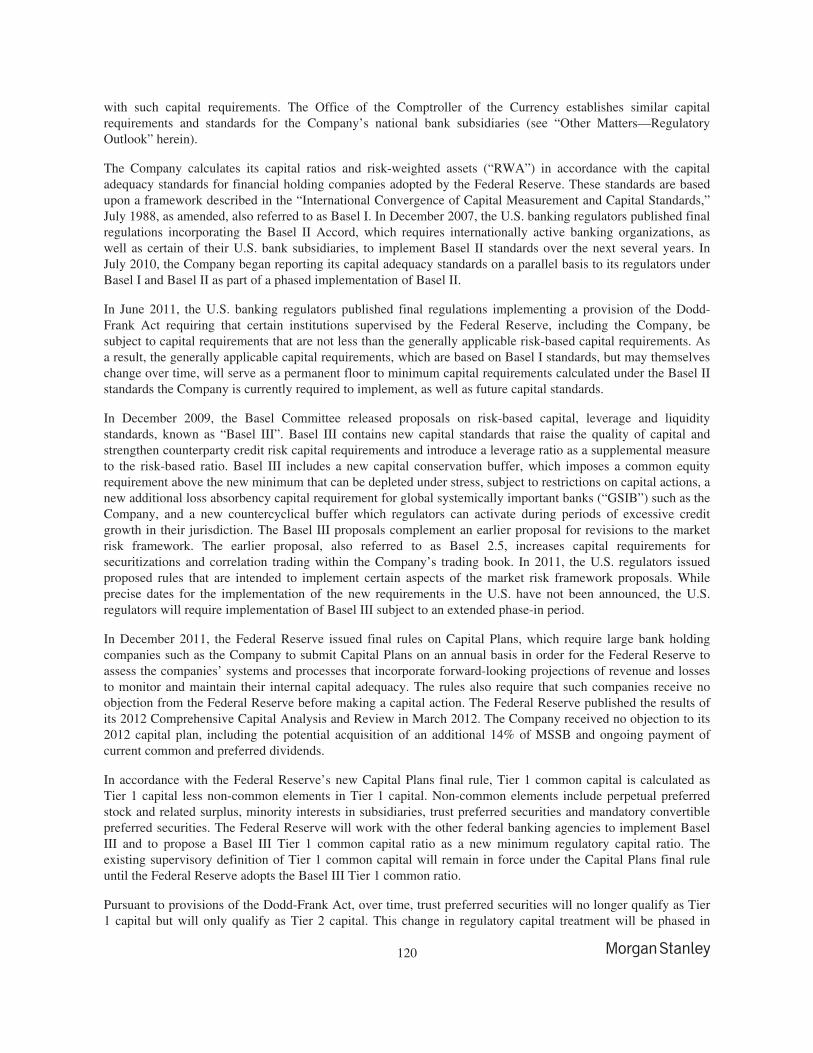
with such capital requirements. The Office of the Comptroller of the Currency establishes similar capitalrequirements and standards for the Company’s national bank subsidiaries (see “Other Matters—RegulatoryOutlook” herein).
The Company calculates its capital ratios and risk-weighted assets (“RWA”) in accordance with the capitaladequacy standards for financial holding companies adopted by the Federal Reserve. These standards are basedupon a framework described in the “International Convergence of Capital Measurement and Capital Standards,”July 1988, as amended, also referred to as Basel I. In December 2007, the U.S. banking regulators published finalregulations incorporating the Basel II Accord, which requires internationally active banking organizations, aswell as certain of their U.S. bank subsidiaries, to implement Basel II standards over the next several years. InJuly 2010, the Company began reporting its capital adequacy standards on a parallel basis to its regulators underBasel I and Basel II as part of a phased implementation of Basel II.
In June 2011, the U.S. banking regulators published final regulations implementing a provision of the Dodd-Frank Act requiring that certain institutions supervised by the Federal Reserve, including the Company, besubject to capital requirements that are not less than the generally applicable risk-based capital requirements. Asa result, the generally applicable capital requirements, which are based on Basel I standards, but may themselveschange over time, will serve as a permanent floor to minimum capital requirements calculated under the Basel IIstandards the Company is currently required to implement, as well as future capital standards.
In December 2009, the Basel Committee released proposals on risk-based capital, leverage and liquiditystandards, known as “Basel III”. Basel III contains new capital standards that raise the quality of capital andstrengthen counterparty credit risk capital requirements and introduce a leverage ratio as a supplemental measureto the risk-based ratio. Basel III includes a new capital conservation buffer, which imposes a common equityrequirement above the new minimum that can be depleted under stress, subject to restrictions on capital actions, anew additional loss absorbency capital requirement for global systemically important banks (“GSIB”) such as theCompany, and a new countercyclical buffer which regulators can activate during periods of excessive creditgrowth in their jurisdiction. The Basel III proposals complement an earlier proposal for revisions to the marketrisk framework. The earlier proposal, also referred to as Basel 2.5, increases capital requirements forsecuritizations and correlation trading within the Company’s trading book. In 2011, the U.S. regulators issuedproposed rules that are intended to implement certain aspects of the market risk framework proposals. Whileprecise dates for the implementation of the new requirements in the U.S. have not been announced, the U.S.regulators will require implementation of Basel III subject to an extended phase-in period.
In December 2011, the Federal Reserve issued final rules on Capital Plans, which require large bank holdingcompanies such as the Company to submit Capital Plans on an annual basis in order for the Federal Reserve toassess the companies’ systems and processes that incorporate forward-looking projections of revenue and lossesto monitor and maintain their internal capital adequacy. The rules also require that such companies receive noobjection from the Federal Reserve before making a capital action. The Federal Reserve published the results ofits 2012 Comprehensive Capital Analysis and Review in March 2012. The Company received no objection to its2012 capital plan, including the potential acquisition of an additional 14% of MSSB and ongoing payment ofcurrent common and preferred dividends.
In accordance with the Federal Reserve’s new Capital Plans final rule, Tier 1 common capital is calculated asTier 1 capital less non-common elements in Tier 1 capital. Non-common elements include perpetual preferredstock and related surplus, minority interests in subsidiaries, trust preferred securities and mandatory convertiblepreferred securities. The Federal Reserve will work with the other federal banking agencies to implement BaselIII and to propose a Basel III Tier 1 common capital ratio as a new minimum regulatory capital ratio. Theexisting supervisory definition of Tier 1 common capital will remain in force under the Capital Plans final ruleuntil the Federal Reserve adopts the Basel III Tier 1 common ratio.
Pursuant to provisions of the Dodd-Frank Act, over time, trust preferred securities will no longer qualify as Tier1 capital but will only qualify as Tier 2 capital. This change in regulatory capital treatment will be phased in
120
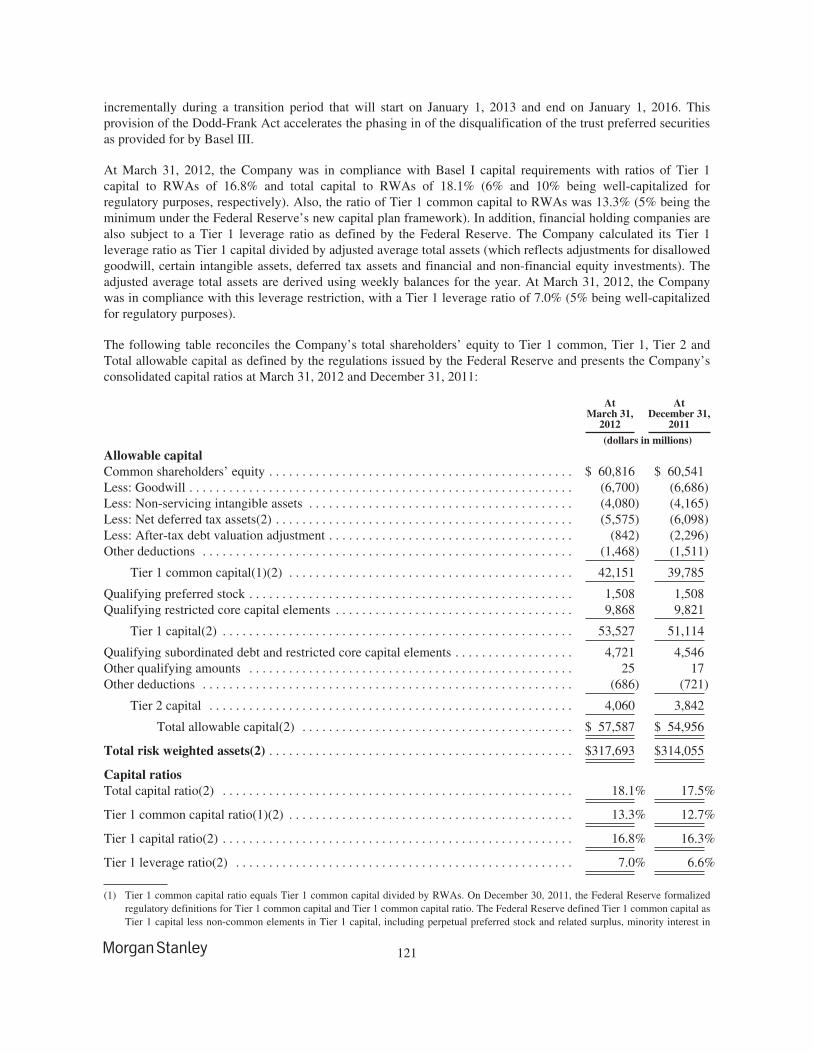
incrementally during a transition period that will start on January 1, 2013 and end on January 1, 2016. Thisprovision of the Dodd-Frank Act accelerates the phasing in of the disqualification of the trust preferred securitiesas provided for by Basel III.
At March 31, 2012, the Company was in compliance with Basel I capital requirements with ratios of Tier 1capital to RWAs of 16.8% and total capital to RWAs of 18.1% (6% and 10% being well-capitalized forregulatory purposes, respectively). Also, the ratio of Tier 1 common capital to RWAs was 13.3% (5% being theminimum under the Federal Reserve’s new capital plan framework). In addition, financial holding companies arealso subject to a Tier 1 leverage ratio as defined by the Federal Reserve. The Company calculated its Tier 1leverage ratio as Tier 1 capital divided by adjusted average total assets (which reflects adjustments for disallowedgoodwill, certain intangible assets, deferred tax assets and financial and non-financial equity investments). Theadjusted average total assets are derived using weekly balances for the year. At March 31, 2012, the Companywas in compliance with this leverage restriction, with a Tier 1 leverage ratio of 7.0% (5% being well-capitalizedfor regulatory purposes).
The following table reconciles the Company’s total shareholders’ equity to Tier 1 common, Tier 1, Tier 2 andTotal allowable capital as defined by the regulations issued by the Federal Reserve and presents the Company’sconsolidated capital ratios at March 31, 2012 and December 31, 2011:
AtMarch 31,
2012
AtDecember 31,
2011
(dollars in millions)
Allowable capitalCommon shareholders’ equity . . . . . . . . . . . . . . . . . . . . . . . . . . . . . . . . . . . . . . . . . . . . . . $ 60,816 $ 60,541Less: Goodwill . . . . . . . . . . . . . . . . . . . . . . . . . . . . . . . . . . . . . . . . . . . . . . . . . . . . . . . . . . (6,700) (6,686)Less: Non-servicing intangible assets . . . . . . . . . . . . . . . . . . . . . . . . . . . . . . . . . . . . . . . . (4,080) (4,165)Less: Net deferred tax assets(2) . . . . . . . . . . . . . . . . . . . . . . . . . . . . . . . . . . . . . . . . . . . . . (5,575) (6,098)Less: After-tax debt valuation adjustment . . . . . . . . . . . . . . . . . . . . . . . . . . . . . . . . . . . . . (842) (2,296)Other deductions . . . . . . . . . . . . . . . . . . . . . . . . . . . . . . . . . . . . . . . . . . . . . . . . . . . . . . . . (1,468) (1,511)
Tier 1 common capital(1)(2) . . . . . . . . . . . . . . . . . . . . . . . . . . . . . . . . . . . . . . . . . . . 42,151 39,785
Qualifying preferred stock . . . . . . . . . . . . . . . . . . . . . . . . . . . . . . . . . . . . . . . . . . . . . . . . . 1,508 1,508Qualifying restricted core capital elements . . . . . . . . . . . . . . . . . . . . . . . . . . . . . . . . . . . . 9,868 9,821
Tier 1 capital(2) . . . . . . . . . . . . . . . . . . . . . . . . . . . . . . . . . . . . . . . . . . . . . . . . . . . . . 53,527 51,114
Qualifying subordinated debt and restricted core capital elements . . . . . . . . . . . . . . . . . . 4,721 4,546Other qualifying amounts . . . . . . . . . . . . . . . . . . . . . . . . . . . . . . . . . . . . . . . . . . . . . . . . . 25 17Other deductions . . . . . . . . . . . . . . . . . . . . . . . . . . . . . . . . . . . . . . . . . . . . . . . . . . . . . . . . (686) (721)
Tier 2 capital . . . . . . . . . . . . . . . . . . . . . . . . . . . . . . . . . . . . . . . . . . . . . . . . . . . . . . . 4,060 3,842
Total allowable capital(2) . . . . . . . . . . . . . . . . . . . . . . . . . . . . . . . . . . . . . . . . . $ 57,587 $ 54,956
Total risk weighted assets(2) . . . . . . . . . . . . . . . . . . . . . . . . . . . . . . . . . . . . . . . . . . . . . . $317,693 $314,055
Capital ratiosTotal capital ratio(2) . . . . . . . . . . . . . . . . . . . . . . . . . . . . . . . . . . . . . . . . . . . . . . . . . . . . . 18.1% 17.5%
Tier 1 common capital ratio(1)(2) . . . . . . . . . . . . . . . . . . . . . . . . . . . . . . . . . . . . . . . . . . . 13.3% 12.7%
Tier 1 capital ratio(2) . . . . . . . . . . . . . . . . . . . . . . . . . . . . . . . . . . . . . . . . . . . . . . . . . . . . . 16.8% 16.3%
Tier 1 leverage ratio(2) . . . . . . . . . . . . . . . . . . . . . . . . . . . . . . . . . . . . . . . . . . . . . . . . . . . 7.0% 6.6%
(1) Tier 1 common capital ratio equals Tier 1 common capital divided by RWAs. On December 30, 2011, the Federal Reserve formalizedregulatory definitions for Tier 1 common capital and Tier 1 common capital ratio. The Federal Reserve defined Tier 1 common capital asTier 1 capital less non-common elements in Tier 1 capital, including perpetual preferred stock and related surplus, minority interest in
121
subsidiaries, trust preferred securities and mandatory convertible preferred securities. Previously, the Company’s definition of Tier 1common capital included all of the items noted in the Federal Reserve’s definition, but it also included an adjustment for the portion ofgoodwill and non-servicing intangible assets associated with MSSB’s noncontrolling interests (i.e., Citi’s share of MSSB’s goodwill andintangibles). The Company’s conformance to the Federal Reserve’s definition under the final rule reduced its Tier 1 common capital andTier 1 common ratio by approximately $4.2 billion and 132 basis points, respectively at December 31, 2011.
(2) The December 31, 2011 deferred tax asset disallowance was adjusted by approximately $1.2 billion, resulting in a reduction to theCompany’s Tier 1 common capital, Tier 1 capital, Total capital and RWAs by such amount, Tier 1 common capital ratio, Tier 1 capitalratio and Total capital ratio by approximately 30 basis points and Tier 1 leverage ratio by approximately 20 basis points.
Total allowable capital is composed of Tier 1 capital, which includes Tier 1 common capital, and Tier 2 capital.Tier 1 common capital is defined as Tier 1 capital less non-common elements in Tier 1 capital, includingqualifying perpetual stock and qualifying restricted core capital elements, as per the Capital Plans final rule. Tier1 capital consists predominately of common shareholders’ equity as well as qualifying preferred stock andqualifying restricted core capital elements (trust preferred securities and noncontrolling interests) less goodwill,non-servicing intangible assets (excluding allowable mortgage servicing rights), net deferred tax assets(recoverable in excess of one year), an after-tax debt valuation adjustment and certain other deductions, includingequity investments. The debt valuation adjustment in the above table represents the cumulative change in fairvalue of certain long-term and short-term borrowings that was attributable to the Company’s own instrument-specific credit spreads and is included in retained earnings. For a further discussion of fair value, see Note 3 tothe condensed consolidated financial statements.
At March 31, 2012, the Company calculated its RWAs in accordance with the regulatory capital requirements ofthe Federal Reserve, which is consistent with guidelines described under Basel I. RWAs reflect both on andoff-balance sheet risk of the Company. The risk capital calculations will evolve over time as the Companyenhances its risk management methodology and incorporates improvements in modeling techniques whilemaintaining compliance with the regulatory requirements and interpretations.
Market RWAs reflect capital charges attributable to the risk of loss resulting from adverse changes in marketprices and other factors. For a further discussion of the Company’s market risks and Value-at-Risk (“VaR”)model, see “Quantitative and Qualitative Disclosures about Market Risk” in Part II, Item 7A, of the Form 10-Kand in Part I, Item 3 herein. Market RWAs incorporate two components: systematic risk and specific risk.Systematic and specific risk charges are computed using either the Company’s VaR model or StandardizedApproach in accordance with regulatory requirements.
Credit RWAs reflect capital charges attributable to the risk of loss arising from a borrower or counterparty failingto meet its financial obligations. For a further discussion of the Company’s credit risks, see “Quantitative andQualitative Disclosures about Market Risk” in Part II, Item 7A, of the Form 10-K and in Part I, Item 3 herein.
Under the Basel Committee’s proposed framework, based on a preliminary analysis of the guidelines publishedto date and other factors, the Company estimates its pro forma Tier 1 common capital ratio under Basel III willbe in a range between 8% and 10% by the end of 2012. This is a preliminary estimate and may change based onguidelines for implementation to be issued by the Federal Reserve. The pro forma Tier 1 common capital ratiounder Basel III is a non-GAAP financial measure that the Company considers to be a useful measure to theCompany and investors to gauge future regulatory capital requirements. The pro forma Tier 1 common capitalratio estimate is based on shareholders’ equity, Tier 1 common capital and RWAs at March 31, 2012, adjustedfor analysts’ consensus of earnings for the remainder of 2012, and various passive mitigation efforts. Thispreliminary estimate is forward-looking, is subject to risks and uncertainties that may cause actual results todiffer materially and should not be taken as a projection of what our capital ratios, RWAs, earnings or otherresults will actually be at these future dates. For a discussion of risks and uncertainties that may affect the futureresults of the Company, please see “Risk Factors” in Part I, Item 1A of the Form 10-K.
122
Liquidity.
The Basel Committee has developed two standards for supervisors to use in liquidity risk supervision. The firststandard’s objective is to promote the short-term resilience of the liquidity risk profile of banks and bank holdingcompanies. The Basel Committee developed the Liquidity Coverage Ratio (“LCR”) to ensure banks havesufficient high-quality liquid assets to cover net outflows arising from significant stress lasting 30 calendardays. The standard requires that the value of the ratio be no lower than 100%. The second standard’s objective isto promote resilience over a longer time horizon. The Net Stable Funding Ratio (“NSFR”) has a time horizon ofone year and builds on traditional “net liquid asset” and “cash capital” methodologies used widely byinternationally active banking organizations to provide a sustainable maturity structure of assets and liabilities.The NSFR is defined as the amount of available stable funding to the amount of required stable funding. Thisratio must be greater than 100%. After an observation period beginning in 2011, the LCR, including anyrevisions, will be introduced on January 1, 2015. The NSFR, including any revisions, will move to a minimumstandard by January 1, 2018. The Company will continue to monitor the development and the potential impact ofthese standards.
In addition, in December 2011, the Federal Reserve issued proposed rules to implement certain requirements ofthe systemic risk regime, including with respect to liquidity. The proposed rules would require systemicallyimportant financial institutions, such as the Company, to maintain a sufficient quantity of highly liquid assets tosurvive a projected 30-day liquidity stress event, to conduct regular liquidity stress tests, and to implementvarious liquidity risk management requirements.
Effects of Inflation and Changes in Foreign Exchange Rates.
The Company’s assets to a large extent are liquid in nature and, therefore, are not significantly affected byinflation, although inflation may result in increases in the Company’s expenses, which may not be readilyrecoverable in the price of services offered. To the extent inflation results in rising interest rates and has otheradverse effects upon the securities markets and upon the value of financial instruments, it may adversely affectthe Company’s financial position and profitability.
A significant portion of the Company’s business is conducted in currencies other than the U.S. dollar, andchanges in foreign exchange rates relative to the U.S. dollar can therefore affect the value of non-U.S. dollar netassets, revenues and expenses. Potential exposures as a result of these fluctuations in currencies are closelymonitored, and, where cost-justified, strategies are adopted that are designed to reduce the impact of thesefluctuations on the Company’s financial performance. These strategies may include the financing of non-U.S.dollar assets with direct or swap-based borrowings in the same currency and the use of currency forwardcontracts or the spot market in various hedging transactions related to net assets, revenues, expenses or cashflows.
123
Item 3. Quantitative and Qualitative Disclosures about Market Risk.Market Risk.
Market risk refers to the exposure of the Company to adverse changes in the values of its portfolios and financialinstruments due to changes in market prices or rates. Generally, the Company is exposed to market risk as aresult of trading, investing and client facilitation activities, mainly within the Institutional Securities businesssegment where the substantial majority of the Company’s Value-at-Risk (“VaR”) for market risk exposures isgenerated. In addition, the Company incurs trading related market risk within the Global Wealth ManagementGroup business segment. The Asset Management business segment incurs mainly non-trading market riskprimarily from capital investments in real estate funds and investments in private equity vehicles. Regardingsales and trading and related activities, the Company is exposed to concentration risk in certain of its OTCderivatives portfolios related to the additional cost of closing out particularly large risk positions. For a furtherdiscussion of the Company’s Market Risk, see “Quantitative and Qualitative Disclosures about Market Risk—Risk Management” in Part II, Item 7A of the Form 10-K.
VaR.
The Company uses VaR as one of a range of risk management tools. VaR methodology has various strengths andlimitations, which include, but are not limited to: use of historical changes in market risk factors, which may notbe accurate predictors of future market conditions, and may not fully incorporate the risk of extreme marketevents that are outsized relative to observed historical market behavior or reflect the historical distribution ofresults beyond the 95% confidence interval; and reporting of losses in a single day, which does not reflect therisk of positions that cannot be liquidated or hedged in one day. A small proportion of market risk generated bytrading positions is not included in VaR. The modeling of the risk characteristics of some positions relies onapproximations that, under certain circumstances, could produce significantly different results from thoseproduced using more precise measures.
The Company’s VaR model evolves over time in response to changes in the composition of trading portfolios and toimprovements in modeling techniques and systems capabilities. The Company is committed to continuous reviewand enhancement of VaR methodologies and assumptions in order to capture evolving risks associated with changesin market structure and dynamics. As part of regular process improvement, additional systematic and name-specificrisk factors may be added to improve the VaR model’s ability to more accurately estimate risks to specific assetclasses or industry sectors. Additionally, the Company continues to evaluate enhancements to the VaR model tomake it more responsive to recent market conditions, while maintaining a longer-term perspective.
The Company also performs routine stress testing to more comprehensively monitor the risks in the portfolio.The Company utilizes Stress VaR (“S-VaR”), which is a proprietary methodology that seeks to measure both theCompany’s market and credit risks, while adjusting for the different liquidity characteristics of the underlyingrisks (in contrast to traditional VaR measures which are typically calculated using the same liquidity horizon forall risks). S-VaR is an important risk metric used in establishing the Company’s risk tolerance and its capitalallocation framework. Further information on S-VaR can be found in “Quantitative and Qualitative Disclosuresabout Market Risk—Risk Management” in Part II, Item 7A of the Form 10-K.
Since the reported VaR statistics are estimates based on historical data, VaR should not be viewed as predictiveof the Company’s future revenues or financial performance or of its ability to monitor and manage risk. Therecan be no assurance that the Company’s actual losses on a particular day will not exceed the VaR amountsindicated below or that such losses will not occur more than five times in 100 trading days for a 95%/one-dayVaR. VaR does not predict the magnitude of losses which, should they occur, may be significantly greater thanthe VaR amount.
The Credit Portfolio VaR has been disclosed as a separate category from the Primary Risk Categories. The CreditPortfolio VaR includes the mark-to-market relationship lending exposures and associated hedges as well ascounterparty credit valuation adjustments and related hedges.
124
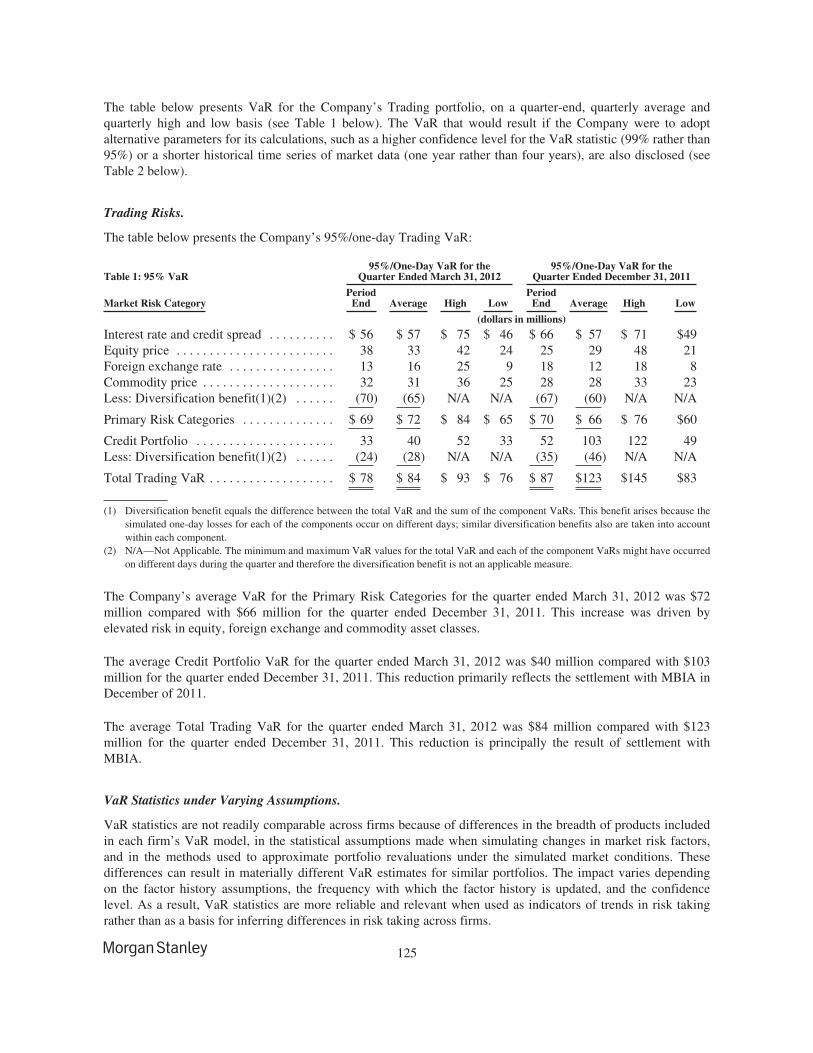
The table below presents VaR for the Company’s Trading portfolio, on a quarter-end, quarterly average andquarterly high and low basis (see Table 1 below). The VaR that would result if the Company were to adoptalternative parameters for its calculations, such as a higher confidence level for the VaR statistic (99% rather than95%) or a shorter historical time series of market data (one year rather than four years), are also disclosed (seeTable 2 below).
Trading Risks.
The table below presents the Company’s 95%/one-day Trading VaR:
Table 1: 95% VaR95%/One-Day VaR for the
Quarter Ended March 31, 201295%/One-Day VaR for the
Quarter Ended December 31, 2011
Market Risk CategoryPeriod
End Average High LowPeriod
End Average High Low
(dollars in millions)
Interest rate and credit spread . . . . . . . . . . $ 56 $ 57 $ 75 $ 46 $ 66 $ 57 $ 71 $49Equity price . . . . . . . . . . . . . . . . . . . . . . . . 38 33 42 24 25 29 48 21Foreign exchange rate . . . . . . . . . . . . . . . . 13 16 25 9 18 12 18 8Commodity price . . . . . . . . . . . . . . . . . . . . 32 31 36 25 28 28 33 23Less: Diversification benefit(1)(2) . . . . . . (70) (65) N/A N/A (67) (60) N/A N/A
Primary Risk Categories . . . . . . . . . . . . . . $ 69 $ 72 $ 84 $ 65 $ 70 $ 66 $ 76 $60
Credit Portfolio . . . . . . . . . . . . . . . . . . . . . 33 40 52 33 52 103 122 49Less: Diversification benefit(1)(2) . . . . . . (24) (28) N/A N/A (35) (46) N/A N/A
Total Trading VaR . . . . . . . . . . . . . . . . . . . $ 78 $ 84 $ 93 $ 76 $ 87 $123 $145 $83
(1) Diversification benefit equals the difference between the total VaR and the sum of the component VaRs. This benefit arises because thesimulated one-day losses for each of the components occur on different days; similar diversification benefits also are taken into accountwithin each component.
(2) N/A—Not Applicable. The minimum and maximum VaR values for the total VaR and each of the component VaRs might have occurredon different days during the quarter and therefore the diversification benefit is not an applicable measure.
The Company’s average VaR for the Primary Risk Categories for the quarter ended March 31, 2012 was $72million compared with $66 million for the quarter ended December 31, 2011. This increase was driven byelevated risk in equity, foreign exchange and commodity asset classes.
The average Credit Portfolio VaR for the quarter ended March 31, 2012 was $40 million compared with $103million for the quarter ended December 31, 2011. This reduction primarily reflects the settlement with MBIA inDecember of 2011.
The average Total Trading VaR for the quarter ended March 31, 2012 was $84 million compared with $123million for the quarter ended December 31, 2011. This reduction is principally the result of settlement withMBIA.
VaR Statistics under Varying Assumptions.
VaR statistics are not readily comparable across firms because of differences in the breadth of products includedin each firm’s VaR model, in the statistical assumptions made when simulating changes in market risk factors,and in the methods used to approximate portfolio revaluations under the simulated market conditions. Thesedifferences can result in materially different VaR estimates for similar portfolios. The impact varies dependingon the factor history assumptions, the frequency with which the factor history is updated, and the confidencelevel. As a result, VaR statistics are more reliable and relevant when used as indicators of trends in risk takingrather than as a basis for inferring differences in risk taking across firms.
125
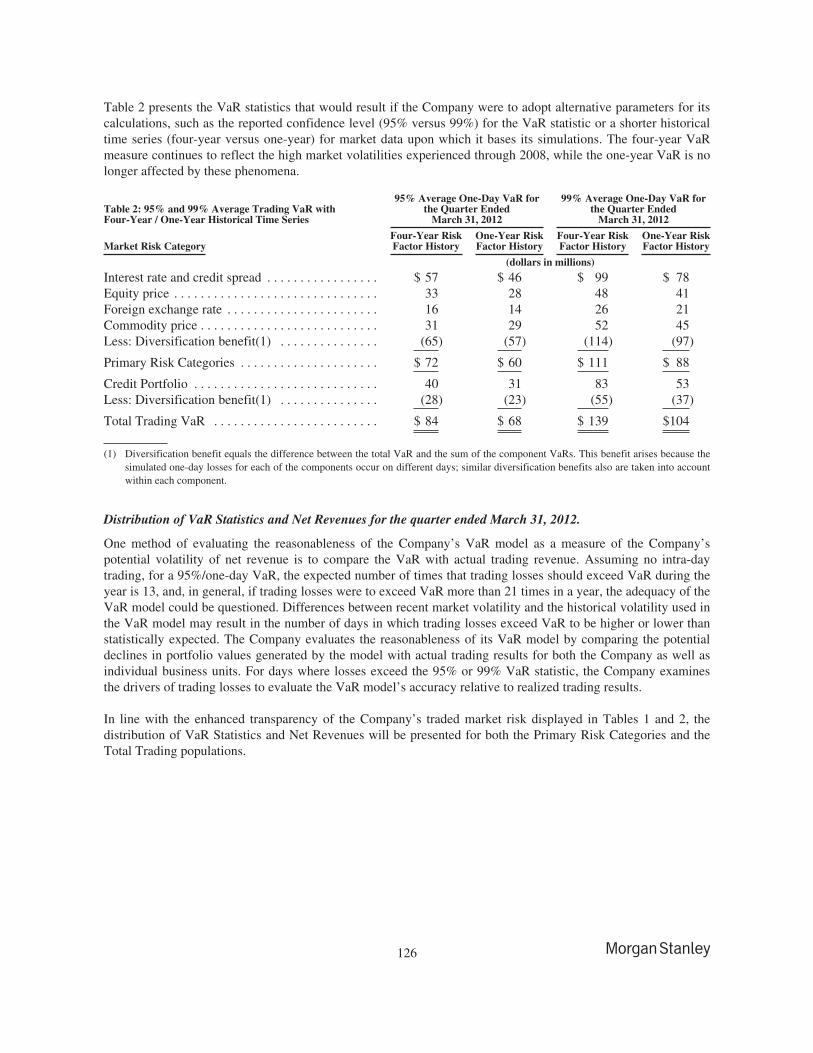
Table 2 presents the VaR statistics that would result if the Company were to adopt alternative parameters for itscalculations, such as the reported confidence level (95% versus 99%) for the VaR statistic or a shorter historicaltime series (four-year versus one-year) for market data upon which it bases its simulations. The four-year VaRmeasure continues to reflect the high market volatilities experienced through 2008, while the one-year VaR is nolonger affected by these phenomena.
Table 2: 95% and 99% Average Trading VaR withFour-Year / One-Year Historical Time Series
95% Average One-Day VaR forthe Quarter Ended
March 31, 2012
99% Average One-Day VaR forthe Quarter Ended
March 31, 2012
Market Risk CategoryFour-Year RiskFactor History
One-Year RiskFactor History
Four-Year RiskFactor History
One-Year RiskFactor History
(dollars in millions)
Interest rate and credit spread . . . . . . . . . . . . . . . . . $ 57 $ 46 $ 99 $ 78Equity price . . . . . . . . . . . . . . . . . . . . . . . . . . . . . . . 33 28 48 41Foreign exchange rate . . . . . . . . . . . . . . . . . . . . . . . 16 14 26 21Commodity price . . . . . . . . . . . . . . . . . . . . . . . . . . . 31 29 52 45Less: Diversification benefit(1) . . . . . . . . . . . . . . . (65) (57) (114) (97)
Primary Risk Categories . . . . . . . . . . . . . . . . . . . . . $ 72 $ 60 $ 111 $ 88
Credit Portfolio . . . . . . . . . . . . . . . . . . . . . . . . . . . . 40 31 83 53Less: Diversification benefit(1) . . . . . . . . . . . . . . . (28) (23) (55) (37)
Total Trading VaR . . . . . . . . . . . . . . . . . . . . . . . . . $ 84 $ 68 $ 139 $104
(1) Diversification benefit equals the difference between the total VaR and the sum of the component VaRs. This benefit arises because thesimulated one-day losses for each of the components occur on different days; similar diversification benefits also are taken into accountwithin each component.
Distribution of VaR Statistics and Net Revenues for the quarter ended March 31, 2012.
One method of evaluating the reasonableness of the Company’s VaR model as a measure of the Company’spotential volatility of net revenue is to compare the VaR with actual trading revenue. Assuming no intra-daytrading, for a 95%/one-day VaR, the expected number of times that trading losses should exceed VaR during theyear is 13, and, in general, if trading losses were to exceed VaR more than 21 times in a year, the adequacy of theVaR model could be questioned. Differences between recent market volatility and the historical volatility used inthe VaR model may result in the number of days in which trading losses exceed VaR to be higher or lower thanstatistically expected. The Company evaluates the reasonableness of its VaR model by comparing the potentialdeclines in portfolio values generated by the model with actual trading results for both the Company as well asindividual business units. For days where losses exceed the 95% or 99% VaR statistic, the Company examinesthe drivers of trading losses to evaluate the VaR model’s accuracy relative to realized trading results.
In line with the enhanced transparency of the Company’s traded market risk displayed in Tables 1 and 2, thedistribution of VaR Statistics and Net Revenues will be presented for both the Primary Risk Categories and theTotal Trading populations.
126
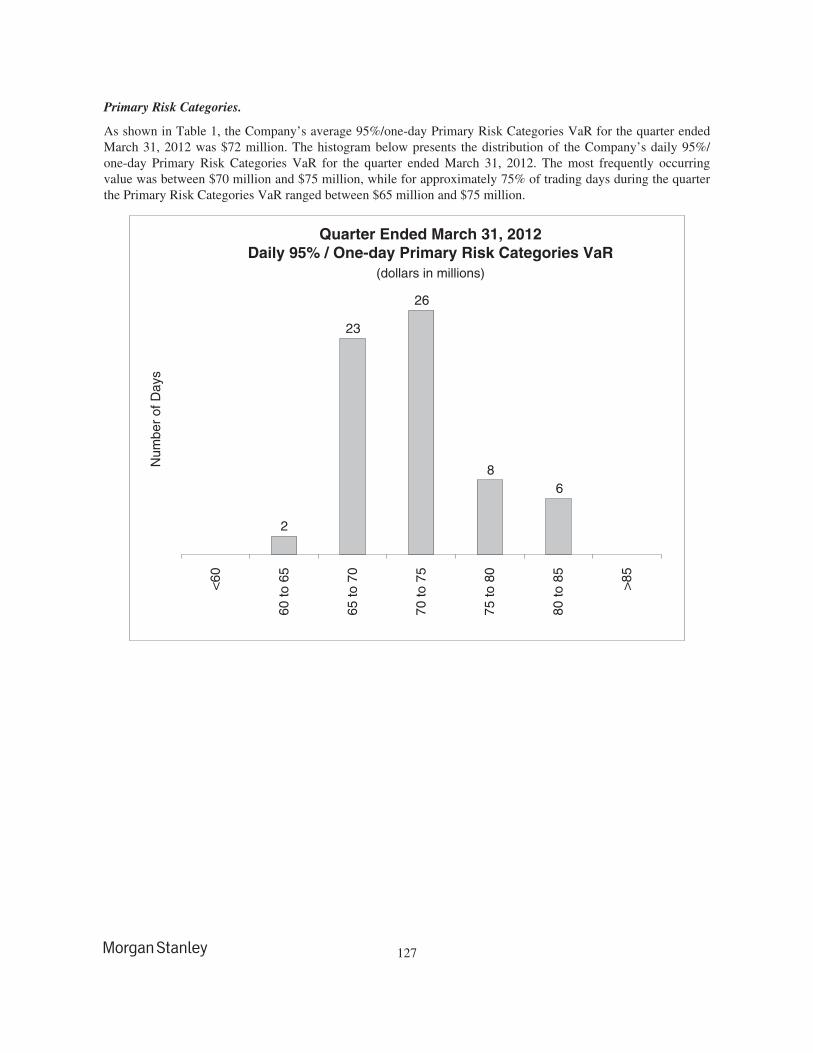
Primary Risk Categories.
As shown in Table 1, the Company’s average 95%/one-day Primary Risk Categories VaR for the quarter endedMarch 31, 2012 was $72 million. The histogram below presents the distribution of the Company’s daily 95%/one-day Primary Risk Categories VaR for the quarter ended March 31, 2012. The most frequently occurringvalue was between $70 million and $75 million, while for approximately 75% of trading days during the quarterthe Primary Risk Categories VaR ranged between $65 million and $75 million.
Num
ber
of D
ays
<60
60 to
65
65 to
70
70 to
75
75 to
80
80 to
85
>85
Quarter Ended March 31, 2012Daily 95% / One-day Primary Risk Categories VaR
(dollars in millions)
8
26
23
2
6
127
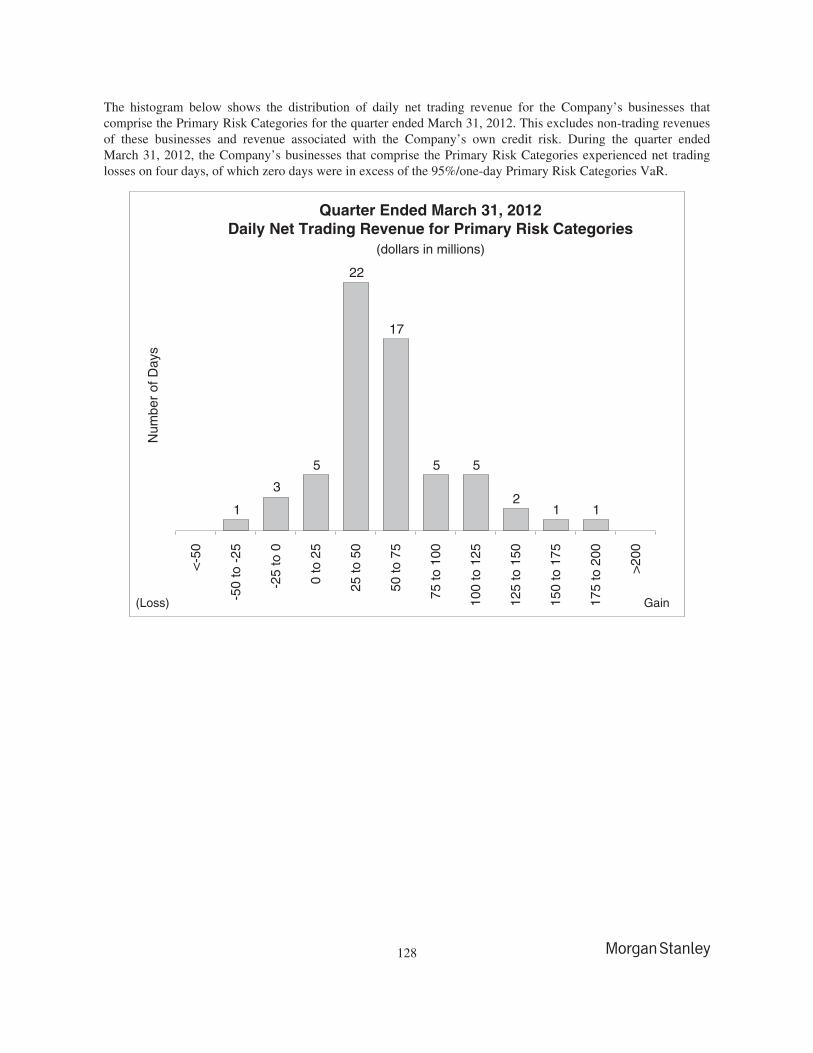
The histogram below shows the distribution of daily net trading revenue for the Company’s businesses thatcomprise the Primary Risk Categories for the quarter ended March 31, 2012. This excludes non-trading revenuesof these businesses and revenue associated with the Company’s own credit risk. During the quarter endedMarch 31, 2012, the Company’s businesses that comprise the Primary Risk Categories experienced net tradinglosses on four days, of which zero days were in excess of the 95%/one-day Primary Risk Categories VaR.
Num
ber
of D
ays
Quarter Ended March 31, 2012Daily Net Trading Revenue for Primary Risk Categories
(dollars in millions)
(Loss) Gain
<-5
0
-50
to -
25
-25
to 0
0 to
25
25 to
50
50 to
75
75 to
100
100
to 1
25
125
to 1
50
150
to 1
75
175
to 2
00
>20
0
12
55
17
22
5
3
1 1
128
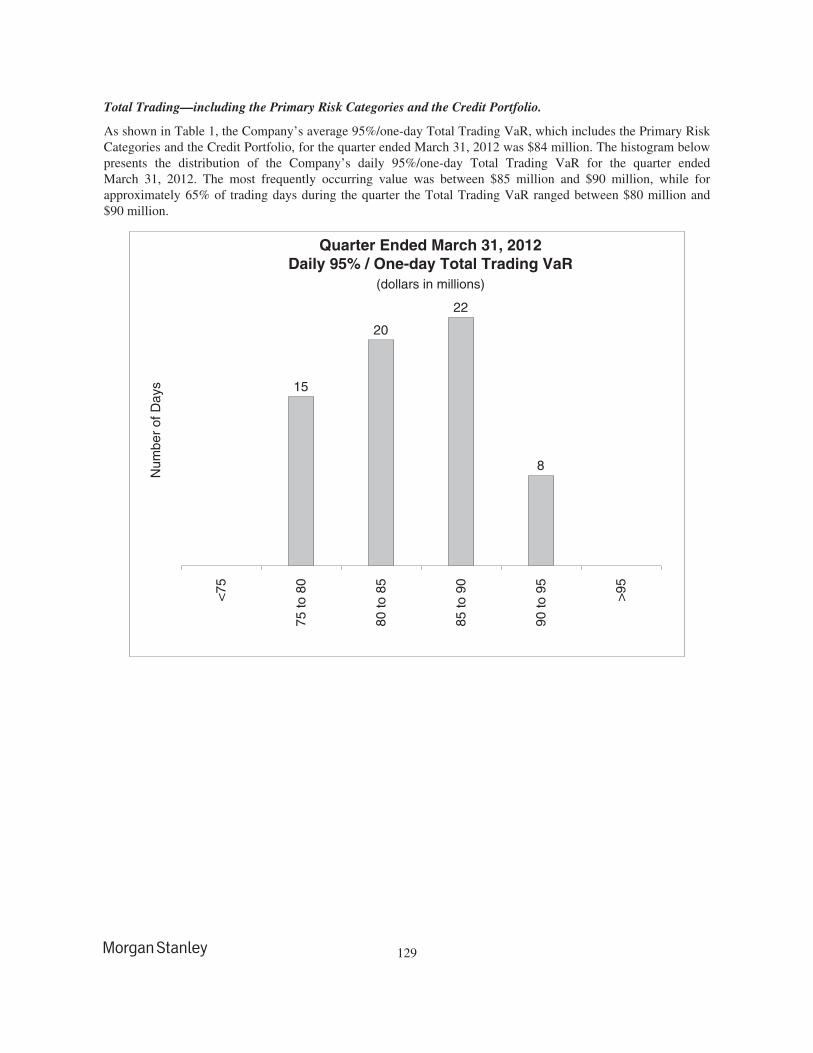
Total Trading—including the Primary Risk Categories and the Credit Portfolio.
As shown in Table 1, the Company’s average 95%/one-day Total Trading VaR, which includes the Primary RiskCategories and the Credit Portfolio, for the quarter ended March 31, 2012 was $84 million. The histogram belowpresents the distribution of the Company’s daily 95%/one-day Total Trading VaR for the quarter endedMarch 31, 2012. The most frequently occurring value was between $85 million and $90 million, while forapproximately 65% of trading days during the quarter the Total Trading VaR ranged between $80 million and$90 million.
Num
ber
of D
ays
Quarter Ended March 31, 2012Daily 95% / One-day Total Trading VaR
(dollars in millions)
<75
75 to
80
80 to
85
85 to
90
90 to
95
>95
22
20
15
8
129
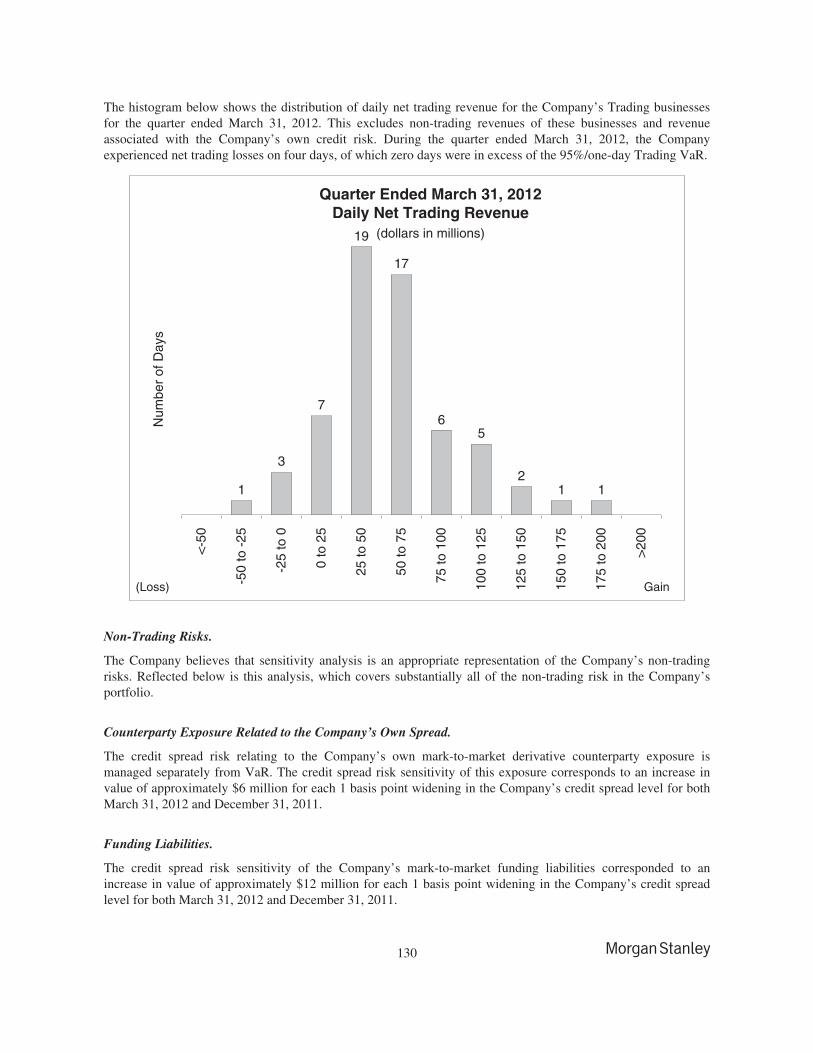
The histogram below shows the distribution of daily net trading revenue for the Company’s Trading businessesfor the quarter ended March 31, 2012. This excludes non-trading revenues of these businesses and revenueassociated with the Company’s own credit risk. During the quarter ended March 31, 2012, the Companyexperienced net trading losses on four days, of which zero days were in excess of the 95%/one-day Trading VaR.
Num
ber
of D
ays
Quarter Ended March 31, 2012Daily Net Trading Revenue
(dollars in millions)
(Loss) Gain
<-5
0
-50
to -
25
-25
to 0
0 to
25
25 to
50
50 to
75
75 to
100
100
to 1
25
125
to 1
50
150
to 1
75
175
to 2
00
>20
0
12
56
17
19
7
3
1 1
Non-Trading Risks.
The Company believes that sensitivity analysis is an appropriate representation of the Company’s non-tradingrisks. Reflected below is this analysis, which covers substantially all of the non-trading risk in the Company’sportfolio.
Counterparty Exposure Related to the Company’s Own Spread.
The credit spread risk relating to the Company’s own mark-to-market derivative counterparty exposure ismanaged separately from VaR. The credit spread risk sensitivity of this exposure corresponds to an increase invalue of approximately $6 million for each 1 basis point widening in the Company’s credit spread level for bothMarch 31, 2012 and December 31, 2011.
Funding Liabilities.
The credit spread risk sensitivity of the Company’s mark-to-market funding liabilities corresponded to anincrease in value of approximately $12 million for each 1 basis point widening in the Company’s credit spreadlevel for both March 31, 2012 and December 31, 2011.
130
Interest Rate Risk Sensitivity on Income from Continuing Operations.
The Company measures the interest rate risk of certain assets and liabilities by calculating the hypotheticalsensitivity of net interest income to potential changes in the level of interest rates over the next twelve months.This sensitivity analysis includes positions that are mark-to-market as well as positions that are accounted for onan accrual basis. For interest rate derivatives that are perfect economic hedges to non-mark-to-market assets orliabilities, the disclosed sensitivities include only the impact of the coupon accrual mismatch. This treatmentmitigates the effects caused by the measurement basis differences between the economic hedge and thecorresponding hedged instrument.
Given the currently low interest rate environment, the Company uses the following two interest rate scenarios toquantify the Company’s sensitivity: instantaneous parallel shocks of 100 and 200 basis point increases to allpoints on all yield curves simultaneously.
The hypothetical model does not assume any growth, change in business focus, asset pricing philosophy or asset/liability funding mix and does not capture how the Company would respond to significant changes in marketconditions. Furthermore, the model does not reflect the Company’s expectations regarding the movement ofinterest rates in the near term, nor the actual effect on income from continuing operations before income taxes ifsuch changes were to occur.
March 31, 2012 December 31, 2011
+100Basis Points
+200Basis Points
+100Basis Points
+200Basis Points
(dollars in millions)
Impact on income from continuing operations before incometaxes . . . . . . . . . . . . . . . . . . . . . . . . . . . . . . . . . . . . . . . . . . . . $614 $1,019 $600 $1,080
Impact on income from continuing operations before incometaxes excluding Citi’s share of MSSB(1) . . . . . . . . . . . . . . . 384 650 370 672
(1) Reflects the exclusion of the portion of income from continuing operations before taxes associated with MSSB’s noncontrolling interestin the joint venture.
Principal Investments.
The Company makes investments in both public and private companies. These investments are predominantlyequity positions with long investment horizons, the majority of which are for business facilitation purposes. Themarket risk related to these investments is measured by estimating the potential reduction in net revenuesassociated with a 10% decline in investment values.
10% Sensitivity
Investments March 31, 2012 December 31, 2011
(dollars in millions)
Investments related to Asset Management activities:Hedge fund investments . . . . . . . . . . . . . . . . . . . . . . . . . . . . . . . . . . . . . . . . $134 $141Private equity and infrastructure funds . . . . . . . . . . . . . . . . . . . . . . . . . . . . 115 108Real estate funds . . . . . . . . . . . . . . . . . . . . . . . . . . . . . . . . . . . . . . . . . . . . . 132 133
Other investments:Mitsubishi UFJ Morgan Stanley Securities Co., Ltd. . . . . . . . . . . . . . . . . . 137 144Other Company investments . . . . . . . . . . . . . . . . . . . . . . . . . . . . . . . . . . . . 292 297
Credit Risk.
For a further discussion of the Company’s credit risks, see “Quantitative and Qualitative Disclosures aboutMarket Risk—Risk Management—Credit Risk” in Part II, Item 7A of the Form 10-K. See Notes 7 and 11 to thecondensed consolidated financial statements for additional information about the Company’s financingreceivables and lending commitments, respectively.
131
Institutional Securities Activities.
Credit Exposure—Corporate Lending. In connection with certain of its Institutional Securities businesssegment activities, the Company provides loans or lending commitments (including bridge financing) to selectedcorporate clients. Such loans and lending commitments can generally be classified as either “relationship-driven”or “event-driven.” These loans and lending commitments have varying terms, may be senior or subordinated,may be secured or unsecured, are generally contingent upon representations, warranties and contractualconditions applicable to the borrower, and may be syndicated, traded or hedged by the Company.
“Relationship-driven” loans and lending commitments refer to loans and lending commitments used for generalcorporate purposes, working capital and liquidity purposes. Commitments associated with “relationship-driven”activities may not be indicative of the Company’s actual funding requirements, as the commitment may expireunused or the borrower may not fully utilize the commitment. The Company may hedge its exposures inconnection with “relationship-driven” transactions. Additionally, the Company may mitigate credit risk byrequiring borrowers to pledge collateral and include financial covenants in lending commitments. TheCompany’s “relationship-driven” loans and lending commitments typically consist of revolving lines of credit,letter of credit facilities and certain term loans. These loans are carried either at fair value with changes in fairvalue recorded in earnings or amortized cost in the condensed consolidated statements of financial condition.
“Event-driven” loans and lending commitments refer to activities associated with a particular event ortransaction, such as to support client merger, acquisition or recapitalization activities. Commitments associatedwith these “event-driven” activities may not be indicative of the Company’s actual funding requirements sincefunding is contingent upon a proposed transaction being completed. In addition, the borrower may not fullyutilize the commitment or the Company’s portion of the commitment may be reduced through the syndication orsales process. The “event-driven” loans are typically syndicated or sold to third party institutional investors. TheCompany may have a custodial relationship with these institutional investors, such as prime brokerage clients.The borrower’s ability to draw on the commitment is also subject to certain terms and conditions, among otherfactors. The Company risk manages its exposures in connection with “event-driven” transactions through variousmeans, including syndication, distribution and/or hedging. The Company’s “event-driven” loans and lendingcommitments typically consist of term loans and bridge loans. These loans are carried either at fair value withchanges in fair value recorded in earnings or amortized cost in the condensed consolidated statements of financialcondition.
During 2011, the Company accounted for certain new “relationship-driven” and “event-driven” loans and lendingcommitments as held for investment. Effective April 1, 2012, the Company began accounting for all new“relationship-driven” and “event-driven” loans and lending commitments as either held for investment or held forsale.
The table below presents the Company’s credit exposure from its corporate lending positions and lendingcommitments, which is measured in accordance with the Company’s internal risk management standards atMarch 31, 2012. The “total corporate lending exposure” column includes both lending commitments and fundedloans. Lending commitments represent legally binding obligations to provide funding to clients at March 31,2012 for both “relationship-driven” and “event-driven” lending transactions. Since commitments associated withthese business activities may expire unused, they do not necessarily reflect the actual future cash fundingrequirements.
132
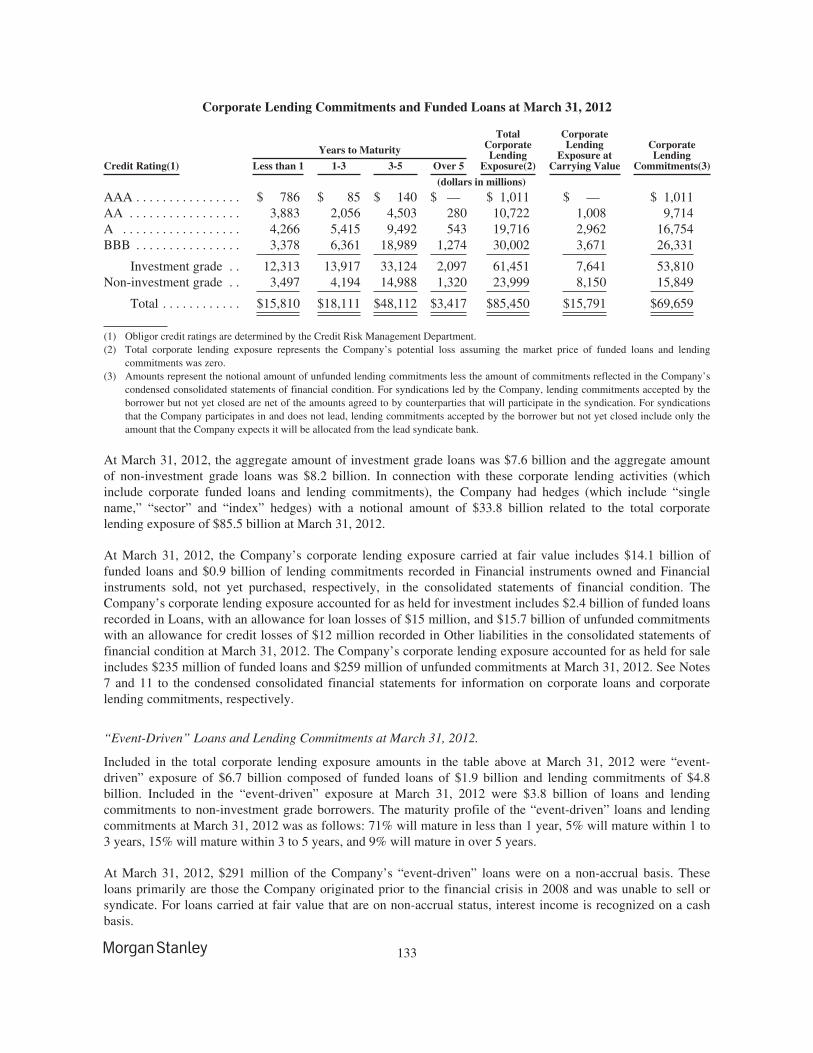
Corporate Lending Commitments and Funded Loans at March 31, 2012
Years to Maturity
TotalCorporateLending
Exposure(2)
CorporateLending
Exposure atCarrying Value
CorporateLending
Commitments(3)Credit Rating(1) Less than 1 1-3 3-5 Over 5
(dollars in millions)
AAA . . . . . . . . . . . . . . . . $ 786 $ 85 $ 140 $ — $ 1,011 $ — $ 1,011AA . . . . . . . . . . . . . . . . . 3,883 2,056 4,503 280 10,722 1,008 9,714A . . . . . . . . . . . . . . . . . . 4,266 5,415 9,492 543 19,716 2,962 16,754BBB . . . . . . . . . . . . . . . . 3,378 6,361 18,989 1,274 30,002 3,671 26,331
Investment grade . . 12,313 13,917 33,124 2,097 61,451 7,641 53,810Non-investment grade . . 3,497 4,194 14,988 1,320 23,999 8,150 15,849
Total . . . . . . . . . . . . $15,810 $18,111 $48,112 $3,417 $85,450 $15,791 $69,659
(1) Obligor credit ratings are determined by the Credit Risk Management Department.(2) Total corporate lending exposure represents the Company’s potential loss assuming the market price of funded loans and lending
commitments was zero.(3) Amounts represent the notional amount of unfunded lending commitments less the amount of commitments reflected in the Company’s
condensed consolidated statements of financial condition. For syndications led by the Company, lending commitments accepted by theborrower but not yet closed are net of the amounts agreed to by counterparties that will participate in the syndication. For syndicationsthat the Company participates in and does not lead, lending commitments accepted by the borrower but not yet closed include only theamount that the Company expects it will be allocated from the lead syndicate bank.
At March 31, 2012, the aggregate amount of investment grade loans was $7.6 billion and the aggregate amountof non-investment grade loans was $8.2 billion. In connection with these corporate lending activities (whichinclude corporate funded loans and lending commitments), the Company had hedges (which include “singlename,” “sector” and “index” hedges) with a notional amount of $33.8 billion related to the total corporatelending exposure of $85.5 billion at March 31, 2012.
At March 31, 2012, the Company’s corporate lending exposure carried at fair value includes $14.1 billion offunded loans and $0.9 billion of lending commitments recorded in Financial instruments owned and Financialinstruments sold, not yet purchased, respectively, in the consolidated statements of financial condition. TheCompany’s corporate lending exposure accounted for as held for investment includes $2.4 billion of funded loansrecorded in Loans, with an allowance for loan losses of $15 million, and $15.7 billion of unfunded commitmentswith an allowance for credit losses of $12 million recorded in Other liabilities in the consolidated statements offinancial condition at March 31, 2012. The Company’s corporate lending exposure accounted for as held for saleincludes $235 million of funded loans and $259 million of unfunded commitments at March 31, 2012. See Notes7 and 11 to the condensed consolidated financial statements for information on corporate loans and corporatelending commitments, respectively.
“Event-Driven” Loans and Lending Commitments at March 31, 2012.
Included in the total corporate lending exposure amounts in the table above at March 31, 2012 were “event-driven” exposure of $6.7 billion composed of funded loans of $1.9 billion and lending commitments of $4.8billion. Included in the “event-driven” exposure at March 31, 2012 were $3.8 billion of loans and lendingcommitments to non-investment grade borrowers. The maturity profile of the “event-driven” loans and lendingcommitments at March 31, 2012 was as follows: 71% will mature in less than 1 year, 5% will mature within 1 to3 years, 15% will mature within 3 to 5 years, and 9% will mature in over 5 years.
At March 31, 2012, $291 million of the Company’s “event-driven” loans were on a non-accrual basis. Theseloans primarily are those the Company originated prior to the financial crisis in 2008 and was unable to sell orsyndicate. For loans carried at fair value that are on non-accrual status, interest income is recognized on a cashbasis.
133
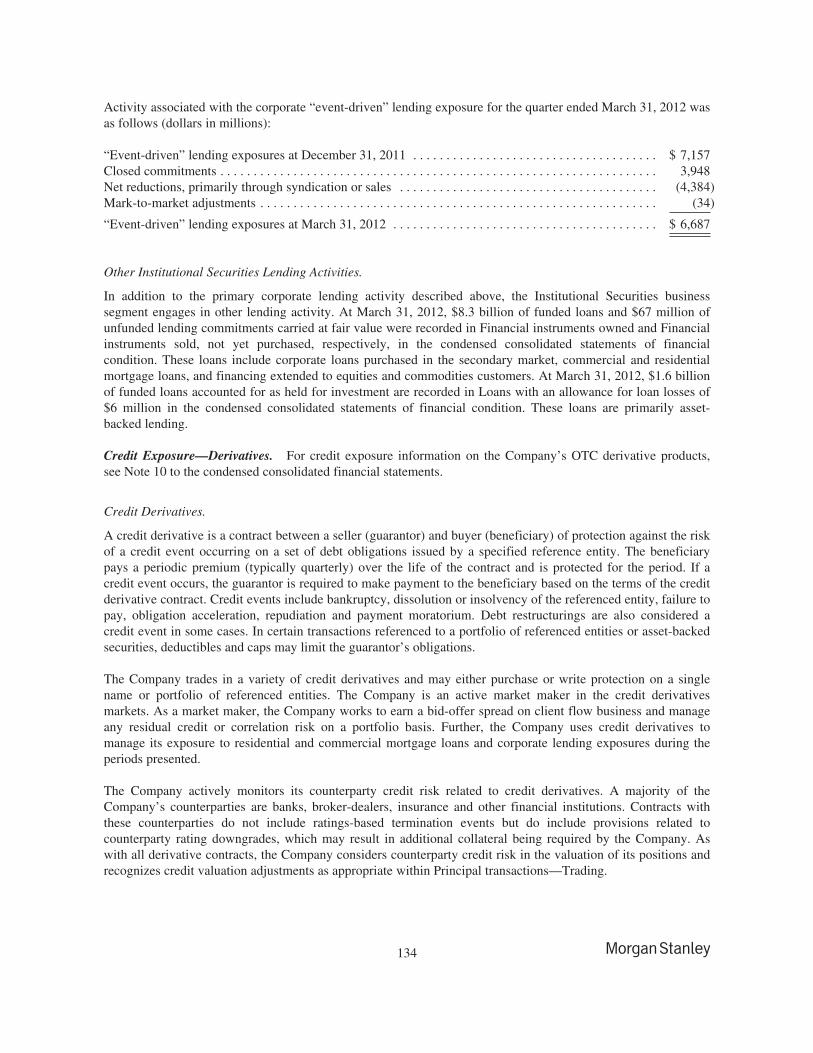
Activity associated with the corporate “event-driven” lending exposure for the quarter ended March 31, 2012 wasas follows (dollars in millions):
“Event-driven” lending exposures at December 31, 2011 . . . . . . . . . . . . . . . . . . . . . . . . . . . . . . . . . . . . . $ 7,157Closed commitments . . . . . . . . . . . . . . . . . . . . . . . . . . . . . . . . . . . . . . . . . . . . . . . . . . . . . . . . . . . . . . . . . . 3,948Net reductions, primarily through syndication or sales . . . . . . . . . . . . . . . . . . . . . . . . . . . . . . . . . . . . . . . (4,384)Mark-to-market adjustments . . . . . . . . . . . . . . . . . . . . . . . . . . . . . . . . . . . . . . . . . . . . . . . . . . . . . . . . . . . . (34)
“Event-driven” lending exposures at March 31, 2012 . . . . . . . . . . . . . . . . . . . . . . . . . . . . . . . . . . . . . . . . $ 6,687
Other Institutional Securities Lending Activities.
In addition to the primary corporate lending activity described above, the Institutional Securities businesssegment engages in other lending activity. At March 31, 2012, $8.3 billion of funded loans and $67 million ofunfunded lending commitments carried at fair value were recorded in Financial instruments owned and Financialinstruments sold, not yet purchased, respectively, in the condensed consolidated statements of financialcondition. These loans include corporate loans purchased in the secondary market, commercial and residentialmortgage loans, and financing extended to equities and commodities customers. At March 31, 2012, $1.6 billionof funded loans accounted for as held for investment are recorded in Loans with an allowance for loan losses of$6 million in the condensed consolidated statements of financial condition. These loans are primarily asset-backed lending.
Credit Exposure—Derivatives. For credit exposure information on the Company’s OTC derivative products,see Note 10 to the condensed consolidated financial statements.
Credit Derivatives.
A credit derivative is a contract between a seller (guarantor) and buyer (beneficiary) of protection against the riskof a credit event occurring on a set of debt obligations issued by a specified reference entity. The beneficiarypays a periodic premium (typically quarterly) over the life of the contract and is protected for the period. If acredit event occurs, the guarantor is required to make payment to the beneficiary based on the terms of the creditderivative contract. Credit events include bankruptcy, dissolution or insolvency of the referenced entity, failure topay, obligation acceleration, repudiation and payment moratorium. Debt restructurings are also considered acredit event in some cases. In certain transactions referenced to a portfolio of referenced entities or asset-backedsecurities, deductibles and caps may limit the guarantor’s obligations.
The Company trades in a variety of credit derivatives and may either purchase or write protection on a singlename or portfolio of referenced entities. The Company is an active market maker in the credit derivativesmarkets. As a market maker, the Company works to earn a bid-offer spread on client flow business and manageany residual credit or correlation risk on a portfolio basis. Further, the Company uses credit derivatives tomanage its exposure to residential and commercial mortgage loans and corporate lending exposures during theperiods presented.
The Company actively monitors its counterparty credit risk related to credit derivatives. A majority of theCompany’s counterparties are banks, broker-dealers, insurance and other financial institutions. Contracts withthese counterparties do not include ratings-based termination events but do include provisions related tocounterparty rating downgrades, which may result in additional collateral being required by the Company. Aswith all derivative contracts, the Company considers counterparty credit risk in the valuation of its positions andrecognizes credit valuation adjustments as appropriate within Principal transactions—Trading.
134
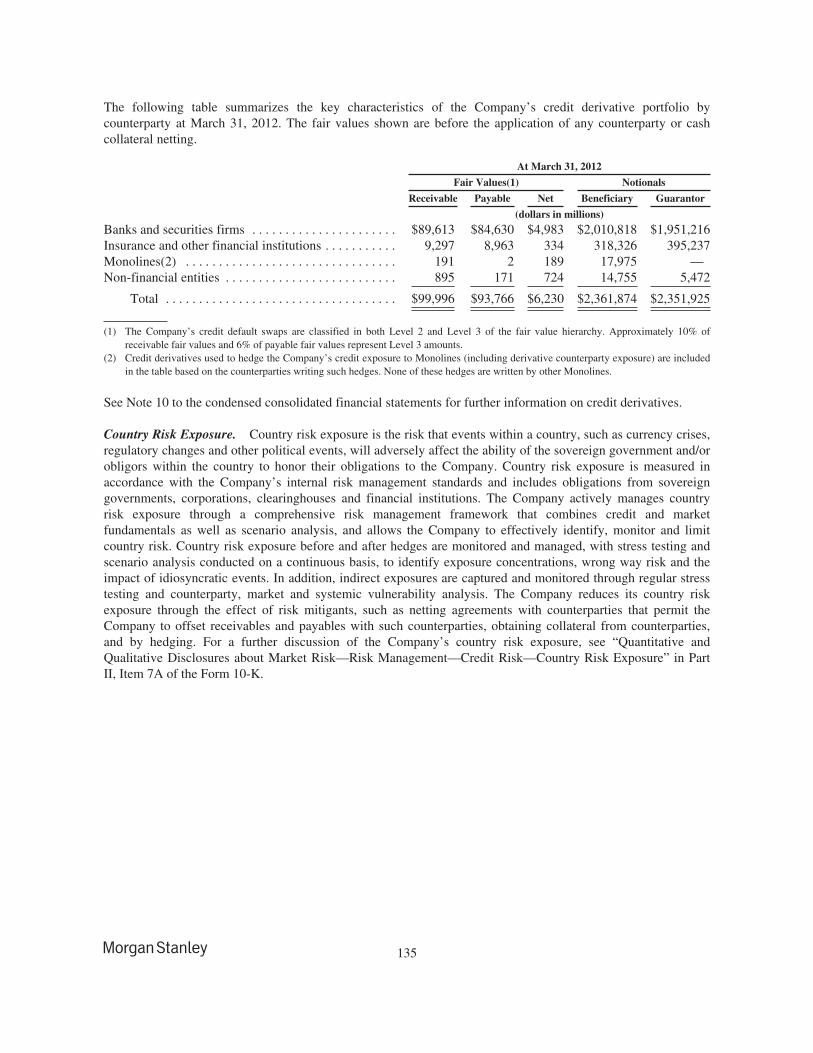
The following table summarizes the key characteristics of the Company’s credit derivative portfolio bycounterparty at March 31, 2012. The fair values shown are before the application of any counterparty or cashcollateral netting.
At March 31, 2012
Fair Values(1) Notionals
Receivable Payable Net Beneficiary Guarantor
(dollars in millions)
Banks and securities firms . . . . . . . . . . . . . . . . . . . . . . $89,613 $84,630 $4,983 $2,010,818 $1,951,216Insurance and other financial institutions . . . . . . . . . . . 9,297 8,963 334 318,326 395,237Monolines(2) . . . . . . . . . . . . . . . . . . . . . . . . . . . . . . . . 191 2 189 17,975 —Non-financial entities . . . . . . . . . . . . . . . . . . . . . . . . . . 895 171 724 14,755 5,472
Total . . . . . . . . . . . . . . . . . . . . . . . . . . . . . . . . . . . $99,996 $93,766 $6,230 $2,361,874 $2,351,925
(1) The Company’s credit default swaps are classified in both Level 2 and Level 3 of the fair value hierarchy. Approximately 10% ofreceivable fair values and 6% of payable fair values represent Level 3 amounts.
(2) Credit derivatives used to hedge the Company’s credit exposure to Monolines (including derivative counterparty exposure) are includedin the table based on the counterparties writing such hedges. None of these hedges are written by other Monolines.
See Note 10 to the condensed consolidated financial statements for further information on credit derivatives.
Country Risk Exposure. Country risk exposure is the risk that events within a country, such as currency crises,regulatory changes and other political events, will adversely affect the ability of the sovereign government and/orobligors within the country to honor their obligations to the Company. Country risk exposure is measured inaccordance with the Company’s internal risk management standards and includes obligations from sovereigngovernments, corporations, clearinghouses and financial institutions. The Company actively manages countryrisk exposure through a comprehensive risk management framework that combines credit and marketfundamentals as well as scenario analysis, and allows the Company to effectively identify, monitor and limitcountry risk. Country risk exposure before and after hedges are monitored and managed, with stress testing andscenario analysis conducted on a continuous basis, to identify exposure concentrations, wrong way risk and theimpact of idiosyncratic events. In addition, indirect exposures are captured and monitored through regular stresstesting and counterparty, market and systemic vulnerability analysis. The Company reduces its country riskexposure through the effect of risk mitigants, such as netting agreements with counterparties that permit theCompany to offset receivables and payables with such counterparties, obtaining collateral from counterparties,and by hedging. For a further discussion of the Company’s country risk exposure, see “Quantitative andQualitative Disclosures about Market Risk—Risk Management—Credit Risk—Country Risk Exposure” in PartII, Item 7A of the Form 10-K.
135
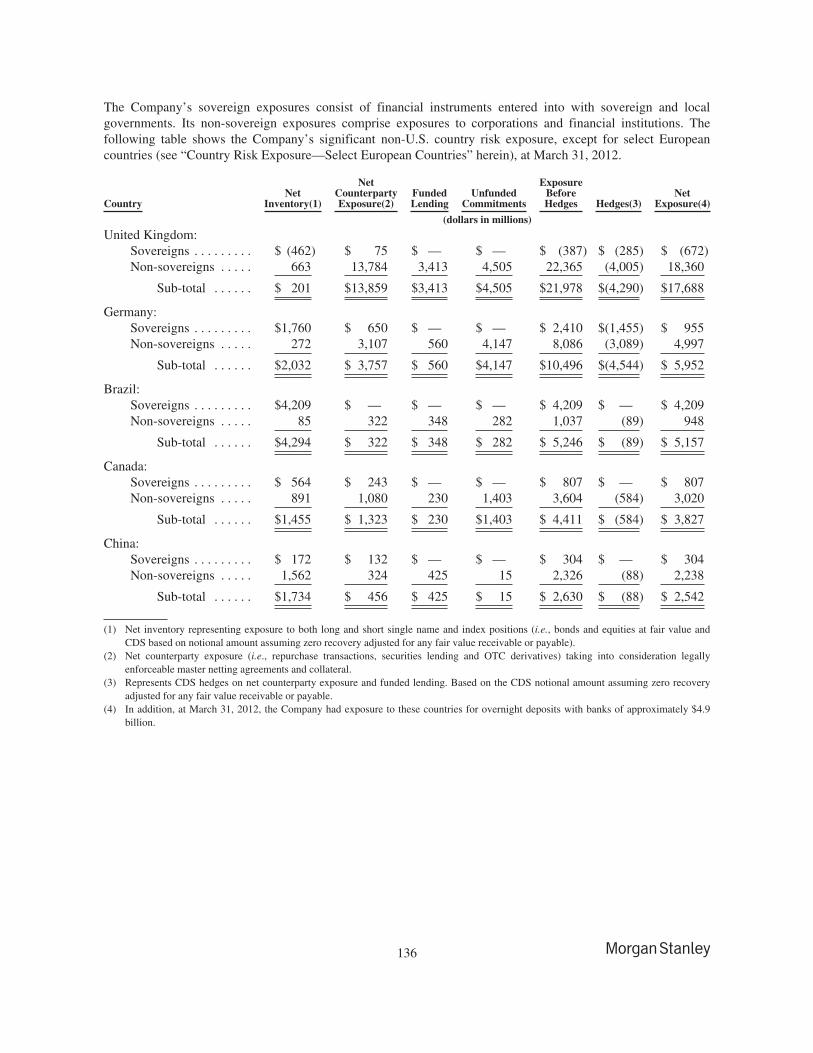
The Company’s sovereign exposures consist of financial instruments entered into with sovereign and localgovernments. Its non-sovereign exposures comprise exposures to corporations and financial institutions. Thefollowing table shows the Company’s significant non-U.S. country risk exposure, except for select Europeancountries (see “Country Risk Exposure—Select European Countries” herein), at March 31, 2012.
CountryNet
Inventory(1)
NetCounterpartyExposure(2)
FundedLending
UnfundedCommitments
ExposureBeforeHedges Hedges(3)
NetExposure(4)
(dollars in millions)
United Kingdom:Sovereigns . . . . . . . . . $ (462) $ 75 $ — $ — $ (387) $ (285) $ (672)Non-sovereigns . . . . . 663 13,784 3,413 4,505 22,365 (4,005) 18,360
Sub-total . . . . . . $ 201 $13,859 $3,413 $4,505 $21,978 $(4,290) $17,688
Germany:Sovereigns . . . . . . . . . $1,760 $ 650 $ — $ — $ 2,410 $(1,455) $ 955Non-sovereigns . . . . . 272 3,107 560 4,147 8,086 (3,089) 4,997
Sub-total . . . . . . $2,032 $ 3,757 $ 560 $4,147 $10,496 $(4,544) $ 5,952
Brazil:Sovereigns . . . . . . . . . $4,209 $ — $ — $ — $ 4,209 $ — $ 4,209Non-sovereigns . . . . . 85 322 348 282 1,037 (89) 948
Sub-total . . . . . . $4,294 $ 322 $ 348 $ 282 $ 5,246 $ (89) $ 5,157
Canada:Sovereigns . . . . . . . . . $ 564 $ 243 $ — $ — $ 807 $ — $ 807Non-sovereigns . . . . . 891 1,080 230 1,403 3,604 (584) 3,020
Sub-total . . . . . . $1,455 $ 1,323 $ 230 $1,403 $ 4,411 $ (584) $ 3,827
China:Sovereigns . . . . . . . . . $ 172 $ 132 $ — $ — $ 304 $ — $ 304Non-sovereigns . . . . . 1,562 324 425 15 2,326 (88) 2,238
Sub-total . . . . . . $1,734 $ 456 $ 425 $ 15 $ 2,630 $ (88) $ 2,542
(1) Net inventory representing exposure to both long and short single name and index positions (i.e., bonds and equities at fair value andCDS based on notional amount assuming zero recovery adjusted for any fair value receivable or payable).
(2) Net counterparty exposure (i.e., repurchase transactions, securities lending and OTC derivatives) taking into consideration legallyenforceable master netting agreements and collateral.
(3) Represents CDS hedges on net counterparty exposure and funded lending. Based on the CDS notional amount assuming zero recoveryadjusted for any fair value receivable or payable.
(4) In addition, at March 31, 2012, the Company had exposure to these countries for overnight deposits with banks of approximately $4.9billion.
136
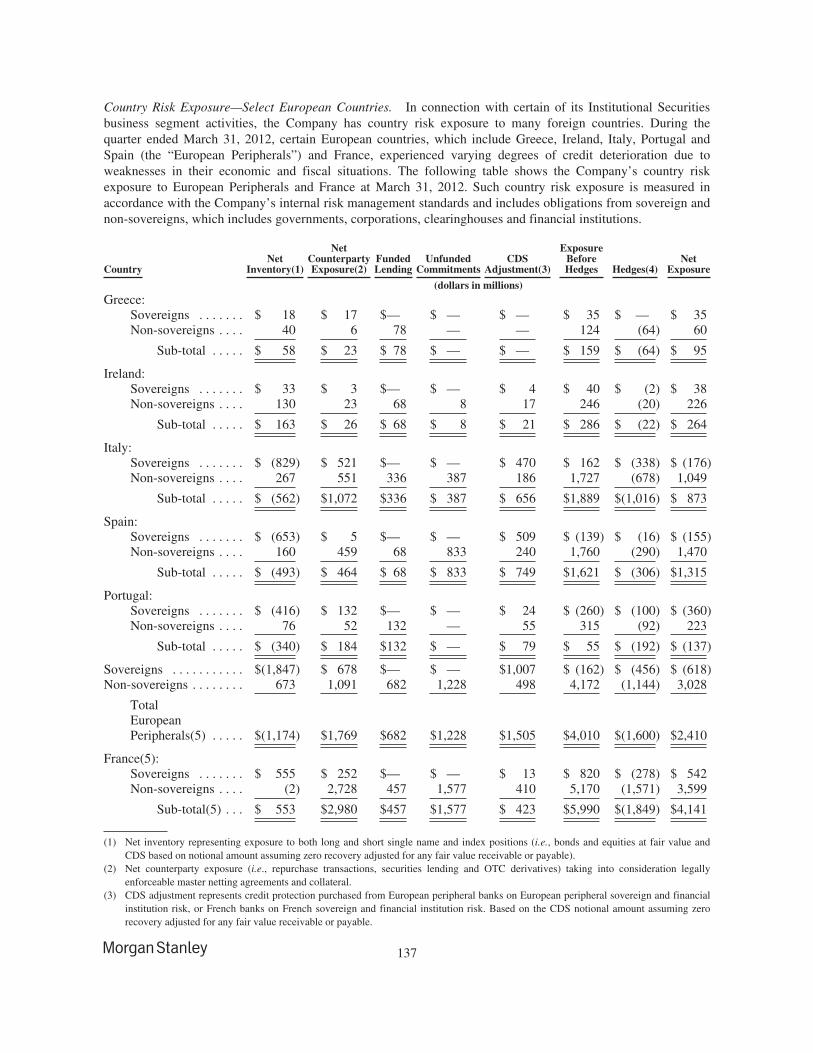
Country Risk Exposure—Select European Countries. In connection with certain of its Institutional Securitiesbusiness segment activities, the Company has country risk exposure to many foreign countries. During thequarter ended March 31, 2012, certain European countries, which include Greece, Ireland, Italy, Portugal andSpain (the “European Peripherals”) and France, experienced varying degrees of credit deterioration due toweaknesses in their economic and fiscal situations. The following table shows the Company’s country riskexposure to European Peripherals and France at March 31, 2012. Such country risk exposure is measured inaccordance with the Company’s internal risk management standards and includes obligations from sovereign andnon-sovereigns, which includes governments, corporations, clearinghouses and financial institutions.
CountryNet
Inventory(1)
NetCounterpartyExposure(2)
FundedLending
UnfundedCommitments
CDSAdjustment(3)
ExposureBeforeHedges Hedges(4)
NetExposure
(dollars in millions)Greece:
Sovereigns . . . . . . . $ 18 $ 17 $— $ — $ — $ 35 $ — $ 35Non-sovereigns . . . . 40 6 78 — — 124 (64) 60
Sub-total . . . . . $ 58 $ 23 $ 78 $ — $ — $ 159 $ (64) $ 95
Ireland:Sovereigns . . . . . . . $ 33 $ 3 $— $ — $ 4 $ 40 $ (2) $ 38Non-sovereigns . . . . 130 23 68 8 17 246 (20) 226
Sub-total . . . . . $ 163 $ 26 $ 68 $ 8 $ 21 $ 286 $ (22) $ 264
Italy:Sovereigns . . . . . . . $ (829) $ 521 $— $ — $ 470 $ 162 $ (338) $ (176)Non-sovereigns . . . . 267 551 336 387 186 1,727 (678) 1,049
Sub-total . . . . . $ (562) $1,072 $336 $ 387 $ 656 $1,889 $(1,016) $ 873
Spain:Sovereigns . . . . . . . $ (653) $ 5 $— $ — $ 509 $ (139) $ (16) $ (155)Non-sovereigns . . . . 160 459 68 833 240 1,760 (290) 1,470
Sub-total . . . . . $ (493) $ 464 $ 68 $ 833 $ 749 $1,621 $ (306) $1,315
Portugal:Sovereigns . . . . . . . $ (416) $ 132 $— $ — $ 24 $ (260) $ (100) $ (360)Non-sovereigns . . . . 76 52 132 — 55 315 (92) 223
Sub-total . . . . . $ (340) $ 184 $132 $ — $ 79 $ 55 $ (192) $ (137)
Sovereigns . . . . . . . . . . . $(1,847) $ 678 $— $ — $1,007 $ (162) $ (456) $ (618)Non-sovereigns . . . . . . . . 673 1,091 682 1,228 498 4,172 (1,144) 3,028
TotalEuropeanPeripherals(5) . . . . . $(1,174) $1,769 $682 $1,228 $1,505 $4,010 $(1,600) $2,410
France(5):Sovereigns . . . . . . . $ 555 $ 252 $— $ — $ 13 $ 820 $ (278) $ 542Non-sovereigns . . . . (2) 2,728 457 1,577 410 5,170 (1,571) 3,599
Sub-total(5) . . . $ 553 $2,980 $457 $1,577 $ 423 $5,990 $(1,849) $4,141
(1) Net inventory representing exposure to both long and short single name and index positions (i.e., bonds and equities at fair value andCDS based on notional amount assuming zero recovery adjusted for any fair value receivable or payable).
(2) Net counterparty exposure (i.e., repurchase transactions, securities lending and OTC derivatives) taking into consideration legallyenforceable master netting agreements and collateral.
(3) CDS adjustment represents credit protection purchased from European peripheral banks on European peripheral sovereign and financialinstitution risk, or French banks on French sovereign and financial institution risk. Based on the CDS notional amount assuming zerorecovery adjusted for any fair value receivable or payable.
137
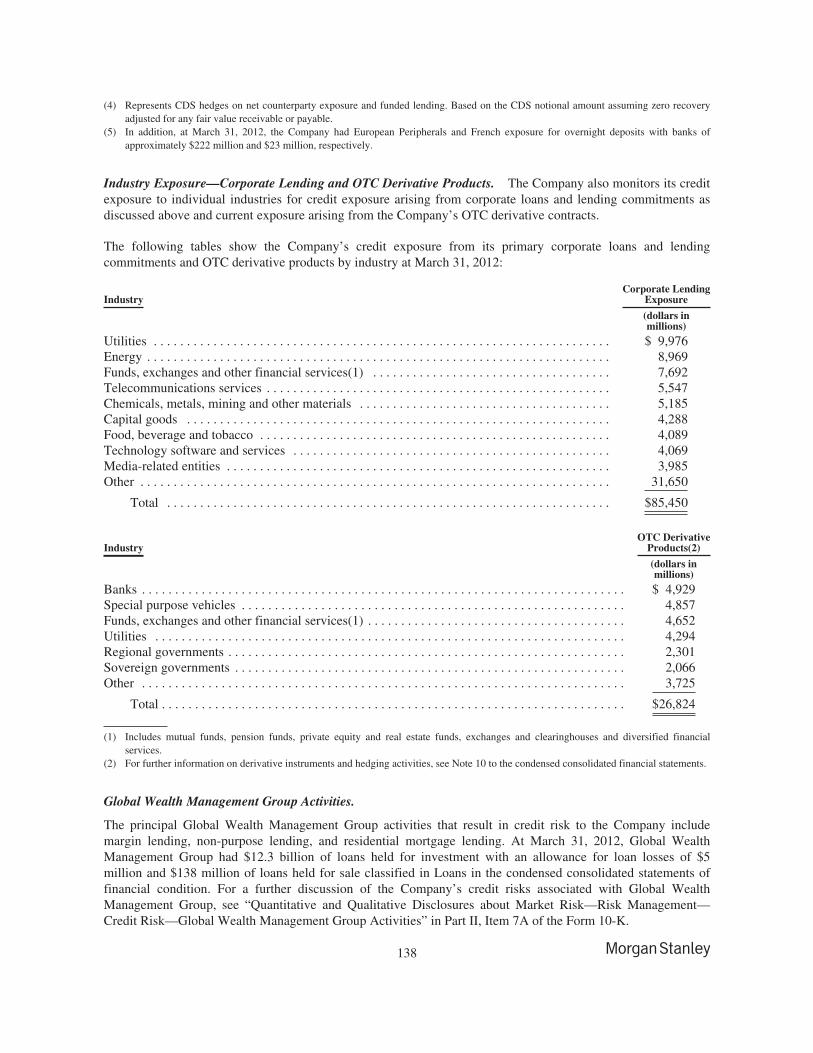
(4) Represents CDS hedges on net counterparty exposure and funded lending. Based on the CDS notional amount assuming zero recoveryadjusted for any fair value receivable or payable.
(5) In addition, at March 31, 2012, the Company had European Peripherals and French exposure for overnight deposits with banks ofapproximately $222 million and $23 million, respectively.
Industry Exposure—Corporate Lending and OTC Derivative Products. The Company also monitors its creditexposure to individual industries for credit exposure arising from corporate loans and lending commitments asdiscussed above and current exposure arising from the Company’s OTC derivative contracts.
The following tables show the Company’s credit exposure from its primary corporate loans and lendingcommitments and OTC derivative products by industry at March 31, 2012:
IndustryCorporate Lending
Exposure
(dollars inmillions)
Utilities . . . . . . . . . . . . . . . . . . . . . . . . . . . . . . . . . . . . . . . . . . . . . . . . . . . . . . . . . . . . . . . . . . . . . $ 9,976Energy . . . . . . . . . . . . . . . . . . . . . . . . . . . . . . . . . . . . . . . . . . . . . . . . . . . . . . . . . . . . . . . . . . . . . . 8,969Funds, exchanges and other financial services(1) . . . . . . . . . . . . . . . . . . . . . . . . . . . . . . . . . . . . 7,692Telecommunications services . . . . . . . . . . . . . . . . . . . . . . . . . . . . . . . . . . . . . . . . . . . . . . . . . . . . 5,547Chemicals, metals, mining and other materials . . . . . . . . . . . . . . . . . . . . . . . . . . . . . . . . . . . . . . 5,185Capital goods . . . . . . . . . . . . . . . . . . . . . . . . . . . . . . . . . . . . . . . . . . . . . . . . . . . . . . . . . . . . . . . . 4,288Food, beverage and tobacco . . . . . . . . . . . . . . . . . . . . . . . . . . . . . . . . . . . . . . . . . . . . . . . . . . . . . 4,089Technology software and services . . . . . . . . . . . . . . . . . . . . . . . . . . . . . . . . . . . . . . . . . . . . . . . . 4,069Media-related entities . . . . . . . . . . . . . . . . . . . . . . . . . . . . . . . . . . . . . . . . . . . . . . . . . . . . . . . . . . 3,985Other . . . . . . . . . . . . . . . . . . . . . . . . . . . . . . . . . . . . . . . . . . . . . . . . . . . . . . . . . . . . . . . . . . . . . . . 31,650
Total . . . . . . . . . . . . . . . . . . . . . . . . . . . . . . . . . . . . . . . . . . . . . . . . . . . . . . . . . . . . . . . . . . . $85,450
IndustryOTC Derivative
Products(2)
(dollars inmillions)
Banks . . . . . . . . . . . . . . . . . . . . . . . . . . . . . . . . . . . . . . . . . . . . . . . . . . . . . . . . . . . . . . . . . . . . . . . . . $ 4,929Special purpose vehicles . . . . . . . . . . . . . . . . . . . . . . . . . . . . . . . . . . . . . . . . . . . . . . . . . . . . . . . . . . 4,857Funds, exchanges and other financial services(1) . . . . . . . . . . . . . . . . . . . . . . . . . . . . . . . . . . . . . . . 4,652Utilities . . . . . . . . . . . . . . . . . . . . . . . . . . . . . . . . . . . . . . . . . . . . . . . . . . . . . . . . . . . . . . . . . . . . . . . 4,294Regional governments . . . . . . . . . . . . . . . . . . . . . . . . . . . . . . . . . . . . . . . . . . . . . . . . . . . . . . . . . . . . 2,301Sovereign governments . . . . . . . . . . . . . . . . . . . . . . . . . . . . . . . . . . . . . . . . . . . . . . . . . . . . . . . . . . . 2,066Other . . . . . . . . . . . . . . . . . . . . . . . . . . . . . . . . . . . . . . . . . . . . . . . . . . . . . . . . . . . . . . . . . . . . . . . . . 3,725
Total . . . . . . . . . . . . . . . . . . . . . . . . . . . . . . . . . . . . . . . . . . . . . . . . . . . . . . . . . . . . . . . . . . . . . . $26,824
(1) Includes mutual funds, pension funds, private equity and real estate funds, exchanges and clearinghouses and diversified financialservices.
(2) For further information on derivative instruments and hedging activities, see Note 10 to the condensed consolidated financial statements.
Global Wealth Management Group Activities.
The principal Global Wealth Management Group activities that result in credit risk to the Company includemargin lending, non-purpose lending, and residential mortgage lending. At March 31, 2012, Global WealthManagement Group had $12.3 billion of loans held for investment with an allowance for loan losses of $5million and $138 million of loans held for sale classified in Loans in the condensed consolidated statements offinancial condition. For a further discussion of the Company’s credit risks associated with Global WealthManagement Group, see “Quantitative and Qualitative Disclosures about Market Risk—Risk Management—Credit Risk—Global Wealth Management Group Activities” in Part II, Item 7A of the Form 10-K.
138
Item 4. Controls and Procedures.
Under the supervision and with the participation of the Company’s management, including our Chief ExecutiveOfficer and Chief Financial Officer, we conducted an evaluation of the effectiveness of the Company’sdisclosure controls and procedures (as defined in Rule 13a-15(e) of the Securities Exchange Act of 1934, asamended (the “Exchange Act”)). Based on this evaluation, our Chief Executive Officer and Chief FinancialOfficer concluded that our disclosure controls and procedures were effective as of the end of the period coveredby this report.
No change in the Company’s internal control over financial reporting (as defined in Rule 13a-15(f) of theExchange Act) occurred during the period covered by this report that materially affected, or is reasonably likelyto materially affect, the Company’s internal control over financial reporting.
139
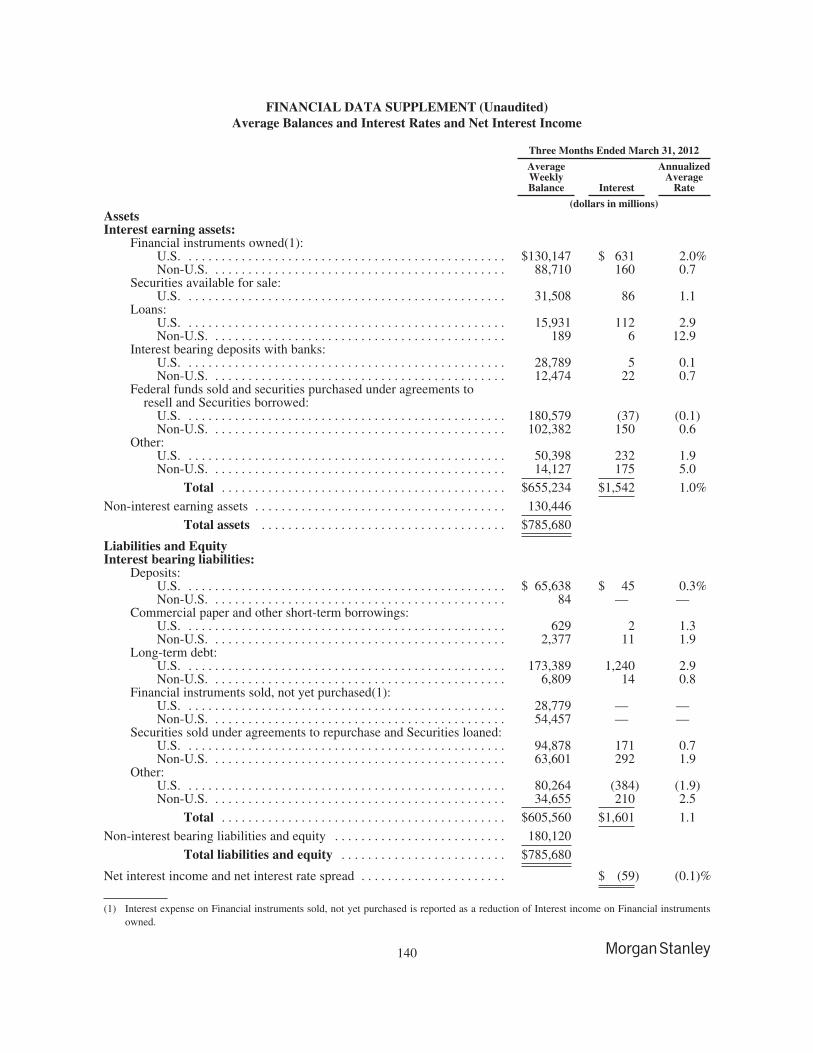
FINANCIAL DATA SUPPLEMENT (Unaudited)Average Balances and Interest Rates and Net Interest Income
Three Months Ended March 31, 2012
AverageWeeklyBalance Interest
AnnualizedAverage
Rate
(dollars in millions)AssetsInterest earning assets:
Financial instruments owned(1):U.S. . . . . . . . . . . . . . . . . . . . . . . . . . . . . . . . . . . . . . . . . . . . . . . . . $130,147 $ 631 2.0%Non-U.S. . . . . . . . . . . . . . . . . . . . . . . . . . . . . . . . . . . . . . . . . . . . . 88,710 160 0.7
Securities available for sale:U.S. . . . . . . . . . . . . . . . . . . . . . . . . . . . . . . . . . . . . . . . . . . . . . . . . 31,508 86 1.1
Loans:U.S. . . . . . . . . . . . . . . . . . . . . . . . . . . . . . . . . . . . . . . . . . . . . . . . . 15,931 112 2.9Non-U.S. . . . . . . . . . . . . . . . . . . . . . . . . . . . . . . . . . . . . . . . . . . . . 189 6 12.9
Interest bearing deposits with banks:U.S. . . . . . . . . . . . . . . . . . . . . . . . . . . . . . . . . . . . . . . . . . . . . . . . . 28,789 5 0.1Non-U.S. . . . . . . . . . . . . . . . . . . . . . . . . . . . . . . . . . . . . . . . . . . . . 12,474 22 0.7
Federal funds sold and securities purchased under agreements toresell and Securities borrowed:
U.S. . . . . . . . . . . . . . . . . . . . . . . . . . . . . . . . . . . . . . . . . . . . . . . . . 180,579 (37) (0.1)Non-U.S. . . . . . . . . . . . . . . . . . . . . . . . . . . . . . . . . . . . . . . . . . . . . 102,382 150 0.6
Other:U.S. . . . . . . . . . . . . . . . . . . . . . . . . . . . . . . . . . . . . . . . . . . . . . . . . 50,398 232 1.9Non-U.S. . . . . . . . . . . . . . . . . . . . . . . . . . . . . . . . . . . . . . . . . . . . . 14,127 175 5.0
Total . . . . . . . . . . . . . . . . . . . . . . . . . . . . . . . . . . . . . . . . . . . $655,234 $1,542 1.0%
Non-interest earning assets . . . . . . . . . . . . . . . . . . . . . . . . . . . . . . . . . . . . . . 130,446
Total assets . . . . . . . . . . . . . . . . . . . . . . . . . . . . . . . . . . . . . $785,680
Liabilities and EquityInterest bearing liabilities:
Deposits:U.S. . . . . . . . . . . . . . . . . . . . . . . . . . . . . . . . . . . . . . . . . . . . . . . . . $ 65,638 $ 45 0.3%Non-U.S. . . . . . . . . . . . . . . . . . . . . . . . . . . . . . . . . . . . . . . . . . . . . 84 — —
Commercial paper and other short-term borrowings:U.S. . . . . . . . . . . . . . . . . . . . . . . . . . . . . . . . . . . . . . . . . . . . . . . . . 629 2 1.3Non-U.S. . . . . . . . . . . . . . . . . . . . . . . . . . . . . . . . . . . . . . . . . . . . . 2,377 11 1.9
Long-term debt:U.S. . . . . . . . . . . . . . . . . . . . . . . . . . . . . . . . . . . . . . . . . . . . . . . . . 173,389 1,240 2.9Non-U.S. . . . . . . . . . . . . . . . . . . . . . . . . . . . . . . . . . . . . . . . . . . . . 6,809 14 0.8
Financial instruments sold, not yet purchased(1):U.S. . . . . . . . . . . . . . . . . . . . . . . . . . . . . . . . . . . . . . . . . . . . . . . . . 28,779 — —Non-U.S. . . . . . . . . . . . . . . . . . . . . . . . . . . . . . . . . . . . . . . . . . . . . 54,457 — —
Securities sold under agreements to repurchase and Securities loaned:U.S. . . . . . . . . . . . . . . . . . . . . . . . . . . . . . . . . . . . . . . . . . . . . . . . . 94,878 171 0.7Non-U.S. . . . . . . . . . . . . . . . . . . . . . . . . . . . . . . . . . . . . . . . . . . . . 63,601 292 1.9
Other:U.S. . . . . . . . . . . . . . . . . . . . . . . . . . . . . . . . . . . . . . . . . . . . . . . . . 80,264 (384) (1.9)Non-U.S. . . . . . . . . . . . . . . . . . . . . . . . . . . . . . . . . . . . . . . . . . . . . 34,655 210 2.5
Total . . . . . . . . . . . . . . . . . . . . . . . . . . . . . . . . . . . . . . . . . . . $605,560 $1,601 1.1
Non-interest bearing liabilities and equity . . . . . . . . . . . . . . . . . . . . . . . . . . 180,120
Total liabilities and equity . . . . . . . . . . . . . . . . . . . . . . . . . $785,680
Net interest income and net interest rate spread . . . . . . . . . . . . . . . . . . . . . . $ (59) (0.1)%
(1) Interest expense on Financial instruments sold, not yet purchased is reported as a reduction of Interest income on Financial instrumentsowned.
140
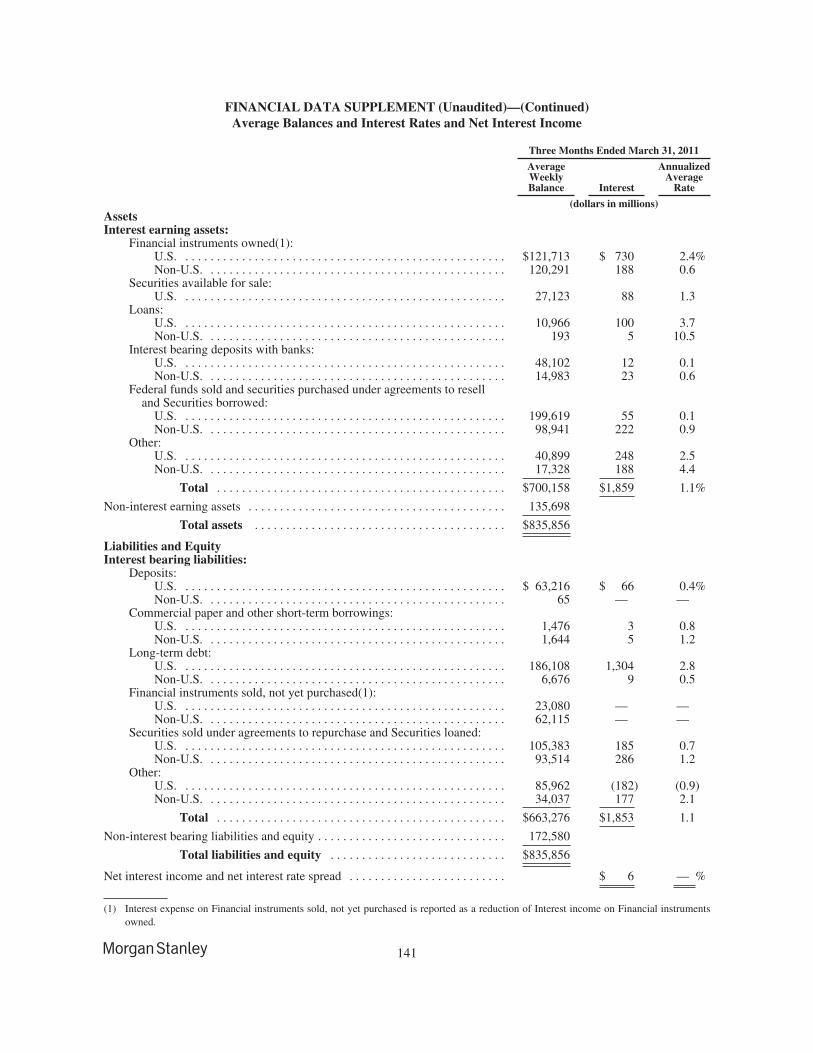
FINANCIAL DATA SUPPLEMENT (Unaudited)—(Continued)Average Balances and Interest Rates and Net Interest Income
Three Months Ended March 31, 2011
AverageWeeklyBalance Interest
AnnualizedAverage
Rate
(dollars in millions)AssetsInterest earning assets:
Financial instruments owned(1):U.S. . . . . . . . . . . . . . . . . . . . . . . . . . . . . . . . . . . . . . . . . . . . . . . . . . . . $121,713 $ 730 2.4%Non-U.S. . . . . . . . . . . . . . . . . . . . . . . . . . . . . . . . . . . . . . . . . . . . . . . . 120,291 188 0.6
Securities available for sale:U.S. . . . . . . . . . . . . . . . . . . . . . . . . . . . . . . . . . . . . . . . . . . . . . . . . . . . 27,123 88 1.3
Loans:U.S. . . . . . . . . . . . . . . . . . . . . . . . . . . . . . . . . . . . . . . . . . . . . . . . . . . . 10,966 100 3.7Non-U.S. . . . . . . . . . . . . . . . . . . . . . . . . . . . . . . . . . . . . . . . . . . . . . . . 193 5 10.5
Interest bearing deposits with banks:U.S. . . . . . . . . . . . . . . . . . . . . . . . . . . . . . . . . . . . . . . . . . . . . . . . . . . . 48,102 12 0.1Non-U.S. . . . . . . . . . . . . . . . . . . . . . . . . . . . . . . . . . . . . . . . . . . . . . . . 14,983 23 0.6
Federal funds sold and securities purchased under agreements to reselland Securities borrowed:
U.S. . . . . . . . . . . . . . . . . . . . . . . . . . . . . . . . . . . . . . . . . . . . . . . . . . . . 199,619 55 0.1Non-U.S. . . . . . . . . . . . . . . . . . . . . . . . . . . . . . . . . . . . . . . . . . . . . . . . 98,941 222 0.9
Other:U.S. . . . . . . . . . . . . . . . . . . . . . . . . . . . . . . . . . . . . . . . . . . . . . . . . . . . 40,899 248 2.5Non-U.S. . . . . . . . . . . . . . . . . . . . . . . . . . . . . . . . . . . . . . . . . . . . . . . . 17,328 188 4.4
Total . . . . . . . . . . . . . . . . . . . . . . . . . . . . . . . . . . . . . . . . . . . . . . $700,158 $1,859 1.1%
Non-interest earning assets . . . . . . . . . . . . . . . . . . . . . . . . . . . . . . . . . . . . . . . . . 135,698
Total assets . . . . . . . . . . . . . . . . . . . . . . . . . . . . . . . . . . . . . . . . $835,856
Liabilities and EquityInterest bearing liabilities:
Deposits:U.S. . . . . . . . . . . . . . . . . . . . . . . . . . . . . . . . . . . . . . . . . . . . . . . . . . . . $ 63,216 $ 66 0.4%Non-U.S. . . . . . . . . . . . . . . . . . . . . . . . . . . . . . . . . . . . . . . . . . . . . . . . 65 — —
Commercial paper and other short-term borrowings:U.S. . . . . . . . . . . . . . . . . . . . . . . . . . . . . . . . . . . . . . . . . . . . . . . . . . . . 1,476 3 0.8Non-U.S. . . . . . . . . . . . . . . . . . . . . . . . . . . . . . . . . . . . . . . . . . . . . . . . 1,644 5 1.2
Long-term debt:U.S. . . . . . . . . . . . . . . . . . . . . . . . . . . . . . . . . . . . . . . . . . . . . . . . . . . . 186,108 1,304 2.8Non-U.S. . . . . . . . . . . . . . . . . . . . . . . . . . . . . . . . . . . . . . . . . . . . . . . . 6,676 9 0.5
Financial instruments sold, not yet purchased(1):U.S. . . . . . . . . . . . . . . . . . . . . . . . . . . . . . . . . . . . . . . . . . . . . . . . . . . . 23,080 — —Non-U.S. . . . . . . . . . . . . . . . . . . . . . . . . . . . . . . . . . . . . . . . . . . . . . . . 62,115 — —
Securities sold under agreements to repurchase and Securities loaned:U.S. . . . . . . . . . . . . . . . . . . . . . . . . . . . . . . . . . . . . . . . . . . . . . . . . . . . 105,383 185 0.7Non-U.S. . . . . . . . . . . . . . . . . . . . . . . . . . . . . . . . . . . . . . . . . . . . . . . . 93,514 286 1.2
Other:U.S. . . . . . . . . . . . . . . . . . . . . . . . . . . . . . . . . . . . . . . . . . . . . . . . . . . . 85,962 (182) (0.9)Non-U.S. . . . . . . . . . . . . . . . . . . . . . . . . . . . . . . . . . . . . . . . . . . . . . . . 34,037 177 2.1
Total . . . . . . . . . . . . . . . . . . . . . . . . . . . . . . . . . . . . . . . . . . . . . . $663,276 $1,853 1.1
Non-interest bearing liabilities and equity . . . . . . . . . . . . . . . . . . . . . . . . . . . . . . 172,580
Total liabilities and equity . . . . . . . . . . . . . . . . . . . . . . . . . . . . $835,856
Net interest income and net interest rate spread . . . . . . . . . . . . . . . . . . . . . . . . . $ 6 — %
(1) Interest expense on Financial instruments sold, not yet purchased is reported as a reduction of Interest income on Financial instrumentsowned.
141
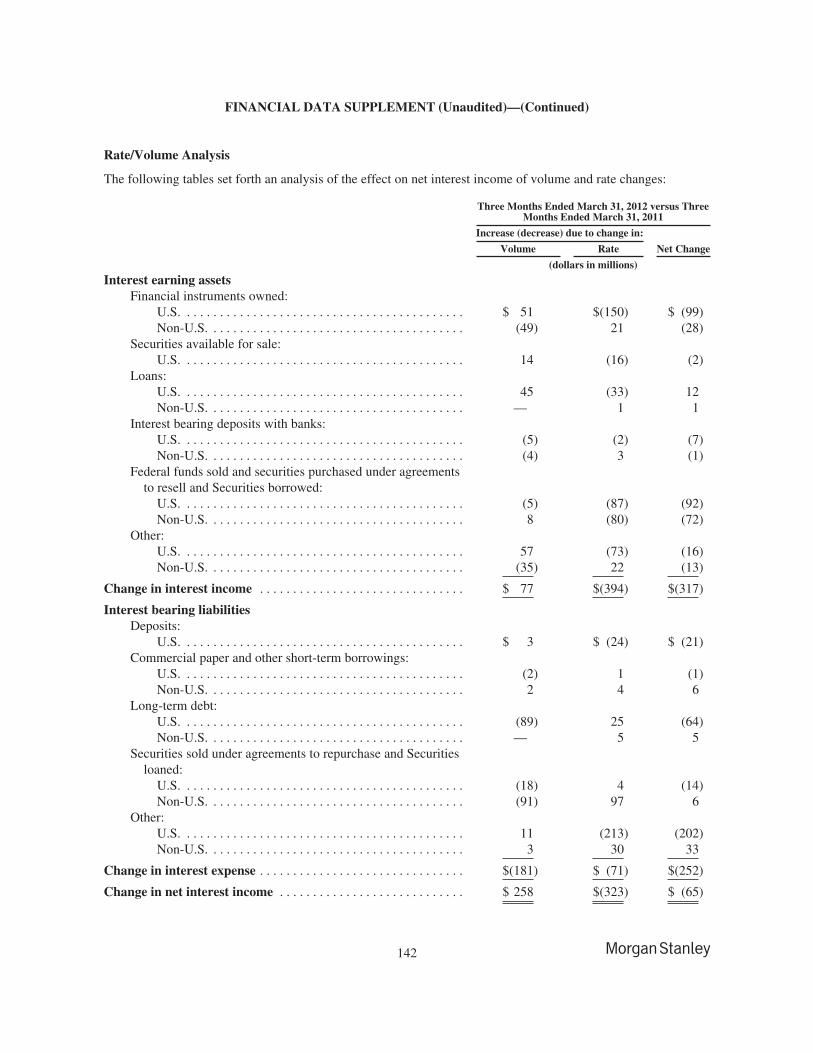
FINANCIAL DATA SUPPLEMENT (Unaudited)—(Continued)
Rate/Volume Analysis
The following tables set forth an analysis of the effect on net interest income of volume and rate changes:
Three Months Ended March 31, 2012 versus ThreeMonths Ended March 31, 2011
Increase (decrease) due to change in:
Volume Rate Net Change
(dollars in millions)
Interest earning assetsFinancial instruments owned:
U.S. . . . . . . . . . . . . . . . . . . . . . . . . . . . . . . . . . . . . . . . . . . $ 51 $(150) $ (99)Non-U.S. . . . . . . . . . . . . . . . . . . . . . . . . . . . . . . . . . . . . . . (49) 21 (28)
Securities available for sale:U.S. . . . . . . . . . . . . . . . . . . . . . . . . . . . . . . . . . . . . . . . . . . 14 (16) (2)
Loans:U.S. . . . . . . . . . . . . . . . . . . . . . . . . . . . . . . . . . . . . . . . . . . 45 (33) 12Non-U.S. . . . . . . . . . . . . . . . . . . . . . . . . . . . . . . . . . . . . . . — 1 1
Interest bearing deposits with banks:U.S. . . . . . . . . . . . . . . . . . . . . . . . . . . . . . . . . . . . . . . . . . . (5) (2) (7)Non-U.S. . . . . . . . . . . . . . . . . . . . . . . . . . . . . . . . . . . . . . . (4) 3 (1)
Federal funds sold and securities purchased under agreementsto resell and Securities borrowed:
U.S. . . . . . . . . . . . . . . . . . . . . . . . . . . . . . . . . . . . . . . . . . . (5) (87) (92)Non-U.S. . . . . . . . . . . . . . . . . . . . . . . . . . . . . . . . . . . . . . . 8 (80) (72)
Other:U.S. . . . . . . . . . . . . . . . . . . . . . . . . . . . . . . . . . . . . . . . . . . 57 (73) (16)Non-U.S. . . . . . . . . . . . . . . . . . . . . . . . . . . . . . . . . . . . . . . (35) 22 (13)
Change in interest income . . . . . . . . . . . . . . . . . . . . . . . . . . . . . . . $ 77 $(394) $(317)
Interest bearing liabilitiesDeposits:
U.S. . . . . . . . . . . . . . . . . . . . . . . . . . . . . . . . . . . . . . . . . . . $ 3 $ (24) $ (21)Commercial paper and other short-term borrowings:
U.S. . . . . . . . . . . . . . . . . . . . . . . . . . . . . . . . . . . . . . . . . . . (2) 1 (1)Non-U.S. . . . . . . . . . . . . . . . . . . . . . . . . . . . . . . . . . . . . . . 2 4 6
Long-term debt:U.S. . . . . . . . . . . . . . . . . . . . . . . . . . . . . . . . . . . . . . . . . . . (89) 25 (64)Non-U.S. . . . . . . . . . . . . . . . . . . . . . . . . . . . . . . . . . . . . . . — 5 5
Securities sold under agreements to repurchase and Securitiesloaned:
U.S. . . . . . . . . . . . . . . . . . . . . . . . . . . . . . . . . . . . . . . . . . . (18) 4 (14)Non-U.S. . . . . . . . . . . . . . . . . . . . . . . . . . . . . . . . . . . . . . . (91) 97 6
Other:U.S. . . . . . . . . . . . . . . . . . . . . . . . . . . . . . . . . . . . . . . . . . . 11 (213) (202)Non-U.S. . . . . . . . . . . . . . . . . . . . . . . . . . . . . . . . . . . . . . . 3 30 33
Change in interest expense . . . . . . . . . . . . . . . . . . . . . . . . . . . . . . . $(181) $ (71) $(252)
Change in net interest income . . . . . . . . . . . . . . . . . . . . . . . . . . . . $ 258 $(323) $ (65)
142
Part II—Other Information.
Item 1. Legal Proceedings.
In addition to the matters described in the Company’s Annual Report on Form 10-K for the year endedDecember 31, 2011 (the “Form 10-K”), and those described below, in the normal course of business, theCompany has been named, from time to time, as a defendant in various legal actions, including arbitrations, classactions and other litigation, arising in connection with its activities as a global diversified financial servicesinstitution. Certain of the actual or threatened legal actions include claims for substantial compensatory and/orpunitive damages or claims for indeterminate amounts of damages. In some cases, the entities that wouldotherwise be the primary defendants in such cases are bankrupt or in financial distress.
The Company is also involved, from time to time, in other reviews, investigations and proceedings (both formaland informal) by governmental and self-regulatory agencies regarding the Company’s business, including,among other matters, accounting and operational matters, certain of which may result in adverse judgments,settlements, fines, penalties, injunctions or other relief.
The Company contests liability and/or the amount of damages as appropriate in each pending matter. Whereavailable information indicates that it is probable a liability had been incurred at the date of the condensedconsolidated financial statements and the Company can reasonably estimate the amount of that loss, theCompany accrues the estimated loss by a charge to income.
In many proceedings, however, it is inherently difficult to determine whether any loss is probable or evenpossible or to estimate the amount of any loss. The Company cannot predict with certainty if, how or when suchproceedings will be resolved or what the eventual settlement, fine, penalty or other relief, if any, may be,particularly for proceedings that are in their early stages of development or where plaintiffs seek substantial orindeterminate damages. Numerous issues may need to be resolved, including through potentially lengthydiscovery and determination of important factual matters, determination of issues related to class certificationand the calculation of damages, and by addressing novel or unsettled legal questions relevant to the proceedingsin question, before a loss or additional loss or range of loss or additional loss can be reasonably estimated for anyproceeding. Subject to the foregoing, the Company believes, based on current knowledge and after consultationwith counsel, that the outcome of such proceedings will not have a material adverse effect on the consolidatedfinancial condition of the Company, although the outcome of such proceedings could be material to theCompany’s operating results and cash flows for a particular period depending on, among other things, the levelof the Company’s revenues or income for such period.
Over the last several years, the level of litigation and investigatory activity focused on residential mortgage andcredit crisis related matters has increased materially in the financial services industry. As a result, the Companyexpects that it may become the subject of increased claims for damages and other relief regarding residentialmortgages and related securities in the future and, while the Company has identified below certain proceedingsthat the Company believes to be material, individually or collectively, there can be no assurance that additionalmaterial losses will not be incurred from residential mortgage claims that have not yet been notified to theCompany or are not yet determined to be material.
The following developments have occurred with respect to certain matters previously reported in the Form 10-Kor concern new actions that have been filed since December 31, 2011:
Residential Mortgage and Credit Crisis Related Matters.
Class Actions.
On March 26, 2012, defendants filed a renewed motion to dismiss the complaint in In re Morgan Stanley ERISALitigation.
143
On April 24, 2012, the court presiding in In re Morgan Stanley Pass-Through Certificate Litigation denieddefendants’ motion for reconsideration of its denial-in-part of defendants’ motion to dismiss the second amendedcomplaint.
Other Litigation.
On February 29, 2012, U.S. Bank National Association, in its capacity as Trustee (“U.S. Bank”), filed asummons with notice on behalf of Morgan Stanley Mortgage Loan Trust 2006-4SL and Mortgage Pass-ThroughCertificates, Series 2006-4SL (together, the “Trust”) against the Company. The summons with notice is styledMorgan Stanley Mortgage Loan Trust 2006-4SL, et al. v. Morgan Stanley Mortgage Capital Inc. and is pendingin New York Supreme Court, New York County. The notice asserts claims for breach of contract and alleges,among other things, that the loans in the Trust, which had an original principal balance of approximately $303million, breached various representations and warranties. The notice seeks, among other relief, an order requiringthe Company to comply with the loan breach remedy procedures in the transaction documents, unspecifieddamages, and interest.
On March 5, 2012, the plaintiff in The Charles Schwab Corp. v. BNP Paribas Securities Corp., et al. filed asecond amended complaint. On April 10, 2012, the Company filed a demurrer to certain causes of action in theamended complaint.
On March 12, 2012, the court presiding in Cambridge Place Investment Management Inc. v. Morgan Stanley &Co., Inc. et al. denied defendants’ motion to dismiss with respect to plaintiff’s standing to bring suit. Defendantssought interlocutory appeal from that decision on April 11, 2012. On April 26, 2012, defendants filed a secondmotion to dismiss for failure to state a claim upon which relief can be granted.
On March 9, 2012, in Federal Home Loan Bank of Boston v. Ally Financial, Inc. F/K/A GMAC LLC et al., theUnited States District Court for the District of Massachusetts denied plaintiff’s motion to remand the case to statecourt.
On March 20, 2012, the Company filed answers to the complaints in both cases styled Federal Deposit InsuranceCorporation, as Receiver for Franklin Bank S.S.B v. Morgan Stanley & Company LLC F/K/A Morgan Stanley &Co. Inc., denying their allegations.
On April 25, 2012, The Prudential Insurance Company of America and certain affiliates filed a complaint againstthe Company and certain affiliates in the Superior Court of the State of New Jersey styled The PrudentialInsurance Company of America, et al. v. Morgan Stanley, et al. The complaint alleges that defendants madeuntrue statements and material omissions in connection with the sale to plaintiffs of certain mortgage passthrough certificates backed by securitization trusts containing residential mortgage loans. The total amount ofcertificates allegedly sponsored, underwritten and/or sold by the Company was approximately $1 billion. Thecomplaint raises claims under the New Jersey Uniform Securities Law, as well as common law claims ofnegligent misrepresentation, fraud and tortious interference with contract and seeks, among other things,compensatory damages, punitive damages, rescission and rescissionary damages associated with plaintiffs’purchases of such certificates.
On April 25, 2012, Metropolitan Life Insurance Company and certain affiliates filed a complaint against theCompany and certain affiliates in the Supreme Court of the State of New York styled Metropolitan LifeInsurance Company, et al. v. Morgan Stanley, et al. The complaint alleges that defendants made untruestatements and material omissions in the sale to plaintiffs of certain mortgage pass through certificates backed bysecuritization trusts containing residential mortgage loans. The total amount of certificates allegedly sponsored,underwritten and/or sold by the Company was approximately $757 million. The complaint raises common lawclaims of fraud, fraudulent inducement, aiding and abetting fraud and negligent misrepresentation and seeks,among other things, rescission, compensatory and/or rescissionary damages, as well as punitive damages,associated with plaintiffs’ purchases of such certificates.
144
On May 1, 2012, Asset Management Fund d/b/a AMF Funds and certain of its affiliated funds filed a summonswith notice against the Company in the Supreme Court of the State of New York, styled Asset Management Fundd/b/a AMF Funds et al v. Morgan Stanley et al. The notice alleges that defendants made materialmisrepresentations and omissions in the sale to plaintiffs of certain mortgage pass through certificates backed bysecuritization trusts containing residential mortgage loans. The total amount of certificates allegedly sponsored,underwritten and/or sold by the Company to plaintiffs was approximately $122 million. The notice identifiescauses of action against the Company for, among other things, common-law fraud, fraudulent inducement, aidingand abetting fraud, and negligent misrepresentation. The notice identifies the relief sought to include, amongother things, monetary damages, punitive damages and rescission.
Other Matters.
On April 2, 2012, the Company entered into a Consent Order (“Order”) with the Board of Governors of theFederal Reserve System (“Federal Reserve Board”) relating to the servicing of residential mortgage loans. Theterms of the Order are substantially similar and, in many respects, identical to the orders entered into with theFederal Reserve Board by other large U.S. financial institutions. The Order, which is available on the FederalReserve Board’s website, sets forth various allegations of improper conduct in servicing by Saxon, requires thatthe Company and its affiliates cease and desist such conduct, and requires that the Company, and its Board ofDirectors and affiliates, take various affirmative steps. The Order requires (i) the Company to engage anindependent third-party consultant to conduct a review of certain foreclosure actions or proceedings that occurredor were pending between January 1, 2009 and December 31, 2010; (ii) the adoption of policies and proceduresrelated to management of third parties used to outsource residential mortgage servicing, loss mitigation orforeclosure; (iii) a “validation report” from an independent third-party consultant regarding compliance with theOrder for the first year; and (iv) submission of quarterly progress reports as to compliance with the Order by theCompany’s the Board of Directors. The Order also provides that the Company will be responsible for thepayment of any civil money penalties or compensatory payments assessed by the Federal Reserve Board relatedto such alleged conduct, which penalties or payments have not yet been determined.
Shareholder Derivative Matter.
On March 22, 2012, the Appellate Division of the Supreme Court of the State of New York affirmed thedismissal of the complaint in Security, Police and Fire Professionals of America Retirement Fund, et al. v. JohnJ. Mack et al.
China Matter.
As disclosed in February 2009, the Company uncovered actions initiated by an employee based in China in anoverseas real estate subsidiary that appeared to have violated the Foreign Corrupt Practices Act. The Companyterminated the employee, reported the activity to appropriate authorities and cooperated with the investigationsby the United States Department of Justice (“DOJ”) and the United States Securities and Exchange Commission(“SEC”). On April 25, 2012, the DOJ announced that the former employee had pled guilty to certain criminalcharges, and the SEC announced that it had brought certain civil charges against the former employee, whichhave been settled. On the same day, the DOJ and SEC announced that they will not take any action against theCompany in connection with this matter.
145
Item 2. Unregistered Sales of Equity Securities and Use of Proceeds.
The table below sets forth the information with respect to purchases made by or on behalf of the Company of itscommon stock during the quarterly period ended March 31, 2012.
Issuer Purchases of Equity Securities(dollars in millions, except per share amounts)
Period
TotalNumber of
SharesPurchased
Average PricePaid Per
Share
Total Number ofShares PurchasedAs Part of PubliclyAnnounced Plansor Programs(C)
Approximate DollarValue of Sharesthat May Yet BePurchased Under
the Plans orPrograms
Month #1(January 1, 2012—January 31, 2012)
Share Repurchase Program(A) . . . . . . . . . . . . . — — — $1,560Employee Transactions(B) . . . . . . . . . . . . . . . . 9,735,096 $17.83 — —
Month #2(February 1, 2012—February 29, 2012)
Share Repurchase Program(A) . . . . . . . . . . . . . — — — $1,560Employee Transactions(B) . . . . . . . . . . . . . . . . 363,505 $19.69 — —
Month #3(March 1, 2012—March 31, 2012)
Share Repurchase Program(A) . . . . . . . . . . . . . — — — $1,560Employee Transactions(B) . . . . . . . . . . . . . . . . 96,101 $19.06 — —
Total
Share Repurchase Program(A) . . . . . . . . . . . . . — — — $1,560Employee Transactions(B) . . . . . . . . . . . . . . . . 10,194,702 $17.91 — —
(A) On December 19, 2006, the Company announced that its Board of Directors authorized the repurchase of up to $6 billion of theCompany’s outstanding stock under a share repurchase program (the “Share Repurchase Program”). The Share Repurchase Program is aprogram for capital management purposes that considers, among other things, business segment capital needs, as well as equity-basedcompensation and benefit plan requirements. The Share Repurchase Program has no set expiration or termination date. Share repurchasesby the Company are subject to regulatory approval.
(B) Includes: (1) shares delivered or attested in satisfaction of the exercise price and/or tax withholding obligations by holders of employeeand director stock options (granted under employee and director stock compensation plans) who exercised options; (2) shares withheld,delivered or attested (under the terms of grants under employee and director stock compensation plans) to offset tax withholdingobligations that occur upon vesting and release of restricted shares; (3) shares withheld, delivered and attested (under the terms of grantsunder employee and director stock compensation plans) to offset tax withholding obligations that occur upon the delivery of outstandingshares underlying restricted stock units, and (4) shares withheld, delivered and attested (under the terms of grants under employee anddirector stock compensation plans) to offset the cash payment for fractional shares. The Company’s employee and director stockcompensation plans provide that the value of the shares withheld, delivered or attested shall be valued using the fair market value of theCompany’s common stock on the date the relevant transaction occurs, using a valuation methodology established by the Company.
(C) Share purchases under publicly announced programs are made pursuant to open-market purchases, Rule 10b5-1 plans or privatelynegotiated transactions (including with employee benefit plans) as market conditions warrant and at prices the Company deemsappropriate.
Item 6. Exhibits.
An exhibit index has been filed as part of this Report on Page E-1.
146
SIGNATURE
Pursuant to the requirements of the Securities Exchange Act of 1934, the Registrant has duly caused thisreport to be signed on its behalf by the undersigned thereunto duly authorized.
MORGAN STANLEY(Registrant)
By: /s/ RUTH PORAT
Ruth PoratExecutive Vice President and
Chief Financial Officer
By: /s/ PAUL C. WIRTH
Paul C. WirthDeputy Chief Financial Officer
Date: May 7, 2012
147
EXHIBIT INDEX
MORGAN STANLEY
Quarter Ended March 31, 2012
Exhibit No. Description
10.1 Form of Award Certificate for Discretionary Retention Awards of Stock Units.
10.2 Form of Award Certificate for Discretionary Retention Awards under the Morgan StanleyCompensation Incentive Plan Deferred Bonus Program.
10.3 Form of Award Certificate for Performance Stock Units.
10.4 Memorandum to Colm Kelleher Regarding Repatriation to London.
10.5 Morgan Stanley U.S. Tax Equalization Program.
10.6 Amendment to Morgan Stanley 401(k) Savings Plan, dated as of February 28, 2012.
12 Statement Re: Computation of Ratio of Earnings to Fixed Charges and Computation of Earningsto Fixed Charges and Preferred Stock Dividends.
15 Letter of awareness from Deloitte & Touche LLP, dated May 7, 2012, concerning unauditedinterim financial information.
31.1 Rule 13a-14(a) Certification of Chief Executive Officer.
31.2 Rule 13a-14(a) Certification of Chief Financial Officer.
32.1 Section 1350 Certification of Chief Executive Officer.
32.2 Section 1350 Certification of Chief Financial Officer.
101 Interactive data files pursuant to Rule 405 of Regulation S-T: (i) the Condensed ConsolidatedStatements of Financial Condition—March 31, 2012 and December 31, 2011, (ii) the CondensedConsolidated Statements of Income—Three Months Ended March 31, 2012 and 2011, (iii) theCondensed Consolidated Statements of Comprehensive Income—Three Months Ended March 31,2012 and 2011, (iv) the Condensed Consolidated Statements of Cash Flows—Three MonthsEnded March 31, 2012 and 2011, (v) the Condensed Consolidated Statements of Changes in TotalEquity—Three Months Ended March 31, 2012 and 2011, and (vi) Notes to CondensedConsolidated Financial Statements (unaudited)
E-1
Related Documents