HR580 Reporting in Human Resources mySAP Human Resources Date Training Center Instructors Education Website Participant Handbook Course Version: 2006 Q2 Course Duration: 3 Day(s) Material Number: 50078273 An SAP course - use it to learn, reference it for work

Welcome message from author
This document is posted to help you gain knowledge. Please leave a comment to let me know what you think about it! Share it to your friends and learn new things together.
Transcript

HR580Reporting in Human Resources
mySAP Human Resources
Date
Training Center
Instructors
Education Website
Participant HandbookCourse Version: 2006 Q2Course Duration: 3 Day(s)Material Number: 50078273
An SAP course - use it to learn, reference it for work

Copyright
Copyright © 2006 SAP AG. All rights reserved.
No part of this publication may be reproduced or transmitted in any form or for any purposewithout the express permission of SAP AG. The information contained herein may be changedwithout prior notice.
Some software products marketed by SAP AG and its distributors contain proprietary softwarecomponents of other software vendors.
Trademarks
� Microsoft®, WINDOWS®, NT®, EXCEL®, Word®, PowerPoint® and SQL Server® areregistered trademarks of Microsoft Corporation.
� IBM®, DB2®, OS/2®, DB2/6000®, Parallel Sysplex®, MVS/ESA®, RS/6000®, AIX®,S/390®, AS/400®, OS/390®, and OS/400® are registered trademarks of IBM Corporation.
� ORACLE® is a registered trademark of ORACLE Corporation.� INFORMIX®-OnLine for SAP and INFORMIX® Dynamic ServerTM are registered
trademarks of Informix Software Incorporated.� UNIX®, X/Open®, OSF/1®, and Motif® are registered trademarks of the Open Group.� Citrix®, the Citrix logo, ICA®, Program Neighborhood®, MetaFrame®, WinFrame®,
VideoFrame®, MultiWin® and other Citrix product names referenced herein are trademarksof Citrix Systems, Inc.
� HTML, DHTML, XML, XHTML are trademarks or registered trademarks of W3C®, WorldWide Web Consortium, Massachusetts Institute of Technology.
� JAVA® is a registered trademark of Sun Microsystems, Inc.� JAVASCRIPT® is a registered trademark of Sun Microsystems, Inc., used under license for
technology invented and implemented by Netscape.� SAP, SAP Logo, R/2, RIVA, R/3, SAP ArchiveLink, SAP Business Workflow, WebFlow, SAP
EarlyWatch, BAPI, SAPPHIRE, Management Cockpit, mySAP.com Logo and mySAP.comare trademarks or registered trademarks of SAP AG in Germany and in several other countriesall over the world. All other products mentioned are trademarks or registered trademarks oftheir respective companies.
Disclaimer
THESE MATERIALS ARE PROVIDED BY SAP ON AN "AS IS" BASIS, AND SAP EXPRESSLYDISCLAIMS ANY AND ALL WARRANTIES, EXPRESS OR APPLIED, INCLUDINGWITHOUT LIMITATION WARRANTIES OF MERCHANTABILITY AND FITNESS FOR APARTICULAR PURPOSE, WITH RESPECT TO THESE MATERIALS AND THE SERVICE,INFORMATION, TEXT, GRAPHICS, LINKS, OR ANY OTHER MATERIALS AND PRODUCTSCONTAINED HEREIN. IN NO EVENT SHALL SAP BE LIABLE FOR ANY DIRECT,INDIRECT, SPECIAL, INCIDENTAL, CONSEQUENTIAL, OR PUNITIVE DAMAGES OF ANYKIND WHATSOEVER, INCLUDING WITHOUT LIMITATION LOST REVENUES OR LOSTPROFITS, WHICH MAY RESULT FROM THE USE OF THESE MATERIALS OR INCLUDEDSOFTWARE COMPONENTS.
g200611120134

About This HandbookThis handbook is intended to complement the instructor-led presentation of thiscourse, and serve as a source of reference. It is not suitable for self-study.
Typographic ConventionsAmerican English is the standard used in this handbook. The followingtypographic conventions are also used.
Type Style Description
Example text Words or characters that appear on the screen. Theseinclude field names, screen titles, pushbuttons as wellas menu names, paths, and options.
Also used for cross-references to other documentationboth internal (in this documentation) and external (inother locations, such as SAPNet).
Example text Emphasized words or phrases in body text, titles ofgraphics, and tables
EXAMPLE TEXT Names of elements in the system. These includereport names, program names, transaction codes, tablenames, and individual key words of a programminglanguage, when surrounded by body text, for exampleSELECT and INCLUDE.
Example text Screen output. This includes file and directory namesand their paths, messages, names of variables andparameters, and passages of the source text of aprogram.
Example text Exact user entry. These are words and characters thatyou enter in the system exactly as they appear in thedocumentation.
<Example text> Variable user entry. Pointed brackets indicate that youreplace these words and characters with appropriateentries.
2006/Q2 © 2006 SAP AG. All rights reserved. iii

About This Handbook HR580
Icons in Body TextThe following icons are used in this handbook.
Icon Meaning
For more information, tips, or background
Note or further explanation of previous point
Exception or caution
Procedures
Indicates that the item is displayed in the instructor'spresentation.
iv © 2006 SAP AG. All rights reserved. 2006/Q2

ContentsCourse Overview ..... . . . . . . . . . . . . . . . . . . . . . . . . . . . . . . . . . . . . . . . . . . . . . . . . . . . . vii
Course Goals .. . . . . . . . . . . . . . . . . . . . . . . . . . . . . . . . . . . . . . . . . . . . . . . . . . . . . . . . . .viiCourse Objectives ... . . . . . . . . . . . . . . . . . . . . . . . . . . . . . . . . . . . . . . . . . . . . . . . . . .vii
Unit 1: HCM Reporting Overview..... . . . . . . . . . . . . . . . . . . . . . . . . . . . . . . . . . . 1Essentials of Reporting ... . . . . . . . . . . . . . . . . . . . . . . . . . . . . . . . . . . . . . . . . . . . . .2Overview of Reporting Tools... . . . . . . . . . . . . . . . . . . . . . . . . . . . . . . . . . . . . . . . .9
Unit 2: Human Resources Information System (HIS).... . . . . . . . . 23Initial HIS Access and Working with HIS... . . . . . . . . . . . . . . . . . . . . . . . . 24Customizing HIS ... . . . . . . . . . . . . . . . . . . . . . . . . . . . . . . . . . . . . . . . . . . . . . . . . . . . 38
Unit 3: Manager�s Desktop (MDT) and Manager Self-Service(MSS)..... . . . . . . . . . . . . . . . . . . . . . . . . . . . . . . . . . . . . . . . . . . . . . . . . . . . . . . . . . . . . . . . . . . . 47
Manager�s Desktop (MDT)... . . . . . . . . . . . . . . . . . . . . . . . . . . . . . . . . . . . . . . . . 48Manager Self-Service (MSS) .. . . . . . . . . . . . . . . . . . . . . . . . . . . . . . . . . . . . . . . 61
Unit 4: Info Systems in the SAP Easy Access Menu ..... . . . . . . . 73Info Systems in the SAP Easy Access Menu ... . . . . . . . . . . . . . . . . . . 74
Unit 5: Logical Databases and InfoSets ..... . . . . . . . . . . . . . . . . . . . . . . . 89Logical Databases, InfoSets, and User Groups... . . . . . . . . . . . . . . . . 90Creating and Changing InfoSets .. . . . . . . . . . . . . . . . . . . . . . . . . . . . . . . . . .104
Unit 6: Ad Hoc Query ..... . . . . . . . . . . . . . . . . . . . . . . . . . . . . . . . . . . . . . . . . . . . . . 131Defining First Queries with Ad Hoc Query ... . . . . . . . . . . . . . . . . . . . .132Defining Complex Queries with Ad Hoc Query ... . . . . . . . . . . . . . . .149
Unit 7: SAP Query ..... . . . . . . . . . . . . . . . . . . . . . . . . . . . . . . . . . . . . . . . . . . . . . . . . . 177Defining Queries with SAP Query .. . . . . . . . . . . . . . . . . . . . . . . . . . . . . . . .178
Unit 8: Payroll and Time Management Infotypes ..... . . . . . . . . . . . 201Payroll Infotypes ... . . . . . . . . . . . . . . . . . . . . . . . . . . . . . . . . . . . . . . . . . . . . . . . . . .202Simulated infotypes in Time Management.. . . . . . . . . . . . . . . . . . . . . . .216
Unit 9: Appendix: HCM in BW and SEM ...... . . . . . . . . . . . . . . . . . . . . . 223Overview of HCM in the Business Information Warehouse(BW)... . . . . . . . . . . . . . . . . . . . . . . . . . . . . . . . . . . . . . . . . . . . . . . . . . . . . . . . . . . . . .224
2006/Q2 © 2006 SAP AG. All rights reserved. v

Contents HR580
Overview of HCM in Strategic Enterprise Management (SEM) 239
Appendix 1: Appendices ..... . . . . . . . . . . . . . . . . . . . . . . . . . . . . . . . . . . . . . . 249
vi © 2006 SAP AG. All rights reserved. 2006/Q2

Course OverviewThis course deals with the reporting tools used in HR. This includes the Ad HocQuery and SAP Query, as well as the Information Systems.
The information in the course is based on the following SAP software componentsand releases:
� SAP ERP Central Component 6.0� BW 3.5
Target AudienceThis course is intended for the following audiences:
� Project team members� Employees in the Human Resources department
Course PrerequisitesRequired Knowledge
� SAPHR� HR050 (or HR100 and HR120)� HR305 or HR306 or HR505
Recommended Knowledge
� HR110
Course GoalsThis course will prepare you to:
� Decide which reporting tool to use to meet which requirements� Execute existing standard reports and queries� Change and create reports using Ad Hoc Query and SAP Query� Execute queries from the Business Information Warehouse
Course ObjectivesAfter completing this course, you will be able to:
� Handle a variety of reporting tools� Perform reporting in different systems
2006/Q2 © 2006 SAP AG. All rights reserved. vii

Course Overview HR580
SAP Software Component InformationThe information in this course pertains to the following SAP Software Componentsand releases:
� R/3 4.7
viii © 2006 SAP AG. All rights reserved. 2006/Q2

Unit 1HCM Reporting Overview
Unit OverviewAt the conclusion of this unit, you will be able to:
� Describe HR reporting roles, the info systems, and the other reporting toolsin HR
� Ascertain which requirements can be satisfied by which tool
Unit ObjectivesAfter completing this unit, you will be able to:
� Describe the overall enterprise scenario, roles, and levels of reporting.� Describe the reporting tools available
Unit ContentsLesson: Essentials of Reporting ... . . . . . . . . . . . . . . . . . . . . . . . . . . . . . . . . . . . . . . . . . . . . .2Lesson: Overview of Reporting Tools ... . . . . . . . . . . . . . . . . . . . . . . . . . . . . . . . . . . . . . . . .9
2006/Q2 © 2006 SAP AG. All rights reserved. 1

Unit 1: HCM Reporting Overview HR580
Lesson: Essentials of Reporting
Lesson OverviewIn this lesson, you learn the basic essentials about reporting.
Lesson ObjectivesAfter completing this lesson, you will be able to:
� Describe the overall enterprise scenario, roles, and levels of reporting.
Business Example� You are an employee in the Human Resources Controlling department. You
regularly require reports for senior management.� There are a number of different reporting tools available to you for this
purpose, depending on the type of reporting task in question.� You inform yourself about how to use the different tools and select a tool
on the basis of what you need it for.
Basics
Figure 1: Workforce Analytics
The Role of a Human Resources Analyst
2 © 2006 SAP AG. All rights reserved. 2006/Q2

HR580 Lesson: Essentials of Reporting
The Human Resources Analyst is an HR expert. He or she is regarded as a strategicpartner of HR managers, and the managing directors of the enterprise. He or sheprovides information that enables HR data to be monitored with regard to thestrategic goals of the enterprise. This information is used as a basis for personnelplanning, and enables the enterprise to satisfy statutory reporting requirements.
The following tasks are typical of those performed by the Human ResourcesAnalyst.
� Creation, execution, and formatting of numerous reports, which constitute asignificant data retrieval tool
� Formatting and timely retrieval of relevant HR data to help HR managers andthe managing directors of the enterprise to devise plans and make decisions
� Processing and timely retrieval of HR statistics required by law
� The following international single roles are available for the authorizationsof the human resources analyst:
� Human Resources Analyst (SAP_HR_REPORTING)� Time and Labor Analyst (SAP_HR_PT_TIME-LABOR-ANALYST)
� To depict the Human Resources Analyst composite role's country-specificactivities, single roles are provided for the following countries:
� Canada: SAP_HR_PA_CA_HR-ADMINISTRATOR� USA: SAP_HR_PA_US_HR-ADMINISTRATOR
Reporting Levels
Figure 2: Reporting Levels
2006/Q2 © 2006 SAP AG. All rights reserved. 3

Unit 1: HCM Reporting Overview HR580
A distinction is made between two levels of reporting:
� Flat or line item reporting� Analytical reporting
Flat reporting means reporting on uncompressed raw data from tables. Thefollowing reporting tools are available:
� Ad Hoc Query (= InfoSet Query in HR)� SAP Query
Analytical reporting means using compressed data (key figures) as the basisfor reporting.
The following reporting tool is particularly suited to this purpose:
� Business Information Warehouse (BW)
Figure 3: �Flat� reporting
When flat reporting is performed, data is retrieved from various infotypes.
The result is displayed in a flat list, which means that each line of outputcorresponds to one database entry.
Reports are based on uncompressed data.
In contrast to the Business Information Warehouse, there is no �slicing� and�dicing�. In other words, there are no views of different levels or segments ofan InfoCube and its key figures and characteristics.
4 © 2006 SAP AG. All rights reserved. 2006/Q2

HR580 Lesson: Essentials of Reporting
Figure 4: Query Views
When multidimensional reporting is performed using the Business InformationWarehouse, data is prepared in a way that is particularly conducive to reporting.
Data is stored and displayed in InfoCubes.
InfoCubes contain:
� Key figures (such as headcount, leaving rate, etc.)� Characteristics (such as gender, personnel area, etc.)
A single query (such as Headcount) can be used to create different views of one ormore InfoCubes as required.
Example: Query Headcount
A single query enables you to depict the number of employees (key figure)according to different criteria (characteristics) in a variety of views, and thereforefor different target groups:
� Head of Sales: headcount of the organizational unit for Sales according tobranch and year.
� Management: headcount for a particular year according to organizationalunit and branch.
� Head of Controlling Department at a particular branch: headcount of abranch according to organizational unit and year.
2006/Q2 © 2006 SAP AG. All rights reserved. 5

Unit 1: HCM Reporting Overview HR580
Query navigation is a special feature of the Business Information Warehouse.Once a query has been determined, it is not �frozen�. Instead, you can use thenavigation functions to create different query views. You can navigate data, createvarious ad-hoc data views, and drilldown to individual characteristics.
Figure 5: Query Views
Figure 6: Query Views - An Example
6 © 2006 SAP AG. All rights reserved. 2006/Q2

HR580 Lesson: Essentials of Reporting
Figure 7: Query Views
2006/Q2 © 2006 SAP AG. All rights reserved. 7

Unit 1: HCM Reporting Overview HR580
Lesson Summary
You should now be able to:� Describe the overall enterprise scenario, roles, and levels of reporting.
8 © 2006 SAP AG. All rights reserved. 2006/Q2

HR580 Lesson: Overview of Reporting Tools
Lesson: Overview of Reporting Tools
Lesson OverviewIn this lesson, you learn the basic facts about reporting tools.
Lesson ObjectivesAfter completing this lesson, you will be able to:
� Describe the reporting tools available
Business ExampleYou require a general overview of the reporting tools before going into them indetail in the following chapters.
Figure 8: Overview of Reporting Tools
Depending on the system environment in which they are used, reporting tools aredivided into two categories, namely reporting tools within
� The ERP System (flat reporting)� The Business Information Warehouse (analytical reporting)
The tools included in the ERP system for flat reporting enable you to
� Execute existing reports and queries� Create new queries and change existing queries
2006/Q2 © 2006 SAP AG. All rights reserved. 9

Unit 1: HCM Reporting Overview HR580
The tools used to execute existing reports and queries are:
� Human Resources Information System (HIS)� Manager�s Desktop and Manager Self-Service via the Portal� Information Systems in the SAP Easy Access Menu
You can create new queries and change existing queries using:
� Ad Hoc Query (= InfoSet Query in HR)� SAP Query
The Business Explorer is available as a front end in the Business InformationWarehouse
You can also execute reports in the Strategic Enterprise Management System.
Figure 9: Human Resources Information System (HIS)
HIS makes it easy for you to request reports using objects in a hierarchy in theSAP System. The reports are started directly from Structural Graphics.
As a prerequisite for starting the graphics function in the Human ResourcesInformation System, the system must contain data in a hierarchical structure.In the standard SAP System, they are
� The organizational structure and� The business event hierarchy
Procedure:
On the initial Structural Graphics screen, select the objects you want to report on.The reports that are available for the selected object are listed on a second screen.To access a report, double-click on it.
10 © 2006 SAP AG. All rights reserved. 2006/Q2

HR580 Lesson: Overview of Reporting Tools
This procedure has the following advantages:
� You are not required to enter data in a report selection screen. The parametersset by the system are the same as the report selection parameters that aremost frequently used in practice.
� You can access reports from different HR components, such as PersonnelAdministration and Recruitment, without having to switch from oneapplication to another.
Figure 10: Manager's Desktop
Manager's Desktop is tailored to the daily needs of managers - line managers,for example - by helping them to perform their administrative, organizational,and strategic tasks.
Manager's Desktop gives managers decision support when making humanresource decisions and when performing strategic planning activities byproviding them with swift access to required HR data of directly and indirectlysubordinate employees. It then enables them to report on this data.
Managers can also execute cross-application functions: for example, they canexecute workflow tasks (work items) or start reports from Controlling. Manager'sDesktop can be used to execute a wide range of standard reports from HR andControlling, as well as customer reports. Its Web browser integration means thatManager's Desktop enables managers to display intranet and Internet pages.
�Drag&Drop� functions make it easier for users to perform tasks.
Finally, Manager's Desktop supports the growing trend of decentralizing humanresource tasks and responsibilities. By transferring more and more tasks to linemanagers, HR departments can concentrate their efforts on key HR activities andfree resources for new services.
2006/Q2 © 2006 SAP AG. All rights reserved. 11

Unit 1: HCM Reporting Overview HR580
Figure 11: Manager Self-Service: The Portal Solution
Manager Self-Service helps managers perform their managerial tasks.
The functions are delivered in business packages.
Easy and intuitive usability are characteristic of Manager Self-Service.
Extensive Customizing options enable you to make changes without the assistanceof a developer.
Prerequisites of Implementation
� Organizational Management as mandatory prerequisite of MSS� Checklist under: www.service.sap.com/MSS
12 © 2006 SAP AG. All rights reserved. 2006/Q2

HR580 Lesson: Overview of Reporting Tools
Figure 12: Info Systems in the SAP Easy Access Menu
In Release 4.6, area menus were converted to tree navigation (SAP Easy AccessMenu). The former report trees are now integrated with the application as infosystems and can be enhanced with new reports and queries.
You can search for standard reports in individual applications or acrossapplications. Application-specific standard reports are available in the infosystems of individual HR components. In the SAP Easy Access Menu, HRstandard reports are also grouped together in comprehensive info systems.
You can access the info system of individual HR components by choosing thefollowing:
� Human Resources⇒ <Component>⇒ Information System⇒ Reports� Human Resources⇒ Payroll⇒ <Continent>⇒ <Country>⇒ Info System� Human Resources⇒ Time Management⇒ <Component>⇒ Info System
HR Info System
As well as containing reporting tools, the HR Information System contains allHR-specific reports. To access the HR Information System, choose:
� Human Resources⇒ Information System→ Reports
2006/Q2 © 2006 SAP AG. All rights reserved. 13

Unit 1: HCM Reporting Overview HR580
Figure 13: Ad Hoc Query
Ad Hoc Query is a simple and efficient tool for selecting and processing HR data.
Ad Hoc Query is the tool that is best suited to line item (flat) reporting.
Ad Hoc Query has the following advantages:
� Report definition is simple using Drag&Drop� You can report on data from Personnel Administration, Organizational
Management, Training and Event Management, Recruitment, and PersonnelDevelopment
� You can select selection and output fields as required� There are numerous report design options� The resulting set is displayed before output� Real data is selected and output � it is a one-screen application� Results are determined very quickly because the database is accessed directly� Logs
14 © 2006 SAP AG. All rights reserved. 2006/Q2

HR580 Lesson: Overview of Reporting Tools
Figure 14: SAP Query
SAP Query performs the following functions for reporting in HR:
� InfoSets are created. They are the basis for defining reports using Ad HocQuery and SAP Query.
� Reports are defined if they cannot be created using Ad Hoc Query (if localfields are required, for example).
� User groups are created and InfoSets are assigned to user groups.
2006/Q2 © 2006 SAP AG. All rights reserved. 15

Unit 1: HCM Reporting Overview HR580
Figure 15: HR Analytics
Human Resources Analytics combines the strategic planning of mySAP SEMwith the operative planning of mySAP ERP HCM to provide integrated BusinessContent for extensive analyses and HR benchmarking.
Figure 16: SAP Business Information Warehouse
16 © 2006 SAP AG. All rights reserved. 2006/Q2

HR580 Lesson: Overview of Reporting Tools
The Business Information Warehouse is a tool that is used to meet analyticalreporting requirements (for example, key figures and benchmarking).
The main constituent parts of the Business Information Warehouse are:
� The Business Information Warehouse Server� The Data Warehousing Workbench� The Business Explorer
Reporting can be done using data extracted from SAP systems, non-SAP systems,or from external sources such as databases, online services, and the Internet.
This data is managed in the Business Information Warehouse Server.
The Data Warehousing Workbench manages the various source systems.
The Business Explorer is used to display, analyze, and process the reports.
Figure 17: mySAP ERP HCM in Business Information Warehouse
Business Content makes it easier to report on, prepare, and retrieve data.Predefined standard reports and report templates enable you to create reportsquickly and simply.
2006/Q2 © 2006 SAP AG. All rights reserved. 17

Unit 1: HCM Reporting Overview HR580
Figure 18: Business Content for HCM in BW
HCM Business Content includes
� Extractors� HCM InfoCubes� Queries
Business Content provides you with detailed standard reports and key figuresthat are used to perform analyses.
Figure 19: Business Explorer
18 © 2006 SAP AG. All rights reserved. 2006/Q2

HR580 Lesson: Overview of Reporting Tools
The Business Explorer consists of two parts:
� The Report Builder in the Business Explorer Analyzer is used to create newqueries and change existing queries. Data is displayed in MS Excel, whichcan be used to analyze it. All MS Excel functions are available (for example,functions that enable you to create graphics which can then be saved in thereport). You can then store the graphics in the report.
� The Business Explorer Browser enables you to make queries available toother users in the Internet or intranet. Users can start queries simply bydouble-clicking on them. They can then be used to perform further analyses.
Figure 20: SAP SEM HCM Measure Catalog
Examples:
Basic key figures
� Such as headcount, FTE (full-time equivalent), number of managers, hiredemployees, workdays, leavers.
Personnel Planning
� Such as management quota, fluctuation rate, average length of service, netentry rate, full-time/part-time rate.
Recruitment
� Such as net hiring rate, internal hiring rate, external hiring rate.
2006/Q2 © 2006 SAP AG. All rights reserved. 19

Unit 1: HCM Reporting Overview HR580
Compensation and Benefits
� Such as average employer expense for benefits, benefits for overallcompensation, percentage enrollment in benefits.
Enterprises' effectiveness
� Such as costs per employee in FTE, salary revenue, income before interestand tax (EBIT) per FTE.
Training
� Such as training investment per FTE, training hours per FTE, traininginvestment per training hour.
Personnel management
� Such as total costs for personnel activities, personnel area costs peremployee, staffing factor personnel area.
Time Management
� Such as illness rate, illness value per FTE.
20 © 2006 SAP AG. All rights reserved. 2006/Q2

HR580 Lesson: Overview of Reporting Tools
Lesson Summary
You should now be able to:� Describe the reporting tools available
2006/Q2 © 2006 SAP AG. All rights reserved. 21

Unit Summary HR580
Unit SummaryYou should now be able to:� Describe the overall enterprise scenario, roles, and levels of reporting.� Describe the reporting tools available
22 © 2006 SAP AG. All rights reserved. 2006/Q2
Unit 2Human Resources Information
System (HIS)
Unit OverviewAt the conclusion of this unit, you will be able to:
� Give an overview of Structural Graphics (HIS) reports� Explain how to access this reporting tool� Use Structural Graphics to access reports from various areas within Human
Resources� Create new areas and include reports in them
Unit ObjectivesAfter completing this unit, you will be able to:
� Access and work with HIS� Set up HIS according to the requirements of your enterprise
Unit ContentsLesson: Initial HIS Access and Working with HIS ... . . . . . . . . . . . . . . . . . . . . . . . . 24
Exercise 1: Initial Access and Working with HIS ... . . . . . . . . . . . . . . . . . . . . . 33Lesson: Customizing HIS.... . . . . . . . . . . . . . . . . . . . . . . . . . . . . . . . . . . . . . . . . . . . . . . . . . . . 38
Exercise 2: OPTIONAL: Customizing HIS .... . . . . . . . . . . . . . . . . . . . . . . . . . . . 41
2006/Q2 © 2006 SAP AG. All rights reserved. 23

Unit 2: Human Resources Information System (HIS) HR580
Lesson: Initial HIS Access and Working with HIS
Lesson OverviewIn this lesson, you learn about the initial HIS screen and how to work with HIS.
Lesson ObjectivesAfter completing this lesson, you will be able to:
� Access and work with HIS
Business ExampleYou use Organizational Management at your enterprise.
You want to use standard display options to create an overview of your enterprise'scurrent overall structure. You then want to report on detailed structures.
Accessing HIS
Figure 21: Human Resources Information System (HIS)
HIS makes it easy for you to request reports using objects in a hierarchy in theSAP System. The reports are started directly from Structural Graphics.
24 © 2006 SAP AG. All rights reserved. 2006/Q2

HR580 Lesson: Initial HIS Access and Working with HIS
As a prerequisite for starting the graphics function in the Human ResourcesInformation System, the system must contain data in a hierarchical structure.In the standard SAP System, they are:
� The organizational structure and� The business event hierarchy
Procedure:
On the initial Structural Graphics screen, select the objects you want to report on.The reports that are available for the selected object are listed on a second screen.To access a report, double-click on it.
This procedure has the following advantages:
� You are not required to enter data in a report selection screen. The parametersset by the system are the same as the report selection parameters that aremost frequently used in practice.
� You can access reports from different HR components, such as PersonnelAdministration and Recruitment, without having to switch from oneapplication to another.
Figure 22: Accessing HIS: Overview
In the SAP Easy Access Menu, choose
Human Resources⇒ Information System→ Reporting Tools⇒ HIS to accessthe Initial Screen of Structural Graphics (HIS).
2006/Q2 © 2006 SAP AG. All rights reserved. 25

Unit 2: Human Resources Information System (HIS) HR580
The initial screen enables you to select:
� Views� Graphical displays� Access objects (with display and validity options)� Defaults
Figure 23: a) Views
Views enable you to select specific objects. The system includes two types ofobject hierarchy:
� Organizational units� Business events
Views are context-specific, which means they differ from one enterprise to another.
The selection you make in the View field determines which functions are availablein graphics display.
26 © 2006 SAP AG. All rights reserved. 2006/Q2

HR580 Lesson: Initial HIS Access and Working with HIS
Figure 24: b) Graphical Display
In the Graphical Display group box, you can specify which object types aredisplayed in Structural Graphics. These are the only object types that can beused as access objects for reporting:
� Organizational view: organizational units� Training and Event Management: business event groups and types
This setting also determines the structure in which objects are displayed.
Organizational Management, for example, provides you with the followingoptions:
� Organizational units only� Organizational units with positions� Organizational units with persons� Organizational units with positions and persons
Other views provide you with other appropriate options.
Hint: If your hierarchical structure is very big, you should restrict itaccordingly to ensure that you still have an overview of the structure whenit is displayed. Choose the part of the structure that you really need foryour report. You should only choose to display persons, for example, ifthe organizational unit is very small.
2006/Q2 © 2006 SAP AG. All rights reserved. 27

Unit 2: Human Resources Information System (HIS) HR580
Figure 25: c) Options on the Initial Screen
The initial screen requires you to choose the organizational unit, event, or groupas of which the hierarchical structure is displayed (that is, you must determinethe access object).
In the Display Depth field, you can enter the number of hierarchical levels to bedisplayed in Structural Graphics.
Caution: The Display Depth field only affects how the object hierarchy isdisplayed. It does not affect reporting. Reporting takes place for lowerlevels too, irrespective of the display depth (unless determined otherwise).
Example:
You display your hierarchy of business event groups, and want to report onattendance numbers per event. The report runs on business events and attendeeson hierarchical levels below the business event group you selected, not just onthe business event group itself.
You can determine a reporting validity period in which the objects to be reportedon are valid. The period indicator enables you to choose preset periods.
28 © 2006 SAP AG. All rights reserved. 2006/Q2

HR580 Lesson: Initial HIS Access and Working with HIS
Figure 26: d) Defaults
HIS reports can be started and executed in a number of ways. The followingsettings are possible:
� Start directly or via selection screen
You can start the report immediately, which means you do not need to enteradditional data in a report selection screen. The programs are usually preset,and contain the required data. Alternatively, you can choose to access thereport selection screen and enter additional data.
� Reporting depth
You can start reporting for one object selected in Structural Graphics, orfor an object and all of its lower-level objects. This selection only affectsstructural reporting.
� Data retrieval depth
The advantage of HIS is that it can use HR master data to create a reportfor persons who are selected automatically when an organizational unit ischosen in a graphic. You need to specify whether the report runs on personsassigned to the selected organizational unit only, or on persons assigned toall of the lower-level organizational units too.
You can also change the standard settings from Structural Graphics.
2006/Q2 © 2006 SAP AG. All rights reserved. 29

Unit 2: Human Resources Information System (HIS) HR580
Working with Structural Graphics
Figure 27: Structural Graphics: Overview
Structural Graphics includes a number of options that enable you to adapt graphicsto your specific requirements, and start reporting.
Structural Graphics includes a menu bar with preset customizing options forviews:
� Detail <-> Overview.
For example, you can switch display from the short text to the long textof the object name.
� Select Section
You can choose a section of the whole structure, which is enlarged andthen displayed.
� Substructure, overall structure
Display switches from the whole structure to the selected substructure, andvice versa.
� View Options
The view options enable you to determine how Structural Graphics isdisplayed so that it meets your specific requirements. An additional windowcontains detailed options with which you determine Structural Graphicsdesign. This includes the following settings: display mode, following mode,graphic type, design, object options, and line options.
30 © 2006 SAP AG. All rights reserved. 2006/Q2

HR580 Lesson: Initial HIS Access and Working with HIS
Displaying an entire object hierarchy can prevent you from retaining a clearoverview if the hierarchy in question is very large. Detail views enable you todisplay clearer overviews of individual substructures.
However, you might want to display an overview of the entire structure and asection of the structure at the same time so that you can see where the sectionof the structure is located within the entire hierarchy. To display both variantssimultaneously, open another view window. The view options enable you todefine this view window as a following mode in which the section of the structureis displayed. As a result, this second window always displays the object that youselected from the entire structure in the first window, together with its lower-levelobjects.
You can start reports from all view windows.
Figure 28: Structural Graphics: The Toolbox
The toolbox contains all of the reports available for the view and object hierarchyyou have selected:
� The upper section of the toolbox lists the areas (HR components).� The lower section of the toolbox lists the reports available for the areas in
question (task functions).
The Help function enables you to access a description of the report you haveselected.
To start a report directly, simply double-click on its title in the lower section ofthe toolbox.
2006/Q2 © 2006 SAP AG. All rights reserved. 31

Unit 2: Human Resources Information System (HIS) HR580
Default settings can also be made from the toolbox.
Hint: If you have closed the toolbox, you can open it again by choosingEdit⇒ Reporting.
32 © 2006 SAP AG. All rights reserved. 2006/Q2

HR580 Lesson: Initial HIS Access and Working with HIS
Exercise 1: Initial Access and Workingwith HIS
Exercise ObjectivesAfter completing this exercise, you will be able to:� Access Structural Graphics in a number of different ways.� Adjust the view options in Structural Graphics so that they meet your
specific requirements.� Give an overview of the functions included in the Structural Graphics
toolbox.� Start reports from Structural Graphics.
Business ExampleYou are an employee at the production plant in Hamburg and have HRresponsibilities.
You want to use Structural Graphics to report on the data of employees that belongto the organizational unit for which you are responsible.
Task 1:Access Structural Graphics (HIS) for IDES AG under Executive Dir. Germany⇒Production and S&D⇒ Production).
1. In the current plan version, select the view �STANDARD�.
2. To determine the correct access object, use the search help.
Load Structural Graphics using the default setting for graphical display andwithout specifying a display depth (all levels are displayed for the selectedobjects). Do not specify a date; this is set automatically.
Task 2:Management at the Hamburg Production Department of IDES AG requiresa list of telephone numbers for the �department responsible for assemblingpumps in Germany�. Management at the plant in Hamburg then requires abreakdown by nationality of all employees assigned to the Hamburg plant.
Start the required reports using the toolbox.
1. Familiarize yourself with the areas included in the toolbox, and their reports.To display information on individual reports, use the help function.
Continued on next page
2006/Q2 © 2006 SAP AG. All rights reserved. 33

Unit 2: Human Resources Information System (HIS) HR580
2. Start the �Telephone no.� report for the �organizational unit responsiblefor assembling pumps in Germany�.
3. Start the �Nationalities� report for the Hamburg plant.
34 © 2006 SAP AG. All rights reserved. 2006/Q2

HR580 Lesson: Initial HIS Access and Working with HIS
Solution 1: Initial Access and Workingwith HISTask 1:Access Structural Graphics (HIS) for IDES AG under Executive Dir. Germany⇒Production and S&D⇒ Production).
1. In the current plan version, select the view �STANDARD�.
a) In the SAP menu, choose
Human Resources⇒ Information System⇒ Reporting Tools⇒ HIS
to call Structural Graphics.
The first time you access Structural Graphics, the system requires youto enter the plan version you want to use. Enter �01� for the currentplan version. Choose the �Standard view�.
2. To determine the correct access object, use the search help.
Load Structural Graphics using the default setting for graphical display andwithout specifying a display depth (all levels are displayed for the selectedobjects). Do not specify a date; this is set automatically.
a) Use the search help on the Organizational unit field and invoke astructural search to locate the object you require:
IDES AG⇒ Exec. Director - Germany⇒ Production and S&D⇒Production (D)⇒ Hamburg Production Site (object ID: 1000)
b) Choose Execute to call Structural Graphics.
Tip: Set the graphic to Overview.
Continued on next page
2006/Q2 © 2006 SAP AG. All rights reserved. 35

Unit 2: Human Resources Information System (HIS) HR580
Task 2:Management at the Hamburg Production Department of IDES AG requiresa list of telephone numbers for the �department responsible for assemblingpumps in Germany�. Management at the plant in Hamburg then requires abreakdown by nationality of all employees assigned to the Hamburg plant.
Start the required reports using the toolbox.
1. Familiarize yourself with the areas included in the toolbox, and their reports.To display information on individual reports, use the help function.
a) To do so, select an area in the upper section of the toolbox. Search forthe report you require in the list that is now displayed in the lowersection of the toolbox.
b) To access the documentation on a particular report, select the reportand choose �Help�.
2. Start the �Telephone no.� report for the �organizational unit responsiblefor assembling pumps in Germany�.
a) Use Structural Graphics to select the �organizational unit responsiblefor assembling pumps in Germany�.
b) In the upper section of the toolbox, select the �Administration� areaby clicking on it once, and then start the �Telephone no.� report in thelower section of the toolbox by double-clicking on Telephone no..
3. Start the �Nationalities� report for the Hamburg plant.
a) Stop displaying the telephone no. report, and start the �Employees�report for the Hamburg plant. This report is also included in the�Administration� area.
b) Close Structural Graphics.
36 © 2006 SAP AG. All rights reserved. 2006/Q2

HR580 Lesson: Initial HIS Access and Working with HIS
Lesson Summary
You should now be able to:� Access and work with HIS
2006/Q2 © 2006 SAP AG. All rights reserved. 37

Unit 2: Human Resources Information System (HIS) HR580
Lesson: Customizing HIS
Lesson OverviewOnce you have become familiar with how to operate HIS from the applicationpoint of view, you want to turn your attention to its Customizing.
Lesson ObjectivesAfter completing this lesson, you will be able to:
� Set up HIS according to the requirements of your enterprise
Business Example� In Customizing, you configure HIS to suit the requirements of your
enterprise.
Figure 29: Customizing HIS
The standard system includes settings that you can adapt to meet your specificrequirements.
38 © 2006 SAP AG. All rights reserved. 2006/Q2

HR580 Lesson: Customizing HIS
Customizing includes two sections in which settings are made for the HumanResources Information System:
� To make your system settings for Structural Graphics, go to Customizingfor Personnel Management and maintain the appropriate global settings.
� To adjust HIS, go to Customizing for the Human Resources InformationSystem. In particular, you can create new areas and then include your ownreports in them.
Figure 30: Customer Reports in Structural Graphics
You can create your own areas and then include your own reports in StructuralGraphics.
New areas are created in the Implementation Guide (IMG) by choosing
Personnel Management→ Human Resources Information System→ HIS⇒Define
Areas.
To include customer reports in an area, in Customizing choose
Personnel Management→ Human Resources Information System→ HIS⇒Define Task
Functions.
Just like standard reports, you can start these reports directly by double-clickingon them in the appropriate toolbox area.
2006/Q2 © 2006 SAP AG. All rights reserved. 39

Unit 2: Human Resources Information System (HIS) HR580
40 © 2006 SAP AG. All rights reserved. 2006/Q2

HR580 Lesson: Customizing HIS
Exercise 2: OPTIONAL: Customizing HIS
Exercise ObjectivesAfter completing this exercise, you will be able to:� Add new areas to the HIS toolbox, and assign existing queries or reports to
these areas.
Business ExampleYou want to categorize existing queries, and customer queries. Therefore, youwant to create your own areas which will then contain the reports you require.
Task 1: OptionalPerform the required customizing activities.
1. Create a new area with the name ZHR580## in the data view ZHR580##.
2. Assign the following reports to this area:
Employee List: RPLMIT00Telephone List: RPLTEL00
Task 2: Optional
1. Restart HIS, and determine whether the area in the data view ZHR580 youjust created now exists. Start one of the reports that it contains.
2006/Q2 © 2006 SAP AG. All rights reserved. 41

Unit 2: Human Resources Information System (HIS) HR580
Solution 2: OPTIONAL: Customizing HISTask 1: OptionalPerform the required customizing activities.
1. Create a new area with the name ZHR580## in the data view ZHR580##.
a) Open a new window by choosing System→ Create⇒ Session.
b) Use the SAP Easy Access Menu to access the Implementation Guide(IMG):
Tools→ Customizing⇒ IMG⇒ Execute Project.
Choose SAP Reference IMG (pushbutton).
c) Choose
Personnel Management→ Human Resources Information System→HIS⇒ Define Areas
Create a new area with the name ZHR580## (choose �New Entries�),and enter the text �Area Gr ##� for it. Choose Save.
d) To assign the area to the ZHR580 view, select the area and then switchto the Views for Area subnode in the dialog structure. By choosingNew entries, you can assign the ZHR580 view (select using input helpfunction). Choose Save and return to the IMG.
Hint: Ignore any messages output about name space at thispoint.
2. Assign the following reports to this area:
Continued on next page
42 © 2006 SAP AG. All rights reserved. 2006/Q2

HR580 Lesson: Customizing HIS
Employee List: RPLMIT00Telephone List: RPLTEL00
a) In the Implementation Guide, choose
Personnel Management→ Human Resources Information System→HIS⇒ Define Task Functions
Assign the reports listed above (task functions):
b) To do so, use appropriate templates (e.g. in group ****, area HRADM),select the templates and choose Copy As and change the area to yourarea ZHR580##.
Hint: Confirm the info message about the namespace.
c) Choose Save and return to the IMG.
Task 2: Optional
1. Restart HIS, and determine whether the area in the data view ZHR580 youjust created now exists. Start one of the reports that it contains.
a) Switch back to the application mode.
b) Start HIS again, this time with the view ZHR580. Your area and itsassigned reports are displayed in the toolbox.
c) Start your reports.
2006/Q2 © 2006 SAP AG. All rights reserved. 43

Unit 2: Human Resources Information System (HIS) HR580
Lesson Summary
You should now be able to:� Set up HIS according to the requirements of your enterprise
44 © 2006 SAP AG. All rights reserved. 2006/Q2

HR580 Unit Summary
Unit SummaryYou should now be able to:� Access and work with HIS� Set up HIS according to the requirements of your enterprise
2006/Q2 © 2006 SAP AG. All rights reserved. 45

Unit Summary HR580
46 © 2006 SAP AG. All rights reserved. 2006/Q2

Unit 3Manager�s Desktop (MDT) andManager Self-Service (MSS)
Unit OverviewAt the conclusion of this unit, you will be able to:
� Use Manager�s Desktop to report on the data of employees assigned to you� Add customer categories and functions to Manager's Desktop
Unit ObjectivesAfter completing this unit, you will be able to:
� Use Manager�s Desktop� Use Manager Self-Service
Unit ContentsLesson: Manager�s Desktop (MDT) ... . . . . . . . . . . . . . . . . . . . . . . . . . . . . . . . . . . . . . . . . 48
Exercise 3: Manager's Desktop (MDT) ... . . . . . . . . . . . . . . . . . . . . . . . . . . . . . . . . 55Lesson: Manager Self-Service (MSS)... . . . . . . . . . . . . . . . . . . . . . . . . . . . . . . . . . . . . . . 61
2006/Q2 © 2006 SAP AG. All rights reserved. 47

Unit 3: Manager�s Desktop (MDT) and Manager Self-Service (MSS) HR580
Lesson: Manager�s Desktop (MDT)
Lesson OverviewIn this lesson, you learn how to work with the Manager's Desktop and how tocustomize MDT.
Lesson ObjectivesAfter completing this lesson, you will be able to:
� Use Manager�s Desktop
Business Example� The managers in your enterprise need an easy-to-use tool that supports them
day-to-day in their administrative, organizational, and strategic tasks.� To make informed decisions, managers need an adequate information base
that draws on a range of reports.
Working with MDT
Figure 31: Manager's Desktop: Goals
Manager's Desktop is tailored to the daily needs of managers - line managers,for example - by helping them to perform their administrative, organizational,and strategic tasks.
48 © 2006 SAP AG. All rights reserved. 2006/Q2

HR580 Lesson: Manager�s Desktop (MDT)
Manager's Desktop gives managers decision support when making HumanResource decisions and when performing strategic planning activities byproviding them with swift access to required HR data of directly and indirectlysubordinate employees. It then enables them to report on this data.
Managers can also execute cross-application functions: for example, they canexecute workflow tasks (work items) or start reports from Controlling. Manager'sDesktop can be used to execute a wide range of standard reports from HR andControlling, as well as customer reports. Its Web browser integration means thatManager's Desktop enables managers to display intranet and Internet pages.
Drag&Drop functions make it easier for users to perform tasks.
Finally, Manager's Desktop supports the growing trend of decentralizing HumanResource tasks and responsibilities. By transferring more and more tasks to linemanagers, HR departments can concentrate their efforts on key HR activities andfree resources for new services.
Figure 32: Manager�s Desktop: Initial Screen
The initial screen provides an overview of the defaultmain scenario in Manager'sDesktop (MDT), which consists of the six theme categories listed above andtheir function lists.
The function codes in Customizing can be used to put these categoriesinto customer-specific hierarchies. The categories can also be enhanced withcustomer-specific functions.
2006/Q2 © 2006 SAP AG. All rights reserved. 49

Unit 3: Manager�s Desktop (MDT) and Manager Self-Service (MSS) HR580
Furthermore, the user can deactivate unnecessary categories and functions on theinitial screen and on the various screens of the different application components. Itis always possible to switch between user settings and standard settings.
The initial screen can be adapted to customer-specific requirements inCustomizing. For example, it can be enhanced with an enterprise logo and/orbackground picture.
Figure 33: Working with Manager's Desktop
In the theme categories Employee, Organization, and CompensationManagement, the screen is divided into a right screen area, showing theorganizational area of responsibility of the user, and a left screen area, wherethere is a list of the default or preset functions.
By choosing tab pages in the right screen area, you can access different views ofyour area of responsibility. Each tab page represents an evaluation path.
If you choose the Directly subordinate employees tab page, the system displays inthe tree structure only organizational objects (organizational units, positions, andholders) for which you are directly responsible. If you choose the All subordinateemployees tab page, the system displays all organizational objects, includingthose for which you are indirectly responsible. If you choose the Cost centers tabpage, the system displays all organizational objects (that is, also those that areindirectly subordinate) with assigned master cost centers, where these exist forthe organizational units shown. The tab page Project Assignments displays allPSP elements to which positions or organizational units in the manager's areaof responsibility are assigned.
50 © 2006 SAP AG. All rights reserved. 2006/Q2

HR580 Lesson: Manager�s Desktop (MDT)
You can execute the functions in the function list in various ways. The Drag&Dropmethod is particularly easy. You can Drag&Drop from right to left by selectingone or more objects in the org. structure, holding down the left mouse button,and dragging the mouse to the desired function - for example to a report - in thefunction list. The function is executed for all selected objects. You can alsoDrag&Drop from left to right. In addition, you can use Drag&Drop to moveorganizational objects within the tree structure.
Figure 34: Prerequisites
If you want to use the functions provided by Manager�s Desktop, you mustfirst use the Organizational Management application component to create anorganizational plan for your enterprise, and display the organizational structureand staff assignments (that is, the assignment of persons or users to positions).
When a user (manager) logs on, the system determines all the organizational unitsthat are headed by him or her. The user then sees a tree structure containing theselected organizational units with their positions and assigned holders. These canbe edited using a function list, for example. The area of responsibility displayedis only ever a section of the enterprise's organizational plan, unless the managerconcerned is the head of the whole enterprise.
2006/Q2 © 2006 SAP AG. All rights reserved. 51

Unit 3: Manager�s Desktop (MDT) and Manager Self-Service (MSS) HR580
Figure 35: Theme Categories
The Compensation Management theme category comprises functions that enableyou to execute cost center accounting functions (CO - Controlling component),plan and display required positions for your area of responsibility, and allocateperformance bonuses and salary adjustments for the employees in your area ofresponsibility (HR Compensation Management component). This includes
� Determining performance bonuses� Making salary adjustments� Determining extraordinary adjustments
A manager's workflow tasks are listed in the workflow inbox. Each work itemhas the attributes description, priority, date of receipt, and task. The work itemscan be sorted in ascending or descending order according to these attributes. Assoon as a work item has been executed, the workflow inbox is updated.
The integration of a Web browser means that you can display intranet or Internetpages relevant to your enterprise in Manager's Desktop, under the Special Areastheme category.
52 © 2006 SAP AG. All rights reserved. 2006/Q2

HR580 Lesson: Manager�s Desktop (MDT)
Customizing MDT
Figure 36: Customizing: Defining Function Codes with the Wizard
In Customizing, you can adjust the theme categories and the functions theycontain.
In Customizing, choose
Personnel Management→ Manager�s Desktop⇒ Enhancement of FunctionCodes⇒ Wizard for Defining Function Codes
to access an easy-to-use Customizing tool.
The tool enables you to create and assign:
� Theme Categories� Subcategories� Functions (transactions, function modules, reports, URLs)
They are then available to the user in Manager's Desktop.
2006/Q2 © 2006 SAP AG. All rights reserved. 53

Unit 3: Manager�s Desktop (MDT) and Manager Self-Service (MSS) HR580
54 © 2006 SAP AG. All rights reserved. 2006/Q2

HR580 Lesson: Manager�s Desktop (MDT)
Exercise 3: Manager's Desktop (MDT)
Exercise ObjectivesAfter completing this exercise, you will be able to:� Start reports for an organizational plan using Manager�s Desktop� Create new theme categories in Manager�s Desktop, and assign functions
to them.
Business ExampleYou are the line manager of a given department. You use the intuitive, easy-to-useinterface of the Manager�s Desktop to request reports about your employees.
Task 1:Execute reports for an organizational plan using Manager�s Desktop:
1. In your organizational structure, find people who are (directly and indirectly)subordinate to you.
2. Display the birthdays of employees assigned (directly and indirectly) to you.
3. Display unoccupied positions that are assigned (directly and indirectly) toyou. Switch to the theme category Organization.
Task 2: Optional
Hint: This exercise is optional since technical restrictions preventmultiple users from accessing the wizard at the same time. For this reason,not all changes will be saved.
Create new theme categories, subcategories, and functions (in the MWB1scenario):
1. In Customizing, in theme category ZHR580 Theme Category HR580, createa new subcategory called ZHR580## (group ##)
2. To this subcategory, assign the report:
Employee List RPLMIT00 (function code ZHR580##_01)
as well as the
URL of the SAP Homepage (http://www.sap.com) (function codeZHR580##_02)
.
Continued on next page
2006/Q2 © 2006 SAP AG. All rights reserved. 55

Unit 3: Manager�s Desktop (MDT) and Manager Self-Service (MSS) HR580
3. Check whether the functions in your subcategory are available in Manager�sDesktop. Call MDT again.
56 © 2006 SAP AG. All rights reserved. 2006/Q2

HR580 Lesson: Manager�s Desktop (MDT)
Solution 3: Manager's Desktop (MDT)Task 1:Execute reports for an organizational plan using Manager�s Desktop:
1. In your organizational structure, find people who are (directly and indirectly)subordinate to you.
a) Choose Human Resources⇒ Manager's Desktop.
b) On the initial screen of Manager�s Desktop, choose the Personal Datatheme category.
c) Expand the tree structure on the Directly subordinate employees and Allsubordinate employees tab pages.
2. Display the birthdays of employees assigned (directly and indirectly) to you.
a) Expand the �Reports� folder (on the left side of the screen) until yousee the report Birthdays.
b) To display the birthdays of the people in your organizational structure,select your organizational unit (making sure that you are on the Allsubordinate employees tab page).
c) Hold down the left mouse button, and drag the cursor to the Birthdaysreport.
3. Display unoccupied positions that are assigned (directly and indirectly) toyou. Switch to the theme category Organization.
a) Expand the �Planning and Administration� folder (on the left side ofthe screen) until you see the report Unoccupied Positions.
b) Ensure that you are on the tab page �All subordinate employees�.
c) Select your organizational unit.
Hold down the left mouse button, and drag the cursor to the UnoccupiedPositions report.
Continued on next page
2006/Q2 © 2006 SAP AG. All rights reserved. 57

Unit 3: Manager�s Desktop (MDT) and Manager Self-Service (MSS) HR580
Task 2: Optional
Hint: This exercise is optional since technical restrictions preventmultiple users from accessing the wizard at the same time. For this reason,not all changes will be saved.
Create new theme categories, subcategories, and functions (in the MWB1scenario):
1. In Customizing, in theme category ZHR580 Theme Category HR580, createa new subcategory called ZHR580## (group ##)
a) Go to the Implementation Guide (IMG) by choosing:
Tools→ Customizing⇒ IMG⇒ Edit Project
Choose SAP Reference IMG (pushbutton).
Follow the instructions under:
Personnel Management→ Manager�s Desktop⇒ Enhancement ofFunction Codes⇒ Wizard for Defining Function Codes
Choose Continue until you can select the option �Subcategory.� ChooseContinue.
b) The scenario MWB1 is preset. Enter the function code ZHR580## andthe text Subcategory Group ##. Choose Continue.
c) Choose �ZHR580 Theme Category HR580� both as theme category andas higher-level category.
d) Select �Save entries to database� and choose Continue.
e) A dialog box appears prompting you to save the data to a workbenchrequest. If no workbench request has been created for your user groupyet, you must create a request now by choosing Create Request. Youmust enter the corresponding short description for the request.
Choose Save.
The request is created. You can now save data to your new request.Choose Continue.
f) Choose Complete.
2. To this subcategory, assign the report:
Employee List RPLMIT00 (function code ZHR580##_01)
as well as the
Continued on next page
58 © 2006 SAP AG. All rights reserved. 2006/Q2

HR580 Lesson: Manager�s Desktop (MDT)
URL of the SAP Homepage (http://www.sap.com) (function codeZHR580##_02)
.
a) Follow the instructions under:
Personnel Management→ Manager�s Desktop⇒ Enhancement ofFunction Codes⇒ Wizard for Defining Function Codes
Choose Continue. On the next screen, select the option �Executablefunction.� Choose Continue.
b) Create a function ZHR580##_01 with the long text Employee Group.Choose Continue.
c) Select the theme category �ZHR580 Theme Category HR580� andas higher-level category, select the subcategory you just created�ZHR580## Subcategory Gr##.� Choose Continue.
d) On the next screen, select the function type REPORT and enter theprogram name RPLMIT00. Choose Continue.
e) Select the option Create more function codes and proceed as in steps (a)to (c) to create the URL of the SAP Homepage (function code name:ZHR580##_02; long text SAP Homepage).
f) On the next screen, select the function type WWW Addresswith (or without) navigation keys and enter the WWW addresshttp://www.sap.com. Choose Continue.
g) Select Save entries to database and confirm the workbench requestprompt by choosing Continue.
h) Choose Continue and / or Complete.
3. Check whether the functions in your subcategory are available in Manager�sDesktop. Call MDT again.
a) Note in particular the selection of your subcategory in the themecategory ZHR580 Theme Category HR580.
b) Start the report or the Homepage.
2006/Q2 © 2006 SAP AG. All rights reserved. 59

Unit 3: Manager�s Desktop (MDT) and Manager Self-Service (MSS) HR580
Lesson Summary
You should now be able to:� Use Manager�s Desktop
60 © 2006 SAP AG. All rights reserved. 2006/Q2

HR580 Lesson: Manager Self-Service (MSS)
Lesson: Manager Self-Service (MSS)
Lesson OverviewIn this lesson, you learn how to work with Manager Self-Service.
Lesson ObjectivesAfter completing this lesson, you will be able to:
� Use Manager Self-Service
Business ExampleYou require an easy-to-use tool that your managers can use on a Web interfacethat includes budget tracking functions.
Figure 37: Manager Self-Service: The Portal Solution
The functions are delivered in business packages.
2006/Q2 © 2006 SAP AG. All rights reserved. 61

Unit 3: Manager�s Desktop (MDT) and Manager Self-Service (MSS) HR580
Figure 38: Overview of Manager Self-Service
The Business Package Manager Self-Service (MSS) supports line managers,project managers, and team leaders in their daily tasks and gives them access toinformation that is relevant to them.
Managers with personnel responsibility have direct access to all informationrelevant to their employees and area of responsibility when they log on to theportal. They can see at a glance what employees are on leave or who is available.
They can start human resources business processes directly from the portal. Forexample, after an employee appraisal, directly from the portal the manager canarrange for the employee to receive a bonus.
Manager Self-Service contains a wide range of reporting options and reports basedboth on the standard reporting functions in R/3 and on the Business InformationWarehouse (BW). Customers that do not have BW implemented can use MSSwithout any restrictions.
62 © 2006 SAP AG. All rights reserved. 2006/Q2

HR580 Lesson: Manager Self-Service (MSS)
Figure 39: Area Group Pages MSS � Content in mySAP ERP 2005
SAP MSS HR Content in mySAP ERP 2005 based on WebDynpro:
� Attendance� Employees' Change Requests� Recruitment/E-Recruiting� Analytics and Reporting� Headcount Planning
Highlights:
� Integration of Adobe Designer� Integration of E-Recruiting
2006/Q2 © 2006 SAP AG. All rights reserved. 63

Unit 3: Manager�s Desktop (MDT) and Manager Self-Service (MSS) HR580
Figure 40: Area Page: Example 1 Employees' Change Request
Figure 41: Application: New Change Request for Employee Data
64 © 2006 SAP AG. All rights reserved. 2006/Q2

HR580 Lesson: Manager Self-Service (MSS)
Figure 42: Employees' Change Request
Figure 43: Employees' Change Request - Status Information
2006/Q2 © 2006 SAP AG. All rights reserved. 65

Unit 3: Manager�s Desktop (MDT) and Manager Self-Service (MSS) HR580
Figure 44: Reporting: BW Queries
On this page, the manager selects a query from the list. The standard systemcontains the following queries:
� Headcount� Overtime and number of employees off sick� Personnel Development
Figure 45: Reporting: BW Query Headcount - Table View
66 © 2006 SAP AG. All rights reserved. 2006/Q2

HR580 Lesson: Manager Self-Service (MSS)
Headcount Overview
This service is supported by the BW cockpit and four BW reports. The managercan change the reporting period via the drop-down list on the upper edge of thescreen, for example to:
� Current month� Last 4 quarters� Last 12 months
Each of the four reports provides a summary of the data in graphic format. Todisplay more details, the manager simply double-clicks on the graphic.
Headcount Details
Click Detail to display the detail view.
Figure 46: Reporting: BW Query Headcount � Graphic View and InformationView
2006/Q2 © 2006 SAP AG. All rights reserved. 67

Unit 3: Manager�s Desktop (MDT) and Manager Self-Service (MSS) HR580
Figure 47: Reporting: BW Query Headcount � Data Analysis View andInformation View
Figure 48: Reporting: BW Query Overtime and Number of Employees OffSick
Overtime and Number of Employees Off Sick
68 © 2006 SAP AG. All rights reserved. 2006/Q2

HR580 Lesson: Manager Self-Service (MSS)
This Web Cockpit provides the manager with an overview of employees' overtimeand the number of employees off sick and the resulting costs incurred. The WebCockpit contains the following BW queries:
� Employees off sick: relationship between sick time and planned workingtime
� Overtime: relationship between overtime and planned working time� Costs incurred by sick time� Overtime and costs
Figure 49: Reporting: BW Query Qualifications
Qualifications
This Web Cockpit provides an overview of the skills and qualifications of theemployees in the manager's area of responsibility. It contains the following BWqueries:
� Qualifications: Qualifications are displayed for active employees (filter viaemployment status and employee group).
� Course Attendance and Cancellation (and Resulting Costs Incurred)
2006/Q2 © 2006 SAP AG. All rights reserved. 69

Unit 3: Manager�s Desktop (MDT) and Manager Self-Service (MSS) HR580
Figure 50: Prerequisites for Manager Self-Service in EP
If you want to make the best use of the Manager Self-Service in your enterprise,you must use and maintain Organizational Management (OM).
You must uniquely assign an employee to the chief position of an organizationalunit.
Besides the advantages it provides for Manager Self-Service, there is a wide rangeof other functions that can be used in conjunction with OM, such as in the areaof SAP WebFlow.
70 © 2006 SAP AG. All rights reserved. 2006/Q2

HR580 Lesson: Manager Self-Service (MSS)
Lesson Summary
You should now be able to:� Use Manager Self-Service
2006/Q2 © 2006 SAP AG. All rights reserved. 71

Unit Summary HR580
Unit SummaryYou should now be able to:� Use Manager�s Desktop� Use Manager Self-Service
72 © 2006 SAP AG. All rights reserved. 2006/Q2

Unit 4Info Systems in the SAP Easy Access
Menu
Unit OverviewAt the conclusion of this unit, you will be able to:
� Execute reports from the SAP Easy Access Menu� Create new info systems, and adapt existing info menus so that they meet
your requirements
Unit ObjectivesAfter completing this unit, you will be able to:
� Execute reports from the SAP Easy Access Menu� Create new info systems, and adapt existing info menus so that they meet
your requirements
Unit ContentsLesson: Info Systems in the SAP Easy Access Menu ... . . . . . . . . . . . . . . . . . . . 74
Exercise 4: Info Systems in the SAP Easy Access Menu.... . . . . . . . . . . 79
2006/Q2 © 2006 SAP AG. All rights reserved. 73

Unit 4: Info Systems in the SAP Easy Access Menu HR580
Lesson: Info Systems in the SAP Easy Access Menu
Lesson OverviewCall reports from the Info System and define your own role (user menu) toenable you to integrate customer reports and define the menu structure to meetcustomer-specific requirements.
Lesson ObjectivesAfter completing this lesson, you will be able to:
� Execute reports from the SAP Easy Access Menu� Create new info systems, and adapt existing info menus so that they meet
your requirements
Business Example� You are responsible for executing a variety of reports on a regular basis.� To do so, you use the info systems in the SAP Easy Access Menu.� You adjust the SAP Easy Access Menu so that it meets your requirements by
creating new area menus with their own reports.
Execute Reports
Figure 51: Standard Reporting:Reporting Using the ABAP Workbench
74 © 2006 SAP AG. All rights reserved. 2006/Q2

HR580 Lesson: Info Systems in the SAP Easy Access Menu
You can execute SAP standard reports directly from the ABAP Editor(Workbench). The prerequisites for doing so are that you have the appropriateauthorization, and that you know the technical name of the report in question.Start the ABAP Editor in the SAP Easy Access Menu by choosing: Tools→ABAP Workbench⇒ Development⇒ ABAP Editor.
Alternatively, you can start a report from the menu by choosing: System→Services⇒ Reporting.
Naming conventions are used to group HR-specific reports together. For example:
Name: Reports for:RP... Personnel Administration (PA)RH... Organizational Management and Personnel Development (PD)RPT... Time ManagementRPC... PayrollRPL... List Reports in Personnel AdministrationRPB... StatementsRPR... Travel ExpensesRPAQ... ABAP QueryRPAPL... Recruitment
Figure 52: Info Systems in the SAP Easy Access Menu
2006/Q2 © 2006 SAP AG. All rights reserved. 75

Unit 4: Info Systems in the SAP Easy Access Menu HR580
In Release 4.6B, area menus were converted to tree navigation (SAP Easy AccessMenu). The former report trees are now integrated with the application as infosystems and can be enhanced with new reports and queries.
You can search for standard reports in individual applications or acrossapplications. Application-specific standard reports are available in the infosystems of individual HR components. In the SAP Easy Access Menu, HRstandard reports are also grouped together in comprehensive info systems.
You can access the different info systems of individual HR components bychoosing:
� Human Resources⇒ <Component>⇒ <Info System>⇒ Reports� Human Resources⇒ Payroll⇒ <Continent>⇒ <Country>⇒ Info System� Human Resources⇒ Time Management⇒ <Component>⇒ Info System
HR Info System
As well as containing reporting tools, the HR Information System contains allHR-specific reports. Its structure corresponds to the HR components. Within thecomponents, reports are grouped together by subject matter. This makes it easierfor you to find specific reports. To access the HR Information System, choose:
Human Resources⇒ Information System→ Reports
Figure 53: Reports in the SAP Easy Access Menu
76 © 2006 SAP AG. All rights reserved. 2006/Q2

HR580 Lesson: Info Systems in the SAP Easy Access Menu
Apart from transactions that used to be included in area menus, you can alsoinsert all types of reports that used to be included in report trees directly into areamenus. Each report without a transaction code is automatically assigned a newtransaction code, which is then inserted into the menu.
Path: Tools→ ABAP Workbench→ Development⇒ Other Tools→ Area Menus.
If you do not want a transaction code generated automatically, you must create itbeforehand.
Define Your Own User Menu
Figure 54: Define Your Own User Menu
To integrate your own reports in a role, perform the following steps:
� Integrating reports directly in the role or via an area menu, for example� Profile generation� User assignment
These steps are part of general role maintenance. This course merely providesyou with an overview of them. You access role maintenance in the SAP EasyAccess Menu by choosing Tools⇒ Administration⇒ User Maintenance⇒ Roles.
If you require further information on this subject, see the online help for rolemaintenance or the exercises for this unit.
2006/Q2 © 2006 SAP AG. All rights reserved. 77

Unit 4: Info Systems in the SAP Easy Access Menu HR580
Figure 55: Info Systems in HR
All SAP report trees are integrated into the SAP Easy Access Menu. As a result,the reports of every HR component are accessed via the same menu path:
Human Resources⇒ <Component>⇒ Information System⇒ Reports
To access the entire HR report tree (formerly known as HR00), choose
Human Resources⇒ Information System→ Reports
78 © 2006 SAP AG. All rights reserved. 2006/Q2

HR580 Lesson: Info Systems in the SAP Easy Access Menu
Exercise 4: Info Systems in the SAP EasyAccess Menu
Exercise ObjectivesAfter completing this exercise, you will be able to:� Execute reports from the SAP Easy Access Menu� Create an output list based for example on the �Birthday List� report� Use the standard output functions� Define display variants and set initial variants� Create a new info system and include it in the Easy Access Menu
Business Example� You are responsible for executing a variety of reports on a regular basis.� To do so, you use the info systems in the SAP Easy Access Menu.� You adjust the SAP Easy Access Menu so that it meets your requirements
by adding your own reports.
Task 1:
Hint: Use the evaluation period TODAY unless specified otherwise inthe exercises.
Executing the Birthday List
You require a list of birthdays for all employees in personnel area 1000/Hamburg.
1. Create this list by using the Birthday List report in the PersonnelAdministration info system.
2. Use the filter function to restrict output to just employees who were bornin 1965.
3. Use the filter function to restrict output to only male employees who wereborn in 1965.
Continued on next page
2006/Q2 © 2006 SAP AG. All rights reserved. 79

Unit 4: Info Systems in the SAP Easy Access Menu HR580
Task 2:Executing the Employee List
You require a simple list of your employees. You create this list with the report ofthe same name (Employee List) in the Info system of Personnel Administration.Execute the report in two different ways:
Variant 1: To select persons, use the Personnel area field (and the appropriatepersonnel area, 1000/Hamburg).
Variant 2: To select persons, choose Organizational Structure and the appropriateorganizational unit in IDES AG (Exec. Director - Germany→ Production andS&D⇒ Production (D)⇒ Hamburg Site).
1. Hide the following columns so they are not included in data output:
PersIDNo, name at birth, leaving.
2. Once you have hidden these columns, save the layout as Variant##.
3. Execute the report again. When the result is output, switch to the /Variante##layout you have just defined.
4. Define Variant## as a default setting.
5. Execute the report again.
Task 3: OptionalCreating a User Menu/Role
1. Integrate two reports in the single role T_HR580_AG_## assigned to you:
Access role maintenance:
Tools→ Administration⇒ User Maintenance⇒ Role Administration⇒Roles.
Enter your role.
Transfer the following reports or transactions to the role menu:
- ABAP Report: Employee List (RPLMIT00)
- SAP Query: Birthday List of the /SAPQUERY/ H2 user group in theglobal area)
To do so, on the Menu tab page choose Insert Report.
2. Now generate the appropriate authorization profiles: To do so, accessthe Authorizations tab page, choose Change authorization data, and thenchoose Generate on the following screen.
Continued on next page
80 © 2006 SAP AG. All rights reserved. 2006/Q2

HR580 Lesson: Info Systems in the SAP Easy Access Menu
Update your authorizations. To do so, access the User tab page, enter youruser name and perform a complete user comparison.
3. In the SAP Easy Access menu, the user menu is now active and the roleis displayed. Call it again to see the new menu structure. Note the newreports in your role.
2006/Q2 © 2006 SAP AG. All rights reserved. 81

Unit 4: Info Systems in the SAP Easy Access Menu HR580
Solution 4: Info Systems in the SAP EasyAccess MenuTask 1:
Hint: Use the evaluation period TODAY unless specified otherwise inthe exercises.
Executing the Birthday List
You require a list of birthdays for all employees in personnel area 1000/Hamburg.
1. Create this list by using the Birthday List report in the PersonnelAdministration info system.
a) In the SAP Easy Access menu, choose
Human Resources⇒ Personnel Management⇒ Administration⇒Information System⇒ Reports⇒ Employees
and start the report Birthday List.
Enter 1000 in the Personnel Area field.
Choose Execute.
2. Use the filter function to restrict output to just employees who were bornin 1965.
a) To select the Year column, click once on the column header.
Choose Edit→ Set Filter.
In the Determine Values for Filter Criteria dialog box that appears,enter 1965 in the Year field (no period selection).
Choose Execute.
3. Use the filter function to restrict output to only male employees who wereborn in 1965.
a) Choose Edit→ Set Filter.
In the Define Filter Criteria dialog box, define the Year of birth andGender (Gend.) fields as filter criteria (copy from right to left).
Choose Transfer.
In the Filter Criteria dialog box, enter 1965 (no period selection) in theYear of birth field and 1 (male) in the Gender field.
Choose Execute.
Continued on next page
82 © 2006 SAP AG. All rights reserved. 2006/Q2

HR580 Lesson: Info Systems in the SAP Easy Access Menu
Task 2:Executing the Employee List
You require a simple list of your employees. You create this list with the report ofthe same name (Employee List) in the Info system of Personnel Administration.Execute the report in two different ways:
Variant 1: To select persons, use the Personnel area field (and the appropriatepersonnel area, 1000/Hamburg).
Variant 2: To select persons, choose Organizational Structure and the appropriateorganizational unit in IDES AG (Exec. Director - Germany→ Production andS&D⇒ Production (D)⇒ Hamburg Site).
1. Hide the following columns so they are not included in data output:
PersIDNo, name at birth, leaving.
a) In the SAP Easy Access menu, choose
Human Resources⇒ Personnel Management? Administration⇒Information System⇒ Reports⇒ Employees⇒ Employee List
� Variant 1: Selection via Field
In the Personnel area field, enter 1000.
Choose Execute.
� Variant 2: Selection using organizational structure
Choose Org. structure (top right pushbutton).
In the dialog box Select Organizational Unit under IDES AGselect the organizational unit Exec. Director - Germany⇒Production and S&D⇒ Production (D)⇒ Hamburg Site).
Choose Continue. This takes you back to the selection screen.The Org structure pushbutton is now highlighted in a differentcolor. This indicates that you used the pushbutton to make yourselection.
Choose Execute.
b) Position the cursor on the columns Pers lD No., Name at birthandLeaving or hold down the CTRL key and select all three together.
c) Right-click the columns and choose Hide from the context menu.
(Alternatively, choose Settings Layout⇒ Change to hide all threefields in one step.)
Continued on next page
2006/Q2 © 2006 SAP AG. All rights reserved. 83

Unit 4: Info Systems in the SAP Easy Access Menu HR580
2. Once you have hidden these columns, save the layout as Variant##.
a) Choose Settings⇒ Layout⇒ Save.
In the Layout and Description fields, enter /Variant##.
Where relevant, select the User-specific indicator (and change thename of the layout accordingly).
b) Choose Continue.
c) Choose Back. This takes you back to the selection screen.
3. Execute the report again. When the result is output, switch to the /Variante##layout you have just defined.
a) In the Personnel area field, enter 1000.
Choose Execute.
b) Choose Settings⇒ Layout⇒ Choose, and select your /Variant##.
4. Define Variant## as a default setting.
a) Choose Settings⇒ Layout⇒ Administer.
Select your /Variante## (by using the first column to select theappropriate row).
b) Choose Edit→ Set Default.
Choose Save.
Choose Back. This takes you back to the output screen.
Choose Back. This takes you back to the selection screen.
5. Execute the report again.
a) In the Personnel area field, enter 1000.
b) Choose Execute. When the report is executed, data is automaticallyoutput in accordance with the layout you just defined.
Task 3: OptionalCreating a User Menu/Role
1. Integrate two reports in the single role T_HR580_AG_## assigned to you:
Access role maintenance:
Tools→ Administration⇒ User Maintenance⇒ Role Administration⇒Roles.
Enter your role.
Continued on next page
84 © 2006 SAP AG. All rights reserved. 2006/Q2

HR580 Lesson: Info Systems in the SAP Easy Access Menu
Transfer the following reports or transactions to the role menu:
- ABAP Report: Employee List (RPLMIT00)
- SAP Query: Birthday List of the /SAPQUERY/ H2 user group in theglobal area)
To do so, on the Menu tab page choose Insert Report.
a) In the SAP Easy Access menu, choose
Tools→ Administration⇒ User Maintenance⇒ Role Administration⇒ Roles
b) In the Role field, enter T_HR580_AG_##.
c) Choose Change role.
d) Switch to the Menu tab page.
e) Choose Insert Report.
f) Select the report type �ABAP Report� and enter the report nameRPLMIT00.
Press Enter.
g) Choose Insert Report again.
h) Select the report type �SAP Query�, select �Globaler Area�, enter usergroup �/SAPQuery/H2� and choose the query �Birthday list�. PressEnter.
i) Choose Save. Confirm any messages output by pressing Enter.
2. Now generate the appropriate authorization profiles: To do so, accessthe Authorizations tab page, choose Change authorization data, and thenchoose Generate on the following screen.
Continued on next page
2006/Q2 © 2006 SAP AG. All rights reserved. 85

Unit 4: Info Systems in the SAP Easy Access Menu HR580
Update your authorizations. To do so, access the User tab page, enter youruser name and perform a complete user comparison.
a) Switch to the Authorizations tab page (which still contains a red trafficlight).
b) Choose Change authorization data (pushbutton).
c) Choose Save and Generate. Accept the default names proposed forthe profile and text.
d) Choose Back. The traffic light on the Authorizations tab page is nowgreen. The traffic light on the User tab page is red because the profileyou just created has not yet been compared with the assigned users.
e) Switch to the User tab page.
f) Enter your user ID.
g) Choose User compare (pushbutton).
h) In the Compare User Master Record of Role dialog box, chooseComplete compare. Confirm any information messages output with Yes.
i) Choose Back. This takes you back to the selection screen.
3. In the SAP Easy Access menu, the user menu is now active and the roleis displayed. Call it again to see the new menu structure. Note the newreports in your role.
a) Choose User Menu/SAP Menu to switch from one menu to another.
b) To test, choose User menu and check the two new reports added.
86 © 2006 SAP AG. All rights reserved. 2006/Q2

HR580 Lesson: Info Systems in the SAP Easy Access Menu
Lesson Summary
You should now be able to:� Execute reports from the SAP Easy Access Menu� Create new info systems, and adapt existing info menus so that they meet
your requirements
2006/Q2 © 2006 SAP AG. All rights reserved. 87

Unit Summary HR580
Unit SummaryYou should now be able to:� Execute reports from the SAP Easy Access Menu� Create new info systems, and adapt existing info menus so that they meet
your requirements
88 © 2006 SAP AG. All rights reserved. 2006/Q2

Unit 5Logical Databases and InfoSets
Unit OverviewAt the conclusion of this unit, you will be able to:
� Explain the importance of logical databases, InfoSets and user groups� List the functions of the logical databases PNP/PNPCE, PCH, and PAP� Create InfoSets and field groups
Unit ObjectivesAfter completing this unit, you will be able to:
� Explain the importance of logical databases, InfoSets and user groups� List the functions of the logical databases PNP/PNPCE, PCH, and PAP� Create infoSets and field groups
Unit ContentsLesson: Logical Databases, InfoSets, and User Groups ... . . . . . . . . . . . . . . . . 90Lesson: Creating and Changing InfoSets .. . . . . . . . . . . . . . . . . . . . . . . . . . . . . . . . . .104
Exercise 5: Creating and Changing InfoSets .. . . . . . . . . . . . . . . . . . . . . . . . . .119
2006/Q2 © 2006 SAP AG. All rights reserved. 89

Unit 5: Logical Databases and InfoSets HR580
Lesson: Logical Databases, InfoSets, and User Groups
Lesson OverviewExplain logical databases, InfoSets, and user groups
Lesson ObjectivesAfter completing this lesson, you will be able to:
� Explain the importance of logical databases, InfoSets and user groups� List the functions of the logical databases PNP/PNPCE, PCH, and PAP
Business Example� You need various reports to present to the Board that are not covered by
standard reports.� It is your task to generate these reports in the form of queries.� You want to take advantage of the possibilities offered by the logical
databases in HR.
Logical Databases, InfoSets, and User Groups
Figure 56: The functions of logical databases
Logical databases are special ABAP programs that provide data for processing byqueries or programs. Logical databases provide a particular view of the databasetables in the SAP System.
90 © 2006 SAP AG. All rights reserved. 2006/Q2

HR580 Lesson: Logical Databases, InfoSets, and User Groups
Logical databases can perform the following tasks:
1. Data Retrieval:
Personal data for each employee is loaded into the main memory, where itis available for processing.
2. Selection Screen:
On a selection screen, you can select employees according to organizationalcriteria, for example all hourly wage earners in a particular part of theenterprise.
3. Authorization Check:
The system checks whether the user starting a report is authorized to viewthe data in the report.
In addition, performance improvements in logical databases are passed on to allrelated programs and queries, without them needing to be changed themselves.
Figure 57: Logical Databases and InfoSets
InfoSets are special views of logical databases. An InfoSet determines whichfields of a logical database can be reported on by queries. InfoSets are assigned touser groups. InfoSets are structured according to field groups. Field groups inHR correspond to infotypes.
Each logical database has a standard selection screen that is determined by thestructure of the logical database. Irrespective of the structure of the databasetables that are used, the selection screen contains the selection parameters that are
2006/Q2 © 2006 SAP AG. All rights reserved. 91

Unit 5: Logical Databases and InfoSets HR580
most frequently used. When you define reports with logical databases, you areseldom required to select selection fields explicitly because they are included inthe standard selection screen.
Another method of acquiring an overview of the selection parameters of a logicaldatabase consists of defining and executing a query with the logical database.All of the selection parameters are included in the selection screen. If a largenumber of parameters is available, you can also display them by choosing Furtherselections.
Customer infotypes (namespace 9000-9999) can be included in InfoSets createdfor HR components.
Figure 58: InfoSets and User Groups
InfoSets are only available to users if the users have been assigned to user groups.
The prerequisites for working with Ad Hoc Query and SAP Query are:
1. You have created InfoSets and user groups2. You have assigned InfoSets to user groups3. Users can now create queries.
92 © 2006 SAP AG. All rights reserved. 2006/Q2

HR580 Lesson: Logical Databases, InfoSets, and User Groups
Figure 59: Assign InfoSets to User Groups
To set up an appropriate working environment for end users, the systemadministrator maintains user groups. Users who work in the same applicationare grouped together in user groups.
It does not matter which users within a user group actually defined its queries.They can be executed by every user assigned to this user group.
However, users assigned to a user group can only change and redefine queries ifthey have the appropriate authorization to do so.
Queries that belong to other user groups cannot be changed, but they can becopied and executed.
Every user can be assigned to more than one user group.
2006/Q2 © 2006 SAP AG. All rights reserved. 93

Unit 5: Logical Databases and InfoSets HR580
Figure 60: Global and Standard Query Area
A distinction is made between two query areas, the standard query area andthe global query area.
Standard query area:
� In the standard query area, all query objects (queries, InfoSets, user groups)are created and managed per client. Query objects are not linked to theWorkbench Organizer, which means they cannot be entered and transportedusing customary correction and transport procedures. The advantage of thisquery area is that it enables end users to develop queries in their clientswhich are not intended for system-wide use.
Global area:
� Query objects in the global query area are cross-client.
They are available throughout the entire system, that is, in all clients. Queryobjects in the global query area are linked to the Workbench Organizer. Theycan be entered and transported using customary correction and transportprocedures.
� You are not required to perform any activities either before or aftertransports. For this reason, the global query area is suitable for queries thatmust be developed and distributed as centrally usable objects. Query objectsdelivered by SAP as of Release 4.0 are also stored in this area.
94 © 2006 SAP AG. All rights reserved. 2006/Q2

HR580 Lesson: Logical Databases, InfoSets, and User Groups
Figure 61: Transports from the Global Area
The transactions used to maintain query objects check the name syntax. You areonly allowed to use name prefixes for query objects in the global query area.This is important because SAP query objects could be imported into this areawhen the system is upgraded. Query objects provided by SAP use the reservedname prefix �/SAPQUERY/�.
If you need to create queries in a user group whose prefix belongs to SAP, apartner, or another R/3 customer, you must take careful note of the fact thatqueries inherit their user group's prefix. Such user groups could end up in thesystem after a release upgrade or transport has been performed. The query thenconstitutes part of the objects that are assigned to the namespace specified bythe user group's prefix.
2006/Q2 © 2006 SAP AG. All rights reserved. 95

Unit 5: Logical Databases and InfoSets HR580
Logical databases in HR
Figure 62: Logical Databases in HR
The system includes three logical databases - PNPCE (will eventually replacePNP), PCH, and PAP - that enable you to create InfoSets for HR. The logicaldatabase you need to use when creating an InfoSet is determined by the HRcomponents on which you need to report.
The following assignments between components and logical databases apply:
� HR-Administration: PNP or PNPCE� Time Management: PNP or PNPCE� Payroll PNP or PNPCE� Recruitment: PAP� Personnel Development: PCH� Organizational Management: PCH� Training and Event Management: PCH
96 © 2006 SAP AG. All rights reserved. 2006/Q2

HR580 Lesson: Logical Databases, InfoSets, and User Groups
Figure 63: a) The New Logical Database PNPCE
As of SAP R/3 Enterprise Core 4.70 (SAP_HR 470) there is a new logicaldatabase PNPCE that is intended to eventually replace the logical database PNP.
The new features of logical database PNPCE compared with PNPCE mainlyfall into two categories:
� Unlike the logical database PNP, the logical database PNPCE can be usedwith Concurrent Employment. For more information about ConcurrentEmployment, see note 517071.
� The logical database PNPCE contains the following enhancements and newfeatures that are not contained in the logical database PNP:
� Customizable list box for setting the reporting period that is intuitiveand easy to use.
� Individual specification of person selection period and data selectionperiod has been simplified.
� Integration of reporting period and payroll period on one screen (noscreen change required).
� Clearly-structured selection screen with all pushbuttons in the generalapplication toolbar.
� Clearly-structured in-place display of dynamic selection options(optionally as a dialog box, as with PNP).
� Support for selection IDs when selecting personnel numbers.
2006/Q2 © 2006 SAP AG. All rights reserved. 97

Unit 5: Logical Databases and InfoSets HR580
These general functional enhancements can be used independent of the ConcurrentEmployment concept. For this reason, it is recommended to use the logicaldatabase PNPCE for all new developments. The logical database PNP willcontinue to be supported.
If you want to report on data from the Personnel Administration, Payroll, or TimeManagement components, use logical database PNPCE to create InfoSets. Inolder releases, you can import the Query Generator with the help of notes andSupport Packages (4.6C: note 305118; 4.6B: note 187767; 4.5B: note 153684).
You can find detailed documentation in the SAP Service Marketplace under thequicklink: /HR→ Services for mySAP HR→ Special Documentation.
Figure 64: Data Model Personnel Administration and Recruitment
Infotypes are units of information in HR. Infotypes group together coherent datafields.
They are a way of structuring the information that is reported on by reports orqueries.
To preserve the history of infotypes, the system saves them in time-specificrecords. For each infotype record the system records a validity period. Usually,therefore, there are several data records for each of an employee's infotypes.Therecords are distinguished by their differing validity periods.
98 © 2006 SAP AG. All rights reserved. 2006/Q2

HR580 Lesson: Logical Databases, InfoSets, and User Groups
Using a time constraint, you specify how the data records of an infotype react toeach other over time:
� Time constraint 1: For the whole time an employee belongs to the enterprise,there must be exactly one valid data record of a particular infotype.
� Time constraint 2: At any particular point in time there can be at most onevalid data record of a particular infotype.
� Time constraint 3: At any particular point in time there can be unlimitedvalid data records of a particular infotype.
For a personnel or applicant number to exist, the infotypes Actions (0000),Organizational Assignment (0001), Personal Data (0002), and Payroll Status(0003) must be in existence.
Figure 65: b) Logical Database PCH
If you want to report on data from the following components:
� Organizational Management� Personnel Cost Planning� Training and Event Managament� Personnel Development
use logical database PCH.
If you create InfoSets using logical database PCH, note that you can restrict theInfoSet using an object type.
2006/Q2 © 2006 SAP AG. All rights reserved. 99

Unit 5: Logical Databases and InfoSets HR580
The InfoSet can only be used for Ad Hoc Query if it has been restricted using anobject type. In this instance, the system only allows you to select infotypes thatare relevant to the selected object type.
If you do not restrict the InfoSet using an object type, the system allows you toselect all of the infotypes available in logical database PCH.
Figure 66: Data Model Personnel Planning
Organizational Management is based on the concept that each element in anorganization is depicted as an independent object with individual characteristics.These objects were individually created and maintained. Then they are connectedto each other using relationships (see above). This creates a network whoseflexibility enables you to carry out personnel planning, previews, and reports.
Since cost centers are not maintained in Organizational Management, they arean external object type.
In Customizing you can enhance the existing data model by - for example -defining new object types and allowing new relationships between object types.Each standard object type name consists of two letters. The customer namespaceis 00 to 99.
This data model (object types and relationships) is also the foundation for otherpersonnel planning applications, such as Training and Event Management(business event hierarchies), Personnel Development (qualifications catalog andso on).
100 © 2006 SAP AG. All rights reserved. 2006/Q2

HR580 Lesson: Logical Databases, InfoSets, and User Groups
Figure 67: Reporting on Data From PNP/PNPCE and PCH
An InfoSet can only be based on one logical database. For this reason, you canonly select one logical database to create an InfoSet.
The following situations can arise for logical databases PNP and PCH. Theyrequire you to decide which logical database to use to create a correspondingInfoSet.
� a) You want to output data from infotypes 0-999 and data from someinfotypes from the PCH database , e.g. Personnel Development orTraining and Event Management infotypes:
In this case, you must work with the logical database PNP/PNPCE . If youcreate an InfoSet using logical database PNP/PNPCE, you can also includeinfotypes from logical database PCH in the InfoSet.
� b) You want to report on all HR master data infotypes:
In this case, you must work with the logical database PCH. When you createthe Infoset, do not select an object type (in which case you can only workwith SAP Query) or select the object type P (Person) or S (position).
2006/Q2 © 2006 SAP AG. All rights reserved. 101

Unit 5: Logical Databases and InfoSets HR580
Figure 68: c) Logical Database PAP
If you want to report on data from the Recruitment component, use logicaldatabase PAP to create InfoSets. If you select logical database PAP to create anInfoSet, the system automatically provides you with an appropriate selectionof relevant infotypes.
102 © 2006 SAP AG. All rights reserved. 2006/Q2

HR580 Lesson: Logical Databases, InfoSets, and User Groups
Lesson Summary
You should now be able to:� Explain the importance of logical databases, InfoSets and user groups� List the functions of the logical databases PNP/PNPCE, PCH, and PAP
2006/Q2 © 2006 SAP AG. All rights reserved. 103

Unit 5: Logical Databases and InfoSets HR580
Lesson: Creating and Changing InfoSets
Lesson OverviewIn this lesson, you learn how to create and change InfoSets.
Lesson ObjectivesAfter completing this lesson, you will be able to:
� Create infoSets and field groups
Business ExampleOnce you have familiarized yourself with the basic technical terms, you want todefine InfoSets. These should contain the fields you require for your queries.
Procedure for Creating InfoSets
Figure 69: Procedure for Creating and Changing InfoSets
104 © 2006 SAP AG. All rights reserved. 2006/Q2

HR580 Lesson: Creating and Changing InfoSets
To create InfoSets, perform the following steps:
1. Select a logical database depending on the components used and thepurpose of the InfoSet.
(applies to PCH only): if the InfoSet is intended for Ad Hoc Query, select therequired object type.
2. Select the relevant infotypes.
For additional information on which infotypes are used for whichcomponents, see HR Infotypes manual.
3. Activate or deactivate other fields (in the standard system, allinfotype-specific fields and the most important additional fields are active).You are advised to avoid creating unnecessarily large InfoSets. This makesthem easier to use. You can reactivate fields and include more infotypesat any time.
4. Rename field groups if necessary.5. Saveand generate InfoSet.6. As soon as you have generated the InfoSet, assign it to a user group and
perform a test to ensure that the InfoSet is complete.
Figure 70: Initial Maintenance Screen for Reporting on Persons/ Applicants
2006/Q2 © 2006 SAP AG. All rights reserved. 105

Unit 5: Logical Databases and InfoSets HR580
The maintenance interface for InfoSets is set up as follows:
� You select the infotypes for an InfoSet using checkboxes in a Tree Control.� If an InfoSet is created through HR Master Data (logical database
PNP/PNPCE), the HR infotypes are grouped according to the user groupselected (which you can set under User Groups→ Change View). You canselect Personnel Planning objects and their related infotypes from the list ofallowed relationships in the group Infotypes of Related Objects.
� You can modify the order of the field groups in an InfoSet and the order ofthe fields in a field group if you need to. You can change the names of fieldsand field groups. The InfoSet is displayed in the InfoSet Query exactlyas you created it.
� You can change the selection of infotypes in an InfoSet at a later date ifrequired. You can add or remove infotypes later. You can only remove aninfotype if none of the fields is used in a query.
Figure 71: Initial Maintenance Screen for Reporting on Personnel PlanningObjects
If you use the logical database PCH to create an InfoSet that you can use to selectobjects in the InfoSet Query, you must start by specifying an object type.
When you have selected the object type, the infotypes allowed for the object typeare available for selection. Additionally, under Infotypes of Related Objects, allobject types are listed that can be related with the object type you selected. On thenext level of the tree display, all relationships are listed that may exist between theobject type you selected and object types you can select. On the lowest level, allinfotypes of the specified object type are displayed.
106 © 2006 SAP AG. All rights reserved. 2006/Q2

HR580 Lesson: Creating and Changing InfoSets
Figure 72: Maintenance Interface for HR InfoSets
The InfoSet maintenance interface is divided into three sections. The whole ofthe left hand side is devoted to data field management in a tree structure. Atthe top right, another tree structure enables field group management. If youdouble-click on a field for detailed processing, details of the field are displayed atthe bottom right of the screen.
The data fields are displayed in two different formats: with or without a text field.With text field means that the system has found a text for this field, for examplein another table. The link is found via a foreign key specified in the dictionary.When you are processing a query, you can specify in the settings whether thesystem should output the value of the data field or of the text field.
To see a contextual menu of functions for the nodes in the tree structure,right-click an object. You can, for example, assign a data field to a field groupby right-clicking the desired field group. In the query, you can only select fieldsthat you have assigned to a field group.
2006/Q2 © 2006 SAP AG. All rights reserved. 107

Unit 5: Logical Databases and InfoSets HR580
The New Logical Database PNPCE
Figure 73: The New Query Generator of the Logical Database PNPCE
When you use generic reporting tools such as SAP Query and the InfoSet query,the source code is generated automatically by means of a query generator. Thesource code generated in this way is regulated by two main elements, namely thegeneration logic of the query generator and query definition.
As of SAP R/3 Enterprise Core 4.70 (SAP_HR 470), the new query generatoris available in SAP Query for the logical databases of HR. In addition to thefunctions available so far, you can now configure the query logic at InfoSet level.This give you more flexibility when you want to define queries to meet differentrequirements.
You make the settings using switches, which the query generator processes. Wedistinguish between general switches and infotype-specific switches (see nextslide for details).
� General switches control the settings that are valid for the InfoSet as a whole.� Infotype-specific switches control settings that can be defined for each
infotype.
For detailed information about the switches and how they are used, see thecorresponding Customizing activity Create InfoSets for HR. You access theseCustomizing activities by choosing Human Resources⇒ Human ResourcesInformation System→ HR Settings for SAP Query⇒ Create InfoSets for HR.
108 © 2006 SAP AG. All rights reserved. 2006/Q2

HR580 Lesson: Creating and Changing InfoSets
General Switches and Infotype-Specific Switches
� A query generator generates the source code automatically� For business reasons, it may make sense to make logic-specific settings
for an infotype using
� general switches: valid for each InfoSet� infotype-specific switches: apply to each infotype (in this InfoSet)
General switches:
� BL_ALLOW-DUP_Lines - outputs identical (double) lines in the basic list� REPORT_CLASS - Set up report category (PNP and PNPCE)� PROCESS_LOCKED_RECORDS - Process locked data records (PNP and
PNPCE)� PROC_PERNR_PARTIAL_AUT - Process persons for which only partial
authorization is available (PNP and PNPCE)� PERSON_ONLY_ONCE - Process each person once only (PNPCE)
Infotype-specific switches:
� LAST_RECORD_ONLY - Process last data record only� PROVIDE - Merge neighboring/overlapping data records� PROVIDE_FIELD - Relevant fields for merging data records� PRIMARY_INFTY - Infotype relationship to primary infotype (infotype
views)� TIME_DEPENDENCE - Time dependence� DATA_REQUIRED - Existence of data records required� SPLIT_DATA_REQUIRED - Existence of data records required in split
period� NO_INDIRECT_EVALUATION - Indirectly reported wage types are not
calculated� IGNORE_WAGE_TYPE_OPERA - Ignore operation indicators(for
deduction wage types)� NO_DUPLICATE_LANGU - Output data records in one language only� CASE_SENSITIVE_SEL - Case-sensitive selection� ADD_FIELDS_SPLIT_DEP - HR additional fields considered
split-dependent� SPLIT_DEPENDENT_AF - Technical name of an HR additional field that is
split-dependent� SPLIT_INDEPENDENT_AF - Technical name of an HR additional field
that is split-independent
2006/Q2 © 2006 SAP AG. All rights reserved. 109
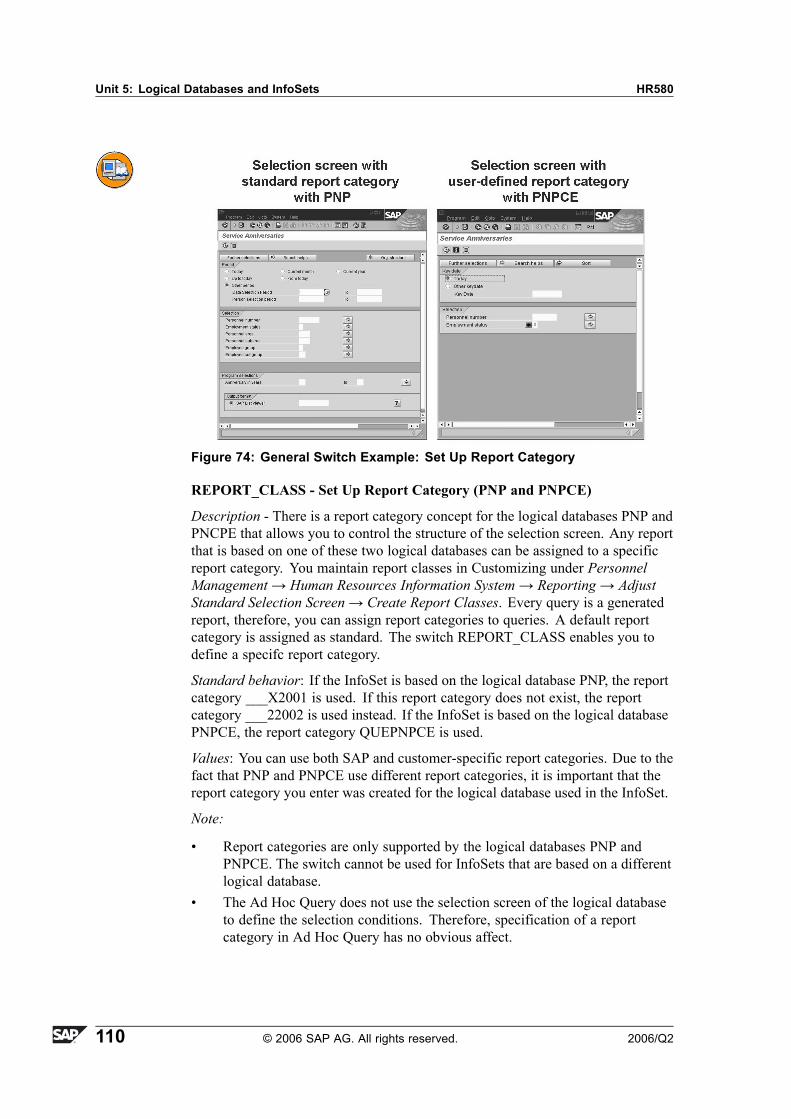
Unit 5: Logical Databases and InfoSets HR580
Figure 74: General Switch Example: Set Up Report Category
REPORT_CLASS - Set Up Report Category (PNP and PNPCE)
Description - There is a report category concept for the logical databases PNP andPNCPE that allows you to control the structure of the selection screen. Any reportthat is based on one of these two logical databases can be assigned to a specificreport category. You maintain report classes in Customizing under PersonnelManagement→ Human Resources Information System→ Reporting→ AdjustStandard Selection Screen→ Create Report Classes. Every query is a generatedreport, therefore, you can assign report categories to queries. A default reportcategory is assigned as standard. The switch REPORT_CLASS enables you todefine a specifc report category.
Standard behavior: If the InfoSet is based on the logical database PNP, the reportcategory ___X2001 is used. If this report category does not exist, the reportcategory ___22002 is used instead. If the InfoSet is based on the logical databasePNPCE, the report category QUEPNPCE is used.
Values: You can use both SAP and customer-specific report categories. Due to thefact that PNP and PNPCE use different report categories, it is important that thereport category you enter was created for the logical database used in the InfoSet.
Note:
� Report categories are only supported by the logical databases PNP andPNPCE. The switch cannot be used for InfoSets that are based on a differentlogical database.
� The Ad Hoc Query does not use the selection screen of the logical databaseto define the selection conditions. Therefore, specification of a reportcategory in Ad Hoc Query has no obvious affect.
110 © 2006 SAP AG. All rights reserved. 2006/Q2

HR580 Lesson: Creating and Changing InfoSets
Example:
� *$HR$ [COMMON]� *$HR$ REPORT_CLASS = �PNPCEALL�
Figure 75: Infotype-Specific Switch: Existence of Data Records Required
DATA_REQUIRED - Existence of data records required
Description: Data does not always exist for all infotypes that are output in a query.By default, queries display initial values (blanks) for persons or objects for whichno data records exist. A possible alternative is not to display persons or objects forwhich no data records exist. The switch DATA_REQUIRED enables you to dothis. If the switch is activated, a person or object is only displayed if at least onedata record exists for them in the evaluation period.
Standard behavior: As of Release 4.0 all persons and objects that fulfill theselection conditions are displayed. If no data record exists for an infotype in theevaluation period, the appropriate fields are displayed empty (with initial values).Before Release 4.0, the default was that only persons were displayed for whomdata records existed.
Values:
� �X�# Only persons and objects are displayed for which at least one datarecord exists in the evaluation period.
� � � #Standard: All persons and objects are displayed (that fulfill the selectionconditions). If no data records exist for one of these persons or objects, theinitial values are displayed.
2006/Q2 © 2006 SAP AG. All rights reserved. 111

Unit 5: Logical Databases and InfoSets HR580
Note: A similar switch exists, SPLIT_DATA_REQUIRED, which gives you evenmore control.
Example:
*$HR$ [P0004]
*$HR$ DATA_REQUIRED = �X�
Figure 76: Using Switches in InfoSets: Step 1
Make InfoSet-specific settings in the following way:
� On the Change InfoSet <Name of InfoSet> screen, choose Goto→ SourceCode→ Data.
� In the right screen area, (coding tab/coding section DATA) enter the switchand the value for the setting you require.
See the documentation in the Implementation Guide (IMG) under HR Settings forSAP Query→ Create InfoSets for HR.
112 © 2006 SAP AG. All rights reserved. 2006/Q2

HR580 Lesson: Creating and Changing InfoSets
Figure 77: Using Switches in InfoSets: Step 2
Figure 78: Using Switches in InfoSets: Step 3
2006/Q2 © 2006 SAP AG. All rights reserved. 113

Unit 5: Logical Databases and InfoSets HR580
Note the following syntax:
� General switches:
� *$HR$ [COMMON]� *$HR$ NAME_OF_SWITCH = �VALUE�
� Infotype-specific switches (NNNN,MMMM = infotype number):
� Definition of an infotype:
*$HR$ [PNNNN]
*$HR$ NAME_OF_SWITCH = �VALUE�
� Specification of different infotypes:
*$HR$ [P0000, P0004, P0006]
� Specification of an area:
*$HR$ [P0006 # P0009]
� Templates/placeholders (�+� for one character, �*� for a characterstring):
*$HR$ [P00++]
*$HR$ [P*]
*$HR$ [P0+1*]
Figure 79: Using Switches in InfoSets: Step 4
114 © 2006 SAP AG. All rights reserved. 2006/Q2

HR580 Lesson: Creating and Changing InfoSets
Other Functions
Figure 80: Additional Fields and Local Fields
The term additional fields covers all of the fields that do not exist in the databasetable of the corresponding infotype, but that are available for reporting purposes.
� Standard additional fields are additional fields that are required by themajority of customers, as experience has shown. For this reason, they areavailable in the standard system when InfoSets are created.
� Additional fields can also be defined by customers to meet special,company-specific requirements. They can be created in HR Customizing, orwhen an InfoSet is created. When they have been created in Customizing(under HR Settings for SAPQuery⇒ Additional Information for MaintainingInfoSets (Functional Areas)⇒ Define Additional Fields), they are alwaysavailable when InfoSets are created. If they are created in an InfoSet, theyare only available in that particular InfoSet.
Just like additional fields, local fields are used to meet specific requirements.They are defined within a query, and are only available for that query (for instance,in SAP Query).
2006/Q2 © 2006 SAP AG. All rights reserved. 115

Unit 5: Logical Databases and InfoSets HR580
Figure 81: Logging I
Through the Ad Hoc Query, you can receive logs on the execution of queries. Todo so, you must link an InfoSet to logging. You can do this in the maintenancetransaction SQ02 in the Extras menu.
Now, if you create and execute a query using this InfoSet (the query does not haveto be saved), the system saves information such as user, entries on the selectionscreen, and so on (AQPROT table). You can report on this information using thedata browser, existing queries from user group /SAPQUERY/QUERY_LOGGING(in the user group SAPQuery/SQ in the global work area), or with you own queries.
You can delete the logs in maintenance transaction SQ02, by choosing Managelogs under Extras. You access a selection screen on which you can restrict whichlogs are deleted. For example, you can delete all the logs for a user.
116 © 2006 SAP AG. All rights reserved. 2006/Q2

HR580 Lesson: Creating and Changing InfoSets
Figure 82: Logging II
You can log queries that are executed using Ad Hoc Query/InfoSet Query. Youcan switch the log function on and off as required.
You can delete logs if they are no longer required.
The AQ_QUERY_PROT Business Add-In enables you to create your own logs.For more information, see the SAP Implementation Guide (IMG) under SAPQuery→ Logging→ BAdI: Define Own Logging.
2006/Q2 © 2006 SAP AG. All rights reserved. 117

Unit 5: Logical Databases and InfoSets HR580
118 © 2006 SAP AG. All rights reserved. 2006/Q2

HR580 Lesson: Creating and Changing InfoSets
Exercise 5: Creating and ChangingInfoSets
Exercise ObjectivesAfter completing this exercise, you will be able to:� Create user groups� Generate InfoSets for HR components� Assign InfoSets to user groups� Enhance InfoSets and change the names of field groups� Transport Infosets
Business ExampleYou want to create your own queries. You therefore need to create InfoSets basedon the right logical database.
Task 1:Creating your own user group.
Hint: You work in the standard area that is defaulted. The trainer mayhave already set up the user group.
1. Create a user group HR580## (## = group number).
Assign yourself to this user group.
2. Assign InfoSets HR580PNPMINI and HR580PNPPCH to your user group.
3. In your user group, maintain parameter AQB (Setting Up User Group) withparameter value HR580##.
Task 2:Defining and generating Infosets.
1. Define and generate an InfoSet for Personnel Administration using thelogical database PNPCE. The InfoSet should contain infotypes 0000-0004and 0006-0008 PA_##).
Assign the InfoSet to your user group.
2. Define and generate an InfoSet for Training and Event Management usingthe logical database PCH (PE_##).
Continued on next page
2006/Q2 © 2006 SAP AG. All rights reserved. 119

Unit 5: Logical Databases and InfoSets HR580
To do so, use the object type course type (D) (or business event type) andinfotypes 1000 to 1002.
Assign the InfoSet to your user group.
3. Define an InfoSet using the logical database PNPCE that enables you toreport on Personnel Administration data (infotypes 0-2) and output thequalifications held by a person (name: PAQ_##).
Assign the InfoSet to your user group.
Task 3: OptionalCopying and editing Infosets.
1. Make a copy of InfoSet PA_##, rename the copy PA2_## and add infotypes9-12 to it.
Assign the InfoSet to your user group.
2. Change the names of some of the field groups by including the infotypenumbers in the name of the field group.
Task 4: OptionalTransporting an InfoSet from the global work area to the standard work area.
1. Switch to the global work area and select any standard InfoSet. Use theTransport InfoSets option, and theMERGE import option. Perform an initialtest transport, and determine whether the required InfoSet is transported.
2. Switch back to the standard query area, and rename the InfoSet Standard_##.
3. Assign the InfoSet to your user group.
120 © 2006 SAP AG. All rights reserved. 2006/Q2

HR580 Lesson: Creating and Changing InfoSets
Solution 5: Creating and ChangingInfoSetsTask 1:Creating your own user group.
Hint: You work in the standard area that is defaulted. The trainer mayhave already set up the user group.
1. Create a user group HR580## (## = group number).
Assign yourself to this user group.
a) In the SAP Easy Access menu, choose
Tools→ ABAP Workbench⇒ Utilities⇒ SAP Query⇒ User Groups.
b) You check the standard work area in the maintenance transaction bychoosing Environment⇒ Query areas.)
c) Enter the name of the new user group, HR580## (## = group number).
Choose Create.
d) This takes you to the User Group: Create or Change screen.
Enter a long text for the user group, and then choose Save.
This takes you back to the initial screen.
e) Choose Assign users and InfoSets. Enter your user name, and save.
2. Assign InfoSets HR580PNPMINI and HR580PNPPCH to your user group.
a) Choose Assign InfoSets. Select the InfoSets HR580PNPMINI andHR580PNPPCH.
Save your entries.
b) You can now use Ad Hoc Query to access these InfoSets. (They arerequired for exercises that you will do later.)
3. In your user group, maintain parameter AQB (Setting Up User Group) withparameter value HR580##.
a) To do so, choose System⇒ User Profile⇒ Own Data and choosethe Parameters tab page.
b) Enter AQB as the Parameter ID and enter HR580## as the Parametervalue.
Continued on next page
2006/Q2 © 2006 SAP AG. All rights reserved. 121

Unit 5: Logical Databases and InfoSets HR580
Task 2:Defining and generating Infosets.
1. Define and generate an InfoSet for Personnel Administration using thelogical database PNPCE. The InfoSet should contain infotypes 0000-0004and 0006-0008 PA_##).
Assign the InfoSet to your user group.
a) In the SAP Easy Access menu, choose
Tools→ ABAP Workbench⇒ Utilities⇒ SAP Query⇒ InfoSets
or
Human Resources⇒ Information System⇒ Settings⇒ CurrentSettings⇒ SAP Query: Maintain InfoSets
b) Enter the name of the new InfoSet PA_##.
Choose Create.
c) The template InfoSet: Title and Database is displayed.
Enter a name for the InfoSet, and the name of the logical database(PNPCE); (also select the appropriate option).
Press Enter.
d) The Infotype Selection screen is displayed.
From the infotype folder, choose the infotypes for the InfoSet. Ifnecessary, use the search icon to find the infotypes concerned.
e) Choose Execute.
The InfoSet is created and displayed in a selection tree.
Choose Generate.
f) Return to the initial screen.
Choose Role/User Group Assignment.
Select your user group HR580##.
Save your entries.
2. Define and generate an InfoSet for Training and Event Management usingthe logical database PCH (PE_##).
To do so, use the object type course type (D) (or business event type) andinfotypes 1000 to 1002.
Continued on next page
122 © 2006 SAP AG. All rights reserved. 2006/Q2

HR580 Lesson: Creating and Changing InfoSets
Assign the InfoSet to your user group.
a) In the SAP Easy Access menu, choose
Tools→ ABAP Workbench⇒ Utilities⇒ SAP Query⇒ InfoSets
or
Human Resources⇒ Information System⇒ Settings⇒ CurrentSettings⇒ SAP Query: Maintain InfoSets
b) Enter the name of the new InfoSet PE_##.
Choose Create.
c) In the following template, enter a name for the InfoSet and the nameof the logical database (PCH).
Save your entries.
d) In the following template, choose Determine Object Type to select theobject type course type (D) and the necessary infotypes 1000 to 1002.
Choose Continue.
e) The InfoSet is created and displayed in a selection tree.
Choose Generate.
Return to the initial screen.
f) Choose User Group Assignment.
Select your user group HR580##.
Save your entries.
3. Define an InfoSet using the logical database PNPCE that enables you toreport on Personnel Administration data (infotypes 0-2) and output thequalifications held by a person (name: PAQ_##).
Continued on next page
2006/Q2 © 2006 SAP AG. All rights reserved. 123

Unit 5: Logical Databases and InfoSets HR580
Assign the InfoSet to your user group.
a) In the SAP Easy Access menu, choose
Tools→ ABAP Workbench⇒ Utilities⇒ SAP Query⇒ InfoSets
or
Human Resources⇒ Information System⇒ Settings⇒ CurrentSettings⇒ SAP Query: Maintain InfoSets.
b) Enter the name of the InfoSet PAQ_## (##=group number).
Choose Create.
c) In the following template, enter a name for the InfoSet and the name ofthe logical database used (PNPCE).
Choose Continue.
d) In the following template, enter the necessary infotypes from PersonnelAdministration (0000 to 0002). You can access the infotypes fromPersonnel Planning using the node Infotypes of Related Objects.Select the object type Qualification→ Fulfills (A032)→ Object (1000).
Choose Continue.
e) The InfoSet is created and displayed in a selection tree.
Choose Generate .
Return to the initial screen.
f) Choose Role/User group assignment.
Select your user group HR580##.
Save your entries.
Task 3: OptionalCopying and editing Infosets.
1. Make a copy of InfoSet PA_##, rename the copy PA2_## and add infotypes9-12 to it.
Continued on next page
124 © 2006 SAP AG. All rights reserved. 2006/Q2

HR580 Lesson: Creating and Changing InfoSets
Assign the InfoSet to your user group.
a) In the SAP Easy Access menu, choose
Tools→ ABAP Workbench⇒ Utilities⇒ SAP Query⇒ InfoSets
or
Human Resources⇒ Information System⇒ Settings⇒ CurrentSettings⇒ SAP Query: Maintain InfoSets
b) Choose Copy.
Use the dialog box that is now displayed to enter the name of the InfoSetyou want to copy (PA_##), and the name of the new InfoSet (PA2_##).
Choose Continue.
c) Select the copied InfoSet.
Choose Change.
d) Choose Edit→ Change Infotype Selection.
On the following screen, choose the infotypes that you want to add(0009 to 0012).
Choose Continue.
The InfoSet is enhanced by the specified infotypes.
e) Choose Generate.
Return to the initial screen.
f) Choose User Group Assignment.
Select your user group HR580##.
Save your entries.
Continued on next page
2006/Q2 © 2006 SAP AG. All rights reserved. 125

Unit 5: Logical Databases and InfoSets HR580
2. Change the names of some of the field groups by including the infotypenumbers in the name of the field group.
a) Return to the initial screen.
Choose Change.
Select one of the field groups that you want to change.
b) Right-click the field group and choose Change Field Group to addthe infotype number to the field group name. Do this for a numberof field groups.
Choose Continue.
Save your entries.
c) Choose Generate.
Task 4: OptionalTransporting an InfoSet from the global work area to the standard work area.
1. Switch to the global work area and select any standard InfoSet. Use theTransport InfoSets option, and theMERGE import option. Perform an initialtest transport, and determine whether the required InfoSet is transported.
a) In the SAP Easy Access menu, choose
Tools→ ABAP Workbench⇒ Utilities⇒ SAP Query⇒ InfoSets
or
Human Resources⇒ Information System⇒ Settings⇒ CurrentSettings⇒ SAP Query: Maintain InfoSets.
b) To switch to the global query area, choose Environment⇒ Queryareas. The system displays a dialog box that enables you to select aquery area. Choose Global area. Select any InfoSet from the list.
Choose Transport.
c) Select Copy Global Area⇒ Standard Area and Transport InfoSets.
Enter the name of the InfoSet, and select the import optionMERGE.
Select Test run.
d) To start the transport, choose Execute.
Check the resulting log to determine whether the InfoSet can betransported. If the transport does not trigger any problems, deselect Testrun. To start the transport, choose Execute.
Continued on next page
126 © 2006 SAP AG. All rights reserved. 2006/Q2

HR580 Lesson: Creating and Changing InfoSets
2. Switch back to the standard query area, and rename the InfoSet Standard_##.
a) To switch to the standard query area, choose Environment⇒ Queryareas. The system displays a dialog box that enables you to select aquery area.
b) Select Standard area.
Select the InfoSet you transported from the list.
Choose Rename.
c) In the dialog box that is displayed, enter the new name ((Standard_##)).
Choose Continue.
3. Assign the InfoSet to your user group.
a) Choose Role/User group assignment.
Select your user group HR580##.
b) Save your entries.
2006/Q2 © 2006 SAP AG. All rights reserved. 127

Unit 5: Logical Databases and InfoSets HR580
Lesson Summary
You should now be able to:� Create infoSets and field groups
128 © 2006 SAP AG. All rights reserved. 2006/Q2

HR580 Unit Summary
Unit SummaryYou should now be able to:� Explain the importance of logical databases, InfoSets and user groups� List the functions of the logical databases PNP/PNPCE, PCH, and PAP� Create infoSets and field groups
2006/Q2 © 2006 SAP AG. All rights reserved. 129

Unit Summary HR580
130 © 2006 SAP AG. All rights reserved. 2006/Q2

Unit 6Ad Hoc Query
Unit OverviewAt the conclusion of this unit, you will be able to:
� Describe the principle of Ad Hoc Query� Select selection fields and a selection period� Enter selection values� Define and format output� Output and export reports� Save and reuse queries� Perform set operations� Explain how Ad Hoc Query is integrated in HR
Unit ObjectivesAfter completing this unit, you will be able to:
� Describe the principle of Ad Hoc Query� Choose selection fields� Enter selection values� Output and export reports� Save and reuse queries� Perform set operations� Explain how Ad Hoc Query is integrated in HR
Unit ContentsLesson: Defining First Queries with Ad Hoc Query .. . . . . . . . . . . . . . . . . . . . . . .132
Exercise 6: Defining First Queries .. . . . . . . . . . . . . . . . . . . . . . . . . . . . . . . . . . . . . .143Lesson: Defining Complex Queries with Ad Hoc Query .. . . . . . . . . . . . . . . . . .149
Exercise 7: Define Complex Queries .. . . . . . . . . . . . . . . . . . . . . . . . . . . . . . . . . . .163
2006/Q2 © 2006 SAP AG. All rights reserved. 131

Unit 6: Ad Hoc Query HR580
Lesson: Defining First Queries with Ad Hoc Query
Lesson OverviewIn this lesson, you learn how to define simple queries using Ad Hoc Query.
Lesson ObjectivesAfter completing this lesson, you will be able to:
� Describe the principle of Ad Hoc Query� Choose selection fields� Enter selection values
Business Example� You regularly require special reports for which the SAP system provides no
standard report. You want to use Ad Hoc Query to define your own reports,and then make them available to other colleagues.
� You start by informing yourself about the options offered to you by Ad HocQuery and you then use it to create the reports you require.
� An administrator provides you with the InfoSets you require to work withAd Hoc Query.
Ad Hoc Query
� Is a tool used to report on data from Human Resources.� Facilitates access to data from all areas of Human Resources.� Is characterized by simple selection of selection and output fields.
Ad Hoc Query is a tool that enables you to report on the following data:
� HR master data, data from Time Management, and payroll results (logicaldatabase PNPCE)
� Applicant master data (logical database PAP)� Data from Personnel Planning (logical database PCH)
You do not need programming skills to use Ad Hoc Query. Instead, you can selectselection and output fields simply by clicking on them or by using Drag&Drop.
Ad Hoc Query selects the requested data directly from the database. As a result, itsperformance is better than that of standard reports because the latter use logicaldatabases to retrieve data. The standard authorization check is performed whendata is selected and output.
132 © 2006 SAP AG. All rights reserved. 2006/Q2

HR580 Lesson: Defining First Queries with Ad Hoc Query
Figure 83: Structure of HR Info Systems
Before users can start the InfoSet query in the individual HR applicationcomponent information systems automatically using the delivered InfoSets, theymust be assigned to the relevant user group in the SAP Query. The following SAPQuery user groups are used for the individual application components:
� /SAPQUERY/H0 for Compensation Management� /SAPQUERY/H1 for Benefits� /SAPQUERY/H2 for Personnel Administration� /SAPQUERY/H4 for Recruitment� /SAPQUERY/H4 for Training and Event Management
Figure 84: The Ad Hoc Query: Overview
2006/Q2 © 2006 SAP AG. All rights reserved. 133

Unit 6: Ad Hoc Query HR580
You can select selection and output fields simply by using Drag&Drop. To doso, select one or more fields and then drag them to the required area (selectionor output). If fields have values and texts, you can use the text, the value, orboth (see �Processing Text Fields�).
The next time Ad Hoc Query is started, your user settings are reloaded (forexample, the last queries that you accessed). This is the case when you exit AdHoc Query and when you log off the system.
The output preview enables you to output real data (see �Data Output on theAd Hoc Query Screen�).
You can switch off object selection and work in �Basic Mode�, (choose Extras→Switch Off Object Selection). This gives you the advantage of being able to use allbasis mode functions, such as selections using texts (see �Processing Text Fields�).
Hint: The disadvantage of switching object selection off is that you nolonger benefit from improved performance (fast selection routine forpersons and Personnel Planning objects). Furthermore, you cannot restrictthe reporting set when object selection is switched off.
Figure 85: The Principle of Ad Hoc Query I
Ad Hoc Query's basic mode of operation consists of two steps:
� In the first step, you define one or more selection criteria and then start theselection. The result of this selection is a set of objects, such as persons,applicants, business events, or positions.
� In the second step, you output data as required for the selected objects.
134 © 2006 SAP AG. All rights reserved. 2006/Q2

HR580 Lesson: Defining First Queries with Ad Hoc Query
Figure 86: The Principle of Ad Hoc Query II
The Ad Hoc Query screen is divided into three main areas:
� The field groups and fields of the current InfoSet are displayed on the leftof the screen. This part of the screen is used to select selection and outputfields.
� The right side of the screen enables you to determine selection values, andexecute your selection.
� The lower part of the screen contains a preview of output.
This slide explains themain steps you use when working with Ad Hoc Query.
1. Select selection and output fields in the overview tree.2. Enter a value, and choose a selection option if necessary.3. Execute the selection (the hit list is determined by selecting objects that
match the selection criteria).4. Format output in the output preview.5. Access output.
2006/Q2 © 2006 SAP AG. All rights reserved. 135

Unit 6: Ad Hoc Query HR580
Figure 87: InfoSets for Ad Hoc Query
The InfoSets required for Ad Hoc Query are created and managed in SAP Query.When you create an InfoSet, you select the logical database on which it is based,and determine the infotypes which it includes. They are subsequently displayed inthe InfoSet as field groups. Once you have selected your infotypes, you determinethe fields of each infotype to be included in the field group.
The InfoSet determines the objects that you can select with Ad Hoc Query. Thefollowing scenarios are possible:
� The InfoSet is based on logical database PNP/PNPCE. These InfoSets enableyou to use Ad Hoc Query to select employees and then output data on them.It is also possible to include Personnel Planning infotypes in these InfoSets.Therefore, you can use them to output person-related Personnel Planningdata on the persons selected. Furthermore, you can use these InfoSets toreport on payroll results.
� The InfoSet is based on logical database PAP. These InfoSets enable you touse Ad Hoc Query to select applicants.
� The InfoSet is based on logical database PCH. These InfoSets enable you touse Ad Hoc Query to select objects of one object type, such as businessevents, qualifications, or positions. When you create the InfoSet, youdetermine the object type that it enables you to select.
136 © 2006 SAP AG. All rights reserved. 2006/Q2

HR580 Lesson: Defining First Queries with Ad Hoc Query
Figure 88: Choosing Selection and Output Fields
To access data in the system, Ad Hoc Query uses an InfoSet that provides you witha view of data in specific parts of HR. The view is structured by infotype. TheInfoSet is displayed as an overview tree on the initial Ad Hoc Query screen.
You can select selection and output fields simply by using Drag&Drop. To doso, select one or more fields and then drag them to the required area (selectionor output). If fields have values and texts, you can use the text, the value, orboth (see �Processing Text Fields�).
If you can flag a field in the Selection (S) column, you can use it as a selection field.
Select the selection field in the overview tree (column: Selection). It is then copiedto the list of selection criteria on the right of the screen. If you use more than oneselection criterion, they are linked by AND logic; for example, all persons wholive in London and are 25 years old.
You also select output fields in the overview tree. They are then copied to thepreview of output as columns. You can select output fields at the same time as youselect selection fields, or after you have made the selection. You can select outputfields from field groups as required.
You can output field contents as values (value output), and sometimes as texts(text output). For example, form of address key: value: 01, text: Mr; value: 02,text: Ms. If in doubt, specify both. The text often conveys more meaning. If youare a power user, you may only require the values.
The number of selection criteria and output fields that you have chosen is specifiedin the overview tree for each field group.
2006/Q2 © 2006 SAP AG. All rights reserved. 137

Unit 6: Ad Hoc Query HR580
Figure 89: Treatment of Text Fields
If object selection has been switched off, and if values and texts exist for a field,you can select objects using values or texts. For example, you can select personnelarea Frankfurt instead of personnel area 1000. The fact that object selectionhas been switched off is indicated by the absence of the hit list function and itsoutput field.
For the output, you can always use the value and, when available, the text also.
When choosing a field for selection or output, the following applies:
� Select using Drag&Drop → User setting (see slide �Setting forOutput/Export�).
� Select using checkboxes → User setting (see slide �Setting forOutput/Export�).
� Select from context menu⇒ You can choose between Value, Text or Valueand Text.
138 © 2006 SAP AG. All rights reserved. 2006/Q2

HR580 Lesson: Defining First Queries with Ad Hoc Query
Figure 90: Entering Selection Options and Values
To restrict the selection, you enter values and, if necessary, selection options forthe selection criteria.
You select the required selection option from input help.
You can enter values directly, or determine them using standard input help. Inputhelp enables you to select an input value, and/or use multiple selection to enterany required number of single values or intervals.
The values you can enter depend on the type of selection field (for example,numeric, alphanumeric, date).
You can also use patterns as values. For example, if you want to find all of theemployees whose names begin with S, enter S* as your value.
Figure 91: Editing the Selected Set of Objects
2006/Q2 © 2006 SAP AG. All rights reserved. 139

Unit 6: Ad Hoc Query HR580
The result of each selection is a set of objects (such as persons or business events)for which you can output data. You can also use the following editing optionsfor each object set:
� You can output the selected objects in a list.� You can sort the list.� If you do not want to output data for particular objects, you can remove
them from the list.� Pushbuttons enable you to
� Branch directly to HR master data for a set of persons.� Branch directly to applicant master data for a set of applicants.� Branch directly to detail maintenance for other sets of objects.
Figure 92: Selection Using Organizational Structure
Ad Hoc Queries are often required to report on employee data from one or moreorganizational units. Therefore, you can select persons using the organizationalstructure (if the InfoSets are based on logical database PNPCE).
To display the organizational structure, use the pushbutton. You can select theorganizational unit(s) you require from the overview tree that appears:
When you confirm, the persons who belong to the organizational unit(s) areselected immediately. They are written to Ad Hoc Query as a reporting set.
140 © 2006 SAP AG. All rights reserved. 2006/Q2

HR580 Lesson: Defining First Queries with Ad Hoc Query
If you make your selection using the organizational structure, the system takes thespecified reporting period into account and uses the current plan version.
Hint: If you use the organizational structure to select a higher-levelorganizational unit, the selection includes all of the persons who belong tothe selected organizational unit or one of the lower-level organizationalunits. To achieve the same result, you must use the Organizational unitselection field and explicitly specify all of the organizational units usingmultiple selection.
You can switch off object selection and work in �Basic Mode�, (choose Extras→ Switch Off Object Selection). This gives you the advantage of being able touse all basis mode functions, such as selections using texts (see �Processing TextFields�). The fact that object selection has been switched off is indicated by theabsence of the hit list function and its output field.
Hint: The disadvantage of switching object selection off is that you nolonger benefit from improved performance (fast selection routine forpersons and Personnel Planning objects). Furthermore, you cannot restrictthe reporting set when object selection is switched off.
2006/Q2 © 2006 SAP AG. All rights reserved. 141

Unit 6: Ad Hoc Query HR580
142 © 2006 SAP AG. All rights reserved. 2006/Q2

HR580 Lesson: Defining First Queries with Ad Hoc Query
Exercise 6: Defining First Queries
Exercise ObjectivesAfter completing this exercise, you will be able to:� Define selection criteria and output fields� Edit the hit list� Make your selection using the organizational structure
Business ExampleYou have special reporting requirements that are not satisfied by any standardreport. You want to use Ad Hoc Query to define your own reports, and then makethem available to other colleagues.
An administrator provides you with the InfoSets you require to work with AdHoc Query.
Hint: Work in the Standard Area in your user group HR580## forthese exercises.
Hint: Use Infoset HR580PNPMINI (or the one you created in theprevious unit: Infoset PA_##) unless instructed otherwise. Use TODAYas the reporting period unless instructed otherwise.
Hint: Your instructor will not be able to go through all of the exerciseswith you. The following exercises are flagged as OPTIONAL.
Task 1:CREATING A SIMPLE QUERY
You require a query that allows you to report on all employees according to theyear in which they were born. The query should display the following datafor employees in the specified order:
� Personnel numbers
� Last name
� First name
� Personnel area (as value and text)
1. Report on how many employees were born in 1965 by selecting the relevantemployees. How many employees does this include?
Continued on next page
2006/Q2 © 2006 SAP AG. All rights reserved. 143

Unit 6: Ad Hoc Query HR580
________________________________________________
2. After selecting, display the list of employees. You should branch to HRmaster data for any two employees.
3. Delete these two employees from the list of selected employees. What effectdoes this have on the number of hits?
______________________________________________
______________________________________________
______________________________________________
4. Start output.
Task 2:MULTIPLE SELECTION
Enhance the query you created in exercise 1 so that it determines which employeeswere born between 1965 and 1967 and have two or more children. Display theexact number of children they have.
1. Report on how many employees fulfill these criteria by selecting theemployees. How many employees does this include?
_______________________________________________
2. Start output. You can also save this query under the name GR##_AHQ_2.
Task 3:SELECTION USING ORGANIZATIONAL STRUCTURE
Define a NEW query that allows you to report on all employees who belong to theorganizational unit Human Resources (D) (in IDES AG in the area Exec. Director- Germany). Use Selection via Organizational Structure. Display the followingdata for the selected persons:
� Last name
� First name
� Organizational Unit
1. Start output. You can also save this query under the name GR##_AHQ_3.
144 © 2006 SAP AG. All rights reserved. 2006/Q2

HR580 Lesson: Defining First Queries with Ad Hoc Query
Solution 6: Defining First QueriesTask 1:CREATING A SIMPLE QUERY
You require a query that allows you to report on all employees according to theyear in which they were born. The query should display the following datafor employees in the specified order:
� Personnel numbers
� Last name
� First name
� Personnel area (as value and text)
1. Report on how many employees were born in 1965 by selecting the relevantemployees. How many employees does this include?
________________________________________________
a) In the SAP Easy Access menu, choose Human Resources ⇒Information System→ Reporting Tools⇒ Ad Hoc Query. As workarea, enter Standard area and as user group, enter HR580##. TheInfoset for exercises 1 to 4 is HR580PNPMINI.
Choose Continue (Enter).
Select TODAY as the reporting period.
b) In the field group Actions choose the output field Personnel Number. Inthe field group Personal Data choose the selection field Year of Birthand the output fields Last Name and First Name.
In the field group Organizational Assignment, choose the output fieldPersonnel Area (use the right mouse to choose the option OutputValue and Text). If necessary, change the sequence of the columns inthe output preview. To do this select one column at a time and useDrag&Drop to drag the column to the desired position.
c) Enter the value for the year of birth as 1965. Start selection by choosingHit List. In the neighboring field, read the number of selected persons.
2. After selecting, display the list of employees. You should branch to HRmaster data for any two employees.
a) Display the list of selected employees using the Display Number of Hits(pushbutton next to the hit list). To branch to HR master data, select therequired person and choose HR Master Data.
Continued on next page
2006/Q2 © 2006 SAP AG. All rights reserved. 145

Unit 6: Ad Hoc Query HR580
3. Delete these two employees from the list of selected employees. What effectdoes this have on the number of hits?
______________________________________________
______________________________________________
______________________________________________
a) To delete a person from the list, select the relevant person and chooseDelete Line(s). The number of hits is reduced by the number of personsyou deleted from the list.
4. Start output.
a) To start the output, choose Output.
Task 2:MULTIPLE SELECTION
Enhance the query you created in exercise 1 so that it determines which employeeswere born between 1965 and 1967 and have two or more children. Display theexact number of children they have.
1. Report on how many employees fulfill these criteria by selecting theemployees. How many employees does this include?
_______________________________________________
a) Extend the query you created in exercise 1 as follows:
In the field group Personal Data, choose Number of Childres as theselection field and the output field. Using multiple selection, enter theinterval 1965 to 1967 in the selection field Year of Birth. In the selectionfield Number of Children, enter 2 and choose the selection option >=.
b) Start selection by choosing Hit List. In the neighboring field, readthe number of selected persons.
2. Start output. You can also save this query under the name GR##_AHQ_2.
a) To start the output, choose Output. Optional: You can save this queryunder the name GR##_AHQ_2. To do this, choose Save Query Asand enter the name.
Continued on next page
146 © 2006 SAP AG. All rights reserved. 2006/Q2

HR580 Lesson: Defining First Queries with Ad Hoc Query
Task 3:SELECTION USING ORGANIZATIONAL STRUCTURE
Define a NEW query that allows you to report on all employees who belong to theorganizational unit Human Resources (D) (in IDES AG in the area Exec. Director- Germany). Use Selection via Organizational Structure. Display the followingdata for the selected persons:
� Last name
� First name
� Organizational Unit
1. Start output. You can also save this query under the name GR##_AHQ_3.
a) Query with selection of organizational unit using organizationalstructure:
b) To create a new query, choose Query⇒ New (Infoset HR580##, usergroup and work area are entered by default) and press Enter.
c) To make a selection using the organizational structure, select PersonsUsing Organizational Structure from the restrict by: selection listin the Reporting set group box.
d) To display the organizational structure, click once on theOrganizationalStructure entry. Under IDES AG, in the area Exec. Director - Germany,select the organizational unit Human Resources (D). All employeeswho belong to this organizational unit - including those assigned to thesubordinate organizational units - are selected. They are available as areporting set for additional reports or for display.
e) In the Personal data field group, select the Last name and First nameoutput fields. In the field group Organizational Assignment, choose theselection field Organizational Unit. Choose Output.
f) Optional: You can save this query under the name GR##_AHQ_3. Todo this, choose Save Query As and enter the name.
2006/Q2 © 2006 SAP AG. All rights reserved. 147

Unit 6: Ad Hoc Query HR580
Lesson Summary
You should now be able to:� Describe the principle of Ad Hoc Query� Choose selection fields� Enter selection values
148 © 2006 SAP AG. All rights reserved. 2006/Q2

HR580 Lesson: Defining Complex Queries with Ad Hoc Query
Lesson: Defining Complex Queries with Ad Hoc Query
Lesson OverviewIn this lesson, you learn how to define more complex queries using Ad Hoc Query.
Lesson ObjectivesAfter completing this lesson, you will be able to:
� Output and export reports� Save and reuse queries� Perform set operations� Explain how Ad Hoc Query is integrated in HR
Business Example� You regularly require special reports for which the SAP system provides no
standard report. You want to use Ad Hoc Query to define your own reports,and then make them available to other colleagues.
� You start by informing yourself about the options offered to you by Ad HocQuery and you then use it to create the reports you require.
� An administrator provides you with the InfoSets you require to work withAd Hoc Query.
Figure 93: Determining the Reporting Period
2006/Q2 © 2006 SAP AG. All rights reserved. 149

Unit 6: Ad Hoc Query HR580
The reporting period enables you to determine the period from which objects areretrieved. The system searches for objects that have valid infotype records thatmeet the selection criterion in the period you specified.
Examples:
� If you want to determine which employees belong to personnel area 1000today, use today as your reporting period. Today is the system date.
� If you want to determine which employees belonged to personnel area 1000in 1995, use other period to enter January 1 1995 as the start date, andDecember 31 1995 as the end date.
� If you want to determine which employees belong to the personnel area inthe current month, use the current month.
Hint: The system always selects all objects for which a valid recordexists at ANY point within the reporting period. If you report on anentire year (for example), the system selects employees who belonged toorganizational unit 1000 (for example) for just one day during that yearas well as employees who belonged to organizational unit 1000 for thewhole year.
Hint: The reporting period also affects data output (persons and dataselection period). You can separate these time periods on the selectionscreen if required.
Figure 94: Time Constraints and Data Output
150 © 2006 SAP AG. All rights reserved. 2006/Q2

HR580 Lesson: Defining Complex Queries with Ad Hoc Query
An infotype's time constraint affects the contents of the output list. When aselection is made, the system determines whether objects exist that meet theselection criterion during the reporting period (see the Reporting Period slide).
When output is executed, all of the valid records that exist for the selected objectsare output. If you report on data for a key date, different numbers of records areoutput depending on the time constraint specified for the infotype and possiblyits subtypes.
� Time constraint 1: one row is output per object because the system alwayscontains just one valid infotype record (for example, infotype 0002 PersonalData).
� Time constraint 2: one row is output per object because the system canonly ever contain one valid infotype record (for example, infotype 0050Time Recording Info).
� Time constraint 3: the system can contain several valid infotype records atthe same time. For this reason, the number of valid records determines thenumber of rows output per object (for example, infotype 0023 Other/PreviousEmployers).
� Subtypes with different time constraints: if an infotype has subtypes, thesubtypes' time constraints can determine that different numbers of recordsexist for each subtype. For this reason, the number of records that existdetermines the number of rows output per object. For example, you selectall of the employees who live in New York. Your selection lists all of thepersons who reside in New York. If you then output these persons' cities, arow is output for each valid city; for example, the permanent residence ofNew York (subtype with time constraint 1) and the temporary residences ofLondon, Berlin, and Walldorf (subtype with time constraint 3).
2006/Q2 © 2006 SAP AG. All rights reserved. 151

Unit 6: Ad Hoc Query HR580
Figure 95: Data Output on the Ad Hoc Query Screen
The lower part of the Ad Hoc Query screen contains a preview of output in theSAP List Viewer. It enables you to use example data to acquire an impressionof the output list's appearance.
The Refresh function enables you to replace the example data with real data. Thedata is output to the SAP List Viewer on the Ad Hoc Query screen. This meansthat the definition and result of a query are both included in a single screen.
Once you have output real data, you can use SAP List Viewer functions on the AdHoc Query screen. For example, you can:
� Search for entries� Calculate totals and subtotals� Display the output list in Excel and then use all Excel functions� Use ALV's export and display options
For more information about the functions of the SAP List Viewer, see the SAPLibrary under Getting Started⇒ Working with Tools and Functions→ Workingwith Lists→ SAP List Viewer for SAP GUI.
152 © 2006 SAP AG. All rights reserved. 2006/Q2

HR580 Lesson: Defining Complex Queries with Ad Hoc Query
Figure 96: Defining and Formatting Output
The preview of output allows you to see the layout of the output list before data isfinally output. It also enables you to format the output list.
You can:
� Sort the list by one or more columns.� Calculate totals for numeric columns in basic lists and calculate subtotals
using specific criteria (non-numeric columns).� Delete all output fields at once.� Initialize formatting.� Determine the position of the currency column in basic lists, or hide it
completely.
The context menu for ranked lists and statistics enables you to determine whetheradditional columns (mean value, share in %, and total number) are output.
2006/Q2 © 2006 SAP AG. All rights reserved. 153

Unit 6: Ad Hoc Query HR580
Figure 97: Types of Output
You can select the type of output. The type of output determines how data isdisplayed when output. You can choose from various types of list output andexport functions. For example, you can output data for spreadsheets. In thisinstance, a list is not output to the screen. Instead, the report is copied to a filethat you can then edit using a spreadsheet program.
Figure 98: Settings for Output/Export
154 © 2006 SAP AG. All rights reserved. 2006/Q2

HR580 Lesson: Defining Complex Queries with Ad Hoc Query
Choose Edit⇒ Settings to specify various output and export settings in a singledialog box.
� The Output tab page enables you to select the type of output list (basic list,statistics, ranked list) and the type of output (such as standard list, wordprocessing, and spreadsheet). It also enables you to determine whether thequery is started via a selection screen. Ad Hoc Query uses the SAP ListViewer as the standard type of output.
� The Stats/ranked list tab page enables you to determine the referencecurrency used to translate currency fields, and the reference unit used totranslate units of measurement. It also enables you to specify the number oflines included in a ranked list.
� The Crystal reports tab page enables you to determine how data is exportedto Crystal Reports if Crystal Reports is started directly from InfoSet Query.You can create a new Crystal Report each time data is exported, or you canexport data to an existing Crystal Report on your local PC.
� The Default: Val/text tab page enables you to determine whether the valueor the text is used when a field is selected by Drag&Drop or checkbox. Youcan override these defaults by using the context menu to select a field.
Figure 99: Type of output list
Basic lists enable you to output detailed overviews. Statistics and ranked listsenable you to output aggregated data.
2006/Q2 © 2006 SAP AG. All rights reserved. 155

Unit 6: Ad Hoc Query HR580
Example of a basic list: you want to output an overview of monthly salariesreceived by employees in an organizational unit. To do so, you use the requiredorganizational unit as a selection criterion and output the name and monthly salary.You select basic list as your output type. When output is defined this way, thecurrency field is output automatically.
Example of statistics: instead of an overview of individual salaries, you want tooutput monthly salary totals per organizational unit. In this instance, you use therequired organizational units as selection criteria, and organizational unit andmonthly salary as output fields. You select statistics as your output type. The totalof monthly salaries is output for each organizational unit. The number of valuesincluded in the total is only output if you have defined output accordingly. Atotals row is also output for each statistic. In this example, it contains the total ofmonthly salaries and the total number of values included.
Example of ranked list: you want to determine the investment types that are mostfrequently selected as savings plans at your enterprise. To do so, select all of theemployees at your enterprise. Select ranked list as your type of output list. Use theinvestment type as the only output field. The output list contains the investmenttypes, which are sorted by the number of employees who selected them. Thenumber of rows output in ranked lists is limited. The rank and number columnsare output automatically.
Figure 100: Restricting the Reporting Set
156 © 2006 SAP AG. All rights reserved. 2006/Q2

HR580 Lesson: Defining Complex Queries with Ad Hoc Query
If you do not restrict the reporting set, selections are performed for all of theobjects of an object type that are stored in the system. However, reports are oftenrequired for just one specific set of objects, such as the employees assigned to anorganizational unit or a group of persons who meet certain conditions. You cansatisfy this requirement by restricting the reporting set as appropriate.
You can use one of the following restrictions for sets of persons:
1. The current hit list, which you obtained by making a specific selection.2. A set of persons that you selected by using the organizational structure.3. A set of persons that you selected in HIS or Manager�s Desktop.4. A set of persons that you determined by using set operations.
You can define further restrictions of the reporting set (of persons). For moreinformation, access the Implementation Guide (IMG) for the Human ResourcesInformation System and read the section on Selection IDs.
Figure 101: Set Operations
You can use hit lists from more than one selection to perform set operations. Theadditional �Set operations� tab page enables you to do so.
2006/Q2 © 2006 SAP AG. All rights reserved. 157

Unit 6: Ad Hoc Query HR580
To perform a set operation, make a selection, copy the hit list to set A, make asecond selection, and copy the second hit list to set B. You can then performthe following set operations:
� Create intersections� Create unions� Add sets� Subtract sets
The resulting set can be used
� For further set operations� As a precondition for further selections� As a hit list, and therefore as the basis of data output
Set operations are suitable, for example, for
� �Negative selections�; that is, if you want to find employees for whom aspecific infotype record does not exist (for example, if a temporary residencehas not been recorded).
� Combinations of person sets that have been selected using different selectioncriteria, and for whom data must be output in a joint list.
Figure 102: Reporting on Data from Personnel Planning
158 © 2006 SAP AG. All rights reserved. 2006/Q2

HR580 Lesson: Defining Complex Queries with Ad Hoc Query
In earlier releases, Personnel Planning data could be output for selected sets ofpersons but could not be used to make selections. This restriction no longerapplies as of release 4.6C. The infotypes of related objects can now be used asselection and output fields for persons and Personnel Planning objects.
The prerequisite is an InfoSet created on the basis of logical database PNP/PNPCE(HR master data).
Figure 103: Reporting on Data from Personnel Planning
In earlier releases, you could only use Ad Hoc Query to select sets of persons. Youcould output any data from Personnel Administration for the selected persons, aswell as data from infotypes of related Personnel Planning objects. You could notuse Personnel Planning data to make selections.
You can also select Personnel Planning objects and report on related objects(business events and their related objects, for example).
The prerequisite is that you use an InfoSet specially created for selecting a specificobject type, such as business events (based on PCH).
2006/Q2 © 2006 SAP AG. All rights reserved. 159

Unit 6: Ad Hoc Query HR580
Figure 104: Reusing Queries
When you create queries, you can switch between query areas, user groups, andInfoSets. If you are assigned to a user group, you can save queries. The query isautomatically available to all of the users who belong to the same user group.
If you often perform reporting using the same selection criteria but differentvalues, you are advised to save queries without specifying values. Do not enterdata in the value and option fields before saving.
If you often perform reporting using the same selection criteria and the samevalues, you are advised to save queries with values.
Saved queries can be accessed from Ad Hoc Query, SAP Query, and menus. Ifyou access saved queries from Ad Hoc Query, you can then execute them, changethem if necessary, save them in their changed form, or save them with a new name.
SAP Query enables you to continue editing saved queries. You are advised tocontinue editing in SAP Query if you want to use particular output functions inSAP Query, such as summation levels or colors in the output list.
Caution: The technical name of a query must not exceed 14 characters,and must not contain any special characters with the exception ofunderscores and hyphens. Queries that contain a period, for example, canbe saved but cannot be reaccessed.
160 © 2006 SAP AG. All rights reserved. 2006/Q2

HR580 Lesson: Defining Complex Queries with Ad Hoc Query
Integration of Ad Hoc Query
� Information Systems� Access from HIS� Start from Manager's Desktop� Input help for object selection� Processing of selected object set in general reporting
Ad Hoc Query can be accessed in HR as a stand-alone tool from the various infosystems in the SAP Easy Access Menu. However, it is also integrated with otherHR reporting tools.
� You can access Ad Hoc Query from HIS. The set of persons selected inHIS is available as a reporting set in Ad Hoc Query. You can make furtherselections from this set, or use it as a hit list and output data on the persons.You can even use saved queries for the selected set of persons.
� In the same way, you can use Ad Hoc Query to process sets of personsdetermined inManager�s Desktop. To do so, select a suitable object fromthe Employee theme category in Manager�s Desktop, and access Ad HocQuery.
� Ad Hoc Query is also available in many HR input helps for selecting objectsin the system (for fast data entry in Personnel Administration, for example).
You can use standard reports to continue processing sets of objects selected byAd Hoc Query.
Figure 105: Conclusion
2006/Q2 © 2006 SAP AG. All rights reserved. 161

Unit 6: Ad Hoc Query HR580
This slide summarizes the options available to you in Ad Hoc Query.
You can select a set of objects as follows:
� Selection using selection fields, selection options, and values� Restriction of reporting set using any selections or set operations� Set Operations� Selection of set of persons in HIS or Manager�s Desktop� Selection of set of persons using organizational structure
You can continue to process data as follows:
� Output/export list with the required output fields� Process selected set of objects in general reporting; data is output by the
selected standard report� Display hit list, delete unnecessary objects as required
162 © 2006 SAP AG. All rights reserved. 2006/Q2

HR580 Lesson: Defining Complex Queries with Ad Hoc Query
Exercise 7: Define Complex Queries
Exercise ObjectivesAfter completing this exercise, you will be able to:� Define statistics and ranked lists� Create reports for Personnel Planning objects� Specify a reporting period� Save and reuse queries� Perform set operations� Branch to standard report processing
Business ExampleYou need special reports for HR master data because your requirements are notmet by any of the standard reports.
You define these reports using Ad Hoc Query.
Task 1:
Hint: Work in the Standard Area in your user group HR580## forthese exercises.
Hint: Use Infoset HR580PNPMINI (or the one you created in theprevious unit: Infoset PA_##) unless instructed otherwise. Use TODAYas the reporting period unless instructed otherwise.
Hint: Your instructor will not be able to go through all of the exerciseswith you. The following exercises are flagged as OPTIONAL.
STATISTICS AND RANKED LISTS
Define a NEW query that allows you to report on all employees who belong to thepersonnel area 1300, Frankfurt. Use the personnel area to select objects in thisexercise, do not select objects via the organizational structure.
1. Display statistics that show how many employees belong to a specificpersonnel subarea (= number of employees per personnel subarea). Howmany employees belong to the individual personnel subareas?
_________________________________________________
_________________________________________________
Continued on next page
2006/Q2 © 2006 SAP AG. All rights reserved. 163

Unit 6: Ad Hoc Query HR580
_________________________________________________
2. Display a ranked list that specifies the five most common places ofresidence for employees who belong to personnel area 1300. Display optionRanked ListWhich is the most popular location and which is the second mostpopular location in the ranked list?
_________________________________________________
_________________________________________________
You can also save this query under the name GR##_AHQ_4.
Task 2: OptionalCOPYING THE REPORTING SET HIT LIST
Change the query you created in exercise 2, task 6 so that you can report only onemployees in the personnel area 1000 Hamburg. The query should display thefollowing data in the specified order:
� Personnel numbers
� Last name
� First name
� Nationality
� Age
1. Select all employees from personnel area 1000. How many employees doesthis include?
_________________________________________________
2. For performance reasons, use this set of persons as the reporting set. Fromthis group of persons, select all employees whose nationality is French (FR)or Swiss (CH). How many employees does this include?
_________________________________________________
3. Start output. Sort the output list according to nationality.
4. Return to the initial screen of the Ad Hoc Query. Change the sequence ofcolumns in the output preview as follows:
� Age
� Nationality
� Last name
� First name
� Personnel numbers
Continued on next page
164 © 2006 SAP AG. All rights reserved. 2006/Q2

HR580 Lesson: Defining Complex Queries with Ad Hoc Query
5. Use the output preview to sort the list according to Nationality (first sortingcriterion) and Age (second sorting criterion).
Choose Spreadsheet (MS Excel) as the output form and then Standard List.Start the output and note the differences.
6. You can also save this query under the name GR##_AHQ_5.
Task 3:SET OPERATIONS
1. Use set operations to output all of the employees in the CABB personnel areawho do not have a temporary residence.
Choose Edit⇒ Settings and on the Output tab, check that the SelectionConditions indicator is not set.
You can store this query as GR##_AHQ_6.
Task 4: OptionalQUERYWITH INFOSET OF LOGICAL DATABASES PNPCE AND PCH
1. Change to InfoSet HR580PNPPCH for this exercise. Output a list ofemployees who belong to personnel area 1000, Hamburg. The list shouldcontain the following information: personnel number, last name, first name,qualification (name).
Sort the list according to last name or qualification.
You can also save this query under the name GR##_AHQ_7.
Task 5: OptionalSPECIFYING THE REPORTING PERIOD
1. Define a new query that enables you to determine which employees inpersonnel area CABB were hired to work on special projects in 1999(action type 01, reason for action 05). The list must include the followinginformation: personnel number, first name, last name, and entry date.
Use Other period as the reporting period (January 01 1999 - December 311999).
When were the employees hired?
_____________________________________________________
_____________________________________________________
Continued on next page
2006/Q2 © 2006 SAP AG. All rights reserved. 165

Unit 6: Ad Hoc Query HR580
Task 6: OptionalSTARTING STANDARD REPORTS
1. Use Ad Hoc Query to start the Employee List standard report (RPLMIT00)for all of the employees in either the CABB or 1000 Hamburg personnel area.
166 © 2006 SAP AG. All rights reserved. 2006/Q2

HR580 Lesson: Defining Complex Queries with Ad Hoc Query
Solution 7: Define Complex QueriesTask 1:
Hint: Work in the Standard Area in your user group HR580## forthese exercises.
Hint: Use Infoset HR580PNPMINI (or the one you created in theprevious unit: Infoset PA_##) unless instructed otherwise. Use TODAYas the reporting period unless instructed otherwise.
Hint: Your instructor will not be able to go through all of the exerciseswith you. The following exercises are flagged as OPTIONAL.
STATISTICS AND RANKED LISTS
Define a NEW query that allows you to report on all employees who belong to thepersonnel area 1300, Frankfurt. Use the personnel area to select objects in thisexercise, do not select objects via the organizational structure.
1. Display statistics that show how many employees belong to a specificpersonnel subarea (= number of employees per personnel subarea). Howmany employees belong to the individual personnel subareas?
_________________________________________________
_________________________________________________
_________________________________________________
a) To create a new query, choose Query⇒ New (Infoset HR580##, usergroup and work area are entered by default) and press Enter.
In the field group Organizational Assignment, choose the selectionfield Personnel Area and enter the value 1300. Start selection bychoosing Hit List.
b) In the field group Organizational Assignment, choose the selectionfield Personnel Area.
Choose Edit→ Settings. On the Output tab page, choose Statistics asthe Type of Output List. Choose Continue. Choose Output.
2. Display a ranked list that specifies the five most common places ofresidence for employees who belong to personnel area 1300. Display optionRanked ListWhich is the most popular location and which is the second mostpopular location in the ranked list?
Continued on next page
2006/Q2 © 2006 SAP AG. All rights reserved. 167

Unit 6: Ad Hoc Query HR580
_________________________________________________
_________________________________________________
You can also save this query under the name GR##_AHQ_4.
a) Return to the initial screen of the Ad Hoc Query. Delete the output fieldPersonnel Subarea. In the Addresses field group, select the Locationoutput field.
b) Choose Edit→ Settings. On the Output tab page, choose Ranked Listas the Type of Output List. On the tab page Statistics/Ranked Listenter the specify the number of rankings as 5.
Choose Continue.
c) Choose Output.
d) Optional: You can save this query under the name GR##_AHQ_1. Todo this, choose Save Query As and enter the name.
Task 2: OptionalCOPYING THE REPORTING SET HIT LIST
Change the query you created in exercise 2, task 6 so that you can report only onemployees in the personnel area 1000 Hamburg. The query should display thefollowing data in the specified order:
� Personnel numbers
� Last name
� First name
� Nationality
� Age
1. Select all employees from personnel area 1000. How many employees doesthis include?
Continued on next page
168 © 2006 SAP AG. All rights reserved. 2006/Q2

HR580 Lesson: Defining Complex Queries with Ad Hoc Query
_________________________________________________
a) Extend the query you created in exercise 2 as follows:
Delete the selection fields Year of Birth and Number of Children.Delete the output fields Personnel Area and Number of Children. In thePersonal data field group, select the employee�s Nationality and Ageoutput fields. In the field group Organizational Assignment, choose theselection field Personnel Area.
b) In the selection field Personnel Area, enter the value 1000. Startselection by choosing Hit List. In the neighboring field, read thenumber of selected persons.
2. For performance reasons, use this set of persons as the reporting set. Fromthis group of persons, select all employees whose nationality is French (FR)or Swiss (CH). How many employees does this include?
_________________________________________________
a) To use the selected number of persons as the reporting set, in theReporting Set area, choose No.of Hits.
In the field group Personal Data, choose the selection field Nationality.Access multiple selection for the Nationality selection field, and enterthe following values: FR and US.
Start selection by choosing Hit List. In the neighboring field, readthe number of selected persons.
3. Start output. Sort the output list according to nationality.
a) Choose Output.
b) In the output list, select the Nationality column. Choose Sort inAscending Order or Sort in Descending Order (pushbutton).
4. Return to the initial screen of the Ad Hoc Query. Change the sequence ofcolumns in the output preview as follows:
� Age
� Nationality
� Last name
� First name
� Personnel numbers
a) Choose Back to return to the initial screen.
b) Change the sequence of columns in the output preview by choosingone column at at a time and using Drag&Drop to drag the column tothe desired position.
Continued on next page
2006/Q2 © 2006 SAP AG. All rights reserved. 169

Unit 6: Ad Hoc Query HR580
5. Use the output preview to sort the list according to Nationality (first sortingcriterion) and Age (second sorting criterion).
Choose Spreadsheet (MS Excel) as the output form and then Standard List.Start the output and note the differences.
a) To select a line, click in any field in the output preview. Now chooseSort in Descending Order or Sort in Ascending Order.
b) A dialog box is displayed in which you can choose all fields fromthe Field Selection (=all selected output fields) that you want to useto sort the output list. Select the sorting fields you want and chooseShow Selected Fields (left arrow). Select the relevant field option todetermine whether each field is to be sorted in ascending or descendingorder. Choose Transfer.
c) Choose Edit→ Settings to access the Output tab page. Then selectSpreadsheet as the type of output and press Enter. To start the output,choose Output. In answer to the next two queries, enter Table andthen MS Excel.
d) Repeat this procedure for the output form Standard List.
6. You can also save this query under the name GR##_AHQ_5.
a) Optional: You can save this query under the name GR##_AHQ_5. Todo this, choose Save Query As and enter the name.
Task 3:SET OPERATIONS
1. Use set operations to output all of the employees in the CABB personnel areawho do not have a temporary residence.
Choose Edit⇒ Settings and on the Output tab, check that the SelectionConditions indicator is not set.
Continued on next page
170 © 2006 SAP AG. All rights reserved. 2006/Q2

HR580 Lesson: Defining Complex Queries with Ad Hoc Query
You can store this query as GR##_AHQ_6.
a) Select any output field you want (e.g. last name, city, address type).To show the Set operations tab page, choose Extras→ Show setoperations. Ensure that the indicator �Use Selection Conditions� isNOT set. To do so, choose Edit→ Settings and the tab page Output.
b) First select all employees in the personnel area cabb:
Choose the Personnel area selection field, and then make yourselection with the word cabb; (choose Refresh hit list.) Copy theselected employees to set A (choose Copy hits to set A).
c) In the Addresses InfoSet, select the Address record type selection field.Enter 2 (temporary residence).
d) Make your selection by choosing Refresh hit list. Copy the selectedemployees to set B (choose Copy hits to set B). By doing so, youhave copied all of the employees in personnel area CABB who havea temporary residence to set B.
e) Select the Set operations tab page. Sets A and B are both displayed.
f) To subtract set B from set A, select Set A minus set B and choosePerform operation. The system displays all of the persons who belongto the CABB personnel area and do not have a temporary residence.The set of persons is displayed in the Resulting set field. You mayhave to scroll down.
g) To output the list of persons, you must copy it to the hit list. To do so,select to hit list and choose Copy resulting set.
h) Switch to the Selection tab page. The hit list now only lists persons thatdo NOT have a temporary residence. Choose Output.
i) Optional: You can save this query under the name GR##_AHQ_6. Todo this, choose Save Query As and enter the name.
Task 4: OptionalQUERYWITH INFOSET OF LOGICAL DATABASES PNPCE AND PCH
1. Change to InfoSet HR580PNPPCH for this exercise. Output a list ofemployees who belong to personnel area 1000, Hamburg. The list shouldcontain the following information: personnel number, last name, first name,qualification (name).
Sort the list according to last name or qualification.
Continued on next page
2006/Q2 © 2006 SAP AG. All rights reserved. 171

Unit 6: Ad Hoc Query HR580
You can also save this query under the name GR##_AHQ_7.
a) To switch InfoSets, choose Query → New. The Create NewQuery � InfoSet Selection dialog box appears. Select the InfoSetHR580PNPPCH. Choose Continue. The selected InfoSet is displayedin the selection tree and you can use it to define queries.
b) In the field group Organizational Assignment, choose the selectioncriterion Personnel Area. In the selection field, Personnel Area, enterthe value 1000.
c) In the field group Personal Data, choose the output fields Last Nameand First Name. In the field group Qualification, choose the outputfield Qualification (Name). Check the sequence of output fields inthe output preview.
d) Choose Output. You can also save this query as GR##_AHQ_7 bychoosing Query⇒ Save as and entering a name.
Task 5: OptionalSPECIFYING THE REPORTING PERIOD
1. Define a new query that enables you to determine which employees inpersonnel area CABB were hired to work on special projects in 1999(action type 01, reason for action 05). The list must include the followinginformation: personnel number, first name, last name, and entry date.
Use Other period as the reporting period (January 01 1999 - December 311999).
When were the employees hired?
_____________________________________________________
Continued on next page
172 © 2006 SAP AG. All rights reserved. 2006/Q2

HR580 Lesson: Defining Complex Queries with Ad Hoc Query
_____________________________________________________
a) In the SAP Easy Access menu, choose Human Resources ⇒Information System→ Reporting Tools⇒ Ad Hoc Query. If you arealready in an InfoSet, choose Query⇒ New. As work area, enterStandard area and as user group, enter HR580##. The Infoset isHR580PNPMINI. Choose Continue.
Select TODAY as the reporting period unless otherwise instructed.
b) In the Personal data field group, select the Last name and First nameoutput fields. In the Actions field group, select the Entry date outputfield and the Action type and Reason for action selection fields.
In the field group Organizational Assignment, choose the selectionfield Personnel Area. You require the further selection field Entrydate in the field group Actions (to ensure that no person is hired for aspecial project BEFORE 1/1/99.
Enter the following values: CABB for the personnel area, 01 Hiringfor the action type, 01/01/99 to 12/31/99 for the entry date, and 05(special projects) for the reason for action.
Select Other period as the reporting period, and enter 01/01/1999 and12/31/1999. To select the appropriate persons, choose Hit list. ChooseOutput.
Choose Back to return to the overview and delete all output andselection fields.
Task 6: OptionalSTARTING STANDARD REPORTS
1. Use Ad Hoc Query to start the Employee List standard report (RPLMIT00)for all of the employees in either the CABB or 1000 Hamburg personnel area.
a) In the field group Organizational Assignment, choose the selectioncriterion Personnel Area. Enter personnel area CABB or 1000. Startselection by choosing Hit List. Choose Goto⇒ Start Report. Enter thestandard report�s technical name (RPLMIT00) in the window that isnow displayed, and select Start via selection screen. Choose Continue.
b) This takes you to the selection screen for the report, which you canexecute for the persons you selected earlier.
2006/Q2 © 2006 SAP AG. All rights reserved. 173

Unit 6: Ad Hoc Query HR580
Lesson Summary
You should now be able to:� Output and export reports� Save and reuse queries� Perform set operations� Explain how Ad Hoc Query is integrated in HR
174 © 2006 SAP AG. All rights reserved. 2006/Q2

HR580 Unit Summary
Unit SummaryYou should now be able to:� Describe the principle of Ad Hoc Query� Choose selection fields� Enter selection values� Output and export reports� Save and reuse queries� Perform set operations� Explain how Ad Hoc Query is integrated in HR
2006/Q2 © 2006 SAP AG. All rights reserved. 175

Unit Summary HR580
176 © 2006 SAP AG. All rights reserved. 2006/Q2

Unit 7SAP Query
Unit OverviewAt the conclusion of this unit, you will be able to:
� Create and change HR-specific queries using SAP Query� Include local fields in a query
Unit ObjectivesAfter completing this unit, you will be able to:
� Create and change HR-specific queries using SAP Query� Include local fields in a query
Unit ContentsLesson: Defining Queries with SAP Query ... . . . . . . . . . . . . . . . . . . . . . . . . . . . . . . .178
Exercise 8: Defining Queries with SAP Query... . . . . . . . . . . . . . . . . . . . . . . .185
2006/Q2 © 2006 SAP AG. All rights reserved. 177

Unit 7: SAP Query HR580
Lesson: Defining Queries with SAP Query
Lesson OverviewIn this lesson, you learn how to define queries using SAP Query.
Lesson ObjectivesAfter completing this lesson, you will be able to:
� Create and change HR-specific queries using SAP Query� Include local fields in a query
Business Example� You have learned which reports are not covered by the standard reports.� You have created customer and payroll infotypes that you want to report on.� You use SAP Query to create the required reports.
Figure 106: Creating Queries I
If you use SAP Query to create queries, note that you can create one basic listand up to nine statistics or ranked lists for one query (defined using selectionand output fields).
When creating queries using HR logical databases, you can use the Line Groupsfunction, which enables you to group specific lines together within multiline basiclists to form line groups. If infotypes have more than one record, this ensuresthat infotype fields which logically belong together are then grouped in a logicalmanner, instead of being output one after the other.
178 © 2006 SAP AG. All rights reserved. 2006/Q2

HR580 Lesson: Defining Queries with SAP Query
Without line groups: With line groups:Martin Smith Martin Smith54333 Musterstadt 54333 Musterstadt12456 Anyplace Any Street 4Any Street 4 12456 AnyplaceExample Street 4 Example St. 4
Figure 107: Creating Queries II
The system guides you through the following sequence of screens for fieldselection:
Title, Format:
The title of the query is assigned on this screen. By entering format data, youcan determine the page layout. By entering special attributes, you can determinefurther characteristics for the query (for example, change lock, output types).
Field Group Selection:
InfoSets are divided into field groups, which correspond to infotypes in HR. Youcan select the required field groups at this point.
Field Selection (Output Fields):
This enables you to select the data fields required for the field groups selectedearlier. If you require local fields, you can define them at this point.
Selection Fields:
You can define selection fields that enable you to enter further restrictions on theselection screen.
2006/Q2 © 2006 SAP AG. All rights reserved. 179

Unit 7: SAP Query HR580
Figure 108: Creating Basic Lists
The following screens guide you through the process of creating a basic list:
Basic List Line Structure:
This screen enables you to arrange fields in single or multiple lines, and determinethe field sequence. It also enables you to determine the sort sequence and otherglobal field characteristics. Control level processing can be defined for sortedfields. Summation and field counting is possible for each control level.
List Line Output Options:
This screen enables you to determine output options for each line: outputdepending on whether another line exists, output for blank lines (before and after aline), page breaks, output in the page header.
Field Output Options:
This screen enables you to determine output options for each field: output length,output position, output with template (in this case, using an additional FieldTemplates screen).
Basic List Header
This screen enables you to enter a text for the footer and header, and to changethe texts for column headers.
Graphic:
This screen enables you to determine the graphic type that is used if the listis output as a graphic.
180 © 2006 SAP AG. All rights reserved. 2006/Q2

HR580 Lesson: Defining Queries with SAP Query
Figure 109: Creating Control Level Lists
If a sort sequence is specified for the line structure, the screen sequence branches tocontrol level definition. The system then guides you through the following screens:
Control Levels:
� This screen enables you to determine the following attributes for each controllevel: ascending/descending control level sorting, use of an introductorycontrol level text, summation, counting, frame, blank line, new page.
� If you use the summation function for a field, the total is output in the samecolumn as the field, that is, with the same output length. This means that theoutput length is sometimes too short for outputting the total, which causesan overflow (an asterisk at the first position of the value). To avoid suchoverflows when totals are output, you can simply extend the output length ofthe field for which the summation function is used.
Control Level Texts (Totals Texts):
� This screen enables you to enter a text that is then output at the beginningof a control level (for a total). In the standard system, the text of thecorresponding field is used.
The system takes you from this screen to the List Line Output Options screen,which has already been discussed in the context of defining basic lists.
2006/Q2 © 2006 SAP AG. All rights reserved. 181

Unit 7: SAP Query HR580
Figure 110: Creating Statistics
Statistics are used to perform analytical reporting for numerical data. The systemdoes not merely output the values of numerical fields. Instead, it includes asummation function for the contents of fields, can count the number of processedrecords, and can output mean and percentage values. You are guided through thefollowing screens for creating statistics:
Statistic 1 Structure (Statistic 2, etc.):
� Basic settings: field sequence, sort sequence, calculation of subtotals, fieldlength, use of a field text for outputting a graphic.
� Settings for processing numerical fields: counting processed data records,mean values, the value as a percentage of the total, rounding.
Headers:
� This screen enables you to enter a text for the footer and header, and tochange the texts for column headers.
The list includes the conversions performed by the system. If errors occur, theconversions that could not be performed are logged. The affected currency amountfields or quantity fields are also highlighted within the statistics.
Depending on the definition, subtotal lines can occur within statistics. As a resultof summarized statistics display, the system only displays subtotals and the total.
182 © 2006 SAP AG. All rights reserved. 2006/Q2

HR580 Lesson: Defining Queries with SAP Query
Figure 111: Creating Ranked Lists
Ranked lists are special types of statistics that are sorted in the standard system bythe ten highest values of a numerical field. This means that you can only defineone numerical field as a ranked list criterion for a ranked list. The system guidesyou through the following screens for creating ranked lists:
Ranked List 1 Structure (Ranked List 2, etc.):
On this screen, you make the following settings for ranked lists:
� Basic settings: field sequence, field length, use of a field text for outputting agraphic.
� Settings for processing numerical fields as a ranked list: specifying a rankedlist criterion, rounding.
Headers:
� This screen enables you to enter a text for the footer and header, and tochange the texts for column headers.
2006/Q2 © 2006 SAP AG. All rights reserved. 183

Unit 7: SAP Query HR580
Figure 112: Additional Fields and Local Fields
The term additional fields covers all of the fields that do not exist in the databasetable of the corresponding infotype, but that are available for reporting purposes.
� Standard additional fields are additional fields that are required by themajority of customers, as experience has shown. For this reason, they areavailable in the standard system when InfoSets are created.
� Additional fields can also be defined by customers to meet special,company-specific requirements. They can be created in HR Customizing, orwhen an InfoSet is created. When they have been created in Customizing(under HR Settings for SAPQuery⇒ Additional Information for MaintainingInfoSets (Functional Areas)⇒ Define Additional Fields), they are alwaysavailable when InfoSets are created. If they are created in an InfoSet, theyare only available in that particular InfoSet.
Just like additional fields, local fields are used to meet specific requirements.They are defined within a query, and are only available for that query (for instance,in SAP Query).
184 © 2006 SAP AG. All rights reserved. 2006/Q2

HR580 Lesson: Defining Queries with SAP Query
Exercise 8: Defining Queries with SAPQuery
Exercise ObjectivesAfter completing this exercise, you will be able to:� Define queries using SAP Query, and output them as basic lists, statistics,
and ranked lists.� Define local fields in queries
Business ExampleYou want to create your own queries with the SAP Query tool.
Hint: Before doing the exercises, access the initial screen of the SAPQuery and deactivate the Graphical Query Painter.
Hint: Unless otherwise specified, use the selection fields provided by thestandard selection screen of the report class. Work in the standard workarea in your user group HR580## with the Infoset HR580PNPMINI.
Hint: Your instructor will not be able to go through all of the exerciseswith you. The following exercises are flagged as OPTIONAL.
2006/Q2 © 2006 SAP AG. All rights reserved. 185

Unit 7: SAP Query HR580
Task 1:Single-Line Basic List
With the InfoSet HR580PNPMINI, define a query (Q1HR580##) with a basiclist, which outputs the following data:
Last name, first name, nationality, year of birth, and place of residence.
Please note the formatting specifications in the model list:
Last name(length 10)
First name(length 10)
Nationality(length 2)
Year of birth(length 4)
Place ofresidence(length 15)
1. Test the query for the personnel area 1000 Hamburg using the output formSAP List Viewer.
2. Change the query so that the basic ABAP list is surrounded by a frame, andthe individual columns are separated from one another by lines. After youhave made these changes, execute the query once again.
3. Once you have executed the query, display the SAP List Viewer. Set theSAP List Viewer up to include only employees whose place of residence isHeidelberg.
Continued on next page
186 © 2006 SAP AG. All rights reserved. 2006/Q2

HR580 Lesson: Defining Queries with SAP Query
Task 2:Basic List with a Control Level
With the InfoSet HR580PNPMINI, define a query Q2HR580## with a basiclist, which outputs the following data:
Organizational unit (text), last name, first name, payroll for-period, gross, anddeductions.
Sample list:
Payroll records for <text for OU1>Lastname (L:10)
Firstname (L:10)
For-period(L: 6)
Gross (L:10)
ER SI Expenses (L: 10)
Miller John 200412 13.000 6.000... ... ...... ... ...Total for OU <text for OU1> 500,000
EUR300,000 EUR
Payroll records for <text for OU2>... ... ...... ... ...... ... ...
Further information on the output format (see sample list):
Define the Organizational unit field as a control level.
Display totals for the numerical fields using the organizational unit field.
Adapt the text for the control level and the total for the organizational unit inaccordance with the sample list.
Adapt the length of the fields in accordance with the sample list.
1. Execute the query for the personnel area 1000 and for the evaluation periodDecember of last year. Output the query once as an ABAP list, SAP ListViewer and once as a table.
Task 3: OptionalBasic List with Two Control Levels
1. Make a copy of query Q2HR580##, and call it Q3HR580##.
Continued on next page
2006/Q2 © 2006 SAP AG. All rights reserved. 187

Unit 7: SAP Query HR580
Define the Last name field as a control level, and use the control level tocalculate totals. Output the following text for the control level total: Totalfor employees.
Execute the query as an ABAP List for the personnel area 1000 and for theevaluation period October to December of last year.
Task 4:Basic List with One Control Level and Statistics
1. Copy the Query Q2HR580## and rename it Q4HR580##. Define statisticswith which the following data is output:
- Total of evaluation wage type Gross per organizational unit
- Total of evaluation wage type Deductions per organizational unit
- Percentage of each total evaluation wage type for each organizational unit
- Average amount within the organizational unit allotted for each employee(for both evaluation wage types)
Sample list (header):
orga-niza-tionalunits
Gross Shareas
meanvalue
ER SIshare
Shareas
meanvalue
(L: 15) (L:12)
% (L: 12) %
Execute the query as an ABAP List for the personnel area 1000 and for theevaluation period December of last year.
Task 5: OptionalBasic List with One Control Level and Local Fields
Make a copy of query Q2HR580##, and call it Q5HR580##. Define a localfield called Net for the new query that outputs the difference (gross amount -deductions). Include the field in the basic list.
1. Execute the query (personnel area 1000, period December last year). Outputthe query once as an ABAP List, once as a table, and once using the SAPList Viewer.
2. Define another local field for the query called Limit, and set it up to outputa green, yellow, or red traffic light depending on the amount in the Grossamount field. Include the field in the basic list.
Continued on next page
188 © 2006 SAP AG. All rights reserved. 2006/Q2

HR580 Lesson: Defining Queries with SAP Query
Execute the query (personnel area 1000, period December last year). Outputthe query once as an ABAP List, and once using the SAP List Viewer.
Task 6: OptionalMulti-Line Basic List
1. Define a new query Q6HR580## based on the Infoset HR580PNPMINIwith a multi-line basic list.
Line 1 must include the First name (pos. 1/L=15) and Last name (pos.2/L=15) fields. Line 2 must include the Street and house number (L=30)field. Line 3 must include the Postal code (pos. 1/L=10) and City (pos.2/L=30) fields. Execute the query as an ABAP List for the personnel area1000.
2006/Q2 © 2006 SAP AG. All rights reserved. 189

Unit 7: SAP Query HR580
Solution 8: Defining Queries with SAPQueryTask 1:Single-Line Basic List
With the InfoSet HR580PNPMINI, define a query (Q1HR580##) with a basiclist, which outputs the following data:
Last name, first name, nationality, year of birth, and place of residence.
Please note the formatting specifications in the model list:
Last name(length 10)
First name(length 10)
Nationality(length 2)
Year of birth(length 4)
Place ofresidence(length 15)
1. Test the query for the personnel area 1000 Hamburg using the output formSAP List Viewer.
a) Choose Human Resources⇒ Information System→ Reporting Tools⇒ SAP Query.
Ensure that you are in your user group HR580## (choose Edit→Otheruser group). Choose Settings⇒ Settings and deactivate the GraphicalQuery Painter.
b) EnterQ1HR580## as the short name of your query. Choose Create andin the query screen that appears, select the InfoSet HR580PNPMINI.
Enter a title of your choice on the next screen. Choose Next Screen.
Select the field groups Personal data and Addresses. Choose NextScreen.
Select the fields Last name, First name, Nationality, Year of birth (fieldgroup Personal Data) and City (field group Addresses). Choose NextScreen.
Choose Basic List to access basic list definition (you do not have toselect any fields as selections fields)
In the Line column, enter 01 for all fields (= one-line basic list) anddefine the column sequence as specified in the activity.
Choose Next Screen twice.
Continued on next page
190 © 2006 SAP AG. All rights reserved. 2006/Q2

HR580 Lesson: Defining Queries with SAP Query
Specify the fields in accordance with the requirements of the activity.(Note too how the output preview changes in the lower part of thescreen.)
Choose Save.
c) Choose Query→ Execute⇒ Execute and start the query for personnelarea 1000.
2. Change the query so that the basic ABAP list is surrounded by a frame, andthe individual columns are separated from one another by lines. After youhave made these changes, execute the query once again.
a) Navigate to the function for defining frames and separation lines on theBasic List Line Structure screen, and select the appropriate checkboxes.
b) Choose Query→ Execute⇒ Execute, and start the query for personnelarea 1000 Hamburg and the output form ABAP List.
3. Once you have executed the query, display the SAP List Viewer. Set theSAP List Viewer up to include only employees whose place of residence isHeidelberg.
a) Choose List⇒ SAP List Viewer, and select the City column.
b) Choose Edit→ Set filter, and enter Heidelberg as a filter value.
Task 2:Basic List with a Control Level
With the InfoSet HR580PNPMINI, define a query Q2HR580## with a basiclist, which outputs the following data:
Organizational unit (text), last name, first name, payroll for-period, gross, anddeductions.
Sample list:
Payroll records for <text for OU1>Lastname (L:10)
Firstname (L:10)
For-period(L: 6)
Gross (L:10)
ER SI Expenses (L: 10)
Miller John 200412 13.000 6.000... ... ...... ... ...Total for OU <text for OU1> 500,000
EUR300,000 EUR
Continued on next page
2006/Q2 © 2006 SAP AG. All rights reserved. 191

Unit 7: SAP Query HR580
Payroll records for <text for OU2>... ... ...... ... ...... ... ...
Further information on the output format (see sample list):
Define the Organizational unit field as a control level.
Display totals for the numerical fields using the organizational unit field.
Adapt the text for the control level and the total for the organizational unit inaccordance with the sample list.
Adapt the length of the fields in accordance with the sample list.
1. Execute the query for the personnel area 1000 and for the evaluation periodDecember of last year. Output the query once as an ABAP list, SAP ListViewer and once as a table.
a) EnterQ2HR580## as the short name of your query. Choose Create andon the query screen that appears, select the InfoSet HR580PNPMINI.
b) Enter a title of your choice on the next screen. Choose Next Screen.
Select the field groups Organizational Assignment, Personal data andPayroll Results. Choose Next Screen.
c) Select the fields Organizational unit, Last name, First name, Forperiod of payroll, Gross and ER SI expenses. Choose Next Screen.Choose Next Screen.
d) Choose basic list to access the screen for basic list definition.
In the Line field, enter 01 for the Last name, First name, For-period,Gross amount, and Deductions 01 (= single-line basic list), and definethe sequence in accordance with the requirements of the activity. Entersort position 01 for the Organizational unit field. Activate the Totalcheckbox for the Gross amount and Deductions fields. Choose NextScreen.
e) Activate the Text and Total checkboxes for the organizational unitcontrol level. Choose Next Screen.
f) Enter Payroll records as an alternative text for the control level. EnterTotal for OU as an alternative text for the total.
g) Choose Next screen twice, and enter the field lengths in accordancewith the requirements of the activity.
h) Choose Save.
Continued on next page
192 © 2006 SAP AG. All rights reserved. 2006/Q2

HR580 Lesson: Defining Queries with SAP Query
i) Choose Query→ Execute⇒ Execute, and start the query for personnelarea and reporting period specified in the exercise and the output formsspecified.
Task 3: OptionalBasic List with Two Control Levels
1. Make a copy of query Q2HR580##, and call it Q3HR580##.
Define the Last name field as a control level, and use the control level tocalculate totals. Output the following text for the control level total: Totalfor employees.
Execute the query as an ABAP List for the personnel area 1000 and for theevaluation period October to December of last year.
a) To copy your query, choose Copy on the SAP Query initial screen.Choose Change.
b) On the Basic List Line Structure screen, enter sort position 02 for thelast name field. Choose Next Screen.
c) Activate the Total for the Last name control level. Choose Next Screentwice.
Enter Total for Employee as an alternativen text for the new controllevel total.
Choose Save.
d) Choose Query→ Execute⇒ Execute and specify the parameters asinstructed in the exercise.
e) Choose Execute.
Task 4:Basic List with One Control Level and Statistics
1. Copy the Query Q2HR580## and rename it Q4HR580##. Define statisticswith which the following data is output:
- Total of evaluation wage type Gross per organizational unit
- Total of evaluation wage type Deductions per organizational unit
- Percentage of each total evaluation wage type for each organizational unit
- Average amount within the organizational unit allotted for each employee(for both evaluation wage types)
Sample list (header):
Continued on next page
2006/Q2 © 2006 SAP AG. All rights reserved. 193

Unit 7: SAP Query HR580
orga-niza-tionalunits
Gross Shareas
meanvalue
ER SIshare
Shareas
meanvalue
(L: 15) (L:12)
% (L: 12) %
Execute the query as an ABAP List for the personnel area 1000 and for theevaluation period December of last year.
a) To copy your query, choose Copy on the SAP Query initial screen.Choose Change.
b) Within the new query Q4HR580##, choose Statistics 1 Structure tonavigate to the Statistics Structure screen.
c) Enter a title and assign sequence numbers and field lengths to the fieldsOrganizational unit, Gross amount, and Deductions fields accordingto the information in the sample list. Enter the reference currencyEUR for numeric fields.
Activate the Mean value and Percentage share options for the Grossamount and Deductions fields.
Choose Save.
d) Choose Query→ Execute⇒ Execute and specify the parameters asinstructed in the exercise.
Choose Execute.
e) At the top of the output list you see the basic list, below you see thestatistics.
Continued on next page
194 © 2006 SAP AG. All rights reserved. 2006/Q2

HR580 Lesson: Defining Queries with SAP Query
Task 5: OptionalBasic List with One Control Level and Local Fields
Make a copy of query Q2HR580##, and call it Q5HR580##. Define a localfield called Net for the new query that outputs the difference (gross amount -deductions). Include the field in the basic list.
1. Execute the query (personnel area 1000, period December last year). Outputthe query once as an ABAP List, once as a table, and once using the SAPList Viewer.
a) To copy your query, choose Copy on the SAP Query initial screen.Choose Change.
b) Within the new query Q5HR580##, navigate to the Field Selectionscreen and activate the short names by choosing Edit→ Short Names.
Enter short names, such as GRS and DED, for the Gross amount andDeductions fields.
Choose Edit→ Local Field⇒ Create.
Enter a short name, field name, and header (such as GROSS).
Use the properties to determine that the field has the same properties asthe Gross amount (GRS) field.
Enter the following calculation formula: GRS-DED (that is, using theshort names you have entered) and choose Continue.
Go to the basic list and on the screen Basic List Line Structure assign 1to the local field Line, a sequence number, and select TOTAL.
Choose Save.
c) Execute the query with the parameters and output forms specified.
2. Define another local field for the query called Limit, and set it up to outputa green, yellow, or red traffic light depending on the amount in the Grossamount field. Include the field in the basic list.
Continued on next page
2006/Q2 © 2006 SAP AG. All rights reserved. 195

Unit 7: SAP Query HR580
Execute the query (personnel area 1000, period December last year). Outputthe query once as an ABAP List, and once using the SAP List Viewer.
a) Navigate back to the Field Selection screen. Choose Edit→ LocalField⇒ Create and create another local field Limit with the followingattributes:
Characteristics: Icon
Button Complex Calculation:
Condition: BRT<=1000
Formula: ICON_GREEN_LIGHT
Condition: GRS>1000 AND GRS<=3000
Formula: ICON_YELLOW_LIGHT
Condition: BRT>3000
Formula: ICON_RED_LIGHT
b) Go to the basic list and on the screen Basic List Line Structure assign1 to the local field Line, a sequence number.
c) Go to the screen Output Options Field and change the length of thefield Net to 10.
d) Choose Save and execute the query with the parameters and outputforms specified.
Task 6: OptionalMulti-Line Basic List
1. Define a new query Q6HR580## based on the Infoset HR580PNPMINIwith a multi-line basic list.
Continued on next page
196 © 2006 SAP AG. All rights reserved. 2006/Q2

HR580 Lesson: Defining Queries with SAP Query
Line 1 must include the First name (pos. 1/L=15) and Last name (pos.2/L=15) fields. Line 2 must include the Street and house number (L=30)field. Line 3 must include the Postal code (pos. 1/L=10) and City (pos.2/L=30) fields. Execute the query as an ABAP List for the personnel area1000.
a) Enter Q6HR580## as the short name of your query. Choose Create andin the query screen that appears, select the InfoSet HR580PNPMINI.
Select the fields in accordance with the requirements of the activity.
b) Choose Basic List and on the Basic List Line Structure make the lineand field sequence entries as instructed.
On the Field Output Options screen, make appropriate entries for thefield length.
c) Execute the query as an ABAP List for the personnel area 1000.
2006/Q2 © 2006 SAP AG. All rights reserved. 197

Unit 7: SAP Query HR580
Lesson Summary
You should now be able to:� Create and change HR-specific queries using SAP Query� Include local fields in a query
198 © 2006 SAP AG. All rights reserved. 2006/Q2

HR580 Unit Summary
Unit SummaryYou should now be able to:� Create and change HR-specific queries using SAP Query� Include local fields in a query
2006/Q2 © 2006 SAP AG. All rights reserved. 199

Unit Summary HR580
200 © 2006 SAP AG. All rights reserved. 2006/Q2

Unit 8Payroll and Time Management
Infotypes
Unit OverviewAt the conclusion of this unit, you will be able to:
� Describe the concept of payroll infotypes and simulated Time Managementinfotypes
� Set up payroll infotypes� Include payroll infotypes and simulated Time Management infotypes in
InfoSets
Unit ObjectivesAfter completing this unit, you will be able to:
� Explain the concept of payroll infotypes� Set up payroll infotypes� Use payroll infotypes, that is, use payroll data from the clusters in your
reporting activities� Explain the concept of simulated infotypes in Time Management
Unit ContentsLesson: Payroll Infotypes .. . . . . . . . . . . . . . . . . . . . . . . . . . . . . . . . . . . . . . . . . . . . . . . . . . . . .202
Exercise 9: Payroll Infotypes.. . . . . . . . . . . . . . . . . . . . . . . . . . . . . . . . . . . . . . . . . . . . .209Lesson: Simulated infotypes in Time Management .. . . . . . . . . . . . . . . . . . . . . . .216
2006/Q2 © 2006 SAP AG. All rights reserved. 201

Unit 8: Payroll and Time Management Infotypes HR580
Lesson: Payroll Infotypes
Lesson OverviewIn this lesson, you learn about the payroll infotypes.
Lesson ObjectivesAfter completing this lesson, you will be able to:
� Explain the concept of payroll infotypes� Set up payroll infotypes� Use payroll infotypes, that is, use payroll data from the clusters in your
reporting activities
Business ExampleYou want to report on payroll results:
� The results of specific wage types per employee, per personnel area, perorganizational unit and so on.
� A list of all employees with an annual gross income exceeding 100,000.-.� �
Figure 113: Reporting on Payroll Results I
202 © 2006 SAP AG. All rights reserved. 2006/Q2

HR580 Lesson: Payroll Infotypes
Most Human Resource data is stored in infotypes. You can report on this datausing standard reporting procedures (Ad Hoc Query or SAP Query). Payrollresults, however, are stored in cluster tables. You can only report on them usingspecific standard reports or reports you have programmed yourself (that is, usingthe ABAP Editor/SE38).
Figure 114: Reporting on Payroll Results II
To evaluate payroll results in the same way as other HR data, you can set uppayroll infotypes.
Preconfigured payroll infotypes are available for this or you can define you own.
2006/Q2 © 2006 SAP AG. All rights reserved. 203

Unit 8: Payroll and Time Management Infotypes HR580
Figure 115: Structure of Payroll Infotypes
The basic principle of payroll infotypes (PIT) involves defining an infotype whosespecific fields correspond to the results of one or more wage types in Payroll.
To enable the results of (technical) wage types to be aggregated, evaluationwage types (EWT) are defined in an intermediate step. They are used to definethe payroll infotypes.
Example:
Wage types EWT PIT/101 (Gross/Employee) Gross/ER-EWT Gross/ER-PIT/262 (Gross/Social Contribution/ER)
Technical wage types /101 and /262 are both written to evaluation wage typeGross/ER-EWT. In this case, the payroll infotype Gross/ER-PIT only containsthis evaluation wage type.
Like all other infotypes in Personnel Administration, payroll infotypes have threesubstructures (key fields/PAKEY, administrative fields/PSHD1, infotype-specificfields/PSnnnn). The infotype-specific fields are contained in substructure PSnnnn.In the case of payroll infotypes, however, this structure contains additional,payroll-specific fields (sequence number, MOLGA, etc.) that are createdautomatically when a payroll infotype is created. The infotype-specific fields of apayroll infotype are contained in include CI_Pnnnn. These fields correspond tothe evaluation wage types defined in Customizing.
Country-specific (USA) key fields in preconfigured infotypes:
The structure of infotypes that are preconfigured for the USA (0446, etc.) alsocontains the following key fields: TXCMP (tax interface) and TAXAU (taxauthorities).
204 © 2006 SAP AG. All rights reserved. 2006/Q2

HR580 Lesson: Payroll Infotypes
Figure 116: Cumulated Payroll Infotypes
Depending on the reports that you require, SAP advises that you cumulate payrollresults, and then import them into payroll infotypes. In this case, you must definecumulated payroll infotypes. When defining cumulated payroll infotypes, takenote of the fact that you can determine which amounts are included in the payrollinfotype, and the number of infotype records that are created (in relation to thepayroll period).
Payroll infotype data records without cumulation: each record contains the totalpaid for the corresponding payroll period.
Example (for employee):
Record 1 for period 012004: 3000 EUR
Record 2 for period 022004: 3200 EUR
....
Data records of a cumulated payroll infotype (annual cumulation). Each recordalways contains the cumulated values currently valid (payroll run at month end):
Record 1 for quarter 012004: 3000 Euro (on 01/31/04)Record 1 for quarter 012004: 6200 Euro (on 02/28/04)Record 1 for quarter 012004: 9200 Euro (as of 03/31/04)Record 2 for quarter 012004: 12200 Euro (on 01/31/04)Record 2 for quarter 012004: 15200 Euro (as of 02/28/04)...
2006/Q2 © 2006 SAP AG. All rights reserved. 205

Unit 8: Payroll and Time Management Infotypes HR580
When cumulated payroll infotypes are set up, you are no longer required to definethe assignment to evaluation wage types. This assignment is taken from payrollinfotypes that are not cumulated.
Figure 117: Creating a PIT (Overview)
You set up payroll infotypes in Customizing for HR Information Systems. In theImplementation Guide, choose:
Personnel Management→ HR Information System→ Payroll Results.
If you want to work with preconfigured payroll infotypes, you only need toperform some of the Customizing activities listed.
Figure 118: 1) Defining Evaluation Wage Types
206 © 2006 SAP AG. All rights reserved. 2006/Q2

HR580 Lesson: Payroll Infotypes
This step enables you to define evaluation wage types. The definition of evaluationwage types is country-specific (MOLGA).
Figure 119: 2) Assigning Wage Types
This step enables you to determine the (technical) wage types that are entered inan evaluation wage type.
Figure 120: 3) Setting Up Payroll Infotypes I
2006/Q2 © 2006 SAP AG. All rights reserved. 207

Unit 8: Payroll and Time Management Infotypes HR580
This step enables you to define the payroll infotype by assigning evaluation wagetypes to it and then generating.
The appropriate screens and tables are generated in accordance with the evaluationwage types you assigned.
Hint: You can only use entries from the customer namespace (9nnn)as infotype numbers.
Figure 121: For 3) and 4) Setting Up Payroll Infotypes (II) and Setting UpPayroll Assignment
This step enables you to set the generated payroll infotype to active.
Once the PIT has been set to active, you can test it to make sure it functionscorrectly.
Perform the following steps:
� Transfer payroll results manually from payroll cluster tables to the payrollinfotype (RPABRI00).
� Display the contents of the corresponding database tables (PA9*) usingSE16, and compare the values with the values in the payroll clusters (withRPCLSTRD for Germany, for example).
� Display the values in the payroll infotype fields using the HR master data ofthe corresponding persons.
To ensure that the payroll infotype is filled with data automatically, enter thepayroll infotype in the Set up Assignment to Payroll Customizing activity.
208 © 2006 SAP AG. All rights reserved. 2006/Q2

HR580 Lesson: Payroll Infotypes
Exercise 9: Payroll Infotypes
Exercise ObjectivesAfter completing this exercise, you will be able to:� Create payroll infotypes� Fill payroll infotypes� Include payroll infotypes in InfoSets, and use them in queries.
Business ExampleYou want to define and fill a payroll infotype so as to be able to access payrollresults using Ad Hoc Query and SAP Query.
Task 1:Create a payroll infotype (PIT) 96## for the country grouping 01 Germany. ThePIT must include two evaluation wage types (EWT). Therefore, you need toperform the activities described in the following sections.
1. Define evaluation wage types and enter the following parameters and names:
Abbr. Cumulation Amount or number TextZ1## - Amount Gr##: GrossZ2## - Amount Gr##: Deductions
2. Assign the following wage types to these evaluation wage types (countrygrouping 01):
Z1## consists of the wage type /101 Gross amount.
Z2## consists of the wage type /262 Average employer expense SI.
3. Assign these evaluation wage types to infotype 96## and generate the payrollinfotype. Don't forget to activate it.
Task 2:To fill the infotype you just created with payroll results, start report RPABRI00for the personnel area 1000 (Hamburg), the period December of last year, andpayroll infotype 96##.
1. Check three records of a person to ensure that the payroll infotype was filledwith correct results.
Continued on next page
2006/Q2 © 2006 SAP AG. All rights reserved. 209

Unit 8: Payroll and Time Management Infotypes HR580
Task 3: Optional
1. Include the payroll infotype 96## you created in your InfoSet (PA_##) andcreate a query that outputs the payroll results.
210 © 2006 SAP AG. All rights reserved. 2006/Q2

HR580 Lesson: Payroll Infotypes
Solution 9: Payroll InfotypesTask 1:Create a payroll infotype (PIT) 96## for the country grouping 01 Germany. ThePIT must include two evaluation wage types (EWT). Therefore, you need toperform the activities described in the following sections.
1. Define evaluation wage types and enter the following parameters and names:
Abbr. Cumulation Amount or number TextZ1## - Amount Gr##: GrossZ2## - Amount Gr##: Deductions
a) Use the SAP Easy Access Menu to access the Implementation Guide(IMG):
Tools→ Customizing→ IMG→ Edit Project
In the SAP Reference IMG, choose:
Personnel Management→ Human Resources Information System→Payroll Results
b) Access the Define Evaluation Wage Types customizing activity.
Enter the country grouping 01 Germany.
c) Choose New entries.
d) Make the following entries and selections in the fields for eachevaluation wage type:
Abbr. Cumula-tion
Amount or number Text
Z1## - Amount Gr##: GrossZ2## - Amount Gr##: Deductions
e) Save your entries. If a workbench request prompt is displayed, enterany existing request (or create one).
2. Assign the following wage types to these evaluation wage types (countrygrouping 01):
Z1## consists of the wage type /101 Gross amount.
Continued on next page
2006/Q2 © 2006 SAP AG. All rights reserved. 211

Unit 8: Payroll and Time Management Infotypes HR580
Z2## consists of the wage type /262 Average employer expense SI.
a) Access the Assign Wage Types customizing activity.
b) When asked to specify a country grouping, select 01 (Germany).
c) Choose New entries.
d) To assign evaluation wage type Z1XX, make the following entries:
Eval.WT: Z1## (use the input help function)Cumulation: No entryWage type: /101EWT text: Entry is made automatically
e) To assign evaluation wage type Z2##, make the following entries:
Eval.WT: Z2## (use the input help function)Cumulation: No entryWage type: /262EWT text: Entry is made automatically
f) Save your entries.
Continued on next page
212 © 2006 SAP AG. All rights reserved. 2006/Q2

HR580 Lesson: Payroll Infotypes
3. Assign these evaluation wage types to infotype 96## and generate the payrollinfotype. Don't forget to activate it.
a) Access the Set up Payroll Infotypes customizing activity.
b) In the Payroll Infotypes view, choose New entries.
c) Make the following entries:
IType: 96##Inftyp. Type: No entryCumulation: No entryInfotype Text: Entry is made automaticallyGenerated: Entry is made automaticallyActive: No entryInfotype: No entry
d) Select your payroll infotype 96##..
e) Double-click the Assign Evaluation Wage Types view. Confirm thecountry grouping 01 Germany and infotype 96##..
f) Choose New entries.
g) Make the following entries:
IType: 96## (use the input help function)Eval.WT: Z1## (use the input help function)EWT text: Entry is made automatically
Repeat these entries for EWT Z2##.
h) Choose Save and Generate Payroll Infotype. If you are asked for theobject catalog, select Local Object and choose Continue.
i) Choose Back to return to the PIT Overview.
j) Set your infotype 96## to active.
k) Save your entries.
Continued on next page
2006/Q2 © 2006 SAP AG. All rights reserved. 213

Unit 8: Payroll and Time Management Infotypes HR580
Task 2:To fill the infotype you just created with payroll results, start report RPABRI00for the personnel area 1000 (Hamburg), the period December of last year, andpayroll infotype 96##.
1. Check three records of a person to ensure that the payroll infotype was filledwith correct results.
a) Access the ABAP Editor. To do so, choose System→Services→Reporting.
Start report RPABRI00 with the following values:
Other period: December of last yearPersonnel area: 1000Infotype: 96##
b) To test the infotype:
Open the HR master data maintenance transaction in one session, anddisplay the records of infotype 96## for the corresponding person.
In a second session, choose System→Services→ Reporting to start thereport for displaying payroll results (H99_DISPLAY_PAYRESULT).Enter the relevant personnel number and display payroll results for theperiod concerned. Check in particular the amounts from table RT.
Task 3: Optional
1. Include the payroll infotype 96## you created in your InfoSet (PA_##) andcreate a query that outputs the payroll results.
a) Choose Tools→ ABAP Workbench→ Utilities→ SAP Query→Infoset.
b) Select your Infoset PA_## and choose Change. In InfoSet maintenancemode, choose Edit→ Change Infotype Selection and select the infotype96## you just generated. Generate your Infoset again.
c) Choose Human Resources→ Information System→ Reporting→Tools→ Ad Hoc Query. Based on the InfoSet PA_##, define a querythat displays payroll results.
214 © 2006 SAP AG. All rights reserved. 2006/Q2

HR580 Lesson: Payroll Infotypes
Lesson Summary
You should now be able to:� Explain the concept of payroll infotypes� Set up payroll infotypes� Use payroll infotypes, that is, use payroll data from the clusters in your
reporting activities
2006/Q2 © 2006 SAP AG. All rights reserved. 215

Unit 8: Payroll and Time Management Infotypes HR580
Lesson: Simulated infotypes in Time Management
Lesson OverviewIn this lesson, you learn about simulated infotypes in Time Management.
Lesson ObjectivesAfter completing this lesson, you will be able to:
� Explain the concept of simulated infotypes in Time Management
Business ExampleFor reporting purposes, you want to have time evaluation results together withinformation from Time Management infotypes presented in an easy-to-use form.
Figure 122: Time Management Reporting Without Simulated Infotypes
The time management data is stored in the various infotypes and in cluster B2(time evaluation results).
Standard reports enable you to report on individual data sources. For example,you can report on infotype data (report RPTABS20) or cluster data (reportRPTBAL00). However, they do not enable you to report on infotype data andcluster data. Therefore, standard reports can restrict you because they only enableyou to report on some of the data relevant to your business.
216 © 2006 SAP AG. All rights reserved. 2006/Q2

HR580 Lesson: Simulated infotypes in Time Management
Figure 123: Time Management Reporting With Simulated Infotypes
As of release 4.6, you can also use business-oriented BW structures (InfoSources)in R/3 as simulated infotypes.
Simulated infotypes facilitate reporting on a new business level. The infotypeconcept is used to retrieve data in a user-friendly manner from a variety of datasources (infotype data, time evaluation results, data from the personal workschedule). For example, they enable infotype structures to be used to read andreport on cluster data (cluster tables ZES, ZL with ALP and C1).
Therefore, the infotypes are simulated because infotype data is not stored in aninfotype database table, as is usually the case. Instead, it is retrieved from a varietyof database tables at runtime by a function module in Time Management.
Just like other infotypes, simulated infotypes are available in logical databasePNPCE. This means that they can be used like other infotypes for customer ABAPprograms and reporting with SAP Query.
Hint: In the past, reports had to count attendance or absence recordsthemselves if they were executed for attendances or absences lastingseveral days (and in particular, for attendances or absences lasting beyondthe reporting period). This problem does not occur when simulatedinfotypes are used because attendance and absence records are countedeach day and retrieved accordingly.
2006/Q2 © 2006 SAP AG. All rights reserved. 217

Unit 8: Payroll and Time Management Infotypes HR580
Figure 124: Simulated Infotype: Personal Work Schedule (2500)
Simulated infotype 2500 Personal Work Schedule Times includes the followingdata:
� Data from infotypes 0001 Organizational Assignment and 0007 PlannedWorking Time
� Additional information, such as target time according to the personal workschedule and target time without public holidays
Target time is determined using the following data:
� Daily work schedule (which is determined using the appropriate workschedule rule from infotype 0007 Planned Working Time)
� Employment percentage from infotype 0007 Planned Working Time� Substitutions infotype (2003)
218 © 2006 SAP AG. All rights reserved. 2006/Q2

HR580 Lesson: Simulated infotypes in Time Management
Figure 125: Simulated Infotype Employee Times (2501)
Simulated infotype 2501 Employee Times includes the following data:
� Data from infotypes 0001 Organizational Assignment and 0007 PlannedWorking Time
� Employee time data, such as the reporting time type (field REPTT) with thenumber of hours and days
� Cost assignment data� Activity allocation data� Different payment data
The new term reporting time type facilitates a standard view of employee timesfrom a variety of Time Management datasets (attendances, absences, employeeremuneration information, time evaluation results from tables ZES, ZL, C1, andALP of cluster B2).
You create the reporting time type in Customizing, and use it to group requiredtime data together.
For example, you can use a reporting time type to create overtime statistics thatare based on overtime data from different data sources.
2006/Q2 © 2006 SAP AG. All rights reserved. 219

Unit 8: Payroll and Time Management Infotypes HR580
Figure 126: Simulated Infotype Quota Transaction (2502)
Simulated infotype 2502 Quota Transaction includes the following data:
� Data from infotypes 0001 Organizational Assignment and 0007 PlannedWorking Time
� Quota transaction data:
� Reporting quota type (field QUOTA)� Data from infotype 2006 Absence Quotas� Data from infotype 2007 Attendance Quotas
The new term reporting quota type facilitates a standard view of quota data from avariety of Time Management datasets (attendance quotas, absence quotas).
You create the reporting quota type in Customizing, and use it to group requiredquota data together.
For example, you can use a reporting quota type to create leave statistics that arebased on a variety of absence quotas.
Hint: The simulated Quota Transaction infotype also takes data frominfotype 0005 Leave Entitlement into account.
220 © 2006 SAP AG. All rights reserved. 2006/Q2

HR580 Lesson: Simulated infotypes in Time Management
Lesson Summary
You should now be able to:� Explain the concept of simulated infotypes in Time Management
2006/Q2 © 2006 SAP AG. All rights reserved. 221

Unit Summary HR580
Unit SummaryYou should now be able to:� Explain the concept of payroll infotypes� Set up payroll infotypes� Use payroll infotypes, that is, use payroll data from the clusters in your
reporting activities� Explain the concept of simulated infotypes in Time Management
222 © 2006 SAP AG. All rights reserved. 2006/Q2

Unit 9Appendix: HCM in BW and SEM
Unit OverviewAt the conclusion of this unit, you will be able to:
� Give a general overview of how the Business Information Warehouse isused in HCM
� Provide detailed knowledge of the business content of InfoCubes, queries,and key figures available in HCM
� Execute HCM queries� Outline the role of HCM in Strategic Enterprise Management
Unit ObjectivesAfter completing this unit, you will be able to:
� Give a general overview of the Business Information Warehouse in the areaof HCM.
� Provide details of the business content of the InfoCubes, queries and keyfigures available in HCM.
� Execute HR queries.� Give an overview of HCM in Strategic Enterprise Management.
Unit ContentsLesson: Overview of HCM in the Business Information Warehouse(BW) ... . . . . . . . . . . . . . . . . . . . . . . . . . . . . . . . . . . . . . . . . . . . . . . . . . . . . . . . . . . . . . . . . . . . . . . . . . . .224Lesson: Overview of HCM in Strategic Enterprise Management (SEM) 239
2006/Q2 © 2006 SAP AG. All rights reserved. 223

Unit 9: Appendix: HCM in BW and SEM HR580
Lesson: Overview of HCM in the Business InformationWarehouse (BW)
Lesson OverviewThis lesson gives you an overview of the HCM Content in BW.
Lesson ObjectivesAfter completing this lesson, you will be able to:
� Give a general overview of the Business Information Warehouse in the areaof HCM.
� Provide details of the business content of the InfoCubes, queries and keyfigures available in HCM.
� Execute HR queries.
Business ExampleManagement regularly requires key figures from Human Resources.
The Business Information Warehouse enables you, an employee in the HRAnalysis Department, to provide authorized persons with the up-to-date keyfigures and reports they require using an Internet/intranet browser when theyrequire them.
Basics
Figure 127: HCM in BW and SEM: Overview
224 © 2006 SAP AG. All rights reserved. 2006/Q2

HR580 Lesson: Overview of HCM in the Business Information Warehouse (BW)
A data warehouse is a standalone application environment with its own databasecontaining information taken from different data sources. It is designed for queriesand analyses. The Business Information Warehouse
� Combines state-of-the-art data warehouse technology with SAP's businessknow-how.
� Is a standalone system with its own release cycle.
Figure 128: HR Analytics
Human Resources Analytics combines the strategic planning of mySAP SEMwith the operative planning of mySAP ERP HCM to provide integrated BusinessContent for extensive analyses and benchmarking.
2006/Q2 © 2006 SAP AG. All rights reserved. 225

Unit 9: Appendix: HCM in BW and SEM HR580
Figure 129: HCM BW Business Content as a Basis for Business Intelligence
Data from BW is used as a basis in multiple different ways.
Business Information Warehouse Overview
� Definition of a Data Warehouse
� A data warehouse is a standalone application environment containinginformation taken from different data sources. It is designed for queriesand analyses.
� The Business Information Warehouse
� Combines state-of-the-art data warehouse technology with SAP'sbusiness know-how.
� Is a standalone system with its own release cycle.
Decision makers urgently require reliable information from Production,Purchasing, Sales, Financial Accounting, and Human Resources. They need anup-to-date and comprehensive overview of a given business area, and also of thewhole business environment. This necessitates highly efficient and reliable dataretrieval from relevant data sources.
Information must be collated at a central point from which all data can be accessed.
Efficient analysis technologies with meaningful, multimedia display options areindispensable. The information needs of a wide variety of user groups must besatisfied.
226 © 2006 SAP AG. All rights reserved. 2006/Q2

HR580 Lesson: Overview of HCM in the Business Information Warehouse (BW)
Advantages of BW:
� Standardized structure and display for all enterprise data� Easy access to enterprise data via single point of entry� Highly sophisticated reporting for analyses� Environment conducive to high performance� Data retrieval from heterogeneous environment
Figure 130: Components of the Business Information Warehouse
The three main constituent parts of the Business Information Warehouseare the Business Information Warehouse Server, the Data WarehousingWorkbench, and the Business Explorer.
This graphic provides you with an overview of the structure of the SAP BusinessInformation Warehouse in a heterogeneous system landscape. At the lowest level,source systems may be SAP systems and non-SAP systems. Reporting can bedone using data extracted from SAP systems, non-SAP systems, or from externalsources such as databases, online services, and the Internet.
Extractors (programs that enable data extraction) are used to retrieve data fromthe SAP system. HR extractors are delivered for HR as Business Content.
This data is managed in the Business Information Warehouse.
The Data Warehousing Workbench is an easy-to-use, central administrativetool. Among its other uses, it manages the various source systems.
2006/Q2 © 2006 SAP AG. All rights reserved. 227

Unit 9: Appendix: HCM in BW and SEM HR580
Using the Business Explorer, reports can be displayed in MS Excel, analyzed,and processed.
The OLAP (Online Analytical Processing) Processor
� Executes queries and generates different views of a query� Facilitates horizontal, vertical, and hierarchical �drilldowns�� Enables you to exchange characteristics (navigation)� Has different aggregation functions (total, numerator, min. / max., first /
last, ...), comparison (deviation, ratio, percentage...), sequences (sorting,cumulated totals, time series, values,...) and currency conversion
InfoCubes
� InfoCubes contain InfoObjects (two types of data):
� Key figures
(quantifiable values, such as the number of employees)
� Characteristics
(required to determine key figures in accordance with different criteria;organizational unit and gender are examples of characteristics for thenumber of employees)
Data is stored and displayed in InfoCubes.
InfoCubes are n-dimensional data stores that are used for reporting.
An InfoCube contains InfoObjects, which consist of characteristics and keyfigures.
The structure of an HR InfoCube is comparable with an InfoSet in Ad Hoc Queryor SAP Query.
Figure 131: Hierarchies
228 © 2006 SAP AG. All rights reserved. 2006/Q2

HR580 Lesson: Overview of HCM in the Business Information Warehouse (BW)
Hierarchies are delivered in HR for the following, for example:
� Organizational structure� Cost centers� Business events/business event groups� Qualifications/qualification groups� Age structure� Capacity utilization level
You can also create your own hierarchies.
Figure 132: Business Explorer
The Business Explorer is used to report on, analyze, and display data.
The Business Explorer enables you to define queries, which are based on aselection of InfoObjects or predefined query structures from an InfoCube.
By navigating queries, you create different views of data. This enables you toanalyze and display InfoCube data.
The Business Explorer is a comprehensive base of information for a variety ofusers from all areas of an enterprise. It supports standardized reporting, ad hocqueries, special reports, and individual online analyses. It also contains a graphicalreport catalog.
The Business Explorer Browser can retrieve queries via the Internet or intranet.
The user simply accesses tables, graphics, and business reports that are displayedin Excel.
2006/Q2 © 2006 SAP AG. All rights reserved. 229

Unit 9: Appendix: HCM in BW and SEM HR580
HCM Business Content in BWUsers of Business Information Warehouse in HR
� Management/heads of department� HR department� User departments
(such as Controlling, Administration)
BW provides you with operational data from a variety of areas within an enterprise.Reports can be used to process data for decision-making or information purposes.
Standard determination of key figures facilitates benchmarking between differententerprises, or within a single enterprise.
Comparative key figures can be broken down to the business process if the reporthas been defined accordingly. In HR, for example, they can be broken downto the employee.
Figure 133: Business Content
The Business Information Warehouse includes Business Content, that is,business information from Accounting, Logistics, and Human Resources. Thisdistinguishes it from, and is its great advantage over, other Data Warehouseproducts.
Business Content facilitates optimum customer support for the tasks performedby the user in question.
230 © 2006 SAP AG. All rights reserved. 2006/Q2

HR580 Lesson: Overview of HCM in the Business Information Warehouse (BW)
Figure 134: mySAP ERP HCM in Business Information Warehouse
Business Content makes it easier to report on, prepare, and retrieve data.Predefined standard reports and report templates enable you to create reportsquickly and simply.
Figure 135: Business Content for HCM
2006/Q2 © 2006 SAP AG. All rights reserved. 231

Unit 9: Appendix: HCM in BW and SEM HR580
The Business Content comprises extractors, InfoCubes, and queries (business keyfigures and reports) for the following human resources areas:
� Personnel Administration� Recruitment� Training and Event Managament� Payroll� Time Management� Organizational Management� Personnel Development� Compensation Management� Benefits
BW functions also enable you to create cross-application InfoCubes and queries /key figures, which are known as MultiProviders.
232 © 2006 SAP AG. All rights reserved. 2006/Q2

HR580 Lesson: Overview of HCM in the Business Information Warehouse (BW)
Examples of Key Figures and Reports (I)
� Personnel Administration
For example: headcount, personnel structure, leaving rate, average age
� Recruitment
For example: number of applications/applicants, advertising, advertisingcosts, recruitment success
� Payroll
For example: salary costs per organizational unit, wage type comparisons,overview of salary costs
� Training and Event Managament
For example: reports on attendance, cancellations, business event duration,fees, costs, revenue
� Personnel Development
For example: qualifications per employee, proficiency of a qualification,employees by qualification group
� Time Management
For example: overview of personnel times, leave, sickness, overtime, costcenter debiting
� Organizational Management
For example: overview of positions, occupied/vacant/unoccupied positions,full-time positions
� Compensation Management
For example: compensation analyses, average annual salary, bonuspayments, position of employees in pay grade/pay grade level, plannedcompensation adjustment
� Benefits
For example: cost analysis according to organizational criteria, cost analysisaccording to benefits criteria
� Learning Solution
For example, training by target group, test results, number of learningobjectives achieved, external course price.
� E-Recruiting
For example, application origin, candidate's qualifications, number ofpostings.
2006/Q2 © 2006 SAP AG. All rights reserved. 233

Unit 9: Appendix: HCM in BW and SEM HR580
Figure 136: Business Content: Structures
HCM Business Content includes predefined queries and key figures, andstructures for frequently used standard calculations and comparisons.
This makes it easy for you to perform time series comparisons, and to calculateaverages for specific periods.
These structures can be used for any HCM query.
Working with HCM Queries and Key Figures in BW
Figure 137: Business Explorer Browser
234 © 2006 SAP AG. All rights reserved. 2006/Q2

HR580 Lesson: Overview of HCM in the Business Information Warehouse (BW)
Communicating data to the people involved in a particular decision-makingprocess is an important aspect of reporting within Human Resources, and ofreporting in general.
The Business Information Warehouse enables you to retrieve reports and keyfigures using the Business Explorer Browser (that is, via the intranet/Internet).This accelerates data access, and ensures that all of the people involved in makinga decision are supplied with identical information.
Roles can be created for the various user groups. Reports and key figures can begrouped together within these roles according to the tasks and issues concerned,and then accessed using the Business Explorer Browser.
Roles are also included in HCM Business Content, and contain HCM queriesgrouped into clusters.
Figure 138: Query Views - An Example
2006/Q2 © 2006 SAP AG. All rights reserved. 235

Unit 9: Appendix: HCM in BW and SEM HR580
Figure 139: Navigation in a Query (Excel Front End)
The characteristics defined in a query as �free characteristics� can be used fornavigation.
The Business Information Warehouse's multidimensional views mean that asingle Human Resource query covers a variety of classic standard reports. HCM's�Headcount� query, for example, enables you to view the headcount in accordancewith organizational characteristics, such as the organizational structure of theenterprise, employee groups, personnel areas, and cost centers. Alternatively,you can view the headcount in accordance with person-specific characteristics,such as gender, age, and nationality.
The query also enables you to view a combination of characteristics. Within anorganizational unit, for example, you can view the headcount according to genderor nationalities. You can even �drill down� to data on an individual employee.
Practically all of the queries supplied by SAP for HCM provide the customerwith this flexibility.
236 © 2006 SAP AG. All rights reserved. 2006/Q2

HR580 Lesson: Overview of HCM in the Business Information Warehouse (BW)
Figure 140: Navigation in a Query (Web Browser)
You can give users Web access to the BW queries as they are or as Web Cockpits(see next slide for details).
Figure 141: HR Web Cockpit: Example Headcount Planning
2006/Q2 © 2006 SAP AG. All rights reserved. 237

Unit 9: Appendix: HCM in BW and SEM HR580
Lesson Summary
You should now be able to:� Give a general overview of the Business Information Warehouse in the area
of HCM.� Provide details of the business content of the InfoCubes, queries and key
figures available in HCM.� Execute HR queries.
238 © 2006 SAP AG. All rights reserved. 2006/Q2

HR580 Lesson: Overview of HCM in Strategic Enterprise Management (SEM)
Lesson: Overview of HCM in Strategic EnterpriseManagement (SEM)
Lesson OverviewThis lesson gives you an overview of the HR applications in SEM.
Lesson ObjectivesAfter completing this lesson, you will be able to:
� Give an overview of HCM in Strategic Enterprise Management.
Business ExampleOnce you have familiarized yourself with reporting in the ERP system and the BWSystem, you want to learn about SEM as a strategic enterprise management system.
Benchmarking with SEM
� Benchmarking is the process of comparing the same processes in differententerprises, plants, and industries to enable �best practices� to be determinedand plans and activities be developed for improvements.
(Score Research)
⇒ Learn from the best by comparing processes in different enterprises.
⇒ Comparing processes in different enterprises results in mutual learning.
Motivation: Changes in the current climate demand that enterprises improvetheir strategy orientation and align all business processes and managerial levelsaccordingly. This includes supplying HR departments and the management withall strategically important information. Afterall, only a correct assessment of risksand potentials ensures that the right decisions are met at an enterprise.
� Benchmarking - analyzing processes and indentifying room for improvement.� Planning data and simulations from Personnel Cost Planning
In 1979, benchmarking was devised at enterprise level by the US copiermanufacturers, Xerox, in an effort to combat competition from the Japanesemarket. The managing director of Xerox at the time, Charles Christ, sent a team ofemployees to Japan with the instruction to examine the procedures, products, andmaterials of their competition.
2006/Q2 © 2006 SAP AG. All rights reserved. 239

Unit 9: Appendix: HCM in BW and SEM HR580
Figure 142: SAP SEM HCM Measure Catalog: Overview
Basic key figures
� Such as headcount, FTE (full-time equivalent), number of managers, hiredemployees, workdays, leavers.
Personnel Planning
� Such as management quota, fluctuation rate, average length of service, netentry rate, full-time/part-time rate.
Recruitment
� Such as net hiring rate, internal hiring rate, external hiring rate.
Compensation and Benefits
� Such as average employer expense for benefits, benefits for overallcompensation, percentage enrollment in benefits.
Enterprises' effectiveness
� Such as costs per employee in FTE, salary revenue, income before interestand tax (EBIT) per FTE.
Training
� Such as training investment per FTE, training hours per FTE, traininginvestment per training hour.
240 © 2006 SAP AG. All rights reserved. 2006/Q2

HR580 Lesson: Overview of HCM in Strategic Enterprise Management (SEM)
Personnel management
� Such as total costs for personnel activities, personnel area costs peremployee, staffing factor personnel area.
Time Management
� Such as illness rate, illness value per FTE.
Figure 143: Data Flow _ Key Figure Employee Satisfaction
Possible data sources for key figures include:
� Basic key figures� Calculated key figures� Restricted key figures� Structure
In order to be able to use them in a scorecard, the key figures must be provided bya ODBGO-enabled BW query.
2006/Q2 © 2006 SAP AG. All rights reserved. 241

Unit 9: Appendix: HCM in BW and SEM HR580
Figure 144: Balanced Scorecard (BSC) - Key Components
Why use the Balanced Scorecard?
� Examine enterprise startegy� Derive and implement an HCM strategy� Aligned with customer requirements� Personnel area measures in interest of whole enterprise� Measurable results� Positive contribution of HR department to value-adding process becomes
transparent� Enhancement to HR department
Strategic goals are displayed in the cause and effect chain - one of the views inthe Balanced Scorecard. Each objective belongs to a perspective and strategy. Therelationships between different objectives are clarified using arrows.
Each objective is linked to initiatives and measures. The initiatives portray howan objective can be reached. The measures represent certain key performanceindicators (KPIs) that allow you to check whether the target has been reached.
For each scorecard element (as show in the initiatives example), there is a personresponsible, a specified duration, and, most probably, a budget.
242 © 2006 SAP AG. All rights reserved. 2006/Q2

HR580 Lesson: Overview of HCM in Strategic Enterprise Management (SEM)
Figure 145: BSC: Strategic Alignment of the Enterprise
Enterprise goals can be cascaded throughout the entire enterprise and stored inlower-level scorecards for areas, departments, and so on. We can distinguishbetween the following levels:
� Define enterprise goals:
� What are our core competencies?� What market position are we striving toward?� What products do we want to offer?
� Identify critical success factors:
� Formulation of strategic goals� Grouping into strategies
� What Paths Lead to Success:
� Formulate initiatives� Assign key figures� Set target values� Assign resources� Name people responsible
2006/Q2 © 2006 SAP AG. All rights reserved. 243

Unit 9: Appendix: HCM in BW and SEM HR580
Figure 146: BSC: Perspectives
Implementing the Balanced Scorecard in SAP SEM:
� The classic definition of a scorecard covers four balanced perspectives onwhich the success of the enterprise depends.
� Strategtic goals are identified for each perspective that is important forthe success of an enterprise or department. In this example, this relatesto reducing umplanned absences or competitive compensation. Keyperformance indicators monitor to what degree the goals are achieved. Thestatus of each goal is indicated using the colors red, yellow, and green.
The new aspect of the Balanced Scorecard concept allows not only financial goalsto be considered as important factors of success, but also less tangible ones suchas employee satisfaction and motivation.
The HCM department must consider the enterprise as its customer. As one ofthe HCM department's most important tasks is to assist others in contributing tothe value-adding process, it is essential that the HCM department does not losesight of its customers.
Once the customer perspective has been defined, the process perspective is much�simpler�. Processes should be so aligned that they provide optimal supportfor goals defined in relation to customers. The same applies to learning andgrowth perspectives that relate to the qualifications employees need in the HCMdepartment to fulfill all customer requirements.
Possible goals could be: use the Balanced Scorecard to improve recruitmentprocesses, minimize costs incurred by staff turnover, reduce absence times inpersonnel administration.
244 © 2006 SAP AG. All rights reserved. 2006/Q2

HR580 Lesson: Overview of HCM in Strategic Enterprise Management (SEM)
Lesson Summary
You should now be able to:� Give an overview of HCM in Strategic Enterprise Management.
2006/Q2 © 2006 SAP AG. All rights reserved. 245

Unit Summary HR580
Unit SummaryYou should now be able to:� Give a general overview of the Business Information Warehouse in the area
of HCM.� Provide details of the business content of the InfoCubes, queries and key
figures available in HCM.� Execute HR queries.� Give an overview of HCM in Strategic Enterprise Management.
246 © 2006 SAP AG. All rights reserved. 2006/Q2

HR580 Course Summary
Course SummaryYou should now be able to:
� Handle a variety of reporting tools� Perform reporting in different systems
2006/Q2 © 2006 SAP AG. All rights reserved. 247

Course Summary HR580
248 © 2006 SAP AG. All rights reserved. 2006/Q2

Appendix 1Appendices
� This section contains supplementary reference material.� This material is not part of the standard course.� The instructor may not cover this material during the course presentation.
Overview: Reporting in mySAP ERP 2005
This section contains a tabular overview of the purpose, benefits, and limitationsof the different reporting options in HCM.
Reporting Tool Purpose Advantages LimitationsStandard Reports Provide
solutions foryour mostfrequentreportingrequirements
Can be usedimmediatelyNoprogrammingrequired
LimitedflexibilityOutput fieldscannot beselected asrequired
2006/Q2 © 2006 SAP AG. All rights reserved. 249

Appendix 1: Appendices HR580
Reporting Tool Purpose Advantages LimitationsHIS Hierarchies are
displayed asgraphics
Reports areexecutedusing selectedstructures orsubstructures,that is, usingpreselected setsof objects.
User-friendlymethod ofdisplayinghierarchicalstructures
Integration withInfoSet Queryand standardreports
No need toswitch from oneHR applicationto another ifyou want toexecute reportsfrom differentapplications
Little trainingrequired
Limitedflexibility
Tool is used toexecute standardreports andcustomer reports
It cannot be usedto create reports
250 © 2006 SAP AG. All rights reserved. 2006/Q2

HR580 Appendix 1: Appendices
Reporting Tool Purpose Advantages LimitationsInfoSet Query Intuitive,
general SAPreporting toolused to createcustomerreportsEnables you tocreate reportsfor all areas ofHR
When InfoSetQuery isaccessedfrom HumanResources(HR), theQuery Areaand UserGroupparametersalready containvalues andyou can onlyperform ad hocreporting. IfInfoSet Queryis accessed thisway, it is calledAd Hoc Queryin HR (seeHR in InfoSetQuery).
User-friendlyinterface
Very easy to use
No programmingrequired
If integratedwith SAP Query,you can furtherprocess queriesusing SAP Query.
Set operationsenable youto create setsof objects asrequired forwhich data mustbe output
Can be includedin roles using asuitable InfoSet
InfoSets and usergroups must bedefined in SAPQuery before youcan use InfoSetQuery
Multiline listscannot bedisplayed
2006/Q2 © 2006 SAP AG. All rights reserved. 251

Appendix 1: Appendices HR580
Reporting Tool Purpose Advantages LimitationsSAP Query General SAP
reporting toolused to createcustomerreportsIndividualdefinition ofuser groups,InfoSets, andqueries.
ExtremelyflexibleNoprogrammingrequired
Queries can beprovided inthe SAP EasyAccess menu
Includesnumerousoptions foraggregatingdata,performingcalculations,and displayinggraphics.
Enables youto displaymultiline lists
Enables you todefine one basiclist and severalstatistics andranked lists foreach query
Restricted todata from theR/3 SystemEach HR querycan processdata from justone HR logicaldatabase:
PNP:Administration,TimeManagement,and Payroll
PCH:Generallyfor all areas,but particularlysuitable forreporting ondata fromPersonnelPlanning
PAP:Recruitment
Requires muchmore trainingthan otheroptions
252 © 2006 SAP AG. All rights reserved. 2006/Q2

HR580 Appendix 1: Appendices
Reporting Tool Purpose Advantages LimitationsBusinessInformationWarehouseFor moreinformation,see the BWdocumentation.
Analyticalreportingtool used forinformationand decision-makingpurposes
ExtremelyflexibleFacilitatescomplexcalculations(calculationof averages,time seriescomparisons)
Enables you toaccess non-SAPdata
Easy to use
Uses OLAPtechnology
IncludesdetailedBusinessContent (HRextractors,InfoCubes,key figures,and standardqueries).
Data isextracted fromOLTP systems,that is, real-timedata is notaccessed.
Selecting a Reporting Tool
Purpose
To enable you to report on HR data, the R/3 System provides you with numerousstandard reports and, in addition, reporting tools that give you easy access toexisting reports (HIS) or enable you to create your own reports, even if you haveno programming skills (InfoSet Query, SAP Query).
HIS
HIS is used to report on HR data along hierarchical structures (organizationalstructure, business event hierarchy, or customer hierarchies). You can select thestructure you want to report on, and the objects you want to display. The structureis displayed in SAP Structural Graphics. In the standard system, a separate
2006/Q2 © 2006 SAP AG. All rights reserved. 253

Appendix 1: Appendices HR580
window lists all of the reports that exist for the root object. They correspond tothe standard reports in Human Resources. Customizing also enables you to addyour own reports.
Use HIS to report on HR data along hierarchical structures. HIS is particularlyuseful if you want to report on data from different HR components because youcan start all reports from HIS, which means you do not have to switch from onecomponent to another. Another advantage of HIS is that you are not required toenter data in a selection screen when a report is started because HIS uses theparameters that are most frequently set in practice.
InfoSet Query
InfoSet Query is a general SAP reporting tool that is particularly easy to use andintuitive. By selecting selection fields and output fields directly, you can accessdata stored anywhere within the Human Resources System.
You do not require programming skills to create reports using InfoSet Query. Ifyou have the appropriate authorizations, you can save and reuse reports definedin InfoSet Query.
Hint: When InfoSet Query is accessed from Human Resources (HR), theparameters Work Area and User Group already contain values and youcan only perform ad hoc reporting. When you access the InfoSet Queryin this way in HR, it is called Ad Hoc Query.
Use InfoSet Query if the system does not include a suitable standard report.InfoSet Query is particularly suitable for
� Defining specific or seldom required reports on an �ad hoc� basis� Defining specific reports that need to be reused
InfoSet Query is also suitable for cross-component reporting within HR becauseit can access data from Personnel Administration and person-related data fromPayroll, Time Management, and Personnel Planning, for example. Furthermore,you can use InfoSet Query to report on data for objects in Personnel Planning.
SAP Query
SAP Query is a cross-application reporting tool in the R/3 System. Just likeInfoSet Query, it is used to create reports that are not included in the standardsystem. You do not require programming skills to work with SAP Query.
254 © 2006 SAP AG. All rights reserved. 2006/Q2

HR580 Appendix 1: Appendices
In the context of HR reporting, SAP Query has the following functions:
� It provides additional options for reporting on data and formatting output.You can:
� Use control levels. Use this output option if you want to put differentinfotype fields into groups; for example, all of the addresses pertainingto one person. This is particularly relevant to infotypes with subtypesand/or time constraint 3. See Output Options for Control Levels
� Define one basic list, up to nine statistics, and up to nine ranked listsper report (query). This enables you to prepare data for the outputlist in a number of different ways.
� Format output lists using colors.� Define and use local fields.
� It is used to manage the user groups and InfoSets that are required for InfoSetQuery, assuming you do not use the InfoSets included in the standard system.
Use SAP Query if you cannot use InfoSet Query to meet your requirements, orto refine queries from InfoSet Query. You could, for example, enhance a queryby outputting control levels.
Business Information Warehouse
The Business Information Warehouse (SAP BW) is an independent DataWarehouse solution that can be used to retrieve data from SAP systems and thevast majority of external systems. BW provides you with specialized reportingtechnology and HR Business Content, which means it contains business content,reports, and key figures from all areas of Human Resources.
An important BW focus is on the retrieval of key figures and time seriescomparisons (for example, headcount with regard to organizational characteristicsduring the past three years). Operational data from various areas within anenterprise is prepared using predefined standard queries and report templates.You can break comparative key figures down to individual employees. BW alsoenables you to create different views of queries by exchanging free characteristics.
BW can provide data in an intranet/Internet environment, where it can be viewedat any time by persons with the appropriate authorizations. It supplies you withdata for decision-making and information purposes. Standard calculation of keyfigures also facilitates benchmarking.
If you require further information on BW Queries for Human ResourcesManagement, refer to the documentation on the Business Information Warehouseand see the section on Queries with HR Business Content.
2006/Q2 © 2006 SAP AG. All rights reserved. 255

Appendix 1: Appendices HR580
Figure 147: Reports (I)
Figure 148: Reports (II)
Figure 149: Query
256 © 2006 SAP AG. All rights reserved. 2006/Q2

FeedbackSAP AG has made every effort in the preparation of this course to ensure theaccuracy and completeness of the materials. If you have any corrections orsuggestions for improvement, please record them in the appropriate place in thecourse evaluation.
2006/Q2 © 2006 SAP AG. All rights reserved. 257
Related Documents