Pricing strategies of low-cost airlines: The Ryanair case study Paolo Malighetti a, * , Stefano Paleari a , Renato Redondi b a Department of Economics and Technology Management, University of Bergamo– Universoft, Viale Marconi 5, Dalmine 24044, Italy b Department of Mechanical Engineering, University of Brescia – Universoft, Via Branze, 38 – 25123 Brescia, Italy Keywords: Dynamic pricing Low-cost Ryanair Fares abstract We analyse the pricing policy adopted by Ryanair, the main low-cost carrier in Europe. Based on a year’s fare data for all of Ryanair’s European flights, using a family of hyperbolic price functions, the optimal pricing curve for each route is estimated. The analysis shows a positive correlation between the average fare for each route and its length, the frequency of flights operating on that route, and the percentage of fully booked flights. As the share of seats offered by the carrier at the departure and destination airports increases, fares tend to decrease. The correlation of dynamic pricing to route length and the frequency of flights is negative. Conversely, as competition increases discounts on advance fares rise. Ó 2008 Elsevier Ltd. All rights reserved. 1. Introduction In recent years, the entry of low-cost carriers has totally revo- lutionised the air passenger transport industry. The low-cost business model was introduced by Southwest in the US at the beginningof the 1970s. However, it was only in the 1990s that the phenomenon spread worldwide. Ryanair was one of the first airlines in Europe to adopt the low-cost model in 1992. Easyjet, Ryanair’s main low-cost competitor, was founded in 1995. Although the phenomenon is relatively recent, the stunning results obtained by low-cost carriers urge academics to study the reasons for their success. The reduction of costs lies at the core of the low-cost business model, which aims to offer lower fares, eliminating some comfort and services that were traditionally guaranteed (hence the defini- tion of ‘‘no frills’’, often employed to refer to low-cost flights). The use of an on-line booking system, the suppression of free in-flight catering, the use of secondary airports connected through a point- to-point network, and the use of homogeneous fleets are only a part of the innovative choices made by low-cost airlines. Many studies have analysed low-cost businesses, highlighting the keys to lower costs (Alamdari and Fagan, 2005; Doganis, 2006; Franke, 2004), and the role played by entreprership (Cassia et al., 2006). The containment of costs is only one of the reasons for the success of a low-cost carrier. Alertness to ‘‘latent demand,’’ char- acterised by the passenger’s willingness to pay elastic prices, which is not the attitude of the so-called ‘‘traditional’’ passenger, is among the key factors. In the airline business, the maximisation of the profits obtained from each flight is strictly related to the maximisation of revenues, because many of the costs incurred are essentially fixed, at least in the short term. Pricing has always represented an important factor in the carriers’ choices, driving the adoption of different strategies by low-cost and full-cost carriers. Full-cost carriers choose price discrimination techniques based on different fare classes, complex systems of discounts with limited access, customer loyalty schemes, and overbooking techniques. Low-cost carriers instead use ‘‘dynamic pricing’’. Because of dynamic pricing, it is now common for people to buy air tickets to European destinations for less than V10.00 (airport taxes excluded). This paper deals with the pricing policies of low-cost carriers, offering a detailed analysis of Ryanair, the main developer of the low-cost model in Europe. Generally speaking, fares tend to increase until the very last moment before the closing of bookings. If it is assumed that Ryanair aims to maximise its profits, it is to be expected that travellers are prepared to bear higher costs more easily as the date of flight approaches. We aim to identify the competitive and contextual factors that drive the choice of the average fares, and their relative dynamics. In details, our analysis will focus on Ryanair’s pricing policies in correlation with the features of its airport network. The results show that the fare policy is clearly innovative relative to traditional pricing strategies, and that the fares are influenced by the competitive economic context in which the route is offered. 2. State of the art This study refers to two main fields of literature, namely the analysis of the low-cost business model and the study of dynamic pricing techniques. The main point of interest is the extraordinary * Corresponding author. E-mail address: [email protected] (P. Malighetti). Contents lists available at ScienceDirect Journal of Air Transport Management journal homepage: www.elsevier.com/locate/jairtraman 0969-6997/$ – see front matter Ó 2008 Elsevier Ltd. All rights reserved. doi:10.1016/j.jairtraman.2008.09.017 Journal of Air Transport Management 15 (2009) 195–203

Welcome message from author
This document is posted to help you gain knowledge. Please leave a comment to let me know what you think about it! Share it to your friends and learn new things together.
Transcript
lable at ScienceDirect
Journal of Air Transport Management 15 (2009) 195–203
Contents lists avai
Journal of Air Transport Management
journal homepage: www.elsevier .com/locate/ ja i r t raman
Pricing strategies of low-cost airlines: The Ryanair case study
Paolo Malighetti a,*, Stefano Paleari a, Renato Redondi b
a Department of Economics and Technology Management, University of Bergamo– Universoft, Viale Marconi 5, Dalmine 24044, Italyb Department of Mechanical Engineering, University of Brescia – Universoft, Via Branze, 38 – 25123 Brescia, Italy
Keywords:Dynamic pricingLow-costRyanairFares
* Corresponding author.E-mail address: [email protected] (P. Mali
0969-6997/$ – see front matter � 2008 Elsevier Ltd.doi:10.1016/j.jairtraman.2008.09.017
a b s t r a c t
We analyse the pricing policy adopted by Ryanair, the main low-cost carrier in Europe. Based on a year’sfare data for all of Ryanair’s European flights, using a family of hyperbolic price functions, the optimalpricing curve for each route is estimated. The analysis shows a positive correlation between the averagefare for each route and its length, the frequency of flights operating on that route, and the percentage offully booked flights. As the share of seats offered by the carrier at the departure and destination airportsincreases, fares tend to decrease. The correlation of dynamic pricing to route length and the frequency offlights is negative. Conversely, as competition increases discounts on advance fares rise.
� 2008 Elsevier Ltd. All rights reserved.
1. Introduction
In recent years, the entry of low-cost carriers has totally revo-lutionised the air passenger transport industry. The low-costbusiness model was introduced by Southwest in the US at thebeginning of the 1970s. However, it was only in the 1990s that thephenomenon spread worldwide. Ryanair was one of the firstairlines in Europe to adopt the low-cost model in 1992. Easyjet,Ryanair’s main low-cost competitor, was founded in 1995.Although the phenomenon is relatively recent, the stunning resultsobtained by low-cost carriers urge academics to study the reasonsfor their success.
The reduction of costs lies at the core of the low-cost businessmodel, which aims to offer lower fares, eliminating some comfortand services that were traditionally guaranteed (hence the defini-tion of ‘‘no frills’’, often employed to refer to low-cost flights). Theuse of an on-line booking system, the suppression of free in-flightcatering, the use of secondary airports connected through a point-to-point network, and the use of homogeneous fleets are only a partof the innovative choices made by low-cost airlines.
Many studies have analysed low-cost businesses, highlightingthe keys to lower costs (Alamdari and Fagan, 2005; Doganis, 2006;Franke, 2004), and the role played by entreprership (Cassia et al.,2006). The containment of costs is only one of the reasons for thesuccess of a low-cost carrier. Alertness to ‘‘latent demand,’’ char-acterised by the passenger’s willingness to pay elastic prices, whichis not the attitude of the so-called ‘‘traditional’’ passenger, is amongthe key factors.
ghetti).
All rights reserved.
In the airline business, the maximisation of the profits obtainedfrom each flight is strictly related to the maximisation of revenues,because many of the costs incurred are essentially fixed, at least inthe short term. Pricing has always represented an important factorin the carriers’ choices, driving the adoption of different strategiesby low-cost and full-cost carriers. Full-cost carriers choose pricediscrimination techniques based on different fare classes, complexsystems of discounts with limited access, customer loyaltyschemes, and overbooking techniques. Low-cost carriers insteaduse ‘‘dynamic pricing’’. Because of dynamic pricing, it is nowcommon for people to buy air tickets to European destinations forless than V10.00 (airport taxes excluded).
This paper deals with the pricing policies of low-cost carriers,offering a detailed analysis of Ryanair, the main developer of thelow-cost model in Europe. Generally speaking, fares tend toincrease until the very last moment before the closing of bookings.If it is assumed that Ryanair aims to maximise its profits, it is to beexpected that travellers are prepared to bear higher costs moreeasily as the date of flight approaches. We aim to identify thecompetitive and contextual factors that drive the choice of theaverage fares, and their relative dynamics. In details, our analysiswill focus on Ryanair’s pricing policies in correlation with thefeatures of its airport network. The results show that the fare policyis clearly innovative relative to traditional pricing strategies, andthat the fares are influenced by the competitive economic contextin which the route is offered.
2. State of the art
This study refers to two main fields of literature, namely theanalysis of the low-cost business model and the study of dynamicpricing techniques. The main point of interest is the extraordinary
P. Malighetti et al. / Journal of Air Transport Management 15 (2009) 195–203196
performance of the major low-cost carriers, especially whencompared with the trend, and the average profitability, of the airtransport industry in general. Researchers have extensively exam-ined the cost-effective policy, which so clearly permeates the low-cost business model. Franke (2004) and Doganis (2006) havefocused in particular on the cost benefits that low-cost carriers canderive from their operational choices. Their studies show that thereis no single driving element responsible for the competitiveadvantage. Rather, all the choices made contribute to the produc-tion of cost benefits. Gudmundsson (2004), using a longitudinalsurvey approach, studies factors explaining the success probabilityof the ‘‘new’’ airlines and finds that productivity and brand imagefocus are significantly related to financial non-distress, whilstmarket power (market-share) focus is significantly related tofinancial distress.
A first mover competitive advantage could explain why the mostsuccessful airlines seem to be able to maintain their market lead-ership in the short and medium term, are the ones that gave rise tothe phenomenon, as witnessed by the likes of Southwest in the USAand by Ryanair and Easyjet in Europe. It is clear that, a good low-cost strategy can never be replicated in all its detailsdand thiscould account for the carriers that succeeded as well as for thosethat did not. Alamdari and Fagan’s (2005) study quantified theimpact of the deviation from the original low-cost business model.
The importance of the different strategic choices made bycarriers suggests investigating other elements of the low-costbusiness model. Revenue analysis is an important element that hasbeen less studied. Indeed, the generation of revenues is onedistinctive aspect differentiating low-cost from full-cost airlinespolicies. Piga and Filippi (2002) have analysed the pricing policiesof the low-cost business model in comparison with the pricingstrategies of the full-cost airlines. Coherent choices seem to beessential in pricing policies as well. For instance, the widespreaduse of the Internet for the sale of tickets tends to decrease pricedispersion. This phenomenon may in part be attributed to the‘‘efficiency of electronic markets,’’ as defined by Smith (Smithet al., 2000).
The success of the low-cost model is based on a fragile balancebetween fare levels, load factors and operating costs. The structureof revenues and the determination of prices are nearly as importantas the minimisation of costs in the equation of profits. Indeed, anexcellent pricing strategy for perishable assets results in a turnoverincrease, ceteris paribus, which can be quantified between 2% and5%, according to Zhao and Zheng’s (2000) study.
The analysis of fare levels and policies aims to understand thekey factors in the achievements of low-cost carriers, including theeffects of the competitive interaction between carriers (Pels andRietveld, 2004). The price choices and the ability of the airlines tounderstand the characteristics of the demand, in either a conditionof monopoly or a competitive context, are decisive in the balance ofthe business model itself. Fare dynamics must be taken intoaccount in a thorough evaluation of market competitiveness, and ofthe benefits travellers have achieved through deregulation.
This paper analyses the pricing strategies adopted by Ryanairagainst the characteristics of the context in which it operates,including the degree of competitiveness.
First, the study deals with the demand curve derived fromRyanair’s prices. The analysis starts from the microeconomic prin-ciples of dynamic pricing. Generally speaking, airlines deal withperishable goods sold in different time steps, with the aim tomaximise profits. The offer of seats on a flight can be compared tothe sale of ‘‘perishable assets’’ with pre-determined capacity inconditions of negligible marginal costs. The themes investigated bythe relevant literature are dynamic pricing and yield management.
Zhao and Zheng (2000) have determined the minimumconditions required for optimal dynamic pricing. Because the price
trend is influenced by demand, one part of the literature focuses onoptimal pricing policies by using specific functional forms torepresent demand and customer benefits. For example, it is quitetypical to use an exponential demand curve (Gallego and VanRyzin, 1994) and a mechanism ‘‘of customer arrival’’ into themarket with a probability similar to a Poisson process. The studiesmentioned above presuppose a continuous optimal price function.Other studies are more likely to hypothesise the existence ofa limited range of prices (Wilson, 1988). The present study adoptsa continuous function, because Ryanair offers a wide range ofprices.
The study of price dynamics raises interesting questions. Manytravellers have probably noticed that prices often tend to increaseas the flight date approaches. According to McAfee and te Velde(2006), in the period preceding the flight date, the price trendmainly depends on the trade off between the option of waiting fora potential lower price, and the risk of seats becoming unavailable.In this case, the functional form of the demand curve, together withits adjustment over time, also help to determine a series ofminimum prices.
This study analyses the range of actual prices on all of Ryanair’sroutes. It aims to validate some of the assumptions made in theliterature through a thorough study of this wide empirical sample.The estimated demand curve makes it possible to make inferencesabout the trend of bookings and the curve relating to the fullybooked aircraft. Stokey’s (1979) studies determined an optimalconstant filling curve in a context of monopoly. Similar results canbe obtained by using a demand with functional forms belonging tothe family of continuous functions presented by Anjos et al. (2005).For such functions, when dealing with goods that are to be sold bya given deadline, it is possible to define and implement the optimalpricing strategy. The reference curves adopted in this study belongto the Anjos family of curves.
The structure of demand, which guides the optimisation choicesof the carrier, is influenced by the presence of competitors, and thepassengers’ opportunities to opt for a substitute service. Classicalstudies, starting from Borenstein’s (1989) analysis, have mainlyfocused on the airlines’ average fare level, showing the undeniableinfluence exercised by the competitive structure on the fares of full-cost airlines. Such competitive structures are exemplified by a farepremium correlated to the dominance of the hub of reference.Alderighi et al. (2004) have pointed out that full-cost airlines tendto decrease fares on routes also operated by low-cost carriers. Theinfluence of the competitive structure on the pricing strategies oflow-cost carriers has been less studied, as far as we know. Pels andRietveld’s (2004) studies have examined the evolution of fares onthe London–Paris route; traditional behavioural models do notseem to apply here, given the mixture of direct and indirectcompetition.
It is not clear whether the presence of other airlines can criti-cally affect the pricing strategies of low-cost carriers. Pitfield (2005)has analysed the routes originating from Nottingham East Midlandsairport in 2003, when it was possible to observe low-cost airlines indirect competition. The results showed a weak influence of thecompetitive structure on prices. The historical pattern of faresoffered by each airline seems to play a more important role, aswould be expected in a situation of price leadership. In a studyexamining the London–Berlin and London–Amsterdam routes,Barbot (2005) found that the low-cost and full-cost markets coexiston totally separate levels, so that low-cost carriers compete ‘‘only’’among themselves, as do full-cost carriers.
The approach we have adopted here focuses on the differentbehaviours assumed by carriers according to the distinctive char-acteristics of the routes they operate. We aim to identify thecompetitive and contextual factors that drive the choice of theaverage fares, and their relative dynamics.
P. Malighetti et al. / Journal of Air Transport Management 15 (2009) 195–203 197
3. Methodological aspects
The literature on low-cost carriers highlights the important roleplayed by dynamic pricing. It is assumed that once the flights havebeen scheduled, the marginal costs incurred in relation to thenumber of passengers are practically null. It follows that themaximisation of profits is strictly dependent on the maximisationof the revenue function. Let the reference unit of time be the singleday.1 Considering T days, the revenue R can be expressed as
R ¼XT
i¼1
piqi (1)
where pi is the flight price on the day i of the year, and qi is thenumber of seats booked on the same day. The optimal pricingstrategy results from the maximisation of the previous expression,under the binding limit of the aircraft’s capacity, which can beexpressed as
XT
i¼1
qi � Q (2)
where Q is the capacity, that is, the total number of seats availableon the aircraft.
For the purposes of this study it is assumed that, for the specificroute and type of customers availing themselves of low-cost flights,the operator is not a price-taker. We hypothesise that thecompetitive structure and the level of market and product differ-entiation enable the operators to modify the price variable. Themaximisation problem can be solved through a ‘‘lagrangian’’.
L ¼XT
i¼1
piqi þ m
Q �
XT
i¼1
qi
!(3)
where m represents the Kuhn–Tucker’s multiplier, which takes intoaccount the aircraft limit of capacity. It follows that
m
Q �
XT
i¼1
qi
!¼ 0
If the limit of capacity is reached, m> 0; if not, m¼ 0. In order todetermine the optimal price pi at the specific time i, the derivativeof the expression (3) with respect to pi must equal zero, thusobtaining
vLvpi¼ qi þ
XT
j¼1
�pj � m
�vqj
vpi¼ 0 where i˛½1;K; T � (4)
This expression can be held valid even if the markets on thedifferent days are not ‘‘separated.’’ In this case, for example, the fareduring one period can modify the quantity of available seats ina successive period, that is, vqj/vpi s 0 with i s j. In line with many ofthe studies analysed in the literature, for the purpose of this study, it isassumed that the markets for the purchase of air tickets are separatedin time, that is vqj/vpi¼ 0 with i s j. A later development of this studywill eliminate this hypothesis in order to verify the possible interactionbetween the demands of the different periods.
Here, expression (4) is simplified in the following optimalconditions:
qi þ ðpi � mÞvqi
vpi¼ 0 where i˛½1;K; T � (5)
1 Demand and prices are assumed to be fixed over the single day.
This study considers the functional form of demand as proposedby Anjos et al. (2005), where the demand for air tickets depends onprice levels, and on the time interval between the purchase dateand the flight date, according to
qi ¼ Ae�a$piFðiÞ where i˛½1;K; T � (6)
where A and a are two constants, and F(i) is a function positivelycorrelated to the time period between the purchase date and theflight date. In this case, the function of demand is subject to anexponential decrease as the advance purchasing time increases.
An advance booking is less useful because people are less sure oftheir plans far in advance. Given the functional form of the demandin expression (6), it is possible to identify the optimal pricingstrategy by substituting the following form for pi in expression (5).
pi ¼ mþ 1a$FðiÞ (7)
The multiplier m can be viewed as the extra charge assigned tothe fully booked flights.2 In the next section, some F(i) forms will betested on Ryanair’s actual prices. The parameters of the pricefunction will be estimated by minimising the quadratic errorcompared to the actual prices. The underlying assumption is thatRyanair operates by maximising its revenues, and using a demandfunction similar to function (6). Therefore, the accuracy that may beobtained using the model for the estimation of prices enablesassessment of the validity of the forms of the demand curves.
Through the substitution of the optimal price expression (7) inthe expression (6), we have
qi ¼ Ae�1 (8)
Expression (8) implies that, following the application of theoptimal price, the expected demand is steady over time. If thequantity sold over a certain time span is greater than the steadyexpected quantity, the operator may decide to raise the price.Similarly, the operator may decide to reduce the price in order togain demand when demand is scarce.
In the empirical calculations, two functions are used for theestimation of prices. The first expression is
pi ¼ mþ 1a$ð1þ b$iÞ (9)
where i is the number of days between the advance reservation andthe flight date. The form of the optimal price is a hyperbola with theprice going up as the flight date approaches. This functional formmakes it impossible to obtain price reductions as the flight dateapproaches.
A more complete functional form is
pi ¼ mþ 1
a$�
1þ b$iþ g$i2 þ qffiffiip � (10)
In this case, the price may decrease as the departure dateapproaches. The degree of accuracy of both functional forms will bediscussed in the next section.
The hypothesis is that Ryanair has tailored a pricing strategy forspecific routes. In other words, it is assumed that Ryanair holdsspecific values for the parameters in (9) and (10) for each individualroute. An estimation of the parameters of the price functions ismade for each route using data from the 90-day period before theflight date.
2 Fully booked flights have no available seats on the day before departure.
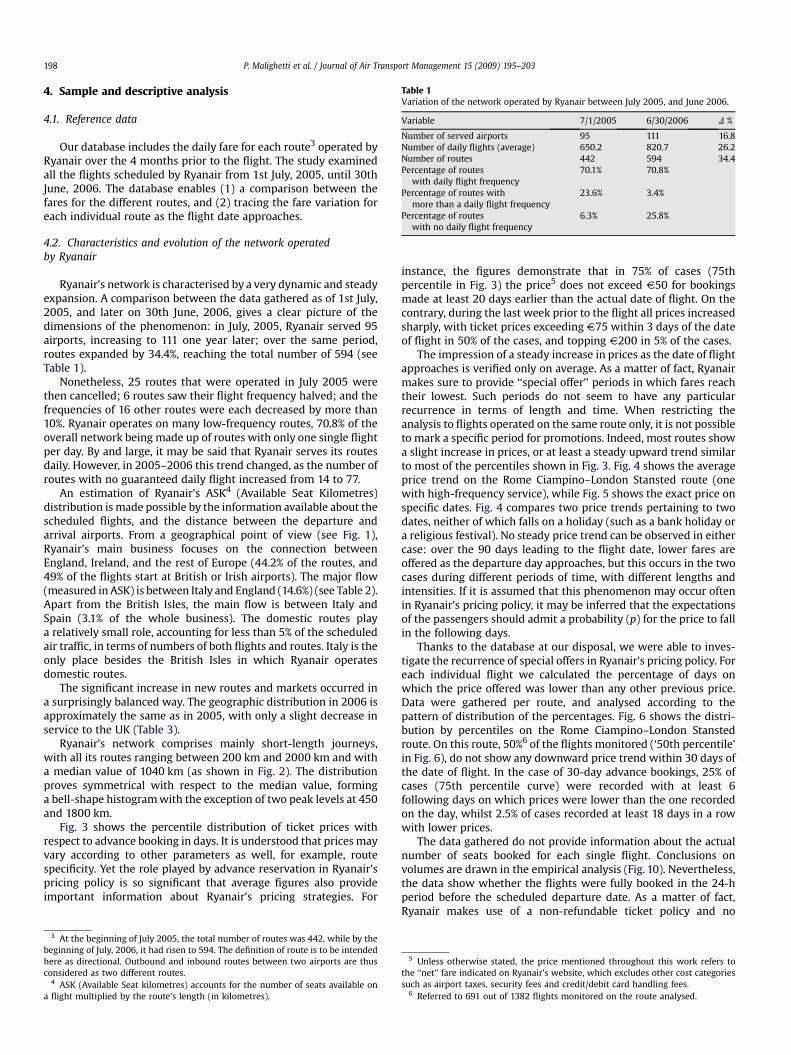
Table 1Variation of the network operated by Ryanair between July 2005, and June 2006.
Variable 7/1/2005 6/30/2006 D %
Number of served airports 95 111 16.8Number of daily flights (average) 650.2 820.7 26.2Number of routes 442 594 34.4Percentage of routes
with daily flight frequency70.1% 70.8%
Percentage of routes withmore than a daily flight frequency
23.6% 3.4%
Percentage of routeswith no daily flight frequency
6.3% 25.8%
P. Malighetti et al. / Journal of Air Transport Management 15 (2009) 195–203198
4. Sample and descriptive analysis
4.1. Reference data
Our database includes the daily fare for each route3 operated byRyanair over the 4 months prior to the flight. The study examinedall the flights scheduled by Ryanair from 1st July, 2005, until 30thJune, 2006. The database enables (1) a comparison between thefares for the different routes, and (2) tracing the fare variation foreach individual route as the flight date approaches.
4.2. Characteristics and evolution of the network operatedby Ryanair
Ryanair’s network is characterised by a very dynamic and steadyexpansion. A comparison between the data gathered as of 1st July,2005, and later on 30th June, 2006, gives a clear picture of thedimensions of the phenomenon: in July, 2005, Ryanair served 95airports, increasing to 111 one year later; over the same period,routes expanded by 34.4%, reaching the total number of 594 (seeTable 1).
Nonetheless, 25 routes that were operated in July 2005 werethen cancelled; 6 routes saw their flight frequency halved; and thefrequencies of 16 other routes were each decreased by more than10%. Ryanair operates on many low-frequency routes, 70.8% of theoverall network being made up of routes with only one single flightper day. By and large, it may be said that Ryanair serves its routesdaily. However, in 2005–2006 this trend changed, as the number ofroutes with no guaranteed daily flight increased from 14 to 77.
An estimation of Ryanair’s ASK4 (Available Seat Kilometres)distribution is made possible by the information available about thescheduled flights, and the distance between the departure andarrival airports. From a geographical point of view (see Fig. 1),Ryanair’s main business focuses on the connection betweenEngland, Ireland, and the rest of Europe (44.2% of the routes, and49% of the flights start at British or Irish airports). The major flow(measured in ASK) is between Italy and England (14.6%) (see Table 2).Apart from the British Isles, the main flow is between Italy andSpain (3.1% of the whole business). The domestic routes playa relatively small role, accounting for less than 5% of the scheduledair traffic, in terms of numbers of both flights and routes. Italy is theonly place besides the British Isles in which Ryanair operatesdomestic routes.
The significant increase in new routes and markets occurred ina surprisingly balanced way. The geographic distribution in 2006 isapproximately the same as in 2005, with only a slight decrease inservice to the UK (Table 3).
Ryanair’s network comprises mainly short-length journeys,with all its routes ranging between 200 km and 2000 km and witha median value of 1040 km (as shown in Fig. 2). The distributionproves symmetrical with respect to the median value, forminga bell-shape histogram with the exception of two peak levels at 450and 1800 km.
Fig. 3 shows the percentile distribution of ticket prices withrespect to advance booking in days. It is understood that prices mayvary according to other parameters as well, for example, routespecificity. Yet the role played by advance reservation in Ryanair’spricing policy is so significant that average figures also provideimportant information about Ryanair’s pricing strategies. For
3 At the beginning of July 2005, the total number of routes was 442, while by thebeginning of July, 2006, it had risen to 594. The definition of route is to be intendedhere as directional. Outbound and inbound routes between two airports are thusconsidered as two different routes.
4 ASK (Available Seat kilometres) accounts for the number of seats available ona flight multiplied by the route’s length (in kilometres).
instance, the figures demonstrate that in 75% of cases (75thpercentile in Fig. 3) the price5 does not exceed V50 for bookingsmade at least 20 days earlier than the actual date of flight. On thecontrary, during the last week prior to the flight all prices increasedsharply, with ticket prices exceeding V75 within 3 days of the dateof flight in 50% of the cases, and topping V200 in 5% of the cases.
The impression of a steady increase in prices as the date of flightapproaches is verified only on average. As a matter of fact, Ryanairmakes sure to provide ‘‘special offer’’ periods in which fares reachtheir lowest. Such periods do not seem to have any particularrecurrence in terms of length and time. When restricting theanalysis to flights operated on the same route only, it is not possibleto mark a specific period for promotions. Indeed, most routes showa slight increase in prices, or at least a steady upward trend similarto most of the percentiles shown in Fig. 3. Fig. 4 shows the averageprice trend on the Rome Ciampino–London Stansted route (onewith high-frequency service), while Fig. 5 shows the exact price onspecific dates. Fig. 4 compares two price trends pertaining to twodates, neither of which falls on a holiday (such as a bank holiday ora religious festival). No steady price trend can be observed in eithercase: over the 90 days leading to the flight date, lower fares areoffered as the departure day approaches, but this occurs in the twocases during different periods of time, with different lengths andintensities. If it is assumed that this phenomenon may occur oftenin Ryanair’s pricing policy, it may be inferred that the expectationsof the passengers should admit a probability (p) for the price to fallin the following days.
Thanks to the database at our disposal, we were able to inves-tigate the recurrence of special offers in Ryanair’s pricing policy. Foreach individual flight we calculated the percentage of days onwhich the price offered was lower than any other previous price.Data were gathered per route, and analysed according to thepattern of distribution of the percentages. Fig. 6 shows the distri-bution by percentiles on the Rome Ciampino–London Stanstedroute. On this route, 50%6 of the flights monitored (‘50th percentile’in Fig. 6), do not show any downward price trend within 30 days ofthe date of flight. In the case of 30-day advance bookings, 25% ofcases (75th percentile curve) were recorded with at least 6following days on which prices were lower than the one recordedon the day, whilst 2.5% of cases recorded at least 18 days in a rowwith lower prices.
The data gathered do not provide information about the actualnumber of seats booked for each single flight. Conclusions onvolumes are drawn in the empirical analysis (Fig. 10). Nevertheless,the data show whether the flights were fully booked in the 24-hperiod before the scheduled departure date. As a matter of fact,Ryanair makes use of a non-refundable ticket policy and no
5 Unless otherwise stated, the price mentioned throughout this work refers tothe ‘‘net’’ fare indicated on Ryanair’s website, which excludes other cost categoriessuch as airport taxes, security fees and credit/debit card handling fees.
6 Referred to 691 out of 1382 flights monitored on the route analysed.
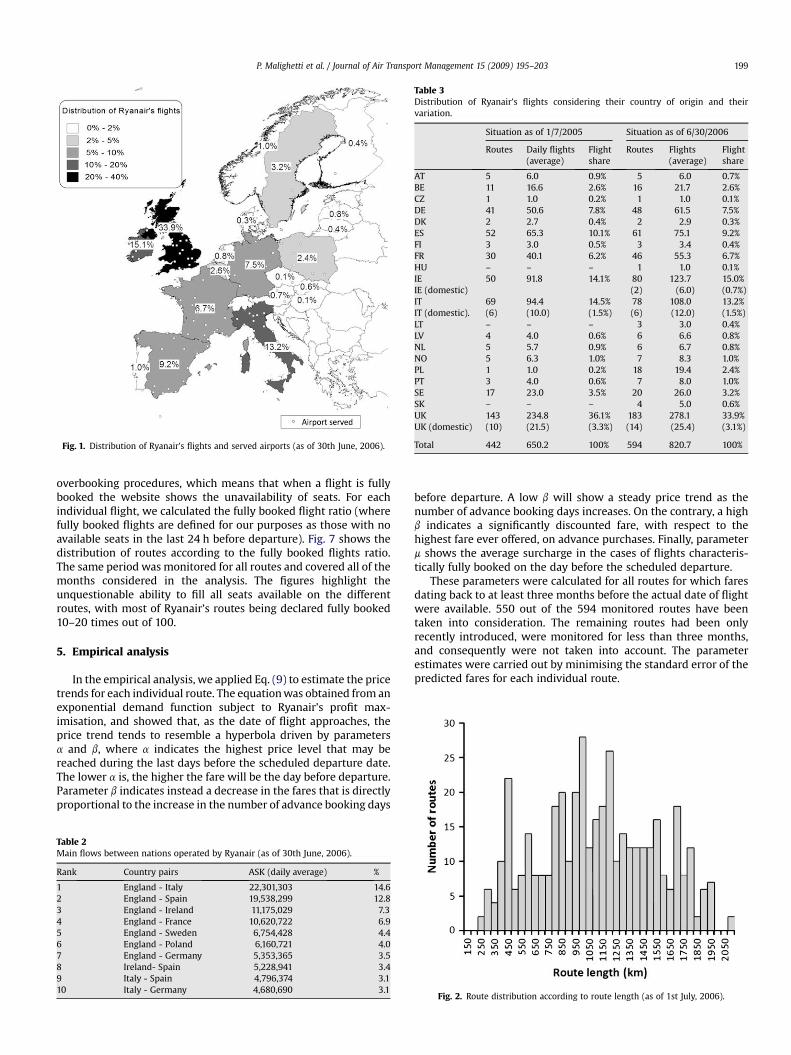
Fig. 1. Distribution of Ryanair’s flights and served airports (as of 30th June, 2006).
Table 3Distribution of Ryanair’s flights considering their country of origin and theirvariation.
Situation as of 1/7/2005 Situation as of 6/30/2006
Routes Daily flights(average)
Flightshare
Routes Flights(average)
Flightshare
AT 5 6.0 0.9% 5 6.0 0.7%BE 11 16.6 2.6% 16 21.7 2.6%CZ 1 1.0 0.2% 1 1.0 0.1%DE 41 50.6 7.8% 48 61.5 7.5%DK 2 2.7 0.4% 2 2.9 0.3%ES 52 65.3 10.1% 61 75.1 9.2%FI 3 3.0 0.5% 3 3.4 0.4%FR 30 40.1 6.2% 46 55.3 6.7%HU – – – 1 1.0 0.1%IE 50 91.8 14.1% 80 123.7 15.0%IE (domestic) (2) (6.0) (0.7%)IT 69 94.4 14.5% 78 108.0 13.2%IT (domestic). (6) (10.0) (1.5%) (6) (12.0) (1.5%)LT – – – 3 3.0 0.4%LV 4 4.0 0.6% 6 6.6 0.8%NL 5 5.7 0.9% 6 6.7 0.8%NO 5 6.3 1.0% 7 8.3 1.0%PL 1 1.0 0.2% 18 19.4 2.4%PT 3 4.0 0.6% 7 8.0 1.0%SE 17 23.0 3.5% 20 26.0 3.2%SK – – – 4 5.0 0.6%UK 143 234.8 36.1% 183 278.1 33.9%UK (domestic) (10) (21.5) (3.3%) (14) (25.4) (3.1%)
Total 442 650.2 100% 594 820.7 100%
P. Malighetti et al. / Journal of Air Transport Management 15 (2009) 195–203 199
overbooking procedures, which means that when a flight is fullybooked the website shows the unavailability of seats. For eachindividual flight, we calculated the fully booked flight ratio (wherefully booked flights are defined for our purposes as those with noavailable seats in the last 24 h before departure). Fig. 7 shows thedistribution of routes according to the fully booked flights ratio.The same period was monitored for all routes and covered all of themonths considered in the analysis. The figures highlight theunquestionable ability to fill all seats available on the differentroutes, with most of Ryanair’s routes being declared fully booked10–20 times out of 100.
5. Empirical analysis
In the empirical analysis, we applied Eq. (9) to estimate the pricetrends for each individual route. The equation was obtained from anexponential demand function subject to Ryanair’s profit max-imisation, and showed that, as the date of flight approaches, theprice trend tends to resemble a hyperbola driven by parametersa and b, where a indicates the highest price level that may bereached during the last days before the scheduled departure date.The lower a is, the higher the fare will be the day before departure.Parameter b indicates instead a decrease in the fares that is directlyproportional to the increase in the number of advance booking days
Table 2Main flows between nations operated by Ryanair (as of 30th June, 2006).
Rank Country pairs ASK (daily average) %
1 England - Italy 22,301,303 14.62 England - Spain 19,538,299 12.83 England - Ireland 11,175,029 7.34 England - France 10,620,722 6.95 England - Sweden 6,754,428 4.46 England - Poland 6,160,721 4.07 England - Germany 5,353,365 3.58 Ireland- Spain 5,228,941 3.49 Italy - Spain 4,796,374 3.110 Italy - Germany 4,680,690 3.1
before departure. A low b will show a steady price trend as thenumber of advance booking days increases. On the contrary, a highb indicates a significantly discounted fare, with respect to thehighest fare ever offered, on advance purchases. Finally, parameterm shows the average surcharge in the cases of flights characteris-tically fully booked on the day before the scheduled departure.
These parameters were calculated for all routes for which faresdating back to at least three months before the actual date of flightwere available. 550 out of the 594 monitored routes have beentaken into consideration. The remaining routes had been onlyrecently introduced, were monitored for less than three months,and consequently were not taken into account. The parameterestimates were carried out by minimising the standard error of thepredicted fares for each individual route.
Fig. 2. Route distribution according to route length (as of 1st July, 2006).
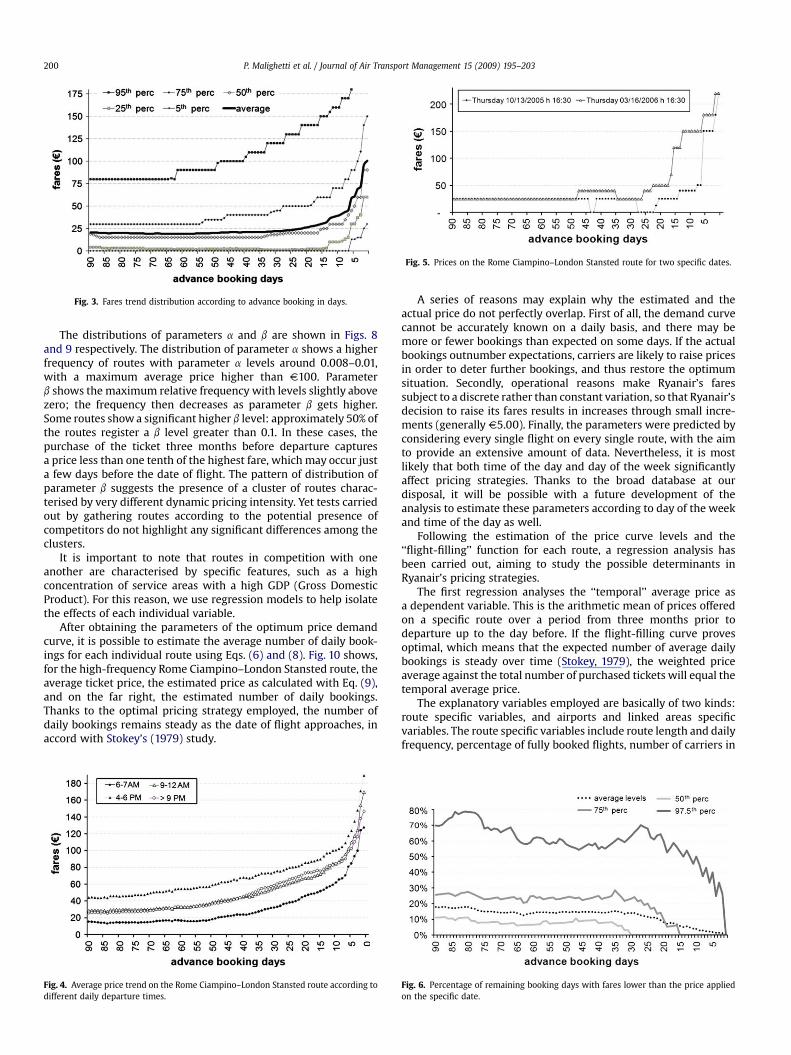
Fig. 3. Fares trend distribution according to advance booking in days.
Fig. 5. Prices on the Rome Ciampino–London Stansted route for two specific dates.
P. Malighetti et al. / Journal of Air Transport Management 15 (2009) 195–203200
The distributions of parameters a and b are shown in Figs. 8and 9 respectively. The distribution of parameter a shows a higherfrequency of routes with parameter a levels around 0.008–0.01,with a maximum average price higher than V100. Parameterb shows the maximum relative frequency with levels slightly abovezero; the frequency then decreases as parameter b gets higher.Some routes show a significant higher b level: approximately 50% ofthe routes register a b level greater than 0.1. In these cases, thepurchase of the ticket three months before departure capturesa price less than one tenth of the highest fare, which may occur justa few days before the date of flight. The pattern of distribution ofparameter b suggests the presence of a cluster of routes charac-terised by very different dynamic pricing intensity. Yet tests carriedout by gathering routes according to the potential presence ofcompetitors do not highlight any significant differences among theclusters.
It is important to note that routes in competition with oneanother are characterised by specific features, such as a highconcentration of service areas with a high GDP (Gross DomesticProduct). For this reason, we use regression models to help isolatethe effects of each individual variable.
After obtaining the parameters of the optimum price demandcurve, it is possible to estimate the average number of daily book-ings for each individual route using Eqs. (6) and (8). Fig. 10 shows,for the high-frequency Rome Ciampino–London Stansted route, theaverage ticket price, the estimated price as calculated with Eq. (9),and on the far right, the estimated number of daily bookings.Thanks to the optimal pricing strategy employed, the number ofdaily bookings remains steady as the date of flight approaches, inaccord with Stokey’s (1979) study.
Fig. 4. Average price trend on the Rome Ciampino–London Stansted route according todifferent daily departure times.
A series of reasons may explain why the estimated and theactual price do not perfectly overlap. First of all, the demand curvecannot be accurately known on a daily basis, and there may bemore or fewer bookings than expected on some days. If the actualbookings outnumber expectations, carriers are likely to raise pricesin order to deter further bookings, and thus restore the optimumsituation. Secondly, operational reasons make Ryanair’s faressubject to a discrete rather than constant variation, so that Ryanair’sdecision to raise its fares results in increases through small incre-ments (generally V5.00). Finally, the parameters were predicted byconsidering every single flight on every single route, with the aimto provide an extensive amount of data. Nevertheless, it is mostlikely that both time of the day and day of the week significantlyaffect pricing strategies. Thanks to the broad database at ourdisposal, it will be possible with a future development of theanalysis to estimate these parameters according to day of the weekand time of the day as well.
Following the estimation of the price curve levels and the‘‘flight-filling’’ function for each route, a regression analysis hasbeen carried out, aiming to study the possible determinants inRyanair’s pricing strategies.
The first regression analyses the ‘‘temporal’’ average price asa dependent variable. This is the arithmetic mean of prices offeredon a specific route over a period from three months prior todeparture up to the day before. If the flight-filling curve provesoptimal, which means that the expected number of average dailybookings is steady over time (Stokey, 1979), the weighted priceaverage against the total number of purchased tickets will equal thetemporal average price.
The explanatory variables employed are basically of two kinds:route specific variables, and airports and linked areas specificvariables. The route specific variables include route length and dailyfrequency, percentage of fully booked flights, number of carriers in
Fig. 6. Percentage of remaining booking days with fares lower than the price appliedon the specific date.
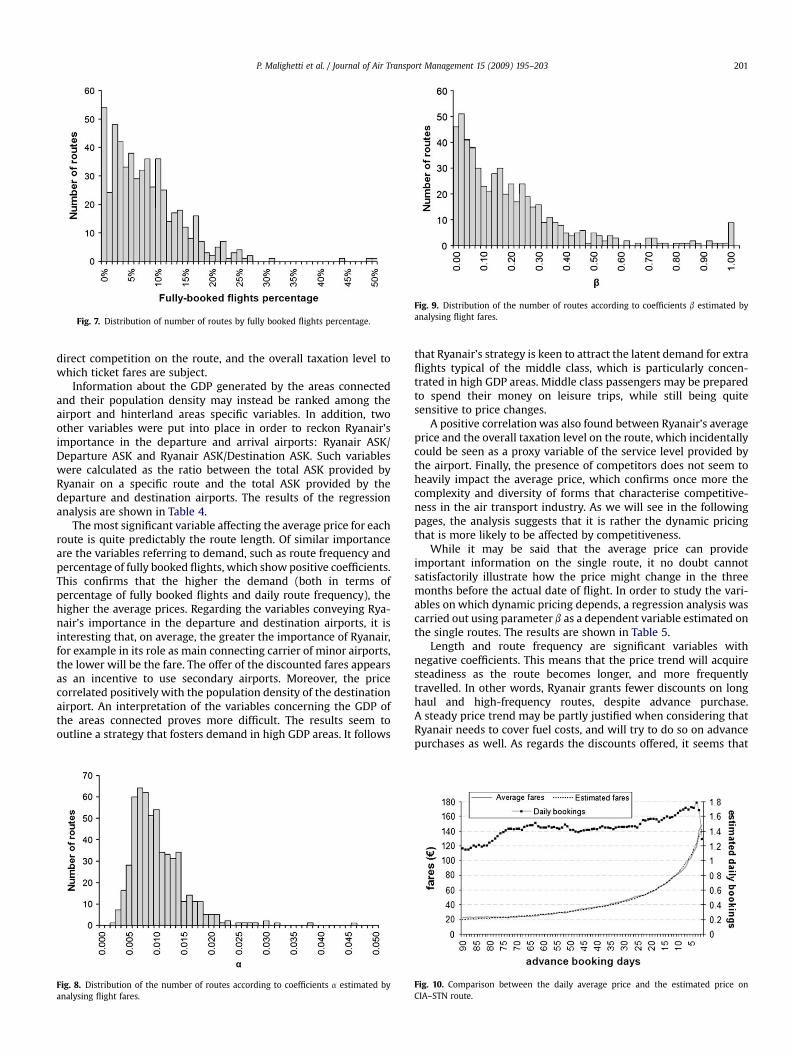
Fig. 7. Distribution of number of routes by fully booked flights percentage.
Fig. 9. Distribution of the number of routes according to coefficients b estimated byanalysing flight fares.
P. Malighetti et al. / Journal of Air Transport Management 15 (2009) 195–203 201
direct competition on the route, and the overall taxation level towhich ticket fares are subject.
Information about the GDP generated by the areas connectedand their population density may instead be ranked among theairport and hinterland areas specific variables. In addition, twoother variables were put into place in order to reckon Ryanair’simportance in the departure and arrival airports: Ryanair ASK/Departure ASK and Ryanair ASK/Destination ASK. Such variableswere calculated as the ratio between the total ASK provided byRyanair on a specific route and the total ASK provided by thedeparture and destination airports. The results of the regressionanalysis are shown in Table 4.
The most significant variable affecting the average price for eachroute is quite predictably the route length. Of similar importanceare the variables referring to demand, such as route frequency andpercentage of fully booked flights, which show positive coefficients.This confirms that the higher the demand (both in terms ofpercentage of fully booked flights and daily route frequency), thehigher the average prices. Regarding the variables conveying Rya-nair’s importance in the departure and destination airports, it isinteresting that, on average, the greater the importance of Ryanair,for example in its role as main connecting carrier of minor airports,the lower will be the fare. The offer of the discounted fares appearsas an incentive to use secondary airports. Moreover, the pricecorrelated positively with the population density of the destinationairport. An interpretation of the variables concerning the GDP ofthe areas connected proves more difficult. The results seem tooutline a strategy that fosters demand in high GDP areas. It follows
Fig. 8. Distribution of the number of routes according to coefficients a estimated byanalysing flight fares.
that Ryanair’s strategy is keen to attract the latent demand for extraflights typical of the middle class, which is particularly concen-trated in high GDP areas. Middle class passengers may be preparedto spend their money on leisure trips, while still being quitesensitive to price changes.
A positive correlation was also found between Ryanair’s averageprice and the overall taxation level on the route, which incidentallycould be seen as a proxy variable of the service level provided bythe airport. Finally, the presence of competitors does not seem toheavily impact the average price, which confirms once more thecomplexity and diversity of forms that characterise competitive-ness in the air transport industry. As we will see in the followingpages, the analysis suggests that it is rather the dynamic pricingthat is more likely to be affected by competitiveness.
While it may be said that the average price can provideimportant information on the single route, it no doubt cannotsatisfactorily illustrate how the price might change in the threemonths before the actual date of flight. In order to study the vari-ables on which dynamic pricing depends, a regression analysis wascarried out using parameter b as a dependent variable estimated onthe single routes. The results are shown in Table 5.
Length and route frequency are significant variables withnegative coefficients. This means that the price trend will acquiresteadiness as the route becomes longer, and more frequentlytravelled. In other words, Ryanair grants fewer discounts on longhaul and high-frequency routes, despite advance purchase.A steady price trend may be partly justified when considering thatRyanair needs to cover fuel costs, and will try to do so on advancepurchases as well. As regards the discounts offered, it seems that
Fig. 10. Comparison between the daily average price and the estimated price onCIA–STN route.
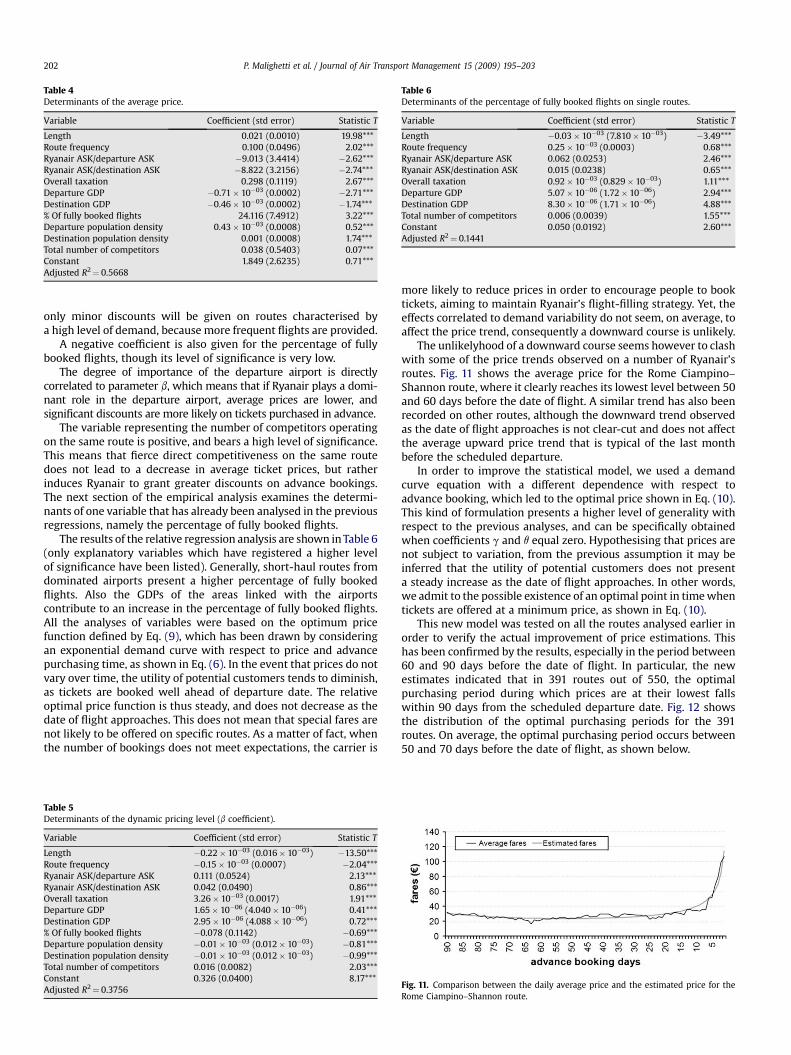
Table 4Determinants of the average price.
Variable Coefficient (std error) Statistic T
Length 0.021 (0.0010) 19.98***Route frequency 0.100 (0.0496) 2.02***Ryanair ASK/departure ASK �9.013 (3.4414) �2.62***Ryanair ASK/destination ASK �8.822 (3.2156) �2.74***Overall taxation 0.298 (0.1119) 2.67***Departure GDP �0.71� 10�03 (0.0002) �2.71***Destination GDP �0.46� 10�03 (0.0002) �1.74***% Of fully booked flights 24.116 (7.4912) 3.22***Departure population density 0.43� 10�03 (0.0008) 0.52***Destination population density 0.001 (0.0008) 1.74***Total number of competitors 0.038 (0.5403) 0.07***Constant 1.849 (2.6235) 0.71***Adjusted R2¼ 0.5668
Table 6Determinants of the percentage of fully booked flights on single routes.
Variable Coefficient (std error) Statistic T
Length �0.03� 10�03 (7.810� 10�03) �3.49***Route frequency 0.25� 10�03 (0.0003) 0.68***Ryanair ASK/departure ASK 0.062 (0.0253) 2.46***Ryanair ASK/destination ASK 0.015 (0.0238) 0.65***Overall taxation 0.92� 10�03 (0.829� 10�03) 1.11***Departure GDP 5.07� 10�06 (1.72� 10�06) 2.94***Destination GDP 8.30� 10�06 (1.71� 10�06) 4.88***Total number of competitors 0.006 (0.0039) 1.55***Constant 0.050 (0.0192) 2.60***Adjusted R2¼ 0.1441
P. Malighetti et al. / Journal of Air Transport Management 15 (2009) 195–203202
only minor discounts will be given on routes characterised bya high level of demand, because more frequent flights are provided.
A negative coefficient is also given for the percentage of fullybooked flights, though its level of significance is very low.
The degree of importance of the departure airport is directlycorrelated to parameter b, which means that if Ryanair plays a domi-nant role in the departure airport, average prices are lower, andsignificant discounts are more likely on tickets purchased in advance.
The variable representing the number of competitors operatingon the same route is positive, and bears a high level of significance.This means that fierce direct competitiveness on the same routedoes not lead to a decrease in average ticket prices, but ratherinduces Ryanair to grant greater discounts on advance bookings.The next section of the empirical analysis examines the determi-nants of one variable that has already been analysed in the previousregressions, namely the percentage of fully booked flights.
The results of the relative regression analysis are shown in Table 6(only explanatory variables which have registered a higher levelof significance have been listed). Generally, short-haul routes fromdominated airports present a higher percentage of fully bookedflights. Also the GDPs of the areas linked with the airportscontribute to an increase in the percentage of fully booked flights.All the analyses of variables were based on the optimum pricefunction defined by Eq. (9), which has been drawn by consideringan exponential demand curve with respect to price and advancepurchasing time, as shown in Eq. (6). In the event that prices do notvary over time, the utility of potential customers tends to diminish,as tickets are booked well ahead of departure date. The relativeoptimal price function is thus steady, and does not decrease as thedate of flight approaches. This does not mean that special fares arenot likely to be offered on specific routes. As a matter of fact, whenthe number of bookings does not meet expectations, the carrier is
Table 5Determinants of the dynamic pricing level (b coefficient).
Variable Coefficient (std error) Statistic T
Length �0.22� 10�03 (0.016� 10�03) �13.50***Route frequency �0.15� 10�03 (0.0007) �2.04***Ryanair ASK/departure ASK 0.111 (0.0524) 2.13***Ryanair ASK/destination ASK 0.042 (0.0490) 0.86***Overall taxation 3.26� 10�03 (0.0017) 1.91***Departure GDP 1.65� 10�06 (4.040� 10�06) 0.41***Destination GDP 2.95� 10�06 (4.088� 10�06) 0.72***% Of fully booked flights �0.078 (0.1142) �0.69***Departure population density �0.01� 10�03 (0.012� 10�03) �0.81***Destination population density �0.01� 10�03 (0.012� 10�03) �0.99***Total number of competitors 0.016 (0.0082) 2.03***Constant 0.326 (0.0400) 8.17***Adjusted R2¼ 0.3756
more likely to reduce prices in order to encourage people to booktickets, aiming to maintain Ryanair’s flight-filling strategy. Yet, theeffects correlated to demand variability do not seem, on average, toaffect the price trend, consequently a downward course is unlikely.
The unlikelyhood of a downward course seems however to clashwith some of the price trends observed on a number of Ryanair’sroutes. Fig. 11 shows the average price for the Rome Ciampino–Shannon route, where it clearly reaches its lowest level between 50and 60 days before the date of flight. A similar trend has also beenrecorded on other routes, although the downward trend observedas the date of flight approaches is not clear-cut and does not affectthe average upward price trend that is typical of the last monthbefore the scheduled departure.
In order to improve the statistical model, we used a demandcurve equation with a different dependence with respect toadvance booking, which led to the optimal price shown in Eq. (10).This kind of formulation presents a higher level of generality withrespect to the previous analyses, and can be specifically obtainedwhen coefficients g and q equal zero. Hypothesising that prices arenot subject to variation, from the previous assumption it may beinferred that the utility of potential customers does not presenta steady increase as the date of flight approaches. In other words,we admit to the possible existence of an optimal point in time whentickets are offered at a minimum price, as shown in Eq. (10).
This new model was tested on all the routes analysed earlier inorder to verify the actual improvement of price estimations. Thishas been confirmed by the results, especially in the period between60 and 90 days before the date of flight. In particular, the newestimates indicated that in 391 routes out of 550, the optimalpurchasing period during which prices are at their lowest fallswithin 90 days from the scheduled departure date. Fig. 12 showsthe distribution of the optimal purchasing periods for the 391routes. On average, the optimal purchasing period occurs between50 and 70 days before the date of flight, as shown below.
Fig. 11. Comparison between the daily average price and the estimated price for theRome Ciampino–Shannon route.
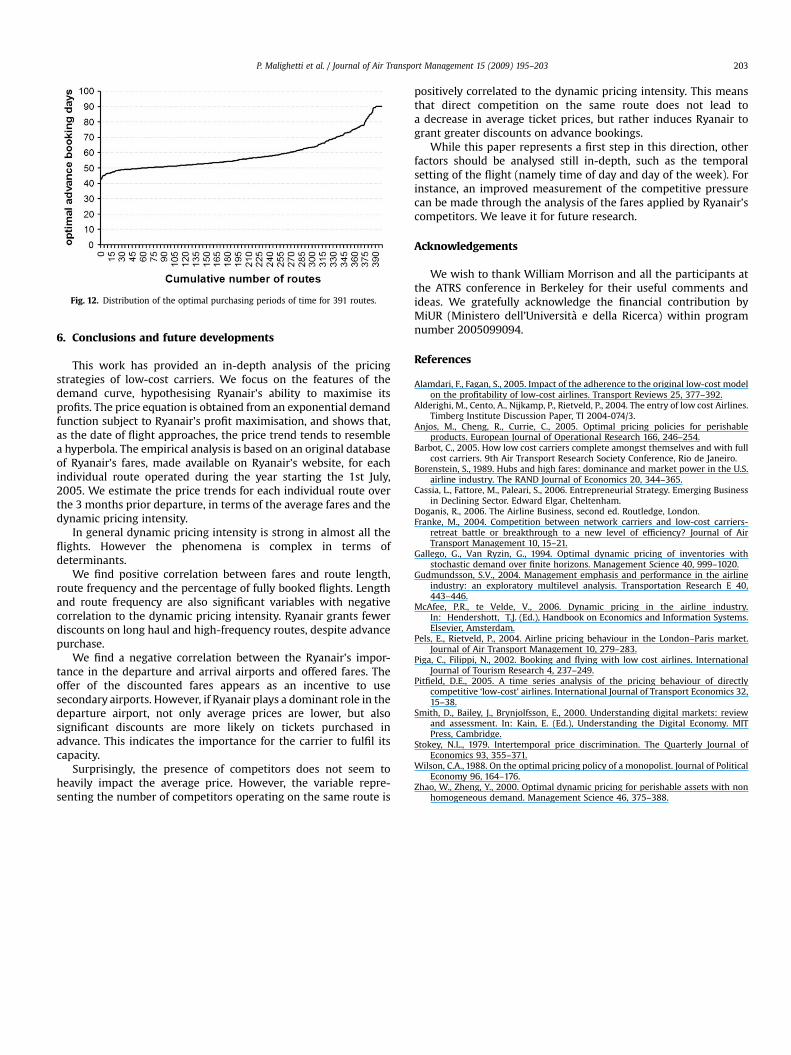
Fig. 12. Distribution of the optimal purchasing periods of time for 391 routes.
P. Malighetti et al. / Journal of Air Transport Management 15 (2009) 195–203 203
6. Conclusions and future developments
This work has provided an in-depth analysis of the pricingstrategies of low-cost carriers. We focus on the features of thedemand curve, hypothesising Ryanair’s ability to maximise itsprofits. The price equation is obtained from an exponential demandfunction subject to Ryanair’s profit maximisation, and shows that,as the date of flight approaches, the price trend tends to resemblea hyperbola. The empirical analysis is based on an original databaseof Ryanair’s fares, made available on Ryanair’s website, for eachindividual route operated during the year starting the 1st July,2005. We estimate the price trends for each individual route overthe 3 months prior departure, in terms of the average fares and thedynamic pricing intensity.
In general dynamic pricing intensity is strong in almost all theflights. However the phenomena is complex in terms ofdeterminants.
We find positive correlation between fares and route length,route frequency and the percentage of fully booked flights. Lengthand route frequency are also significant variables with negativecorrelation to the dynamic pricing intensity. Ryanair grants fewerdiscounts on long haul and high-frequency routes, despite advancepurchase.
We find a negative correlation between the Ryanair’s impor-tance in the departure and arrival airports and offered fares. Theoffer of the discounted fares appears as an incentive to usesecondary airports. However, if Ryanair plays a dominant role in thedeparture airport, not only average prices are lower, but alsosignificant discounts are more likely on tickets purchased inadvance. This indicates the importance for the carrier to fulfil itscapacity.
Surprisingly, the presence of competitors does not seem toheavily impact the average price. However, the variable repre-senting the number of competitors operating on the same route is
positively correlated to the dynamic pricing intensity. This meansthat direct competition on the same route does not lead toa decrease in average ticket prices, but rather induces Ryanair togrant greater discounts on advance bookings.
While this paper represents a first step in this direction, otherfactors should be analysed still in-depth, such as the temporalsetting of the flight (namely time of day and day of the week). Forinstance, an improved measurement of the competitive pressurecan be made through the analysis of the fares applied by Ryanair’scompetitors. We leave it for future research.
Acknowledgements
We wish to thank William Morrison and all the participants atthe ATRS conference in Berkeley for their useful comments andideas. We gratefully acknowledge the financial contribution byMiUR (Ministero dell’Universita e della Ricerca) within programnumber 2005099094.
References
Alamdari, F., Fagan, S., 2005. Impact of the adherence to the original low-cost modelon the profitability of low-cost airlines. Transport Reviews 25, 377–392.
Alderighi, M., Cento, A., Nijkamp, P., Rietveld, P., 2004. The entry of low cost Airlines.Timberg Institute Discussion Paper, TI 2004-074/3.
Anjos, M., Cheng, R., Currie, C., 2005. Optimal pricing policies for perishableproducts. European Journal of Operational Research 166, 246–254.
Barbot, C., 2005. How low cost carriers complete amongst themselves and with fullcost carriers. 9th Air Transport Research Society Conference, Rio de Janeiro.
Borenstein, S., 1989. Hubs and high fares: dominance and market power in the U.S.airline industry. The RAND Journal of Economics 20, 344–365.
Cassia, L., Fattore, M., Paleari, S., 2006. Entrepreneurial Strategy. Emerging Businessin Declining Sector. Edward Elgar, Cheltenham.
Doganis, R., 2006. The Airline Business, second ed. Routledge, London.Franke, M., 2004. Competition between network carriers and low-cost carriers-
retreat battle or breakthrough to a new level of efficiency? Journal of AirTransport Management 10, 15–21.
Gallego, G., Van Ryzin, G., 1994. Optimal dynamic pricing of inventories withstochastic demand over finite horizons. Management Science 40, 999–1020.
Gudmundsson, S.V., 2004. Management emphasis and performance in the airlineindustry: an exploratory multilevel analysis. Transportation Research E 40,443–446.
McAfee, P.R., te Velde, V., 2006. Dynamic pricing in the airline industry.In: Hendershott, T.J. (Ed.), Handbook on Economics and Information Systems.Elsevier, Amsterdam.
Pels, E., Rietveld, P., 2004. Airline pricing behaviour in the London–Paris market.Journal of Air Transport Management 10, 279–283.
Piga, C., Filippi, N., 2002. Booking and flying with low cost airlines. InternationalJournal of Tourism Research 4, 237–249.
Pitfield, D.E., 2005. A time series analysis of the pricing behaviour of directlycompetitive ‘low-cost’ airlines. International Journal of Transport Economics 32,15–38.
Smith, D., Bailey, J., Brynjolfsson, E., 2000. Understanding digital markets: reviewand assessment. In: Kain, E. (Ed.), Understanding the Digital Economy. MITPress, Cambridge.
Stokey, N.L., 1979. Intertemporal price discrimination. The Quarterly Journal ofEconomics 93, 355–371.
Wilson, C.A., 1988. On the optimal pricing policy of a monopolist. Journal of PoliticalEconomy 96, 164–176.
Zhao, W., Zheng, Y., 2000. Optimal dynamic pricing for perishable assets with nonhomogeneous demand. Management Science 46, 375–388.
Related Documents