ORIGINAL PAPER Prey preference of large carnivores in Anamalai Tiger Reserve, India Arumugam Kumaraguru & R. Saravanamuthu & K. Brinda & S. Asokan Received: 3 July 2010 / Revised: 11 November 2010 / Accepted: 12 November 2010 # Springer-Verlag 2010 Abstract Prey preferences of large carnivores (tiger (Panthera tigris), leopard (Panthera pardus) and dhole (Cuon alpinus)) in the tropical forest of Anamalai Tiger Reserve (ATR) were evaluated. This was the first study in ATR to estimate the density of prey and the food habits of these large carnivores. The 958-km 2 intensive study area was found to have a high mammalian prey density (72.1 animals per square kilometre) with wild boar (20.61 animals per square kilometre) and chital (20.54 animals per square kilometre) being the most common species, followed by nilgiri tahr (13.6 animals per square kilometre). When the density figures were multiplied by the average weight of each prey species, a high biomass density of 14,204 kg km -2 was obtained for the intensive study area. Scat analysis and incidental kill observation were used to determine the dietary composition of these predators. During the study from the period of March 2001 to April 2004, 1,145 tiger scats, 595 leopard scats and 2,074 dhole scats were collected and analysed. Kill data were based on direct observation of 66 tiger kills and 39 leopard kills. Sambar, with a density of 6.54 kg km -2 was the preferred prey for these carnivores. Sambar constitutes 35% of the overall diet of tiger, whereas it constitutes 17% and 25% in leopard and dhole diets, respectively. Chital was utilized less than sambar in the range of about 7%, 11% and 15% by tiger, leopard and dhole, respectively. Predator diet was estimated more accu- rately by scat analysis, which reveals 30% of smaller prey species in leopard’ s diet, which was not observed by kill data. This study reveals that ATR harbours high prey density, and these large carnivores seem mostly dependent on the wild prey rather than on domestic livestock as in some other areas in the subcontinent. These factors make ATR a potential area for long-term conservation of these endangered carnivores. Keywords Prey preference . Food habits . Tiger . Leopard . Dhole . Anamalai Tiger Reserve (ATR) Introduction Food habits of large carnivores are central to the ecological niche they occupy and play an important role in explaining their social systems, behaviour and factors affecting predator density. It may also have important implications in the life history of their prey. Knowledge of food selection is critical in understanding the life history strategies and developing sound conservation recommendations (Miquelle et al. 1996). The larger carnivores play a vital role as predators in regulating and perpetuating the ecological processes and maintaining the ecosystem as a whole (Sunquist and Sunquist 1989; Terborgh et al. 2002; Kumaraguru 2002). Predatory strate- gies are shaped and refined by natural selection to maximize nutrient intake within the bounds of a wide range of biologically relevant ecological constraints (Sunquist and Sunquist 1989; Clutton-Brock and Harvey 1983). The scenario gets complicated when several predatory species hunt in the same area, resulting in a joint demand for a Communicated by C. Gortázar A. Kumaraguru (*) : R. Saravanamuthu : S. Asokan PG Research and Development of Wildlife Biology, Division of Zoology, AVC College, Mayiladuthurai 609001, India e-mail: [email protected] K. Brinda Project Trainee, National Facility for Marine Cyanobacteria, Bharathidasan University, Tiruchirappalli 621 024, India Present Address: A. Kumaraguru Centre for Cellular and Molecular Biology, Hyderabad 500 007, India Eur J Wildl Res DOI 10.1007/s10344-010-0473-y

Welcome message from author
This document is posted to help you gain knowledge. Please leave a comment to let me know what you think about it! Share it to your friends and learn new things together.
Transcript
ORIGINAL PAPER
Prey preference of large carnivores in Anamalai TigerReserve, India
Arumugam Kumaraguru & R. Saravanamuthu &
K. Brinda & S. Asokan
Received: 3 July 2010 /Revised: 11 November 2010 /Accepted: 12 November 2010# Springer-Verlag 2010
Abstract Prey preferences of large carnivores (tiger (Pantheratigris), leopard (Panthera pardus) and dhole (Cuon alpinus))in the tropical forest of Anamalai Tiger Reserve (ATR) wereevaluated. This was the first study in ATR to estimate thedensity of prey and the food habits of these large carnivores.The 958-km2 intensive study area was found to have a highmammalian prey density (72.1 animals per square kilometre)with wild boar (20.61 animals per square kilometre) and chital(20.54 animals per square kilometre) being the most commonspecies, followed by nilgiri tahr (13.6 animals per squarekilometre). When the density figures were multiplied by theaverage weight of each prey species, a high biomass densityof 14,204 kg km−2 was obtained for the intensive study area.Scat analysis and incidental kill observation were used todetermine the dietary composition of these predators. Duringthe study from the period of March 2001 to April 2004, 1,145tiger scats, 595 leopard scats and 2,074 dhole scats werecollected and analysed. Kill data were based on directobservation of 66 tiger kills and 39 leopard kills. Sambar,with a density of 6.54 kg km−2 was the preferred prey for
these carnivores. Sambar constitutes 35% of the overall diet oftiger, whereas it constitutes 17% and 25% in leopard anddhole diets, respectively. Chital was utilized less than sambarin the range of about 7%, 11% and 15% by tiger, leopard anddhole, respectively. Predator diet was estimated more accu-rately by scat analysis, which reveals 30% of smaller preyspecies in leopard’s diet, which was not observed by kill data.This study reveals that ATR harbours high prey density, andthese large carnivores seem mostly dependent on the wildprey rather than on domestic livestock as in some other areasin the subcontinent. These factors make ATR a potential areafor long-term conservation of these endangered carnivores.
Keywords Prey preference . Food habits . Tiger . Leopard .
Dhole . Anamalai Tiger Reserve (ATR)
Introduction
Food habits of large carnivores are central to the ecologicalniche they occupy and play an important role in explainingtheir social systems, behaviour and factors affecting predatordensity. It may also have important implications in the lifehistory of their prey. Knowledge of food selection is critical inunderstanding the life history strategies and developing soundconservation recommendations (Miquelle et al. 1996). Thelarger carnivores play a vital role as predators in regulatingand perpetuating the ecological processes and maintainingthe ecosystem as a whole (Sunquist and Sunquist 1989;Terborgh et al. 2002; Kumaraguru 2002). Predatory strate-gies are shaped and refined by natural selection to maximizenutrient intake within the bounds of a wide range ofbiologically relevant ecological constraints (Sunquist andSunquist 1989; Clutton-Brock and Harvey 1983). Thescenario gets complicated when several predatory specieshunt in the same area, resulting in a joint demand for a
Communicated by C. Gortázar
A. Kumaraguru (*) : R. Saravanamuthu : S. AsokanPG Research and Development of Wildlife Biology,Division of Zoology, AVC College,Mayiladuthurai 609001, Indiae-mail: [email protected]
K. BrindaProject Trainee, National Facility for Marine Cyanobacteria,Bharathidasan University,Tiruchirappalli 621 024, India
Present Address:A. KumaraguruCentre for Cellular and Molecular Biology,Hyderabad 500 007, India
Eur J Wildl ResDOI 10.1007/s10344-010-0473-y
limited prey source. Ultimately, competition for a limitedprey resource leads to increased extinction risk of sympatriccarnivores (Hayward and Kerley 2008).
Studies on food habits are of conservation significance intwo ways, i.e. primarily, competition can reduce the popula-tion size of an endangered carnivore (Caro and Stoner 2003)(Hayward and Kerley 2008); secondarily, competitionbetween carnivores can affect the population of other speciesat lower tropic levels (Jedrzejewska and Jedrzejewski 2005).For example, the absence of carnivore species may increaseeither herbivore population (Sinclair et al. 1990) or othermedium-sized carnivores (Sovada et al. 1995) or both(Sinclair et al. 1990). Carnivores often regulate or limit thenumbers of their prey, thereby altering the structure andfunction of entire ecosystems (Schaller 1972; Estes et al.1998; Berger et al. 2001; Terborgh et al. 2002), and largecarnivores themselves are limited by the abundance of theirprey (Hayward et al. 2007). Prey selection of large carnivoreis a complex phenomenon (Bekoff et al. 1984; Kruuk 1972;Sunquist and Sunquist 1989). The hypotheses so farproposed to explain that prey selection by predators indicatethat the energetic benefits for the predator and proximatemechanisms of selection shape their overall prey selection(Griffiths 1975; Taylor 1976; Stephens and Krebs 1987;Temple 1987; Karanth and Sunquist 1995).
Studies of feeding ecology of large carnivores rely on one ora combination of many methods. There are varieties oftechniques including fecal analysis (Johnsingh 1983; Karanthand Sunquist 1995; Swaminathan et al. 2002; Kumaraguru2002) spoor tracking (Eloff 1984; Stander et al. 1997), radiotracking (Seidensticker 1976) and direct observation ofanimals hunting (Mills 1984). Scat analysis is non-invasiveand has been extensively applied in the studies of thecarnivore food habits, either alone (Karanth and Sunquist1995; Hersteinsson and Macdonald 1996; Ranawana et al.1998; Ramakrishnan et al. 1999; Khorozyan and Malkhasyan2002) or in combination with data from predator kills(Sunquist 1981; Johnsingh 1983). The analysis of food habitsprovides practical and immediately accessible information forthe management of a particular species and occasionally aidslaw enforcement and management needs (Korschgen 1971).
With the intention of collecting baseline information onlarge carnivores and its prey species at ATR, the present studywas designed to estimate the density and biomass of majorprey species of large carnivores in the study area and to studythe food habits of large carnivores with reference to its preyavailability and utilization pattern. This study was the firstreport in ATR to understand the ecological parameters, such asavailability of prey, which support the survival of theseendangered carnivores. Thus, increasing knowledge of preypreference and food habits of these carnivores will enable us torecognize the plasticity in the predator's ability to use theavailable resources and conservation of these resources.
Study area
The present study was a long-term investigation (fromMarch 2001 to April 2004) planned to provide informationon the large carnivores in ATR. This reserve was located inthe Coimbatore district of Tamil Nadu adjoining Kerala,India (10° 12′ and 10° 54′ N and 76° 44′ and 77° 48′ E),and was spread over 958 km2 (Fig. 1). Minimum andmaximum temperature ranges from 10°C in December to37°C in April. Average annual precipitation varied between1,178 and 2,268 mm. The landscape was highly undulating,and accordingly the rainfall varies from an annual averageof 500 mm in the eastern part of the sanctuary to about3,000 mm in the Western Plateau and slopes. ATR has aheterogeneous nature of vegetation which ranges fromevergreen to tropical scrub and thorn forest. These habitatsvaried in their extent of cover and also experience two wetseasons, a winter season and a dry season, in a year, eachlasting for 3 months. The dominant vegetation types weretropical evergreen forests, tropical semi-evergreen forests,moist deciduous forests and teak plantation forests, inter-spersed with patches of dry-deciduous forests, scrub forestsand grassland. The ATR was a home to teeming biodiver-sity and supports a diverse assemblage of large mammalprey species. Endemism was quite high, and the area wasthe last stronghold of remnant populations of the nilgiri tahr(Hemitragus hylocrius) and the lion-tailed macaque(Macaca silenus). Sympatric carnivore species include thetiger (Panthera tigris), leopard (Panthera pardus), strippedhyena (Hyaena hyaena), sloth bear (Melursus ursinus) anddhole (Cuon alpinus). The larger mammalian prey speciesinclude gaur (Bos frontalis), sambar (Cervus unicolor),nilgiri tahr (H. hylocrius), wild boar (Sus scrofa) and slothbear (M. ursinus). Medium prey species like chital (Axisaxis), barking deer (Muntiacus muntjak), lion-tailed macaque(M. silenus), common langur (Semnopithecus entellus),nilgiri langur (Presbytis johni), porcupine (Hystrix indica)and other mesopredatory species such as jungle cat (Felischaus), leopard cat (Felis bengalensis) and fishing cat (Felisviverrina) were found in the area. The smaller prey specieswere mouse deer (Tragulus meminna), black-naped hare(Lepus nigricollis), peafowl (Pavo cristatus), civets, mon-gooses, hedgehog (Paraechinus micropus) and honey badger(Mellivora capensis).
Methodology
Estimation of density, biomass and group size distributionof prey species
The line transect method (Eberhardt 1968; Burnham et al.1980; Buckland et al. 1993) was used to estimate densities of
Eur J Wildl Res
prey species in the study area. This method had beenconsistently and efficiently used as a standard method todetermine animal densities under similar tropical conditions(Karanth and Sunquist 1992, 1995; Varman and Sukumar1995; Khan et al. 1996; Biswas and Sankar 2002). The datawere analysed using Gajah version 1.0 which was based onFourier Series estimation. Forty two transects which varied inlength between 2 and 5 km were laid randomly in the studyarea. The total transect length of 127.4 km was monitoredeight times in the early morning (0600–1000 hours) and inthe late afternoon (1500–1900 hours), resulting in 1,020 kmof transect walked. The following sighting parameter such assighting angle (with a field compass); sighting distance(ocular estimated); and group size, sex and age class ofindividuals (whenever it was possible to classify them) wererecorded for each sighting in the transect. The major habitatand microhabitat types were sampled in proportion to theiravailability in the study area. The sampling effort wasuniform for different seasons of the year.
Stratified random sampling (Buckland et al. 1993) wasused. The stratified vegetation map of the study area wasdivided into number of grids comprising 4 km2 in 1:50,000
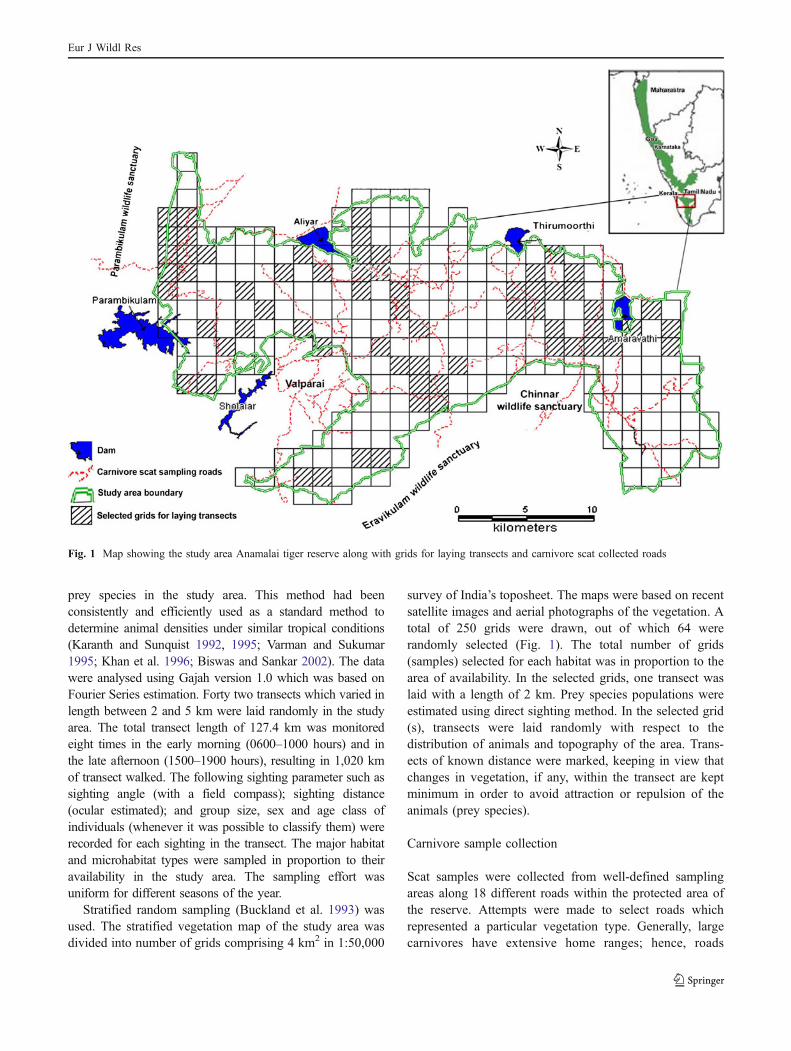
survey of India’s toposheet. The maps were based on recentsatellite images and aerial photographs of the vegetation. Atotal of 250 grids were drawn, out of which 64 wererandomly selected (Fig. 1). The total number of grids(samples) selected for each habitat was in proportion to thearea of availability. In the selected grids, one transect waslaid with a length of 2 km. Prey species populations wereestimated using direct sighting method. In the selected grid(s), transects were laid randomly with respect to thedistribution of animals and topography of the area. Trans-ects of known distance were marked, keeping in view thatchanges in vegetation, if any, within the transect are keptminimum in order to avoid attraction or repulsion of theanimals (prey species).
Carnivore sample collection
Scat samples were collected from well-defined samplingareas along 18 different roads within the protected area ofthe reserve. Attempts were made to select roads whichrepresented a particular vegetation type. Generally, largecarnivores have extensive home ranges; hence, roads
Fig. 1 Map showing the study area Anamalai tiger reserve along with grids for laying transects and carnivore scat collected roads
Eur J Wildl Res
located well within a particular habitat were considered forthis study, but not those which cut across two or moredifferent types of habitats.
Scat identification
Identification of dhole scat was fairly simple, as they tendto defecate in the middle of the roads and paths unlike thelarge cats, which defecate along the edge of the road orpath. Additionally, the entire pack of dhole defecates at thesame spot. Identification of tiger and leopard scats in theareas where they co-exist has been largely based on size.For instance, tiger scat was differentiated from leopard scat,as a full-grown leopard was about one fourth the size of afull-grown tiger (Seidensticker 1976), thus producingidentifiably smaller scat. Though complete scat of largeadult tigers can be easily differentiated from those ofleopards, there can be mistakes in identification when shapealone was taken into account. The scats were identifiedbased on the shape as well as the associated signs such aspugmarks or the size of the scrape in the present study. Thisallowed greater accuracy as pug marks allowed moreaccurate identification of the predator.
Scat analysis
A reference key was developed for the identification of preyspecies on the basis of hair structure/morphology. All scatsamples were sun-dried and preserved in tagged polythenebags for further analysis. Each scat was carefully broken andsoaked in water to separate prey remains, such as hair, bones,hooves, teeth, feathers, etc. All these parts were observed andanalysed with a magnifying glass and under a light micro-scope. They were identified against the reference collectiontaken from captive animals by comparing features such asstructure, colour and medullary configuration to identify preyspecies (Kopikar and Sabins 1976; Amerasinghe 1983;Karanth 1993; Kitsos et al. 1995; Ranawana et al. 1998;Ramakrishnan et al. 1999). The remains of one prey speciesin one scat were scored as 1. If there were prey remains oftwo species in a scat, each prey species was scored as 1.
Prey selectivity index
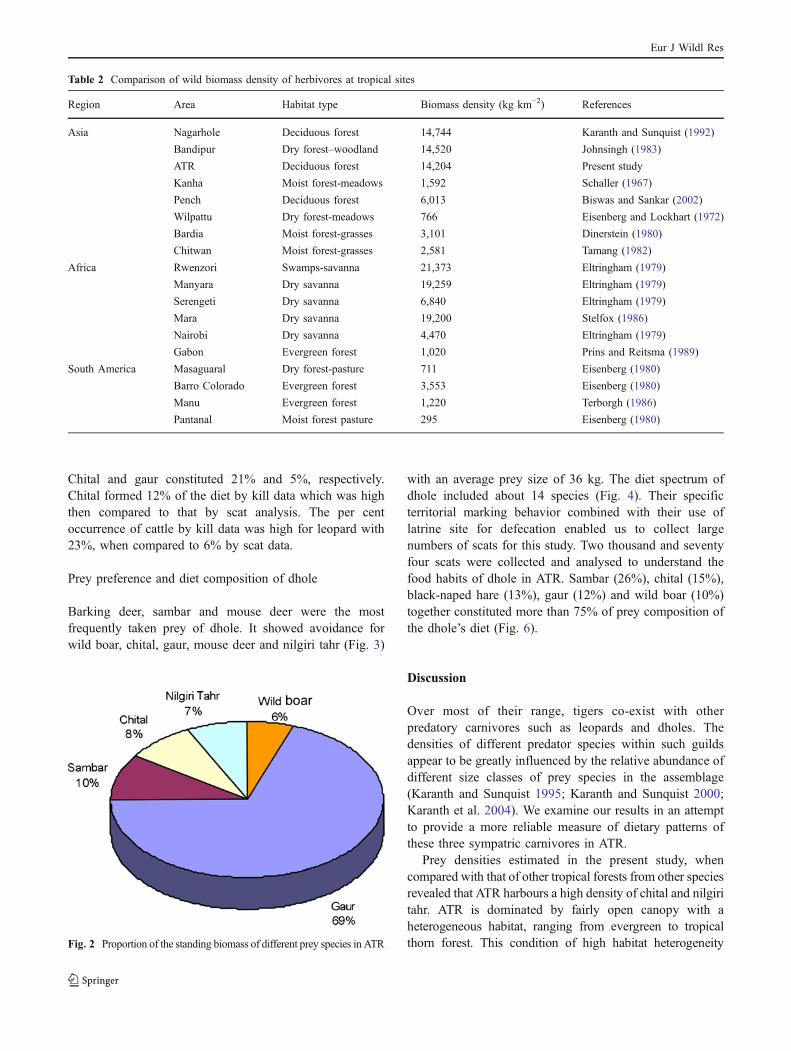
The most preferred prey of the these sympatric carnivoresestimated by Ivelv’s selectivity index (1961) was representedin Fig. 3. Selectivity index value, which ranges from +1 to −1,denotes preference for a particular prey with a positive valueand avoidance with a negative value. Electivity index wascalculated using the following formula.
Ei ¼ ri� nið Þriþ nið Þ
where Ei is Ivelv’s electivity measure of species i, ri is thepercentage of species i in the diet, and ni is the percentage ofspecies i in the environment.
Kill study
The tiger, leopard and wild dog kills were studied in orderto assess their prey selection. Clues like odour, alarm callsof prey, carnivore signs and calls were useful to locate thekill (Karanth and Sunquist 1995). Whenever the kill wasfound relatively intact, the age and health of the killedindividual were recorded on the basis of the size and colourof the animal, sexual characters, etc. Whenever possible,the colour and texture of femur marrow fat were examinedin order to record the health condition of the kill assuggested by Schaller (1967).
Reconstruction of predator diets
Frequency occurrence of mammalian prey in carnivore scatwas commonly used as a parameter in predation studies.The frequency occurrence of different prey species in thescat of tiger was converted to the relative biomass (Floyd etal. 1978; Ackerman et al. 1984; Karanth and Sunquist1995). The equation used is as follows:
Y ¼ 1:980þ 0:035x Tiger and Leopardð ÞY ¼ 0:035þ 0:020x Dholeð Þ
where Y is the kilogramme of prey consumed per fieldcollectible scat and x is the average weight of an individualof a particular prey type (Ackerman et al. 1984). Multiply-ing each Y by the number of scats found to contain aparticular prey species gave the relative weight of each preytype consumed. These values were used to estimate per centbiomass contribution of different prey species to the largecarnivore diet (Biswas and Sankar 2002).
Results
Density of prey species
Density estimation of individuals and groups of ninepotential prey species present in the study area wassummarized in Table 1. The study area harboured highmammalian prey density of 72.1 animals per squarekilometre with chital and wild boar constituting about50% of it. Among the different prey species, wild boar andchital were the most abundant prey species with the highestdensity (20 km−2). Although the next predominant preyspecies was the nilgiri tahr (13.67 km−2), it was restricted inits distribution to high-altitude grasslands, cliff areas of
Eur J Wildl Res
scrub forest and adjoining evergreen habitat. Whereas otherlarger prey species such as gaur and sambar were foundwith relatively lower density values of 12.34 and6.54 km−2, respectively, with wide distribution all overthe sanctuary. Nilgiri tahr, barking deer and mouse deerwere present at relatively lower densities than chital.
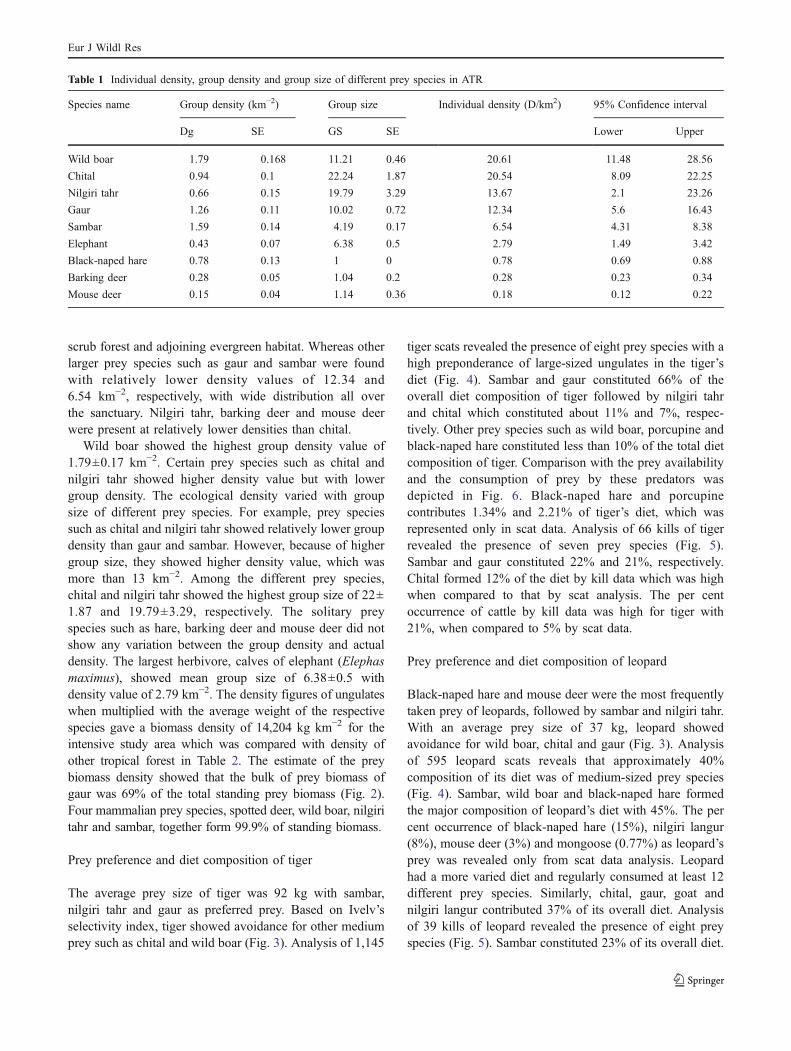
Wild boar showed the highest group density value of1.79±0.17 km−2. Certain prey species such as chital andnilgiri tahr showed higher density value but with lowergroup density. The ecological density varied with groupsize of different prey species. For example, prey speciessuch as chital and nilgiri tahr showed relatively lower groupdensity than gaur and sambar. However, because of highergroup size, they showed higher density value, which wasmore than 13 km−2. Among the different prey species,chital and nilgiri tahr showed the highest group size of 22±1.87 and 19.79±3.29, respectively. The solitary preyspecies such as hare, barking deer and mouse deer did notshow any variation between the group density and actualdensity. The largest herbivore, calves of elephant (Elephasmaximus), showed mean group size of 6.38±0.5 withdensity value of 2.79 km−2. The density figures of ungulateswhen multiplied with the average weight of the respectivespecies gave a biomass density of 14,204 kg km−2 for theintensive study area which was compared with density ofother tropical forest in Table 2. The estimate of the preybiomass density showed that the bulk of prey biomass ofgaur was 69% of the total standing prey biomass (Fig. 2).Four mammalian prey species, spotted deer, wild boar, nilgiritahr and sambar, together form 99.9% of standing biomass.
Prey preference and diet composition of tiger
The average prey size of tiger was 92 kg with sambar,nilgiri tahr and gaur as preferred prey. Based on Ivelv’sselectivity index, tiger showed avoidance for other mediumprey such as chital and wild boar (Fig. 3). Analysis of 1,145
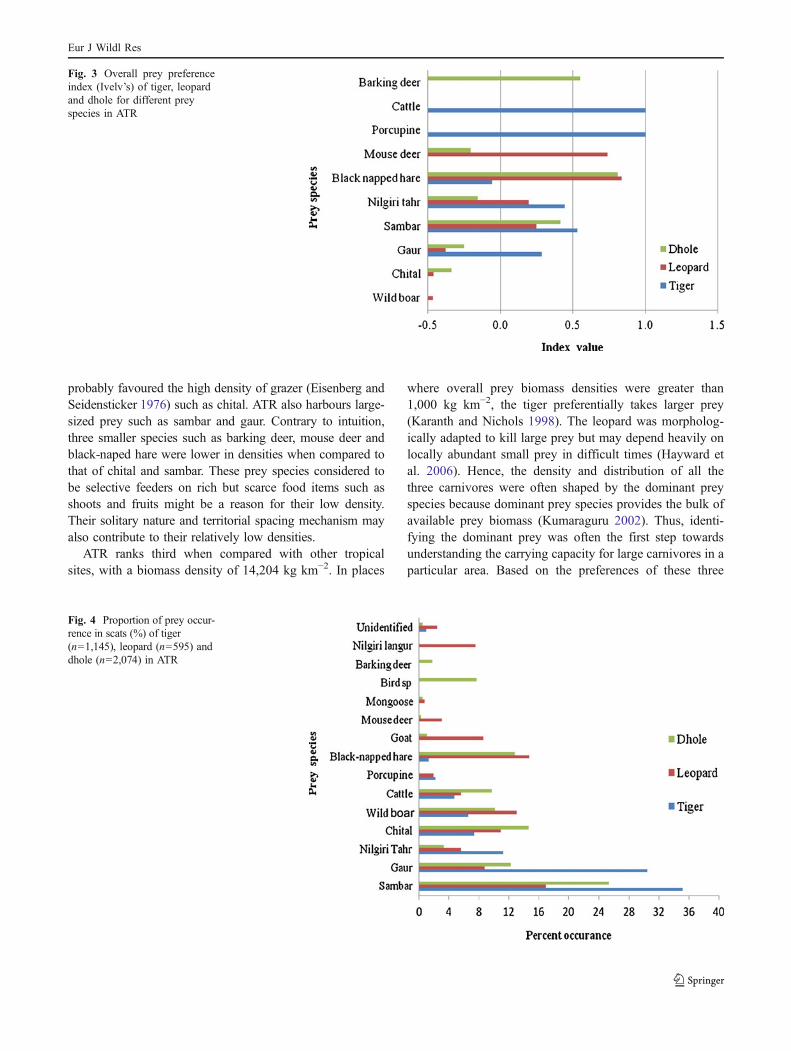
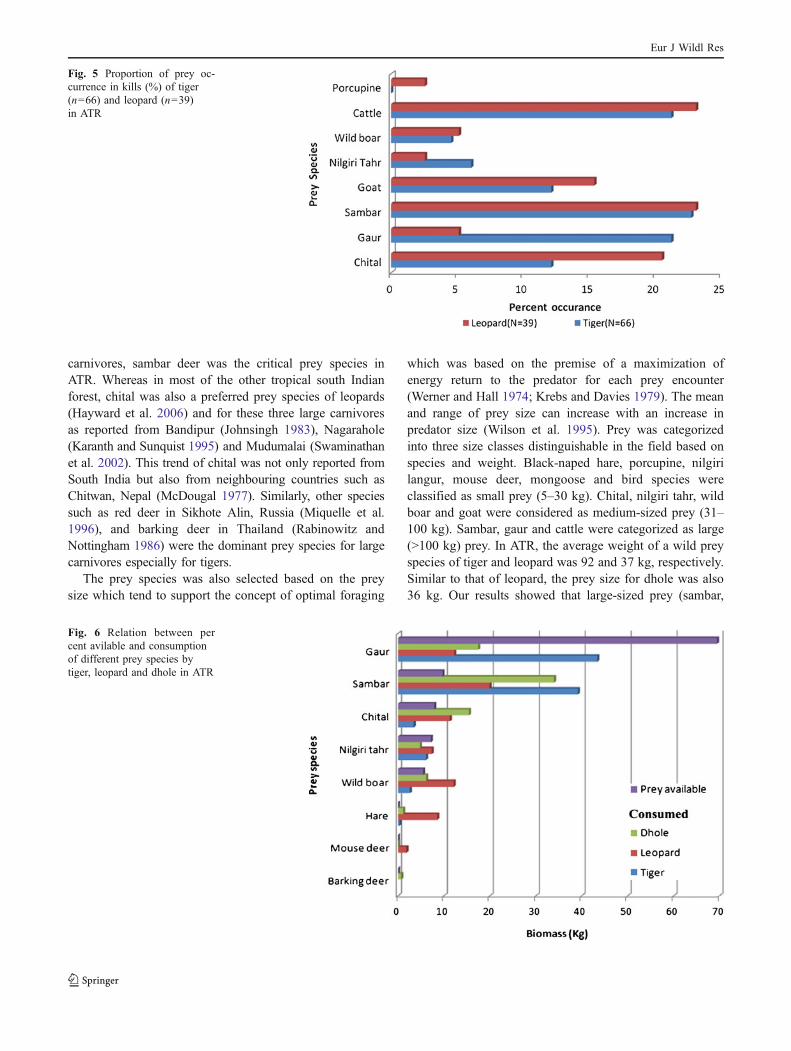
tiger scats revealed the presence of eight prey species with ahigh preponderance of large-sized ungulates in the tiger’sdiet (Fig. 4). Sambar and gaur constituted 66% of theoverall diet composition of tiger followed by nilgiri tahrand chital which constituted about 11% and 7%, respec-tively. Other prey species such as wild boar, porcupine andblack-naped hare constituted less than 10% of the total dietcomposition of tiger. Comparison with the prey availabilityand the consumption of prey by these predators wasdepicted in Fig. 6. Black-naped hare and porcupinecontributes 1.34% and 2.21% of tiger’s diet, which wasrepresented only in scat data. Analysis of 66 kills of tigerrevealed the presence of seven prey species (Fig. 5).Sambar and gaur constituted 22% and 21%, respectively.Chital formed 12% of the diet by kill data which was highwhen compared to that by scat analysis. The per centoccurrence of cattle by kill data was high for tiger with21%, when compared to 5% by scat data.
Prey preference and diet composition of leopard
Black-naped hare and mouse deer were the most frequentlytaken prey of leopards, followed by sambar and nilgiri tahr.With an average prey size of 37 kg, leopard showedavoidance for wild boar, chital and gaur (Fig. 3). Analysisof 595 leopard scats reveals that approximately 40%composition of its diet was of medium-sized prey species(Fig. 4). Sambar, wild boar and black-naped hare formedthe major composition of leopard’s diet with 45%. The percent occurrence of black-naped hare (15%), nilgiri langur(8%), mouse deer (3%) and mongoose (0.77%) as leopard’sprey was revealed only from scat data analysis. Leopardhad a more varied diet and regularly consumed at least 12different prey species. Similarly, chital, gaur, goat andnilgiri langur contributed 37% of its overall diet. Analysisof 39 kills of leopard revealed the presence of eight preyspecies (Fig. 5). Sambar constituted 23% of its overall diet.
Table 1 Individual density, group density and group size of different prey species in ATR
Species name Group density (km−2) Group size Individual density (D/km2) 95% Confidence interval
Dg SE GS SE Lower Upper
Wild boar 1.79 0.168 11.21 0.46 20.61 11.48 28.56
Chital 0.94 0.1 22.24 1.87 20.54 8.09 22.25
Nilgiri tahr 0.66 0.15 19.79 3.29 13.67 2.1 23.26
Gaur 1.26 0.11 10.02 0.72 12.34 5.6 16.43
Sambar 1.59 0.14 4.19 0.17 6.54 4.31 8.38
Elephant 0.43 0.07 6.38 0.5 2.79 1.49 3.42
Black-naped hare 0.78 0.13 1 0 0.78 0.69 0.88
Barking deer 0.28 0.05 1.04 0.2 0.28 0.23 0.34
Mouse deer 0.15 0.04 1.14 0.36 0.18 0.12 0.22
Eur J Wildl Res
Chital and gaur constituted 21% and 5%, respectively.Chital formed 12% of the diet by kill data which was highthen compared to that by scat analysis. The per centoccurrence of cattle by kill data was high for leopard with23%, when compared to 6% by scat data.
Prey preference and diet composition of dhole
Barking deer, sambar and mouse deer were the mostfrequently taken prey of dhole. It showed avoidance forwild boar, chital, gaur, mouse deer and nilgiri tahr (Fig. 3)
with an average prey size of 36 kg. The diet spectrum ofdhole included about 14 species (Fig. 4). Their specificterritorial marking behavior combined with their use oflatrine site for defecation enabled us to collect largenumbers of scats for this study. Two thousand and seventyfour scats were collected and analysed to understand thefood habits of dhole in ATR. Sambar (26%), chital (15%),black-naped hare (13%), gaur (12%) and wild boar (10%)together constituted more than 75% of prey composition ofthe dhole’s diet (Fig. 6).
Discussion
Over most of their range, tigers co-exist with otherpredatory carnivores such as leopards and dholes. Thedensities of different predator species within such guildsappear to be greatly influenced by the relative abundance ofdifferent size classes of prey species in the assemblage(Karanth and Sunquist 1995; Karanth and Sunquist 2000;Karanth et al. 2004). We examine our results in an attemptto provide a more reliable measure of dietary patterns ofthese three sympatric carnivores in ATR.
Prey densities estimated in the present study, whencompared with that of other tropical forests from other speciesrevealed that ATR harbours a high density of chital and nilgiritahr. ATR is dominated by fairly open canopy with aheterogeneous habitat, ranging from evergreen to tropicalthorn forest. This condition of high habitat heterogeneity
Table 2 Comparison of wild biomass density of herbivores at tropical sites
Region Area Habitat type Biomass density (kg km−2) References
Asia Nagarhole Deciduous forest 14,744 Karanth and Sunquist (1992)
Bandipur Dry forest–woodland 14,520 Johnsingh (1983)
ATR Deciduous forest 14,204 Present study
Kanha Moist forest-meadows 1,592 Schaller (1967)
Pench Deciduous forest 6,013 Biswas and Sankar (2002)
Wilpattu Dry forest-meadows 766 Eisenberg and Lockhart (1972)
Bardia Moist forest-grasses 3,101 Dinerstein (1980)
Chitwan Moist forest-grasses 2,581 Tamang (1982)
Africa Rwenzori Swamps-savanna 21,373 Eltringham (1979)
Manyara Dry savanna 19,259 Eltringham (1979)
Serengeti Dry savanna 6,840 Eltringham (1979)
Mara Dry savanna 19,200 Stelfox (1986)
Nairobi Dry savanna 4,470 Eltringham (1979)
Gabon Evergreen forest 1,020 Prins and Reitsma (1989)
South America Masaguaral Dry forest-pasture 711 Eisenberg (1980)
Barro Colorado Evergreen forest 3,553 Eisenberg (1980)
Manu Evergreen forest 1,220 Terborgh (1986)
Pantanal Moist forest pasture 295 Eisenberg (1980)
Fig. 2 Proportion of the standing biomass of different prey species in ATR
Eur J Wildl Res
probably favoured the high density of grazer (Eisenberg andSeidensticker 1976) such as chital. ATR also harbours large-sized prey such as sambar and gaur. Contrary to intuition,three smaller species such as barking deer, mouse deer andblack-naped hare were lower in densities when compared tothat of chital and sambar. These prey species considered tobe selective feeders on rich but scarce food items such asshoots and fruits might be a reason for their low density.Their solitary nature and territorial spacing mechanism mayalso contribute to their relatively low densities.
ATR ranks third when compared with other tropicalsites, with a biomass density of 14,204 kg km−2. In places
where overall prey biomass densities were greater than1,000 kg km−2, the tiger preferentially takes larger prey(Karanth and Nichols 1998). The leopard was morpholog-ically adapted to kill large prey but may depend heavily onlocally abundant small prey in difficult times (Hayward etal. 2006). Hence, the density and distribution of all thethree carnivores were often shaped by the dominant preyspecies because dominant prey species provides the bulk ofavailable prey biomass (Kumaraguru 2002). Thus, identi-fying the dominant prey was often the first step towardsunderstanding the carrying capacity for large carnivores in aparticular area. Based on the preferences of these three
Fig. 3 Overall prey preferenceindex (Ivelv’s) of tiger, leopardand dhole for different preyspecies in ATR
Fig. 4 Proportion of prey occur-rence in scats (%) of tiger(n=1,145), leopard (n=595) anddhole (n=2,074) in ATR
Eur J Wildl Res
carnivores, sambar deer was the critical prey species inATR. Whereas in most of the other tropical south Indianforest, chital was also a preferred prey species of leopards(Hayward et al. 2006) and for these three large carnivoresas reported from Bandipur (Johnsingh 1983), Nagarahole(Karanth and Sunquist 1995) and Mudumalai (Swaminathanet al. 2002). This trend of chital was not only reported fromSouth India but also from neighbouring countries such asChitwan, Nepal (McDougal 1977). Similarly, other speciessuch as red deer in Sikhote Alin, Russia (Miquelle et al.1996), and barking deer in Thailand (Rabinowitz andNottingham 1986) were the dominant prey species for largecarnivores especially for tigers.
The prey species was also selected based on the preysize which tend to support the concept of optimal foraging
which was based on the premise of a maximization ofenergy return to the predator for each prey encounter(Werner and Hall 1974; Krebs and Davies 1979). The meanand range of prey size can increase with an increase inpredator size (Wilson et al. 1995). Prey was categorizedinto three size classes distinguishable in the field based onspecies and weight. Black-naped hare, porcupine, nilgirilangur, mouse deer, mongoose and bird species wereclassified as small prey (5–30 kg). Chital, nilgiri tahr, wildboar and goat were considered as medium-sized prey (31–100 kg). Sambar, gaur and cattle were categorized as large(>100 kg) prey. In ATR, the average weight of a wild preyspecies of tiger and leopard was 92 and 37 kg, respectively.Similar to that of leopard, the prey size for dhole was also36 kg. Our results showed that large-sized prey (sambar,
Fig. 5 Proportion of prey oc-currence in kills (%) of tiger(n=66) and leopard (n=39)in ATR
Fig. 6 Relation between percent avilable and consumptionof different prey species bytiger, leopard and dhole in ATR
Eur J Wildl Res
gaur and cattle) comprised 70%, medium-sized prey (chital,nilgiri tahr, wild boar and goat) comprised 25% and smallprey (porcupine, black-naped hare, nilgiri langur, mousedeer and mongoose) provided only 3.5% of tiger’s dietbased on scat analysis. On the other hand, medium-sizedprey dominated leopard diet, contributing to 37%. Largeprey and small prey provided about 31% and 27% based onscat analysis. Dhole depend even more predominantly onmedium-sized prey (~50% of overall diet).
Sambar was the most important prey species for tigers,leopard and dhole in our study. In the site where predation onsambar was more, a correspondingly lower degree of chitalpredation by tigers is recorded (Biswas and Sankar 2002). InATR, chital occurred in high densities, which might haveincreased their predation rate, but their gregarious nature wassupposed to be one of the factors that reduced the chance ofpredation by these large carnivores (Karanth and Sunquist1995). Predation of wild boar in ATR suggests high overlapof habitat use between these large carnivores and wild boarwhich might have facilitated a high level of predation on thewild boar (Miquelle et al. 1996). The selectivity for wildboar as prey suggests that these predators were makingforaging decisions on the basis of energy gain and not oninjury risk (Sunquist and Sunquist 1989).
Tigers depend on concealment and ambush to captureprey. In ATR, grasslands were interspersed with islands ofshola which enables tigers to capture tahr and that could bethe reason for the higher proportion of tahr in tiger scat.The prime factor influencing the predation of gaur in thestudy area was probably due to their high density(12 km−2). Presence of porcupine remains in the scats oftiger reflects the ability of tiger to hunt this aggressive preyspecies. Similar observations have also been reported fromMudumalai on tiger which fed upon sloth bear (Swaminathanet al. 2002). The restricted distribution of chital and nilgiritahr in specific habitats may have compelled the tiger to gofor different prey selection.
The higher proportion of cattle in the diet of these largecarnivores could be attributed to the considerable behaviouralplasticity of these predators which could enable them tosurvive in diverse forest environments. Supplementary preysuch as cattle become more important due to low preyavailability in specific size class and competition between co-predators for food and space. The role of livestock in thefeeding habits of these large carnivores was relevant not onlyto the survival of these predators but also to understanding andthus managing their conflict with farmers.
In contrast to the preference of tiger, leopard and dholeshowed preference for medium- and small-sized prey species.Occurrence of smaller species such as black-naped hare,mouse deer, porcupine and mongoose in their diet might bedue the weight of these species that are within the preferredprey weight range of leopard and dhole. The presence of
arboreal prey such as langur in the scats of leopard could belinked to the leopard’s greater arboreality and crypticity incomparison to the other two carnivores. The dietary prefer-ences of dhole are concluded based only on the scat analysis inthis study. Since prey such as chital and sambar are eatenalmost entirely, only the lower jaws remain, making detectionof such kills unlikely (Venkataraman et al. 1995). Thepresence of black-naped hare and bird species in the diet ofdhole could be due to pack hunting and the ability of thedholes to flush out and hunt the smaller and cryptic preyspecies. While being too small for the pack as a whole, suchprey was sufficient for an individual dog. Black-naped harewhen flushed out by the dogs was usually grabbed by thenearest dog and eaten alone or shared with another dog whilethe hunt continues for a larger prey more suitable for theentire pack. It was likely that risk of injury during preycapture may be the reason underlying the lower per centcomposition of large prey in the scats of leopard (Hayward etal. 2006) and dhole.
In the present study, the data from scat analysis showedthat smaller prey species constituted more than 30% of theleopard’s diet, which was not clear from the kill observa-tions. This indicates that scat analysis give a more accurateestimate, whereas kill samples underestimated the propor-tion of smaller prey in the carnivore’s diet. Hence in thepresent investigation, the scat of predators and kill datawere judiciously taken into consideration to determine theprey composition of predator’s diet.
ATR was one of the areas that still harbour high preydensity with predators mostly depending on wild preyrather than on domestic livestock for food as in many otherareas of the Indian subcontinent. From the present study, itcan be concluded that ATR, because of its high wild preydensity, has the potential to accommodate a higher densityof predators (Hayward et al. 2007; Kumaraguru 2002),making it comparable to few of the best remaining tigerhabitats of the Indian subcontinent. Thus, protection of thehabitat along with regular monitoring of endangered speciessuch as tigers, leopard and dhole along with their preypopulation using comparable scientific methods was essen-tial for ATR to emerge as one of the most important areasfor wildlife conservation in India.
Acknowledgement We acknowledge PCCF and CCF, Tamil NaduForest Department (TNFD), for permitting us to enter and to carry outresearch in protected areas of the forest.We extend our sincere thanks to theTNFD for funding part of this project. We thank all forest rangers, forestersand field staff of ATR without whom the project could not be completed.We express our sincere thanks to principal, HOD and all staff members ofthe Department of Wildlife Biology, AVC College, for providing us fullfreedom to carry out the research. We thank Dr. J.C. Daniel, BNHS, andAjay A Desai., Asian Elephant Co-chair person, IUCN, for his valuableguidance to carry out this research and for useful suggestion duringmanuscript preparation. We express our sincere gratitude to the twoanonymous authors for their valuable suggestions.
Eur J Wildl Res
References
Ackerman BB, Lindzey FG, Hemker TP (1984) Cougar food habits inSouthern Utah. J Wildl Manage 48:147–155
Amerasinghe FP (1983) The structure and identification of the hair ofthe mammals of Sri Lanka. Ceylon J Sci Biol Sci 16:76–125
Bekoff M, Daniels TJ, Gittleman JL (1984) Life history patterns andthe comparative social ecology of carnivores. Ann Rev EcologSyst 15:191–232
Berger J, Stacey-Peter B, Bellis L, Johnson MP (2001) A mammalianpredator–prey imbalance: grizzly bear and wolf extinction affectavian neotropical migrants. Ecol Appl 11:947–960
Biswas S, Sankar K (2002) Prey abundance and food habit of tigers(Panthera tigris tigris) in Pench National Park, Madhya Pradesh,India. J Zool 256:411–420
Buckland ST, Anderson DR, Burnham KP, Laake JL (1993) Distancesampling: estimating abundance of biological populations.Chapman & Hall, London
Burnham KP, Anderson DR, Laake JL (1980) Estimation of densityfrom line transect sampling of biological populations. WildlMonogr 72:1–202
Caro TM, Stoner CJ (2003) The potential for interspecific competitionamong African carnivores. Biol Conserv 110:67–75
Clutton-Brock TH, Harvey PH (1983) The functional significance ofvariation in body size among mammals. In: Eisenberg JF,Kleiman DG (eds) Advances in the study of mammalianbehaviour. Allen, Lawrence, pp 632–663
Dinerstein E (1980) An ecological survey of the Royal Karnali-BardiaWildlife Reserve, Nepal. Part III: ungulate populations. BiolConserv 18:5–38
Eberhardt LL (1968) A preliminary appraisal of line transect. J WildlManage 32:82–88
Eisenberg JF, Lockhart M (1972) An ecological reconnaissance ofWilpattu National Park, Ceylon. Smithsonian contribution toZoology 101:1–118
Eisenberg JF, Seidensticker J (1976) Ungulates in Southern Asia: aconsideration of biomass estimates for selected habitats. BiolConserv 10:293–307
Eisenberg JF (1980) The density and biomass of tropical mammals. InConservation Biology, an Evolutionary-Ecological Perspective(eds M. E. Soule and B. A. Wilcox). Sinauer Press, Sunderland
Eloff FC (1984) Food ecology of the Kalahari lion (Panthera leo).Koedoe 27:249–258
Eltringham SK (1979) The ecology and conservation of large Africanmammals. Macmillan, London
Estes JA, Tinker MT, Williams TM, Doak DE (1998) Killer whalepredation on sea otters linking oceanic and near shore ecosystems.Science 282:473–476
Floyd TJ, Mech LD, Jordan PJ (1978) Relating wolf scat contents toprey consumed. J Wildl Manage 42:528–532
Griffiths D (1975) Prey availability and the food of predators. Ecology56:1209–1214
Hersteinsson P, Macdonald DW (1996) Diet of Arctic foxes (Alopexlagopus) in Iceland. J Zool Lond 240:457–474
Hayward MW, Kerley GIH (2008) Prey preferences and theconservation status of Africa's large predators. S Afr J WildlRes 38:93–108
Hayward MW, Henschel P, Brien J, Hofmeyr M, Balme G, KerleyGIH (2006) Prey preferences of the leopard (Panthera pardus). JZool Lond 270:298–313
Hayward MW, Brien J, Kerley GIH (2007) Carrying capacity of largeAfrican predators: predictions and tests. Biol Conserv 139:219–229
Jedrzejewska B, Jedrzejewski W (2005) Large carnivores andungulates in European temperate forest ecosystems: bottom-up
and top-down control. In: Ray JC, Redford KH, Steneck RS,Berger J (eds) Large carnivores and the conservation ofbiodiversity. Island, Washington, pp 230–246
Johnsingh AJT (1983) Large mammalian prey–predators in Bandipur.J Bombay Nat Hist Soc 80:1–57
Karanth KU (1993) Predator–prey relationships among largemammals ofNagarhole National Park. Mangalore University, Bangalore, India.Ph.D. dissertation
Karanth KU, Nichols JD (1998) Estimation of tiger densities in Indiausing photographic captures and recaptures. Ecology 79:2852–2862
Karanth KU, Sunquist ME (1992) Population structure, density andbiomass of large herbivores in the tropical forests of Nagarhole,India. J Trop Ecol 8:21–35
Karanth KU, Sunquist ME (1995) Prey selection by tiger, leopard anddhole in tropical forests. J Anim Ecol 64:439–450
Karanth KU, Sunquist ME (2000) Behavioural correlates of predationby tiger (Panthera tigris), leopard (Panthera pardus) and dhole(Cuon alpinus) in Nagarhole, India. J Zool Lond 250:255–265
Karanth KU, Nicholas JD, Kumar NS, Link WA, Hines JE (2004)Tigers and their prey: predicting carnivore densities from preyabundance. Proc Natl Acad Sci 101:4854–4858
Khan JA, Chellam R, Rodgers WA, Johnsingh AJT (1996) Ungulatedensities and biomass in the tropical dry deciduous forests of Gir,Gujarat, India. J Trop Ecol 12:149–162
Khorozyan I, Malkhasyan A (2002) Ecology of the leopard (Pantherapardus) in Khosrov Reserve, Armenia: implications for conserva-tion. Societa Zoologica ‘La Torbiera’, Italy, scientific report no. 6
Kitsos AJ, Hunter MJ, Sabnis JH, Mehta A (1995) A guide to theidentification of some Indian mammal hairs. In: Berwick SH,Saharia VB (eds) The development of international principles andpractices of wildlife research and management, Asian and Americanapproaches. Oxford University Press, New Delhi, pp 125–130
Kopikar BR, Sabins JH (1976) Identification of hairs of some Indianmammals. J Bombay Nat Hist Soc 73:5–20
Korschgen LJ (1971) Procedures for food-habits analysis. In: GilesRH (ed) Wildlife management technique. Wildlife Society,London, pp 233–258
Krebs JR, Davies NB (1979) Behavioral ecology and evolutionaryapproach. Sinauer, Sunderland
Kruuk H (1972) The spotted hyena: a study of predation and socialbehavior. University of Chicago Press, Chicago
Kumaraguru A (2002) The influence of prey species diversity anddensities in different vegetation types on the foraging ecologyand community structure of large carnivores in Indira GandhiWildlife Sanctuary and National Park, South India. Reportsubmitted to Tamil Nadu Forest Department, Tamil Nadu, India
McDougal C (1977) The face of the tiger. Rivington Books, LondonMills MGL (1984) Prey selection and feeding habits of the large
carnivores in the Southern Kalah. Koedoe 27:281–294Miquelle DG, Smirnov EN, Quigley HB, Hornocker MG, Nikolaev
IG, Matyukshin EN (1996) Food habits of Amur tigers inSikhote-Alin Zapovednik and the Russian Far East and implicationsfor conservation. J Wildl Res 1:138–147
Prins HHT, Reitsma JM (1989) Mammalian biomass in an Africanequatorial rain forest. J Anim Ecol 58:851–861
Rabinowitz A, Nottingham BG (1986) Ecology and behaviour of thejaguar (Panthera onca) in Belize, Central America. J Zool210:149–159
Ramakrishnan U, Coss RG, Pelkey NW (1999) Tiger decline causedby the reduction of large ungulate prey: evidence from a study ofleopard diets in Southern India. Biol Conserv 89:113–120
Ranawana KB, Bambaradeniya CNB, Bogahawatte TD, AmerasingheFP (1998) A preliminary survey of the food habits of the SriLanka leopard (Panthera pardus fusca) in three montane wetzone forests of Sri Lanka. Ceylon J Sci Biol Sci 25:65–71
Eur J Wildl Res
Schaller GB (1967) The deer and the tiger. University of ChicagoPress, Chicago
Schaller GB (1972) The Serengeti lion: a study of predator–preyrelations. University of Chicago Press, Chicago, p 504
Seidensticker J (1976) On the ecological separation between tigers andleopards. Biotropica 8(4):225–234
Sinclair ARE, Olsen PD, Redhead TD (1990) Can predators regulatesmall mammal populations? Evidence from house mouse outbreaksin Australia. Oikos 59:382–392
Sovada MA, Sargeant AB, Grier JW (1995) Differential effects ofcoyotes and red foxes on duck nest success. J Wildl Manage 59:1–9
Stander PE, II Ghau, Tsisaba D, II OMA, VI (1997) Tracking and theinterpretation of spoor: a scientifically sound method in ecology.J Zool 242:329–341
Stelfox JB (1986) Effects of livestock enclosures (bomas) on thevegetation of the Athi Plains, Kenya. Afr J Ecol 24:41–45
Stephens DW, Krebs JR (1987) Foraging theory. Princeton UniversityPress, Princeton
Sunquist ME (1981) The social organization of tigers (Panthera tigris) inRoyal Chitwan National Park, Nepal. Smithsonian contributions tozoology no. 336. Smithsonian Institution Press, Washington, DC,p 98
Sunquist ME, Sunquist FC (1989) Ecological constraints on predation bylarge felids. In: Gittleman JL (ed) Carnivore behaviour, ecology andevolution. Cornell University Press, Ithaca, pp 283–301
Swaminathan S, Desai AA, Daniel JC (2002) Large carnivores inMudumalai Wildlife Sanctuary and National Park. Reportsubmitted to Bombay Natural History Society, Bombay, 80
Tamang KM (1982) The status of tiger and its impact on principalprey populations in the Royal Chitawan National Park, Nepal.Ph.D Thesis, Michigan State University, East Lansing
Taylor RJ (1976) Value of clumping to prey and the evolutionaryresponse of ambush predators. Am Nat 110:13–29
Temple SA (1987) Do predators always capture sub standardindividuals disproportionately from prey populations? Ecology68:669–674
Terborgh J (1986) Keystone plant resources in the tropical forest.Sinauer Associates, Sunderland
Terborgh J, Lopez L, Nunez P, Rao M, Shahabudin G, Orihuela G,Riveros M, Ascanio R, Adler GH, Lambert TD, Balbas L (2002)Ecological meltdown in predator-free forest fragments. Science294:1923
Varman KS, Sukumar R (1995) The line transect method forestimating densities of large mammals in a tropical deciduousforest: an evaluation of models and field experiment. J Biosci20:273–287
Venkataraman AB, Arumugam R, Sukumar R (1995) The foragingecology of dhole (Cuon alpinus) in Mudumalai Sanctuary,southern India. J Zool 237:543–561
Werner EE, Hall D (1974) Optimal foraging and the size selection ofprey by the bluegill sunfish (Lepomis macrochirus). Ecology55:1042–1052
Wilson RP, Putz K, Gremillet D, Culik BM, Kierspel M, Regel J,Charles AB, Lage J, Cooper J (1995) Reliability of stomachtemperature changes in determining feeding characteristics ofseabirds. J Exp Biol 198:1115–1135
Eur J Wildl Res
Related Documents