r, ELSEVIER A Predator-Prey Model with Optimal Suppression of Reproduction in the Prey MATS GYLLENBERG Department of Mathematics, University of Turku, FIN-20500 Turku, Finland ILKKA HANSKI Department of Zoology, University of Helsinki, FIN-O0100 Helsinki, Finland AND TORSTEN LINDSTROM Department of Mathematics, University of Orebro, S-70130 Orebro, Sweden Received 14 October 1994; revised 12 April 1995 ABSTRACT Several time-discrete ecological models are formulated and analyzed. Common to these models is that a trade-off between reproductive effort and competitive ability is assumed. We investigate how behavioral adjustment (suppression of reproduction) affects the population dynamics. 1. INTRODUCTION Numerous theoretical and empirical studies have elucidated the consequences of predation risk on the foraging behavior of animals (e.g., [1, 2]). A much less studied but equally interesting question is to what extent predation risk affects the breeding behavior of prey individ- uals. This is an intriguing question because it directly links behavior and population dynamics. An expanding body of empirical literature demon- strates that high risk of predation may lead to suppressed reproduction in the prey [3-7], but to our knowledge there are no theoretical analyses of the population dynamic consequences of optimal breeding behavior of prey in the presence of high risk of predation. The empirical system that has motivated our study is the interaction between microtine rodents and their mustelid predators in northern Europe [8]. Recent studies have demonstrated that both maturation of young voles and the early development of the offspring of older voles are affected by risk of predation [3]. MATHEMATICAL BIOSCIENCES 134:119-152 (1996) © Elsevier Science Inc., 1996 655 Avenue of the Americas, New York, NY 10010 0025-5564/96/$15.00 SSDI 0025-5564(95)00082-O

Welcome message from author
This document is posted to help you gain knowledge. Please leave a comment to let me know what you think about it! Share it to your friends and learn new things together.
Transcript

r,
ELSEVIER
A Predator-Prey Model with Optimal Suppression of Reproduction in the Prey
MATS GYLLENBERG Department of Mathematics, University of Turku, FIN-20500 Turku, Finland
ILKKA HANSKI Department of Zoology, University of Helsinki, FIN-O0100 Helsinki, Finland
AND
TORSTEN LINDSTROM Department of Mathematics, University of Orebro, S-70130 Orebro, Sweden
Received 14 October 1994; revised 12 April 1995
ABSTRACT
Several time-discrete ecological models are formulated and analyzed. Common to these models is that a trade-off between reproductive effort and competitive ability is assumed. We investigate how behavioral adjustment (suppression of reproduction) affects the population dynamics.
1. INTRODUCTION
Numerous theoretical and empirical studies have elucidated the consequences of predation risk on the foraging behavior of animals (e.g., [1, 2]). A much less studied but equally interesting question is to what extent predation risk affects the breeding behavior of prey individ- uals. This is an intriguing question because it directly links behavior and population dynamics. An expanding body of empirical literature demon- strates that high risk of predation may lead to suppressed reproduction in the prey [3-7], but to our knowledge there are no theoretical analyses of the population dynamic consequences of optimal breeding behavior of prey in the presence of high risk of predation. The empirical system that has motivated our study is the interaction between microtine rodents and their mustelid predators in northern Europe [8]. Recent studies have demonstrated that both maturation of young voles and the early development of the offspring of older voles are affected by risk of predation [3].
MATHEMATICAL BIOSCIENCES 134:119-152 (1996) © Elsevier Science Inc., 1996 655 Avenue of the Americas, New York, NY 10010
0025-5564/96/$15.00 SSDI 0025-5564(95)00082-O

120 MATS GYLLENBERG ET AL.
The main objective of this paper is to formulate and analyze a predator-prey model with the possibility of suppressed reproduction in the prey. We commence with a single-species model in which we assume a trade-off between the reproductive effort and competitive ability. If no behavioral adjustment of the rate of reproduction is allowed for, the type with the reproductive rate maximizing the equilibrium population size prevails, regardless of whether the equilibrium point is stable or not. However, when behavioral adjustments are allowed for, the winning type suppresses reproduction, to some extent, whenever the equilibrium is unstable, and this behavior decreases the mean amplitude of popula- tion oscillations. We then extend this model to include predation, assuming a trade-off between the reproductive effort and an individual's ability to avoid predation. Optimal adjustment of reproduction by the prey adds to population stability, as measured by the mean amplitude of oscillations. This result supports the main conclusions in [9, 10], where population dynamical consequences of optimal behavior were analyzed using different approaches.
Our paper is organized as follows. In Section 2 we introduce the notions of fixed and adjustable strategy in the single-species case. We find the best fixed strategy and investigate the asymptotic behavior of solutions to a model describing competition between fixed and ad- justable strategies. In Section 3 we introduce a new discrete predator- prey model, which can be regarded as a combination of the Ricker model [11], the Nicholson-Bailey model [12], and the continuous Lotka-Volterra model [13, 14]. A mechanistic explanation of the model is included in Section 3. In Section 4 we investigate the dynamics of this discrete predator-prey model, and this study culminates in an impor- tant stability theorem. In Section 5 we investigate the dynamical conse- quences of the optimal suppression of reproduction in the prey. The analytical study of the predator-prey model is supplemented with a numerical study in Section 6. In Section 7 we relate our results to those of other authors and discuss their biological implications. The proofs of the theorems and propositions can be found in Section 8.
2. FIXED AND ADJUSTABLE STRATEGIES IN THE SINGLE-SPECIES CASE
The growth of a semelparous population reproducing at discrete instances can in general be described by the difference equation
x' = xR( E) , (2.1)
where x is the population density, E is the state of the environment at the beginning of a season (immediately after reproduction), and x' is

OPTIMAL SUPPRESSION OF REPRODUCTION 121
the population density at the beginning of the next season. R(E) is the net reproduction number when the environmental state is E, that is, the expected number of offspring born to an individual. In this paper we are concerned with the effects of density-dependent competition and preda- tion upon population dynamics, and therefore we choose, in the single- species case, simply the population density as the environmental state. In the predator-prey model considered in Sections 3-5 the environ- mental state of the prey will be described by the sum of the prey density and the predation pressure. In both cases it is natural to assume that R is a decreasing function tending to zero as E tends to infinity. To be specific we choose
R ( E ) =/3exp( - kE). (2.2)
Observe that the model (2.1), (2.2) supplemented by E - - x is nothing but the well-known Ricker model, first introduced in [11]. The parame- ter k in (2.2) measures the strength of the density dependence or the competitive ability, and /3 can be interpreted as the average clutch size at low density, when there is no negative effect of density on reproduc- tion. (We use the term clutch as shorthand for a "batch of offspring born at the same time," with no intention of restricting the results to species for which "clutch" is generally used in the biological literature.)
Consider now competition between two asexually reproducing types x and y of the same species. We assume that the types have different parameters /3 and k and that the environment is given by the total population density. The population density dynamics is then described by the model
x' = xRI(E) , (2.3a)
y' = yR2( E) , (2.3b)
E = x + y, (2.3c)
Ri(E ) =/3iexp( - kiE ) , i = 1, 2. (2.3d)
We prove below that the type with the net reproduction number that maximizes the equilibrium population size will outcompete all other types. This conclusion is a well-known principle of natural selection going back at least as far as [15]. We prove the result in a general setting that includes the cases where the equilibrium point is unstable and the dynamics are cyclic or chaotic.
PROPOSITION 2.1
Let [~1, /32 ~> 1, and let x* = log •1/kl and y* = log/32/k2 be the unique solutions of the equations Rl(X*) = 1 and R2(y*) = 1, respectively.

122 MATS GYLLENBERG ET AL.
Then (x*,0) and (0,y*) are fired points of system (2.3). f i x * > y*, then the x axis attracts every point not on the y axis; and if x* < y*, then the y axis attracts every point not on the x axis.
We now assume a trade-off between reproductive effort and compet- itive ability by making k a function of/3. We assume that offspring are produced in clutches, that larger values of /3 correspond to larger clutches, and that individuals producing small clutches do better in competition than individuals producing large clutches. This assumption has substantial empirical support for many organisms [16] and requires k to be an increasing function of /3. The competition model now takes the form
x ' = x/31 exp[ - k ( /3 , )E l ,
Y'= Y/32 exp[ - k(/32) E] ,
E = x + y .
(2.4a)
(2.4b)
(2.4c)
Proposition 2.1 implies that the type with the largest equilibrium density in the absence of the other type will outcompete the other. Since this equilibrium is given by
log/3 (2.5) h( /3 ) k ( /3 ) '
we infer that the type with largest h(/3) will win in intraspecific competition. For physiological reasons, individuals cannot produce an arbitrarily large number of offspring. We denote the upper bound of the clutch size by M. It seems reasonable to assume the existence of a unique optimal clutch size /3. Mathematically this amounts to requiring that the function h defined by (2.5) have a unique global maximum /3 e (0, M].
We make the following assumptions about k.
(B.I) k:(0, M] ~ R+ is positive and increasing. (B.II) The function 13 ~ ( l o g / 3 ) / k ( / 3 ) has a unique global maxi-
mum /3 • (0, M ]. (B.III) k • C2(0, M) and /3k" (/3) + k'(/3 ) > 0 for all /3 • (0, M).
The first two of these assumptions are, as explained above, biologically justified. The significance of the last one will become clear in connec- tion with Propositions 2.2 and 5.1. Notice that the function k(/3) =/3P, p > 0, satisfies (B.I)-(B.III), and this k will serve as our prototype in the sequel.

OPTIMAL SUPPRESSION OF REPRODUCTION 123
The strategy involving /3 is best among all fixed strategies, that is, strategies for which individual reproductive behavior does not depend on the current state of the environment. We consider now a strategy in which individuals adjust their clutch size by maximizing their contribu- tion to the next generation, that is, the net reproduction number is given by
R z ( E ) = sup [ 3 e x p [ - k ( [ 3 ) E ] . (2.6) 0</3<M
Is this strategy better than the fixed one? To answer this question we consider the competition model (2.3) with R 1 given by RI(E)= /3exp[- k(/3)El and R z given by (2.6). For ease of reference we repeat the model describing competition between the best fixed strategy and the adjustable strategy:
x ' = x/3exp[ - k ( / 3 ) E ] , (2.7a)
y ' = y sup [3exp[-k ([3)E] , (2.7b) 0 < ~ < M
E = x + y. (2.7c)
PROPOSITION 2.2
Assume (B.I)-(B.III) . Then,
(i) The supremum in (2.6) is a maximum, and for every E ~ R+ it is attained at precisely one ~ ~ (0, M ].
(ii) The unique [3 =: [3(E) found in (i) defines a continuous function /3:R+ ~ (0, M] that takes on the value M in [0, 1/Mk'(M)], is strictly decreasing in [1/ Mk'( M), o,) and satisfies
/3 [ ( log /3 ) /k ( /3 ) ] =/3.
(iii) Put
/ 1 ) z e = .
(2.8)
The map (x, y) ~ ( x', y') defined by (2.7) is continuously differentiable on
Conclusion (ii) says that the type y using the adjustable strategy produces the largest physiologically possible clutches at low population densities E. As the population density grows beyond a threshold value

124 MATS GYLLENBERG ET AL.
1/[Mk'(M)], this type starts to suppress reproduction. If the population density is larger than the equilibrium population density (log f i ) /k( /3) , then the type using the adjustable strategy will actually produce smaller clutches than the type x using the best fixed strategy.
The following theorem is of considerable importance.
THEOREM 2.3
Let the assumptions (B.I) - (B.II I ) hold, and assume that P =(x 0, Y0) ~ Int R E. Every point on the segment
log fi x + Y = k ( f i ) , x~>0;y~>0, (2.9)
is a fixed point of (2.7). I f the w-limit set to(P) of P is not a subset of the y axis, then to(P) consists of a single point on the segment (2.9). One has
Y' Y (2.10) X ~ ~>X '
and the exact location of to(P) depends on the initial state P.
Remark 2.4. By the argument used in the proof of Theorem 2.3, it is possible to show that the optimal adjustable strategy amounts to maxi- mization of an individual's share of the offspring in the next generation.
Theorem 2.3 enables us to draw some interesting conclusions. By inequality (2.10), the adjustable strategy always gains ground at the expense of the fixed strategy. Notice that the equilibrium total popula- tion density x*+ y* = (log f i ) / k ( ~ ) is the nontrival fixed point of both the maps
x ' = xfi e x p [ - k( fi)x] (2.11)
and
y ' = y sup / 3exp [ -k ( /3 )y ] (2.12) O < f l < M
describing the dynamics of each of the two types in the absence of the other. Theorem 2.3 shows that if the nontrivial fixed point of (2.11) is unstable, then the proportion of individuals using the adjustable strat- egy increases until a stable fixed point of (2.7) is reached. If all the fixed points of (2.7) are unstable, then the adjustable strategy outcompetes the fixed strategy.

OPTIMAL SUPPRESSION OF REPRODUCTION 125
Next we give an example demonstrating that adjustment of reproduc- tion has a stabilizing effect on population dynamics.
Example 2.5. Consider the case k( /3)=/3 p and M---/3. We first calculate /3 and get /3 = exp(1/p). Thus the map (2.11) is given by
x' = x exp(1 /p ) exp( - ex), (2.13)
and the map (2.12) is given by
Y'= lyexp(1/p) exp( - ey), y < 1/pe (2.14)
I Y(pey)-I/P' Y > l/pe.
If 0 < p < 1/2, then the map (2.13) has cyclic or chaotic behavior. Observe that the map (2.14) conserves the derivative of the map (2.13) in the fixed point 1/pe, and therefore the linearized stability of the fixed point 1/pe of the map (2.13) carries over to the map (2.14). It was shown in [17], Proposition 1, pp. 121-122, that if a continuous map f on a compact interval has no two-periodic points, then every orbit con- verges to a fixed point of f. The maps (2.13) and (2.14) have bounded orbits and a unique locally stable fixed point for p >/1/2. Moreover, these maps have no two-periodic points, and hence the result men- tioned above implies that the locally stable fixed point is in fact (almost) globally stable (it attracts everything except the origin).
Figure 1 demonstrates how adaptive adjustment of reproduction decreases the mean amplitude of oscillations. The amplitude was mea- sured by the standard deviation of log-transformed values after the changes 2"= ex and y = e y in (2.13) and (2.14), respectively. Our example shows that as long as the equilibrium 1/pe is a global attractor for the map (2.13), this equilibrium is a global attractor for the map (2.14). However, if this equilibrium is unstable, then the mean ampli- tude of the cyclic or chaotic oscillations in the behaviorally adjustable case (2.14) seems to be smaller than in the case of fixed behavior (2.13). Note that the dominating period (the period corresponding to the maximum of the Fourier spectrum) is 2 during the whole first-period doubling sequence and far beyond it in both cases. The mean amplitude of oscillations and the dominating period are noteworthy variables in this context because they are frequently estimated in empirical studies of rodent population dynamics [8].
3. A PREDATOR-PREY MODEL
In this section we derive a discrete predator-prey model that is a variant of the Nicholson-Bailey model with density-dependent prey

126 MATS GYLLENBERG ET AL.
~ 4
'<2
0
JjJ 10 . . . . . .
"6 6"
~2 . . . . .
_ F o 40
exp(1/p) 0 20 40 60 60
exp(1/p)
(a) (b)
.•41 ~ 0.1
0 2 ~-0.1 :.I -0.4
0 20 40 60 0 20 40 60 exp(l/p) exp(l/p)
(c) (d)
FIG. 1. Comparison of the solutions of (2.13) (solid) and (2.14) (dotted) in the case k(/3) = tip for p in the range 7.09 < exp(1/p) < 55.0. (a) Amplitudes of the solutions. (b) The logarithm of the period. (c) The logarithm of the dominating period (the period corresponding to the maximum of the Fourier spectrum). (d) The Lyapunov exponent.
dynamics and a long-lived predator. As before, we assume that the prey individuals live for one season only.
As in the preceding sections we use the Ricker model (2.1), (2.2) to describe reproduction and intraspecific competition among the prey. Predation is an extra source of mortality in the prey, and it seems reasonable to incorporate this in the model by adding a term describing "predation pressure" to the definition of the environmental state E. We wish to emphasize that the precise way in which predation is taken into account through E is not obvious and that careless discretization of continuous predator-prey models may lead to biologically meaningless models (see Gyllenberg et al. [18]). We therefore derive our preda tor - prey model by integrating the corresponding continuous Lotka- Wolterra model over one season.

OPTIMAL SUPPRESSION OF REPRODUCTION 127
During the season, predation takes place continuously according to the linear (type I) functional response ayx and predators die at a constant rate d. We make a distinction between the consequences of predator behavior ( a ) and prey behavior ( y ) on predation rate, hence the product of the two parameters (this will become apparent below). The densities x and z of prey and predators, respectively, satisfy the following system of ordinary differential equations:
2 = - c~yxz, 2 = - dz. (3.1)
The solution to (3.1) is given by
x(t) =exp[--~--Zo(1-e-at)]Xo,
z( t) = exp( - dt)z o,
0 ~< t ~< T, where x 0 and z 0 are the initial densities of prey and preda- tors, respectively, and T is the length of the season.
We introduce the new parameters
5 r = exp( - d T ) ,
which is the probability that a predator survives the season, and
a = d ( 1 - S r ) .
The number of prey eaten during the season is given by
[1 - exp( - 3mZo) ] Xo,
and of these
J-[1 - exp( - -/az0) ] x 0
have been digested by predators still alive at the end of the season. We assume that a fraction rn of this prey mass is transformed into new predators at the end of the season.
Following the single-species model of Section 2, we assume that there is a relationship between the competitive ability and the reproduc-

128 MATS GYLLENBERG ET AL.
tive effort of the prey, and hence we assume that k is an increasing function of /3. We also assume that prey individuals producing large clutches are more vulnerable to predation and hence that the coeffi- cient 3' in the functional response is an increasing function of /3. To simplify the model we assume that
y = k .
Assuming that the prey individuals that survived competition and preda- tion produce/3 offspring on average, we arrive at the following discrete model:
x ' = x/3exp[- k ( / 3 ) ( x + az)] ,
z' = m~{1 - exp[ - k ( /3 )az] }x + grz.
(3.2)
(3.3)
Observe that Equation (3.2) is of type (2.1), (2.2) with E = x + az. The term az can be interpreted as the predation pressure each prey individual is subject to.
We now continue as follows. We analyze the dynamics of the fixed strategy case (3.2), (3.3) for different /3 < M < exp(2) in Section 4. Here we assume that /3 =/3 (see Section 2). The last assumption holds, for instance, if the optimal fixed strategy has outcompeted the other fixed strategies before the predators enter the system. If k(/3) =/3P, then the restriction 0 </3 < M < exp(2) implies that p > 1/2. In Section 5 we allow the prey to adjust its reproduction as in model (2.12) and compare the dynamics of the adjustable strategy to the dynamics of the fixed strategy in the predator-prey case.
4. DYNAMICS OF THE PREDATOR-PREY MODEL
In this section we give a complete description of the local bifurca- tions of model (3.2), (3.3) when /3 varies from 0 to M < exp(2). The restriction on/3 implies that in the Ricker model x' = xfl exp[ - k( /3)x] either (if /3 < 1) the origin is a globally stable fixed point or [if 1 </3 < M < exp(2)] there is a positive stable fixed point attracting all points except the origin. Hence all oscillations in model (3.2), (3.3), if any occur, are due to the predator-prey interaction, not to oscillations in the Ricker model. We therefore call these oscillations pure predator- prey oscillations.
The case /3 > exp(2) was studied numerically for the Nicholson- Bailey model with density-dependent host reproduction in [19]. The

OPTIMAL SUPPRESSION OF REPRODUCTION 129
conclusion was that if /3 exceeds exp(2) then an unexpected extinction of the predator can occur, as a result of subcritical flip bifurcation.
THEOREM 4.1
Consider system (3.2), (3.3), where the parameters a, m, /3, o ar are positive, oar< 1, and k:(0, M] ~ R+ is increasing.
(i) The origin is a fixed point for all parameter values. It is globally asymptotically stable if/3 < 1 and unstable if/3 > 1.
(ii) I f /3 >1 1, then (log/3 / k(/3), 0) is a fixed point and there are no other fixed points on the boundary of R 2 except the origin. ( log /3 /k ( /3 ) , O) is locally asymptotically stable if 1 < / 3 < exp[(1-Sr)/am~q r] and is unstable if exp[(1 - 5r)/am.5 r] </3.
(iii) There exists a foced point (x*, z*)~ In tR 2 if and only if exp[(1 - 9) /amSr] </3 and there are no other fixed points in Int R2+. Assume that exp[(1 - ar)/ am~] </3, and let (x*, z*) be the unique fixed point in Int R 2 provided by (iii).
(iv) I f 0 < am < 1, then (x*, z*) is locally asymptotically stable for /3 < exp(2).
(v) I f am > 1, then there exists a /3* > exp[(1 - S r ) / a m a r] such that (x*, z*) is locally asymptotically stable for /3 </3* and unstable if/3 >/3*.
(vi) I f /3" < exp(2), then the eigenvalues of the Jacobian evaluated at (x*, z*) for/3 =/3* are complex conjugates located on the unit circle.
Theorem 4.1 calls for some comments. Conclusion (i) states the obvious fact that if the prey's average clutch size /3 is less than 1, then the prey and hence the predator will go extinct. As /3 is increased through 1, a fLxed point at ( log /3 /k ( /3 ) , 0) is formed in a saddle-node bifurcation and the prey becomes persistent. A new fixed point in the interior of the state space is formed in a saddle-node bifurcation when /3 = e x p [ ( 1 - S r ) / a m ~ ] and the predator becomes persistent. We notice that it is the relation between the odds (1 - ~ r ) / S r of the predator dying and the number am log/3 that determines whether the predator is persistent or not.
If the fixed point in the interior of the state space becomes unstable as /3 increases from e x p [ ( 1 - J r ) / a m a r ] to exp(2), then it undergoes at most one bifurcation. By (vi) this bifurcation is a Hopf bifurcation (unless the eigenvalues happen to be some of the first five roots of unity, which is extremely unlikely), and pure bounded predator-prey oscillations occur. A quick observation tells us that am > 1 is a neces- sary condition for pure predator-prey oscillations. The proof of Theo- rem 4.1 shows that a sufficient condition is that amg- i s large enough.
The generic behavior of dynamical systems after a Hopf bifurcation has been studied by several authors; see [20-22] and references therein.

130 MATS GYLLENBERG ET AL.
As an especially interesting biological application, we refer to [23]. If we interpret these results for system (3.2), (3.3), we get the following. As /3 is slightly increased above the critical value /3", an invariant circle with quasi-periodic behavior appears generically [20]. As /3 is further in- creased, this quasi-periodic behavior will generically become inter- spersed with (usually) high-periodic resonances [21, 22].
The likelihood for resonances increases as the parameter /3 is further increased and large intervals with low-periodic behavior can be detected. Simultaneously, the invariant circle formed in the Hopf bifur- cation loses its smoothness gradually, and a transition from regular behavior toward chaotic behavior takes place. The fine structure of this transition is extremely complicated and is studied in detail numerically for another system in [24]. Our numerical results, presented in Section 6, agree with the findings of [24].
5. PREDATOR-PREY SYSTEMS AND THE ADJUSTABLE STRATEGY
In this section we take a closer look at the dynamical consequences of the adjustable strategy. We are interested in two questions. Does a type with the ability to adjust its reproduction have an advantage over types that lack this ability? Does the adjustable strategy increase the stability of the dynamics?
To treat the first question we assume that a prey of type x uses the optimal fixed strategy, which, in the absence of predation, was found in Section 2 to set its average clutch size /3 to /3, the maximum of (log s)/k(s). The predator-prey dynamics are thus given by the model
x ' = x / 3 e x p [ - k ( / 3 ) ( x + az)],
z'=m3-{1-exp[-k( ~)az])x +3rz, (5.1)
where, as before, z denotes the predator density. Consider now another prey type y, which can adjust the clutch size/3
according to the present state of the environment. Mathematically we express this by letting /3 be a function /3 of the state E of the environment. We finally combine model (5.1) with (2.7), describing intraspecific competition between two prey types--one (x) using a fixed strategy, and the other (y) using an adjustable strategy. We obtain
x ' = x/} exp[ - k ( / 3 )E ] ,
y ' = y/3 e x p [ - k ( / 3 ) E l ,
(5.2a)
(5.2b)

OPTIMAL SUPPRESSION OF REPRODUCTION 131
z ' = mg-(1--exp[- k( ~)az] }x + m J { 1 - e x p [ - k( fl )az] }y + o~-z,
(5.2c)
E = x + y + az, (5.2d)
where /3 =/3(E) is determined by
f l ( E ) e x p [ - k ( f l ( E ) ) E ] = sup /3exp[ -k ( /3 )E] . (5.3) O<fl~M
The constant M >//3 is a physiologically determined upper bound of the clutch size /3. The idea behind (5.3) is similar to the optimal adjustment (2.6) in the single-species case. The right-hand side of (5.3) is the maximal net reproduction number and the net reproduction number for the type using the adjustable strategy. The assumptions (B.I)-(B.III) guarantee that /3 is uniquely determined through (5.3), and so the mapping (x, y, z) ---, (x', y', z') given by (5.2) is well defined. This is the main content of the following proposition.
PROPOSITION 5.1
Let the assumptions ( B.I)- ( B.III) hold, and put E = x + y + az. Then,
(i) For each E ~ R+, the relation (5.3) uniquely determines a number ~(E) ~ (0, M].
(ii) The function /3:R+ ~ (0, M] defined by (5.3) is continuous, con- stant on [0, 1/ Mk'( M)], and strictly decreasing on (1 / Mk'( M), ~). Moreover,
/~[ log/3 I
(iii) Put
{ 1} .Sf= ( x , y , z ) ~ R 3 : x + y + a z M k ' ( M ) "
The map (x, y, z) (x , y', z') defined by (5.2) is continuously differen- tiable on R3\_~.
As the proof of Proposition 2.2 and the completely analogous and therefore omitted proof of Proposition 5.1 show, assumption (B.III) is needed to show that /3 is a well-defined function of E.

132 MATS GYLLENBERG ET AL.
As in Section 2, the asymptotic dynamics of system (5.2) reduce in several cases to the asymptotic dynamics of
y ' = yf3(y + az )exp[ - k( f3(y + az))(y + az)]
z '= m g r ( 1 - e x p [ - k( f l (y +az) )az]}y + ~rz. (5.4)
We have the following analog of Theorem 2.3.
THEOREM 5.2
Let the assumptions (B.I ) - (B.I I I ) hold, and assume that P = (x, y, z) ~ IntR 3 and M > ft. The triangle
log fi x + y + a z = ~ x~>O;y>~O; z~>O, (5.5)
k ( f i ) '
contains one or two segments of nontrivial fixed points of (5.2). I f the to-limit set to(P) of P is not a subset of the yz plane, then to(P) consists of a single point on one of the at most two segments with fired points on the triangle (5.5). One has
yl Y x' >~ (5.6)
x
and the exact location of to(P) depends on the initial state P.
So, if M > fi and the fixed points of (5.1) are unstable, the propor- tion of individuals using the adjustable strategy increases until a stable fixed point of system (5.2) is reached. If all the fixed points of system (5.2) are unstable, then the adjustable strategy outcompetes the fixed strategy. That is, when the adjustable strategy prevails, it stabilizes oscillating dynamics or outcompetes the fixed strategy.
In the next theorem we show that the adjustable strategy can stabilize oscillating dynamics in the case k(/3) =/3P.
THEOREM 5.3
Assume that k(/3)=/3P and M > ~. Consider system (5.1) with p as bifurcation parameter, and assume that the fixed point in Int R2+ loses its stability through a Hopf bifurcation as p decreases through p*. Then there exists an ~ > 0 such that the fired point in IntR 2 of system (5.4) is locally asymptotically stable for p > p* - e.
Theorem 5.3 states that for p ~ [ p * - E , p*], the fixed point is unstable if the prey do not adjust their reproductive behavior to prey

OPTIMAL SUPPRESSION OF REPRODUCTION 133
and predator density, but stable if they do. Moreover, the adjustable strategy cannot be the reason for any observed oscillations. If the oscillations are present in the adjustable strategy case (5.4), they are also present in the fixed strategy case (5.1) for the corresponding parameter values.
6. N U M E R I C A L RESULTS
We supplement the analytical comparison of systems (5.1) and (5.4) in Sections 4 and 5 with a numerical study. Our aim is to make as complete a comparison as possible of systems (5.1) and (5.4) when 1 </3 < M < exp(2). Observe that this study includes a study of the system (3.2), (3.3).
We were interested in the case where M was only slightly greater than /3 and k( /3) =/3P; that is, we compared the systems
and
Y ' = 2~exp(1 /p ) exp( - 2 ~ - ~.2"),
.2" = [1 - exp( - ~¢.U) ] ~ - 5r_U
(6.1)
(6.2)
[y (p(y + -,h,
Z ' = [ .ac.U 1 y + p(y
y + ~'.2" < - - , P
(6.3) 1 - e
~ / + J . 2 " > P ,
~"2", y + ~¢~ > - -
p '
p '
(6.4)
with 2 ~= k( ~ ) x , ~ = k( ~ ) y , .U = k ( ~ ) z / ( m , ~ r ) , s,¢= am.~, and ~ = 1 0 - 1 4 . (The numerical accuracy in double precision is expected to be on the order of 10-15.)
We have used the approximations M P / e - 1 and M = exp (1 /p ) in (6.3), (6.4). The relative errors caused by these approximations are on the order of 10 -14 , so they are negligible compared to the relative errors in the calculation of 1 - e x p ( - ~ ) in (6.2) and (6.4). These errors

2.5
MATS GYLLENBERG ET AL.
are on the order of 10 -8 - 1 0 .9 , and they are of this order despite the fact that we used the formula
1 - e x p ( - ~ ) = [ so' 0 < ~ < K, (6 .5) t 1 - exp( - ~ ) , ~: > K.
A direct calculation of 1 - exp(~) causes large cancellation errors for small ~ on any computer, and this is usually followed by an unexpected extinction of the predator. In (6.5), K is a compiler- and precision- dependent constant. The optimal choices for x on our computers varied in the range (0.37-0.94)x 10 -8 in double precision.
In Figure 2 we compare the solutions of systems (6.1), (6.2) (solid line) and (6.3), (6.4) (dotted line) in the case s¢ = 3.0 and , ~ = 0.5. The
¢D
1.5 O.
E 1 ,<
0.5
0 0 ;~ 4 6
exp( 1/p) (a)
-o4 0
~.3 E
"62
¢1
- -0
10
"6 6
~ 4
~ 2 o
0 0
134
4 6 exp(1/p)
(b)
0.01
® 0 e -
& ~ -0.01 e.-
--0.02
..,.""
-0.03 0 2 4 6 8 0 2 4 6 8
exp(1/p) exp(1/p)
(c) (d)
FIG. 2. Comparison of system (6.1), (6.2) (solid line) and system (6.3), (6.4) (dotted line) in the case s¢ = 3.0 and 3 r= 0.5. (a) Amplitudes of the solutions. (b) The logarithm of the period. (c) The logarithm of the dominating period (the period corresponding to the maximum of the Fourier spectrum). (d) The Lyapunov expo- nent.

OPTIMAL SUPPRESSION OF REPRODUCTION 135
amplitude increases as a parabola for system (6.1), (6.2) [solid line, panel (a)], and faster than for system (6.3), (6.4) [dotted line, panel (a)]. System (6.3), (6.4) remains quasi-periodic after the Hopf bifurcation at exp(1/p) = 3.90 [dotted line, panels (b) and (d)] as the parameter value exp(1/p) (horizontal axis) is increased. Transition into periodic and chaotic behavior as the parameter value exp(1/p) increases is observed for system (6.1)-(6.2) [solid line, panels (b) and (d)]. Some periodic solutions of (6.1), (6.2) are quite dominating--for example, the 19-peri- odic solution formed at exp (1 /p )= 5.80 and the 9-periodic solution near exp(1/p) = exp(2).
When the value of the parameter ~¢ = a m J was increased, every- thing happened faster as expected from Theorem 4.1. In Figure 3 a
25
20
E l 0
5
0 0
10
0
"6 6
==4 m & _8,2
0 . . . . i
2 4 6 8 0 2 4 6 8 exp(l/p) exp(l/p)
(a) (b)
.~6 ° ~ ¢1 Q.
E4 0
" 0
"6
o 2
0
• , J,=i
0.01
-0.01 r - ::3
~ -0.02
: .,' .
2 4 6 8 -0"030 2 4 6 exp(l/p) exp(l/p)
(c) (d)
FIG. 3. Comparison of system (6.1), (6.2) (solid line) and system (6.3), (6.4) (dotted line) in the case ,~¢ = 18.0 and 9-= 0.5. (a) Amplitudes of the solutions. (b) The logarithm of the period• (c) The logarithm of the dominating period (the period corresponding to the maximum of the Fourier spectrum). (d) The Lyapunov expo- nent.

136 MATS GYLLENBERG ET AL.
comparison between the solutions of the systems (6.1), (6.2) (solid line) and (6.3), (6.4) (dotted line) in the case ~ ' = 18.0 and ~r= 0.5 is shown. Periodic or chaotic solutions started to appear also in model (6.3), (6.4). For system (6.1), (6.2), larger periodic windows are observed in the ranges 2.20 < exp(1 /p )< 2.67 (period 44). A quite clear sequence of period doublings for system (6.3), (6.4) is observed at exp(1/p) = 6.98 (a 16-periodic solution becomes 32-periodic) and exp(1 /p )= 7.19 (the 32-periodic solution becomes 64-periodic) [dotted line, Figure 3, panels (b) and (d)]. The dominant period [panel (c)] is almost constant regard- less of period doublings and chaos.
When we decreased the value of J , the Hopf bifurcation in systems (6.1), (6.2) and (6.3), (6.4) occurred later. This was not directly to be expected from Theorem 4.1. The reason for this is that the approxima- tions used in the proof of Theorem 4.1 do not work well if 5 r is small. In Figure 4 the solutions of system (6.1), (6.2) (solid line) and (6.3), (6.4) (dotted line) in the case ~¢ = 18.0 and ~r= 0.1 are compared. No chaotic solutions were detected for the system (6.3), (6.4) [dotted line, panel (d)]. The very dominating periodic window for system (6.3), (6.4) at 3.71088 < exp(1 /p )< exp(2) has period 10. Also, system (6.1), (6.2) has a lot of periodic windows in the quasi-periodic regime, but a large 32-periodic window in the range 4.55 < exp(1/p) < 5.63 is very dominat- ing. The oscillations of (6.1), (6.2) become chaotic for the first time when /3 exceeds 6.16 here [solid line, panel (d)].
When we increased ~¢ enough, system (6.3), (6.4) started to possess chaotic solutions even if ~- was low. Figure 5 shows the situation in the case ~¢-- 21.0 and 3-= 0.1. The solution of (6.3), (6.4) becomes chaotic (after a clear period doubling 52-104-208.. .) for the first time when exp(1/p) = 4.97, and the solution of (6.1), (6.2) becomes chaotic for the first time for/3 = 5.81. A quite dominant periodic solution of period 37 was observed in the range 4.054 < exp(1/p)<5.40 for system (6.1), (6.2). Note that suppression of reproduction can cause transitions from periodic solutions or quasi-periodic solutions into chaotic solutions [panels (b)-(d)], but it will still have a stabilizing impact as measured by the mean amplitude [panel (a)] and the dominating period [panel (c)].
It is evident from these figures that suppression of reproduction generally decreases the amplitude of the oscillations and therefore has a global stabilizing effect. Another dominant feature in these results is that the adjustable strategy makes the dominating period shorter.
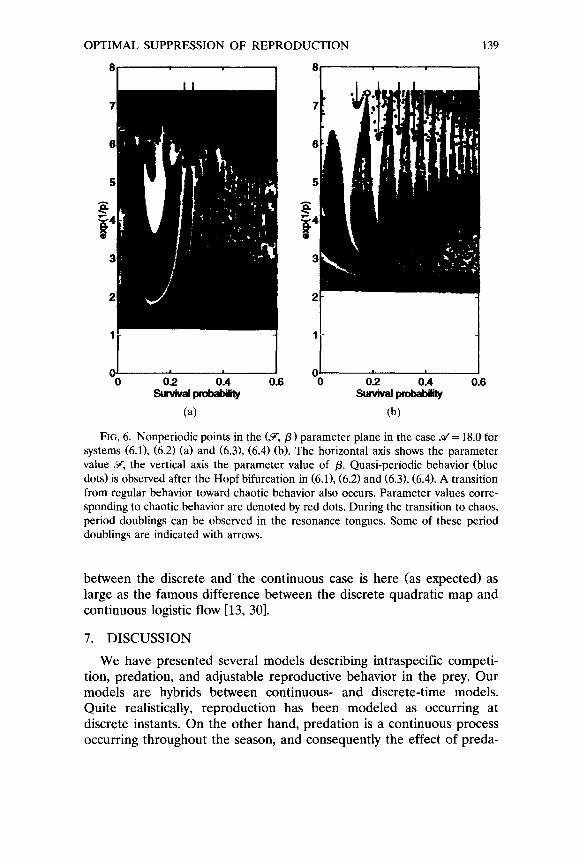
In Figure 6 are plotted the parameter values corresponding to nonperiodic behavior in the (~,, /3) parameter plane. Red is used to indicate chaotic behavior, blue to indicate quasi-periodic behavior, and no color to indicate periodic motion. The transition from regular behavior toward chaotic behavior does not occur along a well-defined

OPTIMAL SUPPRESSION OF REPRODUCTION 137
20
15 0 z3 ~.1o E
5
0 2 4 6 exp(1/p)
(a)
10
'5 6
~ 4
$ 2
0 - - 0 2 4 6
exp(l/p)
(b)
"86 . r -
qO
"6
22
- - 0 0
0.02
¢-
= 0
>e -0.02 0 C
a . ~,4.~
- J
"..'" i !"
k"
8 8 -0.0% 2 4 6 exp(1/p) exp(1/p)
(c) (d)
FIG. 4. Comparison of system (6.1), (6.2) (solid line) and system (6.3), (6.4) (dotted line) in the case .~¢ = 18.0 and 3-= 0.1. (a) Amplitudes of the solutions. (b) The logarithm of the period. (c) The logarithm of the dominating period (the period corresponding to the maximum of the Fourier spectrum). (d) The Lyapunov expo- nent.
smooth curve in the parameter plane. This scenario is easier to follow in the case of system (6.3), (6.4), Figure 6b, because the resonance tongues are larger and correspond to lower periods. The transition involves multiple attractors, period doublings in the resonance tongues, and much more. For example, in the case of (6.3), (6.4), we found coexisting 10- and ll-periodic attractors at e x p ( 1 / p ) = 7.33 and 5 r= 0.18 (black circle, Figure 6b). In the case of (6.1), (6.2), the transition is more complete, and a region with almost only chaotic behavior can be discerned, cf. Figure 6a. The plot shows the situation for ~¢ = 18.0.
The calculation of the Lyapunov exponent for system (6.3), (6.4) requires some explanation, as the system is not continuously differen- tiable. However, by Proposition 5.1(iii), the system is continuously

138 MATS GYLLENBERG ET AL.
25
20 ¢D
"~ 15 O.
2 4 6 exp(1/p) (a)
0 2 4 6 8 exp(1/p) (b)
.~6 "¢::
Eo4 '10
5
0 ,.
2
0.02
0
~-0•02 0 C - I
-0•04
~ i ~ - - ~ i i . + . , .
i ."
+.+
-0.06 0 8 ,~ 6 2 4 6
exp(1/p) exp(1/p)
(c) (d)
FIG. 5. Comparison of system (6.1), (6.2) (solid line) and system (6•3), (6.4) (dotted line) in the case .~¢= 21.0 and # -= 0.1. (a) Amplitudes of the solutions. (b) The logarithm of the period• (c) The logarithm of the dominating period (the period corresponding to the maximum of the Fourier spectrum). (d) The Lyapunov expo- nent.
differentiable almost everywhere, so in the case of quasi-periodic and complicated behavior, this discontinuity does not cause problems, be- cause the Lyapunov exponent is a mean, and the contributions from the discontinuity points to this mean are not significant• Again, in the case of periodic behavior, a periodic solution does not generically lie on the discontinuity lines, so these contributions are essential in exceptional cases only. The assumption that M > fi guarantees that the fixed points do not lie on the discontinuity lines.
Our numerical results show that the discrete predator-prey model (3.2), (3.3) captures all the dynamics of related continuous predator-prey models with density-dependent prey growth such as the Gause-type predator-prey models and much more (cf. [13, 25-29]). The difference
OPTIMAL SUPPRESSION OF REPRODUCTION
n
139
m
m
m
o ' i 0 0.2 0.4 0.6 0 0.2 0 4 0.6 S = v ~ probab~ny S = v i ~ proba~ay
(~) (b)
Fro. 6. Nonperiodic points in the (~,/3) parameter plane in the case ~¢= 18.0 for systems (6.1), (6.2) (a) and (6.3), (6.4) (b). The horizontal axis shows the parameter value J,, the vertical axis the parameter value of /3. Quasi-periodic behavior (blue dots) is observed after the Hopf bifurcation in (6.1), (6.2) and (6.3), (6.4). A transition from regular behavior toward chaotic behavior also occurs. Parameter values corre- sponding to chaotic behavior are denoted by red dots. During the transition to chaos, period doublings can be observed in the resonance tongues. Some of these period doublings are indicated with arrows.
between the discrete and the continuous case is here (as expected) as large as the famous difference between the discrete quadratic map and continuous logistic flow [13, 30].
7. DISCUSSION
We have presented several models describing intraspecific competi- tion, predation, and adjustable reproductive behavior in the prey. Our models are hybrids between continuous- and discrete-time models. Quite realistically, reproduction has been modeled as occurring at discrete instants. On the other hand, predation is a continuous process occurring throughout the season, and consequently the effect of preda-

140 MATS GYLLENBERG ET AL.
tion upon the population densities at the instants of reproduction has been obtained by integrating the corresponding continuous Lotka-Volt- erra system over the time between two reproductive events. In this paper we have chosen to model intraspecific competition using the familiar Ricker law. For a detailed description of the relation between the Ricker model and continuous intraspecific competition processes, we refer to [18].
Adaptive behavioral strategies generally have some costs associated with them that should be taken into account when considering the ultimate fitness payoff of the behavior. The adjustable reproductive behavior studied in this paper, reduced clutch size under certain conditions, does not appear to entail any such costs. On the contrary, resources not used for reproduction should remain available for other functions. An interesting additional question about the adjustments is whether they might occur with a time delay, which would have poten- tially destabilizing consequences. Though such time delays are possible, they are unlikely to occur in the case of the empirical example consid- ered in this paper--rodents exposed to intraspecific competition and predation. Breeding females are able to fine-tune their reproductive effort by resorbing embryos and possibly by selectively lactating only some of their offspring.
We assumed a specific functional form for the trade-off between the reproductive effort and competitive ability, such as is predicted by the life history theory and is empirically observed for a range of organisms [16]. In this case, selection will maximize the equilibrium population size. We have rigorously proved for the model analyzed here that the equilibrium population size will be maximized regardless of its stability. Hence, selection will not eliminate complex dynamics associated with an unstable equilibrium. For some parameter values, the winning type shows chaotic dynamics. Similar results have been obtained with other models [31].
The Ricker model has the property that the nontrivial equilibrium equals the average population size even in the case of chaotic dynamics. Thus the result mentioned above can be reformulated by saying that selection maximizes mean population size, a result that is well known from previous work [32]. This is an important observation, because in [18] we showed that if intraspecific competition is modeled as a continu- ous process during the season, then it may very well happen that the winning type has lower equilibrium density, whereas it is still true it has higher mean density. Thus even if the assumptions of continuous and discrete intraspecific competition lead to different models, both models share the property that they predict that selection maximizes mean population size.

OPTIMAL SUPPRESSION OF REPRODUCTION 141
The key result for the models analyzed in this paper is generally stabilizing effect of optimal reproductive adjustments. In the single- species competition model this stabilizing effect is apparent in reduced mean amplitude of population oscillations. In the predator-prey model, optimal reproductive behavior of the prey may have a more striking effect, by transforming a periodic solution to a fixed point. Chaotic dynamics may become transformed to periodic or quasi-periodic dynam- ics by optimal reproductive suppression, but the reverse may also occur (Figures 5 and 6), though in all cases stability as measured by the mean amplitude is increased. In the case of pure predator-prey oscillations (cf. Section 3), our numerical results demonstrated a decrease in the dominant period of oscillations in the presence of adjustable reproduc- tive behavior.
It is in general difficult to determine periods and Lyapunov expo- nents from short and noisy empirical time series, and our results show that optimal adjustment of reproduction does not affect these quantities in a clear-cut way. Regardless of the dynamics, dominating periods and mean amplitudes are easy to determine from observations, and these quantities are expected to be negatively correlated to optimal adjust- ment of reproduction.
Prey types capable of optimally suppressing their reproduction gener- ally outcompete types that lack such flexibility, and this will generally increase stability, but the Lyapunov exponent of the dynamics of the winning type may be less or greater than the Lyapunov exponent of the other types.
The empirical results for microtine rodents from Fennoscandia sug- gest that suppression of reproduction is stronger in the northern popu- lations with a fairly regular high-amplitude cycle than in the more stable southern populations [3]. This observation is consistent with the present results: Reproductive adjustment is not expected when the equilibrium point is stable, because then nothing is to be gained by delaying reproduction. Our results suggest that the observed behavioral re- sponses of voles to risk of predation in the high-amplitude northern populations are not the cause of the oscillations, but in contrast the oscillations occur in spite of the potentially stabilizing behavioral re- sponses.
8. PROOFS
If a map w ~ w' is defined in R k, then the (forward) orbit of w0 obtained by iterating the map starting at w 0 is denoted by {wn}~= 0. The components are indexed correspondingly--for example, wn--(x,, Yn) for orbits in R 2.

142 MATS GYLLENBERG ET AL.
Proof of Proposition 2.1. We first notice that it follows from our assumptions that every orbit is bounded. Next observe that
(X') 1/k' /31/klexp(--E)xl/kl /3:/k'[xl/k, I ( y,) l/kz = /3g/k:exp( _ E) yl/k2 = /3~/k2 ~ y--i7-~2 1"
If x* > y*, that is, if l og /31 /k l > log /32/k2, then 1/kl 1/k2 xn / Yn tends to infinity in a geometrical progression as n tends to infinity. Since all orbits are bounded, this is possible only if yn tends to zero. The conclusion for the reverse inequality is proved in an identical way. •
Proof of Proposition 2.2. For every E ~ R+, the continuous function
~be(/3) : = / 3 e x p [ - k ( / 3 ) E ]
attains its maximum in the compact interval (0, M]. As ¢e is positive and Ce(0) = 0, the maximum is in fact attained in (0, M]. If it is attained at /3 ~ (0, M), then
~k( / 3 ) = [ 1 - /3k'( / 3 )E]exp[ - k ( /3)E] =O. (8.1)
Equation (8.1) holds if and only if
1 x ( / 3 ) := o - - - - - - - - r = e . ( 8 . 2 )
]pil k ' (
It follows from (B.III) that g is strictly decreasing on (0, ~) and hence Equation (8.2) can have at most one solution in (0, M). This proves (i).
If E <~ 1 /Mk ' (M) , then Equation (8.2) has no roots in (0, M), and hence ~b e attains its maximum at the endpoint /3 = M. If this is not the case, then by (i) the maximum is attained in (0, M). It follows in particular that lim e _~ 0+ X(/3) =~ . Thus,
~ ( E ) = M if0 < E < 1 / M k ' ( M ) ,
(8.3) X-I( E) if 1 /Mk ' ( M) < E <co.
All the assertions of (ii) except formula (2.8) follow from (8.3). But by (B.II), /3 is the unique zero of the derivative of the function /3 ,--, log( /3 ) /k ( /3 ) and using this fact one easily shows that (2.8) holds.
Finally we note that the X-1 is continuously differentiable and hence /3 is continuously differentiable except possibly at E -- M by (8.3). This proves (iii). •

OPTIMAL SUPPRESSION OF REPRODUCTION 143
Proof of Theorem 2.3. The inequality (2.10) follows immediately be- cause 0 </3 < M. If Yn/xn ---, oo, then the to-limit set is a subset of the y axis because every orbit is bounded. On the other hand, if y~/x n tends to a positive real value C, then
and
/3(x + y) =/3 (8.4)
y = C x (8.5)
for all (x, y) ~ to(P). By (8.4) and Proposition 2.2(ii), we have
0 < x + y < l o g ( f l ) / k ( ~ ) (8.6)
for all (x, y ) ~ to(P). [The latter inequality in (8.6) is an equality if f l<M. ]
It follows from (8.4) that we can add the two first equations in model (2.7) (this operation is valid in the corresponding ~l imit set) and arrive at
( x + y ) ' = B ( x + y ) e x p [ - k ( ~ ) ( x + y ) ] . (8.7)
The map (8.7) is equivalent to the map (2.11), so the only subset of the domain defined by (8.6) that can be an to-limit set is the segment
x + y=log( f l ) / k ( fl). (8.8)
Thus every point in to(P) satisfies both (8.5) and (8.8), and thus to(P) consists precisely of the unique point of intersection between the straight lines (8.5) and (8.8). •
Proof of Theorem 4.1. To facilitate the analysis we perform the linear change of variables
~"= k( /3 )x , (8.9)
. ~ = [k( ~)/mar]z (8.10)
and introduce the new parameters
d = am,~,
~ - - 1-~r .
(8.11)
(8.12)

144 MATS GYLLENBERG ET AL.
Equations (3.2) and (3.3) then take the form
o/,, = ,~/3 exp( - ~ - ac'.U),
.2" = [ 1 - exp( - ~ ' 2 " ) ] ~ + ,gr~'.
(8.13)
(8.14)
We calculate the location of the interior fixed points, if some exist. From the prey equation we get
log/3 = ~ + ag.2", (8.15)
and from the predator equation we get
.~.2" y = 1 - exp( - a¢-2"). (8.16)
One can show that system (8.15), (8.16) has a unique solution (~'*, 2"*) [except the solution (log(/3), 0)] and that the solution of (8.16) defines a concave function .2" = ,U(~). It is important to note that the solution of system (8.15), (8.16) satisfies ~ < log(/3) < 2, .@/a t < ~ "* [put a¢.2"* > 1 - e x p ( - a e . ~ * ) in (8.16)], ~ * / ~ > .2"* [put 1 > 1 -exp ( - a¢ .~ ' * ) in (8.16)], and .g'* > (~* - _ ~ / a e ) / . ~ [the estimate
1 - e ~ ( - ~ ) > - - at.g"
1 + ag.~
can be substituted in (8.16)]. As these inequalities are important and will be used later, we give names to them according to
_~/a¢ < ~'* < 2, (8.17)
< < - - ( 8 . 1 8 ) .,~ ~ . ~ "
The characteristic equation of the Jacobian of system (8.14) calcu- lated at the unique fixed point (~'*, .~'*) in the interior of the state space is a quadratic equation. Denote the coefficients by p and q, as in h 2 + p h + q = 0. We shall then prove that - 1 + [pl < q < 1 when 0 <ag <~" and - 1 + [p[ < q when a e > ~ . As (~*, .2"*) can lose its stability
only if h 1 h a = 1, and at least one eigenvalue has to have modulus 1 in a bifurcation point, both eigenvalues have to be either 1 or - 1 if they are real.

O P T I M A L S U P P R E S S I O N O F R E P R O D U C T I O N 145
We proceed by calculating the Jacobian of system (8.14) in (~'*, .~*) and arrive at
1 - , ~ ' * - a¢2~'*
J(~W*, .2"*) = ag~ ' 1 - ~ +.~rJ •
The characteristic polynomial is given by ~ 2 _ Tr J ( ~ ' , .2"*)h + det J(,~*, .U*), so we have to require
- 1 - T r J(~. o'*, .2"*) < det J(~ '*, .U*), (8.19)
- 1 + Tr J(~ '*, _2"*) < det J(~ '*, _2"*), (8.20)
det J(~+*, .2"*) < 1, (8.21)
for local stability. We have
Tr J(~ '*, .~o-,) = 1 - ~ + a¢~W* - a¢~.~ * + 9-, (8.22)
det J ( ~ , .2"*) = action'* + 9 - a¢~-2 + ae~W* ~.2"* - o ~ ' . (8.23)
We start by proving inequality (8.19). We substitute expressions (8.22) and (8.23) and get
- 1 - 1 + ~ - a ¢ ~ - a ¢ ~ * - 3 - < a g ~ ~'*
+ o GK- ,3~¢,~ 2 + ,,W',~...~..~* -- oq~'*.
(8.24)
Inequality (8.24) is equivalent to
- 2 - 2,9r+ ~ - 2a¢~W* + ~ + d Y .2 + a¢~.2"* - ae~W*~.~v'* < O.
(8.25)
We show first that (8.25) holds if ,W* > 1. We show this by the following series of inequalities.
- 2 - 2 a t + ~ - 2 4 ¢ ~ ~* + ~ * + , ~ / , ~ 2 -'F ~ 1 . . ~ . . ~ * - - . 5~¢ ,~ . , ~r .~ *
< max( - 1 - ~ r - a¢, 0) + (1 - ~ ' ) a ¢ ~ . U * < 0. (8.26)
The first inequality in (8.26) holds because -2 -2 - -5 r+~ ~'* -2a¢'~ a~* + + a¢~'* 2 is a convex function of ~ * and 1 < ~ < log(/3) < 2.

146 MATS GYLLENBERG ET AL.
If 0 < ~ < 1, we show tha t the inequal i ty (8.25) holds by the follow- ing ser ies o f inequal i t ies
- 2 - 2 S t + ~ * - 2 a ~ * + ~ + a 2 ~.2 + a ~ . 2 " * - a , ~ * ~ . 2 " *
< - 2 - 2 5 r + 2~* - 2 a ~ * + ~ + a~o ~.2 + a ~ * - a ~ ~.2
< - 2 - 2 5 r + ~ * - a2~* + 5~g~ *
< max( - 2 - 2 ~ , - 1 - 5 r - a ) < 0. (8 .27)
The first inequal i ty in (8.27) holds because .2"* < ~ ' * / ~ . W e cont inue with inequal i ty (8 .20) . W e s u b s t i t u t e ( 8 . 2 2 ) a n d ( 8 . 2 3 )
a n d g e t
- 1 + 1 - ~ * + a ~ ' * - a ~ . 2 " *
+~<, .~ ' ,~ '* +,;,~'---,3~¢',~ 2 -[",3~4,~.~..~ "* --,~¢* + . ~ . ( 8 . 2 8 )
Inequa l i ty (8.28) is equiva len t to
- a ~ A r* + a ~ ~.2 - a ~ * . ~ . 2 " * - . ~ < O. (8 .29)
W e prove that (8.29) holds using tha t .2"* > ~ ' * / ~ - l / a , cf. (8.18). W e get
- a ~ . 2 " * + a ~ ~.2 - a ~ * . ~ . ~ * -
1 < - a . ~ ( 2 ~ * + l ) ( ~ a ) + a ~ * 2 -
< - a ~ 2 + ~ * - a , ~ * + . ~ + a ~ 2 _
< - a ~ + . ~ < 0. (8 .30)
The last inequal i ty in (8.30) holds because ~ > ~ / a , of. (8.17). Final ly, we wan t to f ind condi t ions implying (8.21), tha t is,
a £ ~ ' - ~ - a A '¢.2 + a~.¢*~.2"* - ~ * < 0
or
1 1 5 r 2 ;* ~* ~ + F(W*). < a ~ * ~ ~-~ ~ - =

OPTIMAL SUPPRESSION OF REPRODUCTION 147
The function F(~ '~) is convex and the curve determined by (8.16) was concave; hence they can intersect at most twice. If 0 < ~¢ < ~ , they do not intersect at all because
F ( ~ ) = ~ + ~ + ~ - > - ~ - .
Again, if s¢ > 5 r, these curves intersect once, because of their asymptotic behavior. They intersect in the fixed point (,~*, .2"*), corresponding to the parameter value/3", and the theorem follows. •
Proof of Theorem 5.2. Because M >/3 we get
yl x' >~ y
If y , / x , -00% then the ~limit set is a subset of the yz plane, because every orbit is bounded..Again, if Y n / x , tends to some nonnegative real value, then we have /3=/3, y / x = C , and 0 < C < o o in ~o(P). By Proposition 5.1(ii) we get x + y + az = log( ~ ) / k ( ~ ) in o~(P), so ~o(e) is a subset of the solution to
y / x = C , 0 < C < ~ ,
x + y + a z = l o g ( ~ ) / k ( ~ ) , (8.31)
which is a straight line in R 3 . As system (5.2) restricted to this line is equivalent to system (3.2), (3.3), we conclude that all the points except the fixed points on this line, are mapped to points outside this line; cf. the beginning of the proof of Theorem 4.1. Hence, ~o(P) consists of a single point. •
Proof of Theorem 5.3. We start by performing the transformations = z / m g r and a¢= am3 r in systems (5.1) and (5.4), respectively. We
get
exp[- ( ÷
~" = {1- exp[- k(~)~'C ] }x + s~C (8.32/
and
y ' = y~ exp[ - k ( /3 ) (y + .~¢~" )],
~"= ( 1 - e x p [ - k(/3 )rig" ]}y + 3r~, (8.33)

148 MATS GYLLENBERG El ' AL.
respectively, where/3 is as defined by (5.3). Using the fact that k(/3) --- /3P, we observe that /3 = exp(1/p). The map corresponding to (8.32) is therefore given by
x '= xexp(1 /p) exp[ - e( x + s¢~ )], ~" = [ 1 - exp( - e.~¢~" )] x + .gr~ " , (8.34)
and the map corresponding to (8.33) is given by
' yMexp[ - MP( y + ..~'~ )], y + .~" < 1 /pM p, y'-~.
y[pe(y+s¢()] -1/p, y+ , .~ ' (> l /pM p,
{ [1-exp( - MP~cT~ ) ] y + Sr~,
~ ' ~ ) ]y +9-if, ~"= [X-exp( p(y+.~¢~
(8.35a)
y + st~ < 1 /pM p,
y +~¢~ > 1 /pM p,
(8.35b)
Using the new coordinates .~ = e~', ~" = e.x, and ~ = ey, respectively, we can simplify Equations (8.34) and (8.35) to
,~' =,~exp(1/p) exp( - , ~ - ~ Z ) , Z ' = [ 1 - e x p ( - ~ Z ) ] ~ " +..~'-~, (8.36)
and
e ~ + .a¢.~ < pM e '
e ,~ + ~'.~ > - - pM p '
~ , + ~¢'.~ <
(8.37a)
e
pM p '
e
pM p •
(8.37b)
Because M > exp(1/p), we have to compare the stability properties of the map
,~' = ,~ [ p ( ~ ' ~ + ,.~'.2") ] -I/p, (8.38a)
Z ' = [ 1 - e x p ( p(,~+,a¢..~)'~'~" ) ] ~ + . ~ (8.38b)

OPTIMAL SUPPRESSION OF REPRODUCTION 149
with stability proper t ies of the map (8.36) (compare the p roof of T h e o r e m 4.1).
Note that (~¢'*, .2"*) satisfies
+ ~'..~* = 1 / p ,
.~.2"*/~ q~* = 1 - exp( - ~¢.~'*).
Let J * ( ~ * , ~ * ) be the Jacobian of system (8.38) calculated at (~'*, ~ * ) . We get
J * ( ~ , .~*)
= . ~ . 2 " * ~'* p~¢~.~,_~, + p.~v,~.~,2 ~ ¢ p ~ 2 _ ~ ¢ p ~ , , . ~ , + ~- •
We have
T r J * ( ~ , .U*) = 1 - ~ ' * + ~q~-+ ,aCp,~ ¢'.2 - ~ ¢ p ~ ' * . ~ * , (8.39)
det J * ( ~ * , .~'*) = d p ~ .2 - ~¢p~g'*.2"* + ~ r _ ~¢~e~, 2
+ ~ ¢ ~ ' * . U * - 5 ~ ¢* + ~¢~.2"*. (8.40)
To complete the p roof we have to show that
- 1 - T r J * ( ~ ~*, .~*) < det J * ( ~ , .2"*), (8.41)
- 1 + T r J * ( ~ ¢*, .2"*) < det J(~,q¢*, _~'*), (8.42)
det J * ( ~ -~¢*, .~*) < det J ( g ' * , .~*) . (8.43)
W e prove first that (8.41) holds. We substitute (8.39) and (8.40) and arrive at
- 2 + ~ - Z9 r - 2.aCpa~ ~'.2 + 2 ~ p ~ e * . 2 "* + ,~¢~2 _ . . ~ , ~ . . ~ *
+ ~ ¢ * - ~ s ¢ ~ < o. ( 8 . 4 4 )
Inequali ty (8.44) holds because of the following series of inequalities.
- 2 + ~ * - 25 r - 2~¢'p~W* 2 q_ 2sOp ~ ' * _ 2 " * +~¢~¢, 2 -_@~¢~'*.2" * + ~ * - ~ ¢ . 2 "
= - 2 + ~ * - 2,9 r - 2 . , q ¢ ~ 2 .~_~,~ 2 ..[_~¢,* _~rj~c~_l..~f~,~,* ( 2 p _ 1).2"*
< - 2 +,~'* - 2.9 r - 2~¢p~¢, 2 +~¢~q~, 2 +,9~W* -~,ac.U* +.~¢~¢, 2 ( 2 p - 1)
= - 2 + ~ - 2 ~ + ~ - ~ ¢ . ~ *
< rain( - 2 - 2~ , 0) - ~ ¢ ~ * < 0.

150 MATS GYLLENBERG ET AL.
We assumed basically that 0 < ~ / d <,~* < 1/p < 2 and .~* < g ~ * / ~ . To prove (8.42) we show that
~'~W .2 - -q~ - d ~ . 2 " * < 0. (8.45) P
Inequality (8.45) holds because of the following series of inequalities.
~ , ~ , 2 _ _q~,,, _ ~¢.2" * - , ~ . ~ ' 2 " *
< .~¢~ 2 _ . ~ , _ ~.~¢~., _ s , ¢ ~ , ( ~ 1 )
= - .~.~..~* < O.
Finally, we substitute (8.23) and (8.40) in (8.43) and get
.~p ,~ 2 _ ,~ 'p~.2"* + ~¢'_~.2"* - ,a¢~ < O. (8.46)
Inequality (8.46) holds because of the following series of inequalities.
= ~¢p,~2 + d . ~ . ~ , p ( 1 _ ~ ) - ~¢£~,
1 _~.~,) - ~ * = O. < ..qe,p,..~, 2 + Nf~qr,,p ( ~
We have used the estimates 1/p>2"* and . ~ * < ~ * / d here. The proof is complete. •
Remark 8.1. Note that system (8.38) is not a reasonable predator-prey model in the state space R 2, because the net reproduction number of the prey (~) tends to infinity as both the prey and predator densities tend to zero. System (8.38) is used solely as a tool in the proof of Theorem 5.3 and lacks biological interpretation.
This work was supported in part by the Bank of Sweden Tercentenary Foundation, the Royal Swedish Academy of Sciences, FRN, and the Wallenberg foundation. A large part of this work was done during Torsten Lindst~m's stay at IIASA (International Institute for Applied Systems Analysis, Laxenbur~ Austria), at the Department of Mathematics, Univer- sity of Turku, Finland, and at the Department of Zoology, University of

OPTIMAL SUPPRESSION OF REPRODUCTION 151
Helsinki, Finland. Generous support in the form of computer time from SDCN is gratefully acknowledged. We thank Horst Thieme and Odo Diekmann for valuable comments on an earlier version of the manuscript and Sven Oberg for helpful discussions concerning the numerical work presented here.
REFERENCES
1 S. L. Lima and L. M. Dill, Behavioural decisions made under the risk of predation: a review and prospectus, Can. J. Zool. 68:619-640 (1990).
2 H. Y1fnen and C. Magnhagen, Eds., Predation risk and behavioural adaptations of prey: ecological and evolutionary consequences, Ann. Zool. Fenn. 29:177-320 (1992).
3 J. Heikkil~i, K. Kaarsalo, O. Mustonen, and P. Pekkarinen, Influence of preda- tion risk on early development and maturation in three species of Clethrionomys voles, Ann. Zool. Fenn. 30:153-161 (1993).
4 C. Magnhagen, Reproduction under predation risk in the sand goby, Po- matoschistus minutus, and the black goby, Gobius niger: The effect of age and longevity, Behav. Ecol. Sociobiol. 26:331-335 (1990).
5 C. Magnhagen, Predation risk as a cost of reproduction, Trends Ecol. Evol. 6(6):183-186 (1991).
6 C. Magnhagen, Parental care and predation in fish, Ann. Zool. Fenn. 29:227-232 (1992).
7 H. Yl6nen, Weasels Mustela nivalis suppress reproduction in cyclic bank voles Clethrionomys glareolus, OIKOS 55(1): 138-140 (1989).
8 I. Hanski, P. Turchin, E. Korpim~iki, and H. Henttonen, Population oscillations of boreal rodents: regulation by mustelid predators leads to chaos, Nature 364:232-235 (1993).
9 A. Ives and A. P. Dobson, Antipredator behavior and the population dynamic of simple predator-prey systems, Am. Nat. 130:431-447 (1987).
10 M. Mangel and B. D. Roitberg, Behavioral stabilization of host-parasite popu- lation dynamics, Theor. Popul. Biol. 42:308-320 (1992).
11 W.E . Ricker, Stock and recruitment, J. Fish. Res. Board Can. 11(5):559-623 (1954).
12 A . J . Nicholson and V. A. Bailey, The balance of animal populations. Part I, Zool. Soc. (Lond.) Proc. 3:551-598 (1935).
13 H. I. Freedman, Deterministic Mathematical Models in Population Ecology, Marcel Dekker, New York, 1980.
14 M. W. Hirsch and S. Smale, Differential Equations, Dynamical Systems, and Linear Algebra, Academic, New York, 1974.
15 R.A. Fisher, The Genetical Theory of Natural Selection, Clarendon Press, Oxford, 1930.
16 S.C. Steams, The Evolution of Life Histories, Oxford Univ. Press, Oxford, 1992. 17 L.S. Block and W. A. Coppel, Dynamics in One Dimension (Lect. Notes Math,
1513) Springer-Verlag, Berlin, 1992. 18 M. Gyllenberg, I. Hanski, and T. Lindstr6m, Continuous versus discrete single
species population models, Res. Rep. A6, Univ. Turku, Inst. Applied Mathemat- ics, 1994.

152
19
20
MATS GYLLENBERG ET AL.
M. G. Neubert and M. Kot, The subcritical collapse of predator populations in discrete-time predator-prey models, Math. Biosci. 110:45-66 (1992). P. Brunovski, One-parameter families of diffeomorphisms, in Symposium on Differential Equations and Dynamical Systems, Univ. Warwick, 1969, (Lect. Notes Math. 206), D. Chillingworth, Ed., Springer-Verlag, New York, 1971, pp. 29-32.
21 H.A. Lauwerier, Two-dimensional iterative maps, in Chaos, A. V. Holden, Ed., Manchester Univ. Press, 1986, pp. 58-95.
22 D. Whitley, Discrete dynamical systems in dimensions one and two, Bull. Lond. Math. Soc. 15:177-217 (1983).
23 H.A. Lauwerier and J. A. J. Metz, Hopf-bifurcation in host-parasitoid models, IMA J. Math. Appl. Med. Biol. 6:191-210 (1986).
24 D.G. Aronson, M. A. Chory, G. R. Hall, and R. P. McGehee, Bifurcations from an invariant circle for two-parameter families of maps and plane: a computer assisted study, Commun. Math. Phys. 83:303-354 (1982).
25 G .F . Gause, The Struggle for Existence, Williams & Wilkins, Baltimore, 1934. 26 G.F . Gause, N. P. Smaragdova, and A. A. Witt, Further studies of interaction
between predator and prey, J. Animal Ecol. 5:1-17 (1936). 27 Y. Kuang, Nonuniqueness of limit cycles of Gause-type predator-prey systems,
Appl. Anal 29:269-287 (1988). 28 Y. Kuang, Global stability of Gause-type predator-prey systems, J. Math. Biol.
28:463-474 (1990). 29 Y. Kuang and H. I. Freedman, Uniqueness of limit cycles in Gause-type
predator-prey systems, Math. Biosci. 88:67-84 (1988). 30 R. Devaney, An Introduction to Chaotic Dynamical Systems, Addison-Wesley,
Reading, MA, 1989. 31 J .A.J . Metz, R. M. Nisbet, and S. A. H. Geritz, How should we define 'fitness'
for general ecological scenarios, Trends Ecol. Evol. 7(6):198-202 (1992). 32 B. Charlesworth, Evolution in Age-Structured Populations, Cambridge Univ.
Press, Cambridge, 1980.
Related Documents