RESEARCH Open Access Array-based comparative genomic hybridization for genomic-wide screening of DNA copy number alterations in aggressive bone tumors Masahiko Kanamori 1,2* , Akimi Sano 2 , Taketoshi Yasuda 2 , Takeshi Hori 2 and Kayo Suzuki 2 Abstract Background: The genetic pathways of aggressive changes of bone tumors are still poorly understood. It is very important to analyze DNA copy number alterations (DCNAs), to identify the molecular events in the step of progression to the aggressive change of bone tissue. Methods: Genome-wide array-based comparative genomic hybridization (array CGH) was used to investigate DCNAs of 14 samples from 13 aggressive bone tumors, such as giant cell tumors (GCTs) and osteosarcoma (OS), etc. Results: Primary aggressive bone tumors had copy number gains of 17.8±12.7% in the genome, and losses of 17.3 ±11.4% in 287 target clones (threshold for each DCNA: ≦085, 1.15≦). Genetic unstable cases, which were defined by the total DCNAs aberration ≧30%, were identified in 9 of 13 patients (3 of 7 GCTs and all malignant tumors). High-level amplification of TGFβ2, CCND3, WI-6509, SHGC-5557, TCL1A, CREBBP, HIC1, THRA, AFM217YD10, LAMA3, RUNX1 and D22S543, were commonly observed in aggressive bone tumors. On the other hand, NRAS, D2S447, RAF1, ROBO1, MYB, MOS, FGFR2, HRAS, D13S319, D13S327, D18S552, YES1 and DCC, were commonly low. We compared genetic instability between a primary OS and its metastatic site in Case #13. Metastatic lesion showed increased 9 DCNAs of remarkable change (m/p ratio ≧1.3 folds), compared to a primary lesion. D1S214, D1S1635, EXT1, AFM137XA11, 8 M16/SP6, CCND2, IGH, 282 M15/SP6, HIC1 and LAMA3, were overexpressed. We gave attention to HIC1 (17p13.3), which was common high amplification in this series. Conclusion: Our results may provide several entry points for the identification of candidate genes associated with aggressive change of bone tumors. Especially, the locus 17p11-13 including HIC1 close to p53 was common high amplification in this series and review of the literature. Keywords: Osteosarcoma, Giant cell tumor, Bone tumors, Microarray, Comparative genomic hybridization Background The development and progression of aggressive bone tumor is a multi-step process. The acquisition of chromo- somal abnormalities in tumor cells and a series of genetic alterations occurring over the life-time of the tumor are one of the central events in malignant transformation or aggressive change. Multiple studies have identified the prevalence and clinical significance of a various genetic markers in primary bone tumors [1,2]. However, the ge- netic pathways of aggressive changes of bone tumors are still poorly understood. It is very important to analyze DNA copy number alterations (DCNAs), to identify the molecular events in the step of progression to the aggres- sive change of bone tissue. Metaphase comparative genomic hybridization (meta- phase CGH) enabled us to detect DCNAs on whole chro- mosomes [3,4]. But the resolution of metaphase CGH is approximately 2 Mb for amplifications and 10 - 20 Mb for deletions. Advances in mapping resolution using array- based CGH (array CGH), have greatly improved resolving power in comparison to metaphase CGH, and provide more details regarding both the complexity and exact location of genomic rearrangements leading to DCNAs [5,6]. Thereafter, array CGH technologies for identifying * Correspondence: [email protected] 1 Department of Human Science, University of Toyama, 2630 Sugitani, Toyama city, Toyama 930-0194, Japan 2 Department of Orthopaedic Surgery, University of Toyama, 2630 Sugitani, Toyama city, Toyama 930-0194, Japan © 2012 Kanamori et al.; licensee BioMed Central Ltd. This is an Open Access article distributed under the terms of the Creative Commons Attribution License (http://creativecommons.org/licenses/by/2.0), which permits unrestricted use, distribution, and reproduction in any medium, provided the original work is properly cited. Kanamori et al. Journal of Experimental & Clinical Cancer Research 2012, 31:100 http://www.jeccr.com/content/31/1/100

Welcome message from author
This document is posted to help you gain knowledge. Please leave a comment to let me know what you think about it! Share it to your friends and learn new things together.
Transcript
Kanamori et al. Journal of Experimental & Clinical Cancer Research 2012, 31:100http://www.jeccr.com/content/31/1/100
RESEARCH Open Access
Array-based comparative genomic hybridizationfor genomic-wide screening of DNA copy numberalterations in aggressive bone tumorsMasahiko Kanamori1,2*, Akimi Sano2, Taketoshi Yasuda2, Takeshi Hori2 and Kayo Suzuki2
Abstract
Background: The genetic pathways of aggressive changes of bone tumors are still poorly understood. It is veryimportant to analyze DNA copy number alterations (DCNAs), to identify the molecular events in the step ofprogression to the aggressive change of bone tissue.
Methods: Genome-wide array-based comparative genomic hybridization (array CGH) was used to investigate DCNAsof 14 samples from 13 aggressive bone tumors, such as giant cell tumors (GCTs) and osteosarcoma (OS), etc.
Results: Primary aggressive bone tumors had copy number gains of 17.8±12.7% in the genome, and losses of 17.3±11.4% in 287 target clones (threshold for each DCNA: ≦085, 1.15≦). Genetic unstable cases, which were defined bythe total DCNAs aberration ≧30%, were identified in 9 of 13 patients (3 of 7 GCTs and all malignant tumors). High-levelamplification of TGFβ2, CCND3, WI-6509, SHGC-5557, TCL1A, CREBBP, HIC1, THRA, AFM217YD10, LAMA3, RUNX1 andD22S543, were commonly observed in aggressive bone tumors. On the other hand, NRAS, D2S447, RAF1, ROBO1, MYB,MOS, FGFR2, HRAS, D13S319, D13S327, D18S552, YES1 and DCC, were commonly low. We compared genetic instabilitybetween a primary OS and its metastatic site in Case #13. Metastatic lesion showed increased 9 DCNAs of remarkablechange (m/p ratio ≧1.3 folds), compared to a primary lesion. D1S214, D1S1635, EXT1, AFM137XA11, 8 M16/SP6, CCND2,IGH, 282 M15/SP6, HIC1 and LAMA3, were overexpressed. We gave attention to HIC1 (17p13.3), which was common highamplification in this series.
Conclusion: Our results may provide several entry points for the identification of candidate genes associated withaggressive change of bone tumors. Especially, the locus 17p11-13 including HIC1 close to p53 was common highamplification in this series and review of the literature.
Keywords: Osteosarcoma, Giant cell tumor, Bone tumors, Microarray, Comparative genomic hybridization
BackgroundThe development and progression of aggressive bonetumor is a multi-step process. The acquisition of chromo-somal abnormalities in tumor cells and a series of geneticalterations occurring over the life-time of the tumor areone of the central events in malignant transformation oraggressive change. Multiple studies have identified theprevalence and clinical significance of a various geneticmarkers in primary bone tumors [1,2]. However, the ge-netic pathways of aggressive changes of bone tumors are
* Correspondence: [email protected] of Human Science, University of Toyama, 2630 Sugitani,Toyama city, Toyama 930-0194, Japan2Department of Orthopaedic Surgery, University of Toyama, 2630 Sugitani,Toyama city, Toyama 930-0194, Japan
© 2012 Kanamori et al.; licensee BioMed CentCommons Attribution License (http://creativecreproduction in any medium, provided the or
still poorly understood. It is very important to analyzeDNA copy number alterations (DCNAs), to identify themolecular events in the step of progression to the aggres-sive change of bone tissue.Metaphase comparative genomic hybridization (meta-
phase CGH) enabled us to detect DCNAs on whole chro-mosomes [3,4]. But the resolution of metaphase CGH isapproximately 2 Mb for amplifications and 10 − 20 Mb fordeletions. Advances in mapping resolution using array-based CGH (array CGH), have greatly improved resolvingpower in comparison to metaphase CGH, and providemore details regarding both the complexity and exactlocation of genomic rearrangements leading to DCNAs[5,6]. Thereafter, array CGH technologies for identifying
ral Ltd. This is an Open Access article distributed under the terms of the Creativeommons.org/licenses/by/2.0), which permits unrestricted use, distribution, andiginal work is properly cited.
Kanamori et al. Journal of Experimental & Clinical Cancer Research 2012, 31:100 Page 2 of 7http://www.jeccr.com/content/31/1/100
target molecules developed to permit for the identificationof genes involved in tumors [3,4].In this study, we investigated DCNAs of human
aggressive bone tumors using the technique of arrayCGH. The quantitative measurement of DCNAs acrossthe genome may facilitate oncogene identification, andmight also be used for tumor classification.
Materials and methodsTumor tissue specimens and DNA extractionFourteen bone tumor samples were collected from 13patients with aggressive bone tumors and frozen untiluse. Samples from 7 giant cell tumors (GCTs), 5 osteo-sarcoma (OS) and 1 chondrosarcoma, were obtainedfrom the surgical- or biopsied specimens at the Univer-sity Hospital of Toyama (Table 1). Patients consisted of6 men and 7 women with an average age of 32.9 yearsold (range, 7–65 years). No cases had been received thechemotherapy before the sampling. This study protocolwas approved by the Institutional Review Board forHuman Use at the University Hospital of Toyama.Tumor specimens were stored frozen at −80°C until
use. Genomic DNA was isolated from the tumor accor-ding to standard procedures using proteinase K diges-tion and phenol-chloroform extraction [7].
Hybridization and analysis of array CGHHybridization and analysis of array CGH were performedaccording to the manufacture’s protocols (Vysis-AbbottJapan Inc., Tokyo, JAPAN). The array CGH consisted of287 clones containing important tumor suppressor and
Table 1 Clinicopathologic data on the samples in genomic ar
Cases Age Gender* Diagnosis**
1 16 F GCT
2 16 F GCT
3 18 M GCT
4 21 M GCT
5 25 M GCT
6 41 F GCT
7 55 M GCT
8 47 F chondrosarcoma
9 7 F OS
10 41 M OS
11 58 F OS
12 65 F OS
13a 18 M OS (primary)
13b OS (metastasis)
*Gender; F: female, M: male.**Diagnosis; GCT: giant cell tumor, OS: osteosarcoma.***Follow-up; m: month, y: year.****Recurrence: The number means operation times due to the recurrences.*****NED: no evidence of disease, AWD: alive with disease, DOD: dead of disease.
oncogene loci. Each tumor DNA sample was labeled andhybridized to microarrays for CGH. One hundred nano-gram of tumor DNA was labeled by random priming withfluorolink cy3-dUTP (Perkin-Elmer Life Sciences, Inc.,Boston, MA, USA), and normal reference DNA waslabeled in the same fashion with cy5-dUTP. Then, thetumor and control DNAs were mixed with Cot-1 DNA(Vysis-Abbott Japan Inc), precipitated, and re-suspendedin microarray hybridization buffer containing 50% forma-mide. The hybridization solution was heated to 80°C for10 min to denature the DNA, and then was incubated for1 h at 37°C. Hybridization was performed for 72 h in amoist chamber, followed by post-hybridization wash in 50%formamide/2xSSC at 45°C. Slides were mounted in phos-phate buffer containing 4', 6-diamidino- 2-phenylindole(array DAPI solution). Fluorescence intensity images wereobtained from the hybridized microarray slides usingGenoSensor Reader System equipped with Array 300 Soft-ware (Vysis-Abbott Japan Inc.) according to the manufac-ture’s instructions. The total intensity and the intensityratio of the two dyes for each spot were automatically cal-culated [7,8].
Evaluation of array CGHThe diagnostic cut-off level representing gains and lossesof DCNAs was set to 1.15 (upper threshold) and 0.85(lower threshold), respectively [7,8]. The p value is theprobability that the data value for an individual set oftarget spots is part of the normal distribution. All ratioswere filtered by p values, and only those samples with p
ray analysis
Follow-up*** Recurrence**** Outcome*****
9y none NED
12.5y 1 NED
11.2y 1 NED
11y none NED
12.3y none NED
20.6y 2 AWD
16.2y 2 AWD
20y none NED
4y metastasis (+) DOD
9 m metastasis (+) DOD
20y none NED
6 m metastasis (+) DOD
4 m metastasis (+) DOD
Kanamori et al. Journal of Experimental & Clinical Cancer Research 2012, 31:100 Page 3 of 7http://www.jeccr.com/content/31/1/100
values of 0.01 or less were displayed in the GenoSensorReader System.We defined the three grades by the genomic imbalances
from the data of array CGH; genetically stable group(genetic aberration <5%), intermediate group (5%≦geneticaberration <30%), genetically unstable group (genetic aber-ration ≧30%).
Statistical analysisThe results are expressed as the mean ± SD. We usedindependent sample t-test for continuous variables andchi square test for categorical variables in comparison. Ap value less than 0.05 was considered significant. Allstatistics were calculated using StatMate III software(Atoms Co., Tokyo, Japan).
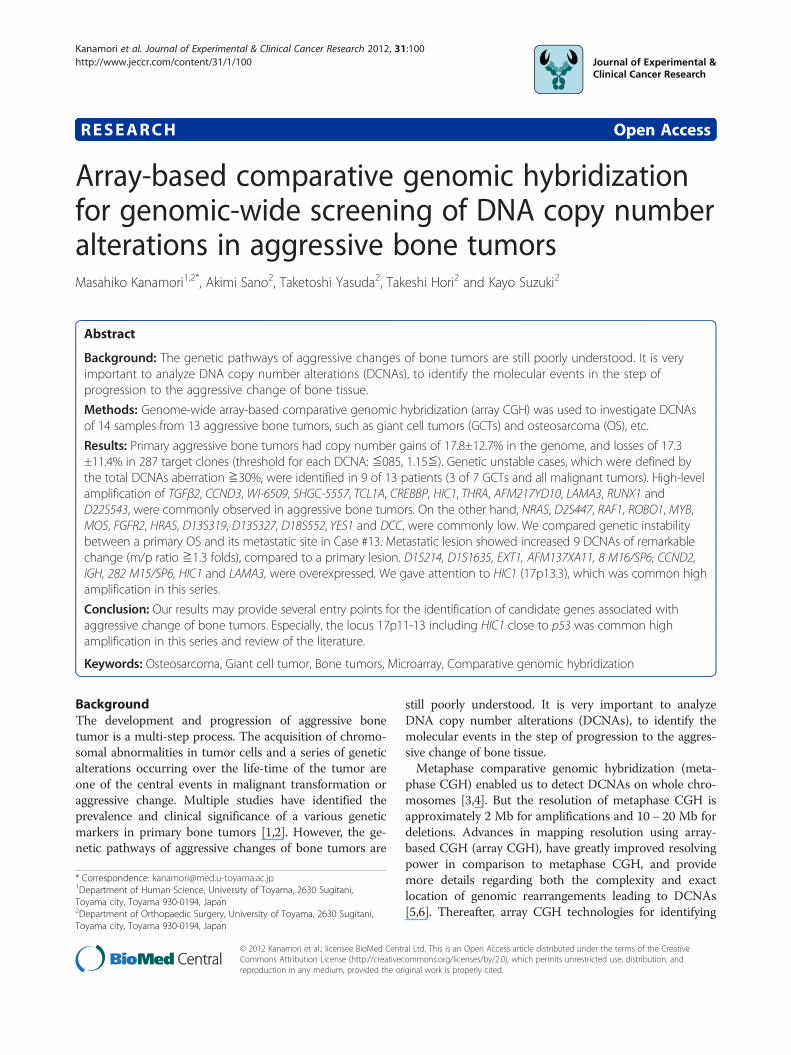
ResultsOverall array CGH results in aggressive bone tumorsFigure 1 shows a representative case, and a microarrayslide which was hybridized by array CGH technique.DCNAs of primary tumors showed 17.8±12.7% in gains,and 17.3±11.4% in losses of target 287 clones. The ave-rage of the proportion of total genetic instability reachedthe 38.6±22.8%. Genetic unstable cases which weredefined by the total DCNAs aberration (≧30%) were
Figure 1 A representative case and an array CGH slide (Case #7). a: Rashowing GCT (H&E x200). c: A study of microarray CGH.
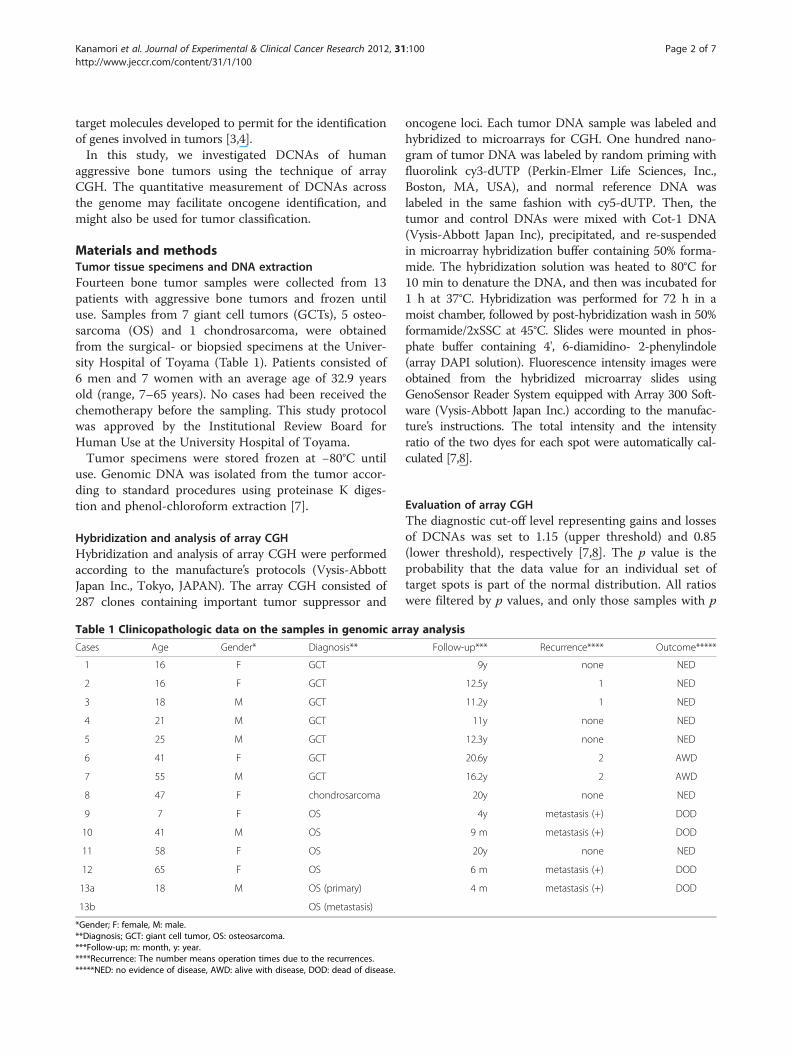
identified in 9 of 13 patients (3 of 7 GCTs and all malig-nant tumors). All malignant cases were genetically clas-sified into the unstable group. We picked up major genenames, which showed many gain cases or loss cases. Anoverall array CGH results and gene names of commongenetic instability are listed in Figure 2.High-level amplification of TGFβ2 (1q41), CCND3
(6p21), WI-6509 (11qtel), SHGC-5557 (12ptel), TCL1A(14q32.1), CREBBP (16q13.3), HIC1 (17p13.3), THRA(17q11.2), AFM217YD10 (17qtel), LAMA3 (18q11.2),RUNX1 (21q22.3) and D22S543 (22q11), was commonlyobserved in aggressive bone tumors. On the other hand,NRAS (1p13.2), D2S447 (2qtel), ROBO1 (3p12-13), RAF1(3p25), MYB (6q22-23), MOS (8q11), FGFR2 (10q26),HRAS (11q11.5), D13S319 (13q14.2), D13S327 (13qtel),YES1 (18p11), D18S552 (18ptel) and DCC (18q21.3)were commonly low (Figure 2).
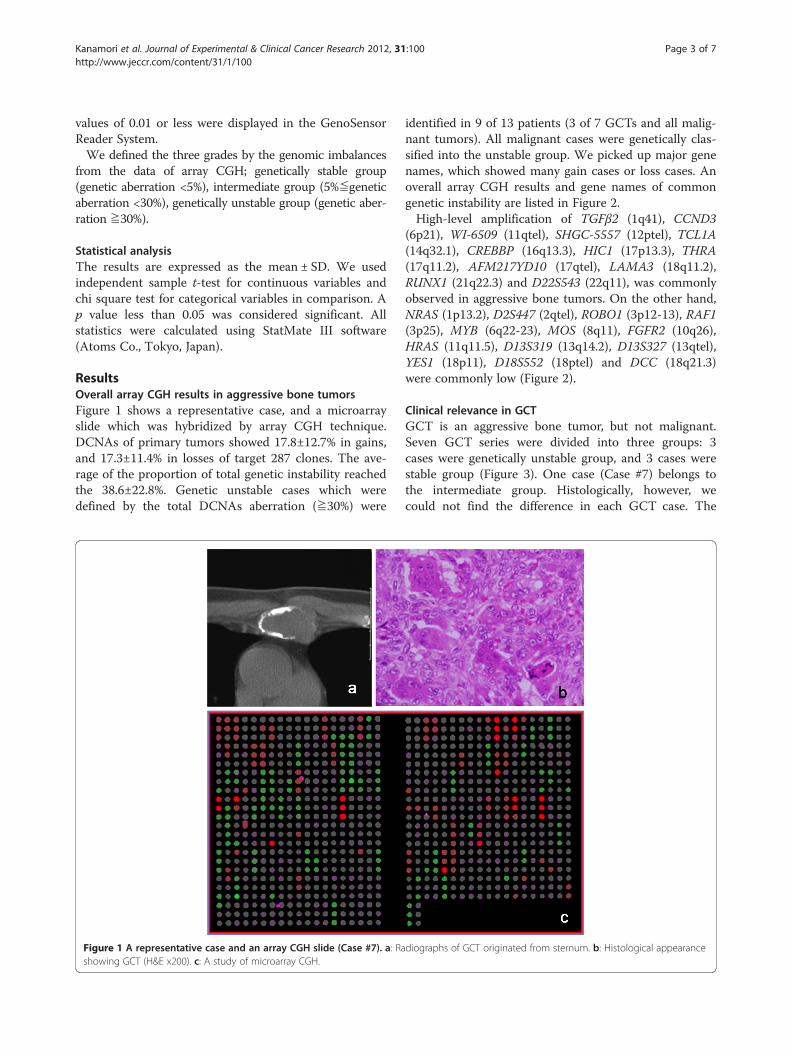
Clinical relevance in GCTGCT is an aggressive bone tumor, but not malignant.Seven GCT series were divided into three groups: 3cases were genetically unstable group, and 3 cases werestable group (Figure 3). One case (Case #7) belongs tothe intermediate group. Histologically, however, wecould not find the difference in each GCT case. The
diographs of GCT originated from sternum. b: Histological appearance
CSGene names Location 1 2 3 4 5 6 7 8 9 10 11 12 13a 13b gain cases loss casesTGFβ 2 1q41 7 0CCND3 6p21 8 0WI-6509 11qtel 7 0SHGC-5557 12ptel 8 0TCL1A 14q32.1 8 0CREBBP 16q13.3 7 0HIC1 17p13.3 7 1THRA 17q11.2 8 0AFM217YD10 17qtel 7 0LAMA3 18q11.2 7 1RUNX1(AML1) 21q22.3 7 0D22S543 22q11 7 1NRAS 1p13.2 1 10D2S447 2qtel 0 9RAF1 3p25 0 7D3S1274, ROBO1 3p12-13 0 8MYB 6q22-23 0 7MOS 8q11 0 7FGFR2 10q26 0 9HRAS 11q15.5 2 7D13S319 13q14.2 0 8D13S327 13qtel 0 7D18S552 18ptel 0 8YES1 18p11 0 7DCC 18q21.3 0 7
0.3 27.5 21.6 25.8 1.4 0.0 0.0 25.4 34.5 23.7 17.1 31.0 22.6 30.71.4 21.6 16.0 26.8 2.8 0.0 18.1 12.5 30.0 18.1 19.9 39.4 17.8 26.11.7 49.1 37.6 52.6 4.2 0.0 18.1 37.9 64.5 41.8 37.0 70.4 40.4 56.8
Green and red squares represent decreases (Tumor DNA/Normal DNA ratio 0.85) and increases (Tumor DNA/Normal DNA ratio 1.15) of DCNAs, respecti*Genetic gain/loss (%) are caliculated as a ratio of increase or decrease of DCNAs based on the data of 287 clones.CS: chondrosarcoma, Case #13a: primary tumor, #13b: metastatic tumor
Total instability(%)Genetic loss (%)*Genetic gain (%)*
Tumor/ Cases Giant cell tumor osteosarcoma
Figure 2 Summary of DCNAs data detected by array CGH.
Kanamori et al. Journal of Experimental & Clinical Cancer Research 2012, 31:100 Page 4 of 7http://www.jeccr.com/content/31/1/100
mean clinical follow-up time of these GCT cases was11.8 years. Tumor recurrence was observed in all casesof genetically unstable group. On the other hand, the re-currence rate of stable group was low (33.3%). However,there was no significance between two groups (chi-
Figure 3 Representative genetic unstable group (a-d) and stable grou(OS), c: Case #12 (OS), d: Case 4 (GCT), e: Case #2 (GCT), f: Case #5 (GCT).
square test; p = 0.083), because the sample size wassmall.As many GCTs have some telomeric associations, we
have given an attention to these areas. In analyzed 73clones of telomeric area, losses of D2S447 (2qtel), and
p (e, f) in a study of microarray CGH. a: Case #9 (OS), b: Case #10
Kanamori et al. Journal of Experimental & Clinical Cancer Research 2012, 31:100 Page 5 of 7http://www.jeccr.com/content/31/1/100
gain of WI-6509 (11qtel) and D19S238E (19qtel) weremainly observed.
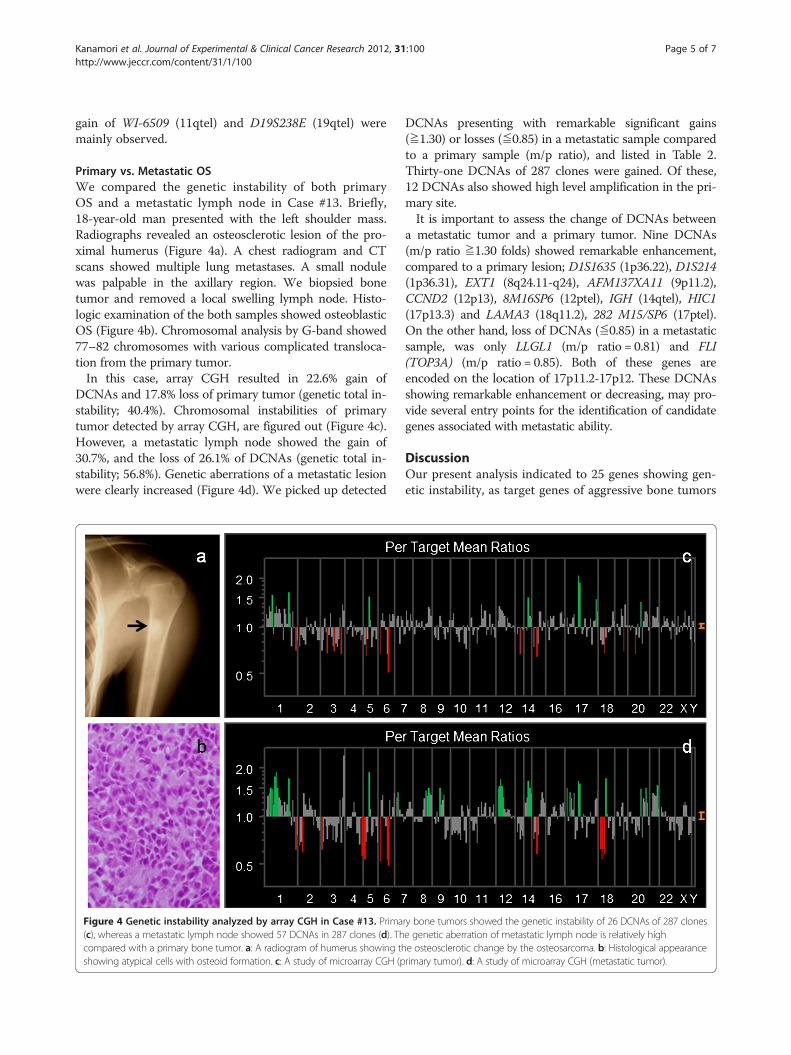
Primary vs. Metastatic OSWe compared the genetic instability of both primaryOS and a metastatic lymph node in Case #13. Briefly,18-year-old man presented with the left shoulder mass.Radiographs revealed an osteosclerotic lesion of the pro-ximal humerus (Figure 4a). A chest radiogram and CTscans showed multiple lung metastases. A small nodulewas palpable in the axillary region. We biopsied bonetumor and removed a local swelling lymph node. Histo-logic examination of the both samples showed osteoblasticOS (Figure 4b). Chromosomal analysis by G-band showed77–82 chromosomes with various complicated transloca-tion from the primary tumor.In this case, array CGH resulted in 22.6% gain of
DCNAs and 17.8% loss of primary tumor (genetic total in-stability; 40.4%). Chromosomal instabilities of primarytumor detected by array CGH, are figured out (Figure 4c).However, a metastatic lymph node showed the gain of30.7%, and the loss of 26.1% of DCNAs (genetic total in-stability; 56.8%). Genetic aberrations of a metastatic lesionwere clearly increased (Figure 4d). We picked up detected
Figure 4 Genetic instability analyzed by array CGH in Case #13. Prima(c), whereas a metastatic lymph node showed 57 DCNAs in 287 clones (d). Thcompared with a primary bone tumor. a: A radiogram of humerus showing thshowing atypical cells with osteoid formation. c: A study of microarray CGH (p
DCNAs presenting with remarkable significant gains(≧1.30) or losses (≦0.85) in a metastatic sample comparedto a primary sample (m/p ratio), and listed in Table 2.Thirty-one DCNAs of 287 clones were gained. Of these,12 DCNAs also showed high level amplification in the pri-mary site.It is important to assess the change of DCNAs between
a metastatic tumor and a primary tumor. Nine DCNAs(m/p ratio ≧1.30 folds) showed remarkable enhancement,compared to a primary lesion; D1S1635 (1p36.22), D1S214(1p36.31), EXT1 (8q24.11-q24), AFM137XA11 (9p11.2),CCND2 (12p13), 8M16SP6 (12ptel), IGH (14qtel), HIC1(17p13.3) and LAMA3 (18q11.2), 282 M15/SP6 (17ptel).On the other hand, loss of DCNAs (≦0.85) in a metastaticsample, was only LLGL1 (m/p ratio = 0.81) and FLI(TOP3A) (m/p ratio = 0.85). Both of these genes areencoded on the location of 17p11.2-17p12. These DCNAsshowing remarkable enhancement or decreasing, may pro-vide several entry points for the identification of candidategenes associated with metastatic ability.
DiscussionOur present analysis indicated to 25 genes showing gen-etic instability, as target genes of aggressive bone tumors
ry bone tumors showed the genetic instability of 26 DCNAs of 287 clonese genetic aberration of metastatic lymph node is relatively highe osteosclerotic change by the osteosarcoma. b: Histological appearancerimary tumor). d: A study of microarray CGH (metastatic tumor).
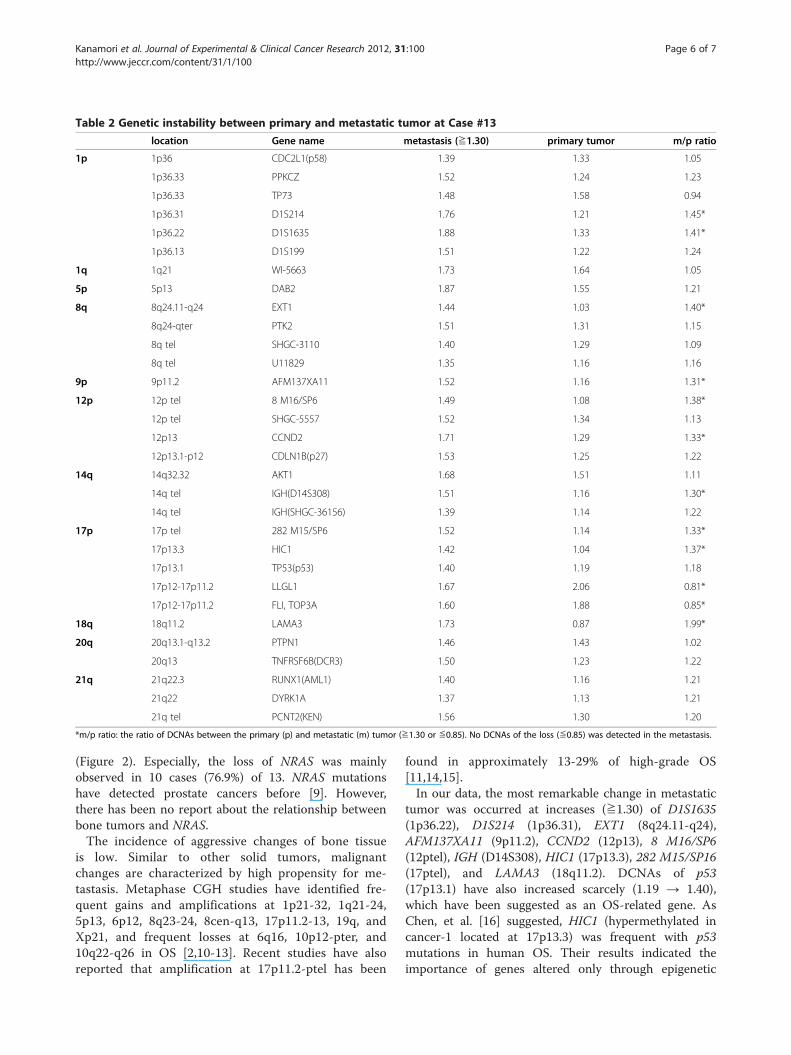
Table 2 Genetic instability between primary and metastatic tumor at Case #13
location Gene name metastasis (≧1.30) primary tumor m/p ratio
1p 1p36 CDC2L1(p58) 1.39 1.33 1.05
1p36.33 PPKCZ 1.52 1.24 1.23
1p36.33 TP73 1.48 1.58 0.94
1p36.31 D1S214 1.76 1.21 1.45*
1p36.22 D1S1635 1.88 1.33 1.41*
1p36.13 D1S199 1.51 1.22 1.24
1q 1q21 WI-5663 1.73 1.64 1.05
5p 5p13 DAB2 1.87 1.55 1.21
8q 8q24.11-q24 EXT1 1.44 1.03 1.40*
8q24-qter PTK2 1.51 1.31 1.15
8q tel SHGC-3110 1.40 1.29 1.09
8q tel U11829 1.35 1.16 1.16
9p 9p11.2 AFM137XA11 1.52 1.16 1.31*
12p 12p tel 8 M16/SP6 1.49 1.08 1.38*
12p tel SHGC-5557 1.52 1.34 1.13
12p13 CCND2 1.71 1.29 1.33*
12p13.1-p12 CDLN1B(p27) 1.53 1.25 1.22
14q 14q32.32 AKT1 1.68 1.51 1.11
14q tel IGH(D14S308) 1.51 1.16 1.30*
14q tel IGH(SHGC-36156) 1.39 1.14 1.22
17p 17p tel 282 M15/SP6 1.52 1.14 1.33*
17p13.3 HIC1 1.42 1.04 1.37*
17p13.1 TP53(p53) 1.40 1.19 1.18
17p12-17p11.2 LLGL1 1.67 2.06 0.81*
17p12-17p11.2 FLI, TOP3A 1.60 1.88 0.85*
18q 18q11.2 LAMA3 1.73 0.87 1.99*
20q 20q13.1-q13.2 PTPN1 1.46 1.43 1.02
20q13 TNFRSF6B(DCR3) 1.50 1.23 1.22
21q 21q22.3 RUNX1(AML1) 1.40 1.16 1.21
21q22 DYRK1A 1.37 1.13 1.21
21q tel PCNT2(KEN) 1.56 1.30 1.20
*m/p ratio: the ratio of DCNAs between the primary (p) and metastatic (m) tumor (≧1.30 or ≦0.85). No DCNAs of the loss (≦0.85) was detected in the metastasis.
Kanamori et al. Journal of Experimental & Clinical Cancer Research 2012, 31:100 Page 6 of 7http://www.jeccr.com/content/31/1/100
(Figure 2). Especially, the loss of NRAS was mainlyobserved in 10 cases (76.9%) of 13. NRAS mutationshave detected prostate cancers before [9]. However,there has been no report about the relationship betweenbone tumors and NRAS.The incidence of aggressive changes of bone tissue
is low. Similar to other solid tumors, malignantchanges are characterized by high propensity for me-tastasis. Metaphase CGH studies have identified fre-quent gains and amplifications at 1p21-32, 1q21-24,5p13, 6p12, 8q23-24, 8cen-q13, 17p11.2-13, 19q, andXp21, and frequent losses at 6q16, 10p12-pter, and10q22-q26 in OS [2,10-13]. Recent studies have alsoreported that amplification at 17p11.2-ptel has been
found in approximately 13-29% of high-grade OS[11,14,15].In our data, the most remarkable change in metastatic
tumor was occurred at increases (≧1.30) of D1S1635(1p36.22), D1S214 (1p36.31), EXT1 (8q24.11-q24),AFM137XA11 (9p11.2), CCND2 (12p13), 8 M16/SP6(12ptel), IGH (D14S308), HIC1 (17p13.3), 282 M15/SP16(17ptel), and LAMA3 (18q11.2). DCNAs of p53(17p13.1) have also increased scarcely (1.19 → 1.40),which have been suggested as an OS-related gene. AsChen, et al. [16] suggested, HIC1 (hypermethylated incancer-1 located at 17p13.3) was frequent with p53mutations in human OS. Their results indicated theimportance of genes altered only through epigenetic
Kanamori et al. Journal of Experimental & Clinical Cancer Research 2012, 31:100 Page 7 of 7http://www.jeccr.com/content/31/1/100
mechanisms in cancer progression in conjunction withgenetically modified tumor suppressor genes. In ourstudy, HIC1 was also higher in the metastatic lesion thanthe primary site (m/p ratio =1.37 in Table 2). Therefore,we gave attention to the locus of 17p13 including HIC1as a target gene.Recent studies have reported that overexpression of
17p11-p12 have been linked p53 degradation [10,16-20].In Case #13, the gain of LLGL1, FLI (TOP3A) at 17p11-p12 have also detected. However, these two DCNAswere decreased in a metastatic sample, compared withprimary tumor, which might be important in the step ofmetastasis. These findings support that target genesclose to p53 (17p13.1), may contribute to OS tumorige-nesis [17,18].Thus, the present pilot study suggests that array CGH
could powerful means to detect genetic instability andgene aberrations that are reflected to the progressionand outcome of primary aggressive bone tumors. HIC1is increased at the both step of aggressive change andmetastatic process. HIC1 might play a role of bonetumor progression and metastasis. We should pay atten-tion the locus of 17p11-13 including HIC1, LLGL1, FLI(TOP3A), as well as p53. Further detailed studies arenecessary to clarify genetic pathways of the aggressivebone tumors.
ConclusionOur results may provide several entry points for the iden-tification of candidate genes associated with aggressivechange of bone tumors. Especially, the locus 17p11-13 in-cluding HIC1 close to p53 was common high amplifica-tion in this series and review of the literature.
Competing interestsThe authors declare that they have no competing interests.
Authors’ contributionsMK participated in the data collection, performed the statistical analysis anddrafted the manuscript.AS, TY and TH made substantial contributions to the analysis andinterpretation of data. KS helped to draft the manuscript. All authors readand approved the final manuscript.
AcknowledgementsThis study was supported by grants from the he National Science Council ofJapan (NSC 88-2314-B-075-096). The authors would like to thank Prof.Tomoatsu Kimura and Dr. Shigeharu Nogami, Department of Orthopaedics,University of Toyama, who provided clinical advices.
Received: 2 May 2012 Accepted: 25 June 2012Published: 30 November 2012
References1. Boehm AK, Neff JR, Squire JA, Bayani J, Nelson M, Bridge JA: Cytogenetic
findings in 36 osteosarcoma specimens and a review of the literature.Pediatr Pathol Mol Med 2000, 19:359–376.
2. Sandberg AA, Bridge JA: Updates on the cytogenetics and moleculargenetics of bone and soft tissue tumors: osteosarcoma and relatedtumors. Cancer Genet Cytogenet 2003, 145:1–30. 35–46.
3. Kallioniemi A, Kallioniemi OP, Sudar D, Rutovitz D, Gray JW, Waldman F,Pinkel D: Comparative genomic hybridization for molecular cytogeneticanalysis of solid tumors. Science 1992, 258:818–821.
4. Pinkel D, Segraves R, Sudar D, Clark S, Poole I, Kowel D, Collins C, Kuo W-L,Chen C, Zhai Y, Dairkee SH, Ljung B, Gray JW, Albertson DG: Highresolution analysis of DNA copy number variation using comparativegenomic hybridization to microarrays. Nat Genet 1998, 20:207–211.
5. Pollack JR, Perou CM, Alizadeh AA, Eisen MB, Pergamenschikov A, WilliamsCF, Jeffrey SS, Bostein D, Brown PO: Genome-wide analysis of DNA copy-number changes using cDNA microarrays. Nat Genet 1999, 23:41–46.
6. Hashimoto K, Mori N, Tamesa T, Okada T, Kawauchi S, Oga T, Furuya T,Tangoku A, Oka M, Sasaki K: Analysis of DNA copy number aberrations inhepatitis C virus-associated hepatocellular carcinomas by conventionalCGH and array CGH. Mod Pathol 2004, 17:617–622.
7. Kanamori M: Cytogenetics of dedifferentiated chondrosarcoma. ToyamaMed J 2007, 18:34–38.
8. Yasuda T, Kanamori M, Nogami S, Hori T, Oya T, Suzuki K, Kimura T:Establishment of a new human osteosarcoma cell line, UTOS-1:cytogenetic characterization by array comparative genomichybridization. J Exp Clin Cancer Res 2009, 28:26–33.
9. Eskandarpour M, Hashemi J, Ringborg U, Platz A, Hansson J: Frequency ofUV-inducible NRAS mutations in melanomas of patients with germlineCDKN2A mutations. J Natl Cancer Inst 2003, 95:790–798.
10. Overholtzer M, Rao PH, Favis R, Lu X-Y, Elowitz MB, Barany F, Ladanyi M,Gorlick R, Levine AJ: The presence of p53 mutations in humanosteosarcomas correlates with high levels of genomic instability. ProcNatl Acad Sci USA 2003, 100:11547–11552.
11. Tarkkanen M, Karhu R, Kallioniemi A, Elomaa I, Kivioja AH, Nevalainen J,Böhling T, Karaharju E, Hyytinen E, Knuutila S, Kallioniemi O-P: Gains andlosses of DNA sequences in osteosarcomas by comparative genomichybridization. Cancer Res 1995, 55:1334–1338.
12. Ozaki T, Schaefer K-L, Wai D, Buerger H, Flege S, Lindner N, Kevric M, DialloR, Bankfalvi A, Brinkschmidt C, Juergens H, Winkelmann W, Dockhorn-Dworniczak B, Bielack SS, Poremba C: Genetic imbalances revealed bycomparative genomic hybridization in osteosarcomas. Int J Cancer 2002,102:355–365.
13. Ozaki T, Neumann T, Wai D, Schäfer K-L, van Valen F, Lindner N, Scheel C,Böcker W, Winkelmann W, Dockhorn-Dworniczak B, Horst J, Poremba C:Chromosomal alterations in osteosarcoma cell lines revealed bycomparative genomic hybridization and multicolor karyotyping. CancerGenetics Cytogenet 2003, 140:145–152.
14. Stock C, Kager L, Fink FM, Gadner H, Ambros PF: Chromosomal regionsinvolved in the pathogenesis of osteosarcomas. Genes Chrom Cancer2000, 28:329–336.
15. Zielenska M, Bayani J, Pandita A, Toledo S, Marrano P, Andrade J, Petrilli A,Thorner P, Sorenson P, Squire JA: Comparative genomic hybridizationanalysis identifies gains of 1p35 approximately p36 and chromosome 19in osteosarcoma. Cancer Genet Cytogenet 2001, 130:14–21.
16. Chen W, Cooper TK, Zahnow CA, Overholtzer M, Zhao Z, Ladanyi M, Karp JE,Gokgoz N, Wunder JS, Andrulis I, Levine AJ, Mankowski JL, Baylin SB:Epigenetic and genetic loss of Hic1 function accentuates the role of p53in tumorigenesis. Cancer Cell 2004, 6:387–398.
17. van Dartel M, Cornelissen PWA, Redeker S, Tarkkanen M, Knuutila S,Hogendoorn PCW, Wsterveld A, Gomes I, Bras J, Hulsebos TJM:Amplification of 17p11.2-p12, including PMP22, TOP3A and MAPK7 inhigh-grade osteosarcoma. Cancer Genet Cytogenet 2002, 139:91–96.
18. van Dartel M, Redeker S, Bras J, Kool M, Hulsebos TJM: Overexpressionthrough amplification of genes in chromosome region 17p11.2-p12 inhigh-grade osteosarcoma. Cancer Genet Cytogenet 2004, 152:8–14.
19. van Dartel M, Hulsebos TJM: Amplification and overexpression of genes in17p11.2-p12 in osteosarcoma. Cancer Genet Cytogenet 2004, 153:77–80.
20. Henriksen J, Aagesen TH, Maelandsmo GM, Lothe RA, Myklebost O, Forus A:Amplification and overexpression of COPS3 in osteosarcomas potentiallytarget TP53 for proteasome-mediated degradation. Oncogene 2003,22:5358–5361.
doi:10.1186/1756-9966-31-100Cite this article as: Kanamori et al.: Array-based comparative genomichybridization for genomic-wide screening of DNA copy numberalterations in aggressive bone tumors. Journal of Experimental & ClinicalCancer Research 2012 31:100.
Related Documents