Journal of Human Hypertension (1997) 11, 101–106 1997 Stockton Press. All rights reserved 0950-9240/97 $12.00 Pressure response to successive clinic readings predicts an elevated blood pressure at 2.6 years’ follow-up: The Israeli CORDIS Study S Melamed 1 , E Kristal-Boneh 1 , P Froom 1,2 , G Harari 1 , MS Green 2 and J Ribak 1,2 1 Occupational Health and Rehabilitation Institute, Raanana; and 2 Epidemiology Department, Sackler School of Medicine, Tel Aviv University, Ramat Aviv, Israel Background: Many persons exhibit an elevation in blood respective subgroup with an initially similar baseline BP value. Logistic regression results indicated that those pressure (BP) when examined in a medical setting. We examined whether individuals exhibiting an exagger- with high SBP responsivity had a 2.7 times greater chance of having an elevated SBP (>140 mm Hg) on fol- ated pressure response (high responders) to BP deter- mination would have an elevated baseline BP on follow- low-up (95% CI 1.8– 4.1, P , 0.001), independently of initial SBP, age, or body mass index. Other significant up, independent of the initial BP level. Methods and results: A total of 1217 employed men not predictors were the initial baseline SBP value and age. In those with an initial SBP of 130–139 mm Hg, the base- on hypertensive medication, aged 20–64 years were examined over 2– 4 years (mean 2.6 years) following the line SBP was not predictive of future readings whereas high responders had a four times higher risk of having baseline measurements at entry. Pressure response was assessed at entry and defined as the difference an elevated SBP on follow-up (OR = 4.0, 95% CI 2.0–8.0, P , 0.001). between the first and fourth values in successive read- ings. Such a response was apparent for systolic BP Conclusions: These findings suggest that SBP hyper- responsivity to BP determination at the clinic indepen- (SBP) but was negligible for diastolic BP (DBP) and the former was negatively related to the baseline BP value. dently predicts elevated SBP 2.6 years later. Further studies are warranted to determine the predictive value High responders were defined as persons showing a pressure response greater than the average for the over a longer follow-up period. Keywords: blood pressure determination; white-coat; hypertension; follow-up It has been suggested that the pressure response Introduction to BP determination contributes to white-coat hyper- In successive blood pressure (BP) readings in the tension, that is, the presence of arterial hyperten- clinic or physician’s office, the first reading is fre- sion, defined on the basis of BP measured in a clini- quently elevated, with systolic BP (SBP) reportedly cal setting, in subjects who have normal ambulatory exceeding subsequent readings by as much as 50 or self-measured BP outside the physician’s mm Hg. 1–7 A much smaller and sometimes negli- office. 10,12 Much of the relevant literature has gible difference is observed for diastolic BP (DBP). 8 focused on the pressure response as leading to mis- This response may persist over several visits, classification of hypertension. 12,13 Several studies, despite increasing familiarity with the clinic however, have attempted to determine whether environment. 4–6 It also varies greatly in magnitude white-coat hypertension elicits end-organ change or between individuals. 3,4,7 poses a cardiovascular risk; some have shown posi- The exaggerated pressure response, termed alert- tive findings, 12,14–16 whereas others have not. 17,18 ing reaction, 2–4 white-coat effect, or conditioned With the exception of one work by Stein et al, 19 defense response, 8 has been attributed to psycho- few prospective studies have been conducted to logical factors. Support for this assumption has been explore whether the pressure response to BP deter- provided by observations that the magnitude of the mination independently predicts BP change over response depends on the authority, familiarity, and time. In the study of Stein et al, 19 performed in pre- gender concordance with the examiner. 3,9–11 There school children, no association was found between is also evidence that the pressure response is related pressure responsivity and BP change over 16 to personality traits such as hostility, 9 but not to months. On the basis of evidence suggesting that responses to standardized laboratory stressors. 4,8 white-coat hypertension may represent a prehyper- tensive state, 20,21 we formulated the working hypothesis that individuals exhibiting an exagger- Correspondence: Dr S Melamed, Occupational Health and ated response (high responders, that is those whose Rehabilitation Institute, POB 3, Raanana 43100, Israel Received 1 June 1996; revised 15 November 1996; accepted 21 pressure response was above the mean of their November 1996 respective subgroup with initially similar baseline

Welcome message from author
This document is posted to help you gain knowledge. Please leave a comment to let me know what you think about it! Share it to your friends and learn new things together.
Transcript

Journal of Human Hypertension (1997) 11, 101–106 1997 Stockton Press. All rights reserved 0950-9240/97 $12.00
Pressure response to successive clinicreadings predicts an elevated bloodpressure at 2.6 years’ follow-up: TheIsraeli CORDIS StudyS Melamed1, E Kristal-Boneh1, P Froom1,2, G Harari1, MS Green2 and J Ribak1,2
1Occupational Health and Rehabilitation Institute, Raanana; and 2Epidemiology Department, SacklerSchool of Medicine, Tel Aviv University, Ramat Aviv, Israel
Background : Many persons exhibit an elevation in blood respective subgroup with an initially similar baseline BPvalue. Logistic regression results indicated that thosepressure (BP) when examined in a medical setting. We
examined whether individuals exhibiting an exagger- with high SBP responsivity had a 2.7 times greaterchance of having an elevated SBP ( >140 mm Hg) on fol-ated pressure response (high responders) to BP deter-
mination would have an elevated baseline BP on follow- low-up (95% CI 1.8–4.1, P , 0.001), independently ofinitial SBP, age, or body mass index. Other significantup, independent of the initial BP level.
Methods and results : A total of 1217 employed men not predictors were the initial baseline SBP value and age.In those with an initial SBP of 130–139 mm Hg, the base-on hypertensive medication, aged 20–64 years were
examined over 2–4 years (mean 2.6 years) following the line SBP was not predictive of future readings whereashigh responders had a four times higher risk of havingbaseline measurements at entry. Pressure response
was assessed at entry and defined as the difference an elevated SBP on follow-up (OR = 4.0, 95% CI 2.0–8.0,P , 0.001).between the first and fourth values in successive read-
ings. Such a response was apparent for systolic BP Conclusions : These findings suggest that SBP hyper-responsivity to BP determination at the clinic indepen-(SBP) but was negligible for diastolic BP (DBP) and the
former was negatively related to the baseline BP value. dently predicts elevated SBP 2.6 years later. Furtherstudies are warranted to determine the predictive valueHigh responders were defined as persons showing a
pressure response greater than the average for the over a longer follow-up period.
Keywords: blood pressure determination; white-coat; hypertension; follow-up
It has been suggested that the pressure responseIntroductionto BP determination contributes to white-coat hyper-
In successive blood pressure (BP) readings in the tension, that is, the presence of arterial hyperten-clinic or physician’s office, the first reading is fre- sion, defined on the basis of BP measured in a clini-quently elevated, with systolic BP (SBP) reportedly cal setting, in subjects who have normal ambulatoryexceeding subsequent readings by as much as 50 or self-measured BP outside the physician’smm Hg.1–7 A much smaller and sometimes negli- office.10,12 Much of the relevant literature hasgible difference is observed for diastolic BP (DBP).8 focused on the pressure response as leading to mis-This response may persist over several visits, classification of hypertension.12,13 Several studies,despite increasing familiarity with the clinic however, have attempted to determine whetherenvironment.4–6 It also varies greatly in magnitude white-coat hypertension elicits end-organ change orbetween individuals.3,4,7
poses a cardiovascular risk; some have shown posi-The exaggerated pressure response, termed alert- tive findings,12,14–16 whereas others have not.17,18
ing reaction,2–4 white-coat effect, or conditioned With the exception of one work by Stein et al,19
defense response,8 has been attributed to psycho- few prospective studies have been conducted tological factors. Support for this assumption has been explore whether the pressure response to BP deter-provided by observations that the magnitude of the mination independently predicts BP change overresponse depends on the authority, familiarity, and time. In the study of Stein et al,19 performed in pre-gender concordance with the examiner.3,9–11 There school children, no association was found betweenis also evidence that the pressure response is related pressure responsivity and BP change over 16to personality traits such as hostility,9 but not to months. On the basis of evidence suggesting thatresponses to standardized laboratory stressors.4,8
white-coat hypertension may represent a prehyper-tensive state,20,21 we formulated the workinghypothesis that individuals exhibiting an exagger-Correspondence: Dr S Melamed, Occupational Health andated response (high responders, that is those whoseRehabilitation Institute, POB 3, Raanana 43100, Israel
Received 1 June 1996; revised 15 November 1996; accepted 21 pressure response was above the mean of theirNovember 1996 respective subgroup with initially similar baseline

Predicting blood pressure elevationS Melamed et al
102BP values to BP determination) would display an Psychological testselevated baseline BP on follow-up, compared to low
To explore whether over-responsivity to BP determi-responders. We tested this hypothesis in a large sam-nation may be associated with certain personalityple of industrial male workers (excluding medicateddispositions and/or psychoneurotic symptoms, thehypertensives) who were followed up for 2–4 years.following measures were included at entry: traitanger,22 emotional reactivity,23 somatic com-plaints,24 irritability,25 anxiety,26 and depression.27Subjects and methods
Study populationExclusions
Between 1985 and 1987, 4318 men from 21 factoriesOf the original 4318 men, 119 were outside the agein Israel, engaged in sedentary or physical work,range of 20–64 years. Also excluded were 266 per-were screened for cardiovascular risk factors in thesons receiving antihypertensive medication and 119CORDIS study (Cardiovascular Occupational Riskwith missing data. Thus, the initial sample consistedFactor Determination in Israeli Industries). Theof 3804 men. Out of the 1333 retained for this fol-examinations were offered free of charge. The num-low-up study, 116 were excluded, 79 because theyber of individuals examined represents a responsewere receiving antihypertensive medication and 37rate of 60% of the potential target population. Fail-for missing data. Thus, the final follow-up sampleure to comply was largely due to technical and logis-consisted of 1217 subjects. There were no significanttic factors rather than worker refusal to participate.differences between the two groups, although thereBetween 1988 and 1990 attempts were made to re-was a trend for lower age (P , 0.06) and cigaretteexamine the original subjects. Owing to thesmoking (P , 0.06) in those who were lost to follow-depressed state of the economy during the follow-up (see Table 1).up period, several of the factories had closed, and
in others there had been large-scale worker dis-missals. As a result, only 1333 men of the original Statistical analysescohort were available for re-examination. The aver-age time between examinations was 2.6 years, and The SAS package was used for data editing and stat-the range was 2–4 years. istical analyses. Univariate analysis was used to
compare the different variables between the studypopulation and those who were lost to follow-up.
Interview data Corrections were made for multiple comparisons.The difference between the first and fourth BP read-Information collected at entry on each participanting (responsivity) was calculated, and the workersby interview was consisted of demographic data,were divided into two groups; those with more thanpersonal habits, and medical history, including per-an average decrease in SBP and those with less thanmanent medication use. The health-related habitsan average decrease in SBP. Logistic regression wasexamined were smoking (cigarettes/day), coffee con-used in an attempt to predict those with an elevatedsumption (cups/day), and alcohol consumptionbaseline SBP on follow-up (SBP >140 mm Hg, aver-(converted into an estimate of milliliters/month).aging the third and fourth readings). Although allAlso recorded were job titles and physical activityvariables were entered into the analysis, only thoseat work and outside of work.with a P value of less than 0.1 for the entire cohortwere retained in the regression results. Odds ratio(OR) and 95% confidence interval (CI) were calcu-Physical examinationlated.
Physical examinations, at entry and at follow-up,including height, weight and BP measurements,were carried out in the non-fasting state between
Table 1 Characteristics of the total (initial) study population of7.00 am and 4.00 pm in a quiet, air-conditioned3804 men
room allocated by factory management. BP was mea-sured four times using a standard mercury sphygmo- Variable Subjects re- Subjects lost tomanometer (Baumanometer) with the cuff on the examined follow-up
at follow-up (n = 2587)right arm. Measurements were taken by trained tech-(n = 1217)nicians after the subject had been resting for 5 min.
The first measurement was taken with the subjectAge (years) 43 ± 11 41 ± 12supine and the next two in the sitting position. TheBlue collar worker (%) 70.1 68.0fourth measurement was taken after subjects had Physically active (%) 40.3 41.0
returned to work for approximately 1 h; it was per- Alcohol (ml/month) 183 ± 355 160 ± 241Smoking (cigarettes/day) 20 ± 11 14 ± 10formed in the same examination room, in the sittingCoffee (cups/day) 2.6 ± 1.0 2.5 ± 1.6position, following a 5-min rest. SBP correspondedBody mass index (kg/m2) 26.1 ± 3.6 25.8 ± 4.9to the first Korotkoff sound and DBP to the fifth Kor-SBP (mm Hg) 128 ± 16 123 ± 20
otkoff sound (or the fourth, when the sounds did not DBP (mm Hg) 79 ± 10 77 ± 11disappear). As a measure of relative weight we usedthe body mass index [BMI = weight in kilograms/ SBP = systolic blood pressure; DBP = diastolic blood pressure.
All values are reported as mean ± standard deviations.(height in meters)2].

Predicting blood pressure elevationS Melamed et al
103ResultsPressure responsivity to BP determination and itsrelation to baseline BP value at entry
The mean values across the four BP determinationsfor the initial study sample (n = 3804) are depictedin Figure 1. As expected, the alerting response wasmore evident for SBP. We can clearly see that thefirst value was the highest and declined at an almosteven rate with successive readings. Result of one-way ANOVA with repeated measures demonstrateda significant overall time effect (P , 0.0001). Theaverage difference between the first and fourth read-ings (reflecting the magnitude of the pressureresponse to BP determination) was 6.35 ± 0.17mm Hg. Such a difference, albeit significant (P ,0.0001), was very small for DBP (1.19 ± 0.15
Figure 2 Mean SBP response by initial baseline value.mm Hg), and of no clinical significance. Thus, onlySBP responsivity was used in subsequent analyses.
Further analysis indicated that the magnitude ofthe pressure response was negatively correlated (r = responders were defined as those displaying a
higher pressure response than the average value for−0.18, P , 0.0001) with the baseline value (on aver-age of the third and fourth BP readings). The mean their respective subgroup with similar baseline
values. To illustrate, of the persons with baselinevalues (and s.e.) of the pressure response by group-ing of the baseline SBP values are depicted in Figure SBP values ranging from 101 to 110 mm Hg, those
with a pressure response of more than 7.5 mm Hg2. Inspection of this figure shows that the systolicpressure response declined with an increase in base- were considered high responders. The other cutoff
points were: 6.8, 3.7, 2.2 and 4.3, respectively. Usingline values.Last examined was the correlation between SBP this procedure, 43% of the total (initial) sample
were classified as high responders. The proportionresponsivity and the psychological variables. Therewas no significant correlation for any of the vari- of high responders was similar (47%) in the sub-
sample of 1217 men who remained in the follow-up.ables tested: trait anger, emotional reactivity,somatic complaints, anxiety, irritability anddepression. Pressure response and elevated SBP at 2.6 years
follow-upDefinition of high and low responders The average increase in the baseline SBP value at
2.6 years of follow-up was 2.07 mm Hg. Of the 1072Given that the average magnitude of the pressureresponse was related to the baseline value, high SBP participants who had normal BP values at entry, 106
Figure 1 Mean systolic blood pressure (SBP) and diastolic blood pressure (DBP) at four successive determinations.
Predicting blood pressure elevationS Melamed et al
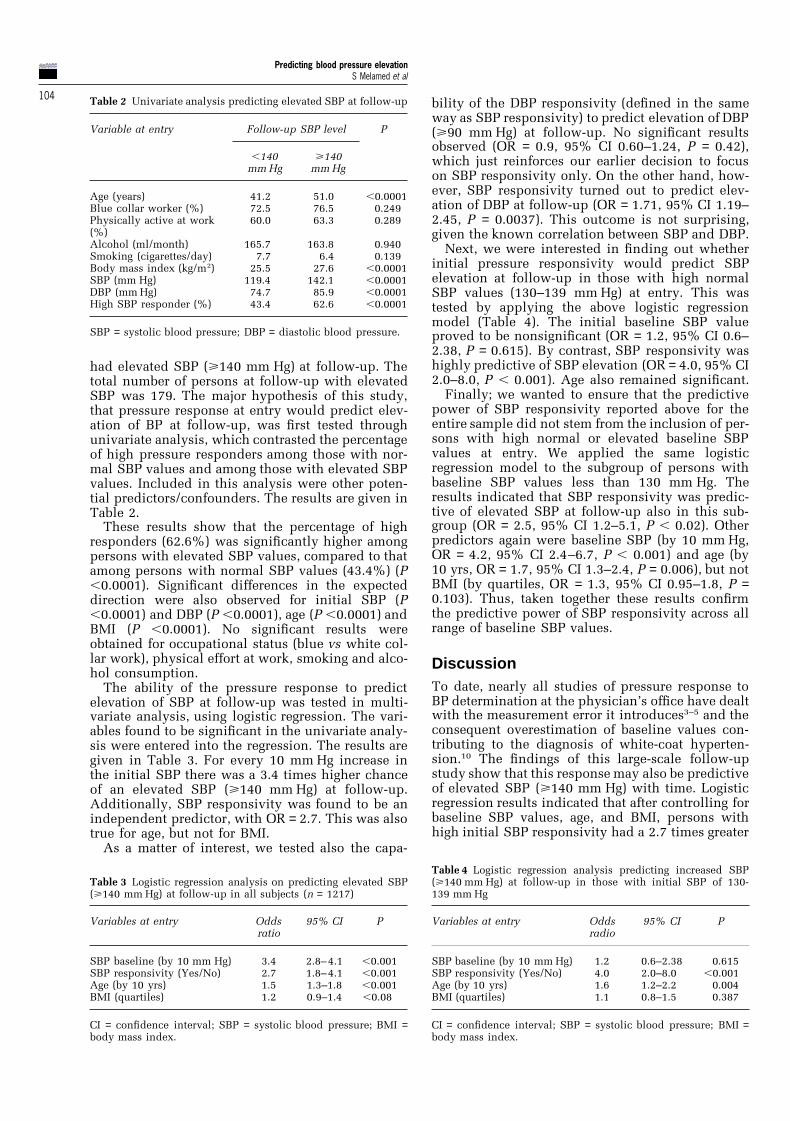
104 Table 2 Univariate analysis predicting elevated SBP at follow-up bility of the DBP responsivity (defined in the sameway as SBP responsivity) to predict elevation of DBP
Variable at entry Follow-up SBP level P (>90 mm Hg) at follow-up. No significant resultsobserved (OR = 0.9, 95% CI 0.60–1.24, P = 0.42),
,140 >140 which just reinforces our earlier decision to focusmm Hg mm Hg
on SBP responsivity only. On the other hand, how-ever, SBP responsivity turned out to predict elev-Age (years) 41.2 51.0 ,0.0001ation of DBP at follow-up (OR = 1.71, 95% CI 1.19–Blue collar worker (%) 72.5 76.5 0.249
Physically active at work 60.0 63.3 0.289 2.45, P = 0.0037). This outcome is not surprising,(%) given the known correlation between SBP and DBP.Alcohol (ml/month) 165.7 163.8 0.940 Next, we were interested in finding out whetherSmoking (cigarettes/day) 7.7 6.4 0.139
initial pressure responsivity would predict SBPBody mass index (kg/m2) 25.5 27.6 ,0.0001elevation at follow-up in those with high normalSBP (mm Hg) 119.4 142.1 ,0.0001
DBP (mm Hg) 74.7 85.9 ,0.0001 SBP values (130–139 mm Hg) at entry. This wasHigh SBP responder (%) 43.4 62.6 ,0.0001 tested by applying the above logistic regression
model (Table 4). The initial baseline SBP valueSBP = systolic blood pressure; DBP = diastolic blood pressure. proved to be nonsignificant (OR = 1.2, 95% CI 0.6–
2.38, P = 0.615). By contrast, SBP responsivity washighly predictive of SBP elevation (OR = 4.0, 95% CIhad elevated SBP (>140 mm Hg) at follow-up. The2.0–8.0, P , 0.001). Age also remained significant.total number of persons at follow-up with elevated
Finally; we wanted to ensure that the predictiveSBP was 179. The major hypothesis of this study,power of SBP responsivity reported above for thethat pressure response at entry would predict elev-entire sample did not stem from the inclusion of per-ation of BP at follow-up, was first tested throughsons with high normal or elevated baseline SBPunivariate analysis, which contrasted the percentagevalues at entry. We applied the same logisticof high pressure responders among those with nor-regression model to the subgroup of persons withmal SBP values and among those with elevated SBPbaseline SBP values less than 130 mm Hg. Thevalues. Included in this analysis were other poten-results indicated that SBP responsivity was predic-tial predictors/confounders. The results are given intive of elevated SBP at follow-up also in this sub-Table 2.group (OR = 2.5, 95% CI 1.2–5.1, P , 0.02). OtherThese results show that the percentage of highpredictors again were baseline SBP (by 10 mm Hg,responders (62.6%) was significantly higher amongOR = 4.2, 95% CI 2.4–6.7, P , 0.001) and age (bypersons with elevated SBP values, compared to that10 yrs, OR = 1.7, 95% CI 1.3–2.4, P = 0.006), but notamong persons with normal SBP values (43.4%) (PBMI (by quartiles, OR = 1.3, 95% CI 0.95–1.8, P =,0.0001). Significant differences in the expected0.103). Thus, taken together these results confirmdirection were also observed for initial SBP (Pthe predictive power of SBP responsivity across all,0.0001) and DBP (P ,0.0001), age (P ,0.0001) andrange of baseline SBP values.BMI (P ,0.0001). No significant results were
obtained for occupational status (blue vs white col-lar work), physical effort at work, smoking and alco- Discussionhol consumption.
To date, nearly all studies of pressure response toThe ability of the pressure response to predictBP determination at the physician’s office have dealtelevation of SBP at follow-up was tested in multi-with the measurement error it introduces3–5 and thevariate analysis, using logistic regression. The vari-consequent overestimation of baseline values con-ables found to be significant in the univariate analy-tributing to the diagnosis of white-coat hyperten-sis were entered into the regression. The results aresion.10 The findings of this large-scale follow-upgiven in Table 3. For every 10 mm Hg increase instudy show that this response may also be predictivethe initial SBP there was a 3.4 times higher chanceof elevated SBP (>140 mm Hg) with time. Logisticof an elevated SBP (>140 mm Hg) at follow-up.regression results indicated that after controlling forAdditionally, SBP responsivity was found to be anbaseline SBP values, age, and BMI, persons withindependent predictor, with OR = 2.7. This was alsohigh initial SBP responsivity had a 2.7 times greatertrue for age, but not for BMI.
As a matter of interest, we tested also the capa-
Table 4 Logistic regression analysis predicting increased SBPTable 3 Logistic regression analysis on predicting elevated SBP (>140 mm Hg) at follow-up in those with initial SBP of 130-
139 mm Hg(>140 mm Hg) at follow-up in all subjects (n = 1217)
Variables at entry Odds 95% CI P Variables at entry Odds 95% CI Pradioratio
SBP baseline (by 10 mm Hg) 3.4 2.8–4.1 ,0.001 SBP baseline (by 10 mm Hg) 1.2 0.6–2.38 0.615SBP responsivity (Yes/No) 4.0 2.0–8.0 ,0.001SBP responsivity (Yes/No) 2.7 1.8–4.1 ,0.001
Age (by 10 yrs) 1.5 1.3–1.8 ,0.001 Age (by 10 yrs) 1.6 1.2–2.2 0.004BMI (quartiles) 1.1 0.8–1.5 0.387BMI (quartiles) 1.2 0.9–1.4 ,0.08
CI = confidence interval; SBP = systolic blood pressure; BMI = CI = confidence interval; SBP = systolic blood pressure; BMI =body mass index.body mass index.
Predicting blood pressure elevationS Melamed et al
105chance (95% CI 1.8–4.1, P , 0.0001) of having an regression analysis presented in Table 3, with defin-
ing SBP responsivity as a difference from the secondelevated SBP after 2.6 years of follow-up. We areunaware of any previous studies in adults that have reading to the fourth (both taken in the sitting
position). The results for the SBP responsivitytested the hypothesis that pressure hyper-responsiv-ity is an independent predictor of elevated BP over remained significant (OR = 1.96, 95% CI 1.31–2.95,
P = 0.0012).time. Additional significant predictors were baselineSBP values (OR = 3.4, 95% CI 2.8–4.1, P , 0.001) It is difficult to suggest a possible underlying
mechanism for the association between SBP respon-and age (OR = 1.5, 95% CI 1.3–1.8, P , 0.001). Otherpossible confounders such as smoking, alcohol con- sivity and elevation in SBP with time. There is no
evidence, as yet, that persons manifesting an exag-sumption, BMI, blue collar work and physical effortat work did not predict subsequent SBP levels. gerated pressure response to BP determination
would manifest a similar cardiovascular response toAn additional noteworthy finding here was that inpersons with high-normal initial baseline SBP other psychological stressors.8 No association was
found here between SBP responsivity and person-values (130–139 mm Hg), SBP responsivity washighly predictive of elevated SBP with time (OR = ality disposition (anger trait, emotional reactivity) or
psychoneurotic symptoms (somatic complaint, anxi-4.0, 95% CI 2.0–8.0, P , 0.001), whereas the base-line value was not (OR = 1.2, 95% CI 0.6–2.58, P = ety, irritability and depression). However, generaliz-
ing from recent findings concerning white-coat0.615). These findings if replicated in future studies,may contribute to the long-standing efforts to pre- hypertension,20,21 we may hypothesize that the
excessive pressure response might signify a prehy-dict later sustained hypertension in persons withhigh-normal baseline BP values. Further analysis of pertensive state. Given that this pressure response
is very easy to gauge, it is possible to accumulatethe data also indicated that the above predictivevalue of SBP responsivity in the total cohort did not new data or to utilize existing databases with longer
follow-up periods to crossvalidate the present find-stem from high normal baseline SBP values; repeat-ing the analysis for persons with lower baseline SBP ings and determine the effect of a longer interval.values (,130 mm Hg) yielded similar results (OR =2.5, 95% CI 1.2–5.1, P , 0.02). Acknowledgements
Consistent with findings of earlier studies,8This study was supported by a grant from the Com-responsivity to BP determination was observedmittee of Preventive Action and Research in Occu-mainly in the SBP value and negligibly in the DBPpational Health of the Ministry of Labor andvalue. Earlier studies conducted in small groups ofSocial Welfare.hypertensives did not show an association between
baseline values and the magnitude of the pressureresponse.2–4 However, in the present study, using a Referenceslarge group with a wide range of BP values who
1 Armitage D, Fox W, Rose GA, Tinker CM. The varia-were not receiving BP medication, the magnitude ofbility of measurements of casual blood pressure. II.the SBP responsivity was negatively related to theSurvey experience. Clin Sci 1966; 30: 334–337.baseline BP values. Such a negative association
2 Mancia G et al. Effects of blood pressure measurementbetween BP response to stress and the baseline hasby the doctor on patient’s blood pressure and heartbeen reported in laboratory studies.28 As a result of rate. Lancet 1983; ii: 695–697.
this finding, our classification of subjects into high 3 Mancia G et al. Alerting reaction and rise in bloodand low SBP responders was based on the average pressure during measurement by physician and nurse.value of the SBP response for the respective sub- Hypertension 1987; 9: 209–215.group with initially similar baseline values. Further 4 Mancia G et al. Effect of stress on diagnosis of hyper-
tension. Hypertension 1991; 17 (Suppl): III56–III62.large scale studies involving both normotensives5 Watson RDS et al. Variation in cuff blood pressure inand hypertensives are needed to crossvalidate our
untreated outpatients with mild hypertension – impli-results.cations for initiating anti-hypertensive treatment. JThis follow-up study, which included a large sam-Hypertens 1987; 5: 207–211.ple of employed persons, has a number of limi-
6 Mancia G et al. Doctor-elicited blood pressure rises attations. The average follow-up period was only 2.6 the time of sphygmomanometric blood pressureyears. It is likely that over time the predictive value assessment persist over repeated visits. J Hypertensof the initial SBP decreases and that of age and BMI 1995; 3 (Suppl): S421–S423.increases,29 but the effect of a longer follow-up per- 7 Shimada K et al. Non-invasive ambulatory bloodiod on the predictive value of SBP responsivity is pressure monitoring during clinic visit in elderly
hypertensive patients. Clin Exp Hypertens 1990; A12:unclear. Furthermore, our results may not apply to151–170.all industrial workers, since unrecognized biases
8 Pickering TG. Clinic measurement of blood pressuremay have characterized our selected group. Finallyand white-coat hypertension. In: Pickering TG (ed).our methods included the first BP measurement inAmbulatory Monitoring and Blood Pressure Varia-the supine position at rest, and the last measurementbility. Science Press Ltd: London, 1991, pp 7.1–7.14.taken at rest in the sitting position, after an 9 McCubbin JA. Gender effects on blood pressures
additional work period. To exclude the possibility obtained during an on-campus screening. Psychosomthat our results concerning the predictive power of Med 1991; 53: 90–100.SBP responsivity is not confounded by the fact that 10 Pickering TG et al. How common is white-coat hyper-the first BP was measured in the supine position, we tension? JAMA 1988; 259: 225–228.
11 White WB. Assessment of patients with office hyper-took the following post hoc step. We repeated the
Predicting blood pressure elevationS Melamed et al
106 tension by 24-hour noninvasive ambulatory blood 20 Burnier M et al. Renal sodium handling in patientswith untreated hypertension and white-coat hyperten-pressure monitoring. Arch Intern Med 1986; 146:
2196–2199. sion. Hypertension 1993; 23: 495–502.21 Bidlingmeyer M et al. Long-term evolution of blood12 Verdecchia P et al. Variability between current defi-
nitions of ‘normal’ ambulatory blood pressure. Impli- pressure inpatients with white-coat hypertension(abstract). J Hypertens 1994; 12 (Suppl 3): 7.cations in the assessment of white-coat hypertension.
Hypertension 1992; 20: 555–562. 22 Spielberger CD, Jacobs G, Russell S, Crane RS. Assess-ment of anger. The State-Trait Anger Scale. In: Butcher13 Pearce KA et al. Population-derived comparisons of
ambulatory and office blood pressures. Implications JN, Spielberger CD (eds). Advances in PersonalityAssessment, Vol 2. Lawrence Erlbaum: Hillsdale, NJ;for the determination of usual blood pressure and the
concept of white-coat hypertension. Arch Intern Med 1983, pp 159–192.23 Melamed, S. Emotional reactivity and elevated blood1992; 152: 750–756.
14 Cardillo C, De Felice F, Campia U, Folli G. Psychophy- pressure. Psychosom Med 1987; 49: 217–225.24 Caplan RD et al. Job demands and worker health: Mainsiological reactivity and cardiac end-organ changes in
white-coat hypertension. Hypertension 1993; 21: effects and occupational differences. Report toNational Institute for Occupational Safety and Health,836–844.
15 Julius S et al. ‘White-coat’ versus ‘sustained’ hyperten- HEW Publication No. (NIOSH), Washington, DC,1975,pp 75–160.sion in Tecumseh, Michigan. Hypertension 1990; 16:
617–623. 25 Kushnir T, Melamed S. Work-load, perceived controland psychological distress in Type A/B industrial16 Kuwajima I, Suzuki Y, Fujisawa A, Kuramoto K. Is
white-coat hypertension innocent? Structure and func- workers. J Organ Behav 1991; 12: 155–168.26 Zung WWK. A rating instrument for anxiety disorders.tion of the heart in the elderly. Hypertension 1993; 22:
826–831. Psychometrics 1971; 12: 371–379.27 Zung WWK. A self-ratingdepression scale. Arch Gen17 Verdecchia P et al. Ambulatory blood pressure: an
independent predictor of prognosis in essential hyper- Psychiatry 1965; 12: 63–70.28 Manuck SB et al. Psychophysiologic reactivity as atension. Hypertension 1994; 22: 766–770.
18 Gosse P, Promax H, Durendet P, Clementy J. ‘White- dimension of individual differences. In: SchneidermanN, Weiss SM, Kaufmann PG (eds). Handbook ofcoat’ hypertension: no harm for the heart. Hyperten-
sion 1993; 22: 766–770. Research Methods in Cardiovascular Behavioral Medi-cine. Plenum Press: New York; 1989, pp 365–382.19 Stein AD, Shea S, Basch CE, Zybert P. Blood pressure
reactivity does not correlate with baseline blood press- 29 Froom P et al. Predictive value of systolic blood press-ure in young men for elevated blood pressure 12 to 15ure or blood pressure change over time in preschool
children. Am J Epidemiol 1992; 136: 795–805. years later. Circulation 1983; 68: 467–469.
Related Documents