Ethylene Oxide Residuals An Alternative Testing Method Presented to ISO/TC 194 / WG11 Chicago, Illinois July 13, 2006

Welcome message from author
This document is posted to help you gain knowledge. Please leave a comment to let me know what you think about it! Share it to your friends and learn new things together.
Transcript

Ethylene Oxide Residuals
An Alternative Testing Method
Presented to ISO/TC 194 / WG11
Chicago, Illinois
July 13, 2006

Scientific AssumptionsScientific Assumptions
The rate limiting factor in The rate limiting factor in offgassingoffgassing is is the rate of release of the residue from the rate of release of the residue from the material, regardless of the matrix the material, regardless of the matrix being released intobeing released into
The rate of transfer of EO into clean air The rate of transfer of EO into clean air or nitrogen is equivalent to the rate of or nitrogen is equivalent to the rate of transfer into clean water based upon transfer into clean water based upon research by 3M scientistsresearch by 3M scientists

An Innovative New Alternative toAn Innovative New Alternative to
Existing Technologies ….Existing Technologies ….
• Detection of acids, bases, volatiles and semi-volatiles
simultaneously
• Quantitation and identification of compounds
• Fast collection and analysis time – Get Product to
Market Faster
• Low detection limits as required by guidelines

Historical Use of IR for EOHistorical Use of IR for EO
Proposed method is FTIR, not IRProposed method is FTIR, not IR
Interference problems were present in the Interference problems were present in the
past due to fixed wavelength IR past due to fixed wavelength IR technologytechnology
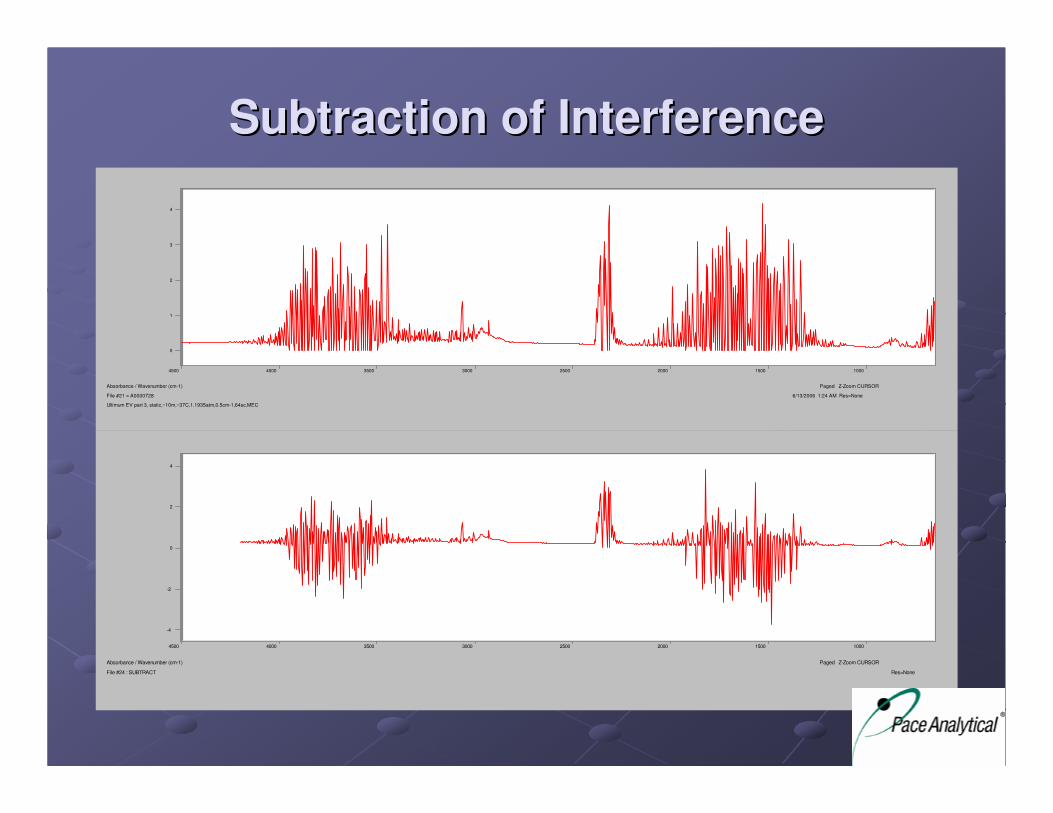
Subtraction of InterferenceSubtraction of Interference
0
1
2
3
4
4500 4000 3500 3000 2500 2000 1500 1000
Absorbance / Wavenumber (cm-1) Paged Z-Zoom CURSOR
File #21 = A0000728 6/13/2006 1:24 AM Res=None
Ultimum EV part 3, static,~10m,~37C,1.1935atm,0.5cm-1,64sc,MEC
-4
-2
0
2
4
4500 4000 3500 3000 2500 2000 1500 1000
Absorbance / Wavenumber (cm-1) Paged Z-Zoom CURSOR
File #24 : SUBTRACT Res=None

Effects on InterferenceEffects on Interference
0 100 200 300 400 500 600 700 800
Minutes
0.0
10.0
20.0
30.0
ppm
Ethylene_Oxide
0 100 200 300 400 500 600 700 800
Minutes
0.0
20.0
40.0
60.0
80.0
ppm
Ethylene_Oxide

FTIR Spectra of EO/ECH/EGFTIR Spectra of EO/ECH/EG
0
50E-05
.001
.0015
.002
.0025
4000 3500 3000 2500 2000 1500 1000
Absorbance / Wavenumber (cm-1) Paged Z-Zoom CURSOR
File #16 : ETOX_25T 4/13/2006 10:01 AM Res= .500
Ethylene oxide at 25 C, Composite spectrum (1 ppm-meter at 296 K)
0
10E-05
20E-05
30E-05
40E-05
4000 3500 3000 2500 2000 1500 1000
Absorbance / Wavenumber (cm-1) Paged Z-Zoom CURSOR
File #19 : CLETHO~1 4/13/2006 9:35 AM Res= .500
2-Chloroethanol at 25 C, Composite spectrum (1 ppm-meter at 296 K)
0
10E-05
20E-05
30E-05
40E-05
4000 3500 3000 2500 2000 1500 1000
Absorbance / Wavenumber (cm-1) Paged Z-Zoom CURSOR
File #18 : ETOHOH~1 4/13/2006 9:35 AM Res= .500
Ethylene glycol at 50 C, Composite spectrum (1 ppm-meter at 296 K)
EO Reference
Spectrum
ECH Reference
Spectrum
EG Reference
Spectrum
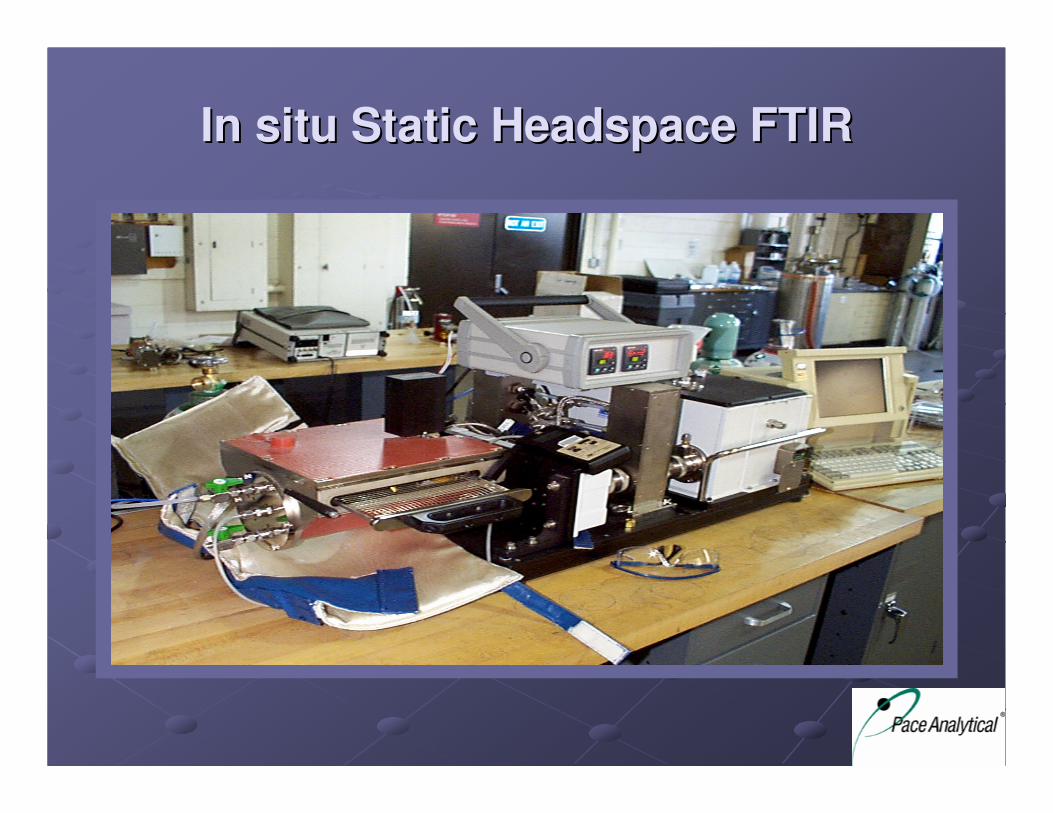
In situ Static Headspace FTIRIn situ Static Headspace FTIR

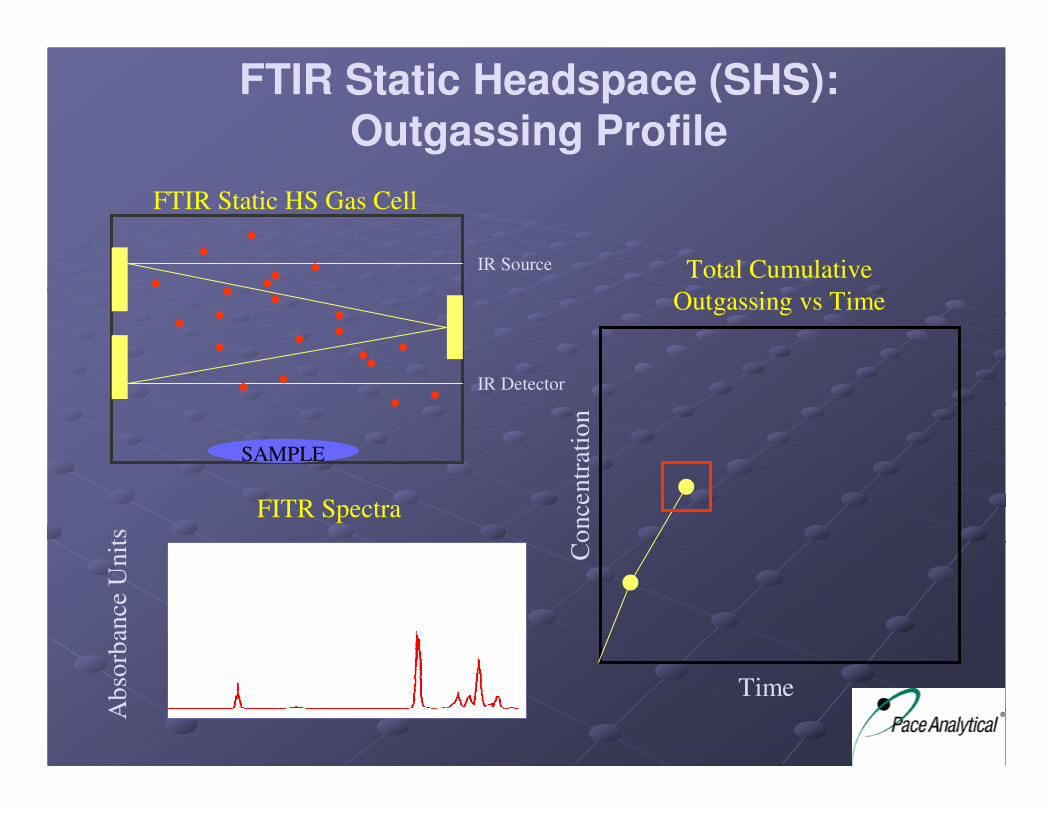
FTIR Static Headspace (SHS):
Outgassing Profile
FITR Spectra
Co
nce
ntr
atio
n
Ab
sorb
ance
Unit
s
Time
FTIR Static HS Gas Cell
Total Cumulative
Outgassing vs Time
SAMPLE
IR Source
IR Detector
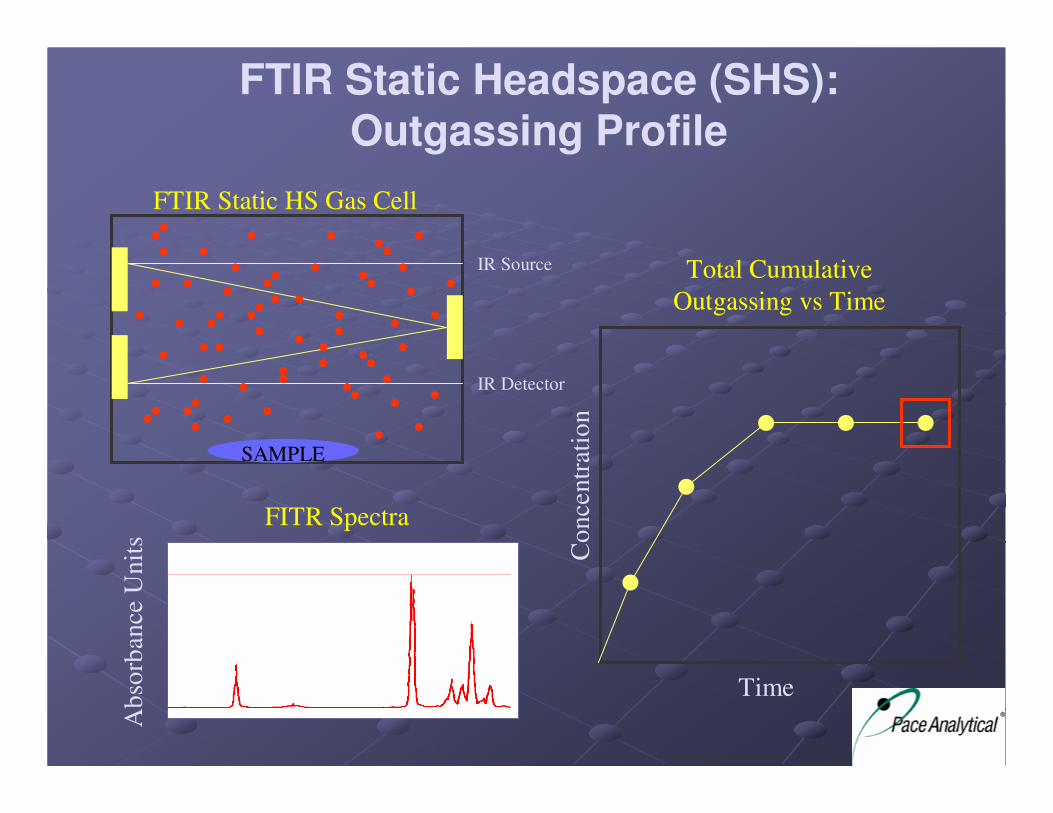
FTIR Static Headspace (SHS):
Outgassing Profile
FITR Spectra
Co
nce
ntr
atio
n
Ab
sorb
ance
Unit
s
Time
FTIR Static HS Gas Cell
Total Cumulative
Outgassing vs Time
SAMPLE
IR Source
IR Detector

FTIR Static Headspace (SHS):
Outgassing Profile
FITR Spectra
Co
nce
ntr
atio
n
Ab
sorb
ance
Unit
s
Time
FTIR Static HS Gas Cell
Total Cumulative
Outgassing vs Time
SAMPLE
IR Source
IR Detector

FTIR Static Headspace (SHS):
Outgassing Profile
FTIR Static HS Gas Cell
Total Cumulative
Outgassing vs Time
FITR Spectra
Co
nce
ntr
atio
n
Ab
sorb
ance
Unit
s
Time
SAMPLE
IR Source
IR Detector
FTIR Static Headspace (SHS):
Outgassing Profile
FTIR Static HS Gas Cell
Total Cumulative
Outgassing vs Time
FITR Spectra
Co
nce
ntr
atio
n
Ab
sorb
ance
Unit
s
Time
SAMPLE
IR Source
IR Detector
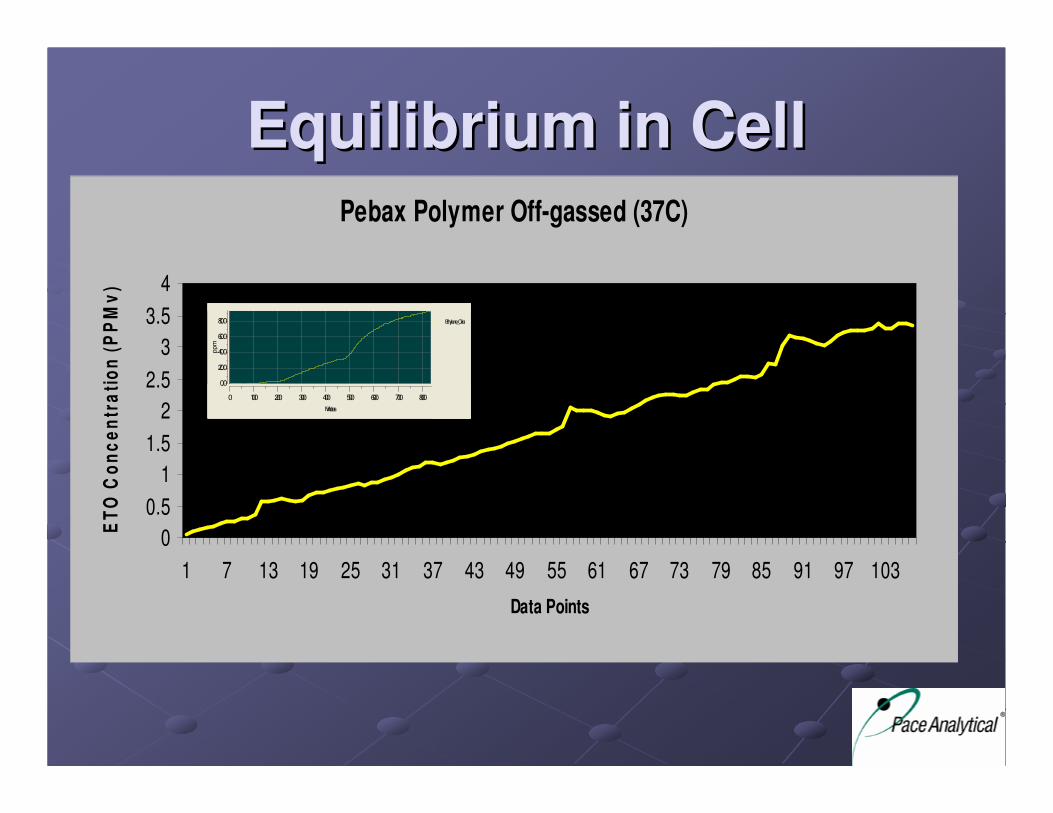
Pebax Polymer Off-gassed (37C)
0
0.5
1
1.5
2
2.5
3
3.5
4
1 7 13 19 25 31 37 43 49 55 61 67 73 79 85 91 97 103
Data Points
ET
O C
on
ce
ntr
ati
on
(P
PM
v)
0 100 200 300 400 500 600 700 800
Minutes
0.0
20.0
40.0
60.0
80.0
ppm
Ethylene_Oxide
Equilibrium in CellEquilibrium in Cell

Simulated Use Simulated Use –– 24 Hr & 37 24 Hr & 37 ooCC
0 200 400 600 800 1000 1200 1400
Minutes
0.0
10.0
20.0
30.0
40.0
pp
m
Ethylene_Oxide

Rate Determinations (24 hrs & 37 Rate Determinations (24 hrs & 37 ooCC))
EO Release Rates
-10
0
10
20
30
40
50
0 50 100 150 200 250 300 350
Time (minutes)
EO
Co
ncen
tratio
n (P
PM
v)
1 to 5 hrs
5 to 10 hrs
10 to 15 hrs
15 to 20 hrs
20 to 24 hrs
Linear (1 to 5

DescriptionDescription 5 Hour5 Hour Release Release ExtrapolatedExtrapolated
MaximumsMaximums RateRate Simulated UseSimulated Use
PPMv/min
0.1506
0.1126
0.0973
0.0911
0.0917
µg/g
15.1
11.8
10.1
9.4
4.4
µg/g*24hr
69.6
52.1
45.0
42.1
42.4
Sum of [EO] 50.7Average [EO] 50.2
1 to 5 hours
5 to 10 hours
10 to 15 hours
15 to 20 hours
20 to 24 hours
Summary of ResultsSummary of Results

Simulated Use Test Simulated Use Test
ComparisonsComparisonsAnalytical Method
Extraction Time
Extraction Temperature
Number of Replicates
Concentration
Static Headspace GCFIDStatic Headspace GCFID
24 Hrs.24 Hrs.
37 37 ooCC
22
µµg/gg/g
SPME GCFIDSPME GCFID
24 Hrs.24 Hrs.
37 37 ooCC
33
µµg/gg/g
In Situ FTIRIn Situ FTIR
2 Hrs.2 Hrs.
37 37 ooCC
33
µµg/gg/g
Stainless Steel <5 <0.9 <0.7
Polypropylene/Pebax 21 ± 3 29 ± 7 ** 34 ± 11
Pebax 21 ± 1 30 ± 2 22 ± 0.3
Multi-Component Polymer 57 (1 Rep) 105 (1 Rep) 50 (1 Rep)
** 2 replicates were usedSPME Concentrations are estimated because different volumes were used between standards and extracts.

FTIR Static Headspace (SHS):
Outgassing Profile
FTIR Static HS Gas Cell
Total Cumulative
Outgassing vs Time
FITR Spectra
Co
nce
ntr
atio
n
Ab
sorb
ance
Unit
s
Time
SAMPLE
IR Source
IR Detector

Exhaustive Test ComparisonsExhaustive Test Comparisons
192192178178MultiMulti--Component PolymerComponent Polymer
52 52 ±± 2255 55 ±± 33PebaxPebax
< 0.7< 0.7< 0.9 < 0.9 Stainless SteelStainless Steel
2222Number of ReplicatesNumber of Replicates
14 Hrs.14 Hrs.5 Days5 DaysTime Required to Reach ExhaustionTime Required to Reach Exhaustion
1133Number of ExtractionsNumber of Extractions
InIn--situ FTIRsitu FTIRSPME GCFIDSPME GCFIDAnalytical MethodAnalytical MethodAnalytical Method SPME GCFID In-situ FTIRNumber of Extractions 3 1Time Required to Reach Exhaustion 5 Days 14 Hrs.Number of Replicates 2 2
Concentration µµµµg/g µµµµg/g

Method AdvantagesMethod Advantages
RealReal--time data collection allows time data collection allows
calculation of EO release rates (and ECH calculation of EO release rates (and ECH
formulation) formulation)
�� “tolerable contact” evaluations“tolerable contact” evaluations
FTIR method allows simultaneous data FTIR method allows simultaneous data
collection for materials characterization collection for materials characterization (ISO 10993(ISO 10993--18 )18 )

Method AdvantagesMethod Advantages
Since FTIR is additive, interferences can be Since FTIR is additive, interferences can be
subtractedsubtracted
EO/ECH/EG can be detected in a single test EO/ECH/EG can be detected in a single test using fewer devices for testingusing fewer devices for testing
Detection limits for EO are lower than GC Detection limits for EO are lower than GC
methodsmethods
Method AdvantagesMethod Advantages
Broad range of selectivity for detection of Broad range of selectivity for detection of
organic compoundsorganic compounds
Multiple spectral regions can be used to Multiple spectral regions can be used to quantify compoundsquantify compounds
Recent ASTM, NIOSH & EPA approvalsRecent ASTM, NIOSH & EPA approvals
--Method has been validatedMethod has been validated

ConclusionsConclusions
Demonstrated equivalency of simulated useDemonstrated equivalency of simulated use
Demonstrated equivalency of exhaustive testDemonstrated equivalency of exhaustive test
Confirmed ability to provide additional Confirmed ability to provide additional
informationinformation
�� Calculation of release ratesCalculation of release rates
�� Multiple test results on a single sampleMultiple test results on a single sample
�� Shorter test timeShorter test time
�� Quantification of other Quantification of other leachablesleachables

Industries using TechnologyIndustries using Technology
SemiSemi--conductor industry conductor industry
FluorochemicalFluorochemical manufacturing industrymanufacturing industry
Electronics industryElectronics industry
3M uses as standard test procedure for materials 3M uses as standard test procedure for materials characterizationcharacterization
Promulgated government standards:Promulgated government standards:�� ASTM D6348ASTM D6348--98 (Material Off Gassing D667098 (Material Off Gassing D6670--1 & 1 &
D5116D5116--97)97)
�� NIOSH 3800NIOSH 3800
�� EPA Method 320 EPA Method 320

Next StepsNext StepsCurrently performing IQOQ on equipmentCurrently performing IQOQ on equipment
Validating test method for the analysis of Validating test method for the analysis of
EO/ECH/EGEO/ECH/EG
Publishing in scientific journal within a yearPublishing in scientific journal within a year
Evaluate & develop other applicationsEvaluate & develop other applications
�� Currently validating a method for the analysis Currently validating a method for the analysis of water content in polymers to assist with of water content in polymers to assist with establishing manufacturing specificationsestablishing manufacturing specifications
COMMENTS & QUESTIONS?COMMENTS & QUESTIONS?

Cost Analysis of FTIR vs. SPMECost Analysis of FTIR vs. SPME
Capital equipment cost ~ $100,000Capital equipment cost ~ $100,000
Operator skill level Operator skill level –– chemist with FTIR chemist with FTIR experience desiredexperience desired
Supply costs Supply costs –– less than GCless than GC
Maintenance costs Maintenance costs –– similar to GCsimilar to GC
Space required Space required –– similar to similar to GCw/oGCw/o
extraction spaceextraction space
Total cost Total cost –– competitive with GCcompetitive with GC
Related Documents