Welcome message from author
This document is posted to help you gain knowledge. Please leave a comment to let me know what you think about it! Share it to your friends and learn new things together.
Transcript

COPY FOR ASTRA INTERNATIONAL
Certain statements in this presentation concerning our future growth prospects are forward-looking statements, which involve a number of risks and
uncertainties that could cause actual results to differ materially from those in such forward-looking statements. These forward-looking statements
reflect our current views with respect to future events and financial performance and are subject to certain risks and uncertainties, which could
cause actual results to differ materially from historical results or those anticipated.
The risks and uncertainties relating to these statements include, but are not limited to, risks and uncertainties regarding fluctuations in earnings, our
ability to manage growth, intense competition in the Indonesian retail industry including those factors which may affect our ability to attract and
retain suitable tenants, our ability to manage our operations, reduced demand for retail spaces, our ability to successfully complete and integrate
potential acquisitions, liability for damages on our property portfolios, the success of the retail malls and retail spaces we currently own, withdrawal
of tax incentives, political instability, and legal restrictions on raising capital or acquiring real property in Indonesia. In addition to the foregoing
factors, a description of certain other risks and uncertainties which could cause actual results to differ materially can be found in the section
captioned "Risk Factors" in our preliminary prospectus lodged with the Monetary Authority of Singapore on 19 October 2007. Although we believe
the expectations reflected in such forward-looking statements are based upon reasonable assumptions, we can give no assurance that our
expectations will be attained.
You are cautioned not to place undue reliance on these forward-looking statements, which are based on the current view of management on future
events. We undertake no obligation to publicly update or revise any forward looking statements, whether as a result of new information, future
events or otherwise. The value of units in LMIRT (“Units”) and the income derived from them may fall as well as rise. The Units are not obligations
of, deposits in, or guaranteed by, LMIRT Management Ltd, as manager of LMIR Trust (the “Manager”) or any of its affiliates. An investment in Units
is subject to investment risks, including the possible loss of the principal amount invested.
Investors have no right to request the Manager to redeem their Units while the Units are listed. It is intended that Unitholders may only deal in their
Units through trading on Singapore Exchange Securities Trading Limited. Listing of the Units on the SGX-ST does not guarantee a liquid market for
the Units.
This document is for information only and does not constitute an invitation or offer to acquire, purchase or subscribe for the Units. The past
performance of LMIRT is not necessarily indicative of the future performance of LMIRT.
Disclaimer
1

Click to edit Master title style
▪ Click to edit Master text styles
Second level
▪ Third level
Fourth level
» Fifth level
2
Financial Highlights
Portfolio Performance
Growth Outlook
Acquisitions
COPY FOR ASTRA INTERNATIONAL
Notes:
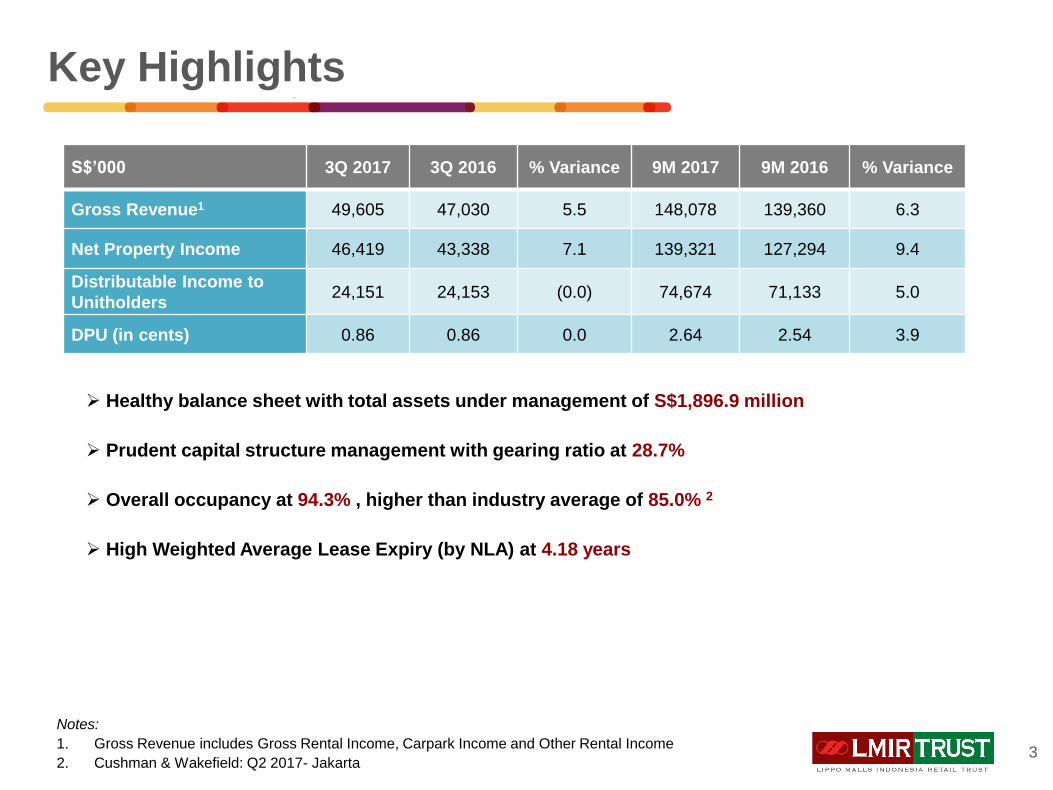
1. Gross Revenue includes Gross Rental Income, Carpark Income and Other Rental Income
2. Cushman & Wakefield: Q2 2017- Jakarta
➢ Healthy balance sheet with total assets under management of S$1,896.9 million
➢ Prudent capital structure management with gearing ratio at 28.7%
➢ Overall occupancy at 94.3% , higher than industry average of 85.0% 2
➢ High Weighted Average Lease Expiry (by NLA) at 4.18 years
S$’000 3Q 2017 3Q 2016 % Variance 9M 2017 9M 2016 % Variance
Gross Revenue1 49,605 47,030 5.5 148,078 139,360 6.3
Net Property Income 46,419 43,338 7.1 139,321 127,294 9.4
Distributable Income to
Unitholders24,151 24,153 (0.0) 74,674 71,133 5.0
DPU (in cents) 0.86 0.86 0.0 2.64 2.54 3.9
Key Highlights
3
COPY FOR ASTRA INTERNATIONAL
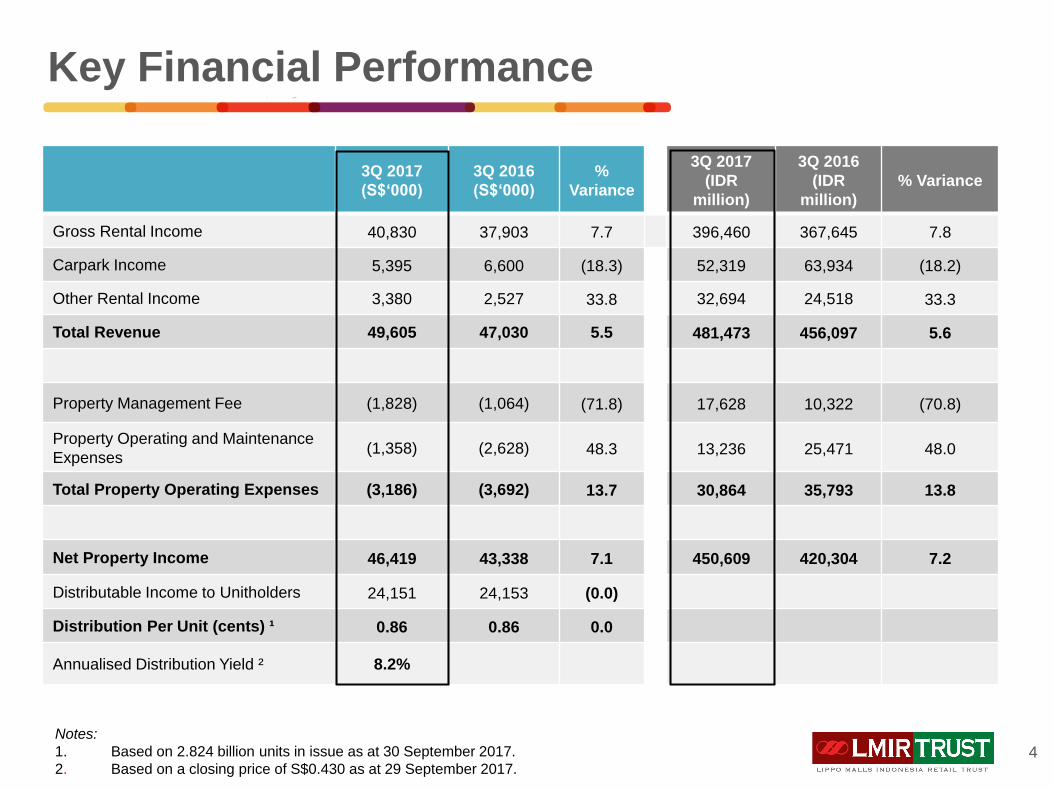
Notes:
1. Based on 2.824 billion units in issue as at 30 September 2017.
2. Based on a closing price of S$0.430 as at 29 September 2017.
3Q 2017
(S$‘000)
3Q 2016
(S$‘000)
%
Variance
3Q 2017
(IDR
million)
3Q 2016
(IDR
million)
% Variance
Gross Rental Income 40,830 37,903 7.7 396,460 367,645 7.8
Carpark Income 5,395 6,600 (18.3) 52,319 63,934 (18.2)
Other Rental Income 3,380 2,527 33.8 32,694 24,518 33.3
Total Revenue 49,605 47,030 5.5 481,473 456,097 5.6
Property Management Fee (1,828) (1,064) (71.8) 17,628 10,322 (70.8)
Property Operating and Maintenance
Expenses(1,358) (2,628) 48.3 13,236 25,471 48.0
Total Property Operating Expenses (3,186) (3,692) 13.7 30,864 35,793 13.8
Net Property Income 46,419 43,338 7.1 450,609 420,304 7.2
Distributable Income to Unitholders 24,151 24,153 (0.0)
Distribution Per Unit (cents) ¹ 0.86 0.86 0.0
Annualised Distribution Yield ² 8.2%
Key Financial Performance
4
COPY FOR ASTRA INTERNATIONAL
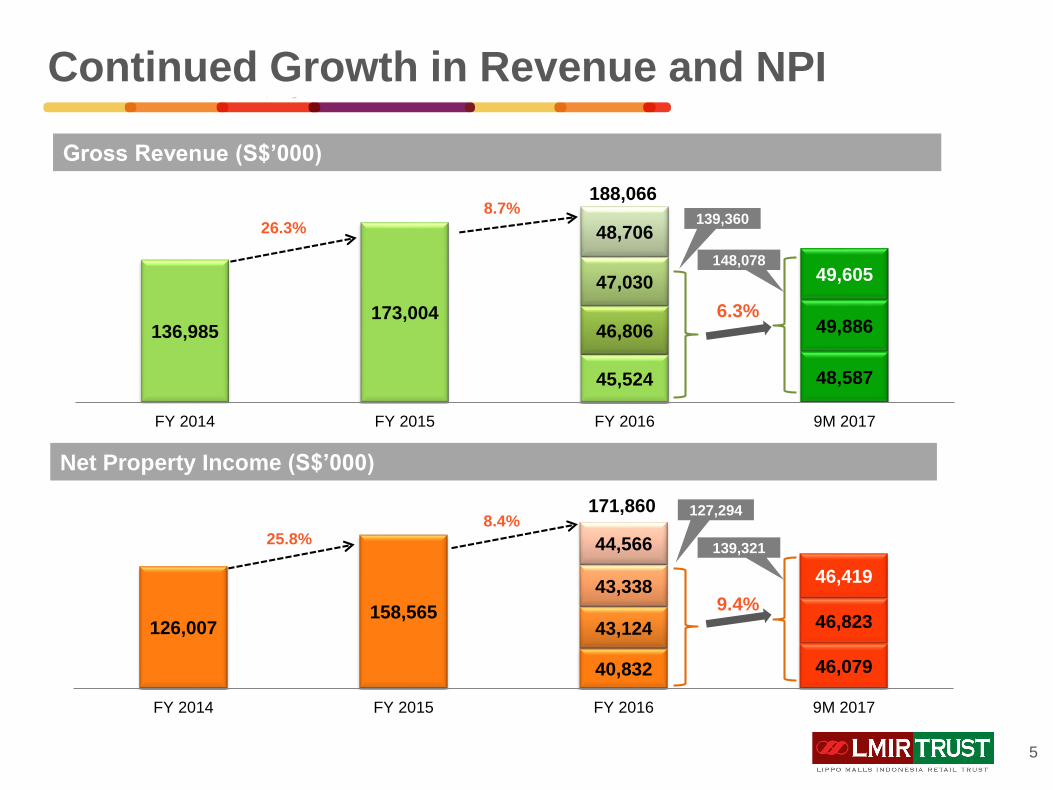
Gross Revenue (S$’000)
Net Property Income (S$’000)
Continued Growth in Revenue and NPI
5
136,985173,004
45,524 48,587
46,806 49,886
47,030 49,605
48,706
FY 2014 FY 2015 FY 2016 9M 2017
126,007158,565
40,832 46,079
43,124 46,823
43,33846,419
44,566
FY 2014 FY 2015 FY 2016 9M 2017
26.3%
8.7%
25.8%8.4%
188,066
6.3%
171,860
139,360
148,078
9.4%
127,294
139,321
COPY FOR ASTRA INTERNATIONAL
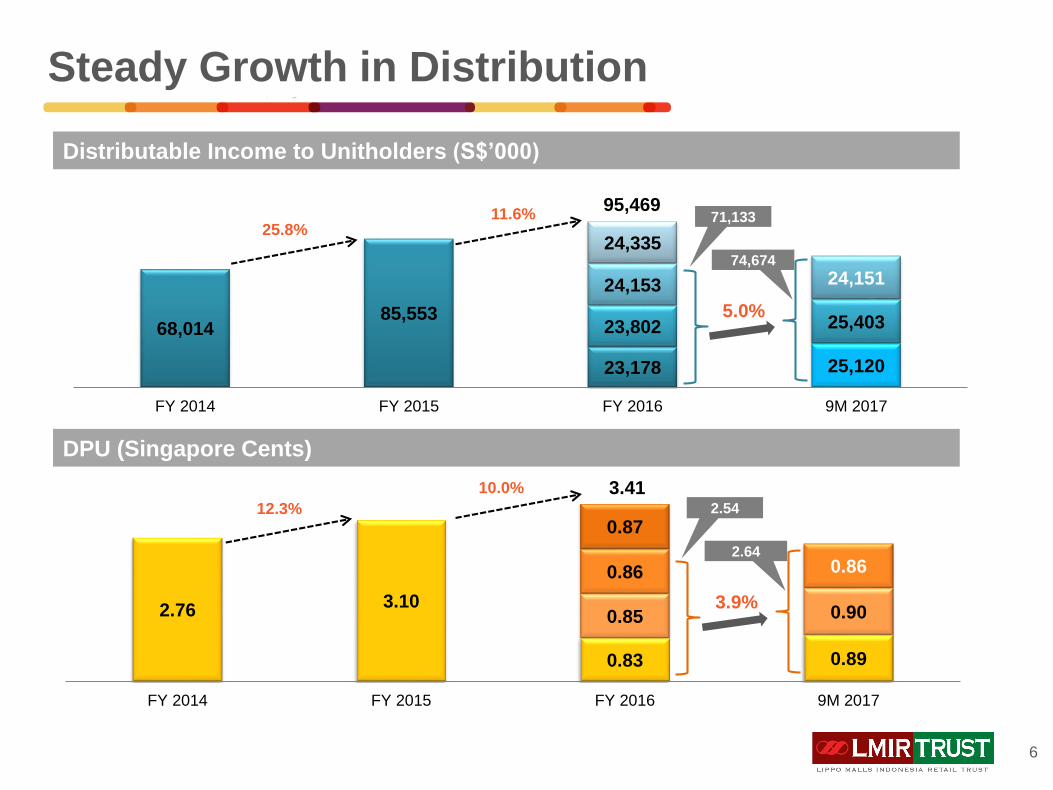
Distributable Income to Unitholders (S$’000)
DPU (Singapore Cents)
Steady Growth in Distribution
6
68,01485,553
23,178 25,120
23,802 25,403
24,153 24,151
24,335
FY 2014 FY 2015 FY 2016 9M 2017
25.8%11.6%
95,469
5.0%
71,133
74,674
2.763.10
0.83 0.89
0.85 0.90
0.86 0.86
0.87
FY 2014 FY 2015 FY 2016 9M 2017
3.9%
2.54
2.64
12.3%
10.0% 3.41
COPY FOR ASTRA INTERNATIONAL
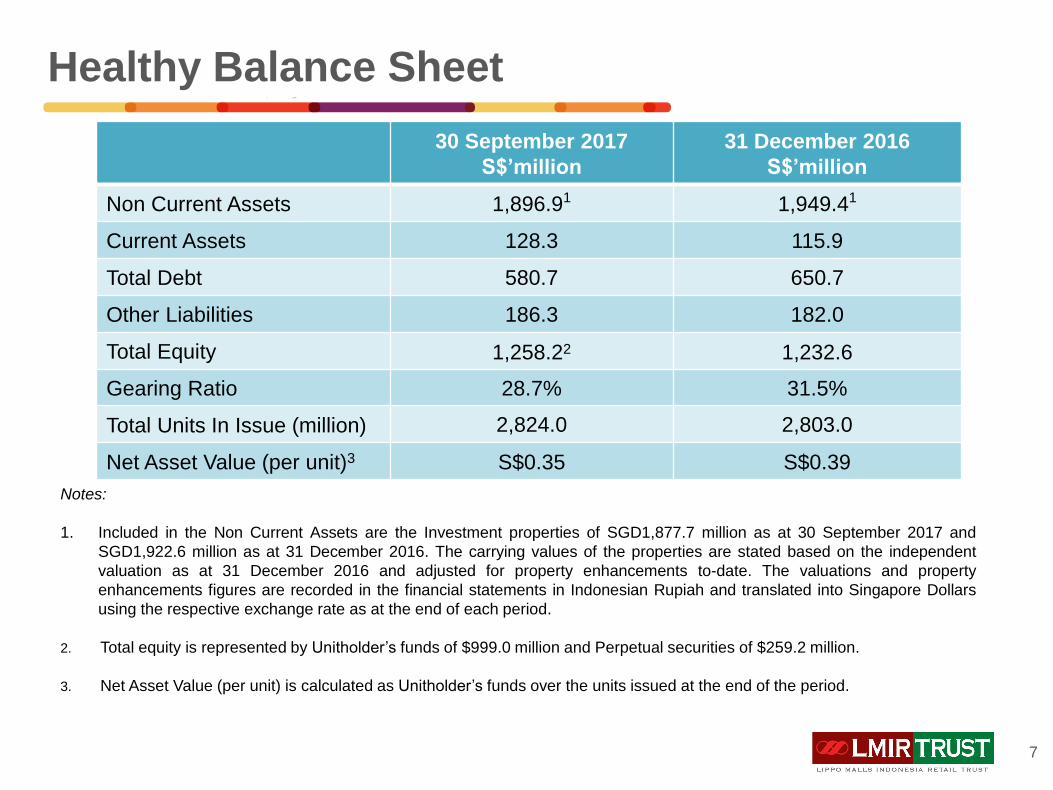
Notes:
1. Included in the Non Current Assets are the Investment properties of SGD1,877.7 million as at 30 September 2017 and
SGD1,922.6 million as at 31 December 2016. The carrying values of the properties are stated based on the independent
valuation as at 31 December 2016 and adjusted for property enhancements to-date. The valuations and property
enhancements figures are recorded in the financial statements in Indonesian Rupiah and translated into Singapore Dollars
using the respective exchange rate as at the end of each period.
2. Total equity is represented by Unitholder’s funds of $999.0 million and Perpetual securities of $259.2 million.
3. Net Asset Value (per unit) is calculated as Unitholder’s funds over the units issued at the end of the period.
30 September 2017
S$’million
31 December 2016
S$’million
Non Current Assets 1,896.91 1,949.41
Current Assets 128.3 115.9
Total Debt 580.7 650.7
Other Liabilities 186.3 182.0
Total Equity 1,258.22 1,232.6
Gearing Ratio 28.7% 31.5%
Total Units In Issue (million) 2,824.0 2,803.0
Net Asset Value (per unit)3 S$0.35 S$0.39
Healthy Balance Sheet
7
COPY FOR ASTRA INTERNATIONAL
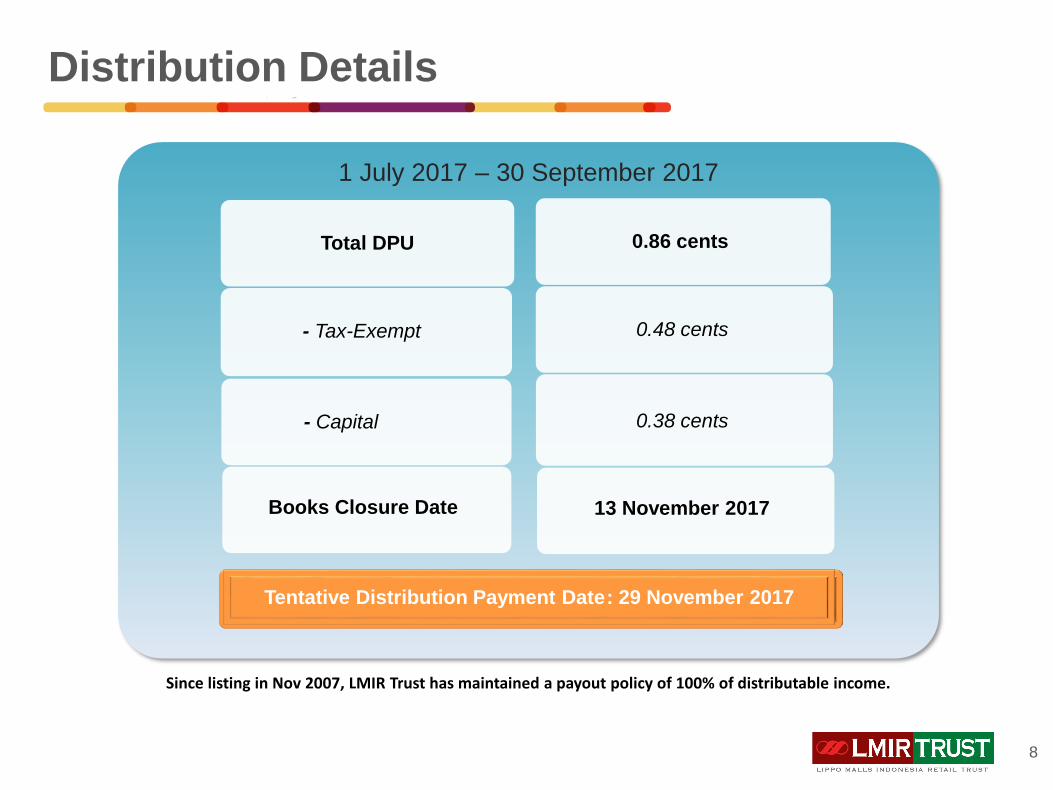
Since listing in Nov 2007, LMIR Trust has maintained a payout policy of 100% of distributable income.
Tentative Distribution Payment Date: 29 November 2017
1 July 2017 – 30 September 2017
Total DPU
- Tax-Exempt
- Capital
Books Closure Date
0.86 cents
0.48 cents
0.38 cents
13 November 2017
Distribution Details
8

Click to edit Master title style
▪ Click to edit Master text styles
Second level
▪ Third level
Fourth level
» Fifth level
9
Financial Highlights
Portfolio Performance
Growth Outlook
Acquisitions
Click to edit Master title style
▪ Click to edit Master text styles
Second level
▪ Third level
Fourth level
» Fifth level
10
10
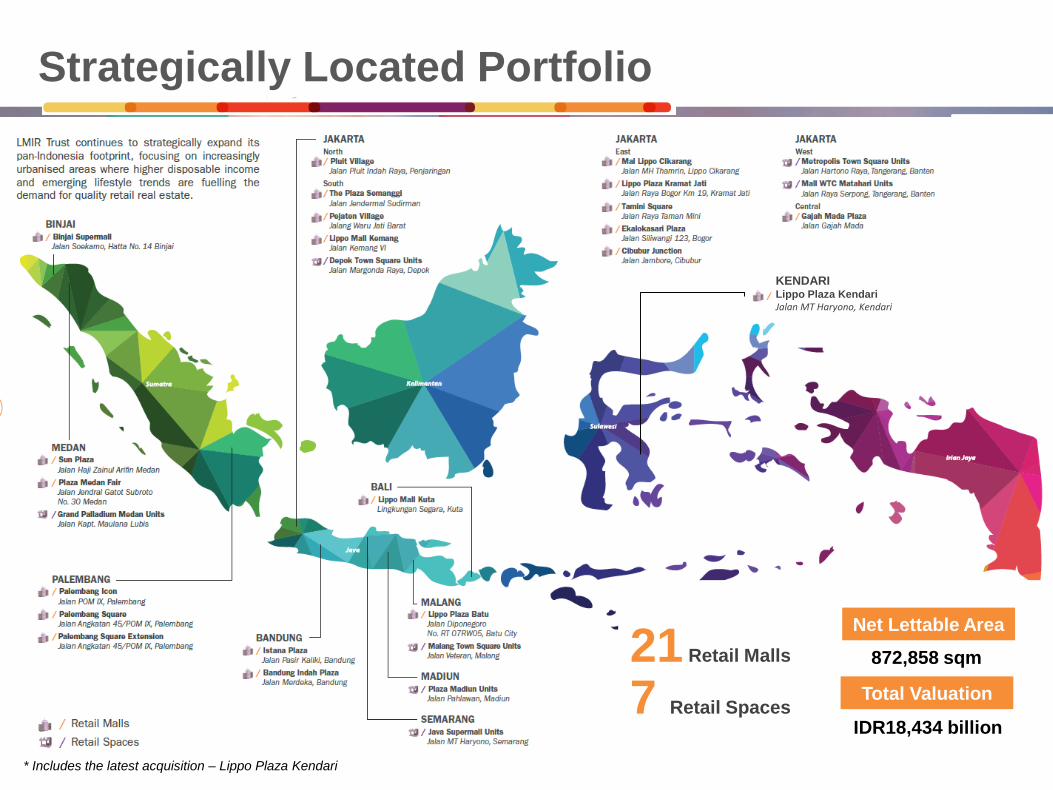
Strategically Located Portfolio
21 Retail Malls
7 Retail Spaces
KENDARILippo Plaza KendariJalan MT Haryono, Kendari
872,858 sqm
IDR18,434 billion
Total Valuation
Net Lettable Area
* Includes the latest acquisition – Lippo Plaza Kendari
COPY FOR ASTRA INTERNATIONAL
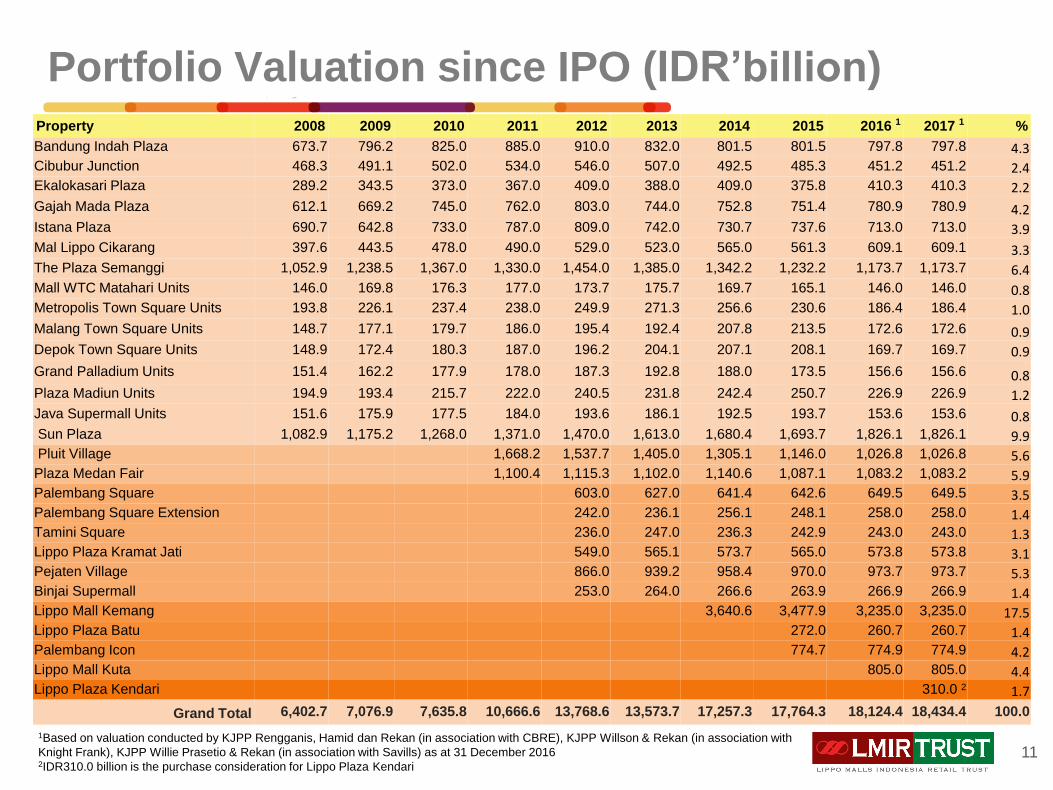
Portfolio Valuation since IPO (IDR’billion)
11
Property 2008 2009 2010 2011 2012 2013 2014 2015 2016 1 2017 1 %
Bandung Indah Plaza 673.7 796.2 825.0 885.0 910.0 832.0 801.5 801.5 797.8 797.8 4.3Cibubur Junction 468.3 491.1 502.0 534.0 546.0 507.0 492.5 485.3 451.2 451.2 2.4Ekalokasari Plaza 289.2 343.5 373.0 367.0 409.0 388.0 409.0 375.8 410.3 410.3 2.2
Gajah Mada Plaza 612.1 669.2 745.0 762.0 803.0 744.0 752.8 751.4 780.9 780.9 4.2Istana Plaza 690.7 642.8 733.0 787.0 809.0 742.0 730.7 737.6 713.0 713.0 3.9Mal Lippo Cikarang 397.6 443.5 478.0 490.0 529.0 523.0 565.0 561.3 609.1 609.1 3.3The Plaza Semanggi 1,052.9 1,238.5 1,367.0 1,330.0 1,454.0 1,385.0 1,342.2 1,232.2 1,173.7 1,173.7 6.4Mall WTC Matahari Units 146.0 169.8 176.3 177.0 173.7 175.7 169.7 165.1 146.0 146.0 0.8Metropolis Town Square Units 193.8 226.1 237.4 238.0 249.9 271.3 256.6 230.6 186.4 186.4 1.0
Malang Town Square Units 148.7 177.1 179.7 186.0 195.4 192.4 207.8 213.5 172.6 172.6 0.9Depok Town Square Units 148.9 172.4 180.3 187.0 196.2 204.1 207.1 208.1 169.7 169.7 0.9
Grand Palladium Units 151.4 162.2 177.9 178.0 187.3 192.8 188.0 173.5 156.6 156.6 0.8Plaza Madiun Units 194.9 193.4 215.7 222.0 240.5 231.8 242.4 250.7 226.9 226.9 1.2Java Supermall Units 151.6 175.9 177.5 184.0 193.6 186.1 192.5 193.7 153.6 153.6 0.8Sun Plaza 1,082.9 1,175.2 1,268.0 1,371.0 1,470.0 1,613.0 1,680.4 1,693.7 1,826.1 1,826.1 9.9Pluit Village 1,668.2 1,537.7 1,405.0 1,305.1 1,146.0 1,026.8 1,026.8 5.6Plaza Medan Fair 1,100.4 1,115.3 1,102.0 1,140.6 1,087.1 1,083.2 1,083.2 5.9Palembang Square 603.0 627.0 641.4 642.6 649.5 649.5 3.5Palembang Square Extension 242.0 236.1 256.1 248.1 258.0 258.0 1.4Tamini Square 236.0 247.0 236.3 242.9 243.0 243.0 1.3Lippo Plaza Kramat Jati 549.0 565.1 573.7 565.0 573.8 573.8 3.1Pejaten Village 866.0 939.2 958.4 970.0 973.7 973.7 5.3Binjai Supermall 253.0 264.0 266.6 263.9 266.9 266.9 1.4Lippo Mall Kemang 3,640.6 3,477.9 3,235.0 3,235.0 17.5Lippo Plaza Batu 272.0 260.7 260.7 1.4Palembang Icon 774.7 774.9 774.9 4.2Lippo Mall Kuta 805.0 805.0 4.4Lippo Plaza Kendari 310.0 2 1.7
Grand Total 6,402.7 7,076.9 7,635.8 10,666.6 13,768.6 13,573.7 17,257.3 17,764.3 18,124.4 18,434.4 100.0
1Based on valuation conducted by KJPP Rengganis, Hamid dan Rekan (in association with CBRE), KJPP Willson & Rekan (in association with
Knight Frank), KJPP Willie Prasetio & Rekan (in association with Savills) as at 31 December 2016 2IDR310.0 billion is the purchase consideration for Lippo Plaza Kendari
COPY FOR ASTRA INTERNATIONAL
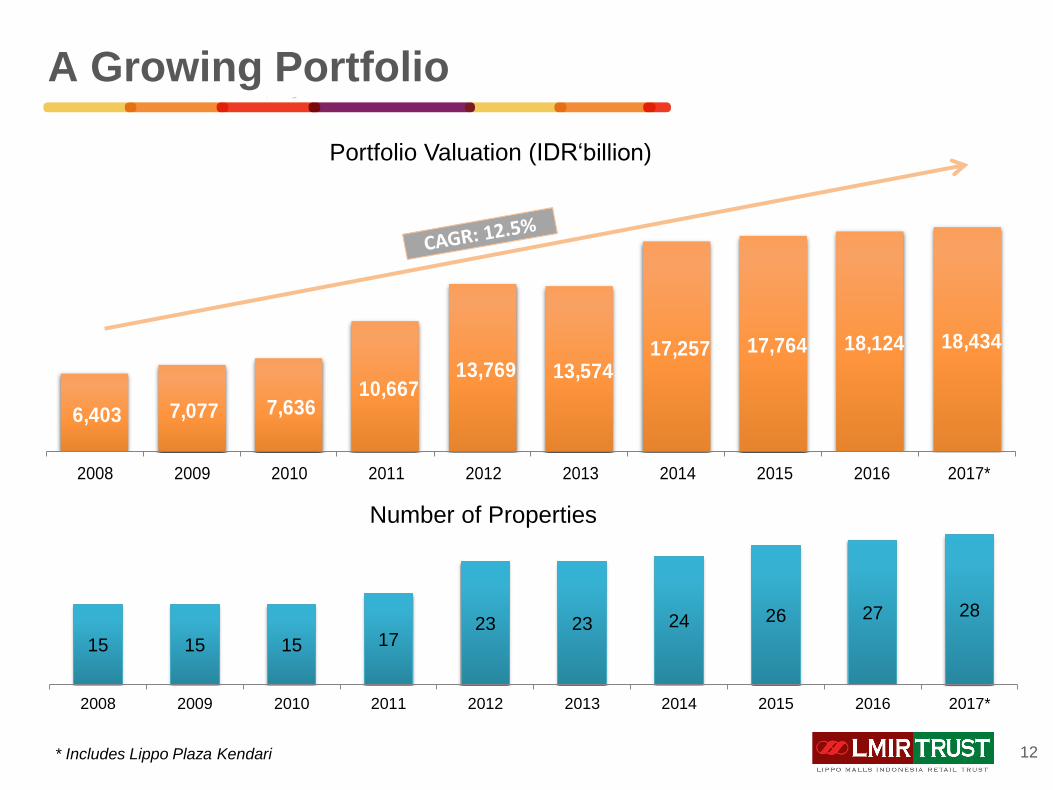
A Growing Portfolio
12
6,403 7,077 7,636 10,667
13,769 13,574 17,257 17,764 18,124 18,434
2008 2009 2010 2011 2012 2013 2014 2015 2016 2017*
Portfolio Valuation (IDR‘billion)
15 15 15 1723 23 24 26 27 28
2008 2009 2010 2011 2012 2013 2014 2015 2016 2017*
Number of Properties
12* Includes Lippo Plaza Kendari
COPY FOR ASTRA INTERNATIONAL
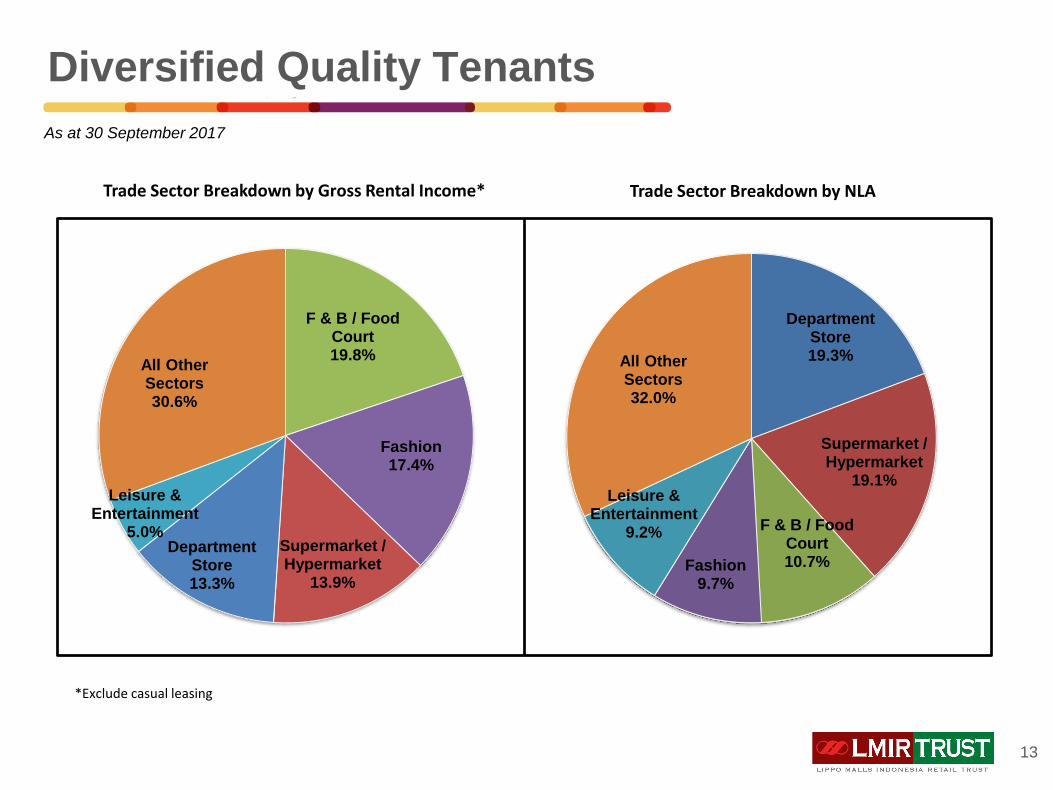
As at 30 September 2017
Diversified Quality Tenants
13
Trade Sector Breakdown by Gross Rental Income* Trade Sector Breakdown by NLA
Department Store19.3%
Supermarket / Hypermarket
19.1%
F & B / Food Court10.7%Fashion
9.7%
Leisure & Entertainment
9.2%
All Other Sectors32.0%
F & B / Food Court19.8%
Fashion17.4%
Supermarket / Hypermarket
13.9%
Department Store13.3%
Leisure & Entertainment
5.0%
All Other Sectors30.6%
*Exclude casual leasing
COPY FOR ASTRA INTERNATIONAL
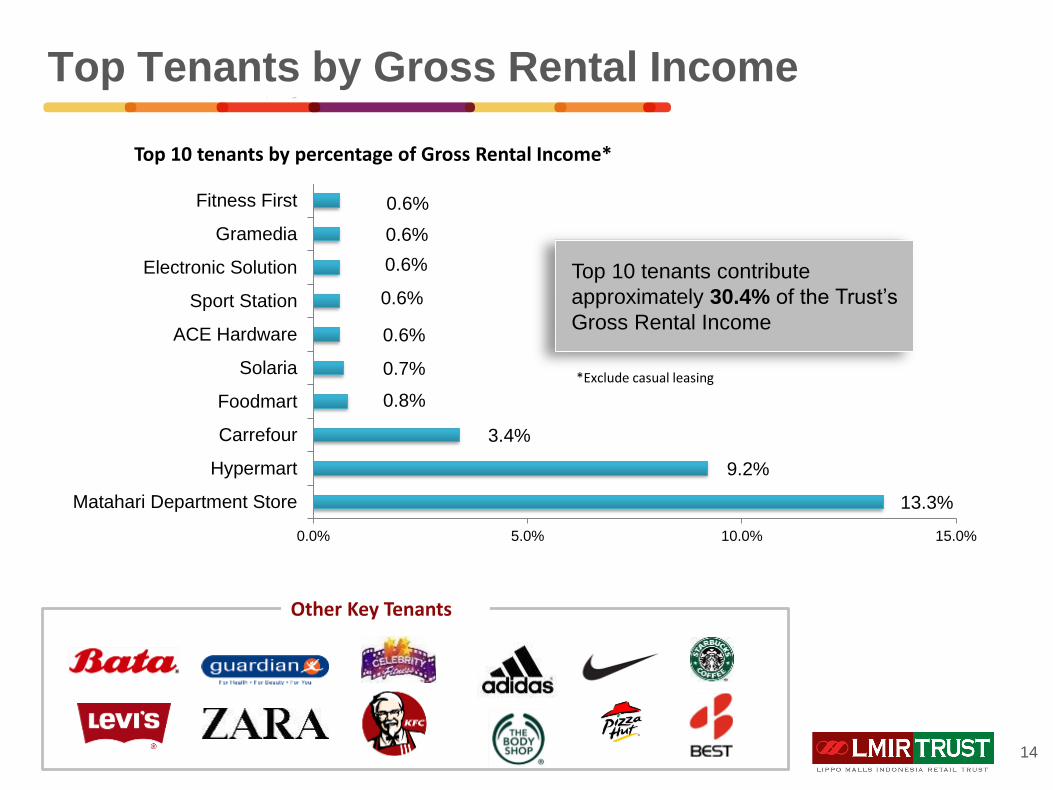
13.3%
9.2%
3.4%
0.8%
0.7%
0.6%
0.6%
0.6%
0.6%
0.6%
0.0% 5.0% 10.0% 15.0%
Matahari Department Store
Hypermart
Carrefour
Foodmart
Solaria
ACE Hardware
Sport Station
Electronic Solution
Gramedia
Fitness First
Top 10 tenants by percentage of Gross Rental Income*
Top 10 tenants contribute
approximately 30.4% of the Trust’s
Gross Rental Income
Other Key Tenants
Top Tenants by Gross Rental Income
14
*Exclude casual leasing
COPY FOR ASTRA INTERNATIONAL
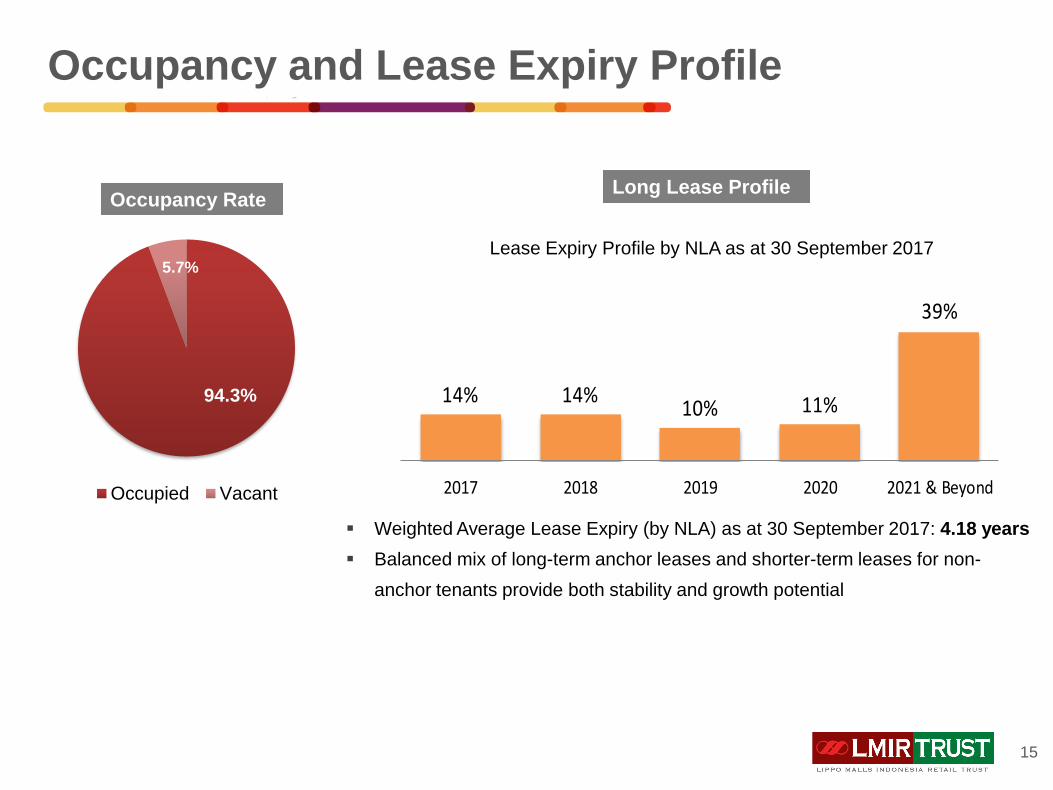
Occupancy and Lease Expiry Profile
94.3%
5.7%
Occupied Vacant
Occupancy Rate
14% 14%10% 11%
39%
2017 2018 2019 2020 2021 & Beyond
Lease Expiry Profile by NLA as at 30 September 2017
▪ Weighted Average Lease Expiry (by NLA) as at 30 September 2017: 4.18 years
▪ Balanced mix of long-term anchor leases and shorter-term leases for non-
anchor tenants provide both stability and growth potential
Long Lease Profile
15
COPY FOR ASTRA INTERNATIONAL
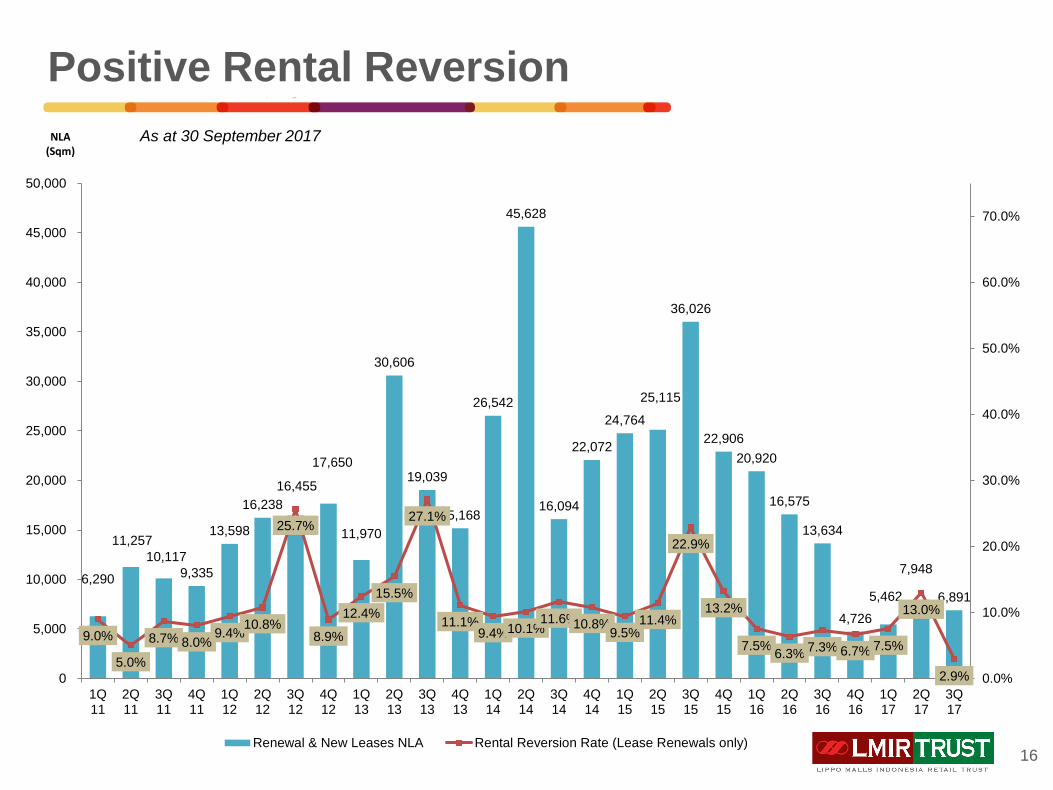
As at 30 September 2017
Positive Rental Reversion
16
NLA (Sqm)
6,290
11,257
10,117
9,335
13,598
16,238
16,455
17,650
11,970
30,606
19,039
15,168
26,542
45,628
16,094
22,072
24,764
25,115
36,026
22,906
20,920
16,575
13,634
4,726
5,462
7,948
6,891
9.0%
5.0%
8.7% 8.0%9.4%
10.8%
25.7%
8.9%
12.4%
15.5%
27.1%
11.1%9.4%10.1%
11.6%10.8%9.5%
11.4%
22.9%
13.2%
7.5%6.3%
7.3% 6.7% 7.5%
13.0%
2.9% 0.0%
10.0%
20.0%
30.0%
40.0%
50.0%
60.0%
70.0%
0
5,000
10,000
15,000
20,000
25,000
30,000
35,000
40,000
45,000
50,000
1Q11
2Q11
3Q11
4Q11
1Q12
2Q12
3Q12
4Q12
1Q13
2Q13
3Q13
4Q13
1Q14
2Q14
3Q14
4Q14
1Q15
2Q15
3Q15
4Q15
1Q16
2Q16
3Q16
4Q16
1Q17
2Q17
3Q17
Renewal & New Leases NLA Rental Reversion Rate (Lease Renewals only)
COPY FOR ASTRA INTERNATIONAL
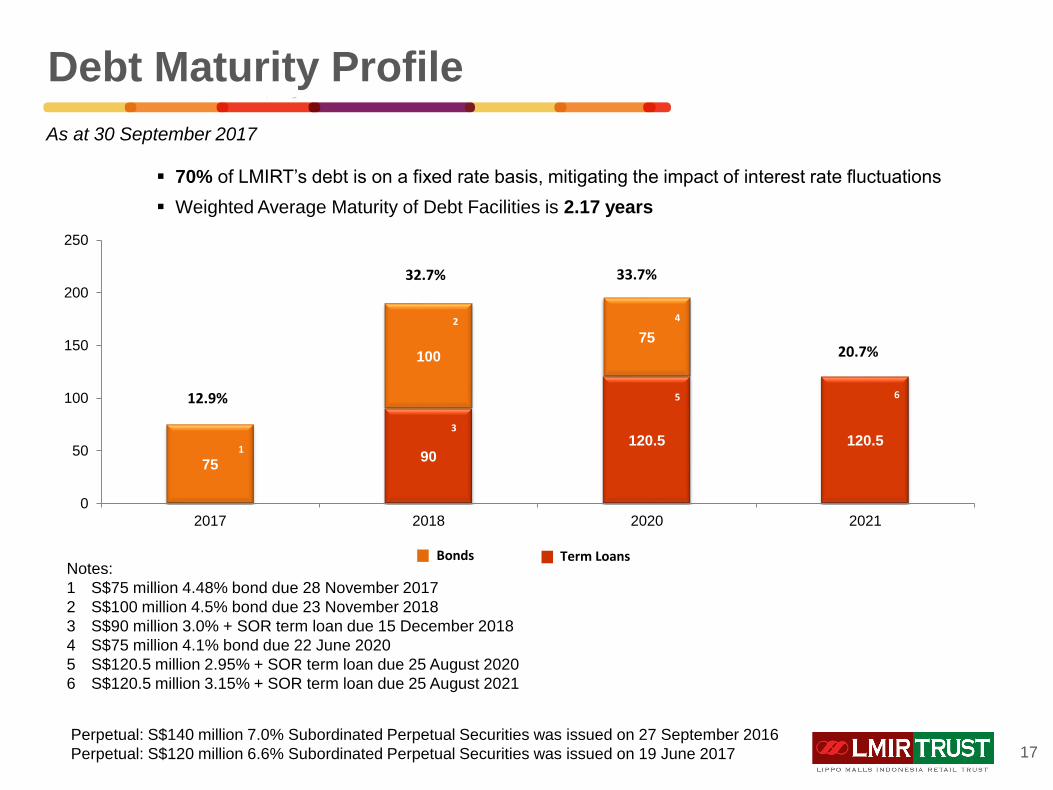
▪ 70% of LMIRT’s debt is on a fixed rate basis, mitigating the impact of interest rate fluctuations
▪ Weighted Average Maturity of Debt Facilities is 2.17 years
Notes:
1 S$75 million 4.48% bond due 28 November 2017
2 S$100 million 4.5% bond due 23 November 2018
3 S$90 million 3.0% + SOR term loan due 15 December 2018
4 S$75 million 4.1% bond due 22 June 2020
5 S$120.5 million 2.95% + SOR term loan due 25 August 2020
6 S$120.5 million 3.15% + SOR term loan due 25 August 2021
7
1
2
3
4
5
6
8
Perpetual: S$140 million 7.0% Subordinated Perpetual Securities was issued on 27 September 2016
Perpetual: S$120 million 6.6% Subordinated Perpetual Securities was issued on 19 June 2017
Bonds Term Loans
7590
120.5 120.5
100
75
0
50
100
150
200
250
2017 2018 2020 2021
33.7%32.7%
20.7%
As at 30 September 2017
1
1
2
3
4
5 6
Debt Maturity Profile
17
12.9%

Click to edit Master title style
▪ Click to edit Master text styles
Second level
▪ Third level
Fourth level
» Fifth level
18
Financial Highlights
Portfolio Performance
Growth Outlook
Acquisitions
COPY FOR ASTRA INTERNATIONAL
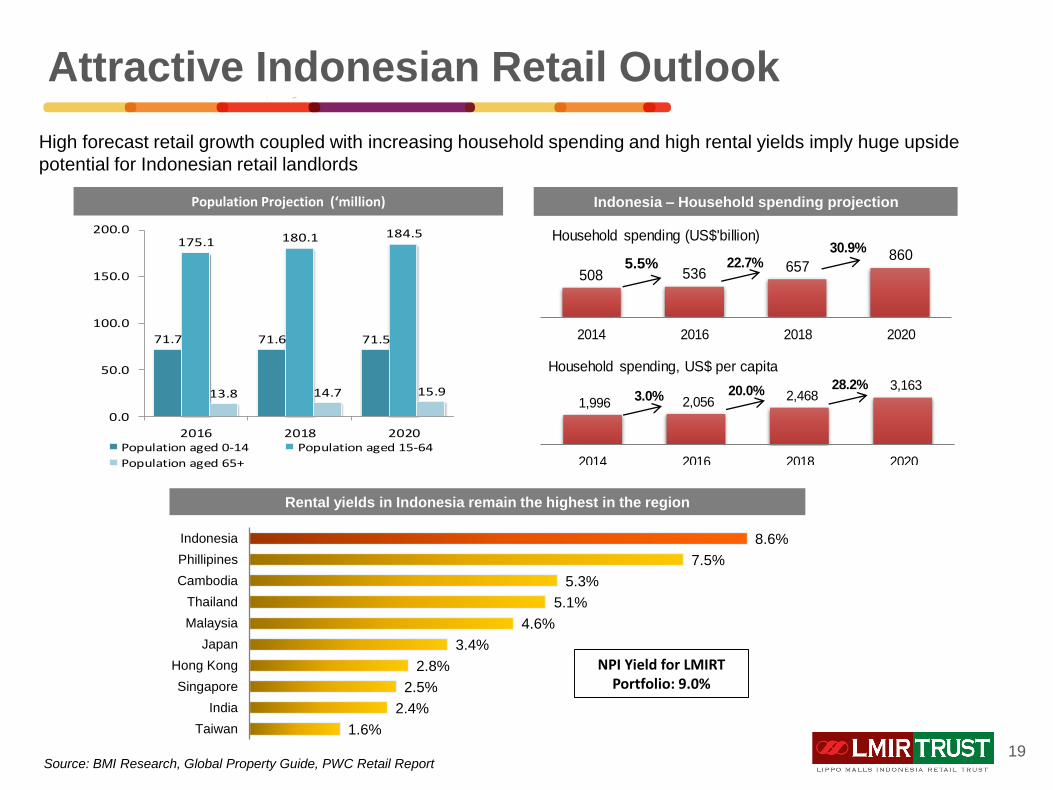
High forecast retail growth coupled with increasing household spending and high rental yields imply huge upside
potential for Indonesian retail landlords
Attractive Indonesian Retail Outlook
19
Indonesia – Household spending projectionPopulation Projection (‘million)
Source: BMI Research, Global Property Guide, PWC Retail Report
508 536 657860
2014 2016 2018 2020
Household spending (US$'billion)
22.7%30.9%
1,996 2,056 2,468 3,163
2014 2016 2018 2020
Household spending, US$ per capita
3.0% 20.0% 28.2%
5.5%
Rental yields in Indonesia remain the highest in the region
8.6%
7.5%
5.3%
5.1%
4.6%
3.4%
2.8%
2.5%
2.4%
1.6%
Indonesia
Phillipines
Cambodia
Thailand
Malaysia
Japan
Hong Kong
Singapore
India
Taiwan
71.7 71.6 71.5
175.1 180.1 184.5
13.8 14.7 15.9
0.0
50.0
100.0
150.0
200.0
2016 2018 2020Population aged 0-14 Population aged 15-64
Population aged 65+
NPI Yield for LMIRT Portfolio: 9.0%
COPY FOR ASTRA INTERNATIONAL
Strong & Committed Sponsor
20
Sponsor, PT Lippo Karawaci Tbk, Indonesia’s largest listed company by
total assets and revenue, with a market capitalisation of US$1.2 billion as
at 31 December 2016
Manages 46 retail malls and plans to develop 40 new retail malls, bringing
total malls under management to over 80 by 2030
Focused on developing and managing community malls located in cities
with dense population
Malls have an average occupancy rate of over 88% and cater to more
than 300 million visitors per year
LMIRT has the right-of-first-refusal to acquire Sponsor’s properties

Click to edit Master title style
▪ Click to edit Master text styles
Second level
▪ Third level
Fourth level
» Fifth level
21
Financial Highlights
Portfolio Performance
Growth Outlook
Acquisitions
COPY FOR ASTRA INTERNATIONAL
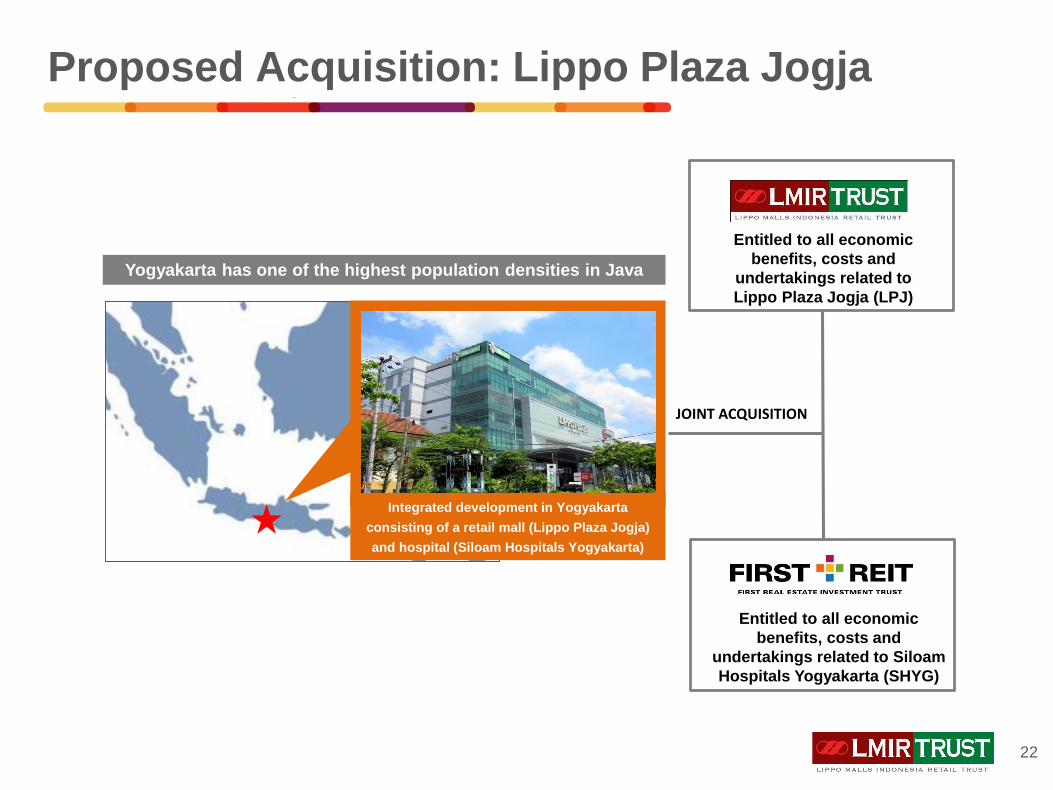
Proposed Acquisition: Lippo Plaza Jogja
22
Yogyakarta has one of the highest population densities in Java
Integrated development in Yogyakarta
consisting of a retail mall (Lippo Plaza Jogja)
and hospital (Siloam Hospitals Yogyakarta)
JOINT ACQUISITION
Entitled to all economic
benefits, costs and
undertakings related to Siloam
Hospitals Yogyakarta (SHYG)
Entitled to all economic
benefits, costs and
undertakings related to
Lippo Plaza Jogja (LPJ)
COPY FOR ASTRA INTERNATIONAL
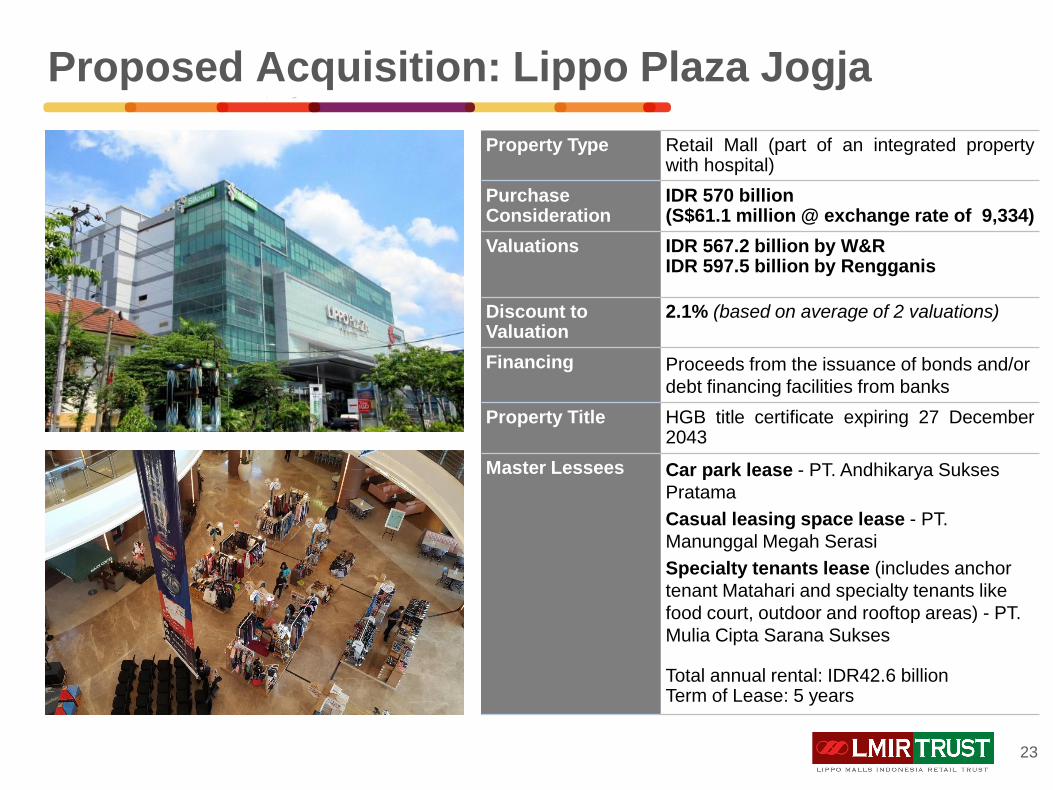
Proposed Acquisition: Lippo Plaza Jogja
23
Property Type Retail Mall (part of an integrated propertywith hospital)
Purchase Consideration
IDR 570 billion(S$61.1 million @ exchange rate of 9,334)
Valuations IDR 567.2 billion by W&RIDR 597.5 billion by Rengganis
Discount to Valuation
2.1% (based on average of 2 valuations)
Financing Proceeds from the issuance of bonds and/or
debt financing facilities from banks
Property Title HGB title certificate expiring 27 December2043
Master Lessees Car park lease - PT. Andhikarya Sukses
Pratama
Casual leasing space lease - PT.
Manunggal Megah Serasi
Specialty tenants lease (includes anchor
tenant Matahari and specialty tenants like
food court, outdoor and rooftop areas) - PT.
Mulia Cipta Sarana Sukses
Total annual rental: IDR42.6 billionTerm of Lease: 5 years
COPY FOR ASTRA INTERNATIONAL
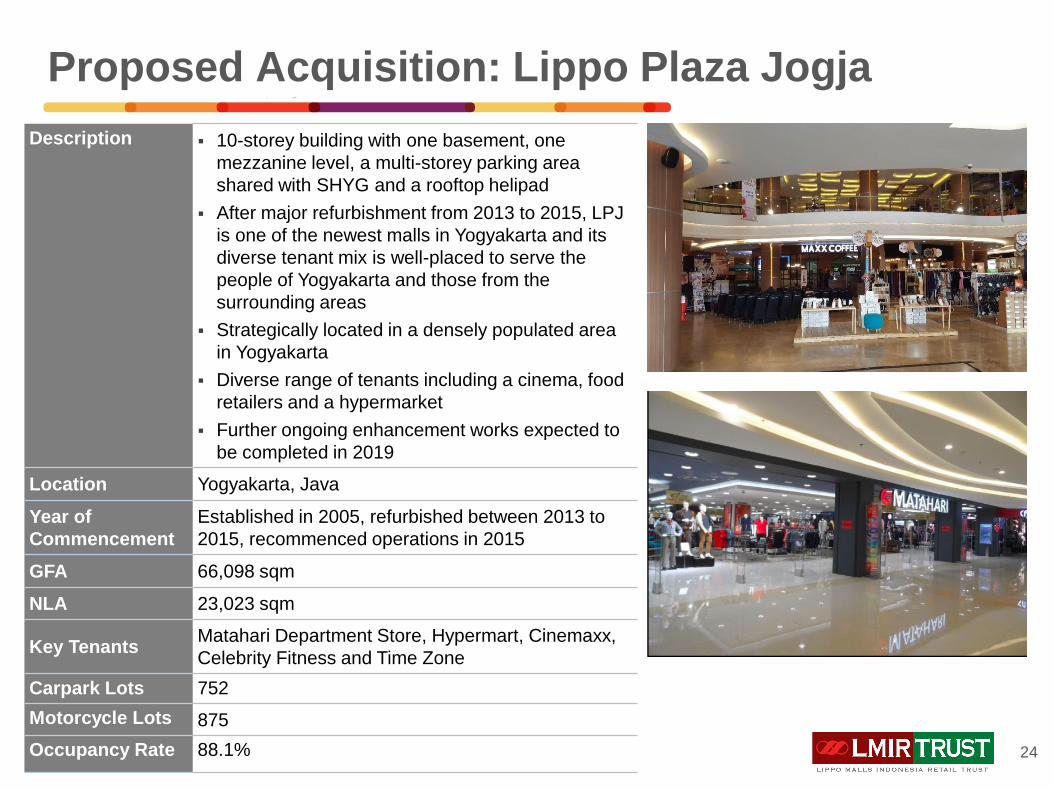
Description ▪ 10-storey building with one basement, one
mezzanine level, a multi-storey parking area
shared with SHYG and a rooftop helipad
▪ After major refurbishment from 2013 to 2015, LPJ
is one of the newest malls in Yogyakarta and its
diverse tenant mix is well-placed to serve the
people of Yogyakarta and those from the
surrounding areas
▪ Strategically located in a densely populated area
in Yogyakarta
▪ Diverse range of tenants including a cinema, food
retailers and a hypermarket
▪ Further ongoing enhancement works expected to
be completed in 2019
Location Yogyakarta, Java
Year of
Commencement
Established in 2005, refurbished between 2013 to
2015, recommenced operations in 2015
GFA 66,098 sqm
NLA 23,023 sqm
Key TenantsMatahari Department Store, Hypermart, Cinemaxx,
Celebrity Fitness and Time Zone
Carpark Lots 752
Motorcycle Lots 875
Occupancy Rate 88.1% 24
Proposed Acquisition: Lippo Plaza Jogja
COPY FOR ASTRA INTERNATIONAL
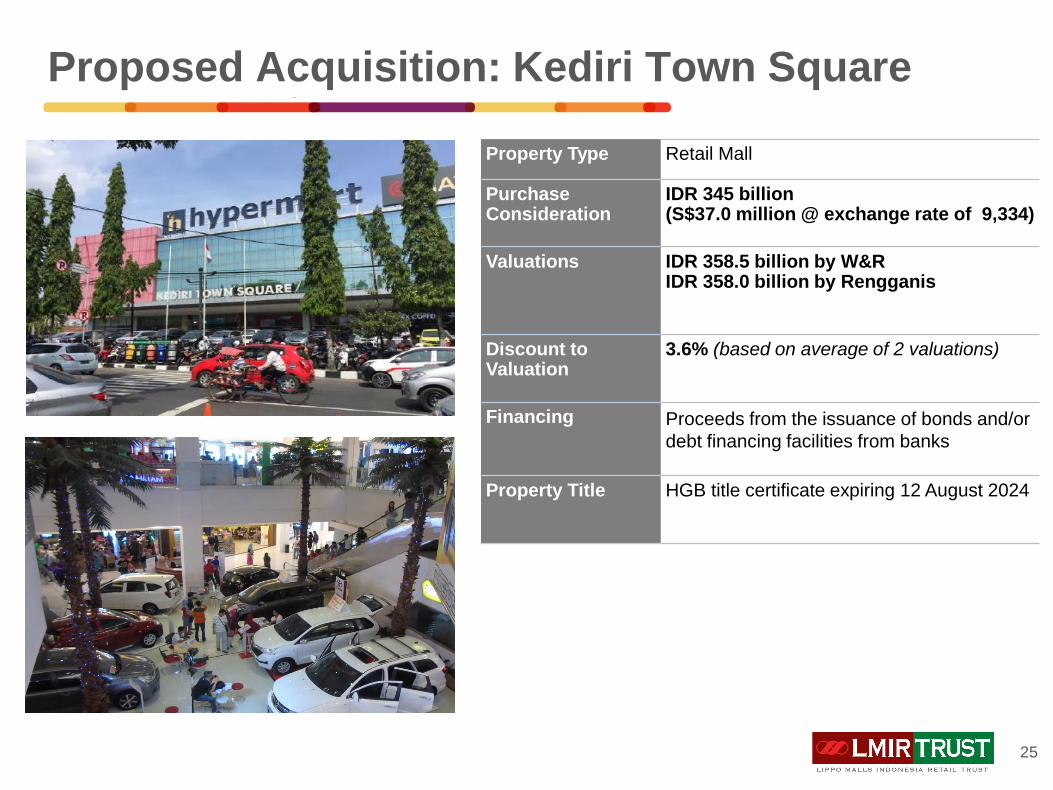
Proposed Acquisition: Kediri Town Square
Property Type Retail Mall
Purchase Consideration
IDR 345 billion(S$37.0 million @ exchange rate of 9,334)
Valuations IDR 358.5 billion by W&RIDR 358.0 billion by Rengganis
Discount to Valuation
3.6% (based on average of 2 valuations)
Financing Proceeds from the issuance of bonds and/or
debt financing facilities from banks
Property Title HGB title certificate expiring 12 August 2024
25
COPY FOR ASTRA INTERNATIONAL
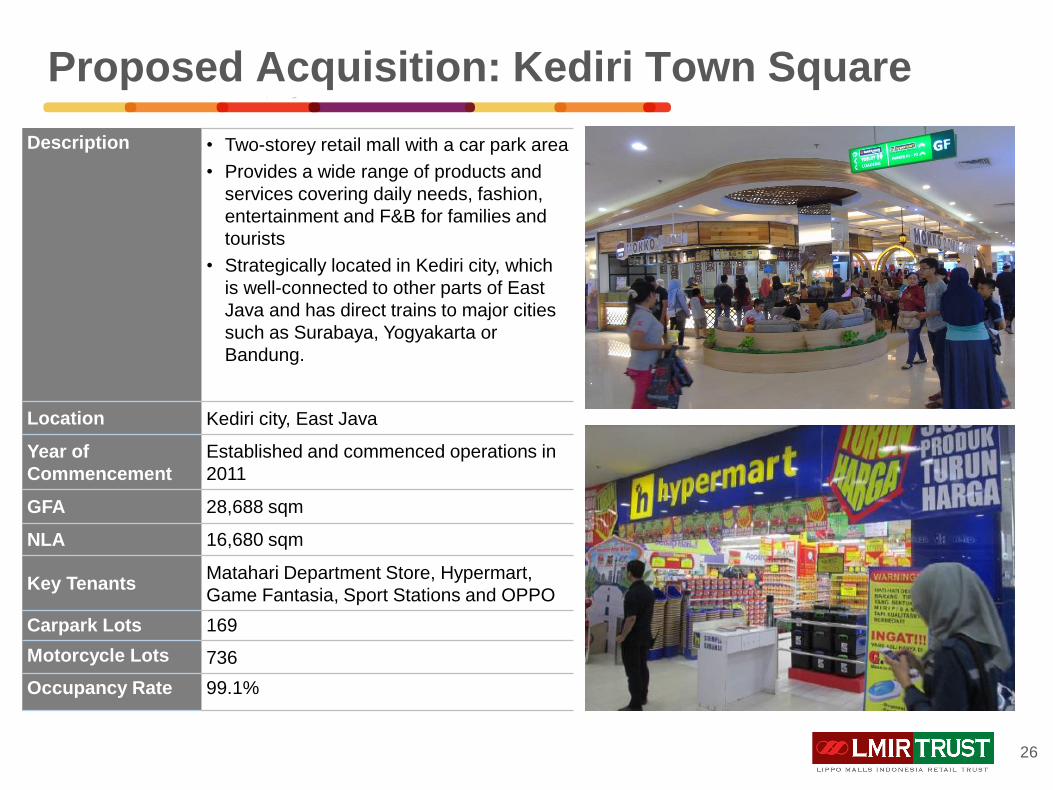
Description • Two-storey retail mall with a car park area
• Provides a wide range of products and
services covering daily needs, fashion,
entertainment and F&B for families and
tourists
• Strategically located in Kediri city, which
is well-connected to other parts of East
Java and has direct trains to major cities
such as Surabaya, Yogyakarta or
Bandung.
Location Kediri city, East Java
Year of
Commencement
Established and commenced operations in
2011
GFA 28,688 sqm
NLA 16,680 sqm
Key TenantsMatahari Department Store, Hypermart,
Game Fantasia, Sport Stations and OPPO
Carpark Lots 169
Motorcycle Lots 736
Occupancy Rate 99.1%
26
Proposed Acquisition: Kediri Town Square
Click to edit Master title style
▪ Click to edit Master text styles
Second level
▪ Third level
Fourth level
» Fifth level
27
Thank You

Click to edit Master title style
▪ Click to edit Master text styles
Second level
▪ Third level
Fourth level
» Fifth level
28
Appendix
COPY FOR ASTRA INTERNATIONAL
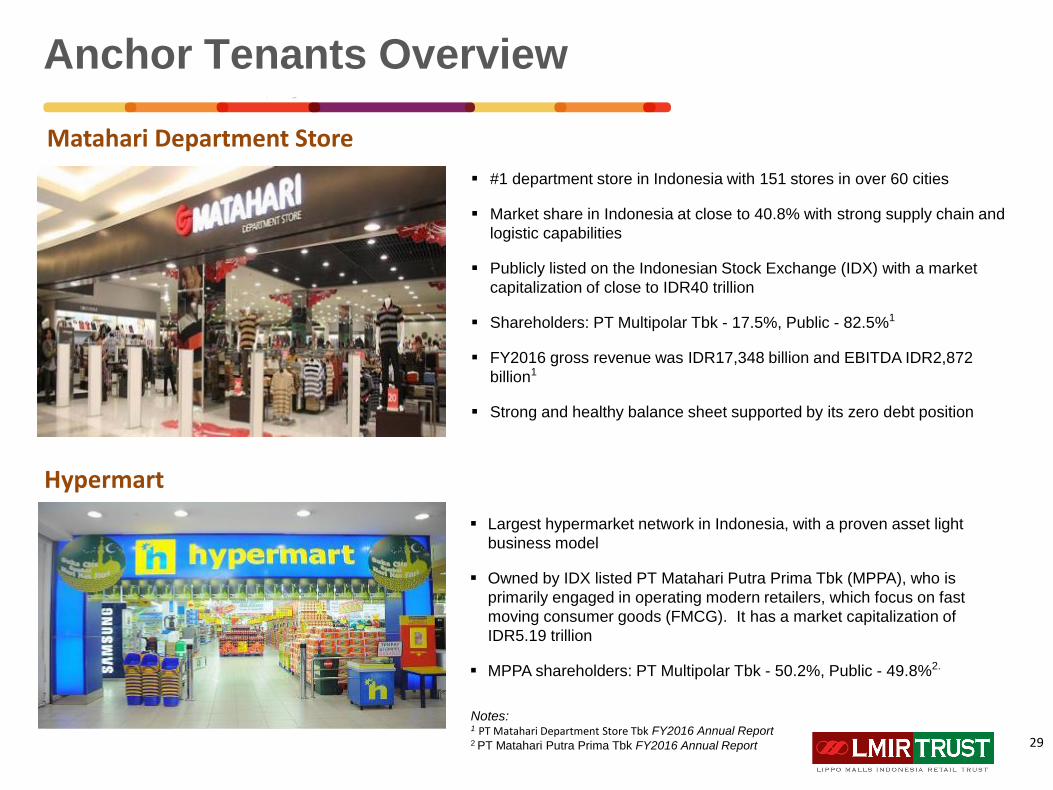
Matahari Department Store
Anchor Tenants Overview
▪ #1 department store in Indonesia with 151 stores in over 60 cities
▪ Market share in Indonesia at close to 40.8% with strong supply chain and
logistic capabilities
▪ Publicly listed on the Indonesian Stock Exchange (IDX) with a market
capitalization of close to IDR40 trillion
▪ Shareholders: PT Multipolar Tbk - 17.5%, Public - 82.5%1
▪ FY2016 gross revenue was IDR17,348 billion and EBITDA IDR2,872
billion1
▪ Strong and healthy balance sheet supported by its zero debt position
Hypermart
▪ Largest hypermarket network in Indonesia, with a proven asset light
business model
▪ Owned by IDX listed PT Matahari Putra Prima Tbk (MPPA), who is
primarily engaged in operating modern retailers, which focus on fast
moving consumer goods (FMCG). It has a market capitalization of
IDR5.19 trillion
▪ MPPA shareholders: PT Multipolar Tbk - 50.2%, Public - 49.8%2.
Notes: 1 PT Matahari Department Store Tbk FY2016 Annual Report2 PT Matahari Putra Prima Tbk FY2016 Annual Report 29
COPY FOR ASTRA INTERNATIONAL
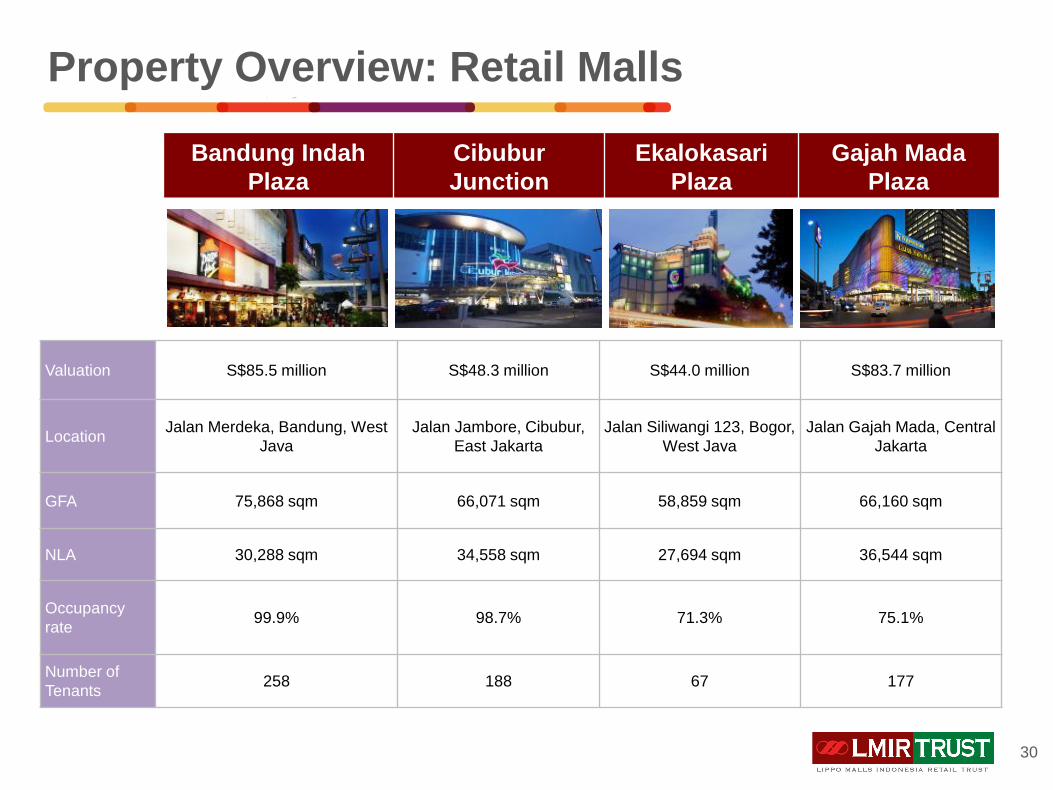
Valuation S$85.5 million S$48.3 million S$44.0 million S$83.7 million
LocationJalan Merdeka, Bandung, West
Java
Jalan Jambore, Cibubur,
East Jakarta
Jalan Siliwangi 123, Bogor,
West Java
Jalan Gajah Mada, Central
Jakarta
GFA 75,868 sqm 66,071 sqm 58,859 sqm 66,160 sqm
NLA 30,288 sqm 34,558 sqm 27,694 sqm 36,544 sqm
Occupancy
rate99.9% 98.7% 71.3% 75.1%
Number of
Tenants258 188 67 177
Bandung Indah
Plaza
Cibubur
Junction
Ekalokasari
Plaza
Gajah Mada
Plaza
Property Overview: Retail Malls
30
COPY FOR ASTRA INTERNATIONAL
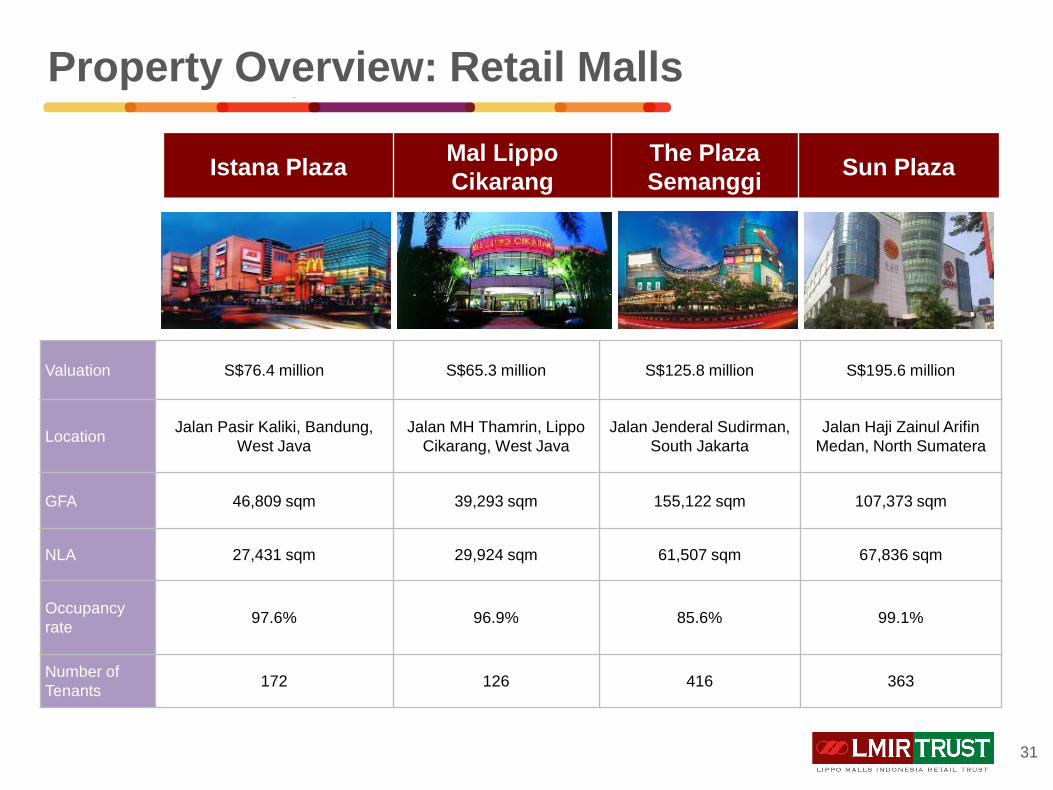
Valuation S$76.4 million S$65.3 million S$125.8 million S$195.6 million
LocationJalan Pasir Kaliki, Bandung,
West Java
Jalan MH Thamrin, Lippo
Cikarang, West Java
Jalan Jenderal Sudirman,
South Jakarta
Jalan Haji Zainul Arifin
Medan, North Sumatera
GFA 46,809 sqm 39,293 sqm 155,122 sqm 107,373 sqm
NLA 27,431 sqm 29,924 sqm 61,507 sqm 67,836 sqm
Occupancy
rate97.6% 96.9% 85.6% 99.1%
Number of
Tenants172 126 416 363
Istana PlazaMal Lippo
Cikarang
The Plaza
SemanggiSun Plaza
Property Overview: Retail Malls
31
COPY FOR ASTRA INTERNATIONAL
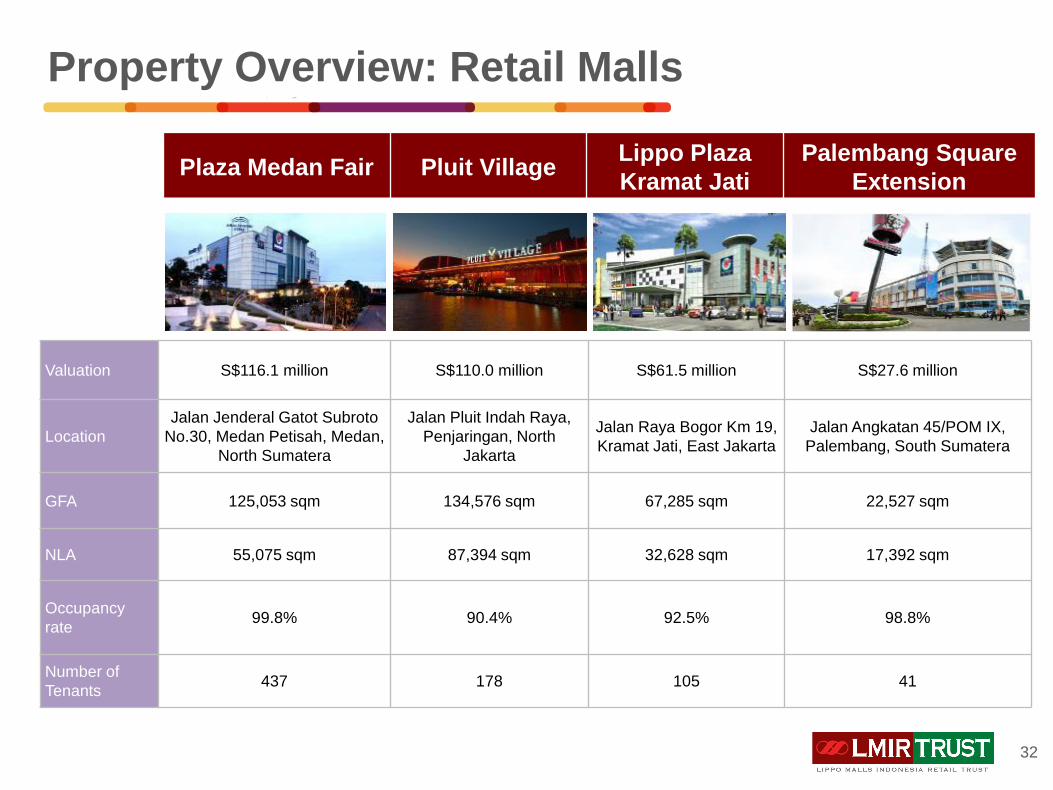
Valuation S$116.1 million S$110.0 million S$61.5 million S$27.6 million
Location
Jalan Jenderal Gatot Subroto
No.30, Medan Petisah, Medan,
North Sumatera
Jalan Pluit Indah Raya,
Penjaringan, North
Jakarta
Jalan Raya Bogor Km 19,
Kramat Jati, East Jakarta
Jalan Angkatan 45/POM IX,
Palembang, South Sumatera
GFA 125,053 sqm 134,576 sqm 67,285 sqm 22,527 sqm
NLA 55,075 sqm 87,394 sqm 32,628 sqm 17,392 sqm
Occupancy
rate99.8% 90.4% 92.5% 98.8%
Number of
Tenants437 178 105 41
Plaza Medan Fair Pluit VillageLippo Plaza
Kramat Jati
Palembang Square
Extension
Property Overview: Retail Malls
32
COPY FOR ASTRA INTERNATIONAL
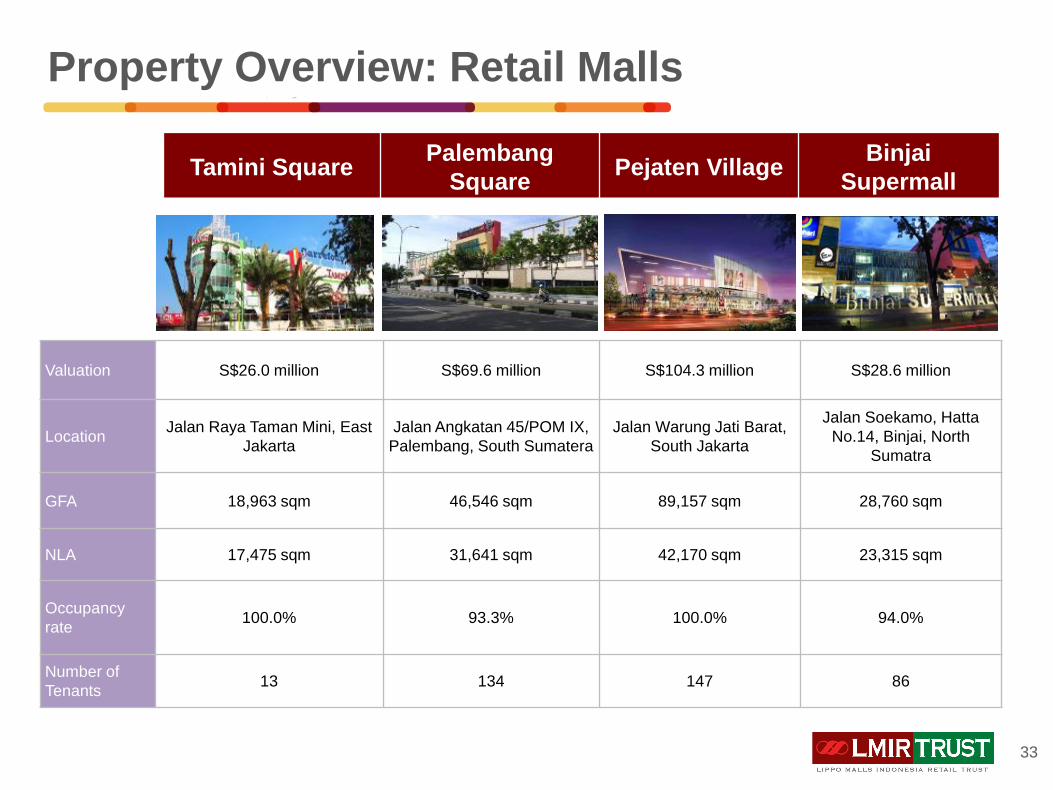
Valuation S$26.0 million S$69.6 million S$104.3 million S$28.6 million
LocationJalan Raya Taman Mini, East
Jakarta
Jalan Angkatan 45/POM IX,
Palembang, South Sumatera
Jalan Warung Jati Barat,
South Jakarta
Jalan Soekamo, Hatta
No.14, Binjai, North
Sumatra
GFA 18,963 sqm 46,546 sqm 89,157 sqm 28,760 sqm
NLA 17,475 sqm 31,641 sqm 42,170 sqm 23,315 sqm
Occupancy
rate100.0% 93.3% 100.0% 94.0%
Number of
Tenants13 134 147 86
Tamini SquarePalembang
SquarePejaten Village
Binjai
Supermall
Property Overview: Retail Malls
33
COPY FOR ASTRA INTERNATIONAL
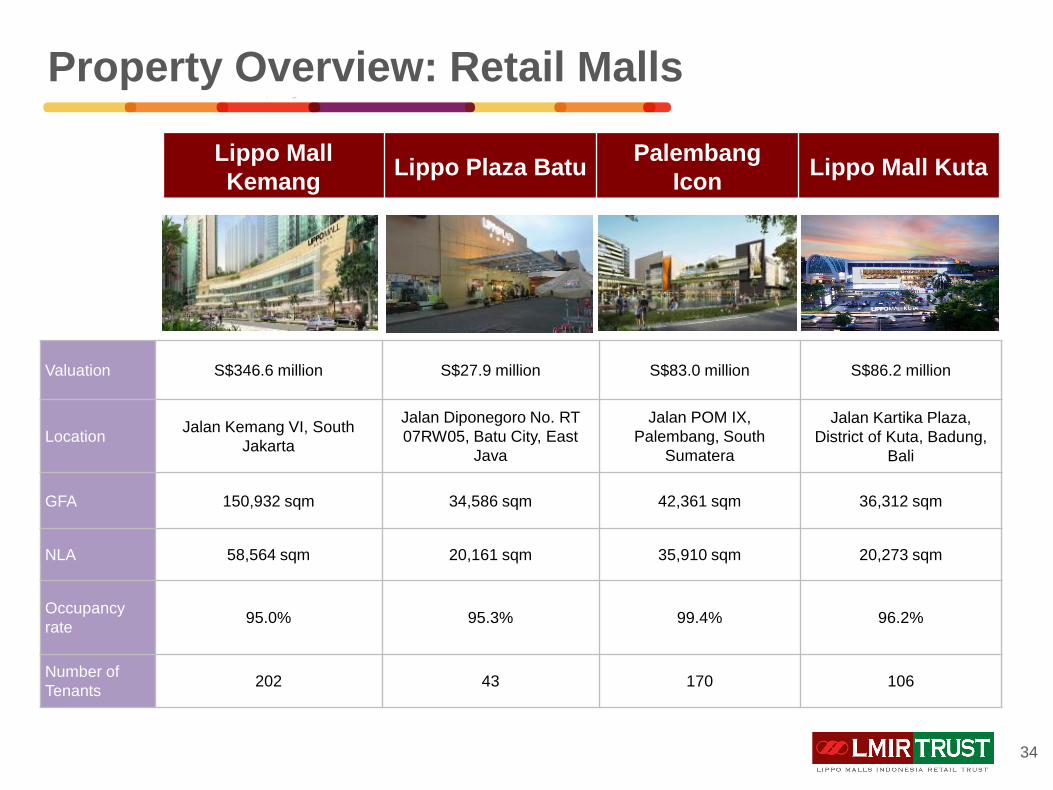
Valuation S$346.6 million S$27.9 million S$83.0 million S$86.2 million
LocationJalan Kemang VI, South
Jakarta
Jalan Diponegoro No. RT
07RW05, Batu City, East
Java
Jalan POM IX,
Palembang, South
Sumatera
Jalan Kartika Plaza,
District of Kuta, Badung,
Bali
GFA 150,932 sqm 34,586 sqm 42,361 sqm 36,312 sqm
NLA 58,564 sqm 20,161 sqm 35,910 sqm 20,273 sqm
Occupancy
rate95.0% 95.3% 99.4% 96.2%
Number of
Tenants202 43 170 106
Lippo Mall
KemangLippo Plaza Batu
Palembang
IconLippo Mall Kuta
Property Overview: Retail Malls
34
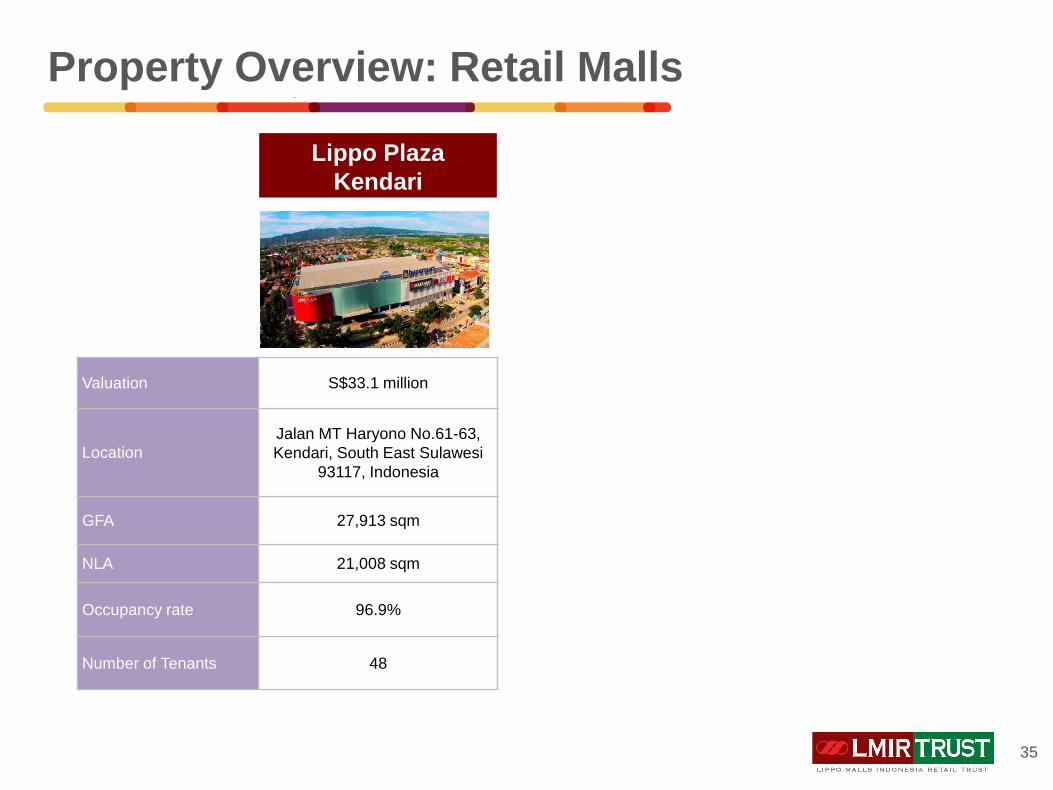
COPY FOR ASTRA INTERNATIONAL Valuation S$33.1 million
Location
Jalan MT Haryono No.61-63,
Kendari, South East Sulawesi
93117, Indonesia
GFA 27,913 sqm
NLA 21,008 sqm
Occupancy rate 96.9%
Number of Tenants 48
Lippo Plaza
Kendari
Property Overview: Retail Malls
35
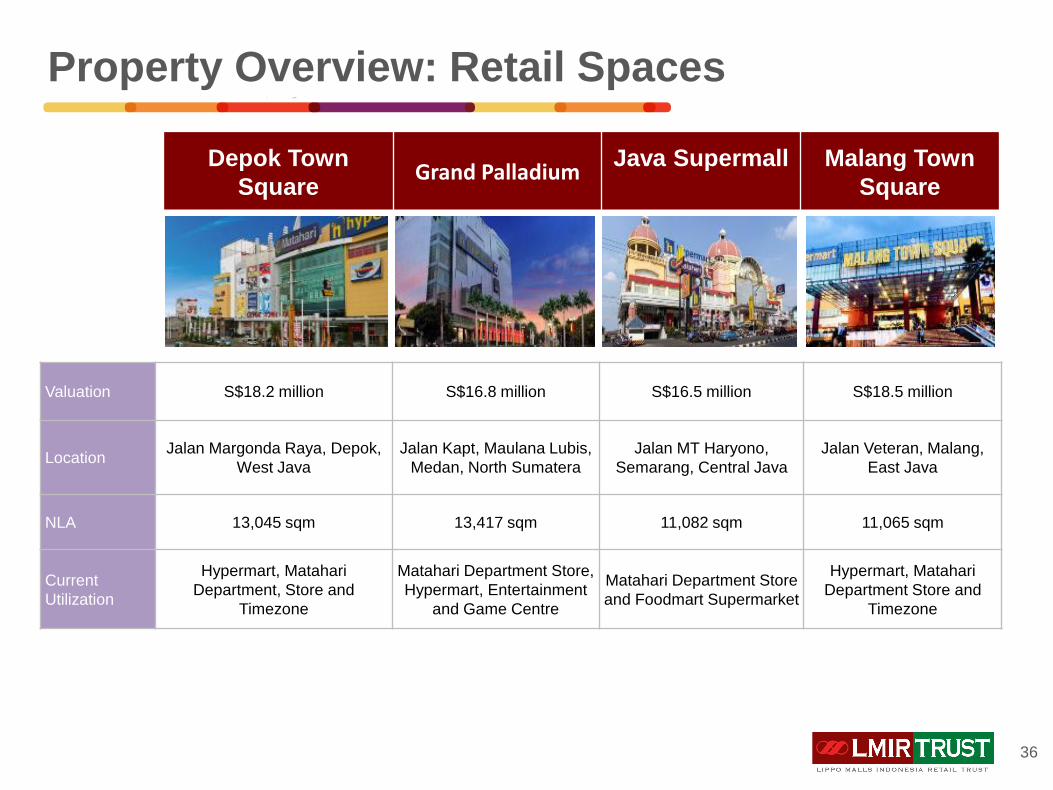
COPY FOR ASTRA INTERNATIONAL Valuation S$18.2 million S$16.8 million S$16.5 million S$18.5 million
LocationJalan Margonda Raya, Depok,
West Java
Jalan Kapt, Maulana Lubis,
Medan, North Sumatera
Jalan MT Haryono,
Semarang, Central Java
Jalan Veteran, Malang,
East Java
NLA 13,045 sqm 13,417 sqm 11,082 sqm 11,065 sqm
Current
Utilization
Hypermart, Matahari
Department, Store and
Timezone
Matahari Department Store,
Hypermart, Entertainment
and Game Centre
Matahari Department Store
and Foodmart Supermarket
Hypermart, Matahari
Department Store and
Timezone
Depok Town
SquareGrand Palladium
Java Supermall Malang Town
Square
Property Overview: Retail Spaces
36
COPY FOR ASTRA INTERNATIONAL
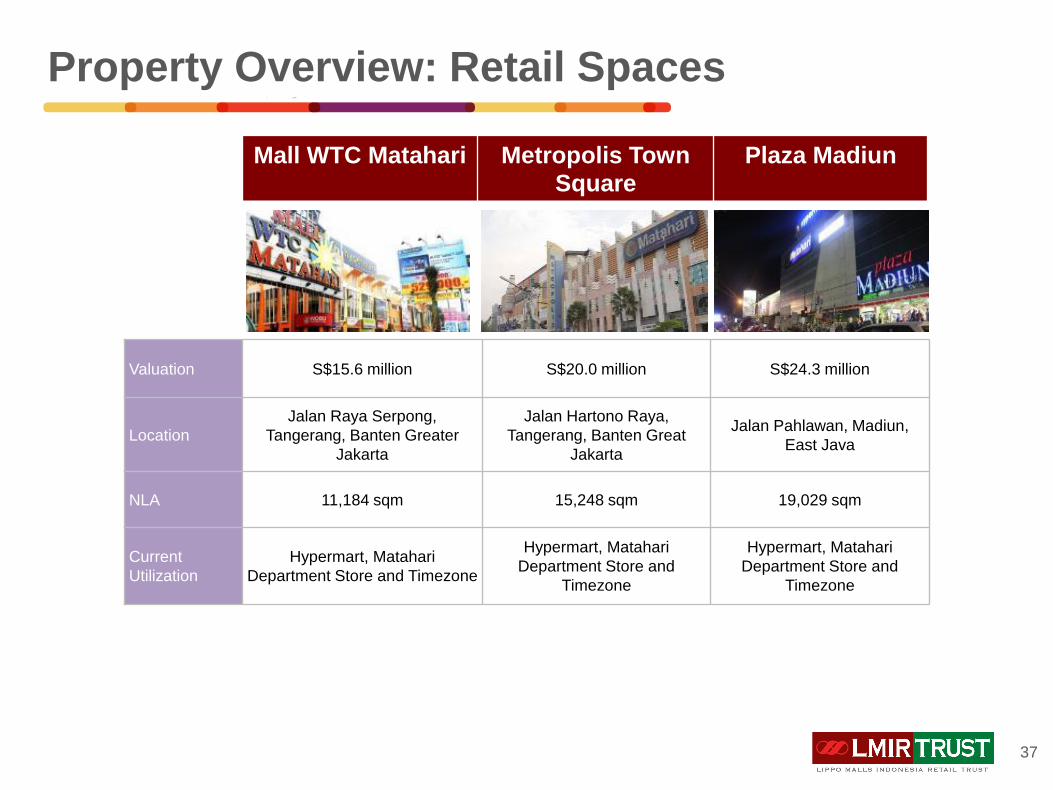
Valuation S$15.6 million S$20.0 million S$24.3 million
Location
Jalan Raya Serpong,
Tangerang, Banten Greater
Jakarta
Jalan Hartono Raya,
Tangerang, Banten Great
Jakarta
Jalan Pahlawan, Madiun,
East Java
NLA 11,184 sqm 15,248 sqm 19,029 sqm
Current
Utilization
Hypermart, Matahari
Department Store and Timezone
Hypermart, Matahari
Department Store and
Timezone
Hypermart, Matahari
Department Store and
Timezone
Mall WTC Matahari Metropolis Town
SquarePlaza Madiun
Property Overview: Retail Spaces
37
COPY FOR ASTRA INTERNATIONAL
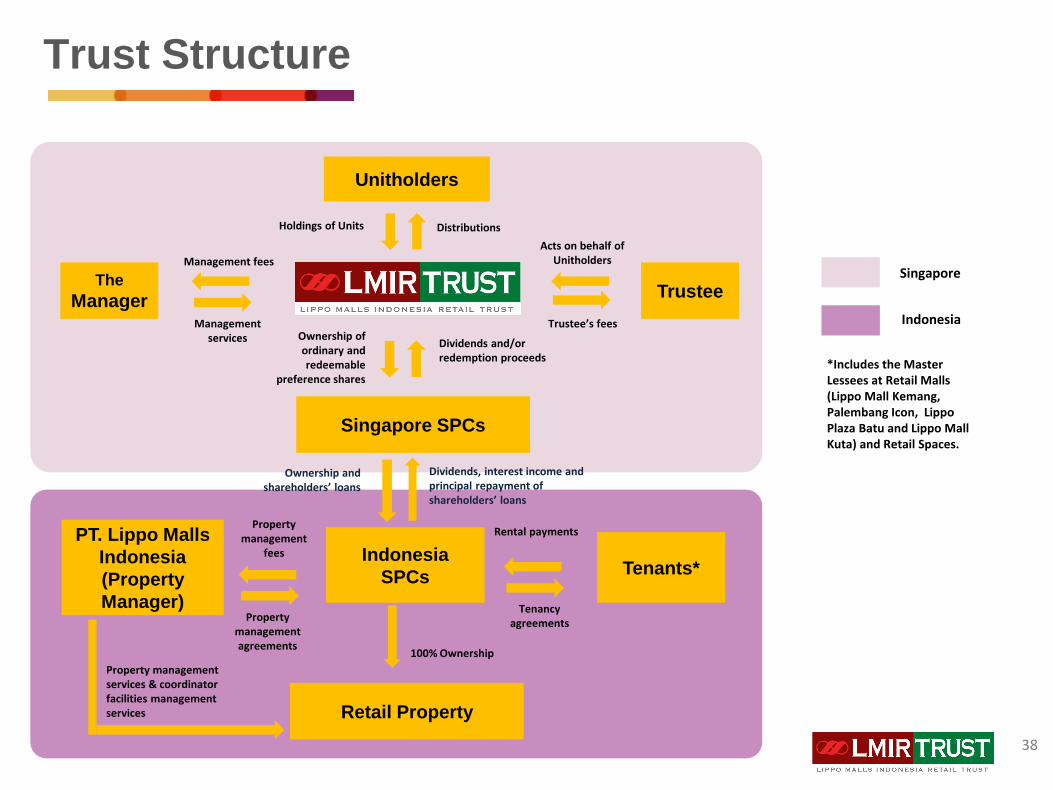
38
Unitholders
TrusteeThe
Manager
Singapore SPCs
Distributions
Acts on behalf of Unitholders
Holdings of Units
Trustee’s fees
Management fees
Management services Ownership of
ordinary and redeemable
preference shares
Dividends and/or redemption proceeds
Indonesia
SPCsTenants*
PT. Lippo Malls
Indonesia
(Property
Manager)
Retail Property
Rental payments
Tenancy agreements
100% Ownership
Property management services & coordinator facilities management services
Property management
fees
Property management agreements
Dividends, interest income and principal repayment of shareholders’ loans
*Includes the Master Lessees at Retail Malls (Lippo Mall Kemang, Palembang Icon, Lippo Plaza Batu and Lippo Mall Kuta) and Retail Spaces.
Indonesia
Singapore
Trust Structure
Ownership and shareholders’ loans
38
Related Documents