1 NLMK Moscow, 8 November 2013 Q3 2013 US GAAP CONSOLIDATED RESULTS

Welcome message from author
This document is posted to help you gain knowledge. Please leave a comment to let me know what you think about it! Share it to your friends and learn new things together.
Transcript

1
NLMK
Moscow, 8 November 2013
Q3 2013 US GAAP CONSOLIDATED RESULTS

This document is confidential and has been prepared by NLMK (the “Company”) solely for use at the investor presentation of the Company and may not be reproduced, retransmitted or further distributed to any other person or published, in whole or in part, for any other purpose. This document does not constitute or form part of any advertisement of securities, any offer or invitation to sell or issue or any solicitation of any offer to purchase or subscribe for, any shares in the Company or Global Depositary Shares (GDSs), nor shall it or any part of it nor the fact of its presentation or distribution form the basis of, or be relied on in connection with, any contract or investment decision. No reliance may be placed for any purpose whatsoever on the information contained in this document or on assumptions made as to its completeness. No representation or warranty, express or implied, is given by the Company, its subsidiaries or any of their respective advisers, officers, employees or agents, as to the accuracy of the information or opinions or for any loss howsoever arising, directly or indirectly, from any use of this presentation or its contents. This document is for distribution only in the United Kingdom and the presentation is being made only in the United Kingdom to persons having professional experience in matters relating to investments falling within Article 19(1) of the Financial Services and Markets Act 2000 (Financial Promotion) Order 2005 (the “Order”) or high net worth entities, and other persons to whom it may otherwise lawfully be communicated, falling within Article 49(2) of the Order (all such persons together being referred to as “relevant persons”). Any person who is not a relevant person should not act or rely on this presentation or any of its contents. The distribution of this document in other jurisdictions may be restricted by law and any person into whose possession this document comes should inform themselves about, and observe, any such restrictions. This document may include forward-looking statements. These forward-looking statements include matters that are not historical facts or statements regarding the Company’s intentions, beliefs or current expectations concerning, among other things, the Company’s results of operations, financial condition, liquidity, prospects, growth, strategies, and the industry in which the Company operates. By their nature, forwarding-looking statements involve risks and uncertainties because they relate to events and depend on circumstances that may or may not occur in the future. The Company cautions you that forward-looking statements are not guarantees of future performance and that the Company’s actual results of operations, financial condition and liquidity and the development of the industry in which the Company operates may differ materially from those made in or suggested by the forward-looking statements contained in this document. In addition, even if the Company’s results of operations, financial condition and liquidity and the development of the industry in which the Company operates are consistent with the forward-looking statements contained in this document, those results or developments may not be indicative of results or developments in future periods. The Company does not undertake any obligation to review or confirm analysts’ expectations or estimates or to update any forward-looking statements to reflect events that occur or circumstances that arise after the date of this presentation. By attending/viewing/downloading this presentation you agree to be bound by the foregoing terms.
DISCLAIMER
2

200
300
400
500
600
700
800
900
Jan
-12
Feb
-12
Mar
-12
Ap
r-1
2
May
-12
Jun
-12
Jul-
12
Au
g-1
2
Sep
-12
Oct
-12
No
v-1
2
Dec
-12
Jan
-13
Feb
-13
Mar
-13
Ap
r-1
3
May
-13
Jun
-13
Jul-
13
Au
g-1
3
Sep
-13
Oct
-13
HRC USA, EXW HRC Europe, EXW
HRC China, EXW HRC Russia, EXW
55%
65%
75%
85%
Jan
-12
Feb
-12
Mar
-12
Ap
r-1
2
May
-12
Jun
-12
Jul-
12
Au
g-1
2
Sep
-12
Oct
-12
No
v-1
2
Dec
-12
Jan
-13
Feb
-13
Mar
-13
Ap
r-1
3
May
-13
Jun
-13
Jul-
13
Au
g-1
3
Sep
-13
Global average China North America EU (27)
INTERNATIONAL STEEL MARKET DEMAND AND SUPPLY
• Average utilization rate in Q3 went down to 77.2% (- 2.4 p.p.)
• Seasonal slowdown in demand and production in August was
followed by a recovery in demand by the end of Q3
PRICES
• Average prices in Q3 declined qoq
o In Russia and Europe prices for HRC went down by 6% and
2%, respectively
o In USA prices for HRC jumped by 10%
• At the end of Q3, prices began recovering supported by
strengthening in demand and an uptick in raw materials
prices PRICES FOR HRC
$/t Quarterly global price trends adjusted for the production / sales
cycle
Source: Metal Bulletin * - average daily output growth 3
STEELMAKING CAPACITY UTILIZATION
Source: World Steel Association
0,6
0,7
0,8
0,9
1
1,1
1,2
1,3
1,4
Jan
-12
Feb
-12
Mar
-12
Ap
r-1
2
May
-12
Jun
-12
Jul-
12
Au
g-1
2
Sep
-12
Oct
-12
No
v-1
2
Dec
-12
Jan
-13
Feb
-13
Mar
-13
Ap
r-1
3
May
-13
Jun
-13
Jul-
13
Au
g-1
3
Sep
-13
Germany China USA
Index, January 2012=1
STEEL PRODUCTS INVENTORIES
Sources: CRU, Bloomberg (Steelhome, Metals Service Center Inst.)
Inventory change qoq/ during the quarter China :-17%, -10%
USA: -2%, +1% Germany: -7%, -8%

RUSSIAN STEEL MARKET
0%
10%
20%
30%
40%
50%
60%
2,0
2,5
3,0
3,5
4,0
Jan
-11
Mar
-11
May
-11
Jul-
11
Sep
-11
No
v-1
1
Jan
-12
Mar
-12
May
-12
Jul-
12
Sep
-12
No
v-1
2
Jan
-13
Mar
-13
May
-13
Jul-
13
Sep
-13
Apparent steel use Share of import in RF steel consumption
STEEL CONSUMPTION TREND
m t
Source: Metal Expert
DEMAND AND SUPPLY
• 9M’13: steel consumption increased to 31.7 m t (+3.5% yoy)
• Growth driven by the construction sector (+8% yoy)
• Import represents a significant share of ASU or 20%
• Imported volumes for 9M’13: up 6% to 5.8 m t yoy
o Long product import up 28% yoy to 2.8 m t
o Flat product import down 9% yoy to 3 m t
PRICES
• HRC prices (in US$) down 6% driven by a RUB decline by 4%
• Long products increased by 1% qoq
Import share in consumption – about 20%
STEEL DEMAND BY SECTOR IN RUSSIA NLMK’S SHARE IN RUSSIAN STEEL AND STEEL PRODUCT
OUTPUT
4
7,5 7,5
1,1 1,1 0,8 0,8
1,6 1,6
0
2
4
6
8
10
12
Q2'13 Q3'13
Pipe producers Steel constructions and shaping
Machinery, incl. automotive Construction and infrastructure
m t
19,8 21,4
3,8 3,3 2,4 2,4 4,6 4,6
0
4
8
12
16
20
24
28
32
9M '12 9M '13
m t
Source: Metal Expert * High value added (HVA) Flat Steel: CR coils, coated, electrical steel
Source : Metal Expert
+8%
-5%
+3.5% 11.0 11.0 30.6 31.7
19%
30%
22%
33%
19% 21%
32%
0%
5%
10%
15%
20%
25%
30%
35%
40%
HR coils CR coils HDG Pre-painted Rebar Crude steel HVA*
Q2’ 13
Q3’ 13
40
50
60
70
80
90
100
110
Jan
-11
Mar
-11
May
-11
Jul-
11
Sep
-11
No
v-1
1Ja
n-1
2M
ar-1
2M
ay-1
2Ju
l-1
2Se
p-1
2N
ov-
12
Jan
-13
Mar
-13
May
-13
Jul-
13
Sep
-13
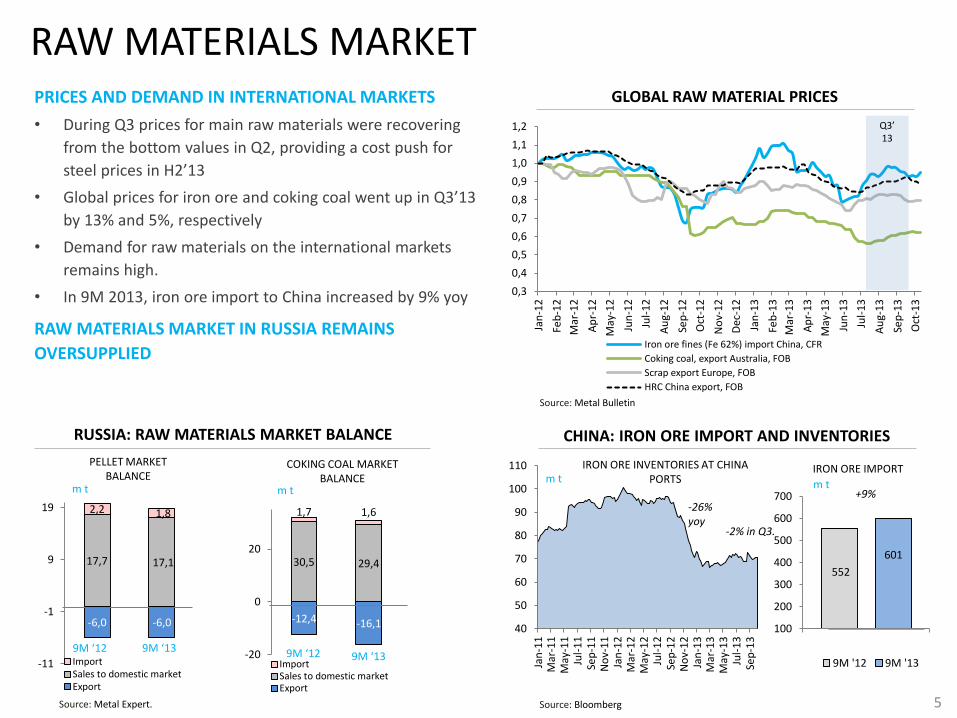
RAW MATERIALS MARKET PRICES AND DEMAND IN INTERNATIONAL MARKETS
• During Q3 prices for main raw materials were recovering
from the bottom values in Q2, providing a cost push for
steel prices in H2’13
• Global prices for iron ore and coking coal went up in Q3’13
by 13% and 5%, respectively
• Demand for raw materials on the international markets
remains high.
• In 9M 2013, iron ore import to China increased by 9% yoy
RAW MATERIALS MARKET IN RUSSIA REMAINS
OVERSUPPLIED
GLOBAL RAW MATERIAL PRICES
Source: Metal Bulletin
5
0,3
0,4
0,5
0,6
0,7
0,8
0,9
1,0
1,1
1,2
Jan
-12
Feb
-12
Mar
-12
Ap
r-1
2
May
-12
Jun
-12
Jul-
12
Au
g-1
2
Sep
-12
Oct
-12
No
v-1
2
Dec
-12
Jan
-13
Feb
-13
Mar
-13
Ap
r-1
3
May
-13
Jun
-13
Jul-
13
Au
g-1
3
Sep
-13
Oct
-13
Iron ore fines (Fe 62%) import China, CFR
Coking coal, export Australia, FOB
Scrap export Europe, FOB
HRC China export, FOB
CHINA: IRON ORE IMPORT AND INVENTORIES
m t
Source: Bloomberg
-26% yoy
-2% in Q3.
552
601
100
200
300
400
500
600
700
Импорт ЖРС
9М '12 9М '13
+9%
IRON ORE IMPORT IRON ORE INVENTORIES AT CHINA PORTS
RUSSIA: RAW MATERIALS MARKET BALANCE
Source: Metal Expert.
-6,0 -6,0
17,7 17,1
2,2 1,8
-11
-1
9
19
ImportSales to domestic marketExport
m t
PELLET MARKET BALANCE
-12,4 -16,1
30,5 29,4
1,7 1,6
-20
0
20
ImportSales to domestic marketExport
COKING COAL MARKET BALANCE
m t
9M ‘12 9М ‘13 9М ‘12 9М ‘13
m t
Q3’ 13

Global average
0%
20%
40%
60%
80%
100%
120%
Q1'08
Q2'08
Q3'08
Q4'08
Q1'09
Q2'09
Q3'09
Q4'09
Q1'10
Q2'10
Q3'10
Q4'10
Q1'11
Q2'11
Q3'11
Q4'11
Q1'12
Q2'12
Q3'12
Q4'12
Q1'13
Q2'13
Q3'13
Lipetsk plant
3,0 3,1 3,1
0,5 0,5 0,6 0,2 0,2 0,2 3,7 3,8 3,9 ~4,1*
Q1'13 Q2'13 Q3'13 Q4'13 (P)
Steel Long products Foreign rolled products
PRODUCTION RESULTS HIGH CAPACITY UTILIZATION RATES
• Growth in steel production in Q3’13 to 3.9 m t (+3% qoq)
• Average capacity utilization rate 96%
o Lipetsk plant – 99%
o NLMK Indiana – 91%
o NLMK Russia Long – 90%
CRUDE STEEL PRODUCTION OUTLOOK
• Q4’13 steel output up by 200,000 t, (+5% qoq) to 4.1 m t
driven by NLMK Kaluga production of 290,000 t
• 2013 steel output of 15.5 m t, +4% yoy
6
87% 90%
96% 94%
91% 90%
99% 96%
70%
80%
90%
100%
NLMK USA NLMK Longproducts
Novolipetsk NLMK Group
Q2'13 Q3'13
NLMK: STEELMAKING CAPACITY UTILIZATION STEELMAKING CAPACITY UTILIZATION
Source: global capacity utilization rate according to WSA
NLMK: STEEL PRODUCTION
m t
* Excluding NLMK Verona output in Q4’13
12,2
1,8 0,9
2012 2013 (P)
14,9 15,5*
80%
8%
11%
0%
20%
40%
60%
80%
100%
Sales by sectorQ3'13
Pipe producers
Machinery
Construction andinfrastructure
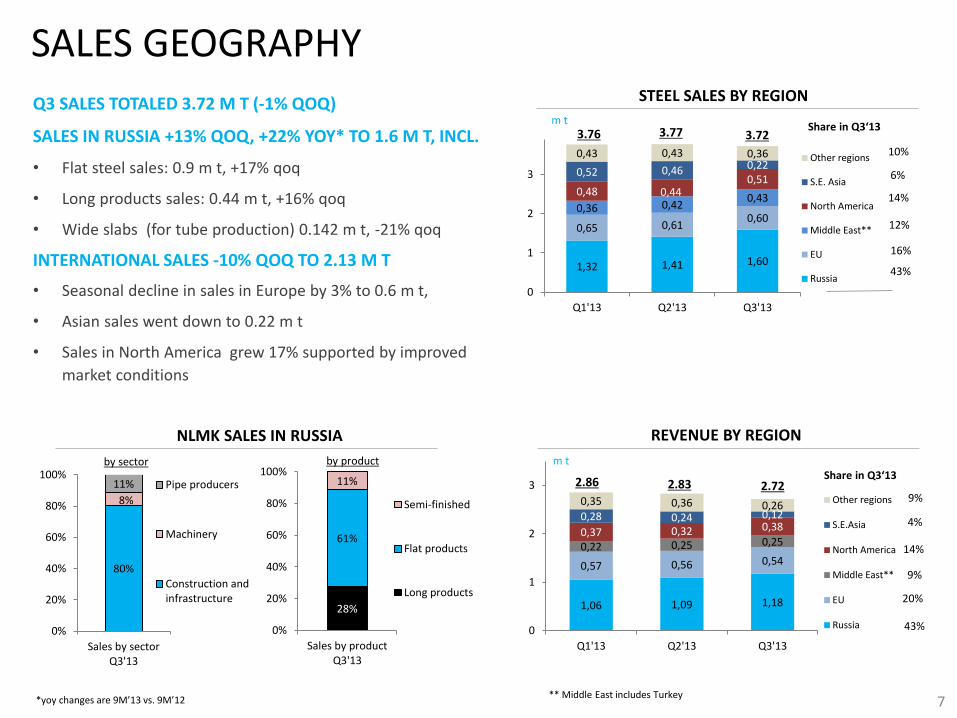
SALES GEOGRAPHY Q3 SALES TOTALED 3.72 M T (-1% QOQ)
SALES IN RUSSIA +13% QOQ, +22% YOY* TO 1.6 M T, INCL.
• Flat steel sales: 0.9 m t, +17% qoq
• Long products sales: 0.44 m t, +16% qoq
• Wide slabs (for tube production) 0.142 m t, -21% qoq
INTERNATIONAL SALES -10% QOQ TO 2.13 M T
• Seasonal decline in sales in Europe by 3% to 0.6 m t,
• Asian sales went down to 0.22 m t
• Sales in North America grew 17% supported by improved
market conditions
7
NLMK SALES IN RUSSIA
28%
61%
11%
0%
20%
40%
60%
80%
100%
Sales by productQ3'13
Semi-finished
Flat products
Long products
*yoy changes are 9M’13 vs. 9M’12
by sector by product
1,32 1,41 1,60
0,65 0,61 0,60
0,36 0,42 0,43
0,48 0,44 0,51
0,52 0,46 0,22 0,43 0,43 0,36
0
1
2
3
Q1'13 Q2'13 Q3'13
Other regions
S.E. Asia
North America
Middle East**
EU
Russia
REVENUE BY REGION
1,06 1,09 1,18
0,57 0,56 0,54 0,22 0,25 0,25 0,37 0,32 0,38 0,28 0,24 0,12 0,35 0,36 0,26
0
1
2
3
Q1'13 Q2'13 Q3'13
Other regions
S.E.Asia
North America
Middle East**
EU
Russia
2.86
m t
2.83 2.72
STEEL SALES BY REGION
3.72 m t
3.76 3.77
10%
6%
14%
12%
16%
43%
Share in Q3‘13
9%
4%
14%
9%
20%
43%
Share in Q3‘13
** Middle East includes Turkey

-89%
-17%
-7%
-2%
-2%
-1%
3%
6%
11%
17%
-40% -30% -20% -10% 0% 10% 20%6% 5% 6% 6% 9% 9%
12% 13%
7% 7% 2% 2%
8% 10%
21% 23% 0%
1% 19% 14%
1% 0% 9% 9%
Q2 '13 Q3 '13
0%
20%
40%
60%
80%
100%
Revenue from otheroperations*Pig iron
Slabs
Billets
HRC
Long products
Metalware
Plate
CRC
Galvanized
Pre-painted
Electrical steel
SALES STRUCTURE FINISHED STEEL SALES GREW 6% TO 2.9 M T
• Share of finished steel grew 5 p.p. qoq to 78%
• Pig iron sales down to 9,000 t, compared to 91,000 t in Q2
• Slab sales to third parties down 17% driven by increased
demand for finished steel and growth in slab sales to
Foreign rolled products segment
• Seasonal growth of long product and metalware sales
HIGH VALUE ADDED GRADES SALES UP 2% TO 1.41 M T
CHANGE IN SALES BY PRODUCT Q3/Q2
8
SALES BY PRODUCT
* Note: Revenue from other operations includes revenues from sales of iron ore, coke, scrap and others
REVENUE BY PRODUCT
4% 3% 4% 4% 8% 8%
13% 15%
6% 6% 2% 2% 10% 12%
26% 28%
0% 1%
25% 21%
2% 0%
Q2'13 Q3'13
0%
20%
40%
60%
80%
100% Pig iron
Slabs
Billets
HRC
Long products
Metalware
Plate
CRC
Galvanized
Pre-painted
Electrical steel
3.774 m t 3.724 m t
$2,72 bn $2.83 bn
High value added grades
High value added grades
20% 10% 0% -10% -20% -100%
Pig iron
Slabs
Electrical steel
Galvanized
Thick plates
Pre-painted
Metalware
HRC
CRC
Long products

13
80 100
30
38
0
20
40
60
80
100
120
Q1'13 Q2'13 Q3'13 9M'13 12M'13 (Е)
75 67 64 66 56 52
34 34 27 27
27 31
12 10
10 9 9 9
50
39 27
121 111
100 102 92 92
0
50
100
150
200
2008 2009 2010 2011 2012 2013(Е)
Carsid + EAF and Long products + Safef Thonville
Service centers
NLMK Coating and NLMK Strasbourg
NLMK La Louviere and total overheads for division
NLMK Europe Strip
IMPROVING HOT-END OPERATIONAL EFFICIENCY
• The program covers production and auxiliary processes
• Target level of savings in 2013: c. $100 m*
• Effect of $80 m achieved in 9М13
RESTRUCTURING OF EUROPEAN ASSETS
• Restructuring program is being implemented since 2008
o Change in asset perimeter and transition to a re-roller model
o Consistent cost reduction through optimization programs
• NLMK La Louviere Restructuring Agreement (March 2013)
o Headcount optimization by 30%
o Fixed costs reduction by $30 m/y (full effect in 2014)
• Involvement of the Belgian state-owned company SOGEPA as
a strategic partner in European assets
o Sale of 20.5% interest in NLMK Belgium Holdings (NBH)
for €91 m ($123 m)
o SOGEPA participation in governance
OPERATIONAL EFFICIENCY
9
* Gains from “quick improvements“ program in hot-end operations at Novolipetsk and Altai-Koks. The program was announced in February 2013.
FIXED COSTS OF NLMK EUROPE STRIP
PRODUCTION COSTS REDUCTION WITHIN “RAPID IMPROVEMENTS” PROGRAM
€ m
$ m
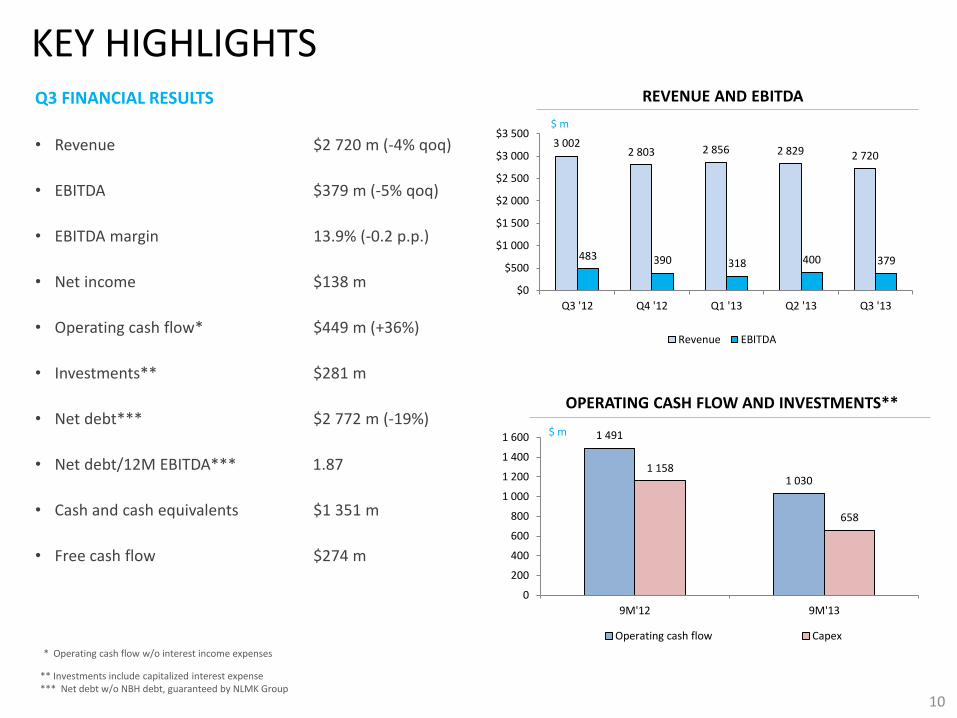
KEY HIGHLIGHTS Q3 FINANCIAL RESULTS
• Revenue $2 720 m (-4% qoq)
• EBITDA $379 m (-5% qoq)
• EBITDA margin 13.9% (-0.2 p.p.)
• Net income $138 m
• Operating cash flow* $449 m (+36%)
• Investments** $281 m
• Net debt*** $2 772 m (-19%)
• Net debt/12M EBITDA*** 1.87
• Cash and cash equivalents $1 351 m
• Free cash flow $274 m
3 002 2 803 2 856 2 829 2 720
483 390 318 400 379
$0
$500
$1 000
$1 500
$2 000
$2 500
$3 000
$3 500
Q3 '12 Q4 '12 Q1 '13 Q2 '13 Q3 '13
Revenue EBITDA
REVENUE AND EBITDA
$ m
10
OPERATING CASH FLOW AND INVESTMENTS**
1 491
1 030 1 158
658
0
200
400
600
800
1 000
1 200
1 400
1 600
9М'12 9М'13
Operating cash flow Capex
$ m
** Investments include capitalized interest expense *** Net debt w/o NBH debt, guaranteed by NLMK Group
* Operating cash flow w/o interest income expenses

PROFITABILITY
11
SEGMENT EBITDA CHANGES
400
-27 +27 +16 -37
-0
379
100
200
300
400
500
Q2'13 SteelSegment
ForeignRolled
ProductsSegment
LongProductsSegment
MiningSegment
Others andintersegm.operations
Q3'13
$ m
16,1%
13,9%
11,1%
14,1% 13,9%
0%
4%
8%
12%
16%
20%
Q3'12 Q4'12 Q1'13 Q2'13 Q3'13
EBITDA MARGIN
EBITDA: FACTOR ANALYSIS
$ m
Q3’13 EBITDA WAS $379 MILLION
• Revenue declined by 4%
o Growth in value added product sales partially offset weaker prices and lower pig iron sales volume
• Stable profitability at 13.9%
o (-) Decline in steel prices outpacing that of raw materials – narrowing price spreads
o (+) Sales structure improvement
o (+) Cost reduction program
o (+) RUB/US$ rate down 4% qoq
318
+29
+32
+21
400
+19
-50 +10
379
200
250
300
350
400
450
Q1'13 Salesstructure
Steel and rawmaterialsspreads
Costoptimization,
FXeffect, other
Q2'13 Salesstructure
Steel and rawmaterialsspreads
Costoptimiz-n
programs, FXeffect, other
Q3'13
1 096
-125
1 221
13.0%
15.0%
NLMK Groupfact
NBH impact NLMK Groupwithout NBH
2 720
-341 219
2 598
NLMKGroup
fact
NBHrevenue
Slab salesto NBH
NLMKwithout
NBH
8 405
-1 062 718
8 061
NLMKGroup
fact
NBHrevenue
Slab salesto NBH
NLMKwithout
NBH
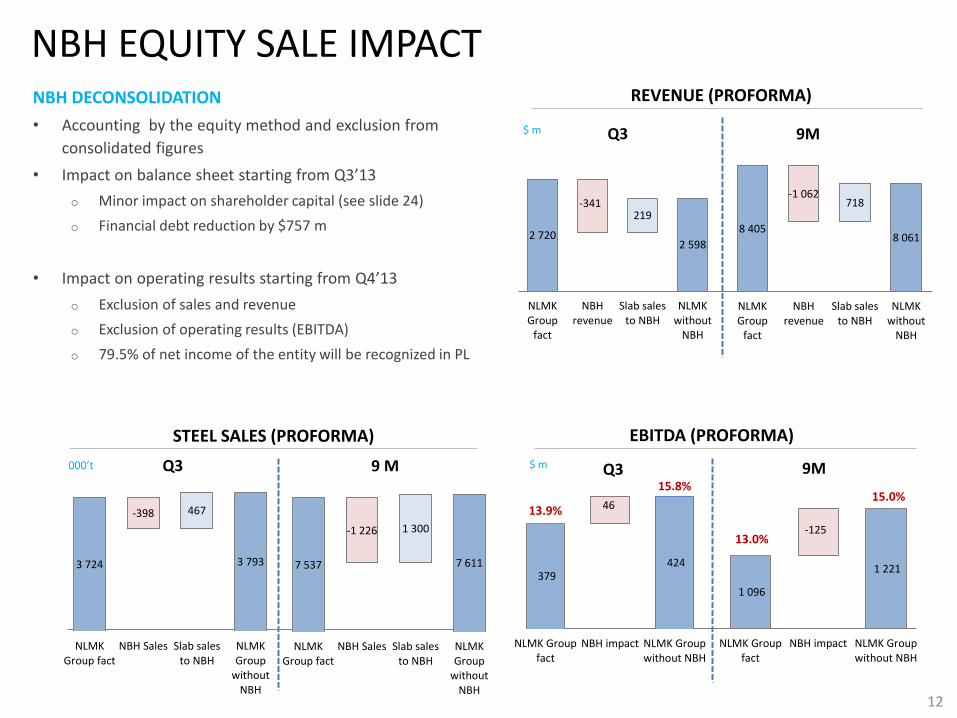
NBH EQUITY SALE IMPACT
12
REVENUE (PROFORMA)
NBH DECONSOLIDATION
• Accounting by the equity method and exclusion from
consolidated figures
• Impact on balance sheet starting from Q3’13
o Minor impact on shareholder capital (see slide 24)
o Financial debt reduction by $757 m
• Impact on operating results starting from Q4’13
o Exclusion of sales and revenue
o Exclusion of operating results (EBITDA)
o 79.5% of net income of the entity will be recognized in PL
EBITDA (PROFORMA) $ m Q3 9M
STEEL SALES (PROFORMA)
000’t Q3 9 M
3 724
-398 467
3 793
NLMKGroup fact
NBH Sales Slab salesto NBH
NLMKGroup
withoutNBH
7 537
-1 226 1 300
7 611
NLMKGroup fact
NBH Sales Slab salesto NBH
NLMKGroup
withoutNBH
379
46
424
13.9%
15.8%
NLMK Groupfact
NBH impact NLMK Groupwithout NBH
$ m Q3 9M

CASH FLOW BRIDGE IN Q3‘13 POSITIVE FREE CASH FLOW
• Release of working capital: $125 m
• Control over investment project implementation
o Investments of $ 281 m significantly lower the
operating cash flow
o Investment reduction as key projects are implemented
• Cash from NBH shares sale $123 m
• Net outflow from borrowings $199 m
• Free Cash Flow (FCFF) in Q3 was $274 m*
13 $ m
EBITDA
Working capital change
Other and non cash operations
Income tax
Net interests
OPERATING CASH FLOW
Capital expenditures
Cash from NLMK Belgium Holdings sale
FREE CASH FLOW OF THE COMPANY
Net repayment of borrowings
Other financial operations
Cash outflow
FREE CASH FLOW TO EQUITY
Change in deposits
FX rate change
CHANGE IN CASH
CASH FLOW
-405
-27
-381
3
-77
+6
-199
274
+123
-281
432
-17
-59
+4
+125
379
*Excluding cash, placed on ST bank deposits

3,79 3,51
0,99
+0.40
-0.60
+0.25
-0.76
+0.05
0,62
2
3
4
5
6
30 Jun '13 Borrowings Debtrepayments
Reclassificationof debt for SIF
shares***
NBHdebt
deconsoli-dation
Other factors 30 Sept '13
ST debt LT debt
3,0
2,5
2,7
3,1
3,3 3,4
3,6
2,0
2,2
2,4
2,6
2,8
3,0
3,2
3,4
3,6
3,8
Q1'12
Q2'12
Q3'12
Q4'12
Q1'13
Q2'13
Q3'132
DEBT POSITION FINANCIAL DEBT
• Net debt* $2.77 bn (-19%)
• Total debt $4.12 bn (-14%)
• Cash and equivalents ** $1.35 bn (-1%)
• Net debt/ 12M EBITDA* 1.87
NLMK BELGIUM HOLDINGS LIABILITIES DECONSOLIDATION
CONSISTENET NET DEBT REDUCTION
INVESTMENT CREDIT RATING (MOODY’S, FITCH)
14
*W/o NBH debt, guaranteed by NLMK Group **Cash and equivalents and ST deposits *** In Q3, $252 of debt for SIF shares was included into financial debt; previously it was included in accounts payable, as they are reassigned to the bank
MATURITY AND NET DEBT/EBITDA
Weighted average maturity
Years to maturity
1,69
1,90
1,84
1,88
1,93
2,15
1,87
0,0
0,5
1,0
1,5
2,0
2,5
3,0
Q1'12
Q2'12
Q3'12
Q4'12
Q1'13
Q2'13
Q3'132
Net debt/EBITDA
CHANGE IN DEBT POSITION
NET DEBT CHANGE
$ bn
3,42
-0,43 +0,28
+0,25
-0,68
-0,05
2,77
2,0
3,0
4,0
30 Jun '13 Operatingcashflow
Capex Reclassificationof debt for SIF
shares***
NBHdeconsoli-
dation
Otherfactors
30 Sept '13
$ bn

24 31 31 27 22
42 37 33 35
35
0%
5%
10%
15%
20%
25%
0
10
20
30
40
50
60
70
Q3'12 Q4'12 Q1'13 Q2'13 Q3'13
Capitalized interest expense (lhs) Non-capitalized interest expense (lhs)
Interest expense to EBITDA (rhs)
27
895 723
2 434
$0
$500
$1 000
$1 500
$2 000
$2 500
$3 000
2013 2014 2015 2016 и далее
RUB bonds ECA EBRD NLMK Dansteel Others Europbonds (USD)
1351 616
2 331
42 187 175 212
$0
$500
$1 000
$1 500
$2 000
$2 500
$3 000
$3 500
$4 000
Liquid assets Q4 '13 Q1 '14 Q2 '14 Q3 '14 12M
SETTLEMENT OF FINANCIAL LIABILITIES SIGNIFICANT LIQUIDITY POSITION
COMFORTABLE MATURITY SCHEDULE
• Short term debt $0.62 bn, (-38% qoq)
o Ruble bonds
o Credit lines
o ECA- financing
• Long term debt $3.51 bn, (-7% qoq)
o Eurobonds and ruble bonds
o Long term part of ECA
15
LIQUIDITY AND ST DEBT MATURITY*
TOTAL DEBT MATURITY SCHEDULE***
$ m
INTEREST EXPENSES**
* ST maturity payments with interest accrued and debt maturity schedule ** Quarterly figures are derived by computational method on the basis of quarterly reports *** Maturity payments do not include interest payments
$ m Undrawn committed credit lines
Cash and equivalents
$ m
57 62 64
68 66
OUTLOOK
16
STEEL PRODUCTION
• Steel output in Q4’13 will grow by 5% to 4.1 m t, driven by production growth at NLMK Kaluga
• In 2013 steel production will reach 15.5 m t (or +4% y/y)
FINANCIALS
• In Q4, we expect steel prices to soften due to the seasonal slowdown in demand and projected decline in steel raw
material prices
• The company continues to work on offsetting the negative impact of market conditions by improving technical and
business process efficiency

SEGMENTS
17

SEGMENT CONTRIBUTION – Q3 ‘13
187
40
190
-35
-2
379
$0
$50
$100
$150
$200
$250
$300
$350
$400
$450
Stee
lse
gmen
t
Lon
gp
rod
uct
sse
gmen
t
Min
ing
segm
ent
Fore
ign
rolle
dp
rod
uct
sse
gmen
t
Oth
er
fact
ors
Q3
'13
$ m
286 197
83 214 187
-62 -72 -26 -62 -35
61
31
20
23 40
190
207
215
227 190
7
27
26
-2 -2 -$90
$110
$310
$510
Q3 '12 Q4 '12 Q1 '13 Q2 '13 Q3 '13
Steel segment Foreign rolled products segmentLong products segment Mining segmentOthers
$ m
18
STEEL SEGMENT
• Decline in steel prices
• Product mix improvement
• Ongoing cost optimization
LONG PRODUCTS SEGMENT
• Seasonal sales growth (incl. contribution from NLMK-Kaluga)
• High capacity utilization
MINING SEGMENT
• Lower iron ore prices
• Cost increase driven by electricity tariffs inflation
FOREIGN ROLLED PRODUCTS SEGMENT
• NLMK USA operating results improvement
• Seasonal reduction in NLMK Europe performance
Steel segment Revenue
Production cost
Revenue
Revenue
Revenue
Production cost
Production cost
Production cost
SEGMENT EBITDA
SEGMENT CONTRIBUTION TO Q3 EBITDA SEGMENT FINANCIAL INDICATORS CHANGE Q3/Q2
Foreign rolled products segment
Long products
segment
Mining segment
0%
-11%
4%
10%
-1%
3%
-1%
-3%

1,82 1,84 1,70 1,66 1,68 1,53
0,46 0,30 0,35 0,35 0,37
0,47
0,32 0,29 0,20 0,08
0,21 0,19
0,0
0,5
1,0
1,5
2,0
2,5
Q2 '12 Q3 '12 Q4 '12 Q1 '13 Q2 '13 Q3 '13
Revenue from intersegment salesRevenue from third partiesEBITDA
14% 13%
10% 4%
10% 9%
EBITDA margin
24%
16%
5% 4% 4%
6% 5%
1%
8%
18%
8%
Iron ore
Coke and coking coal
Scrap
Ferroalloys
Other raw materials
Electricity
Natural gas
Other energy resources
Personnel
Other expenses incl change in inventory
Depreciation
STEEL SEGMENT
EXPORT SALES REDUCTION BY 7% TO 2.21 M T
• Growth of domestic sales incl. finished products
• Export sales decrease
• Increase of intersegment slab supply
DECLINE IN AVERAGE SELLING PRICES
KEEPING PROFITABILITY
• Cost optimization programs
• SG&A costs reduced by 6%
• Average RUB/USD FX rate decreased by 4% qoq
3% 3% 6% 6% 3% 3% 3% 4% 6% 5% 9% 8% 7% 7%
9% 8% 19% 15%
17% 14%
28% 24%
23% 19%
34% 39% 24%
31%
0% 4% 0% 2% 8% 8%
0%
20%
40%
60%
80%
100%
Sales Q3 Sales Q2 Revenue Q3 Revenue Q2
Other revenue*
Pig iron
Slab
HRC
CRC
Galvanized
Pre-painted
Dynamo
Transformer
2,210,000 t $1 529 m
$ bn
19
2,364,000 t $1 685 m
REVENUE AND EBITDA
SALES AND REVENUE STRUCTURE
COST OF SALES STRUCTURE IN Q3 `13
* Revenue from the Segment's sales of other products

329 314 281 288 314 355
162 122
88 59
113
114
50 61 31 20 23 40
0
70
140
210
280
350
420
490
560
Q2 '12 Q3 '12 Q4 '12 Q1 '13 Q2 '13 Q3 '13
Revenue from intersegment sales Revenue from third parties EBITDA
14% 17% 15% 19%
71% 83%
69% 76%
15% 0%
13% 0% 3% 5%
0%
20%
40%
60%
80%
100%
Sales Q3 Sales Q2 Revenue Q3 Revenue Q2
Other revenue*
NLMK Kaluga
Long products
Metalware
LONG PRODUCTS SEGMENT
SALES AND REVENUE GROWTH
• Sales increased by 21% to 570,000 t including sales from
NLMK Kaluga (+86’000 t)
• Stable pricing environment supported by a seasonal
improvement in demand
• Total segment revenue grew by 10% to $468 m
o 24% of total revenue – scrap sales to Lipetsk site (Steel
segment)
SEGMENT’S PROFITABILITY GROWTH TO 8% (+ 3 P.P.)
• Widening spreads between long products and scrap
• Production costs per tonne reduction due to sales growth
469,000 t $314 m
$ m
20
* Revenue from other product sales
60%
2% 1%
8%
8%
15%
5%
Scrap
Ferroalloys
Other materials
Electricity
Personnel costs
Other expenses
Depreciation
$355 m 570,000 t
* - Revenue from intersegment sales mainly include scrap supplies to the Lipetsk site
REVENUE AND EBITDA
SALES AND REVENUE STRUCTURE
COST OF SALES STRUCTURE IN Q3 `13
10%
14%
8%
6% 5%
8%
EBITDA margin
69%
60% 60% 64% 65%
61%
EBITDA margin
86 93 127 92 100 86
274 222
220 245 249 226
247
190 207 215 227 190
0
100
200
300
400
500
Q2 '12 Q3 '12 Q4 '12 Q1 '13 Q2 '13 Q3 '13Revenue from intersegmental sales
Revenue from third parties
EBITDA
MINING SEGMENT
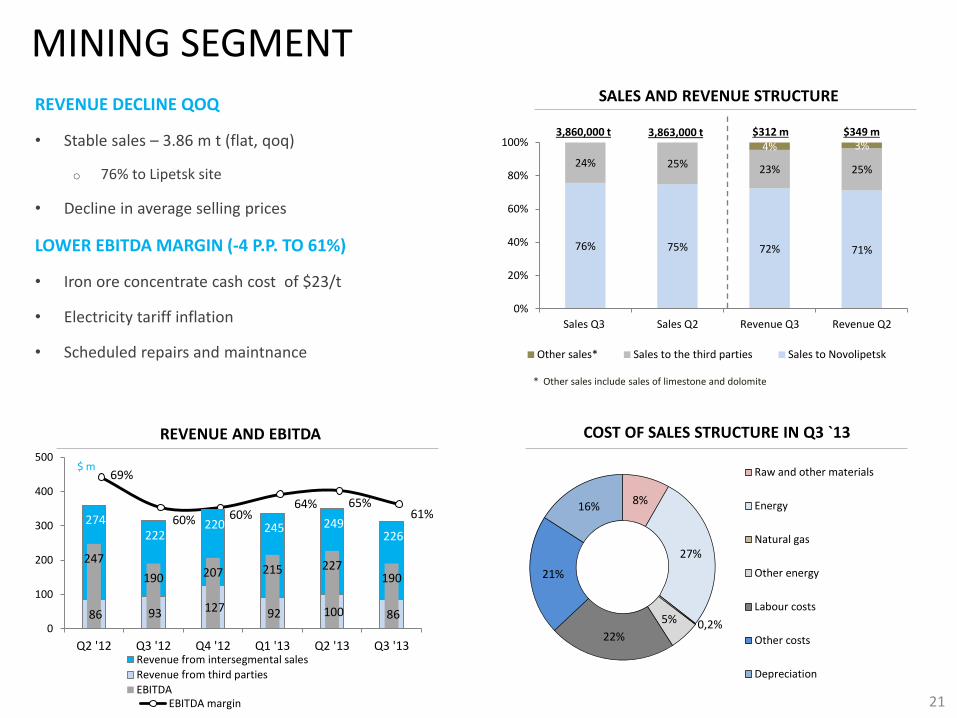
REVENUE DECLINE QOQ
• Stable sales – 3.86 m t (flat, qoq)
o 76% to Lipetsk site
• Decline in average selling prices
LOWER EBITDA MARGIN (-4 P.P. TO 61%)
• Iron ore concentrate cash cost of $23/t
• Electricity tariff inflation
• Scheduled repairs and maintnance
21
76% 75% 72% 71%
24% 25% 23% 25%
4% 3%
0%
20%
40%
60%
80%
100%
Sales Q3 Sales Q2 Revenue Q3 Revenue Q2
Other sales* Sales to the third parties Sales to Novolipetsk
SALES AND REVENUE STRUCTURE
$ m
8%
27%
0,2% 5%
22%
21%
16%
Raw and other materials
Energy
Natural gas
Other energy
Labour costs
Other costs
Depreciation
3,863,000 t $349 m $312 m 3,860,000 t
* Other sales include sales of limestone and dolomite
REVENUE AND EBITDA COST OF SALES STRUCTURE IN Q3 `13
61% 62% 54% 56%
24% 25% 26% 27%
14% 12% 16% 13% 3% 4%
0%
20%
40%
60%
80%
100%
Sales Q3 Sales Q2 Revenue Q3 Revenue Q2
Other revenue
Pre-painted
CRC
HRC
1 026
760 692
817 730 750
-5 -62 -72 -26 -62
-35
0%
-8% -10%
-3%
-9%
-5%
-15%
-10%
-5%
0%
5%
10%
-200
0
200
400
600
800
1 000
1 200
Q2 '12 Q3 '12 Q4 '12 Q1 '13 Q2 '13 Q3 '13
Revenue from third parties EBITDA
EBITDA margin (rhs)
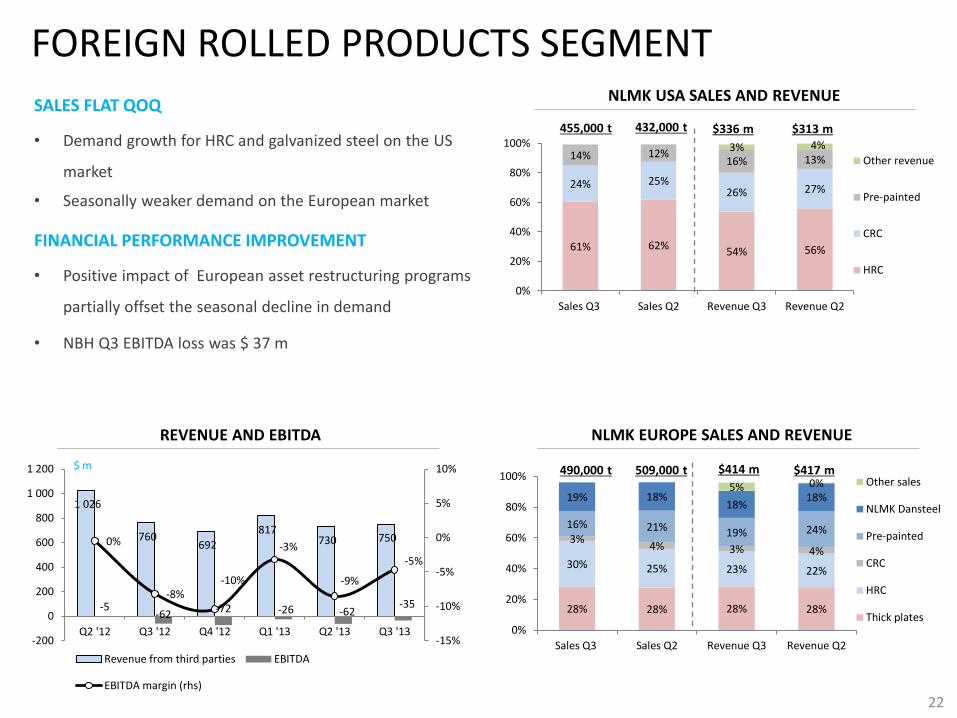
FOREIGN ROLLED PRODUCTS SEGMENT
SALES FLAT QOQ
• Demand growth for HRC and galvanized steel on the US
market
• Seasonally weaker demand on the European market
FINANCIAL PERFORMANCE IMPROVEMENT
• Positive impact of European asset restructuring programs
partially offset the seasonal decline in demand
• NBH Q3 EBITDA loss was $ 37 m
$ m
22
28% 28% 28% 28%
30% 25% 23% 22%
3% 4% 3% 4%
16% 21% 19% 24%
19% 18% 18%
18% 5% 0%
0%
20%
40%
60%
80%
100%
Sales Q3 Sales Q2 Revenue Q3 Revenue Q2
Other sales
NLMK Dansteel
Pre-painted
CRC
HRC
Thick plates
$336 m $313 m 455,000 t 432,000 t
490,000 t $414 m 509,000 t $417 m
NLMK USA SALES AND REVENUE
NLMK EUROPE SALES AND REVENUE REVENUE AND EBITDA

23
APPENDICES
4 786
4 124
-757
+95
3600
3800
4000
4200
4400
4600
4800
5000
Q2 '13 NBH decons* Other changes** Q3 '13
$ m
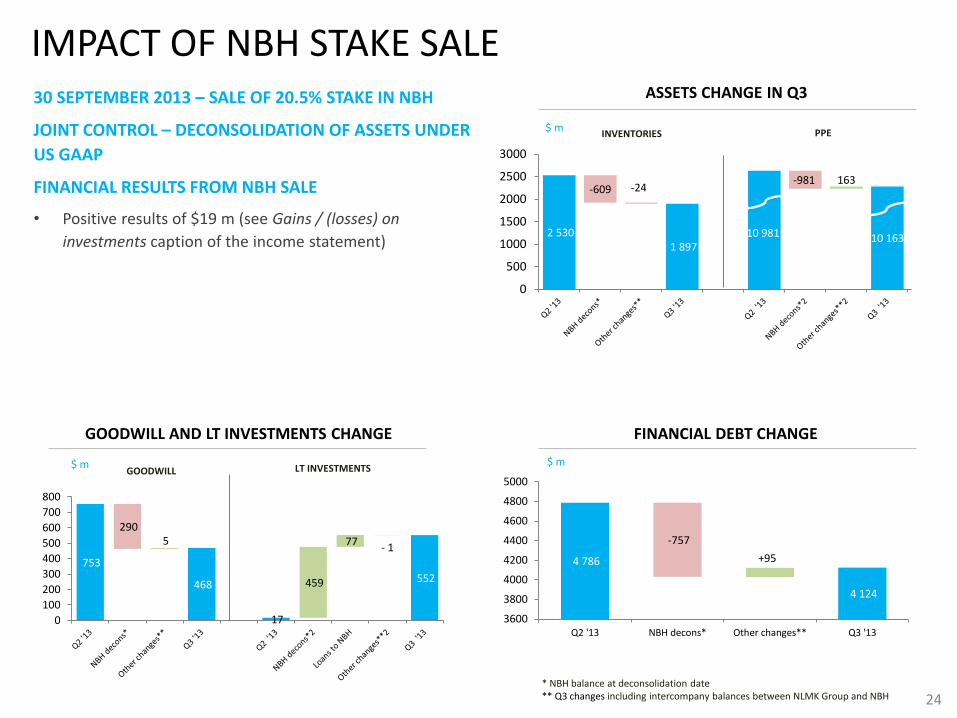
IMPACT OF NBH STAKE SALE 30 SEPTEMBER 2013 – SALE OF 20.5% STAKE IN NBH
JOINT CONTROL – DECONSOLIDATION OF ASSETS UNDER
US GAAP
FINANCIAL RESULTS FROM NBH SALE
• Positive results of $19 m (see Gains / (losses) on
investments caption of the income statement)
GOODWILL AND LT INVESTMENTS CHANGE
24
ASSETS CHANGE IN Q3
FINANCIAL DEBT CHANGE
INVENTORIES PPE
753
468
17
552
290 5
459
77 - 1
0
100
200
300
400
500
600
700
800
$ m GOODWILL LT INVESTMENTS
* NBH balance at deconsolidation date ** Q3 changes including intercompany balances between NLMK Group and NBH
2 530 1 897
10 981 10 163
-609 -24 -981 163
0
500
1000
1500
2000
2500
3000
$ m

FOREIGN ASSET PERFORMANCE
25
LIPETSK SITE SLAB SALES IN 2013
1,13
0,94
0,78
0,35
0,48 0,47
0,11 0,13 0,10 0,05 -
0,37
-
0,2
0,4
0,6
0,8
1,0
1,2
Q1'13 Q2'13 Q3'13
To third parties NBH NLMK Dansteel NLMK USA
m t
FOREIGN ASSET FINANCIALS
1 079
-117
1 234
1
2 313
-116
-500
0
500
1000
1500
2000
2500
Revenue 9М'13
EBITDA 9М'13
$ m
338
-37
429
9
767
-28
-100
0
100
200
300
400
500
600
700
800
900
RevenueQ3'13
EBITDAQ3'13
NBHNLMK USA and NLMK Dansteel
$ m
NLMK USA AND NLMK DANSTEEL STEEL SALES
274 268 275
116 110 111 82
51 65 73
92 92
0
50
100
150
200
250
300
Q1'13 Q2'13 Q3'13
HRC CRC Coated Thick plates (NLMK Dansteel)
m t
NBH STEEL SALES
134 128 146
17 21 14
92 105
80
151 141 138
0
50
100
150
200
Q1'13 Q2'13 Q3'13
HRC CRC Coated Thick plates
m t
400
900
0
100
200
300
400
500
600
700
800
900
1000
2013(e) 2014(e)
46%
21%
8% 9% 8% 6%
1% 0%
17% 12%
31%
18%
11% 7%
2% 1%
0%
5%
10%
15%
20%
25%
30%
35%
40%
45%
50%
Ura
l
Sib
eria
n
Cen
tral
Vo
lga
No
rth
Wes
tern
Sou
ther
n
Far
East
ern
No
rth
Cau
casi
an
Share in long steel production
Share in long steel consumption
Long steel shortage – 3.8 m t py
0 1000 2000 3000 4000
ZSMK
Mechel
MMK
NSMMZ
Abinsky EMZ
Rostovsky EMZ
Severstal - Balakovo
Severstal - Vologda
Revyakinskiy MZ
NLMK Kaluga
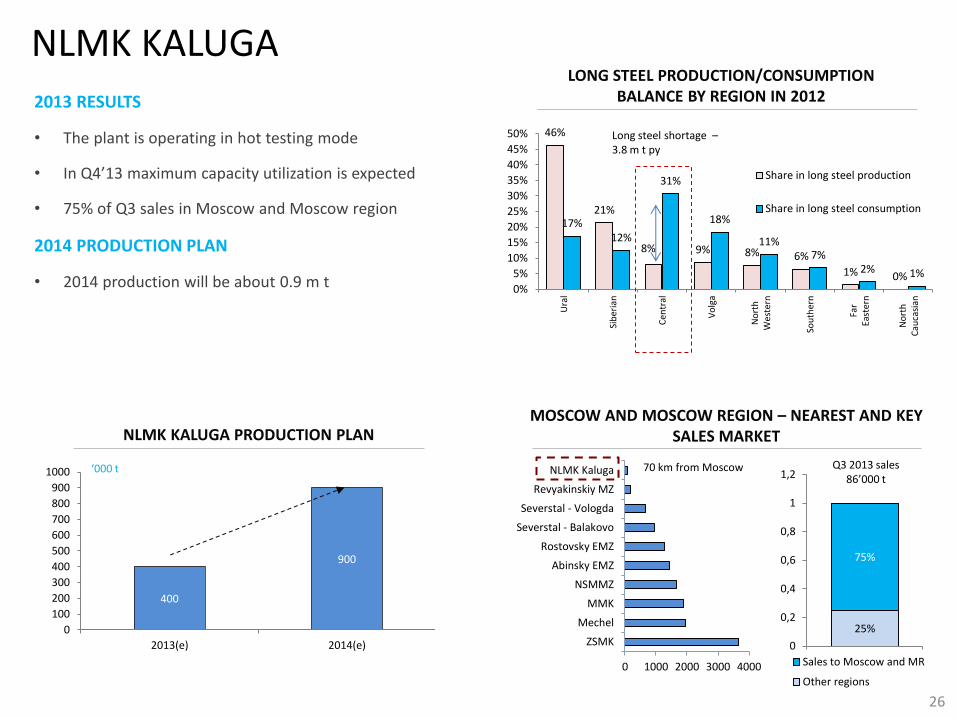
NLMK KALUGA
26
MOSCOW AND MOSCOW REGION – NEAREST AND KEY SALES MARKET
25%
75%
0
0,2
0,4
0,6
0,8
1
1,2
Реализация 3кв 13 Sales to Moscow and MR
Other regions
Q3 2013 sales 86’000 t
2013 RESULTS
• The plant is operating in hot testing mode
• In Q4’13 maximum capacity utilization is expected
• 75% of Q3 sales in Moscow and Moscow region
2014 PRODUCTION PLAN
• 2014 production will be about 0.9 m t
NLMK KALUGA PRODUCTION PLAN
70 km from Moscow ‘000 t
LONG STEEL PRODUCTION/CONSUMPTION BALANCE BY REGION IN 2012
27
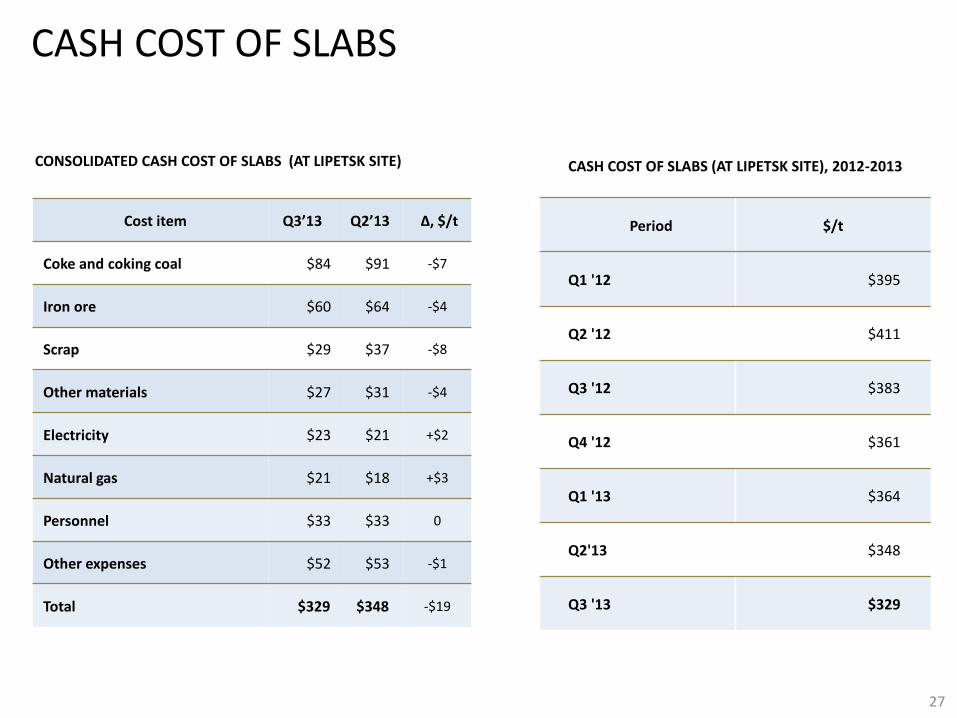
CASH COST OF SLABS
CONSOLIDATED CASH COST OF SLABS (AT LIPETSK SITE)
Cost item Q3’13 Q2’13 ∆, $/t
Coke and coking coal $84 $91 -$7
Iron ore $60 $64 -$4
Scrap $29 $37 -$8
Other materials $27 $31 -$4
Electricity $23 $21 +$2
Natural gas $21 $18 +$3
Personnel $33 $33 0
Other expenses $52 $53 -$1
Total $329 $348 -$19
CASH COST OF SLABS (AT LIPETSK SITE), 2012-2013
Period $/t
Q1 '12 $395
Q2 '12 $411
Q3 '12 $383
Q4 '12 $361
Q1 '13 $364
Q2'13 $348
Q3 '13 $329
28 1 as at 30.09.2013
2 as at 30.06.2013
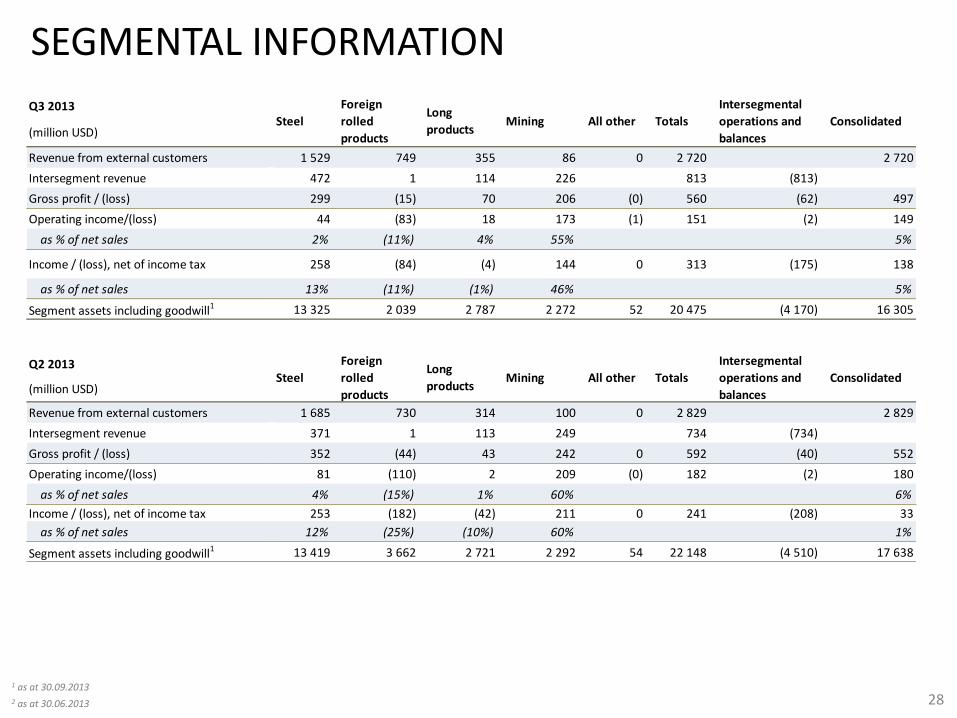
SEGMENTAL INFORMATION
Q3 2013
(million USD)
Revenue from external customers 1 529 749 355 86 0 2 720 2 720
Intersegment revenue 472 1 114 226 813 (813)
Gross profit / (loss) 299 (15) 70 206 (0) 560 (62) 497
Operating income/(loss) 44 (83) 18 173 (1) 151 (2) 149
as % of net sales 2% (11%) 4% 55% 5%
Income / (loss), net of income tax 258 (84) (4) 144 0 313 (175) 138
as % of net sales 13% (11%) (1%) 46% 5%
Segment assets including goodwill1 13 325 2 039 2 787 2 272 52 20 475 (4 170) 16 305
Q2 2013
(million USD)
Revenue from external customers 1 685 730 314 100 0 2 829 2 829
Intersegment revenue 371 1 113 249 734 (734)
Gross profit / (loss) 352 (44) 43 242 0 592 (40) 552
Operating income/(loss) 81 (110) 2 209 (0) 182 (2) 180
as % of net sales 4% (15%) 1% 60% 6%
Income / (loss), net of income tax 253 (182) (42) 211 0 241 (208) 33
as % of net sales 12% (25%) (10%) 60% 1%
Segment assets including goodwill1 13 419 3 662 2 721 2 292 54 22 148 (4 510) 17 638
Totals
Intersegmental
operations and
balances
Consolidated
Steel
Foreign
rolled
products
Long
productsMining All other Totals
Intersegmental
operations and
balances
Consolidated
Steel
Foreign
rolled
products
Long
productsMining All other

29
QUARTERLY DATA: CONSOLIDATED STATEMENT OF INCOME
9M 2013 and 9M 2012 are official reporting periods. Q2 2013 and Q3 2013 figures are derived by computational method.
Q3 2013 Q2 2013 9M 2013 9M 2012
(mln USD) + / - % + / - %
Revenue 2 720 2 829 (110) (4%) 8 405 9 354 (949) (10%)
Production cost (1 993) (2 058) 65 (3%) (6 175) (6 510) 335 (5%)
Depreciation and amortization (230) (220) (10) 4% (656) (569) (87) 15%
Gross profit 497 552 (54) (10%) 1 573 2 275 (702) (31%)
General and administrative expenses (108) (112) 4 (4%) (339) (335) (4) 1%
Selling expenses (212) (227) 15 (7%) (696) (871) 174 (20%)
Taxes other than income tax (28) (33) 4 (13%) (97) (127) 30 (23%)
Operating income 149 180 (31) (17%) 440 942 (502) (53%)
Loss on disposals of property, plant and equipment (11) (4) (7) 174% (17) (38) 21 (55%)
Gains / (losses) on investments 26 (3) 29 23 (0) 23 0%
Interest income 10 12 (2) (15%) 32 18 14 74%
Interest expense (22) (27) 5 (18%) (80) (38) (42) 112%
Foreign currency exchange gain / (loss), net 52 (5) 57 21 (11) 31 0%
Other expense, net (7) (10) 3 (29%) (26) (35) 9 (27%)
Income before income tax 197 143 55 38% 393 839 (446) (53%)
Income tax expense (59) (110) 51 (46%) (186) (223) 37 (17%)
Equity in net earnings of associate 0 0 (0) (5%) 0 0 (0) (34%)
Net income 138 33 105 319% 207 616 (409) (66%)
Add: Net loss attributable to the non-controlling interest (1) 1 (1) 2 2 1 42%0%
Net income attributable to NLMK stockholders 138 34 104 309% 209 617 (408) (66%)
EBITDA 379 400 (21) (5%) 1 096 1 511 (415) (27%)
Q3 2013/Q2 2013 9M 2013/9M 2012

30
CONSOLIDATED CASH FLOW STATEMENT
9M 2013 and 9M 2012 are official reporting periods. Q3 2013 figures are derived by computational method.
Q3 2013 9M 2013 9M 2012
(mln. USD) + / - %
Cash flow from operating activities
Net income 138 207 616 (409) (66%)
Adjustments to reconcile net income to net cash provided by operating Depreciation and amortization 230 656 569 87 15%Loss on disposals of property, plant and equipment 11 17 38 (21) (55%)(Gains) / losses on investments, net (26) (23) 0 (23)Interest income (10) (32) (32)Interest expense 22 80 80Equity in net ernings of associates (0) (0) (0) 0 (34%)Deferred income tax expense / (benefit) 20 20 (2) 22Gains on derivatives (16) (7) (7) (0) 2%Other (45) 17 8 8
Changes in operating assets and liabilities(Increase) / decrease in accounts receivable (295) (417) 75 (492)Decrease in inventories 51 152 128 24 19%Decrease in other current assets 4 6 19 (13) (70%)Increase in accounts payable and other l iabilities 368 333 50 283Increase/(decrease) in current income tax payable (3) 21 (2) 23
Cash provided from operating activities 449 1 030 1 491 (461) (31%)Interest received 7 28Interest paid (24) (71)
Net cash provided from operating activities* 432 987 1 491
Cash flow from investing activities Proceeds from sale of property, plant and equipment 2 3 24 (21) (87%)Purchases and construction of property, plant and equipment (281) (658) (1 157) 500 (43%)
Proceeds from sale of investments, net 11 19 0 19(Placement) / withdrawal of bank deposits, net (381) (403) 227 (630)Prepayment for acquisition of interests in new subsidiaries (157)
Disposal of investments 46 46Acquisition of additional stake in existing subsidiary (10) (10)
Net cash used in investing activities (604) (1 002) (1 063) 61 (6%)
Cash flow from financing activities
Proceeds from borrowings and notes payable 402 1 664 1 320 344 26%
Repayments of borrowings and notes payable (601) (1 666) (551) (1 115) 202%
Capital lease payments (7) (19) (17) (2) 13%Dividends to shareholders (3) (113) (116) 2 (2%)
Net cash (used in) / provided by financing activities (208) (135) 635 (770)
Net (decrease) / increase in cash and cash equivalents (381) (150) 1 063 (1 213)
Effect of exchange rate changes on cash and cash equivalents (25) 34 (58) 92
Cash and cash equivalents at the beginning of the period 1 241 951 797 154 19%
Cash and cash equivalents at the end of the period 835 835 1 803 (968) (54%)
9M 2013/9M 2012
31
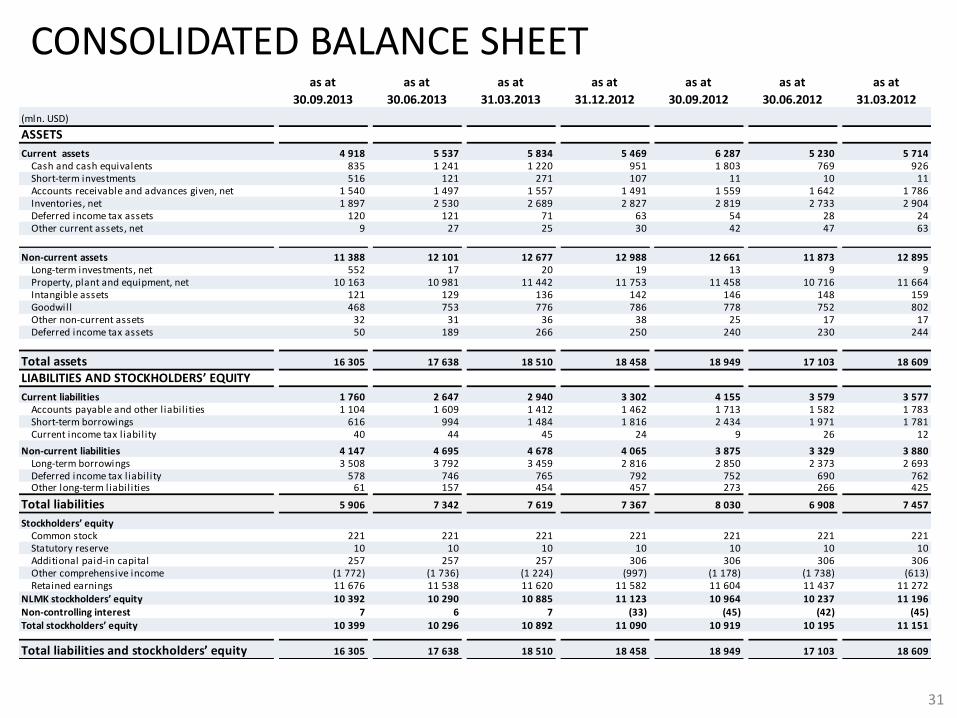
CONSOLIDATED BALANCE SHEET as at
30.09.2013
as at
30.06.2013
as at
31.03.2013
as at
31.12.2012
as at
30.09.2012
as at
30.06.2012
as at
31.03.2012
(mln. USD)
ASSETS
Current assets 4 918 5 537 5 834 5 469 6 287 5 230 5 714Cash and cash equivalents 835 1 241 1 220 951 1 803 769 926Short-term investments 516 121 271 107 11 10 11Accounts receivable and advances given, net 1 540 1 497 1 557 1 491 1 559 1 642 1 786Inventories, net 1 897 2 530 2 689 2 827 2 819 2 733 2 904Deferred income tax assets 120 121 71 63 54 28 24Other current assets, net 9 27 25 30 42 47 63
Non-current assets 11 388 12 101 12 677 12 988 12 661 11 873 12 895Long-term investments, net 552 17 20 19 13 9 9Property, plant and equipment, net 10 163 10 981 11 442 11 753 11 458 10 716 11 664Intangible assets 121 129 136 142 146 148 159Goodwill 468 753 776 786 778 752 802Other non-current assets 32 31 36 38 25 17 17Deferred income tax assets 50 189 266 250 240 230 244
Total assets 16 305 17 638 18 510 18 458 18 949 17 103 18 609
LIABILITIES AND STOCKHOLDERS’ EQUITY
Current liabilities 1 760 2 647 2 940 3 302 4 155 3 579 3 577Accounts payable and other l iabilities 1 104 1 609 1 412 1 462 1 713 1 582 1 783Short-term borrowings 616 994 1 484 1 816 2 434 1 971 1 781Current income tax liability 40 44 45 24 9 26 12
Non-current liabilities 4 147 4 695 4 678 4 065 3 875 3 329 3 880Long-term borrowings 3 508 3 792 3 459 2 816 2 850 2 373 2 693Deferred income tax liability 578 746 765 792 752 690 762Other long-term liabilities 61 157 454 457 273 266 425
Total liabilities 5 906 7 342 7 619 7 367 8 030 6 908 7 457
Stockholders’ equityCommon stock 221 221 221 221 221 221 221Statutory reserve 10 10 10 10 10 10 10Additional paid-in capital 257 257 257 306 306 306 306Other comprehensive income (1 772) (1 736) (1 224) (997) (1 178) (1 738) (613)Retained earnings 11 676 11 538 11 620 11 582 11 604 11 437 11 272
NLMK stockholders’ equity 10 392 10 290 10 885 11 123 10 964 10 237 11 196Non-controlling interest 7 6 7 (33) (45) (42) (45)Total stockholders’ equity 10 399 10 296 10 892 11 090 10 919 10 195 11 151
Total liabilities and stockholders’ equity 16 305 17 638 18 510 18 458 18 949 17 103 18 609

www.nlmk.com
NLMK Investor relations Russia, 115054, Moscow
Bakhrushina str, 18, bldg 1
t. +7 495 915 15 75
f. +7 495 915 79 04
Related Documents