1 NLMK Moscow, 20 May 2014 Q1 2014 US GAAP CONSOLIDATED FINANCIAL RESULTS

Welcome message from author
This document is posted to help you gain knowledge. Please leave a comment to let me know what you think about it! Share it to your friends and learn new things together.
Transcript
1
NLMK
Moscow, 20 May 2014
Q1 2014 US GAAP CONSOLIDATED FINANCIAL RESULTS
This document is confidential and has been prepared by NLMK (the “Company”) solely for use at the investor presentation of the Company and may not be reproduced, retransmitted or further distributed to any other person or published, in whole or in part, for any other purpose.
This document does not constitute or form part of any advertisement of securities, any offer or invitation to sell or issue or any solicitation of any offer to purchase or subscribe for, any shares in the Company or Global Depositary Shares (GDSs), nor shall it or any part of it nor the fact of its presentation or distribution form the basis of, or be relied on in connection with, any contract or investment decision.
No reliance may be placed for any purpose whatsoever on the information contained in this document or on assumptions made as to its completeness. No representation or warranty, express or implied, is given by the Company, its subsidiaries or any of their respective advisers, officers, employees or agents, as to the accuracy of the information or opinions or for any loss howsoever arising, directly or indirectly, from any use of this presentation or its contents.
This document is for distribution only in the United Kingdom and the presentation is being made only in the United Kingdom to persons having professional experience in matters relating to investments falling within Article 19(1) of the Financial Services and Markets Act 2000 (Financial Promotion) Order 2005 (the “Order”) or high net worth entities, and other persons to whom it may otherwise lawfully be communicated, falling within Article 49(2) of the Order (all such persons together being referred to as “relevant persons”). Any person who is not a relevant person should not act or rely on this presentation or any of its contents.
The distribution of this document in other jurisdictions may be restricted by law and any person into whose possession this document comes should inform themselves about, and observe, any such restrictions.
This document may include forward-looking statements. These forward-looking statements include matters that are not historical facts or statements regarding the Company’s intentions, beliefs or current expectations concerning, among other things, the Company’s results of operations, financial condition, liquidity, prospects, growth, strategies, and the industry in which the Company operates. By their nature, forwarding-looking statements involve risks and uncertainties because they relate to events and depend on circumstances that may or may not occur in the future. The Company cautions you that forward-looking statements are not guarantees of future performance and that the Company’s actual results of operations, financial condition and liquidity and the development of the industry in which the Company operates may differ materially from those made in or suggested by the forward-looking statements contained in this document. In addition, even if the Company’s results of operations, financial condition and liquidity and the development of the industry in which the Company operates are consistent with the forward-looking statements contained in this document, those results or developments may not be indicative of results or developments in future periods. The Company does not undertake any obligation to review or confirm analysts’ expectations or estimates or to update any forward-looking statements to reflect events that occur or circumstances that arise after the date of this presentation.
By attending/viewing/downloading this presentation you agree to be bound by the foregoing terms.
DISCLAIMER
2

200
300
400
500
600
700
800
900
Jan
-12
Feb
-12
Mar
-12
Ap
r-1
2M
ay-1
2Ju
n-1
2Ju
l-1
2A
ug-
12
Sep
-12
Oct
-12
No
v-1
2D
ec-1
2Ja
n-1
3Fe
b-1
3M
ar-1
3A
pr-
13
May
-13
Jun
-13
Jul-
13
Au
g-1
3Se
p-1
3O
ct-1
3N
ov-
13
Dec
-13
Jan
-14
Feb
-14
Mar
-14
Ap
r-1
4M
ay-1
4
HRC USA, EXW HRC Europe, EXW
HRC China, EXW HRC Russia, EXW
55%
65%
75%
85%
Jan
-12
Feb
-12
Mar
-12
Ap
r-1
2M
ay-1
2Ju
n-1
2Ju
l-1
2A
ug-
12
Sep
-12
Oct
-12
No
v-1
2D
ec-1
2Ja
n-1
3Fe
b-1
3M
ar-1
3A
pr-
13
May
-13
Jun
-13
Jul-
13
Au
g-1
3Se
p-1
3O
ct-1
3N
ov-
13
Dec
-13
Jan
-14
Feb
-14
Mar
-14
Global average China North America EU (27)
GLOBAL STEEL MARKETSUPPLY AND DEMAND IN Q1’14
• Global steel output grew by 2.5% yoy* to 406 m t
• Capacity utilization rate: 78%. Seasonally softer demand
• Increase in finished product inventories
o Finished product inventories in China grew by 26% qoq on average
o In the USA and Europe inventories grew but are still below the last 5 years average
PRICES IN Q1’14
• Average prices in China went down by 1-3% qoq. Key factors:decrease in raw material prices and increase in inventory levels on the back of seasonally weak demand for steel products
• In Europe and the USA average prices remained stable qoq
HRC PRICES
$/tQuarterly global price trend taking
into account the Company’s production and sales cycle
Source: Metal Bulletin
3
STEELMAKING CAPACITY UTILIZATION RATE
Source: World Steel Association
0,6
0,7
0,8
0,9
1
1,1
1,2
1,3
1,4
Jan
-12
Feb
-12
Mar
-12
Ap
r-1
2M
ay-1
2Ju
n-1
2Ju
l-1
2A
ug-
12
Sep
-12
Oct
-12
No
v-1
2D
ec-1
2Ja
n-1
3Fe
b-1
3M
ar-1
3A
pr-
13
May
-13
Jun
-13
Jul-
13
Au
g-1
3Se
p-1
3O
ct-1
3N
ov-
13
Dec
-13
Jan
-14
Feb
-14
Mar
-14
Ap
r-1
4
Germany China USA
Index, January2012=1
FINISHED PRODUCT INVENTORIES
Sources: CRU, Bloomberg (Steelhome, Metals Service Center Inst.)
Qoq change in inventories during the quarterChina: +26%, +42%
USA: +4%, -1%Germany: +7%, +8%
* Yoy change: change in results compared to the same period in 2013Qoq change: change in Q1 2014 results compared to Q4 2013

RUSSIAN STEEL MARKET
0%
5%
10%
15%
20%
25%
30%
2,0
2,5
3,0
3,5
4,0
Jan
-11
Mar
-11
May
-11
Jul-
11
Sep
-11
No
v-1
1
Jan
-12
Mar
-12
May
-12
Jul-
12
Sep
-12
No
v-1
2
Jan
-13
Mar
-13
May
-13
Jul-
13
Sep
-13
No
v-1
3
Jan
-14
Mar
-14
Apparent finished product consumption
Import share in Russia finished product consumption
FINISHED STEEL PRODUCTS CONSUMPTION TRENDS
m t
Source: Metal Expert
SUPPLY AND DEMAND
• Seasonal slowdown in demand
• Production remained stable (+0.4% yoy)
• Imports as a share in consumption down to 12% as RUB weakened
o Long product import dropped by 40% yoy to 450,000 t
PRICES
• Lower USD nominated prices due to the weaker RUB and seasonally low demand
• Gradual increase in prices throughout the quarter to the export parity level
Imports share in consumption– c.12%
4Source: Metal Expert* HVA: CRC, pre-painted steel, electrical steel Source: Metal Expert, NLMK estimates
NLMK SHARE IN RUSSIAN STEEL AND STEEL PRODUCT OUTPUT, Q1’14
18%
30%24%
34%
21% 22%
33%
HRC CRC Galvanized Pre-painted Rebar Steel HVA*
Q4’ 13
Q1’14
FINISHED PRODUCT DEMAND BREAKDOWN, Q1’14
6,10
0,96
0,79
1,28Construction and infrastructure
Machine buidling, includingautomotive
Steel constructions and shaping
Tube and pipe
9.1 m t
20% qoq import reduction

-3,7 -4,6 -5,8
9,9 9,6 9,4
0,6 0,60,5
-6
-3
0
3
6
9
12
Export Sales to domestic market Import
40
50
60
70
80
90
100
110
Jan
-11
Mar
-11
May
-11
Jul-
11
Sep
-11
No
v-1
1Ja
n-1
2M
ar-1
2M
ay-1
2Ju
l-1
2Se
p-1
2N
ov-
12
Jan
-13
Mar
-13
May
-13
Jul-
13
Sep
-13
No
v-1
3Ja
n-1
4M
ar-1
4
RAW MATERIALS MARKETPRICES AND DEMAND IN GLOBAL MARKETS IN Q1’14
• Iron ore prices in China down by 9% qoq on the back of higher imports of raw materials and lower buyer activity due to limited access to credit instruments
o Iron ore imports to China in Q1’14 increased by 19% yoy
• Coking coal prices in China down by 12% qoq on average due to increased supply and high levels at customers of inventories
• Scrap prices down by 3% qoq due to the seasonally weaker demand from consumers in Europe and Turkey
RUSSIAN COAL MARKET REMAINS IN SURPLUS
RAW MATERIAL GLOBAL PRICE INDEX
Source: Metal Bulletin
5
0,3
0,4
0,5
0,6
0,7
0,8
0,9
1,0
1,1
1,2
Jan
-12
Feb
-12
Mar
-12
Ap
r-1
2M
ay-1
2Ju
n-1
2Ju
l-1
2A
ug-
12
Sep
-12
Oct
-12
No
v-1
2D
ec-1
2Ja
n-1
3Fe
b-1
3M
ar-1
3A
pr-
13
May
-13
Jun
-13
Jul-
13
Au
g-1
3Se
p-1
3O
ct-1
3N
ov-
13
Dec
-13
Jan
-14
Feb
-14
Mar
-14
Ap
r-1
4M
ay-1
4
Iron ore concentrate (62%) import China, CFR
Coking coal export Australia, FOB
Scrap export Europe, FOB
HRC export China, FOB
CHINA: IMPORT AND IRON ORE INVENTORIES
m t
Source: Bloomberg
+28% in Q1
187
222
100
120
140
160
180
200
220
240
Импорт ЖРС
Q1'13 Q1'14
+19%
IRON ORE IMPORTIRON ORE INVENTORIES AT CHINESE PORTS
RUSSIAN COKING COAL MARKET BALANCE
Source: Metal Expert
m t
Q1’14
Q1’12 Q1’13 Q1’14

0%
20%
40%
60%
80%
100%
120%
Q1
'08
Q2
'08
Q3
'08
Q4
'08
Q1
'09
Q2
'09
Q3
'09
Q4
'09
Q1
'10
Q2
'10
Q3
'10
Q4
'10
Q1
'11
Q2
'11
Q3
'11
Q4
'11
Q1
'12
Q2
'12
Q3
'12
Q4
'12
Q1
'13
Q2
'13
Q3
'13
Q4
'13
Q1
'14
Novolipetsk
Global average
3,0 3,1 3,1 3,2 3,1
0,5 0,5 0,6 0,7 0,70,2 0,2 0,20,2 0,2
3,7 3,8 3,9 4,1 3,9
Q1'13 Q2'13 Q3'13 Q4'13 Q1'14
Steel segment Long products segment Foreign rolled products segment
PRODUCTION RESULTS
Q1’14 STEEL OUTPUT: 3.9 M T (-4% QOQ AND +6% YOY)
Q1’14 GROUP STEELMAKING CAPACITY RUN RATES: 92%
• Novolipetsk: 98%
• NLMK Long Products: 73% (due to mastering of sections at NLMK Kaluga)
• NLMK Indiana: 88%
6
NLMK: STEELMAKING CAPACITY UTILIZATION RATESTEELMAKING CAPACITY UTILIZATION RATE
Sources: global capacity utilization rate according to WSA
NLMK: CRUDE STEEL PRODUCTION*
m t
* excluding NLMK Verona output from Q4‘13
85%87%
100%97%
88%
73%
98%
92%
50%
60%
70%
80%
90%
100%
NLMK USA NLMK Longproducts
Lipetsk plant NLMK Group
Q4'13 Q1'14
1,32 1,46 1,55
0,65 0,66 0,740,36 0,25
0,240,48 0,67
0,750,52 0,25 0,070,43 0,28
0,52
0
1
2
3
Q1'13 Q4'13 Q1'14
Others S.E. Asia N. America M.East* EU Russia
73%
14%
13%
0%
20%
40%
60%
80%
100%
Sales by sectorQ1'14
Pipe and tube
Machine-building
Construction
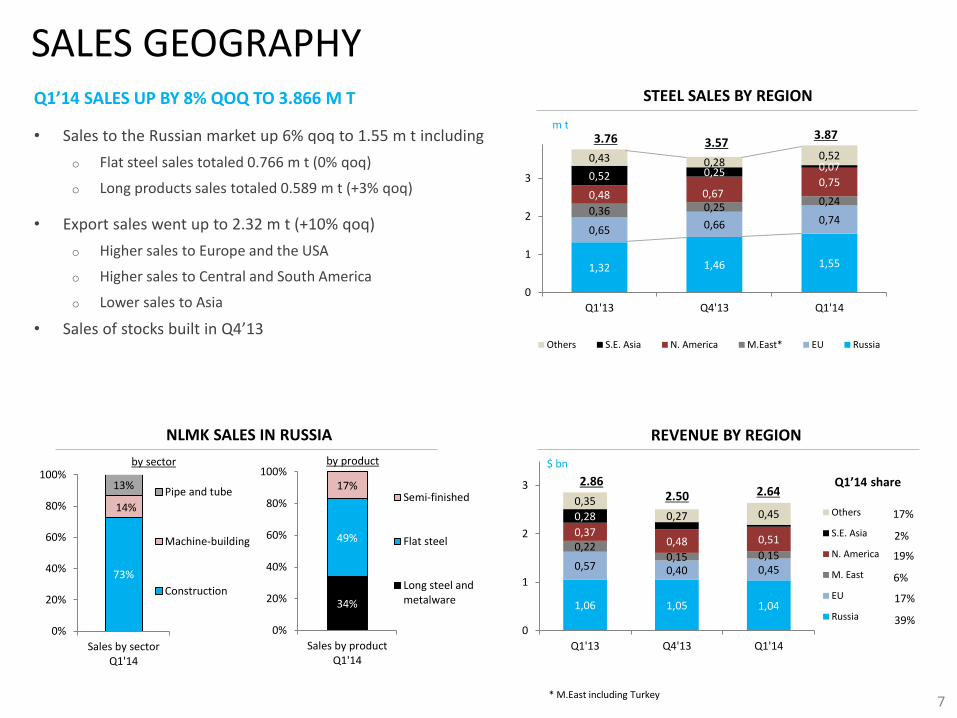
SALES GEOGRAPHYQ1’14 SALES UP BY 8% QOQ TO 3.866 M T
• Sales to the Russian market up 6% qoq to 1.55 m t including
o Flat steel sales totaled 0.766 m t (0% qoq)
o Long products sales totaled 0.589 m t (+3% qoq)
• Export sales went up to 2.32 m t (+10% qoq)
o Higher sales to Europe and the USA
o Higher sales to Central and South America
o Lower sales to Asia
• Sales of stocks built in Q4’13
7
NLMK SALES IN RUSSIA
34%
49%
17%
0%
20%
40%
60%
80%
100%
Sales by productQ1'14
Semi-finished
Flat steel
Long steel andmetalware
REVENUE BY REGION
1,06 1,05 1,04
0,57 0,40 0,45
0,220,15 0,15
0,370,48 0,51
0,28
0,35
0,27 0,45
0
1
2
3
Q1'13 Q4'13 Q1'14
Others
S.E. Asia
N. America
M. East
EU
Russia
2.86
$ bn
2.50 2.64
STEEL SALES BY REGION
m t3.76 3.57
Q1’14 share
by sector by product
17%
2%
19%
6%
17%
39%
* M.East including Turkey
3.87
0,3%
1%
1%
1%
2%
4%
6%
11%
27%
34%
0% 10% 20% 30% 40%
Galvanized
Electrical steel
Metalware
CRC
Billets
Long products
Slabs
Thick plates
HRC
Pre-painted
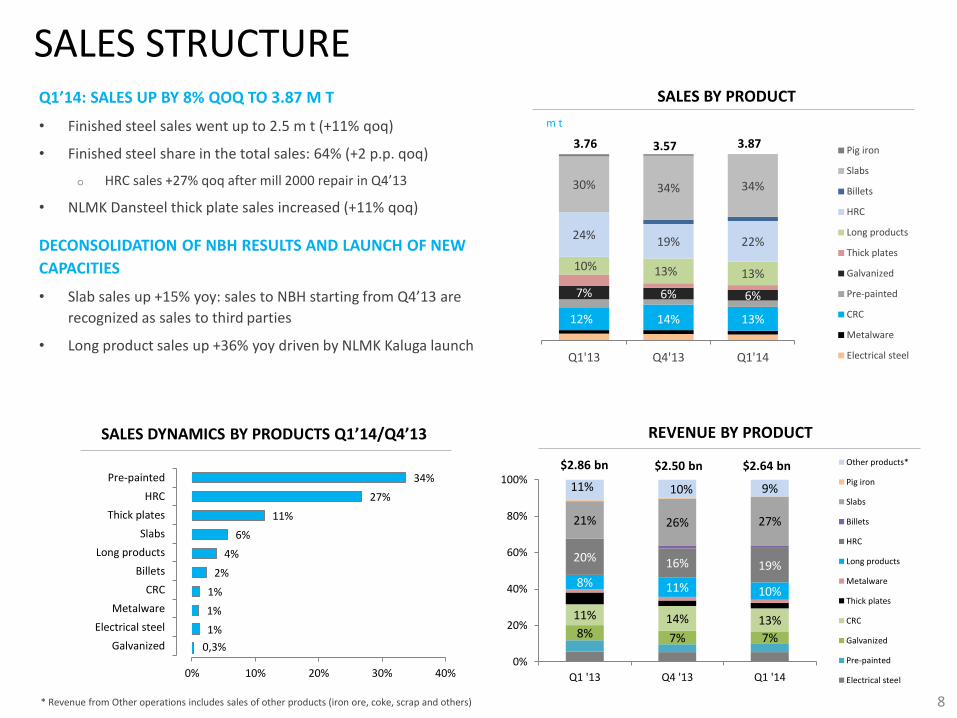
SALES STRUCTUREQ1’14: SALES UP BY 8% QOQ TO 3.87 M T
• Finished steel sales went up to 2.5 m t (+11% qoq)
• Finished steel share in the total sales: 64% (+2 p.p. qoq)
o HRC sales +27% qoq after mill 2000 repair in Q4’13
• NLMK Dansteel thick plate sales increased (+11% qoq)
DECONSOLIDATION OF NBH RESULTS AND LAUNCH OF NEW
CAPACITIES
• Slab sales up +15% yoy: sales to NBH starting from Q4’13 are
recognized as sales to third parties
• Long product sales up +36% yoy driven by NLMK Kaluga launch
8
SALES BY PRODUCT
* Revenue from Other operations includes sales of other products (iron ore, coke, scrap and others)
SALES DYNAMICS BY PRODUCTS Q1’14/Q4’13 REVENUE BY PRODUCT
8% 7% 7%
11% 14% 13%
8% 11% 10%
20% 16% 19%
21% 26% 27%
11% 10% 9%
Q1 '13 Q4 '13 Q1 '14
0%
20%
40%
60%
80%
100%
Other products*
Pig iron
Slabs
Billets
HRC
Long products
Metalware
Thick plates
CRC
Galvanized
Pre-painted
Electrical steel
$2.50 bn$2.86 bn
12% 14% 13%
7% 6% 6%
10% 13% 13%
24%19% 22%
30% 34% 34%
Q1'13 Q4'13 Q1'14
Pig iron
Slabs
Billets
HRC
Long products
Thick plates
Galvanized
Pre-painted
CRC
Metalware
Electrical steel
3.76 3.57
m t
3.87
$2.64 bn

STRATEGY FOR LEADERSHIP IN OPERATIONAL EFFICIENCY IS ON TRACK
9
NLMK CONTINUES TO IMPLEMENT OPERATIONAL EFFICIENCY PROGRAMS
Q1’14 NET GAINS WERE $70 M IN LINE WITH THE STRATEGY 2017 SCHEDULE
KEY DIMENSIONS OF OPTIMISATION PROGRAMS
• Technology:
o equipment productivity improvement
o lowering of production yields and raw materials structure optimization
o quality improvement
• Energy efficiency
• Procurement
• Labor productivity and headcount
OPERATIONAL EFFICIENCY PROGRAM EFFECT
70
244230
$0
$100
$200
$300
2013 Q1'14 Strategy 2017 target
$ m
76%
7%
14%3%
Process technology
Energy efficiency
Procurement
Labor productivity andheadcount
$ m
EFFICIENCY PROGRAMS GAIN IN Q1’14
$70 m
61%
4%
21%
13%Process technology
Energy efficiency
Procurement
Labor productivity andheadcount
$ m
TARGETED GAINS FROM OPERATIONAL EFFICIENCY PROGRAMS TILL 2018
$230 m
2,9 2,8 2,72,5
2,6
0,3 0,4 0,4 0,4 0,511%
14% 14%16%
18%
0%
5%
10%
15%
20%
25%
-
0,5
1,0
1,5
2,0
2,5
3,0
Q1'13 Q2'13 Q3'13 Q4'13 Q1'14
Revenue EBITDA EBITDA margin
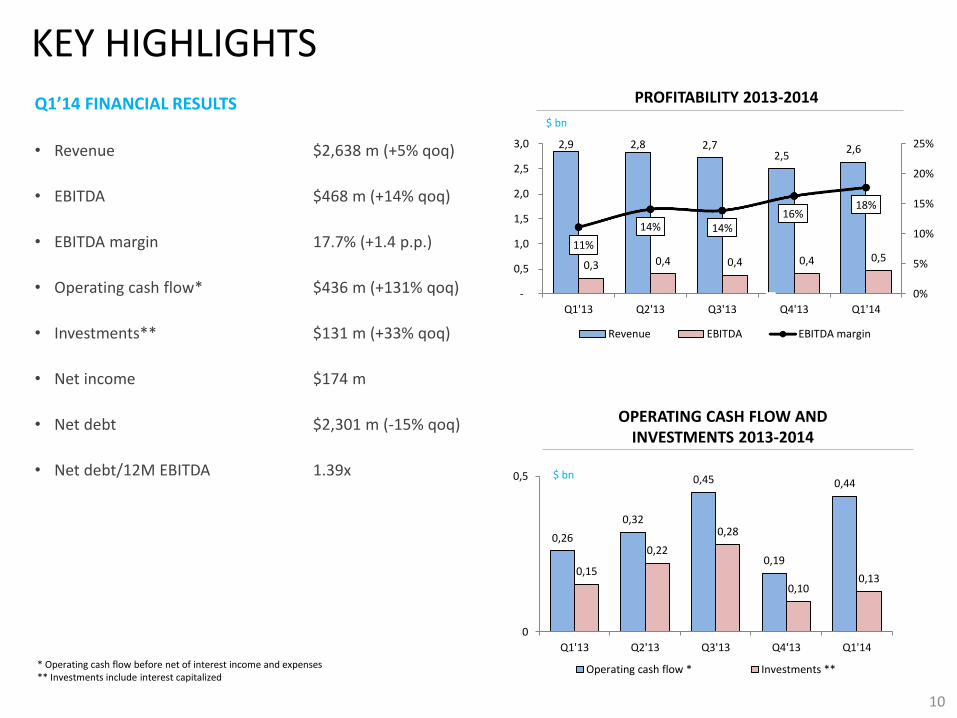
KEY HIGHLIGHTSQ1’14 FINANCIAL RESULTS
• Revenue $2,638 m (+5% qoq)
• EBITDA $468 m (+14% qoq)
• EBITDA margin 17.7% (+1.4 p.p.)
• Operating cash flow* $436 m (+131% qoq)
• Investments** $131 m (+33% qoq)
• Net income $174 m
• Net debt $2,301 m (-15% qoq)
• Net debt/12M EBITDA 1.39х
10
* Operating cash flow before net of interest income and expenses ** Investments include interest capitalized
$ bn
$ bn
PROFITABILITY 2013-2014
OPERATING CASH FLOW ANDINVESTMENTS 2013-2014
0,26
0,32
0,45
0,19
0,44
0,15
0,22
0,28
0,10 0,13
0
0,5
Q1'13 Q2'13 Q3'13 Q4'13 Q1'14
Operating cash flow * Investments **

PROFITABILITY
11
EBITDA Q1’14: $468 M (+14% QOQ)
• EBITDA margin was 17.7%
o (+) Higher sales volumes and optimized sales portfolio
o (-) Decline in prices on the domestic market
o (+) Strong pricing environment maintained on the export markets
o (+) Efficiency improvement program realization
o (+) Russian ruble depreciation against US$
EBITDA CHANGE BY SEGMENT
409
+110-7 -5
-20-19
468
200
300
400
500
600
Q4
'13
Stee
l seg
men
t
Fore
ign
ro
lled
pro
du
cts
segm
ent
Lon
g p
rod
uct
sse
gmen
t
Min
ing
segm
ent
Oth
er o
per
atio
ns
and
inte
rseg
men
tal
Q1
'14
$ m
11,1%
14,1% 13,9%
16,3%17,7%
0%
4%
8%
12%
16%
20%
Q1'13 Q2'13 Q3'13 Q4'13 Q1'14
EBITDA MARGIN
%
262
7
209
23
-33
468
$0
$100
$200
$300
$400
$500
$600
Stee
l seg
me
nt
Lon
g p
rod
uct
sse
gmen
t
Min
ing
segm
ent
Fore
ign
ro
lled
pro
du
cts
segm
ent
Oth
er
op
erat
ion
s an
din
ters
egm
enta
l
Q1
'14
SEGMENT CONTRIBUTION TO Q1’14 EBITDA
$ m
EBITDA
Working capital changes
Other non-cash operations
Income tax
Net interest *
NET OPERATING CASH FLOW
Capital expenditures **
FREE CASH FLOW TO THE FIRM
Net repayments of borrowings
FREE CASH FLOW TO EQUITY
Change in deposits
FX rate change
CHANGE IN CASH
CASH FLOW
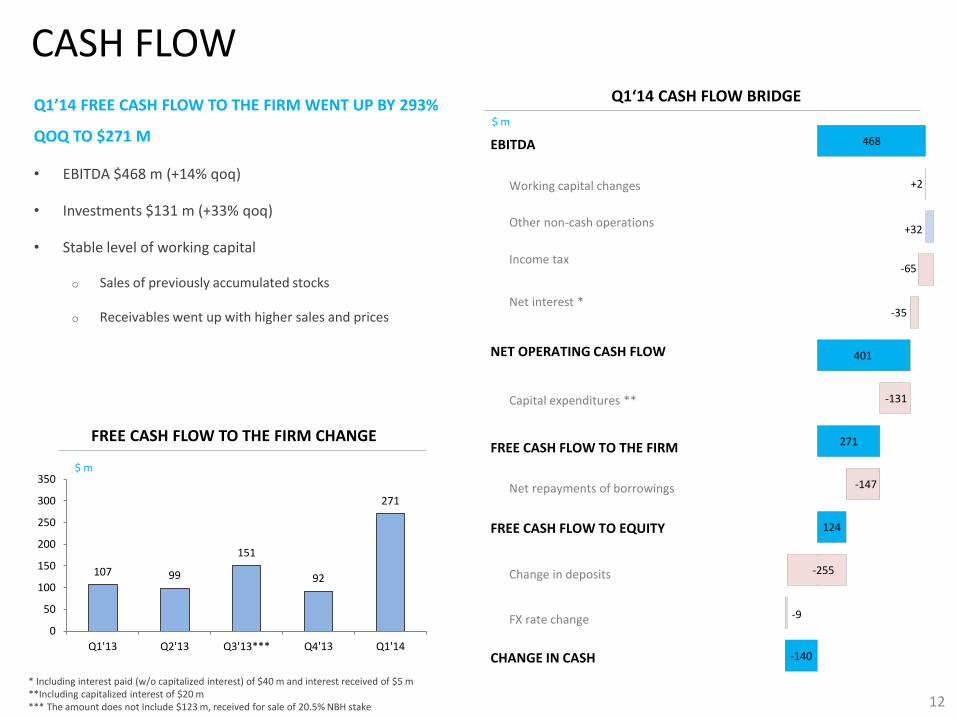
Q1’14 FREE CASH FLOW TO THE FIRM WENT UP BY 293%
QOQ TO $271 M
• EBITDA $468 m (+14% qoq)
• Investments $131 m (+33% qoq)
• Stable level of working capital
o Sales of previously accumulated stocks
o Receivables went up with higher sales and prices
* Including interest paid (w/o capitalized interest) of $40 m and interest received of $5 m**Including capitalized interest of $20 m*** The amount does not Include $123 m, received for sale of 20.5% NBH stake 12
Q1‘14 CASH FLOW BRIDGE
-140
-9
-255
124
-147
271
-131
401
-35
-65
+32
+2
468
$ m
107 99
151
92
271
0
50
100
150
200
250
300
350
Q1'13 Q2'13 Q3'13*** Q4'13 Q1'14
FREE CASH FLOW TO THE FIRM CHANGE
$ m

3,0
2,5
2,7
3,13,3
3,43,6
3,33,2
2,0
2,4
2,8
3,2
3,6
4,0
Q1'12
Q2'12
Q3'12
Q4'12
Q1'13
Q2'13
Q3'13
Q4'13
Q1'14
2,70
-0,40
+0,13 -0,13
2,30
1,5
1,7
1,9
2,1
2,3
2,5
2,7
2,9
31 Dec '13 Operating cashflow
Capex FX rate andother factors
31 Маr '14
DEBT POSITION
13
MATURITY AND NET DEBT/EBITDA
Weighted average maturity
Years to maturity
1,69
1,90
1,84
1,88
1,93
2,15
1,87
1,80
1,39
0,0
0,5
1,0
1,5
2,0
2,5
3,0
Q1'12
Q2'12
Q3'12
Q4'12
Q1'13
Q2'13
Q3'13
Q4'13
Q1'14
Net debt/EBITDA
CHANGE IN DEBT POSITION
NET DEBT CHANGE
$ bn
$ bn
CONSISTENT REDUCTION OF NET DEBT AND LIQUIDITY
GROWTH
• Net debt $2.30 bn (-15% qoq)
• Gross debt $3.89 bn (-7% qoq)
• Cash and equivalents * $1.58 bn (+9% qoq)
• Net debt / 12M EBITDA 1.39х
* Cash and equivalents and short term investments
3,04 2,74
1,12 -0,15 -0,131,14
0
1
2
3
4
5
31 Dec '13 Net settlements ofdebt
FX rate changeimpact
31 Mar '14
ST debt LT debt
1 583
1 105
2 795
424191 300 191
$0
$1 000
$2 000
$3 000
$4 000
$5 000
Liquid assets Q2'14 Q3 '14 Q4'14 Q1'15 12M
$0
$200
$400
$600
$800
$1 000
2014 2015 2016 2017 2018 2019 andonward
Other debt
Revolving credit lines for working capital financing
Eurobonds (USD)
ECA financing and investment credits
Ruble bonds
915
658
403352
917
591
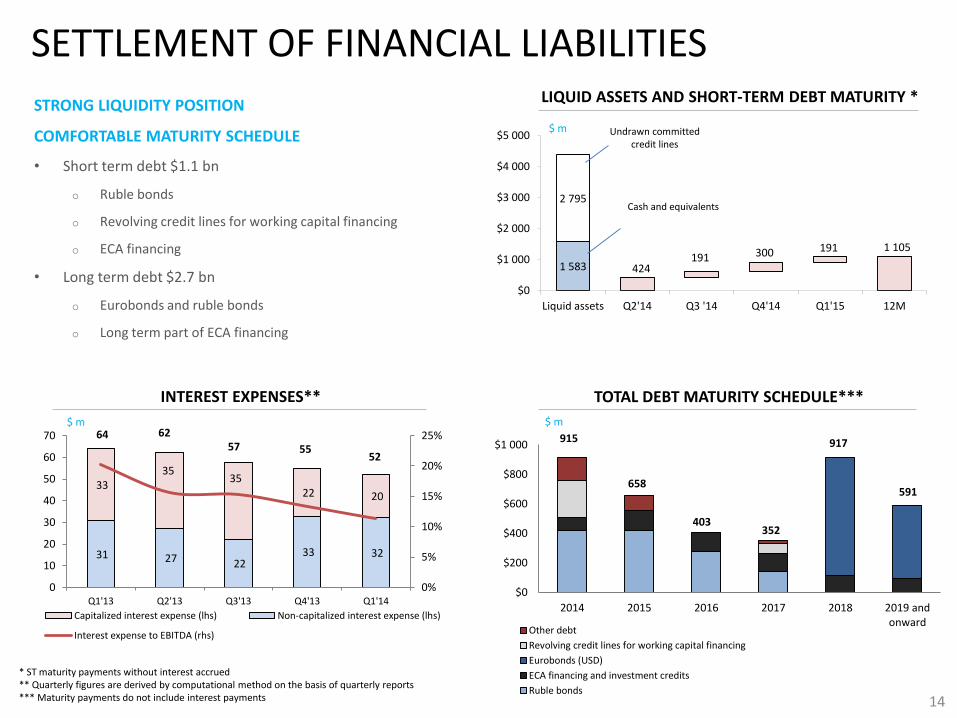
SETTLEMENT OF FINANCIAL LIABILITIES
14
LIQUID ASSETS AND SHORT-TERM DEBT MATURITY *
TOTAL DEBT MATURITY SCHEDULE***
$ m Undrawn committed credit lines
Cash and equivalents
INTEREST EXPENSES**
31 27 22 33 32
33 35
35 22 20
0%
5%
10%
15%
20%
25%
0
10
20
30
40
50
60
70
Q1'13 Q2'13 Q3'13 Q4'13 Q1'14
Capitalized interest expense (lhs) Non-capitalized interest expense (lhs)
Interest expense to EBITDA (rhs)
$ m
55576264
STRONG LIQUIDITY POSITION
COMFORTABLE MATURITY SCHEDULE
• Short term debt $1.1 bn
o Ruble bonds
o Revolving credit lines for working capital financing
o ECA financing
• Long term debt $2.7 bn
o Eurobonds and ruble bonds
o Long term part of ECA financing
$ m
* ST maturity payments without interest accrued** Quarterly figures are derived by computational method on the basis of quarterly reports*** Maturity payments do not include interest payments
52

Q2’14 OUTLOOK
15
MARKET
• Prices are expected to increase driven by seasonally improved demand from key consumers, incl. from the construction
sector
CRUDE STEEL PRODUCTION
• Group crude steel production will remain at the level of the previous quarter at ~ 3.9 m t
FINANCIAL INDICATORS
• Realization of cost optimization measures on the back of stronger demand on our key markets allows us to project
further improvement of the Group margins and profit

-17%
-10%
7%
6%
-15%
-17%
9%
13%
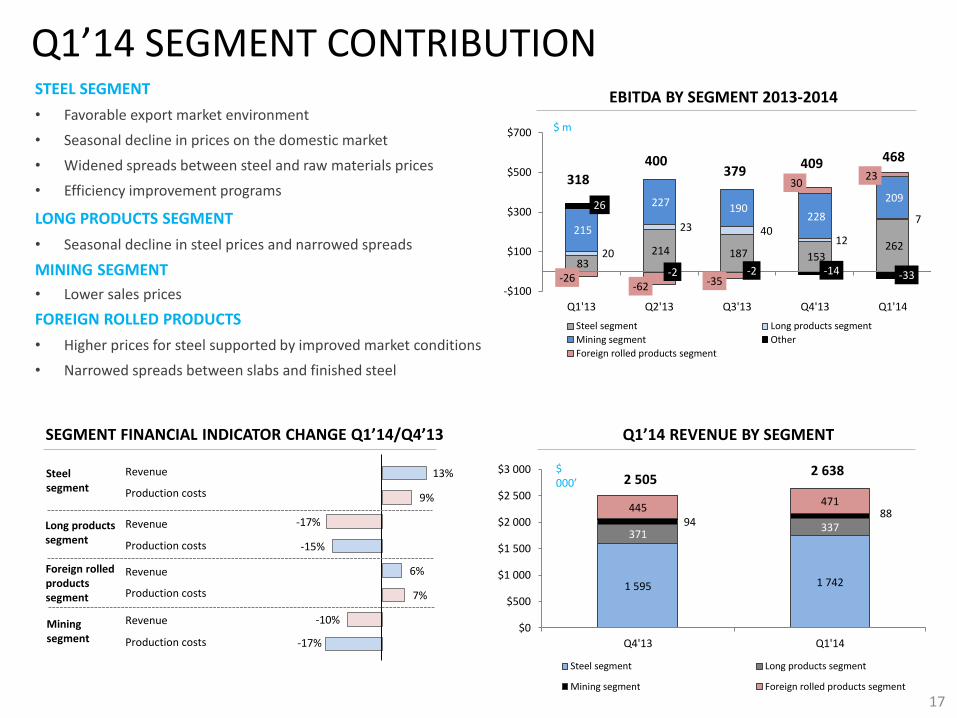
Q1’14 SEGMENT CONTRIBUTION
83 214 187 153
262 20
23 40 12
7 215
227 190 228
209 26
-2 -2 -14 -33-26 -62 -35
30 23
-$100
$100
$300
$500
$700
Q1'13 Q2'13 Q3'13 Q4'13 Q1'14
Steel segment Long products segment
Mining segment Other
Foreign rolled products segment
EBITDA BY SEGMENT 2013-2014
$ m
17
STEEL SEGMENT
• Favorable export market environment
• Seasonal decline in prices on the domestic market
• Widened spreads between steel and raw materials prices
• Efficiency improvement programs
LONG PRODUCTS SEGMENT
• Seasonal decline in steel prices and narrowed spreads
MINING SEGMENT
• Lower sales prices
FOREIGN ROLLED PRODUCTS
• Higher prices for steel supported by improved market conditions
• Narrowed spreads between slabs and finished steel
SEGMENT FINANCIAL INDICATOR CHANGE Q1’14/Q4’13
Steelsegment
Mining segment
Revenue
Production costs
Revenue
Revenue
Revenue
Production costs
Production costs
Production costs
409379
400
318
Long products segment
Foreign rolled products segment
468
1 595 1 742
37133794
88445471
$0
$500
$1 000
$1 500
$2 000
$2 500
$3 000
Q4'13 Q1'14
Steel segment Long products segment
Mining segment Foreign rolled products segment
Q1’14 REVENUE BY SEGMENT
$ 000’ 2 505
2 638
1,66 1,68
1,53 1,60 1,74
0,35 0,37 0,47 0,21
0,30
0,080,21 0,19 0,15
0,26
0,0
0,5
1,0
1,5
2,0
2,5
Q1'13 Q2'13 Q3'13 Q4'13 Q1'14
Revenue from intercompany salesRevenue from third partiesEBITDA
4,2%
10,4% 9,3%
8,5%
12,9%
EBITDA margin
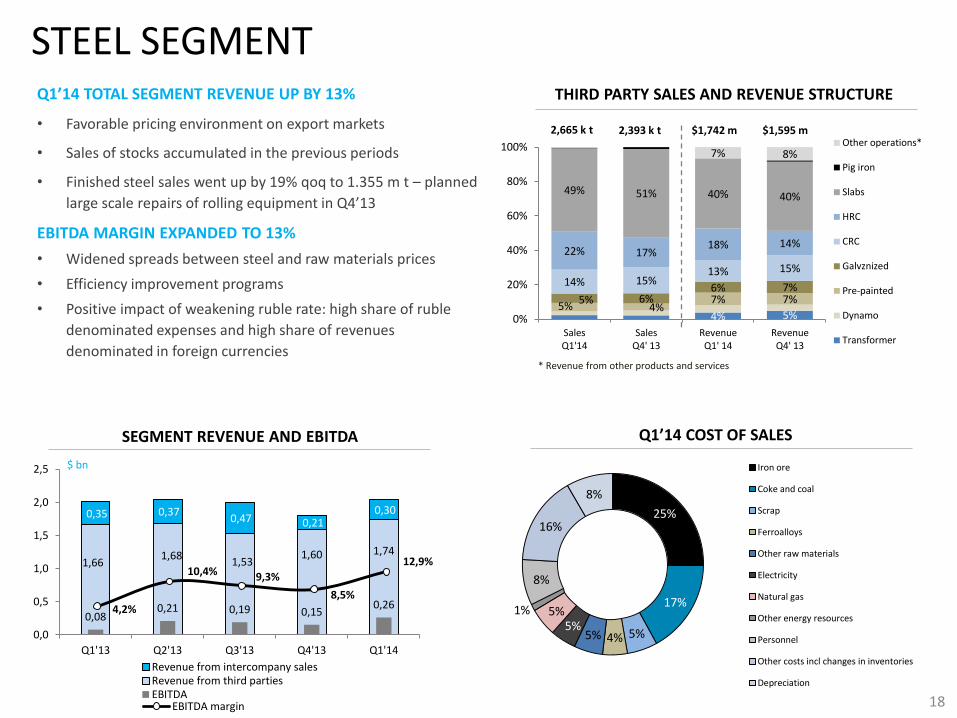
STEEL SEGMENT
4% 5%5% 4%
7% 7%5% 6%6% 7%14% 15%
13% 15%
22% 17%18% 14%
49% 51% 40% 40%
7% 8%
0%
20%
40%
60%
80%
100%
SalesQ1'14
SalesQ4' 13
RevenueQ1' 14
RevenueQ4' 13
Other operations*
Pig iron
Slabs
HRC
CRC
Galvznized
Pre-painted
Dynamo
Transformer
THIRD PARTY SALES AND REVENUE STRUCTURE
2,665 k t $1,742 m
* Revenue from other products and services
$ bn
SEGMENT REVENUE AND EBITDA Q1’14 COST OF SALES
18
2,393 k t $1,595 m
25%
17%
5%4%5%5%
5%1%
8%
16%
8%
Iron ore
Coke and coal
Scrap
Ferroalloys
Other raw materials
Electricity
Natural gas
Other energy resources
Personnel
Other costs incl changes in inventories
Depreciation
Q1’14 TOTAL SEGMENT REVENUE UP BY 13%
• Favorable pricing environment on export markets
• Sales of stocks accumulated in the previous periods
• Finished steel sales went up by 19% qoq to 1.355 m t – planned
large scale repairs of rolling equipment in Q4’13
EBITDA MARGIN EXPANDED TO 13%
• Widened spreads between steel and raw materials prices
• Efficiency improvement programs
• Positive impact of weakening ruble rate: high share of ruble
denominated expenses and high share of revenues
denominated in foreign currencies

288 314 355
371 337
59
113 114102
57
20 2340
12 7
0
70
140
210
280
350
420
490
560
Q1'13 Q2'13 Q3'13 Q4'13 Q1'14
Revenue from intersegmental sales* Revenue from third parties EBITDA
6%
5%
8%
3% 2%
EBITDA margin
12% 12% 14% 13%
12% 13% 10% 11%
76% 75% 75% 73%
0%
20%
40%
60%
80%
100%
SalesQ1'14
SalesQ4'13
RevenueQ1'14
RevenueQ4'13
Income fromoperations*
Long products
Billets
Metalware
LONG PRODUCTS SEGMENTQ1’14 SALES GROWTH BY 2%
• NSMMZ (the Urals based mill) sales growth
• Lower sales from NLMK Kaluga due to mastering of a new
product (sections) - preparation works ahead of seasonal
improvement in demand
DECLINE IN REVENUE FROM THIRD PARTIES
• Seasonal decline in prices for long products in Russia
DECLINE IN EBITDA MARGIN TO 2%
• Contracted spreads between prices for long products and
scrap
633 k t $371 m
$ m
THIRD PARTIES SALES AND REVENUE STRUCTURE
19
* Revenue from other products
SEGMENT REVENUE AND EBITDA Q1‘14 COST OF SALES
$337 m644 k t
* Revenue from intra-group sales in represented mostly by ferrous scrap deliveries to the Lipetsk site
58%
3%1%
7%
9%
15%
8%Scrap
Ferroalloys
Other raw materials
Electricity
Personnel
Other expenses
Depreciation
92 100 86 94 88
245 249 226
259 229
215 227190
228209
0
100
200
300
400
500
Q1'13 Q2'13 Q3'13 Q4'13 Q1'14Revenue from intersegmental sales
Revenue from third parties
EBITDA
64%
65%61%
65%
66%
EBITDA margin
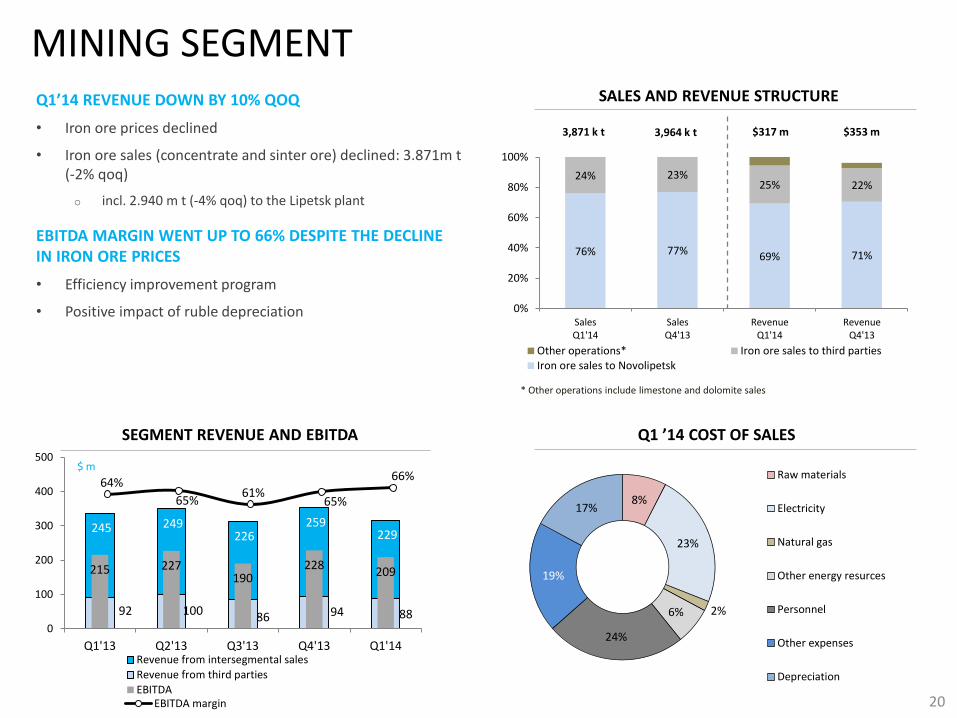
MINING SEGMENTQ1’14 REVENUE DOWN BY 10% QOQ
• Iron ore prices declined
• Iron ore sales (concentrate and sinter ore) declined: 3.871m t (-2% qoq)
o incl. 2.940 m t (-4% qoq) to the Lipetsk plant
EBITDA MARGIN WENT UP TO 66% DESPITE THE DECLINE IN IRON ORE PRICES
• Efficiency improvement program
• Positive impact of ruble depreciation
20
76% 77% 69% 71%
24% 23%25% 22%
0%
20%
40%
60%
80%
100%
SalesQ1'14
SalesQ4'13
RevenueQ1'14
RevenueQ4'13
Other operations* Iron ore sales to third partiesIron ore sales to Novolipetsk
SALES AND REVENUE STRUCTURE
$ m
SEGMENT REVENUE AND EBITDA Q1 ’14 COST OF SALES
3,964 k t $353 m$317 m3,871 k t
* Other operations include limestone and dolomite sales
8%
23%
2%6%
24%
19%
17%
Raw materials
Electricity
Natural gas
Other energy resurces
Personnel
Other expenses
Depreciation
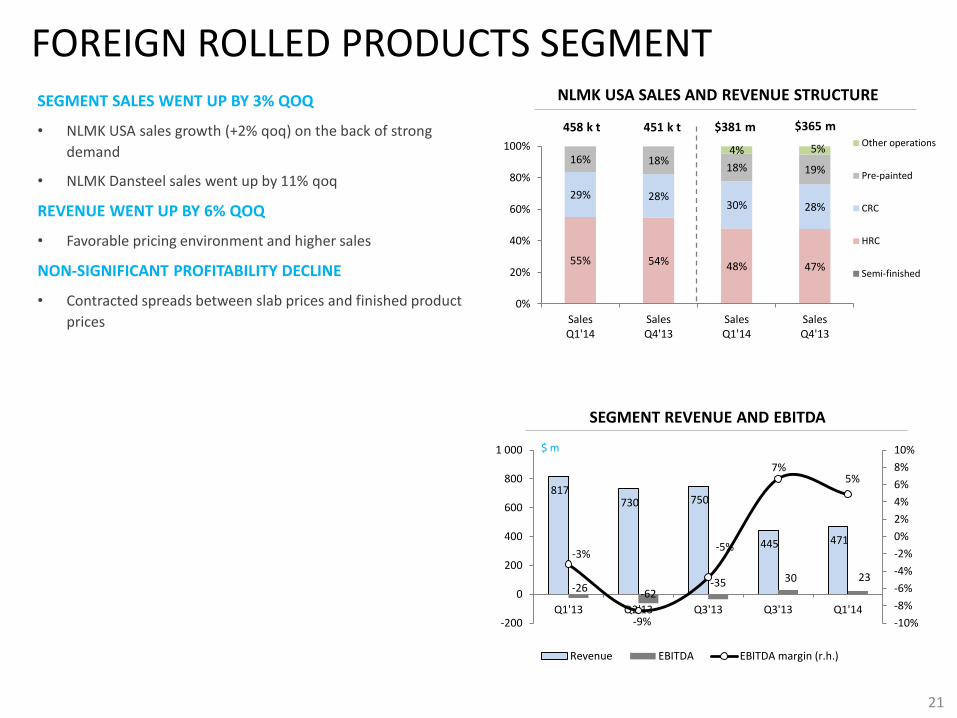
817 730 750
445 471
-26 -62 -35 30 23
-3%
-9%
-5%
7%5%
-10%
-8%
-6%
-4%
-2%
0%
2%
4%
6%
8%
10%
-200
0
200
400
600
800
1 000
Q1'13 Q2'13 Q3'13 Q3'13 Q1'14
Revenue EBITDA EBITDA margin (r.h.)
55% 54% 48% 47%
29% 28%30% 28%
16% 18%18% 19%
4% 5%
0%
20%
40%
60%
80%
100%
SalesQ1'14
SalesQ4'13
SalesQ1'14
SalesQ4'13
Other operations
Pre-painted
CRC
HRC
Semi-finished
FOREIGN ROLLED PRODUCTS SEGMENTSEGMENT SALES WENT UP BY 3% QOQ
• NLMK USA sales growth (+2% qoq) on the back of strong
demand
• NLMK Dansteel sales went up by 11% qoq
REVENUE WENT UP BY 6% QOQ
• Favorable pricing environment and higher sales
NON-SIGNIFICANT PROFITABILITY DECLINE
• Contracted spreads between slab prices and finished product
prices
$ m
NLMK USA SALES AND REVENUE STRUCTURE
21
SEGMENT REVENUE AND EBITDA
$381 m $365 m458 k t 451 k t

421
-8
-100
0
100
200
300
400
500
RevenueQ4'13
EBITDAQ4'13
INTERNATIONAL ASSETS PERFORMANCE
23
NBH FINANCIAL RESULTS
$ m
450
-26
-100
0
100
200
300
400
500
RevenueQ1'14
EBITDAQ1'14
$ m
NLMK USA AND NLMK DANSTEEL ROLLED PRODUCT SALES
275 245 251
117 124 131
83 80 74 73 90 100
0
50
100
150
200
250
300
Q1'13 Q4'13 Q1'14
HRC CRC Galvanised Thick plates (NLMK Dansteel)
000’t
NBH ROLLED PRODUCT SALES
133
204
168
16 17 18
92 86 90
151 152 177
0
50
100
150
200
250
Q1'13 Q4'13 Q1'14
HRC CRC Pre-painted Thick plates
392
000’ t
SLAB SALES FROM THE MAIN PRODUCTION SITE IN LIPETSK
1,11
0,78 0,81
0,35 0,45 0,48
0,11 0,13 0,11 0,05
0,21
0,37
-
0,2
0,4
0,6
0,8
1,0
1,2
Q1'13 Q4'13 Q1'14
To third parties NBH NLMK Dansteel NLMK USA
m t459 453
547539 556
24
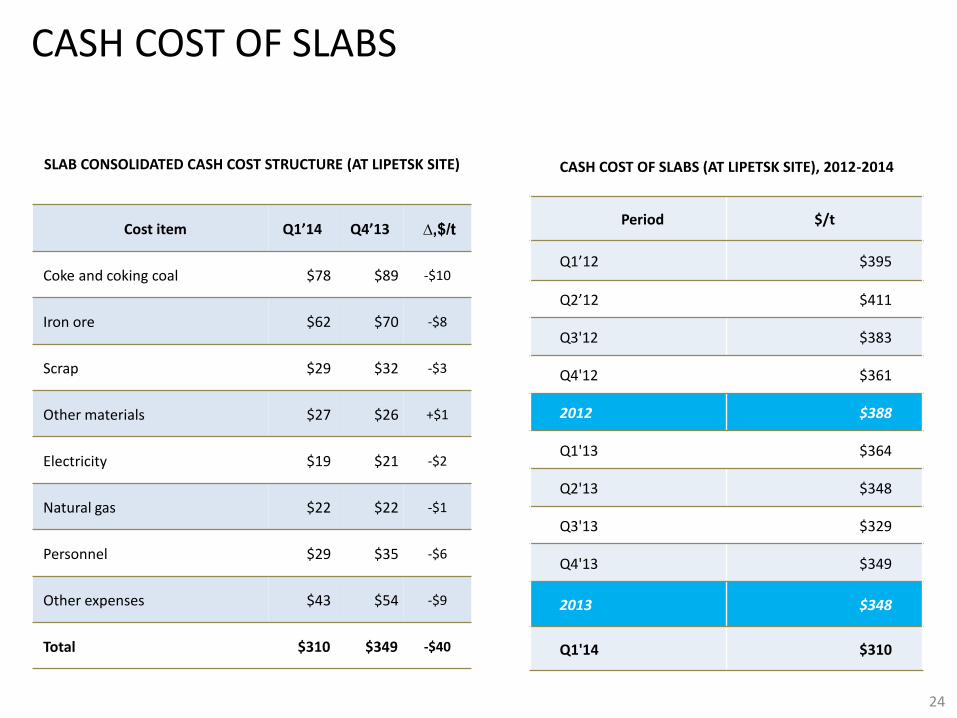
CASH COST OF SLABS
SLAB CONSOLIDATED CASH COST STRUCTURE (AT LIPETSK SITE)
Cost item Q1’14 Q4’13 ∆,$/t
Coke and coking coal $78 $89 -$10
Iron ore $62 $70 -$8
Scrap $29 $32 -$3
Other materials $27 $26 +$1
Electricity $19 $21 -$2
Natural gas $22 $22 -$1
Personnel $29 $35 -$6
Other expenses $43 $54 -$9
Total $310 $349 -$40
CASH COST OF SLABS (AT LIPETSK SITE), 2012-2014
Period $/t
Q1’12 $395
Q2’12 $411
Q3'12 $383
Q4'12 $361
2012 $388
Q1'13 $364
Q2'13 $348
Q3'13 $329
Q4'13 $349
2013 $348
Q1'14 $310
251 as of 31.03.2014
2 as of 31.12.2013
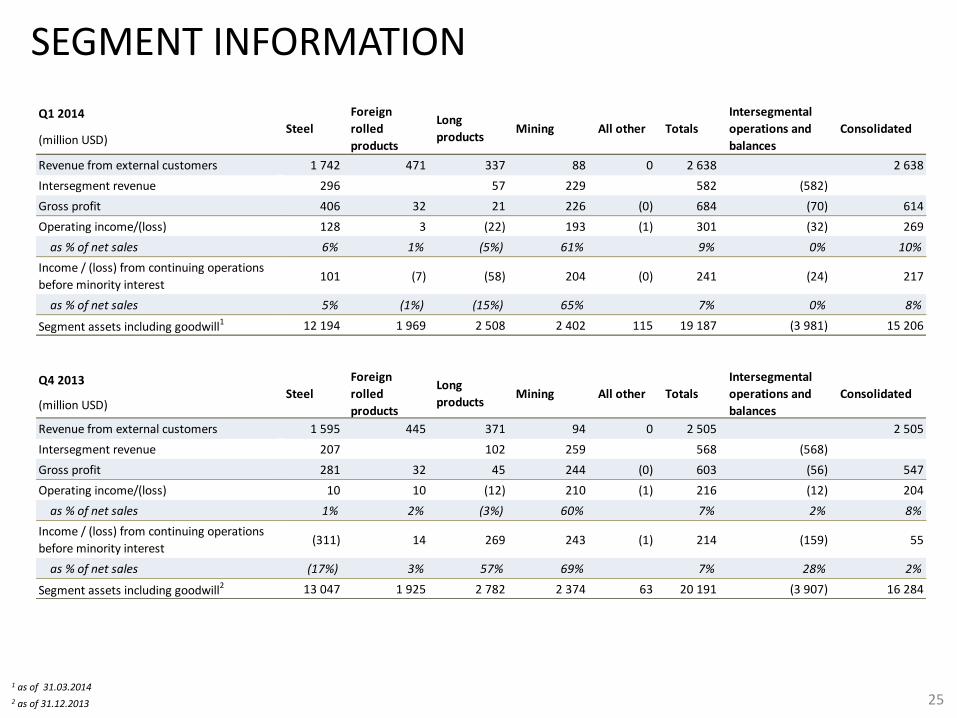
SEGMENT INFORMATION
Q1 2014
(million USD)
Revenue from external customers 1 742 471 337 88 0 2 638 2 638
Intersegment revenue 296 57 229 582 (582)
Gross profit 406 32 21 226 (0) 684 (70) 614
Operating income/(loss) 128 3 (22) 193 (1) 301 (32) 269
as % of net sales 6% 1% (5%) 61% 9% 0% 10%
Income / (loss) from continuing operations
before minority interest101 (7) (58) 204 (0) 241 (24) 217
as % of net sales 5% (1%) (15%) 65% 7% 0% 8%
Segment assets including goodwill1 12 194 1 969 2 508 2 402 115 19 187 (3 981) 15 206
Q4 2013
(million USD)
Revenue from external customers 1 595 445 371 94 0 2 505 2 505
Intersegment revenue 207 102 259 568 (568)
Gross profit 281 32 45 244 (0) 603 (56) 547
Operating income/(loss) 10 10 (12) 210 (1) 216 (12) 204
as % of net sales 1% 2% (3%) 60% 7% 2% 8%
Income / (loss) from continuing operations
before minority interest(311) 14 269 243 (1) 214 (159) 55
as % of net sales (17%) 3% 57% 69% 7% 28% 2%
Segment assets including goodwill2 13 047 1 925 2 782 2 374 63 20 191 (3 907) 16 284
Totals
Intersegmental
operations and
balances
Consolidated
Steel
Foreign
rolled
products
Long
productsMining All other Totals
Intersegmental
operations and
balances
Consolidated
Steel
Foreign
rolled
products
Long
productsMining All other

QUARTERLY DATA: CONSOLIDATED STATEMENT OF INCOME
26Consolidated financial results are prepared based on US GAAP. Reporting periods of the Company are 3M, 6M, 9M and 12M 2013. Quarterly figures (with the exception of Q1) are derived by computational method. The same assumption applies to the calculation of segmental financial results.
Q1 2014 Q4 2013 Q1 2013
(mln USD) + / - % + / - %
Sales revenue 2 638 2 505 133 5% 2 856 (218) (8%)
Production cost (1 825) (1 753) (72) 4% (2 125) 300 (14%)
Depreciation and amortization (199) (205) 6 (3%) (207) 8 (4%)
Gross profit 614 547 67 12% 524 90 17%
General and administrative expenses (92) (85) (8) 9% (120) 27 (23%)
Selling expenses (212) (221) 9 (4%) (257) 45 (18%)
Taxes other than income tax (40) (37) (3) 9% (36) (4) 11%
Operating income 269 204 65 32% 111 158 143%
Gain / (loss) on disposals of property, plant and equipment (0) (6) 5 (91%) (2) 1 (69%)
Gains / (losses) on investments (0) (2) 2 (1) 0 0%
Interest income 7 8 (1) (15%) 10 (3) (31%)
Interest expense (32) (33) 1 (4%) (31) (1) 4%
Foreign currency exchange loss, net 46 17 29 169% (27) 73 0%
Other expense, net (7) (98) 91 (93%) (8) 2 (19%)
Income from continuing operations before income tax 283 91 192 211% 53 230 434%
Income tax (65) (36) (29) 81% (18) (48) 271%
Equity in net earnings/(losses) of associate (44) (54) 10 0 (45) 0%
Net income 173 1 172 22498% 35 137 388%
Less: Net loss / (income) attributable to the non-controlling interest 1 (21) 22 2 (1) 0%0%
Net (loss) / income attributable to OJSC Novolipetsk Steel stockholders 174 (21) 194 (947%) 38 136 359%
EBITDA 468 409 59 14% 318 150 47%
Q1 2014/Q4 2013 Q1 2014/Q1 2013

CONSOLIDATED CASH FLOW STATEMENT
Consolidated financial results are prepared based on US GAAP. Reporting periods of the Company are 3M, 6M, 9M and 12M 2013. Quarterly figures (with the exception of Q1) are derived by computational method. The same assumption applies to the calculation of segmental financial results.
28
Q1 2014 Q4 2013 Q1 2013
(mln. USD) + / - % + / - %
Cash flow from operating activities
Net income 173 1 172 35 137 388%
Adjustments to reconcile net income to net cash provided by operating Depreciation and amortization 199 205 (6) (3%) 207 (8) (4%)Loss on disposals of property, plant and equipment 0 6 (5) (91%) 2 (1) (69%)(Gain)/loss on investments 0 2 (2) 1 (0) (66%)Interest income (7) (8) 1 (15%) (7)Interest expense 32 33 (1) (4%) 31 1 4%Equity in net ernings of associate 44 54 (10) (0) 45Defferd income tax (benefit)/expense (8) 61 (69) (113%) (40) 32 (80%)Loss / (income) on forward contracts 6 7 (1) (6) 13 (193%)Other movements (6) (65) 59 (91%) 49 (55) (112%)
Changes in operating assets and liabilitiesIncrease in accounts receivables (228) 80 (308) (385%) (102) (126) 123%Increase in inventories 230 (248) 478 (193%) 75 155 208%Decrease/(increase) in other current assets (11) 2 (12) (748%) 5 (15) (322%)Increase in accounts payable and oher l iabilities (3) 79 (82) (104%) (17) 14 (82%)Increase/(decrease) in current income tax payable 13 (19) 32 (171%) 22 (9) (39%)
Cash provided from operating activities 436 261 176 67%Interest received 5 12 5Interest paid (40) (10) (40)
Net cash provided from operating activities* 401 190 211 111% 261 140 54%
Cash flow from investing activities Proceeds from sale of property, plant and equipment 4 3 0 1 2 150%Purchases and construction of property, plant and equipment (131) (98) (32) 33% (154) 23 (15%)
Proceeds from sale / (purchases) of investments, net (69) (107) 37 9 (78) (910%)(Placement) / withdrawal of bank deposits, net (183) 139 (322) (170) (13) 8%Acquisition of additional stake in existing subsidiary (10) 10 (100%)
Net cash used in investing activities (380) (63) (317) 502% (323) (56) 17%0
Cash flow from financing activities
Proceeds from borrowings and notes payable 2 341 (340) (99%) 852 (850) (100%)
Repayments of borrowings and notes payable (149) (330) 181 (55%) (553) 404 (73%)
Capital lease payments (6) (5) (1) 17% (7) 1 (18%)Dividends to shareholders (0) (0) 0 (0) 0 (81%)
Net cash used in financing activities (152) 7 (159) (2432%) 292 (445) (152%)
Net increase / (decrease) in cash and cash equivalents (131) 134 (265) (198%) 230 (361) (157%)
Effect of exchange rate changes on cash and cash equivalents (9) 1 (10) (1393%) 39 (48) (123%)
Cash and cash equivalents at the beginning of the period 970 835 135 16% 951 19 2%
Cash and cash equivalents at the end of the period 830 970 (140) (14%) 1 220 (390) (32%)
Q1 2014/Q4 2013 Q1 2014/Q1 2013

28
CONSOLIDATED BALANCE SHEETas at
31.03.2014
as at
31.12.2013
as at
30.09.2013
as at
30.06.2013
as at
31.03.2013
as at
31.12.2012
(mln. USD)
ASSETS
Current assets 4 966 5 102 4 918 5 537 5 834 5 469Cash and cash equivalents 830 970 835 1 241 1 220 951Short-term investments 753 485 516 121 271 107Accounts receivable, net 1 544 1 438 1 540 1 497 1 557 1 491Inventories, net 1 731 2 124 1 897 2 530 2 689 2 827Deferred income tax assets 90 78 120 121 71 63Other current assets, net 17 8 9 27 25 30
Non-current assets 10 241 11 182 11 388 12 101 12 677 12 988Long-term investments, net 443 501 552 17 20 19Property, plant and equipment, net 9 162 10 003 10 163 10 981 11 442 11 753Intangible assets 110 116 121 129 136 142Goodwill 428 463 468 753 776 786Other non-current assets, net 39 40 32 31 36 38Deferred income tax assets 58 59 50 189 266 250
Total assets 15 206 16 284 16 305 17 638 18 510 18 458
LIABILITIES AND STOCKHOLDERS’ EQUITY
Current liabilities 2 242 2 317 1 760 2 647 2 940 3 302Accounts payable and other l iabilities 1 068 1 176 1 104 1 609 1 412 1 462Short-term borrowings 1 141 1 119 616 994 1 484 1 816Current income tax liability 33 22 40 44 45 24
Non-current liabilities 3 361 3 693 4 147 4 695 4 678 4 065Long-term borrowings 2 743 3 038 3 508 3 792 3 459 2 816Deferred income tax liability 566 599 578 746 765 792Other long-term liabilities 52 55 61 157 454 457
Total liabilities 5 603 6 009 5 906 7 342 7 619 7 367
Stockholders’ equityCommon stock 221 221 221 221 221 221Statutory reserve 10 10 10 10 10 10Additional paid-in capital 257 257 257 257 257 306Other comprehensive income (2 739) (1 897) (1 772) (1 736) (1 224) (997)Retained earnings 11 829 11 655 11 676 11 538 11 620 11 582
NLMK stockholders’ equity 9 579 10 247 10 392 10 290 10 885 11 123Non-controlling interest 25 28 7 6 7 (33)Total stockholders’ equity 9 603 10 275 10 399 10 296 10 892 11 090
Total liabilities and stockholders’ equity 15 206 16 284 16 305 17 638 18 510 18 458
www.nlmk.com
NLMK
Investor Relations
Russia, 115054, Moscow
18, Bakhrushina str, bldg 1
t. +7 495 915 15 75
f. +7 495 915 79 04
Related Documents