Welcome message from author
This document is posted to help you gain knowledge. Please leave a comment to let me know what you think about it! Share it to your friends and learn new things together.
Transcript

Income Smoothing in
Shariah Compliant
Companies
An empirical
Study

Research ?
Are Managers involved in Earnings
Management practice??

Introduction•Opportunity of earnings
management is provided
to the firms by GAAP
allowing them the use
of accrual accounting.

• Theoretically present value offuture cash flows is consideredas value of the company. Thusany increase in earnings depictsthe increase in overall value ofcompany and vice versa (Lev,1989).
Review of Literature
Review of Literature• According to an estimate 8-12 percent
firms with small pre-managed earning
decreases manipulate their earnings to
give impression of earning increases.
• 30-44 percent firms with small pre-
managed losses manipulate earnings to
show positive earnings (Burgstahler,
1997).

Review of Literature
(A study of Albanian private sector firms 2013) Reported that 36 out of 75 firms managed earnings downward, which means that 52 % firms tend to enhance their profits to
avoid small losses.
O b j e c t i v e s
To find quality of earnings in Shariah Compliant
companies of Pakistan.
To compare High cap with low cap companies.
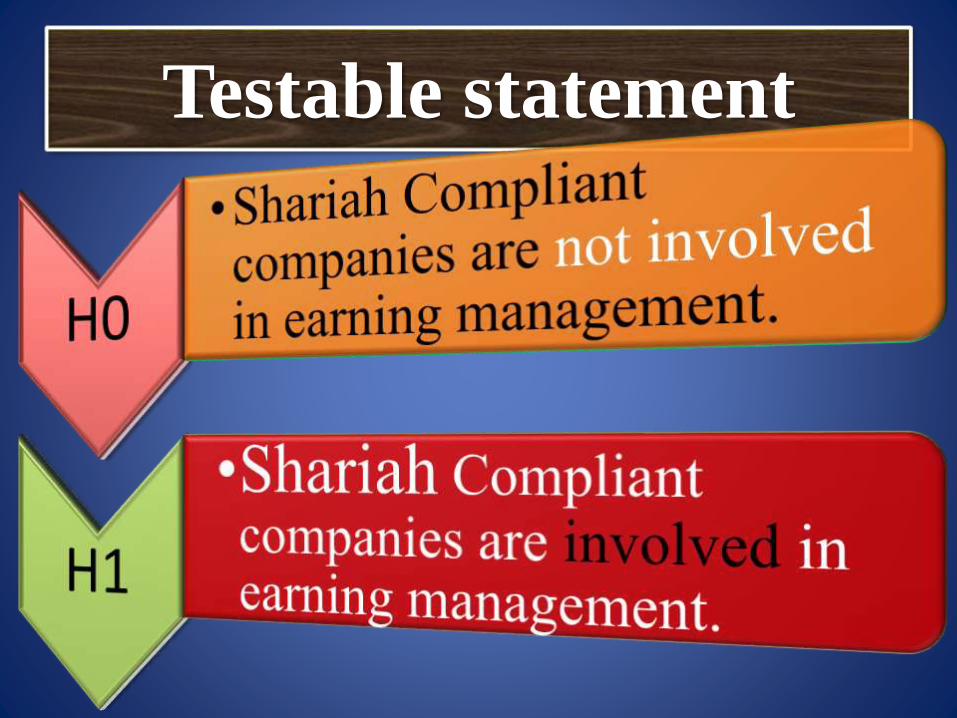
Testable statement

2009 2010 2011 2012
Automobile 8 8 9 8Textile 4 6 6 5Energy(Pet, Gas, Batt) 13 15 15 14(Che, Fert, Pha) 11 12 12 12FMCG & Sugar Mills 4 5 5 5Cement & Ceramics 13 13 13 13Other(Tele, Engg, Logistics) 12 12 12 12Total 65 71 72 69
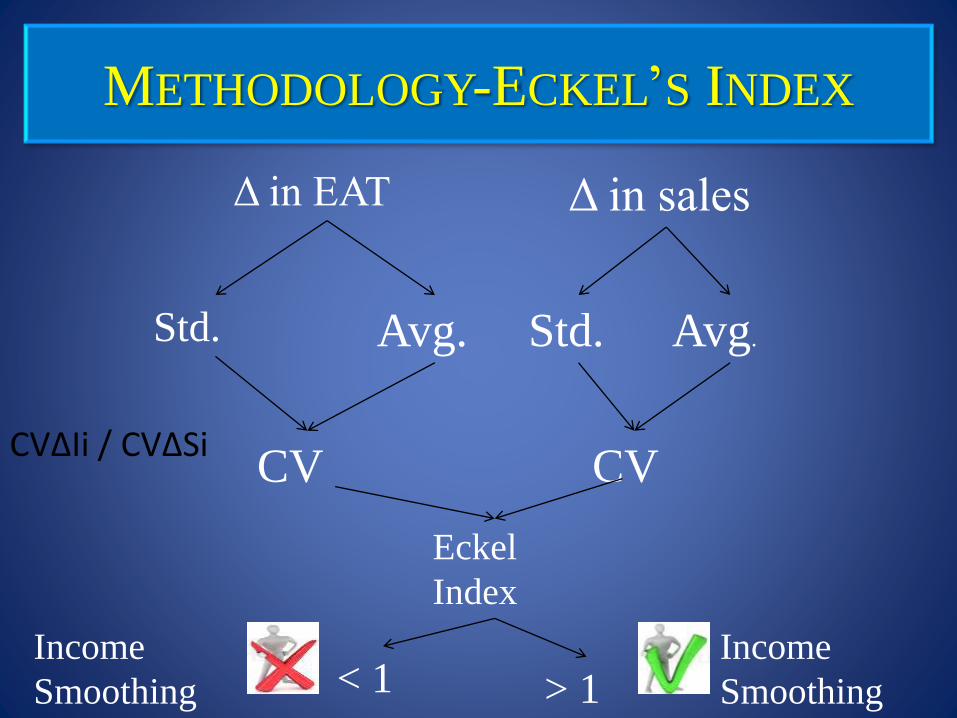
CVΔIi / CVΔSi
Δ in salesΔ in EAT
Avg.Std. Std. Avg.
CV CV
Eckel
Index
< 1 > 1Income
Smoothing
Income
Smoothing
METHODOLOGY-ECKEL’S INDEX
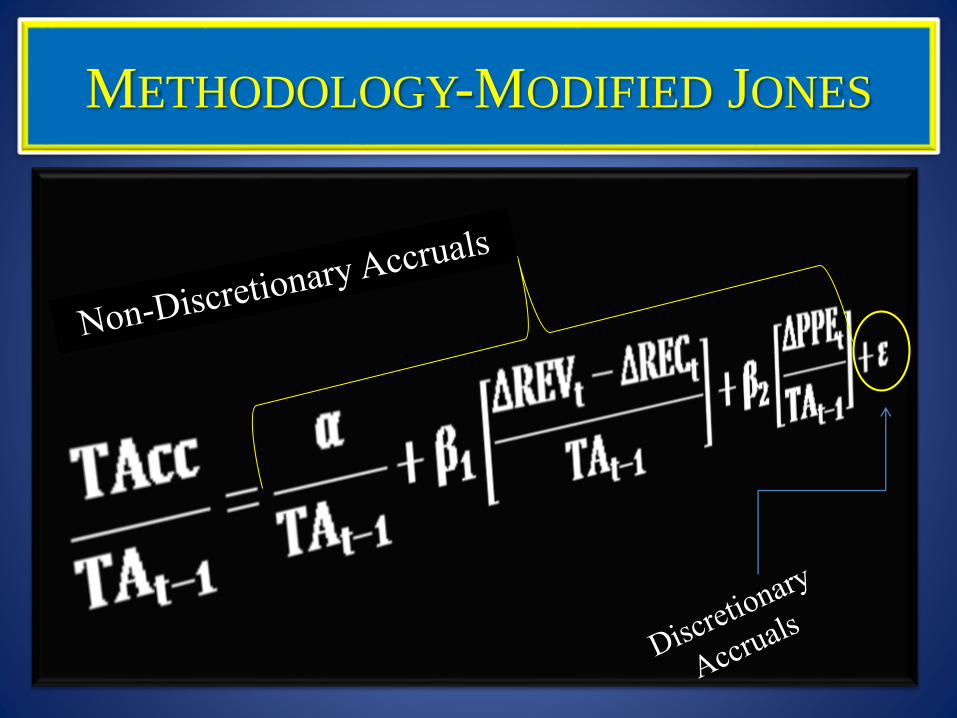
METHODOLOGY-MODIFIED JONES
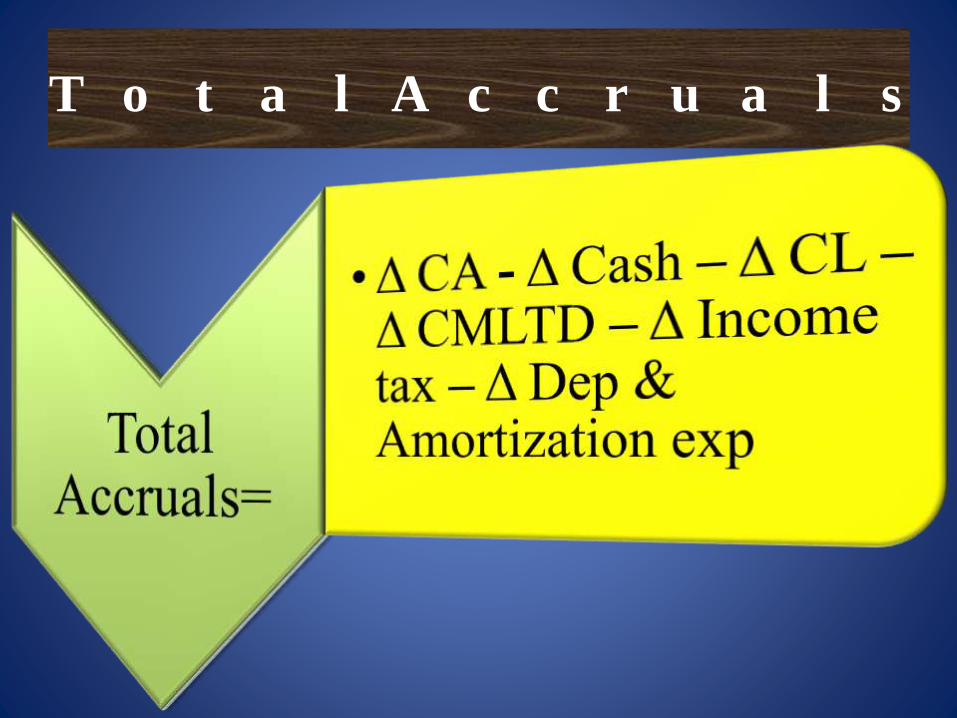
T o t a l A c c r u a l s
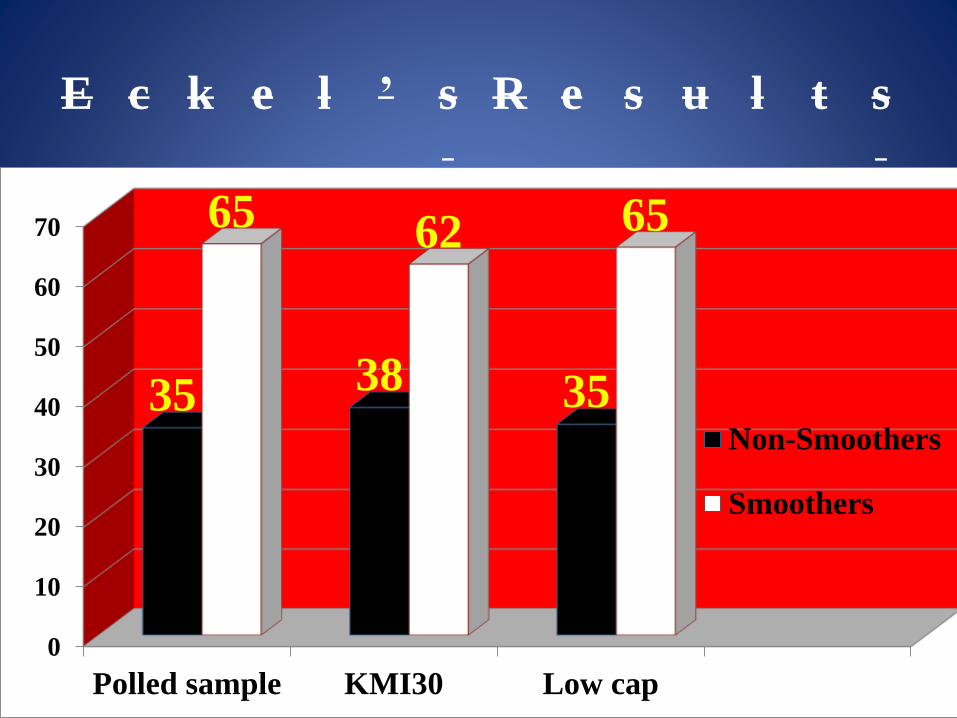
E c k e l ’ s R e s u l t s
0
10
20
30
40
50
60
70
Polled sample KMI30 Low cap
35 38 35
65 62 65
Non-Smoothers
Smoothers
0
10
20
30
40
50
60
70
80
90
100
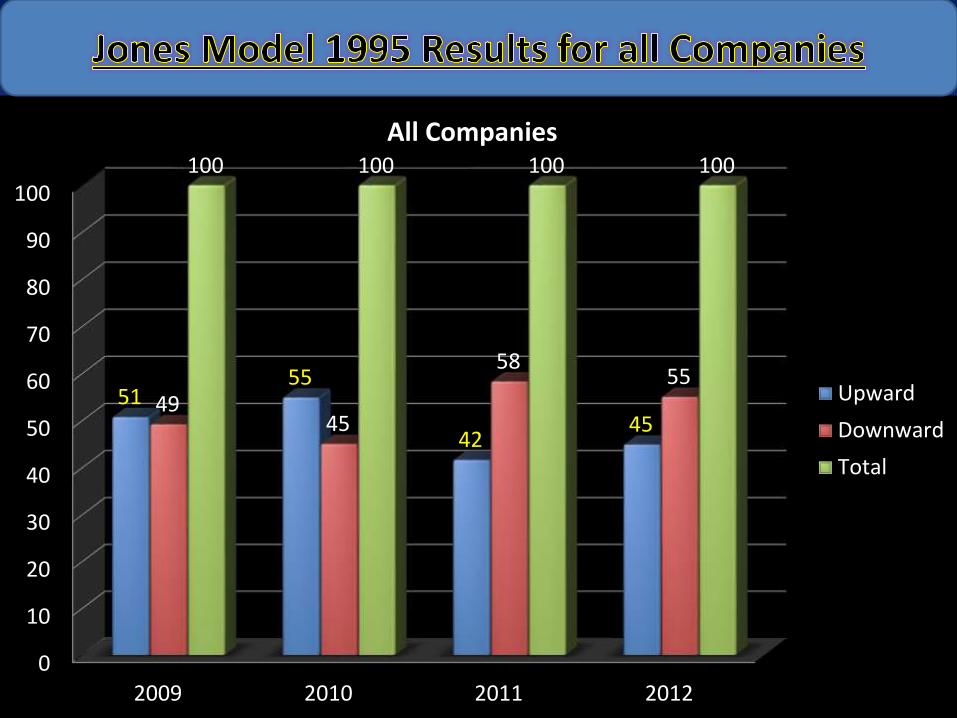
2009 2010 2011 2012
5155
4245
4945
5855
100 100 100 100
All Companies
Upward
Downward
Total
0
10
20
30
40
50
60
70
80
90
100
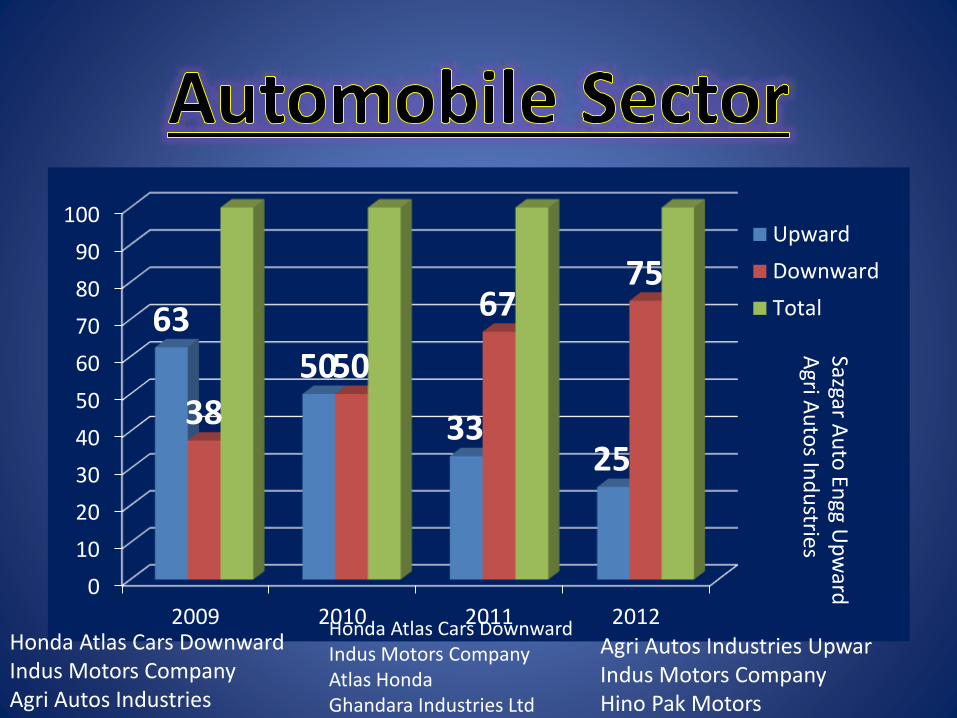
2009 2010 2011 2012
6350
3325
38
50
6775
Upward
Downward
Total
Honda Atlas Cars DownwardIndus Motors Company Agri Autos Industries
Honda Atlas Cars DownwardIndus Motors Company Atlas HondaGhandara Industries Ltd
Agri Autos Industries UpwarIndus Motors CompanyHino Pak Motors
SazgarA
uto
Engg
Up
ward
AgriA
uto
s Ind
ustries
0
10
20
30
40
50
60
70
80
90
100
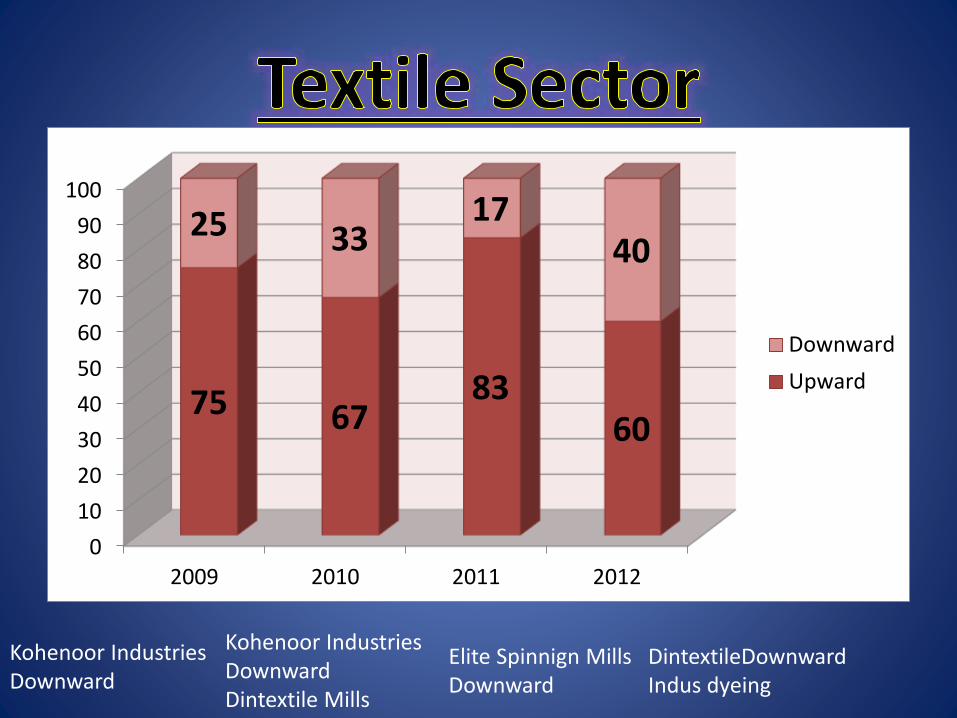
2009 2010 2011 2012
75 6783
60
25 3317
40
Downward
Upward
Kohenoor IndustriesDownward
Kohenoor Industries DownwardDintextile Mills
Elite Spinnign Mills Downward
DintextileDownwardIndus dyeing
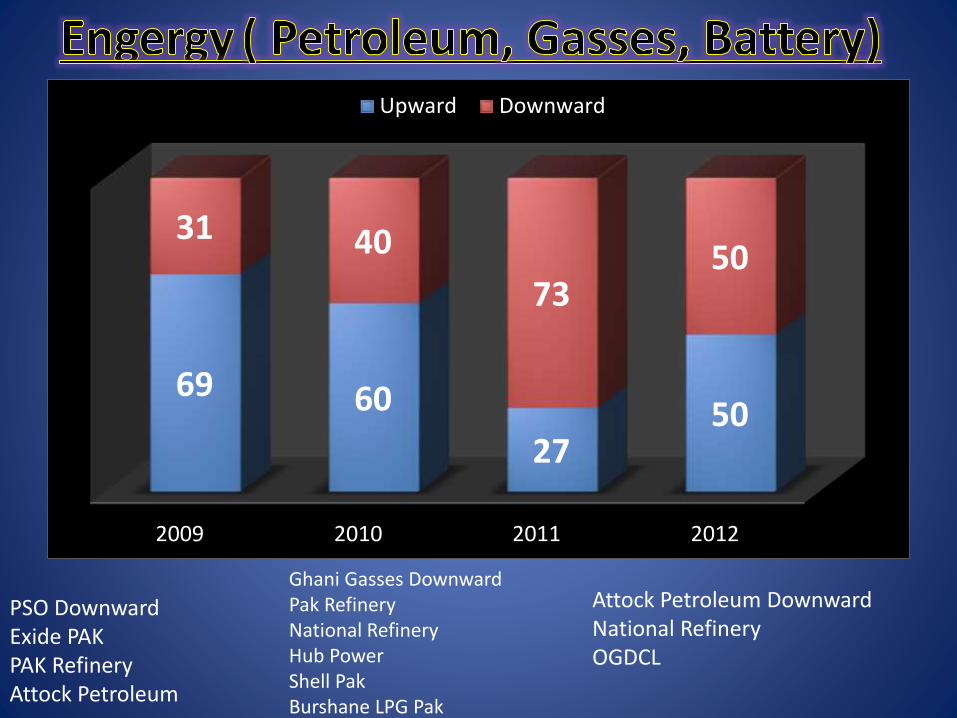
2009 2010 2011 2012
69 60
2750
31 40
7350
Upward Downward
PSO DownwardExide PAKPAK RefineryAttock Petroleum
Ghani Gasses DownwardPak RefineryNational RefineryHub PowerShell PakBurshane LPG Pak
Attock Petroleum DownwardNational RefineryOGDCL
0
10
20
30
40
50
60
70
80
90
100
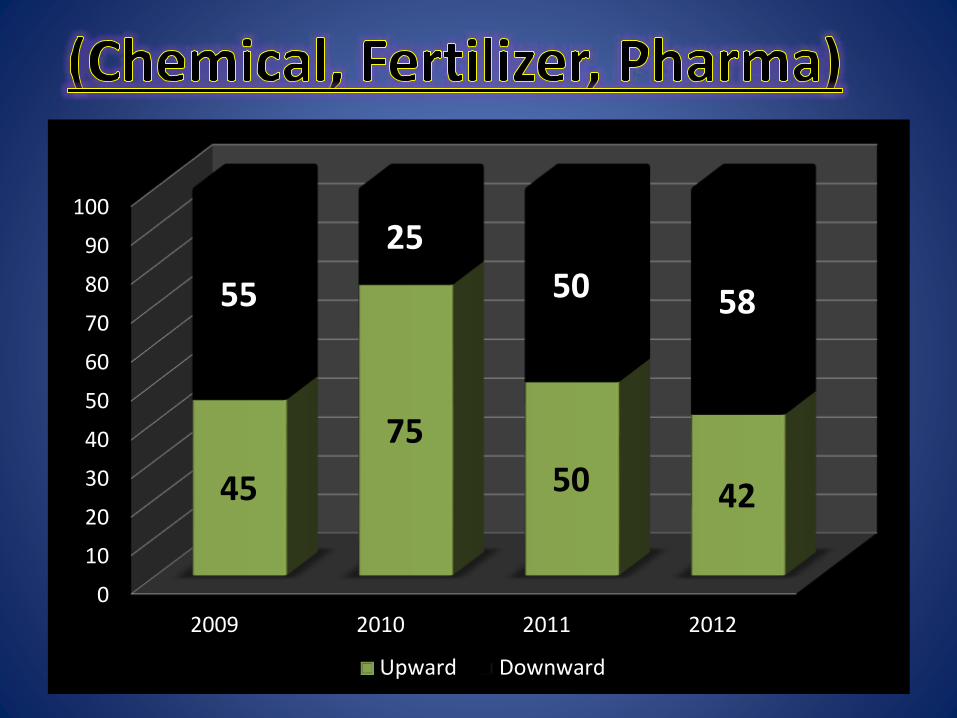
2009 2010 2011 2012
45
75
50 42
55
25
50 58
Upward Downward
0
10
20
30
40
50
60
70
80
90
100
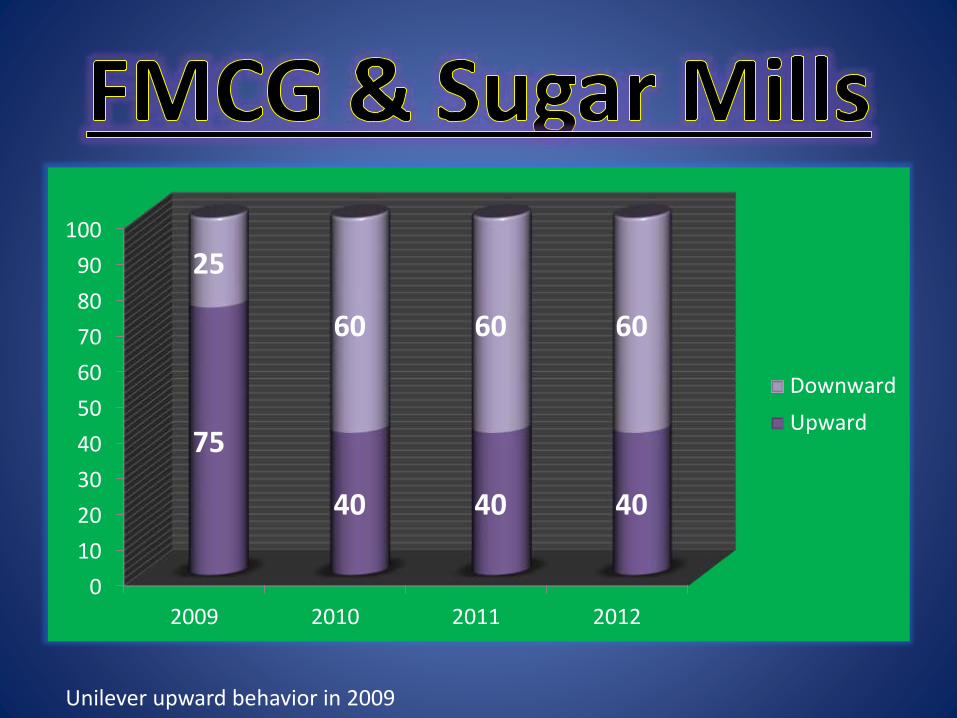
2009 2010 2011 2012
75
40 40 40
25
60 60 60
Downward
Upward
Unilever upward behavior in 2009
0%
10%
20%
30%
40%
50%
60%
70%
80%
90%
100%
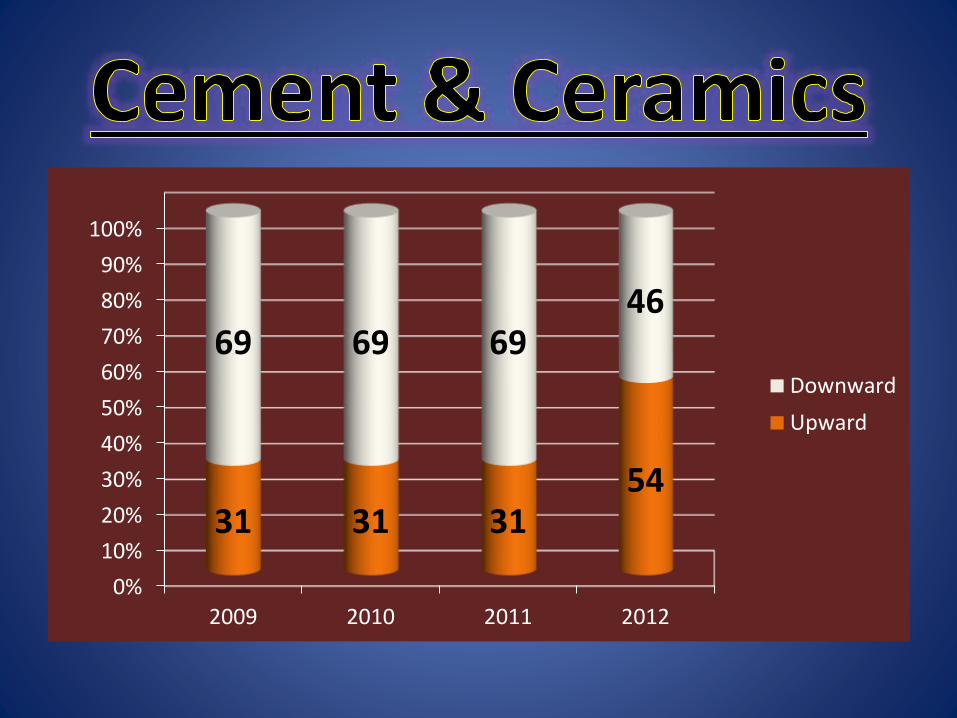
2009 2010 2011 2012
31 31 3154
69 69 6946
Downward
Upward
0%
10%
20%
30%
40%
50%
60%
70%
80%
90%
100%
2009 2010 2011 2012
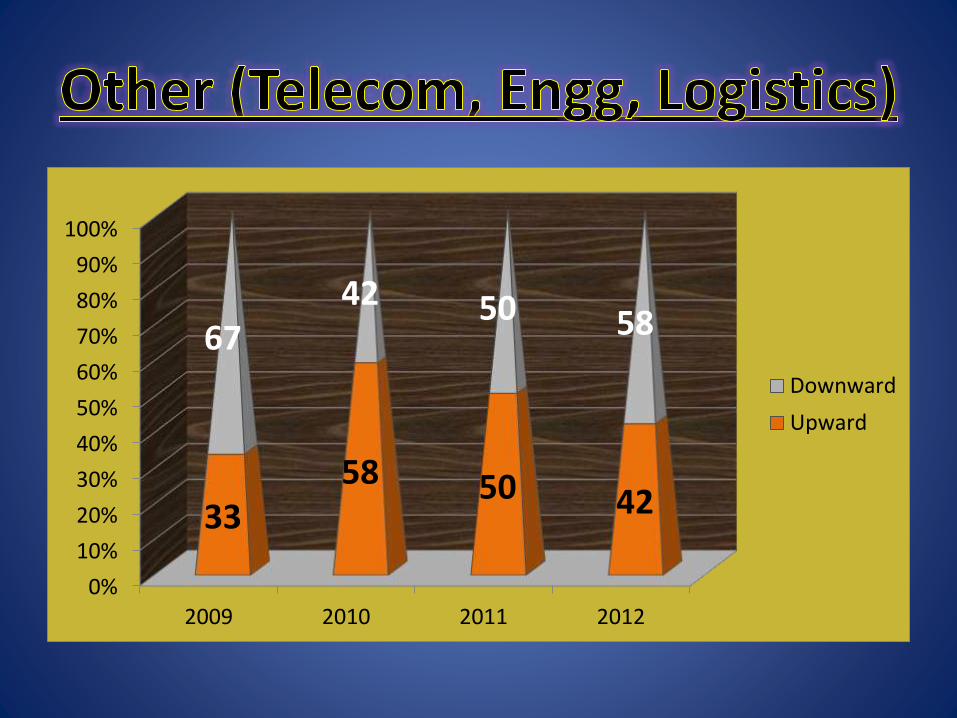
3358 50 42
6742 50 58
Downward
Upward

• Eckel, N. (1981). The Income Smoothing Hypothesis Revisited. Abacus, 11: 28-40.
Emre E., (2011). Income Smoothing: Evidence from Turkey
• Siti Masnah et al. (2013). Income Smoothing and Islam: Evidence from Malaysian
Shariah Compliant Companies. International Journal of Social Science and
Humanity, Vol. 3, No. 2, March 2013.
• Yusarina et al. (2013). Measuring market performance of shariah compliant
companies: the relevance of earnings management and leverage. 4th international
conference on business and economic research (4th October 2013) proceeding
• Alwan Sri Kustono, (2011). The theoretical construction of income smoothing
measurement. Journal of Economics, Business and Accountancy Ventura Volume
14, No. 1, April 2011, pages 59 – 78

Related Documents