Presence of enterotoxigenic Escherichia coli in biofilms formed in water containers in poor households coincides with epidemic seasons in Dhaka. Dilruba Ahmed 1* , Mohammad Shahidul Islam 1* , Yasmin Ara Begum 1 , Anders Janzon 2 , Firdausi Qadri 1 and Åsa Sjöling 2 1 International Centre for Diarrhoeal Disease Research, GPO Box 128, Dhaka, 1000, Bangladesh 2 Department of Microbiology and Immunology, Institute of Biomedicine, the Sahlgrenska Academy, University of Gothenburg, PO Box 435, SE-405 30, Göteborg, Sweden *shared first author E-mail addresses: D Ahmed: [email protected], M S Islam: [email protected] YA Begum: [email protected], A Janzon: [email protected], F Qadri: [email protected], Å Sjöling: [email protected] Corresponding author: Åsa Sjöling Department of Microbiology and Immunology, Institute of Biomedicine, Sahlgrenska Academy, University of Gothenburg Box 435, 405 30 Göteborg, Sweden Tel +46-31-7866232 Fax +46-31-7866205

Welcome message from author
This document is posted to help you gain knowledge. Please leave a comment to let me know what you think about it! Share it to your friends and learn new things together.
Transcript
Presence of enterotoxigenic Escherichia coli in biofilms formed in
water containers in poor households coincides with epidemic seasons
in Dhaka.
Dilruba Ahmed1*, Mohammad Shahidul Islam1*, Yasmin Ara Begum1,
Anders Janzon2, Firdausi Qadri1 and Åsa Sjöling2
1 International Centre for Diarrhoeal Disease Research, GPO Box 128, Dhaka, 1000,
Bangladesh
2 Department of Microbiology and Immunology, Institute of Biomedicine, the
Sahlgrenska Academy, University of Gothenburg, PO Box 435, SE-405 30, Göteborg,
Sweden
*shared first author
E-mail addresses: D Ahmed: [email protected], M S Islam: [email protected]
YA Begum: [email protected], A Janzon: [email protected], F Qadri:
[email protected], Å Sjöling: [email protected]
Corresponding author:
Åsa Sjöling
Department of Microbiology and Immunology, Institute of Biomedicine,
Sahlgrenska Academy, University of Gothenburg
Box 435, 405 30 Göteborg, Sweden
Tel +46-31-7866232
Fax +46-31-7866205
e-mail: [email protected]
Abstract
Background: Bacteria in aqueous conditions tend to form thin coatings of bacterial
communities, i.e biofilms, on abiotic or biotic surfaces and such biofilms may be
potential reservoirs for waterborne pathogens such as enterotoxigenic Escherichia coli
(ETEC).
Results:We show for the first time that enterotoxigenic Escherichia coli (ETEC), the
causative agent of acute watery diarrhea and travelers’ diarrhea is present in biofilms
formed on glass slides submerged into household water tanks in an urban area of
Dhaka, Bangladesh. Biofilms were detected every month over a two year period.
Multilayered mature biofilms were found significantly more often on glass slides
collected in the monsoon period between the two annual ETEC peaks i.e between
May and August. Sixty-four percent (49/76) of the biofilms were ETEC positive as
detected by quantitative real-time PCR. ETEC positive biofilms were found every
month of the year and followed a seasonal pattern with significantly more ETEC-PCR
positive biofilms during the epidemic peaks before and after the monsoon rains and
during flooding. Analyses of drinking water specimens from the same households
showed that planktonic ETEC was present in water during all seasons but no
correlation between presence or numbers of ETEC in water and the epidemic peaks
could be found.
Conclusions: We conclude that ETEC is continuously present in water and biofilms in
household water reservoirs in this area which has a high prevalence of ETEC diarrhea.
The frequency of biofilms with ETEC was significantly associated to seasonal
epidemic peaks of ETEC diarrhea.
Keywords: Enterotoxigenic Escherichia coli, ETEC, Drinking water, Biofilm
Background
Enterotoxigenic Escherichia coli (ETEC) is one of the most common causes of acute
diarrheal disease in developing countries, causing up to 400 million diarrheal cases
annually and approximately 400, 000 deaths among children under the age of five
every year [1-3]. ETEC is also a cause of severe to mild disease in adults. ETEC
produce two main groups of plasmid-encoded virulence factors: colonization factors
(CFs), which are adhesion molecules on the bacterial surface that mediate
colonization of the small intestine by binding to the enterocytes [4, 5], and the heat-
stable (ST) and heat-labile (LT) enterotoxins. The enterotoxins ST and LT induce
diarrhea by binding to receptors on the human intestinal epithelium where both toxins
activate signaling pathways that ultimately result in the secretion of large amounts of
water and electrolytes into the intestinal lumen [6-8]. ETEC strains express either ST
only, LT only, or both toxins simultaneously. Two genotypes of ST are expressed by
strains causing disease in humans; STh and STp [9].
In Bangladesh, diarrheal diseases are a major health problem and ETEC accounts for
about 11-20% of all diarrheal cases and affects both the local population and travelers
to the region [2, 10, 11]. Bangladesh is a subtropical country characterised by heavy
rainfalls. Three seasons are generally recognized: hot, humid summer season from
March to May, a cooler rainy monsoon period from June to September and a cool, dry
winter from October to February. In Bangladesh where ETEC is endemic the infection
rates typically rises in the warm summer season before the monsoon rains with a peak
in April-May and a second peak when the rains abate in September-October every
year [2] but the reason for these epidemic peaks is still elusive. Bangladesh is
sometimes affected by flooding during the monsoon period and severe floods in recent
years occurred in 1998, 2004 and 2007 of which the latter occurred during the period
of this study. The incidence and severity of diarrheal disease increase during floods
[10, 12]. We have previously shown that ETEC is present in drinking and
environmental water in Dhaka, the capital of Bangladesh [13-15] and viable after long
term water incubation [16], suggesting that water may be a reservoir for ETEC and a
possible route of transmission.
However it is well known that bacteria in aqueous conditions prefer to form biofilms
[17]. Biofilms are surface associated bacterial communities surrounded by an
extracellular matrix that shelters the bacteria from outer stress such as antibiotic
treatment and dehydration. Biofilms form readily on solid surfaces in contact with
non-sterile water or in liquid/air interfaces [18]. In nature biofilms are a dominating
habitat for waterborne species and are often composed by multiple species including
bacteria, protozoa and virus and the composition varies with environmental factors
[19]. Bacterial biofilm formation is regulated by complex regulatory systems that
respond to environmental signals [20, 21]. The first steps in biofilm development is
formation of a reversible monolayer of bacteria attached to the surface, this step is
initially dependent on flagellar motility and on expression of surface adhesion
molecules [22, 23]. Later stages of microcolonies and subsequently more developed
biofilms are composed of complex multilayer structures with different bacterial
populations surrounded by exopolysaccharides, external DNA and proteins [20, 24].
In the present study we sought to determine if ETEC form biofilms in household
drinking water in Dhaka. We found that biofilms form on glass slides submerged in
household water all months of the year and that planktonic ETEC was present in the
drinking water samples during the whole year. However, a significant correlation
between presence of ETEC in biofilms and the epidemic peaks was found.
Results
Biofilm formation in drinking water tanks
A total of 101 glass slides from 75 households in Mirpur were collected every month
over a period of 2 years (August 2006-August 2008). Formation of biofilm on the
glass slides were analysed by gram staining and 85% of the samples were found to
have biofilms. Biofilms were found at all months of the year ranging from 60% to
100% positive samples per month (Figure 1A). There was no significant difference in
the number of slides positive for biofilm growth found during the three different
seasons; hot summer between March - May, hot rainy season in June - September and
the dry cold season October - February. The biofilm positive glass slides were scored
for intensity and thickness of the formed biofilm using a 3 graded scale (1 - 3) and the
mean value of the intensity was plotted against the month of collection (Figure 1B and
1C). The highest median scores of intensity were recorded in May and October but
there were no significant association of more developed biofilms scored as 3 with any
of the seasons, however biofilms scored as 3 were significantly more often isolated in
the months May to August when precipitation gradually increase and reach a
maximum than in the other months (p < 0.03). To determine if thicker multilayered
biofilms correlated with ETEC diarrheal peaks we defined the epidemic peaks to
April-May in 2007 and 2008 and July-September in 2007 during the period of
flooding in Bangladesh in 2007 [10] and September-October in 2006. We found a
trend but no significant correlation of presence with biofilms graded as 3 and the
epidemic periods (p < 0.063).
ETEC is present in biofilms
Seventy-six glass slides were further analysed for presence of ETEC using real-time
PCR quantification with a PCR product standard curve as described in detail
previously [15]. Biofilms positive for at least one of the ETEC toxin genes LT, STh
and STp were identified by real-time PCR in totally 49 (64%) of the analysed samples
and during all months. The percentage of ETEC positive glass slides ranged from 20%
in November to 100% in May. No association of ETEC positive biofilms to any of the
seasons were found but significantly more ETEC positive biofilms were collected
during the epidemic peak seasons in April-May and July-September 2007 and
September-October in 2006 relative to the rest of the year (p < 0.0082) (Table 1).
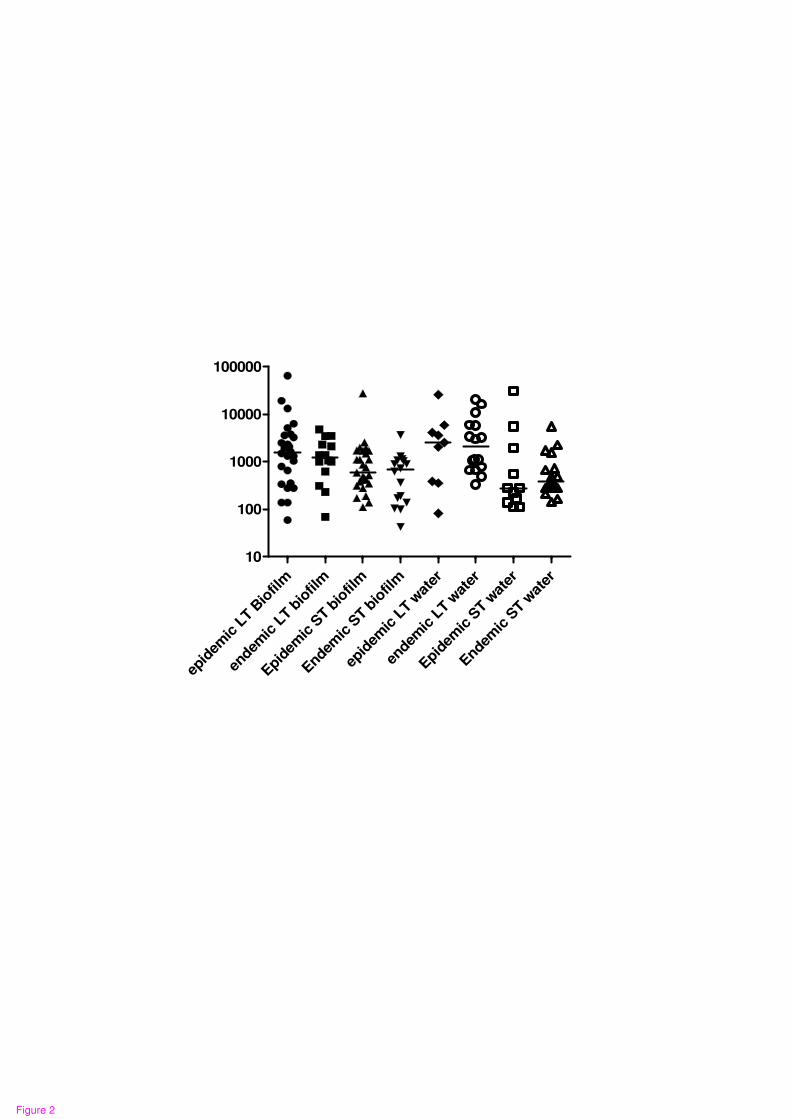
Real-time PCR quantification of the bacterial load expressed as number of ETEC
gene copies per biofilm present on one glass slide ranged from 40 to 65.000 (median
1015) and the PCR mainly detected the genes for LT and STh. However, no
significant differences were found in gene copy numbers per biofilm when comparing
the seasons or when comparing the peak months to the rest of the year (figure 2).
Identification and bacterial load of ETEC in drinking water does not follow the
epidemic peaks.
Drinking water samples were collected at the same time as the biofilm samples from
households in Mirpur during the course of the study. The water samples were also
tested for growth on MacConkey agar plates. A total of 70 water samples were tested
for ETEC growth by culture followed by toxin GM1-ELISA and 62 of these water
samples were also filtered and subjected to DNA extraction and subsequently tested
by real-time PCR. The frequency of ETEC positive samples detected by ELISA was
20% while 63% were real-time PCR positive for one or several of the toxin genes.
Neither real-time PCR nor ELISA results detected any association of ETEC positive
water samples to the epidemic peaks or season. Thirty-one samples that were positive
in real-time PCR were negative in ELISA. Real time PCR quantification revealed that
100 ml water contained a median of 3100 gene copies [15]. No significant difference
was found in gene copy numbers for LT and STh present in drinking water between
the different seasons or in the epidemic peak seasons (figure 2).
Discussion
Enterotoxigenic E. coli and other diarrheal bacterial pathogens are believed to spread
by the fecal-oral route of transmission presumably by contaminated food and water.
We and others have repeatedly reported presence of ETEC in environmental and
drinking water in endemic areas [13 - 15, 25] but since bacteria in aqueous
environments tend to exist mainly in the form of biofilms [17] the presence of ETEC
in biofilms in drinking water sources needed to be established. This is to our
knowledge the first study to confirm the presence of ETEC in biofilms formed in
drinking water sources in an endemic area with high rates of acute watery diarrhea.
Household drinking water biofilms were found during all months of the year.
Developed multilayered biofilms were found significantly more often on glass slides
collected in the period between the two annual ETEC peaks i.e between May and
August (figure 1B). These months have the highest average temperatures in Dhaka
and also this is the peak period for the rainy season. Since the households in this study
were mainly from low income groups and consisted mainly of sheds and one-roomed
over crowded homes the temperatures inside homes and in the drinking water was
presumably also higher during these months. We did however not measure
temperature during the time of the sampling. Biomass and changed biodiversity of
biofilms in estuarine waters has previously been found to be associated with higher
temperatures and rainfall in a subtropical area [26]. Other studies have reported a link
between higher temperature and earlier biofilm formation as well as higher bacterial
biofilm biomass [27]. Hence formation of biofilm in drinking water tanks probably
occurs faster during the warm and humid months in Bangladesh.
In 2007 Bangladesh was hit by massive flooding between July to September that
caused extensive flooding of several areas of Dhaka and contributed to an earlier
epidemic of ETEC cases than in other years with a peak in August [10]. Despite the
flood we could recover slides during this period and they were analysed as slides
collected during epidemic peaks. We found significantly more ETEC positive
biofilms detected by real-time PCR during the epidemic peaks of the entire study
period indicating that ETEC in biofilms are linked to the epidemic peaks. This could
indicate that more ETEC are circulating between the environment and community
during epidemics and hence present in environmental water during the epidemic peaks
and we have also shown this in a previous study [15]. However the presence of ETEC
in drinking water was not found to be higher during the epidemic peaks in this study
in contrast to previous evidence of significantly higher numbers of ETEC positive
drinking water samples during epidemics [15]. This previous report was however not
based on samples taken over the entire year and only covered the autumn peak and the
winter season.
Similar to earlier studies we detected culturable ETEC colonies in the water samples
[14, 15]. However, since we had to detach the biofilms using harsh methods we could
not establish the presence of viable ETEC from the biofilms with confidence which
made a comparison between viability in biofilms and water impossible. In addition,
we could not establish any significant link between presence of culturable ETEC in
water and the epidemic peak seasons or other seasons. The fact that the PCR method
detects more positive samples and higher numbers of bacteria further emphasizes that
conventional culture methods might underestimate the numbers of potentially
infectious bacteria in environmental samples, hence we choose to compare the results
obtained with real-time PCR in this study.
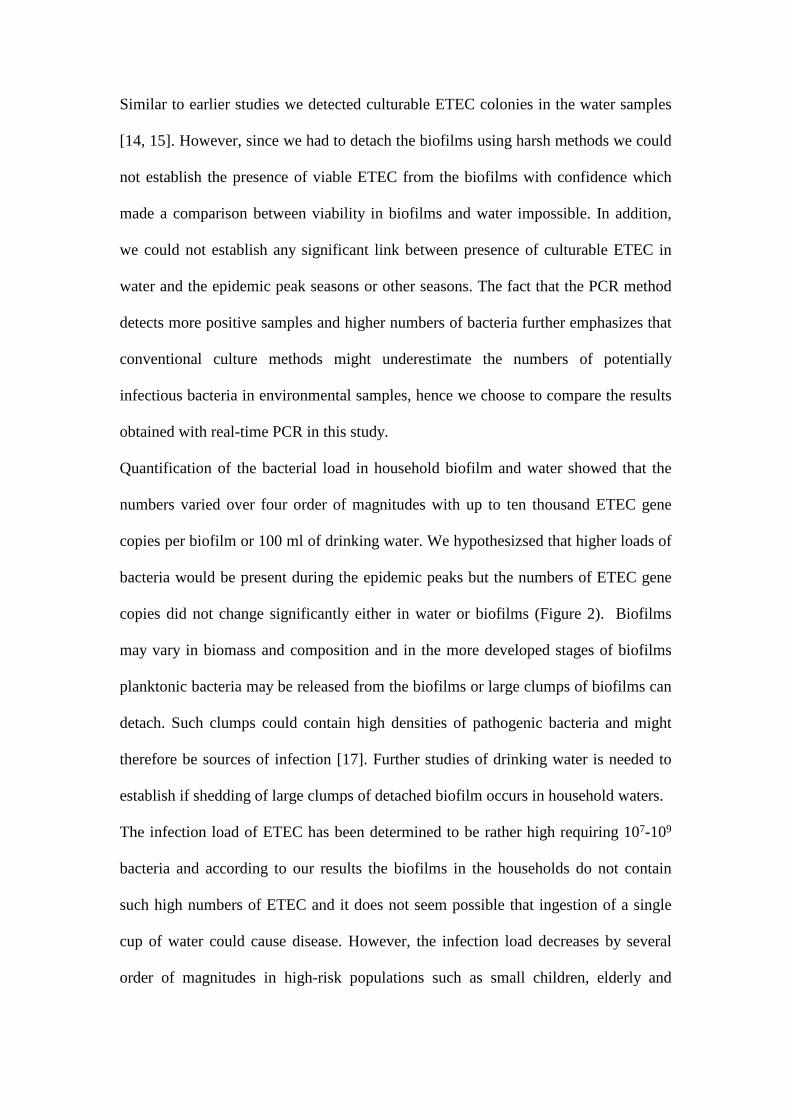
Quantification of the bacterial load in household biofilm and water showed that the
numbers varied over four order of magnitudes with up to ten thousand ETEC gene
copies per biofilm or 100 ml of drinking water. We hypothesizsed that higher loads of
bacteria would be present during the epidemic peaks but the numbers of ETEC gene
copies did not change significantly either in water or biofilms (Figure 2). Biofilms
may vary in biomass and composition and in the more developed stages of biofilms
planktonic bacteria may be released from the biofilms or large clumps of biofilms can
detach. Such clumps could contain high densities of pathogenic bacteria and might
therefore be sources of infection [17]. Further studies of drinking water is needed to
establish if shedding of large clumps of detached biofilm occurs in household waters.
The infection load of ETEC has been determined to be rather high requiring 107-109
bacteria and according to our results the biofilms in the households do not contain
such high numbers of ETEC and it does not seem possible that ingestion of a single
cup of water could cause disease. However, the infection load decreases by several
order of magnitudes in high-risk populations such as small children, elderly and
immuno-compromised individuals. The population in the study area suffers from
malnutrition and poverty and would probably be susceptible to lower levels of
bacteria. In addition, V. cholerae biofilms isolated from water sources have been
reported to be hyperinfectious and able to out-compete planktonic bacteria as well as
establish an infection with several order of magnitudes lower doses of inoculated
bacteria in a mouse model [28]. Hence it might be possible that a small dose of
thousands of ETEC bacteria from biofilms may be able to cause disease in high-risk
individuals. Since mature biofilms formed more often in the warm rainy periods there
might be a link between onset of epidemics and detachment of biofilms. This however
needs to be further investigated. In a previous study we were able to show that ETEC
of similar phenotypic characteristics were isolated both from water and patients with
diarrhea indicating water transmission [14]. On the other hand the constant presence
of low levels of ETEC in biofilms and drinking water found in this study may
contribute to the fact that ETEC are often recovered from the feces of asymptomatic
individuals. Although asymptomatic carriers of ETEC may be immune due to
repeated infections of the same type of ETEC strains [29], studies of ETEC numbers
in fecal specimens of symptomatic and asymptomatic individuals in endemic areas
would be interesting to perform.
Conclusions
In conclusion this is the first study to our knowledge that has established presence of
ETEC in household drinking water biofilms. ETEC is endemic in Bangladesh and the
results of this study indicate a constant presence of ETEC in the drinking water and
biofilms of households in poor areas. However the number of biofilms that contained
ETEC increased significantly during the epidemic periods which might suggest that
biofilms could be a reservoir for ETEC. .
Materials and Methods
Selection of sample sites
Households in Mirpur, which is a poor slum area in Dhaka, Bangladesh were selected
based on results from a previous birth cohort where children in Mirpur that suffered
from several incidences of ETEC diarrhoea 2002-2004 were identified [30].
Households with the highest incidence of ETEC infections in children in the previous
cohort study, i.e most likely to have ETEC within the household, and with household
water storage in water tanks, a requirement for this study, were selected for inclusion
in the present study. The water tanks are large or smaller water reservoirs kept outside
or inside the home that usually contain several hundred litres of water and members of
the household use the water within the tanks for daily consumption. The tanks were
drained every third to six month and a few tanks were drained every month. Totally 75
households were included in the study and samples were taken distributed over all
months of the year. The adults of each household were informed about the purpose of
the study and gave oral consent to collect water and to perform biofilm screening.
Bacterial samples were analysed mainly at the International Centre for diarrhoeal
disease research, Dhaka, Bangladesh icddr,b who has the premises for working with
pathogens.
Household sampling procedures
Biofilm samples were collected by submerging glass slides disinfected with 99,5%
ethanol and mounted into Petri dishes into the water tanks. Two holes were made in
the lid of the Petri dishes so that water could pass freely through the dish. The lid and
plate were tied with a rope and a piece of cork was attached at the other end to keep
the dish floating at a depth of 15-20 cm. The glass slides inside the Petri dishes were
placed into household water tanks of 6-8 households on each occasion. After 30 days
the Petri dishes with glass slides were collected and a water sample was taken from
the water tank.
Staining and DNA extraction
After collection the samples were brought to the laboratory at the international centre
for diarrhoeal disease Research, Bangladesh (iccdr,b) in Dhaka and the slides were
washed with 3x 10 ml of PBS (phosphate buffered saline) to remove the non adherent
cells and other debris. One slide was air dried and gram stained to analyse for the
formation of biofilms. The formation of biofilm was graded on a scale from 1 to 3 on
biofilm positive slides. Adherent cells were collected from the second slide by
applying 250 ul PrepMan®Ultra (Applied Biosystem) on top of the biofilm to
dissociate the attached bacterial cells. Bacterial cells were extracted by scraping off
the biofilms from the slides with the open end of a sterile 1000 µl pipette tip. The
cells were collected in a sterile 1.5 ml micro-centrifuge tube (Eppendorf). Extraction
of bacterial DNA was performed by using the DNeasy Blood and tissue kit (Qiagen,
Hilden, Germany) following the manufacturer’s protocol for extraction of Gram
negative bacterial DNA. Water samples were collected by filtration of 500 ml
drinking water through a 0.22 µm pore filter. Of each filter, one quarter was used for
DNA extraction and one quarter for E. coli culture on MacConkey agar plates as
described previously [15]. The rest of the filter was frozen at -20 ºC.
Culture, ELISA and PCR analyses of the samples
To determine the presence of culturable ETEC all water samples were cultured on
MacConkey agar followed by toxin ELISA or multiplex PCR analyses of lactose-

fermenting colonies as described previously [31]. The procedure for water samples
has been described earlier [15]. To determine and quantify the presence of ETEC
enterotoxin genes, STh, STp and LT, directly in the water and biofilm samples
extracted DNA was analysed by real-time PCR using a PCR product standard curve as
described previously [15]. Briefly, a single band PCR product of each gene was
purified using a PCR purification kit (Qiagen, Hilden, Germany). The concentration
(g / µl ) was measured and the number of double stranded PCR products per µl was
calculated using the length of the fragment multiplied with the mole weight of dsDNA
nucleotides (660 g / mole). Using Avogadro’s number 6.022 x 10²³ molecules per
mole the number of PCR fragments per µl was calculated [32]. Serial ten-fold
dilutions were then used as a standard curve and compared to the Ct value of each
sample to subsequently calculate the number of gene copies per biofilm or water
sample.
Statistical analysis
Statistical significance was tested by GraphPad Prism version 5 using the 2 sided
Fishers exact test. A p-value < 0.05 was considered significant.
Competing interests
The authors declare that they have no competing interests
Author’s contributions
DA conceived of and participated in the design of the study, performed and analysed
biofilm straining and helped to draft the manuscript. MSI performed the house-hold
samplings, performed culture and biofilm staining experiments, analysed the samples
and helped to draft the manuscript. YAB performed house hold samplings, culture
experiments, analysed and organized data and revised the manuscript. AJ performed
molecular real-time PCR analyses and helped to revise the manuscript. FQ conceived
of and designed the study and revised the manuscript. ÅS conceived of and designed
the study, performed real-time PCR analysed all data and wrote the manuscript. All
authors read and approved the final manuscript
Acknowledgements
The study was funded by the joint Formas Sida/SAREC funded programme for
research on sustainable development in developing countries (209-2009-2018) and the
Signe and Olof Wallenius foundation to ÅS and the Swedish International
Development Cooperation Agency (Sida, Grant-INT-icddr,b-HNO1-AV) and the
International Centre for Diarrhoeal Disease Research, Bangladesh (icddr,b) to FQ.
References
[1] Wennerås C, Erling V: Prevalence of enterotoxigenic Escherichia coli-
associated diarrhoea and carrier state in the developing world. J Health Popul
Nutr. 2004., 22: 370-82.
[2] Qadri F, Svennerholm A.M, Faruque AS, Sack RB: Enterotoxigenic Escherichia
coli in developing countries: epidemiology, microbiology, clinical features,
treatment, and prevention. Clin. Microbiol. Rev. 2005, 18: 465-483.
[3] Walker RI, Steele D, Aguado T.; Ad Hoc ETEC Technical Expert Committee:
Analysis of strategies to successfully vaccinate infants in developing countries
against enterotoxigenic E. coli (ETEC) disease. Vaccine. 2007, 25(14): 2545-66
[4] Gaastra W, Svennerholm A M: Colonization factors of human enterotoxigenic
Escherichia coli (ETEC). Trends Microbiol. 1996, 4: 444-452.
[5] Nataro JP, Kaper JB: Diarrheagenic Escherichia coli. Clin Microbiol Rev. 1998,
11:142-201.
[6] Field M, Graf Jr. LH, Laird W J, Smith PL: Heat-stable enterotoxin of
Escherichia coli: in vitro effects on guanylate cyclase activity, cyclic GMP
concentration, and ion transport in small intestine. Proc. Natl. Acad. Sci. USA
1978, 75: 2800-2804.
[7] Sack RB: Enterotoxigenic Escherichia coli: identification and
characterization. J Infect Dis, 1980,142: 279-286.
[8] Sixma TK, Kalk KH, van Zanten BA, Dauter Z, Kingma J, Witholt B, Hol WG:
Refined structure of Escherichia coli heat-labile enterotoxin, a close relative of
cholera toxin. J. Mol. Biol. 1993, 230: 890-918.
[9] Bölin I, Wiklund G, Qadri F, Torres O, Bourgeois AL, Svennerholm AM:
Enterotoxigenic Escherichia coli with STh and STp genotypes is associated with
diarrhea both in children in areas of endemicity and in travelers. J Clin Microbiol
2006, 44(11): 3872-3877.
[10] Harris AM, Chowdhury F, Begum YA, Khan AI, Faruque AS, Svennerholm AM,
Harris JB, Ryan ET, Cravioto A, Calderwood SB, Qadri F: Shifting prevalence of
major diarrheal pathogens in patients seeking hospital care during floods in
1998, 2004, and 2007 in Dhaka, Bangladesh.Am J Trop Med Hyg. 2008, 79(5):
708-14.
[11] Chowdhury F, Rahman MA, Begum YA, Khan AI, Faruque AS, Saha NC, Baby
NI, Malek MA, Kumar AR, Svennerholm AM, Pietroni M, Cravioto A, Qadri F:
Impact of rapid urbanization on the rates of infection by Vibrio cholerae O1 and
enterotoxigenic Escherichia coli in Dhaka, Bangladesh. PLoS Negl Trop Dis.
2011, 5(4): e999.
[12] Qadri F, Khan AI, Faruque AS, Begum YA, Chowdhury F, Nair GB, Salam MA,
Sack DA, Svennerholm AM: Enterotoxigenic Escherichia coli and Vibrio cholerae
diarrhea, Bangladesh, 2004. Emerg Infect Dis. 2005, 11(7): 1104-7.
[13] Begum YA, Talukder KA, Nair GB, Qadri F, Sack RB, Svennerholm AM:
Enterotoxigenic Escherichia coli isolated from surface water in urban and rural
areas of Bangladesh. J Clin Microbiol. 2005, 43(7): 3582-3583.
[14] Begum YA, Talukder KA, Nair GB, Khan SI, Svennerholm AM, Sack RB, Qadri
F: Comparison of enterotoxigenic Escherichia coli isolated from surface water
and diarrhoeal stool samples in Bangladesh. Can J Microbiol 2007, 53(1): 19-26.
[15] Lothigius Å, Janzon A, Begum YA, Sjöling Å, Qadri F, Svennerholm AM,
Bölin I: Enterotoxigenic Escherichia coli Is Detectable in Water Samples from an
Endemic Area by Real-time PCR. Journal of Applied Microbiology 2008, 104(4):
1128-1136.
[16] Lothigius Å, Sjöling Å, Svennerholm AM, Bölin I: Survival and Gene
Expression of Enterotoxigenic Escherichia coli during Long Term Incubation in
Sea- and Freshwater. Journal of Applied Microbiology, 2010, 108: 1441-9
[17] Wingender J, Flemming HC: Biofilms in drinking water and their role as
reservoir for pathogens. Int J Hyg Environ Health. 2011, 214(6) :417-23
[18] Costerton JW, Lewandowski Z, Caldwell DE, Korber DR, Lappin-Scott HM:
Microbial biofilms. Annu Rev Microbiol. 1995, 49: 711-45.
[19] Brümmer IH, Fehr W, Wagner-Döbler I: Biofilm community structure in
polluted rivers: abundance of dominant phylogenetic groups over a complete
annual cycle. Appl Environ Microbiol. 2000, 66(7):3078-82.
[20] Karatan E, Watnick P: Signals, regulatory networks, and materials that build
and break bacterial biofilms. Microbiol Mol Biol Rev. 2009, 73:310-347.
[21] Monds RD, O’Toole GA: The developmental model of microbial biofilms: ten
years of a paradigm up for review. Trends Microbiol 2009, 17: 73-87
[22] Sauer K, Camper AK, Ehrlich GD, Costerton JW, Davies DG: Pseudomonas
aeruginosa displays multiple phenotypes during development as a biofilm. J
Bacteriol 2002, 184:1140-1154
[23] Moorthy S, Watnick PI: Genetic evidence that the Vibrio cholerae monolayer
is a distinct stage in biofilm development Mol. Microbiol. 2004, 52: 573-587
[24] Flemming HC, Wingender J: The biofilm matrix. Nat Rev Microbiol. 2010,
8:623-633.
[25] Patel CB, Vajpayee P, Singh G, Upadhyay RS, Shanker R: Contamination of
potable water by enterotoxigenic Escherichia coli: qPCR based culture-free
detection and quantification. Ecotoxicol Environ Saf. 2011, 74 (8): 2292-2298.
[26] Moss JA, Nocker A, Lepo JE, Snyder RA: Stability and change in Estuarine
biofilm bacterial community density Appl. Environ. Microbiol. 2006, 72: 5679-
5688
[27] Diaz Villanueva V, Font J, Schwartz T, Romani AM: Biofilm formation at
warming temperature: acceleration of microbial colonization and microbial
interactive effects. Biofouling. 2011, 27(1): 59-71
[28] Tamayo R, Patimalla B, Camilli A: Growth in a biofilm induces a
hyperinfectious phenotype in Vibrio cholerae. Infect Immun 2010, 78: 3560-3569.
[29] Qadri F, Ahmed F, Ahmed T, Svennerholm AM: Homologous and cross-
reactive immune responses to enterotoxigenic Escherichia coli colonization
factors in Bangladeshi children. Infect Immun. 2006, 74 (8): 4512-4518.
[30] Qadri F, Saha A, Ahmed T, Al Tarique A, Begum YA, Svennerholm AM:
Disease burden due to enterotoxigenic Escherichia coli in the first 2 years of life
in an urban community in Bangladesh. Infect Immun. 2007, 75(8): 3961-3968.
[31] Sjöling Å, Wiklund G, Savarino S, Cohen D, Svennerholm AM: Comparative
analyses of phenotypic and genotypic methods for detection of enterotoxigenic
Escherichia coli (ETEC) toxins and colonisation factors. Journal of Clinical
Microbiology 2007, 45(10):3295-3301
[32] Sjöling Å, Qadri F, Nicklasson M, Begum YA, Wiklund G, Svennerholm
AM. In vivo expression of the heat stable (estA) and heat labile (eltB) toxins
of enterotoxigenic E. coli (ETEC). Microbes and Infection, 2006, 8: 2797-2802
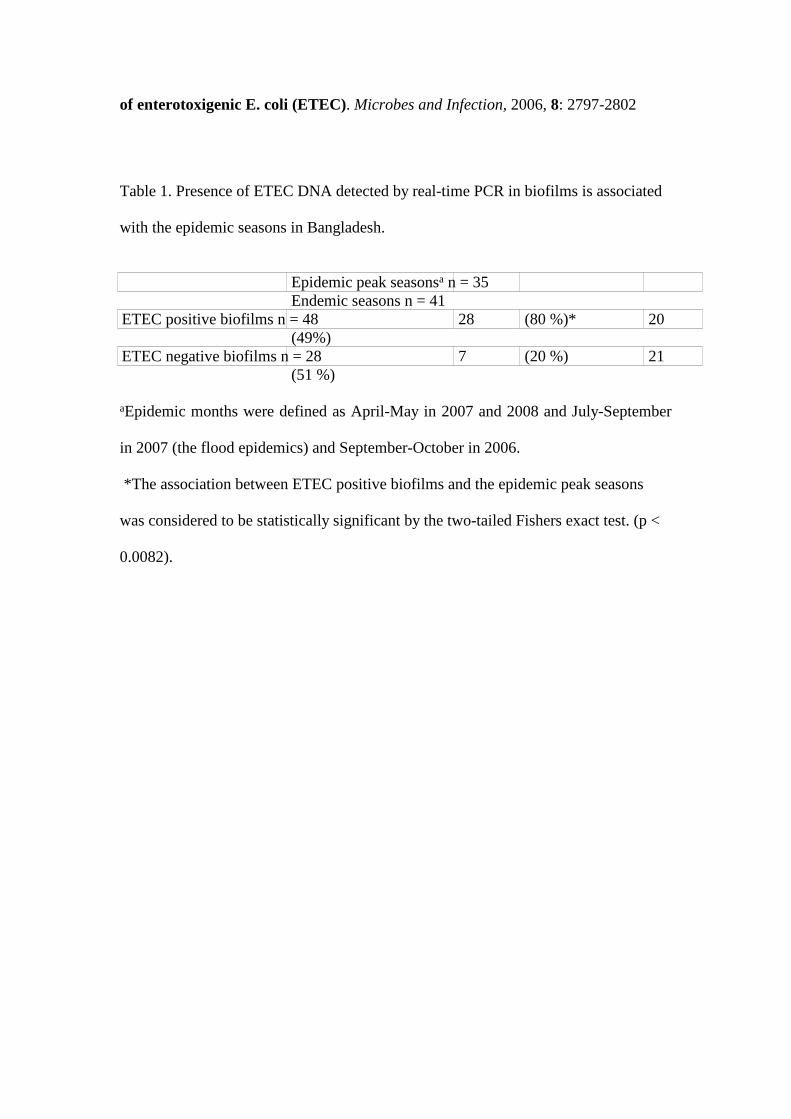
Table 1. Presence of ETEC DNA detected by real-time PCR in biofilms is associated
with the epidemic seasons in Bangladesh.
Epidemic peak seasonsa n = 35Endemic seasons n = 41
ETEC positive biofilms n = 48 28 (80 %)* 20(49%)
ETEC negative biofilms n = 28 7 (20 %) 21(51 %)
aEpidemic months were defined as April-May in 2007 and 2008 and July-September
in 2007 (the flood epidemics) and September-October in 2006.
*The association between ETEC positive biofilms and the epidemic peak seasons
was considered to be statistically significant by the two-tailed Fishers exact test. (p <
0.0082).
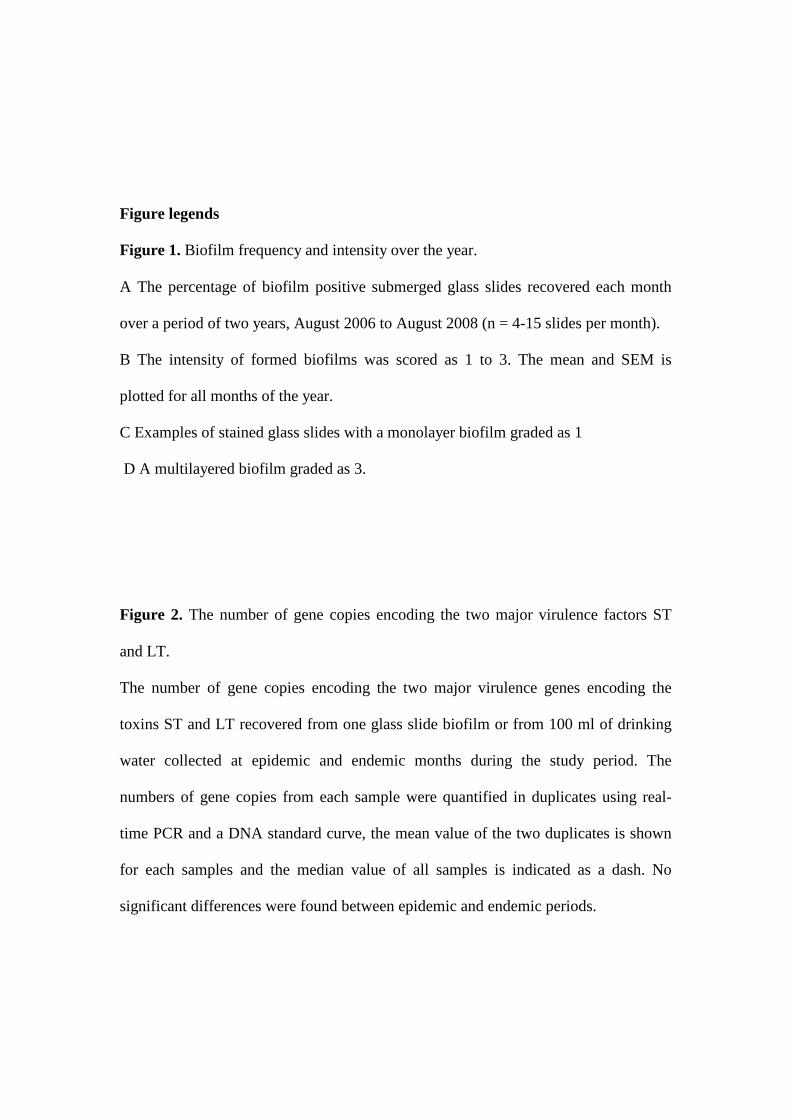
Figure legends
Figure 1. Biofilm frequency and intensity over the year.
A The percentage of biofilm positive submerged glass slides recovered each month
over a period of two years, August 2006 to August 2008 (n = 4-15 slides per month).
B The intensity of formed biofilms was scored as 1 to 3. The mean and SEM is
plotted for all months of the year.
C Examples of stained glass slides with a monolayer biofilm graded as 1
D A multilayered biofilm graded as 3.
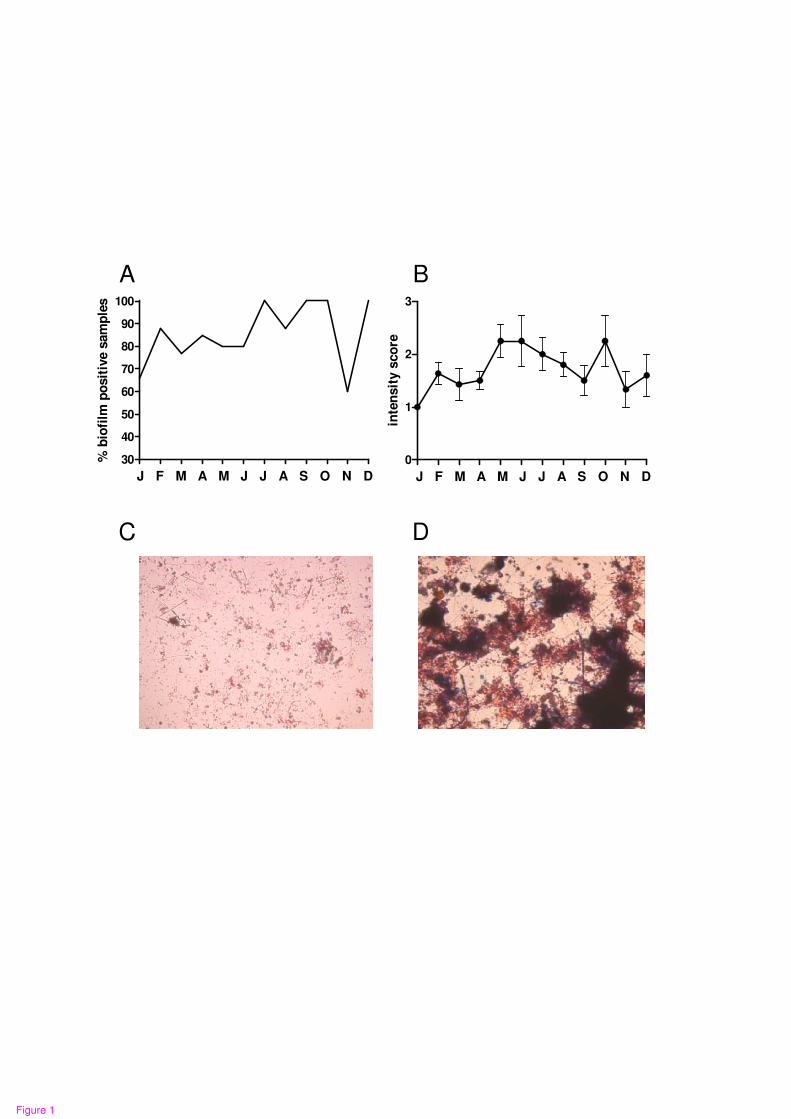
Figure 2. The number of gene copies encoding the two major virulence factors ST
and LT.
The number of gene copies encoding the two major virulence genes encoding the
toxins ST and LT recovered from one glass slide biofilm or from 100 ml of drinking
water collected at epidemic and endemic months during the study period. The
numbers of gene copies from each sample were quantified in duplicates using real-
time PCR and a DNA standard curve, the mean value of the two duplicates is shown
for each samples and the median value of all samples is indicated as a dash. No
significant differences were found between epidemic and endemic periods.
A
C
B
30
40
50
60
70
80
90
100
J F M A M J J A S O N D
% b
iofi
lm p
osit
ive s
am
ple
s
0
1
2
3
J F M A M J J A S O N D
inte
nsit
y s
co
re
D
Figure 1
10
100
1000
10000
100000
epid
emic
LT B
iofil
m
endem
ic L
T bio
film
Epid
emic
ST b
iofil
m
Endem
ic S
T bio
film
epid
emic
LT w
ater
endem
ic L
T wat
er
Epid
emic
ST w
ater
Endem
ic S
T wat
er
10
Figure 2
Related Documents