1 UNLV Center for Democratic Culture Edited by Dmitri N. Shalin Prenatal Care and Infant Mortality in Nevada Douglas L. Garner, University of Nevada, Las Vegas Roger Cleveland, Eastern Kentucky University A. Dexter Samuels, Tennessee State University Tiffany G. Tyler, University of Nevada, Las Vegas The U.S. outspends all other industrial countries on health care, and yet Americans hardly enjoy better health (Gorman 2010). An American baby born in 2006 can expect to live 78 years – two years less than a baby born across the Canadian border. The U.S. ranks 28 th in infant mortality out of the 30 major industrial countries (Gorman 2010). A large part of the gap in infant mortality can be traced to high infant death rates in certain populations, particularly African-Americans who make up about 13% of the total population. In 2005, infant mortality for non-Hispanic blacks in the U.S. ran to 13.6 deaths per 1,000 live births compared with 5.76 deaths per 1,000 live births for non-Hispanic whites. Such disparities reflect differences in education, environment, and socioeconomic status – factors notoriously difficult to mitigate (Gorman, 2010, p. 34). To measure the health of a nation, it is vital to evaluate maternal and child health. Multiple studies have shown that early and continuous prenatal care positively affects the mother and infants health. The United States has improved the infant mortality rate over the last century, so that over 75% of women now enter prenatal care in their first trimester. Nevada reflects this trend, Chapter Highlights The three leading causes of infant mortality death in America – congenital malformations, low birth weight, sudden infant death syndrome – account for 45% of all infant deaths incidence and prevalence. In 1990, infant mortality rate in Nevada was 8.3 deaths per 1,000 live births, lagging behind the goals set by the Healthy People 2010. In 2007, 64.7% of Hispanic women received early prenatal care in Nevada, compared to 71.1% of Black women and 89.2 % of White, non-Hispanic women. The Social Health of Nevada Leading Indicators and Quality of Life in the Silver State How to Cite this Report Garner, Douglas L., Roger Cleveland, Dexter Samuels, and Tiffany Tyler. 2012. “Prenatal Care and Infant Mortality in Nevada.” In The Social Health of Nevada: Leading Indicators and Quality of Life in the Silver State, edited by Dmitri N. Shalin. Las Vegas, NV: UNLV Center for Democratic Culture, http://cdclv.unlv.edu/healthnv_2012/index. html

Welcome message from author
This document is posted to help you gain knowledge. Please leave a comment to let me know what you think about it! Share it to your friends and learn new things together.
Transcript
1
UNLV Center for Democratic Culture Edited by Dmitri N. Shalin
Prenatal Care and Infant Mortality in Nevada Douglas L. Garner, University of Nevada, Las Vegas Roger Cleveland, Eastern Kentucky University A. Dexter Samuels, Tennessee State University Tiffany G. Tyler, University of Nevada, Las Vegas The U.S. outspends all other industrial countries on health care, and yet Americans hardly enjoy better health (Gorman 2010). An American baby born in 2006 can expect to live 78 years – two years less than a baby born across the Canadian border. The U.S. ranks 28th in infant mortality out of the 30 major industrial countries (Gorman 2010). A large part of the gap in infant mortality can be traced to high infant death rates in certain populations, particularly African-Americans who make up about 13% of the total population. In 2005, infant mortality for non-Hispanic blacks in the U.S. ran to 13.6 deaths per 1,000 live births compared with 5.76 deaths per 1,000 live births for non-Hispanic whites. Such disparities reflect differences in education, environment, and socioeconomic status – factors notoriously difficult to mitigate (Gorman, 2010, p. 34). To measure the health of a nation, it is vital to evaluate maternal and child health. Multiple studies have shown that early and continuous prenatal care positively affects the mother and infants health. The United States has improved the infant mortality rate over the last century, so that over 75% of women now enter prenatal care in their first trimester. Nevada reflects this trend,
Chapter Highlights
The three leading causes of infant mortality death in America – congenital malformations, low birth weight, sudden infant death syndrome – account for 45% of all infant deaths incidence and prevalence.
In 1990, infant mortality rate in Nevada was 8.3 deaths per 1,000 live births, lagging behind the goals set by the Healthy People 2010.
In 2007, 64.7% of Hispanic women received early prenatal care in Nevada, compared to 71.1% of Black women and 89.2 % of White, non-Hispanic women.
The Social Health of Nevada Leading Indicators and Quality of Life in the Silver State
How to Cite this Report
Garner, Douglas L., Roger Cleveland, Dexter Samuels, and Tiffany Tyler. 2012. “Prenatal Care and Infant Mortality in Nevada.” In The Social Health of Nevada: Leading Indicators and Quality of Life in the Silver State, edited by Dmitri N. Shalin. Las Vegas, NV: UNLV Center for Democratic Culture, http://cdclv.unlv.edu/healthnv_2012/index.html
2
but we need to keep our efforts to reduce the disparities between races and ethnicities and establish a seamless system of care, including mental health and social services and increase the number of pregnant women covered financially. Our purpose in this report is to promote the understanding that the health of mothers, infants and children is critically import, that the current health trends in the U.S. population and individual states predict the health patterns in the coming generation. After reviewing the national and local trends, we discuss the various factors affecting infant mortality and prenatal care and offer recommendations on how to decrease infant mortality and improve prenatal care in the Silver State. National Picture Rates, Incidence, Prevalence The infant mortality rate is the number of deaths of infants under one year of age per 1,000 live births in a given population. The infant mortality rate in the U.S. was 6.75 infant deaths per 1,000 live births in 2007, not significantly different than the rate of 6.68 in 2006. Infant mortality rates ranged from 4.57 per 1,000 live births for mothers of Central and South American origin to 13.31 for non-Hispanic black mother (Mathews & MacDorman 2011). The rates were higher for the infants born in multiple deliveries, for the infants born to unmarried mothers, and for the infants whose mothers were born in the 50 States or the District of Columbia. Infant mortality was also higher for male infants and infants born preterm or at low birth weight. The neonatal mortality rate was essentially unchanged from 2006 (4.46) to 2007 (4.42). The postneonatal mortality rate increased 5% in relation to overall U.S. infant mortality. Thus, more than one-half of all infant deaths in the U.S. in 2007 (54%) occurred to the 2% of infants born very prematurely (less than 32 weeks of gestation). Still, infant mortality rates for late term preterm infants (34-36 weeks of gestation) were 3.6 times, and those for early term (37-38 weeks) infants were 1.5 times, those for infants born at 39-41 weeks of gestation – the gestation age with the lowest infant mortality rate. The three leading causes of infant mortality death in the U.S. were congenital malformations, low birth weight, and sudden infant death syndrome – these causes accounted for 45% of all infant deaths. The percentage of infant deaths that were “preterm-related” was 36.0 percent in 2007. The problem-related infant mortality rate for non-Hispanic black mothers was 3-4 times higher, and the rate for Puerto Rican mothers was 71% higher than for non-Hispanic white mothers (Mathews & MacDorman 2007). The infant mortality rate in our country is of serious concern because the United States has fallen to the twenty-second place among industrialized nations in infant mortality rankings. This is why healthcare professionals and the public have stressed the need for better pre-natal care, coordination of health services, and the provision of comprehensive maternal-child services. Infant mortality rates have been typically highest for the babies of adolescent mothers and lowest for mothers in their 20’s and
3
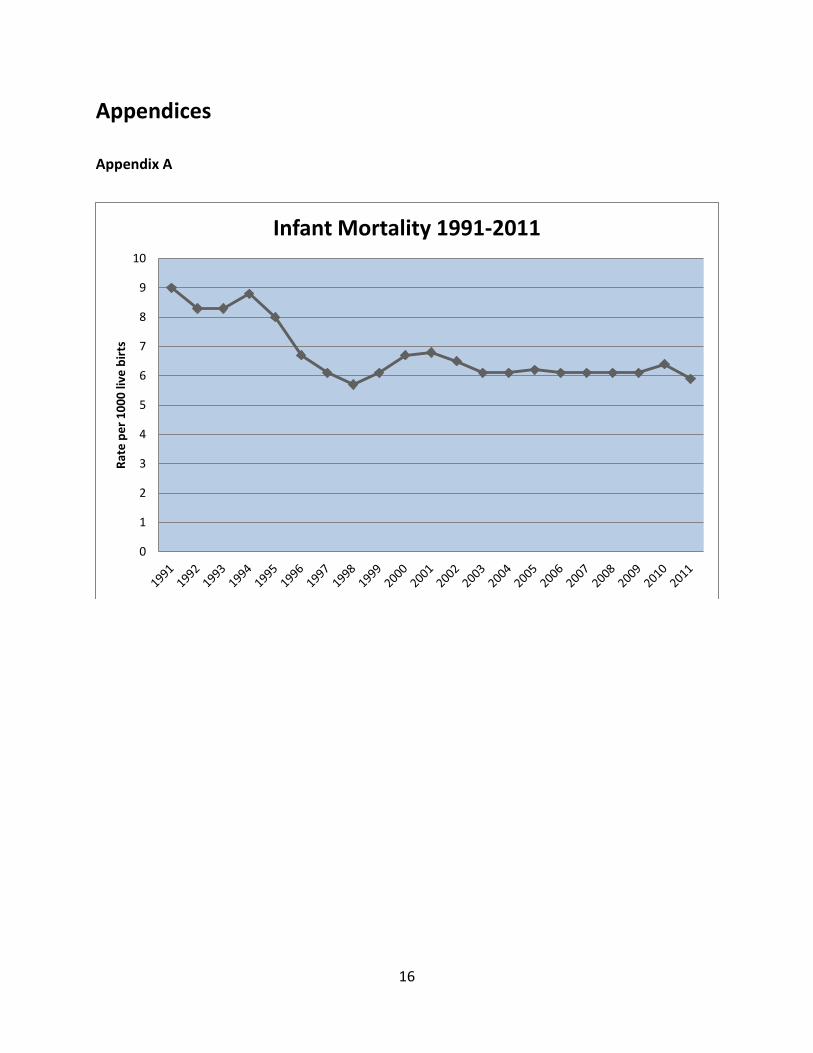
early 30’s. The rates have also been high for women in their forties or older. In general, infant mortality rate decrease with increasing maternal educational levels. The infant mortality rate for unmarried mothers is often more than 8.3% higher than the mortality rate for married women. Likewise, the mortality rate is characteristically higher for infants whose mothers smoke. Infant Mortality in Nevada In 1991, the Nevada State Health Division, partnered with other public and private organizations to tackle the infant mortality rate and improve access to prenatal care. Outreach programs like the “Baby Your Baby” encourage women to obtain early and continuous prenatal care. The program evolved over time into the Maternal & Child Health program, and it now provides a safety net for mothers who do not have health care insurance and do not qualify for financial assistance from other programs. Thanks to these and other efforts Nevada’s infant mortality rate has been significantly reduced in the past decade. Currently Nevada ranks 12 with a value of 5.9 deaths per 1,000 live births (America’s Health Rankings 2011).
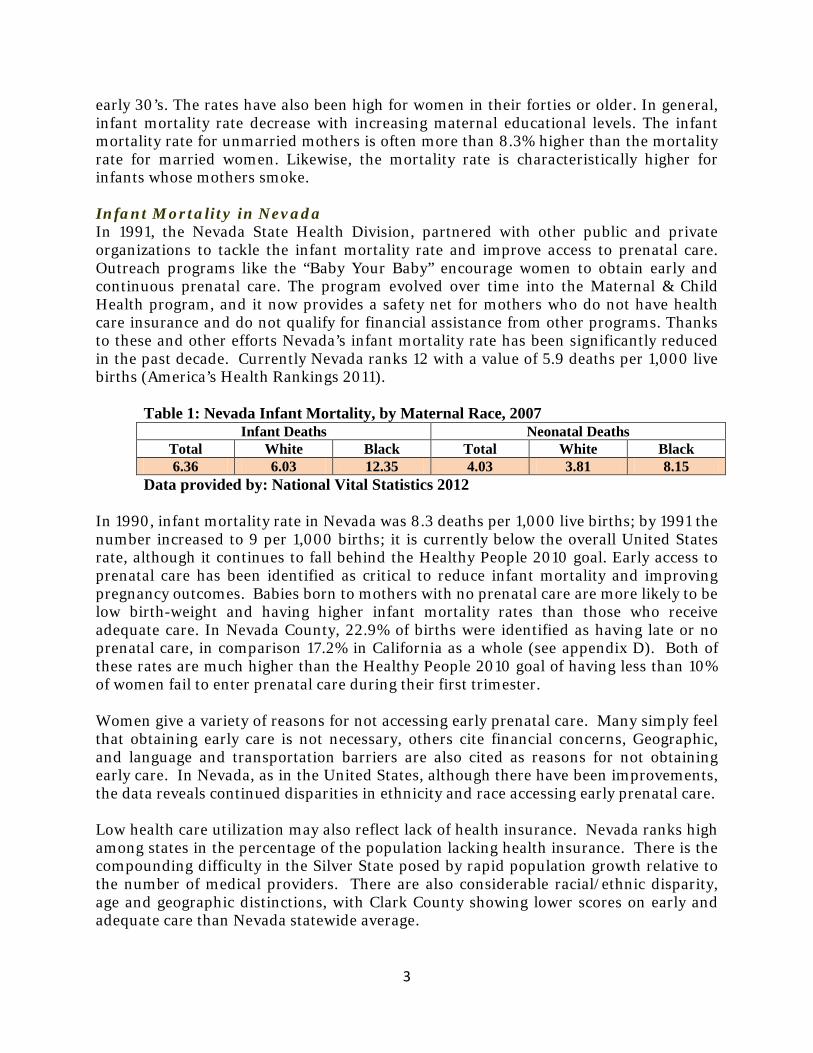
Table 1: Nevada Infant Mortality, by Maternal Race, 2007
Infant Deaths Neonatal Deaths Total White Black Total White Black 6.36 6.03 12.35 4.03 3.81 8.15
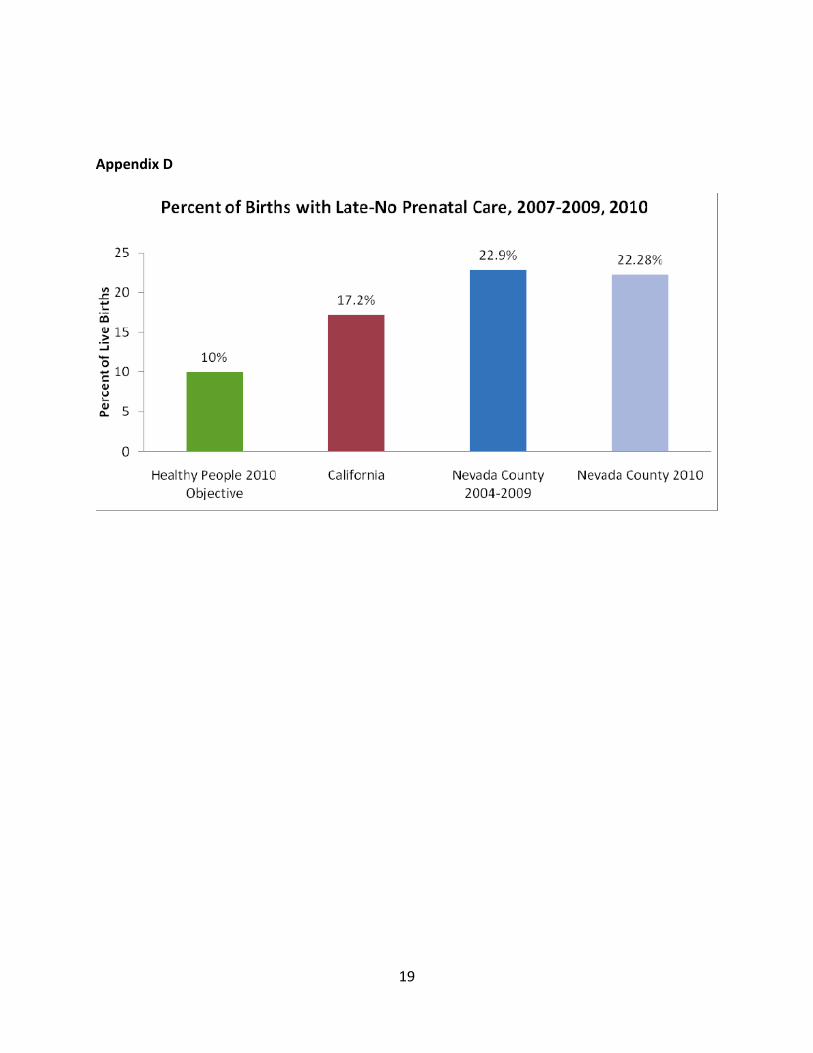
Data provided by: National Vital Statistics 2012 In 1990, infant mortality rate in Nevada was 8.3 deaths per 1,000 live births; by 1991 the number increased to 9 per 1,000 births; it is currently below the overall United States rate, although it continues to fall behind the Healthy People 2010 goal. Early access to prenatal care has been identified as critical to reduce infant mortality and improving pregnancy outcomes. Babies born to mothers with no prenatal care are more likely to be low birth-weight and having higher infant mortality rates than those who receive adequate care. In Nevada County, 22.9% of births were identified as having late or no prenatal care, in comparison 17.2% in California as a whole (see appendix D). Both of these rates are much higher than the Healthy People 2010 goal of having less than 10% of women fail to enter prenatal care during their first trimester.
Women give a variety of reasons for not accessing early prenatal care. Many simply feel that obtaining early care is not necessary, others cite financial concerns, Geographic, and language and transportation barriers are also cited as reasons for not obtaining early care. In Nevada, as in the United States, although there have been improvements, the data reveals continued disparities in ethnicity and race accessing early prenatal care.
Low health care utilization may also reflect lack of health insurance. Nevada ranks high among states in the percentage of the population lacking health insurance. There is the compounding difficulty in the Silver State posed by rapid population growth relative to the number of medical providers. There are also considerable racial/ethnic disparity, age and geographic distinctions, with Clark County showing lower scores on early and adequate care than Nevada statewide average.

4
In the United States, there are two different criteria used nationally to define whether or not prenatal care was adequate, one is known as Kessner Index (see Appendix B) and another as Kotelchuck Index (see Appendix C). The Kessner index identifies the criteria for adequacy of prenatal care based on the gestational age of the fetus and the number of prenatal visits made by the mother. The Kotelchuck index, which is also known as The Adequacy of Prenatal Care Utilization (APNCU) index, uses two elements obtained from birth certificate data-the initiation of prenatal care and the number of prenatal visits from the beginning of prenatal care until delivery.
Causes of Infant Mortality Leading causes of infant mortality is congenital malformations, deformation and chromosomal abnormalities with a rate of 20.2%. Disorders related to short gestation and low birth weight was the second leading cause of death for all infants at 16.4% of all deaths. Sudden infant death syndrome (SIDS) is the third leading cause of infant death. The SIDS incidence decreased by about 9% since 1988. The fourth leading cause of death comes under the heading of newborn affected by maternal complications of pregnancy. In 2008, data from 1990-2008 on planned home VBAC were analyzed by sociodemographic and medical characteristics for the 25 states reporting this information compared with hospital VBAC data. In 2008, there were approximately 42,000 hospital VBAC’s in the United States, up from 664 in 2003 and 656 in 1990. The percentage of home births that were VBAC’s increased from less than 1% in 1996 to 4% in 2008, whereas the percentage of hospital births that were VBAC’s decreased from 3% in 1996 to 1% in 2008. Planned home VBAC’s had a lower risk than hospital VBAC’s with fewer births to teenagers, unmarried women or smokers, fewer preterm or low-birth-weight deliveries, and higher maternal education levels (MacDorman, Declercq, Mathews & Stotland 2008). There is a difference in mortality rates amongst racial groups. The rate for blacks is 14.2 and the rate for whites is 5.8. Experts associate this difference with the minorities’ access to prenatal care. Such care is expensive, and over 40 million Americans do not have health insurance. The mother’s socioeconomic status is a possible contributing factor because the leading cause of death was related to congenital malformations, which in some cases can be eliminated with appropriate nutritional intake and prenatal vitamins. Lack of prenatal care is also a contributing cause of infant death (Mathews & MacDorman 2011). Recent data showed good news for parents of teenagers. The teen birth rate declined by 30% over the past decade to historic low and the rate for black teens was down by more than 40%. For young black teens (15-17 years) the results were even more striking, as the rate was cut in half since 1991. The average age at first birth was 25.1 years in 2002, an all-time high in the United States. Birth rates for women 35-39 (41 births per 1,000 women) and 40-44 (eight per 1,000) were the highest in more than three decades. The rate for women ages 20-24 was 104 births per 1,000 women. In contrast, the rate for teens was 43 per 1,000. It is notable, also, that just over one in ten women smoked

5
during pregnancy in 2002, a decline of 42 percent since 1989. Ethnic Disparities in Infant Mortality and Use of Prenatal Care There are major disparities between races in infant death rates. The Infant Mortality Statistics from the 2007 Period Linked Birth/Infant Death Data Set provides the following data for the United States:
• In the year 2007, the overall mortality rate for all races in the U.S. was 6.75 deaths per 1,000 live births.
• African American had an infant mortality rate of 13.8. • The American Indian infant mortality was 8.6 • Non-Hispanic Whites had an infant mortality rate of 5.8. • Hispanics (all origins) had an infant mortality rate of 5.6. • The Asian/Pacific Islander infant mortality rate was 4.7.
There has been a narrowing of racial disparities in early and adequate prenatal care in the United States over the past thirteen years, yet the disparities still exist (see Appendix E). A study published in the American Journal of Public Health, “Racial Differences in Prenatal Care Use in the United States: Are Disparities Decreasing?,” reports that the reduction in the disparities is due to a national policy’s emphasis on and commitment to the reduction of racial disparities in health outcomes and efforts to promote more culturally competent care. In an effort to promote the engagement and delivery of culturally responsive care. Tools such as the Cultural Competency Domains Model (Wakefield, Garner, Pehrsson & Tyler, 2010) can be utilized to assess levels of culturally competent health care practices. Women give a variety of reason for not accessing early prenatal care. Many simply feel that obtaining early care is not necessary; others cite financial concerns. Geographic, language and transportation barriers are cited as reasons for not obtaining early care. In Nevada, as in the United States, the 2007 data reveals continued disparities in ethnicity and race in accessing early prenatal care, even though there are signs that the situation is improving.
• 64.7% of Hispanic women received early prenatal care in Nevada, compared to 71.1% of Black women and 89.2 % of White, non-Hispanic women.
This data is particularly noteworthy since Hispanics represent over one-third of total live births in Nevada. Table 2: Infant Mortality (deaths per 1,000 live births)
2004 2005 2006 2007 2008 5.9 5.8 6.1 6.1 6.1
Data provided by: Center for Business and Economic Research, 2012. Table 5: Infant Mortality
All races White Black
6
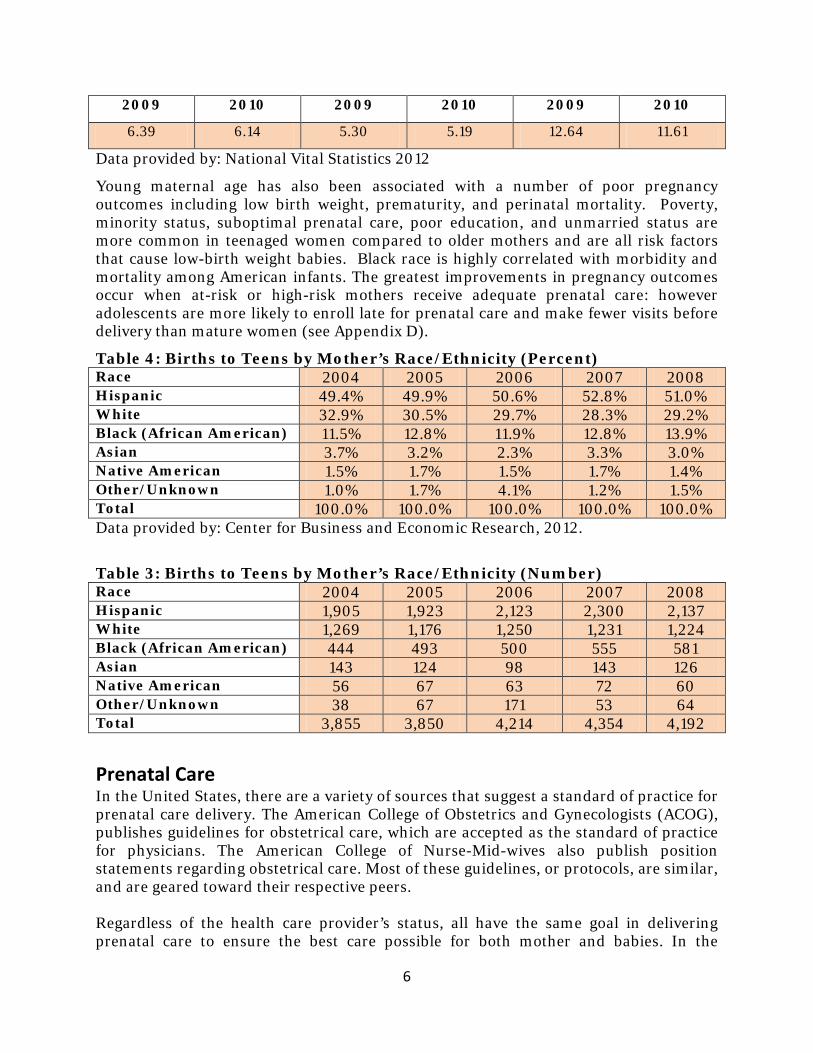
2009 2010 2009 2010 2009 2010
6.39 6.14 5.30 5.19 12.64 11.61
Data provided by: National Vital Statistics 2012
Young maternal age has also been associated with a number of poor pregnancy outcomes including low birth weight, prematurity, and perinatal mortality. Poverty, minority status, suboptimal prenatal care, poor education, and unmarried status are more common in teenaged women compared to older mothers and are all risk factors that cause low-birth weight babies. Black race is highly correlated with morbidity and mortality among American infants. The greatest improvements in pregnancy outcomes occur when at-risk or high-risk mothers receive adequate prenatal care: however adolescents are more likely to enroll late for prenatal care and make fewer visits before delivery than mature women (see Appendix D).
Table 4: Births to Teens by Mother’s Race/Ethnicity (Percent) Race 2004 2005 2006 2007 2008 Hispanic 49.4% 49.9% 50.6% 52.8% 51.0% White 32.9% 30.5% 29.7% 28.3% 29.2% Black (African American) 11.5% 12.8% 11.9% 12.8% 13.9% Asian 3.7% 3.2% 2.3% 3.3% 3.0% Native American 1.5% 1.7% 1.5% 1.7% 1.4% Other/Unknown 1.0% 1.7% 4.1% 1.2% 1.5% Total 100.0% 100.0% 100.0% 100.0% 100.0% Data provided by: Center for Business and Economic Research, 2012.
Table 3: Births to Teens by Mother’s Race/Ethnicity (Number) Race 2004 2005 2006 2007 2008 Hispanic 1,905 1,923 2,123 2,300 2,137 White 1,269 1,176 1,250 1,231 1,224 Black (African American) 444 493 500 555 581 Asian 143 124 98 143 126 Native American 56 67 63 72 60 Other/Unknown 38 67 171 53 64 Total 3,855 3,850 4,214 4,354 4,192
Prenatal Care In the United States, there are a variety of sources that suggest a standard of practice for prenatal care delivery. The American College of Obstetrics and Gynecologists (ACOG), publishes guidelines for obstetrical care, which are accepted as the standard of practice for physicians. The American College of Nurse-Mid-wives also publish position statements regarding obstetrical care. Most of these guidelines, or protocols, are similar, and are geared toward their respective peers. Regardless of the health care provider’s status, all have the same goal in delivering prenatal care to ensure the best care possible for both mother and babies. In the
7
National Collaboration Centre for Women’s and Children’s Health publication, Antenatal Care, routine care for the healthy pregnant woman, recommendations include:
• Pregnant women should be offered opportunities to attend antepartum classes and have written information about their care.
• At the first contact, pregnant women should be informed about the pregnancy-care services and options available, lifestyle considerations, including dietary information, as well as screening.
• Pregnant women should be informed about the purpose of any screening test before it is performed; the right of women to accept or decline a test must be made clear.
• Pregnant women should be offered evidence based information to allow them to make informed decisions, including detailed information on where they will be seen, who will provide their care, and how alternative choices are addressed.
• At each prenatal appointment mid-wives and doctors should offer consistent information along with clear explanations and an opportunity for pregnant women to discuss issues and ask questions.
• A system of clear referral paths should be established so that pregnant women requiring additional care are managed and treated by appropriate specialist teams when problems arise.
• Antenatal care should be provided by small group of care givers with whom the women feel comfortable, with the continuity of care maintained throughout the antenatal period.
As stated, it is ideal to have women begin prenatal care in her first trimester, and continue her prenatal care on a regular basis until delivery. A typical schedule for prenatal visits to a health care provider includes visits: (1) about once each month during the first six months of pregnancy, then (2) every two weeks during the next two months, and then, (3) weekly until delivery date. The goal of prenatal care is not only to provide the best care for the pregnant woman and the unborn child, but also to prepare the mother-to-be for the delivery of a healthy baby. During the prenatal visits, tests are performed on both mother and the baby to assess any potential risks, to treat any maternal or fetal complications, and to monitor the growth and development of the fetus. In addition, counseling and guidance are provided regarding various aspects of pregnancy, including weight gain, exercise, nutrition and overall health. A typical prenatal visit may include any or all of the following:
8
• Weight measurement
• Blood pressure measurement
• Measurement of the uterus to check for proper growth of the fetus
• Physical examination of the mother to identify problems or discomforts (i.e., swelling of the hands and feet
• Urine test to measure sugar and protein levels, which can indicate diabetes or preeclampsia (a condition characterized by pregnancy-induced high blood pressure, protein in the urine, and swelling due to fluid retention)
• Fetal heart rate measurement
• Prenatal screening tests (i.e., blood tests to check anemia) In addition to these tests at each prenatal visit, additional screening tests are performed at various times during the pregnancy to rule out a variety of possible problems.
Reducing Infant Mortality and Improving Prenatal Care The healthy People 2010 report set the following goals for standards of prenatal care and live births:
• 90% entry into prenatal care in the first trimester and early and continuous prenatal care.
• The infant mortality rate goal is 4.5 per 1,00 live births There are several reasons why Nevada failed to meet the standards set by the Healthy People 2010, including language barriers, Geography, and transportation. Other barriers to early and continuous prenatal include educational disparities in learning about the importance of care, shortage of obstetrical providers, and unequal access to health insurance (see Appendix A). We should also mention cultural differences and perinatal depression. There are several things that health providers and state governments can do to lower these barriers. Offering to mature or married minors confidential prenatal care, including medical visits and routine services for labor and delivery, is one sure pathway to improving prenatal healthcare delivery (Guttmacher Institute, 2012). In addition to:
• Public Education programs delivered through various mass media outlets can help women and families to understand the benefits of early and continuous prenatal care.

9
• Prenatal care providers should work to improve their cultural competency.
• Increasing the number of bilingual health care providers will enhance the quality of prenatal care.
• A more positive litigation and practice insurance environment must be created to
reassure health care providers.
• Expanded Medicare coverage will improve the quality of care among at-risk groups.
• Positive outcomes will also increase with screening for a variety of social and
mental health needs, including perinatal depression, domestic violence, transportation needs, drug/alcohol/tobacco use, and family support.
• All providers, including hospital staff, should emphasize the importance of
breastfeeding for positive prenatal care outcomes.
• Nutritional counseling is one more step known to improve the quality of prenatal care.
The 2000-2007 plateaus in the U.S. infant mortality rate represents the first period of sustained lack of decline in the U.S. rate since the 1950’s (see Appendix A). Although there have been positive changes in both outcomes over the past decade or so, a lot of work still lies ahead. Nevada must continue its efforts to meet the Healthy People 2010 goals. The Healthy People 2010 target goal for the U.S. infant mortality rate is 4.5 infant deaths per 1,000 live births. The current U.S. rate is 50% higher than this goal (U.S. Department of Health and Human Services, Healthy People 2010). The situation is likely to improve as collaboration between agencies increases and the public becomes more educated about the benefits of early and continuous prenatal care. While prenatal care is critical for early risk assessment, intervention, and monitoring among those at risk for adverse birth outcomes, African Americans and American Indians continue to have higher rates of infant mortality regardless of timing of initiation or prenatal care.
Policy Recommendations The continuum of maternal and child health services from preconception through the postpartum period should be expanded. As Nevada continues to grow more ethnically and racially diverse, it is essential that health care providers receive training in, and increase their sensitivity to, cultural differences affecting the delivery of culturally competent services and practices (Garner 2011). Collaboration with managed care organizations will also help pregnant women and ensure that infants are not “lost” in systems of care. State, county, and local governments must address mental health and social services needs of women and children. Although these needs are diverse, long term effective interventions must be identified and instituted to create a successful environment where

10
women are empowered to seek and obtain necessary interventions that make their lives and those of their children better. Strategies to reduce IMRs and eliminate disparities among racial/ethnic populations should be sensitive to social factors that vary according to race/ethnicity. Such factors might include infant age at death, cause of death, mother’s age and health, multiple births, low birth weight, premature births, assisted reproductive technology, prenatal visits, and access to healthcare services. To help identify root causes of high IMRs and develop new strategies for reducing IMRs, a State Infant Mortality Collaborative was formed in 2004. It includes CDC, the Association of Maternal and Child Health Programs, and teams from five states (Mathews & Keppel 2005, p. 556). Part of the issue here is that by ascribing the problem as originating elsewhere, the majority population can excuse itself from the responsibility for finding a viable solution. In their role of responsible care providers, public health professionals must be conscious of segregation by priority and proactive in integrating the concerns of minorities into a total picture of American health. Regarding minority women’s health, these responsibilities include making sure that all pregnant women receive prenatal and delivery services in adequate facilities, that all women are provided education and services to avoid unintended pregnancies, and that the causes of all preterm deliveries are discovered (Hoag & Vasquez 2002, p. 553).
Proportionally, births from unintended pregnancy decrease with increasing education. With all the attention going to adolescent pregnancy prevention, one might neglect unintended pregnancies among adults (Hogue & Vasquez 2002). Yet teenage pregnancies are only the tip of the iceberg for unintended pregnancies and not even the tip for unwanted pregnancies. About 75% of unintended pregnancies and 86% of unwanted pregnancies occur among adults (Hoag & Vasquez, 2002, p. 554). As a part of the effort to reduce adverse birth outcomes research must be an ongoing and continuous strategy. Health and Human Services supports a wide range of medical research to prevent and treat birth defects, premature births, SIDS and other life-threatening conditions. For example: The wider use of antenatal corticosteroids to prevent premature labor and promote lung maturation-clinical practice endorsed by the National Institutes of health (NIH) Consensus Development Conference. Treatment with surfactant, discovered and developed through research supported by the National Institute of Child Health and Human Development (NICHD) and National Heart, Lung and Blood Institute (NHILBI), has also reduced deaths of premature infants from respiratory distress syndrome. NLHBI, with input from NICHD, is developing and enhanced research agenda to address key issues regarding hypertensive disorders of pregnancy, such as preeclampsia, characterized as an abnormal increase in blood pressure during pregnancy that affects 5 percent to 8 percent of pregnancies and contributes to maternal, fetal and infant morbidity and mortality. The CDC is also examining sociocultural, behavioral and environmental factors, including stress and social support, related to preterm birth among African-American women in Harlem, New York, and Los Angeles, California.

11
Conclusion As MacDorman & Mathews (2009) argue, infant mortality is an important indicator of the health of a nation because it encompasses a wide range of factors such as maternal health, quality and access to medical care, socioeconomic conditions, and public health practices. While the U.S. infant mortality rate declined throughout the 20th century, more recent data shows a temporary halt in this decline in the first few years of the 21st century. The percentage of infants born prematurely and at a low birth weight continues to increase, and because infants born too small or too soon have higher mortality rates, this is bound to affect infant mortality. Large differences in infant mortality rates among racial/ethnic groups have persisted and even increased, suggesting that not all groups have benefited equally from social and medical advances (MacDorman & Mathews, 2009, p. 671).
Factors frequently mentioned as contributing to racial/ethnic differences in infant mortality include differences in maternal preconception health, infection, income, access to quality health care, stress, racism, and social and cultural factors (MacDorman & Mathews 2009). However, the influence of individual risk factors (e.g., maternal age or income) vary considerably by race/ethnicity, suggesting different disease pathways and life experiences for women of different racial/ethnic groups (MacDorma & Mathews, 2009, p. 672).
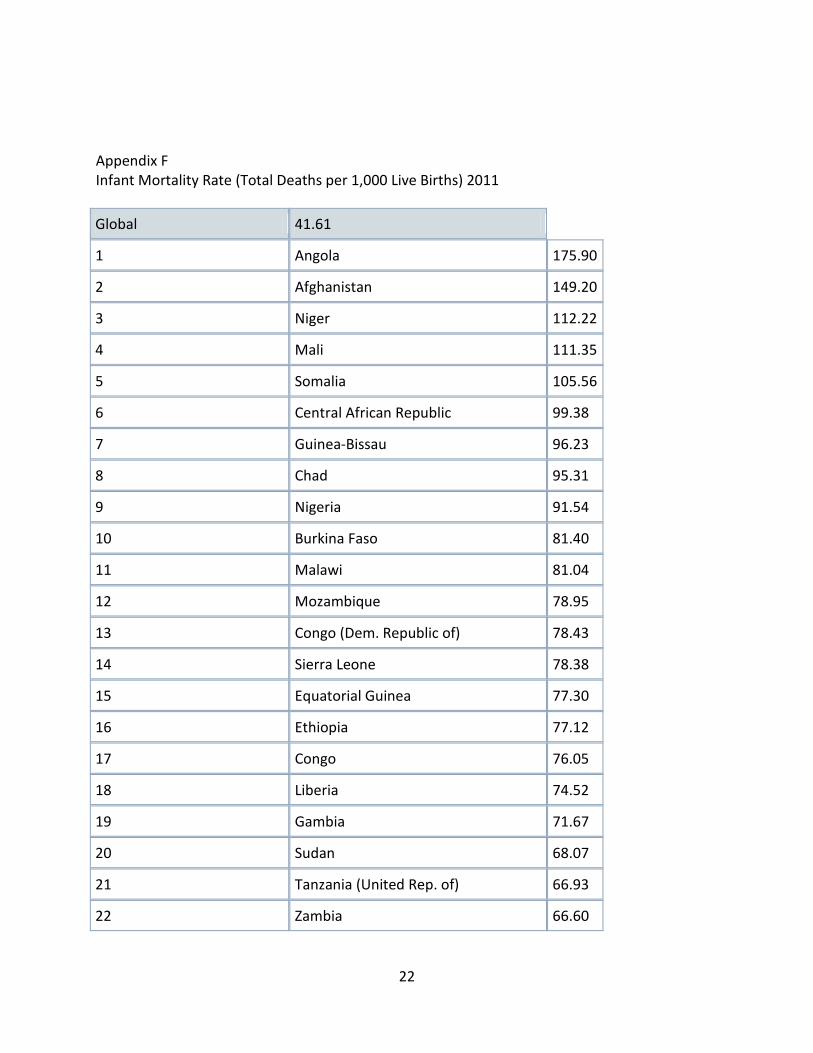
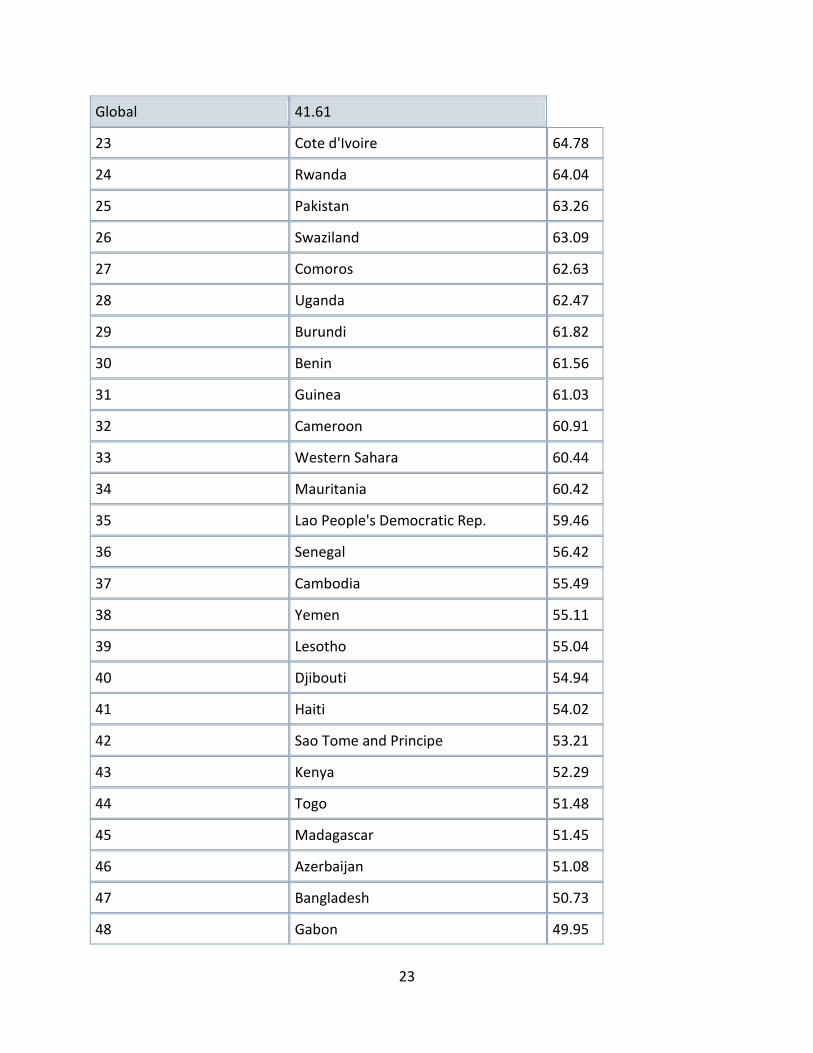
The international standing of the United States (see Appendix F) on infant mortality stems in large part from the substantial racial (Black/White) disparity in infant survival and associated socioeconomic inequality that have existed in the country for a long period (Singh & Yu 1995). Substantial differences in infant mortality among Whites, Blacks, and other racial/ethnic groups have been well documented. Considerable differences in infant mortality have also been noted in terms of such important socioeconomic variables as education and family income. Furthermore, long-term trends in U.S. infant mortality decline have not been uniform for various socioeconomic and demographic subgroups of the population and causes of infant death (Sing & Yu, 1995, p.957). Consequently, differences in income and access to health care among racial/ethnic groups may also contribute to differences in infant mortality (MacDorman & Mathews 2009). In 2005, nearly three times as many black, American Indian, and Hispanic children as non-Hispanic white children (under 18 years of age) lived in families with incomes below the poverty level. To compound the challenge children of black, American Indian, and the Hispanic families were also much less likely than non-Hispanic white children to have health insurance (MacDorman & Mathews, 2009, p. 672).
12
Data Sources and Suggested Readings
American College of Obstetrics and Gynecology (ACOG), http://www.acog.org American College of Nurses and Mid-Wives, http://www.acnm.org/about.cfm Association of Maternal & Child Health Programs, (January 2005), Building State
Partnerships to Improve Birth Outcomes. CIA, The World Factbook, available at: https://www.cia.gov/library/publications/the-
world-factbook/. Gorman, C. (2010). “Closing the health gap.” Scientific American, 303(4), 34-36. Garner, D. L. (2011) Student narratives on the acquisition and practice of cultural
competency: A phenomenological inquiry of counselor education students, Dissertation Study University of Nevada Las Vegas.
Guttmacher Institute (2012). State policies in brief: Minors’ access to prenatal care.
New York: Author. Healthy People 2010, Maternal, Infant and Child Health, Centers for Disease Control
and Prevention. Kids Count Data Center/Nevada (2012). The Annie E. Casey Foundation: Data provided
by the Center for Business and Economic Research. Kessner, D. M., J. Singer, J., Kalk, C. E., Schlesinger, E. R. Infant Death: An Analysis by
Maternal Risks and Health Care. Washington, DC: Institute of Medicine and National Academy of Sciences; 1973: Chap 2.
Kotelchuck, M. the adequacy of Prenatal Care Utilization Index: its US distribution and
association with low birthweight. Am J Public Health. 1994 Sep; 84 (9): 1486-1489. [PMC free article] [PubMed]
UNdata: infant mortality rate (per 1000 births). UNICEF, State of the World’s Children 2003 infant mortality table. United Health Foundation; America’s Health Rankings, Nevada Infant Mortality (2011),
http://www.americashealthrankings.org/NV//MR U.S. Department of Health and Human Services. Healthy People 2010, 2nd ed. With
Understanding and Improving Health and Objectives for Improving Health, 2 vols. Washington, DC: U.S Government Printing Office.
13
U. S. Department of Health and Human Services, Maternal and Child Health Bureau, A Healthy Start, Begin Before Baby’s Born Website, http://www.mncb.hrsa.gov/programs/womeninfants/prenatal.htm
National Collaboration Centre for Women’s and Children’s Health. (Oct. 2003),
Antenatal care: routine care for the healthy pregnant woman. Nevada State Health Division, Bureau of Health Planning and Statistics, 2005. Shi, L., Stevens, G. D., Wulu, J. T., Politzer, R. M., & Xu, J. (2004). America's Health
Centers: reducing racial and ethnic disparities in perinatal care and birth outcomes. Health Services Research, 39(6p1), 1891-1902.
Singh, G. K., & Yu, S. M. (1995). Infant mortality in the United States: Trends,
differentials, and projections, 1950 through 2010. American Journal of Public Health, 85(7), 957-964.
Mathews, T. J., & MacDorman, M.F., (2011) Infant mortality statistics from the 2007
period linked birth/infant death data set. Division of Vital Statistics, U.S. Department of Health and Human Services. Centers for Disease Control and Prevention, National Center for Health Statistics, National Vital Stastics System, Hyattsville, MD.
Mathews, T.J., et al Infant Mortality Statistics from 2007 Period Linked Birth/Infant
Death Data Set Division of Vital Statistics. National Vital Statistics Report, Vol 59, No 6, June 29, 2011. Available at http//www.cdc.gov/nchs/data/nvsr/59/nvsr59_06.pdf
MacDorman, M.F. & Mathews, T. J. (2009) The challenge of infant mortality: Have we
reached a plateau? Public Health Reports (1974-) , 124 (5), 670-681 . MacDorman, M.F. Declercq, E., Mathews, T. J. & Stotland, N. (2012) “Trends and
characteristics of home vaginal birth after cesarean delivery in the United States and selected states.” Obstetrics Gynecological, April 119(4)737-44. PMID 22433337 [Pub-Med – in process].
Rowland Hogue, C. J., & Vasquez, C. (2002). Toward a strategic approach for reducing
disparities in infant mortality. American Journal of Public Health, 92(4), 553-556.
Wakefield, M. A., Garner, D. L., Tyler, T., & Pehrsson, D. E. (2010). A Model for
Analyzing Critical Cultural Domains in Counselor Development. Vistas:
14
Community Resources Clark County Health District provides a variety of public health clinics throughout Clark County. Their main offices are located at 625 Shadow Lane, Las Vegas, NV. Te. 702 759-0708, http://www.cchd.org.
Women’s Resource Center provides education and counseling to pregnant women. 2915 W. Charleston Blvd., Las Vegas, NV, 89102. Tel. 702-366-1247, www.lvwomensctr.org.
Huntridge Teen Clinic provides family planning services. 2100 S. Maryland Pkwy #5, Las Vegas, NV. Tel. 702-732-8776.
North Las Vegas Family Health Center provides Family Medicine, Women’s Health, Pediatrics, D.O.T. Physicals, Occupational Health, STD/HIV Education, Family Planning, Periodic Screenings for Kids & Adults, Well-Child Care and Immunizations, Prenatal and Newborn Care, Chronic Illness Management, Health Education. 2031 McDaniel, Suite 210 , NLV, NV 89030. Tel. 702-214-5948, http://www.nvrhc.org/northlv.htm.
Martin L. King Family Health Center provides Family Medicine, Women’s Health, Pediatrics, D.O.T. Physicals, Occupational Health, STD/HIV Education & Screening, Family Planning, Periodic Screenings for Kids & Adults, Well-Child Care and Immunizations, Prenatal and Newborn Care, Chronic Illness Management, Health Education. 1700 Wheeler Peak, Las Vegas, NV, 89106. Tel. 702-383-1961, http://www.nvrhc.org/lasvegas.htm.
Cambridge Family Health Center provides Family Medicine, Women’s Health, Pediatrics, D.O.T. Physicals, Occupational Health, STD/HIV Education & Screening, Family Planning, Periodic Screenings for Kids & Adults, Well-Child Care and Immunizations, Prenatal and Newborn Care, Chronic Illness Management, Health Education. 3900 Cambridge Ave. #102, Las Vegas, NV 89109. Tel. 702-307-5415, http://www.nvrhc.org/cambridge.htm.
Prenatal Health Services
Baby Steps ( University Medical Center ) is a comprehensive program that provides health care for moms and their babies. Obstetricians, pediatricians, family practice doctors and certified nurse midwives are available to work with clients so both mother and baby get the care needed. 1120 Shadow Lane, Las Vegas, NV. Tel. 702-383-2229, http://www.umc-cares.org/med_serv/familyresource/babysteps.asp.
North Vista Hospital Pregnancy Center provides full obstetrical and infant care. 1409 E. Lake Mead Blvd, NLV, NV. Tel. 702-657-5510, www.northvistahospital.com.

15
Sunrise Pregnancy Center provides referrals to physicians and full obstetrical and infant care. 3101 S. Maryland Pkwy #315, Las Vegas, NV. Tel. 702-735-2229, www.sunrisehospital.com.
Saint Rose Dominican Hospital provides referrals to physicians and full obstetrical and infant care. 102 E. Lake Mead Dr., Henderson, NV. Tel. 702-616-4508, www.strosehospitals.org.
Babies are Beautiful is a program providing help to pregnant women who do not have health care coverage. Prenatal care, childbirth classes, referrals to community agencies and other services are provided. 700 Shadow Lane #455A, Las Vegas, NV. Tel. 702-671-8501, http://www.valleyhospital.net/p711.html.
University Women’s Center provides prenatal care services. 2231 W. Charleston Blvd., Las Vegas, NV. Tel. 702-383-2403.
Washoe Pregnancy Center provides obstetrical care to low-income pregnant women. 975 Ryland, Suite 105, Reno, NV. Tel. 775-982-5640.
Saint Mary’s Nell J. Redfield Center provides obstetrical care to low-income pregnant women. 3915 Neil Road, Reno. Tel. 775-623-5222.
HumboldtGeneralHospital, provides discounted services to low-income women. 118 E. Haskell St., Winnemucca, NV. Tel. 775-623-5222, http://www.hghospital.ws.
16
Appendices Appendix A
0
1
2
3
4
5
6
7
8
9
10
Rate
per
100
0 liv
e bi
rts
Infant Mortality 1991-2011

17
Appendix B KESSNER INDEX ADEQUACY OF PRENATAL CARE DEFINED IN TERMS OF TIMING AND QUANTITY OF PRENATAL VISITS, ADJUSTED FOR GESTATION LENGTH ______________________________________________________________________________ Adequacy of Number of Prenatal Care Gestation (Weeks) Prenatal Visits ______________________________________________________________________________ Adequate 13 or less and 1 or more or not stated 14-17 and 2 or more 18-21 and 3 or more 22-25 and 4 or more 26-29 and 5 or more 30-31 and 6 or more 32-33 and 7 or more 34-35 and 8 or more 36 or more and 9 or more Inadequate 14-21 and 0 or not stated 22-29 and 1 or less or not stated 30-31 and 2 or less or not stated 32-33 and 3 or less or not stated 34 or more and 4 or less or not stated Intermediate Combinations other than those specified above or those specified as having no care. No care Both number of prenatal visits and month care began indicate no prenatal care. ______________________________________________________________________________ a. In addition to the specific number of visits indicated for adequate care, the interval to the first prenatal visit had to be 13 weeks or less (first trimester). b. In addition to the specific number of visits indicated for inadequate care, all women who started their care during the third trimester (28 weeks or later) were considered to have received inadequate care. c. For this gestation group, care was considered inadequate if the time of the first visit was not stated. d. When month and year are specified but day is missing, impute 15 for day. Source: Institute of Medicine, National Academy of Sciences: Infant Deaths, An Analysis by Maternal Risk and Health Care. In: Contrasts in Health Status, Vol. I, 1973. Based on: The American College of Obstetricians and Gynecologists: Standards for Obstetric-Gynecologic Services. Chicago, 1974. Internal modifications have been made to differentiate those having "no care" from those having "inadequate" or "intermediate care."

18
Appendix C The Kotelchuck Index, also called the Adequacy of Prenatal Care Utilization (APNCU) Index, uses two crucial elements obtained from birth certificate data-when prenatal care began (initiation) and the number of prenatal visits from when prenatal care began until delivery (received services). The Kotelchuck index classifies the adequacy of initiation as follows:
• pregnancy months 1 and 2, • months 3 and 4, • months 5 and 6, • and months 7 to 9,
An underlying assumption of the Kotelchuck Index is that the earlier prenatal care begins the better. To classify the adequacy of received services, the number of prenatal visits is compared to the expected number of visits for the period between when care began and the delivery date. The expected number of visits is based on the American College of Obstetricians and Gynecologists prenatal care standards for uncomplicated pregnancies and is adjusted for the gestational age when care began and for the gestational age at delivery. A ratio of observed to expected visits is calculated and grouped into four categories:
1. Inadequate (received less than 50% of expected visits), 2. Intermediate (50%-79%), 3. Adequate (80%-109%), 4. Adequate Plus (110% or more).
The final Kotelchuck index measure combines these two dimensions into a single summary score. The profiles define adequate prenatal care as a score of 80% or greater on the Kotelchuck Index, or the sum of the Adequate and Adequate Plus categories. The Kotelchuck Index does not measure the quality of prenatal care. It also depends on the accuracy of the patient or health care provider's recall of the timing of the first visit and the number of subsequent visits. The Kotelchuck Index uses recommendations for low-risk pregnancies, and may not measure the adequacy of care for high-risk women. The Kotelchuck Index is preferable to other indices because it includes a category for women who receive more than the recommended amount of care (adequate plus, or intensive utilization).
19
Appendix D

20
Appendix E
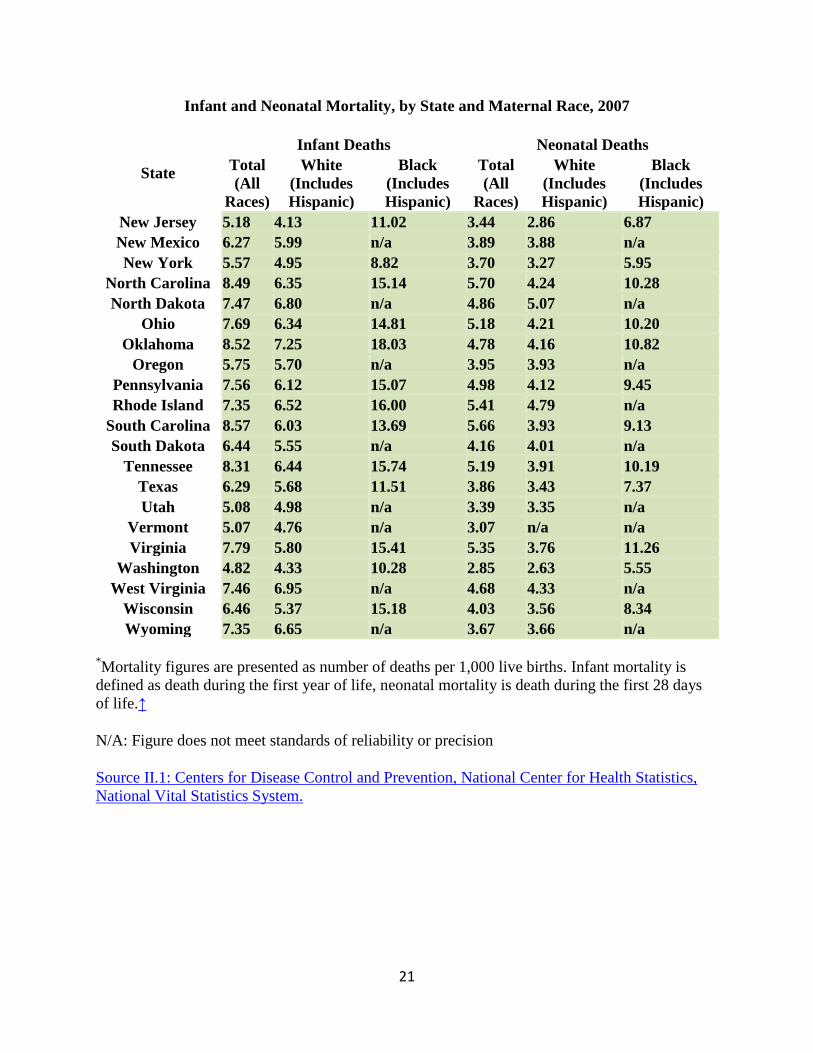
Infant and Neonatal Mortality, by State and Maternal Race, 2007
State
Infant Deaths Neonatal Deaths Total (All
Races)
White (Includes Hispanic)
Black (Includes Hispanic)
Total (All
Races)
White (Includes Hispanic)
Black (Includes Hispanic)
Alabama 9.89 7.98 14.35 6.27 4.90 9.5 Alaska 6.51 5.20 n/a 3.17 3.03 n/a Arizona 6.83 6.49 14.95 4.69 4.53 10.12
Arkansas 7.66 6.47 13.17 4.33 3.38 8.61 California 5.20 4.89 12.35 3.55 3.34 7.98 Colorado 6.12 5.85 13.16 4.17 4.01 8.19
Connecticut 6.63 5.90 12.07 5.06 4.46 9.41 Delaware 7.48 6.12 11.84 5.34 4.32 8.80 District of Columbia 13.09 8.52 16.61 9.70 5.87 12.60
Florida 7.05 5.52 12.21 4.42 3.53 7.47 Georgia 7.98 5.56 12.77 5.07 3.58 7.90 Hawaii 6.48 6.11 n/a 4.23 3.59 n/a Idaho 6.75 6.59 n/a 4.52 4.46 n/a Illinois 6.73 5.22 14.16 4.78 3.84 9.46 Indiana 7.58 6.61 15.99 4.79 4.13 10.40
Iowa 5.50 5.34 11.58 3.30 3.27 n/a Kansas 7.93 7.03 18.98 5.00 4.49 11.63
Kentucky 6.69 6.01 12.69 4.06 3.73 7.58 Louisiana 9.17 6.14 14.08 5.35 3.49 8.37
Maine 6.30 6.33 n/a 4.46 4.54 n/a Maryland 8.00 4.79 13.63 5.80 3.54 9.67
Massachusetts 4.93 4.54 8.76 3.42 3.11 6.12 Michigan 7.94 6.11 16.39 5.56 4.37 11.12 Minnesota 5.55 4.69 11.70 3.80 3.28 7.13 Mississippi 10.04 6.65 13.87 5.89 3.83 8.37 Missouri 7.48 5.89 16.48 4.99 3.77 11.69 Montana 6.35 5.94 n/a 3.62 3.49 n/a Nebraska 6.76 6.12 14.04 4.86 4.38 10.53 Nevada 6.36 6.03 12.35 4.03 3.81 8.15
New Hampshire 5.36 5.34 n/a 3.25 3.31 n/a
21
Infant and Neonatal Mortality, by State and Maternal Race, 2007
State
Infant Deaths Neonatal Deaths Total (All
Races)
White (Includes Hispanic)
Black (Includes Hispanic)
Total (All
Races)
White (Includes Hispanic)
Black (Includes Hispanic)
New Jersey 5.18 4.13 11.02 3.44 2.86 6.87 New Mexico 6.27 5.99 n/a 3.89 3.88 n/a New York 5.57 4.95 8.82 3.70 3.27 5.95
North Carolina 8.49 6.35 15.14 5.70 4.24 10.28 North Dakota 7.47 6.80 n/a 4.86 5.07 n/a
Ohio 7.69 6.34 14.81 5.18 4.21 10.20 Oklahoma 8.52 7.25 18.03 4.78 4.16 10.82
Oregon 5.75 5.70 n/a 3.95 3.93 n/a Pennsylvania 7.56 6.12 15.07 4.98 4.12 9.45 Rhode Island 7.35 6.52 16.00 5.41 4.79 n/a
South Carolina 8.57 6.03 13.69 5.66 3.93 9.13 South Dakota 6.44 5.55 n/a 4.16 4.01 n/a
Tennessee 8.31 6.44 15.74 5.19 3.91 10.19 Texas 6.29 5.68 11.51 3.86 3.43 7.37 Utah 5.08 4.98 n/a 3.39 3.35 n/a
Vermont 5.07 4.76 n/a 3.07 n/a n/a Virginia 7.79 5.80 15.41 5.35 3.76 11.26
Washington 4.82 4.33 10.28 2.85 2.63 5.55 West Virginia 7.46 6.95 n/a 4.68 4.33 n/a
Wisconsin 6.46 5.37 15.18 4.03 3.56 8.34 Wyoming 7.35 6.65 n/a 3.67 3.66 n/a
*Mortality figures are presented as number of deaths per 1,000 live births. Infant mortality is defined as death during the first year of life, neonatal mortality is death during the first 28 days of life.↑
N/A: Figure does not meet standards of reliability or precision
Source II.1: Centers for Disease Control and Prevention, National Center for Health Statistics, National Vital Statistics System.
22
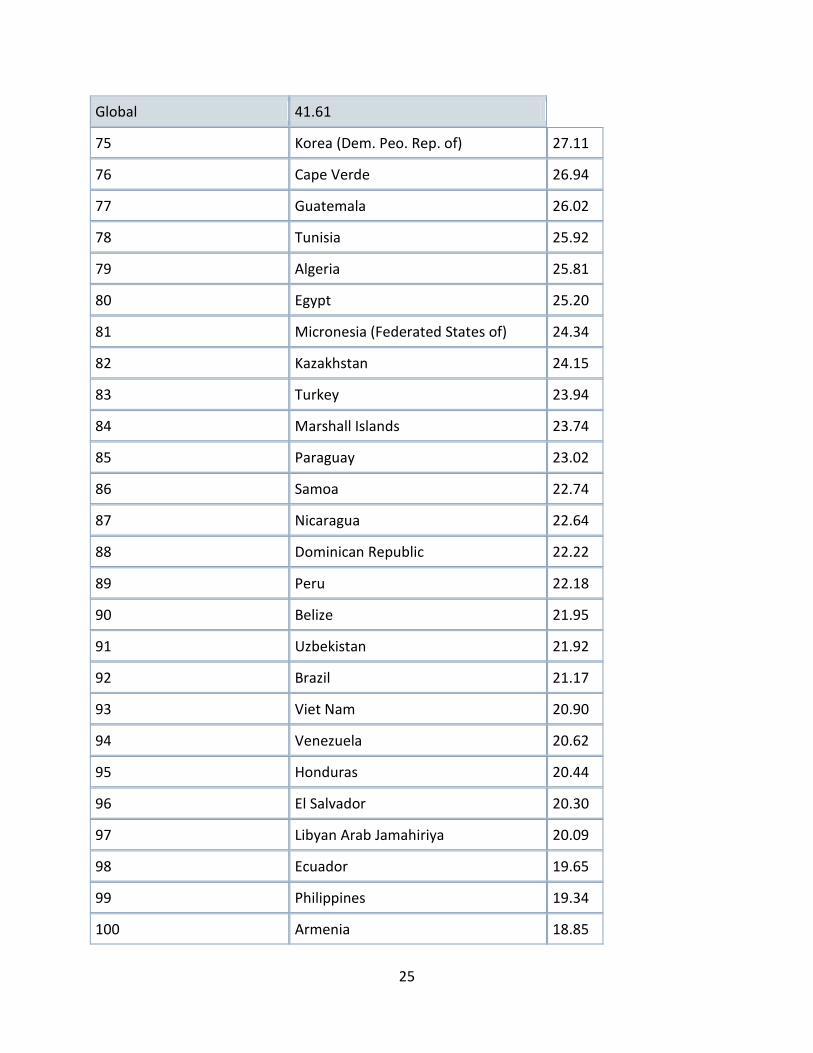
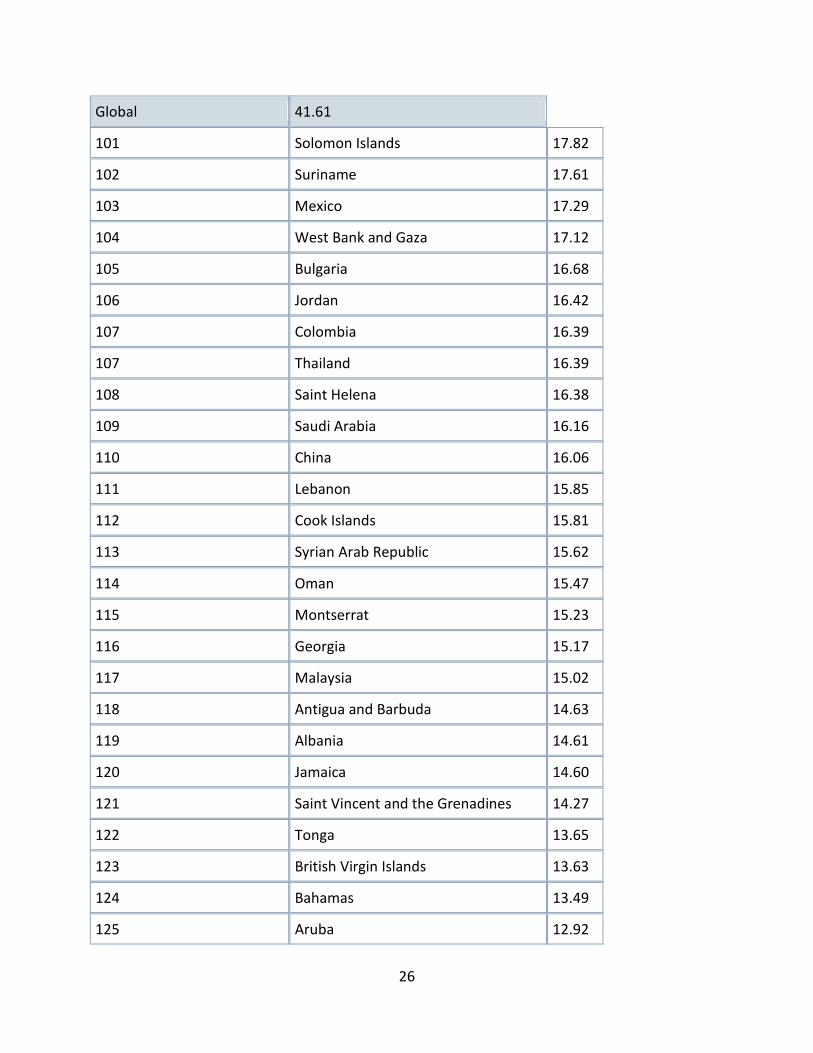
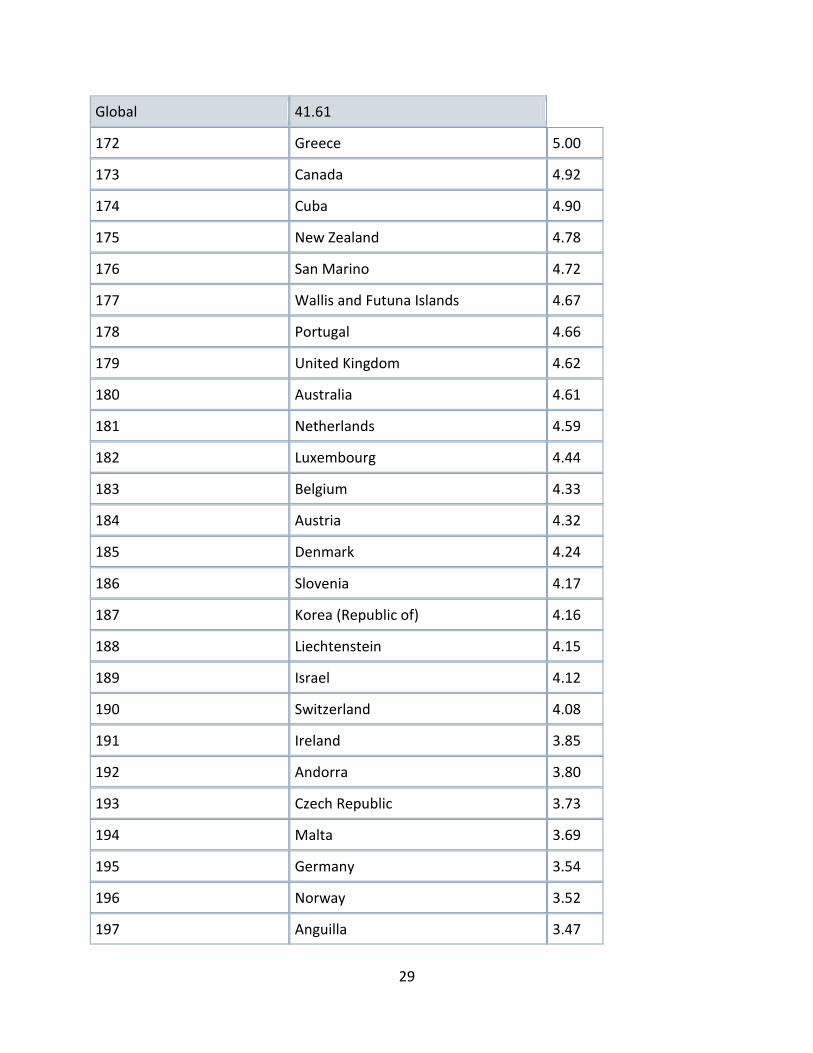
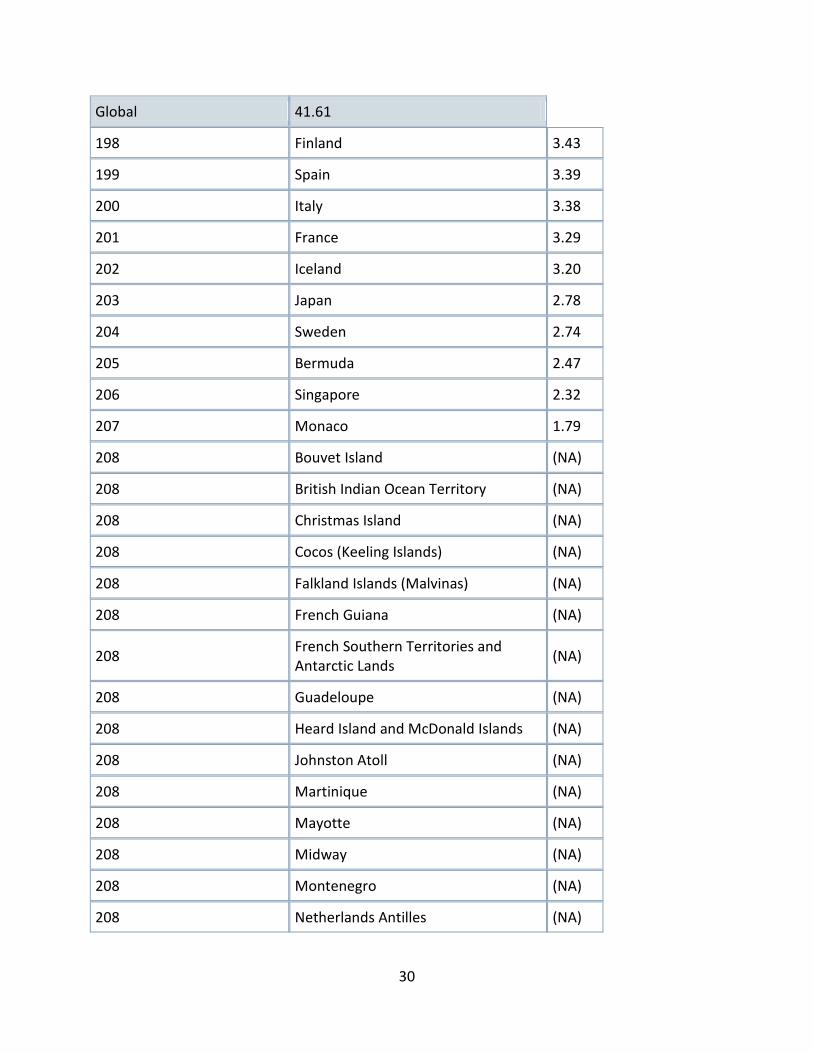
Appendix F Infant Mortality Rate (Total Deaths per 1,000 Live Births) 2011 Global 41.61
1 Angola 175.90
2 Afghanistan 149.20
3 Niger 112.22
4 Mali 111.35
5 Somalia 105.56
6 Central African Republic 99.38
7 Guinea-Bissau 96.23
8 Chad 95.31
9 Nigeria 91.54
10 Burkina Faso 81.40
11 Malawi 81.04
12 Mozambique 78.95
13 Congo (Dem. Republic of) 78.43
14 Sierra Leone 78.38
15 Equatorial Guinea 77.30
16 Ethiopia 77.12
17 Congo 76.05
18 Liberia 74.52
19 Gambia 71.67
20 Sudan 68.07
21 Tanzania (United Rep. of) 66.93
22 Zambia 66.60
23
Global 41.61
23 Cote d'Ivoire 64.78
24 Rwanda 64.04
25 Pakistan 63.26
26 Swaziland 63.09
27 Comoros 62.63
28 Uganda 62.47
29 Burundi 61.82
30 Benin 61.56
31 Guinea 61.03
32 Cameroon 60.91
33 Western Sahara 60.44
34 Mauritania 60.42
35 Lao People's Democratic Rep. 59.46
36 Senegal 56.42
37 Cambodia 55.49
38 Yemen 55.11
39 Lesotho 55.04
40 Djibouti 54.94
41 Haiti 54.02
42 Sao Tome and Principe 53.21
43 Kenya 52.29
44 Togo 51.48
45 Madagascar 51.45
46 Azerbaijan 51.08
47 Bangladesh 50.73
48 Gabon 49.95

24
Global 41.61
49 Myanmar 49.23
50 Ghana 48.55
51 India 47.57
52 Vanuatu 46.85
53 Namibia 45.59
54 Nepal 44.54
55 Bhutan 44.48
56 Papua New Guinea 43.29
57 South Africa 43.20
58 Turkmenistan 42.34
59 Iran (Islamic Republic of) 42.26
60 Bolivia 42.16
61 Iraq 41.68
62 Eritrea 41.33
63 Kiribati 38.89
64 Tajikistan 38.54
65 Timor Leste 38.01
66 Mongolia 37.26
67 Guyana 36.76
68 Tuvalu 34.52
69 Zimbabwe 29.50
70 Kyrgyzstan 29.27
71 Indonesia 27.95
72 Trinidad and Tobago 27.69
73 Morocco 27.53
74 Maldives 27.45
25
Global 41.61
75 Korea (Dem. Peo. Rep. of) 27.11
76 Cape Verde 26.94
77 Guatemala 26.02
78 Tunisia 25.92
79 Algeria 25.81
80 Egypt 25.20
81 Micronesia (Federated States of) 24.34
82 Kazakhstan 24.15
83 Turkey 23.94
84 Marshall Islands 23.74
85 Paraguay 23.02
86 Samoa 22.74
87 Nicaragua 22.64
88 Dominican Republic 22.22
89 Peru 22.18
90 Belize 21.95
91 Uzbekistan 21.92
92 Brazil 21.17
93 Viet Nam 20.90
94 Venezuela 20.62
95 Honduras 20.44
96 El Salvador 20.30
97 Libyan Arab Jamahiriya 20.09
98 Ecuador 19.65
99 Philippines 19.34
100 Armenia 18.85
26
Global 41.61
101 Solomon Islands 17.82
102 Suriname 17.61
103 Mexico 17.29
104 West Bank and Gaza 17.12
105 Bulgaria 16.68
106 Jordan 16.42
107 Colombia 16.39
107 Thailand 16.39
108 Saint Helena 16.38
109 Saudi Arabia 16.16
110 China 16.06
111 Lebanon 15.85
112 Cook Islands 15.81
113 Syrian Arab Republic 15.62
114 Oman 15.47
115 Montserrat 15.23
116 Georgia 15.17
117 Malaysia 15.02
118 Antigua and Barbuda 14.63
119 Albania 14.61
120 Jamaica 14.60
121 Saint Vincent and the Grenadines 14.27
122 Tonga 13.65
123 British Virgin Islands 13.63
124 Bahamas 13.49
125 Aruba 12.92

27
Global 41.61
126 Dominica 12.78
127 Saint Lucia 12.72
128 Moldova (Republic of) 12.43
128 Palau 12.43
129 Qatar 12.05
130 Turks and Caicos Island 11.97
131 United Arab Emirates 11.94
132 Barbados 11.86
133 Seychelles 11.66
134 Panama 11.64
135 Mauritius 11.52
136 Brunei Darussalam 11.51
137 Grenada 11.43
138 Botswana 11.14
139 Romania 11.02
140 Fiji 11.00
141 Argentina 10.81
142 Bahrain 10.43
143 Russian Federation 10.08
144 Greenland 10.05
145 Sri Lanka 9.70
146 Uruguay 9.69
147 American Samoa 9.66
147 Saint Kitts and Nevis 9.66
148 Costa Rica 9.45
149 Cyprus 9.38

28
Global 41.61
150 Bosnia and Herzegovina 8.67
151 Nauru 8.66
152 Macedonia (The former Yugoslav Republic of)
8.54
152 Ukraine 8.54
153 Latvia 8.42
154 Kuwait 8.07
154 Puerto Rico 8.07
155 Chile 7.34
156 French Polynesia 7.27
157 Virgin Islands (U.S.) 7.24
158 Estonia 7.06
159 Gibraltar 6.69
160 Cayman Islands 6.63
161 Slovakia 6.59
162 Poland 6.54
163 Serbia 6.52
164 Lithuania 6.27
165 Belarus 6.25
166 Croatia 6.16
167 Faeroe Islands 6.06
167 United States of America 6.06
168 Guam 5.83
169 Northern Mariana Islands 5.79
170 New Caledonia 5.71
171 Hungary 5.31
29
Global 41.61
172 Greece 5.00
173 Canada 4.92
174 Cuba 4.90
175 New Zealand 4.78
176 San Marino 4.72
177 Wallis and Futuna Islands 4.67
178 Portugal 4.66
179 United Kingdom 4.62
180 Australia 4.61
181 Netherlands 4.59
182 Luxembourg 4.44
183 Belgium 4.33
184 Austria 4.32
185 Denmark 4.24
186 Slovenia 4.17
187 Korea (Republic of) 4.16
188 Liechtenstein 4.15
189 Israel 4.12
190 Switzerland 4.08
191 Ireland 3.85
192 Andorra 3.80
193 Czech Republic 3.73
194 Malta 3.69
195 Germany 3.54
196 Norway 3.52
197 Anguilla 3.47
30
Global 41.61
198 Finland 3.43
199 Spain 3.39
200 Italy 3.38
201 France 3.29
202 Iceland 3.20
203 Japan 2.78
204 Sweden 2.74
205 Bermuda 2.47
206 Singapore 2.32
207 Monaco 1.79
208 Bouvet Island (NA)
208 British Indian Ocean Territory (NA)
208 Christmas Island (NA)
208 Cocos (Keeling Islands) (NA)
208 Falkland Islands (Malvinas) (NA)
208 French Guiana (NA)
208 French Southern Territories and Antarctic Lands
(NA)
208 Guadeloupe (NA)
208 Heard Island and McDonald Islands (NA)
208 Johnston Atoll (NA)
208 Martinique (NA)
208 Mayotte (NA)
208 Midway (NA)
208 Montenegro (NA)
208 Netherlands Antilles (NA)

31
Global 41.61
208 Niue (NA)
208 Norfolk Island (NA)
208 Pitcairn Island (NA)
208 Reunion (NA)
208 Svalbard and Jan Mayen Islands (NA)
208 Tokelau (NA)
208 Wake Island (NA)
Notes: A combined estimate is not available for West Bank and Gaza. West Bank's infant mortality rate is 14.92 deaths per 1,000 live births; Gaza's infant mortality rate is 17.12 deaths per 1,000 live births. Definitions: Infant Mortality Rate: The number of infant deaths in a given year divided by the number of live births in the same year. It is expressed per 1,000 live births. Infants are defined as less than one year of age. Sources: CIA, The World Factbook, available at: https://www.cia.gov/library/publications/the-world-factbook/.
Related Documents