An Analysis of Infant Mortality and Low Birth Weight Rates i,n Texas Applied Research Project submitted to the Department of Political Science Southwest Texas State University in partial fulfillment of the requirements for the degree Master of Public Administration spring 1994 Steven L. Ellers Faculty Approval: Patricia M. Shields, Ph.D. Naomi Robertson, Ph.D.

Welcome message from author
This document is posted to help you gain knowledge. Please leave a comment to let me know what you think about it! Share it to your friends and learn new things together.
Transcript
An Analysis of Infant Mortality and Low Birth Weight Rates i,n Texas
Applied Research Project submitted to the
Department of Political Science Southwest Texas State University
in partial fulfillment of the requirements f o r the degree
Master of Public Administration spring 1994
Steven L. Ellers
Faculty Approval:
Patricia M. Shields, Ph.D.
Naomi Robertson, Ph.D.

To Marc Aaron Dobbing--A brother I never g o t to know
Timothy Sean Ellers--A son whose p o t e n t i a l was thwarted at birth Maury Lindsay James--A grandchild, born healthy, with all
the promise life has to offer
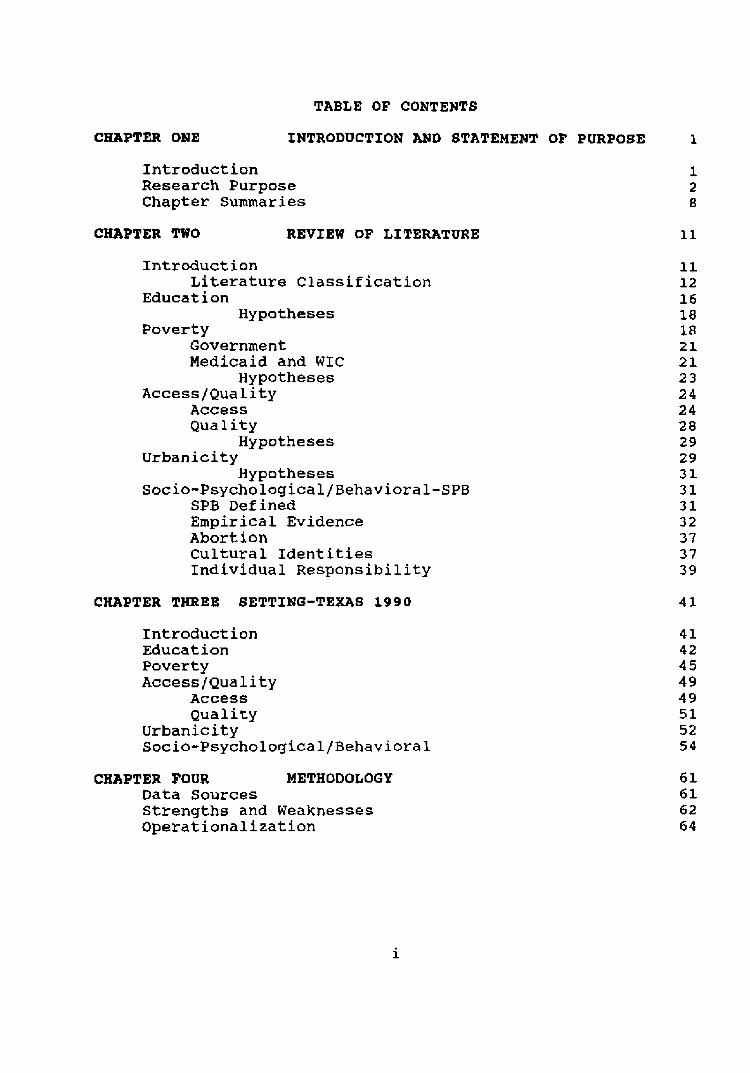
TABLE OF CONTENTS
CEAPTER ONE INTRODUCTION AND STATEMENT OF PURPOSE 1
Introduction Research Purpose Chapter Summaries
CHAPTER TWO REVIEW OF LITERATURE
Introduction Literature Classification
Education Hypotheses
Poverty Government Medicaid and WIC
Hypotheses Access/Quality
Access Qua 1 i t y
Hypotheses Urbanicity
Hypotheses socia-Psychological/~ehavi6ral-SPB
SPB ~efined Empirical Evidence Abortion C u l t u r a l I d e n t i t i e s Individual Responsibility
CHAPTER THREE SETTING-TEXAS 1990
Introduction Education Poverty Access/~uality
Access Quality
Urbanicity socia-Psychological/Behavioral
CEAPTER FOUR METHODOLOGY Data Sources Strengths and Weaknesses Operationalization
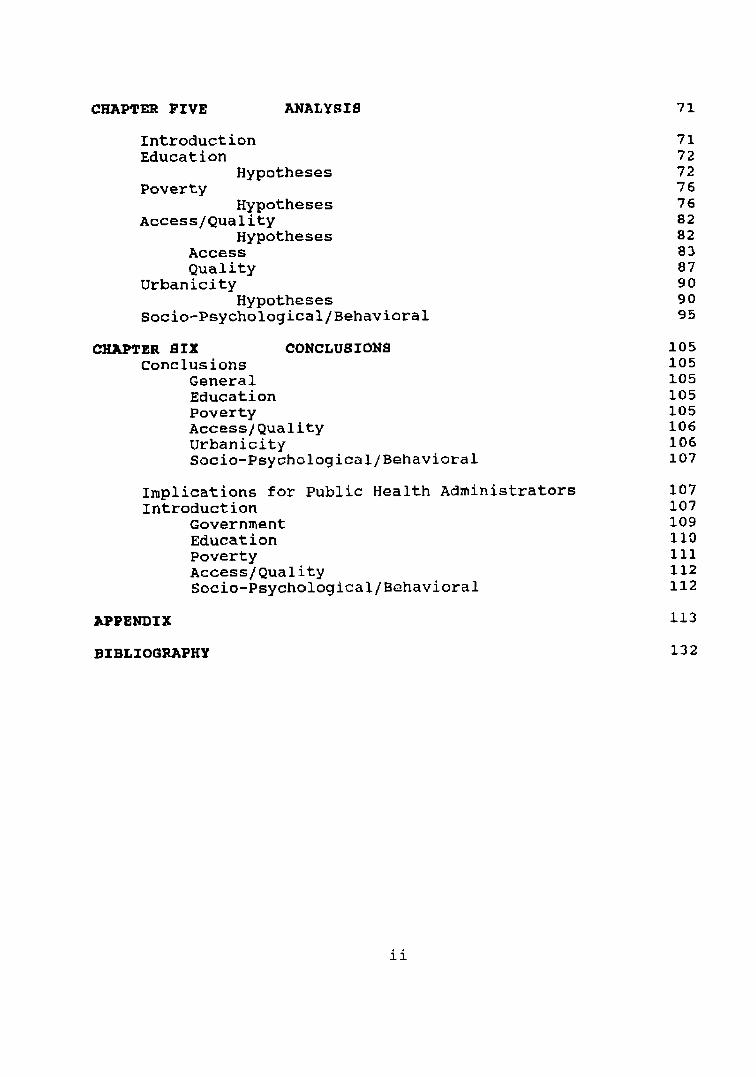
CRAPTER FIVE ANALYSIS
Introduction Education
Hypotheses Poverty
Hypotheses ~ccess/~uality
Hypotheses Access ~uality
Urbanicity Hypotheses
Socio-Psychological/~ehavioral
CHAPTER 8 I X CONCLUSIONS conclusions
General Education Poverty Access/Quality ~rbanicity Socio-Psychological/Behavioral
Implications for Public Heal th ~dministrators Introduction
Government Education Poverty Access/Quality Socio-Psychological/Behavioral
APPENDIX
BIBLIOGRAPHY
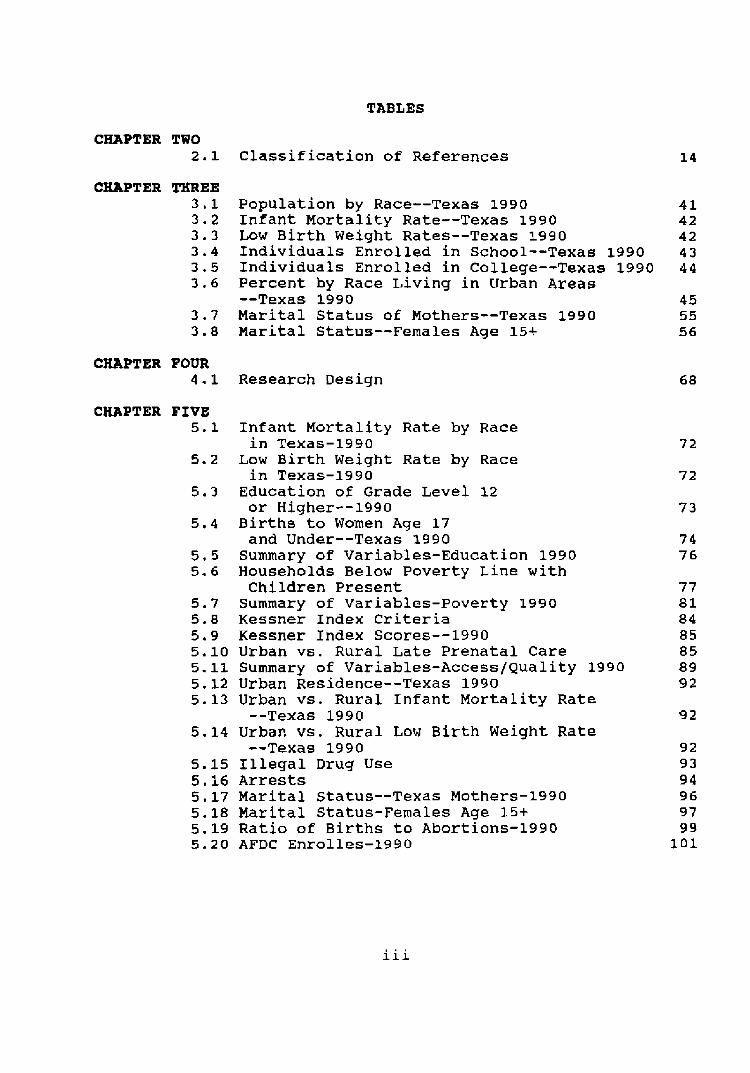
TABLES
CEAPTER TWO 2.1
CHAPTER THREE 3.1 3.2 3 . 3 3 . 4 3 - 5 3 . 6
CHAPTER FOUR 4.1
CHAPTER FIVE 5 . 1
Classification of References 1 4
Population by Race--Texas 1990 41 Infant Mortality Rate--Texas 1990 42 Low Birth Weight Rates--Texas 1990 4 2 Individuals Enrolled in School--Texas 1990 4 3 Individuals Enrolled in College--Texas 1990 4 4 P e r c e n t by Race ~ i v i n g in Urban Areas --Texas 1990 4 5 Marital Status of Mothers--Texas 1990 5 5 Marital Status--Females A g e 15+ 56
Research Design 68
Infant Mortality Rate by Race in Texas-1990
Low Birth Weight Rate by Race in Texas-1990
Education of Grade Level 12 or Higher--1990
Births to Women A g e 17 and Under--Texas 1990
Summary of Variables-Education 1990 Households Below Poverty L i n e w i t h Children Present
Summary of variables-poverty 1990 Kessner Index Cr i t e r i a Kessner Index Scores--1990 Urban vs. Rural Late P r e n a t a l Care Summary of Variables-Access/~uality 1990 Urban Residence--Texas 1990 Urban vs. Rural Infant Mortality Rate --Texas 1990
Urban vs. Rural Low B i r t h Weight Rate --Texas 1990
Illegal Drug Use Arrests Marital Status--Texas Mothers-1990 Marital Status-Females Age 15+ Ratio of Births to Abortions-1990 AFDC Enrolles-1990
iii
CHAPTER ONE
INTRODUCTION AND STATEMENT OF PURPOSE
Introauction
The death or unnecessary suffering of even one child is a
tragedy. Infant mortality [TM] is defined as t h e death of an
individual who is less t h a n one year old at the time of t h e i r
death (BVS 1991, 260). Low birth weight [LBW] is a b i r t h
weight of less than 2 5 0 0 grams or 5 pounds 8 ounces (BVS 1991,
261). Texas continues to experience higher than desired
i n f a n t mortality and low birth weight rates.
In 1990 the state of Texas suffered an infant mortality
rate per 1000 live births of 6 . 8 for whites, 7.3 for
Hispanics, but 14.6 for blacks . The low birth weight rate
[reported as a percent of total live births] fo r whites was
5 . 8 , Hispanics 6 . 3 , and for blacks 12.7. The Texas goal for
the i n f a n t mortality rate is 7 . 0 and the low birth weight rate
the goal is 5 . 0 (Texas Statewide Health Coordinating Council
1992, 3 9 - 4 0 ) . The white and Hispanic rates are f a i r l y close
to the stated goals, however, the black rate is most
disconcerting.
The most commonly recognized root causes f o r low birth
weight and infant mortality are; (1) education, (2) poverty,
and ( 3 ) access to and quality of care. There is no doubt
these factor affect the birth weight and infant mortality
rates. What is often mentioned as an explanation
for t h e problem of high i n f a n t mortality and low birth weight
rates, but n o t addressed in detail is, what t h i s study w i l l
call, the Socio-psycholoqical/behavioral [ S P B ] dimension.
Although not specifically identified as the SPB dimension, it
is referred to in many ways through out the literature. SPB
is sometimes identified as social conditions (Cooper 1992,
645 ) , socioeconomic status (Cramer 1987, 299) , behavior and
attitude (Eberstadt 1991, 36), and social-psychological (Reis
et al. 1992, 14). This Applied Research Project w a s initiated
to examine these root causes of i n f a n t mortality and low b i r t h
weight with emphasis on how they interact by race. While the
root causes interact between themselves, and other sub-factors
such as urbanicity, t h i s review investigates each separately
and then how they are manifested in Texas.
Research Purmse
The purpose of t h i s research is three fold. First, to
examine factors attributed to t h e incidence of infant
mortality and low birth weight rate. Second, investigate the
role of socio-psychological/behavior [SPB] as, possibly, a
significant factor in low birth weight and infant mortality
rates. This will be developed as an alternative/complimentary
explanation through careful review of t h e literature. Third,
to determine implications, if any, of these findings for
public health care administrators and public policy makers.
The s t a t e of Texas will be the focus of t h i s inquiry.
Infant mortality has long been considered an indicator of
t h e health status and welfare of a n a t i o n . The United States
rates poorly compared to other industrialized n a t i o n s when
infant mortality is considered. The United States has ranked
only as high as fifteenth in recent years in the number of
infant deaths per one thousand.
Low birth weight is the p r i n c i p a l cause of death in the
first weeks of a child's life. Howze identifies t h e
ramifications of not reducing t h e low b i r t h weight rate:
There are two types of low-birth-weight i n f a n t s : the t r u l y pre-term i n f a n t , the infant born before 4 0 weeks; and the small-for-gestational-aqe ( S G A ) , t h e infant born t o o small, a f u l l t e r m baby. Low-birth-weight i n f a n t s account for approximately two- thirds of all neonatal infant mortality deaths (deaths of i n f a n t s under 2 8 days per 100 live births) and constitute 50 percent of all deaths in the first year of life. If low-birth-weight babies survive, there is an increased likelihood that they will experience further hospitalizations and suffer developmental and physical complications. Numerous studies have associated low birth weight w i t h increased occurrences of mental retardation, learning disabilities, birth defects, blindness, autism, cerebral palsy, epilepsy, v i sua l and hearing disabilities, delayed speech, and chronic respiratory problems. Unfortunately, blacks are twice as likely as whites to have low birth weight infants and two and one-half times more likely than whites to have very low birth weight i n f a n t s * ' (1987, 121)
The number of deaths attributed to low birth weight have shown
little or no improvement in recent years. This phenomenon
remains one of the chief causes of i n f a n t mortality in the
U n i t e d States.
National and state efforts to prevent, or at l e a s t to
reduce, infant mortality and low birth weight rates have
focused on education, poverty, and t h e lack of access to and
the q u a l i t y of care. These factors have been at the center of
governmental programs designed to reduce both infant mortality
and low bir th weight rates since t h e 1960s. Billions of t a x
dollars--federal, a t a t e and local--are spent each year in an
effort to mitigate these factors where maternal and child
hea l th care is concerned. Recently, t h e Public Health Service
identified a need for health care providers to consider, what
t h i s study identifies as the socio-psychological/behavioral
(SPB] factor in their health care delivery.
This study will attempt to identify and analyze each of
the traditional factors [education, poverty, and
access/qualityl associated with infant mortality and low birth
weight rates. Because it is an influential component,
urbanicity w i l l be examined. In addition, it will develop t h e
arguments supporting the roll of SPB, as another explanation.
Finally, it will attempt to demonstrate their combined effect
on infant mortality and low birth weight rates for the year
1990 in Texas.
More specifically, during 1990 there w a s a distinct
disparity along racial--white, b l a c k and Hispanic--lines.
Blacks suffered a significantly h i g h e r incidence of low birth
weight and infant mortality rates in 1990. At the conclusion
of this research, weaknesses of the t r a d i t i o n a l explanations
will be revealed. F u r t h e r , t h e effect of SPB and its
relationship to t h e other associated factors i n Texas will be
better understood. Finally, any insights gained by t h i s study
may offer strategies for public health administrators and
public policy makers to ameliorate the effects of SPB. The
more effective the delivery of maternal and child health care,
the better the measures of infant h e a l t h will become. The
lower t h e infant mortality rate and proportion of low birth
weight, the more effect ive the distribution of t a x dollars for
maternal and child health care.
This study inves t iga tes the role of SPB in the racial
disparity in infant mortality and low birth weight rates. The
SPB role is be demonstrated by showing that explanations
believed to be related to infant mortality and low birth
weight rates are not verified across when race is controlled.
This study does n o t refute the importance of education,
poverty, or access to and quality of care and t h e i r affect on
infant mortality and low birth weight. These effects are well
documented in all the research. Previous studies p r e s e n t , in
an obscure way, the SPB effect.
SPB is often referred to as s o c i a l , socioeconomic,
psychological, behavioral, or attitudinal influences on infant
mortality and low birth weight rates. If t h e role of SPB is
significant, the disparate infant mortality and low birth
weight rates for blacks , compared to rates for whites or
Hispanics, in Texas may be more the result of SPB than the
effects of other factors. By controlling for the education,
poverty, acceas/quality, and u r b a n i c i t y f ac to r s across racial
lines, the significance of SPB might be demonstrated--or at
l eas t indicated. Perhaps because SP8 may be difficult to
quantify, it is not well addressed i n literature on the topics
of low birth weight and infant mortality. Researchers have
been content , until recent ly , to direct their a t t e n t i o n s more
to the effects of education, poverty and access/quality.
Research for this project indicates t h a t there are
basically two schools of t h o u g h t on the factors and t h e i r
effects as they relate to infant mortality and low birth
weight rates. The two groups are categorized, f o r the purpose
of t h i s study, as (1) academicians and, (2) policy centered
investigators. Academicians are economists, demographers, and
public health scholars. Their ana lyses are centered in the
methods common to "hard" scientific research. They use
regression analysis, s t a t i s t i c a l models, an other such
manipulations of data to study questions relating to those
addressed in this research. The policy centered investigators
are sociologists, political scientists based in public
affa irs , and other policy analysts of vary ing backgrounds.
These two groups posit different theories which examine t h e
influence of education, poverty, access/quality, and other
factors on infant mortality and low b i r t h weight rates.
The policy centered investigators maintain that lowering
i n f a n t mortality and low birth w e i g h t rates is a function of
equalizing the effects of education, poverty, and
access/quality for pregnant women. They tend to dismiss the
possibility that other factors may be as significant as those
previously mentioned. They rely on content and social
artifact analysis, usually using percentages, to substantiate
their position. These analysts are practitioners of what
Babbie refers to as reductionism (1989, 8 7 ) . Their inquiry is
constricted by their training. Further, their focus is in
bringing minority, principally black, rates to those
experienced by w h i t e s th rough the process of equalizing the
factors listed above.
The academicians, on the other hand, attempt to quantify
the effects of education, poverty, and accesslquality, as well
as other factors on infant mortality and l o w birth weights.
They rely an more sophisticated data a n a l y s i s such as
regression, statistical modeling, or heavily scrutinized
survey and soc ia l artifact data to address t h e i r research
questions. They are more amenable to the possibility that
there are other factors just as important as education,
poverty, and access/quality.
This study will examine along racial lines each of the
accepted factors, identified above, related to infant
mortality and low birth weight rates. The racial descriptors
to be used are black, is panic and white. These descriptors
are used throughout the literature reviewed and are the major
statistical identifiers used by the state of Texas in its
data.
A s they relate to i n f a n t mortality and low birth weight
rates, the factors--education, poverty, access/quality, and
urbanicity--will be analyzed separately to determine if there
exists a disparity between races.
T h e literature reviewed was selected based on relevance to
birth rates, i n f a n t mortality, and prenatal care. Prenatal
care was researched because it is most directly affected by
the root causes discussed above and has a significant ef fect
on infant mortality and low birth weight (Eberstein et al.
1990, 4 1 9 ) . If, by controlling for each f a c t o r , disparity is
indicated along racial lines, t h e adequacy of the traditional
explanation is suspect and an alternative explanation may be
implied. If disparity is not indicated along racial lines,
when controlling independently far each factor, evidence
supporting the traditional explanation is validated. For
example, if analysis reveals the percentage of black and
Hispanic women who have at l e a s t a high school education is
relatively the same, t h e traditional argument that education
disproportionally affects LBW and IM r a t e s across racial lines
is invalid and an a l t e r n a t i v e explanation may be explored.
Chapter Summaries
Chapter Two of the Applied Research Project reviews
previous research conducted on the topics of infant mortality
and low birth weight. The review focuses on t h e most commonly
recognized root causes of infant mortality and low birth
weight which are; (1) education, (2) poverty , and ( 3 ) access
to and quality of care. A sub-category, urbanicity, will a l s o

be scrutinized for i ts ' effect on infant mortality and low
birth weight. Fur ther , t h e literature indicates a new, or at
least under s tudied factor identified in this research as the
socio-psycholoqical/behavioral dimension.
The literature indicates a clear delineation between two
schools of thought, discussed earlier, categorized as; (1)
academicians and, (2) policy centered investigators. Each
factor, education, poverty, access/quality, and
socio-psychological behavioral, will be reviewed through the
point of view expressed by these t w o schools of thought.
The setting chapter will outline t h e infant mortality and
low b i r t h weight rate experience of the state of Texas for the
year 1990. Pertinent statistical information, by subtopic ,
will be introduced and discussed. The statistical information
will be further subdivided and presented along r a c i a l lines so
that perspectives addressed i n the literature w i l l be
clarified for t h e s t a t e of Texas.
The methodology used in this study is presented in Chapter
Four. This study will have elements of descriptive,
explanatory, and exploratory research. T h e data used will be
presented, usually, as analysis of existing data by
percentages. Additionally, strengths and weaknesses of the
research design will be presented. Conclusions which can be
drawn from the findings of this research will be presented
along with any implications for both public health care
administrators and public policy making entities in t h e f i n a l

chapter of t h i s paper.
CHAPTER TWO
REVIEW OF THE LITERATURE
Introduction
The most commonly recognized root causes involved in low
birth weight rate and infant mortality are; (1) education, ( 2 )
poverty (income, economics) and, ( 3 ) access to and quality of
care. Where a woman lives through out her pregnancy is a
consistent, y e t minor, component of all t h e fac tors listed
above. As such, it will be explored in this review of the
literature. There is no doubt the root causes af fec t low
birth weight and i n f a n t mortality rates. What is o f t e n
mentioned, but not addressed in detail, is the
Socio-psychological/behavioral [ S P B ] dimension. In fact, the
SPB dimension is referred to in many ways through out the
literature, It is sometimes identified as social conditions
(Cooper 1992, 6 4 5 ) , socioeconomic status (Cramer 1987, 299),
behavior and attitude (Eberstadt 1991, 3 6 ) , and
social-psychological (Reis et al. 1992, 1 4 ) .
his literature review examines t h e s e root causes of
infant mortality and l o w b i r t h weight with emphasis on how
they interact by race. While the root causes i n t e r a c t between
themselves, and other sub-factors such as urbanicity, this
review looks at each separately. The literature selected for
this project was based on relevance to birth rates, infant
mortality, and prenatal care. Prenatal care is re l evant

because it is most directly affected by the root causes
discussed above and has a significant effect on infant
mortality and low birth weight (Eberstein 1990, 419).
Literature Classification
Research indicates there are basically two schools of
thought on the factors and their effects as they relate to
infant mortality and low birth weight rates. The two groups
are categorized, for the purpose of this study, as (1)
academicians and, (2) policy centered investigators (See Table
2.1). Academicians are primarily economists, demographers,
and public health scholars/practitioners. Their analyses are
centered in methodologies common to '*hardt1 scientific
research. They use regression a n a l y s i s , statistical models,
and other such manipulations of data to study questions
relating to those addressed in t h i s research. The policy
centered investigators are sociologists, political scientists
based in public affairs, and other policy a n a l y s t s of varying
backgrounds. There are differences between these two groups
on the effect of education, poverty, access/quality, and other
factors associated with infant mortality and low birth weight
rates.
The policy centered investigators look upon lowering
infant mortality and low b i r t h weight rates as a function of
equalizing t h e effects of education, poverty, and
access/quality f o r pregnant women. They tend to dismiss the
possibility that other factors may be as significant as those
mentioned. They r e l y on content and s o c i a l artifacts
analysis, usually using percentages, to substantiate their
position. These analysts are practitioners of what Babbie
refers to as reductionism (1989, 8 7 ) . Their inquiry is
constricted by the ir t r a i n i n g . Fur ther , their f o c u s is in
bringing minority, principally black, infant mortality and low
birth weight rates to r a t i o s experienced by whites through the
process of equalizing the f a c t o r s , for minorities, being
examined in this study.
Academicians, on the other hand, a t tempt to quantify t h e
effects of education, poverty, and access/quality, as well as
other factors on infant mortality and low birth weights. They
rely on more sophisticated data analysis such as regression,
statistical modeling, or heavily scrutinized survey and social
artifact data to address t h e i r research questions. They are
more amenable to the possibility that t h e r e are other
explanatory factors just as important as educat ion, poverty,
and access/quality. The academicians a r e primarily
demographers and health service professionals. The policy
centered investigators are based in political science,
sociology, or policy analysts of varying backgrounds. Each
view is reported in this presentation.

Table 2.1
Classification of References
Author Category Topic Methodology
Lirdtrt Bwrrcher 8 Yard
Aeademi c i an Academician
Pover ty Poverty, PNC
Various Methds l o g i s t i c regress ion Log- t inear regress ion Log-Linear regress ion Mul i tnomiat l o g i t regress ion S t a t i s t i c a l model ing
Academician 1M r a c i a l t rends
Acedemician
Academician
Academician
In social f a c t o r s
Eberstein, Nam, a d Humpr Joyce & Grossman
I M causal i ty
PNC
Kahler e t e l . Academician PWC, poverty 8 b i r t h outcanes Educat i onai concepts PNC, b i r t h DUt CaTLeS
JH pa t te rns
Mu1 t i v a r i a t e ana lys i s
M / A L i v i n g a d & Yoodhouse Nassipour & Jensen *Panpel & P i l l a i
Academician
Academician
Academician
Mul t ip le regress ion Mul t ip le regression H u t t i p l e regress ion Chi square Mu1 t i p l e regress ion
Poldenak JM r a c i a l patterns Black at t i tudes I n t e r n a t i o n a l IH corrparison
Reis e t e l . Santerre Grubaugh 8 st01 l a r Schoewbrf e t a l .
Academician Academician
Academician
Academician
IH and education S t r a t i f i e d u n i v a r i a t e ana lys i s
Ethn ic In - t - t e s t , p-value *Weeks and R u b u t
B u t l e r Howze Jeiuks Hoyni han Ueiner 8 Engel The M i t e House Doraestic P o l i c y C o w i l Y i l s o n
P o l i c y P o l i c y Poi i cy Pol i c y P o l i c y Pal icy
Race/econmi cs IH ra tes Poverty, Policy Pover ty Poverty, access Access, hea l th pol i c y
NONE NONE HONE HONE NONE N/ A
Pol i c y
Pol icy
Poverty, access, NONE educat i on Poverty, access, NONE educat ion
Cooper
Continued on Next Page
Table 2.1 continued
14

Author Category Topic Methodology
Eberstsdt P o l i c y
Hale Po l icy Longest Policy **Schltsinger & Pol icy Kranebusch
Poverty, access NONE vs. other nations IM ~ o l i c y NONE Heelth policy WONE PHC results Various m t h d s
MOTE: 1. Govermnta l and quasi-goverrmental references used in th is study are not inctuded in this table.
2. I n the Methodology eolum, IINONE" indicates that no methodology i s attecnptd by the author(s). They do support their posi t im through the use o f various public domain information with rro additional analysis.
I M = Infant Morta l i ty PNC = Prenatal Care
* Author(s1 i s a socio logist by t ra ining and an exception. ** Author(s) i s an economist by t ra ining and an exception.
Education
Educational attainment has long been considered a
meaningful contributing factor in birth outcomes (Eberstadt
1991, 3 7 ) . The education level of mothers is a significant
factor in explaining low birth weight and i n f a n t mortality,
particularly for women w i t h a high school or less education.
The higher the educational level of women, t h e more inclined
they will be to adopt life s t y l e s t h a t are supportive of a
higher probability of desired p r e n a t a l care practices and
birth outcomes (Pampel and Pillai 1986, 5 2 6 ) .
Mothers who do not have a high school education are more
likely to have fewer prenatal visits (Eberstadt 1991, 4 0 ) or
adequate prenatal care {Weiner and Engel 1991, 4 ) . This is
true even f o r women receiving Medicaid, where c o s t s to t h e
individual are not a consideration (Nassipour and Jensen 1992,
41). This fact is significant because it is o f t e n believed
that uneducated women can't afford prenatal care, eliminating
education as a factor, and therefore do n o t seek t h e service
(Pampel and P i l l a i 1986, 5 2 7 ) . These s t u d i e s show that
education and not income is a crucial determinant of healthy
births.
For black and w h i t e mothers over age twenty, t h e i n f a n t
mortality rates fo r unmarried b u t college-educated women was
greater than for married high school graduates or dropouts
(Eberstadt 1991, 37). Although education is impor t an t , it
does not account for differences by race. For example,

Schoendorf et al. found in their study of parents who were
white and black college graduates that the infants of black
college educated parents were more likely to be low birth
weight infants (1992, 1523). Also, they noted that normal
birth weight infants born to both black and white college
educated parents were equally likely to survive their first
year of life (1992, 1525) . The Weeks and Rumbaut study of recent immigrants, from
third world countries, to the United States indicates the
effect of education is not as great as some would think (1991,
329). These immigrant mothers who had little to no formal
education enjoyed a much better infant mortality rate than
blacks and was comparable to whites and Hispanics; yet t h e s e
recent immigrants experienced education levels which were much
lower than blacks, whites, or isp panics in the same area being
studied (Weeks and Rumbaut 1991, 330). The study was limited
by data available from vital statistics records, but the
authors speculated that one factor contributing to the study
groups' results was a positive cultural attitude toward
pregnancy and children (Weeks and Rumbaut 1991, 333). The
Weeks and Rumbaut study confirmed other previous studies
(1991, 327).
While education is a contributing factor in the incidence
of low birth weight and infant mortality, this literature
review indicates the effect is n o t uniform. This study will
examine education using the following hypotheses:
H: 1.1 If education is controlled, t h e infant morta l i ty rate w i l l be similar by race.
H: 1.2 If education is controlled, t h e low birth weight rate will be similar by race.
Some researchers tend to concentrate their attention on
the poverty aspect of t h e infant mortality and low birth
weight problem. The next section examines literature which is
focused on the effects of poverty on i n f a n t mortality and low
birth weight rates.
Poverty
Poverty is referred to in the literature in many different
ways. The official poverty rate was formulated by t h e Soc ia l
Security Administration in 1964. It was derived by
calculating the cheapest cost of feeding a family f o r one
year. There have been modifications, principally t h e
inclusion of an adjustment for i n f l a t i o n , over the years, b u t
they have been few and far between (Wilson 1987, 170).
Others feel t h e poverty rate is an i n d e x measuring wealth
(Eberstadt 1991, 3 3 ) . The rate is expressed by income in a
given year. In 1990, the poverty level for a family of three
was $10,560; the federally mandated level of 133 percent of
the poverty level f o r receiving assistance, raised the income
ceiling to $ 1 4 , 0 4 5 (Children's Defense Fund 1992, 11).
18
Policy makers routinely accept poverty as t h e c h i e f
explanation for infant mortality. They theorize that infant
mortality is a result of the proportion of children in poverty
(Eberstadt 1991, 32). While some d i s c u s s poverty as income,
others speak of it in terms of economics.
In the 1978 book, Fertilitv and Scarcity in America,
economist Peter ~indert concluded:
There seems to be good reason for believing that extra fertility affects the s i z e a n d quality of the labor force in ways that raise income inequities. Fertility, like immigration, seems to reduce the average quality of the labor force, by reducing the amounts of family and public school resources devoted to each child. The r e t a r d a t i o n in the historic improvement in the labor force quality has in turn held back the rise in incomes of the unskilled relative to those enjoyed by skilled labor and wealth holders. These connections have been revealed by comparison of t r ends in ~merican income i n e q u i t y with t rends in fertility, immigration, and the growth in the s i z e and quality of the labor force. ( 2 5 8 )
Lindert seems to be suggesting that fertility is
directly relative to the disposable incomes of families which
lowers the quality of educational and public resources
available to counterac t poverty. The pover ty status of
individuals causes t h e i r skill level to remain
low and therefore their incomes a l s o remain low. As t h e
fertility rate is a product of poverty, it follows that, as
the poverty sta tus increases so does t h e fertility rate. The
vicious cycle continues. Lindert's findings could contribute
to explaining the irregular status of t h e U.S. compared to
other industrialized nations where it is commonly accepted
that the standard economic and demographic factors explain
infant mortality (Santerre et al. 1991, 10).
The decline of in fant mortality by developed nations is
normally seen as a result of higher s tandards of living,
urbanization, and better medical care resulting from economic
development. The modernization of t h e role of women and their
birthing practices have a l s o had an effect on t h e decline in
infant mortality. Research i n d i c a t e s (1) women are having
fewer children, (2) women having children are somewhat older
when giving birth, and (3) they are better educated. These
changes have lowered the probability of infant death. In the
U.S. where the economy and demographic changes exceed the
decline in infant mortality, t h e accepted explanations may not
be accurate (Pampel and P i l l a i 1986, 5 2 5 ) . According to
Pampel and Pillai, "No study tests explanations of patterns of
i n f a n t mortality among developed nations, leaving a major gap
in the empirical literature on mortality ( 5 2 6 ) . "
The economic growth of a n a t i o n t e n d s to lower i n f a n t
mortality, but there is no evidence that inequity in income or
diversity combines to raise mortality (Pampel and ~ i l l a i 1986,
5 3 5 ) . Yet, neonatal mortality is effected t h e most by changes
in gross national product, while urbanization positively
affects the survival rate of infants between their, post
neonatal, first month and one year of age (Pampel and ~ i l l a i
1986, 531-5321, Similar conclusions were reported by
Santerre, et al. (1991, 10-11). The economic growth of
nations are heavily in f luenced by governments .
Government
Governments have been and remain heavily involved in t h e
economic condition and health status of their nation. This
involvement, as indicated above, has an effect on infant
mortality and low birth weight. The government of the United
States, and each state individually, recognizes their role and
has over the years devised programs to ameliorate t h e s e
problems. The next step i n this review is to look at programs
available to mothers and their children in the United States.
The programs offered revolve, primarily, around the poverty,
or income, status of the m o t h e r . Conversely, Eberstadt found
that t h e states with the lowest infant mortality r a t e s
suffered from the lowest per capita incomes (1990, 10).
Maternal and child-care services a r e distributed among
fourteen programs in the federal government (Hale 1990, 2 4 ) .
Those most affecting infant mortality and low birth weight
rates are Medicaid--which funds prenatal, birth and
maternal-infant care--and the Women, Infants and Children
[ W I C ] nutrition program. Federal law requires that states
offer ~edicaid to single, poor mothers and their children.
Medicaid and WIC
~ e d i c a i d is t h e chief h e a l t h financing program f o r the low
income female and child population of the United States.
Nationally, Medicaid funding accounts for about n i n e percent
of the women ages 15 to 4 4 ( Hale 1990, 22). The eligibility
criteria for Medicaid has been historically the province of
the individual states. National s tandards of care and s t a t e
reporting requirements were eliminated by Congress in the
1980s. The eligibility requirements are a l s o at t he
discretion of the providers receiving their grants (Hale 1990,
21). What has been the result of these programs?
The National Center for Health Statistics found in a 1982
study t h a t the income line should be set at one hundred and
fifty percent in order to see no change in the incidence of
low birth weight (Eberstadt 1991, 3 6 ) . In an Institute of
Medicine study, the researchers e s t i m a t e d that f o r every one
dollar spent to improve prenatal care for persons eligible f o r
Medicaid, t h e r e would be a savings of over three dollars in
the infants first year of l i f e . This would be realized by
reducing the number of low birth weight babies born (Weiner
and Engel 1991, 4 ) .
One way to reduce the number of low birth weight babies is
to increase the number of prenatal care visits made by the
mother (Nassipour and Jensen 1992, 36, 40). Yet, Medicaid
recipients t e n d to be young, unmarried and less educated,
therefore, they report late f o r prenatal care (Nassipour and
Jensen 1992, 41). The r e s u l t of r e p o r t i n g l a t e was that t h e
Medicaid funded mothers tended to have more pregnancy
complications a as sip our and Jensen 1992, 16).
Women who were p a r t i c i p a n t s in a WIC program were more
likely to seek prenatal care (Kahler 1992, 6 2 ) . Where a WIC
center was located near a black population, t h e women were
more likely to seek care in a timely manner. The effects of
WTC and Medicaid a r e readily apparent when information abou t
those women who do not, or can not utilize these services is
considered. Women, regardless of race, living at or above t h e
poverty line initiated care later than women in the poorer
areas. Unmarried white women-again living at or above the
poverty line-began care later than ei ther married women and
blacks regardless of marital status (Joyce and Grossman 1990,
12). Conversely, in 1986, white women reporting no p rena t a l
care experienced an infant mortality rate three and one half
times the national average; blacks, reporting no prenatal
care, in that same period suffered at three times the n a t i o n a l
average (Eberstadt 1991, 39). The effects of prenatal care
outlined above are o n l y as good as t h e quality of and access
to it.
Poverty aspects of infant mortality and low birth weight
are many and the literature reviewed for this study indicates
various effects . This study will explore the topic using t h e
following hypotheses:
H: 2.1 If poverty is controlled, the i n f a n t mortality rate will be similar by race.
H:2.2 If poverty is controlled, the low b i r t h w e i g h t r a t e will he similar by race.
The next area of literature to be reviewed will be access
/quality aspect of i n f a n t mortality and low birth weight.
Aecess/Quality
Access to prenatal and infant care involves many factors.
Those most commonly mentioned are funding, adequate numbers of
health care providers and facilities, and discriminatory or
racial barriers (Longest 1988, 421). Quality is closely
linked to access. Simply stated, quality is t h e degree of
adherence to pre-established criteria or standards. The
government and the health care industry have established t h e
qualification standards for medical care delivery, t h e
facilities, equipment, and staff qualifications (Shortell et
al. 1988, 4 3 9 ) . The discussion in the previous section
indicated the significance of care on infant mortality and low
bir th weight r e s u l t s . If care is n o t accessible or the
quality is suspect, t h e birth outcome will be affected.
There are those who maintain that to have access in care
for pregnant women many things are necessary. Most vocal
among these groups is the Children's Defense Fund [ C D F ] . The
CDF believes that to assure access in care to pregnant women
the pregnant woman should:
a. be afforded specialized care if they are identified as a h i g h risk pregnancy.
b. no t have to w a i t f o r more than one hour before b e i n g seen in a doctors office or clinic.
c. n o t have to wait for appointments. This means t h a t having an appointment f o r more t h a n two weeks from the date requested is not acceptable.
d . have adequate services available in convenient locations.
e . have child care facilities available at t h e clinics or doctors office.
f. have assistance w i t h transportation needs to be able to get to the care.
g. have c l i n i c hours in t h e evening and on week-ends.
h. Where necessary, have a bilingual staff.
i. have clinic s t a f f who are professional and treat p a t i e n t s with d i g n i t y (Children's Defense Fund 1992, 7 ) .
The Longest study reported that the availability of
medical personnel and their charges h a s little effect on the
accessibility of prenatal care (1988, 422). Availability
simply means there are adequate medical personnel to provide
prenatal care services. Y e t it is o f t e n viewed in the context
of being able to afford care (Jones and Rice 1987, 7). This
misconception of availability is negated because rates charged
by medical professionals and the funding sources to pay these
charges is of little consequence when seek ing prenatal care
(Schlesinger and Kronebusch 1990, 102). his finding is
supported by Kessner score information.
Kessner index scores a r e a comparative measure of the
adequacy of prenatal care. Kessner scores are t h e measurement
of three items. They are (1) the length of pregnancy, (2)
timing of the first prenatal care v i s i t , and ( 3 ) number of
visits for care. This data is taken from the birth
certificates filed with the state ( Bureau of V i t a l S t a t i s t i c s
1991, 2 5 9 ) . The measurements of timing of t h e f i r s t prenatal
v i s i t and the number of v i s i t s of care are t h e most
significant factors of the three. The earlier in t h e
pregnancy and t h e more v i s i t s f o r prenatal care treathent, the
greater the potential for a satisfactory birth r e s u l t and
healthy child. Information from t h e Kessner scores indicate
differences along racial lines. Most studies are concerned
with the black versus white differential.
There is fear among some that the gap between the two
races, black versus white, is indicative of a lack of access
to care (Howze 1987, 120). Parnpel and P i l l a i concluded that
lowering mortality is easier when t h e population of the nation
is less socially diverse and homogeneous ethnically (1986,
5 3 4 ) . In 1990, there were only 3 . 4 percent of mothers in
Texas who d i d n o t receive prenatal care (Bureau of V i t a l
Statistics 1991, 22). Racially, whites attributed w i t h having
an adequate prenatal care experience was 7 4 . 2 % , blacks 50.1%
and Hispanics 45.6% in Kessner index scores for 1990 (Bureau
of Vital Statistics 1991, 72). Those who received inadequate
prenatal care according to the Kessner scores weres, (1)
whites-6.8%, ( 2 ) blacks-18.6%, and ( 3 ) Hispanics-20.7% (Bureau
of Vital Statistics 1991, 73). While there is a significant
di f f erence between white and blacks in Texas, t h e difference
between whites and isp panics is even greater.
It is clear these numbers need to improve. Urban women
enjoy better access to prenatal care than do women living in
rural areas (~chlesinger and Kronebusch 1990, 103). Urban
areas have a higher number of clinics and hospital outpatient
departments than do rural areas. Kessner scores for women who
used clinics or h o s p i t a l outpatient departments, usually found
in urban areas, enjoyed a better birth outcome than did t h o s e
who were treated by their p r i v a t e physicians. T h i s was true
even for those women who began their care later in their
pregnancies (Schlesinger and Kronebusch 1990, 102). These
findings are contrary to popu la r belief about the value of
private physicians in health care delivery and the effects of
competition on the health status of pregnant women and their
babies.
Managed competi t ion between hea l th care providers is t h e
cornerstone of the Presidential h e a l t h care plan. It has been
found to have an adverse effect on birth weight. Mark
Schlesinger and Karl Kronebusch found in'their study on
prenatal care for poor women that the only characteristic
adversely affecting birth outcomes was competition between
providers (1990 , 103) . They found t h a t where (1) c h a r g e s were
lowered, ( 2 ) Health Maintenance Organizations [HMOs] entered
t h e market, and ( 3 ) an abundant number of providers were
available to the population, birth outcomes were actually
adversely affected (1990, 1 0 3 ) . In fact, they found that a
system of prenatal care founded in clinic care or hospital
outpatient departments was t h e more preferable method of
prenatal care delivery. Since these types of care are funded,
at least in part, by a governmental entity, it follows that
participation in state prenatal outreach programs and Medicaid
enrollment would improve access to prenatal care and birth
outcomes (Schlesinger and Kronebusch 1990, 99, 107).
Quality
Again, quality is closely linked to access. The medical
profession along with medical support professions are
constantly working to improve t h e standards of medical care
provided. The diagnosis and treatment of patients is assessed
based on professional standards (Shortell et al. 1988, 4 3 9 ) .
The success of their endeavors is evident in t h e reverence t h e
rest of the world holds for American medical practices. The
medical system in the United States has been found to have no
harmful effects on infant mortality (Pampel and P i l l a i 1986,
5 3 7 ) . The quality of prenatal care in a variety of prenatal
care facilities has n o t been w i d e l y studied; in fact, there
were no published studies as of 1990 that proved the h i g h e s t
quality of prenatal care was rendered by private physicians
(Schlesinger and Kronebusch 1990, 9 6 ) . Christopher Jencks
reports t h a t before 1964 poor families visited a doctor, on
average, four times per year while middle-income families
vis i ted five times per year. Conversely, after the
institution of Medicaid and Medicare, utilization by
middle-income families fell to f o u r times per year while the
poor were seeing doctors almost s i x times per year (1992, 74).
Clearly, the literature indicates that access to and quality
of care for the poor is equal to and perhaps better than many
middle-income individuals. his study will contemplate two
hypotheses on t h e topic of access/quality. They are:
H: 3.1 If access/quality is controlled, the infant mortality rate will be similar by race.
H: 3 . 2 If access/quality is controlled, t h e low birth weight rate will be similar by race.
As previously discussed, urbanicity is a sub-factor to the
identified root causes--education, pover ty , and
access/quality--of i n f a n t mortality and low birth weight
rates. Because most of t h e literature scrutinized in this
study deals w i t h urban areas it will be examined in the next
section of t h i s literature review.
Urbanicity
The literature also makes reference to an urban- rura l
dichotomy. The studies examined in this literature review
predominantly analyzed urban regions. The s u b j e c t is
interwoven, in the studies reviewed, into t h e larger topics of
education, poverty, access/quality, and socio-psychological
/behavioral causes for i n f a n t mortality and low birth weight
rates.
The infant mortality, and subsequently the low birth
weight rate, of developed nations is considered to be
affected, lowered, in part by t h e urbanization of a population
(Pampel and P i l l a i 1986, 525). Urban women enjoy better
access, and therefore better quality prenatal care than do
women from rural areas (Schlesinger and Kronebusch 1990, 103).
Cramer suggests that, while many studies abou t r a c i a l trends
29
are made on a national scale; it is f a r more preferable to
study the t o p i c on a sub-national, s t a t e or reg iona l , l e v e l
(1988, 165). One of t h e reasons to study this t o p i c on a
lower, state or regional, level is t h e variance in t h e degree
of urbanization by racial populations in various quadrants of
t h e count ry (Cramer 1988, 165). According to Hale, residing
in an urban area was found to be a "powerful predictor" of
birth outcomes (1990, 21). Unlike earlier studies, Reis et
al. found that the urban woman was more adversely a f f e c t e d by
SPB influences (1992, 19).
In comparing Medicaid participant b i r t h outcomes between
urban and rural populations, c as sip our found that residence
was an important variable and a rural resident could expect to
enjoy better birth outcomes (1992, 40). Poldenak confirms
Nassipour and attributes the difference to economic,
accessjquality issues, maternal education and their decision
making process (1991, 1481). In addition, drug abuse,
especially in urban communities, has been touted as being more
prevalent in black, rather than white or Hispanic,
communities. The evidence is unclear on this point (Clifford
1987, 145) .

This study will examine urbanicity using the following
hypotheses:
H: 4.1 If urbanicity is controlled, the infant mortality rate will be similar by race.
H: 4 . 2 If urbanicity is controlled, t h e low birth weight rate will be similar by race.
The literature reviewed to this point indicates the
t r a d i t i o n a l factors associated with infant mortality and low
birth weight, education, poverty, and access/quality, f a i l to
provide a complete explanation for differences experienced
along r a c i a l lines. The next section presents a complementary
explanation.
Socio-PsycholoqicallBehavioral--SPB
SPB Defined
What is socio-psychological/behavioral? Culture is an
important part of every persons life. What constitutes a
culture can not be readily defined, but includes cus toms ,
beliefs, knowledge, va lues , institutions, h a b i t s , and skills
that influence the individual and are therefore in a constant
state of flux. These shared norms are believed to be
psychosocial in nature. The norms are structured around mores
and sanctions of the culture in which t h e individual is a
part. The individual learning process t e n d s to happen within
the confines of a social context. This social context is the
result of the individuals' environment, how they internalize
learning and behaviors, and the reaction of t h e i r society to
3 1
the individualsf a c t i o n .
In the United States, a person can identify with more than
one cultural heritage, usually dominated along their
ethnicity/race lines. Within t h e i r sphere of influence,
different dimensions of t h e i n d i v i d u a l can be independent of
one another. It is the amalgamation of a l l of these factors
that constitutes socio-psychological/behavioral activity. The
mixture of social factors, at some point, manifests i n t o
biological realities, but how and when is not clear ei ther in
the literature or in concept (Eberstein, Nam and H u m m e r 1990,
4 2 6 ) .
Empirical Evidence
Janet Reis et al. examined the family dominated soc ia l
support system of an urban area population, 98 percent black,
and its effects on prena ta l care (1992, 14). The study was
initiated in order to examine the social and psychological
factors of prenatal care addressed by a public Health service
expert panel in 1989. This panel found t h a t an emphasis on
the psychosocial aspects of prenatal care was necessary ( ~ e i s
et al. 1992, 1 4 ) . A woman's attitude abou t pregnancy and her
concepts about the usefulness of prenatal care has a large
effect on the perception of access to prenatal care. T h i s
at t i tude is based on beliefs and knowledge (~chlesinger and
Kronebusch 1990, 101) . Support for the pregnant woman includes such things as
spousal support, family concern about health, lifestyle
choices--diet, alcohol and drug use, tobacco use, etc.--, and
work activity while pregnant (Weeks and Rumbaut 1991, 332).
Women, in t h e Reis and Schoendorf studies, who felt they were
strongly influenced by their family structure were less likely
to use prenatal care services (Reis et a l . 1992, 14:
Schoendorf et al. 1992, 1525). In fact, Reis et al. found
that 3 6 percent of the women surveyed, of which 98 percent
were black, reported the men in their lives was t h e single
most important source of how t o care for themselves during
pregnancy (1992, 18). The Reis survey also found that both
men and women felt drug use among pregnant women was under
reported by women. Both t h e males and females interviewed
believed t h a t access problems commonly attributed to poor
prenatal care, such as location of clinics, hours of
operation, poor physician care, and cost, were not a barr i er
to obtaining prenatal care. The Reis study participants a l s o
felt that families did not actively encourage women to seek
the prenatal services of a physician (1992, 17). T h i s may be
indicative of social a t t i t u d e s or the traditional family
structure many blacks in an urban area have come to accept.
Christopher Jencks discusses t h e findings of Oscar Lewis,
who postu lated that t h e cultural attitudes experienced during
the f i r s t seven years of life became a part of t h e childs'
persona in later years (1992, 215). The public interactions
within a neighborhood reinforce these cultural impressions
(Jencks 1992, 215). William Julius Wilson t a k e s the position
that poor cultural practices are reinforced by other
influences such as poverty, unemployment, and inadequate
church support (1987, 8 2 ) . John Sibley B u t l e r believes that
the black church has been so consumed with politics and civil
rights issues that ensuring a strong cultural support system
has been sacrificed (1991, 326; Telephone interview 20
December 1993). The effect of the black church on behavior is
well documented.
Frederick C. Harris found that church attendance w a s a
strong predictor of voting behavior (1993, 63). In fact the
black church goer votes more regularly and in a higher
percentage t han do whites (Harris 1993, 62-3). Black church
goers receive political messages at their worship services at
a greater level than whites (Harris 1993, 6 3 ) . This
information indicates the black church is quite effective in
encouraging unified communal action. Religious influence in
t h e black community, as in other ethnic communities, provides
both a social and psychological foundation for behavior that
could be considered morally motivated.
Hispanics have a stronger traditional religious [Catholic]
dogma and communal support structure. These structures and
practices are believed to be a significant aspect relative to
child birth and pregnancy (Cramer, 1988 310; Schlesinger and
Kronebusch 1990, 102). This phenomenon of positive familial
influence, as having a beneficial ef fect on pregnancies, is
repeated in other cultures as reported by Weeks and Rumbaut
(1991, 3 3 3 ) . It could also partially explain the Kessner
index scores, previously discussed, where the Hispanic
population had worse Kessner scores than either blacks or
whites in Texas, yet had infant mortality and low birth weight
rates comparable to whites and twice as good as blacks in
1990.
B i r t h weight and infant mortality are linked to background
and similar variables [SPB] such as late initiation of
prenatal care [discussed above], nutritional deficiencies, low
socio-economic status, illegitimate birth rates, and poor
educational levels (Eberstadt 1991, 421; Howze 1987, 123).
Eberstadt found that the spending patterns, of t h e poor in the
United States, for food and non-alcoholic beverages, as a
percentage, is lower than many European nations. Further, the
Eberstadt study noted when the poverty line index was applied
to other nations, the U.S. had as good or better i n f a n t
mortality rates (1991, 3 4 ) . They found, according to the
Consumer Expenditure Survey, low income people in the United
States believed they could afford to spend much more on
alcohol, tobacco and entertainment than on health care (1991,
4 5 ) . The Consumer Expenditure Survey findings support the
Eberstadt study which found there was not a feeling of
necessity among the poor to purchase health care (1991, 4 5 ) .
Poor health or nutrition habits transcend income levels.
In the Schoendorf et al. study, the authors concluded that the
higher black rate of prematurity of children born to college
educated women could be attributed to factors such as poor
health habits during pregnancy and psychological r i s k s
contributed to by psychosocial activity (1992, 1525).
Psychosocial activity manifests itself in many ways such as
lifestyle choices and composition of t h e family.
Lifestyles and the structure of t h e family can be
attributed to cultural patterns, discussed above and
governmental programs.
If parental lifestyles and family-formation patterns play a direct and important role in determining infant surviva l chances, the prospects for reducing American infant mortality rates through government income support and health care p o l i c i e s may be less s u b s t a n t i a l than is sometimes supposed (Eberstadt 1991,lO) .
John Sibley Butler goes f u r t h e r by implying that a large
p o r t i o n of underc lass blacks have developed a culture built
around the welfare system (Telephone interview, 20 December
Low income women are often charged with having more
children in order to increase their incomes through t h e A i d
For Dependent Children [AFDC], WIC, and other governmental
programs predicated on t h e number of offsprings (Wilson 1987,
7 8 ) . This activity is counter produc t ive in attempting to
reduce infant mortality and low birth weight rates. Low
income women who could be using their WIC and supplemental
food program benefits, due to pregnancy, are feeding their
other children instead of taking better care of their own
nutritional needs (Weiner and Engel 1991, 9). Hispanics enjoy
higher bir th weight babies than blacks or whites. Again, t h i s
is attributed, in part, to their lifestyle, which includes
nutrition and non-use of alcohol and tobacco or drugs during
pregnancy (Schlesinger and Kronebusch 1990,102). Along with
the nutritional aspect of governmental involvement is the
attitude toward abortion.
Abortion
Women receiving assistance, i . e . welfare, were found to be
significantly less likely to use contraceptive devices (Wilson
1987, 7 8 ) . These women did not use contraception even though
they self reported not wanting additional children (Wilson
1987, 7 9 ) . The stigma attached to illegitimate children in
other cultures is not as pronounced in poor black communities
than in others (Wilson 1987, 74). Wilson further indicates,
and supports through a number of studies, that familial
influences and personal characteristics do not discourage
pregnancy and this a t t i t u d e may be linked to receiving AFDC
(1987 7 5 , 7 8 ) . For those children who are born, a C e n t e r s for
Disease Control monthly report related that socioeconomic
support of a mother does not affect the survival rate of an
infant (Eberstadt 1991, 37) .
cultural Identities
Throughout this literature review it has been noted that
blacks are different t h a n both w h i t e s and Hispanics. What is
different about them? In 1992, the U.S. Department of Health
and Human Service-Alcohol, Drug Abuse, and Mental Health
Administration published a guide which deals with different
e t h n i c and r ac ia l communities. This guide is based on
empirical evidence and is a compilation of reports of experts
in each ethnicity. They were quick to point out that there is
no stereotype-type which can be applied to t h e black community
(1992, 37) . The male/female relationship, according to DHHS, was
characterized as being one in which t h e female looks to marry
a "good mantq who will commit to caring f o r children and t h e
family unit. The man, on t h e other hand, is more interested
in a woman who will supplement his income, satisfy his sexual
desires, allow him freedom to do as he p l e a s e s , and not s t i f le
him (OSAP Cultural Competence Series 1 1992, 4 5 ) . Black males
are not concerned w i t h creating a secure situation or
relationships within t h e family because their culture has
based itself on reliance on the extended family (OSAP Cultural
Competence Series 1 1992, 4 4 - 4 5 ) . These findings are accurate
characteristics of most blacks living in urban areas, and some
rural areas of the United States according to John Sibley
Butler, (Telephone interview, 20 December 1993).
Hispanics, on the other hand, are more family oriented.
Hispanics are predominantly Catholic. The law of t h e church
is that marriage is seen as a union of two people for life.
Children are the responsibility of the p a r e n t s and their care

and upbringing is an intense part of t h e Hispanic culture.
The guide indicates there is a conception of female Hispanics
seen as passive, but they report this is not the case.
isp panic females are more demanding where familial matters are
concerned. Males are receptive to t h e s e demands and take a
greater responsibility in t h e family life more than other
ethnic groups.(OSAP Cultural Competence Series 1 1992,
120-122). Responsibility and commitment appear to be
significantly different.
Individual Responsibility
Since the beginning of time, human health h a s been
determined, in large part, by their behavior, nutrition, and
the nature of their environment. Since the Industrial
Revolution, medical professional, scientific, and
technological advances have tended to replace personal aspects
of health responsibility. The attitude has been t h a t
medicine, science and technology can cure or at least
successfully treat diseases and maladies of human health.
This perspective gives one permission to deny death and
disease and be irresponsible i n personal h a b i t s because if
something went wrong, well, science, medicine, or technology
had the answer or cure. Well, with all t h i n g s there comes a
point of maximization of returns. A p o r t i o n of t h e health
plan proposed by President Clinton addresses individual
responsibility, therefore, we have reached the point where
individual responsibility can no longer be abrogated where
health is concerned (White House Domestic Policy Council 1993,
12).
Health care providers are trying to find strategies to
attract a greater participation of individuals, pregnant women
in this case, in their health matters (Reis et al. 1992, 19).
The individual should realize that to perpetuate t h e present
methods of personal health h a b i t s will no longer work. In the
case of prenatal care, it is believed the o n l y way to assure
care, the single most critical factor in infant mortality and
low birth weight reduction, is delivered to every woman is
through mandatory participation. American women would not be
amenable to t h i s requirement (Eberstadt 1991, 4 6 ) .
The documentation in this chapter i n d i c a t e s that above the
commonly recognized root causes involved in low birth weight
and infant mortality rates, t h e socio-psychological
/behavioral [SPB] dimensions is a part of the infant mortality
and low birth weight equation. Measurement is at the heart of
how to quantify SPB. Some researchers have attempted to
quantify parts of the SPB factor (Reis et al. as an example),
none have been willing to assign significant study of its
effects with t h e other variables. The next chapter focuses on
the Texas experience as it relates to t h e factors under
consideration and infant mortality and low birth weight.

CHAPTER THREE
SETTING-TEXAS 1990
Introduction
This chapter discusses the Texas context. Educational
programs, including drop o u t rates will be addressed. General
conditions of poverty and pertinent programs dealing w i t h
access and quality issues relating to the i n f a n t mortality and
low bir th weight experience in Texas f o r t h e year 1990 will be
discussed.
Texas will soon become the second most populated s t a t e in
t h e nation. In 1990, the ethnicities under consideration in
t h i s study accounted f o r 88.6 percent of a l l residents in t h e
state of Texas. Table 3.1 indicates t h e total number of
individuals by race in 1990.
Table 3.1
Population by Race--Texas 1990
White % Black % Hispanic % 12,787,521 66.9 2,018,543 10.6 4,292,120 2 2 . 8
In 1990, the overall infant mortality rate in Texas
was eight per one thousand births. According to t h e Texas
Department of Health, Bureau of V i t a l Statistics [BVS)(BVS
1991, 8 2 1 , as indicated in Table 3.2 the rates ethnically
were:
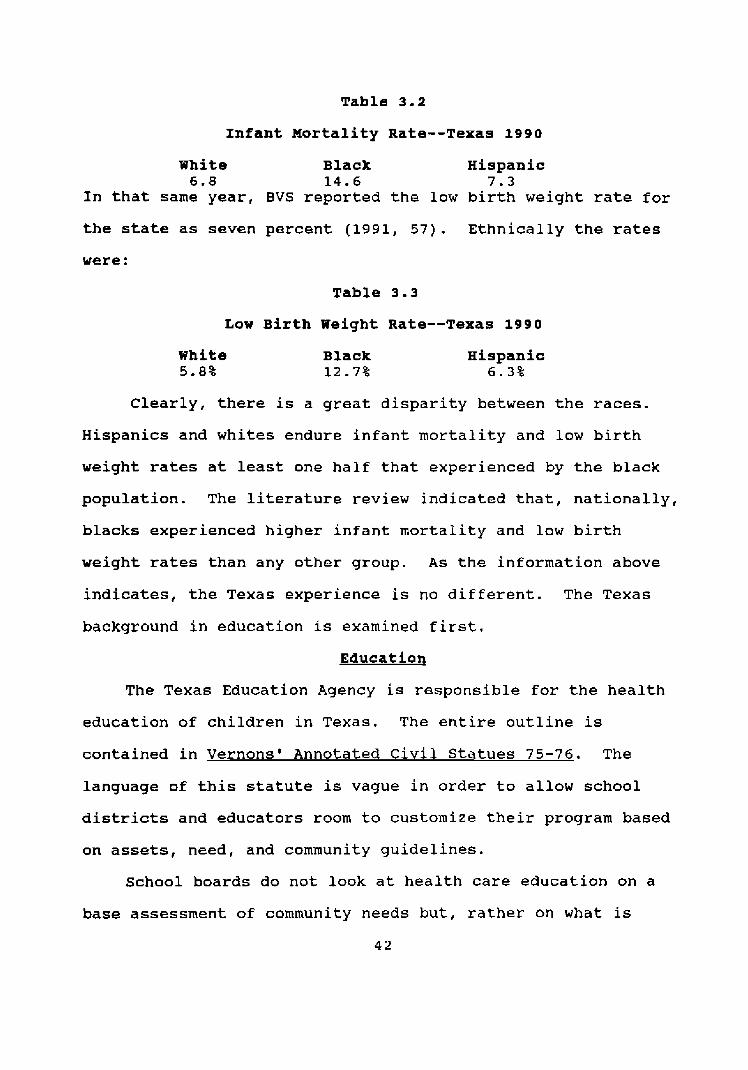
Table 3.2
Infant Mortality Rate--Texas 1990
White B l a c k Hispanic 6 . 8 14.6 7.3
In that same year, BVS reported t h e low b i r t h weight rate for
the state as seven percent (1991, 57). ~thnically the rates
were:
Table 3.3
Low ~ i r t h weight Rate--Texas 1990
white 5 . 8 %
B l a c k 12.7%
Hispanic 6 . 3 %
Clearly, there is a great disparity between the races.
Hispanics and whites endure infant mortality and low b i r t h
weight rates at least one half that experienced by the black
population. The literature review i n d i c a t e d t h a t , nationally,
blacks experienced higher infant mortality and low birth
weight rates than any other group. A s t h e information above
indicates, the Texas experience is no different. T h e Texas
background in education is examined first.
Education
The Texas Education Agency is responsible for the health
education of children in Texas. The entire outline is
contained i n Vernons' Annotated C i v i l Statues 75-76. The
language of t h i s s t a t u t e is vague in order to allow school
districts and educators room to customize their program based
on assets, need, and community guidelines.
School boards do not look at health care education on a
base assessment of community needs but, r a t h e r on what is
4 2
least offensive and cos t l y . A finding of Livingood and
Woodhouse was that t h e community involvement aspect of health
education was preferred in order to assure maximum r e s u l t s and
behaviors of s tudents exposed to t h e instruction (1992, 15).
It would fallow that if education is a factor in low b i r t h
weight and in fant mortality rates, then t h e more education on
prenatal care, pregnancies, and infant care t r a i n i n g given
prior to the tenth grade [age 161, t h e pregnancy outcomes
would improve.
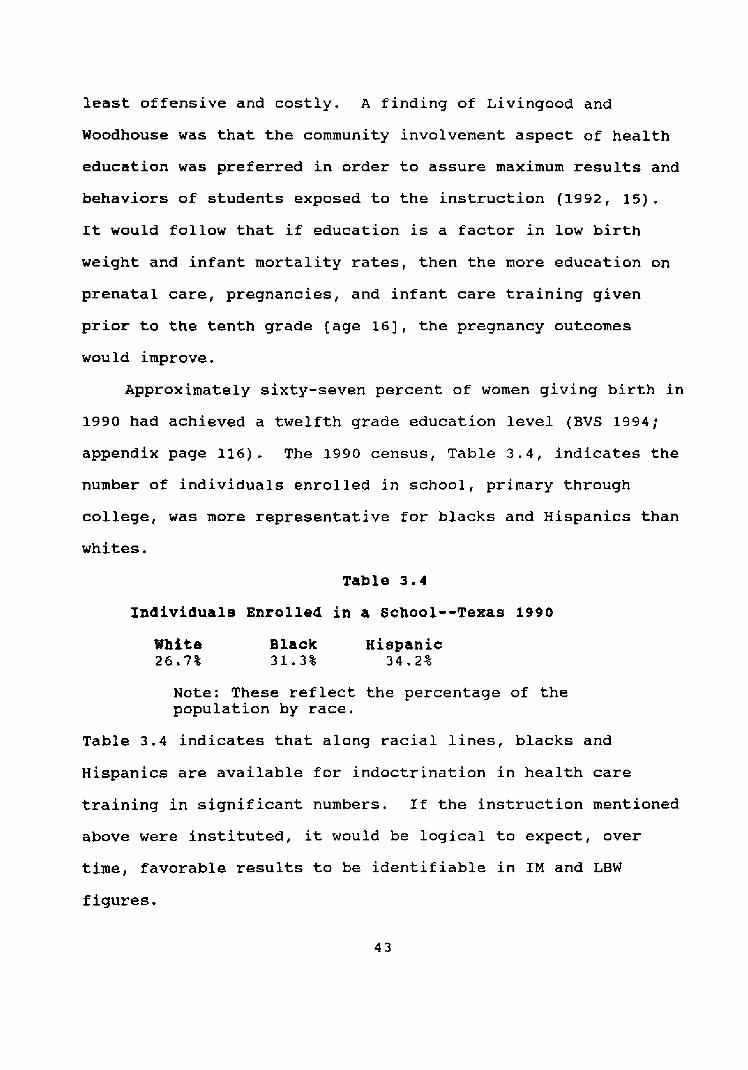
Approximately sixty-seven p e r c e n t of women g i v i n g birth in
1990 had achieved a twelfth grade education level (BVS 1994;
appendix page 116). The 1990 census, Table 3 . 4 , indicates t h e
number of individuals enrolled in school, primary through
college, was more representative for blacks and Hispanics than
whites.
Table 3 . 4
Individuals Enrolled in a School--Texas 1990
White B l a c k Hispanic 2 6 . 7 % 31.3% 3 4 . 2 %
Note: These ref lect t h e percentage of the population by race.
Table 3 . 4 indicates that along r a c i a l lines, blacks and
Hispanics are available f o r indoctrination in health care
training in significant numbers. If t h e instruction mentioned
above were instituted, it would be l o g i c a l to expect, over
t i m e , favorable r e s u l t s to be identifiable in IM and LBW
figures.

Further analysis, see Table 3.5, of this information shows
that the percentage of b l a c k s in college in 1990 was higher
than Hispanics and has almost achieved t h e level of whites in
Texas. Table 3 .5
Individuals Enrolled in College--Texas 1990
White Black Hispanic 7.1% 6 . 8 % 5 . 8 %
Note: The percentages reflected above are along racial lines.
Schoendorf et al. found t h a t w h i l e there was a higher
incidence of undesirable birth outcomes among college educated
black women, when compared to whites, t h e b i r t h results were
better than black women having a high school or lower
education (1992, 1525). Table 3.5 indicates the percentage of
blacks enrolled in college, as a percentage by race, is better
than Hispanics and comparable to whites. A s this percentage
of blacks in college increases over time, it would be logical
to expect t h e IM and LBW results to improve. An indicator of
a successful school system i n a state is t h e drop out rate. A
low drop out rate indicates that a h i g h e r number of
individuals are completing their high school education. If a
high school education is a major player in birth outcomes, t h e
lower t h e drop out rate, t h e end result would be more
favorable IM and LBW r e s u l t s . In Texas, the drop o u t rate was
five percent in the 1989-1990 school year (CRHI 1992, 25).
The five percent represents j u s t over 6 8 , 0 0 0 s tudent s . One i n
seven of these individuals were from a r u r a l area (CRHI 1992,
4 4
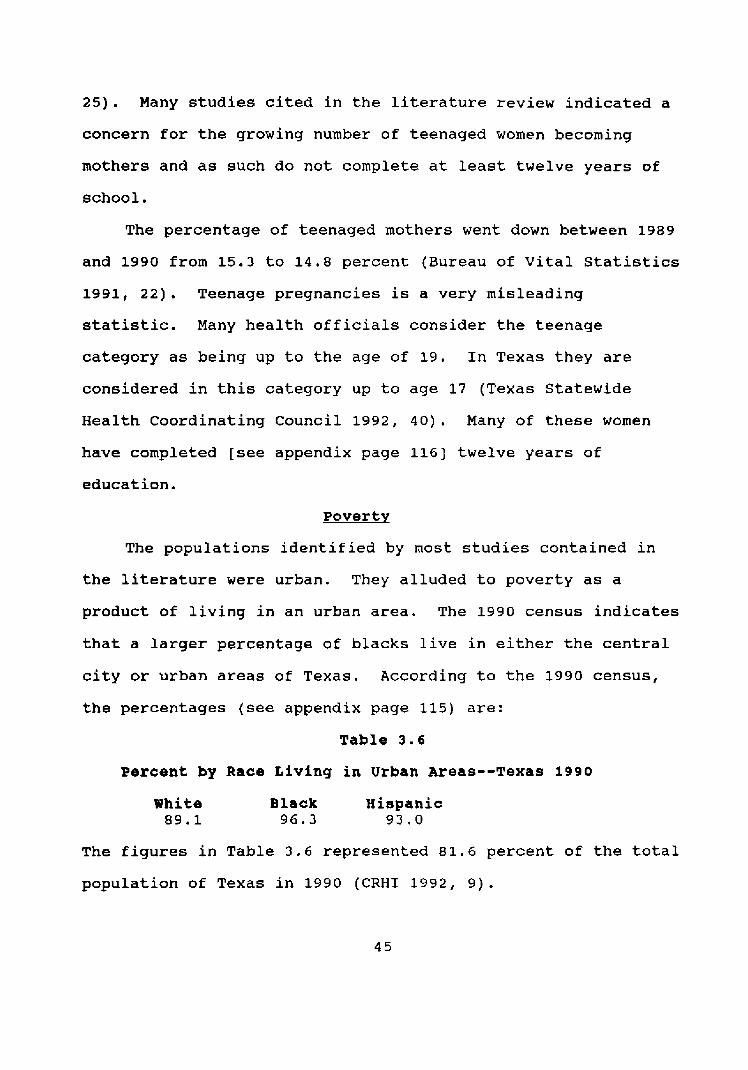
2 5 ) . Many studies cited in the literature review indicated a
concern for the growing number of teenaged women becoming
mothers and as such do not complete at l e a s t twelve years of
school.
The percentage of teenaged mothers went down between 1989
and 1990 from 15.3 to 14.8 percent (Bureau of Vital Statistics
1991, 22). Teenage pregnancies is a very misleading
statistic. Many health officials consider the teenage
category as being up to the age of 19. In Texas they are
considered in t h i s category up to age 17 (Texas S ta tewide
Health Coordinating Council 1992, 40). Many of these women
have completed [see appendix page 1161 twelve years of
education.
Poverty
The populations identified by most studies contained in
the literature were urban. They alluded to pover ty as a
product of living in an urban area. The 1990 census indicates
t h a t a larger percentage of b l a c k s live in either the central
city or urban areas of Texas. According to t h e 1990 census,
t h e percentages (see appendix page 115) are:
Table 3.6
Percent by Race Living in Urban Areas--Texas 1990
White B l a c k Hispanic 89.1 96.3 93.0
The figures in Table 3.6 represented 81.6 p e r c e n t of the total
population of Texas in 1990 (CRHI 1992, 9 ) .
Statewide, t h e average per capita income, in 1990, w a s
$15,512 (CRHI 1992, 12). The significance of this information
may be mitigated when t h e poverty rate of urban versus rural
areas are considered. According to t h e Center f o r Rural
Health Initiatives, the poverty rate for rural areas is
consistently higher (1992, 13). This difference may be the
result of unemployment differences. Statewide, the
unemployment rate in Texas was 6.2 percent in 1990. The urban
areas of the state experienced a 6.1 percent rate while in
rural areas it was 6.3 percent (CRHI 1992, 17). The effect of
urbanization will be discussed, later, in more detail. There
are many health services offered i n Texas to mitigate the
effects of poverty. Medicaid is t h e most popular of t h e s e
services. Nationally, Medicaid funding accounts for about
nine percent of t h e women ages 15 to 4 4 (Hale 1990, 2 2 ) .
The Texas Medicaid enrollment for rural areas was 10.8
percent of the population and 8.9 percent of t h e urban
population was enrolled in Medicaid (Center f o r Rural Health
Initiatives 1992, 27). In Texas, according to Timothy Varian
a Supervisor a t the Program Budget & Statistics Client
Self-support Services division of t h e Depa r tmen t of Human
Services, Medicaid funded approximately one-half [ s e e appendix
page 121) of a l l live births in 1990 (Telephone interview,
11/12/92). The state offers other h e a l t h and human services.
The s t a t e of Texas has three agencies directly r e s p o n s i b l e
for health and human services to citizens. They are; t h e
Texas Department of Human Services, Texas Department of
Health, and the Texas Education Agency. No s i n g l e state
agency coordinates, oversees, or otherwise manages t h e
a c t i v i t i e s of t h e s e agencies to assure effective and efficient
utilization of resources.
In an e f f o r t to reduce fragmented h e a l t h and human
services, the Primary Health Care Service Program (PHSCP) is
tasked w i t h the management of t h e Integrated Eligibility (IE)
intake system. The idea behind IE is to establish one-stop
shopping f o r eligibility determination of individuals for
health service programs. I n FY 1990, t h e program provided
primary care services to 90,000 medically indigent clients
(Primary Health Services Care Program 1992, 6 ) . This is less
than t e n (10) percent of the e s t i m a t e d 1 . 4 million targeted
population (Primary H e a l t h Care Service Program 1992, 6 ) .
The Texas Department of Human Services is responsible for
the administration of t h e A i d For Dependent Children Program
(AFDC), County Indigent Health Care Program (CIHCP), Primary
Health Care Services Program (PHSCP), Early Periodic
Screening, Diagnosis and Treatment (EPSDT) f o r t h e s t a t e of
Texas. In each case, t h e programs are passive i n their
approach toward service. The individual m u s t approach t h e i r
offices and seek assistance. There is no program that
pro-actively s e e k s to i d e n t i f y individuals in need of services
and refer them to t h e necessary programs. Those individuals
who use a service are identified and referred w i t h no
comprehensive follow up by the referring program.
The Texas Department of Health administers the Women,
Infants and Children's (WIC) and the Maternal and Chi ld Health
(MCH) Programs. MCH is organized to oversee and administer
the Maternal Infant Care Access (MICA) [funded by the March of
~ i m e s organization and t h e federal government], Vision and
Hearing Screening Services, Speech and Language Services,
Program for Amplification for Children of Texas (PACT), and
Sudden Infant Death Syndrome Services ( S I D S ) , the newborn
screening program, genetic services, the midwife program, and
other programs not associated with t h i s study. Effective
October 1, 1993, t h e Texas Department of Health assumed
responsibility for Medicaid. Private l o c a l providers include
the Community and Migrant Health Centers (CMHC) and
independent rural health clinics.
These clinics provide primary health care f o r residents i n
their catchment areas. A s of July 1992 there were 76 rural
health clinics, with 32 more pending state certification, and
27 CHMCts active in Texas. National standards of care and
state reporting requirements were eliminated by Congress. The
eligibility requirements are a l s o at the discretion of t h e
providers receiving the ir grants (Hale 1990, 21). These
standards of care and reporting requirehents may affect access
and the q u a l i t y of b i r t h outcomes.
&ccess/Oualitv
Access
Generally, urban women enjoy better access to prenatal
care than do women living in r u r a l areas (Schlesinger and
Kronebusch 1990, 103) . A s previously stated, in 1990, 8 6 . 8
percent of blacks and 84.1 percent of Hispanics lived in urban
areas. Blacks comprise 12.4 percent of urban area
populations, while Hispanics totaled 26.3 percent (Center for
Rural Health Initiatives 1992, 11). The 1990 census
indicated, as a percentage by race, more Hispanics lived
either outside an urban area or in a rural location than
blacks but less than whites ( s e e appendix page 115). Access
for blacks and Hispanics would be about equal , given a l l the
information above, and their birth outcomes should, therefore,
be on par, Access to care may be affected by t h e process used
to obtain it.
According to the Children's Defense Fund [ C D F ] , pregnant
women and children in Texas must o f t e n wait weeks in order to
apply f o r Medicaid (1991, 10). This is attributed to a
shortage of eligibility workers and a lack of documentation
provided by the applicant necessary to qualify for t h e
services (CDF 1991, 10). Once approved, t h e ind iv idual must
then seek out services. The number of h e a l t h care providers,
in Texas, willing to accept ~ e d i c a i d is not very high.
Incentives to accept Medicaid payments are low. Hospi ta l s
lost an average of $ 8 0 6 per ~edicaid admission (CDF 1991, 12).
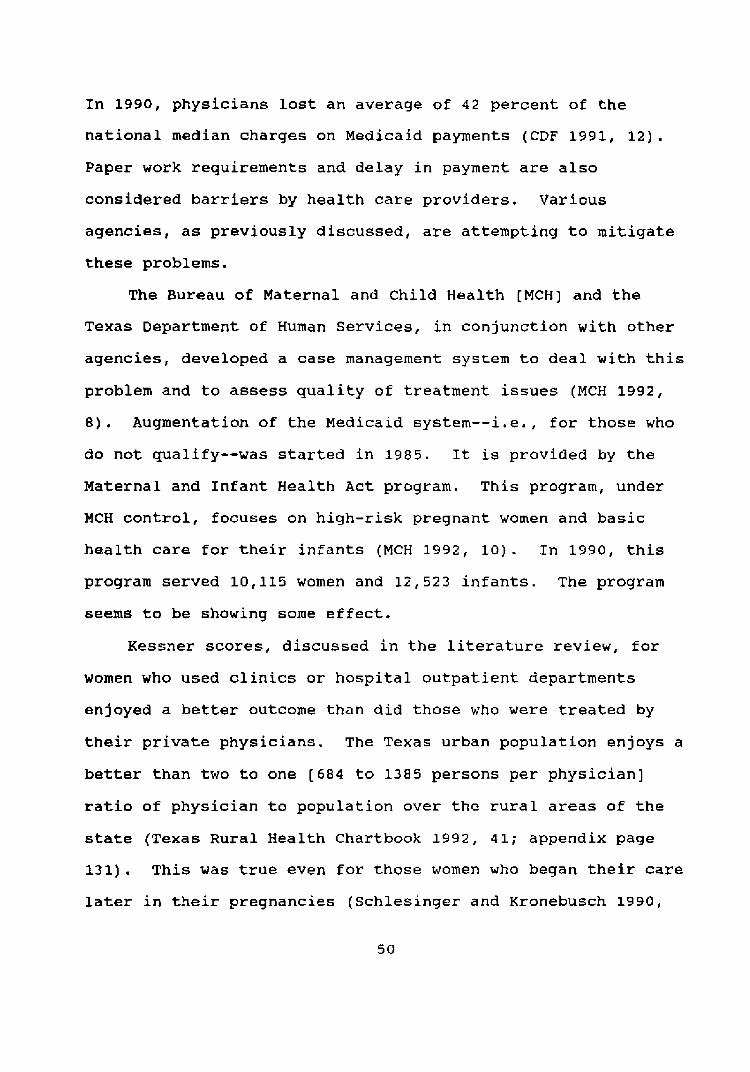
In 1990, physicians lost an average of 42 percent of the
nat iona l median charges on Medicaid payments (CDF 1991, 12).
Paper work requirements and de lay in payment are a l s o
considered barriers by health care providers . Various
agencies, as previously discussed, are attempting to mitigate
these problems.
The Bureau of Maternal and Child Health [MCH] and the
Texas Department of Human Services, i n conjunction with other
agencies, developed a case management s y s t e m to deal w i t h this
problem and to assess quality of treatment issues (MCH 1992,
8 ) . Augmentation of the Medicaid system--i.e., for those who
do not qualify--was started in 1985. It is provided by the
Maternal and Infant Health A c t program. This program, under
MCH con t ro l , focuses on high-risk pregnant women and b a s i c
health care for their i n f a n t s (MCH 1992, 10). I n 1990, t h i s
program served 10,115 women and 12,523 infants. The program
seems to be showing some effect.
Kessner scores, d i s c u s s e d in the literature review, for
women who used clinics or hospital outpatient departments
enjoyed a better outcome t h a n did those who were treated by
their private physicians. The Texas urban population enjoys a
better than two to one ( 6 8 4 to 1385 persons per physician]
ratio of physician to population over the rural areas of t h e
state (Texas Rural Health Chartbook 1992, 41; appendix page
131). This was true even for those women who began the ir care
later in their pregnancies (Schlesinger a n d Kronebusch 1990,
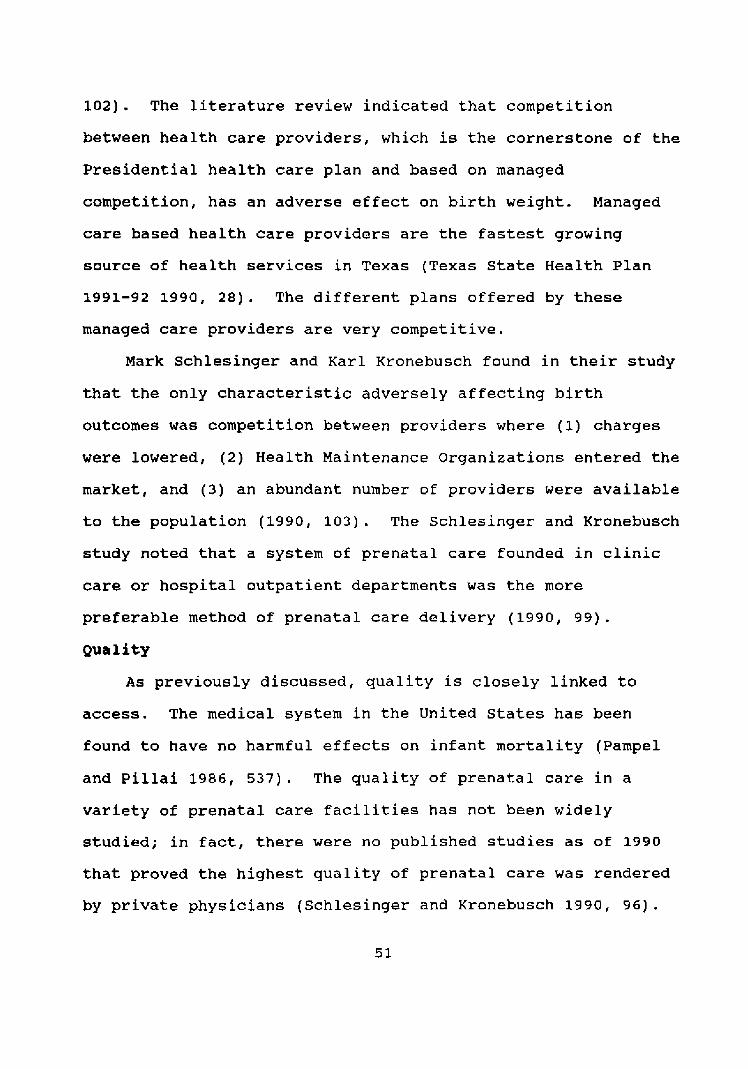
102). The literature review indicated that competition
between health care providers, which is the cornerstone of t h e
Presidential health care plan and based on managed
competition, has an adverse effect on birth weight. Managed
care based h e a l t h care providers are t h e fa s te s t growing
source of h e a l t h services in Texas (Texas State Health Plan
1991-92 1990, 2 8 ) . The different p l a n s offered by these
managed care providers are very competitive.
Mark Schlesinger and Karl Kronebusch found in their study
that the on ly characteristic adversely affecting birth
outcomes was competition between providers where (I) charges
were lowered, (2) Health Maintenance Organizations entered the
market, and ( 3 ) an abundant number of providers were available
to the population (1990, 103). The Schlesinger and Kronebusch
study noted that a system of prenatal care founded in clinic
care or hospital outpatient departments was the more
preferable method of prenatal care delivery (1990, 99).
Quality
A s previously discussed, quality is closely linked to
access. The medical system in t h e United States has been
found to have no harmful effects on infant mortality (Pampel
and Pillai 1986, 5 3 7 ) . The quality of p r e n a t a l care in a
variety of prenatal care facilities has n o t been w i d e l y
studied; in fact, there were no published studies as of 1990
t h a t proved the highest quality of p r e n a t a l care was rendered
by private physicians (Schlesinger and Kronebusch 1990, 96).
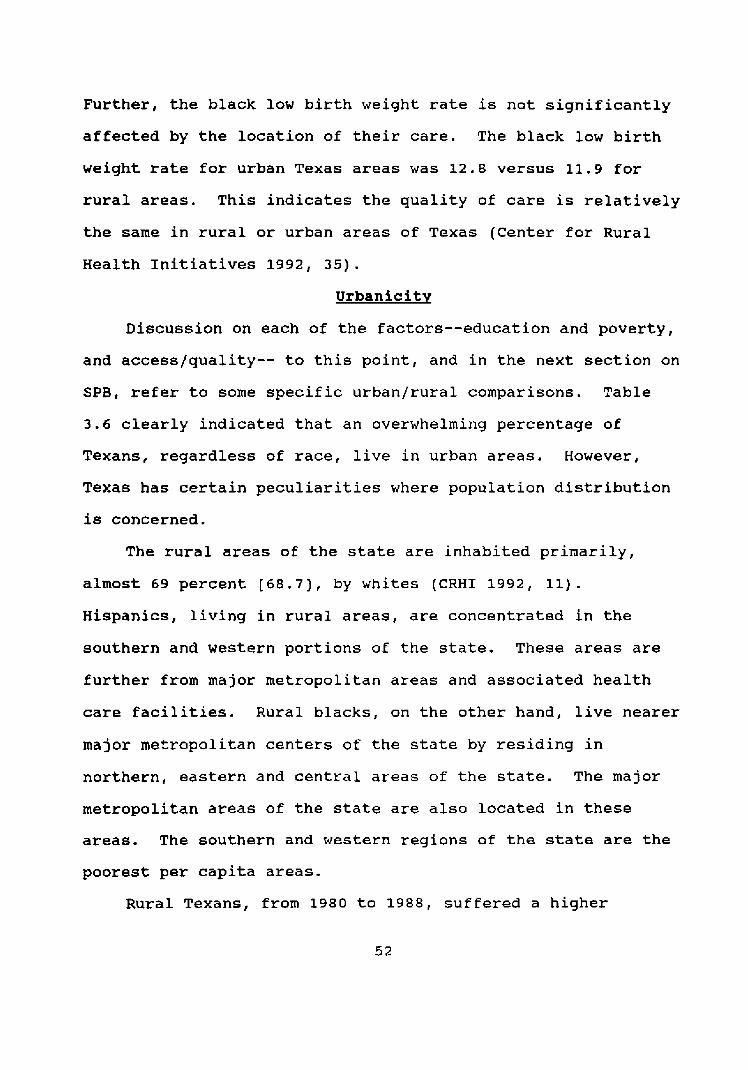
Further, the black low birth weight rate is not significantly
affected by the location of their care. The black low birth
weight rate for urban Texas areas was 12.8 versus 11.9 for
rural areas. This indicates t h e quality of care is relatively
the same in rural or urban areas of Texas (Center for Rural
Health Initiatives 1992, 35).
Urbanicitv
Discussion on each of t h e factors--education and poverty,
and access/quality-- to this point, and in the next section on
SPB, refer to some specific urban/rural comparisons. Table
3 . 6 clearly indicated that an overwhelming percentage of
Texans, regardless of race, live in urban areas. However,
Texas has certain peculiarities where population distribution
is concerned.
The rural areas of t h e state are inhabited primarily,
almost 69 percent [ 6 8 . 7 3 , by whites (CRHI 1992, 11).
Hispanics, living in rural areas, are concentrated in the
southern and western portions of t h e state. These areas are
further from major metropolitan areas and associated health
care facilities. Rural blacks, on t h e other hand, live nearer
major metropolitan centers of the state by residing in
northern, eastern and central areas of t h e s t a t e . The major
metropolitan areas of t h e state are also located in these
areas, The southern and western regions of the state are the
poorest per capita areas.
Rural Texans, from 1980 to 1988, suffered a higher
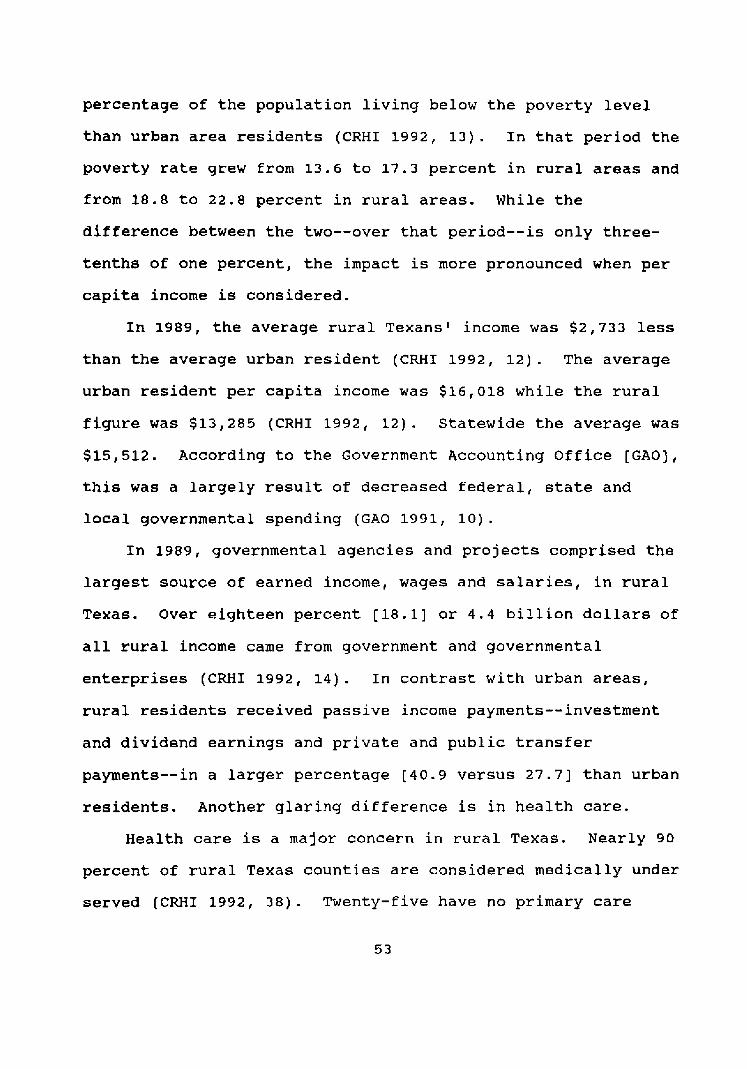
percentage of the population living below the poverty level
than urban area residents (CRHI 1992, 13). In t h a t period the
poverty rate grew from 13.6 to 17.3 percent in rural areas and
from 1 8 . 8 to 2 2 . 8 percent in r u r a l areas. While the
difference between the two--over t h a t period--is o n l y three-
tenths of one percent, t h e impact is more pronounced when per
capita income is considered.
In 1989, the average rural Texans ' income was $2,733 less
than the average urban resident (CRHI 1992, 12). The average
urban resident per capita income was $16,018 while the rural
figure was $13,285 (CRHI 1992, 12). Statewide the average was
$15,512. According to t h e Government Accounting Office [ G A O J ,
t h i s was a large ly r e s u l t of decreased f e d e r a l , state and
local governmental spending (GAO 1991, 10).
In 1989, governmental agencies and projects comprised the
largest source of earned income, wages and salaries, in rural
Texas. Over eighteen percent (18.11 or 4 . 4 billion dollars of
all rural income came from government and governmental
enterprises (CRfII 1992, 14). In contrast w i t h urban areas,
rural residents received passive income payments--investment
and dividend earnings and private and public transfer
payments--in a larger percentage [ 4 0 , 9 versus 27.7) than urban
residents. Another glaring difference is i n health care.
Health care is a major concern in r u r a l Texas. Nearly 90
percent of rural Texas counties are considered medically under
served (CRHI 1992, 3 8 ) . Twenty-five have no primary care
physicians. Most of these are in areas where t h e population
is white and Hispanic (CRHI 1992, 39) . Of those rural
counties having physicians, 2 4 . 2 percent of those doctors were
over 60 years o ld (CRHI 1992, 4 2 ) . Hospitals are another
problem which is more acute in rural areas.
Fifty-six counties in Texas had no hospital at the
beginning of 1991 (CRHI 1992, 50). Fifty-five of those
counties were located i n rural Texas (CRHI 1992, 5 0 ) . Twenty
of those counties had no other health care available to them
CRHI 1992, 5 0 ) . More i n line with the subject of this
inquiry, hospital-based obstetrical care was not available in
80 rural counties in 1990 (CRHI 1992, 5 6 ) . These counties
experienced almost 8,000 births i n 1990 (CRHI 1992, 56).
Clearly, the dichotomy between urban and rural infant
mortality and low birth weight results are more pronounced
when the two are compared. The next section may indicate an
explanation on why, even w i t h t h e obstructions they suffer,
r u r a l birth outcomes are closer to urban resul t s .
Soeio-Ps~eholosical/Behavioral--SPB
SPB is difficult to either find indicators of or quantify
in terms that can be agreed on by researchers. It is even
more difficult to find quantitative information related to the
topic in any existing material related to Texas. Some
information presented in this section will be discussed and
analyzed in chapter five. The attitude towards pregnancy can
be influenced by religious indoctrination and social stigma

(Joyce and Grossman 1990, 2).
Hispanic Texans practice t h e i r religion primarily in the
Roman Catholic church. While there may be a great debate over
whether Hispanics or blacks are more religious, there is no
debate that the r i g i d i t y of Roman Catholic dogma is greater
than other popular sects. The Roman Catholic church is very
strict in their teachings about t h e continuity of a family
unit, marriage, abortion, and the responsibilities of
parenting. Other sects, in large par t , frequented more by
whites and blacks are less exacting on these t op i c s . Among
the more lenient attitudes is contraception and its'
associated issues. With contraception techniques and abortion
being readily available, women have t h e means to c o n t r o l the
number and timing of t h e i r pregnancies and births (Joyce and
Grossman 1990, 2) . Self-selecting could therefore, be
influenced by religious or soc ia l mores.
Marriage and birth o u t of wedlock is a central i s s u e i n
many social and religious viewpoints. In 1990, 17.9 percent
of a l l births were to single mothers (Bureau of V i t a l
Statistics 1991, 2 2 ) . Table 3.7 i n d i c a t e s the marital status
of mothers, along racial lines.
Table 3 . 7
Marital S t a t u s of Mothers--Texas 1990
White Black isp panic Unmarried 8.9% 4 8 . 3 % 17.8% larrf ed 91.1% 51.7% 82.2%
Source: BVS
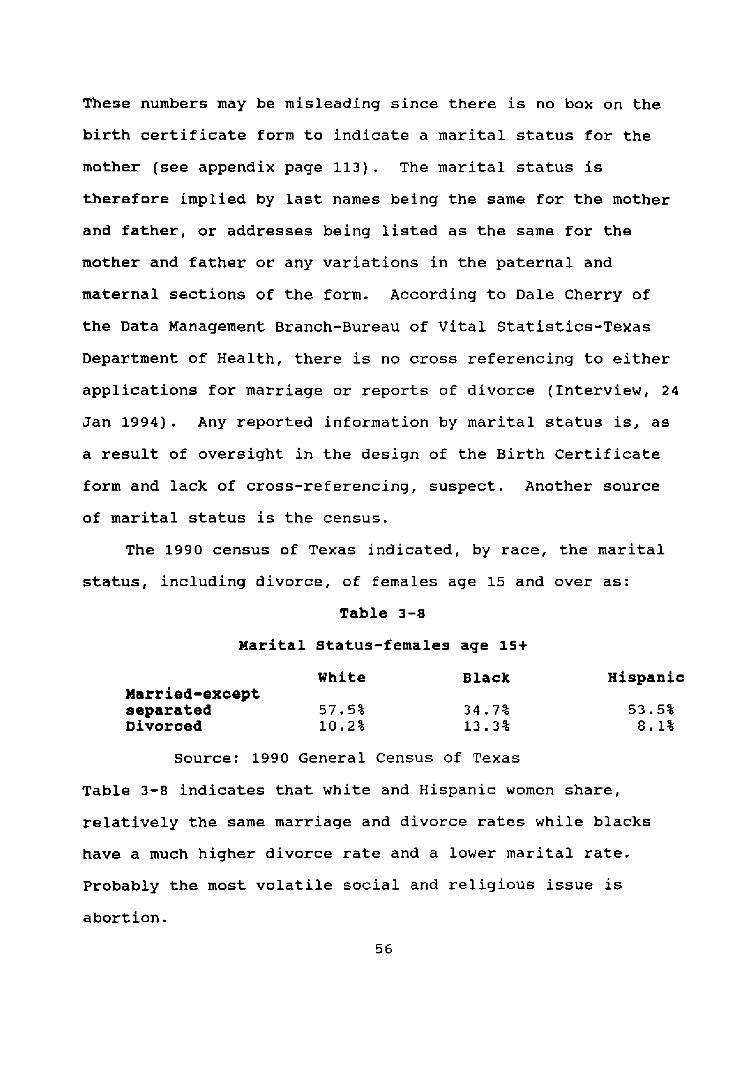
These numbers may be misleading since there is no box on t h e
birth certificate form to indicate a marital status for the
mother ( s e e appendix page 113). The marital status is
therefore implied by l a s t names being t h e same for the mother
and father, or addresses being Listed as the same fo r the
mother and father or any variations in t h e paternal and
maternal sections of the form. According to Dale Cherry of
the Data Management Branch-Bureau of V i t a l Statistics-Texas
Department of Health, there is no cross referencing to either
applications f o r marriage or reports of divorce (Interview, 2 4
Jan 1994). Any reported information by marital s ta tus is, as
a result of oversight i n t h e design of the Birth Certificate
form and lack of cross-referencing, s u s p e c t . Another source
of marital s ta tus is the census.
The 1990 census of Texas i n d i c a t e d , by race, t h e marital
status, including divorce , of females age 15 and over as:
Table 3-8
Marital Status-females age 15+
White Married-except separated 57.5% Divorced 10.2%
Black Hispanic
Source: 1990 General Census of Texas
Table 3-8 indicates that white and Hispanic women share,
relatively the same marriage and d ivorce rates while blacks
have a much higher divorce rate and a lower marital rate.
Probably the most volatile soc ia l and religious issue is
abort ion.
There were 89,051 abortions performed in Texas in 1990
(Bureau of V i t a l Statistics 1991, 225). The th ree races under
examination accounted fo r 8 5 , 6 8 3 (96.2%) of the total. The
form used in reporting an abortion does classify marital
status (BVS 1991, 225). Whites having an abort ion in 1990
comprised 5 3 . 4 percent, blacks were 21 percent, and 2 5 . 6
percent of the total were Hispanic ( s e e appendix page 98).
A l m o s t seventy-six percent 175.83 were to unmarried women ( s e e
appendix page 127). An indicator of familial and religious
influence may be the number of abortions performed on minors.
Only 4 4 4 abortions were performed on females 15 years o l d
or younger (Bureau of Vital Statistics 1991, 227). The
largest cohort to have abor t ions in Texas in 1990 were the 20
to 24 age group (Bureau of V i t a l Statistics 1991, 227). Over
one-half [61.5%] stated they were experiencing their first
abortion (Bureau of Vital Statistics 1991, 2 2 5 ) .
For every white woman who aborted i n 1990, 3.3 d i d n o t ;
for blacks t h e ratio is 2.4 b i r t h s for every abort ion, and;
Hispanics gave bir th to 5 . 3 children for every one aborted
(Bureau of V i t a l Statistics 1991, 9 5 , 2 3 2 ) . The above
information confirms not only the assertions of Jencks and
Butler but a l so the findings of Joyce and Grossman, that
Hispanics and older women are t h e least likely to abort (1990,
12). In addition to abortion, family and s o c i a l support may
be apparent in the health habits of individuals.
Poor health and nutrition h a b i t s are d i f f i c u l t to
quantify. The BVS collects information on the birth
certificate about alcohol and tobacco use during pregnancy
(BVS 1991, 2 7 ) . They readily admit that their information is
n o t a reliable indicator of usage because of a high incidence
of incomplete data (BVS 1991, 27). The BVS reported the
percentage of missing information on tobacco as 4 0 . 7 percent
and alcohol usage during pregnancy as 51.8 percent (BVS 1991,
27).
The Center for Rural Health Initiatives indicated alcohol
use by the urban populations, male and female, was 89.1
percent and the rural population usage rate was 8 4 . 9 percent;
tobacco use was exactly the same at 71.1 percent (1992, 2 2 ) .
The urban population was found to have a higher utilization
rate of illegal substances (CRHI 1992, 22). Specifics in this
area will be examined in chapter five. Health h a b i t s may also
be i n d i c a t e d by t h e utilization of nutrition based services.
The Women, I n f a n t s and Children [ W I C ] program provides
n u t r i t i o n education and specific food items to poor pregnant
women. The program is available in a l l counties i n the s t a t e
of Texas. In fact, the services are available in 475 clinics
in the s t a t e (CDF 1991, 16). Only 23% of the eligible
population is participating in the program (CDF 1991, 16).
This population, after t h e birth of their child, usually
enrol ls in the AFDC program. ~ccording to t h e Program Budget
and Statistics--Client Self-support services S t a t e office--
Texas Department of Human services [TDHS] in 1990, t h e black
population utilized, a s a percentage of a l l enrolles, AFDC
services more than either whites or Hispanics (1992, 17).
Hispanics used WIC services more but less AFDC services than
blacks. This could i n d i c a t e that Hispanic families are
extended further in the financial support area than black or
white families.
The cultural importance of pregnancy and children is
further indicated by t h e higher utilization of child health
services by Hispanics. In 1990, 137,757 children were served
by MCH care givers (MCH 1991, 16). Hispanics comprised 5 6 . 2 % ,
blacks 19%, and 22.9% whites made use of t h e child health
services offered through MCH (MCH 1991, 17). Over half of
these children were under the age of one (MCH 1991, 17). It
is interesting to note that 53% of these children served were
from the same metropolitan areas mentioned above (MCH 1991,
18).
The maternal and child h e a l t h programs in Texas spent four
billion, eight hundred and sixty million dollars in fiscal
year 1991 (CDF 1991, 21). One billion, seven hundred and
nineteen million came from s t a t e revenues (CDF 1991, 21).
Over one-half of these funds were used f o r services related to
pregnancy, birth, and t h e first year of a childs life (CDF
1991, 21). The government and private philanthropic efforts
may be not focusing their attention in the proper direction.
The next chapter will discuss how this research will a n a l y z e
the commonly recognized factors of infant mortality and low

birth weight rates.
CHAPTER FOUR
METHODOLOGY
This Chapter d i s c u s s e s t h e methodology used to test the
hypotheses advanced in the literature review chapter . This
study has elements of description, explanation and exploration
research. The descriptive aspect of t h e study is founded in
its reliance on t h e quality at tached to t h e information being
examined. The sources, see Table 4.1, are accepted standard
points of reference in the health care industry. This effort
seeks to explain "why" birth weights are lower and i n f a n t
mortality higher among blacks. T h e "whyf1 aspect has been
developed through t h e careful review of associated literature.
Finally, t h i s investigation explores t h e relatively new
subject of socio-psychological/behavioral [ S P B ] .
Specifically, it examines t h e r e l a t i o n s h i p between SPB and the
i n f a n t mortality and low birth weight rates.
Data Sources
The variables, see Table 4.1, measured in this study come
from existing statistics--reports, census bureau records,
studies and state vital statistics--germane to the t o p i c s
under examination. These statistics are being used to address
the question and the hypotheses. The existing statistics are
not really formatted in such a way that it is possible to test
them d i r e c t l y . To reimburse t h e various agencies for
extrapolating information in a manner appropriate f o r t h i s

study was beyond the financial resources of this researcher.
The evidence therefore, is compiled indirectly and it is hoped
it will be persuasive.
The major source of Texas related reports and studies
used in this analysis were issued by various departments of
the T e x a s Department of Health. The primary source is the
Bureau of Vital Statistics. Additionally, information found
in the 1990 Texas census compiled by t h e United States Bureau
of the Census is used.
Strengths and Weaknesses
This study looks at a single year , 1990. As Babbie
points out, a cross sectional study o f t e n deals w i t h a s i n g l e
point in time to explain a c a u s a l process that occurs over
t i m e (1989, 89). As such, findings a r e often called into
question. The literature researched supports possible
findings or inferences of this research. The literature is
broad enough and h a s a large enough time frame of reference to
void the negative effects of cross sectionalization in this
work. Further, this study is relevant for national
application because (1) Texas has approximately five percent
of the United States population, (2) as a percentage of the
population, the minority representation, black and Hispanic,
is large enough to be representative, and ( 3 ) the minority
populations are homogeneous enough to be representative.
The variables will be reiterated in the next chapter and
reported in narrative form, supplemented by t a b l e s , and
presented usually as percentages across r a c i a l lines. The
t a b l e s will be constructed in order to make the information
reported more understandable. Detailed information is
presented in the appendix portion of this study.
In the next chapter, hypotheses advanced in chapter two
will be tested. As with t h e traditional factors, SPB is a
composite of many variables which either can not or have not
been fully measured, or are so integrated w i t h o ther aspects
of the end result that causality and measurable effect is open
to question.
Factors, or causes, discussed in this study--education,
poverty, access/quality--are considered the primary causes of
infant mortality and low birth w e i g h t . In exploring the SPB
aspect, t h i s study takes t h e nomothetic model of explaining
infant mortality and low birth w e i g h t . It is not t h e i n t e n t
of this study to suggest SPB shou ld be classified as a cause
but rather that there may be sufficient evidence to consider
SPB as an important component, or alternative explanation, in
the general understanding of infant mortality and low b i r t h
weight. Babbie suggests that in order show causality,
illustration must, at least minimally, be established (1989,
6 2 ) . If t h e perception that SPB is a integral segment in the
infant mortality and low birth weight outcomes can be deduced
through this work, t h e n additional s t u d y of SPB is warranted.
The e ight hypotheses advanced in this study attempt to
ascertain one thing. In the state of Texas, if a factor such
as education, poverty, access/quality, and urban ic i ty are
controlled, in fan t mortality and low birth weight rates will
be similar along racial lines. The point of controlling for
these factors is to determine if there exists a difference
along racial lines. If education, poverty, access/quality and
urbanicity are key explanatory factors one would expect no
differences by race. If, on t h e o t h e r hand, differences
continue, traditional explanations (education, poverty, etc.)
are suspect.
Each hypothesis advanced in t h i s study uses existing
statistics. As previously stated, there are difficulties with
the data. Babbie indicates that t h e desire of researchers is
to select a se t of elements from a population in such a manner
as to precisely portray the population (1989, 172). Once
selected statistical methods are employed to assure as
accurate a depiction of the population a s possible. The study
populations i n this inquiry are t h e whites, blacks and
Hispanics living in Texas during t h e year 1990. Because t h i s
study is deal ing with totals within each race, statistical
manipulation is not necessary. Statistical tests exist to
reduce sampling errors. In this case, total populations are
being examined and any differences can be attributed to the
populations.
operationalisation
The infant mortality rate is reported by race as a rate per
one-thousand births in the year 1990 by the Bureau of v i t a l
Statistics. Low birth weight rates are a l so reported by race
as a percentage of live births. The additional variables used
in the two hypotheses on education are teenage b i r t h rates and
educational attainment.
The teenage b i r t h rate was reported as a percentage of
women age nineteen and below giv ing birth during the y e a r .
The educational attainment measurement is a percentage of
mothers giving birth in Texas for t h e year 1990. These two
variables coupled with the i n f a n t mortality or low birth
weight and r a c i a l variables will be used to evaluate the
educational aspect of t h e study. The next factor to be
deliberated in chapter five is poverty.
In addition to t h e rac ia l populations and either t h e
in fan t mortality or low birth weight rate there are many
variables examined in the poverty postulations. The 1990
Census Bureau information used is reported as percentages,
except per c a p i t a income, a l o n g r a c i a l lines. Measures of
poverty include (1) employment, (2) households living below
the poverty line, ( 3 ) children living below the poverty line,
( 4 ) poverty status. Another ingredient examined in this
section, and i n t h e access/quality section, i s t h e total
number of deliveries funded by ~edicaid. The ~edicaid figures
were compiled by the state agency responsible for its'
administration. It is believed t h e analysis of t h e s e factors
delivers a fair examination on the effect of poverty on infant
mortality and low b i r t h weight results. The final major
component inspected in this study is access/quality.
The literature reviewed i n this study were very explicit
in t h e importance of access and quality considerations on
infant mortality and low bir th weight consequences. The most
often discussed components were prenatal care and government
services. T h i s study examined t h e access/quality aspec t of
infant mortality and low birth weight along racial lines by
examining many indicators, in addition to prenatal care and
government services, brought out in the literature review.
The Kessner Index is a report, characterized in
percentages receiving prenatal care, internationally
recognized as an indicator of health care results for pregnant
women. Medicaid funded deliveries, discussed above, are also
examined as a feature to be considered in t h e review of access
and quality. The government aspect is a l so reflected by the
examination of MCH maternity care and child, in the case of
low birth weight, services. The factors discussed to this
point were primarily examined i n the literature in terms of
urban populations. The sub-factor of urbanicity is the final
aspect of hypothetical examination.
A m a j o r i t y of researchers on t h e t o p i c s of infant
mortality and low b i r t h weight examined urban populations.
Many were quick to point out that urban areas suffered a
higher incidence of in fan t mortality and l o w birth weight
rates than rural areas. Interlaced with t h e studies of
education, poverty, and access/quality was urbanicity. A
common theme was a high incidence of illegal drug related
factors in t h e urban setting.
This study i n s p e c t s urbanicity looking at the population
distribution and drug influence across the urban/rural
spectrum. The Center for Rural Health Initiatives was the
major source for drug related figures. The information on
population distribution in Texas for t h e year 1990 was drawn
from federal census information and the Bureau of V i t a l
S ta t i s t i c s .
Table 4.1 is a summary of t h e operationalization of
hypotheses advanced in the literature review chapter. The SPB
aspect, discussed above, is presented as a possible
alternative explanation if these hypotheses are found, after
consideration, to be not supported. The next chapter analysis
of the hypotheses is accomplished.

Table 4.1
RESEARCH DESIGN
Operational Hmothesis
1.2 E h t i m and Lou Birth Ueight
2.1 Powrty end Inf ent llortality
Variables operation Edueat ion
Education X grade 12 level achiwed
Infant k r t a l i t y Rate per 1000 l ive births
Race White, Black, Hispanic
T m g e B i r t h Rate X awrthers 19 and uder
Education
L w Birth Ueight
Race
Teenage B i r t h Rate
Poverty - Hatseholds Belou Powrty Line
lnfant Mor ta l i ty
Race
Children L i v i n g Below Poverty l ine
M i c a i d F& Deliveries
Per Capita I n c m €4-t
Poverty Status
X grade 12 Lwel =hiwed X of Total Live Births m i t e , Black, H i s m i c X mthers 19 end uder
X o f Households l iving below poverty l ine Rate per 1000 l i ve births White, Black, Hispanic X of Children L iv iw below pwerty Line Total h r of f W deliveries
Incone by Race X erployed
X above and below poverty Level
source
Texas Dept . of H u w l Services 1990 w 1990 emus
Continued on next page

Table 4.1 Continued Operational B M O ~ ~ ~ S ~ S 2.2 Pwerty Bid
L o u Birth kigt
3.1 kcess/Quality mlity and I n f s n t Wortali t y
Variable Households B e l w Pwerty L i m
Low Birth Wight
Race
Children Living Belw Poverty Line M i c a i d F l n d e d Del iwries
Per wits I n c m E l p l o y r ~ n t Poverty Stat=
Access/Quality K ~ s n e r Index Scores
Infant Mortality
Race
Late Prenatal Care K H Maternity Care
Medicaid F u d e d Deliveries
Low Birth Weight
Race
Late Prenatal Care MCH Maternity Care
Medicaid F u d d Del i ver ies
llCH Child Services
X Households Livins be lw poverty l ine X of Total Live Births White, Btack, Hispanic X Children t i v i m belou p v e r t y line Total t u b r of fuded births
Incarp by Race X eaptoyed X above erd b e l w pwerty l ine
X receiving d x p a t e pre- natal tare Rate per IOOO l i v e births mitt, Bleck, Hispanic X late-1990 X receivim mternity care2 r l h r of births fvded-1m
X receiving adeqmte pre- natal care X of to ta l l i ve births m i t e , Slack, Hispanic X late-1990 X receiving mternal care U-r of births f W- 1990
X children servd
source 1m w
Te- Dept. of H- Serv ice 1990 C m r s 1m - 1990 Gens-
1- Census, BVS
BUS, CRHI Bvs, wcn
Texas Dept . of H m Services
1m Cm-mm, BVS
BVS, CRHl BVS, M H
Texas Dept. o f H m Semi ces MCH
Continued on next page

Table 4.1 Cont inued
Urbanicity Operational pmothesis 4.1 Urben v.
Rural d I nfmt Mortality
4.2 Urben v. Rural and Low Birth
Variable Overation Source Pqwla t im of Texas X l i v i w in urban 1990 Cmm
areas of Texas Infant Mortality Rate per 1000 BVS, CRHl
Live births Race m i t e , Black, 1990 Census,
Hispanic BVS D r u g Use X d n i t t e d drug CRHI
w e Drrrg Related Arrests % ar rs ted CRHl
Popllatim of Texas
Low Birth Ueight
Race
D r y l Use
Drlrg Related Arrests
X l iv ing in urtm 19W Cevmwz areas of Texas X o f total Live BVS births White, Biack, 19W Census, Hispanic BVS X d m i t t e d drug CRHI use X arrested CRHI
LEGEND
BVS= Bureau o f Vital Stat ist ics, Texas Departslent of Health-spcial reports prepared for this study d their 1990 ArrrJel Report
WH= Bureeu o f Maternal wd Child Health, Texas Department of Health
CRHI= Cmter of Rural Health In i t i a t iwg , Texas Department of Health
1990 - 1PPO General Population Characteristics--Texas, conpiled by the Bureau of the Cmm, U.S. D e p e r m t of Colllerce
raas Dept. o f H u e n Senices= W i a L walys is report prepared by the E l ig ib i l i t y Monitoring Unit, Texas Departmnt of H w Servics
CHAPTER FIVE
ANALYSIS
Introduction
This chapter examines specifics about the Texas
experience based on information discussed in previous chapters
relating to education, poverty, access/quality, and t h e
urbanicity factors associated with infant mortality [fM] and
low birth weight [LBW]. Hypotheses previously presented will
be examined by each factor. Socio-psychological/behavioral
[SPB] will be examined as a possible significant factor in the
equation. It is important to restate t h a t the factors--
education, poverty, and access/quality, and the sub-component
ubanicity--attributed to infant mortality and low birth weight
are not challenged as to their contribution to the problem.
Rather, if by controlling for each factor a disparity is
indicated along racial lines the fac tor under examination
could be s a i d to have an atypical effect on t h e infant
mortality and low birth weight rate fo r that racial group.
The infant mortality rate and low birth weight rate are common
variables in the hypothese proposed in this study.
In 1990, the overall infant mortality rate in Texas was
eight per one-thousand births. According to t h e Department of
Health, Bureau of Vital S t a t i s t i c s (BVSJ(1991, 8 2 ) the rates
ethnically were :

Table 5.1
Infant Mortality in Texas by Race--1990
White Black Hispanic 6 . 8 14.6 7 . 3
In that same year, BVS reported the low birth weight rate f o r
the s t a t e was seven percent (1991, 57) . Ethnically the rates
were:
Table 5 . 2
Low B i r t h Weight Rate by Race in Texas--1990
White Black Hispanic 5 . 8 % 12.7% 6 . 3 %
Clearly, there is a great disparity between the races.
Since the black experience, indicated in tables 5.1 and
5 . 2 above, in infant mortality and low b i r t h weight is roughly
double t h a t of whites or Hispanics, it would logically follow
that the Black experience with the factors under examination
would be approximately twice that of the white or Hispanic
community. This examination begins w i t h t h e educational
aspect.
Education
Hypotheses: H: 1.1 If education is controlled, t h e i n f a n t
mortality rate will be similar by race.
H: 1.2 If edication is controlled, the low birth weight rate will be similar by race.
In Texas, approximately sixty-seven percent of women
giving birth in 1990 had achieved a twelth grade education
level.

Racially, the number of mothers reporting at l east the
education level a of high school graduate, according to BVS
(see appendix page 116), was:
Table 5.3
Education of grade Level 12 or Higher--Mothers 1990
white Black Hispanic 81.7% 71.4% 42.1%
This t a b l e indicates more t h a n twice a s many Hispanic mothers
[ 5 6 . 3 % ] in 1990 had below a high school education level as
Black mothers [ 2 7 . 2 % ] , and over three times the rate of white
mothers (17.5%) during t h e same period (BVS 1990). These
percentages do not equal 100 due to missing data on t h e birth
certificate form. The effect of education on birth outcomes
w a s found, in the literature review, to not be uniform.
Pampel and Pillai found that t h e higher t h e education
level of women, the more likely they were to live a healthy
lifestyle and seek prenatal care (1986, 526). This behavior
would reduce i n f a n t mortality and low birth weight rates
(Pampel and ~ i l l a i 1 9 8 6 , 5 2 6 ) . Eberstadt found the rates were
more pronounced for blacks than whites who d i d n o t have a t
l eas t a h igh school education ( 1 9 9 1 , 37). The experience of
Texas i n 1990, which is reflective of t h e long term trend
experienced by the state, does not support t h e Pampel and
P i l l a i or t h e Eberstadt findings. One explanation may be
found in the percentage of teenage mothers.
The percentage of teenage mothers went down between 1989
and 1990 from 15.3 to 1 4 . 8 percent (Bureau of V i t a l Statistics
73

1991, 2 2 ) . Teenage, nineteen and under, birth rates are
insignificant when looking at t h e education factor. The BVS
data indicates, in this category, black and white mothers who
had at least a high school education were roughly equal
[black-30% vs. white-30.6%) while Hispanic mothers reporting a
high school education was only 16.8 percent ( s e e appendix page
116). There is a significance when the age of t h e mother is
lowered to seventeen. Table 5 . 4 indicates that black and
Hispanic women age seventeen are more likely than whites to
become pregnant.
Table 5 . 4
Births to Women Age 17 and Under--Texas 1990 (percent of total children)
Uhite Black Hispanic 3.1% 9.6% 7.2%
Source: Bureau of Vital Statistics
Reflected in t h e rate of women who d i d not have a grade 12
level education is the dropout r a t e . S ta tewide t h e dropout
rate is 5 . 7 per hundred in urban areas and 3 . 2 per hundred in
rural areas. The analysis of urbanicity will be addressed in
detail later in this chapter, yet there is a relationship to
education that will be examined at t h i s time.
I n the 1989-1990 school year six o u t of seven student
dropouts were f r o m an urban area (center fo r Rural Health
Initiatives 1992, 2 5 ) . It would be expected, because the drop
o u t rate was h i g h e r , t h a t t h e infant mortality r a t e and low
b i r t h weight rates experienced by urban women would be
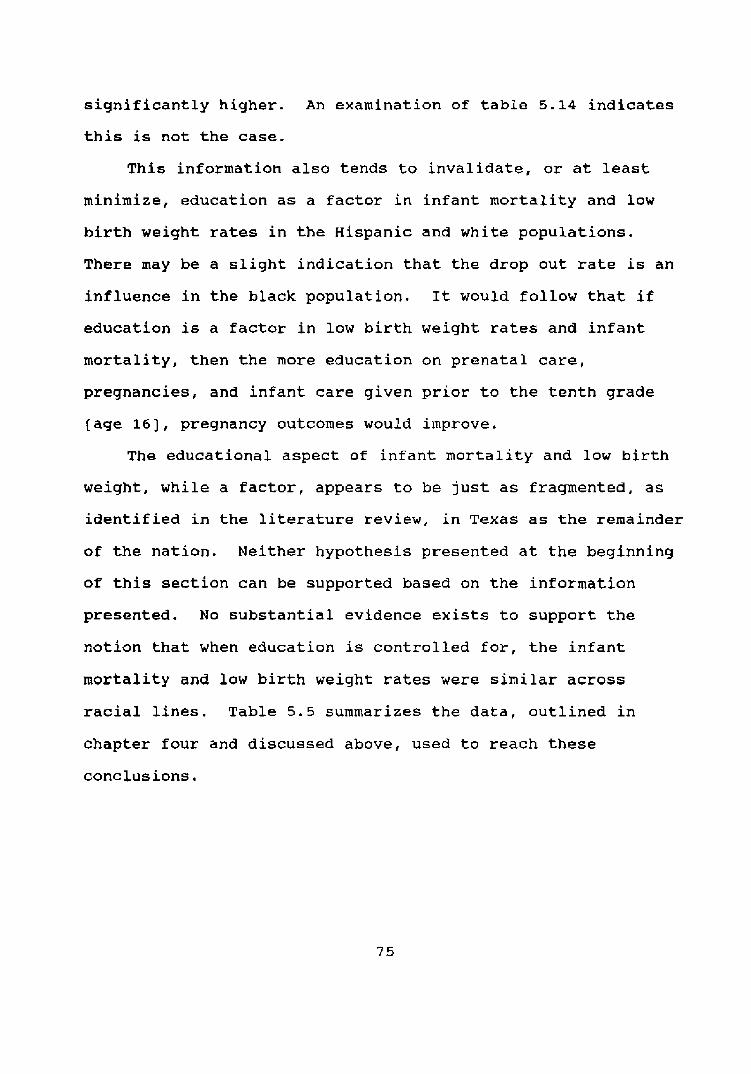
significantly higher. An examination of t a b l e 5 . 1 4 indicates
this is not the case.
This information also tends to invalidate, or at least
minimize, education as a factor in infant mortality and low
birth weight rates in the Hispanic and white populations.
There may be a slight indication that t h e drop out rate is an
influence in the black population. It would follow that if
education is a factor in low b i r t h we ight rates and i n f a n t
mortality, then the more education on prenata l care,
pregnancies, and i n f a n t care given prior to the t e n t h grade
[age 161, pregnancy outcomes would improve.
The educational aspect of infant mortality and low birth
weight, while a factor, appears to be just as fragmented, as
identified in the literature review, i n Texas as the remainder
of the nation. Neither hypothesis presented at t h e beginning
of t h i s sect ion can be supported based on the information
presented. No s u b s t a n t i a l evidence exists to support the
n o t i o n t h a t when education is controlled for, t h e infant
mortality and low b i r t h weight rates were similar across
racial lines. Table 5.5 summarizes the data , outlined in
chapter f o u r and d iscussed above, used to reach these
conclusions.
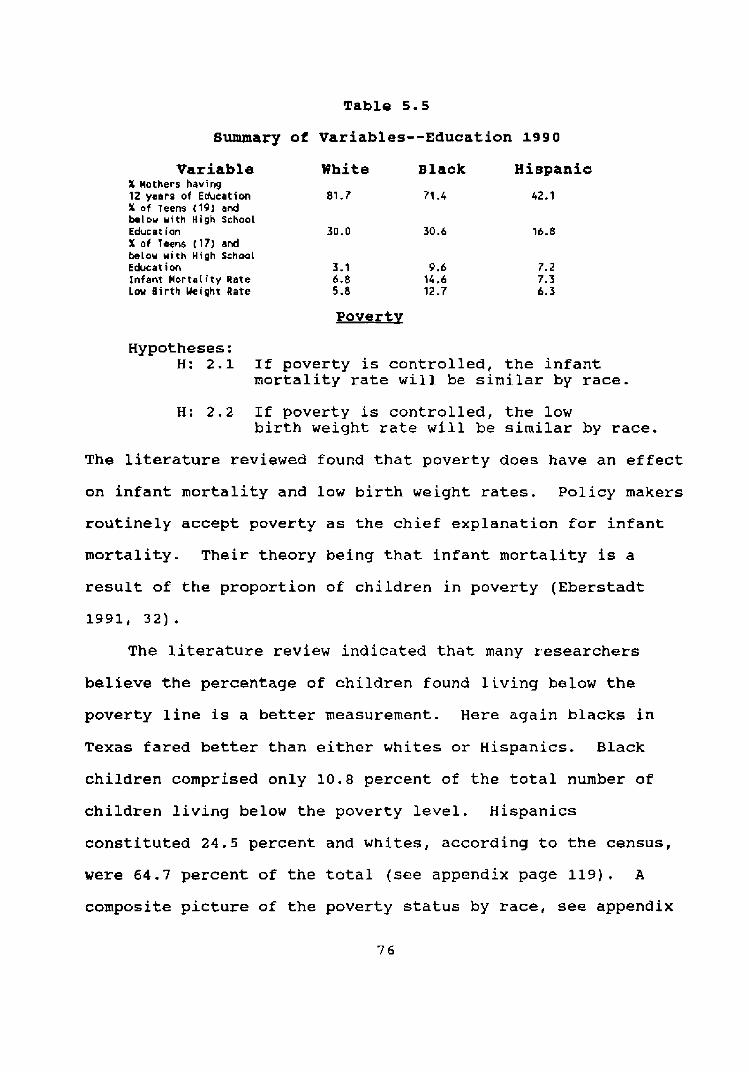
Table 5 . 5
Summary of variables--Education 1 9 9 0
Variable White Black Hispanic X Mothers having 12 years of Educeticm 81.7 71 -4 42.1 % of Teens (19) and belou with High School Educ at ion 30.0 30.6 16.8 X o f Terns (17) end below with High School Educat i m 3.1 9.6 7.2 Infant MortaLity Rate 6.8 14,6 7.3 Low B i r t h Ueight Rate 5 -8 12.7 6.3
Poverty
Hypotheses: H: 2.1 If poverty is controlled, the i n f a n t
mortality rate will be similar by race.
H: 2 . 2 If poverty is controlled, the low birth weight rate will be similar by race.
The literature reviewed found that poverty does have an effect
on infant mortality and low birth weight r a t e s . Policy makers
routinely accept poverty as the chief explanation for i n f a n t
mortality. Their theory being that i n f a n t mortality is a
result of t h e proportion of children in poverty (Eberstadt
The literature review indicated that many researchers
believe the percentage of children found living below the
poverty line is a better measurement. Here again b l a c k s in
Texas fared better t han either whites or Hispanics. Black
children comprised only 10.8 percent of the t o t a l number of
children living below the poverty level. Hispanics
constituted 2 4 . 5 percent and whites, according to the census,
were 64.7 percent of the total (see appendix page 119). A
composite picture of the poverty s ta tus by race, see appendix
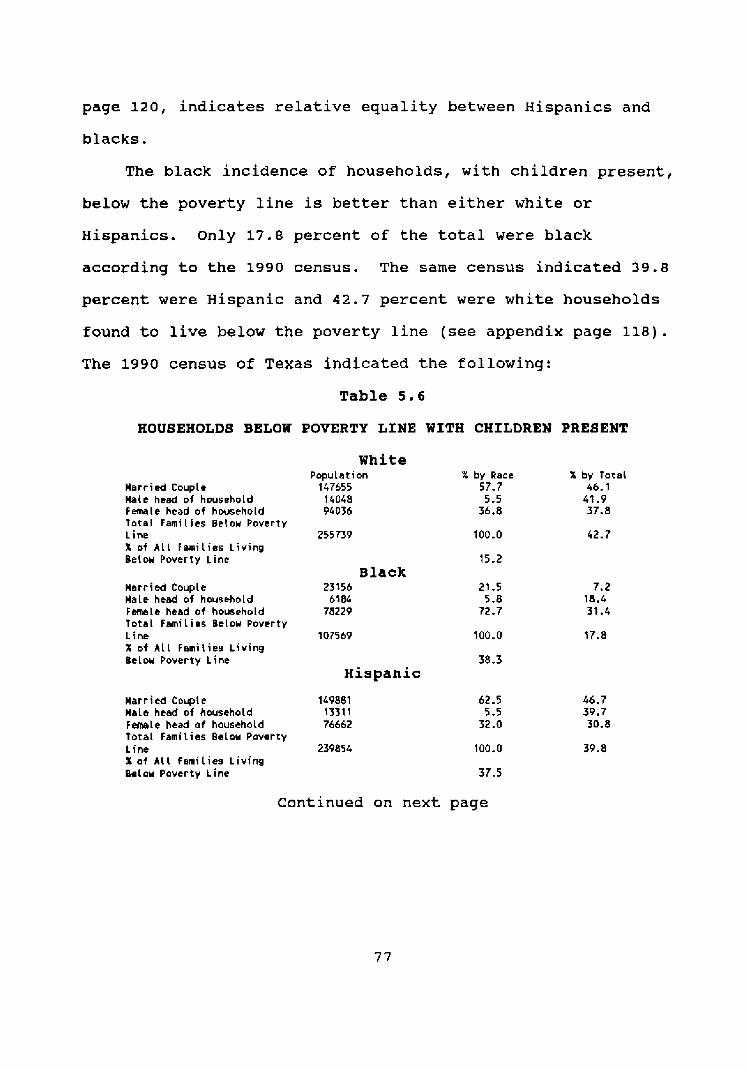
page 120, indicates relative equality between Hispanics and
blacks.
The black incidence of households, with children present,
below the poverty line is better than either white or
Hispanics. Only 17.8 percent of t h e total were black
according to the 1990 census. The same census indicated 39.8
percent were Hispanic and 4 2 . 7 percent were white households
found to live below t h e poverty line (see appendix page 118).
The 1990 census of Texas indicated the following:
Table 5 . 6
HOUSEHOLD8 BELOW POVERTY LINE WITH CHILDREN PRESENT
White
Marr ied Couple Ha i r head of household Fernale head of hwsehold T o t a l Families Below Poverty Line X of A L L Famil ies L i v i n g Beiow Poverty Line
M a r r i d Couple Male heed of household F m l e heed of housah~ld Total Famil ies Bclou Poverty Line X of A l l Famil ies L iv ing Belou Poverty Line
Population 147655
14048 94036
Black 23156
6184 78229
Hispanic
Harried C n q l e 149881 Male htad of household 1331 1 F m l e head of household 76662 Total Famil ies Below Poverty L ine 239854 X af A i l fami l ies living Below Poverty t ine
X by Race 57.7
5 - 5 36.8
X by Total 46.1 42 -9 37.8
C o n t i n u e d on next page
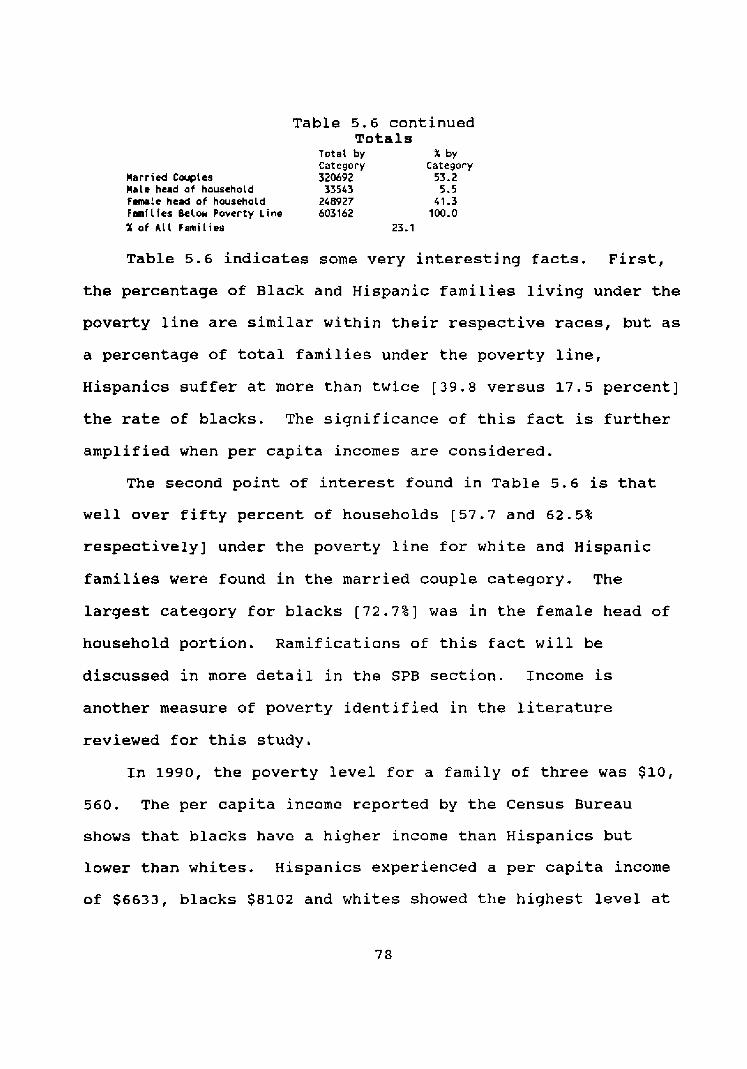
Table 5 . 6 continued Totals
T o t a l by X by Category Category
Harried Couples 320692 53.2 M a l t head af household 33543 5.5 Female head of household 248927 41 - 3 Famllles Below Poverty Line 603162 100.0 X of A l l Famil ies 23.1
Table 5 . 6 indicates some very interesting f a c t s . F i r s t ,
the percentage of Black and isp panic families living under the
poverty line are similar within their respective races, but as
a percentage of total families under the poverty line,
Hispanics suffer at more than twice [ 3 9 . 8 versus 17.5 percent]
the rate of blacks. The significance of this fact is further
amplified when per capita incomes are considered.
The second point of interest found in Table 5.6 is that
well over fifty p e r c e n t of households [57.7 and 6 2 . 5 %
respectively] under the pover ty line for white and isp panic
families were found in the married couple cateqory. The
largest cateqory for blacks [72.7%] was in the female head of
household p o r t i o n . Ramifications of this f a c t will be
discussed in more detail in the SPB section. Income is
another measure of poverty identified in the literature
reviewed for this study.
In 1990, t h e poverty level f o r a family of three was $10,
5 6 0 . The per capita income reported by the Census Bureau
shows that blacks have a higher income than Hispanics but
lower than whites. Hispanics experienced a per capita income
of $6633, blacks $8102 and whites showed t h e highest level at
$14629. Eberstadt found that in t h e states with the lowest
infant mortality rates suffered from the lowest per c a p i t a
incomes (1991, 10). Using per capi ta income as a measure, the
per cap i ta income information indicates Hispanics should have
twice t h e rate of infant mortality and the low birth weight
rate of w h i t e s and significantly more t han blacks. The per
capita incomes could be skewed by a higher or lower number of
incomes at the extreme levels of t h e spectrum. Some
researchers believe that t h e percentage of households below
the poverty line is a better measurement. Unquestionably,
when the above information is considered, t h e Hispanic
experience can be characterized as more severe than either
blacks or whites. The income disparity can not be s a i d to be
the r e s u l t of unemployment.
A s a percent of the total population, by race, living
below t h e poverty line Hispanics experienced 3 3 percent and
blacks 31 percent, while w h i t e s encompassed 14 percent. One
area of poverty sociologists call attention to is employment
(Wilson 1987, 8 2 ) . In 1990, according to t h e Census Bureau,
blacks and ~ispanics, age sixteen and over, experienced
relatively the same employment percentages by race [ 5 6 . 4 vs.
57.81 and n o t significantly less t h a n whites [62.2%] (see
appendix page 122). Another poverty indicator offered by many
is t h e employment status of females (Wilson 1987, 72). Here
again black females, age 16 and over, in Texas enjoyed a
slightly higher percentage, by race, of employment than either
whites or isp panics (see appendix page 122).
The employment aspect is relatively equal by race.
Hispanics enjoyed a 1.4 percent greater level of employment
[ 5 7 . 8 versus 5 6 . 4 ) over blacks. Black women enjoyed the
highest percentage of employment, 2% more than w h i t e s and 5.7%
over Hispanics (See appendix page 122). The effect of poverty
can also be examined by looking at Medicaid utilization.
The federally mandated level for Medicaid assistance is
133 percent of the poverty l eve l and raised t h e income ceiling
to $ 1 4 , 0 4 5 (Children's Defense Fund 1992, 11). Nationally,
Medicaid funding accounts f o r abou t n i n e percent of t h e women
ages 15 to 4 4 (Hale 1990, 22). The Texas Medicaid enrollment
for r u r a l areas was 10.8 percent of the population and 8.9
percent of the urban population was enrolled in Medicaid
(Center f o r Rural Health Initiatives 1992, 27). In Texas,
according to Timothy Varian, a Supervisor at t h e Program
Budget & Statistics Client Self-support Services division of
the Department of Human Services, Medicaid funded
approximately one-half [ s e e appendix page 121) of the live
births in 1990 (Telephone interview, 11/12/92). A n
examination of t h e information [appendix page 1211 indicates
the Medicaid utilization rate by Hispanic and black women is
relatively equal. It is difficult to properly a s s i g n
percentages since Medicaid f u n d i n g is reported on a fiscal
year and t h e birth t o t a l s are reported on a calendar year.
~t is interesting to note that the number of b i r t h s funded
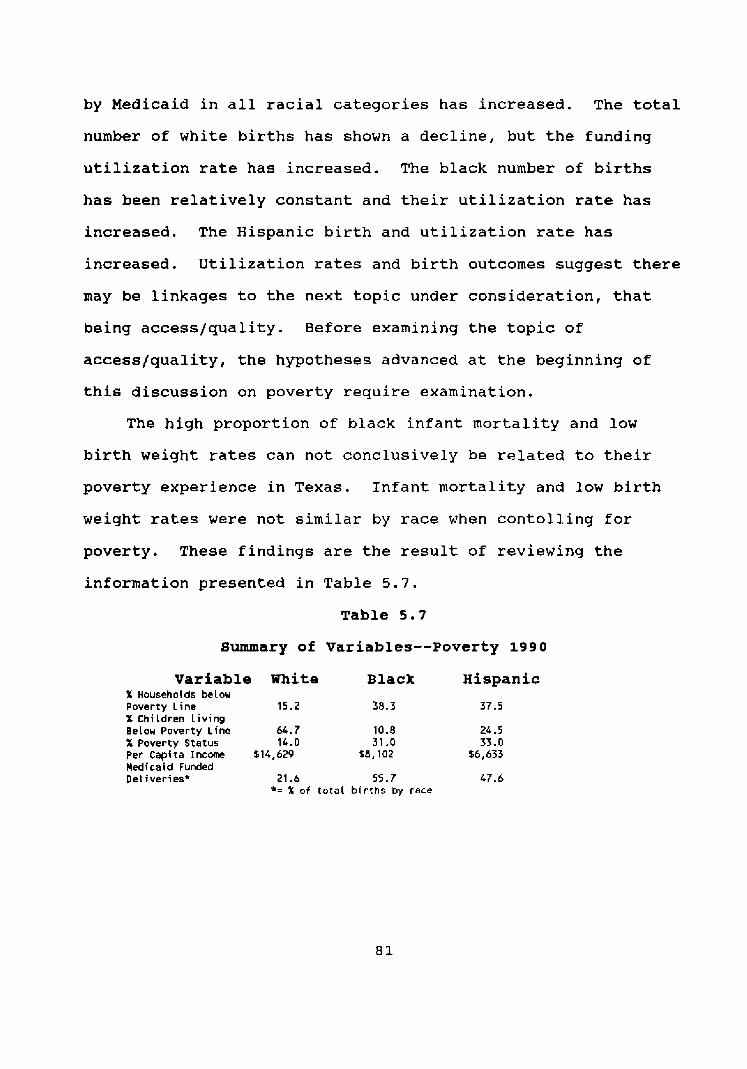
by Medicaid in a l l racial categories has increased. The total
number of white births has shown a decline, but t h e funding
utilization rate has increased. The black number of births
has been relatively constant and their utilization rate has
increased. The Hispanic birth and utilization rate has
increased. Utilization rates and birth outcomes suggest there
may be linkages to t h e next topic under consideration, that
being access/quality. Before examining t h e t o p i c of
access/quality, t h e hypotheses advanced at t h e beginning of
this discussion on poverty require examination.
The h i g h proportion of black infant mortality and low
birth weight rates can not conclusively be related to their
poverty experience in Texas. Infant mortality and low birth
weight rates were not s i m i l a r by race when contolling f o r
poverty. These findings are t h e result of reviewing the
information presented in Table 5.7.
Table 5 . 7
Summary of Variables--Poverty 1990
Variable White B l a c k Hispanic % Households below Poverty Line 15.2 38.3 37.5 X Children Living Below Poverty l i n e 64.7 10.8 24.5 X Poverty Status 14.0 31 .O 33.0 PerCapitaIncome $14,629 $8,102 16,633 Medicaid Funded Del iver ies* 21.6 55 .7 47.6
*= % of to ta l b i r t h s by race
Hypotheses : H: 3.1 If access/quality is controlled,
the infant mortality rate will be similar by race.
H: 3.2 If access/quality is controlled, the low birth weight rate will be similar by race.
The literature reviewed indicated that individuals
classified as poor were e n j o y i n g greater access to and quality
of care than middle-income families (Jencks 1992, 7 4 ) . The
Jencks analysis is confirmed by both the Schlesinger &
Kronebusch (1990) and Pampel & Pillai (1986) s t u d i e s . The
previous discussions on education and poverty indicated
Hispanics were less educated and poorer, by any measurement,
than either whites or b l a c k s . T h e i r birth outcomes, i n f a n t
mortality and low birth weight r a t e s , a r e h a l f t h e rate of
blacks and comparable to whites. Often, in t h e literature,
when poverty and education are n o t found to be discordant the
blame is laid at t h e feet of the access/quality aspect of
i n f a n t mortaltity and low birth weight by the researchers
(Howze 1987, 120) . As discussed in chapter t w o , t h e access/quality topic is
often c lose ly studied in terms of a n urban population and very
little is analyized in state-wide terms, which would include
rural populations. Information, significant to this topic in
Texas, was found subdivided into urban and rural categories.
While t h e next section is d e d i c a t e d to a deliberation on
urbanicity, it is an intregal aspect of an examina t ion of this
topic and a better understanding of access/quality. Some
information is, therefore, reported in urban-rural terms in
t h i s section.
Access
Urban women enjoy better access to prenatal care than do
women living in rural areas (Schlesinger and Kronebusch 1990,
103). In 1990, 8 6 . 8 percent of b l a c k s and 8 4 . 1 percent of
Hispanics lived in urban areas. Blacks comprise 12.4 percent
of urban area populations, while Hispanics t o t a l e d 2 6 . 3
percent (Center for Rural Health Initiatives 1992, 11). The
1990 census indicated, as a percentage by race, more Hispanics
lived either outside an urban area or in a rural location than
blacks but less than whites (see appendix page 115). Access
for blacks and Hispanics would be about equal, given a l l the
information above, and their birth outcomes should, therefore,
be on par. The percentage of low birth weight babies born in
Texas during 1990 was nearly the same for both urban and rural
mothers (Center for Rural Health Initiatives 1992, 35). What
is unusual is that both white and Hispanic low birth weight
rates were slightly higher in rural areas whereas; the black
experience was slightly lower i n r u r a l areas. The infant
mortality rate for Hispanics and whites was higher in r u r a l
areas, but black i n f a n t mortality was higher in the urban area
(Center for Rural Health Initiatives 1992, 36).
In 1990, 36.3 percent of rural mothers and 29.8 percent of
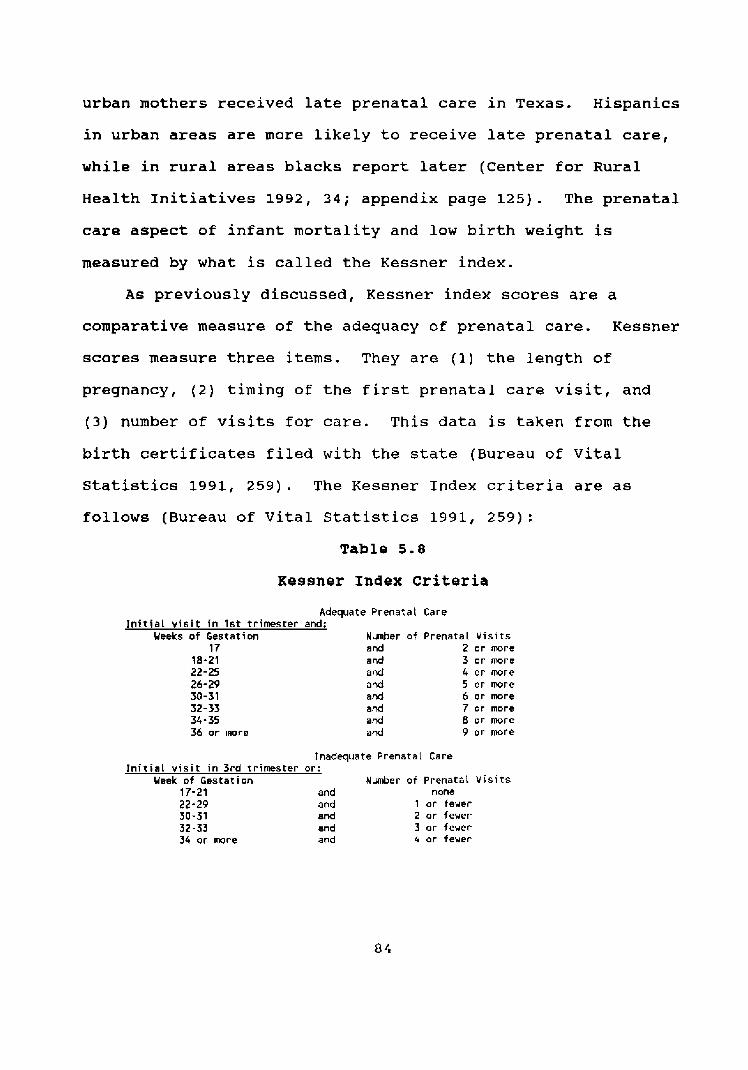
urban mothers received l a t e prenatal care in Texas. Hispanics
in urban areas are more likely to receive late prenatal care,
w h i l e in rural areas b l a c k s report later (Center for Rural
Health ~nitiatives 1992, 3 4 ; appendix page 125). The prenatal
care aspect of infant mortality and low birth weight is
measured by what is called the Kessner index.
A s previously discussed, Kessner index scores are a
comparative measure of t h e adequacy of prenatal care. Kessner
scores measure three items. They are (1) t h e l e n g t h of
pregnancy, (2) t i m i n g of t h e f i r s t prenata l care v i s i t , and
( 3 ) number of visits for care. This data is t a k e n from the
birth certificates filed with the state (Bureau of Vital
S t a t i s t i c s 1991, 259). The Kessner Index criteria a r e as
follows (Bureau of Vital Statistics 1991, 259):
Table 5 . 8
Kessner Index Criteria
Adequate Prenatal Care I n i t i a l v i s i t i n 1st tr imester and:
Weeks of Gestation Nunber of Prenatal V i s i t s 17 and 2 or more
18-21 and 3 or m r e 22-25 and 4 or more 26-29 and 5 or more 30-31 a d 6 o r more 32-33 and 7 or more 34 - 35 and 8 or more 36 or m r e and 9 o r more
Inadequate Prenatat Care I n i t i a l v i s i t i n 3rd trimester or:
Week of Gestation Number of Prenatai V i s i t s 17-21 and none 22-29 and 1 or fewer 30-31 and 2 or fewer 32-33 and 3 or fewer 34 or more and 4 or fewer
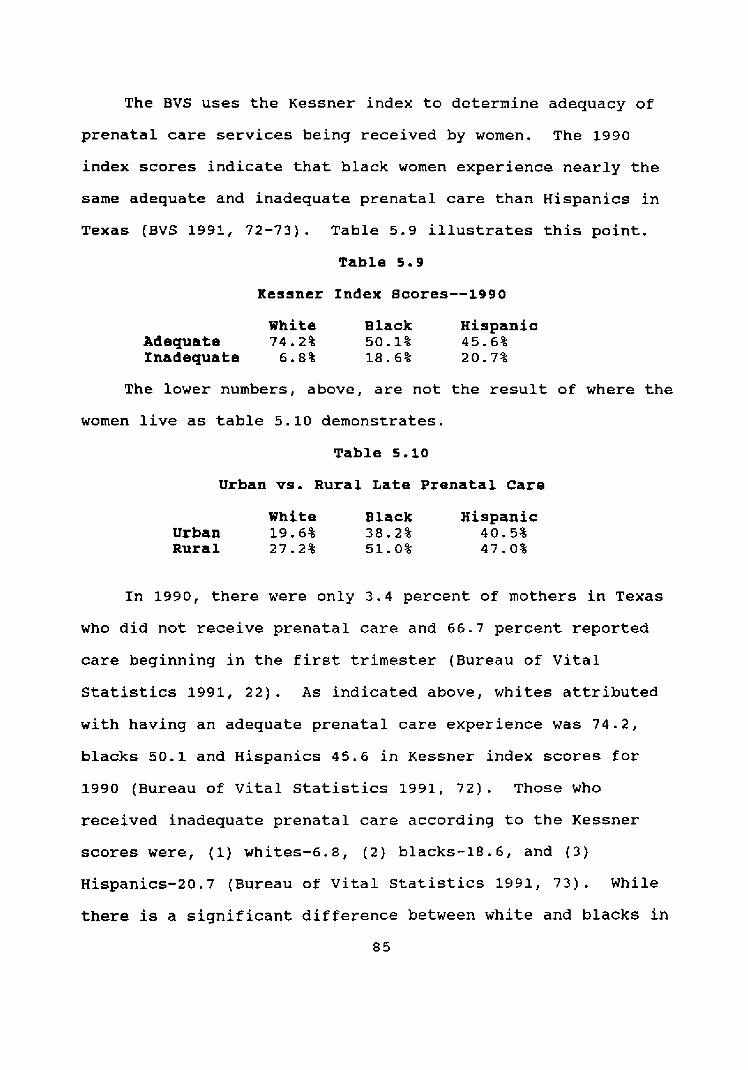
The BVS uses t h e Kessner index to determine adequacy of
prenatal care services being received by women. The 1990
index scores indicate that black women experience nearly t h e
same adequate and inadequate prenatal care than Hispanics in
Texas (BVS 1991, 72-73). Table 5.9 illustrates this point.
Table 5 . 9
Kessner Index Scores--1990
White Black Hispanic Adequate 7 4 . 2 % 50.1% 45.6% fnadequate 6 . 8 % 18.6% 20.7%
The lower numbers, above, are not the result of where the
women live as table 5.10 demonstrates.
Table 5 . 1 0
Urban vs. Rural Late Prenatal Care
White Black Hispanic Urban 19.6% 38.2% 40.5% Rural 2 7 . 2 % 51.0% 4 7 . 0 %
In 1990, there were only 3 . 4 percent of mothers in Texas
who d i d not receive prenatal care and 66.7 percent reported
care beginning in t h e first trimester (Bureau of Vital
Statistics 1991, 22) . A s indicated above, whites attributed
with having an adequate prenatal care experience was 74.2,
blacks 50.1 and Hispanics 4 5 . 6 in Kessner index scores for
1990 (Bureau of Vital S t a t i s t i c s 1991, 72). Those who
received inadequate prenatal care according to t h e Kessner
scores were, (1) whites-6.8, ( 2 ) blacks-18.6, and (3)
Hispanics-20.7 (Bureau of Vital Statistics 1991, 73). While
there is a significant difference between white and blacks in
8 5
Texas, the difference between whites and Hispanics is even
greater (see appendix page 126).
Kessner scores for women who used clinics or h o s p i t a l
outpatient departments enjoyed a better outcome than did those
who were treated by their private physicians. T h i s was true
even for those women who began their care later in the i r
pregnancies (Schlesinger and Kronebusch 1990, 102).
103). The Schlesinger and Kronebusch study found that a
system of prenatal care founded in clinic care or hospital
outpatient departments was t h e more preferable method of
prenatal care delivery (1990, 99).
Community and Migrant Health Care Centers [CMHCC], which
are located in areas of t h e state where prenatal care is most
needed, have established a sliding scale rate structure in
order to serve the neediest populations (Community and Migrant
Health Centers 1991, 18). The CMEICC bridge the gap between
totally public and private care givers, These types of
facilities are funded, at least in part, by a governmental
e n t i t y and it follows that participation in state prenatal
outreach programs and Medicaid enrollment improves access to
prenatal care and birth outcomes which were the concerns
addressed by ~chlesinger and Kronebusch (1990, 99,107).
Schlesinger and Konebusch implied that access and quality
could be measured by i n f a n t mortality across r a c i a l lines
(1990, 106).
If quality and access were racially determined there would
be a significant difference i n i n f a n t death, mortality,
totals. Infant deaths in Texas t o t a l e d 2536 in 1990. Of
those deaths, whites totaled 40.3 percent, blacks 2 4 . 9 , and
3 4 . 9 percent Hispanic (Bureau of V i t a l S t a t i s t i c s 1991, 216).
Neonatal deaths , infant deaths in the first 27 days of life,
comprised 61.2 percent of a l l infant deaths in 1990 (Bureau of
Vital S t a t i s t i c s 1991, 8 3 ) . Of the 1552 deaths, 3 9 . 4 percent
were whites, 2 3 . 7 percent black, and 36.9 percent were
Hispanic (Bureau of Vital Statistics 1991, 217) . Qyality
As previously discussed, quality is closely linked to
access. The medical system in the United States has been
found to have no harmful effects on infant mortality (Pampel
and Pillai 1986, 537). The quality of prenatal care in a
variety of prenatal care facilities h a s not been wide ly
studied; in fact, there were no published studies as of 1990
that proved the highest quality of prenatal care was rendered
by private physicians (Schlesinqer and Kronebusch 1990, 96).
Further, the black low birth weight rate is not significantly
affected by t h e location of their care. The black low birth
weight rate for urban Texas areas was 12.8 versus 11.9 f o r
rural care. This indicates that the quality of care is
re lat ive ly t h e same in rural or urban areas of Texas (Center
for Rural Health Initiatives 1992, 35).
The Primary Health Care Services Program of t h e T e x a s
Department of Health reported that, in 1990, of individuals
living under one-hundred and fifty percent of t h e poverty
level, 4 5 . 7 percent of them have private health insurance and
31.9 percent of them are actively enrolled in Medicaid (1992,
6 ) . Medicaid funded' slightly over one-half of the black
births and nearly one-half the Hispanic b i r t h s in Texas in
1990 (see appendix page 121). Federal funding of services is
not the only method of care for low income individuals offered
in the state.
The Bureau of Maternal and Child Health Services assists
in funding 49 local health agencies and over 300 clinics i n
the state (MCH 1991, 8). The Bureau coordinates referrals f o r
maternal and child services between both state and federal
agencies (MCH 1991, 8 ) . These agencies a r e located primarily
in urban areas. The MCH reported serving 7 4 , 4 9 9 women for
maternity needs and 137,757 children (1991, 19). Of t h e
children served, 22.9 percent were white, 19 percent were
black, and 56.2 percent were Hispanic (1991, 17). These
percentages are impor tan t since 53.1 percent of these children
were under the age of one (MCH 1991, 17). Of t h e maternity
needs for low income pregnant and postpartum women services,
Hispanics comprised 55.4 percent, blacks 17 percent and whites
t h e n o t
Medica BVS birth possible,
.id funding of b i r t h s is reported by fiscal year and report is by calendar year. A direct correlation is but the information provided (see appendix page 1
indicates a clear p a t t e r n of utilization across racial lines. Therefore, reporting utilization over a calendar period is sustainable.
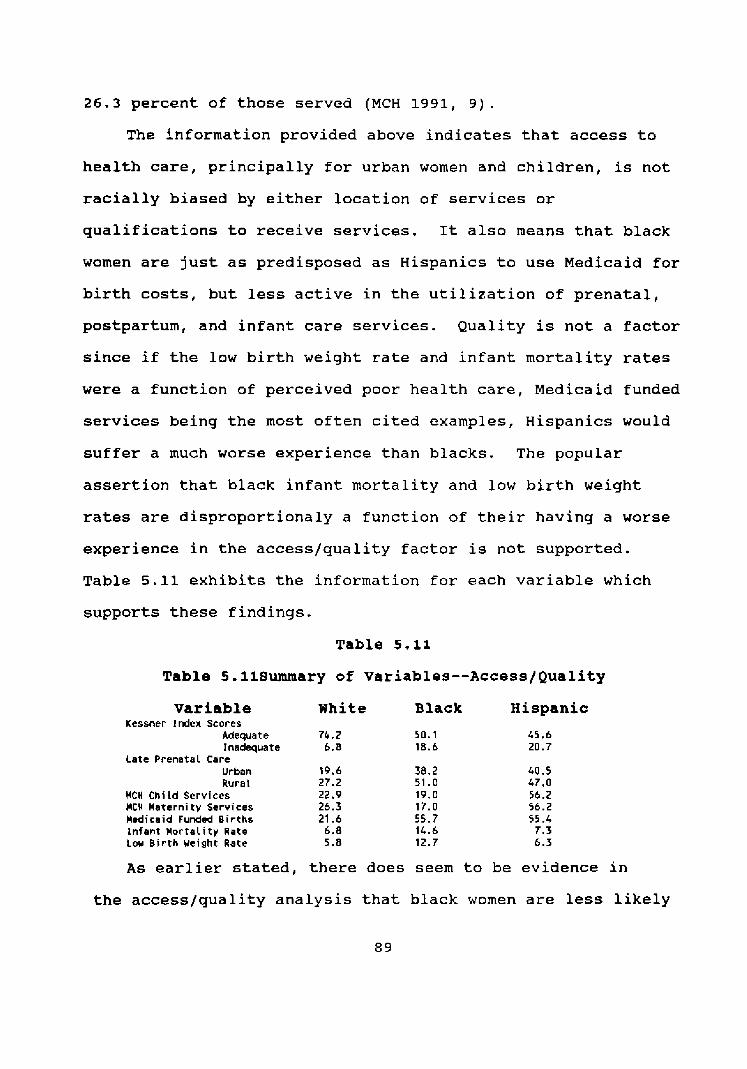
26.3 percent of those served (MCH 1991, 9).
The information provided above indicates that access to
health care, principally for urban women and children, is not
racially biased by either location of services or
qualifications to receive services. It a l s o means that black
women are just as predisposed as Hispanics to use Medicaid f o r
birth costs, but less active in t h e utilization of prenatal,
postpartum, and in fant care services. Quality is not a factor
since if the low birth weight rate and infant mortality rates
were a function of perceived poor health care, Medicaid funded
services being t h e most o f t e n cited examples, isp panics would
suffer a much worse experience than b l a c k s . The popular
assertion that black infant mortality and low birth weight
rates are disproportionaly a function of their having a worse
experience in t h e access/quality factor is not supported.
Table 5.11 exhibits t h e information f o r each variable which
supports these findings.
Table 5.11
Table 5.11Summary of Variables--Access/Quality
Variable Kessner Index Scores
Adequate Inadequate
Late Prenatal Care Urban Rural
MCH Chiid Services MCH Maternity Services Medicaid Funded Births infant Mor ta l i t y Rate Low Birth Weight Rate
White B l a c k Hispanic
A s earlier stated, there does seem to be evidence in
the access/quality analysis that black women are less likely
to seek prenatal or infant health care. This perception
indicates another factor may be involved. The SPB portion of
this study will examine this perception as the f i n a l factor to
be scrutinized. It is important to note at this point in t h e
analysis that when controlled f o r , none of the commonly
accepted factors--education, poverty, and access/quality--
associated with in fant mortality and low birth weight rates
have been found to have a disproportional impact on any ethnic
population of Texas. It is not an assertion of this study
that these factors do n o t affect t h e infant mortality and low
birth weight rates.
Close ly amalgamated into the education, poverty, and
access/quality f a c t o r s is an urbanicity element. The
literature review indicated most studies are focused on
examining the subjects of this effort in an urban s e t t i n g .
Before scrutinizing SPB, the effect of urbanicity will be
probed.
Urbanicit~
Hypotheses :
H: 4.1 If urbanicity is controlled, t h e infant mortality rate will be similar
by race.
H: 4 . 2 If urbanicity is controlled, t h e low birth weight rate will be similar by race.
In each s e c t i o n examined to this point, the research has
been affected in some manner by t h e residence, urban or rural,
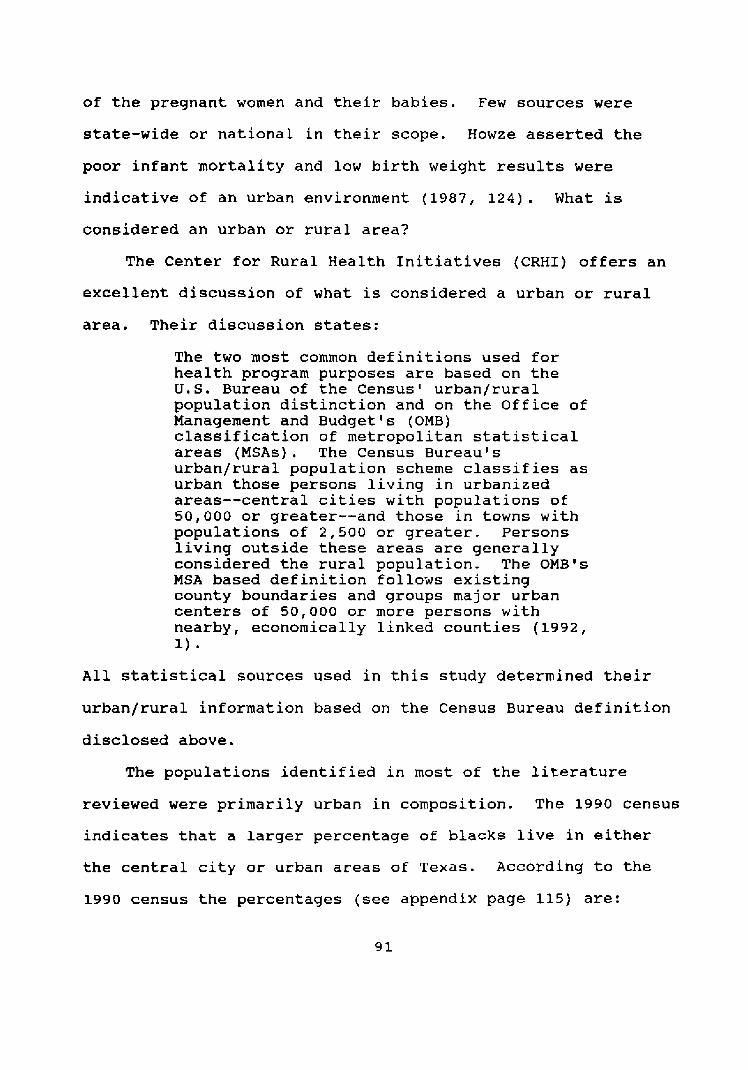
of the pregnant women and their babies. Few sources were
state-wide or national in their scope. Aowze asserted the
poor infant mortality and low birth weight results were
indicative of an urban environment (1987, 124). What is
considered an urban or r u r a l area?
The Center for Rural Health Initiatives (CRHI) offers an
excellent discussion of what is considered a urban or rural
area. Their discussion states:
The two most common definitions used for health program purposes are based on t h e U . S . Bureau of the Censust urban/rural population distinction and on t h e Office of Management and Budget's (OMB) classification of metropolitan statistical areas (MSAs). The Census Bureau's urban/rural population scheme classifies as urban those persons living i n urbanized areas--central cities with populations of 50,000 or greater--and those i n towns w i t h populations of 2,500 or greater. Persons living outside these areas are generally considered the rural population, The OMB's MSA based definition follows existing county boundaries and groups major urban centers of 5 0 , 0 0 0 or more parsons w i t h nearby, economically linked counties (1992, 1)
All statistical sources used in this study determined their
urban/rural information based on the Census Bureau definition
disclosed above.
The populations identified in most of the literature
reviewed were primarily urban in composition. The 1990 census
indicates that a larger percentage of blacks live in either
t h e central city or urban areas of Texas. According to the
1990 census the percentages (see appendix page 115) are:
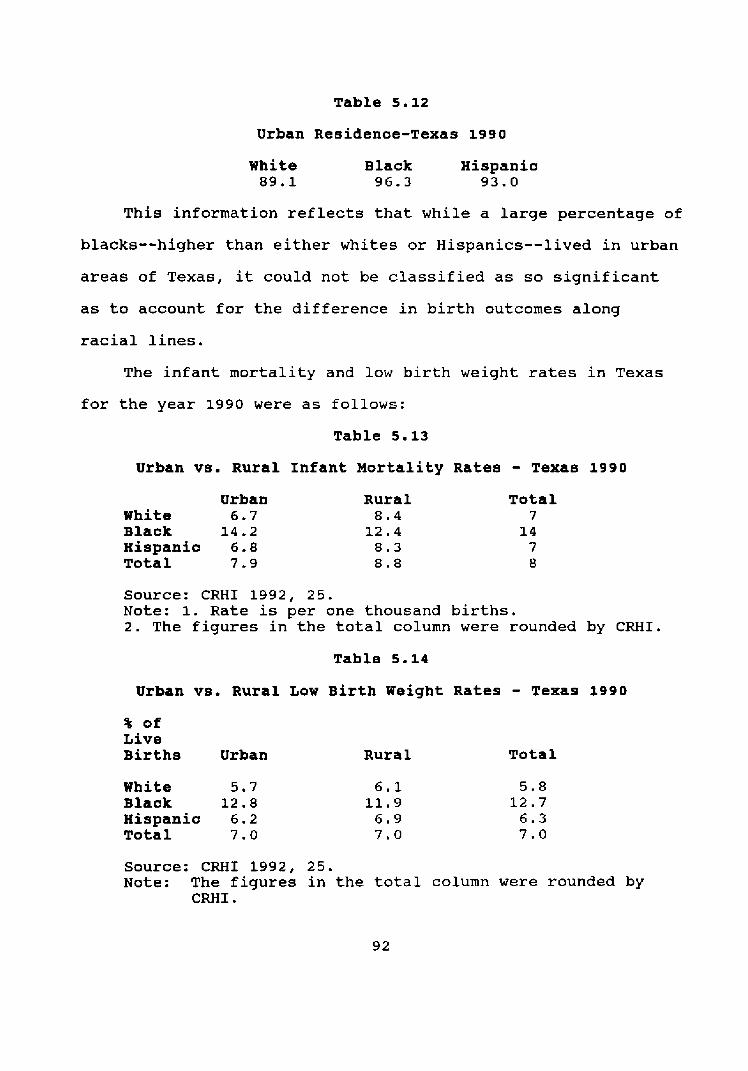
Table 5.12
Urban Residence-Texas 1990
White Black Hispanic 89.1 96.3 93.0
T h i s information reflects that while a large percentage of
blacks--higher than either whites or Hispanics--lived in urban
areas of Texas, it could not be classified as so significant
as to account f o r the difference in b i r t h outcomes along
racial lines.
The infant mortality and low birth weight rates in Texas
f o r t he year 1990 were as follows:
Table 5.13
Urban vs. Rural Infant Mortality Rates - Texas 1990 Urban
White 6 . 7 Black 14.2 Hispanic 6 . 8 Total 7 . 9
Rural Total 8 . 4 7
12.4 14 8.3 7 8.8 8
Source: CRHI 1992, 25. Note: 1. Rate is per one thousand births. 2. The figures in t h e t o t a l column were rounded by CRHI.
Table 5 . 1 4
Urban vs. Rural Low B i r t h Weight Rates - Texas 3990
% of Live Births Urban
White 5.7 Black 12.8 Hispanic 6.2 Total 7.0
Rural Total
Source: CRHI 1992, 25. Note: The figures in the total column were rounded by
C M I .
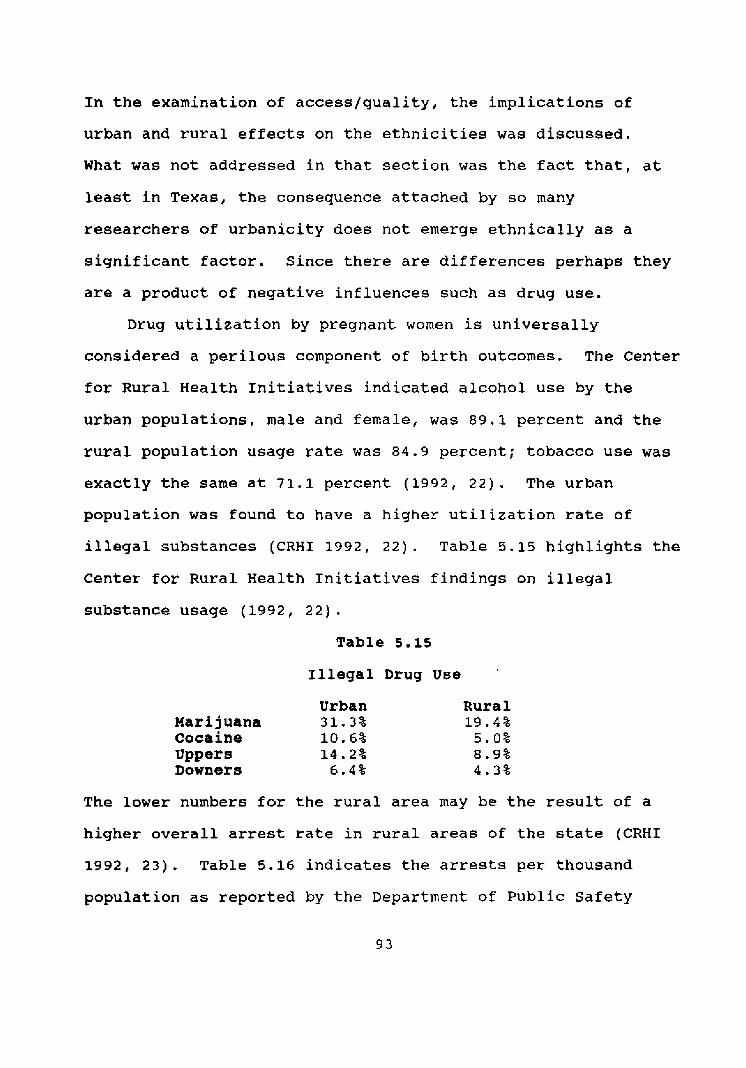
In the examination of access/quality, t h e implications of
urban and rural effects on t h e ethnicities was discussed.
What was not addressed in that s e c t i o n was the fact that, at
least in Texas, t h e consequence attached by so many
researchers of urbanicity does not emerge ethnically as a
significant factor. Since there are differences perhaps they
are a product of negative influences such as drug use.
Drug utilization by pregnant women is universally
considered a perilous component of birth outcomes. The Center
fo r Rural Health Initiatives indicated alcohol use by the
urban populations, male and female, was 89.1 percent and t h e
rural population usage rate was 8 4 . 9 percent; tobacco use was
exactly the same at 71.1 percent (1992, 2 2 ) . The urban
population w a s found to have a h ighe r utilization rate of
illegal substances (CRHI 1992, 22). Table 5.15 highlights t h e
Center for Rural Health Initiatives findings on illegal
substance usage (1992, 22).
Table 5 . 1 5
Illegal Drug U s e
Urban Marijuana 31.3% cocaine 10.6% Uppers 14.2% Downers 6 . 4 %
Rural 19.4%
5.0% 8 . 9 % 4 . 3 %
The lower numbers for the r u r a l area may be the result of a
higher overall arrest rate in rural areas of the state (CRHI
1992, 23). Table 5.16 indicates t h e arrests per thousand
population as reported by t h e Department of Public Safety
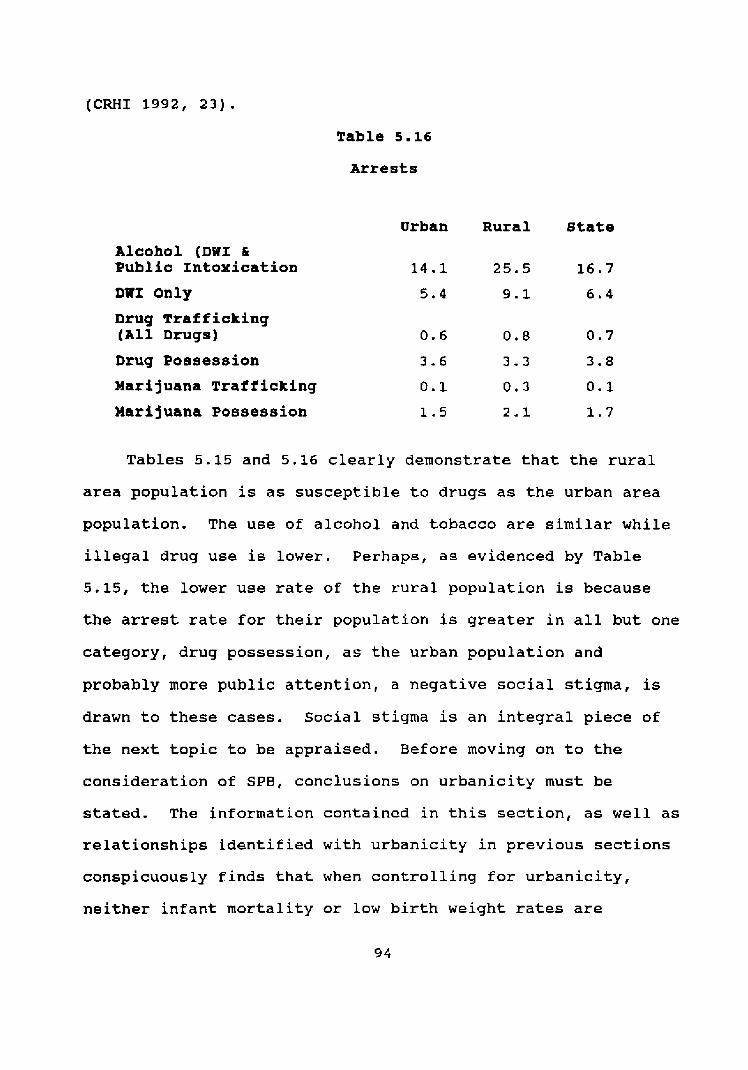
(CRHI 1992, 23).
Table 5.16
Arrests
Urban Rural s t a t e
Alcohol (DWI & Public Intoxication
DWI Only
Drug Trafficking (All Drugs)
Drug Posisession
Marijuana ~rafffcking
Marijuana Possession
Tables 5.15 and 5.16 clearly demonstrate that the rural
area population is as s u s c e p t i b l e to drugs as the urban area
population. The use of alcohol and tobacco are similar while
illegal drug use is lower. Perhaps, as evidenced by Table
5.15, the lower use rate of t h e rural population is because
the arrest rate f o r their population is greater in all but one
category, drug posse s s ion , as the urban population and
probably more public attention, a negative social stigma, is
drawn to these cases. S o c i a l stigma is an integral piece of
the next topic to be appraised. Before moving on to the
consideration of SPB, conclusions on urbanicity must be
stated. The information contained in t h i s section, as well as
relationships identified with urbanicity in previous sections
conspicuously finds that when controlling for urbanicity,
neither infant mortality or low birth weight rates are
in terms that can be agreed on by researchers. C r a m e r
addressed t h i s when he pointed to three failings of
researchers in studying social differentials in infant
mortality (1987, 299). Cramer states that first there is a
problem of determining descriptive statistics that correlate
to risk factors (1987, 2 9 9 ) . Second, he finds that many
studies do not specify how social factors a r e identified
(1987, 3 0 0 ) . Finally, Cramer points out that the problem in
explaining an interaction of social factors w i t h infant
mortality is the result of a l a c k of a conceptual framework to
explain variations in risk (1987, 300).
Schoendorf et al. identify fac tors associated w i t h
psychological, which results in physiological, risk as (1)
poor maternal health before pregnancy, ( 2 ) poor health habits
during pregnancy, and ( 3 ) poor access and quality of care
(1992, 1525). Health habits a r e the result of cultural, and
or family, influence, economic s ta tus , and education (Reis et
al. 1992, 14) . The Kessner index scores, previously
discussed, attempts to measure access, quality and can imply,
a l l access and quality factors being e q u a l , the a t t i t u d e of
pregnant women. Reis et al. a l s o found t h a t the attitude and
knowledge expressed by individuals, regardless of sex, was the
result of their social network (1992, 1 4 ) . The attitude
towards pregnancy can also be influenced by religious
indoctrination and social stigma.
Joyce and Grossman indicated that pregnancy and prenatal
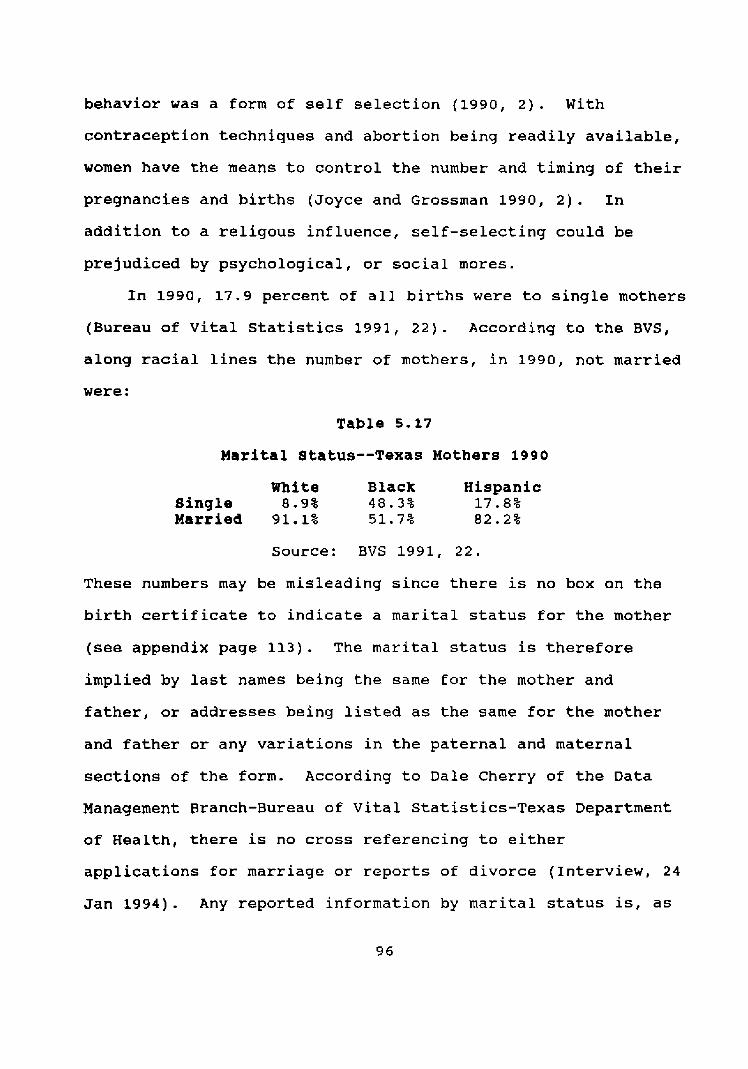
behavior was a form of self selection (1990, 2). With
contraception techniques and abortion being readily available,
women have the means to control the number and t i m i n g of their
pregnancies and births (Joyce and Grossrnan 1990, 2). In
addition to a religous influence, self-selecting could be
prejudiced by psychological, or social mores.
In 1990, 17.9 percent of a l l births were to s i n g l e mothers
(Bureau of Vital S t a t i s t i c s 1991, 22). According to the BVS,
along racial lines t h e number of mothers , in 1990, n o t married
were:
Table 5 . 1 7
Marital Status--Texas Mothers 1990
White Black Hispanic Single 0. 9% 4 8 . 3 % 17.8% Married 91.1% 51.7% 82.2%
Source: BVS 1991, 22.
These numbers may be misleading since there is no box on t he
bir th certificate to indicate a marital status for the mother
(see appendix page 113). The marital status is therefore
implied by last names being t h e same for t h e mother and
father, or addresses being listed as the same for the mother
and father or any variations in t h e paternal and maternal
sections of the form. According to Dale Cherry of t h e Data
Management Branch-Bureau of V i t a l Statistics-Texas Department
of Health, there is no cross referencing to either
applications f o r marriage or reports of divorce (Interview, 2 4
Jan 1994). Any reported information by marital status is, as
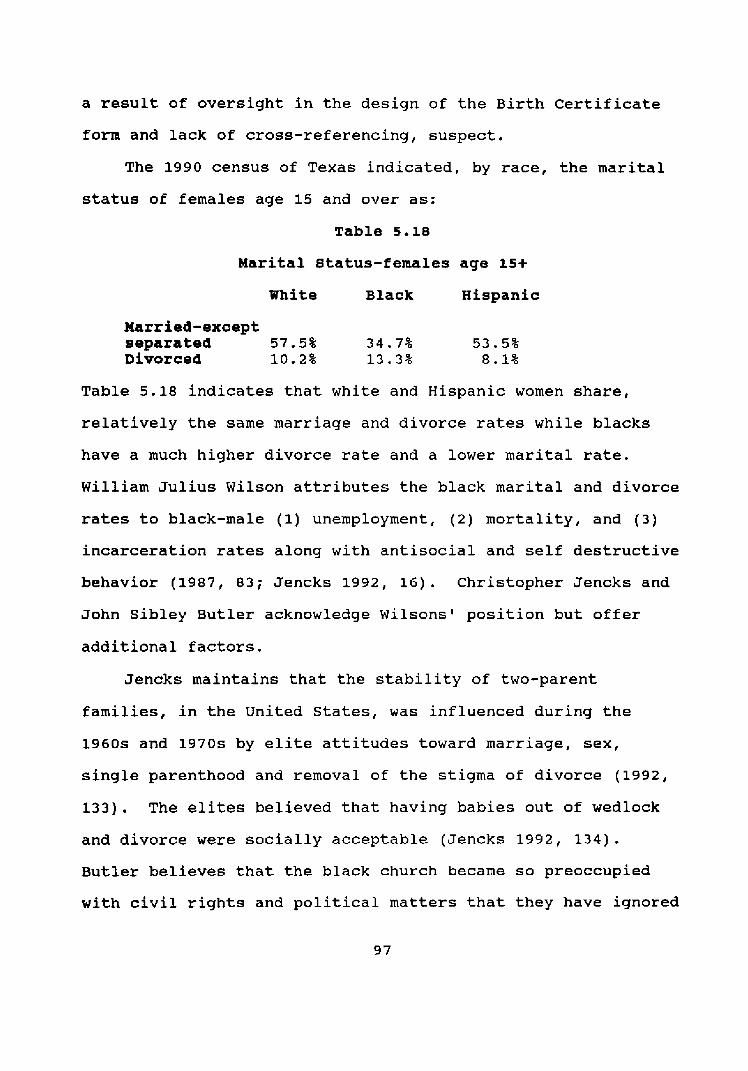
a result of oversight in the design of t h e Birth Certificate
form and lack of cross-referencing, suspect.
The 1990 census of Texas indicated, by race, t h e marital
status of females age 15 and over as:
Table 5.18
Marital status-females age l5+
White Black Hispanic
Married-except separated 5 7 . 5 % 3 4 . 7 % 53.5% Divorced 10.2% 13.3% 8.1%
Table 5.18 indicates t h a t white and Hispanic women share,
relatively the same marriage and divorce rates while blacks
have a much higher divorce rate and a lower mar i ta l rate.
William Julius Wilson attributes t h e black mar i t a l and divorce
rates to black-male (1) unemployment, (2) mortality, and ( 3 )
incarceration rates along with antisocial and self destructive
behavior (1987, 8 3 ; Jencks 1992, 16). Christopher Jencks and
John Sibley Butler acknowledge Wilsons' position but offer
additional factors.
Jencks maintains that the stability of two-parent
families, in t h e United States, was influenced during t h e
1960s and 1970s by elite attitudes toward marriage, sex ,
single parenthood and removal of the stigma of divorce (1992,
133). The elites believed that having babies out of wedlock
and divorce were socially acceptable (Jencks 1992, 134).
Butler believes that the black church became so preoccupied
w i t h civil rights and political matters that they have ignored
other concerns including the importance of many social mores
such as marriage, and parentinq (1991, 326; Telephone
interview, 2 0 December 1993). Michael Michie concluded that
the foundation a church offers young members of t h e black
community can have profound effects (1993, 6 5 ) . The single
parenthood, divorce, and abortion rates, across a l l racial
lines, increased after the 1970s (1992, 132).
With t h e above information as a background; there were
89,051 abortions performed in Texas in 1990 (Bureau of V i t a l
Statistics 1991, 225). The three races under scrutiny in this
study accounted for 85,683 (96.2%) of the total. Contrary to
birth certificates, the form used in reporting an abortion
does classify marital status (BVS 1991, 225). Whites having
an abortion in 1990 comprised 53.4 percent, blacks were 21
percent, and 2 5 . 6 percent of t h e t o t a l were Hispanic ( s e e
appendix page 9 8 ) . Almost seventy-six percent 175.81 were to
unmarried women (see appendix page 127). Only 4 4 4 abortions
were performed on females 15 years o l d or younger (Bureau of
Vital Statistics 1991, 227).
The largest cohort to have abortions in Texas in 1990 Were
the 2 0 to 24 age group (Bureau of Vital Statistics 1991, 227).
Over one-half (61.5%) stated they were experiencing t h e i r
first abortion (Bureau of Vital Statistics 1991, 225). The
ra t io of births to abortions are shown in Table 5.19.
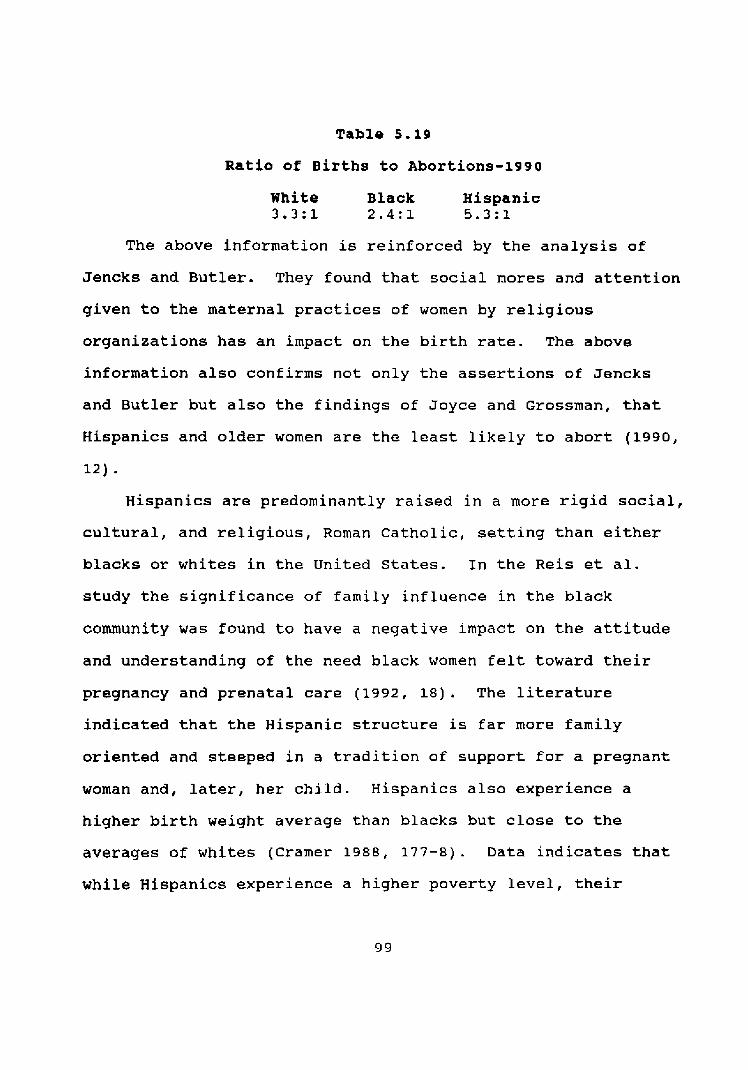
Table 5.19
Ratio of Births to Abortions-1990
White Black Hispanic 3 . 3 : l 2 . 4 : l 5.3:1
The above information is reinforced by t h e analysis of
Jencks and Butler. They found that soc ia l mores and attention
given to the maternal practices of women by religious
organizations has an impact on t h e birth rate. The above
information a l s o confirms not only t h e assertions of Jencks
and Butler but a l s o t h e findings of Joyce and Grossman, that
Hispanics and older women are the least likely to abort (1990,
12).
Hispanics are predominantly r a i s e d in a more r i g i d soc ia l ,
cultural, and religious, Roman Catholic, setting than either
blacks or whites in the United States. In t h e Reis et al.
study the significance of family influence in t h e black
community was found to have a negative impact on t h e attitude
and understanding of t h e need black women felt toward their
pregnancy and prenatal care (1992, 18). The literature
indicated that t h e Hispanic structure is far more family
oriented and steeped in a tradition of support f o r a pregnant
woman and, later, her child. Hispanics a l s o experience a
higher birth weight average than blacks but close to the
averages of whites (Cramer 1988, 177-8). Data indicates t h a t
while Hispanics experience a higher poverty level, their
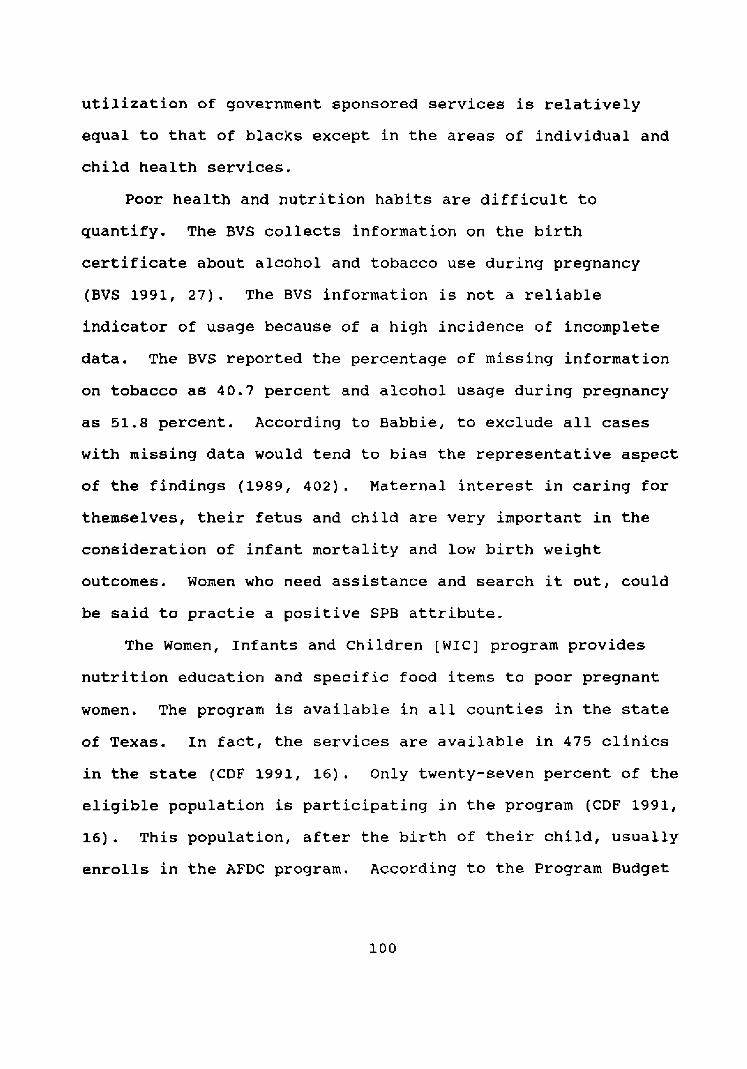
utilization of government sponsored services is relatively
equal to that of blacks except in t h e areas of individual and
child hea l th services.
Poor health and nutrition hab i t s are difficult to
quantify. The BVS collects information on t h e birth
certificate about alcohol and tobacco use during pregnancy
(BVS 1991, 2 7 ) . The BVS information is not a reliable
indicator of usage because of a high incidence of incomplete
data. The BVS reported t h e percentage of missing information
on tobacco as 4 0 . 7 percent and alcohol usage during pregnancy
a s 5 1 . 8 percent. According to Babbie, to exclude a l l cases
with m i s s i n g data would tend to bias t h e representative aspect
of the f i n d i n g s (1989 , 4 0 2 ) . Maternal interest in caring for
themselves, their fetus and child are very important in t h e
consideration of i n f a n t mortality and low birth weight
outcomes. Women who need assistance and search it out, could
be said to pract ie a positive SPB attribute.
The Women, Infants and children [WIC] program provides
n u t r i t i o n education and specific food items t o poor pregnant
women. The program is available i n all c o u n t i e s in the state
of Texas. In fact, t h e services are available in 475 clinics
in the state (CDF 1991, 16). Only twenty-seven percent of the
eligible population is participating in the program (CDF 1991,
16). This population, af ter t h e birth of their child, usually
enrolls in t h e AFDC program. ~ccording to the Program Budget
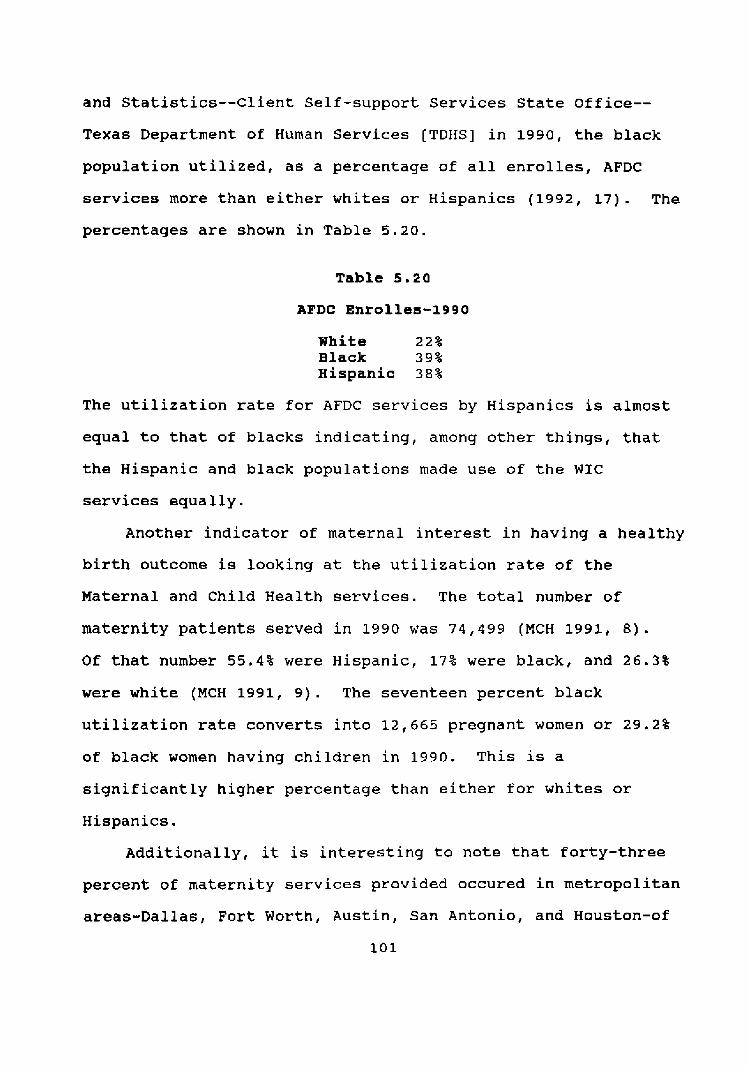
and Statistics--Client Self-support Services State Office--
Texas Department of Human Services [TDHS] in 1990, the black
population utilized, as a percentage of a l l enrolles, AFDC
services more t h a n e i t h e r whites or Hispanics (1992, 17). The
percentages are shown in Table 5.20.
Table 5 . 2 0
AFDC Enrolles-1990
white 22% Black 39% Hispanic 3 8 %
The utilization rate for AFDC services by Hispanics is almost
equal to that of blacks indicating, among other things, that
the Hispanic and black populations made use of t h e WIC
services equally.
Another indicator of maternal interest in having a healthy
birth outcome is looking at the utilization rate of t h e
Maternal and Child Health services. The total number of
materni ty patients served i n 1990 was 7 4 , 4 9 9 (MCH 1991, 8 ) .
Of that number 55.4% were Hispanic, 17% were black, and 26.3%
were white (MCH 1991, 9). The seventeen percent black
utilization rate converts into 12,665 pregnan t women or 29.2%
of black women having children in 1990. his is a
significantly higher percentage than either f o r w h i t e s or
Hispanics.
Additionally, it is interesting to note that forty-three
percent of maternity services prov ided occured in metropolitan
areas-Dallas, Fort Worth, Austin, San Antonio, and Houston-of
101
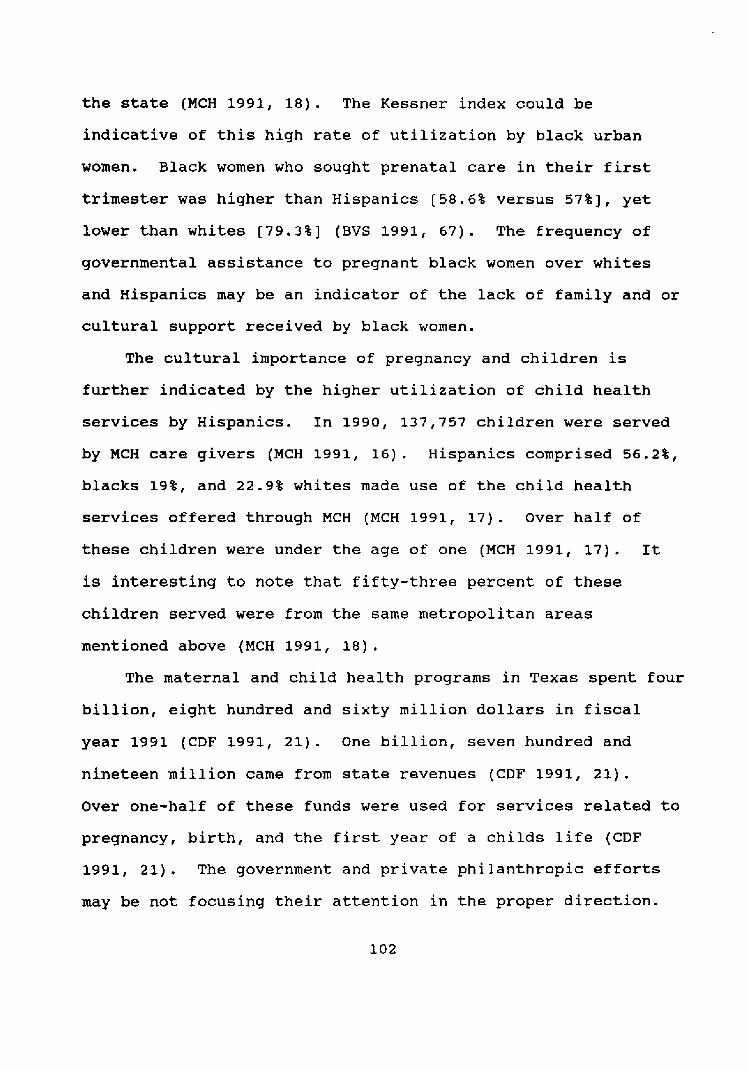
the state (MCH 1991, 18). The Kessner index could be
indicative of t h i s high rate of utilization by black urban
women. Black women who sought prenatal care in their f irs t
trimester was higher than Hispanics (58.6% versus 5 7 % ] , yet
lower than whites [79.3%] (BVS 1991, 67). The frequency of
governmental assistance to pregnant black women over whites
and Hispanics may be an indicator of the lack of family and or
cultural support received by black women.
The cultural importance of pregnancy and ch i ldren is
further indicated by the higher utilization of child health
services by Hispanics. In 1990, 137,757 children were served
by MCH care givers (MCH 1991, 16). Hispanics comprised 5 6 . 2 % ,
blacks 19%, and 22.9% whites made use of t h e child health
services offered through MCH (MCH 1991, 17). Over half of
t h e s e children were under t h e age of one (MCH 1991, 17). It
is interesting to note that fifty-three percent of t h e s e
children served were from the same metropolitan areas
mentioned above (MCH 1991, 18).
The maternal and c h i l d health programs in Texas spent four
billion, eight hundred and sixty million dollars in fiscal
year 1991 (CDF 1991, 21). One billion, seven hundred and
n i n e t e e n million came from state revenues (CDF 1991, 21).
Over one-half of t h e s e funds were used for services related t o
pregnancy, b irth , and the f i r s t y e a r of a childs life (CDF
1991, 21). The government and private philanthropic efforts
may be not focusing their attention in the proper direction.

The next chapter w i l l discuss how this research will analyze
the commonly recognized factors of infant mortality and low
birth weight rates.
In chapter four the stated method of examining the socio-
psychological/behavioral { S P B ] aspect of the infant mortality
and low birth weight rate is the nomothetic model. The
analysis of SPB is well s u i t e d to this model since there are
few variables which can be empirically and statistically, at
t h i s t i m e , affixed to this influence (Babbie 1989, 62). The
variables identified by t h e literature review and found in t h e
information presented in t h i s chapter meet the criteria,
previously di scussed , Babbie established for consideration of
causality (1989, 63). What does t h e ev idence presented in
this study indicate about SPB?
The nomothetic model, according to Babbie, aids the
researcher in assigning general patterns of cause and effect
and itsf utility is in pointing to t h e need for more extensive
study in t h e area being examined ( 1 9 8 9 , 6 3 ) . SPB is a new
concept in t h e study of i n f a n t mortality and low birth weight
rates. The information provided above establishes relevance,
within the parameters of the nomathetic model of inquiry, and
further examination of SPB in the study of infant mortality
and low birth weight rates. Thomas Kuhn points out that
discovery is the result of new alternatives being presented
(1970, 76). Perhaps this research is a minor suggestion that
there is something, SPB, beyond the horizon in t h e study of

infant mortality and low birth weight.
CHAPTER SIX
CONCLUSIONS
General
The postulations investigated in the previous chapter
were not supported by the evidence. When each factor was
controlled for, there were n o t similarities along racial lines
in either the infant mortality or low birth weight categories.
Evidence was presented that suggests SPB may be, with further
examination, an acceptable alternative to explain the
variance. The following sections discuss each factor
examined.
Education
The analysis in t h i s study indicated there was a
disproportion of Hispanic women giving birth in 1990 who did
not have at least twelve years of education at the time of t h e
b irth of their child. The teenage birth rate was almost t h e
same for blacks and whites. Education can therefore be said
to not have a significant correlation to t h e higher black
infant mortality and low birth weight rates experienced in
Texas in 1990.
Poverty
In every category examined, Hispanics were found to
experience an asymmetric result. while the black population,
per capita, experiences substantially lower incomes than
whites, Hispanics encountered an even greater influence due to
an even lower income t h a n blacks. The impact of low incomes
on t h e black population having children could not be found to
be more adversely affected than Hispanics. The effect of
every other grouping in t h e poverty area was not more harsh
on blacks, over whites or Hispanics. The black i n f a n t
mortality or low birth weight rates in 1990 are not reflected
in their suffering higher poverty status t h a n other groups
studied.
Accesn/Quality
The information presented and analyzed in this study
demonstrated that Hispanics and blacks have relatively equal
access to and quality of care i n the state of Texas. Whites
were found to not use services frequented by blacks or
Hispanics as often. It was assumed that the w h i t e s not using
like service, sought care at different places than either
blacks or Hispanics. Hispanics experienced similar birth
outcomes as whites and significantly better results than
blacks while using s i m i l a r care providers. Based on this
analysis, the d i sparate birth outcomes experienced by blacks
can not be attributed to access or quality in health care.
Drbanicity
The effect of urban residence on infant mortality and low
birth weight rates was found to be essentially the same for
blacks and Hispanics. The percentages of blacks and Hispanics
living in urban areas was fundamentally equal. The white
population living in urban areas, as a percentage, was not far
behind the other two groups. The drug problem, which is o f t e n
c i t e d as being more pronounced in urban areas, was discovered
to be equally commonplace in t h e r u r a l areas of Texas.
8ocio-Psyeholog~cal/Behavioral
SPB was demonstrated in this analysis as the only factor
exhibiting more negatives f o r the black population than
others under study. T h i s a n a l y s i s w a s advanced only to
consider SPB as a possible consideration in t h e factors
associated with infant mortality and low birth weight rates.
Information available f o r examination and empirical
documentation on t h i s s u b j e c t indicated that this area is of
study may hold a very important key to s u c c e s s f u l l y
understanding the infant mortality and low birth weight rate
differences along r a c i a l lines. C l e a r l y , more sophisticated
examination of this topic is warranted.
Implications for Public Health Administrators
Introduction
In 1965 and again in 1969, Daniel Patrick Moynihan warned
that t h e programs of t h e "Great Society" would have serious
negative ramifications (1970, lx; 1992, 55). He has continued
h i s analysis th roughout t h e years and most r e c e n t l y pointed
out that the problem with social policy is that no one has any
real indication of what is sufficient (1992, 60). H i s
skepticism is manifested in quoting l ' R o s s i l s Iron L a w . "
Rossiqs statement was:

If there is any empirical law that is emerging from the past decade of widespread evaluation research activities, it is that t h e expected value for any measured effect of a soc ia l program is zero (Moynihan 1992, 61).
There have been widely publicized policy statements at
all governmental levels on the need to reform many programs
designed to assist various portions of our society . Any
changes this analysis suggests must be tempered by the r e a l i t y
that they must be frugal in both cost and the manpower needed
to implement and manage them. Further, any suggestions must
be mindful that they, if implemented, shou ld show immediate
pos i t ive results.
Public health administrators a r e in a more precarious
situation than many other public servants since their
decisions and actions have a more immediate and profound
effect on their constituency than many other administrators.
For example, the under funding of one clinic could effect the
birth outcome of thousands of children. If a child is born
w i t h what could have been a preventable b i r t h d e f e c t , the cost
to society for the life of that i n d i v i d u a l is staggering.
With that in mind, in addition to a discussion on each f a c t o r ,
state government action will be discussed independently.
Suggestions will be d i s c u s s e d w i t h i n t h e framework of the
factor even though they may, and probably do, have
corresponding implications in another area.
Government
1. Texas does control health related activities under
108

one agency. T h e Texas Department of Heal th , Department of
Human Services, Mental Health and Mental Retardation, and
Texas Education Agency are primary players involved in hea l th
matters in t h e state of Texas. Many a c t i v i t i e s these agencies
engage in are duplications and cross over i n t o areas of
expertise of other agencies. There is little coordination of
activities between agencies. All state agencies w i t h
departments w i t h health related activities should be
identified and a single agency, probably the Department of
Health, assigned the task of organizing these departments
under their sphere of control.
2 . If, for whatever reason, consolidation is not
accomplished, public administrators examining issues must
learn to seek information from other agencies and departments.
During the course of this examination it became clear, to this
researcher, that agencies were not comfortable with t h e notion
of collecting data from sources outside their sphere of
influence. There were many instances, when discussing various
aspects of t h i s project with assorted agencies, where
information previously gathered was shocking news to a
department studying that issue. The reason for this
consternation was that they had no knowledge of other
information gathered and reported by another agency. This
activity is petty , unprofessional, and a great i n j u s t i c e to
the public t r u s t .
3 . All counties in t h e state should establish h e a l t h

departments and, where applicable, satellite services to areas
within t h e county identified as high risk. County governments
can establish their costs to the County Indigent Health Care
Program [CIHCP] and charge their costs against their mandated
ten percent CIHCP liability. Case management of h e a l t h care
clients using assistance programs could be managed by this
department. Costs could be supplemented by the state through
savings derived from personnel reductions at s t a t e level
resulting from the consolidation of responsibilities.
4 . The s t a t e agency responsible f o r health should
provide assistance to established and proposed private health
providers in the application process, administration of, and
grant renewal process of federal programs available.
5 . The b i r t h certificate used by the state should
include specific marital status, substance use, and pregnancy
funding source information.
Education
1. The Texas E d u c a t i o n Agency should support legislation
to include prenatal education in t h e schools beginning at
either the sixth or seventh grade level. This instruction
would inc lude t h e male population of the schools to ensure
their understanding of the need for, importance of, and
assistance available to pregnant women.
2. Minority leadership, principally among religious
leaders and their congregations, should be recruited at the
local level to a i d in the education, training, and support for
prenatal, maternal, parenting and child care. Morality is n o t
the provence of the public health administrator. Literature,
trainers, and other support functions could be supplied to
these groups at a minimal cost t o the state with a higher
exposure rate than other forms of public disclose.
Poverty
1. The thresho ld of 133 percent of t h e poverty level f o r
entry into s t a t e and federally funded assistance should be
raised to 150 percent. This level has been found to be t h e
optimum level to maximize results.
2. All pregnant women, regardless of marital s ta tus ,
enrolled i n any government assistance program should be
identified to all local h e a l t h providers and enrolled
automatically to receive care. Once identified, they could be
monitored by hea l th care providers t o ensure proper h e a l t h and
prenatal care activities are provided. Women in t h i s category
who refused or did n o t a c t i v e l y p a r t i c i p a t e i n a program of
prenatal and maternal h e a l t h care would risk the loss of
governmental assistance.
3 . AFDC should not be tied to the mar i ta l status of the
care giver of t h e ch i ld . Fathers, or mothers in some cases,
should be encouraged to live w i t h their families and not
abandon them for financial benefits. If a family is found to
qualify for AFDC assistance their could be a bonus paid for
both parents residing together. his bonus could be f o r a
t i m e certain payment period where increased income would not
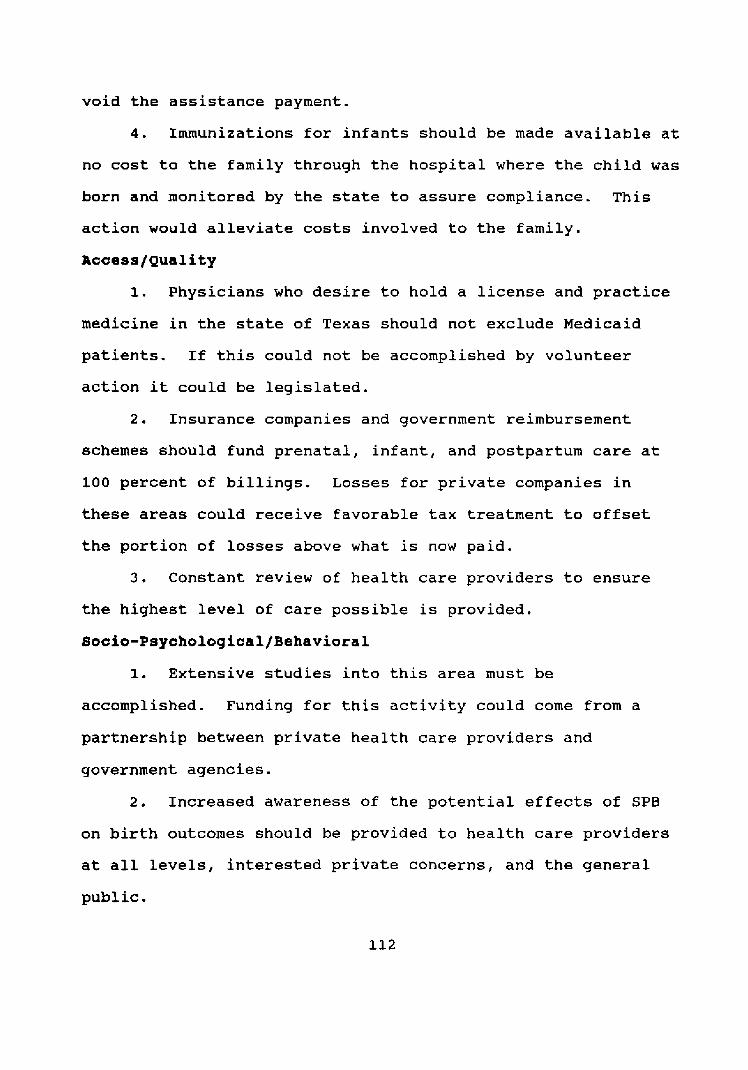
void t h e assistance payment.
4 . Immunizations f o r infants should be made available at
no cost to t h e family through t h e hospital where the child was
born and monitored by the state to assure compliance. T h i s
act ion would alleviate costs involved to the family.
Accesa/~uality
1. Physicians who desire to hold a license and practice
medicine in t h e state of Texas should not exclude Medicaid
patients. If t h i s could n o t be accomplished by volunteer
action it could be legislated.
2 . Insurance companies and government r e imbursemen t
schemes should fund prenatal, infant, and postpartum care at
100 percent of billings. Losses for p r i v a t e companies in
these areas could receive favorable t a x treatment to offset
the portion of losses above what is now paid .
3 . Constant review of h e a l t h care providers to ensure
the highest level of care p o s s i b l e is provided.
Socio-Psychological/Behavioral
1. Extensive studies into this area must be
accomplished. Funding for t h i s activity could come from a
partnership between private health care providers and
government agencies.
2 . Increased awareness of the potential effects of SPB
on bir th outcomes should be provided to health care providers
at a l l levels, interested private concerns, and the general
public.


Revlsad 1989 Sample CertlfIeate of Blrth
USUAL m p * r Y I u
5 STATE OF TEXAS CERY IFKITE OF BIRTH muru wo I r 0, w ~ n l l nu F..u IUUrMI. ICL L a u I OATS w warn 1 wa
,
Yr U U FAtfOeD Call TMU PllttUAMCT IO*P*Imw
rn , - - I?= - . . . . . , sc *mi- r W m c rm , , mC
. . -an- . . . . . . P.C . u l r m t m k n g r - m=
. . . . a . . . . . OLC -doll- or1 --nr - - w: nm-- . . -1 " r ~ n m l w . -*-a# :a= E C ' M - m u , 11:
IIY-m c m r . . . i l Z -aolrtm.Om - 1- . 11:
~ N E U R 0 1 L L Y I R U t O l W M -L1mrppn
. . . . . . . na . . .at r a l . l ~ ~ m - r WY'CI . . - . . - . . . . . mc
. . . . . U s r m m . r r p D r W ~ . mc
. --or-irIZ- .%I: . . . . . . . . . . a m 4 - .=c
. . . . . . . . . *-I.- ..=Z . . . . . ~ m r m r m - .YE I 'L*nm-l- . . . . m i
. . . . . . R . o o r m m l r S l a n ( w ~ ~ i , a m v l l . . . . . . . . hrh*mrru'sr - 1 u r r m m m
- . zat
Fmlw. : j -nuop - -=
I. C O I I W Y I L L # W I-OLmW
. . . . -I**- . - - Y Z
. . . . . . . . . . . . . - mc . . . . . . . . . . 3pu LlW- .E
. . . . . . . . . . R.. 67: . . . . . . . . . . . . . . . . . . . . . - .=
-srmr- .mn- *am YK
. . . . , ,,,a. . . M.: Om*-l-- ,-a B i
*st*-m-. . . I; T- IratuWE-
. . . . . . . . . . . . . . - sf= . . . . 61:
Dg-- 1-bl mC
. . . . --.. , - . x w- . . - - . . . . I l f
--a- b-m n=
Omrww. . . . . . . . . nc . . . . . . . mi- 71:
. . -I.Rmo114. -1-
n2 . .. , . , , . , , nc
. . . asmgnursqmr TI1 muw-m-w -1.
1-m ;IC
-1- , . . . x O m u c n M - 8
lSpclM 1DC
41; iSer;lM
10165455
* m u 8 om- a un*l-rsr-p.uuwrq* b e - w . b r =
,n*t . id: I %n- u= m& el- 73: I 'Sorc131 h YmlhIYlW '1:
77.. 1 h l r m ~ o l u r e o t m m - i c 3 7 l . r U . 5TD ?I; . D I r r - ' 17 ut-rrw or oEuvln
r-hr b 0 1 . u ul unrr w t
a O ~ W E R CACTOLf sou WIS P R E ~ M ~ ~ C Y C O ~ O Y S yl I v.pn- - , , . a=
VWW M" an- pmn G-lon UC . . . . . . T w o ~ Y R C . ~ -Y *n: ro: . . . . . .
* - " v n p r s # ~ v m n M JIV - Y: 1 z- , , - *-= 4- u u aunng -v 7- .*I =,--
- , 4crrp.mmor-m1pr-- "= . . . .
*-w-.-qnt - ,h *C -*m-Rnn. -MC~_- .M
,
U ca51n4C *aOCtWAES tnw UI tnn .wwn
"CN :I r-scm*nra El.rnrms Iaru m ~ m a n g I *CK!#W 01 I- SI.~.IWIIW OI I.PX - ::L -.-*.a,
Jilt W M
O l p n . 17 I S W I I I
Y . % k O m u A ~ COYDIM- 01 r*S NtWmRII chub w m* vrmr
w*. 4rrm.,*cl cB,wrr 1s
4: . idr
: v w Yc-Iq- srz * v u * m memmuu m - a ~ 121 UUOn~vm -9n*lr*mm* 5;1z ar ra rmrnu lasnc l~mn ,%: a r e l r n , m # w . m i n ~ . 55 1 h a - mz Oh- - n=
r-bl
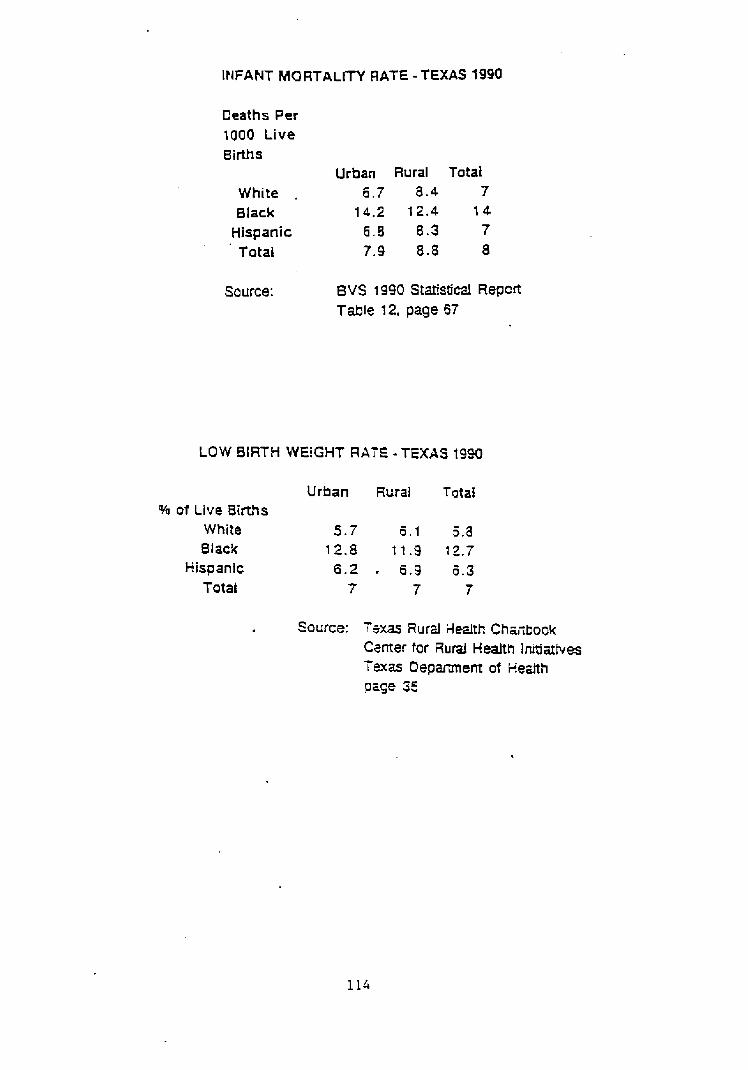
INFANT MORTALrrY RATE - TEXAS 1990
Deaths Per 1000 Live Births
Urban Rural Total White . 7 8.4 7 Black 14.2 t 2.4 14
Hispanic 6 . 8 8 .3 7 T atal 7.9 8.8 8
Source: 8 V S 1990 Ststistical Repcrt Table 12, page 67
LOW BIRTH WEiGHT RATE -TEXAS t9W
Urban Rural Totai % o i Live 8irths
White 5 . T 1 5.a Slack 12.8 1 1 .9 12.7
Hispanic 6 . 2 . 8.9 5.3 Total 7 7 7
Source: isxas Rurzl itealth Ch~ctbook Camer for Rural Health Initiatives T2xm D e p m e r r t of Heztth p q e 35
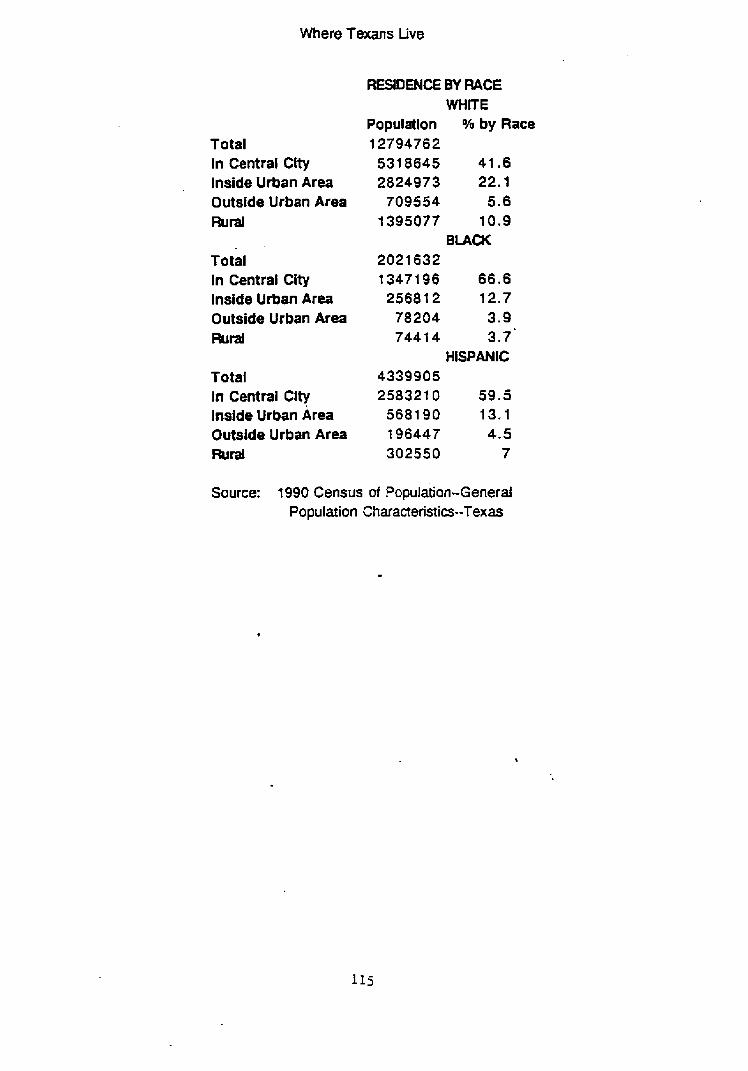
Where Texans Live
Total In Central City Inside Urban Area Outside Urban Area Flud
Total In Central City lnside Urban Area Outside Urban Area Flurad
Total In Central City Inside Urban krea Outside Urban Area mral
RESIDEEIE BY R A E WHITE
Population % by Race 12794762 531 8645 41.6 2824973 22.1
709554 5.6 1395077 10.9
B U C K 2021 632 13471 96 66.6 25681 2 12.7
78204 3.9 7441 4 3.7'
HISPANIC 4339905 258321 0 59 .5
5681 90 t3 , I t 96447 4.5 302550 7
Source: 1990 Census of Population-General Population Characteristia--Texas
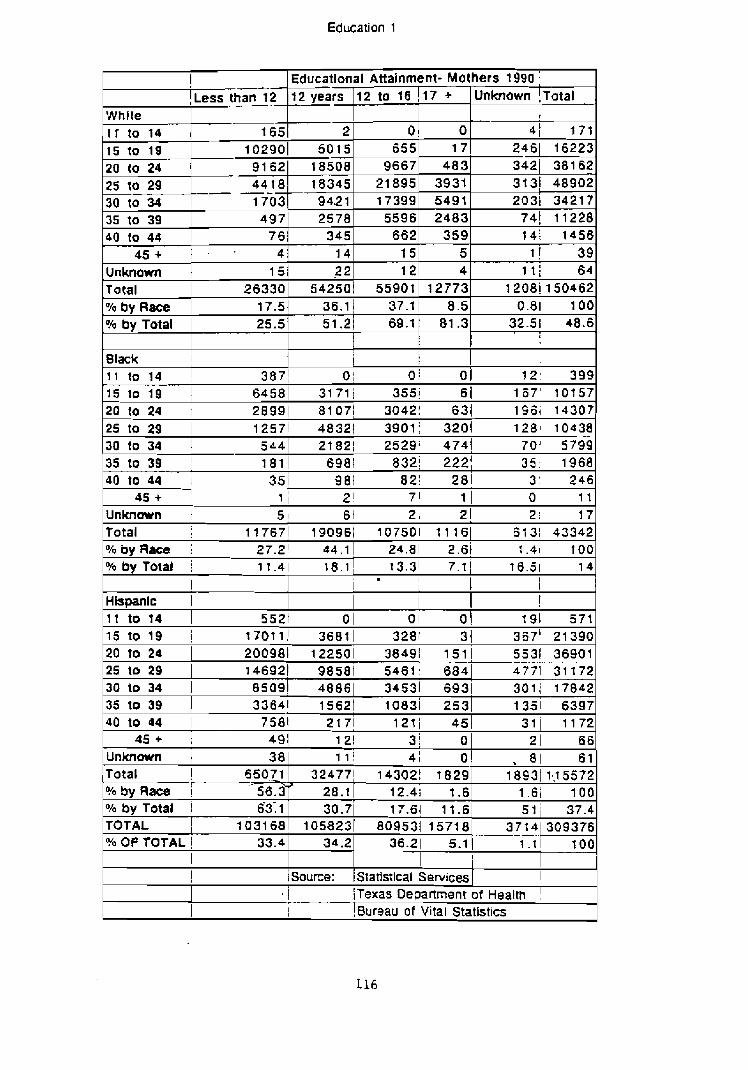
Education 1
! Educational Attainment- Mothers 1990 j
While I T to 14
15 to 19
- ,Less than 12 -
165 10290
Unknown ! ~ o t a l
- I 1 41 171 2461 16223 3421 38162 3131 48902 2031 34217
74 ! 11228 I 4 1 1456
1 ! 3 9 l t i 64
12081 150462 0.81 100
32.5! 48.6
7 2 , 399
17 +
0 17
483 3931 5491 2483
359 5 4
12773
12 years
2 5015
12 to 16
0 6 5 5
9667 21895 17399 5596 662
15 1 2
5590t
20 to 24 1 91621 18508
25 to 29 -18345 -- -
15 to 19 64581 31 71; 355i 6 1 1 6 7 ' 10757 2 0 t 0 2 4 r 28991 81071 3042; 63! 196i 14307 25 to 29 1 1257i 48321 3901: 3201 1281 10438 30 to 34 1 5441 21821 2529; 4741 70' 5799 -
35 to 39 1 1811 6981 832i 2221 3 5 1968 40 to 44 i 35 i 981 821 281 3 ' 2 4 6
45 + ! 1 i 2 i 7' 1 I 0 1 1
Unknown t 5 ! 6 1 2, 2! 2 1 17 Total 117671 190961 107501 1 1 161 61 31 43342 Oh by Race I 27.2' 44.1 1 24.81 2.6t t .41 1 00 OhbyTotal i 11.41 18.1 1 13.31 7.1 1 16.51 1 4
30 to 34 1 1703 35 to 39 1 497
% by Race W by Total
1 Hispanlc 1
9421 2578
, . I
I
1 I I
!
Slack I 1 j 1 1 1 to 14 1 3871 o 1 o 1 o
17-51 36.1) 37-11 8 . 5
$0 to 44 1 7 6 I 345 4 5 + 1 - . 4 1 1 4
25.5
I t to t4
Unknown Total
51.21 69.1! 81.3
5521 0 1 0 1 0 \ 191 57t
151 2 2 263301 54250.
15 to f 9 i t 7 0 ? t ! 36811 3281 3! 367' 21390 20 to 24 25 to 29
200991 122501 38491 151 5531 36901 146921 9858t 5461: 6841 4771 31 172
30 to 34 1 85091 48861 34531 6931 301; 17842 35 to 39 33641 1s62t io83i 253 40 to 44 I 7581 2171 12t i 45
t 351 6397 311 1172
Unknown i
12.4i t .6 17.61 11.6
1031 68 1058231 809531 1571 8
1 Bureau of Vital Statistics

EDUCATION 2
EDUCATION LEVEL OF MOTHERS-1 990 White Black Hispanlc Total
% Below 12 years 17.5 27.2 56.3 33.4 % Above 12 years 81.7 71.4 42.1 65.5
Source: Statistical Services Texas Department of Health Bureau of Vital Statistics
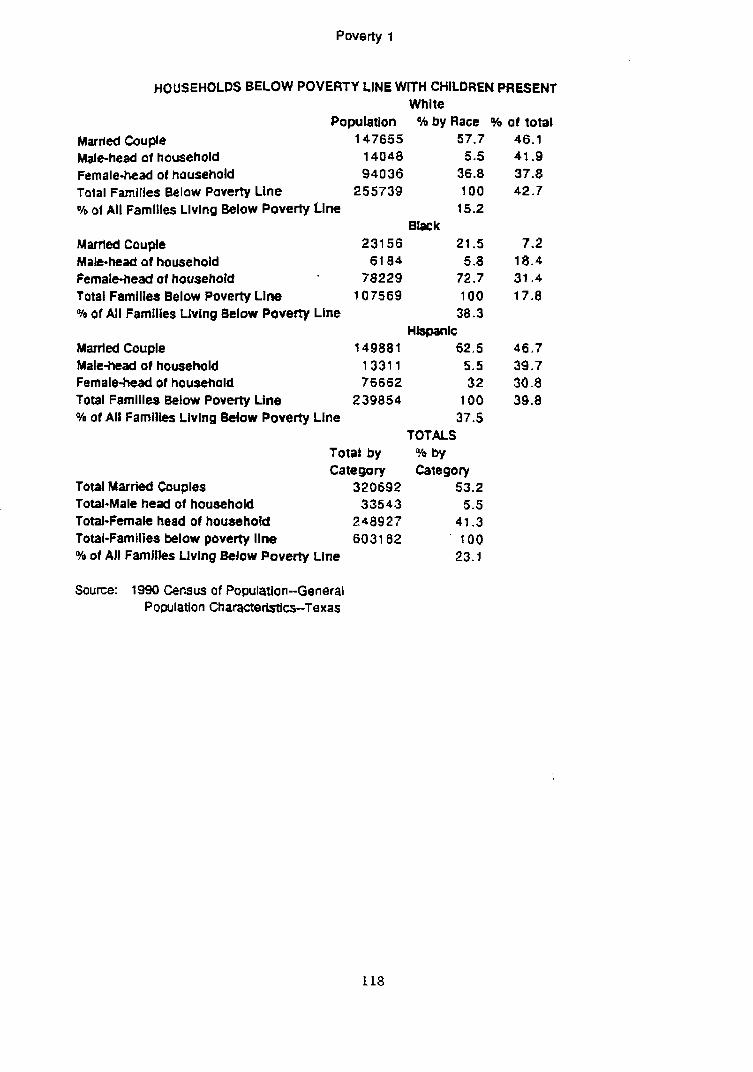
Poverty I
HOUSEHOLDS BELOW POVERTY LINE WtTH CHILDREN PHESENT Whlte
Population %by Race % of total Marrled Couple 147655 57.7 46.1 Male-head of hausehold 14048 5.5 41.9 Female-head ot household 94036 36.8 37.8 Total Families Below Poverty Llne 255739 100 42.7 Oh 01 All Famllles Llvlnq Below Poverty Llne 15.2
B k k Marrted Couple 231 5 6 21.5 7.2 Male-head of household 61 84 5.8 18.4 fernatehead ol hausehold 78229 72.7 31.4 Total Famllles Below Poverty Line 107569 100 17.8 % of All Families Living Below Poverty tine 38.3
Hlspanlc Married Couple 14988 1 62.5 46.7 Male-head of household 1331 1 5.5 39.7 Female-bed of household 76662 32 30.8 Total Familles Below Poverty Line 239854 100 39.8 O/p 01 All Famllles Llving Below Poverty Line 37.5
TOTALS Total by % by Category Category
Total Married Couples 320692 53.2 Total-Male head of household 33543 5.5 Total-Female head of househotd 248927 41.3 Total-families below poverty llne 6031 62 100 % of AJI Famjlles Living Below Poverty Line 23.1
Source: 1990 Census of Population--General Population Characteristics-Texas
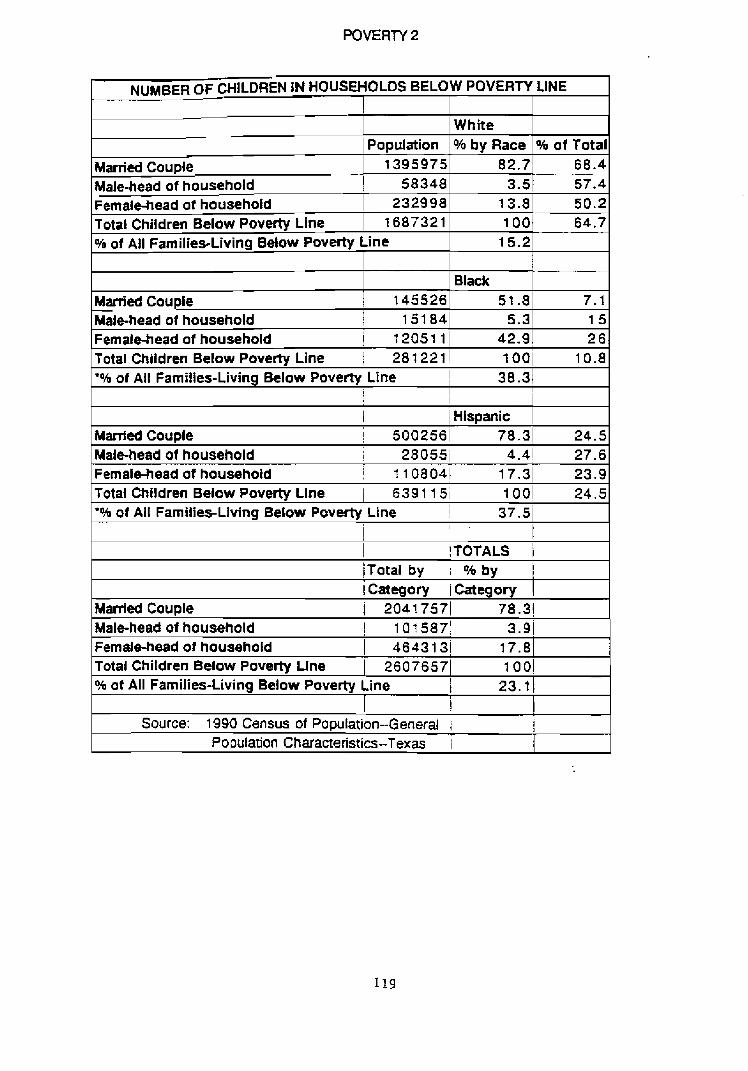
NUMBER OF CHILDREN IN HOUSEHOLDS BELOW POVERTY LINE
Married Couple Male-head of household Female-head ot hot~sehold Total Children Below Poverty Line
Population 1395975
58348 232998
I687321
White 0/6 by Race
ppp
8 2.7 3.5
13.8 100
% of All Families-Living Below Poverty Line
% of Total 68.4 57.4 50.2 64.7
15.2
Black 51.8
5.3 Married Couple
I 7.1 15
Femalehead of household 1 1205111 42.9
145526
26 Male-head of household I 15184
Total Children Below Poverty Line 1 281221/ 1001 10.8 *oh of All Families-Living Below Poverty Line I 38.3
j i 1 1 Hispanic
Married Couple 1 5002561 78.3 24.5 Malehead of household ! 28 05Si 4.4 i 27.6 Femalehead of househoid i 1 lO804i 17.31 23.9 Total Children Below Poverty Line / 6391 15; 1001 24.5 '% of All Families-Living Below Poverty Line ! 37.51
1 I - t I !TOTALS 1 /Total by i O h by i category iCategov 1
Married Couple ] 20417571 78.31
Femalehead of household Total Children Bdow Poverty Line % ot All Families-Living Below Poverty Line
Source: 1 990 Census of Population--General i
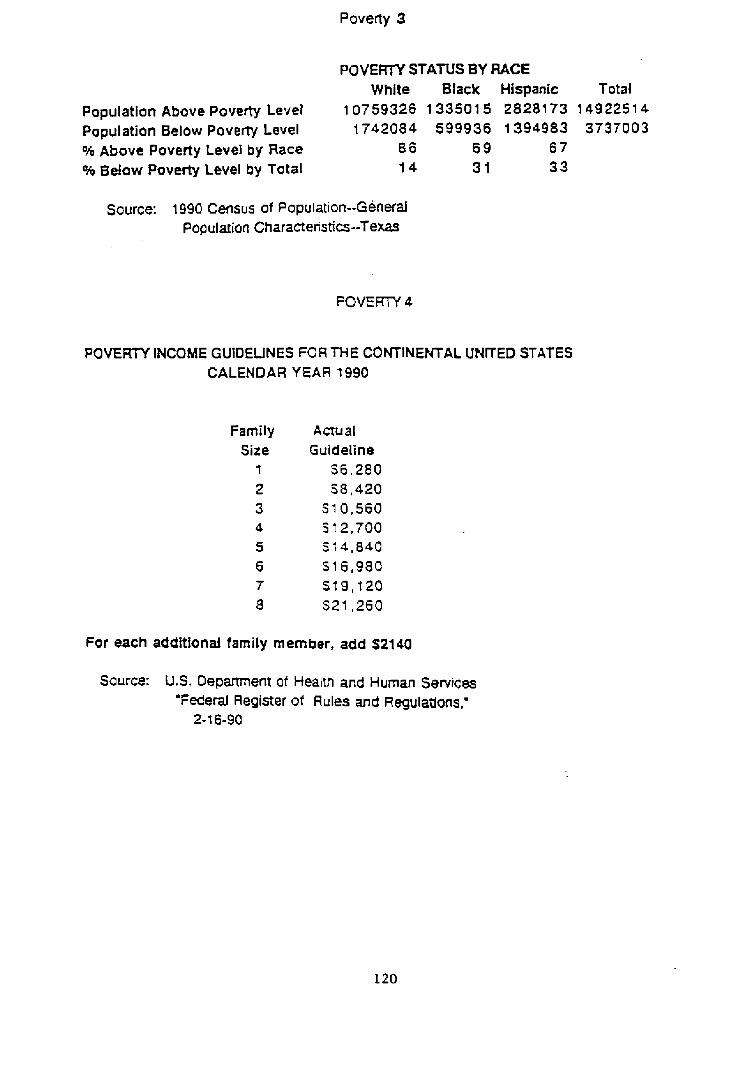
Poverty 3
POVERTY STATUS BY RACE White Black Hispanic Total
Population Above Poverty Level 1 0759326 1 3350 1 5 2828 1 73 1 49 225 1 4
Population Below Poverty Level 1742084 599936 1394983 3737003 % Above Poverty Level by Race 86 6 9 6 7 % Below Poverty Level by Total 14 3 1 3 3
Source: 1990 Census of Population--General Population Charaaerisiics--Texas
POVERPI INCOME GUlOEUNES FORTHE CONTINENTAL UNITED STATES CALENDAR YEAR 1990
family Size
1
2 3 4
5 6 7 8
Actual Guideline
56,280 58 ,420
S10,560 S 12,700 51 4 ,840 S16,980 S 1 9 , f 20 S 2 t ,260
For each additionai family mern ber, add S2140
Source: U.S. Department of Health and Human Services 'Federal Register of Rules and Regulations,'
2- 1 6-90
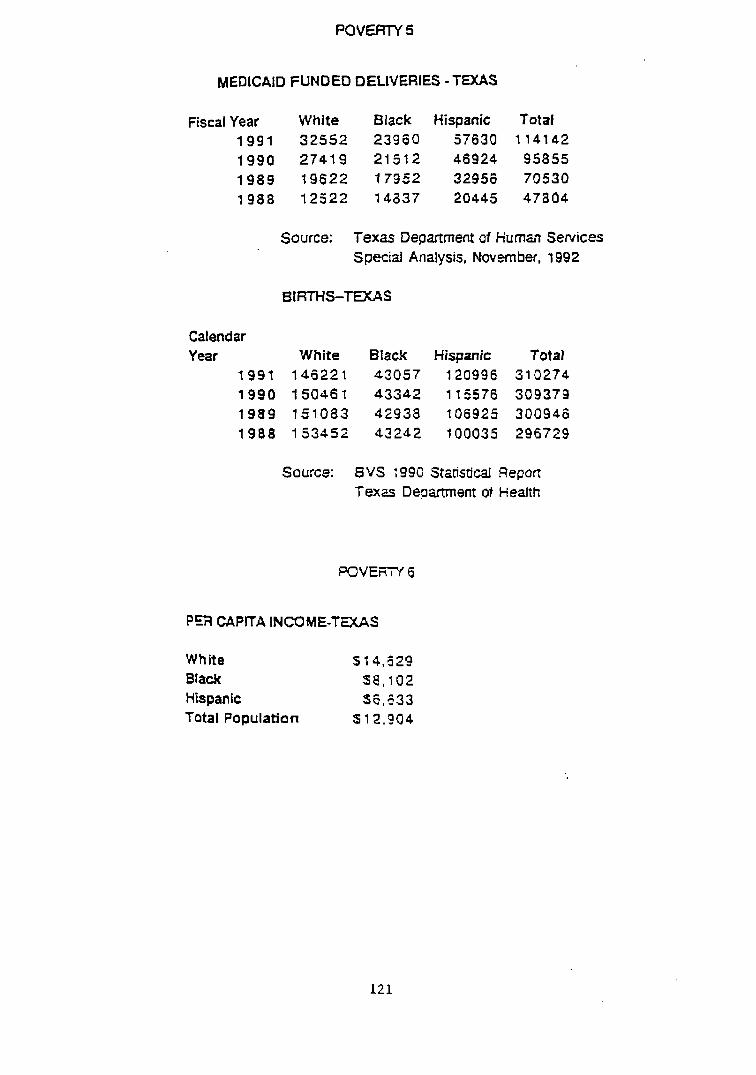
MEDICAID FUNDED DELIVERIES - TEXAS
Fiscal Year White Black Hispanic Total 1 9 9 1 32552 23960 57630 1 1 4 t 4 2
t 990 27419 21512 46924 95855 1 9 8 9 19622 17352 32956 70530 1 9 8 8 12522 14337 20445 47804
Source: Texas Department of Human Services Specid Analysis, November, 1992
BIRTHS-TEXAS
Calendar Year White Black Hispanic Total
1991 146221 43057 120996 310274 1990 15046 1 43342 11 5576 309379 1989 151083 45938 to6925 300946 1988 153452 43242 100035 296729
Source: 8 V S 1990 Statistical Repon T e x a D e p m e n t of Health
PER CAPlTA INCOME-TMAS
White S 1 4 , d Z g Black 5 8 , 1 0 2 Hispanic 56,!33 Total Population S 12.904
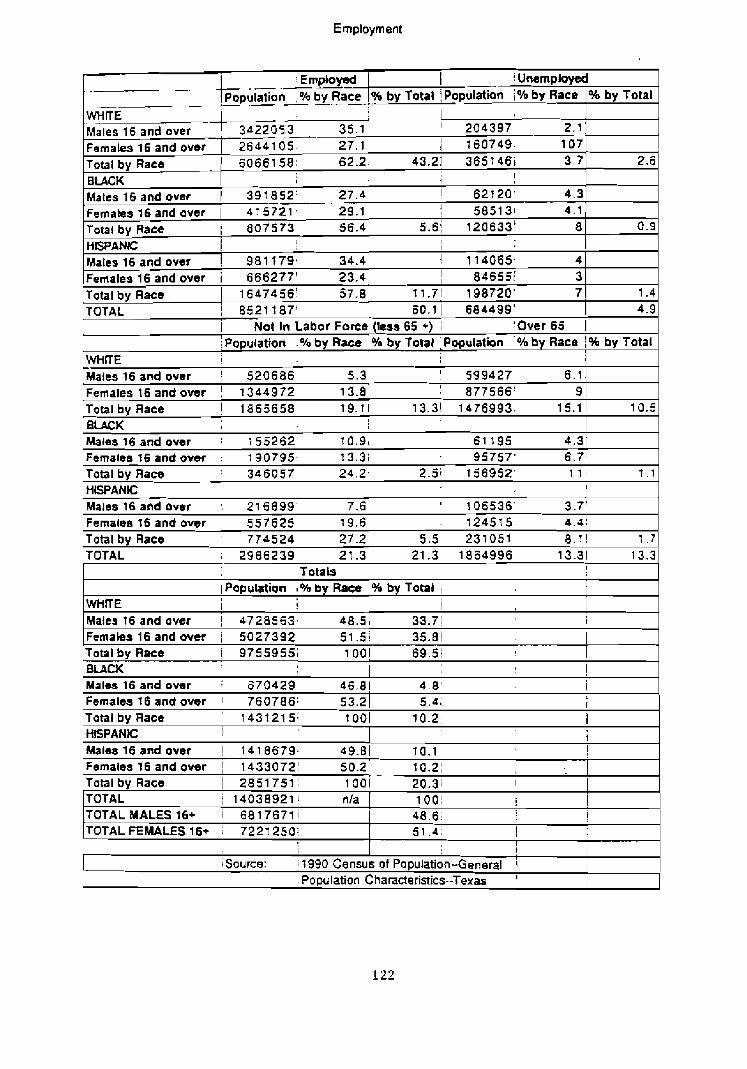
Emptoyment
.-.-- ! UnempIoyd
-- -
WHrrE Males 16 and over -+3d~5-+ - 35.1 ' ' 204397 2.1 Females 16 and over ] 2644 1 05 27.1! 1 160749, 107 Total by Race 62.21 43.21 365 146i 3.7 2.5 B U C K 1 ; !
0.9
1 .4 4.9
Matts16andover 1 397652' 27.4 emal ales 16 and aver I 4 7 572 1 . 29.1 Total by Race I 807573 56.4 HISPANK: Matesl6andover ! 981179- 34.4 Females 16 and over i 666277' 23.4 Total by Race 1 16474561 57.8 TOTAL / 8 5 2 1 f87'
e 4.3 1 585131 4.1
5.6i 120833' 8 I I
1 114065, 4 I 846551' 3
11.71 198720' 7 60.1 1 684499'
I Not In Labor Force (less 65 +) ; :Over65 1 i ~ o ~ u l a t b n .Oh by Race 1 % by Total ,Population by Race 1 % by Total
WHtTE 1 Males16andover ! 520686 5.31 I 599427 6.7 j Femalest6andover ! 1344972 13.01 1 877566' 9 1 Total by Race 1 1865658 19.71 13.31 1476993. 15.1 ! 10.5 BLACK ? I
I
Males 16 and over 1 1 55262- 10.91 61 195 4.31 FemalesI6andovsr : 190795, j3.31 95757' 6.71 Total by Race ' 346057 24.2' 2.5; 156952' 1 1 : t . l
HWANC I r Males16andavrr 215899 ' 7.6 1 ' 106536' 3.7' Females t6 and over 557625 19.61 - 124515 4.4 !
Total by Race 774524 27.21 5.5 231051 8 . r ! 1 . 7 TOTAL 2986239 21.31 21.3 1864996 13.31 13.3
Totab i I
1 Papubtion % by Race /Oh by Total !
WHTE I ! ! Malta 16 and over 1 4728563, 48 .5 ) 33.71 Females 16 and over 1 5027392 51.5! 35.81 Total by Race i 9755955; 1 OO! 6 9 . 5 ; BLACK ! Males 16 and over 1 670429 46.8j 4 .8 ' i Females I 6 and over ! 760786; 53.2 1 5 . 4 ; I
Total by Race ' 1431215: t 001 10.2 ! HISPANIC I i
Males16andover 1 1418679. 49.01 70.1 I
Females16andover 1 1433072' 50.zi 10.2; Total by Race 1 2851751, 1001 20.3; I
TOTAL / 14038921 1 nla TOTALMALES16+ i 6817671; TOTALFEMALES16+ i 7221250:
1001 ! 1 4 8 . 6 ~ I 5 1 . 4 , I i
I
source: ; f 990 Census of Population-General i . Population Characteristics--Texas '
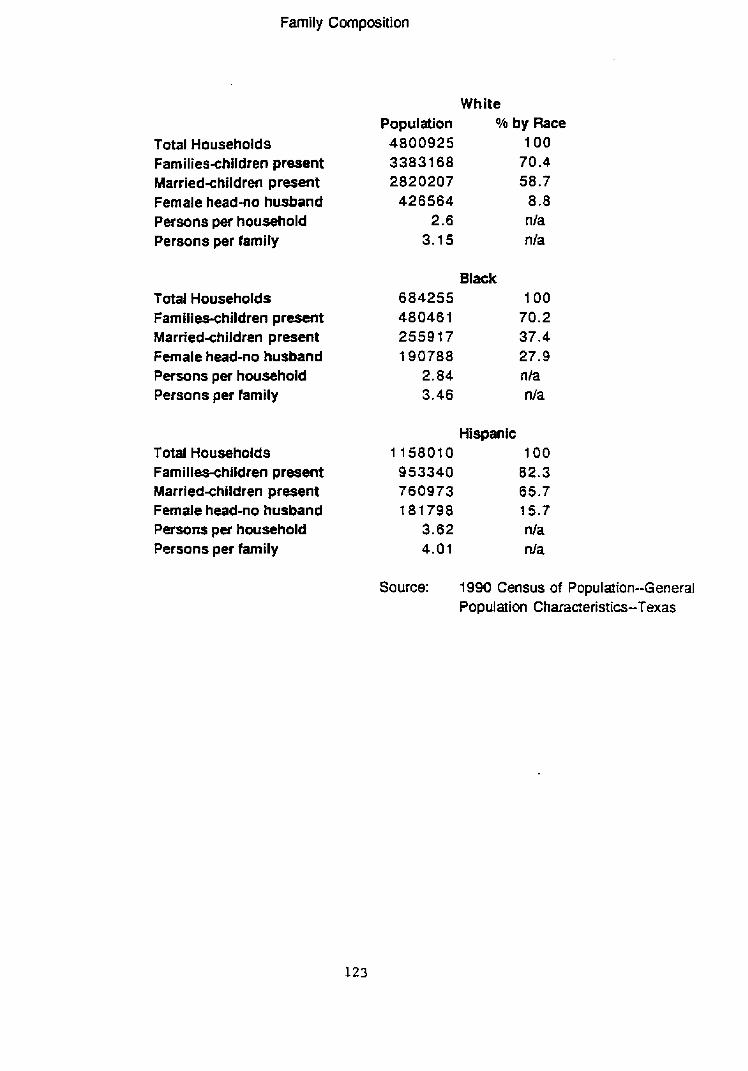
Family Composition
Total Households Families-children present Marriedxhildren present Female head-no husband Persons per household Persons per family
Total Households Families-children present Married~hildren present Female head-no husband Persons per household Persons per family
Total Households Familiwhildren present Marriedxhildren present FemaIe head-no husband Persons pw household Persons per family
White Population Oh by Race
4800925 100 33831 68 70.4 2820207 58.7
426564 8.8 2.6 nla
3.15 nla
Black 684255 100 480461 70.2 2559 t 7 37.4 190788 27.9
2.84 nia 3.46 nla
Hispanic 11580t0 100 953340 82.3 760973 65.7 t 8 t 7 9 8 15.7
3.62 nla 4.01 nla
Source: 1 990 Census of Population--General Population Characteristics-Texas
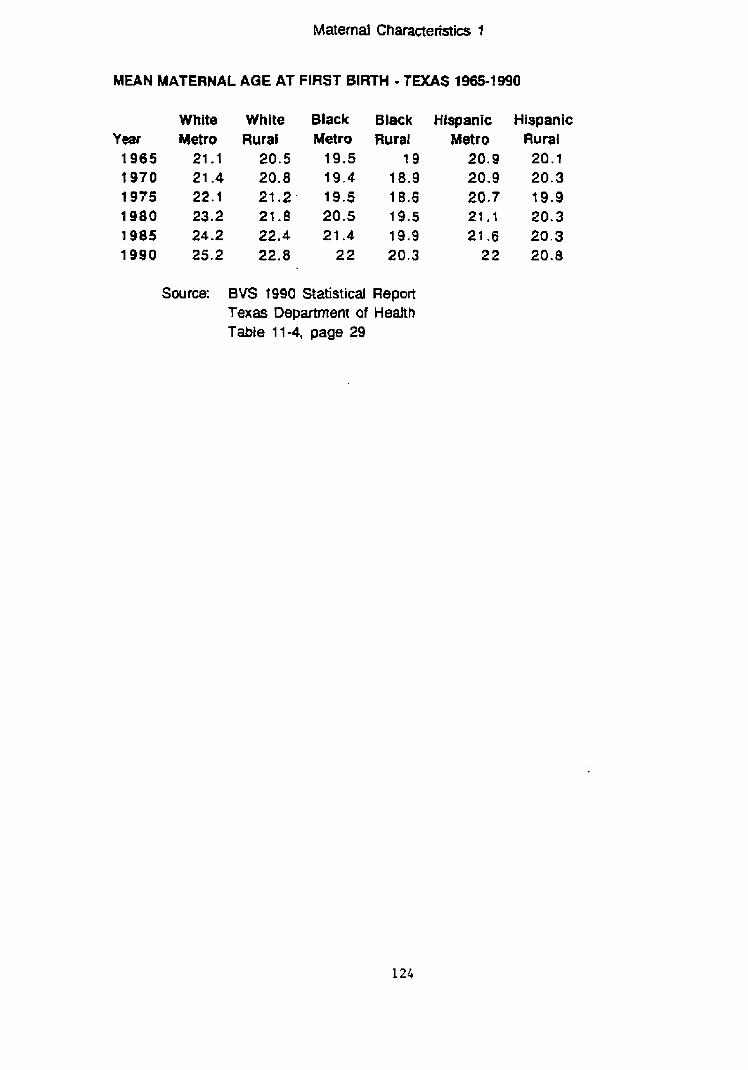
Maternal Characteristiw 1
MEAN MATERNAL AGE AT FIRST BIRTH - TaCAS 1965-1990
White Year Metro 1965 21 -1 1970 21.4 1975 22.1 1980 23.2 1985 24.2 1990 25.2
White Rural
20.5 20.8 21.2. 21.8 22.4 22.8
Black Metro
19.5 t 9 . 4 19.5 20.5 21.4
22
Black Rural
1 9 18.9 18.6 19.5 19.9 20.3
Source: BVS 1990 Statistical Report Texas Department of Health Table 1 1-4, page 29
Hispanic Metro
20.9 20.9 20.7 21 . I 21.6
2 2
Hispanic Rural 20.1 20.3 19.4 20.3 20.3 20.8
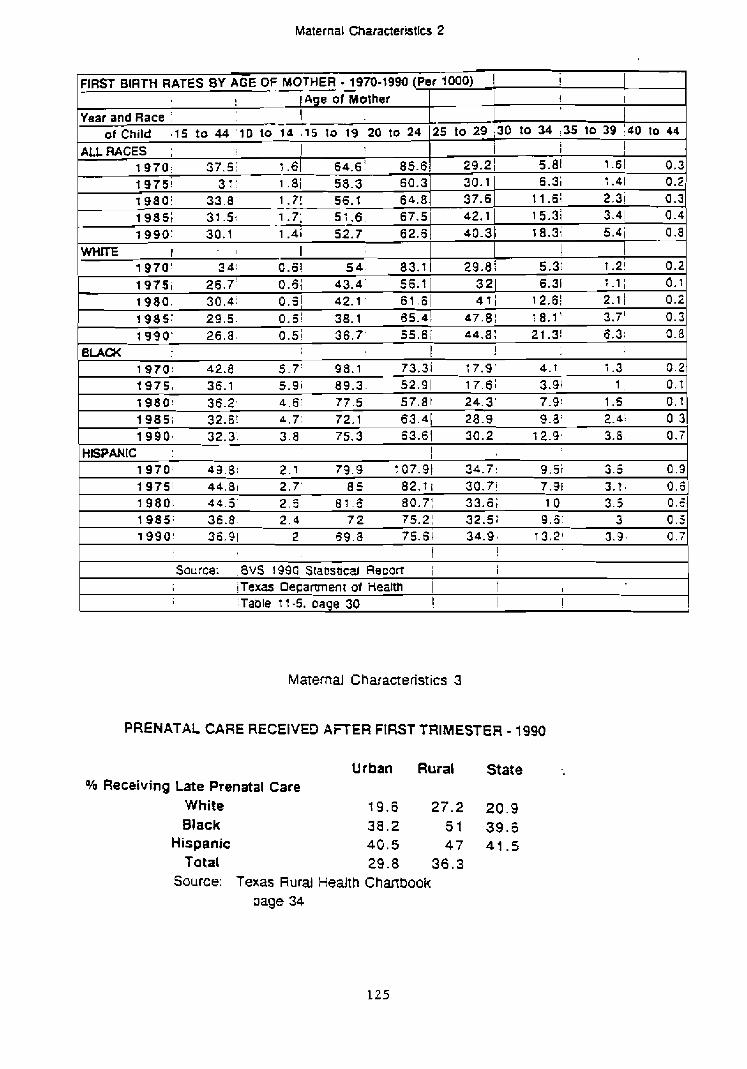
Maternal Characteristics 2
Maternal Characteristics 3
FIRST BIRTH RATES BY AGE OF -- MOTHER - 1970-19W (Per 1000) i ! I Age of Mother
1
PRENATAL CARE RECElVEO AFTER FIRST TRIMESTER - 1990
!
! I I
Urban Rural State % Receiving Late Prenatal Care
White 19.6 27.2 20.9 Black 38.2 5 1 39.6
Hispanic 40.5 47 41.5 Total 29.8 36,3
Source: Texas Rural HeAth Chartbook page 34
Year and Race t -- ofchild # I 5 to 4 4 ' 1 0 to 14 , I 5 to 19 20 to 24
ALLRACES : 1 1970: 37.51 r .61 64.6 ' 85.6 , 19751 3 1: 1 .8 / 58.3 60.3 tg8o i 33.8 - 1.71 56.1 64 .8 1985: 31.5: 1.7; 51.6 67.5 1990: 30.1 1.4; 52.7 62.6
WHITE I - I I 1 9 7 0 ' 3 4: 0.61 5 4. 83. t 1 9751 26.7: 0.6; 43.4- 56.1 1980. 30.4: O.o"l 42.1. 61.61 411 12.61 2.1 1 0.2 1985: 29 .5 . 0.61 38.1 65.a! 47.81 1 8 . v 3.7' 0.3 1 990 ' 26.8 0.51 36.7' 55 .6 ; 44.8: 2?.3! 5.3; 0.8
I I BLACK 1970: 42.8 5.7 ' 98.1 73.31 1 7.9' 4.1 1.3 0.2 1 9 7 5 , 36.1 5.9i 89.3- 52.91 17.6; 3.91 1 , 0.1 19801 36.2, 4.81 77.5 57.81 24.31 7.9! 1.5 0.1 1985; 32.8: 4.7: 72.1 63.4! 28.9! 9.8: 2.41 0.3 1 990 , 32.3. 3 . 8 75.3 63.61 30.2' 12.9, 3.8. 0.7
79.9 107.9! 34.7: 9.5 i 3.5 0.3 82.1; 30.71 7.31 3.1 , 0.5 80.71 33.5; 10 3.5 0.4 75.21 32.5; 9.3 3 0.3
i Table t 1-5. cage 30 ,
' 25 to 29 ;30 to 34 :35 to 39 1d0 to 44
i I 29.21 5.81 1.61 0.3 30.1 37.6 42. t
6.3; 1.41 0.2 I t -6: 2.3j 0.3 15.3i 3.41 0 . 4
40.31 1 8.3; 5.4i 0 . 8
! 29.8i 5.3; 1.2! 0.2
321 6.31 1.1; 0.1
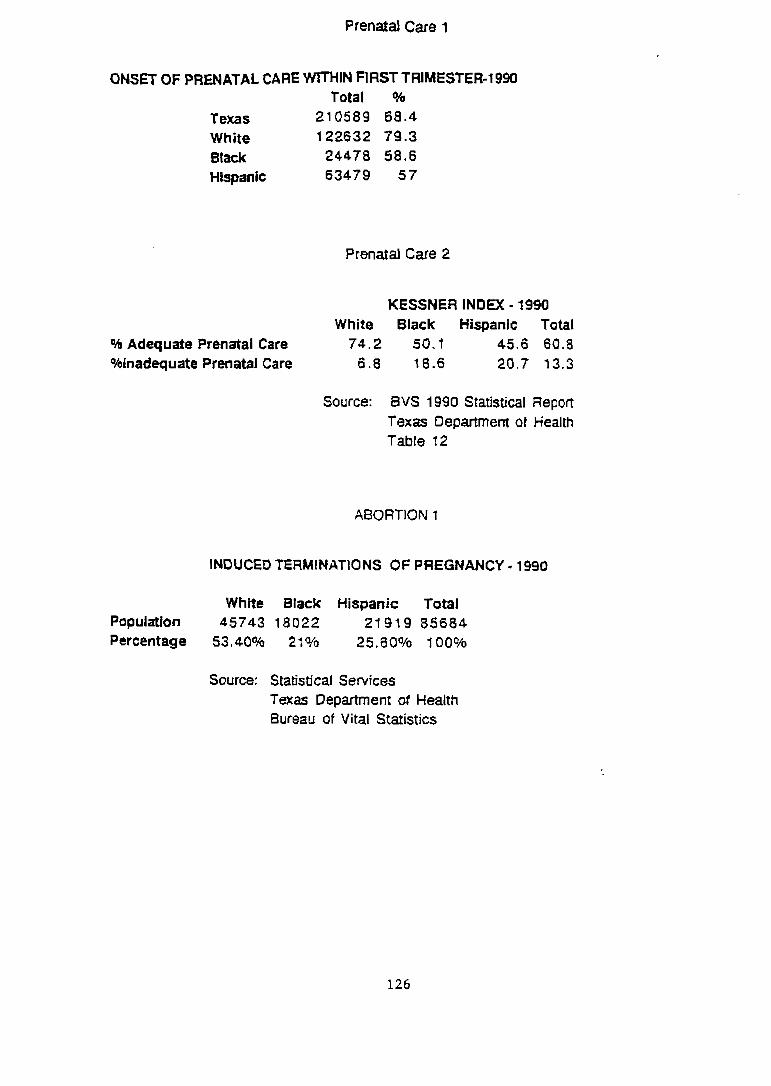
Prenatd Care 1
ONSET OF PRENATAL CARE WITHIN FIRST TRIMESTER-19% Total %
Texas 210589 68.4 White 122632 79.3 Black 24478 58.6 Hispanic 63479 5 7
Prenatal Care 2
KESSNER INDEX - 1990 White Black Hispanic Total
% Adequate Prenatal Care 74.2 50.1 45.6 60.8 %inadequate Prenatal Care 6 .8 18.6 20.7 13.3
Source: BVS 1990 Statistical Report Texas O e p m e r n of Health Table 12
ABORTION 1
INDUCED TERMINATIONS OF PREGNANCY - 1990
White Black Hispanic Total Population 45743 18022 21919 85684 Percentage 53,40% 21 YO 25.60% 100%
Source: Statistical Services Texas Depmment of Health Bureau of Vital Statistics
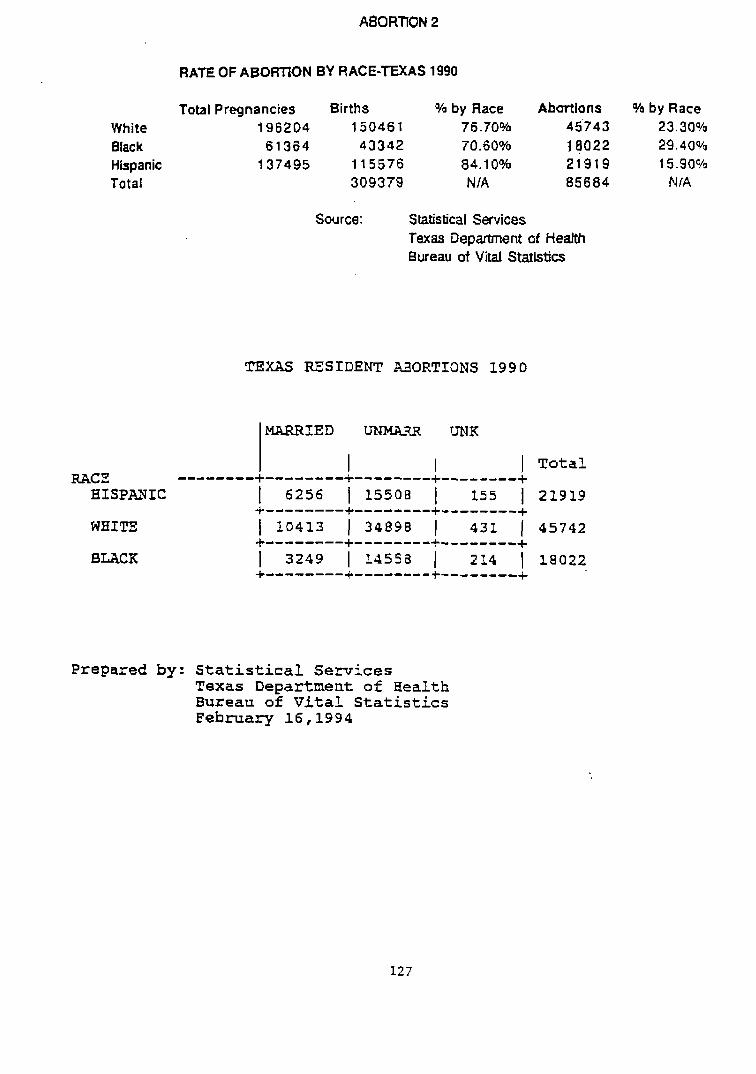
RATE OF ABORTION BY RACE-TEXAS 1990
Total Pregnancies Births YO by Race Abmlons H by Race White 196204 150461 76.70% 45743 23.30% Black 61 364 43342 70.60% 18022 29.40% Hispanic 137495 1 1 5576 84.1 OOh 2191 9 15.90% Total 309379 NIA 85684 NIA
Source: Statistical Services Texas Oepament of Health Bureau of Vital Statistics
TEXAS RESIDENT
I I 1 I Tota l RACE --------+--------+--------+------+
HISPANIC 1 6256 1 15508 [ 155 1 21919 4--------f--------+--------+
WHITE 1 10413 1 34898 1 431 1 45742 +--------+--------+--------+
BUCK 1 3249 1 l i l s s a 1 214 1 18022 +--------+--------+-a ------ +
Prepared by: Stat i s t i ca l Services Texas Department of Health Buxeau of V i t a l Statistics February 16,1994
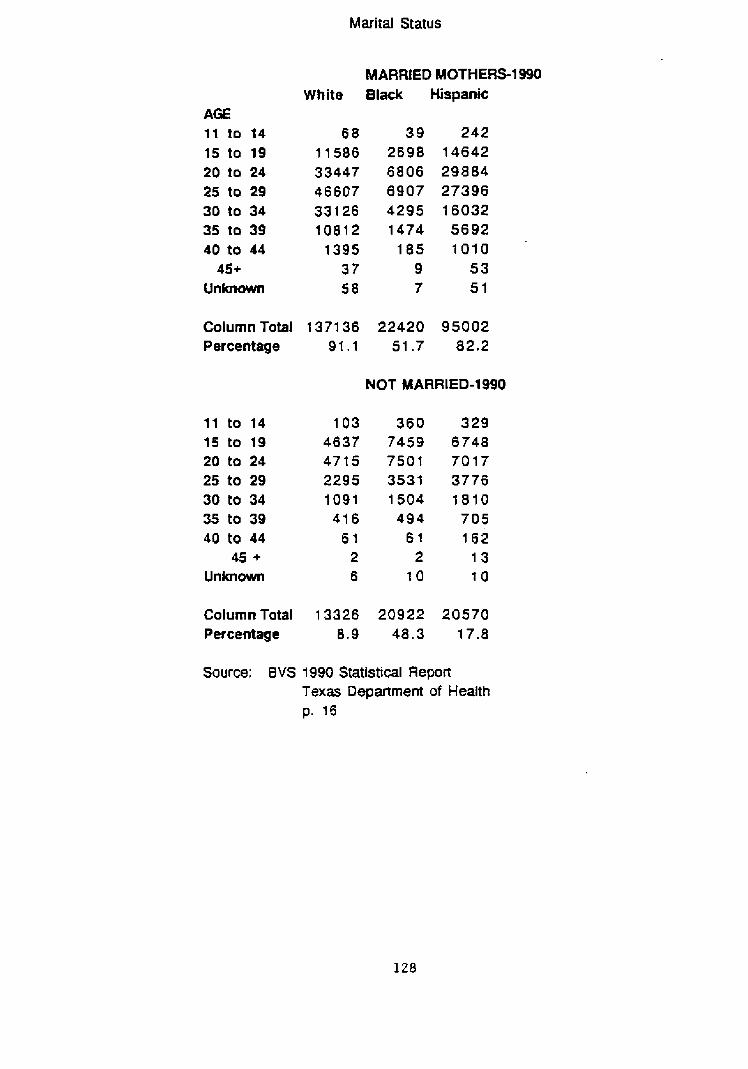
Marital Status
AGE 11 to 14 15 to 19 20 to 24 25 to 29 30 to 34 35 to 39 40 tO 44
45+ Unknown
MARRIED MOTHERS-1 990 White 81&c HIspanic
Column Total 1371 36 22420 95002 Percentage 91.1 51.7 82.2
NOT MARRIED-1 990
Column Total 13326 20922 20570 Percentage 8.9 48.3 17.8
Source: BVS 1990 Statistical RepoFt Texa Department of Health p. 16
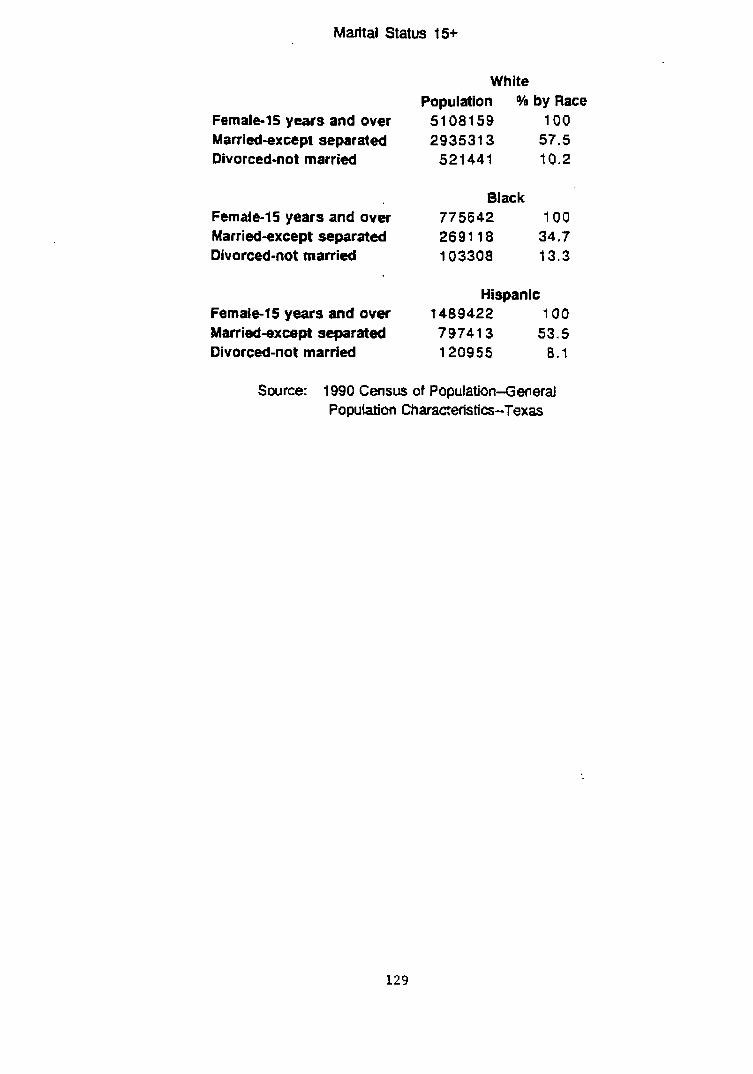
Marital Status t5+
White Population % by Race
Female15 years and over 5108159 100 Married-except separated 2935313 57.5 Divorced-not married 521 441 t 0.2
Black Female-15 years and over 775642 100 Married-except separated 2691 18 34.7 Divorced-not married 103308 t 3.3
Hispanic Female-15 years and over t 489422 100 Married-except separated 79741 3 53.5 Divorced-not married 120955 8.1
Source: 1990 Census of Population-General Population Charaaeflstia-Texas
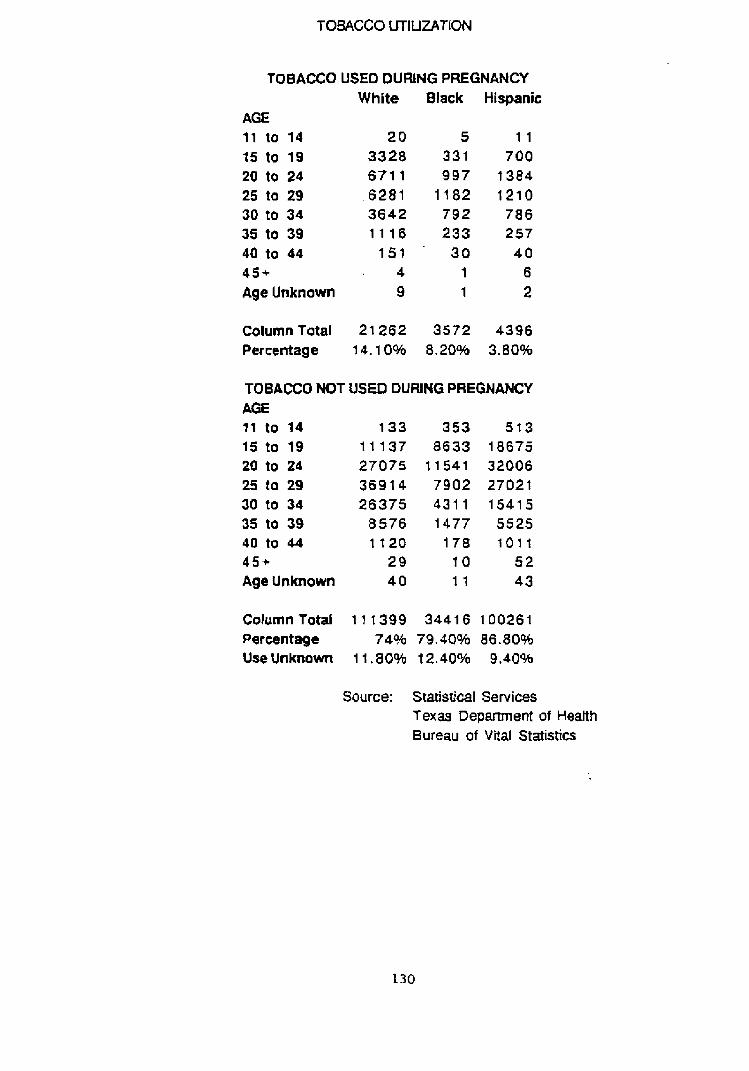
TOBACCO UTILIZATION
TOBACCO USEO DURING PREGNANCY White Black Hispanic
AGE 11 to 14 20 5 1 1
15 to 19 3328 331 700 20 to 24 671 1 997 1384 25 to 29 6281 1182 1210 30 to 34 3642 792 7 8 6 35 to 39 1 1 1 6 233 257 40 to 44 151 30 4 0 4 S + 4 1 6 Age Unknown 9 1 2
ColumnTatal 21262 3572 4396 Percentage 1 4.1 0% 8.20% 3.80%
TOBACCO NOT USEO DURING PREGNANCY AGE I f to 14 133 353 513 15 to 19 11 137 8633 18675 20 to 24 27075 t 1541 32006 25 la 29 3 6 9 t 4 7902 27021 30 to 34 26375 4 3 1 1 15415 35 to 39 8576 1477 5525 40 to 44 t t 2 O 178 1011 4 5 + 29 10 5 2 Age Unknown 4 0 1 1 43
Column Total 11 1399 3441 6 100261 Percentage 74% 79.40% 86.80% UseUnknom 11.80% 12.40% 9.40%
Source: Statistical Services Texas Depamnent of Health Bureau of Vital Statistics

ACCESS.
POPULATION P€R PHYSICIAN
Urban Rural State 684 1395 754
Source: Texas Rural Health Chartbook p. 41
BIBLIOGRAPHY
Books
Babbie, E a r l . The Practice of Social Research. 5th ed. Belmont: Wadsworth, 1989.
B u t l e r , John Sibley. Entrepreneurship and Self-Help Amonq B lack Americans: A Reconsideration of Race and Economics . Albany: State University of N e w York Press, 1991.
Clifford, Patr ick R.. "Substance Abuse in the Black Community." In Health Care Issues i n Black America. Ed. Woodrow Jones Jr., and Mitchel F. Rice. N e w York: Greenwood Press, 1987.
Howze, Dorothy C . . 9 t C l o s i n g the Gap Between B lack and White Infant Mortality R a t e s : An Analysis of Policy opt ions ." In Health Care Issues in Black America. Ed. Woodrow Jones, Jr., and Mitchel F. R i c e . N e w York: Greenwood Press, 1987.
Jencks , Christopher. Rethinkins social Policy: Race Poverty, and t h e Underclass. N e w York: Harper perennial, 1992.
Kuhn, Thomas S . . The Structure of S c i e n t i f i c Revolutions. 2nd ed., enlarged. Chicago: University of Chicago, 1970.
Lindert, Peter H. Fertility and Scarcitv in America. Princeton: P r i n c e t o n University Press, 1978.
Moynihan, Daniel P. P r e s s , 1970. Maximum F e a s i b l e Misunderstandinq. N e w York: Free Press, 1970.
Shortell, Stephen M . , Arnold D. Kaluzny and Associates. Health Care Manaqement: A Text in Orqanization Theory and Behavior. 2nd ed. Albany: Delmar, 1988.
Weiner, Joshua M. and Jeannie E n g e l . Irnprovinq Access to Health Services for Children and Presnant Women. Dialoqs onPublic Washington: The Brookings Institution, 1991.
The White House Domestic Policy Council. The President's I T h e Clinton Blueprint. N e w York: T i m e s Books, 1993.
Wilson, William J. The Truly Disadvantaqed: The Inner City, the Underclass, and Public Policy. Chicago: University of Chicago Press, 1987.
Journals
Buescher, Paul A . and Nancy I. Ward. "A Comparison of L o w Birth Weight Among Medicaid Patients of Public Health Departments and Other Providers of Prenatal Care in North Carolina and Kentucky." Public Health Re~orts. 107 no. 1 (1992) : 54-65.
Children's Defense Fund-Texas, The Benedictine Resources Center, The March of Dimes Birth Defects Foundation, and The Texas Per ina ta l Association. "Women and Children F i r s t : A Plan for Improving Maternal and Child Health Outcomes in the 1990I~.~l Texas Hospital Association. (1992).
Cooper, Mary H. "Infant ~ortality: Why is t h e U.S. Death Rate High Compared With Other Nations?'' C.O. Researcher. 2 no. 2 8 (1992): 641-664.
Cramer, James C . "Trends in I n f a n t Mortality among Racial and Ethnic Groups in California. Socia l Science Research. 17 (1988) : 164-189.
. "Social Factors and Infant Mortality: Identifying High-Risk Groups and Proximate Causes." Demoqraphy. 2 4 no. 3 (1987): 299-322.
Eberstadt, Nicholas. llAmerica's infant-mortality puzzle." The Public Interest. 105 (1991): 30-47.
Eberstein, Isaac W., Charles B. Nam, and Robert A. Hummer. tBfnfant ~ortality by Cause of Death: ~ a i n and Interaction Effects." Demosra~hv. 27 no. 3 (1990): 413 -430 .
Hale, Christiane B.. 'IInfant Mortality: An American Tragedy." The B lack Scholar. (1990): 17-26.
Harris, Fredrick C. "something w i t h i n : Religion as a Mobilizer of African-American Political Activi~rn.'~ - The Journal of ~olitics. 56 no. 1 (1993): 4 2 - 6 8 .
Joyce, Theodore J. and Michael Grossman. "Pregnancy Wantedness and t h e Early I n i t i a t i o n of Prenatal Care." Demoqravhy. 27 no. 1 (1990): 1-17.
Kahler, Lucinda R . , MS, Robert M. O'Shea, PhD, Linda C . Duffy, PhD, and Germaine M. Buck, PhD. "Fac tors Associated with Rates of Participation in WIC by Eligible Pregnant W~rnen.~~ Public Health Reports. 107 no. 1 (1992): 6 0 - 6 5 .
Livingood, William C. and Lynn D. Woodhouse. "Keystone: Model for Training to Implement School Health Promotion Programs." Health Values. 16 no. 1 (1992) : 10-15.
Longest Jr., Beaufort B.. "American Health Policy in the Year 2000.Iq Hospital & Health Services Administration. 3 3 no. 4 (1988) : 4 1 9 - 4 3 3 .
Maynihan, Daniel Patrick. tlHou the Great Society Destroyed the American Family." The Public Interest. 108 (1992) : 53-64 .
Nassirpour, Mehdi and Ted Jensen. ''Comparing Medicaid Mothers and Babies to Non-Medicaid Recipients." Health Values. 16 no. 3 (1992) : 33-42.
Organisation for Economic Co-operation and Development. OECD Social Policy Studies No. 7. "Health Care Systems in Transition: The Search for Efficiency." Paris, 1990.
Pampel, Fred C. Jr. and Vijayan K. Pillai. 'I Patterns and Determinants of Infant Mortality in Developed Nations, 1950-1975.1' Demoqraphy. 23 no. 4 (1986) : 525-541.
Polednak, Anthony P . "Black-White Differences in I n f a n t Mortality in 3 8 Standard ~etropolitan Statistical Areasen American Journal of Public Health. 81 no.11 (1991): 1480-1481.
Reis, Janet, PhD, Denise Robinson, RN, V i r g i n i a Anderson, MEd, and Bernice Mills-Thomas, RN, MS.. qlPerspectives on Pregnancy and Prenatal Care Among Inner-City Men and Women." H e a l t h V a l u e s . 16 no. 3 (1992): 14-19.
Santerre, Rexford E., Stephen G. Grubaugh and Andrew J. Stollar. I'Government Intervention in Health Care Markets and Health Care Outcomes: Some International Evidence." Cato Journal. 11 no. 1 (1991): 1-11.
Schlesinger, Mark and Karl Kronebusch. "The Failure of Prenatal Care Policy for the Poor.f1 Health A f f a i r s . (1990): 91-111.
Schoendorf, M.D.,, M.P.H., Carol J . R . Hogue, M.P .H . , Ph.D., Joel C. Klelnman, Ph.D., and Diane Rowley, M.D., M.P.H.. *@Mortality Among I n f a n t s of Blacks as Compared w i t h White College-Educated Parents, ' ' New Enqland Journal of pedicine. 326 no. 2 3 (1992): 1522-1526.
Weeks, John R. and Ruben G. Rumbaut. "Infant Mortality Among Ethnic Immigrant Groups.lt Social Science Medicine. 33 no. 3 (1991): 3 2 7 - 3 3 4 .
Government Publications
Bureau of Maternal and Child Health, Texas Department of Health. (1991). Maternal and Child Health Services 1990. Texas Department of Health, Austin, Texas.
Bureau of V i t a l S t a t i s t i c s , Texas Department of Health. (1991). Texas V i t a l statistics: 1990 Annual Rewort. Texas Department of Health, Austin, Texas.
Center of Rural Health Initiatives, Texas Department of Health. (1992). Texas Rural Health Chartbook. Texas Department of Health, A u s t i n , Texas.
General Accounting Office. (1992). Maternal and Child Health Block G r a n t Funds Should Be Distributed More Equitably. (GAO Report No. GAO/ARD-92-5). Gaithersburg, Md: U . S General Accounting Office.
Primary Health Care Services Program, Texas Department of Health. (1992). Baseline Needs Assessment. Texas Department of Health, Austin, Texas.
Program Budget & Statistics Client Self-support Services State Office, Texas Department of Human Services. (1991). The Demosra~hic Profile of AFDC Caretakers for Ausust 1991,Texas Department of Human Services, Austin, Texas.
Texas Statewide Health Coordinating Council, Texas Department of Health. (1992). 1993-1994 Preliminarv Texas S t a t e Health Plan. Texas Department of Health , Austin, Texas.
S. Congress. Senate. The report of-The National Commission to Prevent Infant Mortality. Death Before Life: The Trasedv of Infant Mortality. Washington: GPO, 1989.
S. Department of Commerce. Economics and S t a t i s t i c s Administration. Bureau of the Census. (1992) 1990 Census of Population-General Population Characteristics--Texas. Washington D. C. ( pub. no.1990 CP-1-45).
Department of Health & Human Services. P u b l i c Hea l th Serv i ce . Health Resources and Services Administration. Maternal and Child Health Bureau. (1991). Healthv Children 2000: National Health Prommotion and Disease Prevention Objectives Related to Mothers, Infants, Children, Adolescents and Youth. U. S . Department of Health & Human Services, Washington D.C. (DHHS publication No. HRSA-M-CH-91-2) .
~rlandi, ~ a r i o A * , Raymond Weston, and Lenoard G. E p s t e i n . eds. Cultural Competence fo r Evaluators: A Guide for , A 8 Working with Ethnic/Racial Communities. (1992) OSAP Cultural Competence Series I. U. S. D e p a r t m e n t of Health and Human Services. Public Health Service. Alcohol, Drug Abuse, and Mental Health Administration. Office for Substance Abuse Prevention-Division of Community Prevention and Training, Rockville, Md.
S. Department of Health & Human Services, Public Health Service, Health Resources services Administration, Bureau of Health Professions. Health Status of t h e f . 1990.U.. Department of Health & Human Services, Washington, D.C. (DHHS Publication No. [HRSA] HRS-P-DV 90-1) .
other
Michie, Michael W. "Exploring t h e Keys t h e Educational Success for Black Males: A Comparison of Results from Focus Groups of B l a c k Males to Focus Groups of Black Females and Suggestions from t h e Literature." MPA a . p . r . , southwest Texas State University, 1993.
Related Documents