The Pennsylvania State University The Graduate School Eberly College of Science FUNCTIONAL ROLE OF CYTOSKELETON PROTEIN ACTIN IN SYNAPSE MATURATION AND PLASTICITY A Thesis in Biology By Jun Yao © 2007 Jun Yao Submitted in Partial Fulfillment of the Requirements for the Degree of Doctor of Philosophy August 2007

Welcome message from author
This document is posted to help you gain knowledge. Please leave a comment to let me know what you think about it! Share it to your friends and learn new things together.
Transcript
The Pennsylvania State University
The Graduate School
Eberly College of Science
FUNCTIONAL ROLE OF CYTOSKELETON PROTEIN ACTIN IN
SYNAPSE MATURATION AND PLASTICITY
A Thesis in
Biology
By
Jun Yao
© 2007 Jun Yao
Submitted in Partial Fulfillment
of the Requirements
for the Degree of
Doctor of Philosophy
August 2007

ii
The thesis of Jun Yao was reviewed and approved* by the following:
Gong Chen
Assistant Professor of Biology
Thesis Advisor
Chair of Committee
Richard Ordway
Associate Professor of Biology, Chair of Genetics Graduate Program
Si-Qiong Liu
Assistant Professor of Biology
Zhi-chun Lai
Associate Professor of Biology, Biochemistry & Molecular Biology
Pamela J. Mitchell
Associate Professor of Biochemistry & Molecular Biology
Douglas Cavener
Head and Professor of Biology
*Signatures are on file in the Graduate School
iii
ABSTRACT
Long-term synaptic plasticity, which is accompanied by both functional and
morphological changes of synapses, may involve not only postsynaptic potentiation, but
also presynaptic enhancement. Activation of postsynaptic silent synapses has been found
to contribute significantly to long-term synaptic plasticity during early developmental
stage of neurons. Postsynaptic silent synapses only show NMDA receptor (NMDAR)
activity but not AMPA receptor (AMPAR) activity before the induction of LTP.
Postsynaptic silent synapses are activated through NMDAR-dependent insertion of
AMPARs to postsynaptic density. On the other hand, presynaptic silent synapses have
also been found during recent years. Presynaptic silent synapses are likely due to very
low probability of neurotransmitter release. However, not like postsynaptic silent
synapses, the mechanism underlying activation of presynaptic silent synapses is not well
understood.
Actin is an essential type of cytoskeleton protein which plays a vital role in
synapse development and synaptic plasticity. Postsynaptically, actin filaments may
undergo activity-dependent remodeling and play a critical role in the maintenance of LTP
and stabilizing/destabilizing dendritic spines. In presynaptic terminals, actin filaments are
surrounding synaptic vesicles and thus may regulate synaptic vesicle cycling. Moreover,
activity-dependent presynaptic actin redistribution facilitates new synapse formation. In
addition, actin was found to maintain synaptic integrity during neuronal development.

iv
The main objective of this doctoral thesis was to address the functional role of the
actin during the activation of presynaptic silent synapses and long-term synaptic
plasticity. Here, I have shown that repetitive spaced stimulation induced long-term
synaptic plasticity in immature but not mature hippocampal neurons. Functional FM
imaging and retrospective immunostaining revealed a transition of presynaptic silent
boutons into active ones in response to repetitive stimulation. Electrophysiology analysis
and FM imaging indicated that the activation of presynaptic silent synapses may be
triggered by L-type Ca2+ channel-mediated Ca2+ influx and is dependent on downstream
PKA/PKC signaling cascades, but independent of postsynaptic NMDA receptors.
Moreover, inhibition of actin polymerization prevented the activation of presynaptic
silent synapses, whereas promoting actin polymerization facilitates the conversion of
silent to active synapses. In summary, our data suggest that the activation of presynaptic
silent synapses significantly contribute to the long-term synaptic plasticity during early
developmental stage of rat hippocampal neurons, and actin polymerization plays an
important role in regulating such presynaptic plasticity.

v
TABLE OF CONTENTS
LIST OF FIGURES..........................................................................................................viii
ABBREVIATION...............................................................................................................x
ACKNOWLEDGEMENTS...............................................................................................xii
Chapter 1 Introduction.................................................................................................... 1
1.1 Synapse formation and synaptic remodeling...................................................... 1 1.1.1 Synapse formation..................................................................................... 1 1.1.2 Silent synapse and long-term synaptic plasticity........................................ 10 1.1.3 Ca2+ signaling and protein kinases involved in synaptic remodeling…..... 15
1.2 Actin in synapse formation and synapse modification........................................ 18 1.2.1 General Consideration……………………………………........................ 18 1.2.2 Actin in axon growth................................................................................. 20 1.2.3 Actin in synaptic development and plasticity............................................ 22 1.2.4 Actin binding proteins............................................................................... 26
1.2.4.1 ADF/cofilin........................................................................................ 26 1.2.4.2 Capping proteins................................................................................ 27 1.2.4.3 Arg2/3 complex................................................................................. 28 1.2.4.4 Profilin............................................................................................... 29 1.2.4.5 Thymosins.......................................................................................... 29 1.2.4.6 DNase I.............................................................................................. 30
1.3 Aims of this thesis............................................................................................. 31
Chapter 2 Materials and Methods................................................................................... 33
2.1 Cell culture....................................................................................................... 33 2.1.1 Preparation of microisland………………………………………….......... 33 2.1.2 Primary glial culture.................................................................................. 33 2.1.3 Hippocampal neuronal culture................................................................... 35
2.2 Electrophysiology............................................................................................ 36 2.3 FM 1-43 imaging assay.................................................................................... 37 2.4 Quantification of FM imaging......................................................................... 38 2.5 Immunocytochemistry..................................................................................... 39 2.6 Quantification of immunofluorescent staining................................................ 41 2.7 Drugs and treatments....................................................................................... 41
Chapter 3 Summary of results…..................................................................................... 43
3.1 Repetitive-spaced stimulation induces long-term synaptic plasticity in immature

vi
but not mature hippocampal neurons.................................................................. 43 3.2 Repetitive stimulation increases presynaptic functional boutons in immature
neurons but not mature neurons.......................................................................... 48
3.3 Immature synapses are presynaptically silent but become active after repetitive
stimulation........................................................................................................... 56
3.4 Activation of presynaptic silent synapses depends on L-type Ca2+ channels and
PKA/PKC signaling pathways………………………………………................ 59
3.5 Actin plays a critical role in activating presynaptic silent synapses…………... 67 3.6 Actin but not microtubule is critical for presynaptic long-term plasticity…...... 73 3.7 Repetitive stimulation increases actin polymerization in immature but not
mature axons..................................................................................................................... 75
Chapter 4 Discussion...................................................................................................... 77
4.1 Presynaptic versus postsynaptic mechanisms of long-term synaptic
plasticity.............................................................................................................................. 77
4.2 Actin-dependent activation of presynaptic silent boutons....................................... 82 4.3 The role of actin in developmentally regulated long-term synaptic
plasticity.............................................................................................................................. 86
Chapter 5 Rapid GABAergic synapse formation in hypothalamic neurons................... 89
5.1 Introduction......................................................................................................... 89 5.1.1 GABAergic synapse formation………………………………………...... 89 5.1.2 BDNF signaling pathway…………………………………………........... 90 5.1.3 Summary…………………………………………………………............ 92
5.2 Methods.............................................................................................................. 93 5.2.1 Primary hippocampal culture..................................................................... 93 5.2.2 Electrophysiology...................................................................................... 93
5.3 Results................................................................................................................. 94 5.3.1 Embryonic neurons lack functional glutamate receptors........................... 94 5.3.2 Application of TrkB antagonist abonishes early GABAergic
synaptogenesis........................................................................................................ 97
5.4 Discussion........................................................................................................... 99
Chapter 6 Effects of cyclothiazide on GABAergic synaptic transmission...................103
6.1 Introduction.......................................................................................................103 6.2 Methods.............................................................................................................106

vii
6.2.1 Primary hippocampal culture...................................................................106 6.2.2 Immunofluorescent staining and quantification.......................................106
6.3 Results...............................................................................................................107 6.4 Discussion.........................................................................................................110
Bibliography....................................................................................................................113

viii
LIST OF FIGURES
Figure 1-1. Presynaptic assembly is envisioned to occur by multiple processes that take
place over several timescales....................................................................... 5
Figure 1-2. Pre- and postsynaptic silent synapses…….................................................. 13
Figure 1-3. Actin filaments and microtubules are polarized polymers........................... 19
Figure 3-1. Repetitive stimulation induces long-term enhancement of synaptic
transmission in immature but not mature hippocampal neurons.................. 44
Figure 3-2. Repetitive stimulation induces long-term enhancement first in presynaptic
terminals but not postsynaptic dendritic spines........................................... 46
Figure 3-3. Repetitive spaced stimulation protocal for FM 1-43 imaging..................... 50
Figure 3-4. Repetitive stimulation induces long-term enhancement of presynaptic
function in immature but not mature neurons.............................................. 52
Figure 3-5. Single spaced stimulation does not induce presynaptic long-term
enhancement in immature neurons............................................................... 54
Figure 3-6. Retrospective immunocytochemistry reveals presynaptic silent boutons in
immature but not mature neurons................................................................. 55
Figure 3-7. Comparison of repetitive stimulation-induced changes of presynaptic versus
postsynaptic puncta in immature neurons.................................................... 58
Figure 3-8. Dependence on L-type Ca 2+ channels of the presynaptic
enhancement................................................................................................. 60
Figure 3-9. Glutamate receptor antagonists block postsynaptic but not presynaptic
long-term enhancement................................................................................ 62
ix
Figure 3-10. Dependence on PKA/PKC signaling pathways of the presynaptic
enhancement................................................................................................. 65
Figure 3-11. Effets of H89 and GF109203x on basal presynaptic activity under normal
conditions without repetitive stimulation..................................................... 66
Figure 3-12. Inhibition of actin polymerization abolishes presynaptic long-term
enhancement in immature neurons............................................................... 68
Figure 3-13. Effect of actin depolymerizer on basal synaptic activity in immature
neurons......................................................................................................... 70
Figure 3-14. Actin but not microtubule polymerization is critical to presynaptic long-term
enhancement in immature neurons............................................................... 72
Figure 3-15. Repetitive stimulation increases actin polymerization in immature but not
mature neurons............................................................................................. 74
Figure 5-1. Lack of functional glutamate receptors and a delay of glutamatergic synapse
formation in embryonic neurons.................................................................. 96
Figure 5-2. BDNF derived synapse formation is through the activation of tyrosine
kinase receptors…………............................................................................ 98
Figure 6-1. Chronic CTZ treatment results in a significant decrease of the frequency but not
the amplitude of miniature IPSCs............... ...................................................108
Figure 6-2. CTZ treatment does not affect the number of GABAergic synapses..................109

x
ABBREVIATION
CNS central nervous system
NMDA N-methyl-D-aspartic acid
NMDAR NMDA receptor
AMPA α-Amino-3-hydroxy-5-methyl-4-isoxazolepropionic acid
AMPAR AMPA receptor
GABA γ-Aminobutyric acid
GABAAR GABAA receptor
PKA cAMP-dependent protein kinase A
PKC protein kinase C
TTX tetanus toxin
mEPSCs miniature excitatory postsynaptic currents
mIPSCs miniature inhibitory postsynaptic currents
FGF fibroblast growth factor
CAM cell-adhesion molecule
PTV piccolo/bassoon transport vesicles
RRP readily releasable pool
RP reserve pool
LTP long-term potentiation
L-LTP late phase LTP
E-LTP early phase LTP
PPF paired-pulse facilitation

xi
CREB cAMP response element binding protein
L-VSCCs L-type voltage-sensitive Ca2+ channels
G-actin globular actin
F-actin filamentous actin
MTs Microtubules
NMJ Neural-muscular junction
LIMK-1 LIM kinase-1
BDNF Brain-derived neurotrophic factor
SNARE soluble NSF attachment protein receptor
Trk tyrosine receptor kinase
CTZ cyclothiazide
GAD glutamate decarboxylase

xii
ACKNOWLEDGEMENTS
I would like to express sincere thanks to my advisor, Dr. Gong Chen, for his
advice, counsel and instruction in the development and completion of this study.
Special recognition and gratitude are given to individuals who served in the thesis
committee and contributed to the completion of this study: Dr. Richard Ordway, Dr.
Si-Qiong Liu, Dr. Zhi-chun Lai and Dr. Pamela Mitchell. Sincere appreciation goes to Dr.
Jinshun Qi for his precious help on experiments. Gratitude expresses to Dr. Bernhard
Luscher for his insightful suggestions in the development of this study. Gratitude also
goes to my colleagues in Dr. Chen’s lab for offering their assistance.
Last and most of all, I would like to extend love and appreciation to my wife
Donghua, for her love, understanding and support to see this degree through to
completion.

1
Chapter 1
Introduction
1.1 Synapse formation and synaptic remodeling
1.1.1 Synapse formation
In 1906, Ramon Cajal and Charles Sherrington described neuronal connections
and came up with the concept of synapse. One synapse is composed of presynaptic
terminal, postsynaptic region and synaptic cleft between them. Since then, synapse
formation and synaptic activity became one of the most significant researches for
neuroscientists because all the neuronal signaling spreading over the neural network must
be conducted through synapses.
The approximate process of synapse formation has already been elucidated in the
past years. During synaptogenesis, signalling molecules are conveyed between
presynaptic and postsynaptic apparatus to adjust their status, so that finally the
morphological characteristics of both the presynaptic boutons and the postsynaptic
dendritic spines could be well matched. The first step of synaptogenesis is target
recognizing. Signaling molecules coming from not only neurons but also surrounding
glial cells participate in this process. For instance, axons are guided to correct targets with
the help of neural-secreted molecules such as netrins, semaphorins and ephrinA (Bagri

2
and Tessier-Lavigne, 2002; Pascual et al., 2004; Tessier-Lavigne, 1995). The
postsynaptic neurons also secrete proteins which participate in presynaptic priming.
These factor molecules including fibroblast growth factor (FGFs) and Wnts are capable
of inducing the accumulation of presynaptic vesicles in the axons (Scheiffele, 2003). In
addition to these factors secreted by neurons, glial cells may also secrete inducing factors
such as cholesterol and thrombospondin (TSP) to promote axonal and dendritic
maturation and initial synapse formation.
After a presynaptic growth cone finds its target region on the postsynaptic
membrane, the filopodia begins to retract, and subsequently causes the differentiation of
both the presynaptic bouton and the postsynaptic density through a series of changes.
Many proteins play active roles in the pre- and postsynaptic development. The
cell-adhesion molecule (CAM) family members cadherins and protocadherins have been
suggested to help not only recognizing targets of axons but also initiating synapse
formation. The neuronal activity-regulated pentraxin (Honarpour et al.) and Ephrin B1
are two major proteins involved in postsynaptic protein clustering. Narp has been
identified to promote NMDARs and AMPARs clustering (Mi et al., 2002; O'Brien et al.,
1999) in glutamatergic synapse formation in inhibitory interneurons but not pyramidal
neurons (Mi et al., 2002). Ephrin B1 is capable of promoting NMDARs clustering
through its receptor EphB’s interaction with NMDAR subunit NR1 (Dalva et al., 2000).
However, Narp and Ephrin B1 could not affect other postsynaptic component such as

3
PSD-95. Unlike Narp and Ephrin B1, SynCAM and neuroligin trigger formation of
presynaptic boutons (Biederer et al., 2002; Dalva et al., 2000; O'Brien et al., 1999;
Scheiffele et al., 2000). SynCAM is a member of Ig superfamily of adhesion molecules.
It has been identified to be capable of inducing presynaptic differentiation (Biederer et al.,
2002). Neuroligin is a type of postsynaptic transmembrane protein. The presynaptic
receptor for neuroligin is β-neurexin. Neuroligins induce β-neurexin clustering, and
subsequently cause the formation of presynaptic active zones (Dean et al., 2003;
Scheiffele et al., 2000). By binding to dendritic neuroligins, β-neurexin could induce
postsynaptic clustering of PSD-95 and NMDARs but not AMPARs (Graf et al., 2004).
After synapse formation starts, the pre- and postsynaptic differentiation may be
through different mechanisms according to neuron types or ages. For cultured
hippocampal neurons, bassoon is the earliest presynaptic protein appeared at new
axodendritic contact sites. Bassoon is a novel Zinc-finger CAG/Glutamine-repeat protein
localized at the presynaptic active zones and can be used as a marker for active zone (tom
Dieck et al., 1998). Mutant mice lacking functional Bassoon show epileptic seizures and
have dysfunctional hippocampal synapses (Altrock et al., 2003). In the next step, the
presynaptic vesicles begin to accumulate. On the other side, for postsynaptic part, the
NMDA receptors and postsynaptic protein PSD-95 will appear in the late stage of the
process of synapse assembly. This may suggest that the presynaptic assembly occurs
prior to the postsynaptic development (Friedman et al., 2000). During synapse assembly,

4
the pre- and postsynaptic differentiation is closely collaborating with each other, so the
morphological characteristics of both the presynaptic active zone (a specialized
presynaptic bouton region that synaptic vesicles dock and fuse with plasma membrane)
and the postsynaptic density (postsynaptic region where the neurotransmitter receptors
and signaling molecules cluster at high density) could be well matched.
The presynaptic assembly process over several timescales is addressed here (Fig.
1-1). The distribution of primitive axonal synaptic vesicle release sites along the axonal
segments is random. After these sites find their target regions on the apposed postsynaptic
membrane, transport packets will start to accumulate there. The transport packets have
different types, including active zone precursor vesicles such as piccolo/bassoon transport
vesicles (PTV) and, perhaps, synaptic vesicles. After accumulation, the primitive
presynaptic bouton forms. However, such axodendritic contact sites do not contain the
functional and structural active zone. So although these contact sites can occasionally
show some synaptic vesicle recycling, a series of intact machinery to carry out functional
synaptic vesicle recycling is lacking. Assembly of new presynaptic active zones could be
induced by dendritic contact onto axonal shafts or at axonal growth cones. It is proposed
that the active zone precursor vesicles such as PTVs play an important role in forming an
active zone at the axodendritic contact sites. Until the appearance of active zone, where
synaptic vesicles dock and fuse with the plasma membrane, those primitive boutons
evolve into immature presynaptic boutons, and the synaptic vesicles also differentiate

5
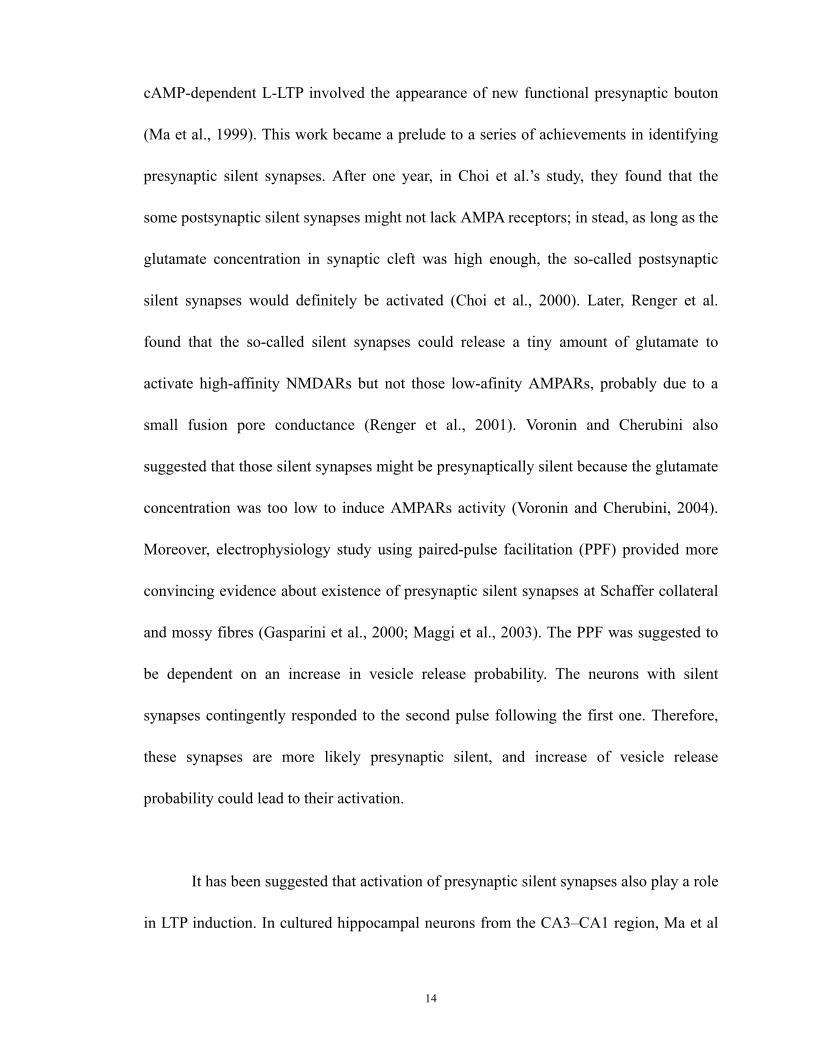
Figure 1-1. Presynaptic assembly is envisioned to occur by multiple processes that take place over several timescales. A. The axons of developing neurons contain several types of transport packets that are used for the assembly of nascent presynaptic structures, including synaptic vesicle packets, pleomorphic tubulovesicular structures and active zone precursor vesicles such as piccolo/bassoon transport vesicles (PTVs). B. In immature axons, primitive synaptic vesicle release sites form along axonal segments. C. The accumulation of various transport packets at contact sites results in the formation of primitive presynaptic boutons. D. The establishment of an axodendritic contact might lead to the rapid formation of an active zone by the fusion of active zone precursor vesicles (such as PTVs) and the subsequent recruitment of synaptic vesicles. E. New synapses form large reserve pools of synaptic vesicles, and acquire the structural and functional characteristics of mature synapses. F. Once presynaptic boutons have formed, units of active zone material and cognate synaptic vesicle clusters can bud from established presynaptic sites and wander away, sometimes giving rise to new presynaptic sites. Adapted from Ziv & Garner, 2004.

6
into two different clusters, docked vesicles and undocked ones. Undocked vesicles gather
and form a small reserve pool. Along with the development, the reserve pool becomes
larger and larger, and those immature presynaptic boutons eventually become mature.
It will take 25~30 min for a presynaptic bouton to form and become mature,
starting from the formation of axodendritic contact sites. However, for a functional
glutamatergic synapse including both intact presynaptic and postsynaptic parts, it may
take 1~2 hr (Friedman et al., 2000). These observations suggest that presynaptic
differentiation occurs prior to postsynaptic development. The precise mechanism about
presynaptic assembly during synaptogenesis is not well known. Ahmari et al suggested
that the presynaptic vesicles participating in presynaptic assembly consist of dense-core
and pleiomorphic vesicles and tubulovesicular structures but not synaptic vesicles
(Ahmari et al., 2000). These dense-core vesicles may be PTVs (Lowe et al., 1988;
Winkler et al., 1987), and pleiomorphic vesicles may be intermediates in the formation of
mature synaptic vesicles (Kraszewski et al., 1995; Vaughn, 1989).
The axondendritic contact sites between neurons could lead to formation of
synaptic vesicle release sites. Changes in plasma membrane may cause the binding of
transport packets to these release sites. These transport packets contain component
proteins which are necessary for active zones assembly. These proteins include not only
calcium channel subunits, endocytic proteins and synaptic vesicle proteins, but also

7
plasma membrane proteins (Ahmari et al., 2000).
The dense-core vesicles revealed in Ahmari’s work has been suggested to be
PTVs because dense-core vesicle protein chromogranin B is present in PTV (Zhai et al.,
2001). Dense-core vesicles closely associate with Golgi in neuronal soma, suggesting that
PTV derives from Golgi. And microtubules may play active role in transporting PTVs
from soma to new synapses. The fusion of the PTVs to the plasma membrane of new
synapses may not only help establish active zones, but also promote postsynaptic
differentiation. The cell adhesion molecules such as N-cadherin in the PTVs could
facilitate postsynaptic recruitment and localization of neurotransmitter receptors (Tanaka
et al., 2000).
The postsynaptic density assembly is fundamentally different from presynaptic
active zone assembly. PSD-95 is one of those proteins first appearing at the postsynaptic
density. PSD-95 appears to be gradually accumulating at new synapses from a diffuse
cytoplasmic pool rather than from transport packets (Bresler et al., 2001; Marrs et al.,
2001). Following the PSD-95 recruitment is the recruitments of NMDARs and AMPARs.
It had been widely accepted that AMPAR recruitment occurs much slower than
NMDARs, maybe from days to weeks (Durand et al., 1996; Isaac et al., 1997; Liao et al.,
1999; Petralia et al., 1999; Rumpel et al., 1998; Wu et al., 1996). Moreover,
electrophysiology study revealed that NMDARs activation is essential for functional

8
AMPARs clustering (Durand et al., 1996; Isaac et al., 1997; Liao and Malinow, 1996; Wu
et al., 1996). However, some recent studies on hippocampal neurons suggested that
AMPARs recruitment might not be later than that of NMDARs, or even earlier (Cottrell
et al., 2000; Friedman et al., 2000; Rao et al., 1998). On the other hand, Washbourne’s
work on cortical neurons confirmed that in cortical neurons, AMPARs clusters are less
mobile than NMDARs and thus are added to postsynaptic density slower than NMDARs.
Determining the temporal sequence of AMPARs and NMDARs recruitments is
particularly important for understanding the mechanisms of synaptic plasticity during
neuronal development. Late recruitment of AMPARs at early developmental stage of
neurons has led to achievements in LTP study. For example, postsynaptic silent synapses,
which are defined to be in short of AMPARs at postsynaptic density, play important roles
in LTP induction and maintenance. NMDARs recruitment to new synapses may be
mediated by cell adhesion molecules such as N-cadherin, neuroligin and EphB (Benson
and Tanaka, 1998; Dalva et al., 2000; Scheiffele et al., 2000).
Here it should be emphasized that the axodendritic contacts possibly but not
absolutely lead to the formation of synaptic boutons. In other words, the axodendritic
contact sites can be silent. Moreover, it is also possible that new synapse can form
eventually at preexisting but silent sites (Cooper and Smith, 1992).
For normal functional glutamatergic synapses, the presynaptic vesicles are

9
morphologically subdivided into two clusters, readily releasable pool (RRP) and reserve
pool (RP). And the size of the readily releasable pool determines the efficiency of
presynaptic glutamate release in response to stimulation (Dobrunz and Stevens, 1997;
Rosenmund and Stevens, 1996). Traditionally, the recruitment of the RRP has been
suggested to be supplied by the RP. However, there is another possibility that the
repopulation could come from the rapid reuse of RRP vesicles (Artalejo et al., 1995;
Neher, 1993; Neher and Zucker, 1993). What needs to be mentioned here is that
morphological definition of RP and RRP has been challenged by Rizzoli and Betz’s
recent work. They suggested that vesicle recruitment cannot be determined by the
distance to release sites, but perhaps by peeling off from the surface of the vesicle cluster
(Rizzoli and Betz, 2004). Recent work by Kavalali group suggested that spontaneously
endocytosed synaptic vesicles could not be recruited into the RRP, and they could be
eventually exocytosed under spontaneous conditions (Sara et al., 2005).
The formation of new functional synapses participates in the induction of
long-term synaptic plasticity. It has been found that the spine density in hippocampal
CA1 basal dendrites would show an significant increase after spaced stimulation, which
indicates an increase in synapse number (Moser et al., 1994). The late phase long-term
potentiation (L-LTP) between hippocampal CA3 and CA1 neurons involves an increase
in the number of active presynaptic boutons in response to single electrical stimulation
(Bolshakov et al., 1997). In 1999, morphological study further indicated that LTP

10
induction resulted in a series of morphological changes including a short postsynaptic
membrane modification and a subsequent increase in the proportion of axons contacting
at least two dendritic spines (Toni et al., 1999), thus LTP is believed to be associated with
the formation of new synapses in which multiple postsynaptic parts may contact the same
presynaptic terminal.
1.1.2 Silent synapse and long-term synaptic plasticity
Long-term potentiation (LTP) plays a key role in information storage in the brain
and in development of neuronal circuits (Bear, 1999; Braunewell and Manahan-Vaughan,
2001; Martin et al., 2000). It is expressed as a constant increase in synaptic strength by
neuronal activity.
In hippocampal CA3-CA1 neurons, LTP includes an early phase LTP (E-LTP) and
a late phase LTP (L-LTP). It has been suggested that the E-LTP can last up to 2 hr, after
which the L-LTP appears and can last for a much longer time. Moreover, the E-LTP is
independent of protein synthesis, but the L-LTP requires the cAMP signaling pathway
and thus rely upon new protein synthesis (Frey et al., 1993; Nguyen et al., 1994).
The most well studied LTP is NMDAR-dependent LTP in hippocampal CA1
neurons, which is induced through the postsynaptic AMPAR-mediated activation of
NMDARs and a following rise in postsynaptic Ca2+. Another form of LTP has also been

11
found in mossy fiber synapses, which does not rely upon NMDAR activation. Mossy
fiber LTP can be induced when AMPARs and kainic acid receptors antagonists are
present (Castillo et al., 1994; Ito and Sugiyama, 1991; Tong et al., 1996; Weisskopf and
Nicoll, 1995; Yeckel et al., 1999). Combining these findings, it is most likely that the
mossy fiber LTP is not dependent on postsynaptic mechanisms, but is induced and
expressed in presynaptic terminals through Ca2+ signaling pathways (Nicoll and Malenka,
1995).
The induction of LTP involves both the formation of new functional synapses and
the remodeling of pre-existing synapses. In early 1990’s, it was reported that the LTP
induced at the potentiated synaptic field accompanied with an increase of the perforated
axospinous synapse number, and these selectively enhanced synapses had multiple active
zones (Calverley and Jones, 1990; Geinisman et al., 1993; Geinisman et al., 1991). In
1998, Chavis et al. found that in cultured cerebellar granule cell, cAMP induced both an
increase of presynaptic bouton number and a remodeling of the synaptic vesicle turnover
(Chavis et al., 1998). The synaptic remodeling was suggested to be dependent on
postsynaptic glutamate receptors and might require a retrograde signal from postsynaptic
density (Ryan et al., 1996b).
In the meantime, three groups respectively found an activation of postsynaptic
silent synapses in hippocampal CA1 neurons after LTP induction (Durand et al., 1996;
12
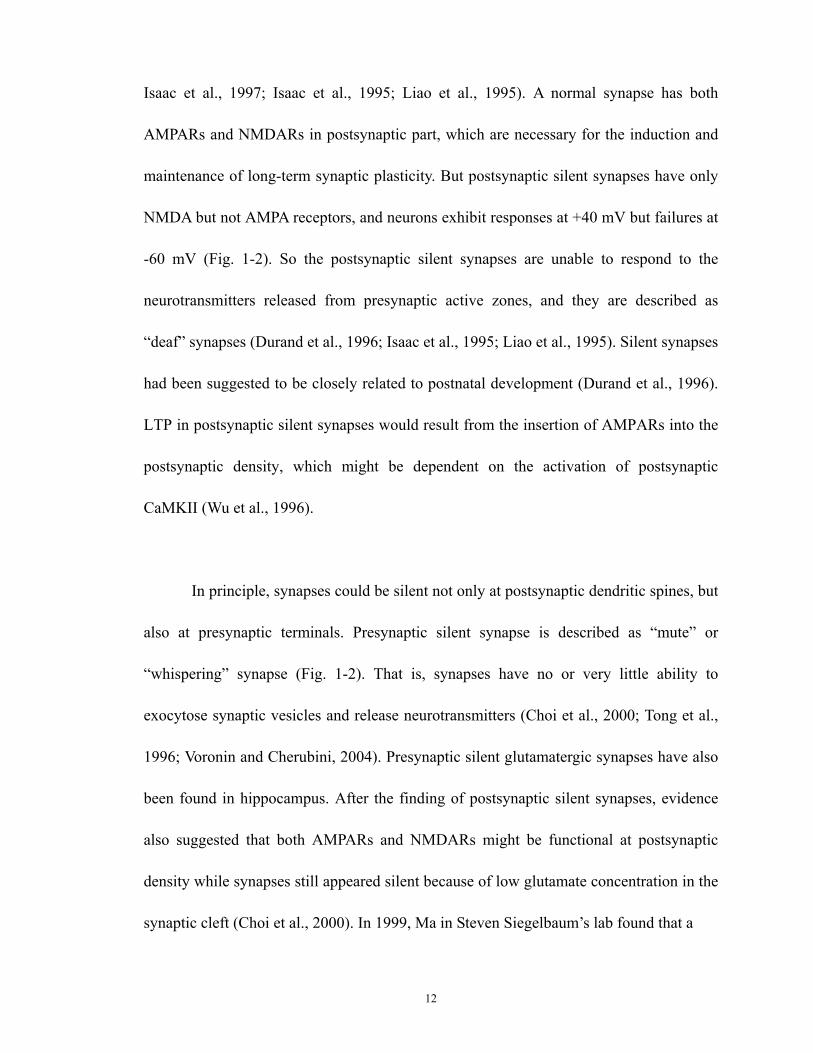
Isaac et al., 1997; Isaac et al., 1995; Liao et al., 1995). A normal synapse has both
AMPARs and NMDARs in postsynaptic part, which are necessary for the induction and
maintenance of long-term synaptic plasticity. But postsynaptic silent synapses have only
NMDA but not AMPA receptors, and neurons exhibit responses at +40 mV but failures at
-60 mV (Fig. 1-2). So the postsynaptic silent synapses are unable to respond to the
neurotransmitters released from presynaptic active zones, and they are described as
“deaf” synapses (Durand et al., 1996; Isaac et al., 1995; Liao et al., 1995). Silent synapses
had been suggested to be closely related to postnatal development (Durand et al., 1996).
LTP in postsynaptic silent synapses would result from the insertion of AMPARs into the
postsynaptic density, which might be dependent on the activation of postsynaptic
CaMKII (Wu et al., 1996).
In principle, synapses could be silent not only at postsynaptic dendritic spines, but
also at presynaptic terminals. Presynaptic silent synapse is described as “mute” or
“whispering” synapse (Fig. 1-2). That is, synapses have no or very little ability to
exocytose synaptic vesicles and release neurotransmitters (Choi et al., 2000; Tong et al.,
1996; Voronin and Cherubini, 2004). Presynaptic silent glutamatergic synapses have also
been found in hippocampus. After the finding of postsynaptic silent synapses, evidence
also suggested that both AMPARs and NMDARs might be functional at postsynaptic
density while synapses still appeared silent because of low glutamate concentration in the
synaptic cleft (Choi et al., 2000). In 1999, Ma in Steven Siegelbaum’s lab found that a

13
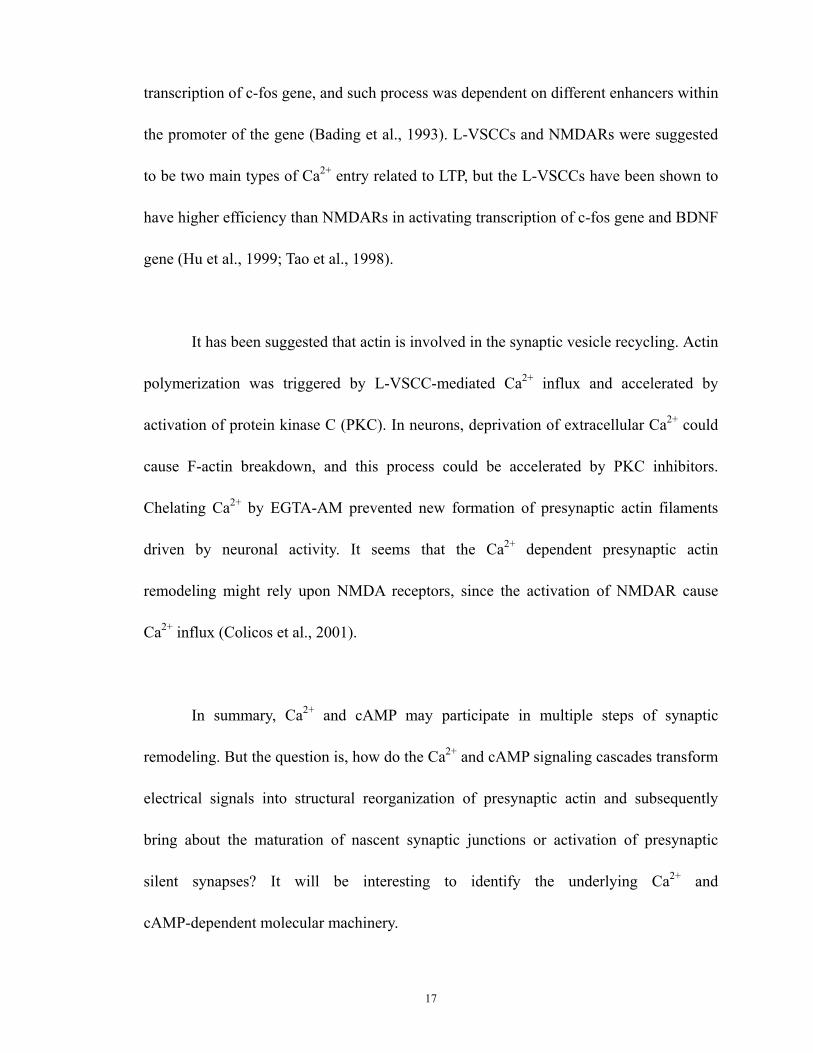
Figure 1-2. Pre- and postsynaptic silent synapses. A. A postsynaptic silent synapse (i) expresses NMDA but not functional AMPA receptors. By contrast, a normal synapse (ii) expresses both receptors. B. The slow exocytosis of glutamate at a presynaptic silent synapse (i) reaches a concentration in the cleft that is sufficient to activate high-affinity NMDA receptors but not AMPA receptors. The glutamate spillover (ii) activates NMDA but not AMPA receptors at a presynaptic silent synapse. Adapted from Kullmann, 2003.
14
cAMP-dependent L-LTP involved the appearance of new functional presynaptic bouton
(Ma et al., 1999). This work became a prelude to a series of achievements in identifying
presynaptic silent synapses. After one year, in Choi et al.’s study, they found that the
some postsynaptic silent synapses might not lack AMPA receptors; in stead, as long as the
glutamate concentration in synaptic cleft was high enough, the so-called postsynaptic
silent synapses would definitely be activated (Choi et al., 2000). Later, Renger et al.
found that the so-called silent synapses could release a tiny amount of glutamate to
activate high-affinity NMDARs but not those low-afinity AMPARs, probably due to a
small fusion pore conductance (Renger et al., 2001). Voronin and Cherubini also
suggested that those silent synapses might be presynaptically silent because the glutamate
concentration was too low to induce AMPARs activity (Voronin and Cherubini, 2004).
Moreover, electrophysiology study using paired-pulse facilitation (PPF) provided more
convincing evidence about existence of presynaptic silent synapses at Schaffer collateral
and mossy fibres (Gasparini et al., 2000; Maggi et al., 2003). The PPF was suggested to
be dependent on an increase in vesicle release probability. The neurons with silent
synapses contingently responded to the second pulse following the first one. Therefore,
these synapses are more likely presynaptic silent, and increase of vesicle release
probability could lead to their activation.
It has been suggested that activation of presynaptic silent synapses also play a role
in LTP induction. In cultured hippocampal neurons from the CA3–CA1 region, Ma et al

15
found that cAMP induced L-LTP might involve unsilencing of presynaptic silent
synapses (Ma et al., 1999). Before that, the cAMP-dependent, NMDAR-independent
forms of E-LTP in hippocampal and cerebellar cultures have already been found to be
likely induced through the activation of presynaptically silent synapses (Tong et al.,
1996);(Isaac et al., 1997; Salin et al., 1996). Besides hippocampal cultures, the L-LTP in
hippocampal slices also showed an accompanied increase in the total number of
presynaptic puncta (Bozdagi et al., 2000). Thus, the activation of presynaptically silent
synapses may be an important and widespread mechanism in central nervous system
(CNS).
The presynaptically silent synapse has been proposed to lack functional active
zone or mature RRP. It is possible that along with the maturation of active zone, these
synapses can gradually become functional (Mozhayeva et al., 2002), probably through
the Ca2+ signaling pathway and transduction of PKC/PKA signal cascades (Bolshakov et
al., 1997; Ma et al., 1999).
1.1.3 Ca2+ signaling and protein kinases involved in synaptic remodeling
Ca2+ and cAMP pathways have been suggested to be involved in the formation of
long-term memory in mice (Abel et al., 1997; Inagaki et al., 2000; Malleret et al., 2001).
Based on multiple animal model studies including Aplysia, Drosophila and mice, Bailey
et al revealed the crucial role of cAMP signaling pathway in long-term memory

16
formation (Bailey et al., 1996). And it has been suggested that the cAMP signaling
pathway participates in both the formation of new presynaptic actin filaments and the
projection of postsynaptic actin filaments, in a manner similar to axodendritic behavior
during de novo synapse asembly (Bozdagi et al., 2000; Colicos et al., 2001; Kim and
Thayer, 2001; Ma et al., 1999). The cAMP-dependent protein kinase (Carninci et al.) is
composed of two catalytic subunits and two regulatory subunits. In neurons, regulatory
subunit II (RII) is the major type of regulatory subunits. In the inactive state, the catalytic
subunits and RII are bound together. If intracellular cAMP binds to the cAMP-binding
sites of RII, the catalytic subunits are released from RII and become activated. Thus the
PKA location is indeed determined by the location of catalytic subunits (Stein et al., 1987;
Ventra et al., 1996). It has been found that PKA catalytic subunits associate with F-actin
in growth cones. Actin cytoskeleton might play an important role in anchoring PKA at the
growth cone, which might be in turn necessary for actin polymerization (Sato et al.,
2002).
For Ca2+ signaling pathway, the transcription factor cAMP response element
binding protein (CREB) (Sheng et al., 1991) was phosphorylated and therefore activated
by L-type voltage-sensitive Ca2+ channels (L-VSCCs) (Deisseroth et al., 1998) during the
induction of LTP. Other types of VSCCs including P/Q- and N-type calcium channels do
not contribute to CREB phosphorylation (Deisseroth et al., 1996). Bading et al.
demonstrated that the activation of NMDA receptors and L-VSCCs could lead to the
17
transcription of c-fos gene, and such process was dependent on different enhancers within
the promoter of the gene (Bading et al., 1993). L-VSCCs and NMDARs were suggested
to be two main types of Ca2+ entry related to LTP, but the L-VSCCs have been shown to
have higher efficiency than NMDARs in activating transcription of c-fos gene and BDNF
gene (Hu et al., 1999; Tao et al., 1998).
It has been suggested that actin is involved in the synaptic vesicle recycling. Actin
polymerization was triggered by L-VSCC-mediated Ca2+ influx and accelerated by
activation of protein kinase C (PKC). In neurons, deprivation of extracellular Ca2+ could
cause F-actin breakdown, and this process could be accelerated by PKC inhibitors.
Chelating Ca2+ by EGTA-AM prevented new formation of presynaptic actin filaments
driven by neuronal activity. It seems that the Ca2+ dependent presynaptic actin
remodeling might rely upon NMDA receptors, since the activation of NMDAR cause
Ca2+ influx (Colicos et al., 2001).
In summary, Ca2+ and cAMP may participate in multiple steps of synaptic
remodeling. But the question is, how do the Ca2+ and cAMP signaling cascades transform
electrical signals into structural reorganization of presynaptic actin and subsequently
bring about the maturation of nascent synaptic junctions or activation of presynaptic
silent synapses? It will be interesting to identify the underlying Ca2+ and
cAMP-dependent molecular machinery.

18
1.2 Actin in synapse formation and synapse modification
1.2.1 General Consideration
The internal cytoskeleton of actin has been recently suggested to play an active
role in activity-dependent synaptic plasticity (Colicos et al., 2001; Okamoto et al., 2004).
Actin is the main component of the cytoskeletal microfilaments playing a vital role in
axon guidance, synapse development, and synaptic plasticity (Dent and Gertler, 2003;
Dillon and Goda, 2005; Matus, 2000). Actin can be found in monomeric and polymeric
forms, respetively called globular actin (G-actin) and filamentous actin (F-actin). The
F-actin is polymerized from many G-actin monomers with energy from ATP hydrolysis
which subsequently release of inorganic phosphate (Pi) (Dent and Gertler, 2003; dos
Remedios et al., 2003). G-actin can exist as ATP-actin, ADP-Pi-actin and ADP-actin,
while the majority of F-actin subunits contain bound ADP.
Like the microtubules, actin filaments are also polar. The fast growing end of
actin filaments is called plus (+) end or barbed end, and the slow growing end is called
minus (-) end or pointed end (Fig. 1-3). The names barbed and pointed end initially come
from the appearance of microfilaments with the motor protein myosin as observed under
electromicroscopy. At the barbed end, usually the rate of actin filaments elongation is
almost 10 times faster than that of the pointed end. In the case that the polymerization

19
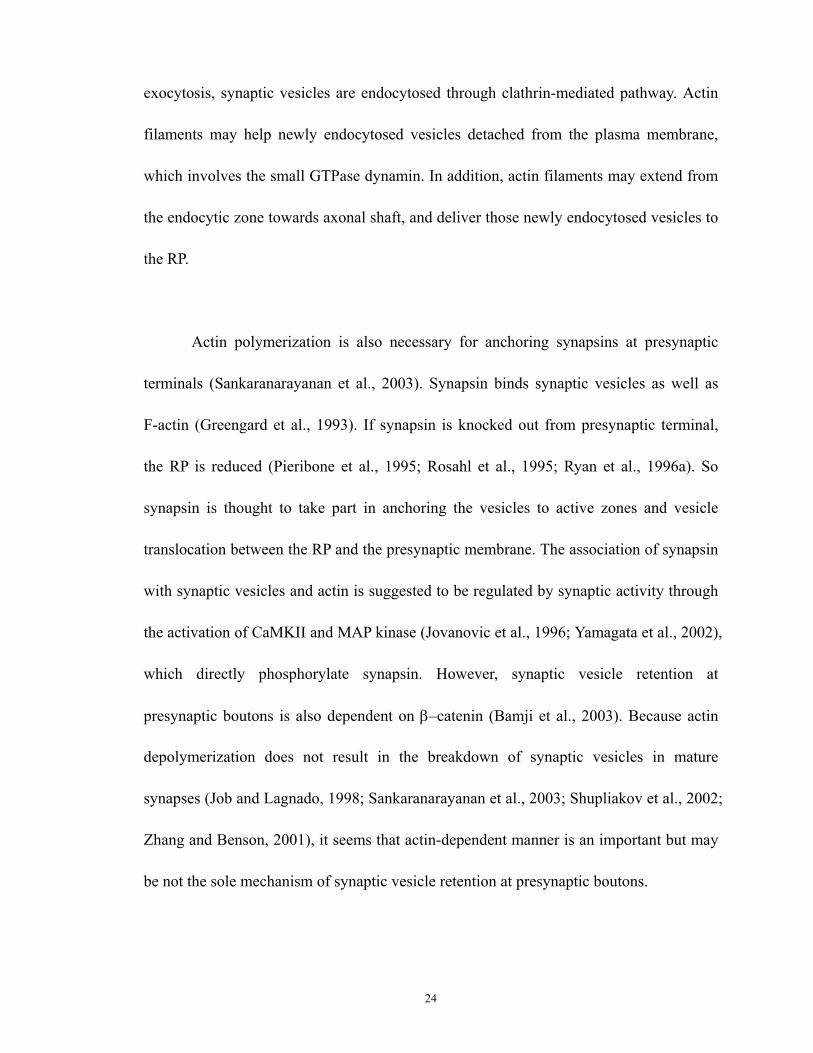
Figure 1-3. Actin filaments and microtubules are polarized polymers. Actin filaments in vitro are capable of adding and removing ATP-actin and ADP-actin from both the barbed and pointed ends. However, the equilibrium constant for ATP dissociation is greater at the pointed end. Consequently, at steady-state, actin filaments devoid of actin-associated proteins undergo slow treadmilling through the addition of ATP-actin to the barbed end and release of ADP-actin from the pointed end. Actin filaments also exhibit aging, in which ATP-actin is hydrolyzed rapidly to ADP-pi-actin, followed by a slow dissociation of the γ-phosphate, giving ADP-actin. Microtubules are also polarized structures with α/GTP-β-tubulin dimers adding to the plus or growing end and α/GDP-β-tubulin dimers dissociating from the minus end. Microtubules also contain an internal mechanism of GTP hydrolysis that occurs rapidly, giving a “GTP-cap” to the polymers. They also exhibit posttranslational modifications that correlate with the age of the polymer. Adapted from Dent & Gertler, 2003.

20
rate at the barbed end equals the depolymerization rate at the pointed end, the actin
filament moves forward without changes in the overall length. This is called treadmilling
effect. The process of actin polymerization starts from the initial association of three
G-actin monomers into a trimer, then more monomers add to the trimer and filament
elongates. During the process of elongation, ATP-G-actin binds to the barbed end of the
actin filament. The ATP is subsequently hydrolyzed and the Pi is released.
Depolymerization of F-actin is not simply the reversed process of polymerization. Actin
depolymerization needs participation of profilin, because actin itself can not generate
ATP from ADP and Pi (Carlier and Pantaloni, 1988; dos Remedios et al., 2003).
1.2.2 Actin in axon growth
In the past years, researchers separated a grow cone into different regions for
convenience of study. These regions include peripheral (P) region, transitional (T) region
and central (C) region. P region consists of lamellipodia and filopodia; C region consists
of organelles and vesicles; T region is a band of the growth cone between P and C regions.
In growth cones, F-actin content is highest in the P and T regions and diminishes to
varying levels in the C region of the growth cone. F-actin and Microtubules (MTs) have
been shown to be necessary for axon growth, but they played different roles in such
process. Scientists have termed three stages to reveal their different functions: protrusion,
engorgement and consolidation. In the stage of protrution, the filopodia forms extensions
which are composed of F-actin networks. Then the MTs enter these extensions and bring

21
a lot of membranous organelles and vesicles, and subsequently the growth cone is
established. Such process is called engorgement. In next step, in the neck of growth cone,
the F-actin polymers begin to dissociate gradually. Finally only MTs are left, and the
axon shaft appears. This process is described as consolidation. Not only axon outgrowth,
such stages can but also be used to describe the formation of secondary branches
extending from the growth cone or axon shaft.
After growth, cell adhesion molecules such as cadherins and integrins, and other
proteins take part in the maintenance of new synapses (Phillips et al., 2001). Many cell
adhesion molecules have already been reported to be linked to the actin cytoskeleton
(Fifkova and Delay, 1982; Gotow et al., 1991; Matus et al., 1982). Thus, cytoplasmic
actin may take effect in different forms of synaptic plasticity by inducing synapse
formation or synaptic remodeling (Fifkova and Delay, 1982; Fisher and Macdonald, 1998;
Kaech et al., 1997).
In chromaffin cells, breakdown of cortical F-actin is thought to enable secretory
granules to move to sites of exocytosis on the plasma membrane (Cheek and Burgoyne,
1987; Vitale et al., 1995). Other experiments indicated that F-actin was involved in
endocytosis in yeast (Geli and Riezman, 1996) and mammalian cells (Lamaze et al.,
1997). Later actin filaments were implicated to take part in the synaptic vesicle recycling
(Mundigl et al., 1998).

22
1.2.3 Actin in synaptic development and plasticity
Actin is enriched in both presynaptic nerve terminals and postsynaptic dendritic
spines to regulate pre- and postsynaptic functions (Chang and De Camilli, 2001; Dillon
and Goda, 2005; Fischer et al., 2000). In postsynaptic dendrites, actin may be directly
linked to postsynaptic density and regulates the clustering of AMPARs and maintenance
of LTP (Ackermann and Matus, 2003; Allison et al., 1998; Fukazawa et al., 2003; Kim
and Lisman, 1999; Krucker et al., 2000; Matsuzaki et al., 2004; Okamoto et al., 2004;
Shen et al., 1998; Star et al., 2002). The actin-dependent synaptic membrane fusion
contributes to LTP induction (Lledo et al., 1998). A report has shown that application of
actin depolymerizers to hippocampal slices can destroy the long-term synaptic plasticity,
but the baseline synaptic transmission is not affected (Krucker et al., 2000).
In the presynaptic terminal, actin is suggested to interact with synaptic vesicles by
the participation of synapsins (Calakos and Scheller, 1996; Greengard et al., 1993;
Sudhof, 1995). Disruption of actin polymerization has been found to impair synaptic
vesicle mobilization and recycling (Cole et al., 2000; Kuromi and Kidokoro, 1998;
Sakaba and Neher, 2003; Shupliakov et al., 2002); but see (Morales et al., 2000) for
exception). At mature synapses, morphological study have revealed that polymerized
actin exists around the presynaptic vesicle clusters (Bloom et al., 2003; Dunaevsky and
Connor, 2000; Sankaranarayanan et al., 2003; Shupliakov et al., 2002). Electrical

23
stimulation can lead to actin polymerization at presynaptic terminals (Colicos et al., 2001;
Sankaranarayanan et al., 2003; Shupliakov et al., 2002). And this polymerization is
necessary for synaptic vesicle exocytosis and endocytosis, and subsequently modulate the
vesicle recruitment between the RRP and the RP (Shupliakov et al., 2002).
For recruiting vesicles from the RP to the RRP, actin may function through two
possible models. First possibility is that actin filaments assemble like a bridge between
the RP and the RRP, and then deliver synaptic vesicles to the RRP. Another possible
pattern is that actin might form a barrier between the RP and the RRP. In this model, the
actin barrier could be destroyed by a certain type of signal, and then the access to the RP
opens. Several studies have already confirmed the positive role of actin which is
illustrated in the first model (Cole et al., 2000; Kuromi and Kidokoro, 1998; Sakaba and
Neher, 2003; Wang et al., 1996). However, the barrier role of actin in vesicle mobilization
was also found in Xenopus NMJ (Wang et al., 1996). Combining these studies, it is
suggested that the effect of actin on synaptic vesicle mobilization might depend on the
specific physiological requirement (Dillon and Goda, 2005). During the process of
neurotransmitter release, actin may either negatively interfere with the assembly of the
fusion machinery at the release site, or positively link to the fusion machinery and
enhance its efficacy.
During endocytosis, actin has been confirmed to play an active role. Following
24
exocytosis, synaptic vesicles are endocytosed through clathrin-mediated pathway. Actin
filaments may help newly endocytosed vesicles detached from the plasma membrane,
which involves the small GTPase dynamin. In addition, actin filaments may extend from
the endocytic zone towards axonal shaft, and deliver those newly endocytosed vesicles to
the RP.
Actin polymerization is also necessary for anchoring synapsins at presynaptic
terminals (Sankaranarayanan et al., 2003). Synapsin binds synaptic vesicles as well as
F-actin (Greengard et al., 1993). If synapsin is knocked out from presynaptic terminal,
the RP is reduced (Pieribone et al., 1995; Rosahl et al., 1995; Ryan et al., 1996a). So
synapsin is thought to take part in anchoring the vesicles to active zones and vesicle
translocation between the RP and the presynaptic membrane. The association of synapsin
with synaptic vesicles and actin is suggested to be regulated by synaptic activity through
the activation of CaMKII and MAP kinase (Jovanovic et al., 1996; Yamagata et al., 2002),
which directly phosphorylate synapsin. However, synaptic vesicle retention at
presynaptic boutons is also dependent on β–catenin (Bamji et al., 2003). Because actin
depolymerization does not result in the breakdown of synaptic vesicles in mature
synapses (Job and Lagnado, 1998; Sankaranarayanan et al., 2003; Shupliakov et al., 2002;
Zhang and Benson, 2001), it seems that actin-dependent manner is an important but may
be not the sole mechanism of synaptic vesicle retention at presynaptic boutons.

25
Actin is involved in the maintenance of L-LTP, which is supported by the fact that
actin depolymerization specifically inhibit the L-LTP but not E-LTP (Krucker et al.,
2000). It has been suggested that the maintenance of LTP accompany structural
reorganization of synapses in both presynaptic terminals (Bozdagi et al., 2000) and
postsynaptic dendritic spines (Engert and Bonhoeffer, 1999; Maletic-Savatic et al., 1999).
The role of F-actin in these processes has been elucidated during the past years. At
postsynaptic dendritic spines, LTP induction propels the G-actin/F-actin equilibrium
towards F-actin (Okamoto et al., 2004). In vivo study suggested that the increase of
F-actin in dentate gyrus is very stable and may not diminish within one month (Fukazawa
et al., 2003). The additional F-actin could either come from the pool of synaptic or
dendritic G-actin (Zhang and Benson, 2002) or local translation of actin mRNA
(Tiruchinapalli et al., 2003) or both. F-actin enrichment in the dendritic spines
accompanies an increase in the size of the spine head (Matsuzaki et al., 2004; Okamoto et
al., 2004).
LIM kinase-1 (LIMK-1) is an actin-binding kinases that phosphorylate members
of the ADF/cofilin family of actin binding and filament severing proteins. The LIMK-1
and ADF/cofilin signaling pathway may be involved in the LTP-dependent shift of
G-actin/F-actin equilibrium towards F-actin in the dendritic spines, because inhibiting the
activity of ADF/cofilin impairs the durable expression of LTP (Fukazawa et al., 2003).
LIMK-1 is a downstream factor of the Rho GTPases family. LIMK-1 may cause changes

26
in actin equilibrium by inhibiting the function of ADF/cofilin, an actin-binding protein
that promotes actin disassembly. Electrophysiology work suggested that hippocampal
slices isolated from LIMK-1 knockout mice show a higher basal mEPSC frequency than
wild type mice, and actin depolymerization by cytochalasin D failed to further increase
the mEPSC frequency (Meng et al., 2002). This could be explained by that in the absence
of LIMK-1, actin turnover rate might be increased, which could prevent the increase in
neurotransmitter release triggered by actin depolymerizers. Accordingly, whether
additional synaptic components also play a part in stabilizing actin and spine remodeling
during LTP remains to be tested. One such candidate is CaMKIIβ, which shows
actin-binding activity, and regulates several proteins involved in NMDAR-dependent LTP
via phosphorylation (Lisman et al., 2002).
1.2.4 Actin binding proteins
1.2.4.1 ADF/cofilin
ADF/cofilin proteins are a family of proteins at small size (15-19 kDa), including
invertebrate depactin, porcine ADF or destrin, cofilin, Drosophila twinstar or D-61,
Xenopus XAC1/2 and so on. ADF and cofilin are two main subtypes in vertebrate cells.
ADF and cofilin are different but related proteins. ADF can depolymerize F-actin while
cofilin incises F-actin, but both of them can actually binds to F-actin and promote the
level of monomeric actin. The ADF/cofilin is responsible for the high rate of treadmilling

27
of monomers in actin filaments in vivo. The ability of ADF/cofilin to assemble or
disassemble F-actin is pH dependent in vitro (Yonezawa et al., 1987). Acidic conditions
(less than pH 6.8) can enhance the ability of ADF/cofilin while at more alkaline pH
(>7.3), cofilin can rapidly depolymerize F-actin.
Gelsolin is a protein that competes with ADF and cofilin for binding to F-actin,
but gelsolin can produce much more powerful severing action to F-actin. Currently
ADF/cofilin is used as the major regulator of actin cytoskeleton reorganization (Bamburg,
1999). Actually if the released monomers were able to reassemble at the barbed end, then
increase of the dissociation rate at the pointed end of F-actin would not depolymerize
actin filaments and thus a steady state is kept. However, if a barbed-end capping protein
such as CapZ blocks adding G-actin to barbed end, then ADF/cofilin will depolymerize
actin filaments very quickly.
1.2.4.2 Capping proteins
CapZ and tropomodulin are the most abundant capping proteins. CapZ can be
added to the barbed end of F-actin and thus prevent actin polymerization. CapZ take
biological effects in capture of pre-existing filaments, regulation of actin assembly at the
barbed ends (Rodal et al., 1999), and correct assembly of filaments at the Z-disk (Schafer
and Cooper, 1995). CapZ does not bind to the pointed ends of F-actin and thus can not
affect the fragmentation rate of actin filaments (Casella and Torres, 1994). The capping

28
of actin filaments is regulated through PIP and PIP2 signaling pathway. PIP and PIP2
remove CapZ from F-actin, resulting in an increased number of free barbed ends.
Unlike CapZ, tropomodulin is a pointed-end capping protein. It is named
tropomodulin because it can strongly bind to actin when tropomyosin is present. It has
been suggested that overexpression of tropomodulin reduces actin filament length
(Dedova et al., 2002). Studies also revealed that both CapZ and tropomodulin can rapidly
exchange at their respective ends (Littlefield et al., 2001).
1.2.4.3 Arg2/3 complex
Arp2/3 may be the only protein other than tropomyosin that can bind to the
pointed end of F-actin and inhibit actin filament elongation at this end. Although Arg2/3
may be capable of capping actin filaments, it is listed in a single section because it is
much more complicated than the capping proteins mentioned above and its capping
function is still controversial.
Arp2/3 is a seven-subunit protein complex, consisting of Arp2 and Arp3 and five
Arc proteins. The cellular concentrations of Arg2 and Arg 3 are 2 µM and 5 µM
respectively (Machesky and May, 2001). Arp2/3 is associated with mammalian cortical
cells that have abundant actin cytoskeleton (Cossart, 2000). In the presence of ATP,
Arp2/3 can create branch points by nucleating the F-actin assembly (Mullins et al., 1998).

29
In addition, Arp2/3 may also function as a cross-linking protein. Myocin I motor protein
can interact with Arg2/3 through the SH3 domain.
1.2.4.4 Profilin
Profilin is another important family of actin binding proteins with an approximate
molecular weight of 19 kD. They are among the most abundant cytoplasmic proteins and
have wide distribution throughout the whole cytoplasma. In principle, profilin is a
high-affinity G-actin binding protein (Perelroizen et al., 1996). It can enhance actin
filament turnover in the presence of cofilin (Didry et al., 1998), because profilin can add
ATP-actin to the barbed end of F-actin while cofilin can dissociate ADP-actin from the
pointed end. Profilin is also capable of inhibiting the hydrolysis of ATP bound to actin
and thus maintaining G-actin highly affinitive to the barbed end of filaments (Ampe et al.,
1988). Dissociation of profiling from actin filaments is stimulated by PIP and PIP2
(Goldschmidt-Clermont et al., 1990), therefore profilin may have effect on signal
transmitting between actin filaments and plasma membrane.
1.2.4.5 Thymosins
β-Thymosin is a small protein with a molecular weight less than 5 kD. It contains
43 residues and half of these residues are charged, thus its structure in solution may be
changeable. It is widely accepted that β-Thymosin is a G-actin binding protein. However,
several studies revealed the binding of β-Thymosin to F-actin (Ballweber et al., 2002;

30
Carlier et al., 1996; Sun et al., 1996). β-Thymosin inhibits actin polymerization through
its actin-binding motif (Vancompernolle et al., 1991). Both gelsolin and profiling
compete with β-Thymosin for binding to actin. And the binding site of β-Thymosin to
actin is partially overlapping with that of DNase I.
1.2.4.6 DNase I
DNase I is widely recognized as an enzyme that cleaves double-stranded DNA.
However, its primary function is related to the formation of actin filaments rather than to
the degradation of DNA. DNase I is a glycoprotein with a molecular weight of 31 kD and
an optimal pH of 7.8 (Kreuder et al., 1984). DNase I is a useful tool in measuring G-actin
levels in cells (Cramer et al., 2002). The biological effect on the dynamics of actin
cytoskeleton is not clear yet.
31
1.3 Aims of this thesis
Activation of postsynaptic silent synapses has been suggested to contribute to
long-term synaptic plasticity (Choi et al., 2000; Durand et al., 1996; Isaac et al., 1995;
Kim et al., 2003; Liao et al., 1995; Ma et al., 1999; Wu et al., 1996). Postsynaptic silent
synapses were identified as only having NMDARs but not AMPARs showed before LTP
(Durand et al., 1996; Isaac et al., 1995; Liao et al., 1995; Wu et al., 1996), and could be
activated through NMDAR-dependent insertion of AMPARs to postsynaptic densities.
Presynaptic silent synapses are likely due to very low probability of neurotransmitter
release (Gasparini et al., 2000; Hanse and Gustafsson, 2001). However, the function of
presynaptic silent synapses and the mechanisms underlying their activation are not well
understood. The aims of this PhD thesis were to elucidate the role of activation of
presynaptic silent synapses in long-term synaptic plasticity and the mechanisms
underlying the activation of presynaptic silent synapses.
Firstly, electrophysiology and FM 1-43 imaging were used to investigate the
effects of repetitive spaced stimulation on synaptic vesicle cycling and synaptic
transmission. Second, retrospective immunostaining and FM imaging assays were used to
investigate the functional turnover of pre-existing synapses during long-term synaptic
plasticity. Third, electrophysiology and FM imaging were used to study the roles of Ca2+
signaling cascades and actin filaments in the activation of presynaptic silent synapses.

32
Finally, retrospective immunostaining assay was used to compare the actin
polymerization during long-term synaptic plasticity.
In particular, the following specific questions were addressed in the current study:
1. What is the effect of repetitive stimulation on synaptic transmission in immature
or mature neurons?
2. What is the effect of repetitive stimulation on presynaptic bouton number in
immature or mature neurons?
3. Where do the new functional presynaptic boutons appearing during long-term
synaptic plasticity come from?
4. Is the activation of presynaptic silent synapses modulated by Ca2+ signaling and
PKA/PKC activity?
5. What is the role of actin filaments in the activation of presynaptic silent
synapses?
6. How does the G-actin/F-actin equilibrium change during long-term synaptic
plasticity?

33
Chapter 2
Materials and Methods
2.1 Cell culture
2.1.1 Preparation of microisland
Days before culturing hippocampal neurons, we spread a thin layer of 0.15-0.2%
agarose onto coverslips and air dry overnight. Second day, we spray poly-d-lysine (0.8
ng/ml, 2X, Collaborative research, Becton-Dickinson) plus laminin (0.1 mg/ml, BD) onto
agarose coated coverslips, using micropipette (thin wall, parameter 4 on pipette puller,
fire polishing tip to about 20 µm) to form microdots of 50-200 µm in diameter. Let it air
dry overnight. Third day, we wash plates three times with sterial H2O, 5-10 min per wash.
Then we let it air dry for overnight before use. It can be sorted for use in two months at
room temperature. The day before doing culture, we add 1 ml culture medium into wells
and put into incubator.
2.1.2 Primary glial culture
Coat two 25 mm2 Corning flasks with 0.1 mg/ml poly-D-lysin for >2 hrs, or
overnight. 3-4 day old postnatal rat pups are euthanized, and cortical regions are
dissected out at 2X2 mm. The small tissue blocks are then washed for three times by
Modified HBSS (MHBSS) solution consisting of Hank’s BSS, 5 mM HEPES and 20 mM
34
D-Glucose. Tissue blocks are then trypsinized with a digestion solution consisting of
0.05% Trypsin-EDTA and supplemented with 20 mM glucose plus 25 U/ml DNAase for
30 min at 37C. After trypsinization, tissue blocks are washed for three times by in a
solution consisting of HBSS, 5 mM HEPES, 20 mM D-glucose and 10% horse serum.
Aspirate the supernatant carefully. The small tissue blocks are then mechanically
dissociated in a solution consisting of HBSS, 5 mM HEPES, 20 mM D-glucose, 20%
horse serum, and 25 U/ml DNAase. Use fire polished Pasteur pipette to gently triturate on
the wall 10-20 times until no big chunk. Centrifuge at 900 RPM for 5 min. The cells are
resuspended by glial culture medium after centrifugation and plated onto flasks. Glial
culture medium consists of 500 ml MEM (Invitrogen, Eugene, OR), 100 mg NaHCO3
(for adjusting pH to 7.4), 20 mM D-Glucose, 5% Fetal Bovine Serum (FBS) (HyClone,
Logan, UT), 25 U/ml Pen/Strep and 0.5 mM L-glutamine. Cultures are maintained at
37°C in a 5% CO2-humidified incubator, and the glial culture medium is replaced three
times in the first week. In about one week, the glia should reach 80-90% confluence. Add
500 µM glutamate into the flasks for 20 min to kill most neurons. For neuronal culture
use, trypsinize glial cells for 5 min, centrifuge at 900 rpm for 5 min, and then re-plate
glial cells onto poly-D-lysine pre-coated coverslips. After the astrocytes forme a single
layer at microisland, change glial culture medium to neuronal culture medium plus 4 µM
Ara-C.

35
2.1.3 Hippocampal neuronal culture
Hippocampal CA1–CA3 regions are dissected from newborn rat pups (P0-P1),
quickly subdivided into small cubes (<1 mm3). The small tissue blocks are then washed
for three times by Modified HBSS (MHBSS) solution consisting of Hank’s BSS, 5 mM
HEPES and 20 mM D-Glucose. Tissue blocks are then trypsinized with a digestion
solution consisting of 0.05% Trypsin-EDTA and supplemented with 20 mM glucose plus
25 U/ml DNAase for 30 min at 37C. After trypsinization, tissue blocks are washed for
three times by in a solution consisting of HBSS, 5 mM HEPES, 20 mM D-glucose and
10% horse serum. Aspirate the supernatant carefully. The small tissue blocks are then
mechanically dissociated in a solution consisting of HBSS, 5 mM HEPES, 20 mM
D-glucose, 20% horse serum, and 25 U/ml DNAase. Use fire polished Pasteur pipette to
gently triturate on the wall 10-20 times until no big chunk. Centrifuge at 900 RPM for 5
min. The cells are resuspended by neuronal culture medium after centrifugation and
plated at a medium density (4000–6000 cells/cm2) onto microislands containing a
monolayer of astrocytes. Neuronal culture medium consists of 500 ml glial culture
medium and 10 ml of B-27 supplement (Invitrogen, Eugene, OR). Cultures are
maintained at 37°C in a 5% CO2-humidified incubator, and 50% of the culture medium is
replaced three times in the first week. Cultured neurons are used in ~3 weeks. In this
study, we define immature neurons as cultured for 7–11 d after plating, and mature
neurons as 18–22 d after plating.
36
2.2 Electrophysiology
Whole-cell recordings are performed in voltage clamp mode using a MultiClamp
700A amplifier (Molecular Devices, Union City, CA) (Deng and Chen, 2003). The
recording chamber is continuously perfused with a bath solution consisting of (in mM)
128 NaCl, 30 glucose, 25 HEPES, 5 KCl, 2 CaCl2, 1 MgCl2, pH 7.3, with NaOH, via a
Warner (Hamden, CT) VC-6 drug delivery system. The 90 mM KCl solution with equal
molar replacement of NaCl by KCl is used to serve as repetitive stimulation (2 min 90 K+
followed by 8 min bath solution, and repeated 6 times) (Wu et al., 2001b). To record
miniature EPSCs (mEPSCs), TTX (0.5 µM) and bicuculline (BIC, 20 µM) are added into
the bath solution to block action potentials and GABAergic events. Patch pipettes are
pulled from borosilicate glass and had resistances of 2–4 MΩ when filled with internal
pipette solution, which consists of the following (in mM): 135 KCl, 10
Tris-phosphocreatine, 2 EGTA, 10 HEPES, 4 MgATP, 0.5 Na2GTP, pH 7.3, with KOH.
The series resistance is typically 10–20 MΩ and partially compensated by 30–50%. The
membrane potential is held at -70 mV. Data are acquired using pClamp 9 software,
sampled at 10 kHz, and filtered at 1 kHz. Off-line data analysis of mEPSCs is performed
using MiniAnalysis software (Synaptosoft, Decator, GA). Experiments are performed at
room temperature. Student’s t test is used for statistical analysis for mini events.
37
2.3 FM 1-43 imaging assay
FM 1-43 is a styryl dye with a hydrophilic head and a hydrophobic tail. The
hydrophobic head enables FM 1-43 to easily bind to plasma membrane, and the
hydrophilic head prevents FM 1-43 from diffusing through plasma membrane. FM 1-43
does not emit green fluorescence unless binding to plasma membrane. After binding to
presynaptic membrane, synaptic vesicle endocytosis makes FM 1-43 enter presynaptic
terminals. Thus FM 1-43 becomes binding to the inner side of vesicle membrane. The
rest of FM 1-43 left on the cell membrane can be washed out by dye-free solution. So the
final result is that the dyes inside synaptic vesicles emit fluorescence and thus label
synaptic vesicle clusters. During exocytosis, the inner side of the vesicle membrane
become outside of presynaptic membrane. FM 1-43 stuck to this part of cell membrane
can be easily washed out by dye-free solution. FM 1-43 images are acquired using an
inverted Nikon (Tokyo, Japan) TE 2000-S microscope equipped with a Hamamatsu
(Hamamatsu City, Japan) ORCA 100 cooled CCD camera. FM1-43 dye is loaded into
nerve terminals by immersion in 90 mM KCl solution plus FM dye (10 µM) for 2 min
and then washing in normal bath for 6 min before taking the first FM staining image. The
FM signal is then destained by exposure to two sequential dye-free 90 mM KCl pulses
and the second destained fluorescence image is taken.
38
2.4 Quantification of FM imaging
The subtracted image (FMstain - FMdestain) represents the activity-dependent
functional synaptic vesicle turnover in nerve terminals. The FM signal is quantified using
the algorithm of SimplePCI imaging software (Compix, Pittsburgh, PA) and the
background noise in the nonsynaptic area is subtracted (Chen et al., 2003). The
quantification of FM-labeled boutons includes three steps. The first step is to apply
enhancement to the images by activating Laplacian and smooth functions. The second
step is to identify objects by setting a threshold so that all visually identifiable boutons
are assigned as regions of interest, although the number of regions of interest in
nonsynaptic area is minimal. The third step is to quantify objects by setting another
threshold to further remove the tiny nonspecific dots in the nonsynaptic area (usually 3–5
pixels). We always used the same settings to quantify FM signal in the whole imaging
field under the control condition and 2 h after repetitive stimulation, and the ratio of the
two values represents long-term presynaptic changes. The number of FM-labeled boutons
per imaging field ranges from hundreds, in immature neurons, to thousands, in mature
neurons. Our analysis may underestimate the number of boutons in the densely
innervated area where two boutons may appear to be merged as one bouton. Therefore,
the ratio of increase in immature neurons can be an underestimation because repetitive
stimulation increases the density of boutons. In addition to counting the FM-labeled
active bouton number, the total integrated FM intensity in the bouton area is also

39
quantified to assess the overall presynaptic functional changes. Because the same
imaging field is compared before and after repetitive stimulation or drug treatment, the
paired Student’s t test is used for all statistical analysis of FM signal.
2.5 Immunocytochemistry
For immunostaining of glutamatergic synapses, presynaptic nerve terminals are
identified with mouse monoclonal antibodies specific for synaptophysin (1:200;
Chemicon, Temecula, CA) and SV2 (1:2000; Developmental Studies Hybridoma Bank,
University of Iowa, Iowa City, IA), and glutamatergic postsynaptic puncta are identified
using rabbit polyclonal antibody specific for PSD-95 (1:100; Zymed, South San
Francisco, CA). Immunostaining is performed after live FM 1-43 imaging, with or
without repetitive stimulation. Neurons are rinsed in PBS for three times and fixed for 12
min in 4% paraformaldehyde, pH 7.4. Coverslips are then rinsed three times in PBS and
primary antibodies are added together with 0.15% saponin blocking solution, incubating
overnight at 4°C. Then, coverslips are rinsed three times in PBS with 0.15% saposin for
15 min. Subsequently, samples are incubated for 45 min in anti-mouse Cy3 conjugated or
anti-rabbit Alexa 488-conjugated secondary antibodies.
For phalloidin staining, neuronal axons are identified with mouse monoclonal
40
antibodies specific for Tau1 (1:200; Chemicon, Temecula, CA) first. Next day, we
incubate neurons in Alexa 488- conjugated phalloidin (1:3000; Invitrogen) for 45 min
together with anti-mouse Cy3 conjugated secondary antibodies for detecting Tau1 signals.
Coverslips are then rinsed six times in PBS with 0.15% saponin for 15 min, and then
mounted with mounting solution (50% glycerol, 50% 0.1 M NaHCO3, pH 7.4).
Fluorescence signal is visualized on a Zeiss (Oberkochen, Germany) Axioplan 2
microscope. Fluorescence images are acquired by OpenLab software and analyzed with
SimplePCI software. The quantification of FM-labeled boutons included three steps. The
first step is to apply enhancement to the images by activating Laplacian and smooth
functions. The second step is to identify objects by setting a threshold so that all visually
identifiable boutons are assigned as regions of interest, although the number of regions of
interest in nonsynaptic area is minimal. The third step is to quantify objects by setting
another threshold to further remove the tiny nonspecific dots in the nonsynaptic area
(usually 3–5 pixels). We always use the same settings to quantify FM signal in the whole
imaging field under the control condition and 2 h after repetitive stimulation, and the
ratio of the two values represents long-term presynaptic changes. The number of
FM-labeled boutons per imaging field ranges from hundreds, in immature neurons, to
thousands, in mature neurons.

41
2.6 Quantification of immunofluorescent staining
For immunostaining of glutamatergic synapses, synaptic punctae are selected
based on immunofluorescent staining of presynaptic marker synaptophysin or SV2, and
postsynaptic marker PSD-95. Fluorescence images are acquired by OpenLab software
and quantified by SimplePCI software. The quantification of SV2- and PSD-95-labeled
punctae includes three steps. The first step is to apply enhancement to the images by
activating Laplacian and Smooth functions. The second step is to identify objects by
setting a threshold so that all visually identifiable punctae are selected. The third step is to
quantify objects by setting another threshold to further remove the tiny nonspecific dots
in the nonsynaptic area (usually 3–5 pixels).
For phalloidin staining, phalloidin intensity is quantified along tau1-labeled axons
(~100 µm per neuron, >1,000 µm in total length) by SimplePCI software, and
background noise in the neighboring area is subtracted (Chen et al., 2003).
2.7 Drugs and treatments
CNQX, AP5, bicuculline, and nocodazole are purchased from Tocris (Ellisville,
MO). Nimodipine, TTX, H89, and GF109203x, KT5720, and calphostin C are purchased

42
from Sigma (St. Louis, MO). Latrunculin A, cytochalasin B, and jasplakinolide are
purchased from Invitrogen. All of the drugs are freshly diluted in experimental solutions
or culture medium to final concentrations before experiments. CNQX, AP5 and
nimodipine are applied only within 90 mM KCl. TTX and bicuculline are applied only
within normal bath solution during patch clamp recording. For experiments containing
high K+ stimulation, nocodazole, H89, GF109203x, KT5720, calphostin C, latrunculin A,
cytochalasin B and jasplakinolide are applied within normal bath solutions at 37C for 30
min after high K+ stimulation, then neurons are put for 1.5 hr incubation at 37C. For
experiments without high K+ stimulation, H89, GF109203x, latrunculin A and
cytochalasin B are applied within normal bath solutions at 37C for 30 min.

43
Chapter 3
Summary of Results
3.1 Repetitive-spaced stimulation induces long-term synaptic plasticity in immature
but not mature hippocampal neurons
We applied 6 times 90 mM KCl application to cultured rat hippocampal neurons.
Every stimulation lasts 2 min, and the interval between stimulations is 6 min. As a
control group, we first recorded glutamatergic excitatory postsynaptic current (mEPSC)
before repetitive stimulation. Usually, mEPSC frequency depicts the level of presynaptic
glutamate release, and mEPSC amplitude depicts the postsynaptic glutamate receptor
activity. After repetitive stimulation, neurons were returned to culture incubator for 2 h
and then taken out for second patch clamp recording (Fig. 1A). We analyzed the
frequency and amplitude of mEPSCs before and 2 h after repetitive stimulation (ARS) to
monitor long-term changes of glutamatergic neurotransmission (Fig. 3-1). We compared
the changes of synaptic transmission between immature and mature neurons. Immature
neurons are defined here as 7–11 d in culture, a time period when the rate of
synaptogenesis is very fast (Cottrell et al., 2000; Friedman et al., 2000; Hsia et al., 1998;
Renger et al., 2001), whereas mature neurons are cultured for 18–22 d. We used the
paired Student’s t test for mEPSCs statistical analysis. 90mM K+ depolarizes membrane
potential to ~0 mV and induces large Ca2+ influx in nerve terminals and soma/dendrite

44
Figure 3-1. Repetitive stimulation induces long-term enhancement of synaptic transmission in immature but not mature hippocampal neurons. A, Diagram showing the experimental protocol. mEPSCs were recorded before and 2 h after six repetitive stimuli with 90 mM KCl solution. B, C, Representative traces illustrating mEPSCs recorded in immature neurons (7–11 d in culture) in the presence of TTX (0.5 µM) and BIC (20 µM) in control (B) and 2 h ARS (C). D, E, mEPSC traces in mature neurons (18 –22 d in culture) in control (D) and 2 h after repetitive stimulation (E). F, Bar graphs showing that repetitive stimulation induced a significant increase in the average mEPSC amplitude in immature neurons (p<0.003) but not mature neurons (p>0.7). G, Bar graphs showing a significant increase in the mEPSC frequency in immature neurons (p<0.03) but not mature neurons (p>0.4) after repetitive stimulation. Error bars indicate SE. *p<0.05.

45
(Wu et al., 2001b). The repetitive stimulation induced long-lasting enhancement of both
the frequency and amplitude of mEPSCs in immature neurons but not mature neurons,
suggesting that the long-term synaptic plasticity is developmentally regulated (Fig. 3-1).
We recorded mEPSCs in the presence of TTX (0.5 µM) and the GABAA receptor blocker
BIC (20 µM). In immature neurons, the average amplitude of mEPSCs was 13.6 ± 0.8 pA
(n = 38) before repetitive stimulation, but increased to 19.4 ± 2.6 pA (n = 22; p < 0.04,
Student’s t test) after repetitive stimulation; the frequency was 1.9 ± 0.3 Hz (n = 38)
before repetitive stimulation, but increased to 3.7 ± 0.6 Hz (p < 0.01; n = 22) after
stimulation. These results suggest that in immature neurons, both presynaptic glutamate
release and postsynaptic glutamate receptor activities were significantly enhanced after
repetitive stimulation.
However, in mature neurons, we did not find significant changes induced by the
same stimulation protocol. The mEPSC frequency was 3.9 ± 0.9 Hz (n=15) before
repetitive stimulation, and only slightly changed to 3.1 ± 0.5 Hz (n=19; p<0.4) after
repetitive stimulation. The amplitude was 16.1 ± 1.7 pA (n=15) before repetitive
stimulation, and slightly changed to 15.3 ± 1.2 pA (n = 19; p > 0.7) after repetitive
stimulation. (Fig. 3-1 F,G). Therefore, repetitive stimulation could induce a long-term
synaptic plasticity in immature hippocampal cultured neurons but not mature neurons,
indicating a significantly regulatory mechanism during neuronal development.

46
Figure 3-2. Repetitive stimulation induces long-term enhancement first in presynaptic terminals but not postsynaptic dendritic spines. A & B, Bar graphs showing a significant increase in the average mEPSC frequency (p < 0.02) but not amplitude (p > 0.21) in immature neurons immediately after repetitive stimulation. C & D, Bar graphs showing asignificant increase in the average mEPSC frequency (p < 0.03) but not amplitude (p > 0.71) in immature neurons after 30 min incubation following repetitive stimulation. Error bars indicate SE. *p<0.05.

47
In order to monitor short-term changes of glutamatergic neurotransmission and
compare the temporal sequence of the changes between presynaptic terminals and
postsynaptic dendritic spine, we investigated the frequency and amplitude of mEPSCs at
different time points after repetitive stimulation. These time points include 0 min and 30
min after repetitive stimulation (Fig. 3-2). At 0 min time point, the average amplitude of
mEPSCs slightly changed from 25.6 ± 2.3 pA (n = 15) in control to 21.6 ± 2.2 pA (n = 14;
p > 0.21, Student’s t test) after repetitive stimulation, whereas the frequency increased
from 0.5 ± 0.1 Hz (n = 15) in control to 1.1 ± 0.2 Hz (p < 0.02; n = 14) after stimulation.
At 30 min time point, the average amplitude of mEPSCs slightly changed from 23.5 ± 3.2
pA (n = 14) in control to 22.1 ± 2.2 pA (n = 14; p > 0.71, Student’s t test) after repetitive
stimulation, whereas the frequency increased from 0.6 ± 0.2 Hz (n = 14) in control to 1.4
± 0.3 Hz (p < 0.03; n = 14) after stimulation. These results suggest that the long-term
synaptic plasticity occurs first in presynaptic terminals.
Combining the experiments described above, our data suggested that repetitive
stimulation could induce long-term synaptic plasticity in immature hippocampal neurons,
with a presynaptic glutamate release enhancement and a following postsynaptic
strengthening. Part of data is contributed by Dr. Jinshun Qi.

48
3.2 Repetitive stimulation increases presynaptic functional boutons in immature
neurons but not mature neurons
The enhancement in mEPSC frequency may be caused by an increase in synapse
number or presynaptic glutamate release probability, or both. In order to distinguish these
probabilities, we used FM 1-43 imaging to investigate the effects of repetitive KCl
stimulation on presynaptic activity including vesicle transmission and pre-synapse
formation (Betz and Bewick, 1992; Ma et al., 1999; Ryan et al., 1993). We examined
activity-dependent FM puncta in the same imaging field before and 2 h after repetitive
stimulation. Cultured hippocampal neurons at different ages were investigated. We used
the paired Student’s t test for imaging statistical analysis. In our repetitive stimulation
protocal, the first 90 mM KCl stimulation contained FM 1-43 (10 µM), and all the other
stimulations were dye-free to destain FM signals. FM 1-43 is a styryl dye with a
hydrophilic head and a hydrophobic tail (Fig. 3-3). The hydrophobic head enables FM
1-43 to easily bind to plasma membrane, and the hydrophilic head prevents FM 1-43
from diffusing through plasma membrane. FM 1-43 does not emit green fluorescence
unless binding to plasma membrane. After binding to presynaptic membrane, synaptic
vesicle endocytosis makes FM 1-43 enter presynaptic terminals. Thus FM 1-43 becomes
binding to the inner side of vesicle membrane. The rest of FM 1-43 left on the cell
membrane can be washed out by dye-free solution. So the final result is that the dyes
inside synaptic vesicles emit fluorescence and thus label synaptic vesicle clusters. During

49
exocytosis, the inner side of the vesicle membrane become outside of presynaptic
membrane. FM 1-43 stuck to this part of cell membrane can be easily washed out by
dye-free solution. Therefore, FM 1-43 could be enwrapped into presynaptic terminals
through vesicle endocytosis and be released through vesicle exocytosis. We took
fluorescent images after FM staining (FM1 for staining) and two rounds of destaining
(FM2 for destaining). Neurons were then returned to culture incubator for 2 h after six
stimuli. Then the same field would be located back for the second round of FM imaging
procedure. Imaging of the same neurons before and 2 h after repetitive stimulation could
give accurate measure of the synaptic plasticity and eliminates variation induced by
comparison of randomly picked neurons before and after stimulation. A phase image
before each round of FM imaging was taken to assess morphological changes. In
destaining image, the FM signal was much weaker than staining image because most of
the FM dye had been exocytosed. Some puncta might not show changes because they
were non-specific staining. In the subtract image, the punta number represented the
number of functional presynaptic boutons, and the puncta fluorescence intensity depicted
the synaptic vesicle cycling efficiency (Fig. 3-3 C). As a result, the non-specific staining
will be counteracted. In our FM imaging protocol, FM1-FM2 represented the efficiency
of synaptic vesicle cycling under the control condition, FM3-FM4 represented the
efficiency of synaptic vesicle cycling after repetitive stimulation (Fig. 3-3 B).
In immature neurons, Fig. 3-4A and B are phase images of immature neurons

50
Figure 3-3. Repetitive spaced stimulation protocal for FM 1-43 imaging. A, Molecular formula of FM 1-43, with a hydrophilic head and a hydrophobic tail. B, Simplified model illustrating encorporation of FM 1-43 into presynaptic terminals. Only those FM 1-43 dyes binding to plasma membrane emit green fluorescence. C, Experimental protocol for FM 1-43 imaging and repetitive 90 K+ stimulation. Four fluorescence images were acquired (arrows, 1– 4) for subtraction and subsequent imaging analysis. FMcontrol = FM1-stain - FM2-destain; FM2 h ARS = FM3-stain - FM4-destain. D, FM subtract image depicts synaptic bouton number and synaptic vesicle cycling efficiency.

51
before and 2 h after repetitive stimulation. No significant change in soma or
axonal/dendritic branches was found 2 h after repetitive stimulation (Fig. 3-4 A, B).
However, if we compared the subtracted FM images, we found significantly enhanced
FM signals after repetitive stimulation (Fig. 3-4 C–G). The density of FM-labeled puncta
(per 100 µm dendrite) was 42 (Fig. 3-4 C) before repetitive stimulation, but greatly
increased to 76 after repetitive stimulation (Fig. 3-4 D). The integated fluorescence
intensity was greatly increased by 255.1% ± 65.9% (n=11, P<0.01; Fig. 3-4 H), and
functional presynaptic bouton number was also dramatically increased by 188.5% ±
20.2% (n=11, P<0.01; Fig. 3-4 I). The quantification was based on the total FM-labeled
bouton number in the whole imaging field, which increased from an average of 165 ± 27
(n = 11) active boutons per imaging field in control to 433 ± 87 boutons after repetitive
stimulation. For clear illustration of the increase after stimulation, both integrated FM
intensity and active bouton number were normalized to the control level before
stimulation.
In the contrast, the repetitive stimulation did not induce any apparent changes in
the presynaptic function of mature neurons (Fig. 3-4 J–P). The morphology of mature
neurons was also similar between control and 2 h after repetitive stimulation (Fig. 3-4 J,
K). The FM signal was not substantially changed after repetitive stimulation in mature
neurons, with a bouton density at 149 per 100 µm dendrite in the control condition (Fig.
3-4 L) and 168 after repetitive stimulation (Fig. 3-4 M). The integrated fluorescence

52
Figure 3-4. Repetitive stimulation induces long-term enhancement of presynaptic function in immature but not mature neurons. A, B, Phase images of the same immature neurons before (A) and 2 h after repetitive stimulation (B). Scale bar: (in A) A–D, J–M, 25 µm. C, D, Subtracted FM 1-43 images of the same neurons (corresponding to A and B) before (C) and 2 h after (D) repeated stimulation. E–G, Enlarged FM images from control (E, enlarged from C) and after stimulation (F, enlarged from D), as well as their merged picture (G). Scale bar: (in E) E–G, N–P, 2.5 µm. H–I, Quantitative analysis showing a significant increase in the integrated FM intensity (H; n=11; p<0.01, paired Student’s t test) and FM-labeled active bouton number (I; n=11; p< 0.01) after repetitive stimulation in immature neurons. The FM intensity and active bouton number after repetitive stimulation were normalized to the control value unless otherwise stated. J, K, Phase images of the same mature neuron before (J) and 2 h after (K) repeated stimulation. L, M, Subtracted FM 1-43 images of the mature neuron before (L) and 2 h after (M) repeated stimulation. N–P, Enlarged FM images from control (N, enlarged from L), after repetitive stimulation (O, enlarged from M), and merged picture (P). Q, R, Quantification of changes in the integratedFMintensity (Q; n=11; p>0.1, paired t test) and the active bouton number (R; n=11; p>0.1) after repetitive stimulation in mature neurons. Error bars indicate SE.

53
intensity was altered by 153.0% ± 62.5% (n=11, P>0.1; Fig. 3-4 Q), and functional
presynaptic bouton number slightly changed by 28.0% ± 23.7% (n=11, P>0.1; Fig. 3-4 R),
respectively. The total number of active boutons per imaging field in mature neurons only
changed slightly from 1649 ± 582 (n = 11) before repetitive stimulation to 2303 ± 536
after repetitive stimulation. Thus, in accordance with the electrophysiological analysis,
the FM imaging experiments indicate that repetitive stimulation induces presynaptic
long-term enhancement in immature but not mature neurons, supporting the notion that
long-term synaptic plasticity is developmentally regulated. And FM imaging further
confirmed a decent increase of functional presynaptic bouton number.
To test whether repetitive stimulation is required for the increase of functional
bouton number in immature neurons, we investigated the effect of single stimulation on
immature neurons (Fig. 3-5). Single stimulation means that after FM staining, we
destained FM signal for only one time, then immediately put neurons back for 2 hr
incubation (Fig. 3-5 A). After single-spaced stimulation and 2 h incubation, we could not
find any significant changes in the integrated FM intensity (p > 0.59; n = 6) or active
bouton number (p > 0.25; n = 6) (Fig. 3-5 B-E). Thus, multiple spaced stimuli are
necessary for long-term presynaptic enhancement.

54
Figure 3-5. Single spaced stimulation does not induce presynaptic long-termenhancement in immature neurons. A, Experimental protocol for single spaced stimulation. The first 90 K+ stimulation solution contained FM 1-43 (10 µM) and served as staining procedure, while the second 90 K+ solution without dye served to destain FM signal. B, C, Subtracted FM 1-43 images of immature neurons before (B) and 2 hrs after (C) single spaced stimulation. Scale bar, 25 µm. D, E, Quantitative analysis showing no significant changes in the integrated FM intensity (D, p>0.59, n=6) and active bouton number (E, p>0.25, n=6) after single spaced stimulation.

55
Figure 3-6. Retrospective immunocytochemistry reveals presynaptic silent boutons in immature but not mature neurons. A, Activity-labeled FM 1-43 images in control immature neurons. B, Retrospective immunostaining of synaptophysin at the same field shown in A. C, Overlaid image of A and B showing that many synaptophysin-labeled boutons are not stained with FM 1-43. D, E, FM1-43 images before (D) and 2 h after repetitive stimulation (E) in immature neurons. F, Retrospective immunostaining of synaptophysin at the same field shown in D and E. G, Overlaid image of E and F showing most of the synaptophysin-labeled boutons are now stained with FM 1-43 after repetitive stimulation. H, FM 1-43-labeled presynaptic boutons in control mature neurons. I, Synaptophysin-labeled presynaptic boutons. J, Overlaid image of H and I showing well correlated synaptophysin and FM puncta in mature neurons under the control condition. K, L, Presynaptic boutons labeled by FM 1-43 before (K) and 2 h after repetitive stimulation (L) in mature neurons.M, Synaptophysin-stained presynaptic boutons. N, Overlaid image of L andM. Scale bars, 15 µm.

56
3.3 Immature synapses are presynaptically silent but become active after repetitive
stimulation
Is the activity-dependent increase of functional synapse number due to new de
novo synapse formation or maturation of pre-existing but non-functional presynaptic
terminals? To answer this question, we did FM imaging and a following retrospective
immunostaining of synaptophysin. FM imaging can identify functional presynaptic
boutons, while anti-synaptophysin antibody can identify both active and silent ones (Fig.
3-6). Single stimulation has been previously confirmed little effect on synaptic activity.
We used single stimulation group as control, because single stimulation is required to
load FM dye. For immature neurons after single stimulation, many presynaptic boutons
could be labeled by synaptophysin antibody and could not be labeled by FM 1-43 dye,
indicating that these synaptophysin-labeled boutons are physically existing but
functionally silent (Fig. 3-6 A–C). After repetitive stimulation, most of the
synaptophysin-labeled boutons were stained with FM 1-43, suggesting that previously
silent presynaptic boutons were converted into active ones after repetitive stimulation
(Fig. 3-6 D–G). Quantitative analysis revealed that after single stimulation, the ratio of
FM-labeled functional bouton number to the total synaptophysin-positive bouton number
is 0.59 ± 0.04 (n = 4); however, after repetitive stimulation, the ratio increased to 0.92 ±
0.03 (n = 4; p < 0.001, Student’s t test). These result indicated a significant increase of
functional presynaptic boutons. In contrast, mature neurons showed highly correlated

57
staining of synaptophysin and FM 1-43 puncta regardless of repetitive stimulation. The
ratio of FM-labeled bouton number to total synaptophysin-labeled bouton number was
0.85 ± 0.02 (n = 4) after single stimulation, and slightly changed to 0.90 ± 0.04 (n = 4; p
> 0.3) after repetitive stimulation (Fig. 3-6 H–N). These results suggested that the
majority of presynaptic boutons of mature neurons are already active before stimulation.
Combining the immunostaining results after single and repetitive stimulation, we
concluded that a great amount of synapses were silent at the early developmental stage of
neurons, but became activated by repetitive stimulation.
We further investigated changes of the presynaptic and postsynaptic components
simultaneously in immature neurons. After FM imaging, we double immunostained
immature neurons with presynaptic marker SV2 and postsynaptic marker PSD-95, which
were respectively used to label the total number of presynaptic and postsynaptic puncta
(Fig. 3-7). Similar with synaptophysion antibody, SV2 antibody can also label both
functional and silent presynaptic boutons. PSD-95 appears in the late stage of synapse
assembly, so PSD-95 antibody can not only be used to examine the effect if repetitive
stimulation on postsynaptic dendritic spines, but also be used to label structurally intact
glutamatergic synapses. After single stimulation, FM-labeled puncta were only a small
fraction of SV2-labeled puncta, confirming that many SV2-labeled presynaptic boutons
are functionally silent (Fig. 3-7 A,C,E). Most of the SV2-labeled puncta also overlaid
with PSD-95 puncta, suggesting that these puncta represent functional synapses (Fig. 3-7

58
Figure 3-7. Comparison of repetitive stimulation-induced changes of presynaptic versus postsynaptic puncta in immature neurons. A–C, Immature neurons under the control condition showing FM 1-43-labeled functional presynaptic boutons (A), PSD-95-labeled postsynaptic puncta (B), and SV2-labeled presynaptic puncta (C) in the same field. D, E, Overlaid images for FM 1-43 labeling together with PSD-95 staining (D), or with SV2 staining (E). F–H, Immature neurons after repetitive stimulation, illustrating FM 1-43-labeled functional presynaptic boutons (F), PSD-95-labeled postsynaptic puncta (G), and SV2-labeled presynaptic puncta (H). I, J, Overlaid images for FM 1-43 labeling with PSD-95 staining (I), or with SV2 staining (J ). Scale bar, 10 µm. K, Quantification of changes of presynaptic versus postsynaptic puncta induced by repetitive stimulation. Data are normalized to the SV2-labeled puncta number. The FM 1-43-labeled active bouton number significantly increased from 40% in control (n=12) to 90% after repetitive stimulation (n=9; ***p<0.001). Error bars indicate SE.

59
A,B,D). After repetitive stimulation, the number of FM-labeled active boutons
significantly increased and the majority of them correlate very well with PSD-95 and
SV2 puncta (Fig. 3-7 F–J). To quantify the relative changes of presynaptic versus
postsynaptic puncta after repetitive stimulation, the puncta numbers of FM 1-43 and
PSD-95 were normalized to that of SV2. The number of FM1-43 puncta increased
significantly from 40% in control (n = 12) to 90% after repetitive stimulation (n = 9) (p <
0.001), whereas the number of PSD-95 puncta only increased slightly from 80 to 90%
without statistical significance (p > 0.2) (Fig. 3-7 K). Thus, the repetitive stimulation
converts presynaptic silent synapses into functional ones in immature neurons, which
may contribute significantly to long-term synaptic plasticity.
3.4 Activation of presynaptic silent synapses depends on L-type Ca2+ channels and
PKA/PKC signaling pathways
Then we asked how these presynaptic silent synapses were activated. The L-type
voltage-sensitive Ca2+ channel and glutamatergic NMDA receptors are two major types
of Ca2+ entry pathway involved in long-term synaptic plasticity and stabilization of
dendritic spines (Bading et al., 1993; Wu et al., 2001b). Here we examined the roles of
L-type Ca2+ channels and NMDARs in the activity-dependent activation of presynaptic
silent synapses in immature neurons.
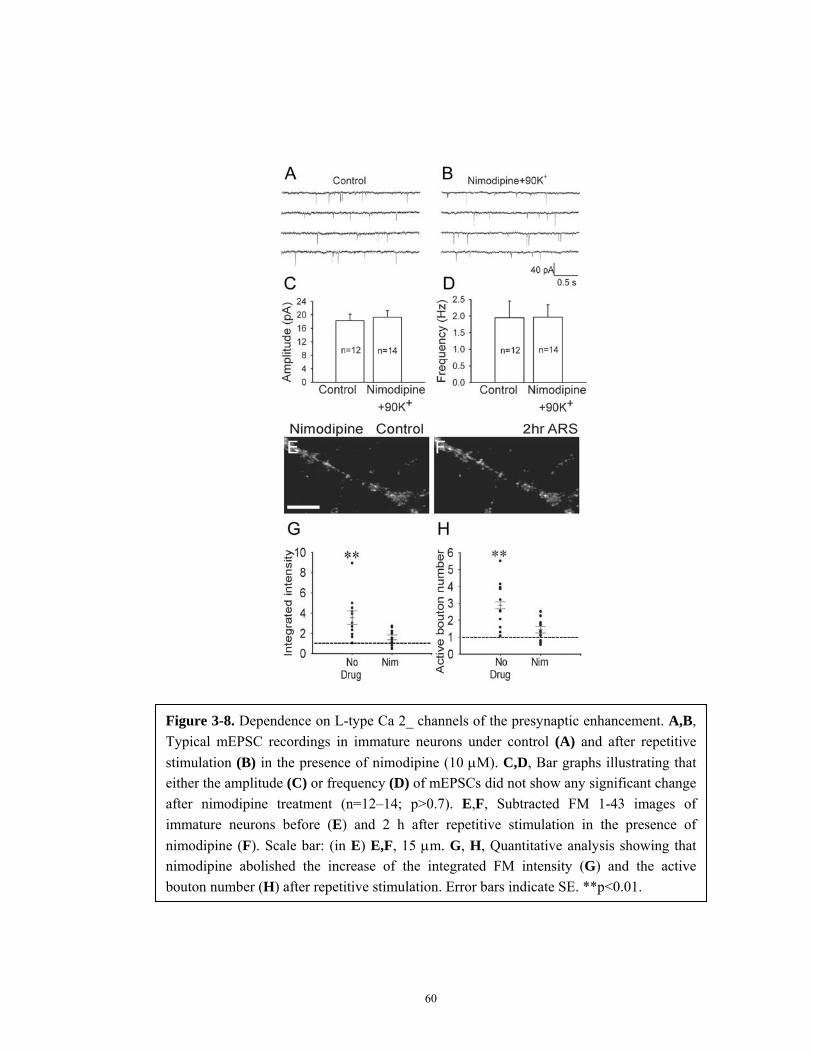
60
Figure 3-8. Dependence on L-type Ca 2_ channels of the presynaptic enhancement. A,B, Typical mEPSC recordings in immature neurons under control (A) and after repetitive stimulation (B) in the presence of nimodipine (10 µM). C,D, Bar graphs illustrating that either the amplitude (C) or frequency (D) of mEPSCs did not show any significant change after nimodipine treatment (n=12–14; p>0.7). E,F, Subtracted FM 1-43 images of immature neurons before (E) and 2 h after repetitive stimulation in the presence of nimodipine (F). Scale bar: (in E) E,F, 15 µm. G, H, Quantitative analysis showing thatnimodipine abolished the increase of the integrated FM intensity (G) and the active bouton number (H) after repetitive stimulation. Error bars indicate SE. **p<0.01.
61
We first treated immature neurons with L-type Ca2+ channel blocker nimodipine
(10 µM). The strong membrane depolarization during 90 K+ stimulation may be
sufficient to activate L-type Ca2+ channels and induce large Ca2+ influx to trigger
long-term synaptic enhancement. Blocking L-type Ca2+ channels essentially abolished the
long-term synaptic plasticity induced by repetitive stimulation (Fig. 3-8). When
nimodipine (10 µM) was present during repetitive 90 mM KCl stimulation, neither the
mEPSC amplitude (18.4 ± 2.0 pA in control, n = 12; 19.3 ± 2.0 pA after stimulation, n =
14; p > 0.8) nor the frequency (1.95 ± 0.72 Hz in control, n = 12; 1.97 ± 0.38 Hz after
stimulation, n = 14; p > 0.7) increased after the repetitive stimulation (Fig. 3-8 A-D),
indicating a critical role of L-type Ca2+ channels in high K+ induced long-term synaptic
plasticity. To further investigate the function of L-type Ca2+ channels in
activity-dependent presynaptic plasticity, we executed FM imaging to examine
presynaptic changes before and after repetitive stimulation in the presence of nimodipine
in immature neurons (Fig. 3-8 E-H). With nimodipine treatment, repetitive stimulation no
longer induces any significant increase of FM intensity (n = 11; p > 0.34) (Fig. 3-8 G),
nor the active bouton number (n = 11; p > 0.10) (Fig. 3-8 H). Thus, L-type Ca2+ channels
may play an important role in the activation of presynaptic silent synapses after repetitive
stimulation.
We next analyzed whether activation of glutamate receptors is required for
activation of presynaptic silent synapses induced by repetitive 90 mM KCl stimulation in

62
Figure 3-9. Glutamate receptor antagonists block postsynaptic but not presynaptic long-term enhancement A,B, Representative traces illustrating mEPSCs of immature neurons in control (A) and 2 hrs after repetitive 90 K+ stimulation in the presence of CNQX (10 µM) and AP5 (50 µM) (B). C, Bar graphs showing the amplitude of mEPSCs did not change significantly (p>0.68) after repetitive stimulation in the presence of CNQX and AP5. D, The frequency of mEPSCs remained substantially increased (p<0.004) after repetitive stimulation with CNQX and AP5. E,F, Activity-labeled FM 1-43 images of immature neurons in the presence of CNQX (10 µM) and AP5 (50 µM) before (E) and 2 hrs after (F) repetitive stimulation. Scale bar: (in E) E,F, 15 µm. G,H, Quantitative analysis showing a significant increase in the integrated FM intensity (G, p<0.02, n=8) and active bouton number (H, p<0.02, n=8) after repetitive stimulation in the presence of CNQX and AP5. Error bars indicate SE. *p<0.05, **p<0.01, ***p<0.001.

63
immature neurons (Fig. 3-9). Antagonists of AMPA (CNQX, 10 µM) and NMDA
receptors (AP5, 50 µM) were applied during repetitive stimulation. We first analyzed
mEPSCs before and after repetitive stimulation in the presence of AP5 and CNQX (Fig.
3-9 A-D). Blocking glutamate receptors abolished the increase of the amplitude of
mEPSCs induced by repetitive stimulation (control, 14.3 ± 1.3 pA, n = 18; stimulation
with CNQX/AP5, 19.0 ± 4.1 pA, n = 24; p > 0.2), consistent with the important role of
glutamate receptors in postsynaptic long-term plasticity. However, the frequency of
mEPSCs was still significantly increased after repetitive stimulation in the presence of
CNQX/AP5 (control, 1.8 ± 0.3 Hz, n = 18; stimulation with CNQX/AP5, 4.9 ± 0.9 Hz, n
= 24; p < 0.004). To further examine the effect of glutamate receptors on presynaptic
plasticity in immature neurons, FM 1-43 imaging was conducted to analyze changes of
presynaptic functional boutons before and after repetitive stimulation in the presence of
CNQX/AP5. In agreement with electrophysiological experiments, repetitive stimulation
induced a significant increase in both the integrated FM intensity (p < 0.01; n = 13) and
active bouton number (p < 0.02; n = 13) (Fig. 3-9 E-H).
What is the downstream factor of L-type Ca2+ channels? Ca2+ influx activates
downstream effectors such as protein kinases, which have been demonstrated to be
important players in long-term synaptic plasticity (Abel et al., 1997; Malenka and Nicoll,
1999; Malinow et al., 1988; Xia and Storm, 2005). For example, activation of L-type
Ca2+ channels induces transcription of c-fos gene through PKA/PKC involved

64
mechanism (Hall et al., 2006; Misra et al., 1994). Here, we examined the effects of two
important protein kinases, PKA and PKC, during activity dependent presynaptic
plasticity in immature neurons (Fig. 3-10). We treated immature neurons with specific
PKA inhibitors H89, KT5720, specific PKC inhibitors GF109203x, Calphostin C and
non-specific protein kinase inhibitors staurosporin, H7. In the presence of PKA inhibitor
H89 (1 µM), we did not find any significant FM puncta change after repetitive
stimulation (Fig. 3-10 A,B). Quantitative analysis revealed that after H89 treatment, there
was little change in either the fluorescence intensity or active bouton number (n = 8; p >
0.14 for fluorescence intensity, and p > 0.48 for bouton number) after the repetitive 90K+
stimulation (Fig. 3-10 C, D); Similarly, KT5720 only slightly affected fluorescence
intensity (0.93 ± 0.11; n = 12; p > 0.17; Fig. 3-10 E) and active bouton number (0.90 ±
0.09; n = 12; p > 0.95; Fig. 3-10 F). When neurons were treated with PKC inhibitor
GF109203x (5 µM), not only the increase of the fluorescence intensity and active bouton
number induced by pure high K+ stimulation were abolished, but also a further decrease
in both was found (for fluorescence intensity, n = 7; p < 0.01; for active bouton number,
n = 7; p < 0.03) (Fig. 3-10 C,D). Similarly, Calphostin C reduced the fluorescence
intensity to 0.28 ± 0.03 (n = 8; p < 0.001; Fig. 3-10 E), and reduced active bouton number
to 0.51 ± 0.03 (n = 8; p < 0.001; Fig. 3-10 F). We further examined the treatment of
PKA/PKC inhibitors on functional boutons under normal conditions without repetitive
stimulation. The number of functional boutons was significantly decreased by
GF109203x (0.48 ± 0.03; n = 15; p < 0.001; Fig. 3-11 B) under control conditions, while

65
Figure 3-10. Dependence on PKA/PKC signaling pathways of the presynaptic enhancement. A, B, SubtractedFM1-43 images of immature neurons before (A) and 2 h after repetitive stimulation (B ) in the presence of PKA inhibitor H89 (1 µM). Scale bar: (in B) A–B, 15 µm. C,D, Quantitative analysis showing the effect of PKA inhibitor H89, and PKC inhibitor GF109203x (5 µM) on changes of presynaptic functional boutons afterrepetitive stimulation. H89 abolished the increase of the integrated FM intensity (C) and the active bouton number (D) after repetitive stimulation. GF109203x treatment decreased the fluorescence intensity (n = 7; p < 0.01) and the active bouton number (n = 7; p < 0.03) after repetitive stimulation, suggesting that PKC is important in maintaining normal synaptic functions. E,F, Quantitative analysis showing the effect of PKA inhibitor KT5720 (10 µM) and PKC inhibitor Calphostin C (100 nM) on changes of presynapticfunctional boutons after repetitive stimulation. KT5720 only slightly affected fluorescence intensity (n = 12; p > 0.17) and active bouton number (n = 12; p > 0.95). Error bars indicate SE. *p<0.05; **p<0.01.

66
Figure 3-11. Effects of H89 and GF109203x on basal presynaptic activity under normal conditions without repetitive stimulation. A. The ratio of integrated fluorescence intensity after versus before G89/GFx treatment. The integrated intensity was significantly decreased by GF109203x (0.48 ± 0.03; n = 15; p < 0.001) under control conditions, while was slightly changed by H89. B. The ratio of functional bouton number after versus before G89/GFx treatment. The number of functional boutons was significantly decreased by GF109203x (0.31 ± 0.03; n = 15; p < 0.001) under control conditions, while was slightly changed by H89. Error bars indicate SE. ***p<0.001.

67
was slightly changed by H89 (1.04 ± 0.12; n = 6; p > 0.96; Fig. 3-11 B). Thus, both PKA
and PKC are required for the activation of presynaptic silent synapses after repetitive
stimulation in immature neurons. PKC may also be critical in maintaining normal
presynaptic functions under resting conditions.
Combing these results, we suggest that activation of presynaptic silent synapses
is dependent on L-type Ca2+ channels and PKA/PKC signaling pathways, whereas
postsynaptic enhancement is dependent on glutamate receptor activation. Part of data is
contributed by Dr. Jinshun Qi.
3.5 Actin plays a critical role in activating presynaptic silent synapses
Actin is the main component of the cytoskeletal microfilaments playing important
roles in axon guidance, synapse development and synaptic remodeling (Colicos et al.,
2001; Matus et al., 2000; Sankaranarayanan et al., 2003; Star et al., 2002; Wang et al.,
2005). In our study, actin polymerization is found to be critical in activity-dependent
activation of presynaptic silent synapses (Fig. 3-12).
We first recorded mEPSCs in immature neurons after repetitive stimulation in the
absence or presence of latrunculin A (5 µM). Latrunculin A is a strong actin
depolymerizing agent, and is widely used to study actin function in synaptic vesicle

68
Figure 3-12. Inhibition of actin polymerization abolishes presynaptic long-term enhancement in immature neurons. A, B, mEPSCs of immature neurons recorded after repetitive 90 K_ stimulation in the absence (A) or presence of latrunculin A (5 µM) (B). C, D, Bar graphs showing that latrunculin A treatment did not affect the amplitude of mEPSCs (n = 14 –17; p > 0.1) but reduced the frequency significantly (p<0.01). E, F, Subtracted FM 1-43 images of immature neurons before (E) and 2 h after (F) repeated stimulation with latrunculinAtreatment. G, H, SubtractedFM1-43 images of immature neurons before (G) and 2 h after (H) repeated stimulation with cytochalasin B (4 µM) treatment. Scale bar: (in E) E–H, 20 µm. I, J, Quantification of changes in the integrated fluorescence intensity (I) and active bouton number (J) after blocking actin polymerization. Cytochalasin B treatment abolished repetitive stimulation-induced increase of the integrated FM intensity (p>0.13; n=8) and the active bouton number (p>0.16; n=8), whereas latrunculin A significantly decreased the integrated FM intensity (**p<0.01; n=10) and the active bouton number (p<0.03; n=10). Error bars indicate SE. *p<0.05.

69
cycling (Morales et al., 2000; Richards et al., 2004; Sankaranarayanan et al., 2003). In the
absence of latrunculin A, mEPSCs showed a frequency at 5.11 ± 1.01 Hz (n = 14) and an
average amplitude at 21.8 ± 3.2 pA (n = 14). After latrunculin A treatment, we found that
the frequency of mEPSCs was significantly reduced to 1.87 ± 0.37 Hz (n = 17; p < 0.01).
However, the amplitude was not greatly affected (16.6 ± 2.1 pA, n = 17, p < 0.1) (Fig.
3-12 A-D).
FM imaging was also used to examine presynaptic changes after repetitive
stimulation with or without inhibition of actin polymerization (Fig. 3-12 E–J). Consistent
with the electrophysiological data, latrunculin A (5 µM) not only abolished the increase
of FMstaining induced by repetitive stimulation, but also induced a significant reduction
in both the integrated FM intensity (0.51 ± 0.12, n = 10, p < 0.01) and active bouton
number (0.62 ± 0.14, n = 10, p < 0.03) (Fig. 3-12 E, F, I, J), supporting the notion that
F-actin is critical in the maintenance of young synapses (Zhang and Benson, 2001). Some
labs have reported that latrunculin A might affect baseline of synaptic transmission. In
order to avoid this side effect, we did FM imaging with another type of actin
depolymerizer, cytochalasin B (4 µM). Cytochalasin B only abolished the increase of
integrated FM intensity (0.95 ± 0.05, n = 8, p > 0.13) and active bouton number (0.89 ±
0.27, n = 8, p > 0.16) induced by repetitive stimulation without causing any additional
decrease compared with the control (Fig. 3-12 G–J).

70
Figure 3-13. Effect of actin depolymerizer on basal synaptic activity in immatureneurons. A, mEPSCs of immature neurons recorded before and after pretreatment (30 min) of cytochalasin B (4 µM) or latrunculin A (5 µM). B, Compared to the control, the amplitude of mEPSCs after cytochalasin B pretreatment showed a slight decrease but no statistical significance (p>0.1), whereas latrunculin A pretreatment significantly reduced the amplitude (p<0.02). C, The mEPSC frequency also showed no significant change after cytochalasin B pretreatment (p>0.1), but had a significant decrease (p<0.001) after latrunculin A pretreatment. D, E, Quantification of changes in the integrated fluorescence intensity (D) and active bouton number (E) after blocking actin polymerization. Cytochalasin B treatment did not show significant effect on either the integrated FM intensity (p>0.15; n=8) or the active bouton number (p>0.98; n=8), whereas latrunculin A significantly decreased the integrated FM intensity (p<0.006; n=10) and the active bouton number (p<0.002; n=10). Error bars indicate SE. *p<0.05; **p<0.01.

71
We further compared the effects of latrunculin A and cytochalasin B on basal
synaptic activity without repetitive stimulation (Fig. 3-13). Latrunculin A significantly
affected basal mEPSCs, whereas cytochalasin B had no significant effect (Fig. 3-13 A).
The average amplitude of mEPSCs was 24.3 ± 1.9 pA (n = 15) in the control condition,
dropped to 18.7 ± 3.4 pA (n = 15; p > 0.1) after cytochalasin B treatment, and
significantly decreased to 15.5 ± 2.6 pA (n = 16; p < 0.02) after latrunculin A treatment
(Fig. 3-13 B). The mEPSC frequency was 0.62 ± 0.16 Hz (n = 15) in control, 0.35 ± 0.07
Hz (n = 15; p > 0.1) after cytochalasin B treatment, and 0.12 ± 0.02 Hz (n = 16; p < 0.001)
after latrunculin A treatment (Fig. 3-13 C). In FM imaging, similar to the effect after
repetitive stimulation, latrunculin A treatment also reduced the functional bouton number
after single stimulation (0.44 ± 0.06; n = 10, p < 0.003, paired t test), but cytochalasin B
did not show a significant effect (1.01 ± 0.13; n = 8, p > 0.9) (Fig. 3-13 D, E). The strong
effect of latrunculin A on basal mEPSCs of immature neurons suggests that actin
polymerization is required for functional integrity of immature synapses (Zhang and
Benson, 2001). However, the mild effect of cytochalasin B on basal release makes it
better suited for studying actin function in synaptic plasticity. Part of data is contributed
by Dr. Jinshun Qi.

72
Figure 3-14. Actin but not microtubule polymerization is critical to presynaptic long-term enhancement in immature neurons. A, B, Subtracted FM 1-43 images of immature neurons pretreated with actin polymerizer jasplakinolide (100 nM, 30 min) before (A) and 2 h after (B) single-spaced stimulation. C, D, Quantitative analysis showing a significant increase in the integratedFMintensity (C; p<0.01; n=13) and active bouton number (D; p<0.01; n=13) after jasplakinolide treatment. E, F, Subtracted FM 1-43 images of immature neurons pretreated with microtubule depolymerizer nocodazole (10 µM, 30 min) before (E) and 2 h after (F) repetitive stimulation.G,H, Quantitative analysis showing that after nocodazole treatment, repetitive stimulation still increased the integratedFMintensity (G; **p<0.01; n=8) and the active bouton number (H; p<0.02; n=8) in immature neurons. Scale bar: (in A) A, B, E, F, 20 µm. Error bars indicate SE.

73
3.6 Actin but not microtubule is critical for presynaptic long-term plasticity
We have known that the activation of presynaptic silent synapses was dependent
on a certain level of actin polymerization. In order to test whether actin polymerization
itself was sufficient to trigger the presynaptic activation, we treated immature neurons
with the actin polymerizer jasplakinolide (100 nM). In order to examine the pure effect os
actin polymerization, we applied jasplakinolide together with single-spaced stimulation
(Fig. 3-14 A–D). Single-spaced stimulation alone did not induce long-term changes of
FM staining and could not activate presynaptic silent synapses. However, the same
single-spaced stimulation paradigm after pretreatment with jasplakinolide resulted in
long-term increase of the integrated FM intensity (2.46 ± 0.45; n = 13, p < 0.01) and
active bouton numbers (2.13 ± 0.26; n = 13, p < 0.01). This result suggested that actin
polymerization alone may be sufficient in enhancing presynaptic function (Fig. 3-14
A–D). Consistent with our finding, it has been demonstrated that jasplakinolide treatment
alone can recruit actin to synaptic terminals and occlude further activity dependent
recruitment (Sankaranarayanan et al., 2003).
Microtubule is another important cytoskeleton element and also reported toplay a
role in synaptic remodeling in certain types of synapses (Langford, 1995; Ruiz-Canada et
al., 2004). To test the function of microtubules in presynaptic plasticity, we treated
immature neurons with nocodazole (10 µM), a widely used depolymerizing agent of

74
Figure 3-15. Repetitive stimulation increases actin polymerization in immature but not mature neurons. A, B, Immature neurons coimmunostained with axon marker tau1 (A) and F-actin marker phalloidin (B) after single 90 K_ stimulation. C, D, Coimmunostaining of tau1 (C) and phalloidin (D) in immature neurons after repetitive stimulation. Repetitive stimulation induced a significant increase of phalloidin intensity in tau1-labeled axons of immature neurons (p<0.001; n=10). E, F, Mature neurons stained with tau1 (E) and phalloidin (F) after single stimulation. G, H, Mature neurons stained with tau1 (G) and phalloidin (H) after repetitive stimulation. Scale bar: (in A) A–H, 5 µm. No significant change in phalloidin intensity was found in mature axons after repetitive stimulation (p>0.44; n=10). I, Simplified model illustrating an important role of actin polymerization in the activation of presynaptic silent boutons induced by repetitive stimulation.

75
microtubules (Gibney and Zheng, 2003; Yabe et al., 1999), before and during repetitive
stimulation (Fig. 3-14 E–H). We found that even though we blocked MTs-mediated
transportation by nocodazole treatment, immature neurons still showed an increase of the
integrated FM intensity (2.25 ± 0.38; n = 8, p < 0.01) nor the active bouton number (1.98
± 0.25; n = 8, p < 0.02) after repetitive stimulation. Thus, it is the polymerization of actin
but not microtubule that plays a critical role in long-term presynaptic enhancement.
3.7 Repetitive stimulation increases actin polymerization in immature but not
mature axons
To understand why the repetitive 90 mM KCl stimulation could induce a
long-term synaptic plasticity in immature but not mature neurons, we examined actin
polymerization induced by single versus repetitive 90 K+ stimulation in both immature
and mature neurons (Fig. 3-15). The degree of actin polymerization was quantified by
immunostaining of fluorescently labeled phalloidin, which binds selectively to F-actin
and widely used as an index for actin polymerization. Coimmunostaining with Tau1
antibody was used to label axons. In immature neurons, phalloidin intensity was weak
after single stimulation, but increased by twofold after repetitive stimulation (single
stimulation, 817 ± 138 arbitrary unit; after repetitive stimulation, 1648 ± 83; n = 5; p <
0.002) (Fig. 3-15 A–D). In contrast, in mature neurons, phalloidin intensity was already
76
strong with single stimulation, and not further increased after repetitive stimulation
(single stimulation, 2016 ± 139; after repetitive stimulation, 2148 ± 83; n = 5; p > 0.44)
(Fig. 3-15 E–H). Together with the experiments using actin polymerizer and
depolymerizer described above, our data suggest that actin dynamics undergo a
significant change during neuronal maturation, which in turn regulates long-term synaptic
plasticity during neuronal development.

77
Chapter 4
Discussion
We used repetitive 90 mM KCl stimulation to induce long-term synaptic plasticity
in rat immature hippocampal neurons. FM 1-43 imaging and immunostaining analysis
revealed that during the long-term synaptic plasticity, a great amount of pre-existing
presynaptic boutons are functionally silent at resting conditions. Repetitive spaced
stimulation triggered the actiation of presynaptic silent synapses through promoting
G-actin/F-actin equilibrium towards F-actin. On the other hand, repetitive stimulation
does not enhance F-actin level or enhance synaptic transmission in mature neurons.
Therefore, our work suggested that in hippocampal neurons at early developmental stage,
actin-dependent activation of presynaptic silent synapses significantly contributes to
long-term synaptic plasticity. These data revealed a critical role of actin in regulating
synaptic plasticity during neuronal development.
4.1 Presynaptic versus postsynaptic mechanisms of long-term synaptic plasticity
In previous research, the NMDAR-dependent LTP is the most thoroughly studied
model of long-term synaptic plasticity. Postsynaptic NMDARs and AMPARs have been
demonstrated to be important for LTP induction and maintenance in this model

78
(Collingridge and Bliss, 1995; Nicoll and Malenka, 1995). The activation of postsynaptic
silent synapses, which is through the insertion of functional AMPARs to postsynaptic
density and the following activation of pre-existing NMDARs, has been suggested to
contribute to this type of long-term synaptic plasticity (Durand et al., 1996; Isaac et al.,
1995; Liao et al., 1995; Wu et al., 1996). In addition, another type of LTP occurring in
mossy fibers of hippocampus has been identified to be independent of postsynaptic
NMDARs. The mossy fiber LTP seems to be induced through a presynaptic signaling
pathway. Therefore, the induction and maintenance of long-term synaptic plasticity
involves not only postsynaptic, but also presynaptic mechanisms.
In our work, we found that activation of presynaptic silent synapses by increased
actin polymerization level also play important roles during long-term plasticity. We used
FM 1-43 imaging to examine the presynaptic changes in the same imaging field during
repetitive stimulation induced long-term synaptic plasticity in immature neurons, and
found a significant increase of functional presynaptic bouton number. Then we carried
out synaptophysin immunostaining following FM imaging to investigate the presynaptic
silent synapses in both immature and mature neurons, since FM 1-43 labels only
functional presynaptic boutons but presynaptic marker synaptophysin can label both
functional and silent boutons. In immature neurons, only a fraction of
synaptophysin-labeled boutons can uptake FM dye before repetitive spaced stimulation,
suggesting that the majority of existing boutons are functionally silent. However, after

79
repetitive stimulation, most of the synaptophysin-labeled boutons become capable of FM
1-43 loading. On the other side, in mature neurons, the synaptophysin-labeled boutons
did not show increased ability of FM 1-43 uptaking. We further quantitatively confirmed
the activation of presynaptic silent synapses in immature neurons through SV2/PSD-95
double immunostaining. PSD-95 antibody was used to examine the changes in
glutamatergic postsynaptic densities. After repetitive stimulation, PSD-95-labeled puncta
number only showed a slight increase. These results suggested that in immature neurons,
most of the new functional synapses were converted from previous presynaptic silent
synapses but not newly formed synapses because PSD-95-labeled puncta number did not
dramatically increase. However, it is also possible that some functional boutons may
come from the de novo formation of new presynaptic puncta. Our quantitiative analysis
of PSD-95- and FM-labeled puncta numbers were based on SV2-labeled puncta number.
The percentage of new synapses forming through de novo pathway was not accurately
estimated because we did not investigate how many SV2-labeled boutons were newly
formed. In summary, comparing FM 1-43 and synaptophysin or SV2 signal before and
after inducing long-term synaptic plasticity, it is most likely that the newly appeared
functional boutons after repetitive stimulation come from the activation of presynaptic
silent synapses.
In our FM imaging protocol, some FM-labeled puncta may be mobile vesicle
clusters, which may pause and form synapses later (Ahmari et al., 2000; Friedman et al.,

80
2000; Krueger et al., 2003). We should also point out that the absolute number of active
boutons depends on the threshold setting of the imaging analysis. Therefore, some
boutons with a very low rate of vesicle turnover may not be detected. We have optimized
our automatic detection system so that the software-detected boutons are the best match
with eye detected boutons (see Materials and Methods). In addition, to offset for the
threshold detection, we also quantified the total FM intensity in the bouton area. Similar
to the bouton number change, the total FM intensity also increased substantially after
repetitive stimulation in immature neurons.
Our study supports that presynaptic mechanisms are involved in long-term
synaptic plasticity. The long-term increase of mEPSC frequency and functional bouton
number, which indicated synaptic enhancement in presynaptic terminals, was induced
after repetitive spaced stimulation. This result is consistent with previous studies (Ma et
al., 1999; Malgaroli et al., 1995; Ryan et al., 1996a; Zakharenko et al., 2001).
Glutamatergic NMDA receptors and L-type Ca2+ channels have been suggested to be two
major Ca2+ entry involved in long-term plasticity (Johnston et al., 1992; Malgaroli and
Tsien, 1992; Nicoll and Malenka, 1995; Niikura et al., 2004; Zakharenko et al., 2001).
We found that the postsynaptic enhancement of mEPSC amplitude after repetitive 90 K+
stimulation can be blocked by either L-type Ca2+ channel blocker or glutamate receptor
antagonists, suggesting multiple signaling pathways involved. However, the presynaptic
enhancement of mEPSC frequency and FM staining was only blocked by nimodipine but

81
not CNQX/AP5, suggesting a NMDAR-independent presynaptic plasticity. Therefore, we
propose that the repetitive 90 K+ stimulation may induce a large Ca2+ influx into nerve
terminals through L-type Ca2+ channels, which directly activates down-stream
cell-signaling pathways such as protein phosphorylation and actin polymerization to
trigger long-term plasticity (Bito et al., 1996; Wu et al., 2001a). The downstream factors
of L-type Ca2+ channel mediated Ca2+ influx, PKA and PKC signaling cascades, are
required for the activation of presynaptic silent synapses. This finding is in accordance
with previous research that cAMP application could increase the number of presynaptic
functional boutons in hippocampal neurons, and this result suggested that PKA signaling
cascade is required for the activation of presynaptic silent synapses (Ma et al., 1999). The
strong effects of PKC inhibitors on basal synaptic activity suggest that PKC is not only
important for activation of presynaptic silent synapses, but also required for maintaining
normal synaptic functions in developing synapses.
Previous research has suggested that postsynaptic changes might affect the
plasticity in presynaptic terminals through NMDAR-dependent release of trans-synaptic
retrograde signal such as nitric oxide. Our study suggests that postsynaptic NMDARs are
not required for either the activation of presynaptic silent synapses or long-term synaptic
plasticity induced by our 90K+ stimulation protocol.

82
4.2 Actin-dependent activation of presynaptic silent boutons
Recent studies suggested that actin filaments may play important roles in synaptic
transmission and plasticity (Dillon and Goda, 2005). The equilibrium between
G-actin/F-actin could be propelled towards F-actin by neuronal activity. It has been
suggested that electrical stimulation induces presynaptic actin condensation and
postsynaptic actin enlargement in dendritic spines (Colicos et al., 2001; Okamoto et al.,
2004; Sankaranarayanan et al., 2003). In presynaptic terminals, actin filaments are
surrounding synaptic vesicles and could regulate synaptic vesicle cycling during
endocytosis and exocytosis. In postsynaptic dendritic spines, actin filaments may be
directly linked to postsynaptic density and could modulate AMPARs clustering and
maintenance of LTP. In addition, postsynaptic actin polymerization might be involved in
activation of presynaptic silent synapses through retrograde signaling (Wang et al., 2005).
However, our work revealed that presynaptic actin polymerization could directly activate
presynaptic silent synapses, perhaps without involvement of trans-synaptic retrograde
signals. In accordance with the actin dynamic changes, our work supports the role of
presynaptic actin polymerization in the activation of presynaptic silent synapses. We
applied two types of actin depolymerizing agents and one type of actin polymerizing
agent to immature neurons to examine the presynaptic changes following movements of
G-actin/F-actin equilibrium, and we further visualized actin polymerization during
long-term synaptic plasticity. latrunculin A is an actin depolymerzer capable of
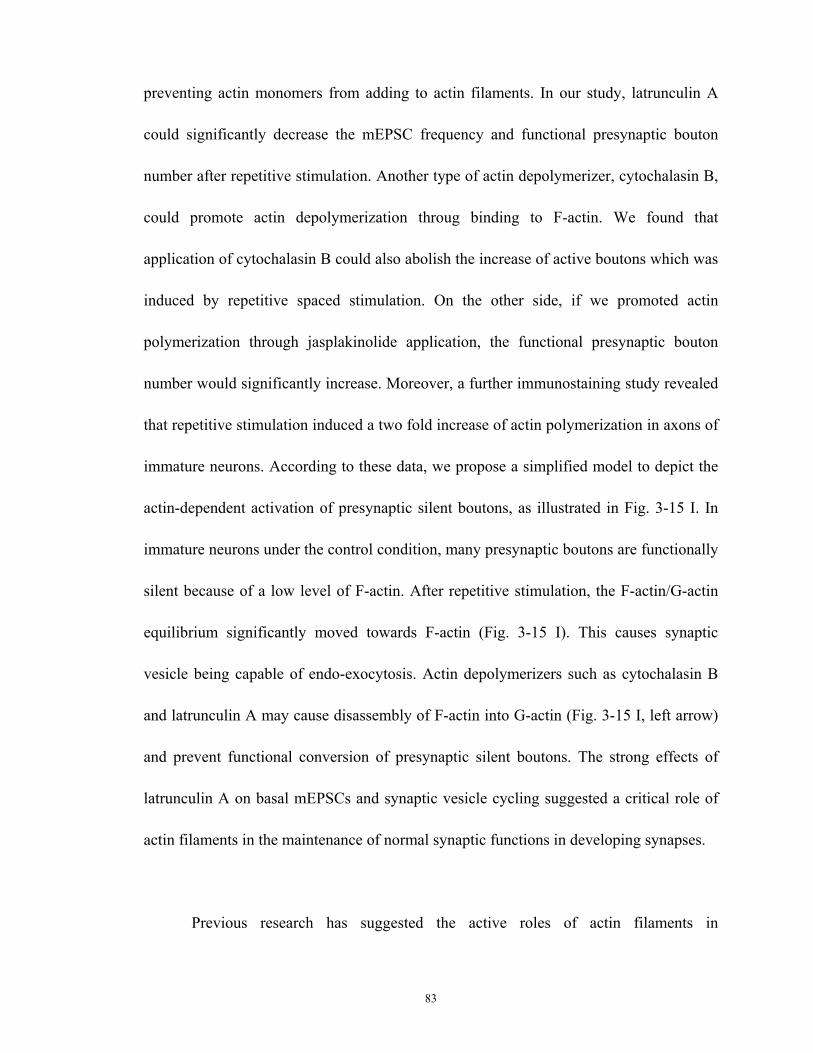
83
preventing actin monomers from adding to actin filaments. In our study, latrunculin A
could significantly decrease the mEPSC frequency and functional presynaptic bouton
number after repetitive stimulation. Another type of actin depolymerizer, cytochalasin B,
could promote actin depolymerization throug binding to F-actin. We found that
application of cytochalasin B could also abolish the increase of active boutons which was
induced by repetitive spaced stimulation. On the other side, if we promoted actin
polymerization through jasplakinolide application, the functional presynaptic bouton
number would significantly increase. Moreover, a further immunostaining study revealed
that repetitive stimulation induced a two fold increase of actin polymerization in axons of
immature neurons. According to these data, we propose a simplified model to depict the
actin-dependent activation of presynaptic silent boutons, as illustrated in Fig. 3-15 I. In
immature neurons under the control condition, many presynaptic boutons are functionally
silent because of a low level of F-actin. After repetitive stimulation, the F-actin/G-actin
equilibrium significantly moved towards F-actin (Fig. 3-15 I). This causes synaptic
vesicle being capable of endo-exocytosis. Actin depolymerizers such as cytochalasin B
and latrunculin A may cause disassembly of F-actin into G-actin (Fig. 3-15 I, left arrow)
and prevent functional conversion of presynaptic silent boutons. The strong effects of
latrunculin A on basal mEPSCs and synaptic vesicle cycling suggested a critical role of
actin filaments in the maintenance of normal synaptic functions in developing synapses.
Previous research has suggested the active roles of actin filaments in

84
morphological plasticity of synapses (Zhang and Benson, 2001). One prominent
characteristic of actin is its activity-dependent dynamics. In presynaptic terminals, it has
been suggested that after electrical stimulation, actin filaments accumulated in
presynaptic boutons but decreased in neighboring axonal regions (Sankaranarayanan et
al., 2003). Postsynaptically, FRET-based detection of actin dynamics revealed
enlargement of dendritic spines after tetanic stimulation (Okamoto et al., 2004).
Simultaneous remodeling of pre- and postsynaptic actin was also monitored in
hippocampal synapses under photoconductive stimulation that presynaptic actin
condensed toward the active zone while postsynaptic actin expanded laterally to enclose
the presynaptic bouton (Colicos et al., 2001). The F-actin/G-actin equilibrium was also
directly revealed to shift toward F-actin by activity (Okamoto et al., 2004). In accordance
with these actin dynamic changes, our work suggested that the axonal actin
polymerization level increased by twofold after repetitive stimulation in immature
neurons. These activity-dependent actin dynamics probably underlie the mechanism of
actin in long-term synaptic plasticity. For example, high frequency stimulation-induced in
vivo dentate gyrus LTP was accompanied with an increase in F-actin content in dendritic
spines and latrunculin A treatment blocked the late phase of LTP (Fukazawa et al., 2003).
Multiple tetanic stimuli also induced long-term presynaptic remodeling of actin,
including the appearance of new actin puncta along axons 2-3 hrs after stimulation
(Colicos et al., 2001). Our current study further demonstrated that the long-term
morphological remodeling of presynaptic actin may be associated with transformation of

85
silent boutons into functional ones in immature neurons. The strong correlation between
actin polymerization and the number of functional presynaptic boutons in immature
neurons suggests that actin polymerization may be an important mechanism underlying
presynaptic plasticity (Antonov et al., 2001; Colicos et al., 2001; Wang et al., 2005).
Therefore, actin not only plays an important role in morphological plasticity, but also
plays a critical role in functional plasticity in immature neurons.
In addition to the dependence on neuronal activity, actin dynamics in presynaptic
axonal filopodia and postsynaptic dendritic spines could also be modulated by glutamate
stimulation (Chang and De Camilli, 2001; Fischer et al., 2000). Application of glutamate
was found to induce a coordinated clustering of both presynaptic protein synaptophysin
and postsynaptic AMPARs subunit GluR1, and such clustering could be blocked by actin
depolymerizing agent cytochalasin D (Antonov et al., 2001; Wang et al., 2005). However,
the puncta number of NMDARs subunit NR1 was not changed, which may suggest that
total number of synapses might not change in response to glutamate stimulation. Because
these chemical-induced new puncta appeared within 5-10 min after glutamate application,
they are unlikely representing newly formed synapses. Nevertheless, these
chemical-induced puncta require actin polymerization and possibly regulated by
retrograde signaling through NO-cGMP-cGK pathway and Rho GTPases (Antonov et al.,
2001; Wang et al., 2005). The fact that this rapid onset of puncta changes also depends on
actin polymerization, together with our own finding of actin-dependent activation of
86
presynaptic silent synapses, supports the notion that actin polymerization may be a
prerequisite for synaptic plasticity (Colicos et al., 2001).
4.3 The role of actin in developmentally regulated long-term synaptic plasticity
Our study suggested that repetitive 90 K+ stimulation induces long-term synaptic
plasticity only in immature but not mature hippocampal neurons. This is reassured by
both electrophysiology and FM imaging studies. The long-term synaptic plasticity in
immature neurons was blocked by actin polymerization inhibitor. Together with the
observation that repetitive stimulation induced a twofold increase of F-actin in immature
but not mature axons, these data clearly point to a critical role of actin in developmental
regulation of synaptic plasticity.
As an essential kind of the cytoskeleton proteins, actin filament has been well
known to play a critical role in neurite growth, axon guidance, synapse development and
synaptic plasticity (Dent and Gertler, 2003). Actin appears early during neuronal
development, and exerts differential effects in maintaining immature versus mature
synaptic structures (Zhang and Benson, 2001). Our finding that actin-dependent
activation of presynaptic silent synapses is prominent in immature but not mature neurons
supports the notion that developing neurons are more plastic than mature neurons (Choi

87
et al., 2000; Durand et al., 1996; Gasparini et al., 2000; Hanse and Gustafsson, 2001;
Renger et al., 2001; Wu et al., 1996). Although it is possible that mature neurons in
culture are less sensitive to certain type of neuronal stimulation, the lack of increase of
active boutons in mature neurons after repetitive stimulation is consistent with previous
studies showing no significant change in the total number of presynaptic puncta after
LTP induction (Fukazawa et al., 2003; Zakharenko et al., 2001). Thus, long-term
plasticity in mature synapses may be expressed mainly by enhancement of presynaptic
release efficiency and postsynaptic receptor responses, whereas in immature synapses,
activation of presynaptic and postsynaptic silent synapses contributes significantly to
long-term synaptic plasticity.
Actin filaments may have differential effects on the maintenance of synapse at
different developmental stages of neurons (Zhang and Benson, 2001). Previous study
revealed that in immature synapses, inhibition of actin polymerization with latrunculin A
induces loss of presynaptic synaptophysin and bassoon clusters, which appears first in the
temporal order of synapse assembly; whereas in mature synapses, such presynaptic
clusters are resistant to latrunculin A treatment (Zhang and Benson, 2001). Our work
further suggests that actin not only participates in the morphological plasticity, but also is
involved in the functional plasticity during neuronal development. In immature neurons,
repetitive stimulation enhances actin polymerization and activates presynaptic silent
boutons; whereas in mature neurons, the same repetitive stimulation does not induce

88
further actin polymerization or long-term synaptic plasticity. Taken together, these
studies suggest that in immature synapses, actin not only serves as a scaffolding
cytoskeletal protein to maintain synaptic structures, but also an active player in
presynaptic vesicle cycling and postsynaptic receptor anchoring. After neuronal
maturation, actin is mainly playing a scaffolding function to allow other proteins such as
synapsin 1a or RIM to regulate synaptic vesicle cycling and PSD-95 to anchor glutamate
receptors (Allison et al., 2000; Allison et al., 1998; Sankaranarayanan et al., 2003;
Schoch et al., 2002; Zhang and Benson, 2001).

89
Chapter 5
Rapid GABAergic synapse formation in hypothalamic neurons
5.1 Introduction
5.1.1 GABAergic synapse formation
Synapse formation consists of a series of pre- and postsynaptic events and the
collaborations between them. During the past several years, the study of central synapse
formation has been mostly focusing on excitatory glutamatergic synapse formation in
hippocampal or cortical neurons (Ahmari et al., 2000; Fletcher et al., 1994; Friedman et
al., 2000; Waites et al., 2005; Ziv and Garner, 2004). However, it is not clear whether
inhibitory GABAergic synapse formation share the same rules which have been found in
glutamatergic synaptogenesis or not. Studying the molecular mechanisms of GABAergic
synapse formation is crucial to understand how brain network forms and is
homeostatically adjusted during development.
GABA is the major type of inhibitory neurotransmitter in central nervous system.
However, during early brain development, it functions as an excitatory molecule, which
may act as a growth factor to modulate developmental processes including
synaptogenesis and neural circuit formation (Behar et al., 1996; Ben-Ari, 2002; Ben-Ari

90
et al., 1989; Chen et al., 1996; LoTurco et al., 1995; Owens and Kriegstein, 2002).
GABAergic neurotransmission in CNS plays a critical role in neural circuit formation and
maintenance in immature neurons (Craig and Boudin, 2001; Hensch and Fagiolini, 2005;
Luscher and Keller, 2004; Moss and Smart, 2001). It has been suggested that GABA
signaling emerges very early during neuronal development (Nguyen et al., 2001). During
early brain developmental, GABAergic synapses have been found appearing earlier than
glutamatergic synapses. However, compared to glutamatergic synapses, the molecular
mechanism underlying GABAergic synaptogenesis is not well understood (Hennou et al.,
2002; Khazipov et al., 2001; Tyzio et al., 1999).
5.1.2 BDNF signaling pathway
Brain-derived neurotrophic factor (BDNF) is a neurotrophic factor found in both
the brain and the periphery nervous system. BDNF plays an important role in synaptic
plasticity and synapse development. BDNF participates in Ca2+ homeostasis by adjusting
plasma membrane depolarization at both pre- and postsynaptic sites. In presynaptic
terminals, BDNF can enhance excitatory synaptic transmission. It has been suggested that
application of BDNF could enhance glutamatergic EPSCs in both hippocampal cultured
neurons (Berninger et al., 1999; Lessmann et al., 1994; Levine et al., 1995; Li et al., 1998;
Schinder et al., 2000) and slices (Tyler and Pozzo-Miller, 2001), probably due to an
enhancement in synaptic vesicle docking by BDNF (Tyler and Pozzo-Miller, 2001).
Moreover, in hippocampal slices, BDNF could selectively enhance evoked FM1-43
91
destaining (Tyler et al., 2006). On the other side, studies in cultured hippocampal neurons
revealed that BDNF was capable of enhancing GABAergic inhibitory synaptic
transmission. BDNF treatment increased the number of presynaptic P/Q and N-type
channels but not postsynaptic L-type channels (Baldelli et al., 2000; Baldelli et al., 2002),
thus the enhancement of GABAergic transmission by BDNF seemed to be mediated by
presynaptic Ca2+ signaling and not related with the RRP (Baldelli et al., 2005).
BDNF can also increase spine density in CA1 pyramidal neurons, which can be
blocked by the Trk inhibitor K252a (Alonso et al., 2004; Tyler and Pozzo-Miller, 2001).
In addition, BDNF particularly increased the proportion of stubby spines (Type-I) (Tyler
and Pozzo-Miller, 2003). Even when synaptic transmission was abolished by Botulinum
neurotoxin C which could cleave t-SNARE proteins, BDNF was still capable of inducing
spine formation.
In vivo study showed that mice born without the ability to make BDNF suffered
developmental defects in the brain and sensory nervous system, and usually died soon
after birth, suggesting that BDNF is crucial in normal neural development.
BDNF signaling is mediated by two types of receptors: the p75 neurotrophin
receptor (p75NTR) and TrkB receptor tyrosine kinase (Huang et al., 2003; Kaplan and
Miller, 2000). So far, almost all the synaptic effects of BDNF we have known are through

92
binding to TrkB. BDNF binding to TrkB triggers TrkB dimerization and a following
autophosphorylation of tyrosine residue in its intracellular domain, and subsequently
leading to the activation of three major signaling pathways: 1) mitogen-activated protein
kinase (MAPK); 2) phosphatidylinositol 3-kinase (PI3K) and 3) phospholipase C (PLC)
(Nagappan and Lu, 2005).
5.1.3 Summary
In this study, we compared the temporal sequence of GABAergic and
glutamatergic synapse formation within the first few days after plating embryonic
hypothalamic neurons in culture and investigated the role of BDNF signaling pathway in
GABAergic synaptogenesis. We found that despite a large majority of glutamatergic
neurons (~60%) in the hypothalamic cultures, the establishment of functional
glutamatergic synapses always lags behind GABAergic synaptogenesis in the embryonic
neurons. Whole-cell current recording revealed that the priority of GABAergic
synaptogenesis is like due to a lack of expression of functional glutamate receptors at
postsynaptic part. Besides, functional studies through patch clamp recording suggested
that the BDNF contributes to GABAergic synapse formation in rat hypothalamic culture
preferentially through affecting presynaptic GABA release.

93
5.2 Methods
5.2.1 Primary hippocampal culture
Brains from newborn Sprague-Dawley rats were removed and placed in ice-cold
modified Hank’s balanced salt solution (HBSS). The hippocampal CA1–CA3 region was
dissected, cut into ~1mm3 cubes and incubated with 0.05% trypsin–EDTA in HBSS for
30 min at 37°C. After trypsin treatment, tissue blocks were triturated with HBSS with
10% horse serum, and dissociated cells were plated onto a monolayer of astrocytes. The
culture medium contained 500 ml MEM (Gibco), 5% fetal bovine serum (Hyclone,
Logan, Utah, USA), 10 ml B27 (Invitrogen, Carlsbad, California, USA), 100 mg
NaHCO3, 20 mM D-glucose, 0.5 mM L-glutamine, and 25 U/ml penicillin/streptomycin.
Culture medium containing 4 µM AraC to stop glial proliferation was replaced three
times in the first week and cultures were maintained in a 5% CO2 incubator for 2–3
weeks. The neonatal pups (P0–P1) were decapitated and the adult rats were killed with
CO2 according to the animal protocols approved by IACUC committee in Pennsylvania
State University and conforming with the federal guidelines.
5.2.2 Electrophysiology
Whole-cell recordings were performed in voltage clamp mode using a
MultiClamp 700A amplifier (Molecular Devices, Union City, CA) (Deng and Chen,
2003). The recording chamber was continuously perfused with a bath solution consisting

94
of (in mM) 128 NaCl, 30 glucose, 25 HEPES, 5 KCl, 2 CaCl2, 1 MgCl2, pH 7.3, with
NaOH, via a Warner (Hamden, CT) VC-6 drug delivery system. Spontaneous EPSCs and
IPSCs were recorded in absence of TTX. To record miniature IPSCs (mIPSCs), TTX (0.5
µM) and CNQX (10 µM) were added into the bath solution to block action potentials and
glutamatergic events. Patch pipettes were pulled from borosilicate glass and had
resistances of 2–4 MΩ when filled with internal pipette solution, which consisted of the
following (in mM): 135 KCl, 10 Tris-phosphocreatine, 2 EGTA, 10 HEPES, 4 MgATP,
0.5 Na2GTP, pH 7.3, with KOH. The series resistance was typically 10–20 MΩ and
partially compensated by 30–50%. The membrane potential was held at -70 mV. Data
were acquired using pClamp 9 software, sampled at 10 kHz, and filtered at 1 kHz.
Off-line data analysis of mEPSCs was performed using MiniAnalysis software
(Synaptosoft, Decator, GA). Experiments were performed at room temperature. Student’s
t test was used for statistical analysis for mini events.
5.3 Results
5.3.1 Embryonic neurons lack functional glutamate receptors
We examined spontaneous synaptic responses (sPSCs) in normal bath solution
without TTX in pure young embryonic hypothalamic cultures within the first few days
after plating (Fig. 5-1). Despite the absence of TTX, few synaptic events were recorded at

95
1 DIV and all of them were slow decaying GABAergic events (Fig. 5-1A). By 3 DIV,
there were a significant number of sPSCs recorded in some embryonic neurons. The
sPSCs showed two distinct decaying phase, one very slow (τ = 9 – 18 ms, black circle)
and the other very fast (τ = 2 – 5 ms, open triangle) (Fig. 5-1A). The slow events were all
abolished by BIC (20 µM) while the few fast events were blocked by CNQX (10 µM)
(data not shown), indicating that glutamatergic events appeared at 3 DIV. Quantification
of the frequency of sIPSCs versus sEPSCs in the same neurons according to the decaying
time constants were illustrated in Fig. 5-1B. Each data point represents 12 to 16
neurons recorded. Clearly, sIPSCs are far more than sEPSCs in the early days of
embryonic cultures (no sEPSCs at 1 DIV; p<0.02 at 2 DIV; p<0.001 at 3 DIV), despite
more glutamatergic neurons in the hypothalamus.
In order to investigate the expression of glutamate receptors and GABA receptors,
we applied GABA (20 µM) or glutamate (500 µM) to the same neurons to elicit
whole-cell currents. The sequence of application of GABA and glutamate was alternated
in different neurons and no significant effect was observed as to which one was applied
first. While a significant GABA current was recorded in every neuron tested starting from
1 DIV, the glutamate current was almost barely detectable at 1 – 3 DIV (Fig. 5-1C, 3
DIV). Even by 5 DIV, the glutamate current remained very small (100 – 300 pA), almost
10-fold smaller than that of GABA current in the same neurons (Fig. 5-1D). The fact that
the glutamate current was still very small at 3 – 5 DIV suggests that the expression level

96
Figure 5-1. Lack of functional glutamate receptors and a delay of glutamatergic synapse formation in embryonic neurons. A, Spontaneous synaptic currents recorded in pure young cultures within the first 3 days after plating. Both sEPSCs and sIPSCs were recorded at 3 DIV. No TTX was included in the recording solution. B, Quantification of the frequency of sIPSCs versus that of sEPSCs showed much less glutamatergic responses comparing to GABAergic responses. n = 12 – 16 for each data point. C, Typical recording of whole-cell currents induced by GABA (20 µM) versus glutamate (500 µM) in embryonic neurons (3 DIV). Note the tiny current induced by glutamate application. D,Developmental changes of the peak amplitude of glutamate currents (black circle) versus GABA currents (open circle).

97
of AMPA receptors is likely very low in the embryonic neurons. Therefore, lack of
functional glutamate receptors may at least be one of the major causes for the lack of
functional glutamatergic transmission in the early stage of embryonic neurons.
5.3.2 Application of TrkB antagonist abonished early GABAergic synaptogenesis
BDNF takes effects through activating Trk B. We investigated the role of BDNF
in GABAergic synapse formation through blocking the activation of Trk B. we applied
K252a, a Trk antagonist, to embryonic hypothalamic cultures at 200 nM on 2-3 DIV, and
at 100 nM from 4 DIV to 7 DIV. We examined miniature inhibitory synaptic responses
(mIPSCs) in normal bath solution with TTX (0.5 µM) plus CNQX (10 µM) in pure
young embryonic hypothalamic cultures on 4, 6 and 8 DIV after plating (Fig. 5-2A). As a
side-by-side control, we did patch clamping recording of mIPSCs on normal embryonic
hypothalamic neurons which was cultured together with K252a treated neurons but
without any drug treatment. Quantification of the frequency and amplitude of mIPSCs in
control and K252a treated neurons according to the neuronal age were illustrated in Fig.
5-8B & 8C. Each data point represents 15 to 18 neurons recorded. At every data point,
the mIPSC frequency of K252a treated neurons was significantly lower than that of
control neurons (p<0.04 at 4 DIV, p<0.05 at 6 DIV, p<0.03 at 8 DIV). And from 4 DIV to
8 DIV, the mIPSC frequency of K252a treated neurons grew 3-fold slower than control
group (Fig. 5-2B). The mIPSC amplitude of the K252a treated neurons was significantly
lower than that of control neurons (p<0.03 at 4 DIV, p<0.01 at 8 DIV; Fig. 5-2C).

98
Figure 5-2. BDNF derived synapse formation is through the activation of tyrosine kinase receptors. A, Diagram showing the experimental protocol. Trk antagonist K252a was applied at 200 nM at 2 & 3 DIV, then at 100 nM from 4-7 DIV. mIPSCs were recorded at 4, 6 & 8 DIV. B, Frequency of mIPSCs recorded at 4, 6 & 8 DIV in culture in the presence of TTX (0.5 µM) and CNQX 10 µM) in control neurons (open circle) and K252a treated neurons (black circle). At every data point, the mIPSC frequency of K252a treated neurons was significantly lower than that of control neurons (p<0.04 at 4 DIV, p<0.05 at 6 DIV, p<0.03 at 8 DIV). And from 4 DIV to 8 DIV, the mIPSC frequency of K252a treated neurons grew 3-fold slower than control group. C, Amplitude of mIPSC in control neurons (open circle) and K252a treated neurons (black circle). The mIPSC amplitude of the K252a treated neurons was significantly lower than that of control neurons (p<0.03 at 4 DIV, p<0.01 at 8 DIV).

99
Therefore, in rat hypothalamic neurons, BDNF regulates synapse formation probably
through the activation of tyrosine kinase receptors.
5.4 Discussion
Although there are more glutamatergic neurons (60%) than GABAergic neurons
(40%) in the hypothalamus, our study demonstrated that in the same early dissociated
neuron, the glutamatergic synapse formation significantly lags behind GABAergic
synapse formation. It has been suggested that even in hippocampus where 90% of the
total synapses are glutamatergic synapses, there still appears to be a sequential formation
of GABAergic synapses and then glutamatergic synapses during embryonic and early
postnatal brain development (Hennou et al., 2002; Khazipov et al., 2001; Tyzio et al.,
1999). Therefore, the molecular mechanisms underlying the assembly of GABAergic
synapses may be quite different from that of glutamatergic synapse assembly. Not like the
remarkable expression of functional GABAA receptors in newly dissociated embryonic
neurons, the expression level of glutamate receptors is too low, even after 3 – 5 days of
culture. In accordance with previous research, our finding about the low level of
glutamate receptors in embryonic neurons confirmed that the postsynaptic development
of glutamatergic synapse formation may be a slow process, (Ahmari et al., 2000; Fletcher
et al., 1994; Friedman et al., 2000). In recent years, the studies on postsynaptic silent

100
synapses, which show only activity of NMDA receptors but not that of AMPA receptors,
have also been reported in the developing brain (Durand et al., 1996; Isaac et al., 1997;
Liao et al., 1995; Wu et al., 1996), further supporting the delay in the development of
functional glutamatergic postsynaptic apparatus. If the presynaptic development of
GABAergic and glutamatergic synapses would take a similar time course, an earlier
functional GABAergic synapses than the glutamatergic synapses would be expected to
appear.
For glutamatergic synapse formation within the first several days after plating,
glutamatergic presynaptic terminals start to be functional at 3 DIV, because
electrophysiological recording revealed spontaneous glutamate release at 3 DIV. However,
the whole-cell glutamate current remained very small at 3 DIV, indicating a delayed
expression of glutamate receptors on membrane surface. It also raises a possibility that
because of a very limited pool of functional glutamate receptors at the early
developmental stage, the glutamate receptors will likely cluster underneath presynaptic
glutamatergic nerve terminals. In contrast, since there is an ample supply of functional
GABAA receptors in embryonic neurons, there appears to be a significant amount of
GABAA receptors targeted to extrasynaptic membranes. These extrasynaptic GABAA
receptors may or may not have the same subunit compositions as those of synaptic ones
and may conduct different functions as well, such as mediating tonic inhibition or
actually tonic excitation in the early developmental stage.

101
Brain derived neurotrophic factor (BDNF) has been suggested to play crucial
roles in synapse development and synaptic plasticity. BDNF takes effect largely through
the activation of TrkB. Our study demonstrated that GABAergic synapse formation was
significantly delayed without the participation of BDNF signaling cascade. BDNF
regulates GABAergic synapse formation through the activation of TrkB receptors. Patch
clamp recording showed a significant reduction of frequency of miniature GABAergic
IPSC, indicating BDNF signaling pathway contributes to the presynaptic assembly of
GABAergic synapses. Electrophysiological analysis suggested that inhibition of TrkB
activity led to a decrease in the amplitude of GABAergic mIPSC. This might indicate that
TrkB activity was important for postsynaptic GABA receptor expression, because
downstream blocking TRPC-mediated cation conductance could not induce similar effect.
On the other hand, it could also be explained by that the inhibition of TrkB activity
reduced the amount of GABA released from presynaptic terminals and thus activates less
postsynaptic GABA receptors. On the other side, more work is needed to find out the real
mechanisms underlying the difference between the fast expression of GABA receptors
and the slow expression of glutamate receptors.
In summary, our findings suggest a significant difference in the time course of
GABAergic versus glutamatergic synapse formation during embryonic development.
This may be critical in establishing proper brain structures. In addition, our work revealed

102
an important role of BDNF signaling pathway in the GABAergic synaptogenesis, that the
presynaptic assembly of new GABAergic synapses is dependent on TrkB activation.

103
Chapter 6
Effects of cyclothiazide on GABAergic synaptic transmission
6.1 Introduction
Epileptiform activity is a special form of neuronal activity, characterized by
recurrent abnormally synchronized bursting activities (Prince and Connors, 1986).
Typical seizure bursts are consisted of paroxysmal depolarization shift (PDS) with
overriding action potentials. It has been suggested that the epileptoform activity could be
largely caused by the imbalance between GABAergic inhibition and glutamatergic
excitation (Clark and Wilson, 1999; Dalby and Mody, 2001; Jones-Davis and Macdonald,
2003).
GABAA receptors are the major type of GABA receptors in the brain, and mediate
the majority of GABAergic inhibition (Mody, 2005). Gene mutations in GABAA receptor
subunits or GABAA receptor trafficking proteins have been linked to familial inherited
epilepsy in humans (Bianchi et al., 2002; Cossette et al., 2002; Dibbens et al., 2004;
Harkin et al., 2002; Harvey et al., 2004; Wallace et al., 2001). Quantitative
immunohistochemical studies have revealed GABAA receptor changes in temporal lobe
epilepsy (TLE) in human brain tissues (Loup et al., 2000). The animal model studies also

104
suggested that the GABAA receptor expression and function in hippocampal neurons are
involved in the temporal lobe epilepsy (TLE) of animal brains (Brooks-Kayal et al., 1998;
Tsunashima et al., 1997). These findings indicate the important role of GABAergic
function in epilepsy.
Both synaptic and extrasynaptic sites have abundant GABAA receptors. Synaptic
GABAA receptors have low affinity for GABA and primarily mediate fast inhibitory
transmission also known as phasic inhibition, whereas extrasynaptic GABAA receptors
exhibit high affinity for GABA and mediate tonic inhibition (Mody and Pearce, 2004;
Semyanov et al., 2004). It has been suggested that deleting extrasynaptic GABAA
receptors could significantly decrease tonic GABA current but not phasic GABA currents
(Brickley et al., 2001; Caraiscos et al., 2004; Stell et al., 2003), and could subsequently
results in a enhancement of neuronal excitability. These results suggested that
extrasynaptic GABAA receptors might be important for learning and memory (Hamann et
al., 2002; Mody, 2005; Semyanov et al., 2003).
However, comparing with the well-characterized synaptic GABAergic inhibition,
tonic inhibition is much less understood. For instance, it has been well known that
alteration of synaptic GABAergic inhibition plays a critical role during epileptogenesis
(Sperk et al., 2004), but whether regulation of tonic inhibition plays any role is not clear
(Richerson, 2004). Houser and Esclapez (2003) first reported that immunostaining of

105
extrasynaptic α5 subunit-containing GABAA receptors was significantly reduced in
hippocampus of the pilocarpine-induced rat model of TLE. Expression of δ
subunit-containing extrasynaptic GABAA receptors in the dentate gyrus was similarly
reduced in the same model (Peng et al., 2004).
Cyclothiazide (CTZ) is widely used to block AMPA receptor desensitization
(Partin et al., 1993; Trussell et al., 1993; Yamada and Tang, 1993; Zorumski et al., 1993).
Recent study suggested that CTZ may also be capable of inhibiting GABAA receptors
(Deng and Chen, 2003). Therefore, CTZ could exert dual effects in both enhancing
glutamatergic transmission and depressing GABAergic transmission, and could
subsequently result in hyperexcitation.
In this project, we further analysed changes in GABAA receptor function
associated with epileptiform activity induced by chronic CTZ treatment. Irrespective of
the stimulation protocol, Dr. Jinshun Qi found that epileptiform activity of cultured
hippocampal neurons was associated with a significant reduction of the whole-cell
GABA currents and the frequency of mIPSCs. However, the amplitude of mIPSCs
mediated by synaptic GABAA receptors was not altered. My immunocytochemical
analysis confirmed that the GABAergic presynaptic marker GAD6-labeled puncta
density remained largely unaffected by epileptogenic stimulation. Therefore, combining
Dr. Qi’s and my work, it is suggested that extrasynaptic GABAA receptors exhibit a

106
heightened functional vulnerability to epileptogenic stimulation, and suggest that
downregulation of tonic GABA currents may contribute to epileptogenesis.
6.2 Methods
6.2.1 Primary hippocampal culture
The hippocampal culture is similarly prepared as described at 2.1.3.
6.2.2 Immunofluorescent staining and quantification
Neurons were washed with PBS, fixed in 4% paraformaldehyde for 12 min and
permeabilized for 5 min with 0.2% Triton X-100 in PBS containing 10% donkey serum.
The primary antibodies mAb SV2 (1 : 2000) and GAD65 (1 : 75, Developmental Studies
Hybridoma Bank, University of Iowa, Iowa City, IA, USA) were used to label total and
GABAergic nerve terminals, respectively, and developed with CY3-conjugated donkey
antimouse secondary antibody (Jackson ImmunoResearch, West Grove, PA, USA; 1 :
500). Fluorescence images were captured with an ORCA-100 camera on a Zeiss
Axiophot 2 microscope equipped with a ×40, 1.3 NA objective and controlled by
Openlab software (Improvision Inc., Lexington, MA, USA). For quantification of
presynaptic bouton numbers, immunoreactive puncta for glutamic acid decarboxylase
(GAD) or the general presynaptic marker SV2 along ~100 µm dendrite per neuron were
107
analysed using SimplePCI software (Compix Inc., Cranberry, PA, USA), as previously
described (Chen et al., 2003). Synaptic density determined by the number of puncta per
100 µm dendrite was compared between different experimental groups.
6.3 Results
In Dr. Jinshun Qi’s work, he first confirmed that Cyclothiazide stimulation could
elicit robust epileptiform activity in hippocampal cultures. Then he found that Chronic
CTZ treatment reduced presynaptic GABA release but not postsynaptic GABAA receptor
responses (Fig. 6-1). The unaltered mIPSC amplitude suggests that the postsynaptic
GABAA receptors are relatively intact, while the significant change of the mIPSC
frequency indicates presynaptic alterations in CTZ-pretreated neurons.
The significant decrease of mIPSC frequency after CTZ pretreatment may be
caused by a reduction of the number of GABAergic synapses or by a decrease of the
presynaptic release probability at each individual synapse. To assess possible changes in
the number of GABAergic synapses, we performed immunofluorescent stainings of
CTZ-pretreated and control neurons with GAD, a widely used marker for GABAergic
synapses. The number of GAD-immunoreactive puncta of CTZ-pretreated neurons (29.6
± 2.1 per 100 µm dendrite, n =14 cells) was indistinguishable from that of controls (26.9

108
Figure 6-1. Chronic CTZ treatment results in a significant decrease of the frequency but not the amplitude of miniature IPSCs. A, B, consecutive current traces illustrating mIPSCs recorded in the presence of TTX (0.5 µM) and CNQX (20 µM) in control (A) and CTZ-pretreated (B) neurons. The frequency of mIPSCs was considerably lower in CTZ-pretreated neurons. Throughout the experiments, holding potential=−70 mV. C, bar graphs showing that the average mIPSC frequency was significantly decreased after CTZ pretreatment (control, 1.33 ± 0.09 Hz; CTZ pretreatment, 0.59 ± 0.05 Hz; p < 0.001). D,bar graphs showing that the average mIPSC amplitude was similar between control (22.3 ± 1.7 pA) and after CTZ pretreatment (20.0 ± 1.6 pA; p > 0.3).

109
Figure 6-2. CTZ treatment does not affect the number of GABAergic synapses. A, B,fluorescence images of GAD immunostaining showing no obvious changes in the numberof GABAergic synapses between control (A) and after CTZ treatment (B). Scale bar, 10 µm. C, quantified data indicating a similar number of GABAergic synapses per 100 µm dendritic length in control (26.9 ± 1.7, n = 14) and after chronic CTZ treatment (29.6 ± 2.1, n = 14) (p > 0.3).
110
± 1.7, n =14; P >0.3) (Fig. 6-2 A–C). Similarly punctuate immunoreactivity for the
general presynaptic marker SV2 was unchanged in CTZ-pretreated neurons (42.7 ± 3.2; n
=11) compared to controls (40.8 ± 3.0; n =13; P >0.6). These experiments suggest that
the number of GABAergic and glutamatergic synapses remained unchanged in
CTZ-pretreated neurons. Therefore, the reduction in the frequency of mIPSCs of
CTZ-pretreated neurons is probably due to a decrease in the GABA release probability.
Our results are consistent with previous findings showing that the quantal release of
GABA was reduced in the hippocampal CA1 region of a rodent TLE model (Hirsch et al.,
1999).
6.4 Discussion
TLE study in animal models has revealed a series change of GABAergic activity
during epileptogenesis, including GABAergic interneuron death, downregulation of
presynaptic GABA release and postsynaptic GABAA receptor activity (Gibbs et al.,
1997a; Brooks-Kayal et al., 1998; Hirsch et al., 1999; Kobayashi and Buckmaster, 2003;
Kobayashi et al., 2003; Leroy et al., 2004; Macdonald et al., 2004; Dzhala et al., 2005;
Mody, 2005). Tonic GABA inhibition was more recently identified in cerebellar granule
cells and hippocampal neurons (Bai et al., 2001; Brickley et al., 1996; Kaneda et al., 1995;
Nusser and Mody, 2002). Comparing with the well-characterized synaptic GABAergic

111
inhibition, tonic inhibition is much less understood. It is still not clear whether regulation
of tonic inhibition plays any role in epileptogenesis (Richerson, 2004). It was recently
reported that a slight reduction of tonic GABA currents may result in significant increase
in neuronal activity (Mitchell and Silver, 2003; Semyanov et al., 2003). Our results
indicate that a minimal level of tonic inhibition may be essential for the homeostatic
maintenance of neural networks. Decrease of tonic inhibition may induce a pathological
epileptiform activity. This result is consistent with a recent finding that the GABAA
receptor α5 and δ subunits is significantly reduced in the hippocampus of animal TLE
models (Houser and Esclapez, 2003; Peng et al., 2004), since GABAA receptors
containing α5 or δ subunits are probably localized at extrasynaptic sites (Brunig et al.,
2002; Crestani et al., 2002; Hamann et al., 2002; Nusser et al., 1998b; Wei et al., 2003).
Our study revealed that extrasynaptic GABAA receptors are downregulated by
chronic epileptogenic stimulation, while GABAergic synapses are relatively stable. Until
today, little is known about that relationship between tonic inhibition and synaptic
inhibition during epileptogenesis. On the otherside, in dentate gyrus, an inconsistent
increase of GABAergic inhibition has been found during epileptogenesis. Therefore,
GABAergic activity during epileptogenesis is quite complicated. It is possible that the
synaptic and extrasynaptic GABAA receptor modulation occurs at different time stage
after epileptogenic stimulation. It was found that in dentate granule cells, GABAergic
inhibition decreased in 3–7 days after pilocarpine-induced status epilepticus (Kobayashi

112
and Buckmaster, 2003), but increased after 30–45 days in fully kindled epileptic rats
(Nusser et al., 1998a). Many previous studies on GABAergic synaptic inhibition are
conducted over a long-term timescale, from weeks to months after epileptogenesis in
animal models (Buckmaster and Jongen-Relo, 1999; Kobayashi et al., 2003; Nusser et al.,
1998a; Sperk et al., 2004), whereas our study of the downregulation of extrasynaptic
GABAA receptors was detected within 48 hrs. Another possibility is that changes in
GABAergic inhibition may be cell type-specific after epileptogenic stimulation. For
example, it has been demonstrated that the whole-cell GABAA receptor currents
decreased in CA1 pyramidal neurons but increased in dentate gyrus granule cells (Gibbs
et al., 1997). The third possibility is that the in vitro studies may not mimic in vivo
epileptogenesis.
In summary, our work revealed the relationship between changes of tonic GABA
currents and epileptogenesis. The downregulation of tonic inhibition not only affects
normal homeostatic activity among neural networks, but also may have pathological
consequences.

113
Bibliography
Abel, T., Nguyen, P. V., Barad, M., Deuel, T. A., Kandel, E. R., and Bourtchouladze, R.
(1997). Genetic demonstration of a role for PKA in the late phase of LTP and in
hippocampus-based long-term memory. Cell 88, 615-626.
Ackermann, M., and Matus, A. (2003). Activity-induced targeting of profilin and
stabilization of dendritic spine morphology. Nat Neurosci 6, 1194-1200.
Ahmari, S. E., Buchanan, J., and Smith, S. J. (2000). Assembly of presynaptic active
zones from cytoplasmic transport packets. Nat Neurosci 3, 445-451.
Allison, D. W., Chervin, A. S., Gelfand, V. I., and Craig, A. M. (2000). Postsynaptic
scaffolds of excitatory and inhibitory synapses in hippocampal neurons:
maintenance of core components independent of actin filaments and microtubules.
J Neurosci 20, 4545-4554.
Allison, D. W., Gelfand, V. I., Spector, I., and Craig, A. M. (1998). Role of actin in
anchoring postsynaptic receptors in cultured hippocampal neurons: differential
attachment of NMDA versus AMPA receptors. J Neurosci 18, 2423-2436.
Alonso, M., Medina, J. H., and Pozzo-Miller, L. (2004). ERK1/2 activation is necessary
for BDNF to increase dendritic spine density in hippocampal CA1 pyramidal
neurons. Learn Mem 11, 172-178.
Altrock, W. D., tom Dieck, S., Sokolov, M., Meyer, A. C., Sigler, A., Brakebusch, C.,
Fassler, R., Richter, K., Boeckers, T. M., Potschka, H., et al. (2003). Functional

114
inactivation of a fraction of excitatory synapses in mice deficient for the active
zone protein bassoon. Neuron 37, 787-800.
Ampe, C., Markey, F., Lindberg, U., and Vandekerckhove, J. (1988). The primary
structure of human platelet profilin: reinvestigation of the calf spleen profilin
sequence. FEBS Lett 228, 17-21.
Antonov, I., Antonova, I., Kandel, E. R., and Hawkins, R. D. (2001). The contribution of
activity-dependent synaptic plasticity to classical conditioning in Aplysia. J
Neurosci 21, 6413-6422.
Artalejo, C. R., Henley, J. R., McNiven, M. A., and Palfrey, H. C. (1995). Rapid
endocytosis coupled to exocytosis in adrenal chromaffin cells involves Ca2+, GTP,
and dynamin but not clathrin. Proc Natl Acad Sci U S A 92, 8328-8332.
Bading, H., Ginty, D. D., and Greenberg, M. E. (1993). Regulation of gene expression in
hippocampal neurons by distinct calcium signaling pathways. Science 260,
181-186.
Bagri, A., and Tessier-Lavigne, M. (2002). Neuropilins as Semaphorin receptors: in vivo
functions in neuronal cell migration and axon guidance. Adv Exp Med Biol 515,
13-31.
Bai, D., Zhu, G., Pennefather, P., Jackson, M. F., MacDonald, J. F., and Orser, B. A.
(2001). Distinct functional and pharmacological properties of tonic and quantal
inhibitory postsynaptic currents mediated by gamma-aminobutyric acid(A)
receptors in hippocampal neurons. Mol Pharmacol 59, 814-824.

115
Bailey, C. H., Bartsch, D., and Kandel, E. R. (1996). Toward a molecular definition of
long-term memory storage. Proc Natl Acad Sci U S A 93, 13445-13452.
Baldelli, P., Forni, P. E., and Carbone, E. (2000). BDNF, NT-3 and NGF induce distinct
new Ca2+ channel synthesis in developing hippocampal neurons. Eur J Neurosci
12, 4017-4032.
Baldelli, P., Hernandez-Guijo, J. M., Carabelli, V., and Carbone, E. (2005). Brain-derived
neurotrophic factor enhances GABA release probability and nonuniform
distribution of N- and P/Q-type channels on release sites of hippocampal
inhibitory synapses. J Neurosci 25, 3358-3368.
Baldelli, P., Novara, M., Carabelli, V., Hernandez-Guijo, J. M., and Carbone, E. (2002).
BDNF up-regulates evoked GABAergic transmission in developing hippocampus
by potentiating presynaptic N- and P/Q-type Ca2+ channels signalling. Eur J
Neurosci 16, 2297-2310.
Ballweber, E., Hannappel, E., Huff, T., Stephan, H., Haener, M., Taschner, N., Stoffler, D.,
Aebi, U., and Mannherz, H. G. (2002). Polymerisation of chemically cross-linked
actin:thymosin beta(4) complex to filamentous actin: alteration in helical
parameters and visualisation of thymosin beta(4) binding on F-actin. J Mol Biol
315, 613-625.
Bamburg, J. R. (1999). Proteins of the ADF/cofilin family: essential regulators of actin
dynamics. Annu Rev Cell Dev Biol 15, 185-230.
Bamji, S. X., Shimazu, K., Kimes, N., Huelsken, J., Birchmeier, W., Lu, B., and

116
Reichardt, L. F. (2003). Role of beta-catenin in synaptic vesicle localization and
presynaptic assembly. Neuron 40, 719-731.
Bear, M. F. (1999). Homosynaptic long-term depression: a mechanism for memory? Proc
Natl Acad Sci U S A 96, 9457-9458.
Behar, T. N., Li, Y. X., Tran, H. T., Ma, W., Dunlap, V., Scott, C., and Barker, J. L. (1996).
GABA stimulates chemotaxis and chemokinesis of embryonic cortical neurons
via calcium-dependent mechanisms. J Neurosci 16, 1808-1818.
Ben-Ari, Y. (2002). Excitatory actions of GABA during development: the nature of the
nurture. Nat Rev Neurosci 3, 728-739.
Ben-Ari, Y., Cherubini, E., Corradetti, R., and Gaiarsa, J. L. (1989). Giant synaptic
potentials in immature rat CA3 hippocampal neurones. J Physiol 416, 303-325.
Benson, D. L., and Tanaka, H. (1998). N-cadherin redistribution during synaptogenesis in
hippocampal neurons. J Neurosci 18, 6892-6904.
Berninger, B., Schinder, A. F., and Poo, M. M. (1999). Synaptic reliability
correlates with reduced susceptibility to synaptic potentiation by brain-derived
neurotrophic factor. Learn Mem 6, 232-242.
Betz, W. J., and Bewick, G. S. (1992). Optical analysis of synaptic vesicle recycling at the
frog neuromuscular junction. Science 255, 200-203.
Bianchi, M. T., Song, L., Zhang, H., and Macdonald, R. L. (2002). Two different
mechanisms of disinhibition produced by GABAA receptor mutations linked to
epilepsy in humans. J Neurosci 22, 5321-5327.

117
Biederer, T., Sara, Y., Mozhayeva, M., Atasoy, D., Liu, X., Kavalali, E. T., and Sudhof, T.
C. (2002). SynCAM, a synaptic adhesion molecule that drives synapse assembly.
Science 297, 1525-1531.
Bito, H., Deisseroth, K., and Tsien, R. W. (1996). CREB phosphorylation and
dephosphorylation: a Ca(2+)- and stimulus duration-dependent switch for
hippocampal gene expression. Cell 87, 1203-1214.
Bloom, O., Evergren, E., Tomilin, N., Kjaerulff, O., Low, P., Brodin, L., Pieribone, V. A.,
Greengard, P., and Shupliakov, O. (2003). Colocalization of synapsin and actin
during synaptic vesicle recycling. J Cell Biol 161, 737-747.
Bolshakov, V. Y., Golan, H., Kandel, E. R., and Siegelbaum, S. A. (1997). Recruitment of
new sites of synaptic transmission during the cAMP-dependent late phase of LTP
at CA3-CA1 synapses in the hippocampus. Neuron 19, 635-651.
Bozdagi, O., Shan, W., Tanaka, H., Benson, D. L., and Huntley, G. W. (2000). Increasing
numbers of synaptic puncta during late-phase LTP: N-cadherin is synthesized,
recruited to synaptic sites, and required for potentiation. Neuron 28, 245-259.
Braunewell, K. H., and Manahan-Vaughan, D. (2001). Long-term depression: a cellular
basis for learning? Rev Neurosci 12, 121-140.
Bresler, T., Ramati, Y., Zamorano, P. L., Zhai, R., Garner, C. C., and Ziv, N. E. (2001).
The dynamics of SAP90/PSD-95 recruitment to new synaptic junctions. Mol Cell
Neurosci 18, 149-167.
Brickley, S. G., Cull-Candy, S. G., and Farrant, M. (1996). Development of a tonic form
118
of synaptic inhibition in rat cerebellar granule cells resulting from persistent
activation of GABAA receptors. J Physiol 497 ( Pt 3), 753-759.
Brickley, S. G., Farrant, M., Swanson, G. T., and Cull-Candy, S. G. (2001). CNQX
increases GABA-mediated synaptic transmission in the cerebellum by an
AMPA/kainate receptor-independent mechanism. Neuropharmacology 41,
730-736.
Brooks-Kayal, A. R., Shumate, M. D., Jin, H., Rikhter, T. Y., and Coulter, D. A. (1998).
Selective changes in single cell GABA(A) receptor subunit expression and
function in temporal lobe epilepsy. Nat Med 4, 1166-1172.
Brunig, I., Suter, A., Knuesel, I., Luscher, B., and Fritschy, J. M. (2002). GABAergic
terminals are required for postsynaptic clustering of dystrophin but not of
GABA(A) receptors and gephyrin. J Neurosci 22, 4805-4813.
Buckmaster, P. S., and Jongen-Relo, A. L. (1999). Highly specific neuron loss preserves
lateral inhibitory circuits in the dentate gyrus of kainate-induced epileptic rats. J
Neurosci 19, 9519-9529.
Calakos, N., and Scheller, R. H. (1996). Synaptic vesicle biogenesis, docking, and fusion:
a molecular description. Physiol Rev 76, 1-29.
Calverley, R. K., and Jones, D. G. (1990). Contributions of dendritic spines and
perforated synapses to synaptic plasticity. Brain Res Brain Res Rev 15, 215-249.
Caraiscos, V. B., Elliott, E. M., You-Ten, K. E., Cheng, V. Y., Belelli, D., Newell, J. G.,
Jackson, M. F., Lambert, J. J., Rosahl, T. W., Wafford, K. A., et al. (2004). Tonic

119
inhibition in mouse hippocampal CA1 pyramidal neurons is mediated by alpha5
subunit-containing gamma-aminobutyric acid type A receptors. Proc Natl Acad
Sci U S A 101, 3662-3667.
Carlier, M. F., Didry, D., Erk, I., Lepault, J., Van Troys, M. L., Vandekerckhove, J.,
Perelroizen, I., Yin, H., Doi, Y., and Pantaloni, D. (1996). Tbeta 4 is not a simple
G-actin sequestering protein and interacts with F-actin at high concentration. J
Biol Chem 271, 9231-9239.
Carlier, M. F., and Pantaloni, D. (1988). Binding of phosphate to F-ADP-actin and role of
F-ADP-Pi-actin in ATP-actin polymerization. J Biol Chem 263, 817-825.
Carninci, P., Kasukawa, T., Katayama, S., Gough, J., Frith, M. C., Maeda, N., Oyama, R.,
Ravasi, T., Lenhard, B., Wells, C., et al. (2005). The transcriptional landscape of
the mammalian genome. Science 309, 1559-1563.
Casella, J. F., and Torres, M. A. (1994). Interaction of Cap Z with actin. The
NH2-terminal domains of the alpha 1 and beta subunits are not required for actin
capping, and alpha 1 beta and alpha 2 beta heterodimers bind differentially to
actin. J Biol Chem 269, 6992-6998.
Castillo, P. E., Weisskopf, M. G., and Nicoll, R. A. (1994). The role of Ca2+ channels in
hippocampal mossy fiber synaptic transmission and long-term potentiation.
Neuron 12, 261-269.
Chang, S., and De Camilli, P. (2001). Glutamate regulates actin-based motility in axonal
filopodia. Nat Neurosci 4, 787-793.

120
Chavis, P., Mollard, P., Bockaert, J., and Manzoni, O. (1998). Visualization of cyclic
AMP-regulated presynaptic activity at cerebellar granule cells. Neuron 20,
773-781.
Cheek, T. R., and Burgoyne, R. D. (1987). Cyclic AMP inhibits both nicotine-induced
actin disassembly and catecholamine secretion from bovine adrenal chromaffin
cells. J Biol Chem 262, 11663-11666.
Chen, G., Trombley, P. Q., and van den Pol, A. N. (1996). Excitatory actions of GABA in
developing rat hypothalamic neurones. J Physiol 494, 451-464.
Chen, Y., Deng, L. B., Maeno-Hikichi, Y., Lai, M. Z., Chang, S. H., Chen, G., and Zhang,
J. F. (2003). Formation of an endophilin-Ca2+ channel complex is critical for
clathrin-mediated synaptic vesicle endocytosis. Cell 115, 37-48.
Choi, S., Klingauf, J., and Tsien, R. W. (2000). Postfusional regulation of cleft glutamate
concentration during LTP at 'silent synapses'. Nat Neurosci 3, 330-336.
Clark, S., and Wilson, W. A. (1999). Mechanisms of epileptogenesis. Adv Neurol 79,
607-630.
Cole, J. C., Villa, B. R., and Wilkinson, R. S. (2000). Disruption of actin impedes
transmitter release in snake motor terminals. J Physiol 525 Pt 3, 579-586.
Colicos, M. A., Collins, B. E., Sailor, M. J., and Goda, Y. (2001). Remodeling of synaptic
actin induced by photoconductive stimulation. Cell 107, 605-616.
Collingridge, G. L., and Bliss, T. V. (1995). Memories of NMDA receptors and LTP.
Trends Neurosci 18, 54-56.

121
Cooper, M. W., and Smith, S. J. (1992). A real-time analysis of growth cone-target cell
interactions during the formation of stable contacts between hippocampal neurons
in culture. J Neurobiol 23, 814-828.
Cossart, P. (2000). Actin-based motility of pathogens: the Arp2/3 complex is a central
player. Cell Microbiol 2, 195-205.
Cossette, P., Liu, L., Brisebois, K., Dong, H., Lortie, A., Vanasse, M., Saint-Hilaire, J. M.,
Carmant, L., Verner, A., Lu, W. Y., et al. (2002). Mutation of GABRA1 in an
autosomal dominant form of juvenile myoclonic epilepsy. Nat Genet 31, 184-189.
Cottrell, J. R., Dube, G. R., Egles, C., and Liu, G. (2000). Distribution, density, and
clustering of functional glutamate receptors before and after synaptogenesis in
hippocampal neurons. J Neurophysiol 84, 1573-1587.
Craig, A. M., and Boudin, H. (2001). Molecular heterogeneity of central synapses:
afferent and target regulation. Nat Neurosci 4, 569-578.
Cramer, L. P., Briggs, L. J., and Dawe, H. R. (2002). Use of fluorescently labelled
deoxyribonuclease I to spatially measure G-actin levels in migrating and
non-migrating cells. Cell Motil Cytoskeleton 51, 27-38.
Crestani, F., Keist, R., Fritschy, J. M., Benke, D., Vogt, K., Prut, L., Bluthmann, H.,
Mohler, H., and Rudolph, U. (2002). Trace fear conditioning involves
hippocampal alpha5 GABA(A) receptors. Proc Natl Acad Sci U S A 99,
8980-8985.
Dalby, N. O., and Mody, I. (2001). The process of epileptogenesis: a pathophysiological

122
approach. Curr Opin Neurol 14, 187-192.
Dalva, M. B., Takasu, M. A., Lin, M. Z., Shamah, S. M., Hu, L., Gale, N. W., and
Greenberg, M. E. (2000). EphB receptors interact with NMDA receptors and
regulate excitatory synapse formation. Cell 103, 945-956.
Dean, C., Scholl, F. G., Choih, J., DeMaria, S., Berger, J., Isacoff, E., and Scheiffele, P.
(2003). Neurexin mediates the assembly of presynaptic terminals. Nat Neurosci 6,
708-716.
Dedova, I. V., Dedov, V. N., Nosworthy, N. J., Hambly, B. D., and dos Remedios, C. G.
(2002). Cofilin and DNase I affect the conformation of the small domain of actin.
Biophys J 82, 3134-3143.
Deisseroth, K., Bito, H., and Tsien, R. W. (1996). Signaling from synapse to nucleus:
postsynaptic CREB phosphorylation during multiple forms of hippocampal
synaptic plasticity. Neuron 16, 89-101.
Deisseroth, K., Heist, E. K., and Tsien, R. W. (1998). Translocation of calmodulin to the
nucleus supports CREB phosphorylation in hippocampal neurons. Nature 392,
198-202.
Deng, L. B., and Chen, G. (2003). Cyclothiazide potently inhibits gamma-aminobutyric
acid type A receptors in addition to enhancing glutamate responses. PNAS 100,
13025-13029.
Dent, E. W., and Gertler, F. B. (2003). Cytoskeletal dynamics and transport in growth
cone motility and axon guidance. Neuron 40, 209-227.
123
Dibbens, L. M., Feng, H. J., Richards, M. C., Harkin, L. A., Hodgson, B. L., Scott, D.,
Jenkins, M., Petrou, S., Sutherland, G. R., Scheffer, I. E., et al. (2004). GABRD
encoding a protein for extra- or peri-synaptic GABAA receptors is a susceptibility
locus for generalized epilepsies. Hum Mol Genet 13, 1315-1319.
Didry, D., Carlier, M. F., and Pantaloni, D. (1998). Synergy between actin
depolymerizing factor/cofilin and profilin in increasing actin filament turnover. J
Biol Chem 273, 25602-25611.
Dillon, C., and Goda, Y. (2005). The actin cytoskeleton: integrating form and function at
the synapse. Annu Rev Neurosci 28, 25-55.
Dobrunz, L. E., and Stevens, C. F. (1997). Heterogeneity of release probability,
facilitation, and depletion at central synapses. Neuron 18, 995-1008.
dos Remedios, C. G., Chhabra, D., Kekic, M., Dedova, I. V., Tsubakihara, M., Berry, D.
A., and Nosworthy, N. J. (2003). Actin binding proteins: regulation of cytoskeletal
microfilaments. Physiol Rev 83, 433-473.
Dunaevsky, A., and Connor, E. A. (2000). F-actin is concentrated in nonrelease domains
at frog neuromuscular junctions. J Neurosci 20, 6007-6012.
Durand, G. M., Kovalchuk, Y., and Konnerth, A. (1996). Long-term potentiation and
functional synapse induction in developing hippocampus. Nature 381, 71-75.
Engert, F., and Bonhoeffer, T. (1999). Dendritic spine changes associated with
hippocampal long-term synaptic plasticity. Nature 399, 66-70.
Fifkova, E., and Delay, R. J. (1982). Cytoplasmic actin in neuronal processes as a

124
possible mediator of synaptic plasticity. J Cell Biol 95, 345-350.
Fischer, M., Kaech, S., Wagner, U., Brinkhaus, H., and Matus, A. (2000). Glutamate
receptors regulate actin-based plasticity in dendritic spines. Nat Neurosci 3,
887-894.
Fisher, J. L., and Macdonald, R. L. (1998). The role of an alpha subtype M2-M3 His in
regulating inhibition of GABAA receptor current by zinc and other divalent
cations. J Neurosci 18, 2944-2953.
Fletcher, T. L., De Camilli, P., and Banker, G. (1994). Synaptogenesis in hippocampal
cultures: evidence indicating that axons and dendrites become competent to form
synapses at different stages of neuronal development. J Neurosci 14, 6695-6706.
Frey, U., Huang, Y. Y., and Kandel, E. R. (1993). Effects of cAMP simulate a late stage of
LTP in hippocampal CA1 neurons. Science 260, 1661-1664.
Friedman, H. V., Bresler, T., Garner, C. C., and Ziv, N. E. (2000). Assembly of new
individual excitatory synapses: time course and temporal order of synaptic
molecule recruitment. Neuron 27, 57-69.
Fukazawa, Y., Saitoh, Y., Ozawa, F., Ohta, Y., Mizuno, K., and Inokuchi, K. (2003).
Hippocampal LTP is accompanied by enhanced F-actin content within the
dendritic spine that is essential for late LTP maintenance in vivo. Neuron 38,
447-460.
Gasparini, S., Saviane, C., Voronin, L. L., and Cherubini, E. (2000). Silent synapses in
the developing hippocampus: lack of functional AMPA receptors or low

125
probability of glutamate release? Proc Natl Acad Sci U S A 97, 9741-9746.
Geinisman, Y., de Toledo-Morrell, L., Morrell, F., Heller, R. E., Rossi, M., and Parshall,
R. F. (1993). Structural synaptic correlate of long-term potentiation: formation of
axospinous synapses with multiple, completely partitioned transmission zones.
Hippocampus 3, 435-445.
Geinisman, Y., deToledo-Morrell, L., and Morrell, F. (1991). Induction of long-term
potentiation is associated with an increase in the number of axospinous synapses
with segmented postsynaptic densities. Brain Res 566, 77-88.
Geli, M. I., and Riezman, H. (1996). Role of type I myosins in receptor-mediated
endocytosis in yeast. Science 272, 533-535.
Gibbs, J. W., 3rd, Shumate, M. D., and Coulter, D. A. (1997). Differential
epilepsy-associated alterations in postsynaptic GABA(A) receptor function in
dentate granule and CA1 neurons. J Neurophysiol 77, 1924-1938.
Gibney, J., and Zheng, J. Q. (2003). Cytoskeletal dynamics underlying collateral
membrane protrusions induced by neurotrophins in cultured Xenopus embryonic
neurons. J Neurobiol 54, 393-405.
Goldschmidt-Clermont, P. J., Machesky, L. M., Baldassare, J. J., and Pollard, T. D.
(1990). The actin-binding protein profilin binds to PIP2 and inhibits its hydrolysis
by phospholipase C. Science 247, 1575-1578.
Gotow, T., Miyaguchi, K., and Hashimoto, P. H. (1991). Cytoplasmic architecture of the
axon terminal: filamentous strands specifically associated with synaptic vesicles.
126
Neuroscience 40, 587-598.
Graf, E. R., Zhang, X., Jin, S. X., Linhoff, M. W., and Craig, A. M. (2004). Neurexins
induce differentiation of GABA and glutamate postsynaptic specializations via
neuroligins. Cell 119, 1013-1026.
Greengard, P., Valtorta, F., Czernik, A. J., and Benfenati, F. (1993). Synaptic vesicle
phosphoproteins and regulation of synaptic function. Science 259, 780-785.
Hall, D. D., Feekes, J. A., Arachchige Don, A. S., Shi, M., Hamid, J., Chen, L., Strack, S.,
Zamponi, G. W., Horne, M. C., and Hell, J. W. (2006). Binding of protein
phosphatase 2A to the L-type calcium channel Cav1.2 next to Ser1928, its main
PKA site, is critical for Ser1928 dephosphorylation. Biochemistry 45, 3448-3459.
Hamann, M., Rossi, D. J., and Attwell, D. (2002). Tonic and spillover inhibition of
granule cells control information flow through cerebellar cortex. Neuron 33,
625-633.
Hanse, E., and Gustafsson, B. (2001). Vesicle release probability and pre-primed pool at
glutamatergic synapses in area CA1 of the rat neonatal hippocampus. J Physiol
531, 481-493.
Harkin, L. A., Bowser, D. N., Dibbens, L. M., Singh, R., Phillips, F., Wallace, R. H.,
Richards, M. C., Williams, D. A., Mulley, J. C., Berkovic, S. F., et al. (2002).
Truncation of the GABA(A)-receptor gamma2 subunit in a family with
generalized epilepsy with febrile seizures plus. Am J Hum Genet 70, 530-536.
Harvey, K., Duguid, I. C., Alldred, M. J., Beatty, S. E., Ward, H., Keep, N. H.,
127
Lingenfelter, S. E., Pearce, B. R., Lundgren, J., Owen, M. J., et al. (2004). The
GDP-GTP exchange factor collybistin: an essential determinant of neuronal
gephyrin clustering. J Neurosci 24, 5816-5826.
Hennou, S., Khalilov, I., Diabira, D., Ben-Ari, Y., and Gozlan, H. (2002). Early sequential
formation of functional GABAA and glutamatergic synapses on CA1 interneurons
of the rat foetal hippocampus. Eur J Neurosci 16, 197-208.
Hensch, T. K., and Fagiolini, M. (2005). Excitatory-inhibitory balance and critical period
plasticity in developing visual cortex. Prog Brain Res 147, 115-124.
Honarpour, N., Tabuchi, K., Stark, J. M., Hammer, R. E., Sudhof, T. C., Parada, L. F.,
Wang, X., Richardson, J. A., and Herz, J. (2001). Embryonic neuronal death due
to neurotrophin and neurotransmitter deprivation occurs independent of Apaf-1.
Neuroscience 106, 263-274.
Houser, C. R., and Esclapez, M. (2003). Downregulation of the alpha5 subunit of the
GABA(A) receptor in the pilocarpine model of temporal lobe epilepsy.
Hippocampus 13, 633-645.
Hsia, A. Y., Malenka, R. C., and Nicoll, R. A. (1998). Development of excitatory circuitry
in the hippocampus. J Neurophysiol 79, 2013-2024.
Hu, S. C., Chrivia, J., and Ghosh, A. (1999). Regulation of CBP-mediated transcription
by neuronal calcium signaling. Neuron 22, 799-808.
Huang, F., Jiang, X., and Sorkin, A. (2003). Tyrosine phosphorylation of the beta2
subunit of clathrin adaptor complex AP-2 reveals the role of a di-leucine motif in

128
the epidermal growth factor receptor trafficking. J Biol Chem 278, 43411-43417.
Inagaki, N., Nishizawa, M., Arimura, N., Yamamoto, H., Takeuchi, Y., Miyamoto, E.,
Kaibuchi, K., and Inagaki, M. (2000). Activation of Ca2+/calmodulin-dependent
protein kinase II within post-synaptic dendritic spines of cultured hippocampal
neurons. J Biol Chem 275, 27165-27171.
Isaac, J. T., Crair, M. C., Nicoll, R. A., and Malenka, R. C. (1997). Silent synapses during
development of thalamocortical inputs. Neuron 18, 269-280.
Isaac, J. T., Nicoll, R. A., and Malenka, R. C. (1995). Evidence for silent synapses:
implications for the expression of LTP. Neuron 15, 427-434.
Ito, I., and Sugiyama, H. (1991). Roles of glutamate receptors in long-term potentiation at
hippocampal mossy fiber synapses. Neuroreport 2, 333-336.
Job, C., and Lagnado, L. (1998). Calcium and protein kinase C regulate the actin
cytoskeleton in the synaptic terminal of retinal bipolar cells. J Cell Biol 143,
1661-1672.
Johnston, D., Fisher, R., and Gray, R. (1992). Voltage-gated calcium channels in adult
hippocampal neurons. Ion Channels 3, 39-62.
Jones-Davis, D. M., and Macdonald, R. L. (2003). GABA(A) receptor function and
pharmacology in epilepsy and status epilepticus. Curr Opin Pharmacol 3, 12-18.
Jovanovic, J. N., Benfenati, F., Siow, Y. L., Sihra, T. S., Sanghera, J. S., Pelech, S. L.,
Greengard, P., and Czernik, A. J. (1996). Neurotrophins stimulate phosphorylation
of synapsin I by MAP kinase and regulate synapsin I-actin interactions. Proc Natl

129
Acad Sci U S A 93, 3679-3683.
Kaech, S., Fischer, M., Doll, T., and Matus, A. (1997). Isoform specificity in the
relationship of actin to dendritic spines. J Neurosci 17, 9565-9572.
Kaneda, M., Farrant, M., and Cull-Candy, S. G. (1995). Whole-cell and single-channel
currents activated by GABA and glycine in granule cells of the rat cerebellum. J
Physiol 485 ( Pt 2), 419-435.
Kaplan, D. R., and Miller, F. D. (2000). Neurotrophin signal transduction in the nervous
system. Curr Opin Neurobiol 10, 381-391.
Khazipov, R., Esclapez, M., Caillard, O., Bernard, C., Khalilov, I., Tyzio, R., Hirsch, J.,
Dzhala, V., Berger, B., and Ben-Ari, Y. (2001). Early development of neuronal
activity in the primate hippocampus in utero. J Neurosci 21, 9770-9781.
Kim, C. H., and Lisman, J. E. (1999). A role of actin filament in synaptic transmission
and long-term potentiation. J Neurosci 19, 4314-4324.
Kim, D., and Thayer, S. A. (2001). Cannabinoids inhibit the formation of new synapses
between hippocampal neurons in culture. J Neurosci 21, RC146.
Kim, J. H., Udo, H., Li, H. L., Youn, T. Y., Chen, M., Kandel, E. R., and Bailey, C. H.
(2003). Presynaptic activation of silent synapses and growth of new synapses
contribute to intermediate and long-term facilitation in Aplysia. Neuron 40,
151-165.
Kobayashi, M., and Buckmaster, P. S. (2003). Reduced inhibition of dentate granule cells
in a model of temporal lobe epilepsy. J Neurosci 23, 2440-2452.
130
Kobayashi, M., Wen, X., and Buckmaster, P. S. (2003). Reduced inhibition and increased
output of layer II neurons in the medial entorhinal cortex in a model of temporal
lobe epilepsy. J Neurosci 23, 8471-8479.
Kraszewski, K., Mundigl, O., Daniell, L., Verderio, C., Matteoli, M., and De Camilli, P.
(1995). Synaptic vesicle dynamics in living cultured hippocampal neurons
visualized with CY3-conjugated antibodies directed against the lumenal domain
of synaptotagmin. J Neurosci 15, 4328-4342.
Kreuder, V., Dieckhoff, J., Sittig, M., and Mannherz, H. G. (1984). Isolation,
characterisation and crystallization of deoxyribonuclease I from bovine and rat
parotid gland and its interaction with rabbit skeletal muscle actin. Eur J Biochem
139, 389-400.
Krucker, T., Siggins, G. R., and Halpain, S. (2000). Dynamic actin filaments are required
for stable long-term potentiation (LTP) in area CA1 of the hippocampus. Proc
Natl Acad Sci U S A 97, 6856-6861.
Krueger, S. R., Kolar, A., and Fitzsimonds, R. M. (2003). The presynaptic release
apparatus is functional in the absence of dendritic contact and highly mobile
within isolated axons. Neuron 40, 945-957.
Kuromi, H., and Kidokoro, Y. (1998). Two distinct pools of synaptic vesicles in single
presynaptic boutons in a temperature-sensitive Drosophila mutant, shibire.
Neuron 20, 917-925.
Lamaze, C., Fujimoto, L. M., Yin, H. L., and Schmid, S. L. (1997). The actin

131
cytoskeleton is required for receptor-mediated endocytosis in mammalian cells. J
Biol Chem 272, 20332-20335.
Langford, G. M. (1995). Actin- and microtubule-dependent organelle motors:
interrelationships between the two motility systems. Curr Opin Cell Biol 7, 82-88.
Lessmann, V., Gottmann, K., and Heumann, R. (1994). BDNF and NT-4/5 enhance
glutamatergic synaptic transmission in cultured hippocampal neurones.
Neuroreport 6, 21-25.
Levine, E. S., Dreyfus, C. F., Black, I. B., and Plummer, M. R. (1995). Brain-derived
neurotrophic factor rapidly enhances synaptic transmission in hippocampal
neurons via postsynaptic tyrosine kinase receptors. Proc Natl Acad Sci U S A 92,
8074-8077.
Li, Y. X., Zhang, Y., Lester, H. A., Schuman, E. M., and Davidson, N. (1998).
Enhancement of neurotransmitter release induced by brain-derived neurotrophic
factor in cultured hippocampal neurons. J Neurosci 18, 10231-10240.
Liao, D., Hessler, N. A., and Malinow, R. (1995). Activation of postsynaptically silent
synapses during pairing-induced LTP in CA1 region of hippocampal slice. Nature
375, 400-404.
Liao, D., and Malinow, R. (1996). Deficiency in induction but not expression of LTP in
hippocampal slices from young rats. Learn Mem 3, 138-149.
Liao, D., Zhang, X., O'Brien, R., Ehlers, M. D., and Huganir, R. L. (1999). Regulation of
morphological postsynaptic silent synapses in developing hippocampal neurons.

132
Nat Neurosci 2, 37-43.
Lisman, J., Schulman, H., and Cline, H. (2002). The molecular basis of CaMKII function
in synaptic and behavioural memory. Nat Rev Neurosci 3, 175-190.
Littlefield, R., Almenar-Queralt, A., and Fowler, V. M. (2001). Actin dynamics at pointed
ends regulates thin filament length in striated muscle. Nat Cell Biol 3, 544-551.
Lledo, P. M., Zhang, X., Sudhof, T. C., Malenka, R. C., and Nicoll, R. A. (1998).
Postsynaptic membrane fusion and long-term potentiation. Science 279, 399-403.
LoTurco, J. J., Owens, D. F., Heath, M. J., Davis, M. B., and Kriegstein, A. R. (1995).
GABA and glutamate depolarize cortical progenitor cells and inhibit DNA
synthesis. Neuron 15, 1287-1298.
Loup, F., Wieser, H. G., Yonekawa, Y., Aguzzi, A., and Fritschy, J. M. (2000). Selective
alterations in GABAA receptor subtypes in human temporal lobe epilepsy. J
Neurosci 20, 5401-5419.
Lowe, A. W., Madeddu, L., and Kelly, R. B. (1988). Endocrine secretory granules and
neuronal synaptic vesicles have three integral membrane proteins in common. J
Cell Biol 106, 51-59.
Luscher, B., and Keller, C. A. (2004). Regulation of GABAA receptor trafficking,
channel activity, and functional plasticity of inhibitory synapses. Pharmacology
and Therapeutics 102, 194-220.
Ma, L., Zablow, L., Kandel, E. R., and Siegelbaum, S. A. (1999). Cyclic AMP induces
functional presynaptic boutons in hippocampal CA3-CA1 neuronal cultures. Nat
133
Neurosci 2, 24-30.
Machesky, L. M., and May, R. C. (2001). Arps: actin-related proteins. Results Probl Cell
Differ 32, 213-229.
Maggi, L., Le Magueresse, C., Changeux, J. P., and Cherubini, E. (2003). Nicotine
activates immature "silent" connections in the developing hippocampus. Proc Natl
Acad Sci U S A 100, 2059-2064.
Malenka, R. C., and Nicoll, R. A. (1999). Long-term potentiation--a decade of progress?
Science 285, 1870-1874.
Maletic-Savatic, M., Malinow, R., and Svoboda, K. (1999). Rapid dendritic
morphogenesis in CA1 hippocampal dendrites induced by synaptic activity.
Science 283, 1923-1927.
Malgaroli, A., Ting, A. E., Wendland, B., Bergamaschi, A., Villa, A., Tsien, R. W., and
Scheller, R. H. (1995). Presynaptic component of long-term potentiation
visualized at individual hippocampal synapses. Science 268, 1624-1628.
Malgaroli, A., and Tsien, R. W. (1992). Glutamate-induced long-term potentiation of the
frequency of miniature synaptic currents in cultured hippocampal neurons. Nature
357, 134-139.
Malinow, R., Madison, D. V., and Tsien, R. W. (1988). Persistent protein kinase activity
underlying long-term potentiation. Nature 335, 820-824.
Malleret, G., Haditsch, U., Genoux, D., Jones, M. W., Bliss, T. V., Vanhoose, A. M.,
Weitlauf, C., Kandel, E. R., Winder, D. G., and Mansuy, I. M. (2001). Inducible
134
and reversible enhancement of learning, memory, and long-term potentiation by
genetic inhibition of calcineurin. Cell 104, 675-686.
Marrs, G. S., Green, S. H., and Dailey, M. E. (2001). Rapid formation and remodeling of
postsynaptic densities in developing dendrites. Nat Neurosci 4, 1006-1013.
Martin, S. J., Grimwood, P. D., and Morris, R. G. (2000). Synaptic plasticity and memory:
an evaluation of the hypothesis. Annu Rev Neurosci 23, 649-711.
Matsuzaki, M., Honkura, N., Ellis-Davies, G. C., and Kasai, H. (2004). Structural basis of
long-term potentiation in single dendritic spines. Nature 429, 761-766.
Matus, A. (2000). Actin-based plasticity in dendritic spines. Science 290, 754-758.
Matus, A., Ackermann, M., Pehling, G., Byers, H. R., and Fujiwara, K. (1982). High actin
concentrations in brain dendritic spines and postsynaptic densities. Proc Natl
Acad Sci U S A 79, 7590-7594.
Matus, A., Brinkhaus, H., and Wagner, U. (2000). Actin dynamics in dendritic spines: a
form of regulated plasticity at excitatory synapses. Hippocampus 10, 555-560.
Meng, Y., Zhang, Y., Tregoubov, V., Janus, C., Cruz, L., Jackson, M., Lu, W. Y.,
MacDonald, J. F., Wang, J. Y., Falls, D. L., and Jia, Z. (2002). Abnormal spine
morphology and enhanced LTP in LIMK-1 knockout mice. Neuron 35, 121-133.
Mi, R., Tang, X., Sutter, R., Xu, D., Worley, P., and O'Brien, R. J. (2002). Differing
mechanisms for glutamate receptor aggregation on dendritic spines and shafts in
cultured hippocampal neurons. J Neurosci 22, 7606-7616.
Misra, R. P., Bonni, A., Miranti, C. K., Rivera, V. M., Sheng, M., and Greenberg, M. E.

135
(1994). L-type voltage-sensitive calcium channel activation stimulates gene
expression by a serum response factor-dependent pathway. J Biol Chem 269,
25483-25493.
Mitchell, S. J., and Silver, R. A. (2003). Shunting inhibition modulates neuronal gain
during synaptic excitation. Neuron 38, 433-445.
Mody, I. (2005). Aspects of the homeostaic plasticity of GABAA receptor-mediated
inhibition. J Physiol 562, 37-46.
Mody, I., and Pearce, R. A. (2004). Diversity of inhibitory neurotransmission through
GABA(A) receptors. Trends Neurosci 27, 569-575.
Morales, M., Colicos, M. A., and Goda, Y. (2000). Actin-dependent regulation of
neurotransmitter release at central synapses. Neuron 27, 539-550.
Moser, M. B., Trommald, M., and Andersen, P. (1994). An increase in dendritic spine
density on hippocampal CA1 pyramidal cells following spatial learning in adult
rats suggests the formation of new synapses. Proc Natl Acad Sci U S A 91,
12673-12675.
Moss, S. J., and Smart, T. G. (2001). Constructing inhibitory synapses. Nat Rev Neurosci
2, 240-250.
Mozhayeva, M. G., Sara, Y., Liu, X., and Kavalali, E. T. (2002). Development of vesicle
pools during maturation of hippocampal synapses. J Neurosci 22, 654-665.
Mullins, R. D., Heuser, J. A., and Pollard, T. D. (1998). The interaction of Arp2/3
complex with actin: nucleation, high affinity pointed end capping, and formation

136
of branching networks of filaments. Proc Natl Acad Sci U S A 95, 6181-6186.
Mundigl, O., Ochoa, G. C., David, C., Slepnev, V. I., Kabanov, A., and De Camilli, P.
(1998). Amphiphysin I antisense oligonucleotides inhibit neurite outgrowth in
cultured hippocampal neurons. J Neurosci 18, 93-103.
Nagappan, G., and Lu, B. (2005). Activity-dependent modulation of the BDNF receptor
TrkB: mechanisms and implications. Trends Neurosci 28, 464-471.
Neher, E. (1993). Cell physiology. Secretion without full fusion. Nature 363, 497-498.
Neher, E., and Zucker, R. S. (1993). Multiple calcium-dependent processes related to
secretion in bovine chromaffin cells. Neuron 10, 21-30.
Nguyen, L., Rigo, J. M., Rocher, V., Belachew, S., Malgrange, B., Rogister, B., Leprince,
P., and Moonen, G. (2001). Neurotransmitters as early signals for central nervous
system development. Cell Tissue Res 305, 187-202.
Nguyen, P. V., Abel, T., and Kandel, E. R. (1994). Requirement of a critical period of
transcription for induction of a late phase of LTP. Science 265, 1104-1107.
Nicoll, R. A., and Malenka, R. C. (1995). Contrasting properties of two forms of
long-term potentiation in the hippocampus. Nature 377, 115-118.
Niikura, Y., Abe, K., and Misawa, M. (2004). Involvement of L-type Ca2+ channels in
the induction of long-term potentiation in the basolateral amygdala-dentate gyrus
pathway of anesthetized rats. Brain Res 1017, 218-221.
Nusser, Z., Hajos, N., Somogyi, P., and Mody, I. (1998a). Increased number of synaptic
GABA(A) receptors underlies potentiation at hippocampal inhibitory synapses.

137
Nature 395, 172-177.
Nusser, Z., and Mody, I. (2002). Selective modulation of tonic and phasic inhibitions in
dentate gyrus granule cells. J Neurophysiol 87, 2624-2628.
Nusser, Z., Sieghart, W., and Somogyi, P. (1998b). Segregation of different GABAA
receptors to synaptic and extrasynaptic membranes of cerebellar granule cells. J
Neurosci 18, 1693-1703.
O'Brien, R. J., Xu, D., Petralia, R. S., Steward, O., Huganir, R. L., and Worley, P. (1999).
Synaptic clustering of AMPA receptors by the extracellular immediate-early gene
product Narp. Neuron 23, 309-323.
Okamoto, K., Nagai, T., Miyawaki, A., and Hayashi, Y. (2004). Rapid and persistent
modulation of actin dynamics regulates postsynaptic reorganization underlying
bidirectional plasticity. Nat Neurosci 7, 1104-1112.
Owens, D. F., and Kriegstein, A. R. (2002). Is there more to gaba than synaptic inhibition?
Nat Rev Neurosci 3, 715-727.
Partin, K. M., Patneau, D. K., Winters, C. A., Mayer, M. L., and Buonanno, A. (1993).
Selective modulation of desensitization at AMPA versus kainate receptors by
cyclothiazide and concanavalin A. Neuron 11, 1069-1082.
Pascual, M., Pozas, E., Barallobre, M. J., Tessier-Lavigne, M., and Soriano, E. (2004).
Coordinated functions of Netrin-1 and Class 3 secreted Semaphorins in the
guidance of reciprocal septohippocampal connections. Mol Cell Neurosci 26,
24-33.

138
Peng, Z., Huang, C. S., Stell, B. M., Mody, I., and Houser, C. R. (2004). Altered
expression of the delta subunit of the GABAA receptor in a mouse model of
temporal lobe epilepsy. J Neurosci 24, 8629-8639.
Perelroizen, I., Didry, D., Christensen, H., Chua, N. H., and Carlier, M. F. (1996). Role of
nucleotide exchange and hydrolysis in the function of profilin in action assembly.
J Biol Chem 271, 12302-12309.
Petralia, R. S., Esteban, J. A., Wang, Y. X., Partridge, J. G., Zhao, H. M., Wenthold, R. J.,
and Malinow, R. (1999). Selective acquisition of AMPA receptors over postnatal
development suggests a molecular basis for silent synapses. Nat Neurosci 2,
31-36.
Phillips, G. R., Huang, J. K., Wang, Y., Tanaka, H., Shapiro, L., Zhang, W., Shan, W. S.,
Arndt, K., Frank, M., Gordon, R. E., et al. (2001). The presynaptic particle web:
ultrastructure, composition, dissolution, and reconstitution. Neuron 32, 63-77.
Pieribone, V. A., Shupliakov, O., Brodin, L., Hilfiker-Rothenfluh, S., Czernik, A. J., and
Greengard, P. (1995). Distinct pools of synaptic vesicles in neurotransmitter
release. Nature 375, 493-497.
Prince, D. A., and Connors, B. W. (1986). Mechanisms of interictal epileptogenesis. Adv
Neurol 44, 275-299.
Rao, A., Kim, E., Sheng, M., and Craig, A. M. (1998). Heterogeneity in the molecular
composition of excitatory postsynaptic sites during development of hippocampal
neurons in culture. J Neurosci 18, 1217-1229.
139
Renger, J. J., Egles, C., and Liu, G. (2001). A developmental switch in neurotransmitter
flux enhances synaptic efficacy by affecting AMPA receptor activation. Neuron 29,
469-484.
Richards, D. A., Rizzoli, S. O., and Betz, W. J. (2004). Effects of wortmannin and
latrunculin A on slow endocytosis at the frog neuromuscular junction. J Physiol
557, 77-91.
Richerson, G. B. (2004). Looking for GABA in all the wrong places: the relevance of
extrasynaptic GABA(A) receptors to epilepsy. Epilepsy Curr 4, 239-242.
Rizzoli, S. O., and Betz, W. J. (2004). The structural organization of the readily releasable
pool of synaptic vesicles. Science 303, 2037-2039.
Rodal, A. A., Tetreault, J. W., Lappalainen, P., Drubin, D. G., and Amberg, D. C. (1999).
Aip1p interacts with cofilin to disassemble actin filaments. J Cell Biol 145,
1251-1264.
Rosahl, T. W., Spillane, D., Missler, M., Herz, J., Selig, D. K., Wolff, J. R., Hammer, R.
E., Malenka, R. C., and Sudhof, T. C. (1995). Essential functions of synapsins I
and II in synaptic vesicle regulation. Nature 375, 488-493.
Rosenmund, C., and Stevens, C. F. (1996). Definition of the readily releasable pool of
vesicles at hippocampal synapses. Neuron 16, 1197-1207.
Ruiz-Canada, C., Ashley, J., Moeckel-Cole, S., Drier, E., Yin, J., and Budnik, V. (2004).
New synaptic bouton formation is disrupted by misregulation of microtubule
stability in aPKC mutants. Neuron 42, 567-580.

140
Rumpel, S., Hatt, H., and Gottmann, K. (1998). Silent synapses in the developing rat
visual cortex: evidence for postsynaptic expression of synaptic plasticity. J
Neurosci 18, 8863-8874.
Ryan, T. A., Li, L., Chin, L. S., Greengard, P., and Smith, S. J. (1996a). Synaptic vesicle
recycling in synapsin I knock-out mice. J Cell Biol 134, 1219-1227.
Ryan, T. A., Reuter, H., Wendland, B., Schweizer, F. E., Tsien, R. W., and Smith, S. J.
(1993). The kinetics of synaptic vesicle recycling measured at single presynaptic
boutons. Neuron 11, 713-724.
Ryan, T. A., Ziv, N. E., and Smith, S. J. (1996b). Potentiation of evoked vesicle turnover
at individually resolved synaptic boutons. Neuron 17, 125-134.
Sakaba, T., and Neher, E. (2003). Involvement of actin polymerization in vesicle
recruitment at the calyx of Held synapse. J Neurosci 23, 837-846.
Salin, P. A., Malenka, R. C., and Nicoll, R. A. (1996). Cyclic AMP mediates a presynaptic
form of LTP at cerebellar parallel fiber synapses. Neuron 16, 797-803.
Sankaranarayanan, S., Atluri, P. P., and Ryan, T. A. (2003). Actin has a molecular
scaffolding, not propulsive, role in presynaptic function. Nat Neurosci 6, 127-135.
Sara, Y., Biederer, T., Atasoy, D., Chubykin, A., Mozhayeva, M. G., Sudhof, T. C., and
Kavalali, E. T. (2005). Selective capability of SynCAM and neuroligin for
functional synapse assembly. J Neurosci 25, 260-270.
Sato, T., Sato-Harada, R., Takano, M., Kato, S., Saburi, S., and Harada, A. (2002).
Localization of cAMP-dependent protein kinase in the actin and microtubule
141
cytoskeletons in mouse hippocampal neurons. Neurosci Lett 325, 83-86.
Schafer, D. A., and Cooper, J. A. (1995). Control of actin assembly at filament ends.
Annu Rev Cell Dev Biol 11, 497-518.
Scheiffele, P. (2003). Cell-cell signaling during synapse formation in the CNS. Annu Rev
Neurosci 26, 485-508.
Scheiffele, P., Fan, J., Choih, J., Fetter, R., and Serafini, T. (2000). Neuroligin expressed
in nonneuronal cells triggers presynaptic development in contacting axons. Cell
101, 657-669.
Schinder, A. F., Berninger, B., and Poo, M. (2000). Postsynaptic target specificity of
neurotrophin-induced presynaptic potentiation. Neuron 25, 151-163.
Schoch, S., Castillo, P. E., Jo, T., Mukherjee, K., Geppert, M., Wang, Y., Schmitz, F.,
Malenka, R. C., and Sudhof, T. C. (2002). RIM1alpha forms a protein scaffold for
regulating neurotransmitter release at the active zone. Nature 415, 321-326.
Semyanov, A., Walker, M. C., and Kullmann, D. M. (2003). GABA uptake regulates
cortical excitability via cell type-specific tonic inhibition. Nat Neurosci 6,
484-490.
Semyanov, A., Walker, M. C., Kullmann, D. M., and Silver, R. A. (2004). Tonically active
GABA A receptors: modulating gain and maintaining the tone. Trends Neurosci
27, 262-269.
Shen, K., Teruel, M. N., Subramanian, K., and Meyer, T. (1998). CaMKIIbeta functions
as an F-actin targeting module that localizes CaMKIIalpha/beta heterooligomers
142
to dendritic spines. Neuron 21, 593-606.
Sheng, M., Thompson, M. A., and Greenberg, M. E. (1991). CREB: a Ca(2+)-regulated
transcription factor phosphorylated by calmodulin-dependent kinases. Science
252, 1427-1430.
Shupliakov, O., Bloom, O., Gustafsson, J. S., Kjaerulff, O., Low, P., Tomilin, N.,
Pieribone, V. A., Greengard, P., and Brodin, L. (2002). Impaired recycling of
synaptic vesicles after acute perturbation of the presynaptic actin cytoskeleton.
Proc Natl Acad Sci U S A 99, 14476-14481.
Sperk, G., Furtinger, S., Schwarzer, C., and Pirker, S. (2004). GABA and its receptors in
epilepsy. Adv Exp Med Biol 548, 92-103.
Star, E. N., Kwiatkowski, D. J., and Murthy, V. N. (2002). Rapid turnover of actin in
dendritic spines and its regulation by activity. Nat Neurosci 5, 239-246.
Stein, J. C., Farooq, M., Norton, W. T., and Rubin, C. S. (1987). Differential expression
of isoforms of the regulatory subunit of type II cAMP-dependent protein kinase in
rat neurons, astrocytes, and oligodendrocytes. J Biol Chem 262, 3002-3006.
Stell, B. M., Brickley, S. G., Tang, C. Y., Farrant, M., and Mody, I. (2003). Neuroactive
steroids reduce neuronal excitability by selectively enhancing tonic inhibition
mediated by delta subunit-containing GABAA receptors. Proc Natl Acad Sci U S
A 100, 14439-14444.
Sudhof, T. C. (1995). The synaptic vesicle cycle: a cascade of protein-protein interactions.
Nature 375, 645-653.

143
Sun, H. Q., Kwiatkowska, K., and Yin, H. L. (1996). beta-Thymosins are not simple actin
monomer buffering proteins. Insights from overexpression studies. J Biol Chem
271, 9223-9230.
Tanaka, H., Shan, W., Phillips, G. R., Arndt, K., Bozdagi, O., Shapiro, L., Huntley, G. W.,
Benson, D. L., and Colman, D. R. (2000). Molecular modification of N-cadherin
in response to synaptic activity. Neuron 25, 93-107.
Tao, X., Finkbeiner, S., Arnold, D. B., Shaywitz, A. J., and Greenberg, M. E. (1998).
Ca2+ influx regulates BDNF transcription by a CREB family transcription
factor-dependent mechanism. Neuron 20, 709-726.
Tessier-Lavigne, M. (1995). Eph receptor tyrosine kinases, axon repulsion, and the
development of topographic maps. Cell 82, 345-348.
Tiruchinapalli, D. M., Oleynikov, Y., Kelic, S., Shenoy, S. M., Hartley, A., Stanton, P. K.,
Singer, R. H., and Bassell, G. J. (2003). Activity-dependent trafficking and
dynamic localization of zipcode binding protein 1 and beta-actin mRNA in
dendrites and spines of hippocampal neurons. J Neurosci 23, 3251-3261.
tom Dieck, S., Sanmarti-Vila, L., Langnaese, K., Richter, K., Kindler, S., Soyke, A., Wex,
H., Smalla, K. H., Kampf, U., Franzer, J. T., et al. (1998). Bassoon, a novel
zinc-finger CAG/glutamine-repeat protein selectively localized at the active zone
of presynaptic nerve terminals. J Cell Biol 142, 499-509.
Tong, G., Malenka, R. C., and Nicoll, R. A. (1996). Long-term potentiation in cultures of
single hippocampal granule cells: a presynaptic form of plasticity. Neuron 16,

144
1147-1157.
Toni, N., Buchs, P. A., Nikonenko, I., Bron, C. R., and Muller, D. (1999). LTP promotes
formation of multiple spine synapses between a single axon terminal and a
dendrite. Nature 402, 421-425.
Trussell, L. O., Zhang, S., and Raman, I. M. (1993). Desensitization of AMPA receptors
upon multiquantal neurotransmitter release. Neuron 10, 1185-1196.
Tsunashima, K., Schwarzer, C., Kirchmair, E., Sieghart, W., and Sperk, G. (1997).
GABA(A) receptor subunits in the rat hippocampus III: altered messenger RNA
expression in kainic acid-induced epilepsy. Neuroscience 80, 1019-1032.
Tyler, W. J., and Pozzo-Miller, L. (2003). Miniature synaptic transmission and BDNF
modulate dendritic spine growth and form in rat CA1 neurones. J Physiol 553,
497-509.
Tyler, W. J., and Pozzo-Miller, L. D. (2001). BDNF enhances quantal neurotransmitter
release and increases the number of docked vesicles at the active zones of
hippocampal excitatory synapses. J Neurosci 21, 4249-4258.
Tyler, W. J., Zhang, X. L., Hartman, K., Winterer, J., Muller, W., Stanton, P. K., and
Pozzo-Miller, L. (2006). BDNF increases release probability and the size of a
rapidly recycling vesicle pool within rat hippocampal excitatory synapses. J
Physiol 574, 787-803.
Tyzio, R., Represa, A., Jorquera, I., Ben-Ari, Y., Gozlan, H., and Aniksztejn, L. (1999).
The establishment of GABAergic and glutamatergic synapses on CA1 pyramidal
145
neurons is sequential and correlates with the development of the apical dendrite. J
Neurosci 19, 10372-10382.
Vancompernolle, K., Vandekerckhove, J., Bubb, M. R., and Korn, E. D. (1991). The
interfaces of actin and Acanthamoeba actobindin. Identification of a new
actin-binding motif. J Biol Chem 266, 15427-15431.
Vaughn, J. E. (1989). Fine structure of synaptogenesis in the vertebrate central nervous
system. Synapse 3, 255-285.
Ventra, C., Porcellini, A., Feliciello, A., Gallo, A., Paolillo, M., Mele, E., Avvedimento, V.
E., and Schettini, G. (1996). The differential response of protein kinase A to cyclic
AMP in discrete brain areas correlates with the abundance of regulatory subunit II.
J Neurochem 66, 1752-1761.
Vitale, M. L., Seward, E. P., and Trifaro, J. M. (1995). Chromaffin cell cortical actin
network dynamics control the size of the release-ready vesicle pool and the initial
rate of exocytosis. Neuron 14, 353-363.
Voronin, L. L., and Cherubini, E. (2004). 'Deaf, mute and whispering' silent synapses:
their role in synaptic plasticity. J Physiol 557, 3-12.
Waites, C. L., Craig, A. M., and Garner, C. C. (2005). Mechanisms of vertebrate
synaptogenesis. Annu Rev Neurosci 28, 251-274.
Wallace, R. H., Marini, C., Petrou, S., Harkin, L. A., Bowser, D. N., Panchal, R. G.,
Williams, D. A., Sutherland, G. R., Mulley, J. C., Scheffer, I. E., and Berkovic, S.
F. (2001). Mutant GABA(A) receptor gamma2-subunit in childhood absence
146
epilepsy and febrile seizures. Nat Genet 28, 49-52.
Wang, H. G., Lu, F. M., Jin, I., Udo, H., Kandel, E. R., de Vente, J., Walter, U., Lohmann,
S. M., Hawkins, R. D., and Antonova, I. (2005). Presynaptic and postsynaptic
roles of NO, cGK, and RhoA in long-lasting potentiation and aggregation of
synaptic proteins. Neuron 45, 389-403.
Wang, X. H., Zheng, J. Q., and Poo, M. M. (1996). Effects of cytochalasin treatment on
short-term synaptic plasticity at developing neuromuscular junctions in frogs. J
Physiol 491 ( Pt 1), 187-195.
Wei, W., Zhang, N., Peng, Z., Houser, C. R., and Mody, I. (2003). Perisynaptic
localization of delta subunit-containing GABA(A) receptors and their activation
by GABA spillover in the mouse dentate gyrus. J Neurosci 23, 10650-10661.
Weisskopf, M. G., and Nicoll, R. A. (1995). Presynaptic changes during mossy fibre LTP
revealed by NMDA receptor-mediated synaptic responses. Nature 376, 256-259.
Winkler, H., Sietzen, M., and Schober, M. (1987). The life cycle of catecholamine-storing
vesicles. Ann N Y Acad Sci 493, 3-19.
Wu, G., Malinow, R., and Cline, H. T. (1996). Maturation of a central glutamatergic
synapse. Science 274, 972-976.
Wu, G. Y., Deisseroth, K., and Tsien, R. W. (2001a). Activity-dependent CREB
phosphorylation: convergence of a fast, sensitive calmodulin kinase pathway and
a slow, less sensitive mitogen-activated protein kinase pathway. Proc Natl Acad
Sci U S A 98, 2808-2813.

147
Wu, G. Y., Deisseroth, K., and Tsien, R. W. (2001b). Spaced stimuli stabilize MAPK
pathway activation and its effects on dendritic morphology. Nat Neurosci 4,
151-158.
Xia, Z., and Storm, D. R. (2005). The role of calmodulin as a signal integrator for
synaptic plasticity. Nat Rev Neurosci 6, 267-276.
Yabe, J. T., Pimenta, A., and Shea, T. B. (1999). Kinesin-mediated transport of
neurofilament protein oligomers in growing axons. J Cell Sci 112 ( Pt 21),
3799-3814.
Yamada, K. A., and Tang, C. M. (1993). Benzothiadiazides inhibit rapid glutamate
receptor desensitization and enhance glutamatergic synaptic currents. J Neurosci
13, 3904-3915.
Yamagata, Y., Jovanovic, J. N., Czernik, A. J., Greengard, P., and Obata, K. (2002).
Bidirectional changes in synapsin I phosphorylation at MAP kinase-dependent
sites by acute neuronal excitation in vivo. J Neurochem 80, 835-842.
Yeckel, M. F., Kapur, A., and Johnston, D. (1999). Multiple forms of LTP in hippocampal
CA3 neurons use a common postsynaptic mechanism. Nat Neurosci 2, 625-633.
Yonezawa, N., Nishida, E., Koyasu, S., Maekawa, S., Ohta, Y., Yahara, I., and Sakai, H.
(1987). Distribution among tissues and intracellular localization of cofilin, a
21kDa actin-binding protein. Cell Struct Funct 12, 443-452.
Zakharenko, S. S., Zablow, L., and Siegelbaum, S. A. (2001). Visualization of changes in
presynaptic function during long-term synaptic plasticity. Nat Neurosci 4,
148
711-717.
Zhai, R. G., Vardinon-Friedman, H., Cases-Langhoff, C., Becker, B., Gundelfinger, E. D.,
Ziv, N. E., and Garner, C. C. (2001). Assembling the presynaptic active zone: a
characterization of an active one precursor vesicle. Neuron 29, 131-143.
Zhang, W., and Benson, D. L. (2001). Stages of synapse development defined by
dependence on F-actin. J Neurosci 21, 5169-5181.
Zhang, W., and Benson, D. L. (2002). Developmentally regulated changes in cellular
compartmentation and synaptic distribution of actin in hippocampal neurons. J
Neurosci Res 69, 427-436.
Ziv, N. E., and Garner, C. C. (2004). Cellular and molecular mechanisms of presynaptic
assembly. Nat Rev Neurosci 5, 385-399.
Zorumski, C. F., Yamada, K. A., Price, M. T., and Olney, J. W. (1993). A benzodiazepine
recognition site associated with the non-NMDA glutamate receptor. Neuron 10,
61-67.

VITA
Jun Yao
EDUCATION
2007 Ph.D. The Pennsylvania State University Biology 2001 M. S. Nanjing University Physiology 1999 B. S. Nanjing University Biology
PROFESSIONAL EXPERIENCE
08/2002 – 05/2005 Graduate Research Assistant, The Pennsylvania State University. 05/2005 – 12/2006 Teaching Asistant, The Pennsylvania State University. 01/2007 – 07/2007 Graduate Research Assistant, The Pennsylvania State University.
PUBLICATIONS
1. Yao, J., Qi, J. S., and Chen, G. Actin-dependent activation of presynaptic silent synapses contributes to long-term synaptic plasticity in developing hippocampal neurons. J Neurosci. 2006 Aug 2; 26(31):8137-47.
2. Deng, L.*, Yao, J.*, Fang, C., Dong, N., Luscher, B., Chen G. Rapid Postsynaptic Functional Maturation Promotes Rapid GABAergic Synaptogenesis. (Submitted) (* Equal contribution)
3. Qi, J., Yao, J., Fang, C., Luscher, B., and Chen G. Downregulation of Tonic GABA Currents Following Epileptogenic Stimulation of Rat Hippocampal Cultures. J Physiol. 2006 Dec 1; 577(2): 579-590.
4. Yuan, X., Yao, J., Norris, D., Qi, J., Chen, G. and Luscher, B. A novel GABA-A receptor-interacting protein, Calcium-Modulating Cyclophilin Ligand (CAML), modulates GABA-A receptor function. (Submitted)
5. Yao, J., Xia, T., Wu, X., Gao, J., Zhao, X., Hu, Z. and Zhang, Z. The inhibitory effects of low power He Ne laser irradiation on K562 cells. Chin J. Laser Med Surge, 2001, 10(2): 108-110.
6. Zhai, Y., Yao, J., Fan, Y., Xu, L., Gao, J. and Zhao, X. Inhibitory effects of LR-98 on proliferation of Hepatocarcinoma cells. Journal of Naijing University (Natural Sciences), 2001, 37(2): 213-217.
SELECTED PRESENTATIONS
1. Functional role of cytoskeleton protein actin in synapse maturation and plasticity. Ph.D. thesis defense. 2007 June 18.
2. Actin-dependent increase of presynaptic functional boutons induced by spaced neuronal activity. 35th Annual Meeting Society for Neuroscience. Washington D.C. 2005 November 12-16.
Related Documents