Preliminary use of ground-penetrating radar and electrical resistivity tomography to study tree roots in pine forests and poplar plantations Terenzio Zenone A,B,G , Gianfranco Morelli C , Maurizio Teobaldelli B , Federico Fischanger C , Marco Matteucci B , Matteo Sordini D , Alessio Armani C , Chiara Ferrè E , Tommaso Chiti F and Guenther Seufert B A Department of Forest Science and Environment, University of Tuscia, Viterbo, Italy. B European Commission DG-Joint Research Centre, Institute for Environment and Sustainability, Climate Change Unit, T.P. 050 Via E. Fermi, I-21027 Ispra (Va), Italy. C Geostudi Astier, Via della Padula, 165. 57125 Livorno, Italy. D LAPETLAB, Landscape Archaeology and Remote Sensing Laboratory, University of Siena, Via Roma 56, 53100 Siena, Italy. E DISAT, Department of Environmental Sciences, University of Milano-Bicocca, P.za della Scienza, 1 20 126 Milan, Italy. F Department of Soil Science and Plant Nutrition, University of Florence, Piazzale delle Cascine, 16–50144 Firenze, Italy. G Corresponding author. Email: [email protected] This paper originates from a presentation at the 5th International Workshop on Functional–Structural Plant Models, Napier, New Zealand, November 2007. Abstract. In this study, we assess the possibility of using ground penetrating radar (GPR) and electrical resistivity tomography (ERT) as indirect non-destructive techniques for root detection. Two experimental sites were investigated: a poplar plantation [mean height of plants 25.7 m, diameter at breast height (dbh) 33 cm] and a pinewood forest mainly composed of Pinus pinea L. and Pinus pinaster Ait. (mean height 17 m, dbh 29 cm). GPR measures were taken using antennas of 900 and 1500 MHz applied in square and circular grids. ERT was previously tested along 2-D lines, compared with GPR sections and direct observation of the roots, and then using a complete 3-D acquisition technique. Three-dimensional reconstructions using grids of electrodes centred and evenly spaced around the tree were used in all cases (poplar and pine), and repeated in different periods in the pine forest (April, June and September) to investigate the influence of water saturation on the results obtainable. The investigated roots systems were entirely excavated using AIR-SPADE Series 2000. In order to acquire morphological information on the root system, to be compared with the GPR and ERT, poplar and pine roots were scanned using a portable on ground scanning LIDAR. In test sections analysed around the poplar trees, GPR with a high frequency antenna proved to be able to detect roots with very small diameters and different angles, with the geometry of survey lines ruling the intensity of individual reflectors. The comparison between 3-D images of the extracted roots obtained with a laser scan data point cloud and the GPR profile proved the potential of high density 3-D GPR in mapping the entire system in unsaturated soil, with a preference for sandy and silty terrain, with problems arising when clay is predominant. Clutter produced by gravel and pebbles, mixed with the presence of roots, can also be sources of noise for the GPR signals. The work performed on the pine trees shows that the shape, distribution and volume of roots system, can be coupled to the 3-D electrical resistivity variation of the soil model map. Geophysical surveys can be a useful approach to root investigation in describing both the shape and behaviour of the roots in the subsoil. Additional keywords: ERT, GPR, root biomass assessment, root detection. Introduction Forest biomass contains ~80% of all aboveground terrestrial carbon (C) and 40% of belowground C (Dixon et al. 1994; Goodale et al. 2002). A better understanding of the allocation of forest biomass and the factors that regulate it is needed for many applications, including assessing of change in forest structure, biogeochemical cycles, and various aspects of global change (Brown et al. 1993; Dixon et al. 1994; Sanford and Cuevas 1996). Forests are considered an important sink for atmospheric carbon dioxide (CO 2 ), and provide a great potential for temporarily storing atmospheric CO 2 in terrestrial ecosystems (Peichl and Altaf Arain 2007). In recent decades, changes in land-use, including deforestation as well as the regeneration of forests and establishment of plantations, particularly in North America CSIRO PUBLISHING www.publish.csiro.au/journals/fpb Functional Plant Biology, 2008, 35, 1047–1058 Ó CSIRO 2008 10.1071/FP08062 1445-4408/08/101047

Welcome message from author
This document is posted to help you gain knowledge. Please leave a comment to let me know what you think about it! Share it to your friends and learn new things together.
Transcript

Preliminary use of ground-penetrating radar and electrical resistivitytomography to study tree roots in pine forests and poplar plantations
Terenzio ZenoneA,B,G, Gianfranco MorelliC, Maurizio TeobaldelliB, Federico FischangerC,Marco MatteucciB, Matteo SordiniD, Alessio ArmaniC, Chiara FerrèE, Tommaso Chiti F
and Guenther SeufertB
ADepartment of Forest Science and Environment, University of Tuscia, Viterbo, Italy.BEuropean Commission DG-Joint Research Centre, Institute for Environment and Sustainability,Climate Change Unit, T.P. 050 Via E. Fermi, I-21027 Ispra (Va), Italy.
CGeostudi Astier, Via della Padula, 165. 57125 Livorno, Italy.DLAPETLAB, Landscape Archaeology and Remote Sensing Laboratory, University of Siena, Via Roma 56,53100 Siena, Italy.
EDISAT, Department of Environmental Sciences, University of Milano-Bicocca, P.za della Scienza,1 20 126 Milan, Italy.
FDepartment of Soil Science and Plant Nutrition, University of Florence, Piazzale delle Cascine,16–50144 Firenze, Italy.
GCorresponding author. Email: [email protected]
This paper originates from a presentation at the 5th International Workshop on Functional–Structural Plant Models,Napier, New Zealand, November 2007.
Abstract. In this study, we assess the possibility of using ground penetrating radar (GPR) and electrical resistivitytomography (ERT) as indirect non-destructive techniques for root detection. Two experimental sites were investigated: apoplar plantation [mean height of plants 25.7m, diameter at breast height (dbh) 33 cm] and a pinewood forest mainlycomposedofPinuspineaL.andPinuspinasterAit. (meanheight 17m,dbh29 cm).GPRmeasureswere takenusingantennasof 900 and 1500MHz applied in square and circular grids. ERT was previously tested along 2-D lines, compared with GPRsections and direct observation of the roots, and then using a complete 3-D acquisition technique. Three-dimensionalreconstructions using grids of electrodes centred and evenly spaced around the tree were used in all cases (poplar and pine),and repeated in different periods in the pine forest (April, June andSeptember) to investigate the influence ofwater saturationon the results obtainable. The investigated roots systems were entirely excavated using AIR-SPADE Series 2000. In orderto acquire morphological information on the root system, to be compared with the GPR and ERT, poplar and pine rootswere scanned using a portable on ground scanning LIDAR. In test sections analysed around the poplar trees, GPR with ahigh frequency antenna proved to be able to detect roots with very small diameters and different angles, with the geometryof survey lines ruling the intensity of individual reflectors. The comparison between 3-D images of the extracted rootsobtained with a laser scan data point cloud and the GPR profile proved the potential of high density 3-DGPR inmapping theentire system in unsaturated soil, with a preference for sandy and silty terrain, with problems arising when clay ispredominant. Clutter produced by gravel and pebbles, mixed with the presence of roots, can also be sources of noise for theGPR signals. The work performed on the pine trees shows that the shape, distribution and volume of roots system, can becoupled to the 3-D electrical resistivity variation of the soil modelmap. Geophysical surveys can be a useful approach to rootinvestigation in describing both the shape and behaviour of the roots in the subsoil.
Additional keywords: ERT, GPR, root biomass assessment, root detection.
Introduction
Forest biomass contains ~80% of all aboveground terrestrialcarbon (C) and 40% of belowground C (Dixon et al. 1994;Goodale et al. 2002). A better understanding of the allocationof forest biomass and the factors that regulate it is needed formanyapplications, including assessing of change in forest structure,biogeochemical cycles, and various aspects of global change
(Brown et al. 1993;Dixon et al. 1994; Sanford andCuevas 1996).Forests are considered an important sink for atmospheric carbondioxide (CO2), and provide a great potential for temporarilystoring atmospheric CO2 in terrestrial ecosystems (Peichl andAltaf Arain 2007). In recent decades, changes in land-use,including deforestation as well as the regeneration of forestsand establishment of plantations, particularly in North America
CSIRO PUBLISHING
www.publish.csiro.au/journals/fpb Functional Plant Biology, 2008, 35, 1047–1058
� CSIRO 2008 10.1071/FP08062 1445-4408/08/101047
and Europe, have resulted in an increased area covered by forestsat different stages of their development. Thus, knowledge aboutthe development of above- and belowground biomass over theentire life cycle of a forest is required for accurate quantificationofC pools on regional and national scales (Vogt 1991; Kurz et al.1996; Brown 2002). There are several established methods forestimating the biomass in aboveground tree components, but thebiomass of root systems is difficult to measure in any forestecosystem (Sanford and Cuevas 1996). The traditional approachused for root biomass harvest (e.g. soil cores and trenches)provide reasonably accurate information, but they aredestructive, labour-intensive, and limited with respect to thesoil volume and surface area that can be assessed. Dataderived from traditional root extraction approaches are alsogenerally limited to root biomass averages across plots ortreatments, rather than information on root distribution. Thesampling needed to detect differences between treatments canbe expensive as well as time consuming for technical personnel(Butnor et al. 2003). For the above reasons, testing anddeveloping new indirect tools for root biomass surveysappears to be of the considerable importance. Recent studieshave examined non-destructive geophysical techniques, such asground penetrating radar (GPR), in order to detect tree roots andestimate root biomass.
The GPR technique has commonly been used to characterisesoil profiles (Bevan1984;Truman et al. 1988;Farrish et al. 1990),but roots have often been considered an unwanted source of noisethat usually complicates radar interpretation (Doolittle andMiller1991; Barker and Doolittle 1992). In the past, GPR was used tomap the coarse root (i.e. roots with diameter bigger than 3 cm)system of 50-year-old sessile oak (Quercus petraeaMattl.) trees.Other researches (Hruska et al. 1999; Butnor et al. 2001) appliedGPR to study roots over a broad range of soil conditions insouth-eastern United States. According to their studies, soils withhigh electrical resistivity are the most amenable to root detectionwith GPR. In contrast though, high clay content limited signalpenetration, owing to intrinsic higher electrical conductivity.
More recent studies (Stokes et al. 2002) have tried to evaluatethe efficiency of GPR in mapping root systems of urban treesin situ: a comparison between hand-drawn images of roots withGPR data showed that the technique is reliable for mapping largeroots on the horizontal plane only. The GPR technique can beconsidered a valuable non-destructive tool, but it still needsdevelopment, especially with regard to software capable ofreconstructing 3-D images of root system architecture fromraw data. The electrical resistivity tomography (ERT)technique has been widely applied in characterising soil layerheterogeneity with 2-D image techniques (Fukue et al. 1999;Samouëlian et al. 2003; Besson et al. 2004; Roger-Estrade et al.2004) and 3-D images (Bourennane et al. 1998). Estimation oftemporal changes in soil moisture can also be monitored withERT (Goyal et al. 1996; Michot et al. 2003). Soil electricanomalies, which may be related to the presence of roots, havebeen found under plants by ERT (Panissod et al. 2001; Attia alHagrey 2007; Lazzari 2008). Research on spatial variabilityof plant roots with 2-D and 3-D ERT was conducted in fieldand laboratory (Loperte et al. 2006). Quantitative relationshipsbetween root biomass and soil electrical resistivity havebeen found in Alnus glutinosa (L.) Gaertn plantations
(Amato et al. 2008). Although previous studies havedemonstrated the potential of these methodologies in detectingroot systems (Hruska et al. 1999;Wielopolski et al. 2000; Butnoret al. 2001), only a fewstudies have tried tovalidateGPRandERTresponse using direct observations of the entire root system. Inthis study we assess the possibility of using GPR and ERT asindirect techniques for detecting root systems.
Materials and methodsExperimental sites
Poplar plantationThe study area is located ~10 kmnorth-east of the city of Pavia
(Italy) (45�1200300N, 09�0304000E) inside the basin of the TicinoRiver and it is representativeof an intensivepoplar plantation (PP)ofPopulus� canadensisMoench, clone I-214. Tree spacing was7� 8m, corresponding to a density of 178 trees ha–1,meanheight25.7m, basal area 19.3m2 ha–1, and diameter at breast height(dbh) of 33 cm, covering an area of ~120 ha. The area is subjectedto periodical floods and characterised by variable hydrologicalconditions reflecting cut-off meanders, which cause variability instanding biomass within same-aged plantations (Meroni 2005).The majority of this area is now covered with 3–4 generations ofpoplar with turnover times of 9–12 years. After each poplarlogging, the residues and stumps are removed to allowploughing 50–60 cm deep and insertion of 4–5m long shootsto a depth of 150–200 cm. Poplar management includes regularfertilisation and removal of ground vegetation; irrigation isnormally applied on demand (Ferré et al. 2005).
A pedological study, conducted by opening four soil pits,classified the soil as Regosols according to the World ReferenceBase for Soil Resources (FAO-ISRIC-ISSS 2006). The soilshows a low pedogenic development, with a prevalently silty-loam texture, and belongs to the soil subunits Humic Arenic,Dystric and Eutric. Soil texture was obtained using thesedimentation method.
San Rossore pine forestThe San Rossore pine forest (PF) site is located close to the
city of Pisa (Italy), inside the San Rossore regional park, whichstretches along the Tyrrhenian coast between the cities ofViareggio and Livorno (43�360–43�480N, 10�150–10�210E)(Rosenkranz et al. 2005).This protected area is limited by theTyrrhenian Sea on thewest and the riversArno andSerchio on thesouth and north, respectively. The climate is Mediterraneansubhumid (Rapetti and Vittorini 1995; Chiesi et al. 2005)characterised by an average yearly temperature around 14.8�Cand total rainfall precipitation of 900mm. The land covered bytrees ismainly dominatedby the presence of aMediterranean pineforest (Pinus pinaster Ait. and Pinus pinea L.). The averageheight of the plants is 17m, dbh is 29 cm, with a density of565 trees ha–1. The investigated forest has no understory; theslope is <3% and the exposure of the aspect is south-west.Recent marine and fluvial deposits from the Quaternaryrepresent soil parent material that was classified as AlbicArenosols according to the World World Reference Base forSoil Resources (FAO-ISRIC-ISSS 2006). Table 1 summarisesthe main results concerning soil properties of both sites.
1048 Functional Plant Biology T. Zenone et al.

Theoretical principles of GPR and ERT
GPR is an impulse radar system designed for shallow, subsurfaceinvestigations (Morey 1974; Ulriksen 1982; Daniels 1996). GPRis widely used for subsurface exploration and monitoring in civilengineering, archaeology and forensic disciplines. Specificallyapplied to pipeline, cavity, and tunnel detection, it is a non-invasive method performed with hand-held portable units. Theimages obtained are used for evaluating the location and depth ofburied objects and to investigate the presence and continuity ofnatural subsurface conditions and features. GPR operates bytransmitting pulse frequency waves, ranging from 20MHz to3GHz, down into the ground through a transducer call antenna.Each pulse consists of a spectrum of frequencies distributedaround the central frequency of the transmitting antenna(Butnor et al. 2001). The transmitted energy is reflected backto a receiving antenna, from various buried objects, characterisedeach one by a specific dieletric constant. The receiving antennaamplifies the reflected energy and converts it into a similarlyshapedwaveform in a lower frequency range. The system radiatesenergy in an elliptical cone of divergence and scans a footprintarea beneath the antenna (Annan and Cosway 1994; Conyers andGoodman 1997). Because the antenna’s radiation pattern formsan elliptical cone of divergence, small features are sensed beforeand after the antenna are moved directly over them: for theinitially decreasing and then increasing travel time to asubsurface reflector, small subsurface features, such as roots,often produce hyperbolic patterns (Barker and Doolittle 1992).These hyperbolas are readily observable on radar profiles and canaid interpretation. The apex of a hyperbola will occur when theantenna is directly over a root (Butnor et al. 2001). The processedreflectedwaveformsaredisplayedonavideo screenand stored forlater processing or printing.
ERT is a geophysical technique that calculates the subsurfacedistribution of soil electrical resistivity. Electrical resistivity (r,W m), a measure of the ability of a body to limit the transfer ofelectrical current, is defined in cylindrical geometry as:
r ¼ RS
L; ð1Þ
whereR is electrical resistance (W), S is cross-sectional area of thecylinder (m2) and L is the length of the cylinder (m). Soilresistivity surveys are conducted by applying electric currentsto the soil through conductors (electrodes) and measuring theresulting differences in electric potential (voltage) at selectedpositions in the soil (Amato et al. 2008). The distribution in spaceof voltage differences is a function of the different resistivity ofsoil volumes (Kearey et al. 2002). There are different electrodeconfigurations, called electrode arrays (Rhoades et al. 1976)where the electrical current (I) is injected by two electrodesconventionally named ‘A’ and ‘B’ and the potential difference(DV) is measured by two other electrodes ‘M’ and ‘N’. Themeasured electrical resistivity of the prospectedmedium is calledapparent resistivity (ra) and is calculated by:
ra ¼DVI
� 2p1=MA� 1=MBþ 1=NB� 1=NA
; ð2Þ
where MA (MB, NB, NA, respectively) represents the distancebetween electrodes M and A (M and B, N and B, N and A,respectively) (Besson et al. 2004). For geophysical applications,ERT uses electrodes placed also in boreholes. By calculating soilresistivity, it is possible detect water, clay layers, voids, but it isalso possible to reconstruct sections of the ground that can be usedto select and calibrate the parameters for GPR surveys. ERTsurveys that employ electrodes arranged in grids or sets oftransect, as in this case, can be used to reconstruct a 3-Dmodel of the subsurface, allowing the mapping of complexstructures such as root systems.
Data collection
Geophysical investigationPreliminary study. GPR and ERT were preliminarily applied
around the selected trees: some transects along the rows of plantsof the PP were analysed using both techniques, and then a smalltrench was opened with the air-spade to verify the position ofroots.
GPRmeasures. GPR was tested by acquiring 2-D images in asquare grid around the trees in PP and PF.
Table 1. Soil texture and bulk density at different depth of the sites investigatedSL, silty loam; L, loam; S, sand
Depth (cm) Poplar plantation (PP) Pine forest (PF)Texture
% Class % Class
Mineral soil texture 0–10 Clay 11.1 ± 4 L 4.2 ± 3 SSilt 46.9 ± 27 3.4 ± 9Sand 42.0 ± 131 92.4 ± 11
10–20 Clay 13.9 ± 6 SL 3.5 ± 4 SSilt 57.5 ± 0 2.3 ± 18Sand 28.6 ± 7 94.2 ± 21
20–40 Clay 14.4 ± 11 SL 2.3 ± 7 SSilt 60.0 ± 34 0.7 ± 3Sand 25.6 ± 45 97.0 ± 8
Mineral soil bulk density 0–10 g cm–3 0.95 ± 0.04 1.1 ± 0.210–20 g cm–3 1.24 ± 0.04 1.2 ± 0.120–40 g cm–3 1.29 ± 0.02 1.3 ± 0.2
Use of ground-penetrating radar and electrical resistivity tomography to study tree roots Functional Plant Biology 1049
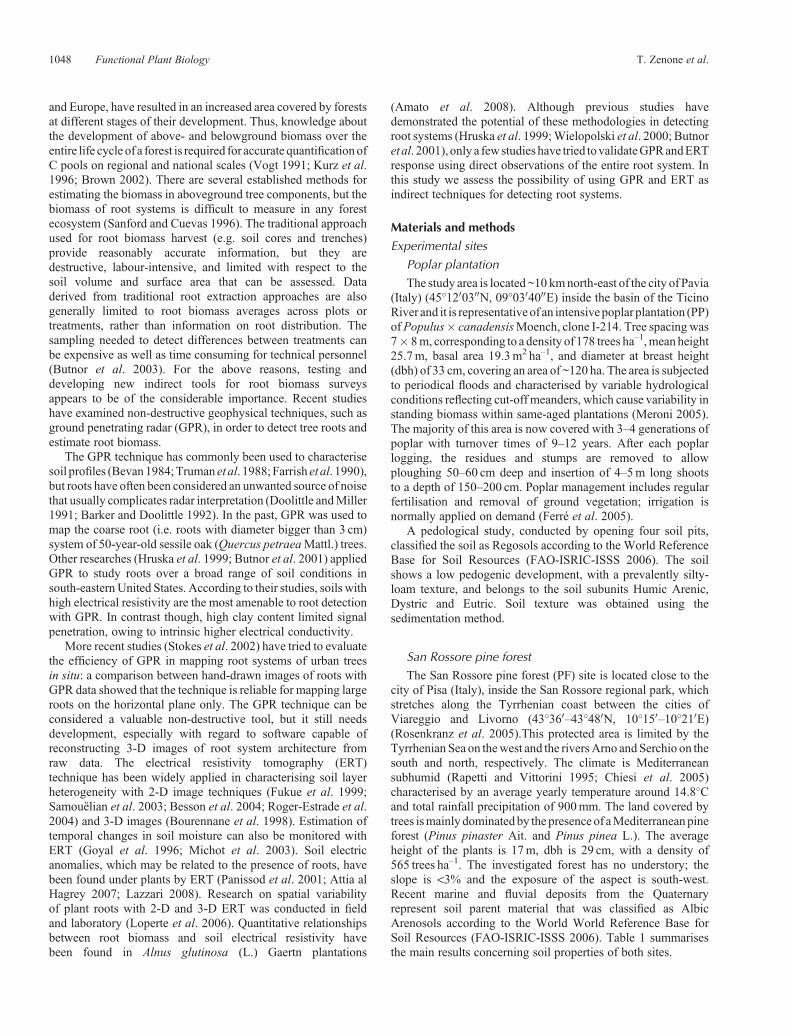
In normal use, square grids are preferred for both GPR linesandERTarrays of electrodes, but in this case itwas also importantto test the results obtainable with circular transect (by rotatingaround the tree with constant radial distance), which shouldensure a quasi-perpendicular scanning of root systems (Fig. 1).The use of circular transect at different radiuses around the treewas tested at the PF site, but inmany cases it was difficult to set upbecause of soil roughness. GPR was also tested by 3-D imagetechniques: in this case the density of survey lines was increasedby acquiring data every 25 cm in both directions on a regularsquare grid and employing a 1500MHz antenna: data wereintegrated in ‘time-slice’ fashion, where the 3-D block isformed and then cut in horizontal planes at constant delay time(equivalent to constant depth if the velocity of wave propagationis homogeneous throughout the surveyed area), providing aseries of ‘maps’ of the targets detected and resulting in 3-Dmaps, which, in principle, can detect roots or other featuresregardless of their direction.
GPR was tested with antennas characterised by differentcentre frequencies; according to literature 900–1000MHzantennas have mostly been used for this kind of application,but for poplar trees, higher frequencies (1500–2000MHz) allowabetter detection of very small roots. In the cases studied the1500MHz antenna (Geophysical Survey Systems, Inc, Salem,NH,USA) proved to be themost suitable, especially for treeswitha dominant radial expansion of the root system. At the PF site, weadded a multi-temporal analysis to investigate how the soilmoisture influences the accuracy of GPR data.
Themulti-temporal GPR analysis wasmade in earlyApril andMay (36 day lag); measurements of watertable level and soilhumidity showed a higher watertable (~50 cm) in April but lowshallow water content, and in May a significant decrease ofwatertable level (a drop of 25–30 cm from April) and thepresence of very shallow high water content, caused the lastby a rainfall occurred within 24 h before the measurements.
In order to assign GPR signals to each monitored tree, a mapwith the distance and position of the surrounding plants wascreated (Fig. 8).
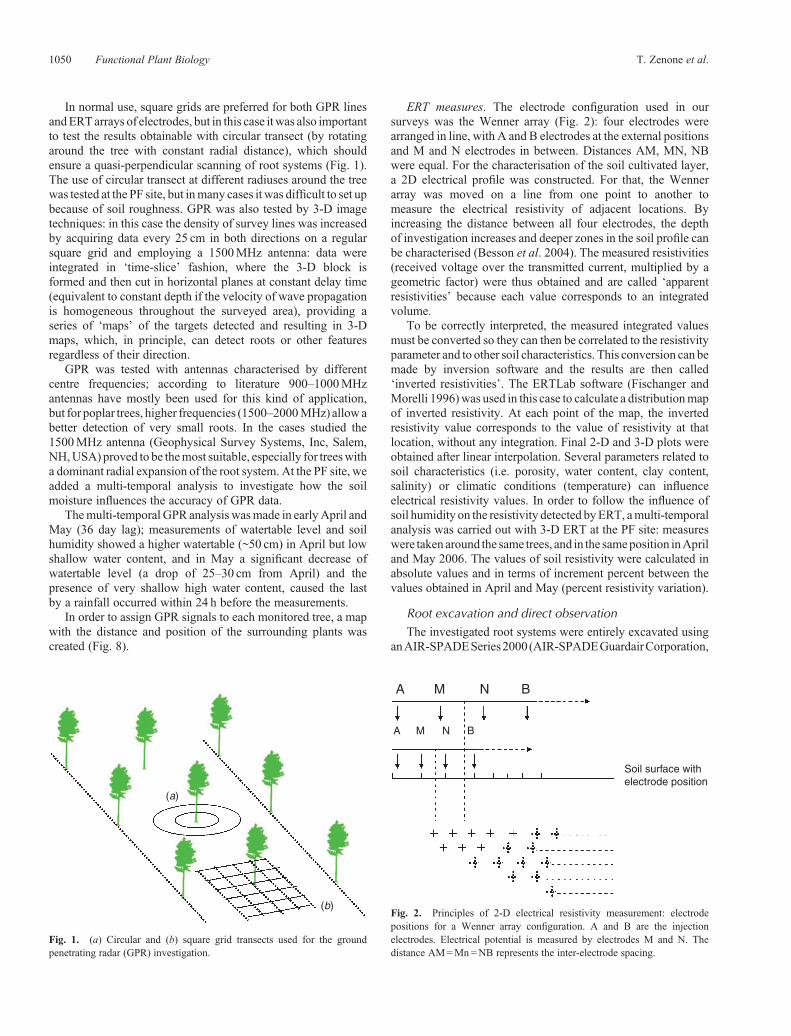
ERT measures. The electrode configuration used in oursurveys was the Wenner array (Fig. 2): four electrodes werearranged in line, with A and B electrodes at the external positionsand M and N electrodes in between. Distances AM, MN, NBwere equal. For the characterisation of the soil cultivated layer,a 2D electrical profile was constructed. For that, the Wennerarray was moved on a line from one point to another tomeasure the electrical resistivity of adjacent locations. Byincreasing the distance between all four electrodes, the depthof investigation increases and deeper zones in the soil profile canbe characterised (Besson et al. 2004). The measured resistivities(received voltage over the transmitted current, multiplied by ageometric factor) were thus obtained and are called ‘apparentresistivities’ because each value corresponds to an integratedvolume.
To be correctly interpreted, the measured integrated valuesmust be converted so they can then be correlated to the resistivityparameter and to other soil characteristics. This conversion can bemade by inversion software and the results are then called‘inverted resistivities’. The ERTLab software (Fischanger andMorelli 1996)was used in this case to calculate a distributionmapof inverted resistivity. At each point of the map, the invertedresistivity value corresponds to the value of resistivity at thatlocation, without any integration. Final 2-D and 3-D plots wereobtained after linear interpolation. Several parameters related tosoil characteristics (i.e. porosity, water content, clay content,salinity) or climatic conditions (temperature) can influenceelectrical resistivity values. In order to follow the influence ofsoil humidity on the resistivity detected byERT, amulti-temporalanalysis was carried out with 3-D ERT at the PF site: measureswere taken around the same trees, and in the sameposition inApriland May 2006. The values of soil resistivity were calculated inabsolute values and in terms of increment percent between thevalues obtained in April and May (percent resistivity variation).
Root excavation and direct observationThe investigated root systems were entirely excavated using
anAIR-SPADESeries2000(AIR-SPADEGuardairCorporation,
(a)
(b)
Fig. 1. (a) Circular and (b) square grid transects used for the groundpenetrating radar (GPR) investigation.
A M N B
A M N B
Soil surface withelectrode position
Fig. 2. Principles of 2-D electrical resistivity measurement: electrodepositions for a Wenner array configuration. A and B are the injectionelectrodes. Electrical potential is measured by electrodes M and N. Thedistance AM=Mn=NB represents the inter-electrode spacing.
1050 Functional Plant Biology T. Zenone et al.

(a) (b)
(B)
(A)
0
0.20
0.40
0.60
410
310
290
380
340
800
410
220
550
850
2100.1
0.2
0.3
0.4
0.5
0.6
0.7
0 0.5
[Resistivity] [Ohm·m]
1.5
150.0 575.0 787.5 1000.0362.5
2.521 3
Fig. 3. (a, b) Comparisons between radar profile with antenna of 1500MHz (A), 2-D lines electrical resistivity tomography (ERT) section (B), and directobservation of the poplar tree roots. In this case the ground penetrating radar (GPR) was able to detect roots of (a) 17mm (b) and 20mm depth 35 and 30 cm,respectively.ERTsection showagoodcorrespondencebetweenpositionof the roots andareaswhere soil resistivity is higher.Values in the y-axis is thedepth (m)of investigation and in x-axis the distance (m).
0.00.0
1.00
2.00
3.00
4.00
Y
0.0
1.00
2.00
3.00
4.00
2.00
(a) (b)
4.000.0 2.00 3.001.00 4.00
4.00(0.0,0.0)
Fig. 4. 3-D radar profile obtainedwith antenna of (a) 1500MHz and (b) 900MHz, using square grid of 25� 25 cm, and direct observation of the roots system.
Use of ground-penetrating radar and electrical resistivity tomography to study tree roots Functional Plant Biology 1051

Chicopee, MA, USA) connected to a Moto-compressor (Mod.Atlas Copco XAS 90. 5400 Lmin–1, 7.5 bar; Atlas Copco S.p.ACinisello,Balsamo, Italy).Theair spadesystemusesaproprietary,synergistic combination of supersonic jets of air and high flowpneumatic vacuum transport. Supersonic air jets are extremelyeffective at penetrating most types of soil, but are harmless to alltypes of non-porous buried objects. This technique allowed thediggingoutof themain root systemwithout damaging them.Afterremoval of shallow soil, roots were pulled out using a digger.In order to acquire morphological information on root system, tobe comparedwith theGPRandERTmethods, poplar root systemswere scanned using a spot Zoller + Fröhlich GmbH lasermeasurement system LARA 53500 (Zoller + Fröhlich GmbHElektrotechnik Wangen Germany). In order to reduce the effectofocclusion, rangescansweremade from10differentviewpoints.Range scan data were processed using JRC–Reconstructorsoftware (European Commission, DG-JRC, IPSC, Ispra, Italy)and 3-D models were exported in dxf format (CAD).
Results and discussion
Preliminary investigationsmade at the PP site are shown in Fig. 3,where the geophysical sections were verified with shallowtrenches: a comparison between 2-D profiles of (Fig. 3a) GPR
0.0
1.00
2.00
3.00
4.001.00 0.50
4.00
3.00
2.00
1.00
0.0
1.000.50
Fig. 5. 2-D Radar profile obtained with antenna of 900MHz. Red and orange line represent the radar transects.
Fig. 6. Comparison between 3-D rendering of laser-scan point cloud andground penetrating radar (GPR) sections. The red points, present in GPRsection, represent the root position.
1052 Functional Plant Biology T. Zenone et al.

(a)
(b)
(c)
(d)
Fig. 7. Radar profile obtained with a circular transect on Pinus pinea root system: measurementswere done using radius of 120 and 80 cm, and antenna of 1500Mhz. The x-axis represents the distanceand y-axis the depth of the ground penetrating radar (GPR) signal.
Use of ground-penetrating radar and electrical resistivity tomography to study tree roots Functional Plant Biology 1053

(Fig. 3b) and ERT shows that the three main characteristics ofroots that influence their detectability are size, depth anddirection. High frequency GPR (1500MHz antenna) can detecteven small roots, but if the direction of the root is not perfectlyperpendicular to the profile, the classic hyperbolic anomaly shapeof GPR targets is lost, and so is the possibility to identify the trueposition. The unsaturated sand and silt layers that characterise thetopsoil in both cases allowed good signal penetration (1.5–2m),even at the high frequencies, which were needed to achieve thebest resolution.
ERT can detect spots of the soil that aremore resistive than thebackground of each layer, and that correspond to the presence ofroots, independent of their direction. Electrical measurementsalso improve knowledge of the stratigraphy of the soil by clearlyindicating a gravel layer around 0.5m depth, which cannot beclearly defined by GPR surveying.
The results of the 3-D GPR acquisition technique arounda root system at the PP site are presented in Fig. 4, where theblue spots (high reflectivity), indicate the presence of roots.Figure 4a and b represent two GPR maps at different delaytimes (equivalent to plan views at a certain depth, dependingon the wave velocities of the soil), and show that the3-dimensionality of roots (very seldom found parallel to thesurface, but rather inclined at random angles) requires the useof several planes to reconstruct their position.
The mesh-shaped white lines that are present throughout themaps are artefacts related to the strong directionality of GPRprofiles, in this case evenly distributed along parallel lines in bothx and y directions. These could be removed using a processingstrategy called ‘migration’, which is applied to reduce allhyperbola shapes into point-wise anomalies by estimating anaveragewave velocity;migrationwas applied on each 2-Dprofile(results shown inFig. 5) butwasverydifficult in this caseowing tothe high variability of wave velocities in the shallow soil.Migration could also be applied to a full 3-D block of GPRprofiles, but it would require a very small line spacing (a few cmwhen using frequencies above 500MHZ) and extremely accuratepositioning, which is impossible over a ground surface withaverage roughness.
The analyses of vertical GPR sections (acquired around thesame poplar tree) are shown in Fig. 5, and confirm the difficulty indetecting roots that have a complex angle respect to the directionof survey lines. Some roots were clearly detected as hyperbolicfeatures, if perpendicular to a GPR scan and in positions wherethe silty-clayey topsoil does not attenuate the signal. Comparingthis GPR scans to the one shown in Fig. 3, we note howheterogeneous was the electrical and electromagnetic responseof the soil in this site, where in a range of a few tens of metres theclay content on the top 40–50 cm can vary greatly. The 3-Drendering of migrated GPR scans, integrated with the point cloudobtained through laser scanning of the root system after itsextraction (Fig. 6), may be a promising technique for testingthe possibility of using GPR for mapping the entire root systemfollowing the position and shape of every component. Theextraction of the root system may induce the deformation of itsshape and the loss of smaller parts, but the overall directions,angles and densities are preserved.
GPR data requires a great deal of memory and high resolutiongraphics, but it can show the real volumetric distribution of the
GPR targets and help to distinguish between roots and other kindsof reflections. For example, some roots approach in depth theinterface between the silty topsoil and the deeper sandy layer,where the reflection of the geologic interface sums up to theechoes originated by the roots themselves.
At the PF site, the overall conditions (main roots shallow insandy soil) were much more favourable to GPR and ERTmeasurements. GPR circular profiles collected in April(Fig. 7a, c) and May (Fig. 7b, d): the top sections of the figureare relative to a radial distance of 120 cm, and the bottom ones arerelative to a radius of 80 cm (Fig. 7). GPR signal attenuation insaturated layers was very strong in April, with high noise clearlyvisible below the 40–50 cm depth, and deeper targets are welldetectable down to 80–90 cm in depth in May because of thenatural drawdown of groundwater.
The top 5–10 cm of soil were actually found less humid inApril, thus causing higher reflectivity (red-blue colour in thefigures) at early delay times inGPRsections; instead, higherwatercontent in shallow soil was present inMay, because of occasionalrain events, thus, causing lower reflectivity in the GPR signal andan increasing contrast in electrical properties, so that thehyperbolas relative to root targets resulted more clearly(Fig. 7d). This effect may also be due also to higher watercontent in the roots, which increases their relative dielectricconstant with respect to the surrounding soil. In this case, animportant improvement is provided by the analysis of circularGPR scans, which allow a quasi-perpendicular intersection withmost of the roots, thus generating hyperbolic features for thetargets. The hyperbolas, in GPR data, are useful for thediscrimination of point-wise targets and also to calculate thewave velocities for each location (the width of each hyperboladepends on the dielectric constant of the surrounding soil).Unfortunately, circular scans cannot be easily performed withmany different radial distances, as accurate positioning is verydifficult. Furthermore, the intercepted roots may be those ofsurrounding trees, which in this case are present at averagedistances of 4–5m (Fig. 8), thus, implying that radial GPR
5 m
5.1 m
5.9 m
4.5 m
D1
9 m5 m
6.2 m
3
2
S
W E
N1
4
5
6 m3.1 m
2.9 m 4.8 m
4 m
6 7
Fig. 8. Position of the trees surrounding the Pinus pinea investigated.
1054 Functional Plant Biology T. Zenone et al.

5.5(a)
(c)
(b)
(d)
(f )
(e)
4.5
3.5
2.5
5.5 6.5 7.54.53.5
5.5
150
400
1200
3000Resistivity (Ohm.m)
4.5
3.5
2.5
5.5
4.5
3.5
2.5
5.5 6.5 7.54.53.5
5.5 6.5 7.54.53.5
5.5
6.5
7.5
4.5
3.5
2.5
5.5
2.5
5.5
5.5
6.5
7.5
4.5
3.5
5.5 6.5 7.54.53.5
5.5
4.5
3.5
2.5
Fig. 9. Comparison between electrical resistivity tomography (ERT) section and rendering of laser-scan point cloud(Pinus pinea roots system). ERT horizontal plane sectionmeasured 15 cmbelow surface; (a) volumetric water content (TDR)9.2. (b) ERT Horizontal plane 30 cm below surface; (c) TDR 10.9%. 3-D View: in red values higher than 2500Ohm.�m.(a–c) Measurements were conducted on 4 April 2006. ERT horizontal plane section measured 15 cm below surface;(d) (TDR) 13.2%. (e) ERT horizontal plane 30 cm below surface (TDR) 5.75%. ( f ) 3-D View: in red values higher than2500Wm. (d–f ) Measurements were conducted on 10 May 2006.
Use of ground-penetrating radar and electrical resistivity tomography to study tree roots Functional Plant Biology 1055

surveying should be analysed in 3-D fashion on a large area to beable to isolate roots from individual trees.
In general, the problems related to circular scanning are of twokinds: practical (ground roughness in many cases makes it verydifficult to slide theGPRantenna properlywhilemoving around atree) and related to 3-D data analysis (at present there is no
software available to input and analyse a dense series of circularscans into a full 3-D model).
For the same plant at the PF site, the multi-temporal analysisconductedwith 3-DERTmeasurements is presented in twoways:absolute resistivity volumes (horizontal plane and section Figs 9and 10, respectively), and percent resistivity variations (Fig. 10).
1.81.61.41.21.00.80.60.40.20.0
–0.8
3.5 4.5 5.5 6.5 7.5
(a) (b)
3.5 4.5 5.53.52.5 4.5 5.53.52.5 4.5 5.5
6.5 7.5
–0.6–0.4–0.2
1.81.61.41.21.00.80.60.40.20.0
–0.8–0.6–0.4–0.2
Fig. 10. Vertical section across main roots measured in (a) April and (b) May.
(a)(b)
(c)
3.54.5
5.5
3.52.54.5 5.5
6.57.5
1.81.61.41.21.00.80.60.40.20.0
–0.8–0.6–0.4–0.2
5.5
6.5
7.5
4.5
3.5
5.5 6.5 7.54.53.5
5.5
4.5
3.5
2.5
5.5
4.5
3.5
2.5
–100
100
0
200Resistivity increment %
Fig. 11. Comparison between 3-D resistivity percent increments higher than 100% of electrical resistance and 3-D rendering of Laser-scan pointcloud of Pinus pinea roots system: (a) 3-D view; horizontal plane, (b) 25 cm below surface, and (c) vertical section.
1056 Functional Plant Biology T. Zenone et al.

The absolute values, in both April (Fig. 9a–c, Fig. 10a) andMay (Fig. 9d–f, Fig. 10b), show a very complex electricalbehaviour of shallow soil, with the expected general indication(roots are theoreticallymore resistive than the surrounding soil, asseen in the case of the poplar trees) but not evident for all rootsfound, especially in April, when very shallow water content waslower and the contrast between roots and dry soil (sandy soiltexture) was not strong enough.
After a single, but significant rain event, in May the topsoilbecamewetter (evidentwhen comparing plan views in Fig. 9b, e),and the background soil around the roots more electricallyconductive. Thus, on analysing increment percent differenceimages (Fig. 11), where the areas of higher resistivityincrement are shown in red, and dark blue shows the negativechanges) provides a reliable overlap of root positions withvariations of resistivity. Different roots are detected dependingon their depth and downward angle: one directed to the upper farright corner is shallow, almost parallel to the surface and it createsa sharp horizontal boundarywherewater drawdown is impeded; asecond one heading towards the bottom right has a noteworthydownward angle and so it produces aweaker resistivity increase; athirddensegroupof roots is almost vertically alignedalong the taproot: it attracts a great deal of water in deeper soil (see verticalsection in Fig. 11c).
This analysis suggests that the multi-temporal ERT methodcan be employed, in general, in combination with natural orartificial changes of soil humidity to create a sort of ‘tracer’experiment where the 3-dimensionality of the measurements isfundamental in correctly reconstructing the root distribution andthe interaction with soil and its water content. ERT and GPRtesting coupled with induced wetting of the topsoil may be one ofthe major improvements for future work. In this paper, this wasdone in different periods of the spring, but the speed of ERTmeasurements (15–30min to collect a full 3-D block using up toseveral hundred electrodes) will allow future studies where theinfiltration of water can be slowly induced and monitored.
Conclusion
For the purpose of optimising analyses of root systems, this paperunderlines the need to integrate different techniques: the GPRmethod, capable of detecting the distribution of the tree roots inthe subsoil with higher resolution, and 3-D ERT, useful incorrelating the recovered resistivity distribution with rootvolumes. Although strong soil heterogeneities made it difficultto obtain much more detailed stratigraphic information aroundpoplar trees, the work performed on the pine trees shows that thespatial distribution of roots can be integrated with electricalresistivity 3-D models. The use of difference images betweensuccessive sets of data was found to be a powerful method, as theroots act as a ‘filter’ for water, thus causing a local increase inresistivity after a wetting period. The comparison of GPRtransects in conditions of different water content helped todefine the best periods for the application of a method that isstrongly influenced by the presence of water and conductive soilin general.
Three-dimensional ERT can be useful in correlating therecovered resistivity distribution with root volumes. Inparticular, the extraction of volumes of resistivity percent
increment between dry and wet conditions in the subsoilaround the trees appears to be a parameter that can be directlyrelated to the volumesof roots. Themain information arising fromERT measurements is water content and clay distribution in alldirections. This gives an important complement to thestratigraphic knowledge of the topsoil, with possiblecalibration of the layer thickness (not directly obtainable fromGPR). Furthermore, the density of roots may be related to theaccumulation of capillary water and to the presence of lowresistivity haloes around the tree. Geophysical surveys mayprove to be a useful approach in root investigation, both indescribing the shape and behaviour of roots in the subsoil andin estimating the belowground biomass.
Further studies should be directed in two areas: first,improvement of a standard field procedure in performinggeophysical surveys; second, the development of a statisticalprocessing tool to relate total belowground biomass togeophysical parameters.
Acknowledgements
This research was partly funded by the CarboEurope IP project (EU-ContractNo. GOCE-CT-2003- 505572), FISR Carboitaly, and by the JRC-IES-CCU-Action 24002 – Greenhouse Gases in Agriculture, Forestry and Other LandUses – GHG-AFOLU. We thank all colleagues of the Climate Change Unitswho helped us with the direct measurements.
References
Amato M, Basso B, Celano G, Bitella G, Morelli G, Rossi R (2008) In situdetectionof tree root distribution andbiomassbymultielectrode resistivityimaging. Tree Physiology 28, in press.
AnnanAP,CoswaySW (1994)GPR frequency selection. In ‘Proceedings 5thInternational Conference on Ground Penetrating Radar. Waterloo Centrefor Groundwater Research and Canadian Geotechnical Society.Kitchener, ON’. pp. 747–760. (University of Waterloo: CA)
Attia al Hagrey S (2007) Geophysical imaging of root-zone, trunk, andmoisture heterogeneity. Journal of Experimental Botany 58, 839–854.doi: 10.1093/jxb/erl237
Barker DB, Doolittle J (1992) Ground-penetrating radar – an archaeologicaltool. Cultural Resource Management Bulletin 15, 25–28.
Besson A, Cousin I, Samouëlian A, Boizard H, Richard G (2004) Structuralheterogeneity of the soil tilled layer as characterized by 2D electricalresistivity surveying. Soil & Tillage Research 79, 239–249. doi: 10.1016/j.still.2004.07.012
Bevan BW (1984) Environmental effects on ground-penetrating radar. In‘Expanded abstracts of the technical meeting, 54th meeting of the societyof exploration geophysicists’. pp. 201–204. (SEG: Tulsa, OK)
Bourennane H, King D, Le Parco R, Isambert M, Tabbagh A (1998)Three-dimensional analysis of soils and surface materials by electricalresistivity survey. European Journal of Environmental and EngineeringGeophysics 3, 5–23.
Brown S (2002) Measuring carbon in forests: current status and futurechallenges. Environmental Pollution 116, 363–372. doi: 10.1016/S0269-7491(01)00212-3
Brown S, Iverson LR, Prasda A, Liu D (1993) Geographical distributions ofcarbon in biomass and soils of tropical Asian forests. GeocartoInternational 8, 45–59.
Butnor JR, Doolittle JA, Kress L, Cohen S, Johnsen KH (2001) Use ofground-penetrating radar to study tree roots in the southeastern UnitedStates. Tree Physiology 21, 1269–1278.
Butnor JR,Doolittle JA, JohnsenKH, SamuelsonL, Stokes T,Kress L (2003)Utility of ground penetrating radar as a root biomass survey tool in forestsystems. Soil Science Society of America Journal 67, 1607–1615.
Use of ground-penetrating radar and electrical resistivity tomography to study tree roots Functional Plant Biology 1057

Chiesi M, Maselli F, Bindi M, Fibbi L, Cherubini P, Arlotta E, Tirone G,MatteucciG, SeufertG (2005)Modelling carbonbudget ofMediterraneanforests using ground and remote sensingmeasurements. Agricultural andForest Meteorology 135, 22–34. doi: 10.1016/j.agrformet.2005.09.011
Conyers LB, Goodman D (1997) ‘Ground penetrating radar: an introductionfor archaeologists.’ (Alta Mira Press: Walnut Creek, CA)
Daniels DJ (1996) ‘Surface penetrating radar.’ (Institute of ElectricalEngineers: London)
DixonRK,TrexlerMC,Wisniewski J, BrownS,HoughtonRA,SolomonAM(1994) Carbon pools and flux of global forest ecosystems. Science 263,185–190. doi: 10.1126/science.263.5144.185
Doolittle JA, Miller WF (1991) Use of ground penetrating radar inarchaeological investigations. In ‘Application of space-age technologyin anthropology conference proceedings’. (Eds CA Behrens, TL Sever)pp. 81–94. (NASA John C Stennis Space Center)
FAO-ISRIC-ISSS (2006) ‘World reference base for soil resources.World soilresources reports.’ (Food and Agriculture Organization of the UnitedNations: Rome)
Farrish KW, Doolittle JA, Gamble EE (1990) Loamy substrata and forestproductivity of sandy glacial drift soils in Michigan. Canadian Journalof Soil Science 70, 181–187.
Ferré C, LeipA,Matteucci G, Previtali F, Seufert G (2005) Impact of 40 yearspoplar cultivation on soil carbon stocks and greenhouse gas fluxes.Biogeosciences Discussions 2, 897–931.
Fischanger F, Morelli GF (1996) Metodi di indagine geoelettrica. GeostudiAstier srl – Italy. Available at http://www.geoastier.com/ [Verified4 September 2008].
Fukue M, Minatoa T, Horibe H, Taya N (1999) The microstructure of claygiven by resistivity measurements. Engineering Geology 54, 43–53.doi: 10.1016/S0013-7952(99)00060-5
Goodale CL, AppsMJ, Birdsey RA, Field CB, Heath SL, et al. (2002) Forestcarbon sinks in the northern hemisphere. Ecological Applications 12,891–899. doi: 10.1890/1051-0761(2002)012[0891:FCSITN]2.0.CO;2
Goyal VC, Gupta PK, Seth PK, Singh VN (1996) Estimation of temporalchanges in soilmoisture using resistivitymethod.HydrologicalProcesses10, 1147–1154. doi: 10.1002/(SICI)1099-1085(199609)10:9<1147::AID-HYP366>3.0.CO;2-S
Hruska J, Cermak J, Sustek S (1999) Mapping tree roots system with groundpenetrating radar. Tree Physiology 19, 125–130.
Kearey P, Brooks M, Hill I (2002) ‘An introduction to geophysicalexploration.’ (Blackwell Science: Oxford)
Kurz WA, Beukema SJ, Apps MJ (1996) Estimation of root biomass anddynamics for the carbon budget model of the Canadian forest sector.Canadian Journal of Forest Research 26, 1973–1979. doi: 10.1139/x26-223
Lazzari L (2008) Study of spatial variability of soil root zone properties usingelectrical resistivity technique. Ph.D. Thesis, University of Basilicata,Potenza, Italy.
Loperte A, Satriani A, Lazzari L, AmatoM, Celano G, Lapenna V,Morelli G(2006) 2-D and 3-D high resolution geoelectrical tomography for non-destructive determination of the spatial variability of plant rootdistribution: Laboratory experiments and field measurements.Geophysical Resource Abstract Wien 8, 06749.
Meroni M (2005) Determinazione di parametri biofisici da osservazioniremote per la stima del bilancio del carbonio di ecosistemi forestali.Ph.D.Thesis,University ofTusciaDepartment ofForestEnvironment andResources University of Tuscia, Viterbo, Italy.
Michot D, Benderitter Y, Dorigny A, Nicoullaud B, King D, Tabbagh A(2003) Spatial and temporal monitoring of soil water content with anirrigated corn crop cover using electrical resistivity tomography. WaterResources Research 39, 1138–1160. doi: 10.1029/2002WR001581
Morey RM (1974) Continuous subsurface profiling by impulse radar. In‘Proceedings ASCE Engineering Foundation Conference on SubsurfaceExploration for Underground Excavations and Heavy Construction’.pp. 212–232. (American Society of Engineers: New York)
Panissod C,Michot D, Benderitter Y, TabbaghA (2001) On the effectivenessof 2-D electrical inversion results: an agricultural case study.GeophysicalProspecting 49, 570–576. doi: 10.1046/j.1365-2478.2001.00277.x
Peichl M, Altaf Arain M (2007) Allometry and partitioning of above- andbelowground treebiomass in an age-sequenceofwhitepine forests.ForestEcologyandManagement253, 68–80.doi: 10.1016/j.foreco.2007.07.003
Rapetti F, Vittorini S (1995) ‘Carta climatica della Toscana.’ (Pacini Editore:Pisa)
Rhoades JD, Raats PAC, Prather RJ (1976) Effect of liquid phase electricalconductivity, water content, and surface conductivity on bulk soilelectrical conductivity. Soil Science Society of America Journal 40,651–655.
Roger-Estrade J, Richard G, Caneill J, Boizard H, Coquet Y, Defossez P,Manichon H (2004) Morphological characterisation of soil structure intilled fields: from a diagnosis method to the modelling of structuralchanges with time. Soil & Tillage Research 79, 33–49. doi: 10.1016/j.still.2004.03.009
Rosenkranz P, Brüggemann N, Papen H, Xu Z, Seufert G, Butterbach-Bahl K (2005) N2O, NO and CH4 exchange and microbial N turnoverover a Mediterranean pine forest soil. Biogeosciences Discussions 2,673–702.
Samouëlian A, Cousin I, Richard G, Tabbagh A, Bruand A (2003) Electricalresistivity imaging for detecting soil cracking at the centimetric scale. SoilScience Society of America Journal 67, 1319–1326.
Sanford RL, Cuevas E (1996) Root growth and rhizosphere interactions intropical forest. In ‘Tropical forest plant ecophysiology’. (Eds SSMulkey,RL Chazdon, AP Smith) pp. 269–300. (Chapman Hall: New York)
Stokes A, Fourcaud T, Hruska J, Cermak J, Nadyezhdin N, Praus L (2002)An evaluation of different methods to investigate root system architectureof urban trees in situ: I.Groundpenetrating radar.Journal ofArboriculture28, 2–10.
Truman CC, Perkins HF, Asmussen LE, Allison HD (1988) Someapplications of ground-penetrating radar in southern Coastal PlainsRegion of Georgia. The Georgia Agricultural Experiment Stations.College of Agriculture University of Georgia. Athens GA. ResearchBulletin 362, 362.
Ulriksen CPF (1982) Application of impulse radar to civil engineering. Ph.D.Thesis, Department of Engineering and Geology, Lund University ofTechnology, Lund, Sweden.
Vogt K (1991) Carbon budgets of temperate forest ecosystems. TreePhysiology 9, 69–86.
Wielopolski L,HendreyG,McGuiganDJM (2000) Imaging tree root systemsin situ. In ‘Proceedings of the 8th International Conference on GroundPenetrating Radar, Gold Coast, Qld, Australia’. (Eds DA Noon,GF Stickley, D Longstaff) pp. 642–646. (University of Queensland:Brisbane)
Manuscript received 8 March 2008, accepted 4 August 2008
1058 Functional Plant Biology T. Zenone et al.
http://www.publish.csiro.au/journals/fpb
Related Documents