Cost estimates for carbon sequestration from fast growing poplar plantations in Canada Daniel W. McKenney a, * , Denys Yemshanov a , Glenn Fox b , Elizabeth Ramlal b a Canadian Forest Service, Great Lakes Forestry Centre, 1219 Queen Street East, Sault Ste. Marie, ON, Canada P6A 2E5 b Department of Agricultural Economics and Business, University of Guelph, Guelph, ON, Canada N1G 2W1 Abstract With concern over human activities affecting the Earth’s climate, the potential role of forests to sequester carbon is of growing interest to national policy-makers. Countries like Canada may be able to use afforestation of marginal agricultural lands to sequester carbon in a cost-effective manner. A spatial simulation study that links the biology and economics of afforestation of marginal agricultural lands in Canada using a modified Hartman-type model is presented. The model recognizes wood production and carbon sequestration and calculates ‘break-even’ carbon prices inclusive of an opportunity cost for agricultural production values. A simplified carbon budget-tracking algorithm is used that predicts accumulation of carbon in soil, litter, standing aboveground and root biomass, carbon flows among ecosystem components and CO 2 release from biomass and forest products decay. Variables are represented as probability distribution functions. Monte-Carlo simulation and sensitivity analysis techniques are used to help assess both biological and economic uncertainty. Some results are presented for Canada and issues identified to improve model results (e.g. spatially varying estimates of productivity). Substantively more land is attractive for afforestation in Western Canada than Eastern Canada but results are highly sensitive to growth and yield assumptions and spatial variation in agricultural production opportunity costs. D 2004 Elsevier B.V. All rights reserved. Keywords: Carbon; Cost-benefit analysis; Geographic information system; Afforestation; Parameter uncertainty; Spatial analysis; Break-even carbon prices 1. Introduction Climate change from anthropogenic emissions of greenhouse gases, such as CO 2 , is believed by some to be one of the most significant environmental concerns of the 21st century (IPCC, 2001; see Essex and McKitrick, 2002 for an alternative view). In Canada, annual emissions of CO 2 were estimated as 5.9610 8 tons of CO 2 -equivalent (1.6210 8 tons of C equivalent) in 1990 ( Jacques, 1998) and 7.2610 8 tons of CO 2 -equivalent (1.9710 8 tons of C equivalent) in 2000 (Environment Canada, 2001). A specific target of a 25% reduction of CO 2 emissions below 1990 levels by the year 2012 has been set through the so-called Kyoto protocol. Canada’s federal government has recently ratified the Kyoto protocol. To meet the Kyoto target, Canadian emissions must be 5.6010 8 tons of CO 2 equivalent, which is 29% below the emission estimates expected for the commitment period. 1389-9341/$ - see front matter D 2004 Elsevier B.V. All rights reserved. doi:10.1016/j.forpol.2004.03.010 * Corresponding author. Tel.: +1-705-541-5569; fax: +1-705- 541-5700. E-mail addresses: [email protected] (D.W. McKenney), [email protected] (D. Yemshanov), [email protected] (G. Fox), [email protected] (E. Ramlal). www.elsevier.com/locate/forpol Forest Policy and Economics 6 (2004) 345 – 358

Welcome message from author
This document is posted to help you gain knowledge. Please leave a comment to let me know what you think about it! Share it to your friends and learn new things together.
Transcript
www.elsevier.com/locate/forpol
Forest Policy and Economics 6 (2004) 345–358
Cost estimates for carbon sequestration from fast growing poplar
plantations in Canada
Daniel W. McKenneya,*, Denys Yemshanova, Glenn Foxb, Elizabeth Ramlalb
aCanadian Forest Service, Great Lakes Forestry Centre, 1219 Queen Street East, Sault Ste. Marie, ON, Canada P6A 2E5bDepartment of Agricultural Economics and Business, University of Guelph, Guelph, ON, Canada N1G 2W1
Abstract
With concern over human activities affecting the Earth’s climate, the potential role of forests to sequester carbon is of
growing interest to national policy-makers. Countries like Canada may be able to use afforestation of marginal agricultural lands
to sequester carbon in a cost-effective manner. A spatial simulation study that links the biology and economics of afforestation
of marginal agricultural lands in Canada using a modified Hartman-type model is presented. The model recognizes wood
production and carbon sequestration and calculates ‘break-even’ carbon prices inclusive of an opportunity cost for agricultural
production values. A simplified carbon budget-tracking algorithm is used that predicts accumulation of carbon in soil, litter,
standing aboveground and root biomass, carbon flows among ecosystem components and CO2 release from biomass and forest
products decay. Variables are represented as probability distribution functions. Monte-Carlo simulation and sensitivity analysis
techniques are used to help assess both biological and economic uncertainty. Some results are presented for Canada and issues
identified to improve model results (e.g. spatially varying estimates of productivity). Substantively more land is attractive for
afforestation in Western Canada than Eastern Canada but results are highly sensitive to growth and yield assumptions and
spatial variation in agricultural production opportunity costs.
D 2004 Elsevier B.V. All rights reserved.
Keywords: Carbon; Cost-benefit analysis; Geographic information system; Afforestation; Parameter uncertainty; Spatial analysis; Break-even
carbon prices
1. Introduction
Climate change from anthropogenic emissions of
greenhouse gases, such as CO2, is believed by some
to be one of the most significant environmental
concerns of the 21st century (IPCC, 2001; see Essex
and McKitrick, 2002 for an alternative view). In
1389-9341/$ - see front matter D 2004 Elsevier B.V. All rights reserved.
doi:10.1016/j.forpol.2004.03.010
* Corresponding author. Tel.: +1-705-541-5569; fax: +1-705-
541-5700.
E-mail addresses: [email protected] (D.W. McKenney),
[email protected] (D. Yemshanov), [email protected]
(G. Fox), [email protected] (E. Ramlal).
Canada, annual emissions of CO2 were estimated
as 5.96�108 tons of CO2-equivalent (1.62�108 tons
of C equivalent) in 1990 (Jacques, 1998) and
7.26�108 tons of CO2-equivalent (1.97�108 tons
of C equivalent) in 2000 (Environment Canada,
2001). A specific target of a 25% reduction of
CO2 emissions below 1990 levels by the year 2012
has been set through the so-called Kyoto protocol.
Canada’s federal government has recently ratified the
Kyoto protocol. To meet the Kyoto target, Canadian
emissions must be 5.60�108 tons of CO2 equivalent,
which is 29% below the emission estimates expected
for the commitment period.
D.W. McKenney et al. / Forest Policy and Economics 6 (2004) 345–358346
The potential for using forests as a short-term
method for reducing atmospheric concentrations of
carbon dioxide is well recognized (van Kooten et
al., 1992; Sedjo et al., 1995; Cannell, 1999). The
Kyoto protocol allows countries to claim as a credit
against their emissions any verifiable amount of
carbon sequestered as a result of afforestation
undertaken since 1990. All carbon assimilated by
newly planted, and importantly, unanticipated prior
to Kyoto, sites over the period 2008–2012 may be
included. Given Canada’s large agricultural land-
base (greater than 67.5 million ha—StatCan, 2001),
one possible option for credits is clearly afforesta-
tion of agricultural lands (van Kooten et al., 1999;
Stevens et al., 2002). Although the physical aspects
of the carbon cycle are generally well understood,
policy development requires integration of this
knowledge in spatial models that link biological
processes with economic models. This will help
assess the cost effectiveness of afforestation relative
to other policy choices.
In this article, we present a spatial model of
possible afforestation activities for Canada. The
primary metric of assessment is mapped break-even
carbon prices. It is currently unclear what the price
of carbon credits will be. Included in the calculations
are plantation establishment and maintenance costs, a
spatially varying opportunity cost for agricultural
production, timber and bioenergy production values.
Thus, our model calculates what the price of carbon
would have to be to justify afforestation activities on
economic efficiency grounds if the timber and bio-
energy values do not generate positive net present
values on their own. For countries like Canada that
have relatively slow growth rates, joint products
obtained from afforested land may create interest
for shared investments in plantations. Lastly, there
is a need for models that integrate biological and
economic uncertainties (e.g. Paoli and Bass, 1997;
Krcmar et al., 2001). In our model, the main bio-
logical and economic parameters and variables (e.g.
prices, biomass estimates, product conversion rates)
are represented as probability distributions. Sensitiv-
ity analysis is also used to characterize the relative
impacts of variation in model parameters on the
break-even carbon price.
Five growth and yield scenarios for fast growing
hybrid poplar species are presented using a model
version that examines wood, bioenergy and carbon
sequestration values. These scenarios are based on a
policy goal of 20-year rotation periods. Some policy
and research implications of our findings and areas of
future research are discussed.
2. Methods and data
2.1. Model overview
The model calculates costs and benefits of wood
production and carbon sequestration inclusive of an
opportunity cost for agricultural production values,
and then determines the price of carbon that would
make afforestation financially attractive. This car-
bon price (‘break-even’ price) is portrayed as a
raster (grid) map. The spatial portrayal of cost-
benefit results allows for identification and com-
parison of afforestation suitability across large
areas. Output maps are compatible with Geographic
Information System (GIS) programs, and can be
further summarized and analyzed using standard
GIS techniques.
The model integrates a simplified carbon budget
tracking algorithm that predicts accumulation of
carbon in soil, litter, standing aboveground and root
biomass, carbon flows among ecosystem components
and CO2 release from biomass and forest products
decay using raster spatial input data to perform
simulations. The minimum data element size (‘grid
cell’ in GIS terms) determines the spatial resolution
of the model. This adds convenience, as our aim is
to apply the model at various spatial scales ranging
from whole-country simulations to fine-scale case
studies.
Net present value calculations (NPVAfforestation)
are based on present values for wood production
(PVTimber), carbon sequestration benefits (PVCarbon
sequest.), benefits associated with fossil fuel substitution
by burning wood as a bioenergy source (PVBioenergy)
less the opportunity costs when converting the land
use from crops or pasture (PV Ag land value):
NPVAfforestation ¼ PVTimber þ PVCarbon seq:
þ PVBioenergy�PVAg land value: ð1Þ
PVTimber þ PVCarbon seq: ¼ ptbvðtÞ � CEst½ e�rT þZ T
0
pcs/cvVðtÞe�rtdt �Z T
0
CTendingðtÞe�rtdt
� CEst; ð2Þ1� e�rT
The present values of timber harvests (PVTimber)
and the flow of carbon sequestration benefits
(PVCarbon seq.) were calculated using a modified
Hartman model (Hartman, 1976; van Kooten et al.,
1995, see also Bowes and Krutilla, 1989; Pearce,
1994):
D.W. McKenney et al. / Forest Policy and Economics 6 (2004) 345–358 347
where t is time, T is the rotation age, r is a discount
rate, /c is a conversion factor from biomass volume to
carbon, vV(t) is an annual tree stand biomass volume
increment, ptb is the price paid for standing timber,
and pcs is the ‘carbon price’. Costs include plantation
establishment, CEst (the second CEst term being the
initial plantation establishment cost), and plantation
tending, CTending(t) (simulated as a function of stand
age). Instead of using fixed carbon price, the model
calculates the value at which NPVAfforestation=0. This
break-even carbon price is calculated in terms of
discounted dollars per metric ton of carbon.
The Hartman model can be used to identify the
rotation age that maximizes timber values and flows
of the specified non-wood (amenity) benefits (Hart-
man, 1976). In our case the rotation age is fixed to 20
years because we are assessing a specific proposed
program—the establishment of fast growing, short
rotation poplar plantations. The model provides maps
of mean, maximum, minimum break-even carbon
prices and present values. Maps can also be provided
for the mean, minimum, maximum and standard
deviation of each output variable and be further
summarized using conventional GIS programs (e.g.
identifying areas available at given carbon prices in
certain regions, etc.).
2.2. Agricultural land values
Afforestation potentially competes with agricul-
tural production. Sedjo et al. (1995) notes the
importance of economic assessments including the
full costs of land and labour for carbon sequestra-
tion projects and that some studies oversimplify this
(e.g. Richards, 1992; de Jong et al., 2000). Agri-
cultural land values vary widely across Canada. To
ensure some consistency of opportunity cost esti-
mates, we used the 2001 Canadian Census of
Agriculture (StatCan, 2001) present value of annual
land rental expenses (PVR):
PVR ¼ 1
r� BR
SR; ð3Þ
where BR is total rental and lease expenses for
agricultural land, SR is the area of agricultural land
rented annually, and r is the discount rate.
The 2001 Census of Agriculture database provides
total rental/lease expenses and the areas of agricultural
land rented annually (i.e. BR and SR) at the level of
Consolidated Census Subdivisions (CCS units, Stat-
Can, 2001). These subdivisions can be plotted as
polygons with areas from 25 km2 (in highly populated
urban areas) to several million hectare (in remote
northern areas). Thus, each CCS unit has its own
PVR value. Some CCS units did not have rental/lease
expenses estimates due to confidentiality reasons
(StatCan, 2001). In that case, rental/lease expenses
summarized at coarser levels were used (StatCan,
2001).
To define a distribution of potential agricultural
production opportunity costs we estimated variation in
PVR from adjacent areas (50 km radius for southern
agricultural regions areas with high population densi-
ty, and 100 km for northern areas, where agricultural
land covers less than 30%). Mean, minimum, maxi-
mum and standard deviation estimates were used to
define the distribution of agricultural land opportunity
costs (mean and standard deviation were used to
define the shape of the distribution, minimum and
maximum—to define variation range). For some areas
in northern parts of the country, little variation was
detected due to lack of data. For these locations, we
D.W. McKenney et al. / Forest Policy and Economics 6 (2004) 345–358348
assumed F20% range. Because no assumption about
the shape of the distribution was made, we used the
simplest, a triangular distribution (see Stevens et al.,
2002).
As would be expected, the highest agricultural land
values were observed close to urban centers and
populated areas and exceeded $15 000 ha�1. The
lowest estimates were located in the northern part of
the Prairie provinces, close to the south-boreal forest
transition zone and were below $300 ha�1.
2.3. Carbon sequestration calculations
Three aboveground C pools (merchantable timber
biomass, non-merchantable aboveground biomass,
and forest floor biomass) and two belowground C
pools (soil carbon and root system carbon) are repre-
sented using the algorithm described in van Kooten et
al. (1999). Our model does not simulate fine-scale
carbon flows between intermediate ecosystem pools
such as slow- and fast-decaying soil pools or operate
on a daily step like some models (e.g. Peng et al.,
2002). In fact most carbon sequestration models used
in economic studies have relatively simple carbon
tracking algorithms and use only major biophysical
parameters, e.g. growth rates and conversion ratios
into the carbon equivalent (van Kooten et al., 1999;
Bateman and Lovett, 2000; Creedy and Worzbacher,
2001). Accumulation of carbon in soil, litter, biomass
and CO2 release is simulated via redistributing carbon
among main ecosystem pools (see also Kurz et al.,
1992).
Stand biomass was derived from growth and
yield curves. Above ground biomass equivalent
was estimated using yield curve estimates multiplied
by 1.5 (Kurz et al., 1992). Carbon in root biomass
was calculated as a proportion of living stand
biomass (0.43 for hybrid poplar from Guy and
Benowicz, 1998). Conversion factors for carbon
transfers between pools were represented as ratios.
This approach is also used in other biophysical
carbon budget models (e.g. Kurz and Apps, 1999).
Note, however, that these ratios are represented as
distributions.
The amount of carbon in the litter and forest floor
follows Smith and Heath (2002) as a species-specific
function of stand age and site conditions. Decompo-
sition of forest floor biomass existing prior to harvest
is an exponential function of stand age (i.e. time since
last clear-cut) and a forest floor residence time (see
Smith and Heath (2002) for details).
Conversion of agricultural land to forest planta-
tions should lead to an increase in soil carbon content.
This is assumed to occur over a specified period after
converting agricultural land to plantations and then
remain stable. During that period, the annual rate of
carbon accumulation was assumed to be linear. For
hybrid poplar plantations, we used a period of 50
years and rates for the Prairies 0.96 and 1.35 ton/ha
for British Columbia and Eastern Canada (van Kooten
et al., 1999).
Five growth and yield scenarios for hybrid poplar
clones were represented: 20, 16, 14, 12 and 10 m3
ha�1 year�1 for 20-year rotations (scenarios 1–5,
respectively). Scenarios 4 and 5 have growth rates
close to growth expectations reported in Guy and
Benowicz (1998) and other Canadian studies (van
Kooten et al., in press). The other three scenarios
represent more optimistic growth rates of policy
interest.
2.4. Carbon redistribution among forest products
Carbon stored in harvested forest products is
released into the atmosphere through decay. The
model distinguishes three types of forest products
based on specific decay rates: lumber, pulp/paper
fast- and slow-decaying products. Fast-decaying pa-
per products usually have half-life periods of 1–5
years (Skog and Nicholson, 1998), lumber: 80–100
years (Winjum et al., 1998). The decay rate for fast-
decaying paper products was 0.5 (van Kooten et al.,
1999). Following van Kooten et al. (1999); we
assumed that 66% of paper products end up in
landfills (slow-decaying pool) with a decay rate
0.005. The remainder goes into the fast-decaying C
pool with a mean decay rate 0.5. A decay rate of
0.01 was assumed for lumber and other wood
products (Table 1). Carbon emissions from forest
products were considered as costs (van Kooten et al.,
1995) using the simulated carbon prices.
2.5. Substitution of fossil fuels
The model includes an assumption that some
harvested wood is used as fuel to offset the release
Table 1
Proportions of forest products and carbon decay rates for hybrid poplar
Parameters Forest products
Bioenergy use Lumber Paper products
(wood fuel), Fast-decaying Slow-decaying
log residuals pools pools
Decay rates 1 0.01 0.5 0.005
Forest product 0.2 0.2 0.6 0.15 0.45
ratios
D.W. McKenney et al. / Forest Policy and Economics 6 (2004) 345–358 349
of carbon by burning fossil fuels. Again following van
Kooten et al. (1999), we assumed that burning 1 m3 of
wood prevents the release of 0.190 ton of carbon from
burning coal.
The substitution of fossil fuels of course also
directly provides benefits from the sales of the resid-
ual material for bioenergy, i.e.:
PVBioenergy ¼pbe/bev tð Þ½ e�rT
1� e�rT; ð4Þ
where /be is a proportion of residual wood used for
bioenergy in the total harvest, pbe is the price paid for
residual wood, other symbols defined above.
In the present study, the expected mean price for
residual wood was assumed to be a triangular
distribution with $7.5 mode (Stevens et al., 2002).
We assumed a price variation of plus and minus
30%.
2.6. Modelling uncertainty
Uncertainty in the parameters and variables is
addressed using Monte–Carlo simulation techniques
(Law and Kelton, 2000). Most model variables such
as growth rates, biophysical constants, can be associ-
ated with the range of variation. Thus numeric vari-
ables were defined as statistical distributions rather
than fixed values with a probability-density function
type, expected range, mean and variance specified for
each model parameter. Algorithms described in Sauc-
ier (2000) were used to represent the three types of
distributions: triangular, constrained Gaussian and
Weibull (Table 2). Biological parameters were repre-
sented by a constrained Gaussian distribution. Most
economic parameters (i.e. agricultural land values,
prices and discount rates) were represented by the
triangular distribution with given minimum, maxi-
mum and mode (Stevens et al., 2002). The Weibull
probability-density function was used to simulate the
distribution of age-dependent parameters such as
stand senescence age and the period of initial carbon
accumulation in soil after beginning afforestation.
Thus, spatially explicit estimates of break-even carbon
price variation can be achieved for specific given
scenarios, but inclusive of a standard deviation and
range estimates. All results presented here are based
on simulations of 50 model runs for each particular
scenario.
2.7. Sensitivity analysis
To further assess the response of the break-even
carbon price to parameter uncertainty, sensitivity
analyses were performed. For each model parameter,
model simulations were repeated with the parameter
shifted plus and minus 20% from its original values
(but still inclusive of distribution limits). Finally, the
resulting distribution of break-even carbon price was
obtained for each parameter and plotted in one graph
for further comparison. This shows the relative sensi-
tivity of break-even carbon prices to the decrease or
increase of the particular parameter value.
2.8. Data
A spatial database of agricultural land was
generated from a 1-km AVHRR landcover classifi-
cation of Canada (Cihlar and Beaubien, 1998). The
following classes were used to delineate the area of
land potentially available for afforestation: grassland
(with shrub cover less than 10%), high, medium
and low biomass croplands, cropland-woodland
(mosaic land with prevalence of croplands, mixtures
Table 2
Basic uncertainty assumptions for the model parameters and variables
Definition Units Uncertaintya
Annual soil carbon accumulation rate in soil ton C ha�1 year�1 3
Annual tending/maintenance costs $ ha�1 year�1 1
Area of land rented annually ha Fixed value
(including land rented from Government)b
Average mature forest floor carbon mass tons ha�1 1
Carbon content of timber ton C m�3 3
Carbon price, social value of sequestering C $ ton�1 C 1, 3
Conversion factor from stem volume into carbon – 3
Conversion of above-ground biomass to carbon – 3
Conversion of above-ground biomass to – 3
non-merchantable timber volume
Discount rate % 1
Carbon offset from fossil fuel substitution tons ha�1 year�1 4c
Farm areab ha Fixed value
Forest products decay rates for fast-decaying, year�1 1
slow-decaying carbon pools and
Gross farm cash receiptsb $ year�1 1
Mean residence time of carbon in forest litter years 1
Period of soil carbon accumulation since the years 2
beginning of the afforestation
Plantation establishment costs $ ha�1 1
Proportion of forest products that goes into forest – 3
products decaying pool (fast- slow- decay and lumber)
Regression coefficients (rate of carbon accumulation in – 1
litter as function of age)
Soil carbon content in agricultural land ton C ha�1
Stand age at the rotation time years 1
Stand senescence age years 2
Standing timber price $ m�3 1
The amount of timber growing on a stand at the time t m3 ha�1 3
Timber price used for bioenergy $ m�3 1
Total farm business expensesb $ year�1 1
Total market value of the landb $ ha�1 1
Total rental/lease expenses for agricultural landb $ year�1 1
a Statistical distributions: 1—triangular; 2—constrained Weibull; 3—constrained Gaussian, see Saucier (2000).b Data from 2001 Census of Agriculture Consolidated Subdivisions (CCS), see StatCan (2001).c This output calculated from the mixture of randomized variables has no assumptions about the type of the distribution.
D.W. McKenney et al. / Forest Policy and Economics 6 (2004) 345–358350
with woodlands and other forest cover types). This
classification results in an estimate of agricultural
land area of 72 million ha including grasslands (67
million ha not including grasslands). This compares
to 67.5 million ha estimated in the Canadian
Census of Agriculture (StatCan, 2001). Grasslands
are included because hybrid poplar may be grown
in these areas. To outline a possible range of hybrid
poplar, the plant hardiness zone database was used
(McKenney et al., 2001). Zone 1a roughly outlines
a northerly limit for hybrid poplar. We assumed that
the appropriate clones of hybrid poplar would be
found to cover the existing variety of ecological
conditions within the study area.
As noted previously, agricultural land values and
their locations were taken from the 2001 Census of
Agriculture at the level of Census Consolidate Sub-
division units (StatCan, 2001).
The model also requires four other user-specified
spatial databases to run: rotation age, minimum,
modal and maximum expected plantation establish-
ment costs. These layers are ‘scenario-specific’. We
assumed a rotation age of 20 years for all areas
(F20%) and establishment costs with minimum
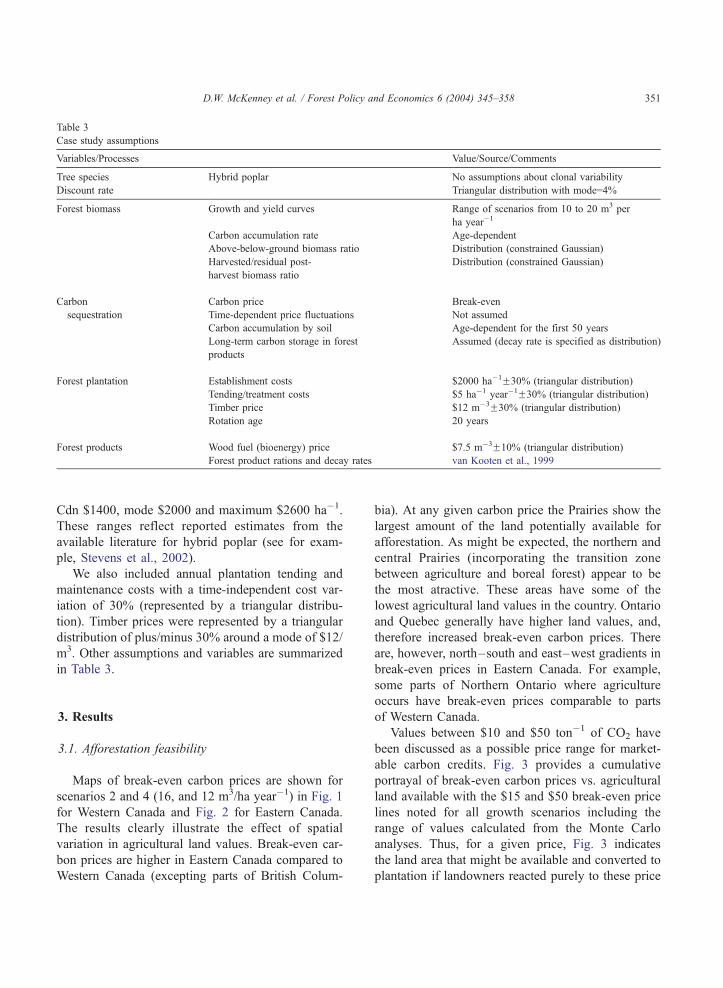
Table 3
Case study assumptions
Variables/Processes Value/Source/Comments
Tree species Hybrid poplar No assumptions about clonal variability
Discount rate Triangular distribution with mode=4%
Forest biomass Growth and yield curves Range of scenarios from 10 to 20 m3 per
ha year�1
Carbon accumulation rate Age-dependent
Above-below-ground biomass ratio Distribution (constrained Gaussian)
Harvested/residual post- Distribution (constrained Gaussian)
harvest biomass ratio
Carbon Carbon price Break-even
sequestration Time-dependent price fluctuations Not assumed
Carbon accumulation by soil Age-dependent for the first 50 years
Long-term carbon storage in forest Assumed (decay rate is specified as distribution)
products
Forest plantation Establishment costs $2000 ha�1F30% (triangular distribution)
Tending/treatment costs $5 ha�1 year�1F30% (triangular distribution)
Timber price $12 m�3F30% (triangular distribution)
Rotation age 20 years
Forest products Wood fuel (bioenergy) price $7.5 m�3F10% (triangular distribution)
Forest product rations and decay rates van Kooten et al., 1999
D.W. McKenney et al. / Forest Policy and Economics 6 (2004) 345–358 351
Cdn $1400, mode $2000 and maximum $2600 ha�1.
These ranges reflect reported estimates from the
available literature for hybrid poplar (see for exam-
ple, Stevens et al., 2002).
We also included annual plantation tending and
maintenance costs with a time-independent cost var-
iation of 30% (represented by a triangular distribu-
tion). Timber prices were represented by a triangular
distribution of plus/minus 30% around a mode of $12/
m3. Other assumptions and variables are summarized
in Table 3.
3. Results
3.1. Afforestation feasibility
Maps of break-even carbon prices are shown for
scenarios 2 and 4 (16, and 12 m3/ha year�1) in Fig. 1
for Western Canada and Fig. 2 for Eastern Canada.
The results clearly illustrate the effect of spatial
variation in agricultural land values. Break-even car-
bon prices are higher in Eastern Canada compared to
Western Canada (excepting parts of British Colum-
bia). At any given carbon price the Prairies show the
largest amount of the land potentially available for
afforestation. As might be expected, the northern and
central Prairies (incorporating the transition zone
between agriculture and boreal forest) appear to be
the most atractive. These areas have some of the
lowest agricultural land values in the country. Ontario
and Quebec generally have higher land values, and,
therefore increased break-even carbon prices. There
are, however, north–south and east–west gradients in
break-even prices in Eastern Canada. For example,
some parts of Northern Ontario where agriculture
occurs have break-even prices comparable to parts
of Western Canada.
Values between $10 and $50 ton�1 of CO2 have
been discussed as a possible price range for market-
able carbon credits. Fig. 3 provides a cumulative
portrayal of break-even carbon prices vs. agricultural
land available with the $15 and $50 break-even price
lines noted for all growth scenarios including the
range of values calculated from the Monte Carlo
analyses. Thus, for a given price, Fig. 3 indicates
the land area that might be available and converted to
plantation if landowners reacted purely to these price
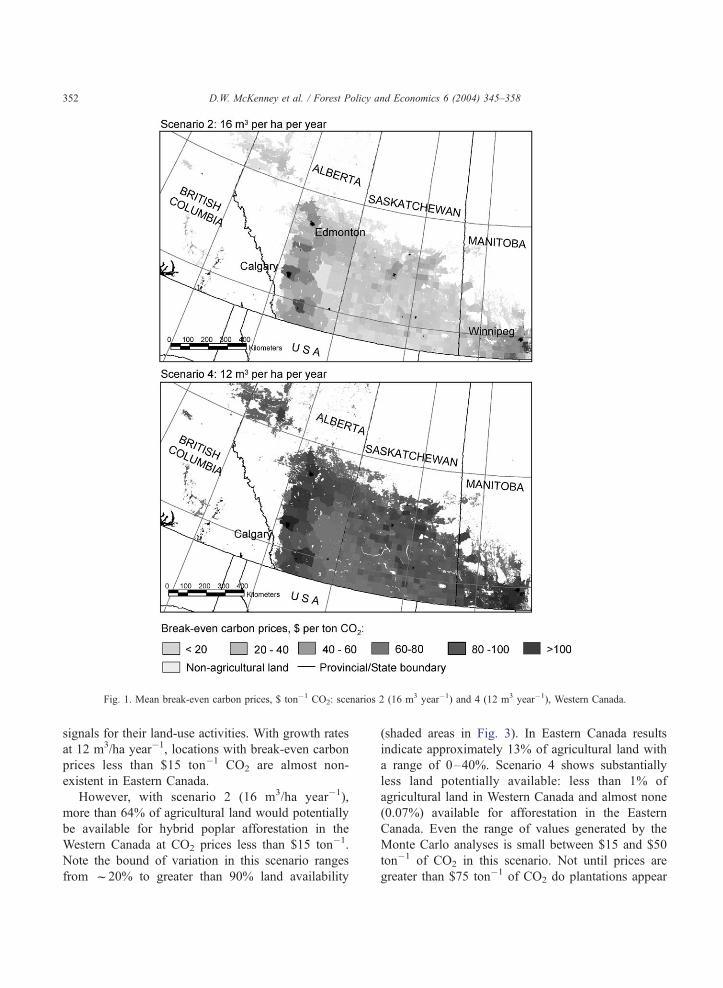
Fig. 1. Mean break-even carbon prices, $ ton�1 CO2: scenarios 2 (16 m3 year�1) and 4 (12 m3 year�1), Western Canada.
D.W. McKenney et al. / Forest Policy and Economics 6 (2004) 345–358352
signals for their land-use activities. With growth rates
at 12 m3/ha year�1, locations with break-even carbon
prices less than $15 ton�1 CO2 are almost non-
existent in Eastern Canada.
However, with scenario 2 (16 m3/ha year�1),
more than 64% of agricultural land would potentially
be available for hybrid poplar afforestation in the
Western Canada at CO2 prices less than $15 ton�1.
Note the bound of variation in this scenario ranges
from f20% to greater than 90% land availability
(shaded areas in Fig. 3). In Eastern Canada results
indicate approximately 13% of agricultural land with
a range of 0–40%. Scenario 4 shows substantially
less land potentially available: less than 1% of
agricultural land in Western Canada and almost none
(0.07%) available for afforestation in the Eastern
Canada. Even the range of values generated by the
Monte Carlo analyses is small between $15 and $50
ton�1 of CO2 in this scenario. Not until prices are
greater than $75 ton�1 of CO2 do plantations appear
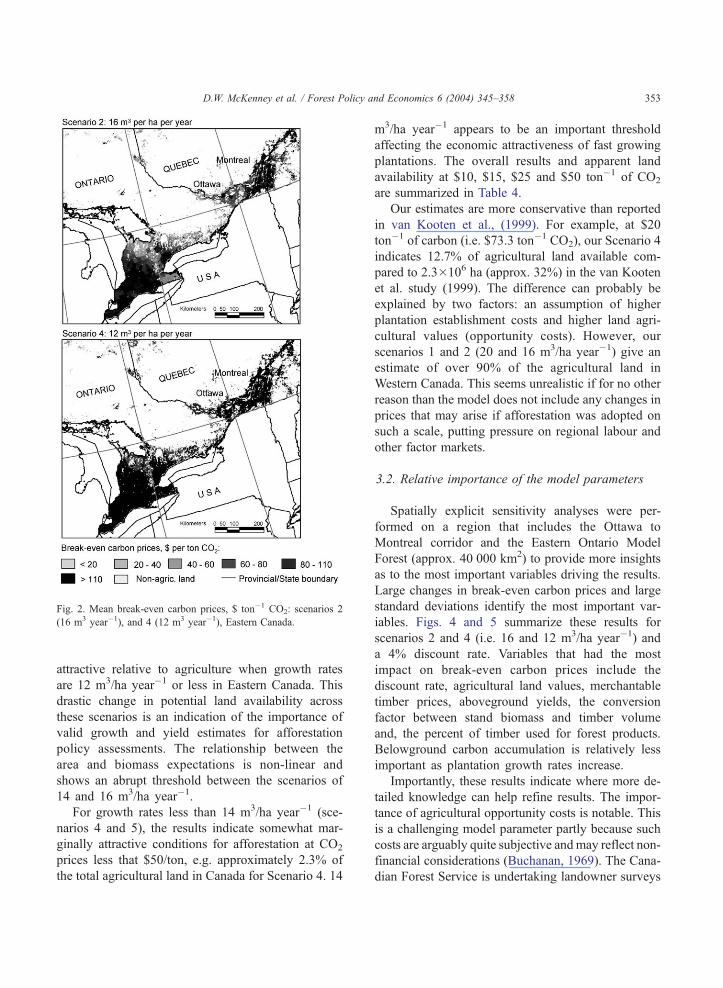
Fig. 2. Mean break-even carbon prices, $ ton�1 CO2: scenarios 2
(16 m3 year�1), and 4 (12 m3 year�1), Eastern Canada.
D.W. McKenney et al. / Forest Policy and Economics 6 (2004) 345–358 353
attractive relative to agriculture when growth rates
are 12 m3/ha year�1 or less in Eastern Canada. This
drastic change in potential land availability across
these scenarios is an indication of the importance of
valid growth and yield estimates for afforestation
policy assessments. The relationship between the
area and biomass expectations is non-linear and
shows an abrupt threshold between the scenarios of
14 and 16 m3/ha year�1.
For growth rates less than 14 m3/ha year�1 (sce-
narios 4 and 5), the results indicate somewhat mar-
ginally attractive conditions for afforestation at CO2
prices less that $50/ton, e.g. approximately 2.3% of
the total agricultural land in Canada for Scenario 4. 14
m3/ha year�1 appears to be an important threshold
affecting the economic attractiveness of fast growing
plantations. The overall results and apparent land
availability at $10, $15, $25 and $50 ton�1 of CO2
are summarized in Table 4.
Our estimates are more conservative than reported
in van Kooten et al., (1999). For example, at $20
ton�1 of carbon (i.e. $73.3 ton�1 CO2), our Scenario 4
indicates 12.7% of agricultural land available com-
pared to 2.3�106 ha (approx. 32%) in the van Kooten
et al. study (1999). The difference can probably be
explained by two factors: an assumption of higher
plantation establishment costs and higher land agri-
cultural values (opportunity costs). However, our
scenarios 1 and 2 (20 and 16 m3/ha year�1) give an
estimate of over 90% of the agricultural land in
Western Canada. This seems unrealistic if for no other
reason than the model does not include any changes in
prices that may arise if afforestation was adopted on
such a scale, putting pressure on regional labour and
other factor markets.
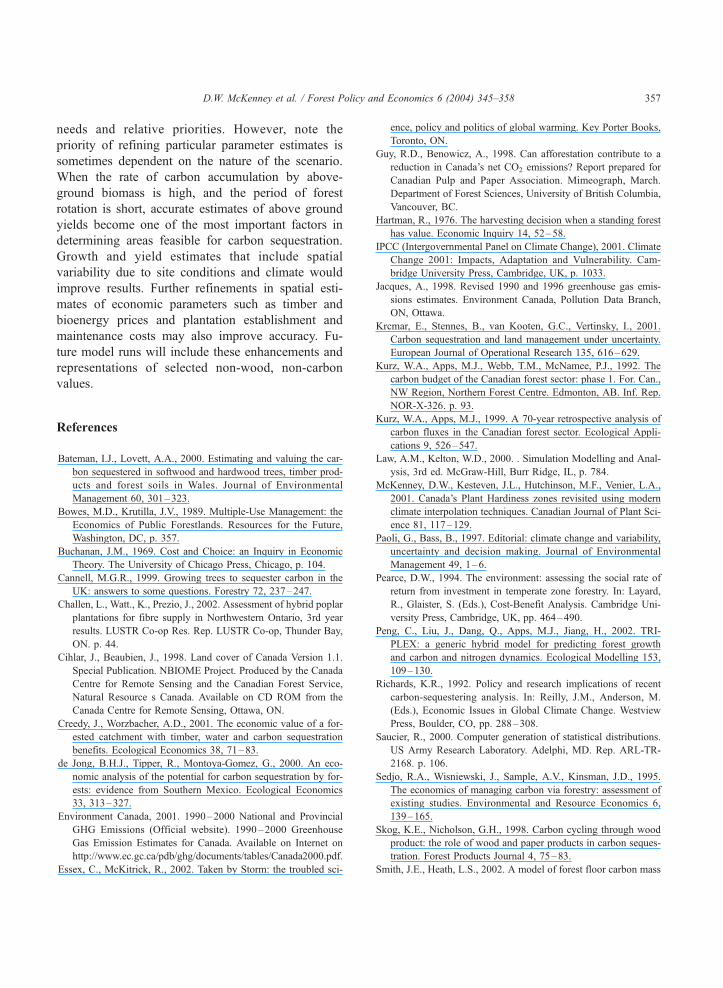
3.2. Relative importance of the model parameters
Spatially explicit sensitivity analyses were per-
formed on a region that includes the Ottawa to
Montreal corridor and the Eastern Ontario Model
Forest (approx. 40 000 km2) to provide more insights
as to the most important variables driving the results.
Large changes in break-even carbon prices and large
standard deviations identify the most important var-
iables. Figs. 4 and 5 summarize these results for
scenarios 2 and 4 (i.e. 16 and 12 m3/ha year�1) and
a 4% discount rate. Variables that had the most
impact on break-even carbon prices include the
discount rate, agricultural land values, merchantable
timber prices, aboveground yields, the conversion
factor between stand biomass and timber volume
and, the percent of timber used for forest products.
Belowground carbon accumulation is relatively less
important as plantation growth rates increase.
Importantly, these results indicate where more de-
tailed knowledge can help refine results. The impor-
tance of agricultural opportunity costs is notable. This
is a challenging model parameter partly because such
costs are arguably quite subjective andmay reflect non-
financial considerations (Buchanan, 1969). The Cana-
dian Forest Service is undertaking landowner surveys
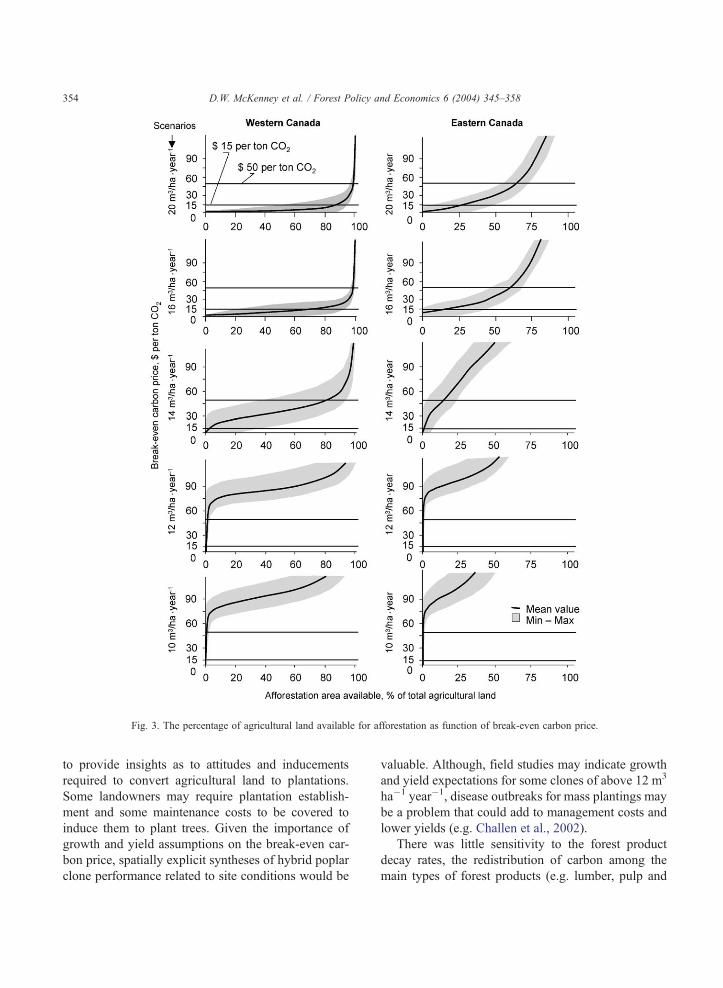
Fig. 3. The percentage of agricultural land available for afforestation as function of break-even carbon price.
D.W. McKenney et al. / Forest Policy and Economics 6 (2004) 345–358354
to provide insights as to attitudes and inducements
required to convert agricultural land to plantations.
Some landowners may require plantation establish-
ment and some maintenance costs to be covered to
induce them to plant trees. Given the importance of
growth and yield assumptions on the break-even car-
bon price, spatially explicit syntheses of hybrid poplar
clone performance related to site conditions would be
valuable. Although, field studies may indicate growth
and yield expectations for some clones of above 12 m3
ha�1 year�1, disease outbreaks for mass plantings may
be a problem that could add to management costs and
lower yields (e.g. Challen et al., 2002).
There was little sensitivity to the forest product
decay rates, the redistribution of carbon among the
main types of forest products (e.g. lumber, pulp and
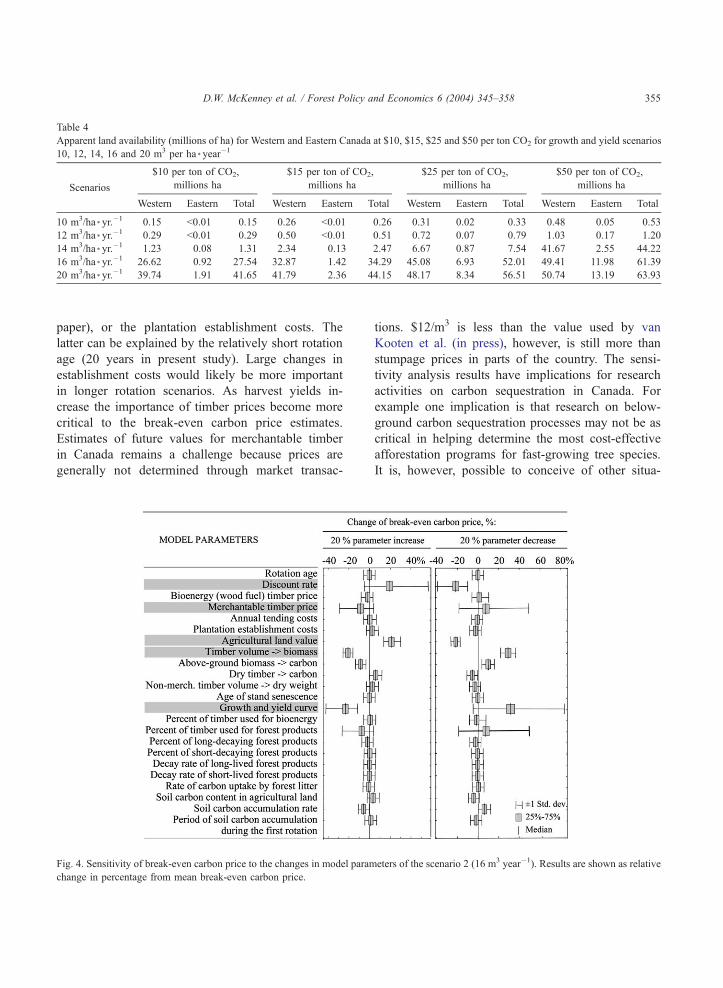
Table 4
Apparent land availability (millions of ha) for Western and Eastern Canada at $10, $15, $25 and $50 per ton CO2 for growth and yield scenarios
10, 12, 14, 16 and 20 m3 per ha * year�1
Scenarios
$10 per ton of CO2,
millions ha
$15 per ton of CO2,
millions ha
$25 per ton of CO2,
millions ha
$50 per ton of CO2,
millions ha
Western Eastern Total Western Eastern Total Western Eastern Total Western Eastern Total
10 m3/ha * yr.�1 0.15 <0.01 0.15 0.26 <0.01 0.26 0.31 0.02 0.33 0.48 0.05 0.53
12 m3/ha * yr.�1 0.29 <0.01 0.29 0.50 <0.01 0.51 0.72 0.07 0.79 1.03 0.17 1.20
14 m3/ha * yr.�1 1.23 0.08 1.31 2.34 0.13 2.47 6.67 0.87 7.54 41.67 2.55 44.22
16 m3/ha * yr.�1 26.62 0.92 27.54 32.87 1.42 34.29 45.08 6.93 52.01 49.41 11.98 61.39
20 m3/ha * yr.�1 39.74 1.91 41.65 41.79 2.36 44.15 48.17 8.34 56.51 50.74 13.19 63.93
D.W. McKenney et al. / Forest Policy and Economics 6 (2004) 345–358 355
paper), or the plantation establishment costs. The
latter can be explained by the relatively short rotation
age (20 years in present study). Large changes in
establishment costs would likely be more important
in longer rotation scenarios. As harvest yields in-
crease the importance of timber prices become more
critical to the break-even carbon price estimates.
Estimates of future values for merchantable timber
in Canada remains a challenge because prices are
generally not determined through market transac-
Fig. 4. Sensitivity of break-even carbon price to the changes in model param
change in percentage from mean break-even carbon price.
tions. $12/m3 is less than the value used by van
Kooten et al. (in press), however, is still more than
stumpage prices in parts of the country. The sensi-
tivity analysis results have implications for research
activities on carbon sequestration in Canada. For
example one implication is that research on below-
ground carbon sequestration processes may not be as
critical in helping determine the most cost-effective
afforestation programs for fast-growing tree species.
It is, however, possible to conceive of other situa-
eters of the scenario 2 (16 m3 year�1). Results are shown as relative
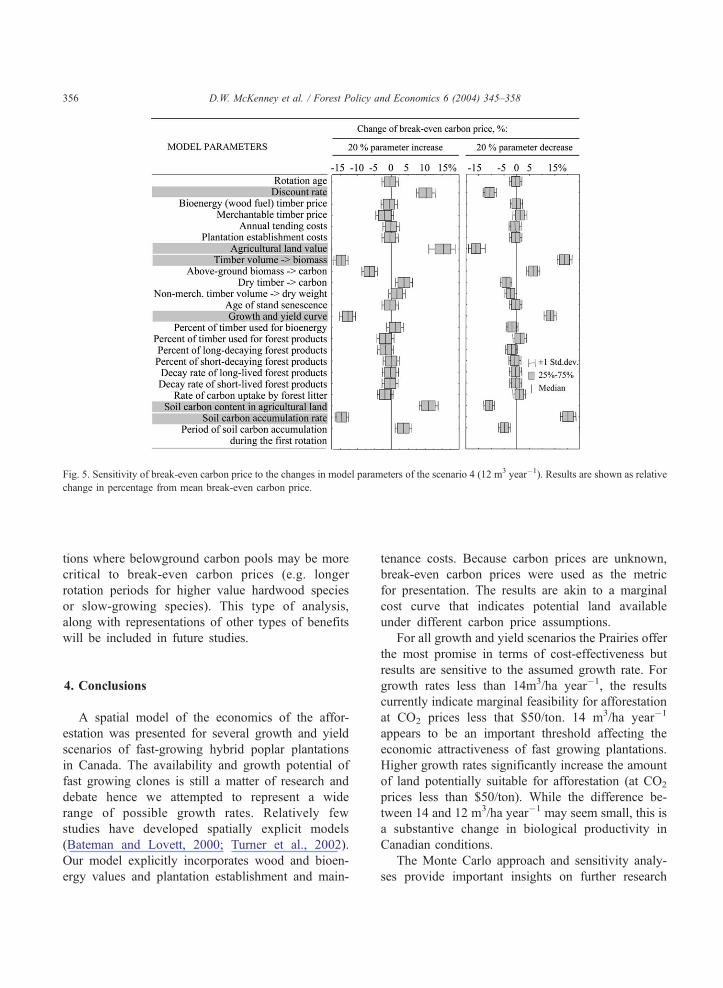
Fig. 5. Sensitivity of break-even carbon price to the changes in model parameters of the scenario 4 (12 m3 year�1). Results are shown as relative
change in percentage from mean break-even carbon price.
D.W. McKenney et al. / Forest Policy and Economics 6 (2004) 345–358356
tions where belowground carbon pools may be more
critical to break-even carbon prices (e.g. longer
rotation periods for higher value hardwood species
or slow-growing species). This type of analysis,
along with representations of other types of benefits
will be included in future studies.
4. Conclusions
A spatial model of the economics of the affor-
estation was presented for several growth and yield
scenarios of fast-growing hybrid poplar plantations
in Canada. The availability and growth potential of
fast growing clones is still a matter of research and
debate hence we attempted to represent a wide
range of possible growth rates. Relatively few
studies have developed spatially explicit models
(Bateman and Lovett, 2000; Turner et al., 2002).
Our model explicitly incorporates wood and bioen-
ergy values and plantation establishment and main-
tenance costs. Because carbon prices are unknown,
break-even carbon prices were used as the metric
for presentation. The results are akin to a marginal
cost curve that indicates potential land available
under different carbon price assumptions.
For all growth and yield scenarios the Prairies offer
the most promise in terms of cost-effectiveness but
results are sensitive to the assumed growth rate. For
growth rates less than 14m3/ha year�1, the results
currently indicate marginal feasibility for afforestation
at CO2 prices less that $50/ton. 14 m3/ha year�1
appears to be an important threshold affecting the
economic attractiveness of fast growing plantations.
Higher growth rates significantly increase the amount
of land potentially suitable for afforestation (at CO2
prices less than $50/ton). While the difference be-
tween 14 and 12 m3/ha year�1 may seem small, this is
a substantive change in biological productivity in
Canadian conditions.
The Monte Carlo approach and sensitivity analy-
ses provide important insights on further research
D.W. McKenney et al. / Forest Policy and Economics 6 (2004) 345–358 357
needs and relative priorities. However, note the
priority of refining particular parameter estimates is
sometimes dependent on the nature of the scenario.
When the rate of carbon accumulation by above-
ground biomass is high, and the period of forest
rotation is short, accurate estimates of above ground
yields become one of the most important factors in
determining areas feasible for carbon sequestration.
Growth and yield estimates that include spatial
variability due to site conditions and climate would
improve results. Further refinements in spatial esti-
mates of economic parameters such as timber and
bioenergy prices and plantation establishment and
maintenance costs may also improve accuracy. Fu-
ture model runs will include these enhancements and
representations of selected non-wood, non-carbon
values.
References
Bateman, I.J., Lovett, A.A., 2000. Estimating and valuing the car-
bon sequestered in softwood and hardwood trees, timber prod-
ucts and forest soils in Wales. Journal of Environmental
Management 60, 301–323.
Bowes, M.D., Krutilla, J.V., 1989. Multiple-Use Management: the
Economics of Public Forestlands. Resources for the Future,
Washington, DC, p. 357.
Buchanan, J.M., 1969. Cost and Choice: an Inquiry in Economic
Theory. The University of Chicago Press, Chicago, p. 104.
Cannell, M.G.R., 1999. Growing trees to sequester carbon in the
UK: answers to some questions. Forestry 72, 237–247.
Challen, L., Watt., K., Prezio, J., 2002. Assessment of hybrid poplar
plantations for fibre supply in Northwestern Ontario, 3rd year
results. LUSTR Co-op Res. Rep. LUSTR Co-op, Thunder Bay,
ON. p. 44.
Cihlar, J., Beaubien, J., 1998. Land cover of Canada Version 1.1.
Special Publication. NBIOME Project. Produced by the Canada
Centre for Remote Sensing and the Canadian Forest Service,
Natural Resource s Canada. Available on CD ROM from the
Canada Centre for Remote Sensing, Ottawa, ON.
Creedy, J., Worzbacher, A.D., 2001. The economic value of a for-
ested catchment with timber, water and carbon sequestration
benefits. Ecological Economics 38, 71–83.
de Jong, B.H.J., Tipper, R., Montoya-Gomez, G., 2000. An eco-
nomic analysis of the potential for carbon sequestration by for-
ests: evidence from Southern Mexico. Ecological Economics
33, 313–327.
Environment Canada, 2001. 1990–2000 National and Provincial
GHG Emissions (Official website). 1990–2000 Greenhouse
Gas Emission Estimates for Canada. Available on Internet on
http://www.ec.gc.ca/pdb/ghg/documents/tables/Canada2000.pdf.
Essex, C., McKitrick, R., 2002. Taken by Storm: the troubled sci-
ence, policy and politics of global warming. Key Porter Books,
Toronto, ON.
Guy, R.D., Benowicz, A., 1998. Can afforestation contribute to a
reduction in Canada’s net CO2 emissions? Report prepared for
Canadian Pulp and Paper Association. Mimeograph, March.
Department of Forest Sciences, University of British Columbia,
Vancouver, BC.
Hartman, R., 1976. The harvesting decision when a standing forest
has value. Economic Inquiry 14, 52–58.
IPCC (Intergovernmental Panel on Climate Change), 2001. Climate
Change 2001: Impacts, Adaptation and Vulnerability. Cam-
bridge University Press, Cambridge, UK, p. 1033.
Jacques, A., 1998. Revised 1990 and 1996 greenhouse gas emis-
sions estimates. Environment Canada, Pollution Data Branch,
ON, Ottawa.
Krcmar, E., Stennes, B., van Kooten, G.C., Vertinsky, I., 2001.
Carbon sequestration and land management under uncertainty.
European Journal of Operational Research 135, 616–629.
Kurz, W.A., Apps, M.J., Webb, T.M., McNamee, P.J., 1992. The
carbon budget of the Canadian forest sector: phase 1. For. Can.,
NW Region, Northern Forest Centre. Edmonton, AB. Inf. Rep.
NOR-X-326. p. 93.
Kurz, W.A., Apps, M.J., 1999. A 70-year retrospective analysis of
carbon fluxes in the Canadian forest sector. Ecological Appli-
cations 9, 526–547.
Law, A.M., Kelton, W.D., 2000. . Simulation Modelling and Anal-
ysis, 3rd ed. McGraw-Hill, Burr Ridge, IL, p. 784.
McKenney, D.W., Kesteven, J.L., Hutchinson, M.F., Venier, L.A.,
2001. Canada’s Plant Hardiness zones revisited using modern
climate interpolation techniques. Canadian Journal of Plant Sci-
ence 81, 117–129.
Paoli, G., Bass, B., 1997. Editorial: climate change and variability,
uncertainty and decision making. Journal of Environmental
Management 49, 1–6.
Pearce, D.W., 1994. The environment: assessing the social rate of
return from investment in temperate zone forestry. In: Layard,
R., Glaister, S. (Eds.), Cost-Benefit Analysis. Cambridge Uni-
versity Press, Cambridge, UK, pp. 464–490.
Peng, C., Liu, J., Dang, Q., Apps, M.J., Jiang, H., 2002. TRI-
PLEX: a generic hybrid model for predicting forest growth
and carbon and nitrogen dynamics. Ecological Modelling 153,
109–130.
Richards, K.R., 1992. Policy and research implications of recent
carbon-sequestering analysis. In: Reilly, J.M., Anderson, M.
(Eds.), Economic Issues in Global Climate Change. Westview
Press, Boulder, CO, pp. 288–308.
Saucier, R., 2000. Computer generation of statistical distributions.
US Army Research Laboratory. Adelphi, MD. Rep. ARL-TR-
2168. p. 106.
Sedjo, R.A., Wisniewski, J., Sample, A.V., Kinsman, J.D., 1995.
The economics of managing carbon via forestry: assessment of
existing studies. Environmental and Resource Economics 6,
139–165.
Skog, K.E., Nicholson, G.H., 1998. Carbon cycling through wood
product: the role of wood and paper products in carbon seques-
tration. Forest Products Journal 4, 75–83.
Smith, J.E., Heath, L.S., 2002. A model of forest floor carbon mass
D.W. McKenney et al. / Forest Policy and Economics 6 (2004) 345–358358
for United States forest types. USDA Forest Service, NE Res.
Stn., Newtown Square, PA. Res. Pap NE-722. p. 37
StatCan (Statistics Canada), 2001. 2001 Census of Agriculture. On-
line database. Accessed Jan 2003. http://www.statcan.ca/
english/freepub/95F0301XIE/.
Stevens, M.L., McKenney, D.W., Campbell, K., 2002. Afforesta-
tion potential in Canada: a spatial analysis of economic land
suitability with carbon sequestration benefits. In: Shaw, C.H.,
Apps, M.J. (Eds.), Proceedings of the International Science
Confernce ‘The Role of Boreal Forests and Forestry in the
Global Carbon Budget’, May 8–12, 2000. Edmonton, AB. Ca-
nadian Forest Services, Edmonton, AB, pp. 201–215.
Turner, B.J., Chikumbo, O., Davey, S.M., 2002. Optimization
modelling of sustainable forest management at the regional
level: an Australian example. Ecological Modelling 153,
157–179.
van Kooten, G.C., Arthur, L.M., Wilson, W.R., 1992. Potential to
sequester carbon in Canadian forests: some economic consider-
ations. Canadian Public Policy 18, 127–138.
van Kooten, G.C., Binkley, C.S., Delcourt, G., 1995. Effect of
carbon taxes and subsidies on optimal forest rotation age and
supply of carbon services. American Journal of Agricultural
Economics 77, 365–374.
van Kooten, G.C., Krcmar-Nozic, E., Stennes, B., van Gorkom, R.,
1999. Economics of fossil fuel substitution and wood product
sinks when trees are planted to sequester carbon on agricultural
lands in Western Canada. Canadian Journal of Forest Research
29, 1669–1678.
van Kooten, G.C., Shaikh, S.L., Suchanek, P. in press. Mitigating
climate change by planting trees: the transaction costs trap. Land
Economics.
Winjum, J.K., Brown, S., Schlamadinger, B., 1998. Forest harvests
and wood products: sources and sinks of atmospheric carbon
dioxide. Forest Science 44, 272–284.
Related Documents