What Went Wrong?: The Puerto Rican Debt Crisis and the “Treasury Put” Robert Chirinko* University of Illinois at Chicago, CESifo Ryan Chiu University of Illinois at Chicago Shaina Henderson University of Illinois at Chicago June 2018 PRELIMINARY COMMENTS WELCOME * Corresponding author. Very useful comments and suggestions have been received from seminar participants at the Einaudi Institute of Economics and Finance (especially Francesco Lippi), the 35th International Symposium on Money, Banking and Finance (especially Clément Mathonnat), the University of Chicago (especially Luigi Zingales), and the University of Illinois at Chicago (especially Chang Lee and Dermot Murphy) and from John Chalmers, Itay Goldstein, Helen Ladd, David Merriman, John Miller, Michael Pagano, Alan Schankel, Barnet Sherman, David Sjoquist, Chris Sims, Sally Wallace, and Pierre Yared. The first author thanks the Booth School/University of Chicago and the Einaudi Institute of Economics and Finance for most hospitable environments in which to complete most of this research. All errors and omissions remain the sole responsibility of the authors, and the conclusions do not necessarily reflect the views of the organizations with which they are associated.

Welcome message from author
This document is posted to help you gain knowledge. Please leave a comment to let me know what you think about it! Share it to your friends and learn new things together.
Transcript
What Went Wrong?:
The Puerto Rican Debt Crisis and the “Treasury Put”
Robert Chirinko* University of Illinois at Chicago, CESifo
Ryan Chiu
University of Illinois at Chicago
Shaina Henderson University of Illinois at Chicago
June 2018
PRELIMINARY COMMENTS WELCOME
* Corresponding author. Very useful comments and suggestions have been received from seminar participants at the Einaudi Institute of Economics and Finance (especially Francesco Lippi), the 35th International Symposium on Money, Banking and Finance (especially Clément Mathonnat), the University of Chicago (especially Luigi Zingales), and the University of Illinois at Chicago (especially Chang Lee and Dermot Murphy) and from John Chalmers, Itay Goldstein, Helen Ladd, David Merriman, John Miller, Michael Pagano, Alan Schankel, Barnet Sherman, David Sjoquist, Chris Sims, Sally Wallace, and Pierre Yared. The first author thanks the Booth School/University of Chicago and the Einaudi Institute of Economics and Finance for most hospitable environments in which to complete most of this research. All errors and omissions remain the sole responsibility of the authors, and the conclusions do not necessarily reflect the views of the organizations with which they are associated.

What Went Wrong?: The Puerto Rican Debt Crisis and the “Treasury Put”
Table Of Contents
Abstract Introduction
1. The “Treasury Put” 2. Estimating The Risk Premium
A. Model B. Potential Biases C. Alternative Approaches
3. Data 4. Results
A. Before Detroit B. After Detroit C. Misallocation Costs
5. Summary And Conclusions References Appendices
A. Computing The Debt/GDP And Unfunded Pension Liabilities/GDP Ratios B. Puerto Rican Government Deficits C. Moody’s Rating Scale – Long-Term Debt D. Comments On Data Collection For Puerto Rican Bonds And Interest Rates E. Computing The Marginal Income Tax Rate For The Marginal Municipal Bond
Investor Figures Tables
What Went Wrong?: The Puerto Rican Debt Crisis and the “Treasury Put”
Abstract
What went wrong? Why did seemingly rational bond investors continue to purchase
Puerto Rican debt with only a modest risk premium, even though the macroeconomic
fundamentals were dismal? Given gloomy macroeconomic fundamentals and relatively low risk
premia, investors were either stunningly myopic or Puerto Rican debt was implicitly insured by
the U.S. Treasury. The rational investor model rules out the former hypothesis.
This project examines the latter hypothesis, which we label the “Treasury Put.” The
expectation of a federal bailout was perfectly reasonable given past behavior by the Federal
Government, especially the prior bailout of the city of New York. Evaluating the Treasury Put
hypothesis with a minimal set of assumptions is possible given two fortuitous features – a unique
characteristic of Puerto Rican bonds and a “seismic shock.” Puerto Rico issued both uninsured
and insured general obligation bonds. These bonds were issued on the same day and, in many
cases, with the exact same maturity. These features allow us to compute accurately the risk
premia on Puerto Rican bonds. The second feature was the non-bailout of the city of Detroit in
2013 that effectively extinguished the Treasury Put. Puerto Rican risk premia were stable before
the Detroit bankruptcy and bracketed by the risk premia on Corporate Aaa and Baa bonds.
However, after the Detroit bankruptcy, risk premia rose dramatically, thus documenting the
existence of a sizeable Treasury Put and a significant misallocation of capital to Puerto Rico.
Keywords: Puerto Rican Debt Crisis; Government Guarantees, Capital Misallocation, Bond Interest Rates JEL Codes: H81 (Loan Guarantees) H74 (State and Local Borrowing) G18 (Government Policy) G01 (Financial Crises)
What Went Wrong?: The Puerto Rican Debt Crisis and the “Treasury Put”
After years of propping up a struggling economy with unsustainable borrowing, Puerto Rico’s financial reckoning
was inevitable. New York Times (January 24, 2018)
[Puerto Rico’s] economic and financial woes don’t appear to be reflected in its bond yields.
Barron’s (August 27, 2012)
Current general obligation credit spreads [on Puerto Rican debt], with yields about 200 basis points above AAA benchmarks,
do not reflect bondholder risk. Schankel (July 27, 2012)
Introduction
What went wrong? Why did seemingly rational bond investors continue to purchase
Puerto Rican debt with only a modest risk premium, even though the macroeconomic
fundamentals were dismal? Since 2002, the Commonwealth of Puerto Rico (which is a territory
of the United States, not a state per se) has run a budget deficit each year. Starting in 2006,
population growth turned negative and the decline accelerated in recent years (Figure 1).
Between 2005 and 2016, population fell by 11%. The employment-to-population ratio also
declined sharply (Figure 2).1 Not surprisingly given these developments, real GDP began to
contract severely (Figure 3). Between 2005 and 2013 (the last year of available data), real GDP
declined by 15%. In 2006, a very favorable tax credit for U.S. corporations operating in Puerto
Rico was finally eliminated.2 In its July 2012 report on the Puerto Rican economy, the Federal
1 Interestingly, this pattern for Puerto Rico follows very closely the pattern for the United States, suggesting some common cause perhaps linked to demographics. In any event, the sharp drop in this employment ratio impaired the ability of Puerto Rico to meet its debt obligations. 2 Section 936 of the Internal Revenue Code allowed for a tax credit for U.S. corporations operating in Puerto Rico. This tax credit was repealed by the Small Business Job Protection Act of 1996. However transition rules allowed firms, which had been credit claimants in 1996, to continue to receive the credit for income generated in Puerto Rico through the end of 2005. From 2006 onward, the tax credit was
2
Reserve Bank of New York (2012) concluded that “[t]he task of putting the Island on a path of
robust, sustainable, and inclusive growth remains a work in progress.” Per the above quotation
from the New York Times, the outcome was “inevitable.” On January 4, 2016, Puerto Rico began
to default on some of its bond commitments; bankruptcy was effectively declared on June 30,
2016.3
The fiscal situation has been precarious for many years. As shown in Figure 4 (see
Appendix A for details) the ratio of government liabilities -- debt plus unfunded pension
liabilities -- to nominal GDP has grown dramatically over the past 15 years. (Unless otherwise
stated, GDP and GNP are in nominal terms.) In 2000, it was 70%; by 2015, this ratio had
increased by more than half to 109%. Figure 5 shows that budget deficits were persistent and
growing. The 2013 figure of 6.3% is much larger than the comparable figure of 4.1% for the
U.S. federal government. This graph is on a budgetary (or cash) basis. Krueger, Teja, and
Wolfe (2015, p. 11) have noted several concerns with these figures, including not being on an
accrual basis and omitting capital expenditures and the deficit-creating activities of several
government agencies. When some of these concerns are addressed, the adjusted deficit rises by
about 84% in recent years (calculations are presented in Appendix B). This figure includes debt
service. To present data closer to an operating deficit, which is a standard measure for assessing
fiscal health, we remove the expenditures associated with debt service. This downward
adjustment nearly cancels the upward adjustments to the deficit noted above. Thus, at least for
completely eliminated. The extent to which this elimination contributed to the slowdown in economic activity is not clear. In 1995 (the year before repeal), there were 440 companies claiming the tax credit with gross income over $40 billion. In the final year of the 10 year transition interval, the comparable figures are 157 companies and $18 billion (GAO, 2018, p. 32). Note that the Puerto Rican price level was approximately constant between 1995 and 2005. 3 It is important to distinguish between default -- failing to honor contractually mandated payments – and bankruptcy -- a legal status determined by a court of law usually after a creditor or debtor initiates a legal proceeding. For a complicated set of reasons related to the Commerce Clause in the U.S. Constitution, states and territories (such as Puerto Rico) cannot file for bankruptcy and a possible reconfiguration of their contractual obligations and other liabilities. (However, municipalities (e.g., Detroit, New York City) can seek protection under Chapter 9 of the bankruptcy code.) In light of this restriction, the Puerto Rico Oversight, Management and Economic Stability Act (PROMESA) was enacted on July 1, 2016, and the PROMESA board was empowered to suspend debt payments and renegotiate debt contracts on behalf of Puerto Rico, thus mimicking traditional bankruptcy procedures that facilitate reorganization. PROMESA was not created to provide any direct fiscal assistance to Puerto Rico, but rather “The purpose of the Oversight Board is to provide a method for a covered territory to achieve fiscal responsibility and access to the capital markets” (U.S. Congress, 2016, p. 5).

3
the latter years, Figure 5 approximates the operating deficit, though it may be somewhat
overstated because it is difficult to remove all debt payments from publicly available sources. A
more important omission that severely understates the reported deficit is the failure to account
for financing gaps in legacy liabilities stemming from, among other sources, employee
retirement plans. By any measure, the fiscal picture has been dismal and deteriorating for many
years.
These persistent deficits reflect a limited fiscal capacity. In 2016, the Puerto Rican
median household income was $19,606. Comparable figures for the United States and its
poorest state (Mississippi) are $55,322 and $40,528, respectively. Moreover, the demographics
are very unfavorable, owing in part to the absence of restrictions for migrating to and working in
the United States (Puerto Ricans are U.S. citizens). As shown in Table 1 for 2015, the median
age of 36.4 years in Puerto Rico is well above the median age for the Caribbean region and only
slightly below that for the United States. The projected growth rate over the next 25 years is also
relatively unfavorable. By 2040, Puerto Rico will have an older population than the Caribbean
region, the United States, and the more developed and less developed groups of countries. With
falling real GDP, ongoing government operating deficits, and an aging population, the debt level
was clearly unsustainable and default inevitable.
The risk premium on Puerto Rican government debt did not reflect these economic
realities, per the other two quotations above. For example, based on a matched pair of uninsured
and insured bonds issued in April 2012 with the exact same maturity of 10 years (entry number
37 in Table 2), the Puerto Rican risk premium was greater than that on Corporate Aaa bonds by
41 basis points and less than that on Corporate Baa bonds by 85 basis points. Baa bonds are
quite creditworthy; “[o]bligations rated Baa are subject to moderate credit risk; they are
considered medium-grade and as such may possess speculative characteristics” (see Appendix C
for further information on Moody’s ratings). The Puerto Rican risk premium was much lower
than that for Non-Investment grade (“junk”) bonds, 428 basis points, though this comparison
should be done with caution due to the substantial liquidity premium for junk bonds. The
official statement associated with this bond issue was pessimistic, reporting that growth in
employment and an economic activity index were both negative in 2011 and 2012.
Notwithstanding this latter pessimism, the risk premium for Puerto Rican bonds is surprisingly

4
low in the face of overwhelming doubts about Puerto Rico’s ability to honor its financial
obligations.
Given these gloomy macroeconomic fundamentals and relatively low risk premium,
either investors were stunningly myopic or Puerto Rican debt was implicitly insured by the U.S.
Treasury. While some myopia and misjudgments are surely possible, the overwhelming
weakness of the Puerto Rican economy rules out the former explanation. This paper examines
the latter hypothesis, which we label the “Treasury Put.” Three important features allow us to
identify and measure the implicit guarantee from the U.S. Treasury as perceived by investors:
1. The dire fiscal and economic situations of Puerto Rico,
2. The simultaneous issuance of insured and uninsured bonds that allows us to estimate the
risk premium,
3. A seismic event – the absence of federal assistance to Detroit in the face of its bankruptcy
– that extinguished the Treasury Put in July 2013 and allows us to estimate its magnitude.
In effect, we are estimating a difference-in-difference model on uninsured vs. insured bonds
based on the “Detroit treatment,” though, given the extraordinarily three favorable circumstances
listed above, the analysis can be successfully executed in a narrative format and with simple
statistics. The approach taken in this paper is no less powerful than formal econometric methods
that are needed to separate signal from noise in a less favorable empirical environment.
Our quantitative evaluation of the Treasury Put hypothesis proceeds as follows. Section
1 documents the Treasury Put. Starting with the 1975 bailout of New York City, a long list of
government rescue plans of distressed borrowers led investors to the expectation of a bailout in
the event of a Puerto Rican default. We carefully examine the historical record to construct the
information set for Puerto Rican bond investors before the Detroit bankruptcy.
Section 2 describes the model for estimating the risk premium, a task made relatively
easy because Puerto Rico issued both uninsured and insured general obligation bonds. These
bonds were issued on the same day and, in many cases, with the exact same maturity. These
features allow us to compute accurately the risk premium on Puerto Rican bonds and to avoid
several potential biases arising from an imprecise estimate of the marginal income tax rate for
the marginal municipal bond investor, the “municipal puzzle” of an excessively upward sloping
yield curve, differential liquidity between uninsured and insured bonds, the creditworthiness of

5
insurers, and general shocks to the municipal market. Our procedure for estimating the risk
premium is then compared to several other more parametric approaches.
Section 3 discusses data requirements. Only five series are needed to estimate the risk
premium: the yield to maturity for uninsured and insured Puerto Rican bonds, the yield curve for
U.S. Treasury securities, the Corporate Aaa yield, and the marginal income tax rate for the
marginal municipal bond investor.
Section 4 presents results based on the risk premium for Puerto Rican bonds both before
and after the seismic shock of the Detroit bankruptcy. The risk premium is relatively low before
Detroit, but increases sharply thereafter. The increase in borrowing costs following the
elimination of the Treasury Put is used to measure the extent of resource misallocation associated
with this implicit government guarantee.
Section 5 summarizes our results and relates them to ongoing discussions about the role
of government guarantees in financial markets.

6
1. The “Treasury Put”
The “Treasury Put” is the implicit guarantee by the federal government to provide
support in the event of financial distress by the issuer of Puerto Rican bonds as perceived by
investors.4 In the event of a default by Puerto Rico, investors would, in effect, “place” their debt
with the federal government, which, in turn, would return to investors the value of the securities
at near face value through a bailout, either a direct payment or government guarantee.
Measuring perceptions at a point in time is a difficult matter. In this section, we review a set of
historical circumstances that allow us to infer the perceptions of a “reasonable investor.” In
effect, we are reconstructing investors’ information sets during the years prior to the Puerto
Rican default.
The expectation of a federal bailout was perfectly sensible given past behavior. In 1975,
the New York City was on the verge of bankruptcy.5 Initially, the federal government explicitly
refused to offer any financial assistance. Republican president Gerald Ford stated that
“[t]he people of this country will not be stampeded. They will not panic when a few desperate
New York officials and bankers try to scare New York’s mortgage payments out of them” (New
York Times, December 28, 2006). President Ford’s position was encapsulated in a famous
(though perhaps dubious) headline in the New York Daily News of October 30, 1975: “Ford to
City: Drop Dead. Vows He’ll Veto Any Bail-Out.” However, the federal government relented,
and financial assistance was authorized on December 10, 1975 in the form of $2.3 billion in
loans. This bailout is equivalent to between $7.8 and $15.5 billion in 2013 if adjusted for growth
in the GDP price deflator or current dollar GDP per capita, respectively). What is particularly
noteworthy about that bailout is that New York City was led by a liberal Democratic mayor,
while the administration of President Ford was Republican and fiscally conservative.
In the face of financial crises, federal financial assistance has been the norm:
1. Lockheed, 1971: federal guarantee of $0.25 billion of Lockheed debt (New York Times, 1979). [$2.35 : $1.12]. Figures in brackets are the nominal figure adjusted to 2013 dollars by the growth rate in nominal GDP : growth rate in the implicit GDP price deflator, respectively.
4 As a technical matter, contractual obligations for bond payments reside with the “obliger,” who is frequently but not always the issuer. 5 Municipalities like New York City can file for bankruptcy. This protection is not available to U.S. states and territories; cf. fn. 3.

7
2. Chrysler, 1980: federal guarantee of $1.5 billion of Chrysler debt (Washington Post,
1984). [$6.29 : $3.61].
3. Savings and Loan Crisis, 1986 to 1995: resolution costs to taxpayers of $124 billion (Curry and Shibut, 2000, Table 4). [$273 : $199, computations based on 1990 values].
4. Brady Bonds, 1989 to the present: federal guarantee that facilitated the swapping of
impaired U.S. bank loans to Latin American firms and countries for tradable bonds guaranteed by the U.S. Treasury (Investopedia, 2018a). No dollar figure is available.
5. Mexican Peso Crisis, 1995: federal guarantee of $20 billion of Mexican government debt, part of a total aid package exceeding $50 billion with additional contributions from the IMF, BIS, Canada, and several Latin American countries (Lustig, 1995, p. 20). [$37 : $28].
6. Troubled Asset Relief Program (TARP), 2007-2008: authorization for the U.S. Treasury to spend $700 billion to support institutions and individuals affected by the Financial Crisis, though only $466 billion was dispersed: $245 billion to banks, $80 billion to General Motors and Chrysler (again), $68 billion to AIG, $46 billion to foreclosure prevention programs, and $27 billion to programs to increase credit availability (Investopedia, 2018b). [$508 : $502].
Mervyn King, former head of the Bank of England, noted that “[a]ll banks, and large ones in
particular, benefited from an implicit taxpayer guarantee, enabling them to borrow cheaply to
finance their lending” (2016, p. 96). This view was confirmed formally by Kelly, Lustig, and
van Nieuwerburgh (2016); using data on options, they document government guarantees of the
U.S banking industry as a whole, though not individual banks, during the financial crisis. The
“Geithner Doctrine” – “no significant financial institution would be allowed to fail” (Kay, 2015,
p. 256) – coupled with the calamitous events that followed the Lehmann Brothers bankruptcy
when the Doctrine was disregarded, led rational investors to expect government support of the
$100+ billion in Puerto Rican debt liabilities.
Government willingness to use its position to assist investors in recent times extends to
other countries. When speaking about the fragility of the Euro, ECB President Mario Draghi
(2012) offered the following famous remark (emphasis added),
But there is another message I want to tell you. Within our mandate, the ECB is ready to do whatever it takes to preserve the euro. And believe me, it will be enough.
8
During the European debt crisis, several severely impaired economies received bailouts from the
ECB and the other two members of the Troika, the European Commission and the IMF. In
September 2007, Northern Rock bank, a substantial presence in the British mortgage market,
faced a liquidity crisis. Motivated by a desire to avoid setting a precedent and cultivating moral
hazard, the Bank of England initially declined Northern Rock’s request for assistance. This
refusal of a bailout was immediately followed by a classic bank run. The Bank of England
relented within 24 hours and provided funds (initially £10 billion, eventually rising to £37
billion) to Northern Rock, earning the Governor of the Bank of England the appellation
“Swervin’ Mervyn.”
Government intervention on behalf of investors has a long tradition. Foreign interference
in U.S. politics is not solely a 21st century phenomenon. In the aftermath of the debt default by
eight U.S. states and one territory circa 1840, British financial interests aggressively lobbied for
intervention by the U.S. federal government (Jenks, 1938, pp. 105-106):
Baring Brothers [a British merchant bank] began an agitation to persuade the federal government to assume the responsibility for the state debts. … London merchants easily gathered the impression that Whigs of the Webster school [a faction of a U.S. political party at the time] were likely to carry out this policy. And so the Whig cause in the campaign of 1840 received generous support from England.
The non-Webster faction of the Whigs won the election but then enacted the Bankruptcy Act of
1841. This act was detrimental to the interests of British bondholders and other creditors
because it allowed for the first time debtors to initiate bankruptcy, resulting in over 33,000
bankruptcy filings in less than 17 months (Federal Judicial Center, n.d.) and “extinguish[ing]
mercantile debts to foreign creditors running into millions of pounds” (Jenks, 1938, p. 106).
This relief was temporary, and the 1841 Act was repealed two years later, a pattern of legislation
that parallels a “tax holiday.” Note that U.S. States were not covered by the 1841 Act;
nonetheless, somewhat over half the delinquent debts were repaid voluntarily, presumably to
maintain future access to foreign capital markets (English, 1996). The British government was
also actively involved in supporting British business interests, as described 80 years ago by
Hobson (1938, p. 56, emphasis added, quoted in Goetzmann, 2016, p. 418) in his book on
Imperialism,

9
Investors who have put their money in foreign lands, upon terms which take full account of risks connected with the political conditions of the country, desire to use the resources of their Government to minimize these risks, and so to enhance the capital value and the interest of their private investments.6
Based on a plethora of past precedents, investors would surely have expected that, given
the size of the outstanding Puerto Rican debt, it benefited from an implicit government guarantee
that would dampen risk premium. Puerto Rican bond investors held a Treasury Put.
6 Hobson has rather harsh words for creditor-initiated arrangements such as PROMESA (cf. fn. 3): “But more frequently the insufficient guarantee of an international loan gives rise to the appointment of a financial commission by the creditor countries in order to protect their rights and guard the fate of their invested capital. The appointment of such a commission literally amounts in the end, however, to a veritable conquest” (p. 54, emphasis added).

10
2. Estimating The Risk Premium
This section presents the model for estimating the risk premium on Puerto Rican general
obligation bonds. Key to the derivation is the existence of both uninsured and insured bonds
issued on the same day with maturities that are equal or nearly equal. Potential biases with our
procedure are then examined. We conclude by comparing our procedure for estimating the risk
premium to several others taking more parametric approaches.
A. Model
Municipal bonds generally enjoy a favorable tax status. All municipal bonds issued in
the United States are exempt from federal income tax and, in most cases, they are also exempt
from income taxes assessed in the state in which they are issued. Puerto Rican bonds enjoy the
most favorable tax status of any municipal bond, as they are “triple tax-free” -- exempt from all
federal, state, and local income taxes (though the latter exemption is of minor importance).
Given this favorable tax status, the taxable-equivalent-yield (TEY) on a bond issued by Puerto
Rico (P), uninsured (uni), and with a maturity m years is modeled as the yield-to-maturity
observed in the bond market, stated on a pre-tax basis by dividing by one minus the marginal
income tax rate for the marginal municipal bond investor ( ),
(1) P,uni,m
f mrr s
(1 )
.
The TEY depends on five factors: the risk-free rate ( fr ), an aggregate or municipal market-wide
shock ( s ), and three premia for liquidity ( ), maturity ( m ), and risk ( ).7 The object of the
analysis in this section is to isolate the latter in terms of observables.
The companion TEY on an insured (ins) Puerto Rican bond with maturity of n years is
modeled in a similar manner,
7 Longstaff (2011) documents that the liquidity premium is quantitatively important for short-term municipal securities in a rather liquid segment of the market, and it averages 56 basis points for the period 2001-2009.

11
(2) P,ins,m
f nrr s
(1 )
.
Equation (2) differs from equation (1) by allowing the bond to have a different maturity ( n m )
and replacing the risk premium on the uninsured bond by a default risk premium for the bond
insurer ( ). Equations (1) and (2) do not include time subscripts because both bonds are
matched exactly by issue day (known as the dated date).
The risk premium on uninsured bonds is obtained in three steps. First, equation (2) is
subtracted from equation (1), thus eliminating the risk free rate, the liquidity premium and
aggregate/market-wide shock,
(3) P,uni,m P,ins,m
m nr r
(1 ) (1 )
.
Second, a Treasury bond of maturity k ( T,kr ) is modeled as the sum of the risk-free yield and a
maturity premium ( k , k m,n ), where k extends over the entire Treasury yield curve,
(4) T,k f kr r .
Subtracting equation (4) from equation (3) twice with k equal to m and n and rearranging, we
eliminate the maturity premia,
(5) P,uni,m P,ins,n
T,m T,nr rr r
(1 ) (1 )
Third, the risk premium for insurers is modeled as the difference between the yields on a 20-year
Corporate Aaa bond ( C,Aaa,20r ) and a 20-year Treasury bond ( T,20r ),
(6) C,Aaa,20 T,20r r .
12
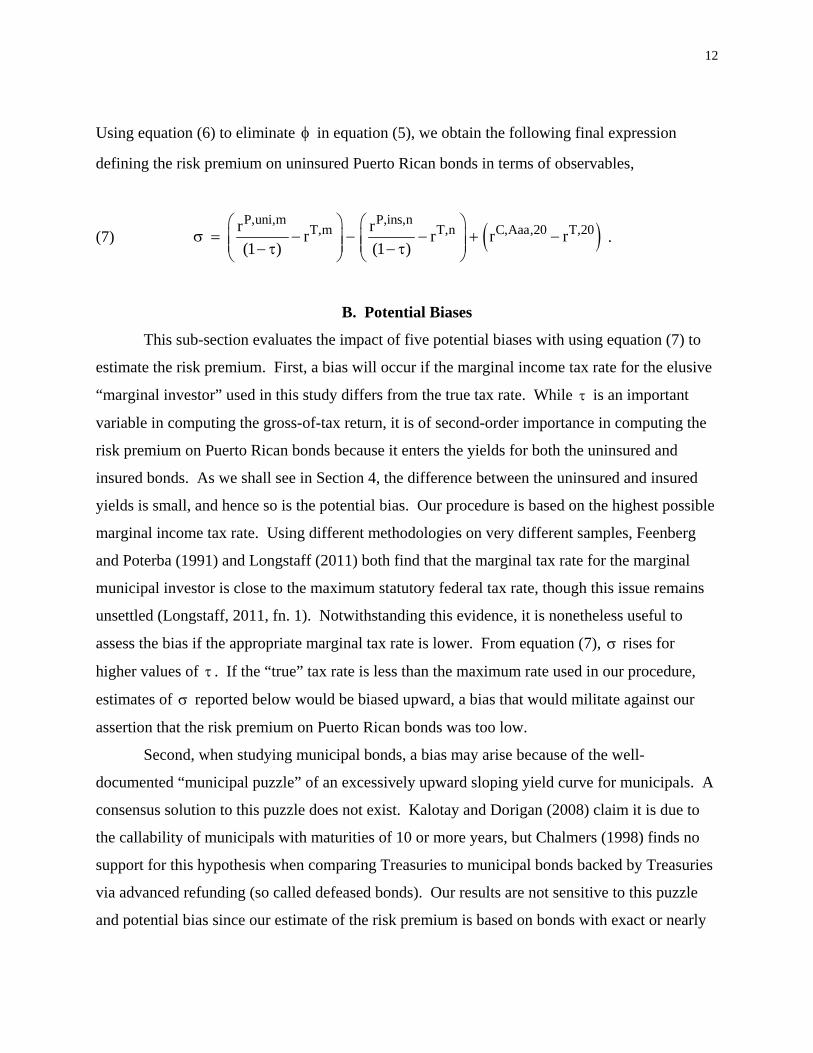
Using equation (6) to eliminate in equation (5), we obtain the following final expression
defining the risk premium on uninsured Puerto Rican bonds in terms of observables,
(7) P,uni,m P,ins,n
T,m T,n C,Aaa,20 T,20r rr r r r
(1 ) (1 )
.
B. Potential Biases
This sub-section evaluates the impact of five potential biases with using equation (7) to
estimate the risk premium. First, a bias will occur if the marginal income tax rate for the elusive
“marginal investor” used in this study differs from the true tax rate. While is an important
variable in computing the gross-of-tax return, it is of second-order importance in computing the
risk premium on Puerto Rican bonds because it enters the yields for both the uninsured and
insured bonds. As we shall see in Section 4, the difference between the uninsured and insured
yields is small, and hence so is the potential bias. Our procedure is based on the highest possible
marginal income tax rate. Using different methodologies on very different samples, Feenberg
and Poterba (1991) and Longstaff (2011) both find that the marginal tax rate for the marginal
municipal investor is close to the maximum statutory federal tax rate, though this issue remains
unsettled (Longstaff, 2011, fn. 1). Notwithstanding this evidence, it is nonetheless useful to
assess the bias if the appropriate marginal tax rate is lower. From equation (7), rises for
higher values of . If the “true” tax rate is less than the maximum rate used in our procedure,
estimates of reported below would be biased upward, a bias that would militate against our
assertion that the risk premium on Puerto Rican bonds was too low.
Second, when studying municipal bonds, a bias may arise because of the well-
documented “municipal puzzle” of an excessively upward sloping yield curve for municipals. A
consensus solution to this puzzle does not exist. Kalotay and Dorigan (2008) claim it is due to
the callability of municipals with maturities of 10 or more years, but Chalmers (1998) finds no
support for this hypothesis when comparing Treasuries to municipal bonds backed by Treasuries
via advanced refunding (so called defeased bonds). Our results are not sensitive to this puzzle
and potential bias since our estimate of the risk premium is based on bonds with exact or nearly

13
exactly maturities. The effect of the “municipal puzzle” from whatever source cancels due to
differencing (cf. m and n in equation (3)).
Third, the derivation was based on the assumption that the liquidity premia on uninsured
and insured bonds was identical, and hence cancelled in step 1. Since insured bonds may appeal
to a broader set of investors, it is possible that their liquidity premium is lower than that for
uninsured bonds. In this case, an additional term would be subtracted from equation (7),
uni ins( ) 0 . Thus, as with the marginal tax rate, the estimates of reported below would
be biased upward in the face of a positive liquidity differential, a bias that would again weigh
against our central thesis that the risk premium on Puerto Rican bonds was too low relative to
macroeconomic fundamentals.
Fourth, the results are sensitive to a proper specification of the creditworthiness of bond
insurers, as represented by . In econometric parlance, is identified by its exclusion from
equation (2), conditional on (as well as the other variables appearing in both equations (1) and
(2)). During the financial crisis, several bond insurers experienced severe financial difficulties
largely due to an expansion of their insurance activities into derivative securities. If the
solvency of companies insuring bonds is seriously questioned, then equation (6) underestimates
the true insurers’ risk premium and, per equation (7), this underestimate will lead to a downward
bias in the estimate of . Such a potential bias would not seem of concern here. As will be
discussed in more detail in the next section, the insured bonds in our sample were backed by five
insurers. As of January 2007, all five insurers had AAA ratings from S&P. All of the bonds in
our sample issued since October 2004 (with one exception) have been insured by only two of
these companies. They have maintained their AAA ratings through September 2010. The next
month, their ratings were lowered a notch to AA+. In November 2016, Moody’s examined these
two insurers and concluded that “[o]ur two pro-forma analyses support our belief that, despite
Puerto Rico’s financial stress and uncertainty about the ultimate outcome of the negotiation
between Puerto Rico and its creditors, the capital positions of our rated guarantors are supportive
of their current ratings” (Moody’s, 2016, p. 2). The same study reports that total Puerto Rican
exposures represent only 41% of total claims paying resources.8 The default risk of insurers
8 See Moody’s (2016, Exhibit 7, p. 6). The 41% figure is a weighted-average of the entries for AGM and AGC.

14
appears to be adequately captured by equation (6). Consistent with the safety afforded by the
insurers of the bonds studied here, as of May 2018, scheduled payments for defaulted bonds have
been covered in full.
Fifth, concern about the financial stability of some insurers of municipal securities can
affect the municipal market as a whole and is an example of a sector-specific shock. Other
shocks that have important impacts on municipal yields are anticipated changes in statutory
income tax rates and the stance of monetary policy. These important drivers of municipal yields
are accounted for in our estimate of by the shock variable, s, eliminated in our procedure
through differencing.
C. Alternative Approaches
Our procedure for identifying and estimating the Treasury Put relies on the unique
circumstances surrounding the Puerto Rican debt market. Its simplicity is its strength. In this
sub-section, we contrast it to three parametric approaches.
One approach forecasts defaults with a procedure similar to the Z-score method (Altman,
2000). The risk premium is measured by the difference between the bond return consistent with
this expected default and the actual bond return. While Z-scores are a mainstay for corporate
credit analysis, it is quite difficult to implement this approach for municipal bonds because of
their very low default rates.
An alternative method to measure the value of government guarantees uses option price
data and an explicit pricing model. Kelly, Lustig, and van Nieuwerburgh (KLN, 2016) combine
the powerful insights from the Black-Scholes option pricing formula and out-of-the-money
options prices for a basket of bank stocks and an index for the financial sector as a whole to
estimate changes in risk premia during the financial crisis. The latter index did not rise pari
passu with the former. They link this differential to implicit insurance for the financial sector as
a whole and conclude that, during the financial crisis, this government guarantee lowered “the
insurance premium for financial index crash insurance by 73 percent on average” (KLN, p.
1280). This parametric approach relies on the correct specification of a somewhat complicated
jump-diffusion pricing model. For example, Bai, Goldstein, and Yang (2017) have argued that a
“leverage effect” impacting equity volatility needs to be considered. In this expanded model, the
financial crisis has a differential impact on the two options prices considered by KLN, and this
15
differential could explain their results independent of any government guarantee. This concern
aside, an options-based approach is not feasible in the current situation because there is
insufficient liquidity in the market for out-of-the-money options on Puerto Rican uninsured
bonds.
In a recent paper, Atkeson, d’Avernas, Eisfeldt, and Weill (AAEW, forthcoming) also
estimate the value of the government guarantee for banks. They decompose the market/book
equity ratio into the fair value and a residual. If book equity and fair value are measured
accurately and the latter captures the value of all future “cash flows associated with bank assets
and liabilities not considering the contribution to bank value from government guarantees” (p. 3),
then the residual is the value of government guarantees. Based on their forecasting equations,
AAEW find that, from 2008 to 2017, approximately one-half the movement in the bank
valuations (as measured by market to book equity) can be accounted for by variations in the
value of government guarantees.
Neither approach dominates in estimating the value of government guarantees. Rather,
these four approaches depict the fundamental tradeoff between simple, non-parametric models
(such as the one used in the current study) that are relatively robust but less efficient and more
complicated procedures relying on an explicit theory and parameterization that are more efficient
but fragile in the face of possible model misspecification.9
9 In the econometrics literature, a similar tradeoff exists between robustness and efficiency. Consider estimating a coefficient of interest in a single equation that is part of a set of simultaneous equations and choosing between 2SLS and 3SLS techniques. The latter is relatively more efficient, but the coefficient of interest may be estimated inconsistently if any of the equations in the system are misspecified. The 2SLS technique trades off these efficiency gains for robustness.
16
3. Data
Our estimate of the risk premium on Puerto Rican bonds requires five time series. The
primary data source for municipal bond market data is the Electronic Municipal Market Access
database (EMMA, http://www.emma.msrb.org) published by the Municipal Securities
Rulemaking Body (MSRB). We restrict our search to government general obligation (GO)
bonds, those that are backed by the full faith and credit of the Puerto Rican government and do
not have any specific revenue streams associated with them. We thus avoid problems with
having to evaluate those revenue streams. The yields on Puerto Rican uninsured and insured GO
bonds ( P,uni,mr and P,ins,nr , respectively) are obtained from a careful review of all GO bonds
from January 1, 2000 to December 13, 2013. Our initial exploration of the EMMA data
identified 279 uninsured and 205 insured GO bonds since January 2000. Entries without
sufficient information to compute the yield or determine the issue date or maturity are excluded.
A tedious examination of the remaining GO bonds (reading the Official Statements, for each
bond offering, cross-checking with online data sources, and resolving discrepancies) identified
45 uninsured bonds that could be matched to 45 insured bonds.
Details are provided in Table 2. (Specific comments on data collection are in Appendix
D.) The quality of the matches is quite good. For each of the 45 matched pairs, the uninsured
and insured bonds were issued on the same day (column 5). Call features are very similar among
the paired bonds (column 8). Maturities tend to be long: 26 are greater than 20 years; 18 are
between 11 and 20 years, and one is less than 10 years (column 9). The maturity matches are
exact for 33 pairs (columns 10). For the remaining 12 pairs, the average discrepancy in
maturities is two years. The resulting bias on our estimate of is likely to be modest (column
11; cf. note 6, Table 2 for a definition of bias). What bias exists is likely to raise (an upward
bias exists in seven cases, a downward bias in five cases), a result that weighs against the
proposition that the risk premium was too low.
The Corporate Aaa yield and Treasury yield curve are obtained from the FRED database.
Data for the Treasury yield curve does not always match exactly the maturities of the Puerto
Rican bonds. We address this problem with the following two-step procedure. For a Puerto
Rican bond of maturity m at time t, we examine the Treasury yield curve at that t (this match on
a date can be done exactly) and determine the points on the yield curve immediately below and
above maturity m. We then compute a linear approximation based on the location of the Puerto

17
Rican bond maturity relative to the interval defined by the low and high Treasury yields.10 For
example, if the period t Puerto Rican bond has a maturity of 8+ years, we compute the
appropriate point on the yield curve as the yield on the 7 year Treasury bond plus the difference
in yields on the 10 and 7 year Treasury bonds, divided by the number of days over this 3 year
interval, all multiplied by the number of days the Puerto Rican bond with a maturity of 8+ years
exceeds the number of days of the 7 year Treasury bond.
The FRED database also provides the yields on Corporate Baa and Non-Investment grade
bonds used to compute risk premia for comparative purposes.
The fifth series is the marginal income tax rate for the marginal municipal bond investor
( ). Recall that income from Puerto Rican bonds is triple-tax free. In order to facilitate
comparisons between tax-free Puerto Rican and taxable bonds, the latter is grossed-up for
income taxation. Several steps are involved; see Appendix E for details. Most importantly, we
must distinguish between regular and alternative minimum tax (AMT) regimes. In either case,
we assume that the marginal investor has a high income and is subject to several taxes applicable
to high-income investors (generally, adjusted gross income above $200,000).11 The following
discussion is keyed to the entries in Table E1 in Appendix E with row numbers indicted in
brackets.
For a taxpayer in the regular tax status, the income from a Treasury bond is subject to
taxation at the federal [1] and state levels [2]. The latter is usually deductible against the former,
and this deductibility lowers the effective tax rate. Thus, the combined federal and state tax rate
is the summation of the two preceding rates less the product of the two rates [3]. We assume that
the marginal investor is subject to the highest marginal statutory tax rates at the federal and state
levels. Given our assumption that the marginal investor has a high income, Treasury interest
10 We believe that his linear approximation between the two points closest to the maturity date on the Puerto Rican bond is likely to be more accurate than using approximations based on the entire yield curve, such as the six-point approximation of Gürkaynak, Sack, and Wright (2007) because of the flatness of the Treasury yield curve at the longer maturities that populate our sample. Note that this adjustment for the maturity premium is not of quantitative importance in this study because, per equation (3), the exact (m = n) or near-exact (m close to n) maturity matches for most pairs of uninsured/insured bonds. 11 Note that we focus on “high,” not the “highest” income. In the latter case for very wealthy individuals, several of the phase-outs discussed below will have been exhausted, and the marginal tax rate for very wealthy individuals will be lower than that for the merely prosperous. That is, for a potential municipal bond investment, the marginal income tax rate for a household consisting of two full economics professors (filing jointly) will be higher than the marginal income tax rate for Bill Gates.

18
income is subject to a three additional taxes: the net investment income tax surcharge [4, known
as the “Medicare tax”] and phase-outs of the personal exemption [5] and select itemized
deductions [6, known as the “Pease Limitation”]. These phase-outs increase the tax on Treasury
interest income. The regular marginal tax rate on interest income is the summation of these four
effective marginal tax rates, items [7].
The AMT regime imposes a different set of marginal income tax rates, and two marginal
income tax rates from the regular regime. We again assume that the marginal investor faces the
highest tax rate [8] and, given this high income, is subject to a phase-out of the AMT exemption
[9]. As in the regular tax regime, the AMT investor is also subject to the state income tax [2] and
the net investment income tax surcharge [4]. The AMT marginal tax rate on interest income is
the summation of these four effective marginal tax rates [10].
In order to compute a single marginal tax rate, we form a weighted average of the regular
and AMT marginal tax rates [14], where the weights are the percentage of select returns filed in
the two regimes [11, 12, 13]. Since financial assets are disproportionately held by higher income
taxpayers, we count only those returns with AGI in excess of a threshold of $200,000.12 This
marginal tax rate varies from 42.7% in 2000 to a low of 39.0% in 2010 and a high at the end of
the sample of 46.3% in 2016.
12 Ideally, we would have varied the threshold level by year, but such a refined calculation was not feasible given the presentation of the IRS data. The modest rate of inflation during this period and the presence of the bias in both the numerator and denominator of the percent of returns filed under regular tax status suggest that this omission will not result in a large error.
19
4. Results
This section contains our empirical results divided into three sections: before the Detroit
bankruptcy of July 2013, after the Detroit bankruptcy when the Treasury Put was extinguished,
and misallocation costs associated with the Treasury Put and inappropriately low interest rates on
Puerto Rican securities.
A. Before Detroit
The Detroit bankruptcy occurred in July 2013. We examine the 13 bond issue dates
comprising 45 sets of matched GO bonds that occurred between January 1, 2000 and the
bankruptcy. We study Puerto Rican matched bonds at the initial offering price on or near the
issue date. This is the period when bonds are most liquid, and hence prices should be most
accurate. The risk premium for Puerto Rican bonds is presented in column 12 of Table 2 for all
45 matched bonds. Table 2 also contains information about each issue including issue (dated)
date, bond insurer, amount of the issue, call year, maturity, quality of and, if any, bias from the
maturity match. The risk premium on Puerto Rican bonds is uniformly quite low – relative to
Baa bonds -- with two exceptions. The 13th issue has a high risk premium of 2.35 driven by a
very low yield on the matched insured bond. This low yield is difficult to understand and out-of-
line relative to the other insured bond issued on the same day (#14) and insured bonds issued five
months earlier (#12). Contributing factors for this low yield may be the non-callability of the
insured bond (however, since this bond matures in 10 years, the benefit of non-callability would
seem to be modest) or a reflection of the “municipal puzzle” discussed in Section 2.B. The
second occurrence of a relatively high risk premium is for bonds issued in May 2008 (#17 to
#22). This month is at the beginning of the financial crisis (the Bears Stearns collapse occurred
in March 2008) when markets were severely disrupted.
The results are summarized in Table 3, which aggregates the 45 risk premia into their 13
issue dates and compares them to the risk premia on Corporate Aaa, Corporate Baa, and Non-
Investment Grade bonds computed as the difference between the bond yield for a given asset
class and the date-comparable yield on a 20-year Treasury bond. The risk premium on Puerto
Rican bonds (column 2) generally lies between the risk premia for Corporate Aaa and Baa bonds
(columns 1 and 3, respectively), apart from the two exceptions noted above. Averaged over all
45 matched GO bonds issued since 2000, the risk premium on Puerto Rican GO bonds exceeds

20
the comparable risk premium on Corporate Aaa bonds by 68 basis points. Relative to Corporate
Baa bonds, the risk premium on Puerto Rican bonds is lower by 31 basis points. That gap
widens considerably when computed with respect to Non-Investment grade bonds, and it is a
substantial 310 basis points. Table 3 documents that the compensation for default risk on Puerto
Rican bonds was exceptionally low, an outcome that was eminently reasonable given the
expectation of financial support from the U.S. Treasury.
B. After Detroit
However, this expectation was upended by a seismic shock to the municipal bond market.
On July 18, 2013, Detroit filed for bankruptcy with liabilities of $18 to $20 billion. No federal
assistance was forthcoming. The absence of a bailout is particularly surprising when compared
to the New York City bailout of $2.3 billion. A comparable bailout in 2013 would have been
between $7.8 to $15.5 billion (using growth in the GDP price deflator or current dollar GDP per
capita as the scaling variable, respectively).
That a bailout was expected was clear. Detroit mayor Dave Bing, speaking on ABC’s
This Week, seemed to leave the door open for federal assistance, saying that he has engaged in
talks with the Obama administration for assistance (ABC, 2013) and noting the Chrysler and GM
had received federal aid when in financial distress. When asked “no federal bailout?,” Mayor
Bing responded “not yet.” Rollcall reported that “[s]oon after Detroit filed for protection under
Chapter 9 of the bankruptcy code, the Obama Administration made it clear it would not seek a
bailout similar to the $2.5 billion [sic] New York City loan package enacted in 1975” (Ota, 2013,
p. 2) The Obama Administration’s reluctance was echoed in Congress concerning pension
obligations. Eight days after Detroit filed for bankruptcy, Senator Lindsay Graham introduced
an amendment to a bill with the following provisions (Graham, 2013):
• No federal funds may be used to purchase or guarantee any asset or obligation of any municipal, local, or county government if that locality has defaulted, is at risk of defaulting, or likely to default absent such federal assistance. • In addition, the federal government would also be prohibited from issuing lines of credit or providing direct or indirect financial aid to prevent bankruptcy.
21
The amendment failed by a 14 to 16 vote. Other legislation was introduced in July 2013 to
specifically exempt the federal government from any liability for state and local pension
obligations (Ota, 2013, p. 2). This no-bailout sentiment was echoed by Morningstar (2013, p.
13): “[g]iven the current political climate in Washington, D.C., we also think it is unlikely that
the federal government will offer any sort of financial bailout for Puerto Rico.” The 2013
Detroit bankruptcy and the federal government’s truancy regarding a rescue package for debtors
or creditors was a watershed event extinguishing the Treasury Put.
The Detroit bankruptcy allows us to identify and quantify the Treasury Put. The effective
termination of the Treasury Put will be reflected in a marked increase in the risk premium on
Puerto Rican bonds on and shortly after July 2013. No new bonds were issued after this date, so
we cannot repeat the analysis in Section 4.A measuring risk premium on the issue date. Instead,
to assess the impact of the removal of the Treasury Put, we track the trading of matched bonds
and compute the yield-to-maturity on a monthly basis. The focus on a monthly interval is
necessitated by the thinness of the Puerto Rican bond market. Using equation (7) to compute the
risk premium for matched Puerto Rican bonds, we examine whether the Detroit bankruptcy led
to a substantial increase in the risk premium.13
Consistent with the Treasury Put hypothesis, the risk premium rises sharply after the
Detroit bankruptcy. For example, in May 2013, the average risk premium computed from
trading data is 256 basis points. The Detroit bankruptcy filing occurred on July 18, 2013. The
rise in the risk premium accelerated slowly. In September 2013, the average risk premium rose
to 423 basis points. This rise halted by the end of 2013, where the average risk premium stood at
606 basis points. The difference between the risk premium in May and December of 350 basis
points is our estimate of the Treasury Put.
C. Misallocation Costs
The Treasury Put misallocates capital. It lowers finance costs, shifts-out the demand
curve for capital, and thus directs capital to inefficient uses. The removal of the Treasury Put is
effectively an inward shift of the demand curve. Given our estimate of the Treasury Put and an
estimate of the slope of the supply curve for municipal bonds, the extent of this misallocation can
13 Owing to the nature of the computer programming, it was not possible to correct for any differential in maturities.

22
be estimated. The 350 basis point increase in the risk premium leads to approximately a 45%
increase in the cost of capital.14 When multiplied by an estimate of the slope of the supply curve
for municipal capital of 0.365 (Joulfaian and Matheson, 2009), the implied decrease in the stock
of capital is 16%, approximately $16 billion.
14 The average yield on uninsured Puerto Rican bonds before Detroit for the period January 2000 to April 2012 (the last issue before the Detroit bankruptcy) is 7.862. This yield is the cost of capital influencing the flow of debt to Puerto Rico. The removal of the Treasury Put, estimated here to be 3.500, would have increased this yield to 11.362, a 45% increase.
23
5. Summary And Conclusions
To answer the question posed in the title of this paper -- “What Went Wrong?” -- the
fault lies in financial markets, which systematically failed to control the flow of capital to Puerto
Rico. That fundamental cause of that failure was an implicit guarantee of the Puerto Rican
liabilities, the “Treasury Put.” Evaluating the Treasury Put hypothesis is made possible in the
case of Puerto Rico given two fortuitous features of the empirical environment – 1) pairs of
uninsured and insured bonds issued on the same day with the same maturity and other
characteristics and 2) the “seismic shock” of the Detroit bankruptcy and the unexpected absence
of federal support. Our identification of the Treasury Put is based on five pillars [supporting
evidence listed in brackets]:
1. Macroeconomic fundamentals were dismal [Introductory Section, Figures 1-5,
and Table 1],
2. The Treasury Put existed [Section 1],
3. Default risk was too low [Sections 2 and 4.A and Table 3],
4. The Treasury Put was extinguished [Section 4.B],
5. Default risk rose [Section 4.B].
The conclusion of this study differs from that offered by the GAO (2018). This well-
researched document concludes that the misallocation of capital was due largely to information
failures. Which view is correct has important implications for the appropriate policy. Under the
Information Failure hypothesis, capital flows can be improved by requiring better quality and
more timely information, as recommended by the GAO.
By contrast, the Treasury Put hypothesis raises the question how does the Treasury
extinguish its implicit guarantee?15 There is a sizeable literature studying the problem of how
governments can make binding, credible commitments while providing a safety net.16 Karaken
and Wallace (1978) was one of the earlier contributions in the context of deposit insurance.
15 The existence of a quantitatively important Treasury Put also raises questions about the proper specification of bond pricing formula, which usually ignore the important role for implicit government guarantees documented in this paper. 16 Bornstein and Lorenzoni (forthcoming) question the wisdom of a commitment strategy. They argue that a firm commitment to forbearance can lead to an aggregate demand externality. Discretionary interventions eliminate the latter and may lead to better outcomes, even in the face of moral hazard.
24
They concluded that regulation of the assets and liabilities of insured financial intermediaries is
essential. More recently, Kehoe and Chari (2016) analyze government bailouts as an inefficient
but unavoidable intervention into otherwise efficient markets. They focus on “sustainably
efficient” policies and also conclude that regulation is important; in their case, they advocate
controlling leverage and taxing size to achieve a second best outcome. A third approach is
“exemplary non-intervention,” as has been pursued with the Detroit and Puerto Rican defaults.
Whether any of these policies can be sustained in the future is debatable. One solution --
attempted unsuccessfully by several in Congress immediately after the Detroit bankruptcy -- is to
enact restrictive legislation. Of course, legislation that is passed can be revoked, but extant
legislation creates friction in the system that may temper changes and ultimately intervention.
Unfortunately, recent events offer a bleak prognosis. The Dodd-Frank legislation passed in the
United States after the 2007-2008 Global Financial Crisis involved a number of stringent
regulations. However, over time, they have been relaxed by actions of the Executive and
Judicial branches. Korea adopted a no-bailout policy after the 1997 financial crisis. This policy
was explicitly stated by the Korean government, resonated with the political position of the
incoming president, and was confirmed in a Letter of Intent to the IMF (Gormley, Johnson, and
Rhee, 2015, pp. 492-493). These authors conclude that the no-bailout policy was not enforced,
as the largest Korean firms received an exceptional amount of aid during the crisis. The history
of government policy during the Euro Crisis paints an equally uninviting picture. The no-bailout
clause in the Maastrict Treaty creating the European Monetary Union, coupled with explicit
statements of support of this clause by German Chancellor Kohl, were insufficient to prevent
massive bailouts during the Euro crisis by the European Union and the ECB (Sinn, 2014, pp. 19-
22). In the end, there may be a Gordian Knot connecting unfettered markets, restrictive policies,
and political interests (Rajan and Zingales, 2003; Morck, Wolfenzon, and Yeung, 2005). How to
extinguish the Treasury Put on an ongoing basis in a democratic society remains an open
question.
25
References
ABC, This Week With George Stephanopoulos (July 21, 2013). See https://abcnews.go.com/ThisWeek/video/detroit-mayor-dave-bing-week-interview-citys-bankruptcy-19727824 .
Altman, Edward I., “Predicting Financial Distress Of Companies: Revisiting The Z-Score
And Zeta® Models,” http://pages.stern.nyu.edu/~ealtman/Zscores.pdf (July 2000).
Atkeson, Andrew G., d’Avernas, Adrien, Eisfeldt, Andrea L., and and Weill, Pierre-Olivier, “Government Guarantees and the Valuation of American Banks,” NBER Macroeconomics Annual 2018 (forthcoming). Draft dated April 7, 2018. Bai, Jennie, Goldstein, Robert S., and Yang, Fan, “The Leverage Effect and the Basket-Index Put Spread,” Georgetown/Minnesota/Connecticut (September 9, 2017).
Barron‘s, “State of the States,” Barron’s (August 27, 2012). Bornstein, Gideon, and Lorenzoni, Guido, “Moral Hazard Misconceptions: The Case of the Greenspan Put,” IMF Economic Review (forthcoming).
Chalmers, John M.R., “Default Risk Cannot Explain the Muni Puzzle: Evidence from
Municipal Bonds that are Secured by U.S. Treasury Obligations,” The Review of Financial Studies 11 (1998), 281-308.
Chari, V.V., and Kehoe, Patrick, “Bailouts, Time Inconsistency and Optimal Regulation: A Macroeconomic View,” American Economic Review 106 (9) (September 2016), 2458-2493.
Commonwealth of Puerto Rico, Financial Information and Operating Data Report
(November 6, 2015). Curry, Timothy, and Shibut, Lynn, “The Cost of the Savings and Loan Crisis: Truth and
Consequences,” FDIC Banking Review 13, No. 2 (2000), 26-35. Draghi, Mario, Speech at the Global Investment Conference, London (July 26, 2012).
English, William B., “Understanding the Costs of Sovereign Default: American State Debts in the 1840's,” The American Economic Review 86 (March 1996), 259-275.
Federal Judicial Center, “Jurisdiction: Bankruptcy,”
https://www.fjc.gov/history/courts/jurisdiction-bankruptcy (n.d.). Federal Reserve Bank of New York, “Report On The Competitiveness of Puerto Rico’s
Economy,” (June 29, 2012).

26
Feenberg, Daniel, and Poterba, James M., “Which Households Own Municipal Bonds? Evidence from Tax Returns,” National Tax Journal 44 (December 1991, Part 1), 93-103.
Flannery, Mark J., and Sorescu, Sorin M., “Evidence of Bank Market Discipline in Subordinated Debenture Yields: 1983-1991,” Journal of Finance 51 (1996), 1347-1377. FRED, Federal Reserve Economic Data. See https://fred.stlouisfed.org.
GAO, U. S. General Accounting Office, “PUERTO RICO: Factors Contributing to the Debt Crisis and Potential Federal Actions to Address Them,” GAO Report to Congressional Committees, GAO-18-387 (May 2018).
Goetzmann, William N., Money Changes Everything: How Finance Made Civilization Possible (Princeton: Princeton University Press, 2016).
Gormley, Todd A., Johnson, Simon, and Rhee, Changyong, “Ending ‘Too Big To Fail’:
Government Promises Versus Investor Perceptions,” Review of Finance 19 (2015), 491-518. Graham, Lindsey, “Lindsey Graham: A Conservative Leader Who Gets Things Done.” Press Release (July 26, 2013).
Gürkaynak, Refet S., Sack, Brian, and Wright , Jonathan H., “The U.S. Treasury yield curve: 1961 to the present,” Journal of Monetary Economics 54 (2007), 2291-2304. Hobson, J.A., Imperialism (Ann Arbor: University of Michigan Press, 1938 (second printing 1967)).
Hotchkiss, E. S., John, K., Mooradian, R. M. and Thorburn, K. S., “Bankruptcy and the Resolution of Financial Distress,” in Handbook of Corporate Finance: Empirical Corporate Finance (Amsterdam: Elsevier/ North.Holland, 2008).
Investopedia, “Brady Bonds,” See https://www.investopedia.com/terms/b/bradybonds.asp, accessed May 18, 2018a.
Investopedia, “Troubled Asset Relief Program – TARP,” See https://www.investopedia.com/terms/t/troubled-asset-relief-program-tarp.asp, accessed May 18, 2018b.
Jenks, Leland Hamilton, The Migration of British Capital To 1875 (New York and
London: Alfred A. Knopf, 1938). Joulfaian, David, and Matheson, Thornton, “The Supply Elasticity of Tax-Exempt
Bonds,” National Tax Association Proceedings (2009), 136-142. Kalotay, Andrew J., and Dorigan, Michael P., “What Makes the Municipal Yield Curve
Rise?,” The Journal of Fixed Income (Winter 2008), 1-7.

27
Kareken, John H., and Wallace, Neil, “Deposit Insurance and Bank Regulation: A Partial-Equilibrium Exposition,” Journal of Business 51, No. 3 (1978), 413-438.
Kay, John, Other People’s Money (New York: Public Affairs, 2015). Kelly, Bryan, Lustig, Hanno, and van Nieuwerburgh, Stijn, “Too-Systematic-to-Fail: What Option Markets Imply about Sector-Wide Government Guarantees,” American Economic Review 106 (2016), 1278-1319.
King, Mervyn, The End of Alchemy: Money, Banking, and the Future of the Global Economy (New York: W.W. Norton & Company, 2016).
Krueger, Anne O., Teja, Ranjit, and Wolfe, Andrew, “Puerto Rico – A Way Forward,” Report (June 29, 2015).
Longstaff, Francis A., “Municipal Debt and Marginal Tax Rates: Is There a Tax Premium in Asset Prices?” The Journal of Finance 66, No. 3 (June 2011), 721-751.
Lustig, Nora, “The Mexican Peso Crisis: The Foreseeable and the Surprise,” Brookings
Institution (June 1995).
Miller, Marcus, Weller, Paul, and Zhang, Lei, “Moral Hazard and the US Stock Market: Analyzing the ‘Greenspan Put’,” The Economic Journal 112 (March 2002), C171-C186.
Moody’s, “Assured Guaranty, Ltd. and National Public Finance Guarantee Corp: Scenario Analysis Highlights Assured Guaranty’s Greater Resilience to Puerto Rico Losses,” ISSUER IN-DEPTH (November 2, 2016).
Moody’s. “Rating Scale and Definitions,” (no date; n.d.). See https://www.moodys.com/sites/products/ProductAttachments/AP075378_1_1408_KI.pdf Morck, Randall, Wolfenzon, Daniel, and Yeung, Bernard, “Corporate Governance, Economic Entrenchment, and Growth,” Journal of Economic Literature 43 (2005), 655-720. Moretti, Enrico, and Wilson, Daniel J., “The Effect of State Taxes on the Geographical Location of Top Earners: Evidence from Star Scientists,” American Economic Review 107(7) (July 2017), 1858-1903. Morningstar, “Morningstar Special Report: Puerto Rico Fiscal Strain: Implications for Investors.” (October 16, 2013). New York Times, “Lockheed Bailout Largest by U.S.,” (August 2, 1979).
New York Times, “Infamous ‘Drop Dead’ Was Never Said By Ford,” (December 28, 2006).

28
New York Times, “Hurricane-Torn Puerto Rico Says It Can’t Pay Any of Its Debts for 5
Years,” (January 24, 2018). Nosal, Jaromir B., and Ordoñez, Guillermo, “Uncertainty as commitment,” Journal of
Monetary Economics 80 (2016), 124-140.
Pensions & Investments, “Puerto Rico Bankruptcy Pits Investors Against Pensioners,” (May 15, 2017).
Rajan, Raghuram G., and Zingales, Luigi, Saving Capitalism from the Capitalists: Unleashing the Power of Financial Markets to Create Wealth and Spread Opportunity (New York: Crown Business/Random House, 2003).
Ota, Alan K., “Detroit’s Woes Put New Spotlight on Pension Overhaul Proposals,” Rollcall (July 24, 2013).
Rajan, Raghuram G., and Zingales, Luigi, Saving Capitalism from the Capitalists:
Unleashing the Power of Financial Markets to Create Wealth and Spread Opportunity (New York: Crown Business/Random House, 2003).
Schankel, Alan, “Puerto Rico’s Debt Overload,” Janney Fixed Income Strategy (July 27,
2012). Sinn, Hans-Werner, The Euro Trap: On Bursting Bubbles, Budgets, and Beliefs (Oxford: Oxford University Press, 2014).
United Nations, Population Division, Department of Economic and Social Affairs, World Population Prospects: The 2017 Revision, Medium fertility variant, 2015 – 2100. DVD Edition. See https://www.un.org/development/desa/publications/world-population-prospects-the-2017-revision.html . Data retrieved May 6, 2018.
U.S. Congress, “Puerto Rico Oversight, Management, and Economic Stability Act” or
“PROMESA,” Public Law 114-187 (June 30, 2016). Veronesi, Pietro, and Zingales, Luigi, “Paulson’s Gift,” Journal of Financial Economics
97 (2010), 339-368. Washington Post, “When the Taxpayers Saved Lee Iacocca’s Bacon, What Did They Get
Out of It?,” (May 13, 1984).

29
Appendix A. Computing The Debt/GDP And Unfunded Pension Liabilities/GDP Ratios
The fiscal situation of a sovereign state –a nation, a sub-national unit (e.g., a U.S. state or
city), or a territory (e.g., the Commonwealth of Puerto Rico) -- is often evaluated by the ratio of
outstanding liabilities to some measure of economic activity. The two most frequently used
measures of economic activity are gross domestic product (GDP) and gross national product
(GNP). (Unless otherwise stated, GDP and GNP are in nominal terms.) GDP measures the
value of economic activity within the borders of a sovereign state regardless if it is undertaken by
citizens (both persons and businesses) or foreigners. GNP equals GDP plus the economic
activity of its citizens working abroad less the economic activity of foreigners working within its
borders. (GNP is sometimes labeled gross national income.) For most countries, the two
measures are quite close. But when there is a large foreign presence, GDP will exceed GNP.
Such a situation holds, for example for Ireland, Luxembourg, and Puerto Rico. Since the
measure of economic activity is meant to capture the ability of a sovereign state to repay its
debts, GDP is the more appropriate concept because the activities it measures can be taxed.
A sovereign state’s liabilities are the sum of outstanding debt plus unfunded pension
liabilities. Data on the outstanding debt of Puerto Rico has been collected by Krueger, Teja, and
Wolfe (2015) but it was stated relative to GNP. The debt/GDP data reported in Figure 4 (column
3) are computed as the product of debt/GNP (column 1) multiplied by the GNP/GDP ratio
(column 2) in Table A1,

30
Table A1 -- Computing The Debt/GDP And Total Liabilities/GDP Ratios
Year Debt/GNP (%)
GNP/GDP Debt/GDP(%)
Total Liabilities/GDP (%)
(1)
(2) (3) (4)
2000 63.2 0.671 42.4 70.2
2005 71.2 0.649 46.2 76.5
2010 90.9 0.658 59.8 99.0
2015 100.2 0.658 65.9 109.1
Notes And Sources: Column 1: Krueger, Teja, and Wolfe (2015, p. 9); unfunded pension obligations are excluded. Column 2: University of Pennsylvania, Ratio of GNP to GDP for Puerto Rico [GNPGDPPRA156NUPN], retrieved from FRED; https://fred.stlouisfed.org/series/GNPGDPPRA156NUPN, February 20, 2018. No data are available for 2015; the 2015 value equals the 2010 value. Column 3: Transformation: the product of columns 1 and 2. Column 4: Transformation: column 3 multiplied by 1.654, per the discussion below.
The debt figures in columns 1, 2, and 3 of Table A1 exclude unfunded pension liabilities.
We use two different data sources to estimate unfunded pension liabilities. Barron’s (2012)
contains data for 2012 on unfunded pension liabilities, as well as outstanding debt. However,
their debt figure of $51.9 is approximately 17% lower than the implied debt figure in column 3,
the latter interpolated linearly between the 2010 and 2015 data (62.3%). We believe that the
Krueger, Teja, and Wolfe are more accurate. To attenuate measurement error, we thus use the
ratio of unfunded pension liabilities to debt in the Barron’s data is 0.638 (= 33.1 / 51.9). The
second data source is from Pensions & Investments (2017), which reports a ratio of unfunded
pension liabilities to debt of 0.670 (= 50.0 / 74.0); we round down slightly since the article
mentions that the estimate of unfunded pension liabilities is slightly below 50. We average these
two ratios (0.654) and assume that this estimate can be applied to the debt figures in the above

31
appendix table. These computations are presented in column 4.
These figures may represent a lower bound. Morningstar (2013) reports that debt and
unfunded liabilities are $88.6 (p. 5) and $37.0 (p. 4), respectively, in 2013, resulting in a Total
Liabilities / GDP ratio of 1.23. This ratio is 17% higher than the comparable ratio in Table A1
(based on a linear interpolation between 2010 and 2015.

Appendix B. Puerto Rican Government Deficits This appendix provides details underlying Figure 5. The figures in columns 1 to 5 are in billions of U.S. dollars. The figures
in columns 6 to 9 are stated as percentages.
Year Deficit Deficit As A Percentage Of GDP
Budgetary (Cash) Basis
Budgetary (Cash) Basis
Accrual Basis
Operating Basis
GDP
Budgetary(Cash) Basis
Budgetary(Cash) Basis
Accrual Basis
Operating Basis
(1)
(2) (3) (4) (5) (6) (7) (8) (9)
2002 1.09 71.62 1.52 2003 0.94 74.83 1.25 2004 2.68 80.32 3.33 2005 3.09 83.91 3.68 2006 1.81 87.28 2.07 2007 1.29 89.52 1.44 2008 4.86 93.64 5.19 2009 5.04 2.86 3.52 2.68 96.39 5.23 2.97 3.65 2.78 2010 4.48 2.72 4.35 1.81 98.38 4.56 2.77 4.42 1.84 2011 4.30 1.80 3.79 1.09 100.35 4.29 1.79 3.77 1.09 2012 5.94 2.38 5.22 2.75 101.56 5.85 2.34 5.14 2.71 2013 6.43 1.31 3.61 2.55 102.45 6.28 1.28 3.52 2.49 2014 6.18 102.45 6.03
. Average, 2009 to 2013 5.24 2.23 4.10 2.18
Ratio To The Average in Column 7 1.00 1.84 0.98

33
Notes And Sources: Column 1: GAO (2018, Figure 2, p. 9. Data provided via a FOIA request to the GAO. These data are based on a careful analysis of government financial statements by the GAO, and they are compiled from Puerto Rico’s publicly available, audited financial statements. Column 2: Commonwealth of Puerto Rico (2015, p. 64). Column 3: Commonwealth of Puerto Rico (2015, p. 66, Total Government). Column 4: Commonwealth of Puerto Rico (2015, p. 66, Total Government less Debt Service less COFINA Debt Service less principal payments (per fn. (1)). Column 5: World Bank [NYGDPMKTPCDPRI], retrieved from FRED, Federal Reserve Bank of St. Louis; https://fred.stlouisfed.org/series/NYGDPMKTPCDPRI, February 20, 2018. Column 6: Transformation, column 1 divided by column 5, times 100. Column 7: Transformation, column 2 divided by column 5, times 100. Column 8: Transformation, column 3 divided by column 5, times 100. Column 9: Transformation, column 4 divided by column 5, times 100.

34
Appendix C. Moody’s Rating Scale – Long-Term Debt Rating Description Investment Grade Aaa Obligations rated Aaa are judged to be of the highest quality, with minimal risk. Aa1
Obligations rated Aa are judged to be of high quality and are subject to very low credit risk. Aa2 Aa3 A1
Obligations rated A are considered upper-medium-grade and are subject to low credit risk. A2 A3 Baa1
Obligations rated Baa are subject to moderate credit risk. They are considered medium-grade and as such may possess speculative characteristics.
Baa2 Baa3 Non-Investment Grade Ba1
Obligations rated Ba are judged to have speculative elements and are subject to substantial credit risk. Ba2 Ba3 B1
Obligations rated B are considered speculative and are subject to high credit risk. B2 B3 Caa1
Obligations rated Caa are judged to be of poor standing and are subject to very high credit risk. Caa2 Caa3 Ca Obligations rated Ca are highly speculative and are likely in, or very near, default, with some
prospect of recovery in principal and interest. C Obligations rated C are the lowest-rated class of bonds and are typically in default, with little prospect
for recovery of principal and interest. Notes: Long-term debt has an original maturity of one year or greater. Source: Moody’s (n.d.) Rating Scale and Definitions; https://www.moodys.com/sites/products/ProductAttachments/AP075378_1_1408_KI.pdf
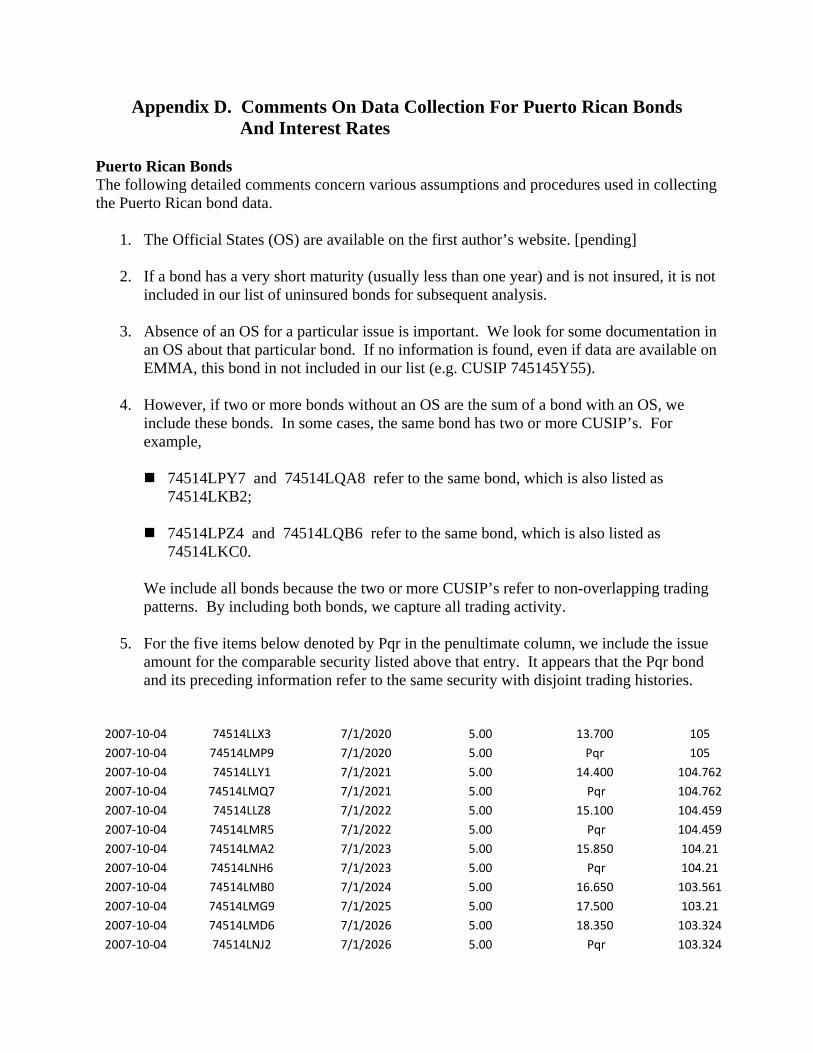
Appendix D. Comments On Data Collection For Puerto Rican Bonds And Interest Rates Puerto Rican Bonds The following detailed comments concern various assumptions and procedures used in collecting the Puerto Rican bond data.
1. The Official States (OS) are available on the first author’s website. [pending]
2. If a bond has a very short maturity (usually less than one year) and is not insured, it is not
included in our list of uninsured bonds for subsequent analysis.
3. Absence of an OS for a particular issue is important. We look for some documentation in an OS about that particular bond. If no information is found, even if data are available on EMMA, this bond in not included in our list (e.g. CUSIP 745145Y55).
4. However, if two or more bonds without an OS are the sum of a bond with an OS, we
include these bonds. In some cases, the same bond has two or more CUSIP’s. For example,
74514LPY7 and 74514LQA8 refer to the same bond, which is also listed as
74514LKB2;
74514LPZ4 and 74514LQB6 refer to the same bond, which is also listed as 74514LKC0.
We include all bonds because the two or more CUSIP’s refer to non-overlapping trading patterns. By including both bonds, we capture all trading activity.
5. For the five items below denoted by Pqr in the penultimate column, we include the issue
amount for the comparable security listed above that entry. It appears that the Pqr bond and its preceding information refer to the same security with disjoint trading histories.
2007‐10‐04 74514LLX3 7/1/2020 5.00 13.700 105
2007‐10‐04 74514LMP9 7/1/2020 5.00 Pqr 105
2007‐10‐04 74514LLY1 7/1/2021 5.00 14.400 104.762
2007‐10‐04 74514LMQ7 7/1/2021 5.00 Pqr 104.762
2007‐10‐04 74514LLZ8 7/1/2022 5.00 15.100 104.459
2007‐10‐04 74514LMR5 7/1/2022 5.00 Pqr 104.459
2007‐10‐04 74514LMA2 7/1/2023 5.00 15.850 104.21
2007‐10‐04 74514LNH6 7/1/2023 5.00 Pqr 104.21
2007‐10‐04 74514LMB0 7/1/2024 5.00 16.650 103.561
2007‐10‐04 74514LMG9 7/1/2025 5.00 17.500 103.21
2007‐10‐04 74514LMD6 7/1/2026 5.00 18.350 103.324
2007‐10‐04 74514LNJ2 7/1/2026 5.00 Pqr 103.324

36
6. For 10.16.07, the data for 74514LNA1 and74514LNB9 are not consistent in EMMA when compared to the OS. We assume the data in the OS is the correct data. In effect, the data for 74514LNA1 and74514LNB9 need to be swapped with each other to be consistent with the information in the OS.
7. If EMMA indicates a lower amount at issuance relative to the OS, we use the data for EMMA.
8. If a bond is listed in the OS but does not appear in EMMA, then a) if we have a CUSIP from the OS, we include the bond or b) if we do not have a CUSIP from the OS, we exclude the bond.
9. For the bonds placed on May 18, 2004, the yield figures (0.0383 for all three bonds)
reported in the OS have been converted to the equivalent bond prices to ensure reporting uniformity with respect to the other bonds in the table. The bond prices have been computed with a precision of two.
Interest Rates 10. Three Aaa and Baa datapoints were interpolated: 12.31.65, 12.31.71, 11.11.16.
11. Two Municipal 20 datapoints were interpolated: 1.1.71, 9.14.01.

37
Appendix E. Computing The Marginal Income Tax Rate For The Marginal Municipal Bond Investor
Table E1 lists the tax rates and other variables needed to compute the marginal income tax rate for the marginal municipal bond investor. Investors in Puerto Rican bonds are not assessed these taxes. The data are provided in Table E2.
Table E1 -- Taxation Of Income From Treasury And Puerto Rican Bonds Regular And Alternative Minimum Tax (AMT) Regimes
Data Sources
Tax Regime: Regular AMT Issuer: U.S.
TreasuryPuerto Rico
U.S. Treasury
Puerto Rico
Tax Rates (1) (2) (3) (4)
1 Federal tax rate
[ F ]
Yes
No No No
2 State tax rate
[ S ]
Yes No Yes No
3 Net federal and state tax rate
[ FS F S F S* ]
Yes No No No
4 3.8% (net investment income tax (NII, “Medicare Tax”))
[ NII 0.038 ]
Yes No Yes No
5 2.0% (phase-out of personal exemptions (PPE))
[ PPE FS(0.02/ 2,500)* ]
Yes No No No
6 3.0% (phase-out of itemized deductions (PID, Pease
Limitation)) [ PID FS0.03* ]
Yes No No No
7 Regular marginal tax rate on interest income
[ REG FS NII PPE PID ]
Yes No No No

38
8 AMT federal tax rate
[ A ]
No No Yes No
9 25.0%*AMT tax rate (phase-out of AMT exemption)
[ A0.25* ]
No No Yes No
10 AMT marginal tax rate on interest income AMT A S NII[ *1.25 ]
No No Yes No
11 Number of total returns filed with AGI > $200,000
[ TOTALN ]
------- ------- ------- -------
12 Number of AMT returns filed with AGI > $200,000
[ AMTN ]
------- ------- ------- -------
13 Percent of returns filed under regular tax status
[ REG TOTAL AMT TOTAL(N N ) / N ]
------- ------- ------- -------
14 Marginal tax rate on interest income
[ REG REG REG AMT* (1 )* ]
------- ------- ------- -------
Notes And Sources (presented by row number) Several of the sources below are to the website of the Internal Revenue Service (IRS, https://www.irs.gov ).
1. Source: IRS (Statistics of Income (SOI), Table 23).
2. Source: Daniel Wilson (Federal Reserve Bank of San Francisco). Weighted-average of the individual state tax rates, where the individual state data are from the NBER TAXSIM model for the period 1999 to 2011 and the weights are state personal income. For the period 2012 to 2016, values for the weighted-average are assumed equal to the 2011 value. State tax data from the SOI Public Use Files suggests that there is little variation in the average state tax rates for the period 2011 to 2016 (http://users.nber.org/~taxsim/marginal-tax-rates/as.html). See Moretti and Wilson (2017) for more details about the source data.
3. Transformation: State taxes are assumed deductible against federal taxes.
4. Source: IRS. This tax began in 2013.

39
5. Source: IRS. Phase-outs are in effect from 1999 to 2000, eliminated from 2001 to 2012 under the 2001 Bush tax cuts (the Economic Growth and Tax Relief Reconciliation Act of 2001), and reinstated from 2013 to the present. In 2015, phase-out increments are determined discretely in terms of $2,500 “steps.” The computation linearizes the step function. The same pattern is assumed for all years in which phase-outs were in effect.
6. Source: IRS. Phase-outs are in effect as follows: 1999-2005, 3%; 2006-2007, 2%, 2008-2009, 1%; 2010-2012, 0%; 2013-present, 3% (American Taxpayer Relief Act, 2012). For 2015, the computation is based on the assumption that adjusted gross income (AGI) is too high to permit the deduction of medical/dental and casualty/theft expenses, that there are no gambling losses, and that investment funds are not borrowed.
7. Transformation.
8. Source: IRS. This figure is for the highest marginal income tax rate under AMT.
9. Source: IRS.
10. Transformation.
11. Source: IRS. For 2004 to 2014, data obtained from SOI Tax Stats – Historic Table 2 (https://www.irs.gov/uac/soi-tax-stats-
historic-table-2). For 1999 to 2003, only data for total returns are available from SOI Tax Stats – Individual Income Tax Returns Publication 1304 (Complete Report) (https://www.irs.gov/uac/soi-tax-stats-individual-income-tax-returns-publication-
1304-complete-report#_tbla). For this period, the ratio REG in row 13 is estimated directly as the total returns ratio (REG / (REG + AMT) in year t divided by the total returns ratio in 2004, all multiplied by the high income ratio (REG / (REG + AMT) for AGI > $200,000) for 2004. A comparison of the total returns data from the two different data sources for 2004 and 2005 indicates a very close match. The data for these computations is contained in the EXCEL file “Computing the REG Weight.”
12. Same as 11.
13. Transformation.
14. Transformation.
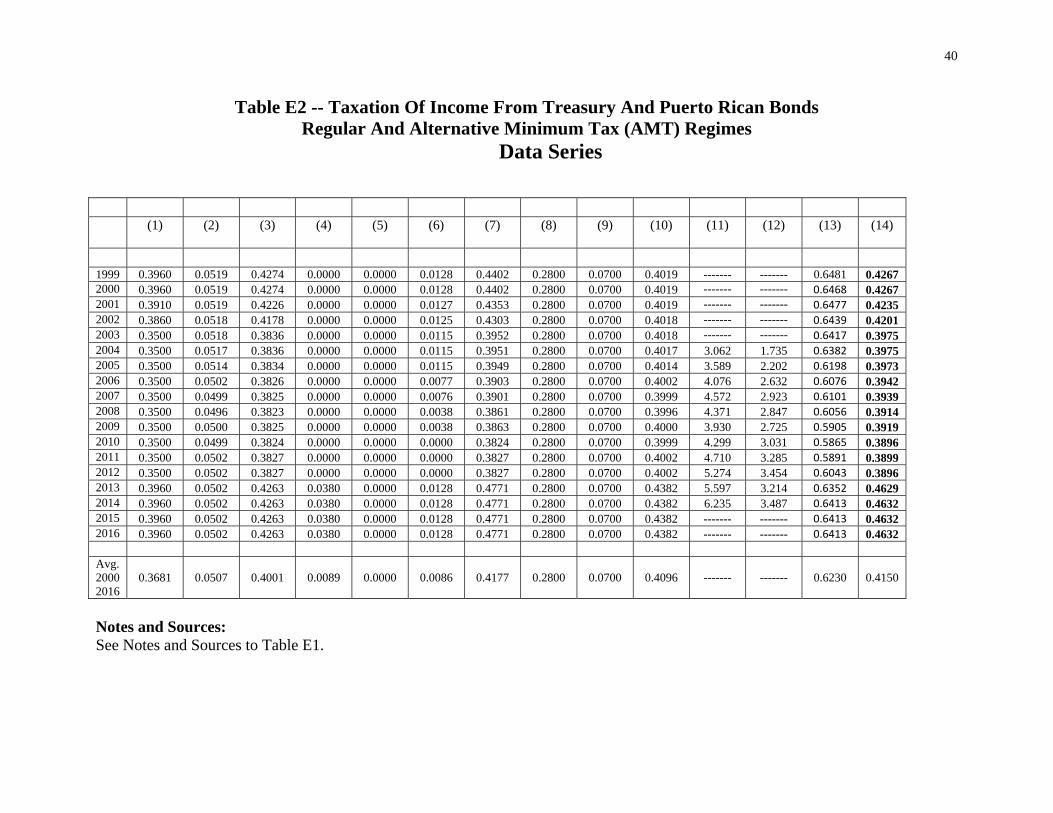
40
Table E2 -- Taxation Of Income From Treasury And Puerto Rican Bonds Regular And Alternative Minimum Tax (AMT) Regimes
Data Series
(1)
(2) (3) (4) (5) (6) (7) (8) (9) (10) (11) (12) (13) (14)
1999 0.3960 0.0519 0.4274 0.0000 0.0000 0.0128 0.4402 0.2800 0.0700 0.4019 ------- ------- 0.6481 0.4267 2000 0.3960 0.0519 0.4274 0.0000 0.0000 0.0128 0.4402 0.2800 0.0700 0.4019 ------- ------- 0.6468 0.4267 2001 0.3910 0.0519 0.4226 0.0000 0.0000 0.0127 0.4353 0.2800 0.0700 0.4019 ------- ------- 0.6477 0.4235 2002 0.3860 0.0518 0.4178 0.0000 0.0000 0.0125 0.4303 0.2800 0.0700 0.4018 ------- ------- 0.6439 0.4201 2003 0.3500 0.0518 0.3836 0.0000 0.0000 0.0115 0.3952 0.2800 0.0700 0.4018 ------- ------- 0.6417 0.3975 2004 0.3500 0.0517 0.3836 0.0000 0.0000 0.0115 0.3951 0.2800 0.0700 0.4017 3.062 1.735 0.6382 0.3975 2005 0.3500 0.0514 0.3834 0.0000 0.0000 0.0115 0.3949 0.2800 0.0700 0.4014 3.589 2.202 0.6198 0.3973 2006 0.3500 0.0502 0.3826 0.0000 0.0000 0.0077 0.3903 0.2800 0.0700 0.4002 4.076 2.632 0.6076 0.3942 2007 0.3500 0.0499 0.3825 0.0000 0.0000 0.0076 0.3901 0.2800 0.0700 0.3999 4.572 2.923 0.6101 0.3939 2008 0.3500 0.0496 0.3823 0.0000 0.0000 0.0038 0.3861 0.2800 0.0700 0.3996 4.371 2.847 0.6056 0.3914 2009 0.3500 0.0500 0.3825 0.0000 0.0000 0.0038 0.3863 0.2800 0.0700 0.4000 3.930 2.725 0.5905 0.3919 2010 0.3500 0.0499 0.3824 0.0000 0.0000 0.0000 0.3824 0.2800 0.0700 0.3999 4.299 3.031 0.5865 0.3896 2011 0.3500 0.0502 0.3827 0.0000 0.0000 0.0000 0.3827 0.2800 0.0700 0.4002 4.710 3.285 0.5891 0.3899 2012 0.3500 0.0502 0.3827 0.0000 0.0000 0.0000 0.3827 0.2800 0.0700 0.4002 5.274 3.454 0.6043 0.3896 2013 0.3960 0.0502 0.4263 0.0380 0.0000 0.0128 0.4771 0.2800 0.0700 0.4382 5.597 3.214 0.6352 0.4629 2014 0.3960 0.0502 0.4263 0.0380 0.0000 0.0128 0.4771 0.2800 0.0700 0.4382 6.235 3.487 0.6413 0.4632 2015 0.3960 0.0502 0.4263 0.0380 0.0000 0.0128 0.4771 0.2800 0.0700 0.4382 ------- ------- 0.6413 0.4632 2016 0.3960 0.0502 0.4263 0.0380 0.0000 0.0128 0.4771 0.2800 0.0700 0.4382 ------- ------- 0.6413 0.4632 Avg. 20002016
0.3681
0.0507
0.4001
0.0089
0.0000
0.0086
0.4177
0.2800
0.0700
0.4096
-------
-------
0.6230
0.4150
Notes and Sources: See Notes and Sources to Table E1.

41
Figure 1. Population Growth, 2000-2016
Notes: Annual population growth rate for year t is the exponential rate of growth of midyear population from year t-1 to t, expressed as a percentage. Population is based on the de facto definition of population, which counts all residents regardless of legal status or citizenship--except for refugees not permanently settled in the country of asylum, who are generally considered part of the population of the country of origin. Source: World Bank, Population Growth for Puerto Rico [SPPOPGROWPRI], retrieved from FRED, Federal Reserve Bank of St. Louis; https://fred.stlouisfed.org/series/SPPOPGROWPRI, February 19, 2018.
‐2.00
‐1.50
‐1.00
‐0.50
0.00
0.50

42
Figure 2. Employment To Population Ratio, 2000-2017
Notes: Employment to population ratio is the proportion of a country's working-age population that is employed. Ages 15 and older are generally considered the working-age population (modeled ILO estimate). Source: World Bank, Employment to Population Ratio for Puerto Rico [SLEMPTOTLSPZSPRI], retrieved from FRED, Federal Reserve Bank of St. Louis; https://fred.stlouisfed.org/series/SLEMPTOTLSPZSPRI, February 19, 2018
35.00
36.00
37.00
38.00
39.00
40.00
41.00
42.00
43.00
44.00
45.00
2000
2001
2002
2003
2004
2005
2006
2007
2008
2009
2010
2011
2012
2013
2014
2015
2016
2017
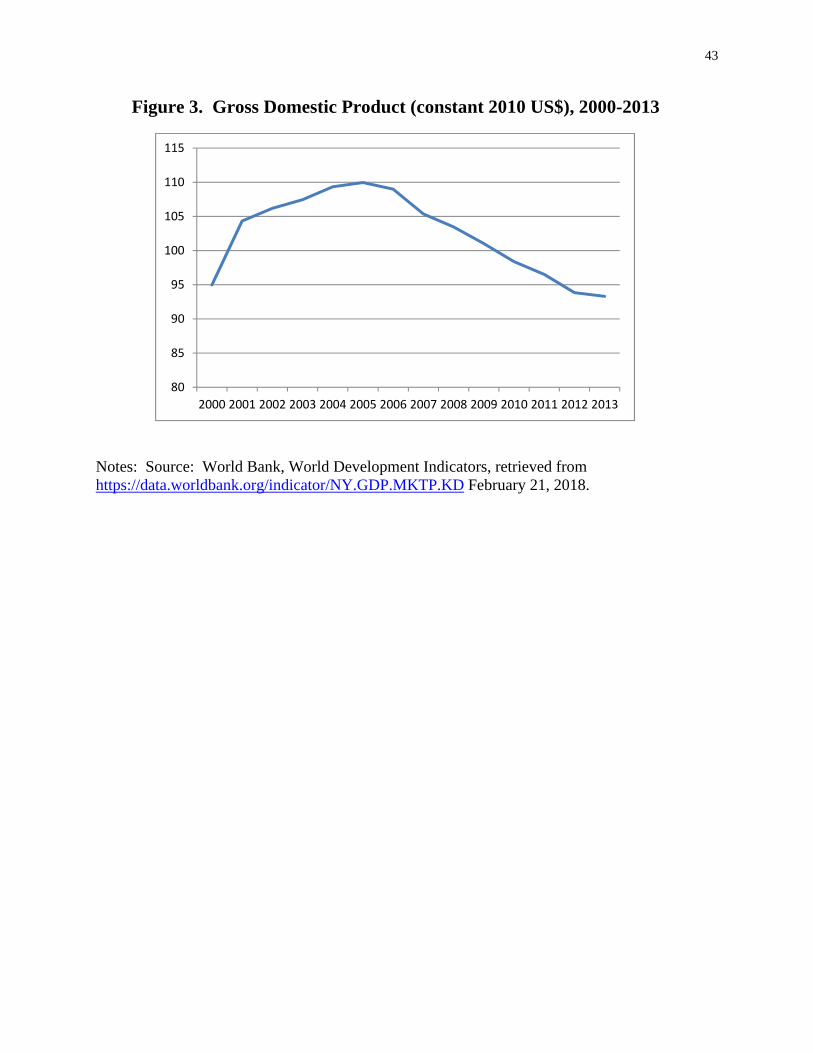
43
Figure 3. Gross Domestic Product (constant 2010 US$), 2000-2013
Notes: Source: World Bank, World Development Indicators, retrieved from https://data.worldbank.org/indicator/NY.GDP.MKTP.KD February 21, 2018.
80
85
90
95
100
105
110
115
2000 2001 2002 2003 2004 2005 2006 2007 2008 2009 2010 2011 2012 2013
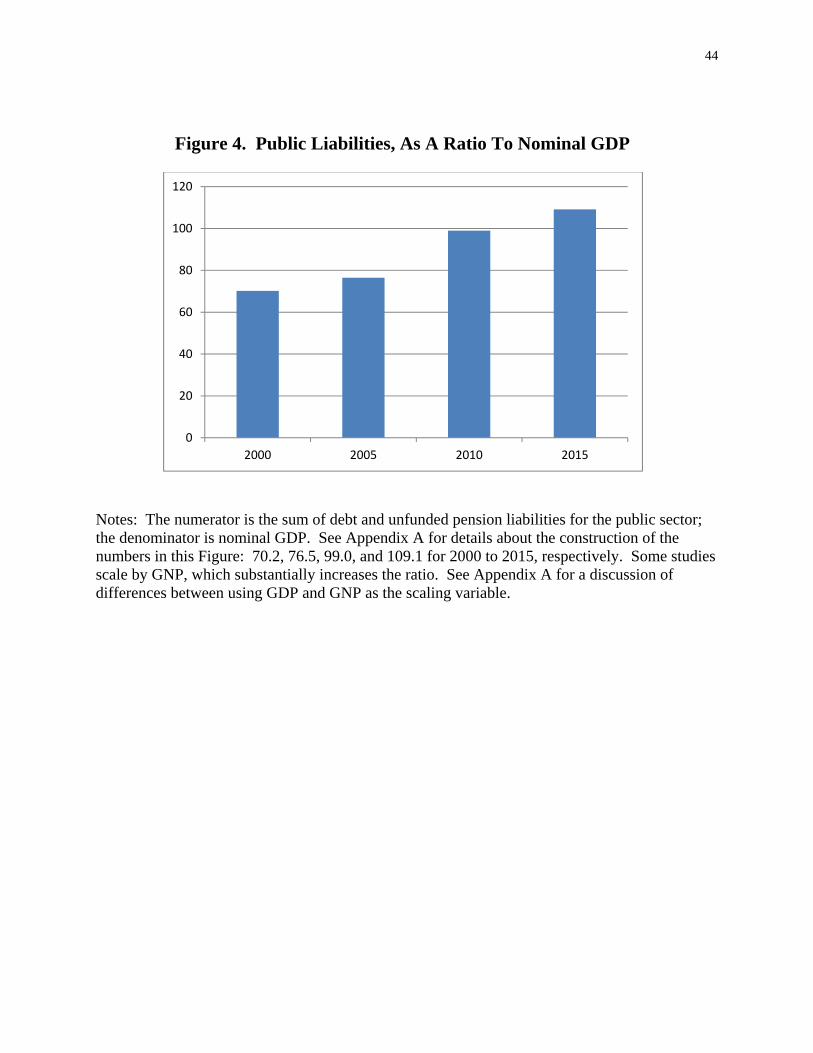
44
Figure 4. Public Liabilities, As A Ratio To Nominal GDP
Notes: The numerator is the sum of debt and unfunded pension liabilities for the public sector; the denominator is nominal GDP. See Appendix A for details about the construction of the numbers in this Figure: 70.2, 76.5, 99.0, and 109.1 for 2000 to 2015, respectively. Some studies scale by GNP, which substantially increases the ratio. See Appendix A for a discussion of differences between using GDP and GNP as the scaling variable.
0
20
40
60
80
100
120
2000 2005 2010 2015
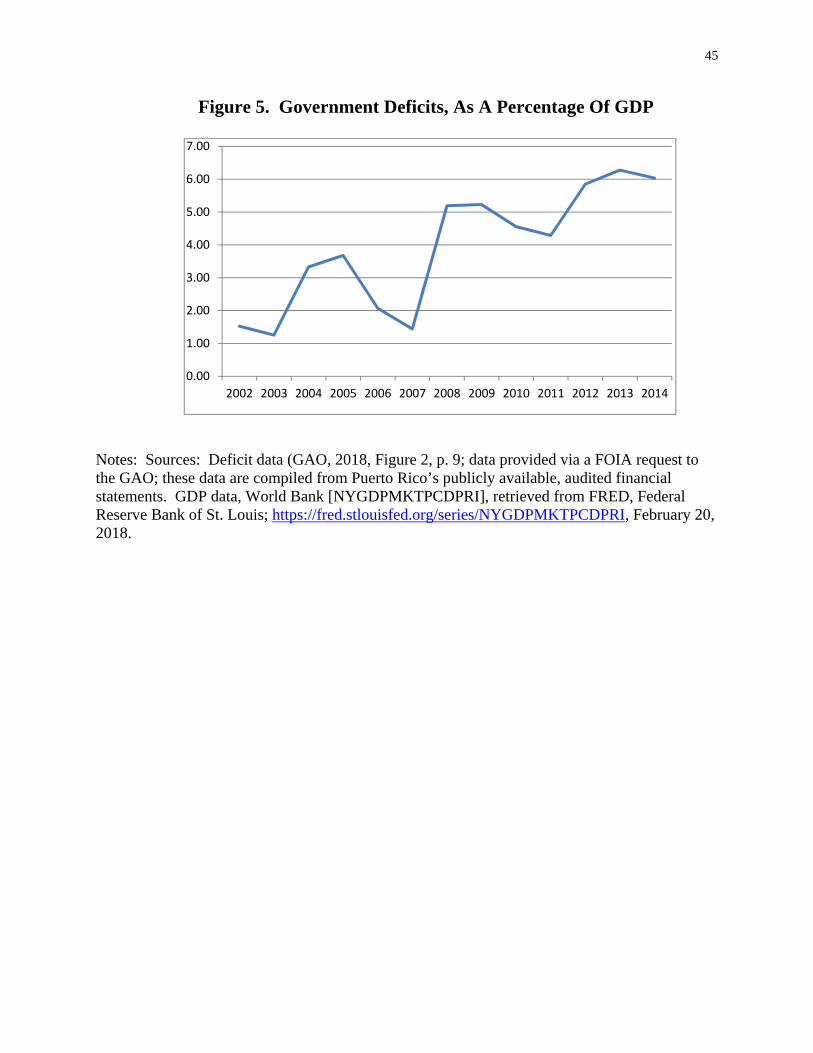
45
Figure 5. Government Deficits, As A Percentage Of GDP
Notes: Sources: Deficit data (GAO, 2018, Figure 2, p. 9; data provided via a FOIA request to the GAO; these data are compiled from Puerto Rico’s publicly available, audited financial statements. GDP data, World Bank [NYGDPMKTPCDPRI], retrieved from FRED, Federal Reserve Bank of St. Louis; https://fred.stlouisfed.org/series/NYGDPMKTPCDPRI, February 20, 2018.
0.00
1.00
2.00
3.00
4.00
5.00
6.00
7.00
2002 2003 2004 2005 2006 2007 2008 2009 2010 2011 2012 2013 2014

46
Table 1 – Median Age Of the Population
Country 2015 2040 Annualized Growth Rate
(%) (1)
(2) (3)
Puerto Rico 36.4 45.8 0.923 Caribbean Region 30.3 37.7 0.878 United States 37.6 41.2 0.366 More Developed Countries 41.1 45.5 0.408 Less Developed Countries 27.8 33.1 0.700
Notes: Source: United Nations (2018).
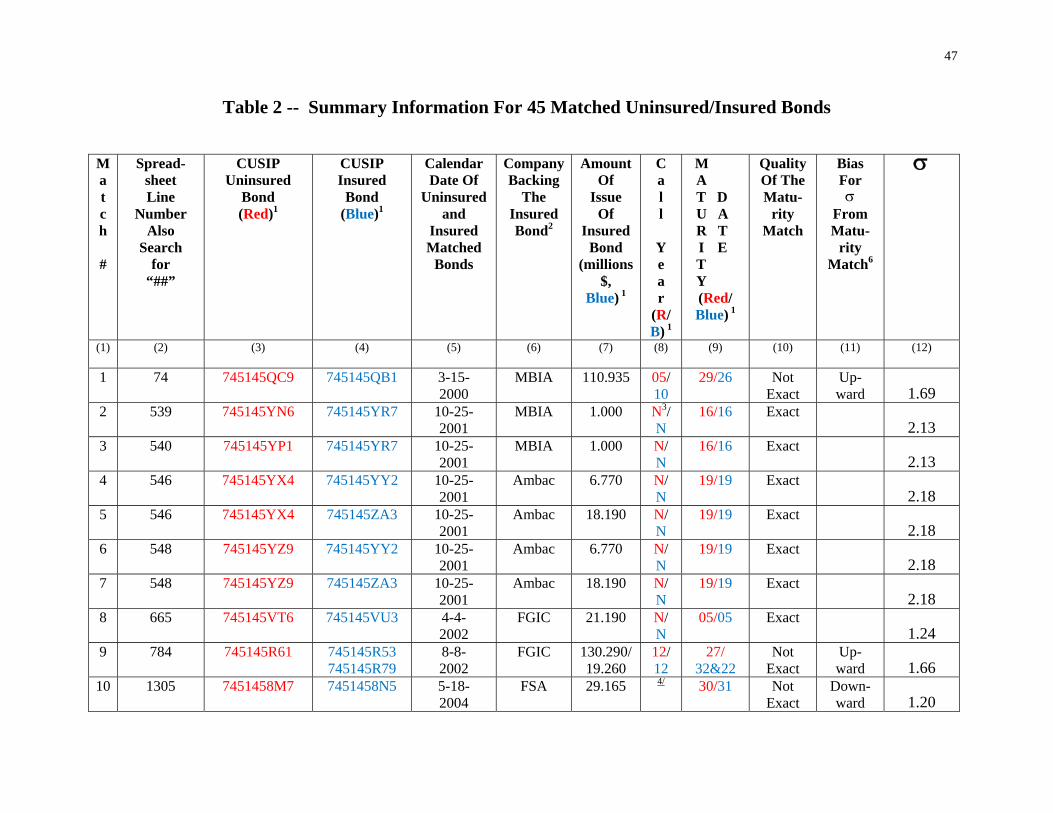
47
Table 2 -- Summary Information For 45 Matched Uninsured/Insured Bonds M a t c h
#
Spread- sheet Line
Number Also
Search for
“##”
CUSIP Uninsured
Bond (Red)1
CUSIP Insured
Bond (Blue)1
Calendar Date Of
Uninsured and
Insured Matched
Bonds
Company Backing
The Insured Bond2
Amount Of
Issue Of
Insured Bond
(millions $,
Blue) 1
C a l l
Y e a r
(R/ B) 1
M A T D U A R T I E T Y
(Red/ Blue) 1
Quality Of The Matu-
rity Match
Bias For
From Matu-
rity Match6
(1) (2) (3) (4) (5)
(6) (7) (8) (9) (10) (11) (12)
1 74 745145QC9 745145QB1 3-15- 2000
MBIA 110.935 05/ 10
29/26 Not Exact
Up- ward 1.69
2 539 745145YN6 745145YR7 10-25- 2001
MBIA 1.000 N3/ N
16/16 Exact 2.13
3 540 745145YP1 745145YR7 10-25- 2001
MBIA 1.000 N/ N
16/16 Exact 2.13
4 546 745145YX4 745145YY2 10-25- 2001
Ambac 6.770 N/ N
19/19 Exact 2.18
5 546 745145YX4 745145ZA3 10-25- 2001
Ambac 18.190 N/ N
19/19 Exact 2.18
6 548 745145YZ9 745145YY2 10-25- 2001
Ambac 6.770 N/ N
19/19 Exact 2.18
7 548 745145YZ9 745145ZA3 10-25- 2001
Ambac 18.190 N/ N
19/19 Exact 2.18
8 665 745145VT6 745145VU3 4-4- 2002
FGIC 21.190 N/ N
05/05 Exact 1.24
9 784 745145R61 745145R53 745145R79
8-8- 2002
FGIC 130.290/ 19.260
12/ 12
27/ 32&22
Not Exact
Up- ward 1.66
10 1305 7451458M7
7451458N5 5-18- 2004
FSA 29.165 4/ 30/31 Not Exact
Down-ward 1.20
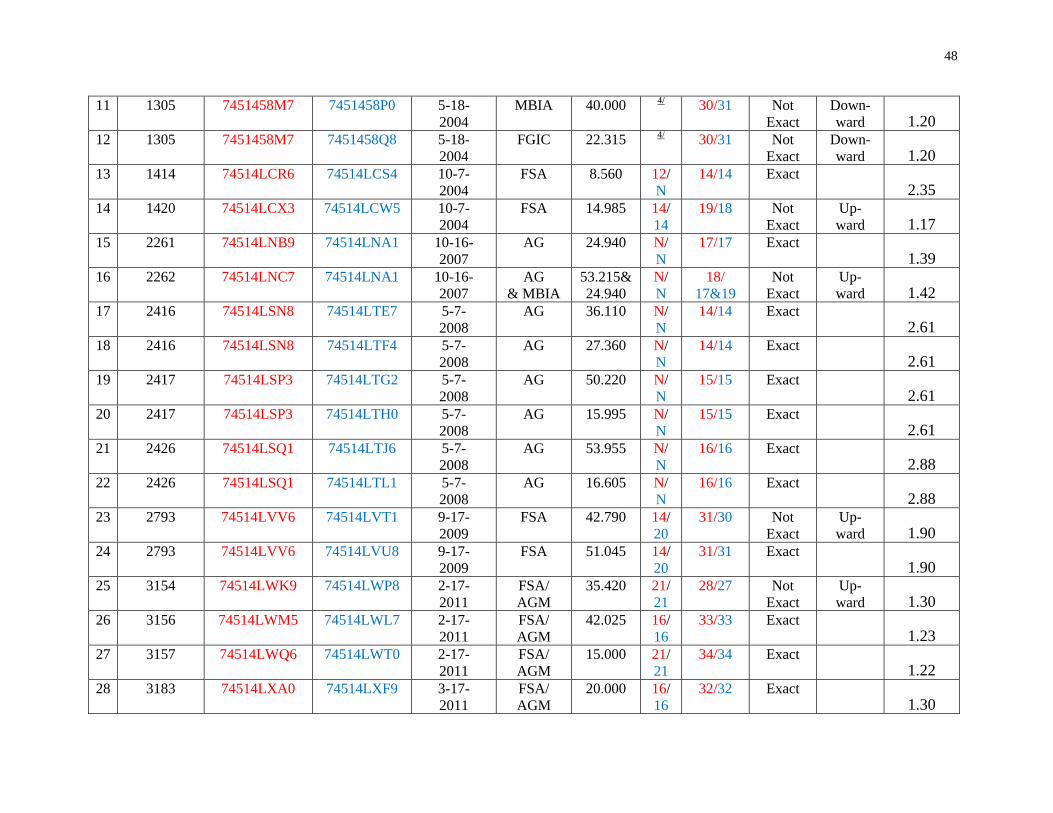
48
11 1305 7451458M7
7451458P0 5-18- 2004
MBIA 40.000 4/ 30/31 Not Exact
Down-ward 1.20
12 1305 7451458M7
7451458Q8 5-18- 2004
FGIC 22.315 4/ 30/31 Not Exact
Down-ward 1.20
13 1414 74514LCR6 74514LCS4 10-7- 2004
FSA 8.560 12/ N
14/14 Exact 2.35
14 1420 74514LCX3 74514LCW5 10-7- 2004
FSA 14.985 14/ 14
19/18 Not Exact
Up- ward 1.17
15 2261 74514LNB9 74514LNA1 10-16- 2007
AG 24.940 N/ N
17/17 Exact 1.39
16 2262 74514LNC7 74514LNA1 10-16- 2007
AG & MBIA
53.215& 24.940
N/ N
18/ 17&19
Not Exact
Up- ward 1.42
17 2416 74514LSN8 74514LTE7 5-7- 2008
AG 36.110 N/ N
14/14 Exact 2.61
18 2416 74514LSN8 74514LTF4 5-7- 2008
AG 27.360 N/ N
14/14 Exact 2.61
19 2417 74514LSP3 74514LTG2 5-7- 2008
AG 50.220 N/ N
15/15 Exact 2.61
20 2417 74514LSP3 74514LTH0 5-7- 2008
AG 15.995 N/ N
15/15 Exact 2.61
21 2426 74514LSQ1 74514LTJ6 5-7- 2008
AG 53.955 N/ N
16/16 Exact 2.88
22 2426 74514LSQ1 74514LTL1 5-7- 2008
AG 16.605 N/ N
16/16 Exact 2.88
23 2793 74514LVV6 74514LVT1 9-17- 2009
FSA 42.790 14/ 20
31/30 Not Exact
Up- ward 1.90
24 2793 74514LVV6 74514LVU8 9-17- 2009
FSA 51.045 14/ 20
31/31 Exact 1.90
25 3154 74514LWK9 74514LWP8 2-17- 2011
FSA/ AGM
35.420 21/ 21
28/27 Not Exact
Up- ward 1.30
26 3156 74514LWM5 74514LWL7 2-17- 2011
FSA/ AGM
42.025 16/ 16
33/33 Exact 1.23
27 3157 74514LWQ6 74514LWT0 2-17- 2011
FSA/ AGM
15.000 21/ 21
34/34 Exact 1.22
28 3183 74514LXA0
74514LXF9
3-17- 2011
FSA/ AGM
20.000 16/ 16
32/32 Exact 1.30

49
29 3184 74514LXB8 74514LXF9
3-17- 2011
FSA/ AGM
20.000 16/ 16
32/32 Exact 1.30
30 3185 74514LWZ6 74514LXC6 3-17- 2011
FSA/ AGM
40.000 16/ 16
35/36 Not Exact
Down- ward 1.25
31 3187 74514LXH5 74514LXC6 3-17- 2011
FSA/ AGM
40.000 35/ 16
36/36 Exact 1.30
32 3189 74514LWX1 74514LXG7 3-17- 2011
FSA/ AGM
105.000 N/ 16
40/37 Not Exact
Up- ward 1.40
33 3276 74514LZF7 74514LZD2 7-12- 2011
FSA/ AGM
5.900 16/ 16
19/19 Exact 1.63
34 3277 74514LZH3 74514LZD2 7-12- 2011
FSA/ AGM
5.900 16/ 16
19/19 Exact 2.03
35 3279 74514LZG5 74514LZE0 7-12- 2011
FSA/ AGM
4.500 16/ 16
20/20 Exact 1.61
36 3280 74514LZJ9 74514LZE0 7-12- 2011
FSA/ AGM
4.500 16/ 16
20/20 Exact 1.94
37 3482 74514LA56 74514LD46 4-3- 2012
FSA/ AGM
20.000 N/ N
22/22 Exact 1.46
38 3484 74514LC70 74514LD53 4-3- 2012
FSA/ AGM
5.000 22/ 22
23/23 Exact 1.54
39 3486 74514LC88 74514LD61 4-3- 2012
FSA/ AGM
5.000 22/ 22
24/24 Exact 1.46
40 3487 74514LA72 74514LD61 4-3- 2012
FSA/ AGM
5.000 22/ 22
24/24 Exact 1.59
41 3489 74514LA80 74514LD79 4-3- 2012
FSA/ AGM
5.000 22/ 22
25/25 Exact 1.43
42 3493 74514LB22 74514LD87 4-3- 2012
FSA/ AGM
11.520 22/ 22
27/27 Exact 1.77
43 3499 & 3500
74514LC39 74514LB63
74514LD20 4-3- 2012
FSA/ AGM
322.925 22/ 22
33&37/ 35
Not Exact
Down-ward 1.30
44 3503 74514LC62 74514LD46 4-3- 2012
FSA/ AGM
20.000 22/ 22
22/22 Exact 1.46
45 3504 74514LC70 74514LD53 4-3- 2012
FSA/ AGM
5.000 22/ 22
23/23 Exact 1.46

50
Notes:
1 “Red” and “Blue” identify uninsured and insured bonds, respectively.
2 Insurance companies: Ambac, AG, CIFG, FGIC, FSA, MBIA, Radian, Syncora. FSA was acquired by AG in July 2009 and renamed Assured Guaranty Municipal Corporation (AGM). AG and FSA/AGM were rated A throughout the entire sample period.
3 “N” indicates not callable.
4 Both the uninsured and insured bonds are callable at the discretion of and on any Mandatory Tender Date set by the Secretary of the Treasury of the Commonwealth of Puerto Rico.
5 See Appendix D for some details concerning the collection of the Puerto Rican data.
6 Bias is based on the assumption that the term structure is upward sloping. Thus, a longer maturity bond, ceteris paribus, will have a higher yield. For example, in row 1, the slightly greater maturity for the uninsured bond results in a higher yield than would have occurred if the uninsured bond had the exact same maturity as its insured pair. This positive differential leads to an upward bias in our estimate of the risk premium, .

51
Table 3 -- Risk Premia Across And Issue Dates
Issue Date Corporate Aaa Puerto Rican Corporate Baa Non-Investment Grade (“Junk”)
(1)
(2) (3) (4)
1. March 15, 2000 1.350 1.690 2.050 5.470 2. October 25, 2001 1.680 2.165 2.560 8.270 3. April 4, 2002 0.900 1.245 2.210 6.040 4. August 8, 2002 1.150 1.662 2.390 8.160 5. May 18, 2004 0.590 1.204 1.300 3.020 6. October 7, 2004 0.590 1.758 1.350 2.480 7. October 16, 2007 0.860 1.402 1.690 3.510 8. May 7, 2008 0.990 2.878 2.310 5.430 9. September 17, 2009 0.960 1.928 2.170 6.220 10. February 17, 2011 0.810 1.249 1.700 2.530 11. March 17, 2011 0.890 1.141 1.800 3.030 12. July 12, 2011 1.000 1.804 1.820 3.480 13. April 3, 2012 1.050 1.497 2.310 4.280 Average 0.986 1.663 1.974 4.763 Differential With Column 2
-0.677
0.000
+0.311
+3.100
Notes: Details concerning data sources and the estimation of the risk premia are discussed in Sections 2 and 3. For Corporate Aaa, Corporate Baa, and Non-Investment grade bonds, the risk premia are the yield on this asset class less the 20-year Treasury yield. The risk premium in column 4 is based on the effective yield of the ICE BofAML U.S. High Yield Master II Index tracking below investment grade corporate debt; these data were retrieved from FRED, Federal Reserve Bank of St. Louis; https://fred.stlouisfed.org/series/SLEMPTOTLSPZSPRI, February 19, 2018. See FRED for details about the construction of this index.
Related Documents