Preliminary Individual Comments. Do not cite or quote. These are preliminary individual comments from members of the Ozone Review Panel. They do not represent EPA policy or consensus CASAC advice. Updated 5-17-11. 1 Preliminary Individual Comments on the Ozone ISA (March 2011) Table of Contents Mr. George Allen .................................................................................................................................. 2 Mr. Ed Avol ........................................................................................................................................... 9 Dr. John Bailar .................................................................................................................................... 13 Dr. Michelle Bell ................................................................................................................................. 18 Dr. Joseph Brain .................................................................................................................................. 22 Dr. David Chock ................................................................................................................................. 24 Dr. W. Michael Foster......................................................................................................................... 28 Dr. Judy Graham ................................................................................................................................. 31 Dr. David Grantz ................................................................................................................................. 53 Dr. Jack Harkema ................................................................................................................................ 60 Dr. Daniel Jacob .................................................................................................................................. 61 Dr. Steven Kleeberger ......................................................................................................................... 64 Dr. Fred J. Miller ................................................................................................................................. 67 Dr. Howard S. Neufeld ....................................................................................................................... 75 Dr. Ted Russell .................................................................................................................................... 83 Dr. Helen Suh ...................................................................................................................................... 93 Dr. James Ultman ................................................................................................................................ 96 Dr. Kathleen Weathers ...................................................................................................................... 101 Dr. Peter B. Woodbury ..................................................................................................................... 104

Welcome message from author
This document is posted to help you gain knowledge. Please leave a comment to let me know what you think about it! Share it to your friends and learn new things together.
Transcript

Preliminary Individual Comments. Do not cite or quote. These are preliminary individual comments from members of the Ozone Review Panel. They do not represent EPA policy or consensus CASAC advice. Updated 5-17-11.
1
Preliminary Individual Comments on the Ozone ISA (March 2011)
Table of Contents Mr. George Allen .................................................................................................................................. 2
Mr. Ed Avol ........................................................................................................................................... 9
Dr. John Bailar .................................................................................................................................... 13
Dr. Michelle Bell ................................................................................................................................. 18
Dr. Joseph Brain .................................................................................................................................. 22
Dr. David Chock ................................................................................................................................. 24
Dr. W. Michael Foster ......................................................................................................................... 28
Dr. Judy Graham ................................................................................................................................. 31
Dr. David Grantz ................................................................................................................................. 53
Dr. Jack Harkema ................................................................................................................................ 60
Dr. Daniel Jacob .................................................................................................................................. 61
Dr. Steven Kleeberger ......................................................................................................................... 64
Dr. Fred J. Miller ................................................................................................................................. 67
Dr. Howard S. Neufeld ....................................................................................................................... 75
Dr. Ted Russell .................................................................................................................................... 83
Dr. Helen Suh ...................................................................................................................................... 93
Dr. James Ultman ................................................................................................................................ 96
Dr. Kathleen Weathers ...................................................................................................................... 101
Dr. Peter B. Woodbury ..................................................................................................................... 104

Preliminary Individual Comments. Do not cite or quote. These are preliminary individual comments from members of the Ozone Review Panel. They do not represent EPA policy or consensus CASAC advice. Updated 5-17-11.
2
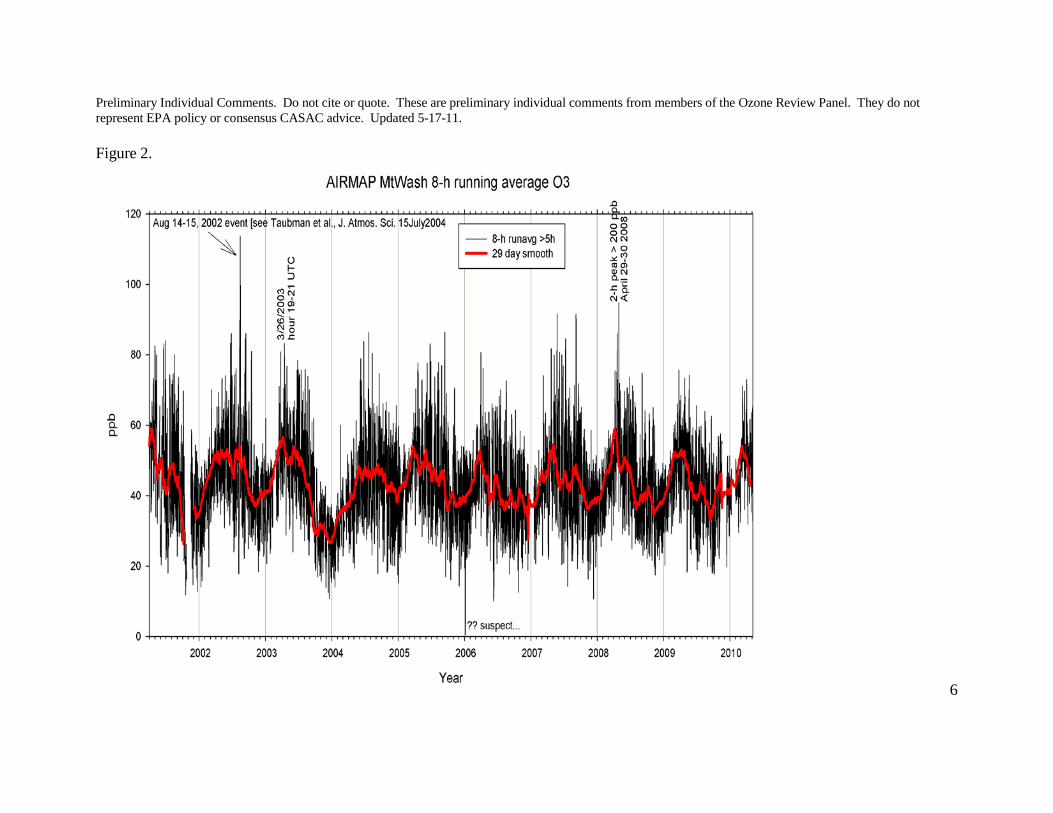
Mr. George Allen Preliminary Individual Comments for CASAC Peer Review of the March 2011 Draft Ozone ISA George Allen, May 10, 2011 These comments focus on Chapter 3, specifically section 3.4 (PRB O3) and 3.5 (Monitoring). Sections 3.2 and 3.3 are well written. 3.4.2 Stratospheric intrusion is unlikely to be a factor in the northeast US. This is based on data from the summit of Mt. Washington (the AIRMAP study) at 6300' and about 4500 feet above surrounding terrain. Thus, although the elevation is not high relative to western high elevation sites, it is a very good high-elevation site for the NE – no NE high elevation sites were included in this analysis. There were two possible stratospheric intrusion events over 10 years (see Figures 1 through 4 below), each lasting 3 hours. This is a very different conclusion from the cite on Pg. 3-29, lines 19-20: “Thompson et al., (2007, Hero 090796) found that roughly 20-25% of tropospheric O3 over northeastern North America during July-August 2004 was of stratospheric origin.” It would be important to reconcile this study with the AIRMAP data in the context of stratospheric ozone events. 3.4.2.1, pg 3-31. Wood smoke in the eastern US and Canada has significant elemental mercury concentrations, which is a potent interference for UV ozone analyzers. Assessment of ozone due to wildfires needs to take this into account. 3.4.3 Pg 3-31, lines 20-24: Consider using CO as relatively conserved tracer of urban air masses. Pg 3-31, lines 34-37, pg 3-31 lines 1-4: There is a 10-year research grade O3 record at the summit of Mt. Washington, NH from the AIRMAP study that should be included in this assessment:
Data are publically available: http://airmap.unh.edu
Daily plots of all available parameters: http://airmap.unh.edu/DownloadData
http://soot.sr.unh.edu/airmap/archive/
Daniel Jacob’s group at Harvard may be able to run GEOS-Chem to assess its performance for the Mt. Washington site - a site that has a very large spatial scale, and thus does not need a small grid size to properly model. Pg 3-33, line 24, and 3-38 and 3-39 tables: Include MtWash as eastern elevated site for this analysis.

Preliminary Individual Comments. Do not cite or quote. These are preliminary individual comments from members of the Ozone Review Panel. They do not represent EPA policy or consensus CASAC advice. Updated 5-17-11.
3
These data could be analyzed by transport regimes. There are 8-10 years of research grade O3 and relevant indicator data (CO, NOy, particle # concentration, etc.) that would be very valuable for this purpose. These data show a spring peak for most years (Figure 2). 3.5.2: plots are hard to use - plot 95 %tiles? 3.5.3, page 3-46, table 3-4 Agree that O3 specifications and FRM are seriously outdated. 3.5.5.2: I endorse the concept of changing the FRM for O3 to the NO chemilumenescent method. 3.5.6.1 pg 3-52, line 23: NH3 and HNO3 are not measured at NCore sites. SO2 is. 3.5.6.1 pg 3-52, line 30: PAMS sites measure NOy, not NOx (“NO-what”). Actually, they measure NOw, since these historical measurements are not robust NOy measurements. 3.6.2.1 pg 3-71, figure 3-25 and related discussion throughout this section: It should be noted that for the Boston CSA ozone sites, Blue Hill, the site 10 miles south of Boston (AQS ID 25-021-3003, “East Milton”), is quasi-high elevation relative to surrounding terrain, at 630 ft.
and often reads higher than most other Metro Boston O3 sites. This site is not run year-round. Lynn (25-009-2006), 12 miles NE of downtown Boston, is run year round.
http://www.hazecam.net/bluehill.html
Also - the Boston C.S.A. is very large, including parts of RI and NH; it’s unclear if this is an appropriate spatial scale to assess. Pg. 3-85, line 11: Which sites are A and D for Boston? 3.6.3.2, pg 3-96, fig. 3-43: add similar plots with weekend and weekdays separated out. Are Mondays cleaner than Fridays? General comment: The Canadian Government recently completed a large report titled: Canadian Smog Science Assessment (2011). Source: Environment Canada and Health Canada. The report is not yet public, but is available upon request to:
There are two chapters that are relevant to the PRB discussion: [email protected]
CHAPTER 3: Ambient Measurements and observations and CHAPTER 7: Air Quality at the Regional and Local Scale: The What, Where, Why and How of Concentration Variations

Preliminary Individual Comments. Do not cite or quote. These are preliminary individual comments from members of the Ozone Review Panel. They do not represent EPA policy or consensus CASAC advice. Updated 5-17-11.
4
Figure 1.

Preliminary Individual Comments. Do not cite or quote. These are preliminary individual comments from members of the Ozone Review Panel. They do not represent EPA policy or consensus CASAC advice. Updated 5-17-11.
5
Preliminary Individual Comments. Do not cite or quote. These are preliminary individual comments from members of the Ozone Review Panel. They do not represent EPA policy or consensus CASAC advice. Updated 5-17-11.
6
Figure 2.
Preliminary Individual Comments from Ozone Review Panel. These are individual panelists’ comments that do not represent consensus CASAC advice or EPA policy. Updated 5-17-11
7
Figure 3.

Preliminary Individual Comments from Ozone Review Panel. These are individual panelists’ comments that do not represent consensus CASAC advice or EPA policy. Updated 5-17-11
8
Figure 4.

Preliminary Individual Comments from Ozone Review Panel. These are individual panelists’ comments that do not represent consensus CASAC advice or EPA policy. Updated 5-17-11
9
Mr. Ed Avol
The breadth, weight, and size of the first external draft ISA O3 document is testimony to the wealth of information available regarding ambient ozone, its atmospheric formation, and the potential for human and material exposure and detrimental effects. To be sure, this large document represents a substantial summarization of a much larger body of published information. That said, in my opinion, the document, is both too large, still missing at least two key chapters, and has a third key chapter mis-identified.
General Overview:
1) The document needs a Summary/ Conclusions section, to provide some determination of
what key points have been presented. 2) The document is missing a chapter identifying current gaps/scientific needs. Is there
sufficient information to address each of the critical topic areas, or are there gaps in understanding or research that need to be addressed? Specific guidance regarding perceived gaps could help improve the utility and quality of subsequent reviews, by motivating researchers to consider/address identified needs.
3) Chapter to chapter, the document is written in differing detail, layout, and approach. This is not surprising, given the broad range of the overall topic and the fact that different authors composed different chapters, but there should still be some harmonization of the approach and layout. Chapter 5, for example, reviews the current state of understanding in “Dosimetry and Mode of Action” by what had been reported up to the 2006 Review, what “recent publications” (post-2006) have shown, with periodic summaries of what each section presents, with an overall chapter summary (p5-61), and a “gaps in knowledge” section (5-62) – could/should this serve as a useful template for each chapter to review what was known as of the last review cycle, what is new, what we know think we know, and what we still need to find out?
Chapter 2, currently entitled” Integrated Health and Welfare Effects Overview” is essentially an “Executive Summary” of the document. It brings together many different elements of understanding ozone, from the chemistry to both animal and human health effects to welfare effects. Arguably its 66 pages could serve as the main section of the ISA, with the remaining chapters referenced appendices to it. Regardless, consideration ought to be given to changing the chapter title. Chapter 1 There are sections of the document that could be reduced in size, without loss of document integrity. In Chapter 1 for example, the discussion on Causal Determination (beginning on P1-12,Section 1.6 in general, p1-14, Section 1.63 in particular) is useful but overly detailed, and could be summarized or substantively moved to an appendix attachment. The Summary paragraph (p1-25, Section 1.7) lacks much substance – what specific conclusions can be drawn from the information
Preliminary Individual Comments from Ozone Review Panel. These are individual panelists’ comments that do not represent consensus CASAC advice or EPA policy. Updated 5-17-11
10
presented? There arguably could and should be concise statements based on what was presented that represent essential elements to be carried forward. Chapter 2 In Chapter 2, the discussion about Policy Relevant Background (PRB) concentrations (p2-5, Section 2.1.3 and especially p 2-7, Section 2.1.3.4) provides some useful information but meanders around the topic at hand. After laying the groundwork for how this is determined and what affects it, what is the best current estimate of the PRB? Has it increased or decreased since the last review? If so, why might this have occurred? These questions are addressed later in Chapter 3 (p3-25, Section 3.4), but why doesn’t the summary chapter present the summary information? Chapter 3 The Chapter 3 discussion on Policy Relevant Background and estimating PRB (p3-25, Section 3.4) is interesting but perhaps too extensive for this focused summary. Could this be more effectively summarized and defer some of these details to an appendix? (This is admittedly more of a packaging and presentation issue than a factual or substantive one, but the important points can get lost in pages and pages of discussion, citation, and discourse). In a similar manner, the Chapter 3 section on Air Monitoring (p3-40, Section 3.5) contains a great deal of instrumentation performance/specification data (for example,p3-44, Sections 3.5.2.1 and p3-46, Section 3.5.3) that would seem more appropriate in an appendix. With respect to p 3- 48,Section 3.5.5.2, it seems inappropriate to specifically review a specific manufacturer’s instrument in this ISA. Wouldn’t a better approach be to discuss the class of instruments or measurement technique? The Chapter 3 air monitoring section boxplots and figure representations of O3 concentrations are interesting, informative, and helpful. The figures on pp3-98 and 3-99, in Section3.6.4 (Associations with Co-Pollutants) is especially insightful...but once again, at the end of the chapter, there is no summary , no conclusions, no drawing together of key issues or identification of critical gaps. Chapter 4 (Charge Question 5) The presented chapter is informative and well-referenced, but major sub-sections lack any focused summary, and the collective chapter lacks a concise set of conclusions. Section 4.6 (p4-21 to p4-25), which is entitled “Summary and Conclusions”, is itself almost four pages in length. Rather than rehashing what was previously presented, key perspectives should be brought forward into a short listing of objective findings. For example, the one-and-one-half pages “summarizing” Exposure Measurement (Section 4.6.1, p4-21) could be arguably collapsed into six statements:
(1) passive badges are widely in use and provide ppb detection levels, when appropriately used;
(2) Small active samplers, either based on chemical oxidation or uv detection, are also available;

Preliminary Individual Comments from Ozone Review Panel. These are individual panelists’ comments that do not represent consensus CASAC advice or EPA policy. Updated 5-17-11
11
(3) indoor/outdoor ratios are driven by air exchange rates (due to a general lack of indoor sources of ozone) and are generally in the 0.1-0.4 range;
(4) personal exposure and ambient ozone concentrations are moderately well-correlated (0.3-0.8) and are related to activity patterns, housing characteristics, and season;
(5) central-site monitor concentrations are representative of day-to-day changes in average personal exposure;
(6) central site concentrations tend to over-report personal exposures, due to time spent indoors (and low indoor penetration of ozone).
In a similar way, Section 4.6.2 (p4-23, Exposure Modeling) might be summarized by presenting a short table, listing the various models (or model types) presented (stochastic, land-use regression, spatial, or APEX, SHEDS, etc) with a summary of application, strengths, and weaknesses. As noted previously in other chapters, there is no needs assessment presented in this chapter. Could discrete improvements or research gaps be identified that, if addressed, would make meaningful progress in these respective areas, on a timeframe that would be useful for the next cycle of review? Do we need a “better”, smaller, more user-friendly real-time ozone monitor? Are there other units (besides the UV monitor mentioned) that have recently become available? Are studies from 20+ years ago being reviewed and presented because they represent a necessary/sufficient level of understanding for the judgments to be made, or are these more “seasoned” studies being used because we have yet to address critical underlying issues needed to move the field forward? The research and regulatory communities have generally considered ozone to be a regional pollutant, with minimal local variability, but our group’s studies (and many others) have repeatedly encountered the diminution of ozone levels caused by NOx titration near busy roads and fresh combustion sources… could a finer spatially-resolved sampling approach identify biologically meaningful differences in ambient ozone levels, or is it purely an academic or engineering exercise in measurement performance? The section/chapter summaries and the needs assessment section should be developed with a clear focus on how the information provided or developed would be applied in interpreting epidemiologic studies. How does the presented work improve our knowledge, or application of it? How would information, perhaps currently identified as being “unavailable”, materially move the science and understanding of that science forward? Chapter 5 This chapter has a great deal of information, organized in a somewhat different way from most of the other chapters, but perhaps in an ultimately more useful one. Whatever the organizational approach, there should be some consistency across chapters. Chapter 6
Preliminary Individual Comments from Ozone Review Panel. These are individual panelists’ comments that do not represent consensus CASAC advice or EPA policy. Updated 5-17-11
12
This chapter, which reviews the available information on short-term effects of ozone exposure, covers a very large data base. Yet a different organizational approach has been used in this presentation, organizing by successive sub-topics first (be it respiratory, cardiovascular, etc, health outcome) and then integrating historical and recent information. One especially interesting and potentially valuable section in this chapter is on Confounding (p6-144, Section 6.6.2.1). This is one of the few places where multi-pollutant exposures are considered, albeit as a “confounder”. Should more be said about multi-pollutant exposures? How is this issue being approached? Chapter 7 Long-term exposure effects are addressed in this chapter by evaluating the evidence for a wide-ranging list of health outcomes. (…additional comments to follow….)
The section on Exposure Measurement in Chapter 2 (p2-12, Section 2.2.1.1) is misleading, in that it describes one passive sampler (a chemically-coated diffusion filter sampler based on nitrite-to-nitrate oxidation) and describes this as if it were the ONLY passive sampler technology available. While the commercial sampler described (but not identified by manufacturer) may well be widely used, it likely is not the only passive sampler in use.
Specific Comments:
P3-4, Section 3.2, lines 9-16 discuss nocturnal low-level jets (LLJs) but to the casual reader, this could be misconstrued to be aircraft rather than wind flow, a word or two would clarify this and avoid confusion.

Preliminary Individual Comments from Ozone Review Panel. These are individual panelists’ comments that do not represent consensus CASAC advice or EPA policy. Updated 5-17-11
13
Dr. John Bailar Comments on Charge Questions 2, 7, and 8: Integrated Science Assessment for Ozone and Related Photochemical Oxidants The time available for the review of this assessment has not been sufficient for me to examine any of the literature cited. Thus I have taken the descriptions of individual studies and their findings as correct. Charge Question 2. The framework for causal determination and judging the overall weight of evidence is presented in Chapter 1. Is this framework appropriately applied for this O3 ISA? How might the application of the framework be improved for O3 effects? Section 1.6.1 It is important that this document give the time point at which new input was suspended, and that it say what was done, if anything, regarding potentially important information received after that time. “Nothing” would be an acceptable answer, but it should be here. 1.6.2 “Cause” is still not well defined. but should be defined in terms of the whole body of evidence, not in terms of individual reports. (My own definition is that an agent is a cause if the effect appears when the agent is present in some setting, and does not occur when the agent is absent, all other things being equal, but there is no reason for you to adopt this if some other definition works better in this ISA context. This requires only a little modification in more complex situations such as synergy. My point is that I do not see a definition here that I could apply in an unambiguous fashion.) 1.6.4 You give a nod to the S-G report on page 1-20, but I think that is not sufficient. It was published some months before the Hill paper, and in my view deserves the credit. More important, perhaps, is that “consistency” may well not be one of the most important criteria – that depends on the context of other information. What is really critical is the whole body of evidence, not any one criterion in isolation. You seem to misinterpret specificity. I have understood Hill’s “specificity” to be non-restrictive -- to refer to a single effect (or a group of closely related effects rather than a collection of effects that are not likely to have a common cause), but not to require only a single cause, which would be extremely restrictive. Or have I misunderstood you? You may want to look at Hill’s original paper on this, as well as the S-G report. We may also not agree about lines 14/15 on page 20. For me, a failure to satisfy one or more criteria can be as telling as meeting them. Again, the whole body of evidence is what matters. 1.6.5, table re “not likely”. It is a truism that one cannot prove a negative with empirical data. I would cast “not likely” in terms of probability and a specific effect size – e.g., “It is very unlikely that X causes more than a 10% increase in Y.”

Preliminary Individual Comments from Ozone Review Panel. These are individual panelists’ comments that do not represent consensus CASAC advice or EPA policy. Updated 5-17-11
14
1.5.4.1 “Conditions” may include more than dose or exposure, duration, and pattern. One example is simultaneous exposure to a synergistic agent. A comment in this chapter that experimental evidence may be the strongest once more brings me to comment on the need to interpret the whole body of evidence. Experimental evidence may not be supreme. It might be worth noting that, for the criteria as a whole, some refer to individual studies, some to collections of studies, and some to the entire body of evidence. I see this comprehensiveness as a strength. Charge Question 7. Chapter 6 is intended to support the evaluation of health effects evidence for short-term exposures to O3. To what extent are the discussion and integration of evidence on the health effects of O3 from the animal toxicological, controlled human exposure, and epidemiologic studies technically sound, appropriately balanced, and clearly communicated? I am not an expert on the health effects of short-term O3 exposure, and time has not allowed me to review the primary literature. Given my dependence on what EPA has presented in this draft, it appears to me that the evidence for mortality as a result of short-term exposure to O3 is stronger than “likely”; it is compelling. This view of the mortality data is guided by two broad principles: There can be no heterogeneity in effects (interaction, synergy, or effect modification) unless there is some kind of effect to be altered in at least some subset of the study population. And, any mortality effect cannot be zero overall if there is an effect for some cause, however minor or for some subset of the population, however small, unless there is a compensating effect in the other direction for some other cause of death; I have not seen any evidence suggesting that O3 exposure is protective against any lethal disease. These principles hold even if overall mortality cannot be shown to be elevated; an effect can be real but too small to be evident in overall mortality or broad categories of causes of death. The epidemiologic findings of increased overall mortality are quite remarkably consistent in direction (though not in size) over space, time, and a wide range of circumstances and study types, despite a few exceptions for single cities or other subgroups. This evidence seems to me to be even stronger than the early evidence regarding cigarette smoking and lung cancer, prior to the time “research” sponsored by the tobacco industry inserted a few negative findings. The discussion of the possible flaws in the evidence is thoughtful and detailed, but seems to me to miss the point that a remarkable combination of factors would have to affect the reported studies, each in different ways, to decrease the estimated effect to no more that “likely”. It is worth note that if a distributed lag model holds, the effect estimated for day X includes the effect for day X-1 with a one day lag, that for X-2 with a 2 day lag, etc. This argues for an analysis of periods longer than days to compare high vs. low O3 levels (and there are other reasons for this, including possible cumulative effects and, conversely, possible habituation or delayed avoidance

Preliminary Individual Comments from Ozone Review Panel. These are individual panelists’ comments that do not represent consensus CASAC advice or EPA policy. Updated 5-17-11
15
behavior). More generally, there should be something here about the combination of daily averages, whether lagged or not. What is the cumulative effect of ten days in a row, each with an RR of 1.01? Is adaptation important? Do RRs decline over a few days because a susceptible sup-population has been depleted? (The text on page 1-167 should mention the possibility of depletion or avoidance, which is suggested, though over a shorter interval, by Figure 6-35.) It would help to add a table showing, for each short-term mortality study, the crude effect and the effect after adjustment for PM and any other factors in the reported study. In my experience, when adjustment for confounders reduces a crude estimate of an effect by a substantial amount, more and better information about confounders etc. (including additional items) is likely to lead to a further reduction; if the initial adjustment has little effect, using more items and better data is not likely to have much effect. The limited information on this in the present report suggests that co-pollutants and other confounders do account for some, but not all, of the relation to O3 measures in the crude measures of mortality. Does the integration of health evidence focus on the most policy-relevant studies or health findings? This is clearly a matter of opinion, and in my opinion the focus is largely appropriate. However, if the ISA concludes that there is a real, measurable mortality effect at the current exposure limit, or that there is no effect near that limit, that finding is likely to drive any overall policy decision about a change in regulatory standards for O3. Thus I would reorganize the report to discuss mortality first, and I would give it more weight in the various summaries. An additional point is the need to consider how regulation should address joint actions that are more or less than additive. For an artificial example, assume that agent A alone is innocuous, with an RR of 1.0, agent B also has an RR of about 1.0, but the combination has an RR of 10.0. How much of that increase should be laid on A and how much on B? The answer could have an impact on regulation of one or both. While this is artificial, more complicated real-life examples may not be rare. This matter should be addressed in the draft ISA report. What are the views of the panel regarding the balance of emphasis placed on evidence from previous and recent epidemiologic studies in deriving the causal determination for short-term O3 exposure and respiratory effects (in particular, additional epidemiologic evidence for lung function and respiratory symptoms and new evidence for biological indicators of airway inflammation and oxidative stress that previously has been largely limited to human controlled exposure and toxicological studies)? Evidence is evidence, regardless of whether it was developed yesterday or a decade ago. I would judge old and new by the same standards (though this may often mean that the new is better because of advances in technology, bigger sample sizes, or other reasons). Also, it is likely that many readers will not have ready access to the prior report(s). Thus I would argue for a more complete statement of prior results when they contribute in an important way to the present conclusions.

Preliminary Individual Comments from Ozone Review Panel. These are individual panelists’ comments that do not represent consensus CASAC advice or EPA policy. Updated 5-17-11
16
The majority of new studies that examine the association between short-term O3 exposure and mortality focus on specific issues that have been previously identified. Does the structure of the chapter adequately highlight the breadth of studies (both older and the new) that indicate an association between O3 exposure and mortality and provide the underlying rationale for the causal determination? Avoidance behavior, when for a good medical reason (not just fashion or trendiness), is a health cost. I would like to see new evidence about the extent and nature of avoidance behavior, but even with what is now available, there should be a bit more emphasis in the summaries here. Are the data properly presented regarding the credibility of newly reported findings being attributable to O3 acting alone or in combination with other co-pollutants and regarding the extent that toxicological study findings lend support to the biologic plausibility of reported epidemiologic associations in reaching a causal determination? I believe that they are. Are the tables and figures presented in Chapter 6 appropriate, adequate, and effective in advancing the interpretation of these health studies? In my view they are appropriate, adequate, and effective. Charge Question 8. Chapter 7 presents important new
findings from studies published since the 2006 O3 AQCD including studies that examine the relationship between long-term O3 exposure and new onset asthma in children, first childhood asthma hospital admissions, increased asthma severity, bronchitic symptoms and respiratory-related school absences. These studies provide evidence in this regard based on different genetic variants. What are the views of the panel on conclusions drawn in the draft ISA regarding the strength, consistency, coherence, and plausibility of the evidence for health effects for long-term O3 exposure on respiratory morbidity?
Page 7-6, lines 16/25. What did Clark et al. report finding, weak as that finding may be? The evidence regarding genetics and asthma would be stronger if it did not rely so heavily on the CHS. Please add a short discussion of why current findings differ from those in the previous review. Are prior results fully consistent with current results, given the differences in study methods, precision, etc.? Limited new data also suggest a link between long-term O3 exposure and respiratory mortality; what weight should be placed on this evidence in causal determinations?

Preliminary Individual Comments from Ozone Review Panel. These are individual panelists’ comments that do not represent consensus CASAC advice or EPA policy. Updated 5-17-11
17
Asthma is a lethal disease, and death from asthma is sufficiently uncommon that it might not show up in studies of total respiratory mortality. If the relative risk is high, a relation to O3 might be evident in a mortality analysis focused on asthma. Has this been done? The section on infant mortality is not focused on asthma, and the few positive finding (among many negative) might be accounted for by small biases in the data, multiple comparisons problems, and post-hoc selection of subgroups. Overall, I agree with the ISA that, overall, the evidence regarding mortality and long-term exposure to O3 is suggestive, but it is not as strong as that regarding morbidity. However, good evidence of an effect on potentially lethal conditions adds to the strength of the findings on mortality. The negative findings of the six-city study could be the result of having only six points of observation with several potentially important confounders or modifiers, as well as the narrow range of average O3 levels, so that even a major effect could be missed. Other negative human studies are in general lacking in statistical power, have narrow ranges of exposure, or do not examine an appropriate set of causes of death. What are the views of the Panel on conclusions drawn in the draft ISA regarding the strength, consistency, coherence and plausibility of the evidence for neurological effects resulting from long-term O3 exposure? This question appears to refer to Sections 7.4.8.2/3 and 7.5.The ISA concludes, “suggestive or a causal relationship”, but I would add that the evidence includes only one human study and that the animal evidence was all at exposures well above the current EPA limit Are the data properly presented regarding the credibility of newly reported findings being attributable to O3 acting alone or in combination with other co-pollutants and regarding the extent that toxicological study findings lend support to the biological plausibility of reported epidemiological associations in reaching a causal determination? This is a bit difficult me to answer because I have not had an opportunity to review the literature that the ISA summarizes, but I am alert to problems of presentation and credibility, and I have found no reason here to question any of the descriptions, findings, or conclusions, except as I have noted elsewhere here. I understand the effect on mortality of adding PM to the O3 model, but what about the reverse? I would like to see, side by side, the effects of PM alone, O3 alone, and their separate effects when both are in the model. That is that only way to understand whether the apparent effect of either one is in part or totally a result of their co-occurrence. Overall, I concur with the ISA that “there is likely to be a causal relationship between long-term exposure to O3 and respiratory morbidity”. I might even make the statement a bit stronger; the evidence is really pretty persuasive, though not as strong as for short-term effects. This conclusion is based primarily on the epidemiologic evidence, but seems to be fully supported by toxicological and human experimental findings.
Preliminary Individual Comments from Ozone Review Panel. These are individual panelists’ comments that do not represent consensus CASAC advice or EPA policy. Updated 5-17-11
18
Dr. Michelle Bell Charge to the O3 CASAC Panel We ask the Panel to focus on the following questions in their review:
1. This first external review draft O3 ISA is of substantial length and reflects the copious amount of research conducted on O3. EPA has attempted to succinctly present and integrate the policy-relevant scientific evidence for the review of the O3 NAAQS. The panel may note that per CASAC consultation on November 13, 2009, considerable discussion has focused on older literature. The panel emphasized that important older studies should be discussed in detail to reinforce key concepts and conclusions if they are open to reinterpretation in light of newer data and where these older studies remain the definitive works available in the literature. In considering subsequent charge questions and recognizing an overall goal of producing a clear and concise document, are there topics that should be added or receive additional discussion? Similarly, are there topics that should be shortened or removed? Does the Panel have opinions on how the document can be shortened without eliminating important and necessary content? Although the O3 ISA is of substantial length, I find the length of the ISA to be appropriate in relation to the body of scientific literature on O3 and the need to summarize the evidence thoroughly and accurately. A significantly shorter summary version is needed; however, the larger document serves to provide the underlying evidence of ozone’s impacts on human health and welfare. The role of Chapter 2 as compared to an executive summary is a bit unclear to me as it doesn’t so much integrate as summarize the following chapters. In that sense it’s largely repeating information that is elsewhere and could be a separate summary document. Alternatively, this chapter needs to be more integrative and does not need to revisit every main point of the subsequent chapters. Whether it stays as a summary or is made more integrative, it could probably be shortened to less than its current 66 pages.
The text on the history of the NAAQS for ozone may have too much detail. In particular, the need to include issues that were raised in court but resolved (e.g., unconstitutional delegation of legislative authority) is unclear. (Chap. 1) The method by which scientific studies were identified is well described overall, with the exception of the incorporation of non-peer reviewed studies. For example, see page 1-7 “Typically, only information that had undergone scientific per review and had been published or accepted for publication were considered. . .” This is vague, but central relating to the quality of studies. (Chap. 1)
Preliminary Individual Comments from Ozone Review Panel. These are individual panelists’ comments that do not represent consensus CASAC advice or EPA policy. Updated 5-17-11
19
The section on estimating policy-relevant background concentrations implies that the approaches used are identical to those used previously (see first sentence of 3.4.3). A better way to state this would be that the methods used are still the state-of-the-art approaches, and to present only the new estimates, without this level of detail. This section could be shortened (Section 3.4.3). In comparison to its importance and length of other chapters, Chap. 3 is far too long, with figures and tables that are not particularly useful for the underlying messages of the ISA and lengthy appendices. As an example, there are 15 figures comparing observed and GEOS-Chem estimates for ozone, but the discussion on these figures only relates to the model, not to our understanding of ozone and health or welfare effects, or the underlying science behind ozone formation. The point of these figures is not clear. The meaning of this chapter is unclear, especially given its 203 pages. At the very least, a substantial number of tables and figures from this section need to be cut. This chapter is disproportionately long compared to its importance. Section 3.3 could be cut entirely or greatly reduced. The importance of regional air quality modeling to the ISA needs to be better described, including its relation to the rest of the document. It seems odd to have an entire section on a tool rather than on underlying principles (i.e., our understanding of the chemical and physical transformation of ozone and its precursors). The ISA does not have primer sections on other tools and methods (e.g., biostatistical modeling) that apply our scientific understanding, but has a very large section on atmospheric modeling. This section also presents a somewhat narrow view of air quality modeling, with heavy emphasis on CMAQ and almost no discussion of how well CMAQ actually estimates ozone levels.
2. Chapter 7 presents important new findings from studies published since the 2006
O3 AQCD including studies that examine the relationship between long-term O3 exposure and new onset asthma in children, first childhood asthma hospital admissions, increased asthma severity, bronchitic symptoms and respiratory-related school absences. These studies provide evidence in this regard based on different genetic variants. What are the views of the Panel on the conclusions drawn in the draft ISA regarding the strength, consistency, coherence and plausibility of the evidence for health effects for long-term O3 exposure on respiratory morbidity? Limited new data also suggest a link between long-term O3 exposure and respiratory mortality; what weight should be placed on this evidence in causal determinations? What are the views of the Panel on the conclusions drawn in the draft ISA regarding the strength, consistency, coherence and plausibility of the evidence for neurological effects resulting from long-term O3 exposure? Are the data properly presented regarding the credibility of newly reported findings being attributable to O3 acting alone or in combination with other co-pollutants and regarding the extent that toxicological study findings

Preliminary Individual Comments from Ozone Review Panel. These are individual panelists’ comments that do not represent consensus CASAC advice or EPA policy. Updated 5-17-11
20
lend support to the biological plausibility of reported epidemiologic associations in reaching a causal determination?
I agree with EPA’s assessment of the degree of evidence on causality for long-term exposure to ozone and respiratory effects (“likely to be a causal relationship”) and central nervous system effects (“suggestive of a causal relationship”). For readers who are unfamiliar with this literature, key questions will relate to the reasons for the lack of stronger evidence. The ISA O3 could discuss these issues relating to whether more conclusive evidence would need to rely on larger sample size, different types of studies, further research, evidence across multiple study designs, etc. (in Section 2.4.2 and Chap. 7) This text could refer to the guidelines used to assess causality in Chap. 1. The text on the relationship between ozone exposure and birth outcomes in Chapter 2 could be misinterpreted to indicate that there is a lack of studies, whereas there have also been some studies that did not identify an association (e.g., for ozone and low birth weight). A more clear way of describing this evidence would be to note that studies are inconsistent, rather than list the limited studies with evidence in Section 2.4.2.3. This is done in more detail in Section 7.4. There have been additional recent articles that review and summarize methodological issues on air pollution and birth outcomes that could be referenced in Section 7.4, page 7-27 (e.g., Woodruff TJ et al. 2010). Assessment of the biological plausibility of effects for long-term O3 exposure can gain information from the evidence for short-term effects of related health endpoints. This could be further discussed and highlighted in the ISA in Chapter 7. As an example, the evidence for respiratory effects on mortality is strengthened by the evidence for respiratory morbidity. As the ISA correctly notes, EPA concluded at the 2006 review that associations between short-term O3 exposure and respiratory health effects are causal, and new evidence since that time supports this claim. This includes a range of study designs (epidemiology, animal models, controlled human exposure). Although that research is for short-term exposure, it contributes to biological plausibility of respiratory impacts from long-term exposure, especially as a range of health responses have been noted (airway inflammation, decline in lung function, respiratory symptoms, hospital visits, emergency room visits). In general, the causality of long-term exposure could borrow information from the studies of short-term exposure, where appropriate, to note consistencies or inconsistencies. Given the wide range of what “long-term exposure” may mean, this chapter would benefit from discussion early in the chapter on how this is defined. The long-term exposure section considers exposure over several months, or spatial comparisons across cities that have different annual O3 levels. The wording used to describe exposure timeframe and the lack of specifications is a large problem in this chapter. The underlying analysis of causality seems appropriate, but it will be

Preliminary Individual Comments from Ozone Review Panel. These are individual panelists’ comments that do not represent consensus CASAC advice or EPA policy. Updated 5-17-11
21
difficult for most readers to assess and compare the evidence without knowing the exposure periods. Throughout the chapter, the text should specify the duration of exposure for each study. This is sometimes provided, but missing in several places. For example, the first sentence of 7.2.3 does not indicate whether children’s lung function was assessed in relation to their lifetime exposure, recent years, or some other timeframe. Another example is on page 7-13 where “chronic exposure” is discussed. There are a few examples where the timeframe of exposure is not specified at all (e.g., Section 7.2.7, Section 7.3.2). The exposure timeframe should also be specified in tables or figures (e.g., Table 7-1 and Table 7-7); this is done nicely in Tables 7-2 to 7-5. Some of the infant mortality studies do not present an exposure timeframe at all (see Section 7.4.9.4) and the inclusion of exposure timeframes of a single day in the long-term exposure chapter is very confusing (see Table 7-6). I recognize this is a challenge EPA has confronted in previous summaries of research on ozone and other pollutants, but the current structure needs improvement. The lack of specification of what “chronic” and “long-term” exposure means contributes to this problem. The causality evidence for long-term exposure to ozone and mortality may be the weakest endpoint as it is based on a single study, so I think the “suggestive of a causal relationship between long-term O3 exposure and all-cause mortality” (page 7-62) is appropriate; however, another study found no association (see Section 2.4.2.6, Section 7.3.2). More description of these studies study would be useful to help evaluate causality given the heavy weight on a single study. For Table 2-3, word “no studies” as “no studies at that time” when referring to the lack of evidence for the previous O3 AQCD. The use of “seasonal” in Section 7.2 would be better defined as exposure over a few months, without using the word “season.” There have been many “seasonal” studies of short-term exposure to ozone. Although the document notes that “the term seasonal was used in these studies as a measure of a long-term exposure of several months,” there appears no benefit to adding potential confusion by using the word seasonal to refer to exposure over several months. The broad range of “long-term exposure” definitions in this chapter adds to this potential confusion as the chapter does include short-term exposures. In this chapter, distinctions between cross-sectional studies and other studies is very useful. More emphasis could be placed on the cohort studies as opposed to the cross-sectional studies. The CHS has information on the study subjects’ individual-level exposure, not just community information, so the 2nd sentence of 7.2.3, showing results by community-level ozone, may not be the best presentation of results.
Preliminary Individual Comments from Ozone Review Panel. These are individual panelists’ comments that do not represent consensus CASAC advice or EPA policy. Updated 5-17-11
22
Dr. Joseph Brain Answer to Charge Question 6 (Chapter 5) General Comments: This chapter, like the entire document, is encyclopedic. There are a large number of references. Most of the relevant ozone publications in the last 5 years are here. Surely, the multiple authors of this document need to be congratulated for being inclusive. At the same time, this encyclopedic feature is sometimes a weakness. It is hard to focus on evidence which might ultimately alter the recommended value for the ozone standard. I am ambivalent about the use of having a section entitled “Recent Publications.” One the one hand, it is convenient to have them here and segregated from the earlier literature. On the other hand, it is unfortunate that these new references are not better integrated into the historic literature. Especially, these sections appear to be an annotated bibliography. They list the references and say a bit about each article, but rarely do they indicate a particularly important paper and explain why it’s important. There is not enough integration and critical analysis. It would be valuable if each “Recent Publications” section would end with a brief comment on how these recent publications make a difference. For example, I applaud the sentence at the beginning of 5.1.3.2 which concludes that the studies reviewed are in agreement with previous studies and “do not change the dosimetry conclusions of the last document.” That kind of critical analysis is very helpful. These same suggestions apply to comparable sections later in the document entitled “New Cellular and Molecular Insights.” A clear statement of conclusions at the beginning or at the end of each section with this title would be helpful in putting the literature into perspective. I appreciate the way in which the list of references and in the text itself, every reference has an identifying number which permits the reader to locate it. That makes this document more useful. Major Comments: 1. I draw attention to section 5.2.9.5, Adaptation. One of the hallmarks of oxidant injury, especially ozone, is the phenomenon of adaptation. There are levels of ozone, or hyperoxia, which produce serious injury or even death in naïve animals. However, in animals chronically exposed to lower levels of ozone or oxygen, there is morphologic and biochemical adaptation. Subsequent exposures to ozone produce a far lower response. This is important in understanding ozone toxicology in humans as well. It also relates importantly to different patterns of ozone exposure. Citizens, who rarely see significant ozone levels and then suddenly have a two to three day episode of high ozone, may be much more affected than those who enjoy steady state ozone exposures all the time. 2. Another component which should be better developed is the one dealing with co-exposures with particulate matter, 5.2.9.6. Yes, there is some evidence for PM modulating ozone responses. This section should be broadened to co-exposures of ozone with a variety of other pollutants, such as oxides of nitrogen and oxides of sulfur. We need to better understand responses to ozone per se compared to responses to ozone, plus other pollutants. 3. In response to Charge Question 6, I believe Chapter 5 does a good job of describing differences in retained dose of ozone among different individuals and among species. They also do a good job of describing generic mechanisms which make measured short and long-term effects of ozone biologically plausible. Yes, I believe that the basic dosimetric principles of ozone uptake are
Preliminary Individual Comments from Ozone Review Panel. These are individual panelists’ comments that do not represent consensus CASAC advice or EPA policy. Updated 5-17-11
23
presented accurately and in sufficient detail. The document does not take a clear position as to what is the ideal and most appropriate dosimetric
Finally, I believe Chapter 5 does link these biochemical changes to associated phenomenon of inflammation and other types of organ injury. An area which could receive more attention is extra-pulmonary effects of ozone. What other organs are affected? Do these responses alter our understanding of dose response effects in humans?
approach. Is it the local absorption/retention of ozone or is it the generation of ozone related by-products which are the mediators of injury.
4. “Gaps in Knowledge” is the title of 5.2.11. I would propose two other bullets. The first would be -Interacts with co-pollutants -Is altered by adaptation and the time course of ozone exposure Minor Comments: Page 51, Line 17-19 I’m concerned about the phrase “cells protruding from the ELF and surface macrophages.” This seems to imply that these cells are not covered by the alveolar lining layer (ELF). Electron microscopic images clearly show that the extracellular lining fluid is continuous and covers these cells. Page 5-9 When discussing the nasal pharyngeal removal, the initial sentence sounds far too certain. The precise percentages are significantly influenced by exercise and especially by the choice of pathway. At least, the considerable variability among individuals should be acknowledged. Also, is there additional information as to how pulmonary uptake and dose is modified by nose breathing versus mouth breathing?
Preliminary Individual Comments from Ozone Review Panel. These are individual panelists’ comments that do not represent consensus CASAC advice or EPA policy. Updated 5-17-11
24
Dr. David Chock CHAPTER 4. EXPOSURE TO AMBIENT OZONE
Chapter 4 describes human exposures to O3. Is the evidence relating human exposure to ambient O3 and errors associated with exposure assessment presented clearly, succinctly, and accurately? Are the results of field studies evaluating indoor-outdoor and personal-ambient exposure relationships, and factors affecting those relationships, presented in a manner that is useful for interpretation of epidemiologic results? Is the information on modeling O3 concentration surfaces and population exposures appropriate for evaluating the utility of these modeling approaches? Do the characterizations of temporal and spatial variability of O3 in urban areas provide support for better understanding and interpreting epidemiologic studies discussed later?
CHARGE QUESTIONS
The Chapter describes clearly and generally quite accurately the understanding to date in the relationships between human exposure to ambient ozone and errors associated with exposure assessment. The results of field studies evaluating indoor-outdoor and personal-ambient exposure relationships, and the factors affecting those relationships, are well described, but there are issues that need further elaborations and modifications (See below). These results are useful in the design of epidemiological models. The Chapter describes the modeling of concentration surfaces and of population exposures adequately, but there remains a lack of sufficient data to (1) properly evaluate the concentration surface models at spatial scales that are less than inter-monitor distances, and (2) refine activity patterns to build more robust exposure models. The descriptions of temporal and spatial variability of ozone represent our current knowledge well and should help ascertain the scope and design of epidemiological studies and help interpret their results. There are more detailed, specific issues that are presented below. Ozone in the lower troposphere is a secondary pollutant, predominantly formed by photochemical reactions between hydrocarbons and oxides of nitrogen in a time scale of a few hours or longer, depending on the reactivity of the hydrocarbons involved. Therefore, we expect it to be rather uniform in a spatial scale on the order of, say, 10 or more km. But ozone is also a rather reactive oxidizing agent. It reacts quickly with NO, and contributes to aging of materials and living things. So, unlike the less-reactive secondary PM2.5, there are significant reductions of ambient ozone concentrations at and downwind of major roadways, with a spatial scale of meters to maybe hundreds of meters or more, depending on the emission rates of NO and wind velocities. And indoors, ozone would be scavenged rather quickly unless the air exchange rate with outdoor air is high. So, even though both ambient PM2.5 and ozone are secondary pollutants, their spatial concentration patterns need not be similar in a populated urban environment with spatially uneven NO sources. For ambient ozone, one can envision a relatively flat terrain punctuated by many trenches and valleys along different roadways whose depths and extents depend on the NO emissions from the vehicular traffic and local wind fields. One also needs to note that increasing the averaging time would increase the smoothness of the spatial pattern of ozone concentrations. In this connection, a 2010 paper by Sarnat, et al. (385852) concluded that PM2.5 and ozone are spatially more homogeneous and thus the health effects are less sensitive to the choice of ambient monitors, as compared to primary pollutants like CO and NO2. First, note that a large portion of NO2 concentration comes from the titration of ozone by NO near the emission sources. But equally if not more important, the authors used
Preliminary Individual Comments from Ozone Review Panel. These are individual panelists’ comments that do not represent consensus CASAC advice or EPA policy. Updated 5-17-11
25
different averaging times to characterize the pollutant concentrations, 24 hours for PM2.5, 8 hours for ozone, and 1 hour for CO and NO2. This would inadvertently and preferentially increase the smoothing of the spatial distributions of PM2.5 and ozone relative to those of CO and NO2. Nevertheless, the value of the paper is not diminished because the paper in effect smoothes out the intra-day spatial variability in order to study the health effects of ozone concentrations based on their inter-day variability. Because of the rather complicated ozone spatial pattern in the urban environment, information on the activity and location patterns of individuals, the proximity of their homes to major roadways, and the indoor-outdoor air exchange rates of their homes become relevant to reliably determine their ozone exposures. The Chapter indicates that indoor ozone concentrations are generally considerably smaller than outdoor ozone concentrations. But it reports only one correlation number, 0.58, which is from a study in the Los Angeles area conducted by Avol, et. Al. (018270
) (page 4-4, line 34). It would be great if the authors include more of such correlations from studies in other cities. The Chapter describes quite thoroughly the observed relations between ambient ozone concentrations measured at monitors and people’s exposures to ozone. The correlations between ambient ozone concentrations and personal exposures of ozone vary considerably, but are generally in line with expectations. In particular, the correlations with ambient ozone concentrations increase from subject-specific exposure, to pooled-group exposure to community-averaged exposure even though the actual ozone exposures are generally significantly lower than the ambient concentrations. This finding indeed supports the use of ambient ozone concentrations as a surrogate for average personal ozone exposure, a finding that is critical to establishing the relevance of community health effects studies.
In the description of personal-to-ambient ozone ratios, the authors need to include the work of Suh and Zanobetti (677202
), which indicates extremely low slopes between 24-hour personal and ambient ozone concentrations for both fall and spring in Atlanta. Also, in the description of the correlations between personal exposure of ozone and of co-pollutants, the Chapter authors’ attribute the paper’s finding of a higher correlation coefficient of 0.14 between personal ozone and personal PM2.5 to the regional nature of ozone and PM2.5 (page 4-8, lines 8 to 12). But this may be a bit of a stretch because the paper also shows a low and insignificant correlation coefficient between personal and ambient ozone (no number given) and between personal ozone and ambient PM2.5 (a value of 0.08).
The Chapter describes three approaches that have been used for concentration-surface modeling: spatial interpolation including inverse-distance weighting and kriging; empirical-statistical modeling including land-use regression; and chemistry transport modeling. The interpolation approaches are useful only if the pollutant concentrations are expected to be spatially smooth. This would not be the case for ozone concentrations near NO emission sources like major traffic areas. The land-use regression approach could provide greater spatial granularity, but it would require frequent retuning to fit different local conditions and emissions. Only the chemistry-transport modeling has a more solid physical basis. However, the required rather detailed emission inventories are generally not available presently, and the parameters used in the model, like eddy diffusivity, may need to be retuned for the relevant grid resolution. Furthermore, the predicted results may need to be rescaled to be consistent with the observed concentrations at the monitors. The Chapter authors have done a good job describing the state of the art developments. There is one minor point that needs to be removed. In describing the work of Brauer et al. (156292), the authors include their own opinions, which was not validated
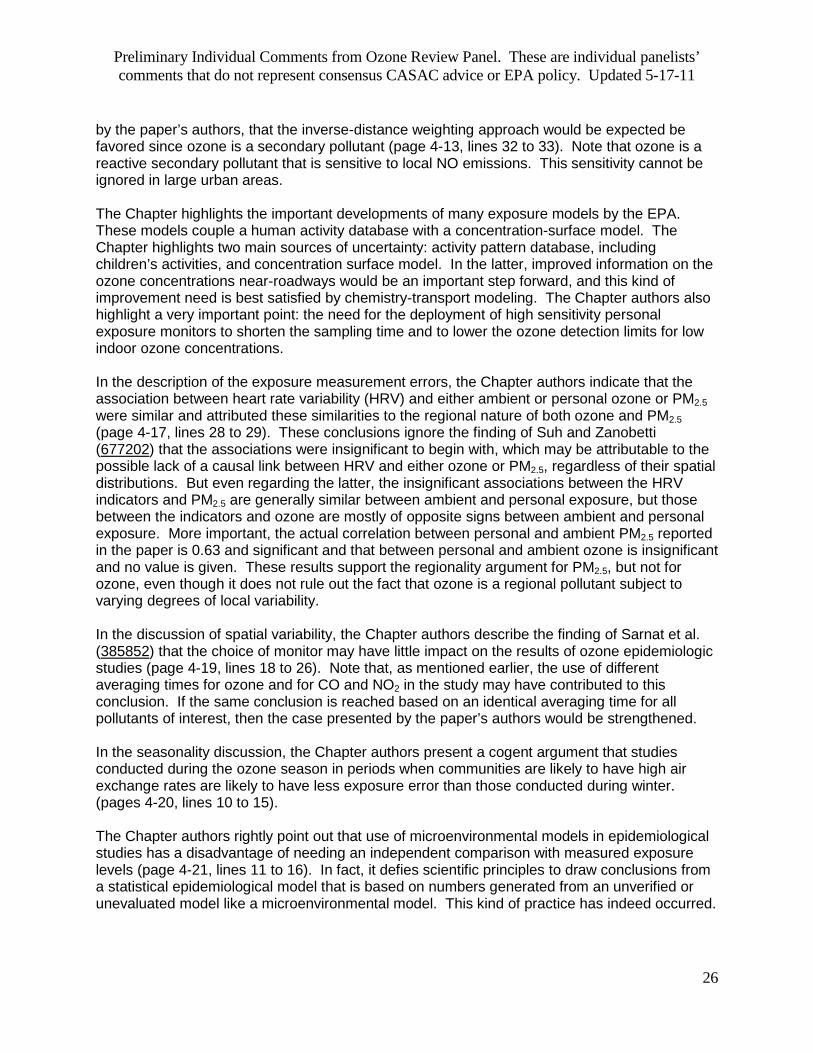
Preliminary Individual Comments from Ozone Review Panel. These are individual panelists’ comments that do not represent consensus CASAC advice or EPA policy. Updated 5-17-11
26
by the paper’s authors, that the inverse-distance weighting approach would be expected be favored since ozone is a secondary pollutant (page 4-13, lines 32 to 33). Note that ozone is a reactive secondary pollutant that is sensitive to local NO emissions. This sensitivity cannot be ignored in large urban areas. The Chapter highlights the important developments of many exposure models by the EPA. These models couple a human activity database with a concentration-surface model. The Chapter highlights two main sources of uncertainty: activity pattern database, including children’s activities, and concentration surface model. In the latter, improved information on the ozone concentrations near-roadways would be an important step forward, and this kind of improvement need is best satisfied by chemistry-transport modeling. The Chapter authors also highlight a very important point: the need for the deployment of high sensitivity personal exposure monitors to shorten the sampling time and to lower the ozone detection limits for low indoor ozone concentrations. In the description of the exposure measurement errors, the Chapter authors indicate that the association between heart rate variability (HRV) and either ambient or personal ozone or PM2.5 were similar and attributed these similarities to the regional nature of both ozone and PM2.5 (page 4-17, lines 28 to 29). These conclusions ignore the finding of Suh and Zanobetti (677202
) that the associations were insignificant to begin with, which may be attributable to the possible lack of a causal link between HRV and either ozone or PM2.5, regardless of their spatial distributions. But even regarding the latter, the insignificant associations between the HRV indicators and PM2.5 are generally similar between ambient and personal exposure, but those between the indicators and ozone are mostly of opposite signs between ambient and personal exposure. More important, the actual correlation between personal and ambient PM2.5 reported in the paper is 0.63 and significant and that between personal and ambient ozone is insignificant and no value is given. These results support the regionality argument for PM2.5, but not for ozone, even though it does not rule out the fact that ozone is a regional pollutant subject to varying degrees of local variability.
In the discussion of spatial variability, the Chapter authors describe the finding of Sarnat et al. (385852
) that the choice of monitor may have little impact on the results of ozone epidemiologic studies (page 4-19, lines 18 to 26). Note that, as mentioned earlier, the use of different averaging times for ozone and for CO and NO2 in the study may have contributed to this conclusion. If the same conclusion is reached based on an identical averaging time for all pollutants of interest, then the case presented by the paper’s authors would be strengthened.
In the seasonality discussion, the Chapter authors present a cogent argument that studies conducted during the ozone season in periods when communities are likely to have high air exchange rates are likely to have less exposure error than those conducted during winter. (pages 4-20, lines 10 to 15). The Chapter authors rightly point out that use of microenvironmental models in epidemiological studies has a disadvantage of needing an independent comparison with measured exposure levels (page 4-21, lines 11 to 16). In fact, it defies scientific principles to draw conclusions from a statistical epidemiological model that is based on numbers generated from an unverified or unevaluated model like a microenvironmental model. This kind of practice has indeed occurred.

Preliminary Individual Comments from Ozone Review Panel. These are individual panelists’ comments that do not represent consensus CASAC advice or EPA policy. Updated 5-17-11
27
In the Chapter conclusions, the authors again highlight the similarity of the associations between HRV indicators and either ambient concentrations or personal exposures of ozone and PM2.5 in the Atlanta study, and attribute this similarity to the regional nature of both pollutants. As pointed out earlier, the description of the finding of the Atlanta study is inaccurate and the attribution is misleading.

Preliminary Individual Comments from Ozone Review Panel. These are individual panelists’ comments that do not represent consensus CASAC advice or EPA policy. Updated 5-17-11
28
Dr. W. Michael Foster Comments on ISA – specifically for Chapter 6 (assigned): Overall there is a tremendous amount of information in this particular chapter and includes 176 pgs of text, 37 Figures, 45 Tables, and 27 pgs of References cited. Several Chapters do not even include 50 pgs of text !
1) a fair amount of text description is devoted to the concentration pattern of controlled lab exposures of human to ozone and whether a square-wave (S-W) or triangular (variable concentration) format for ozone concentration was utilized (pgs. 6/6 - 6/7, Fig. 6-2). Of equal importance is likely some text should be devoted to differences in controlled laboratory exposures whereby the subjects are exposed in a walk-in chamber facility or via a face-mask exposure system (ref. 093690). The face-mask system excludes any scrubbing out of nasal inhaled ozone by the URT, and carries with it then, the potential to delivery a high deposition fraction to the LRT. Any Figures in the chapter, where results from these 2 delivery modalities were combined, should likely be footnoted, and/or the results to exposures listed separately.
2) with respect to Fig. 6-2 (pg. 6/10 of the text), it is not obvious to me why a decrement in
excess of 10% in the FEV1 is being identified in the respective panels of ozone concentration. The rationale for selecting a 10% change as a “threshold” for a response to a given concentration of ozone should likely be expressed. For example if a decrement greater than 15% is selected, the frequency of responder subject to a given ozone concentration decreases considerably. The text provides 2 refs for the 10% rationale (044889 and 626521) and suggests that changes in FEV1 ≥ 5% are clinically meaningful; discussion on the threshold for defining a functional response, may be helpful.
3) text refers frequently to children and adolescents as being highly susceptible to ambient
ozone due to lung size, and perhaps increased time spent outdoors. It would likely be helpful to add to the text (pgs. 6/13 – 6/14 and 6/35) reference to controlled lab studies in children to ozone: for example: Koenig JQ et al, 1985, 1998; McDonnell WF et al, 1985; and Linn WS et al, 1997) as these would add validity to the supposition that children are more susceptible to ozone.
4) to address the issues over male vs. female and sensitivity to ozone, the ref by Weinmann
GC et al, 1985, in a controlled lab exposure setting to ozone with longitudinal data set, has been overlooked and should be added to the text (pg. 6/14). Likewise, to address issues over subjects habituated to cigarettes and their sensitivity to ozone, the controlled lab study with longitudinal data set ref by Emmons K et al, 1991, has been overlooked.
5) in description of repeated exposures to ozone in controlled lab studies, the report by Foster
WM, et al, 1996, and which identifies systemic outcomes (perpheral blood monocyte activation state, serum a-tocopherol, respiratory frequency of the breathing pattern, that during or following repetitive exposures to ozone do not adapt in response to a variable

Preliminary Individual Comments from Ozone Review Panel. These are individual panelists’ comments that do not represent consensus CASAC advice or EPA policy. Updated 5-17-11
29
ozone concentration (triangular), seems to have been overlooked. As well the report by Frank R, Liu MC, et al, 2001, also appears to have been overlooked, and is a helpful ref as substantiates that small airway functional changes persist during repetitive ozone exposure in controlled lab setting.
6) at issue is whether CS treatment of asthma cohorts are protective in controlled lab exposure
studies (pg. 6/30), and a helpful ref that has been overlooked would be the report by Holz O, et al, 2005 that was accomplished in healthy subjects (non-asthmatics) and evaluated for protection provided by comparing inhaled and orally administered GC. This is helpful as provides comparison of the GC in a respiratory tract free of inflammation at pre-exposure.
7) at issue is the description in the text under a toxicology section (pgs. 6/41-6/42) that in
referring to rodent models where the provocative exposure concentrations in testing scenarios may be in the 1-3 ppm range, that these “high” dose models are helpful for mechanism for understanding perhaps airway hyperresponsiveness, but have “questionable” relevance for extrapolation to airway responses in humans exposed to ambient levels of ozone. Two issues arise: human subjects undergo increased MV due to exercise during controlled exposures (which in fact may have durations of 50 min per hr over several to 6 h periods of exposure), are required for initiating functional changes. Given that the rodents are not exercised during exposures and thus do not elevate MV, and that is well known that the deposition fraction of ozone in the rodent respiratory is roughly 40-45 % (ref: Wiester MJ et al, 1988) where as in the human, 90-98 %, exposure concentrations of 1-3 ppm in rodent models are highly relevant for translation to human studies.
8) a topic that seems underserved in the text is the issue over airway neuronal effects that
occur during ozone exposure, either ambient or controlled lab settings. Thus text perhaps should be devoted briefly to this area, and include refs from both the clinical and toxicology literature; for example refs dealing with parasympathetic nerves (Beckett WS, et al, 1985), Krishna MT, et al, 1997; Taylor-Clark TE, et al, 2010; Nishiyama H, et al, 1998; Graham RN, et al, 2001; Hazbun ME, et al, 1993; Zhou S, Sunday ME, et al, 2010; Evans CM, et al, 2000; Coulson FR, et al, 2003.
9) with respect to descriptions of ozone exposure and general effects of the immune system
(pg. 6/73), the understanding of surface expression on lung macrophages of surface receptors called toll-like receptors (TLRs), which can recognize foreign pathogen-associated moldeular patterns (PAMPS), has become a topic of ghigh interest with respect to ozone exposure, alveolar macrophage function, and innate immunity (refs: Kleeberger SR, et al, 2000; Li Z, et al, 2010).
10) with respect to Fig. 6-19: % increase in respiratory-related hospital admission and ED
visits for all yr and seasonal analyses, it might be helpful to separate in the Figure the listings of All subjects, from Senior aged, from children. A significant part of the text has been devoted to acknowledge that children may be more susceptible to ambient ozone, and

Preliminary Individual Comments from Ozone Review Panel. These are individual panelists’ comments that do not represent consensus CASAC advice or EPA policy. Updated 5-17-11
30
thus to emphasize this, one would expect the hospital admissions, etc to be higher in this group with respect to a health effect. As well it would seem that there should be available more ref citations than those provided at this point in the text by Steickland (ref. 624878) and Orasso (ref. 202800).
11) with respect to Summary and Causal Determination, section 6.2.9 (pgs. 6/97 – 6/100) a
concerns arises. The text states on 6/98, that “recent controlled human exposure studies found functional response enhanced in subjects with elevated BMI” as such, this is an overstatement, as the suggestion of higher risk to ozone in subjects with high BMI is based, at this point, entirely on retrospective analysis (as correctly stated in the text on pgs. 6/15 – 6/16) and not designed laboratory studies. Although attractive concept, at this time a controlled human lab study is warranted.
12) with respect to ozone-induced effects on cardiovascular-related proteins, the report by
Weinmann GC, et al, 1995, demonstrated that fibrinogen titers were significantly elevated in bronchoalveolar lavage fluids sampled at delayed time point following controlled lab exposure ozone, and should likely be an addition the refs in this section.

Preliminary Individual Comments from Ozone Review Panel. These are individual panelists’ comments that do not represent consensus CASAC advice or EPA policy. Updated 5-17-11
31
Dr. Judy Graham
COMMENTS ON EPA/600/R-10/076A (O3 ISA 3-11 DRAFT) GENERAL COMMENTS NOT SPECIFIC TO A CHARGE
1. I am very impressed by this draft. I have several comments, but they do not detract from all the excellent parts and the hard work that went into developing this document. Congratulations to all involved, including scientists, engineers, assessors, managers, editors, and production staff.
2. HERO is fantastic, but incomplete. I found several important papers that only had the citations (not the abstract or paper) in HERO. When I went to pub med, it was easy to find the abstracts. I’m sure EPA has a hard copy of these papers, which they could scan. However, the first step is to include all abstracts. I found one example (Adams 2006) for which HERO had the abstract and a connection to the publication in Inhalation Toxicology. However, the journal would not permit free access. I know that EPA has hard copies of all the references used. One possibility of triage to improve HERO would be to identify the several dozen papers crucial to the bottom line of quantitative exposure-response. If the full paper is not available in HERO, steps could be taken to include it. However, I recognize that this would be a major undertaking and, in my view, is not essential to successful completion of the ISA. However, there is an exception. The three references to the ATS definitions of clinical significance (in Ch 1 and 6) should be scanned into HERO. These definitions will have a major impact on interpreting severity of effects which will be helpful to those determining adversity.
3. The database for O3 is extremely large and complex, requiring an unusually high degree of insight to describe and interpret well. I am concerned about whether this draft has had adequate external input and peer review. Eight of 27 authors are external; 1 of 11 contributors is external; and 10 of 35 reviewers are external. This should not be interpreted as a criticism of the EPA staff involved. I know many of them and fully recognize that while several of the EPA staff are internationally recognized experts in O3, most do not have scientific expertise in this area. Thus, external experts play a major role for insuring the quality of the ISA. I also know several of the extramural scientists involved and have great respect for them. The CASAC Ozone Review Panel has a collection of experts, but the magnitude of the database is quite large and, at least for myself, I don’t claim knowledge of the details of every key toxicology paper. A broader collection of external experts would offer greater assurance that the original papers have been critically interpreted correctly. This is even more important due to the brevity of the descriptions of many of the papers. As a first step, I recommend listing the authors, contributors, and reviewers according to the chapter they addressed, as was done for the 2006 AQCD. It was clear in the 2006 AQCD that the authors, contributors, and reviewers represented an array of world-class experts (EPA and external). As a second step, I recommend using additional external experts to assist in making revisions to the ISA and reviewing the next draft prior to the document being reviewed again by CASAC.
4. The O3 database is unique because of the concordance of human clinical, epidemiology, and animal toxicology at ambient or near-ambient exposures. This makes the O3 database especially compelling about health risks, particularly for susceptible subpopulations. This ISA attempts to bring all these study approaches together in the organization and summaries. However, the animal studies are not given sufficient attention to contribute to a fuller understanding of the severity of effects. Each approach has its strengths and weaknesses. Animal toxicology is strong because it is causally linked and can study effects (e.g., lung morphology) not measurable in humans. Its weakness is that extrapolation to humans is

Preliminary Individual Comments from Ozone Review Panel. These are individual panelists’ comments that do not represent consensus CASAC advice or EPA policy. Updated 5-17-11
32
required, and this has quantitative limitations. However, these limitations are outweighed by the strengths. I will offer specific comments in the following comments that expand on this point.
CHARGE QUESTION 1: This first external review draft O3 ISA is of substantial length and reflects the copious amount of research conducted on O3. EPA has attempted to succinctly present and integrate the policy-relevant scientific evidence for the review of the O3 NAAQS. The panel may note that per CASAC consultation on November 13, 2009, considerable discussion has focused on older literature. The panel emphasized that important older studies should be discussed in detail to reinforce key concepts and conclusions if they are open to reinterpretation in light of newer data and where these older studies remain the definitive works available in the literature. In considering subsequent charge questions and recognizing an overall goal of producing a clear and concise document, are there topics that should be added or receive additional discussion? Similarly, are there topics that should be shortened or removed? Does the Panel have opinions on how the document can be shortened without eliminating important and necessary content? General Comments
1. Any collection of knowledgeable reviewers will have different opinions about what to add or subtract. Thus, there is no “correct” answer to this charge question. At best, we can only offer suggestions.
2. This charge focuses on length. Length is an important consideration, but not nearly as important as clarity of presentation for the various audiences using the document for various purposes, particularly regulatory purposes. Thus, although there are several opportunities for shortening, they have little value per se. In some specific cases, to be noted later, I will recommend some targeted shortening and lengthening in my comments related to charge questions.
3. It is extremely important to add tables of effects to the ISA. This draft ISA has no human clinical or toxicology tables. There are several very good epi tables/figures, but some of the existing ones only have exposure information, without an indication of the effects. The text is quite complex due to the number of studies. The text often represents a good, but very inadequate, attempt to describe study parameters and outcomes. When the text is complete (e.g., species, strain, sex, age, ppm, exposure pattern, time of examination, parameters, lowest concentration showing effects), the findings and interpretation are obfuscated. A table would permit the text to be more qualitative. Also, when a number of studies with different details and different outcomes are presented, it is extremely difficult to get a handle on the weight of the evidence. Tables would reduce this problem. Having all the studies (old and new) in a table (ranked by exposure rather than by date of publication) enables a shorter integration of the body of work in the text. The human clinical sections of chapter 6 offer an excellent argument for this. There are several dozens of studies at very relevant concentrations with very relevant response measures and effects. There is a lot of information that contributes to susceptibility factors and exposure-dose-response, but it is buried. In some cases, such information is missing (e.g., 6-43 L32ff) due to the brief summary of the studies in the 2006 AQCD. In many cases, one would need to look at the underlying references (some of which are not in HERO) to get an understanding. Tables would solve this major problem. Page 6-134ff provides a good example; the one paragraph talks about CNS effects in the older study, without providing any information at all on exposures (except for a concentration regression form one epidemiology study). The

Preliminary Individual Comments from Ozone Review Panel. These are individual panelists’ comments that do not represent consensus CASAC advice or EPA policy. Updated 5-17-11
33
epidemiology sections of Chapters 6 and 7 have tables. Some are extremely useful (e.g., the ones showing the outcome and study details). Some should be expanded. For example, Table 6-9 on p6-33 only has study characteristics without indicating results. The results are buried in the text. Making this change would require significant effort. Probably, the easiest approach would be to expand the tables from older AQCDs. If you do this, please be aware that the 2006 AQCD is missing some important studies cited in the 1996 AQCD.
4. Throughout, the old studies (i.e., those presented in previous documents) are summarized, and the new studies are discussed in more detail. The goal of this artificial separation was to keep the length of the document under control, but unfortunately this ISA does it at the expense of understanding the exposure-response effects of O3. EPA regulations need to be based on key studies, underpinned by supporting evidence. In some cases, the key studies are buried because they are old, and less important studies get space just because they are new. A preferred approach is to include tables of all the high quality and relevant studies and use the text to discuss the key studies fully with a shorter discussion of the supporting studies, independent of their year of publication.
Specific Comments
1. In my opinion, there is excessive duplication, especially with the summaries. Also, there is excessive duplication between discussions of MOA, effects, and susceptible populations. Some of these overlaps are necessary. None do any real damage. However, the length of the document is affected. Examples and suggested changes follow:
a. The purpose of Chapter 2 is not clear. It is well-written, but duplicates subsequent summaries exactly. Who is the audience? One possibility is deleting this chapter all together. Because it has no references, tables, or much specificity, it is not useful. Another possibility is to retain sections 2.6, 2.7, and 2.8, delete the other material, and make appropriate modifications to the introduction to the chapter. An alternative possibility is to delete the exactly same summaries within the chapters.
b. In some cases, the attempt at brevity can cause misunderstanding and be a show-stopper to some readers. This typically happens when human studies are described with an concentration but without an indication of whether exercise was involved (e.g., 2-17. L20). Add the exercise statement with an adjective (e.g., moderate, heavy). In many cases, animal studies are described with no indication of the exposure duration (e.g., 2-26 L8; 2-46 L22). Minimally, the term acute, subchronic, and chronic should be used.
2. One approach to shortening is to have a major editing effort to catch minor duplications. I won’t cite them all here. One such example is on p1-18 in which there is excessive duplication in the area between L3 and L24. Another example is 5-7 L35-38; true, but generic and already said in introductory sections.
3. One approach to shortening is to delete the artificial separation between “old” studies of previous documents and the “more recent work”. Actually, my greater concern is that such an artificial separation makes the ISA intellectually “choppy” and hard to understand. This is a far greater problem than length. In virtually all cases, it is necessary to compare the old with the new, causing reiteration of the basis of comparison. There could be value in identifying those conclusions that are changed or unchanged from the previous document. If unchanged, a sentence or 2 would suffice. If changed, then a more rigorous discussion would be needed. Some examples of problems are:

Preliminary Individual Comments from Ozone Review Panel. These are individual panelists’ comments that do not represent consensus CASAC advice or EPA policy. Updated 5-17-11
34
a. 5-6 under “recent publications” discusses older work L34ff. Mudway and Kelly (1998) are in both places.
b. 5-14 L26 is in the “old” section, but contains a 2007 study. 5-15 L4 is in the new section but discusses “past studies”
c. 5-20 L1-16 (new section) is a study by Tsujino et al, 2005, described in some detail, including the statement on L13 that the model is limited in such a way that I think it has little (or no) value to the conclusions. Thus, some valuable old studies are truncated, but new studies are described in detail, sometimes beyond their value.
d. 5-40 is “new” material. However, older studies are included. 4. Chapter 5 contains BOTH dosimetry and MOA. There is no reason to put them together. The
MOA should be integrated with its related concept/item. For example, MOA of interaction of O3 with ELF would stay in dosimetry, but MOA of inflammation would be in the effects chapters. The MOA section 5.2 has several instances of describing effects, rather than MOA, as well as instances of having to describe the effect which is discussed later (i.e., duplication). In some cases, the effect referenced is not discussed later in the appropriate effect chapter. I recognize that this is very difficult to untangle because some MOAs (e.g., inflammation) are a pathway to several effects. Some examples follow:
a. 5-8 L1-2 This is a very important concept, but no details are provided here under dose. The reader is then referred to the MOA section for these details.
b. 5-30 L35 ff. Over half a page is devoted to effects of O3 on sRaw, with emphasis on effects. It’s a stretch to see why this is in the MOA section. Many, but not all, of the references are in Chapter 6, leading to duplication.
5. When studies are cited in the text, important parameters to the outcome need to be included, either in new tables or the text. For example, the text should always indicate whether the humans were exercising or not, and if so, whether it was light, heavy, etc. (p3-37 L2 and several other places it doesn’t).
CHARGE QUESTION 2: The framework for causal determination and judging the overall weight of evidence is presented in Chapter 1. Is this framework appropriately applied for this O3 ISA? How might the application of the framework be improved for O3 effects?
1. 1-10 L6ff. These statements that animal studies are normally very high is generically true for toxicity testing, but NOT for O3. Most of the O3 effects of concern are observed in animals at <0.5 ppm; many are observed <.2ppm. Considering dosimetric differences, these are roughly equivalent to human ambient exposures. The text (L8) goes on to say that “Such studies” (i.e., those are very high concentrations) were considered. Earlier (1-9), the text has a better description of the use of animal studies. Bottom line is that O3 animal studies at environmentally relevant are fundamental to causation and the range of effects. Thus, I suggest L-7 sentence (“Due to…response) be deleted.
Specific Comments
2. 1-24 L21ff. This whole subsection is “Concepts in evaluating adversity.” This is one of THE most important sections of the document and further explanation would be helpful to users. Specifically, please explain the ATS official statement about adversity in some detail.
Minor Comments for EPA’s consideration, but not needing discussion at the meeting

Preliminary Individual Comments from Ozone Review Panel. These are individual panelists’ comments that do not represent consensus CASAC advice or EPA policy. Updated 5-17-11
35
1. 1-15 L22. Consider adding “and ethical constraints”. This change covers the limitations discussed in the immediately following text.
2. 1-18 ff This section reduces the value of animal toxicology studies, relegating it to insights and MOAs.
a. L4. Consider making this paragraph more relevant to O3 by adding “the effects of O3 on” before “human physiology” and deleting “putative” on L5.
b. Add a thought somewhere in this area about being able to detect and describe effects that can’t be measured in humans, such as morphological changes, birth defects, and tumors. This contributes significantly to understanding severity of effects.
c. L 10-13 The limitations of animal-to-human extrapolation are correctly described, but the strengths of such extrapolation are not even mentioned. For example, a discussion of homology should be included.
d. L12 and L17. What “hormonal regulation”. Maybe there are new studies I’m not aware of or the ISA has a different definition. It’s easier to just delete it and add “respiratory tract biochemistry”.
3. 1-23 L38 Add “activity patterns” and “exercise levels” to the list of factors that influence exposure. These are quite important and likely to be more important that some of the others listed.
CHARGE QUESTION 3: Chapter 2 presents the integrative summary and conclusions from the O3 ISA with detailed discussion of evidence in subsequent chapters. Is this a useful and effective summary presentation? How does the Panel view the appropriateness of the causal determinations?
1. It is well-done. However, whether it is useful and effective is dependent on the audience. As mentioned in my response to Charge Question 1, I believe much of this chapter is highly duplicative, doesn’t describe exposure-responses, has no research references, and could be deleted.
General Comments
1. 2-2 L5-7 This language refers strictly to concentration-response but then goes on to include and exposure duration, which is NOT part of concentration and ignores exposure patterns/dose rate. Both concepts need to be clarified. The inclusive language on L5 would be to say “exposure-dose-response”. The expanded form would define each term and include the concept of delivered dose and exposure pattern/dose rate. Another example of this problem is on 2-34, L22 which starts as C-R, but then adds C-V-D.
Specific Comments
2. 2-16 L24 and many other places. Respiratory tract anatomy and dosimetric regions are not defined consistently. “Deeper” has no scientific meaning. Create a standard terminology and stick to it (RT, URT, NP, LRT, NP, TB, A or P), going into more detail when needed (e.g., PAR).
3. 2-31 Section 2.5.1 on “potentially susceptible populations”. Where is the discussion of exercise and greater exposures (as a function of activity pattern) as factors? It is implied with the statement of “air conditioner use”, but these two factors are probably greater susceptibility factors than genetic polymorphisms. Children have less than one line, which is way too little.

Preliminary Individual Comments from Ozone Review Panel. These are individual panelists’ comments that do not represent consensus CASAC advice or EPA policy. Updated 5-17-11
36
4. 2-29 L29ff This sentence talks about dietary deficiencies. It is too “summarized” and sounds stronger than the data. An additional sentence referring to the database (e.g. deficient and then supplemented).
5. 2-36 Table 2-3. For airway hyperresponsiveness. Why aren’t human studies mentioned for the 2011 ISA. As is, it appears that the newer data refute the older conclusions on this important point.
6. 2-36 Table 2-3. Symptoms are not discussed in the preceding text of Ch 2. 7. 2-44 L15 I see no evidence that animal tox and human clinical data support mortality in epi
studies. Even the chronic animal studies have no mortality at reasonable concentrations. This is too big a stretch.
1. 2-2 L25. Delete “potential”. The effects are real. Minor Comments for EPA’s consideration, but not needing discussion at the meeting
2. 2-16 L16-28. Please add a sentence or two about extrapulmonary effects. 3. 2-18 L19. Delete “may” and insert “of laboratory animals” before may. There is no doubt about
it in animals. CHARGE QUESTION 5: Chapter 4 describes human exposures to O3. Is the evidence relating human exposure to ambient O3 and errors associated with exposure assessment presented clearly, succinctly, and accurately? Are the results of field studies evaluating indoor-outdoor and personal-ambient exposure relationships, and factors affecting those relationships, presented in a manner that is useful for interpretation of epidemiologic results? Is the information on modeling O3 concentration surfaces and population exposures appropriate for evaluating the utility of these modeling approaches? Do the characterizations of temporal and spatial variability of O3 in urban areas provide support for better understanding and interpreting epidemiologic studies discussed later?
1. 4-10 L9-10. This cites Anderson and says that “these [referring to previous lines] reaction products may have health effects in addition to, or greater than, those from O3 itself.” Firstly, the Anderson studies used simulated indoor air chemistry of VOCs and studied sensitization potential. They did not use O3. Thus, this citation does not support this sentence. The significant problem is that use of the words “in addition to or greater than” implies either additivity or synergism or that these compounds have greater potency. The Anderson paper does not support that. It could be changed to say that many of these reaction products have effects themselves, opening the possibility of interactions.
Specific Comments
2. 4-17 L1-6. Why is this section so brief? The Georgopoulos paper is not discussed in the previous AQCD, so it especially should be expanded here or criticized to provide a rationale for dismissing it.
3. 4-17 L32 ff. This new exposure model by NERL sounds exciting. It is appropriate to insert this clue at this draft stage if you expect it to be referencable at the time of subsequent ISAs.
4. 4-16 Figure 4-2. This figure is not needed and could be deleted for brevity. 5. Please add a figure(s) that shows hourly personal exposure with variability—or something that
gives the reader a feel for exposure patterns. Minor Comments for EPA’s consideration, but not needing discussion at the meeting
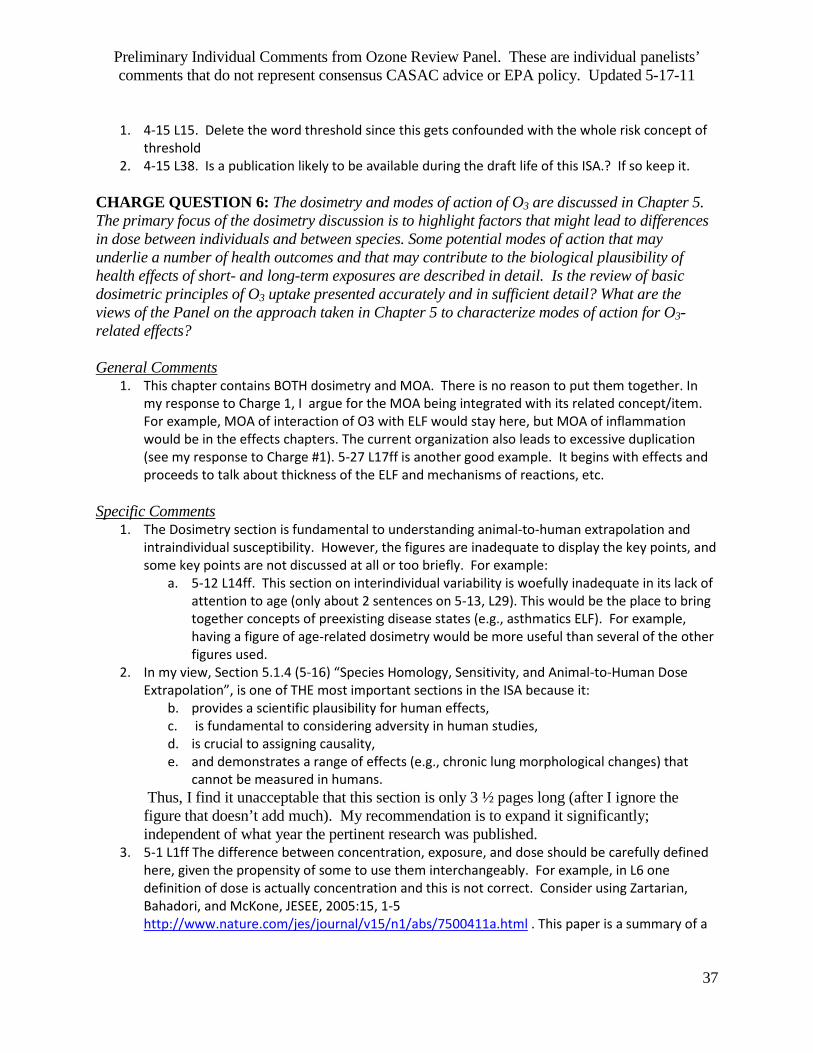
Preliminary Individual Comments from Ozone Review Panel. These are individual panelists’ comments that do not represent consensus CASAC advice or EPA policy. Updated 5-17-11
37
1. 4-15 L15. Delete the word threshold since this gets confounded with the whole risk concept of threshold
2. 4-15 L38. Is a publication likely to be available during the draft life of this ISA.? If so keep it. CHARGE QUESTION 6: The dosimetry and modes of action of O3 are discussed in Chapter 5. The primary focus of the dosimetry discussion is to highlight factors that might lead to differences in dose between individuals and between species. Some potential modes of action that may underlie a number of health outcomes and that may contribute to the biological plausibility of health effects of short- and long-term exposures are described in detail. Is the review of basic dosimetric principles of O3 uptake presented accurately and in sufficient detail? What are the views of the Panel on the approach taken in Chapter 5 to characterize modes of action for O3-related effects?
1. This chapter contains BOTH dosimetry and MOA. There is no reason to put them together. In my response to Charge 1, I argue for the MOA being integrated with its related concept/item. For example, MOA of interaction of O3 with ELF would stay here, but MOA of inflammation would be in the effects chapters. The current organization also leads to excessive duplication (see my response to Charge #1). 5-27 L17ff is another good example. It begins with effects and proceeds to talk about thickness of the ELF and mechanisms of reactions, etc.
General Comments
1. The Dosimetry section is fundamental to understanding animal-to-human extrapolation and intraindividual susceptibility. However, the figures are inadequate to display the key points, and some key points are not discussed at all or too briefly. For example:
Specific Comments
a. 5-12 L14ff. This section on interindividual variability is woefully inadequate in its lack of attention to age (only about 2 sentences on 5-13, L29). This would be the place to bring together concepts of preexisting disease states (e.g., asthmatics ELF). For example, having a figure of age-related dosimetry would be more useful than several of the other figures used.
2. In my view, Section 5.1.4 (5-16) “Species Homology, Sensitivity, and Animal-to-Human Dose Extrapolation”, is one of THE most important sections in the ISA because it:
b. provides a scientific plausibility for human effects, c. is fundamental to considering adversity in human studies, d. is crucial to assigning causality, e. and demonstrates a range of effects (e.g., chronic lung morphological changes) that
cannot be measured in humans. Thus, I find it unacceptable that this section is only 3 ½ pages long (after I ignore the figure that doesn’t add much). My recommendation is to expand it significantly; independent of what year the pertinent research was published.
3. 5-1 L1ff The difference between concentration, exposure, and dose should be carefully defined here, given the propensity of some to use them interchangeably. For example, in L6 one definition of dose is actually concentration and this is not correct. Consider using Zartarian, Bahadori, and McKone, JESEE, 2005:15, 1-5 http://www.nature.com/jes/journal/v15/n1/abs/7500411a.html . This paper is a summary of a

Preliminary Individual Comments from Ozone Review Panel. These are individual panelists’ comments that do not represent consensus CASAC advice or EPA policy. Updated 5-17-11
38
WHO effort that was also adopted by the International Society of Exposure Science to standardize exposure terminology.
4. 5-1 whole page and throughout: Respiratory tract anatomy and dosimetric regions are not defined consistently. “Deep” has no scientific meaning (e.g., L17). What are (5-11 L4) upper, central, and lower airways? Create a standard terminology and stick to it (RT, URT, NP, LRT, NP, TB, A or P), going into more detail when needed (e.g., PAR). Fig 5-1 on 5-3 could be modified to be clear on this. The current figure doesn’t add much. Technically informed people already know it. Non-technical people would probably be better off with an understanding of the total RT. For example, 5-10 has a header saying “pulmonary O3 uptake and dose”. Later “lungs” are referred to. Pulmonary is alveolar. Lungs are LRT. This language must be more precise because some dosimetry studies included the URT and some didn’t.
5. 5-13 L8ff. This says “Variability in local dose may be attributed to …physiology”. This is incomplete—variability is also significantly dependent on anatomy and biochemistry of the epithelial lining layer.
6. 5-16 L5. Greater care has to be taken with citing effect studies. For example, Emmons and Foster, 1991 is not cited in Chapter 6, but Frampton et al 1997 is.
7. 5-16 L17. This summary section talks about “major sources of variability in absorption of O3.” However, the list does not mention surface area, which is an important concept for deposition in children.
8. 5-17 L10-12. It is essential to add a reference here. Do you mean Gong et al. 1998? If so, it was at 0.3ppm. The sentence seems odd since humans can’t really be exposed to “very high” levels.
9. 5-19 Figure 5-5 adds nothing. It would be helpful to use a figure of exposure-responses, comparing different species (including humans)---in Chapter 6.
10. 5-21 ff The MOA section 5.2 is VERY uneven in presentation of exposure characteristics (i.e., male or female, animal species; concentrations, exposure patterns/durations). Having all information for each study in the text would be far too distracting. Thus, there should be a table with all the information and then a summary in the text (species and qualitative description of exposure duration; adding details like sex when the study made such comparisons).
11. 5-29 L6ff Please add comments on systemic possibilities. For example, consider adding “and perhaps systemically” to the end of the sentence on L10.
12. 5-22 L3 ff. This is a discussion of attenuation, but why is it under Section 5.2.3 “Activation of Neural Reflexes”. Then p 5-38 L24 (under Section 5.2.4 (injury and inflammation) goes on to discuss attenuation. These are other examples of the confounding of effects and MOA. The major story of attenuation is that it occurs for some effects, but not for others, may even contribute to effects, and is not long-lived. The MOA is interesting and contributes to understanding, but is not THE story. Thus, it belongs in Chapter 6. Virtually every section has similar examples, but I will not recount them all here. Moving all the MOA (except that part dealing with dosimetry) to the sections on effects will solve these problems.
13. 5-39 L1 ff regarding attenuation has some problems. a. The Tepper et al 1989 paper is cited. The next sentence says: “Thus, the inflammatory
response resembled that of the …function…which was attenuated.” The “thus” is not correct. Tepper reported that inflammation was NOT attenuated. The abstract of his paper (not in HERO) says “Acute ozone (O3) exposure in humans produces changes in pulmonary function that attenuate with repeated exposure. This phenomenon, termed adaptation, has been produced in unanesthetized rats. Rats exposed to O3 (0, 0.35, 0.5, or 1.0 ppm) for 2.25 h for 5 consecutive days showed an increased frequency of

Preliminary Individual Comments from Ozone Review Panel. These are individual panelists’ comments that do not represent consensus CASAC advice or EPA policy. Updated 5-17-11
39
breathing and a decreased tidal volume on Days 1 and 2 of exposure at all O3 concentrations. However, by Day 5 these breathing responses to O3 were diminished in rats exposed to 0.35 and 0.5 ppm, but not in rats exposed to 1.0 ppm. In addition, a flow limitation in smaller airways was observed after the second day of exposure to 0.5 ppm O3 that initially attenuated and then disappeared by the fifth day of exposure. In contrast to these findings, a light microscopic examination of fixed lung tissue sections from rats exposed to 0.5 ppm indicated a 5-day progressive pattern of epithelial damage and inflammation in the terminal bronchiolar region. A sustained 37% increase in lavageable protein was also observed over the course of the 5-day exposure regimen to 0.5 ppm. Lung glutathione increased initially, but it was within the control range on Days 4 and 5. Lung ascorbate was significantly elevated above control levels on Days 3 and 5. These data suggest that attenuation of the pulmonary function response to O3 occurs in laboratory rats with repeated exposure while biochemical and morphologic aspects of the tissue response continue to progress.”
b. The text goes on to say what Christian et al, Hackney et al, and Horvath et al found. The Christian et al had an abstract in HERO, but the others didn’t. The Christian one was quoted correctly. The Horvath one (no abstract in HERO) appears to be quoted incorrectly, based on the abstract in pub med ;
Adaptation to ozone: duration of effect. Horvath SM, Gliner JA, Folinsbee LJ. Abstract Repeated ozone exposure induces an adaptative response whereby subsequent ozone exposure induces little or no pulmonary function change. The time course of the adaptation and the persistence of this adaptation was determined in 24 subjects. Subjects were studied for 125 min while they exercised intermittently. They were exposed to filtered air for 1 day and then in the next week for 5 consecutive days to 0.5 ppm ozone. After the fifth day, subjects were randomly assigned to return for one more ozone exposure at 1, 2, or 3 wk. The greatest decrement in FEV1 occurred on the second day of exposure. The number of consecutive ozone exposures required to produce adaptation varied from 2 to 5 days. Persistence of adaptation in ozone-sensitive subjects (initial decrease in FEV1 greater than 10%) showed marked individual variability, but the duration of adaptation was shortest for the more sensitive subjects. Adaptation, on the average, lasted for less than 2 wk, being as short as 7 days and as long as 20 days. We concluded that more sensitive subjects required more daily sequential exposures in order to adapt. The same problem occurs with the Hackney et al 1977 citation. The abstract in pub med says nothing about inflammation. Adaptation to short-term respiratory effects of ozone in men exposed repeatedly. Hackney JD, Linn WS, Mohler JG, Collier CR. Abstract To investigate whether adaptation which modifies some acute effects of ozone (O3) exposure can develop in humans, six male volunteers with respiratory hyperreactivity were exposed in a controlled environment chamber to 0.5 ppm O3 2h/day for 4 successive days under conditions stimulating ambient pollution exposures. One subject showed little measurable response, while five showed function decrement on exposure days 1-3 which was largely reversed by day 4. Symptom responses generally paralleled the physiological responses. These results suggest that at least some humans adapt to O3 exposure at concentrations occurring in severe community air pollution episodes, to the extent that obvious acute respiratory effects are prevented. Other adverse effects of O3 may not be prevented by this adaptation.
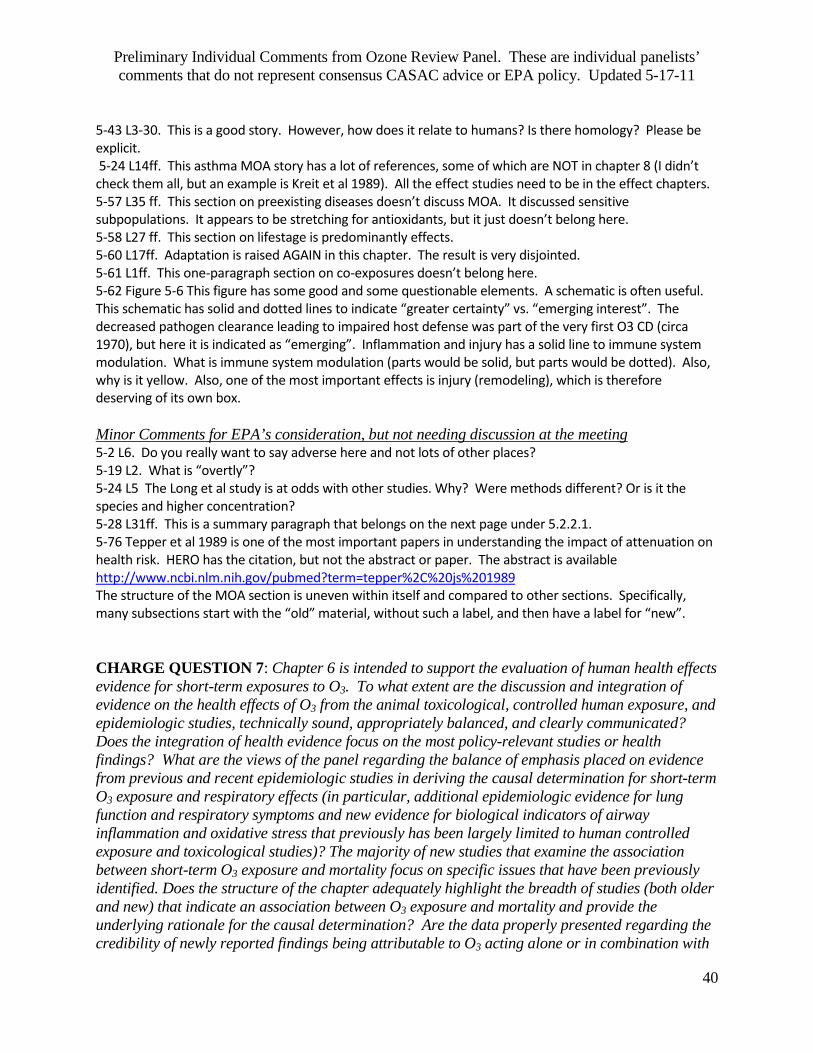
Preliminary Individual Comments from Ozone Review Panel. These are individual panelists’ comments that do not represent consensus CASAC advice or EPA policy. Updated 5-17-11
40
5-43 L3-30. This is a good story. However, how does it relate to humans? Is there homology? Please be explicit. 5-24 L14ff. This asthma MOA story has a lot of references, some of which are NOT in chapter 8 (I didn’t check them all, but an example is Kreit et al 1989). All the effect studies need to be in the effect chapters. 5-57 L35 ff. This section on preexisting diseases doesn’t discuss MOA. It discussed sensitive subpopulations. It appears to be stretching for antioxidants, but it just doesn’t belong here. 5-58 L27 ff. This section on lifestage is predominantly effects. 5-60 L17ff. Adaptation is raised AGAIN in this chapter. The result is very disjointed. 5-61 L1ff. This one-paragraph section on co-exposures doesn’t belong here. 5-62 Figure 5-6 This figure has some good and some questionable elements. A schematic is often useful. This schematic has solid and dotted lines to indicate “greater certainty” vs. “emerging interest”. The decreased pathogen clearance leading to impaired host defense was part of the very first O3 CD (circa 1970), but here it is indicated as “emerging”. Inflammation and injury has a solid line to immune system modulation. What is immune system modulation (parts would be solid, but parts would be dotted). Also, why is it yellow. Also, one of the most important effects is injury (remodeling), which is therefore deserving of its own box.
5-2 L6. Do you really want to say adverse here and not lots of other places? Minor Comments for EPA’s consideration, but not needing discussion at the meeting
5-19 L2. What is “overtly”? 5-24 L5 The Long et al study is at odds with other studies. Why? Were methods different? Or is it the species and higher concentration? 5-28 L31ff. This is a summary paragraph that belongs on the next page under 5.2.2.1. 5-76 Tepper et al 1989 is one of the most important papers in understanding the impact of attenuation on health risk. HERO has the citation, but not the abstract or paper. The abstract is available http://www.ncbi.nlm.nih.gov/pubmed?term=tepper%2C%20js%201989 The structure of the MOA section is uneven within itself and compared to other sections. Specifically, many subsections start with the “old” material, without such a label, and then have a label for “new”. CHARGE QUESTION 7: Chapter 6 is intended to support the evaluation of human health effects evidence for short-term exposures to O3. To what extent are the discussion and integration of evidence on the health effects of O3 from the animal toxicological, controlled human exposure, and epidemiologic studies, technically sound, appropriately balanced, and clearly communicated? Does the integration of health evidence focus on the most policy-relevant studies or health findings? What are the views of the panel regarding the balance of emphasis placed on evidence from previous and recent epidemiologic studies in deriving the causal determination for short-term O3 exposure and respiratory effects (in particular, additional epidemiologic evidence for lung function and respiratory symptoms and new evidence for biological indicators of airway inflammation and oxidative stress that previously has been largely limited to human controlled exposure and toxicological studies)? The majority of new studies that examine the association between short-term O3 exposure and mortality focus on specific issues that have been previously identified. Does the structure of the chapter adequately highlight the breadth of studies (both older and new) that indicate an association between O3 exposure and mortality and provide the underlying rationale for the causal determination? Are the data properly presented regarding the credibility of newly reported findings being attributable to O3 acting alone or in combination with

Preliminary Individual Comments from Ozone Review Panel. These are individual panelists’ comments that do not represent consensus CASAC advice or EPA policy. Updated 5-17-11
41
other co-pollutants and regarding the extent that toxicological study findings lend support to the biological plausibility of reported epidemiologic associations in reaching a causal determination? Are the tables and figures presented in Chapter 6 appropriate, adequate and effective in advancing the interpretation of these health studies?
The causation statements are very well supported scientifically. Many have been well established for many years. This answer leads to the key questions (focusing on susceptible subpopulations) that require more attention, namely, what exposures are sufficient to cause the effects of interest and what is the severity of the effects at these effective exposures. I can find some answers to these questions interspersed in the text, but clarity on these issues would be very helpful. I recognize that adversity has policy implications vis-à-vis the CAA requirements. I am requesting a more extensive discussion of clinical interpretation of the effects in the human clinical studies. The epi studies are a bit easier to interpret (e.g., going to the ED or getting admitted to hospital is a relatively clear estimation of the severity/impact of exposures).
General Comments
Some important human studies cited in Chapter 5 (e.g., Bates et al, 2009 and Emmons and Foster 1991 deal with smokers) are not cited here, but Frampton et al 1997, also on smokers, is in Chapter 5 and 6. Why? I suspect it is due to the confounding of MOA in too many places. I recommend comparing all the MOA literature citations to the citations in Chapters 6 and 7 and asking if some papers have not been fully used. The optimal approach, as mentioned above, is to move all the Chapter 5 MOA to the relevant effect chapters/sections.
1. With rare exception (some of the epi tables, e.g., Fig 6-3 supplemented with table 6-2) the tables are wholly inadequate, the reason being that there are no tables for clinical and toxicological studies. My comments in response to Charge Question 1 go into more detail on this. But, here are a few examples out of many:
a. 6-7 L7. The Schelenge et al studies are quite important, but there is no indication of whether exercise was used and if so, at what level.
b. 6-18 Table 6-1 sets forth key attributes of several epi studies but, at least to me, is deficient without another column of effects. This problem exists throughout.
c. 6-43 L32 ff summarizes the 2006 CD material on human clinical studies on pulmonary inflammation. A number of studies are referenced, with no indication of C, D, or V.
2. The artificial separation between old and new studies and MOA and effects leads to a choppy presentation and weak integration. My comments in response to Charge Question 1 go into more detail on this. The problem is especially troublesome in the case of human clinical and epi studies since they will form the predominant bases of the NAAQS. It is important to understand the whole scientifically valid database which has dependencies on C, D, and V. So giving details on new studies and just sweeping all the older ones into a few sentences doesn’t allow the needed integration.
3. The animal toxicological studies on respiratory morphological/morphometric changes are not adequately discussed. When they are mentioned, the discussion is buried, too brief, does not allude to supporting evidence, and does not discuss implications to severity of effects in humans. There are dozens of references to effects below 0.5ppm, down to 0.15 and 0.2 in non-human primates that are not included. The result of this problem is that the story of structural changes does not come through. It is correlated with inflammation and (at higher levels) with functional changes. Such structural changes cannot be measured in humans, but are very likely to occur, if exposures are sufficient. Such information contributes to understanding of severity.

Preliminary Individual Comments from Ozone Review Panel. These are individual panelists’ comments that do not represent consensus CASAC advice or EPA policy. Updated 5-17-11
42
Therefore, it is essential to add this information. Most of these studies are older, so the easiest approach might be to identify morphological studies discussed in the 1996 and 2006 AQCD that are not included here, add the details to a table, and create a 2-3 paragraph discussion of the findings and their implications to humans.
1. (This comment is a duplicate to that under the next Charge question on Chapter 7) There is some confounding between Chapters 6 and 7 with regard to whether the studies were short- or long-term. For example, some 90-day studies were in both places. Prenatal exposure studies are in both places. The beginning text of each chapter should define the duration term. In some cases, duplicate discussion may be of value, but this could be part of the discussion (e.g., time trend for respiratory tract morphometric changes). The whole of the literature on neonatal exposures should be in one chapter of the other.
Specific Comments
2. 6-2 L6 Insert “non-asthmatic” before children (the original language conflicts with L35) 3. There are a number of problems with inconsistent use of terms. This leads to confusion.
Examples follow: a. 6-2 L11. This is the beginning of a repetitive use of the terms tolerance, adaptation, and
attenuation as synonyms. The terminology is quite important because full understanding is essential to interpreting the severity of repeated exposures. One problem is that for O3, the term tolerance has been used historically to represent repeated low concentration exposures of animals that protect against subsequent exposure to very high levels of O3 or other selected air pollutants. To avoid confusion, it is best to not use it. The use of the terms adaptation and attenuation has some precise differences and has been contentious, given the implications of the terms. It would be best to define them, and then use these definitions consistently.
b. 6-6 L1 ff The terms square-wave and constant are used interchangeably. Also this area uses the word dose to mean CxDxV. Other areas are more careful about this. Continuing down, L22, the word “average” triangular exposure is used. What is the definition of average? Is it CxD or CxDxV? Also address this issue to Figure 6-2 on p6-10.
c. The term adverse or adversity is used in a few places (e.g., 6-138 L15) This results in two problems: (1) If it is used in one place but not other places, it implies that these other places are not adverse and we can ignore them; and (2) adverse has not been defined here and in any case, isn’t it reserved to a policy determination?
4. 6-2 L12. Add a new sentence to express the concept that attenuation does NOT occur for other types of effects. This is important because the current text incorrectly implies that successive exposures are no problem. Also, discuss the possibility that attenuation contributes to the persistent changes by “allowing” more O3 to penetrate and deposit to sensitive lung areas (e.g. PAR when rapid-shallow breathing switches back towards normal).
5. 6-2 L25. Consider changing “unknown” to “still speculative”. There are some suggestions, so unknown is not proper. Also, what about the concept that repeated respiratory infections might contribute to COPD?
6. 6-3 L22. This defines “O3 induced” as “effects that have been corrected for…filtered air exposures.” This is a significant problem because throughout the subsequent text effects and O3-induced are both used. Thus, the L22 statement implies that when “effects” is used, it has not been corrected. Also, why present any study results as “uncorrected for FA responses” (6-98 L5)? Without FA controls, the results are very difficult to interpret and use.

Preliminary Individual Comments from Ozone Review Panel. These are individual panelists’ comments that do not represent consensus CASAC advice or EPA policy. Updated 5-17-11
43
7. 6-4 L1. Add the concept that a shift to oronasal affects the pattern of deposition of O3 dose, which could be quite important. The current text implies that the only difference is a decrease in URT scrubbing.
8. 6-7 L18. This discussion of the Schelegle et al 2009 study is quite important because it goes down to 60 ppb, at which no statistically significant group effects were observed. Question: did EPA evaluate the quality of the statistics on this paper? Did the study have adequate power to detect effects. What exercise levels were involved.
9. 6-7 L30ff. This paragraph, going over to the next page, is a summary of the relationship between concentration and FEV1, considering all the human clinical studies. It needs further exploration. For example, since the importance of CxDxV is well established in acute human clinical FEV1 studies, was there a difference in V or CxDxV in the studies described? Perhaps the CxDxV differences were responsible for the lack of statistical significance of the Schelengle study.
10. 6-5 Figure 6-1 is helpful. More such figures would be helpful. Look back at the 2006 AQCD for suggestions.
11. 6-10 L10 This defines “clinically meaningful” changes of FEV1, citing ATS 1991. HERO does not have this paper. The reference in Chapter 1 also refers to ATS definitions of meaningful, but cite 1985 and 2000 documents (also not in HERO). This is quite important, so it is necessary to go deeper into the discussion of clinically meaningful, preferably in summary sections.
12. 6-10 L14 This says that the data from these 2 studies are unavailable. The reason for the Adams 1998 data unavailability was provided earlier. The reason for the Schelengle et al 2009 being unavailable to EPA should be stated also. Apparently, the OMB A110 rules are not applicable, but what about the implications relative to the Information Quality Act?
13. 6-11 L1-2. This is one of the most important sentences in the document (an interpretation of “clinically meaningful”. Thus, it is deserving of references that are available in HERO (note, I mean having the full ref available, not just the citations).
14. 6-11 L17. An adjective is needed before “effects”. Consider “spirometric”. 15. 6-13 L19-20 The term “increased risk” is used. Explain why decreased symptoms in these groups
would lead to increased risk, especially considering the decreased effects of O3 on the elderly. I can see why a lack/decrease in symptoms in children would result in them not avoiding exposures that would lead to functional deficits.
16. 6-15 L2ff. This paragraph should be balanced with a discussion of the improvements happening in people/animals that were deficient originally.
17. 6-16 L7ff. Add Tepper et al 1989 to the end of the discussion since it is more definitive of persistence of effects
18. 6-39 L1-2. This one sentence is totally insufficient to describe the older literature. The acute pulmonary function literature in animals is not especially important, but it adds background to the human clinical studies. Having a table would suffice.
19. 6-39 L4 ff. This new study (Cremillieux et al 2008) is intriguing because of the types of measurements and the intermittent vs. continuous exposure. I tried to look it up in HERO, but there was a publisher charge for viewing it. Comparing the ISA text to the abstract raised questions. The abstract says no change in inspiratory capacity, but the ISA text says no effect on lung capacity. Also, the ISA says that the effects of intermittent exposure were “more prevalent and severe.” From the abstract, they were more prevalent, but the abstract doesn’t mention severity. The abstract also doesn’t say whether the difference in prevalence was statistically significant. Because all these differences from the abstract could be important, the full text of the paper should be rechecked and the ISA text should be expanded a bit.
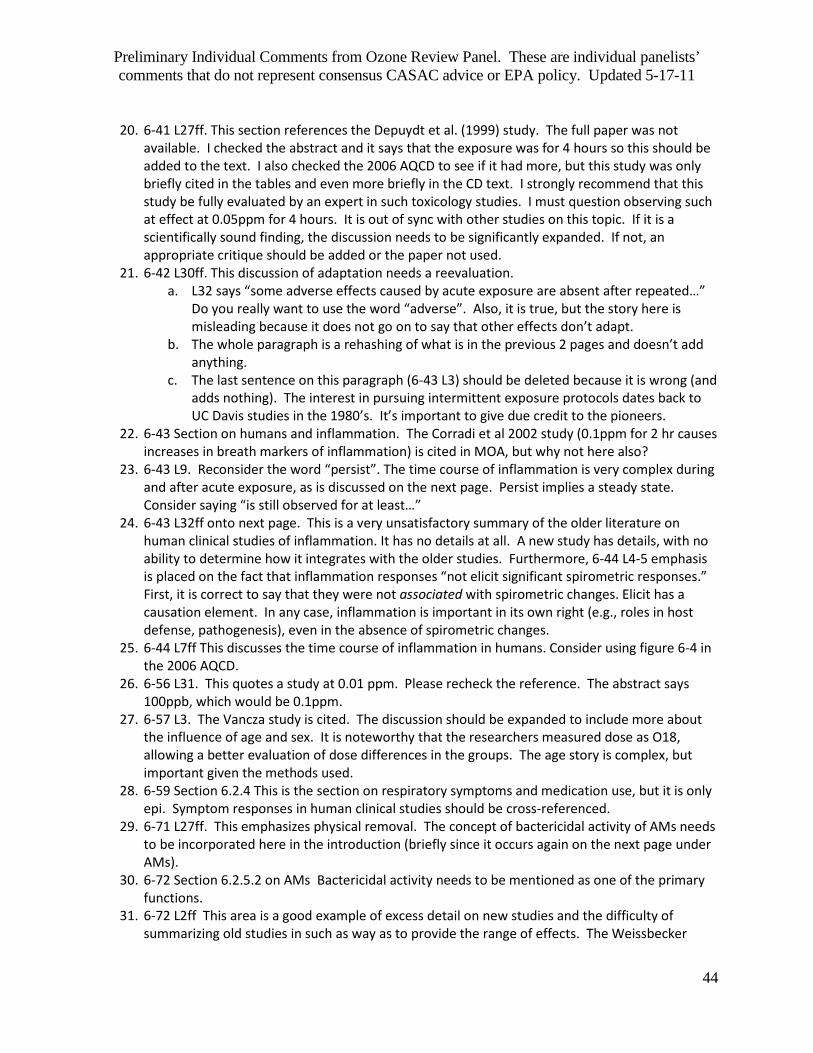
Preliminary Individual Comments from Ozone Review Panel. These are individual panelists’ comments that do not represent consensus CASAC advice or EPA policy. Updated 5-17-11
44
20. 6-41 L27ff. This section references the Depuydt et al. (1999) study. The full paper was not available. I checked the abstract and it says that the exposure was for 4 hours so this should be added to the text. I also checked the 2006 AQCD to see if it had more, but this study was only briefly cited in the tables and even more briefly in the CD text. I strongly recommend that this study be fully evaluated by an expert in such toxicology studies. I must question observing such at effect at 0.05ppm for 4 hours. It is out of sync with other studies on this topic. If it is a scientifically sound finding, the discussion needs to be significantly expanded. If not, an appropriate critique should be added or the paper not used.
21. 6-42 L30ff. This discussion of adaptation needs a reevaluation. a. L32 says “some adverse effects caused by acute exposure are absent after repeated…”
Do you really want to use the word “adverse”. Also, it is true, but the story here is misleading because it does not go on to say that other effects don’t adapt.
b. The whole paragraph is a rehashing of what is in the previous 2 pages and doesn’t add anything.
c. The last sentence on this paragraph (6-43 L3) should be deleted because it is wrong (and adds nothing). The interest in pursuing intermittent exposure protocols dates back to UC Davis studies in the 1980’s. It’s important to give due credit to the pioneers.
22. 6-43 Section on humans and inflammation. The Corradi et al 2002 study (0.1ppm for 2 hr causes increases in breath markers of inflammation) is cited in MOA, but why not here also?
23. 6-43 L9. Reconsider the word “persist”. The time course of inflammation is very complex during and after acute exposure, as is discussed on the next page. Persist implies a steady state. Consider saying “is still observed for at least…”
24. 6-43 L32ff onto next page. This is a very unsatisfactory summary of the older literature on human clinical studies of inflammation. It has no details at all. A new study has details, with no ability to determine how it integrates with the older studies. Furthermore, 6-44 L4-5 emphasis is placed on the fact that inflammation responses “not elicit significant spirometric responses.” First, it is correct to say that they were not associated with spirometric changes. Elicit has a causation element. In any case, inflammation is important in its own right (e.g., roles in host defense, pathogenesis), even in the absence of spirometric changes.
25. 6-44 L7ff This discusses the time course of inflammation in humans. Consider using figure 6-4 in the 2006 AQCD.
26. 6-56 L31. This quotes a study at 0.01 ppm. Please recheck the reference. The abstract says 100ppb, which would be 0.1ppm.
27. 6-57 L3. The Vancza study is cited. The discussion should be expanded to include more about the influence of age and sex. It is noteworthy that the researchers measured dose as O18, allowing a better evaluation of dose differences in the groups. The age story is complex, but important given the methods used.
28. 6-59 Section 6.2.4 This is the section on respiratory symptoms and medication use, but it is only epi. Symptom responses in human clinical studies should be cross-referenced.
29. 6-71 L27ff. This emphasizes physical removal. The concept of bactericidal activity of AMs needs to be incorporated here in the introduction (briefly since it occurs again on the next page under AMs).
30. 6-72 Section 6.2.5.2 on AMs Bactericidal activity needs to be mentioned as one of the primary functions.
31. 6-72 L2ff This area is a good example of excess detail on new studies and the difficulty of summarizing old studies in such as way as to provide the range of effects. The Weissbecker

Preliminary Individual Comments from Ozone Review Panel. These are individual panelists’ comments that do not represent consensus CASAC advice or EPA policy. Updated 5-17-11
45
work cited on L24 should be deleted since it was in vitro with no knowledge of comparable in vivo dose (in vivo, high concentrations are required to affect viability). This work was not cited in the previous 2 documents, perhaps for that reason. Other studies of value described in the 2006 CD (e.g., Bhalla 1996 on chemotaxis and Cohen et al, 2001 and 2002, on superoxide anion production) were not included here. The Cohen work could be correlated with the Hurst studies. The Dohm et al 2005 should be deleted since it is on marine toads and extrapolation from rats and mice is difficult enough. The Klestadt et al, 2005 should be deleted since it is an in vitro study with unknown in vivo correlations and other in vivo studies on chemotaxis could be added (e.g., Bhalla). The Mikerov et al. 2008 work should be examined further with a view towards deletion because of the high in vitro exposure of surfactant proteins. It needs to be tied in or deleted. Minimally, it should be described further. The Devlin et al 1991 should be expanded because it is in humans (and got fewer lines of discussion than the toads).
32. 6-73 L29ff. This says “A relatively large body of evidence shows that O3 increases susceptibility to bacterial infections. The text then proceeds to summarize this large body in 4 sentences, with no references, except for a “new” study at 2ppm. This is totally inappropriate. As said on 9-74 L1 (with no reference), the lowest observed effect was at 0.08ppm. This is deserving of more discussion, references (Coffin et al 1967 and Miller at al, 1978; see 1996AQCD for full reference), and a correct summary the increase in mortality is in streptococcal-induced mortality, not just mortality.
33. 6-74 L3ff. For brevity, delete the work at 2ppm; it adds nothing. 34. 6-98 L6. This says “uncorrected for FA response.” This whole issue of uncorrected needs to be
more carefully presented. For example, 6-5 L3 (Adams 2006) does not mention uncorrected, but 6-9 L20 (Adams 2006) does mention uncorrected. Also, one is tempted to ignore research without appropriate controls. However, the discussion on 6-9 L23 makes comparisons showing that the uncorrected data are likely to be more conservative. Throughout, every time uncorrected data are discussed, they should be placed in context of whether they tend towards being more or less protective conclusions.
35. 6-100 L3. It says “continuum,” which is commonly defined as some kind of progression, with A leading to B and B leading to C. However, he list of effects is not necessarily progressive. Indeed, they are all observed (in multiple studies), but some are no connected, as in lung function decrements and inflammation. Thus, delete “potential continuum” and insert “understanding” or something like it.
36. 6-101 L4 This says O3 is not transported “to extrapulmonary sites to any significant degree.” This is at odds with Chapter 5 which basically says that O3 doesn’t get beyond the epithelium and may not even get to the epithelium. Thus, this section in Chapter 6 needs to be revised to be consistent.
37. 6-101 L24. The Fakhri et al 2009 study is discussed. This discussion should be revisited. The text implies an antagonism between O3 and CAPs and does not discuss the overall HRV. The paper says: “The primary analysis, change in HRV indices between the start and end of the 2-hr exposure period, yielded no consistent differences between the exposure categories (Table 2). HF HRV showed a statistically significant increase for the CAPs-only exposure (p = 0.046) and a similar trend for O3 exposure (p = 0.051) when compared with filtered air…However, when analyzing the CAPs mass concentration relationship for exposures with O3 (i.e., CAPs + O3 and O3 alone), there was a suggestion of negative dose–response slopes (Table 3) between CAPs mass concentration and several HRV indices.” In addition, they evaluated the asthmatics in their study, but this is not mentioned in the ISA.

Preliminary Individual Comments from Ozone Review Panel. These are individual panelists’ comments that do not represent consensus CASAC advice or EPA policy. Updated 5-17-11
46
38. 6-102 Table 6-23 does not have Dockery et al 2005. Why not? In any case, the table is not helpful since it doesn’t have results.
39. 6-128 L24 This sentence refers to CVS changes in humans “at very high O3 exposures”… so caution must be used in interpreting animal studies “(Section 6.3.1)”. I couldn’t find these studies here or in the 2006 AQCD. Even without knowing what papers are being referred to, it’s fairly safe to assume that many of the animal studies were at a higher concentration than the human studies. Not knowing of these human studies, I am reluctant to agree with the conclusion offered in the text.
40. 6-128 L28. The Bloch et al dog studies are mentioned. This is an unpublished report and in not contained in HERO. I know they were careful researchers and perhaps some of the data are contained in other published reports with Trent Lewis as the senior author. Thus, something needs to be done in keeping with the goal of only using peer-reviewed studies. Perhaps the EPA report was peer-reviewed or could be given to a panel of experts for peer-review.
41. 6-129 L1. This says “high concentration O3…”, without providing the concentration. Thus, this paper is, for all practical purposes, useless. Again, a table is needed.
42. 6-133 L18 says increase HR and L19 says bradycardia. L19 and 20 say it is “uncertain if this effect is also observed in humans.” Please be more precise in the animal study statements and the comparison to humans, especially.
43. 6-134 L29ff. This paragraph summarizing the 2006 AQCD on CNS is totally insufficient. It talks about epi effects with no significant details, calling it “adverse”. The rodent studies are described in 2 sentences with no indication of what the species, O3 concentration, exposure duration, or specific endpoints were. Thus, there is no way to compare them to the new studies to better understand the weight of the evidence. The 2006 AQCD refers to studies showing effects at 0.12ppm in animals, further indicating the need for fuller presentation. This area is an excellent example of the need for tables. As additional examples, all the Tepper et al (1982. 1983, 1985) papers should be discussed because they found effects of 6-hr exposures to 0.12ppm in rats and 0.2ppm in mice on running wheel behavior. The Tepper (and a few other) behavioral references can be found in the 1996 AQCD (not in the 2006). The discussion in the 1996 document discusses a potential MOA of avoidance of irritation, etc., without direct effects on the CNS per se. Thus, this issue needs to be explored further.
44. 6-135 L32ff. This section discusses potential relationships between relevant O3 exposure of rats and Alzheimer’s. Thus, it is very important to discuss fully and precisely. This section should therefore be revisited. Why are these studies “consistent with Alzheimer’s incidence in the elderly”. Incidence is a frequency of new cases. There are still significant questions beyond this word choice.
45. 6-137 L1ff. This paragraph discusses CNS effects on offspring of rodent’s exposure during pregnancy. There is no discussion of the scientific issue of exposure, vis-à-vis windows of susceptibility. One of the studies discussed here did not indicate when the exposure was delivered. Also, the word “adverse” in used several times in this paragraph.
46. 6-137 L13 and 6-138 L12. Both places say that “levels as low as 0.3 ppm” had CNS effects in utero. The paper indicates that lower concentrations were not tested. Therefore, there is no basis for the phrasing. For example, if they had tested 0.2ppm, there might have been effects. Thus, just state the effective concentration.
47. 6-138 L15. I agree with the conclusion “suggestive of a causal relationship”. However, I am concerned about the use of “adverse” as an adjective for effects. What is adverse? Is there some reference about clinical significance of these changes in rodents that could be cited?

Preliminary Individual Comments from Ozone Review Panel. These are individual panelists’ comments that do not represent consensus CASAC advice or EPA policy. Updated 5-17-11
47
48. All the extrapulmonary sections need to be revisited for concordance of discussion of MOA regarding extrapulmonary mediators. I don’t disagree with any particular sentence. The problem is the differences in presentation throughout.
1. 6-6 L32. Adams 2006 is the reference, but there are 2, necessitating an a and b. Minor Comments for EPA’s consideration, but not needing discussion at the meeting
2. 6-8 L31 The McDonnell ref has a typo. 3. 6-12 L25 So far, this is the first time I noticed “in this well designed study…” Do you really want
to say that. What about all the others—were they not “well designed”. 4. 6-14 L34. There is nothing “pseudo” about it. 5. 6-15 L32. It says “better”, implying that the others were poor in some way. 6. 6-40 L4. The discussion of Farraj belongs under section 6.2.2.2 unless only the non-sensitized
animal are discussed here. 7. 6-40 L6-7. This last sentence should be deleted. It is true, but bears no relationship to the
preceding material. 8. 6-42 L5. This says, “Thus, recent …monkeys, guinea pigs, and mice…” However the preceding
discussion of the recent studies does not mention monkeys. 9. 6-43 L6. Insert “increased” before “epithelial” 10. 6-58 L8. This is the only place I recall seeing in which the FA concentration (0.02) was reported.
Either do it for all or none, except if it was a key factor in the study itself. 11. 6-71 L15. Just say 0.2 and higher. Saying 1.0ppm is OK if you are sure there are no studies at
higher concentrations. 12. 6-73 L6 call 90 days subchronic. 13. 6-128 L15 Consider deleting “and other photochemical oxidants” because they are not discussed
here. 14. 6-133 L27 This summary says “leading to the reported cardiovascular pathologies.” Pathologies
is a very strong word; far too strong for this database in animals. Thus change to “effects.” 15. 6-135 L30 specify that the increase in glutathione was in the brain. 16. 6-136 L24. Unless you calculated dose, change to concentration-dependent. 17. 6-138 L18 Insert “drug-induced” before sleeping time.
CHARGE QUESTION 8: Chapter 7 presents important new
findings from studies published since the 2006 O3 AQCD including studies that examine the relationship between long-term O3 exposure and new onset asthma in children, first childhood asthma hospital admissions, increased asthma severity, bronchitic symptoms and respiratory-related school absences. These studies provide evidence in this regard based on different genetic variants. What are the views of the Panel on the conclusions drawn in the draft ISA regarding the strength, consistency, coherence and plausibility of the evidence for health effects for long-term O3 exposure on respiratory morbidity? Limited new data also suggest a link between long-term O3 exposure and respiratory mortality; what weight should be placed on this evidence in causal determinations? What are the views of the Panel on the conclusions drawn in the draft ISA regarding the strength, consistency, coherence and plausibility of the evidence for neurological effects resulting from long-term O3 exposure? Are the data properly presented regarding the credibility of newly reported findings being attributable to O3 acting alone or in combination with other co-pollutants and regarding the extent that toxicological study findings lend support to the biological plausibility of reported epidemiologic associations in reaching a causal determination?
Preliminary Individual Comments from Ozone Review Panel. These are individual panelists’ comments that do not represent consensus CASAC advice or EPA policy. Updated 5-17-11
48
1. I support the causality conclusions. However, I think that an expanded discussion the animal toxicological data would offer more support to the conclusions and, more importantly, assist in interpreting severity observed in human studies. In particular, the first sentence on animal tox studies (7-14) dismisses all rodent data. This is wrong. In particular, there are a number of excellent chronic animal studies not cited or discussed too briefly that show numerous types of morphometric changes, some of which are irreversible; findings that can’t be measured in humans. Dosimetric comparisons of these rat studies to humans are possible, but not done. The discussion of interspecies homology is inadequate. The discussion on the effects of age and exposure pattern on respiratory tract morphometry is inadequate, resulting in losing whole concepts about the effects of O3. See specific comments below for details of the foregoing.
General Comments
2. The discussion of animal toxicology studies throughout is insufficient because so many key studies were omitted and some are misquoted. For example, there are at least 3 major studies of seasonal effects, but only one is referenced. There are several on age, but only 1-2 are mentioned. Thus, although I fully support the weight-of-evidence evaluation that relies on animal studies, I support it based on what I know, not on what is restricted to the references presented. More specific comments on this topic follow. Briefly, it is essential to make sure all of the key animal tox studies of the 1996 and 2006 AQCDs are included here. This can be done with significant use of tables. I included the 1996 AQCD because it has some key studies not included in the 2006 AQCD.
3. As I have mentioned under all other charge questions I addressed, the separation between old and new literature is artificial and results in a suboptimal understanding of the whole of the findings.
1. (This comment is a duplicate to that under the previous Charge question on Chapter6.) There is some confounding between Chapters 6 and 7 with regard to whether the studies were short- or long-term. For example, some 90-day studies were in both places. Prenatal exposure studies are in both places. The beginning test of each chapter should define the duration term. In some cases, duplicate discussion may be of value, but this could be part of the discussion (e.g., time trend for respiratory tract morphometric changes). The whole of the literature on neonatal exposures should be in one chapter of the other.
Specific Comments
2. 7-14 L14ff. This first paragraph is the introduction to the section of animal tox studies of structure and function. The first few sentences generally dismiss animal studies. Indeed, quantitative extrapolation is difficult, but qualitative extrapolation is generally accepted if the database is strong enough. As a superficial general statement, subchronic and chronic studies (<0.5ppm) from several laboratories of several species of mice, rats, and non-human primates have shown similar morphometric changes, many of which would be considered “adverse”, at least for that population studied. Given the similarities among all these species and their similarities to humans, it is very likely that these same effects could occur in humans, if exposure was sufficient. Homology is strong. Quantitative extrapolation requires understanding of both interspecies dose and sensitivity (e.g., repair mechanisms). Dosimetric extrapolation for rats is advanced and could be developed for some of the key studies .
a. Thus, the first sentence is incorrect when it says that “considerable controversy surrounds the extrapolation of data generated by rodent toxicology studies…” This implies the studies are of no value. I don’t know of any “controversy” among

Preliminary Individual Comments from Ozone Review Panel. These are individual panelists’ comments that do not represent consensus CASAC advice or EPA policy. Updated 5-17-11
49
knowledgeable people (even with different points of view) about the concepts of homology. Most informed people acknowledge the uncertainties involved in quantitative extrapolation. So even the word “controversy” is wrong. It would be accurate to discuss the issues of certainties AND uncertainties in both qualitative AND quantitative extrapolation.
3. 7-15 L23 Add “where dosimetric models indicate the dose is higher” to the end of the sentence. This is important because it adds evidence of the accuracy and value of dosimetry models.
4. (NOTE: this comment could be made for virtually all of the sections including animal toxicology descriptions ) 7-14 ff. Many key studies are not cited in this section; and according to HERO, they were not even on the list of considered but not used. I only cross-checked a few. There probably are many more. The easiest way to check is to compare this ISA text to the 2006 and 1996 AQCD. Unfortunately, the ones I identified are also missing from the 2006 AQCD. It is NOT necessary to include each and every paper. It is necessary to include papers that demonstrate key concepts of interest or suggested in humans (e.g., age, seasonal exposures, daily patterns of exposure, irreversible effects, correlated endpoints, and fibrotic changes). The few I identified to explain my point are (see 1996 AQCD for full citations):
a. Chang et al (1991, 1992)rats; simulated urban pattern of a base of 0.06 O3, on which was superimposed a spike rising to 0.25; 78 wk exposure, with periodic exams and post-exposure evaluation to assess recovery; advanced morphometric methods. Shows complex pattern of time course of effects during and after exposure ceases.
b. Barry et al (1985) rats; 0.12ppm for 6 wk; Compared morphometry of 1-day old and 6 wk old (at start of study). Some age effects.
c. Pinkerton et al (1995) rats 0.12ppm, 20 mo. Epithelial and interstitial effects d. Tyler et al (1991) rats; 0.25ppm; “continuous” and “seasonal” exposure regimens over
18 mo showing impacts of on-off exposure regimens, approximating the real world of winter-summer sequence. In some cases, patterns equal (even with lesser “dose”); in other cases, seasonal had different effects.
5. L23 ff. The Plopper studies of adult and infant non-human primates are described well and are extremely important. Therefore, it would be of great value to add additional references from different studies (in rats and non-human primates) that support many of the findings. These supportive studies are provided in the 1996 and 2006 AQCDs. This could be done briefly, with reference to tables that will be added.
6. 7-17 L7-26. This whole paragraph describes acute studies (on the order of hours), although this is a long-term exposure chapter. These studies are already in Ch 6. The goal of this paragraph was apparently to provide references to rodent studies of age to buttress the Plopper studies. This could be done better by citing the several subchronic and chronic rat studies that are not included here (see my comment earlier with references).
7. 7-17 L27ff This is a summary paragraph. I fully agree with the first sentence. However, I am concerned about the claim on L30 that the functional and structural changes are “due to persistent inflammation.” Some animal studies show a time-course shift away from acute inflammation and more towards interstitial changes (including increases in fibroblasts). Any statement of “due to” is complex and dependent on an evaluation of multiple studies, most of which are not even described here. The implications of the next sentence (L31) are true, but not strictly correct because it refers to “these findings”, referring to references of one excellent set of studies. If the reference were expanded as recommended above, the sentence would be correct.

Preliminary Individual Comments from Ozone Review Panel. These are individual panelists’ comments that do not represent consensus CASAC advice or EPA policy. Updated 5-17-11
50
8. 7-19 L6. The phrase “protective adaptation” was used. The interpretation is that longer-term seasonal exposures have no effect. The Carey study referenced had effects in both the acute and seasonal group, so there were still effects of concern. This area goes on to quote the Harkema study (L7) to 0.3ppm. I used the link to read the paper and the paper was at 0.15ppm for 6 or 90 days (8h/day). The Harkema study showed effects at 6 days, but not 90 days. There are all sorts of exposure duration/pattern studies not cited here, so care must be exercised in only citing 2. Furthermore, the adjective “protective” needs to either be deleted or justified.
9. 7-19 L8-10 The Schmelzer study is on BAL, whereas the paragraph is on nasal effects. 10. 7-20 L30ff. This is the summary and causal determination section for respiratory effects. The
summary of toxicological evidence is quite insufficient, probably because the base offered in the text is weak (as opposed to the database, which is strong). In addition, the summary should be fully integrated, rather than separating the old and the new for just these 2+pages.
11. 7-25 L1. Briefly explain ApoE mice (i.e., model of atherosclerotic lesions) and the strengths and limitations of this animal model.
12. 7-26 L26-27 This causality statement refers to “relevant” exposures. What is “relevant”. Also other causality statements don’t have such an adjective. Therefore, delete it to avoid confusion.
13. 7-27 L37. This says that the studies didn’t identify specific pollutants and their concentrations. Thus, why include them if there is no way to track to O3? Consider deleting them.
14. 7-28 L1ff Studies of sperm counts and related indices are very difficult methodologically. However, there is no discussion about the quality of the studies. Please add a discussion.
15. 7-29 L8 This says “…O3 was no longer significantly associated with IVF failure.” OK. However the next sentence says that O3 had effects. This sentence therefore needs to be deleted or the study results challenged.
16. 7-29 L21 This animal study on spermatogenesis should be moved over to the section on sperm (p 7-27 7.4.1).
17. 7-34 L6. I did not read the entire epi section. When I look at this summary of studies that are characterized as inconsistence, I fail to see evidence for the hypotheses of effects. First, there may be no consistent effects. Where is the evidence for “decreased in utero oxygen supply, …changes in blood viscosity…” etc.?
18. 7-44 L23 ff. This was an interaction study with 1ppm O3 (intermittent for 1 month) and 0.48 mg particulate matter delivered intratracheally, repeatedly. The unrealistic nature of this exposure regimen needs to be discussed and taken into account in the interpretation.
19. 7-54 L32ff This section summarizes the NTP O3 cancer study in mice and rats. Although the overall summary(L36) for mice is correct, the details provided above are not. There were differences between the “lifetime”-exposed and the 2 yr-exposed mice that are not discussed. The same NTP study had rats (7-56, L3) but only Boorman et al is cited (this is correct, just add the NTP reference). Because this is the most complete and rigorous study on the topic, it should be discussed in more detail. The easiest approach would be to add the information to a table (see the text and tables in the 1996 AQCD).
20. 7-56 L32ff. This discusses the Kim and Cho studies and says that a 10% incidence of oviductal carcinoma was observed at one point in time. The text raises questions about this. Since these investigator used the same mouse strain as the NTP study, add a reference to the NTP study which found no statistically significant increase in tumors at any site other than the lung.
Minor Comments for EPA’s consideration, but not needing discussion at the meeting
Preliminary Individual Comments from Ozone Review Panel. These are individual panelists’ comments that do not represent consensus CASAC advice or EPA policy. Updated 5-17-11
51
1. This chapter needs editorial “clean-up”. Specifically, sometimes the text has a couple of sentences describing a study, but doesn’t give the ref and exposure information until the end.
2. 7-20 L9 Insert “macrophage” after “alveolar”. 3. 7-27 L5 Please clarify. For example, why “indirect effects on the mother’s health”. What about
direct effects on the pregnant or lactating woman’s health that result in indirect effects on the fetus/infant.
4. 7-29 L25. This summary statement needs to be its own paragraph. Furthermore, The phrase “low doses” should be removed since they were concentrations, not doses, and what is “low”. Since the studies showing effects were at 0.8 and 1ppm, “low” is not appropriate.
5. 7-44 L31. The Plopper studies should stay in the other sections where they were discussed (e.g., 7.2.3). This section is on birth defects and deals with prenatal exposure, which was not included in the Plopper studies.
CHARGE QUESTION 9: Chapter 8 is a discussion of potential susceptibility factors. Are the characteristics included within the broad susceptibility categories appropriate and consistent with the definitions used? Are there any key susceptibility factors that were not included and need to be added?
1. The definition of susceptibility (8-1) is very good. It includes susceptibilities related to the magnitude/duration of exposure and health/genetic factors. However, the text that follows does not seriously include the exposure side (see specific comments section below). A specific exposure and dose subsection should be developed.
General Comments
2. This chapter is extremely important because the “average,” “healthy,” “sedentary” person is not at significant risk from “typical” ambient exposures. In contrast, susceptible subpopulations are of significant concern. Therefore, having a clear description of the following for each susceptibility “group” is crucial to interpretation of risk (note: in some cases this information is provided):
a. What is the prevalence of this group in the general population (this is especially important for the genetic polymorphisms; and for different exercise levels). Consider a table for this.
b. What is the nature and severity of the risk. For example, where is the discussion that even if COPD patients are not more affected in terms of % reduction in FEV1, what is the impact of their having less reserves to cope with this “similar” change in FEV1. What is the number of hospital admissions for asthmatic children? What does a 5, 10, 20 % change in FEV1 in health exercising young people mean to their well-being?
c. What is the concordance of human clinical, epi, and animal tox data for this group? d. Does this group have characteristics that result in greater exposure and/or dose?
3. This chapter does not (and should not) repeat all the studies on susceptibles contained in earlier chapters. However, the rationale for those chosen for expanded discussion here are not clear. A more concerted effort is needed to identify the definitive papers for each susceptibility class and then proceed to describe them, with a very brief cross walk to the larger body of information within the other chapters (hopefully contained within tables in the revised ISA).
4. I’m not clear about the criteria used for the discussion, vis-à-vis old and new. I strongly recommend that the full story (not essential to have all the refs, as per my comments above) be provided for each susceptibility group, independent of date of publication. For example

Preliminary Individual Comments from Ozone Review Panel. These are individual panelists’ comments that do not represent consensus CASAC advice or EPA policy. Updated 5-17-11
52
a. 8-6, L15-16 says “Recent epidemiological…” Is there old epi evidence on this point? What’s the story?
b. 8-6 L22 says “no recent evidence…controlled human…or toxicological studies.” It then goes on to discuss recent epi. What about supporting old evidence? What’s the story?
c. 8-7 L27 is about lifestage and overemphasizes new studies. What’s the story?
1. 8-3 L1ff. Please add a cross-reference to animal infectivity studies. Specific Comments
2. 8-3 L12. This says that asthmatics had no increased susceptibility. 3. 8-8 L31. This says comparable O3 doses. Please define dose. 4. 8-8 L38ff. This refers to dosimetry modeling by age. It should not be buried. 5. 8-23 L30ff. This summary identifies populations “that are most susceptible…” . However, it
includes older age groups and doesn’t talk about younger age groups. Also, why aren’t those with higher exposure identified as a group?
6. 8-24 L13ff. This talks about “individuals involved in outdoor activities…in a recent study…no effect modification was observed.” The next line summarizes old studies that disagree. So, what was the weight of the evidence. What study—what is meant by “effect modification?”
1. 8-10 L 4This talks about senescent rats, but the section on older adults is below it. Minor Comments for EPA’s consideration, but not needing discussion at the meeting
2. 8-18 L20. This says “at more relevant doses”. What were the irrelevant doses and if they are irrelevant, why are they even included?
Preliminary Individual Comments from Ozone Review Panel. These are individual panelists’ comments that do not represent consensus CASAC advice or EPA policy. Updated 5-17-11
53
Dr. David Grantz
Charge Question #10; re: Chapter 9 (effects of ozone on vegetation and ecosystems)
Note: Locations in the text are referenced as [chapter-page/line].
Are major effects of O3 exposure on vegetation/ecosystems identified and characterized?
The ISA does a nice job of recognizing the key effects of ozone on vegetation at all scales. An important point is made repeatedly, that new evidence obtained in chamberless exposure systems supports the broad range of conclusions derived from earlier Open Top Chamber experiments. It is therefore appropriate to pursue the analyses of ASPEN and SOY FACE experiments in the context of the NCLAN- and NHEERL-derived C-R relationships for crops and trees. The NCLAN studies imposed mostly chronic and relevant exposures, contrary to the implication in the text (2-55/22-23). It may be preferable to conclude (9-56/25) that the new data “…lie within the range predicted by the meta-analysis…”, rather than that they “…support the meta-analysis…”. This overall conclusion appears to be contradicted at 9-56/20-21, where alternative wording might be, “…enclosed fumigation systems or growth chambers. This did not appear to alter the sensitivity as previously suggested for OTC exposures (e.g. McLeod and Long, 1999…”. For clarity, the various references to this alignment of FACE and OTC data could be brought together in section 9.3.1 (9-18/19). For greater accuracy, it should be noted that for some crop species, the NCLAN relationships are probably conservative, since current varieties in many cases are more ozone-tolerant than those in production during NCLAN. There is a tendency to equate alteration of complex physiological systems with direct effects. Following from this is a tendency throughout the chapter to equate differences in the sensitivity of various responses to mechanisms of resistance, as for the cutleaf coneflower (9-46/2), symptomatic and asymptomatic leaves (9-40/28), and gene expression (9-31 to 9-32). These responses are more appropriately interpreted as symptoms of overall sensitivity, reflecting lack of upstream defense. This is correctly evaluated for sapling beech trees (9-32/25-28), in which greater genetic response is considered to indicate greater sensitivity, rather than the reverse. In Arabidopsis (9-32/8-10) greater transcriptional response is stated to indicate only that upstream defenses (leaf boundary layer, stomatal response, canopy structure, cuticle morphology, metabolic??) are weaker in the WS than Col-0 genotype.
To what extent do the discussions and integration of evidence across scales (e.g., species, communities and ecosystems) correctly represent and clearly communicate the state of the science?
The chapter does a thorough job of integrating effects across scales. However, in many cases the division of the discussion among the various sections dilutes the arguments. The authors may want to consider consolidating the discussion into fewer, but more vertically integrated, sections, with less repetition.

Preliminary Individual Comments from Ozone Review Panel. These are individual panelists’ comments that do not represent consensus CASAC advice or EPA policy. Updated 5-17-11
54
Reproductive effects and yield The knowledge gap in yield suppression (9-11/19) is exactly the same one that remains in reproductive effects (in those species in which economic yield is a reproductive part). The text at 2-53/24-27 does not actually address whether these are direct or indirect effects on reproduction; and it may not be important for purposes of this chapter to resolve this. Stresses of all types alter reproductive behavior in annual, perennial, determinate, and indeterminate species. If the reproductive effects are caused by source-sink perturbations caused by ozone impacts on vegetative tissues, then they are not really distinct reproductive effects. The data at 9-50/7 indicate effects on vegetative productivity and indirectly on reproductive development, and only then on yield. The Black et al. papers (9-19/18-22) are not definitive in this regard, demonstrating compensatory responses, but not necessarily direct effects on reproductive structures. In these studies, ozone effects on the exposed stalk (9-50/11-18) might be direct or might reflect reduced local photosynthesis and source strength. Effects on the second, unexposed stalk may reflect a source-sink disruption, or phytohormone signaling of sink load, rather than a stress specific signal. It is not clear (9-55/22), that reproductive organs are particularly sensitive. Effects on pollen tube growth are more definitive evidence of direct reproductive effects. Carbon and water The stomatal and gas exchange discussions in Chapter 2 could be consolidated (2-52/1-9, 2-54/26-37). Water cycling represents scaling of stomatal conductance and section 2.7.3.2 could be combined with the earlier discussion of stomata and gas exchange. The watershed data strongly support the earlier arguments about loss of stomatal control, and contrast directly with the typically observed stomatal closure caused by ozone. These arguments would have greater impact if made in one place. Similarly in Chapter 9, various sections (9-40-41; 9-75/16-39) might be combined with the discussion of gas exchange, water use efficiency, stomatal control, etc. The scale of observation is less important here than the integrated ozone impact on leaf area, leaf conductance, and photosynthetic capacity. These interact in complex ways that are not captured in the discussion. At 9-75/34, an increase in stem hydraulic conductance is possible, but unlikely, and no mechanism is suggested. Unchanged hydraulic conductance referenced to reduced leaf area, and a possible increase in the water potential gradient due to increased solar exposure, turbulence, and stomatal conductance of the remaining leaves may be more accurate. The invocation of water use efficiency at 9-75/29, is probably appropriate due to the changes in stomatal and photosynthetic properties detailed above, but may require greater explanation. The reference to McLaughlin et al. 2007 (9-45/31) would inform the arguments regarding stomatal control, though the measurements were indirect (sap flow and stem diameter) and the ozone effect was derived from a multiple regression. Changes were likely driven by altered stomatal regulation, and did correlate with independent stream flow data. Loss of stomatal control is also suggested by Gregg et al. as a cause of reduced growth in rural versus urban trees. The Gregg et al. data (9-22/25; 9-23/36) demonstrate an ozone response through comparison of OTC and rural/urban exposure gradient data (9-41/23; 9-45/31), but do not demonstrate parallel physiological responses in the OTC and gradient studies, contrary to the text (9-23/37). In the field, stomatal conductance was measured on young leaves, while only in the OTCs were responsive older leaves measured. In

Preliminary Individual Comments from Ozone Review Panel. These are individual panelists’ comments that do not represent consensus CASAC advice or EPA policy. Updated 5-17-11
55
any case, the Gregg et al. data are more difficult to interpret than their frequent reference in the text implies. The rural trees (with putative loss of stomatal control), exhibited greater rates of photosynthesis, but lower biomass, than urban trees, and the ozone impact was much greater than expected from previous experiments. The controversy over whether direct ozone impacts on photosynthesis affect stomatal conductance or vice versa, continues, and is important. This could be clarified (2-52/1-9). The mode of action of ozone impacts on photosynthesis (2-54/27-28) is not well known, and only effects (not mechanisms) are documented in section 9.4. In general modest stomatal closure will only reduce photosynthetic rate significantly (by reducing intercellular CO2) in C3 plants, yet ozone reduces photosynthesis in C4 plants, too. The arguments at 9-45/26 do not demonstrate direct effects on stomatal guard cells. Wang et al. specifically state that both stomatal and non-stomatal impacts were involved. Kitao et al. show mainly stomatal effects, but state that in shade leaves, both are involved. A stomatal limitation of photosynthesis may be demonstrated by showing reduced intercellular CO2, but only if photosynthesis is unchanged, which is unlikely in a C3 plant with declining intercellular CO2. Photosynthesis and stomatal conductance can decline together, with no change in intercellular CO2. It is often hard to tell from these measurements which effect is primary. The definitive test is derived from a photosynthesis vs. intercellular CO2 response curve. The data of Paoletti and Grulke 2010 (9-46/2) show that stomatal properties may predispose snap beans to ozone sensitivity. However, the tolerant snap bean altered its stomatal response kinetics in response to ozone to become more sluggish than the sensitive line, which weakens the argument for the importance of this parameter. This paper does not deal with cutleaf coneflower, as implied in the text. The coneflower experiments (Grulke et al., 2007 (9-46/2)) do not demonstrate protective stomatal properties, since the plants were already exposed to ozone prior to measurement. The stomatal differences may have been symptoms rather than mechanisms of ozone sensitivity in the co-occurring but genetically contrasting individuals. The conventional wisdom is cited (9-83/9-10) that fast growing, high stomatal conductance species are most sensitive, but this contrasts with a previous conclusion (9-49/18), that slow growing species exhibited greater ozone sensitivity (of the allometric coefficient). It is clear that ozone reduces translocation of sugar and growth of distant sinks such as roots. At 9-49/12-26, this is obscured by leading with reference to the conflicting literature. The variability is real, but should be placed in context by reference to the summaries provided by Andersen 2003, Grantz et al. 2006, and Wittig et al. 2009. Elevated CO2 has been shown experimentally to offset ozone effects, and vice versa. The text (9-13/15) implies that only model evidence suggests this. A possible additional reference could be cited (9-41/25-33), Volin et al., 1998, New Phytologist 138: 315 – 325. Dose modeling The use of exposure at 9-102, where flux is really under discussion, contrasts with the careful distinction made at 9-92/19-20 between flux and exposure. In the modeling secenario (9-92/19-32), temperature, humidity and soil water are required to model, not measure, stomatal conductance. Thus there is no requirement to measure intercellular ozone concentration. In any case, Laisk et al.,

Preliminary Individual Comments from Ozone Review Panel. These are individual panelists’ comments that do not represent consensus CASAC advice or EPA policy. Updated 5-17-11
56
1989 (Plant Physiol. 90: 1163-1167) demonstrated that this concentration is near zero. A major limitation to modeling ozone dose is the relationship between stomatal conductance and poorly characterized environmental parameters. The major limitation to modeling impact from dose is poorly characterized temporal and spatial variability in sensitivity to ozone. Both depend on diurnal characterization of ozone concentrations. At high elevation and rural sites the diurnal profile of ozone concentration is relatively flat or may peak at unexpected hours. This leads to alternate modes of stomatal uptake, associated with nocturnal opening and with predawn opening (a putative blue light response). This could be further detailed here. Semi-direct effects of ozone on reproduction (9-95/1-25) might also inform the relationship between fluxes and impacts and the flux (Level II) approaches (9-98/7). Phenology, time of day, and seasonality are key and currently poorly characterized determinants of impact. The peak in stomatal conductance in mid-morning is usually associated with lower VPD than in the afternoon in high VPD environments, or with soil drought. Otherwise conductance may be bell shaped over the day. The Panek 2004 study was in a summer-drought, western coniferous forest. The Grulke et al. 2002 study indicates the importance of microhabitat. However, the next sentence, “The decoupling of conductance and higher ambient ozone concentration… mesic… xeric..” refers to the early arguments for a flux approach, but does not seem to follow from the references and reasoning presented here. It is clear that stomata provide the principal pathway for ozone to enter and impact plants. There are better references for this (9-109/22), Fuentes et al. 1992, Agricultural and Forest Meteorology, 62, 1-18; Massman and Grantz, 1995; Leuning et al. 1979, Atmospheric Environment, 13, 1155-1163; Reich 1987, Tree Physiology, 3, 63-91; Wesely et al. 1978, Boundary-Layer Meteorology, 15, 361-373; Wesely et al. 1982, Atmospheric Environment, 16: 815-820, might be considered. The discussion at 9-110/10-17 is confusing and not wholly correct. Arguments regarding a consistent measurement height are confused with arguments regarding the ozone concentration to which stomata are exposed. There is an ozone gradient in trees and also in crop plants from this reference height to the ground (including through the understory vegetation in a forest). Different leaves are in contact with different ozone concentrations. The question (line 14) regarding uncoupling of stomatal conductance and high ozone periods is not relevant here. The text requires careful revision.
Has the ISA adequately characterized the available information on the relationship between O3 exposure and effects on individual plants and ecosystems?
In Chapter 1, much is made of the concept of “adverse” responses. Yet, in many locations in the ISA there are references to “alterations” without stating in what direction, or even if they might be deleterious. The summaries in Chapter 2 and section 9.2 rarely identify the direction of change, and as a result do not adequately summarize the subsequent discussion. The discussion of SOD and POD in sensitive and tolerant tobacco genotypes (9-39/30 – 33), states only that measurements were made, with no consideration of whether changes in any direction were observed. An interesting exception which should be emphasized for its novelty (9-30/19-20), is the

Preliminary Individual Comments from Ozone Review Panel. These are individual panelists’ comments that do not represent consensus CASAC advice or EPA policy. Updated 5-17-11
57
demonstration that both up and down regulation of SIPK (salicylic acid induced protein kinase) increases tobacco sensitivity to ozone (i.e. a deleterious alteration no matter which way it changes). Signalling pathways and antioxidants The ISA appropriately concludes (2-50/9) that ozone is perceived in many ways by plants and cells. Ozone and its reaction products interact with ROS metabolism at several potential places. However, the further conclusion (2-50/5-6; 9-24/9) that ozone is “sensed” by specific “apoplastic receptor proteins” which “still remain(s) elusive” is unwarranted at this time. While the initial site of attack by ozone remains unknown, it appears certain to be in the apoplast, which can be stated with greater certainty (9–37/6). It appears that there is no “sensor” in any conventional sense. The concept of Foyer and Noctor (2005) that oxidative stress is a misnomer and that ozone is just part of the normal oxidative metabolism of plants, is quantitatively false. Plants in high ozone environments do not perform well, indicating that this is outside the normal range of signaling metabolism. The concept was a metaphor for understanding (much as suggested by Sandermann earlier) that ozone plays into existing signaling pathways that evolved as biotic defense mechanisms. The oxidative burst is widely recognized to be component of plant defense against pathogens, calling for greater certainty than “thought to be” (9-38/1-8). Consequences of the signaling pathways seem to lead to the most damage, rather than the raw oxidative potential of ozone. The ISA appropriately reverts to a paradigm associated with oxidative stress and interaction with these pathways at 9-29/27-31. The concept of an ozone sensor is premature and potentially wrong. 2-50/34, the role of JA (jasmonates) is more complex than suggested. JA does not just antagonize ET and SA, it has impacts on abscission, directly on growth and allocation, and other effects that are not well understood. A reference for the role of ABA in anatagonizing JA (9-7/2) would be helpful here (possibly Ludwikow and Sadowski, 2008, currently referenced at 9-34). Changes in gene expression, particularly at single loci, do not necessarily indicate much about response at the plant scale. Proteome results support some genetic changes but not others (9-6/30-32). For example (9-5/12-15) it is not clear that these changes scale to responses at plant or community level, due to compensatory changes and to genotypic changes that have little phenotypic expression, due to gene redundancy or other mechanisms (9-25/11-13). There is no experimental evidence (9-40/8-12) that plants cannot maintain elevated antioxidant levels. Theoretical energy costs may argue against it, but there is little evidence that maintaining carbon in these pools is limiting. It may be that other, more stable, protective systems arise over time. The strength of the oxidized glutathione transport system across the plasma membrane is a key component of the regeneration of reduced glutathione. Therefore the fraction present in the apoplast and its redox status are only partially responsible for the strength of the ascorbate defense system. The functional limitation of the ascorbate pool is not sufficiently described (9-38/24-25) to allow a conclusion whether, or not, other antioxidants may be involved.
Subject areas that should be added, expanded upon, shortened or removed
Preliminary Individual Comments from Ozone Review Panel. These are individual panelists’ comments that do not represent consensus CASAC advice or EPA policy. Updated 5-17-11
58
The consideration of ozone impacts on stomatal conductance and it ramifications at various scales could be condensed and consolidated, for brevity and clarity. While it is clear that Ca++ and MAPKs and many other components are involved in ozone responses (9-30/3-16), it is not clear that the entire signaling framework must be described in this chapter. It may be sufficient to note how ozone enters these existing pathways and the havoc that these pre-programmed responses can cause, quite apart from the oxidizing potential of ozone, itself. This establishes plausibility, without getting tangled up in interacting pathways that remain very poorly characterized. The coverage of effects on mammals due to changes in vegetation is rather brief. There may be digestibility studies, if not actual feeding studies, related to dairy or beef production. There are ongoing feeding studies on rabbits, but these are not yet published. Similarly, the coverage of effects on insect herbivory is rather brief. An older paper of relevance here (9-87/12-23), is Summers et al., 1994, J. Agric. Entomol. 11: 181-187, showing increased aphid growth at elevated ozone.
Specific comments:
Chapter 2 could use a brief Executive Summary, or the chapter itself could be condensed into such a summary. The redundancy (minus the references) with later chapters is substantial. At 2-51/23-27, and in section 9.4.5.2, it is important to differentiate root from shoot respiration. The mechanisms and consequences are likely to differ. 2-53/14, perhaps “pasture” would be a better word than “hayfields”. Stomatal conductance is not a rate (9-17/8). Transpiration is a flux with a rate. 9-13/28, insert “transpirational” to modify “water” at end of line, as this was the only aspect of ecosystem water loss that (apparently) did increase. In Figure 9-1, “water production” could be replaced with a more appropriate descriptor, perhaps runoff, stream flow, or watershed yield. Fig. 9-34, the line labeled “control” is defined as “ROS control measurements”, which is unclear. The alleged methodological problems of Perry et al. 2007 should be consolidated at first mention, and deleted from the subsequent two locations. The protocol at 9-35/37 was “eXogenous” rather than eNDogenous application of MeJA. At 9-49/32, seed quality should probably be a 5th category, distinct from yield. 9-55/32, it is incorrect to characterize 79.9 ppb as ambient in the study of Grantz and Shrestha (2006). The study imposed a diurnal profile similar to a maximal daily exposure, but did so on a daily basis. This treatment is considerably in excess of ambient exposure.

Preliminary Individual Comments from Ozone Review Panel. These are individual panelists’ comments that do not represent consensus CASAC advice or EPA policy. Updated 5-17-11
59
9-58/37, typographical error, probably should read “…84% of the variability in the relative feed value…” 9-64/25-26, it is unclear what is meant by “ozone enhances negative effects of ozone”. 9-84/25, over-representation of vegetation (128%) is not intuitively obvious, greater explanation would be helpful. 9-89/9-11, it is unclear how an over-temperature represents a hypothermic response. This needs to be clarified, or a typographical error corrected. The Grulke et al. 2007 references should be a or b, since there are two such references.

Preliminary Individual Comments from Ozone Review Panel. These are individual panelists’ comments that do not represent consensus CASAC advice or EPA policy. Updated 5-17-11
60
Dr. Jack Harkema Ozone and Related Photochemical Oxidants ISA (March 2011 Draft) Chapter 5: Dosimetry and Mode of Action Harkema’s Responses to Questions: Q. Is the review of basic dosimetric principles of O3 uptake presented accurately and in sufficient detail? A. Yes. Q. What are the views of the Panel on the approach taken in Chapter 5 to characterize modes of action for O3-related effects? A. I think this is a good approach/addition. I think some brief text describing how Figure 5-6 was derived would be helpful (e.g., why some things were included and others not)? Figure 5-6 does not include GAPs in Knowledge as identified in 5.2.11 (e.g., MOA for systemic effects?) See comments below. General Comments: In general, the overall format for this chapter is appropriate and the text is clearly written. The author(s) have thoroughly reviewed the recent literature and have included the most pertinent recent studies. The chapter, however, could be improved by:
• More emphasis on recent studies (2006-2010) • More concise description of past studies with more summarization of overall conclusions from
the previous ISA • Specific descriptions of the important results of key studies before 2006 could be placed in an
appendix and referenced in the shortened main text • Description of the GAPs in knowledge should be expanded and other areas identified (e.g.,
effects of ozone:1) on other extrapulmonary organs such as the liver, gut, and gonads; 2) in the context of multipollutant exposures; 3) effects of ozone on facets of the metabolic syndrome including obesity, diabetes, and hypertension)
• Inclusion of the effects of ozone on other important preexisting conditions such as obesity and facets of the metabolic system could be highlighted (e.g., studies by Shore SA et al.)
• More co-referencing of other ISA chapters • Addition of past and recent results for other photochemical oxidants where appropriate
Specific comments/questions: Author(s) need to be careful in their wording of ozone’s promotion of allergic airway disease (avoiding the term “causing asthma” when it is not appropriate). Does ozone really interact directly with cell membranes of some cells in vivo (e.g., macrophages) as alluded to in some parts of the text? Or is the interaction predominantly secondary reactive by products? References should be provided.

Preliminary Individual Comments from Ozone Review Panel. These are individual panelists’ comments that do not represent consensus CASAC advice or EPA policy. Updated 5-17-11
61
Dr. Daniel Jacob 1. Chapter 3 of ISA, Atmospheric Chemistry and Ambient Concentrations (Charge Question 4)
I found chapter 3 of the ISA to be overall very well informed and up to its task. Specific comments are below. The most important comments relate to determination of the PRB and trends in background ozone. These are indicated by asterisks. 3-6, line 20: stratospheric intrusions are not a significant source of NOx. 3-6, lines 20-34: Smith and Mueller (ACP 2010) should be cited for a recent perspective on natural NOx emissions in the US. 3-6, lines 20-34: it should be acknowledged that natural NOx emissions are most important in summer when ozone is of most concern. 3-7, line 33: 26% must be a typo, it’s inconsistent with figure 3-2. 3-8, lines 1-12: Kopacz et al. (ACP 2010) should be cited for the apparent bias in NEI05 CO emissions having a large seasonality, possibly reflecting cold start emissions in winter. 3-8, line 14: I’m surprised that natural CO emissions could be that high. Or does it include oxidation of biogenic VOCs? 3-8, line 33: CFCs would be VOCs by this definition. The proper definition of VOCs is precisely what the acronym says it is – gaseous organic molecules. 3-14, lines 1-2: Wise and Comrie (AE 2005) actually show a strong positive correlation of ozone with temperature in the SW US. 3-14, lines 25-29: the description of low-NOx and high-NOx regimes is not precise. At very low NOx (cf. zero NOx), VOC oxidation is in fact a sink for radicals (through peroxide formation). “Free radicals” is presumably meant to describe HOx, but NOx species are also radicals. Ozone production is limited by the supply of HOx radicals in both the low-NOx and high-NOx regimes. 3-15, line 22: OPE depends on many other factors including solar radiation, VOCs, and ozone: cf. Hirsch et al., JGR 1996. 3-16, lines 1-10: should cite satellite work on using HCHO/NO2 column ratios from GOME and OMI to diagnose NOx-limited and NOx-saturated regimes. See Martin et al., GRL 2004 and Duncan et al., AE 2010. *3-27, lines 12 and 37: it is essential to discourage the notion that PRB could be measured. On line 12, “PRB conditions” should be changed to “PRB-relevant conditions”. On line 37, TH cannot be applied to “PRB conditions” if only because of US anthropogenic contribution to the northern

Preliminary Individual Comments from Ozone Review Panel. These are individual panelists’ comments that do not represent consensus CASAC advice or EPA policy. Updated 5-17-11
62
mid-latitudes background ozone. On the flip side, it is important to recognize the importance of measurements at background sites to test model PRB values. These measurements present challenges to the PRB models in terms of reproducing high observed values and correlations. In particular, Parrish et al. ACP 2010 should be cited for suggesting that surface ozone in the Sacramento Valley could have an unexpectedly large background concentration based on correlations with ozonesonde data at Trinidad Head. *3-27, line 12 and beyond: The importance of measurements at background sites for testing PRB models must be stressed, at the same time one must also stress that these sites are in general not representative of the US. Ozone concentrations measured at Trinidad Head are representative of…Trinidad Head. *3-29, line 3, and elsewhere: use the + sign when indicating a positive trend. 3-36, line 9: I don’t understand, “too high by only 5 and 3 ppb”. *3-37, lines 20-27: these statistics illustrate that models have a difficult time capturing the high extremes of the ozone distribution and this would have implications for PRB estimates, for example with regard to stratospheric intrusions at mountain sites or fire plumes. Some different strategy or screening would be needed for such exceptional events. 3-50, lines 11-30: the limitations of satellite observations with regard to vertical resolution should be stated. *3-93, lines 1 and beyond: the increasing trends of ozone over the US west coast need to be mentioned here (they were mentioned earlier in the chapter in the PRB context). I have heard talks from EPA scientists about rising ozone in national parks in the west, although I don’t know of a peer-reviewed publication. if these trends are robust they should definitely be mentioned. Such rising trends would be of particular concern in meeting a tighter NAAQS. 2. Chapter 10 of ISA, The Role of TroposphericOzone in Climate Change and UV-B Effects
(charge question 11)
This chapter is definitely useful in view of recent interest in chemistry-climate interactions and in combining air quality and climate goals for environmental policy. Overall I found it to be very well informed. I think that it should give more play to the recent RCP scenarios of IPCC AR5, since these scenarios will provide the core of future assessments of climate forcing for emissions relevant to air quality and they present a very different picture than the older SRES scenarios. Below are specific comments. Important comments are flagged by asterisks. *10-3, line 24: the IPCC SRES scenarios are now considered obsolete. I understand that they should be described in this chapter as the literature is based on them. But more attention should be given to the RCP scenarios, and they should be mentioned in this paragraph.

Preliminary Individual Comments from Ozone Review Panel. These are individual panelists’ comments that do not represent consensus CASAC advice or EPA policy. Updated 5-17-11
63
10-5, Figure 10-1: feedback from climate change should apply to the emissions of ozone precursors. 10-8, lines 18-19: is there any evidence of increasing ozone in the SH? Is there any evidence of increasing tropical biomass burning? 10-8, line 37: for bromine effects on ozone cite Yang et al., JGR 2005. The Parrella paper doesn’t exist. 10-8: Ordonez et al. GRL 2007 should be cited for a natural explanation of decadal ozone trends at northern mid-latitudes. 10-11, lines 14-18: it may be better to cite the IPCC values for emission-based RF.as a community consensus. 10-12, line 30: but there’s no SW radiation over the Arctic in winter. Isn’t it a general feature of greenhouse warming to be most intense at high latitudes in winter? *10-14, lines 21-34: I think that it would be useful to include a figure of 21st-century RCP projections of global emissions for AQ-relevant species. Also it would be worth mentioning that the RCP scenarios provide continuity with the previous SRES scenarios in terms of overall radiative forcing: RCP8.5 ≈ A2, RCP6 ≈ A1B, RCP4.5 ≈ B1. However, the projections of emissions for AQ-relevant species are very different. 10-16, line 15: isoprene does not systematically decrease ozone under NOx-limited conditions.
Preliminary Individual Comments from Ozone Review Panel. These are individual panelists’ comments that do not represent consensus CASAC advice or EPA policy. Updated 5-17-11
64
Dr. Steven Kleeberger Chapter 8 Populations susceptible to ozone-related health effects Are the characteristics included within the broad susceptibility categories appropriate and consistent with the definitions used? Initially, the authors of the chapter clarified the meaning of ‘susceptibility’ for the purposes of the ISA to eliminate confusion that has arisen in previous ISA documents for other NAAQS pollutants. That is, susceptible populations include susceptible, vulnerable, and at risk sub-populations. This was very helpful moving forward. The authors then did a very good job capturing what are considered to be the most important known categories of factors that may contribute to enhanced susceptibility to ozone-induced adverse outcomes. The 13 major categories for discussion included pre-existing disease/conditions (8.1), lifestage (8.2), sex (8.3), genetics (8.4), diet (8.5), body mass index (8.6), socioeconomic status (8.7), air conditioning use (8.8), involvement in outdoor activities (8.9), race/ethnicity (8.10), physical conditioning (8.11), smoking (8.12), and hyperthyroidism (8.13). Broadly, the 13 categories could be considered intrinsic (8.1-8.6, 8.10, 8.13) and extrinsic (8.7-8.9, 8.11, 8.12) susceptibility factors. Some of the categories could be collapsed to be more inclusive, e.g. involvement in outdoor activities and physical conditioning; pre-existing disease/conditions and hyperthyroidism and smoking. However, with the given structure, the authors were consistent with the broad meaning of susceptibility and how the various factors may influence responses to ozone exposure. Are there any key susceptibility factors that were not included and need to be added? In the "Lifestage" section, the authors briefly mention in utero exposures and effect on lung function and immune response in animal (mouse and rat) models. It should be more strongly emphasized that pre-term neonates represent a particularly susceptible population, subject to injurious effects of air pollutant exposure as the exposures may disrupt normal fetal developmental processes. Epidemiological studies have also reported associations of air pollution exposures (including ozone) with affected reproductive outcomes including intrauterine and infant mortality, preterm birth, low and very low birth weight, intrauterine growth restriction, and birth defects. Perhaps pregnancy should be considered a temporary ‘pre-existing condition’ and adverse outcomes are reproductive/birth parameters. The Genetics section was well-written, and adequately considers recent genetic association studies in human epidemiological and chamber investigations. It may be worthwhile stating that, due to small sample sizes, many of the chamber studies are limited to testing only those potential candidate genes that have very high minor allele frequencies in order to obtain appropriate statistical power. Other genes with potential impact on ozone-induced outcomes may be
Preliminary Individual Comments from Ozone Review Panel. These are individual panelists’ comments that do not represent consensus CASAC advice or EPA policy. Updated 5-17-11
65
important, such as those identified in some of the mouse models, but power considerations have limited testing these genes in human populations. It was a bit surprising that the discussion of toxicological studies did not include more thorough consideration of other potentially important genes besides those mentioned (e.g. Tnf, Nqo1). A number of recent investigations have implicated additional candidate genes that could/should be considered for future investigations in human populations, including for example 1l10, Mmp9, Il6, Tlr2, Marco, Hsp1a, H2-Aa, Ab1, Eb1, Eb2, Ea (histocompatibility genes), Lta, Nos2, and TLR4 and TNF signaling genes such as Myd88. Perhaps a table should be created that identifies these and other genes that have been implicated to be important in the pathogenesis (or protection against) ozone-induced lung inflammation and injury. The inclusion of diet as a susceptibility factor was timely and important. Given that this factor was not considered in previous AQCDs, the authors should have the flexibility to cite older papers to give the factor appropriate context. In addition to vitamins C and E, vitamin A deficiency has also been shown have important consequences on ozone-induced inflammation (see e.g. Paquette, et al, Am J Physiol 270:L475-82, 1996). Caloric restriction (protein deficiency) was briefly mentioned, but this area could be better developed by including additional studies such as Kari et al (Am J Respir Cell Mol Biol 17:740-747, 1997). Minor comments: Table 8-1. ‘Obesity could be included in the table as it is a potentially highly prevalent risk factor. Page 8-4, lines 14, 15. Formatting errors. Page 8-4, line 34. …asthmatics to, on average, experiences… should be …asthmatics, on average, experience… Page 8-4, line 38. ‘Only study’ should be ‘Only one study’. Page 8-7, line 3. Formatting error. Page 8-7, line 4. …and atherosclerosis were noted… should be …and atherosclerosis was noted… Page 8-9, line 11. Epitheliar should be epithelial. Page 8-11, line 16. …85 year of age… should be …85 years of age… Page 8-15, line 6. ‘individuals with both GSTM1 genotypes’ is a bit confusing since individuals can have only one genotype. Sentence should be re-written to state individuals with either genotype.

Preliminary Individual Comments from Ozone Review Panel. These are individual panelists’ comments that do not represent consensus CASAC advice or EPA policy. Updated 5-17-11
66
Page 8-15, line 35. It is not clear why Nrf2 was stated as a possible susceptibility factor. No references were cited, and this transcription factor has not been well characterized for responsivity to ozone. Page 8-16, line 1. Inf-1 and Inf-2 should be identified as quantitative trait loci, not genes.

Preliminary Individual Comments from Ozone Review Panel. These are individual panelists’ comments that do not represent consensus CASAC advice or EPA policy. Updated 5-17-11
67
Dr. Fred J. Miller Chapter 5: Dosimetry and Mode of Action The dosimetry and modes of action of O3 are discussed in Chapter 5. The primary focus of the dosimetry discussion is to highlight factors that might lead to differences in dose between individuals and between species. Some potential modes of action that may underlie a number of health outcomes and that may contribute to the biological plausibility of health effects of short- and long-term exposures are described in detail. Is the review of basic dosimetric principles of O3
There is actually very little presented about the dosimetric principles of O3 uptake aside from a discussion of what biomolecules O3 react with in the ELF and in the tissue. There is no discussion of the physical and chemical factors involved in gas transport and mechanisms that result in the penetration into and removal of O3 in various regions of the respiratory tract. The roles of convection, bulk flow, laminar versus turbulent flow, effective axial diffusion, radial diffusion, solubility, and Henry’s-Law are among the topics that should have been discussed if the principles determining O3 uptake were to be accurately and sufficiently presented. There is limited discussion of species differences in nasal structure and lung morphometry and the composition of the ELF together with the cellular composition in the major respiratory tract regions (extrathoracic, tracheobronchial, and alveolar). This information affects the strength of species homology and also illustrates what needs to be taken into account in interspecies dosimetric extrapolations.
uptake presented accurately and in sufficient detail?
Most of the dosimetry material centers on factors influencing uptake such as depth and route of breathing, the importance of interindividual variability in O3 uptake, regional experimental uptake data in humans, and factors that influence attempts to correlate measures of internal dose with response in human experimental studies. What are the views of the Panel on the approach taken in Chapter 5 to characterize modes of action for O3-related effects?The MOA material is a combination of effects descriptions mixed in with studies that are more mechanistically oriented. Very little information from animal studies is brought into the MOA discussion. For example, Section 5.2.3. on Activation of Neural Reflexes goes on for 4 pages describing human study results and then in Section 5.2.3.1 on New Cellular and Molecular Insights, animal studies are first brought into the discussion. If some pre 2006 animal studies were cited along the way that support the human findings, the cases for the MOAs would be stronger. The same can be said for other sections.
The figure on page 5-62 depicting the key events and pathways for the effects of ozone on the respiratory tract would be more useful if it was placed at the beginning of the MOA discussion as part of an introduction. Perhaps the section numbers could be included with the boxes; that way if a reader is interested in a particular aspect of one of the MOAs, they could go directly to the material. And the figure could be retained at the end of the chapter as part of the overall summary.

Preliminary Individual Comments from Ozone Review Panel. These are individual panelists’ comments that do not represent consensus CASAC advice or EPA policy. Updated 5-17-11
68
In addition, the MOA Overall Summary is weak, as it does not convey the strength and the importance of the findings discussed in the MOA subsections. Other points relevant to the MOA presentation and material are included below in my general and specific comments. Preliminary General Comments
• While the chapter combines material on the dosimetry and mode of action (MOA) of O3, there is no particular reason why they should be combined. The chapter organization comes through as if the pairing of the two was an after thought.
• The dosimetry chapter discusses various human study results and basically concludes, “this study shows that O3 does that”. Almost every one of these revelations is a confirmation of what mathematical O3 dosimetry models predicted 10 to 20 years earlier. More inclusion of references to the modeling papers would strengthen the presentation of the human dosimetry findings as was done in the material on “Pulmonary Ozone Uptake and Dose”.
• Whatever happened to the Agency criteria that to be included in the Criteria Document (and now the ISA document) studies needed to be at or below 1 ppm O3? Or if higher levels were included, at least the investigators went down in exposure concentration. I find it ridiculous to cite papers at 3 parts ppm O3 for several hours and talk about how they contribute to our understanding of mechanisms or modes of action. Such high exposures have no relevance to the real world and invoke “fictitious findings” (for example, the Williams et al. (2007) study exposing mice to 3 ppm O3 for 3 hour would have “blown away” the lungs of the mice and allowed O3 to directly react with the blood – what relevance can one possible assert to mode of action of O3 at environmental exposure levels?).
• In a number of sections, the text appears to be a stringing together of statements or findings from the original authors as sentence after sentence has a string of references at the end of the sentence. The frequency of references actually interferes with reading the material.
• In the MOA material, the authors need to be careful about making statement that a study shows one species is more sensitive to O3 than another. A good example of this can be found on page 5-34 starting at line 20. The text states that Dormans et al. (1999) exposed rats, mice, and guinea pigs to O3 and found guinea pigs to be the most sensitive with respect to alveolar macrophage elicitation and pulmonary cell density in the centriacinar region. And mice were most sensitive to bronchiolar epithelial hypertrophy … and the list goes on. Such statements about sensitivity are simply not valid unless there is normalization to the dose received. One species may remove more O3 than another in the nasopharyngeal region or one species may receive a greater pulmonary dose. The author of this paragraph points out the problem 9 lines later! Why waste text describing something that is not valid?

Preliminary Individual Comments from Ozone Review Panel. These are individual panelists’ comments that do not represent consensus CASAC advice or EPA policy. Updated 5-17-11
69
• Throughout the MOA material, the O3 exposure level and duration needs to be included more often. As an example, on page 5-53 starting on line 21, the study by Arito et al. (1990) is cited as showing O3 can induce several cardiovascular effects in animals exposed to O3. One might have an initial reaction of “So What?” Only by going to HERO do you find out that very low exposures of 0.1 to 0.2 ppm O3 were used for 5 days in rats. Now these results have relevance to humans and clearly offer insight into a MOA for O3!
• In multiple places, the text asserts that Pryor et al. (1992) show that O3 can not penetrate an ELF layer more than 0.1 microns in thickness, and, thus, effects of O3 on epithelial cells must be due to secondary reaction products. This assertion is more appropriate for the mucous layer than it is for the surfactant layer. But even for the mucous layer, the beating of the ciliated cells ensure that the layer is not stagnant and increases the chance that some O3 may be able to react directly with epithelial cells. In the alveolar region, 98 % of the alveolar epithelium is covered by an ultrathin (< 0.02 µm) surfactant layer. The surfactant layer pools in the corners of the alveoli during part of the breathing cycle leaving only a monolayer film of surfactant over the cells, thereby allowing the cells to be in almost direct contact with O3 in the gas phase. Moreover, the surfactant layer normally only approaches a thickness of 0.1 to 0.2 µm over Type II cells and in crevices, and, Type II cells cover only about 5 % of the alveolar surface area. Thus, there is ample opportunity for O3 to react directly with both cell types in addition to forming reaction products with constituents of the surfactant layer.
Specific Comments Page, line Comment 5-2, 25 The statement that the mucous coating becomes patchy in the distal
conducting airways is highly debatable. The method used to fix the lung specimens greatly influences the results. The most accurate method to preserve the lining lay involves both blood and gas-phase fixative methods. To my knowledge, Mercer’s study was the only one meeting these criteria, and he showed that the layer was continuous even in the terminal bronchioles.
5-2, 27 The sentence beginning with “The progressive thinning …” needs to be reworded. The authors are trying to refer to the radial distance from the center of the air phase to the ELF, but the way the sentence is currently worded implies they are talking about the axial distance into the lungs.
5-3, 1 Suggest inserting the word “mediating” before “…O3 toxicity in the airways.”
5-6, 33 Is the reaction rate constant for GSH stated correctly? If it is, can it be converted to the same units as shown for UA and AH?
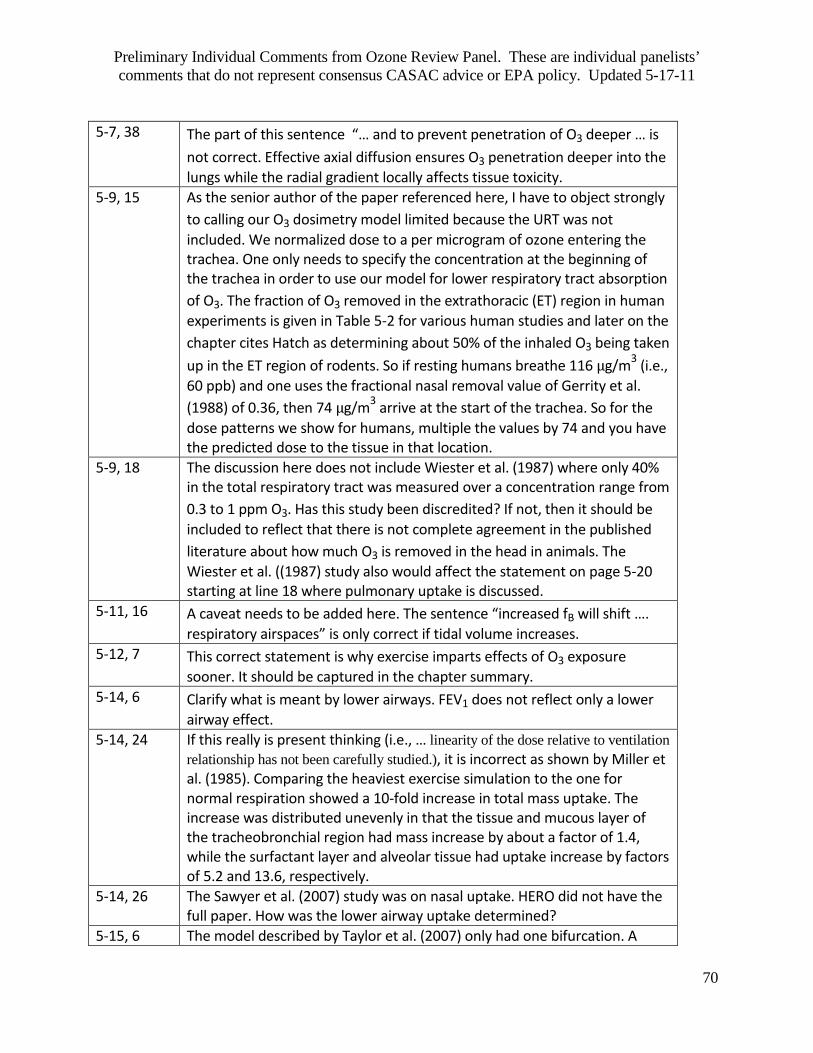
Preliminary Individual Comments from Ozone Review Panel. These are individual panelists’ comments that do not represent consensus CASAC advice or EPA policy. Updated 5-17-11
70
5-7, 38 The part of this sentence “… and to prevent penetration of O3 deeper … is not correct. Effective axial diffusion ensures O3 penetration deeper into the lungs while the radial gradient locally affects tissue toxicity.
5-9, 15 As the senior author of the paper referenced here, I have to object strongly to calling our O3 dosimetry model limited because the URT was not included. We normalized dose to a per microgram of ozone entering the trachea. One only needs to specify the concentration at the beginning of the trachea in order to use our model for lower respiratory tract absorption of O3. The fraction of O3 removed in the extrathoracic (ET) region in human experiments is given in Table 5-2 for various human studies and later on the chapter cites Hatch as determining about 50% of the inhaled O3 being taken up in the ET region of rodents. So if resting humans breathe 116 µg/m3 (i.e., 60 ppb) and one uses the fractional nasal removal value of Gerrity et al. (1988) of 0.36, then 74 µg/m3 arrive at the start of the trachea. So for the dose patterns we show for humans, multiple the values by 74 and you have the predicted dose to the tissue in that location.
5-9, 18 The discussion here does not include Wiester et al. (1987) where only 40% in the total respiratory tract was measured over a concentration range from 0.3 to 1 ppm O3. Has this study been discredited? If not, then it should be included to reflect that there is not complete agreement in the published literature about how much O3 is removed in the head in animals. The Wiester et al. ((1987) study also would affect the statement on page 5-20 starting at line 18 where pulmonary uptake is discussed.
5-11, 16 A caveat needs to be added here. The sentence “increased fB will shift …. respiratory airspaces” is only correct if tidal volume increases.
5-12, 7 This correct statement is why exercise imparts effects of O3 exposure sooner. It should be captured in the chapter summary.
5-14, 6 Clarify what is meant by lower airways. FEV1 does not reflect only a lower airway effect.
5-14, 24 If this really is present thinking (i.e., … linearity of the dose relative to ventilation relationship has not been carefully studied.), it is incorrect as shown by Miller et al. (1985). Comparing the heaviest exercise simulation to the one for normal respiration showed a 10-fold increase in total mass uptake. The increase was distributed unevenly in that the tissue and mucous layer of the tracheobronchial region had mass increase by about a factor of 1.4, while the surfactant layer and alveolar tissue had uptake increase by factors of 5.2 and 13.6, respectively.
5-14, 26 The Sawyer et al. (2007) study was on nasal uptake. HERO did not have the full paper. How was the lower airway uptake determined?
5-15, 6 The model described by Taylor et al. (2007) only had one bifurcation. A
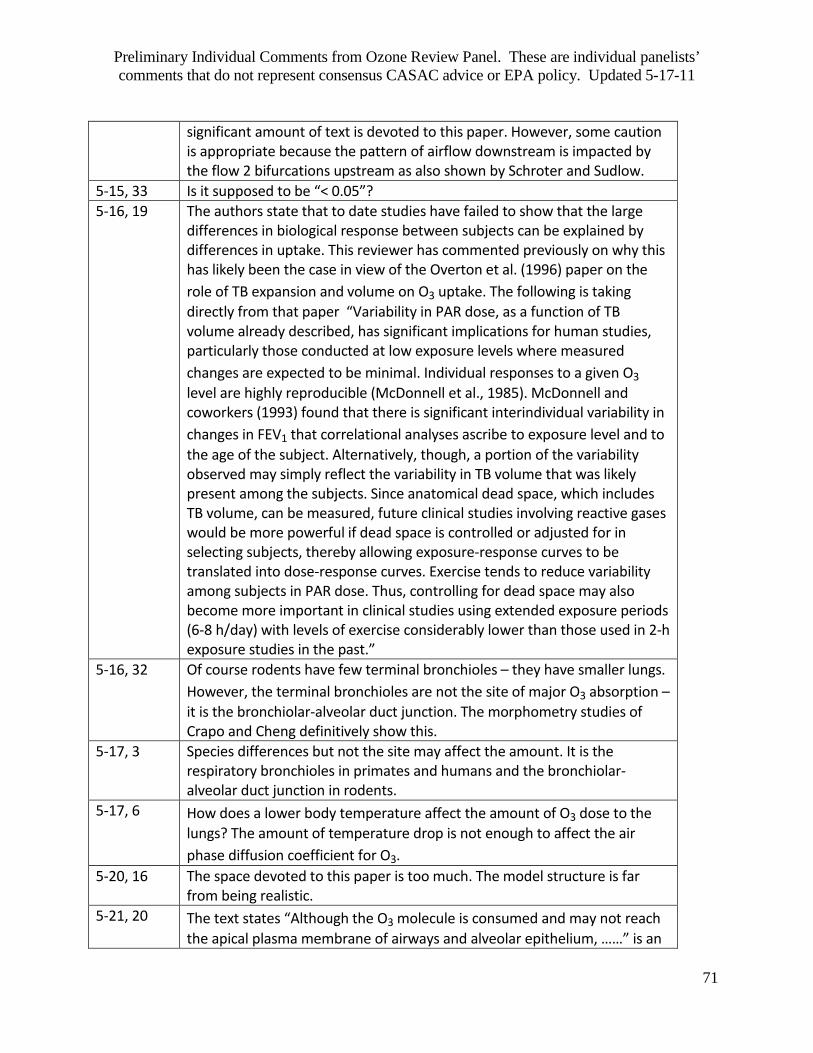
Preliminary Individual Comments from Ozone Review Panel. These are individual panelists’ comments that do not represent consensus CASAC advice or EPA policy. Updated 5-17-11
71
significant amount of text is devoted to this paper. However, some caution is appropriate because the pattern of airflow downstream is impacted by the flow 2 bifurcations upstream as also shown by Schroter and Sudlow.
5-15, 33 Is it supposed to be “< 0.05”? 5-16, 19 The authors state that to date studies have failed to show that the large
differences in biological response between subjects can be explained by differences in uptake. This reviewer has commented previously on why this has likely been the case in view of the Overton et al. (1996) paper on the role of TB expansion and volume on O3 uptake. The following is taking directly from that paper “Variability in PAR dose, as a function of TB volume already described, has significant implications for human studies, particularly those conducted at low exposure levels where measured changes are expected to be minimal. Individual responses to a given O3 level are highly reproducible (McDonnell et al., 1985). McDonnell and coworkers (1993) found that there is significant interindividual variability in changes in FEV1 that correlational analyses ascribe to exposure level and to the age of the subject. Alternatively, though, a portion of the variability observed may simply reflect the variability in TB volume that was likely present among the subjects. Since anatomical dead space, which includes TB volume, can be measured, future clinical studies involving reactive gases would be more powerful if dead space is controlled or adjusted for in selecting subjects, thereby allowing exposure-response curves to be translated into dose-response curves. Exercise tends to reduce variability among subjects in PAR dose. Thus, controlling for dead space may also become more important in clinical studies using extended exposure periods (6-8 h/day) with levels of exercise considerably lower than those used in 2-h exposure studies in the past.”
5-16, 32 Of course rodents have few terminal bronchioles – they have smaller lungs. However, the terminal bronchioles are not the site of major O3 absorption –it is the bronchiolar-alveolar duct junction. The morphometry studies of Crapo and Cheng definitively show this.
5-17, 3 Species differences but not the site may affect the amount. It is the respiratory bronchioles in primates and humans and the bronchiolar-alveolar duct junction in rodents.
5-17, 6 How does a lower body temperature affect the amount of O3 dose to the lungs? The amount of temperature drop is not enough to affect the air phase diffusion coefficient for O3.
5-20, 16 The space devoted to this paper is too much. The model structure is far from being realistic.
5-21, 20 The text states “Although the O3 molecule is consumed and may not reach the apical plasma membrane of airways and alveolar epithelium, ……” is an
Preliminary Individual Comments from Ozone Review Panel. These are individual panelists’ comments that do not represent consensus CASAC advice or EPA policy. Updated 5-17-11
72
overstatement as far as the alveolar region is concerned. During breathing, the 98 % of the alveolar epithelium that is covered by an already ultrathin (< 0.02 µm) surfactant layer pools in the corners of the alveoli, thereby allowing some cells to be in almost direct contact with O3 in the gas phase. Moreover, the surfactant layer normally only approaches a thickness of 0.1 to 0.2 µm over Type II cells and in crevices, and, Type II cells cover only about 5 % of the alveolar surface area.
5-22, 8 The statement that O3 does not diffuse very far into the mucous layer is overall a correct one. However, since the cilia are bathed in the aqueous layer and beat at 1200 beats per minute, the layer is far from stagnate and may allow some O3 to come into direct contact with epithelial cells in the TB region.
5-27, 17 The authors state that an important consideration is the non-uniformity of the injury response to O3. Both Mercer and colleagues and Pinkerton and coworkers have shown that this is due to the variability in tracheobronchial path length and the volume of all the acini attached to a given terminal bronchiole. This is why pathologists describe non-uniform injury when slides are cut randomly through lung tissue, particularly at low exposure levels.
5-28, 1 The statements here about where maximal effects occur are exactly in accord with dosimetry modeling predictions. This is an example of why the general comment was made to cite the modeling papers more at various points in the MOA discussion.
5-30, 18 This excellent paper by Schelegle et al. (2007) should be expanded upon in the discussion. There are a number of good points shown in their publication.
5-32, 11 Why all the listing of references up to 30 years old? This comes across as the MOA only bears insight after all of this time.
5-48, 3 This is an accurate and powerful statement that should be highlighted in the chapter Overall Summary (Section 5.2.10).
5-53, 21 Here is an example of the need to include the O3 exposure levels and durations. The Arito study involved 5 days of exposure of rats to only 0.1 to 0.2 ppm O3 that found the cardiovascular effects described here.
5-56, 14 Are the authors not aware of the 2011 publication by Kim et al.? The whole paragraph on this page goes on about GSTM1 involvement but does not mention the negative finding of no relationship to PMN percentage to O3 exposure at 60 ppb reported by Kim and colleagues. This recent publication showed that GSTM1 has no role in modifying the effects of neutrophilic inflammation at environmentally relevant exposure levels.
5-58, 13 Here is another example of where the O3 exposure level and duration would have been useful. The cited study involved 0.42 ppm for 1.5 hours.

Preliminary Individual Comments from Ozone Review Panel. These are individual panelists’ comments that do not represent consensus CASAC advice or EPA policy. Updated 5-17-11
73
So increased body mass index (BMI) is not likely a risk factor at environmentally relevant exposure levels given the small but significant effect seen for females by Bennett et al. (2007).
5-61 The MOA Overall Summary section is very weak and does not reflect the strength of the findings discussed in the subsections. The current section comes across as “the authors ran out of gas”.
Chapter 8: Populations Susceptible to Ozone-related Health Effects Chapter 8 is a discussion of potential susceptibility factors.
The characteristics included are consistent with the definition of susceptibility presented on the first page of the chapter. Providing EPA’s definition of susceptibility was critical for evaluating the material included in the chapter. As a statistician and familiar with the concept of tolerance distributions, I personally do not like the Agency’s definition of susceptibility; tolerance distributions are founded on the recognition of innate biological differences that make some individuals respond at a given dose while other persons do not. And as the dose is increased the tolerance distribution becomes narrower.
Are the characteristics included within the broad susceptibility categories appropriate and consistent with the definitions used?
Exercise is only indirectly treated as part of the sections on children and on outdoor activities. At ambient exposure levels, exercise is the single most important driver of the amount of ozone inhaled and the likelihood of causing effects in individuals of any age or disease condition. As such, more discussion of the role of exercise and exercise levels should be included in Chapter 8.
Are there any key susceptibility factors that were not included and need to be added?
Preliminary General Comments
• The chapter would be made stronger if evidence from animal toxicology studies were included that provide support for the susceptibility characteristic under discussion. A good example is Section 8.1.1 Influenza/Infections. The section is only a short paragraph about findings in epidemiology studies. However, there are a number of animal studies showing the ability of ozone to increase the incidence and/or mortality from respiratory infections, even to exposures as low as 0.08 ppm O3. Inclusion of such material would strengthen the case for O3 being able to cause similar effects in humans.
• The chapter summary identifies older age groups as being one of the most susceptible populations to O3 exposure. However, the studies discussed in Section 8.2.2 (Older Adults) do not give the reader this impression. For each type of effect discussed, both positive and negative studies are typically available. This section also provides an example of how the results from clinical and animal studies can provide biological plausibility for some endpoints (see the discussion starting at line 33 on page 8-11). The

Preliminary Individual Comments from Ozone Review Panel. These are individual panelists’ comments that do not represent consensus CASAC advice or EPA policy. Updated 5-17-11
74
evidence may be stronger for some endpoints than for others, and this should be the bottom line carried forward to the chapter summary.
• The rambling style of the presentation of studies in various sections makes the material difficult for the reader to take away the bottom line about the importance of some of the susceptibility characteristics being discussed.
Specific Comments Page, line Comment 8-4, 9 Why would one even discuss an epidemiology result based on an N of 4? 8-8, 1 Lung development (i.e., airway branching, addition of alveoli) is completed
between ages 6 and 8. This is different from lung growth, which continues until ages 18-20.
8-14, 18 As noted in the Dosimetry and Mode of Action chapter, why isn’t the Kim et al. (2011) study discussed? Their study shows GSTM1 does not play a role in O3 responses at environmentally relevant exposure levels.
8-18 Section 8.7 on Socioeconomic Status should make clear to the reader that SES is an indicator variable reflecting such things as access to health care, quality of housing, and pollution gradient.
8-23, 3 Smokers are most likely less responsive to O3 due to increased mucous production and because most of the endpoints studied do not reflect alveolar level insults.
Preliminary Individual Comments from Ozone Review Panel. These are individual panelists’ comments that do not represent consensus CASAC advice or EPA policy. Updated 5-17-11
75
Dr. Howard S. Neufeld Chapter 2 I believe this chapter adequately sums up the evidence and conclusions presented in later chapters. It is well written, although it is somewhat lengthy for a summary chapter. My main recommendation would be to provide the reader with a two page (max) executive summary, complete with tables of known causality. Of particular usefulness are the concluding statements at the end of each section which summarize the findings and provide the reader with the state of causality for that process. I found very little factually with which to take issue. There are a few places where some clarity of wording might improve the document, but these would be relatively minor changes. In general, this is a good integration and summary of the remaining chapters in the ISA. The policy relevant background section (2.1.3) is particularly well written, and the definition of PRB, for those not familiar with this parameter, is excellent and easy to understand. Section 2.1.5.4, on Hourly Variations, states that for most locations, diel maxima of ozone occur in mid-afternoon and minima at night. This seems to ignore high elevation ecosystems, where just the opposite can and does occur. Data from the Smokies and other high elevation locations around the world often show flat profiles over time, and sometimes the maxima can occur at night instead of during the day. Because so many sensitive plants may be located at high elevations, I think a distinct discussion of high elevation ozone patterns warrants more discussion and elaboration. It is also not clear to me whether diel patterns at high elevations have remained unchanged over the past 20 years like that for low elevation sites. I can’t comment to any great extent on the sections concerning human responses to ozone, as that is outside my areas of expertise, but even so, they appear to be well constructed, and to take into consideration most, if not all, sources of variation and effects with respect to ozone exposure. My only comment is that by section 2.4, I think the document should make it more clear whether the responses being discussed were obtained using acutely high exposures (unrealistic with respect to known ambient levels) or were obtained using near ambient exposures. The tables (2.1, 2.2, and 2.4) provide the reader with quick summaries of the ISA conclusions, and are very useful. It might be nice to reiterate the category definitions beneath each table so readers are reminded of the degree of certainty with which EPA considers ozone as a cause for each item mentioned. In Section 2.5.1, potentially susceptible populations, I wonder whether any studies have been done on class/economic distinctions with respect to ozone exposure. In this vein, I’m thinking about whether certain classes of people are disadvantaged by income or race, which causes them to live in areas that predispose them to higher pollutant exposures. For example, wealthy people living on the coast of California would be exposed to lower ozone than those further inland or in the central valley. I didn’t see any mention of this in the ISA, but certainly, the EPA has studied similar issues with regard to environmental justice and the placing of nuclear and toxic waste sites. However,
Preliminary Individual Comments from Ozone Review Panel. These are individual panelists’ comments that do not represent consensus CASAC advice or EPA policy. Updated 5-17-11
76
because ozone is often a regional phenomenon, it may not be easy to distinguish differences in exposure due to these issues over much of the rest of the country. In section 2.5.2, the last sentence seems awkwardly constructed. The first phrase states that single day ozone exposures underestimate the public health impact. The second phrase starts off with the disclaimer “but” and then states that multi-day effects are limited to the first few days. The way it is constructed almost makes it seem as if the latter part is not as important as the first. I would substitute “while” for “but” which would give equal weight to both clauses. I have to admit that I thought Figure 2.1 was less than helpful. It’s too confusing with the colors and multi-faceted studies. Is there any way to simplify this? Figure 2.2, in contrast, is much better constructed, but you need to define HA/ED visits. Since everything else is spelled out in the figure, just spell these acronyms out too. In fact, there is no need for any acronyms in this figure at all. With respect to welfare effects, I also have a problem with Figure 2.3. I believe the figures are too simplified. The leaf panel is simply too cluttered, and all the arrows make it confusing to figure out what is going on. Some pathways are covered over by the water vapor arrow. There is no mention of reactive oxygen species inside the leaf, nor any distinction between apoplastic and symplastic reactions, even though the text extensively discusses these things. Also, C4 plants, which constitute a significant fraction of our crop plants, do not have this leaf anatomy, and that difference could have significant influences on why most C4 plants appear less sensitive to ozone than C3 plants (if that indeed is true). The ecosystem panel uses the term “water production” but in the key to the side uses the phrase “water cycling”. Cycling is the more proper term. Ecosystems don’t “produce” water; rather, they use and cycle it. A better indication of trophic cascades could be included. As of now, the insects and animals are just standing off to the side as if separate from everything else. In conclusion, I think this figure could be redrawn to higher standards. Section 2.7.1 closes with a discussion of ozone-induced changes in stomatal functioning. I don’t think sluggish stomata always mean that they do not close after exposure to ozone. Rather, when ozone injury is apparent (such as when foliar symptoms are seen), there is a reduction in stomatal conductance which may or may not be accompanied by sluggishness. That is, sluggishness doesn’t necessarily occur when stomata are as open as in plants not exposed to ozone. Also, sluggishness refers to an inability to either close or open, not just close, as stated in the document. Finally, aberrant stomatal functioning often occurs in the absence of any visible injury, suggesting that some other factor must be at work to cause this effect (and it may not always be due to higher internal CO2). I think the inclusion of a short discussion of potential causal factors (besides increased internal CO2) would be welcome. I agree with most of the rest of this part of Chapter 2. There is a new paper, just accepted to Environmental Monitoring and Management (Smith, G., 2011, in press), which summarizes 16 years of FIA monitoring of ozone bioindicators. As Smith states, extreme soil moisture deficits decrease foliar injury on bioindicators, but in some dry years, soil moisture appears to have less effect on controlling injury levels. Soil moisture appears to protect plants against foliar injury no

Preliminary Individual Comments from Ozone Review Panel. These are individual panelists’ comments that do not represent consensus CASAC advice or EPA policy. Updated 5-17-11
77
matter what the level of ozone exposure. Finally, when soil moisture balance is positive, high ozone generally causes more injury. Most importantly, the best correlations with injury were with the N100 (number of peak hours at or above 100 ppb) and not with a cumulative index, showing again that peak ozone is critically important in determining plant response. Should Shenandoah National Park be included in the list of parks with bioindicator plants and foliar injury (page 2-54, line 19)? With respect to section 2.7.2.2, I simply ask if yield losses with respect to ozone could be reduced by farmers either knowingly or unknowingly selecting for ozone tolerant strains of their crops after experiencing losses from ozone in previous years. That would alter the exposure/response relationships over time. Also, in this same section, line 22, there is the statement that “most research on the mechanism of O3 damage has used acute exposure studies.” Is this still accurate today? I would have accepted this statement 15 years ago, but in my opinion, recent studies have moved to more realistic or near ambient exposures. I think the jury is still out with regard to sluggish stomata. Section 2.7.3.2 seems confident that reduced conductance is the main result of ozone exposure, while admitting that sluggishness does occur. I think some compromise needs to be included here. If the weight of evidence is that ozone lowers conductance, and only that conclusion is incorporated into models, then the impacts of sluggishness (failure to close or open properly) are lost, and the results of studies like McLaughlin et al. (2007), which found that sluggishness might be responsible for reducing ecosystem-wide water availability, would not be accounted for. The last word in this same section should be changed from “production” to “use” or “cycling”. Section 2.7.4.2 discusses night time stomatal conductances. No mention is made of some early studies, such as the one by Peter Tobiessen in 1982 (Oecologia) which showed that some early successional tree species might open their stomata pre-dawn (and to levels approaching day time conductances) or the more recent studies by Lisa Donovan. If this is really happening, then it needs to be addressed. Studies by Lisa Donovan on night-time conductances, and similar parallel studies using eddy covariance, need to be included in the literature review in Chapter 9. Many of these early successional tree species occur at high elevations, where ozone is high at night and in the early morning, and they could take up appreciable amounts of ozone at those times, assuming there is adequate mixing and deposition to the canopy, as discussed elsewhere in the ISA. Finally, in the section on tropospheric ozone and UV-B (2.8.2), I did not see any mention made of UV-B-induced catalysis of elemental mercury in lakes and re-volatilization into the atmosphere. In areas subject to acid deposition, where DOC is reduced, and the lakes are made ultra-clear, light penetrates further down the water column. If UV-B light is present, it can convert methyl Hg photolytically into a volatile form of elemental Hg that then escapes into the atmosphere. If ozone alters UV-B radiation, then it could inadvertently affect Hg volatilization and transport within and among ecosystems (See Schindler, D.W., 1998. Science).

Preliminary Individual Comments from Ozone Review Panel. These are individual panelists’ comments that do not represent consensus CASAC advice or EPA policy. Updated 5-17-11
78
Lastly, the summary table at the end is well done, and provides the reader with an expectation of what to expect in the rest of the ISA. Comments on Chapter 9 Much of the beginning of this chapter is word for word, the same as that in Chapter 2. I would shorten this chapter by going directly into the specific sections, and leave out all the redundant material. Also, I thought that the sections on stomata were too dispersed and redundant. It seems that some re-organization of topics might make the material flow better. In 9.2.2, page 9-6, line 3, it is stated that responses to ozone can be quite rapid, which results from the plant’s ability to sense ozone or its breakdown products, which then result in gene activation or down regulation. However, some of these responses could occur prior to any gene activation. In fact, gene activated responses would generally be slower, given the time required for transcription and translation. Might these extremely rapid responses (such as membrane leakiness) simply be physical responses to ozone or ROS, and not the product of gene activity? This would make the situation similar to how auxin responses are propagated in plants – there is a rapid (10-15 mins) physical reaction (acidification of the apoplast for example) followed by a slower (several hours), prolonged response due to gene activation. On page 9-7, there is a statement that plants “need to keep antioxidant metabolites in a reduced state” and that this “requires a significant shift in C metabolism…”. While this sounds logical, is there really any hard evidence showing this from an experimental point of view? I don’t recall any papers that have actually tested this idea. Yes, respiration rates do tend to go up, but is there evidence that is because plants are attempting maintain their antioxidant defenses, or is it simply a result of foliar injury itself, but with no beneficial results in terms of prolonging leaf life span or function? Regarding the action of ascorbate, pictured in Figure 9.4, there is no mention of the mini-review on the chemistry of ozone-ascorbate interactions by Heinrich Sandermann, which appeared in Biochemical and Biophysical Research Communication 366:271-274 (2008). In this review, Sandermann points out that reaction of apoplastic ascorbate (or ascorbate in the respiratory lining of the lungs and airways) results in the production of a zwitterion that decomposes into peroxy-L-threonic acid and oxalic acid when it reacts with ozone. If it reacts with one of the ROS produced upon ozone exposure (singlet oxygen) it produces peroxy-ketone. Singlet oxygen can be produced when ascorbate reacts with ozone. Peroxy ketones can react with water to yield hydrogen peroxide. These secondary toxicants may affect human/animal and plant responses to ozone in ways not yet fully appreciated. Section 9.4.3.2 ends with a discussion of gene upregulation and downregulation by ozone. It would be interesting to postulate what differences might exist that cause sensitive plants to react to ozone more readily than tolerant plants, if such knowledge exists. That is, what is the molecular basis for differential gene regulation by plants that vary in sensitivity to ozone? For Figure 9.5, there are no labels or units on the Y axis of panel A.
Preliminary Individual Comments from Ozone Review Panel. These are individual panelists’ comments that do not represent consensus CASAC advice or EPA policy. Updated 5-17-11
79
With regard to Section 9.4.4.2, I saw no mention made of Burkey et al. (2006) or Souza et al. (2006) with respect to apoplastic antioxidant levels and degrees of resistance to ozone in native wildflowers, in particular, tall milkweed. These papers showed a clear association of higher apoplastic ascorbate in the reduced state, and reduced foliar injury in the field from ozone for tall milkweed, but not for coneflowers or crownbeard. Although correlative only, it is suggestive of the fact that individual plants of tall milkweed show fewer foliar symptoms from ozone because they have higher apoplastic ascorbate than those plants with reduced amounts which have more foliar injury. Furthermore, tolerant tall milkweed plants maintained elevated apoplastic ascorbate throughout the season compared to sensitive individuals, which slightly contradicts the statement at the end of section 9.4.4.2 that plants cannot maintain elevated antioxidant levels for extended periods of time. Perhaps such patterns are species and environmentally contextual. In Section 9.4.6, there is the statement, on page 9-46, that ozone-sensitive coneflowers “have a set of traits, such as a sluggish stomatal response to changes in light intensity, which predispose them to being more sensitive to O3 exposure…”. In actuality, there is little evidence for any differences in stomatal conductance prior to the appearance of foliar injury between sensitive and tolerant coneflowers (personal knowledge on my part, paper in preparation). Such differences in the magnitude and responsiveness to environmental variables only show up once sensitive plants show visible foliar injury. So it is not accurate to state that there are “predisposing” factors. At this point we simply do not know why one individual is sensitive and an adjacent one is not. Also, in this same section, there is no extended discussion of Nancy Grulke or Elena Paoletti’s work on stomatal sluggishness. In Section 9.5.3.2, page 9-59, line 6, Volk et al. are cited with respect to effects of ozone potentially causing shifts in high elevation community species composition. Yet, this study was repudiated later by Stampfli and Fuhrer (2010) and this latter study is cited later in the ISA in section 9.6.5.2, on page 9-84. Perhaps Section 9.5.3.2 and Section 9.6.5.2 should be made consistent with each other. A recent paper (Volk et al. 2011, Global Change Biology 17:366-376) shows an influence of N deposition on soil C storage in these high elevation meadows, but no effect of ozone and should be included in the ISA. Section 9.5.4.4 documents the reported interactions between ozone and N deposition. There is a lack of investigations on the interaction between N deposition and ozone responses, which highlights a major research deficiency in our understanding of how ozone responses by plants can be modified by other forms of pollution. There are no reports in the ISA of the responses of nonvascular plants (e.g., mosses), lichens or lower vascular plants and their responses to ozone. A quick Web of Science search of papers published since 2006 brought up five papers on lichens and ozone and one for mosses, but none for ferns. Inclusion of a statement that our knowledge of the impacts of ozone on these types of plants has not been a research priority in recent years, and a retrospective summary of past conclusions for these types of organisms might be helpful here. Mosses cover a vast amount of the earth’s

Preliminary Individual Comments from Ozone Review Panel. These are individual panelists’ comments that do not represent consensus CASAC advice or EPA policy. Updated 5-17-11
80
surface, and if they are negatively impacted by ozone, this could have an effect on the C balance, and hence global climate. Most of the ecosystem level studies cited used 2X ambient ozone levels to elicit effects. How relevant are those results then, with respect to current and expected levels of ozone? In Section 9.6.3, line 6, page 9-74, the text reads “…leads to greater stomatal apertures.” This is not entirely accurate. It can lead to sluggish stomata which fail to close; but only rarely do they open more. Section 9.6.6.1 on species-level responses would benefit by having a concluding sentence that summarized the situation. Such a sentence would simply state “that that there is no consensus on how insects respond to feeding on ozone exposed plants.” Section 9.7.3.1 would benefit by inclusion of the Smith paper (see earlier mention) on foliar injury and its relation to peak and cumulative amounts of ozone over 16 field seasons. It too found that peak ozone concentrations (at or above 100 ppb) seemed highly correlated with the degree of foliar injury found in the field; more so than any cumulative index. Section 9.7.3.2. makes no mention of Tobiessen’s early work on nocturnal conductances in early successional trees (Tobiessen, P. 1982. Dark opening of stomata in successional trees. Oecologia 52:356-359) and might be improved by its inclusion. Nor does it reference Lisa Donovan’s extensive and recent work on this subject. In Section 9.7.4.1, Chappelka et al. (WASP 116: 255-260, 1999) documented greater injury in mid-canopy black cherry leaves, rather than those at the exterior and most exposed part of the forest canopy. This probably resulted from an interaction between canopy location and ozone concentration, where fully exposed leaves were more water-stressed and had lower stomatal conductances, while those in mid-canopy had slightly lower ozone, but higher stomatal conductances. Such patterns should be re-emphasized here, even if reviewed in an earlier document. Gregg’s data in Section 9.8.3.3 is eye-opening to say the least. If this represents what is happening in the field, then certain genotypes of trees have already, or will soon be, eliminated by ozone from the landscape (maybe this has already happened in some poplar clones and in white pine – see Berrang and Karnosky’s early work on this). That means a decrease in genetic diversity, which can happen without any noticeable change in appearance of the forest or other plant community, since resistance genotypes would appear visually similar to the sensitive ones that are selected against. One final comment on something in Chapter 3, page 3-7, line 15. Here, it is stated that coniferous forests are the largest source of VOCs nationwide. In the southeastern states, vast swaths of land have been converted from hardwood forests to production pine plantations. I wonder if anyone has calculated whether this has caused an increase in the VOC emissions in this part of the country compared to what was present when it was mostly hardwood forests?

Preliminary Individual Comments from Ozone Review Panel. These are individual panelists’ comments that do not represent consensus CASAC advice or EPA policy. Updated 5-17-11
81
The rest of this chapter is a good summary of the current state of knowledge of how natural and agricultural ecosystems respond to ozone. Comments on Chapter 10 I thought this was a well written summary of both the direct and indirect effects of tropospheric ozone on UV-B radiation impacts. I appreciated how this chapter discussed the climate forcing due to ozone relative to that of CO2 and CH4, as well as the way it distinguished between long-term and short-term greenhouse gases. With respect to calculating recent ozone trends, E. Henry Lee et al. (2003, History of tropospheric ozone for the San Bernardino Mountains of Southern California, Atmos. Env. 37:2705-2747) had a paper out recently comparing trends in California back to the time when ethylene monitors were used and showed that they could reconstruct the ozone trends for that period, but I didn’t see it cited in the ISA. I thought this chapter fairly evaluated the research to date while also pointing out the paucity of studies of how increasing tropospheric ozone will affect UV-B impacts. It also got the point across that most conclusions regarding these effects are tentative, and, where more is known, that the magnitude of effects is likely to be small to moderate at most. I agree with the last conclusion on page 10-28 that “the effects of changes in surface-level O3 concentrations on UV-induced health outcomes cannot yet be critically assessed within reasonable uncertainty.” Typos Needing Correcting I only read Chapters 1, 2, 3, 9 and 10 for typos Note: for ALL figures with legends, they all contain a box after the first sentence or so, which often overlaps with other text. Chapter 1 1-6, line 34 - Change “if” to “of” Chapter 2 2-4, line 25 – Should it be “hPa” or “kPa”?? 2-9, line 13 – Change “This” to “These”. Data are always plural. Line 32 – there is an overlap of the greater then and the left parenthesis 2-23, line 12 – insert “of” before “antioxidant” 2-36, Table 2-3 – In the short-term section of lung function, second column, the less than and parenthesis signs are on top of each other. 2-49, line 8 – insert “that” before “have been” 2-58, line 30 – insert “the” before “Carpathian” Chapter 3 3-10, line 16 – the symbols after acyl peroxide radicals are messed up. For many of the figures, using dark blue for the correlation boxes, with black fonts makes the numbers impossible to read.
Preliminary Individual Comments from Ozone Review Panel. These are individual panelists’ comments that do not represent consensus CASAC advice or EPA policy. Updated 5-17-11
82
Chapter 9 9-41, line 7, “Acer” should be italicized. 9-48, line 35 – insert “production” after “fine root” 9-51, line 20, “Smokey” is misspelled. There is no “e”, e.g., Smoky. Also, “Mountain” should be plural, as in “Mountains” – Great Smoky Mountains National Park Table 9-2 – all the scientific names in the table should be italicized. 9-53, line 5 – “Asclepias exaltata” should all be italicized. 9-56, line 37 – take out “a” before “the individual” 9-58, line 22 – There is some confusion in units on this line. The sentence states that yields are
reduced “by -0.38 to -1.63% ppb/v across the five years.” Should that be are reduced “by 0.38 to 1.63% per ppbv/yr”? That is, take out the negative signs, and correct the ozone unit, and insert yr in the denominator. On this same page, but line 28, “dependant” is misspelled. Should be “dependent”.
9-59, line 4 – change the second “was” at the end of the line to “were” 9-63, line 12 – both Rhizobium and Frankia should be italicized. 9-64, line 25 – I think a word is missing here. The sentence says that O3 may enhance O3 effects. I think the first O3 should be “drought”, right? 9-66, line 7 – Change “on” to “in” before photosynthesis. 9-70, line 11 – “function” should be plural, “functions” 9-71, line 25 – insert “in” before “O3 concentration” 9-72, line 2 – insert “the” before “northeastern” Line 38 – Change “that” to “than” 9-81, line 5 – insert “the” after “Since 2003” 9-83, line 6 – subscript the “4” in “CH4” 9-86, line 27 – take out the comma after “O3” and put in a space Line 32 – change “have” to “has”. This verb refers back to “performance” on the previous line, which is singular. 9-129, line 3 – change “confirms” to “confirm” – should be in the plural form since this verb refers back to cottonwood “data”, and data is a plural word. 9-131, line 8 – insert “%” after “17.9” Note that for ALL references in this (and probably other chapters) that contain scientific names, none of them are italicized, and they should be. Chapter 10 – I did not find any typos in this chapter.

Preliminary Individual Comments from Ozone Review Panel. These are individual panelists’ comments that do not represent consensus CASAC advice or EPA policy. Updated 5-17-11
83
Dr. Ted Russell Review of the Integrated Science Assessment for Ozone and related Photochemical Oxidants (First External Review Draft) First, when I saw one of the staff up in RTP, he jokingly referred to one of my prior reviews of an ISA where I really wondered about the use of the word “concise.” The comment was that they had removed the word, but this appears not to be the case. Again, I bring this up, given that the definition of concise is “expressing or covering much in few words; brief in form but comprehensive in scope; terse:” I estimate that there are about a quarter million words in this document, so I might not use the term concise. Maybe use condensed or compressed, though even those seem a bit strained in this case. Possibly not bring concise up, even though it was the intent of having an ISA as opposed to an AQCD. It is interesting to note that this ISA is about the same size as the prior ozone AQCD (which was about 820 pages, without appendices), so it is not apparent that there has been great success at distilling the information down to a more approachable size, though there has been significant success in stemming the growth of these documents. In general, I think Chapter 3 does most of its job pretty well, and some parts may be a bit long. I was glad to see that a significant fraction was moved to an Appendix. For the most part, the chemistry and transport are relatively well known, and the last ISA did a good job on its description and analysis of observational data. I think there are a couple of potential areas that need to be more fully addressed:
1. Relationship between various ozone metrics at lower levels. The likely driving question associated with this review process is where in the range of 60-75 ppb, 8-hr average should a new standard be set. In part, this will rely on various epidemiologic studies. Various studies have used different ozone metrics, e.g., 24-, Max 8-, and Max 1-hr averages, and it is important to be able to relate those metrics to each other. Some of those studies provide more than one metric and that is good. However, for those that don’t, it is important to be able to relate one to another, with particular interest in what is happening in the 60-75 ppb range. Thus, a good way to convert would be useful. However, the relationship varies between city and between concentration range, so a single value to convert is not likely appropriate. (If it is, great, and show this.) Thus, it might be useful if EPA looks at how this conversion should be done and provide such in the ISA.I might recommend a graph of the 8-hr max compares to 24-hr average for a number of cities and the country as a whole.
2. PRB. The PRB discussion is pretty good, though abbreviated in that it was not apparent what the conclusion is (likely because this is a 1st draft and that updated PRB analysis will be done). Further, and while I do not know how it is best to address this subject, is that this could be a very key issue since the results show that the PRB levels in parts of the country could be similar to the levels of a proposed standard, thus suggesting the

Preliminary Individual Comments from Ozone Review Panel. These are individual panelists’ comments that do not represent consensus CASAC advice or EPA policy. Updated 5-17-11
84
potential need for changing the form of the standard. I suspect that info from the recent PRB workshop will be utilized, assuming that the publication is completed and accepted. To me, the fundamental question is how to mix an observed quantity with a modeled quantity, particularly a modeled quantity that has apparent bias in some locations. Further, it is not apparent that a bias-less product will be developed (if so, great). Thus, a question is how one can modify the PRB to remove bias, or how to use the simulated ozone that is due to North American emissions, along with observations. At present, I think that the former is easier and less open to criticism. EPA should set out a strategy to identify the reason for the observed biases. I think this can be done using the adjoint capabilities in the model. The knowledge gained from such an exercise can provide some confidence in using an adjusted PRB product. In regards to how knowledge of the PRB might influence the determination of the form of the standard (or averaging time), it would be good to provide additional information on PRB ozone distributions for key urban locations, along with values akin to the design value based on 4th highest, 10th highest (etc.), 8-hr ozone. The details could be in the Appendices, but summarized in the main report.
Chapter 9 can be shortened, and streamlined to directly address what are the appropriate indicators. This ISA, as well as the documents developed in the last review, provide strong support for the linkage between ozone and ecosystem damage, and CASAC concurred. What needs to be taken head on is which metric(s) is best and why.
Chapter 10 does a good job of addressing how ozone can potentially impact radiative forcing and hence global change. A couple of things are needed to complete some of the thoughts that go along with this in terms of standard setting. First, it would be good to also integrate the information from the PRB analysis and modeling in to this chapter, e.g., taking on the question of what the impact of the ozone from NA emissions. A second issue is how the warming can impact health. Be very careful to note the uncertainties associated with assessing how health impacts might be linked to future climate changes. I might refer to the Weaver manuscript (BAMS) that discussed the results from many groups. Some general comments that should be addressed throughout:
1. Given that this document is to be used for policy determination, the staff should be very careful to only use studies that have relied upon data and models that are now or have been readily available and/or have been independently evaluated and verified. If the staff feels that specific references that do not fall in to that category are absolutely necessary, they should identify this problem and justify the use of that study within the document. This should be an underlying principle for such documents and assessments (and it might extend beyond documents that are used for policy setting).
2. Make very sure that the figures and tables have the appropriate units and metrics specified
in detail (e.g., “3-yr average of the 4th highest 8-hr maximum daily ozone” as opposed to “ozone”).

Preliminary Individual Comments from Ozone Review Panel. These are individual panelists’ comments that do not represent consensus CASAC advice or EPA policy. Updated 5-17-11
85
3. It would be good if every chapter had an “overall suimmary” and “gaps in knowledge”
similar to Chapter 5.
4. Ozone (and other pollutant) results from models applied to historical cases should be referred to as “modeled” or “simulated” as opposed to predicted
Some specific comments:
• 1-2-26: “mobile” • 1-4-3. I might rephrase “Photochemical pollution (or smog) is a mixture of pollutants,
many of which are oxidants formed from reactions that take place in the presence of sunlight. Historically, ozone has been used as an indicator of photochemical smog, in part because it is one of the most abundant photochemical pollutants and it has been demonstrated to have health effects.”
• 1-7-12: You should make explicit the current status of the standard and what it means that the Administrator has decided to reconsider in terms of actions taken to meeting an 0.075 standard.
• Chapter 2: the amount of text on the plant impacts is a bit out of balance. . • 3-2-5: compounds, as well as particulate matter. • 3-3-7: … in the eastern US, concentrations of• 3-3-28 remove small scale unless you are ready to define it (and it is unnecessary here).
ozone
• 3-4-8 “square kilometers” is not a distance, and a few thousand square km is not that big of an area.
• 3-4-15 Make sure you are consistent about the importance of stratospheric exchange throughout the document.
• 3-6-14: I do not think compensated is correctly used here. • 3-6-34: What is a small amount? 0.05%, 0.5% 5%? • 3-7-8: Are you saying that wildfires are anthropogenic and contribute 1/6 of the
anthropogenic VOCs? • 3-7-28: It is important to note that controls mute the response of CO formation to fuel-
oxygen. • 3-8-33: I think VOC was defined earlier. • 3-9-11 “they” is ambiguous. • 3-9-25: Make sure NOz is defined. • 3-11-12 “… O3 and other compounds• 3-17-6: We don’t just use finite difference techniques, and there is no reason to bee this
specific anyway. (also found on 3-19-7)
.”
• 3-17-23: “… about• 3-18-4 “Historically, CMAQ has been…”
100 hPa,”
• 3-20-40/24: This paragraph raises problems that need to be more quantifiably demonstrated to be an issue in the general application of models in practice. Provide citations and relate to magnitude of other problems.

Preliminary Individual Comments from Ozone Review Panel. These are individual panelists’ comments that do not represent consensus CASAC advice or EPA policy. Updated 5-17-11
86
• 3-21-11: Is the MCM considered a benchmark? I would suggest that being shown to reproduce the controlled laboratory studies is more of a benchmark.
• 3-21-38: Provide citations as to the importance of coupling and also what is meant by heavily polluted (Beijing or LA?) Be quantitative. From reading this chapter one might get the idea we should not use CMAQ because it does not include enough vertical resolution, does not resolve the nocturnal jet, the chemical mechanism is flawed and not as good as the MCM, and does not generally incorporate coupling. Are you ready to say this?
• 3-23-7: Actually many components are tested individually when possible. • 3-25-24/26: Again, this part is speculative and citations are necessary. Should we not use
CMAQ? • 3-33-29:L Should you add low spatial resolution such that elevated sites are not fully
captured. • 3-33-35: Show this graphically. • 3-37-6 It is not that the air is too high, it is that the simulated ozone concentrations are too
high. • 3-55-33: A mixing ratio is not, technically, a concentration. You might state this, but then
say the general practice is to call ppm/ppb concentration. • Fig. 3-18: It would be of interest to identify the two outliers. • Tables 3-6& 3-7: I don’t see the Max column. • Table 3-9: SEARCH monitors year-round. • Figures 3-30/35: Possibly a couple more in Appendix. 3-83-20: The AM monitoring site
seems to be the real outlier to be discussed. • 4-14-17/25 The choice of articles cited is rather (extraordinarily) strange. Choose the
classical and most influential ones. Preface, second line: I hope that the NAAQS are promulgated to protect public health and welfare, as mandated by Sections 108 and 109. Chapter 1. Table 1-1: There are too many significant figures in the concentrations given in ug/m3 units. Chapter 2. Physics and Chemistry of Ozone in the Atmosphere Overall: This Chapter summarizes what is known about the physics and chemistry of ozone in the atmosphere, with particular emphasis on tropospheric ozone and literature published since the last criteria document. Overall, the chapter, along with the annex, provides a comprehensive picture of what we know about how ozone is formed, transported and removed from the troposphere, and thus provides the necessary foundation for the rest of the document in terms of providing a basic amount of information to a reader with relatively little knowledge of atmospheric ozone dynamics. As noted below, the chapter I think suffers from the charge to review the most recent science (i.e., since the last Ozone Criteria Document, or OCD), and that our understanding of ozone chemistry and physics was already pretty mature at the last writing. Thus, concentrating on what is new since then sort of skews the presentation.

Preliminary Individual Comments from Ozone Review Panel. These are individual panelists’ comments that do not represent consensus CASAC advice or EPA policy. Updated 5-17-11
87
I am, however, concerned about a few things. First, it is not well laid out in that it seems to skip around and have strange transitions. That can be fixed (comments are made on the hard copy to be returned). A deeper concern is that I believe it over emphasis uncertainties, and could be construed as to suggest that there is a lot of uncertainty as to how ozone might respond to controls. Yes, there are uncertainties, but our understanding of ozone dynamics is relatively mature, and we generally understand how ozone will respond to controls. Also, it seems to spend more time discussing stratospheric intrusions than is called for given the relatively minor effect that has on exposure of the general population to elevated ozone. This, too, might detract from conveying an accurate reflection of our state of knowledge on ozone control. If one looks at our advances in the study of tropospheric ozone since the last criteria document, I would emphasize four things: 1) Intercontinental transport, 2) Advances in modeling tools (e.g., CMAQ/MM5/SMOKE and specific source apportionment approaches), 3) Improvements, but continued uncertainties in emissions estimates, and 4) linkages to particulate matter. While mentioned, these are not at all stressed in this chapter in proportion to their importance. I would also note that we are just now developing a modest level of understanding of how climate change might impact future ozone levels and management. Associated with this, but not discussed in this chapter is how recent weather patterns have impacted ozone levels. There should also be more of a discussion about what was found as the reason for the periodic very high levels of ozone in Houston. Thus, I would suggest that a revised chapter consider providing greater emphasis on the four topics listed above, providing a more balanced assessment of our state of the knowledge, focus on what one needs to know to address human (and ecosystem) exposure to elevated levels of ozone, and what changes in ozone dynamics might occur due to climate change (though, the latter should be couched as being highly uncertain). I would also not constrain the chapter to primarily highlighting more recent studies. Again, our knowledge of ozone dynamics is relatively mature, and was so at the time of the last criteria document. Highlighting the most recent literature skews the discussion to topics that are of less central concern as those were addressed earlier on. Specific Comments: 2-1-7 (i.e., Chapter 2, Page 1, line 7). It concerns me that they do not, up front, include CO as a precursor to ozone given its impact in urban areas. Later on, this is discussed, to a limited extent. However, it is appropriate to include it here. 2-1-10: the phrase: “atmospheric mixing and processing on cloud and aerosol particles” is too limiting. There is much more happening in clouds. I might rephrase as atmophseric mixing, cloud processing, reaction with aerosol particles. Also, deposition, emissions and surface characteristics should be added to the list. 2-2-2: Note that HNO3 and sulfuric acid form PM and HCHO is a toxic. 2-4-6: Reaction with Cl is brought up here, but not for alkanes. However, if Cl is to have a main impact, it is the reaction with alkanes. I think the whole discussion of Cl chemistry is a bit

Preliminary Individual Comments from Ozone Review Panel. These are individual panelists’ comments that do not represent consensus CASAC advice or EPA policy. Updated 5-17-11
88
overblown given its importance (as discussed somewhat in the Annex). NO3 also reacts with alkanes (though this is more minor). The discussion of alkane and alkene chemistry should be made more parallel. The major difference is reaction with ozone, and that alkene oxidation proceeds by addition at the double bond. 2-5-13: This sentence is contradicted by the Annex. The mechanism for the reaction between OH and an aromatic is reasonably well understood… it is the further steps that are uncertain. 2-5-18. What are you trying to say about particle formation: The particles might reduce ozone, or just the loss of carbon from the system reduces the potential to form ozone? 2-6-12: HONO formation could increase ozone. 2-6-23: This section overemphasizes tropospheric folding, and underemphasizes the real causes. As noted in Chapter 3, this is not a major process contributing to elevated exposures. 2-11-2: Repetitive. 2-12-1-2-12-7. Not sure the point, and lacks quantitative information. Does this really impact
exposure to high levels of ozone? How often is this important (if ever)? 2-12-26… While there is not as strong of a trend in the Phoenix data, it appears as though there is some trend. The discussion of why ozone goes up with T in New York is too brief to be useful, and as it currently exists, is misleading. Ozone goes up with temperature more in New York than Phoenix because of other factors that correlate with T: wind speeds, mixing heights and emissions. 2-14-9: There is a net destruction of ozone in the plume very near to a power pant. Further downwind, there is ozone production. 2-14-17: Oxidation of VOCs can consume free radicals at low NOx (RO2-RO2; RO2-HO2 reactions). This sentence should be rethought. 2-14-24: Use “involving,” not “invoking.”. Also, Jaegle et al is not in the ref. list. 2-15-18: Your discussion about Houston suggests that OPE is highly impacted by VOC levels as well. 2-17-17: rearrange: “…numerical algorithms describing the processes shown in Fig. 2-9…” 2-18-1: Not sure of the basis of the statement that existing mechanisms neglect many important processes. If this were the case, the mechanisms would not work so well. This sentence brings a cloud over the current state of practice that, I think, is not true. 2-19-7: Add “Nationally” before “About”

Preliminary Individual Comments from Ozone Review Panel. These are individual panelists’ comments that do not represent consensus CASAC advice or EPA policy. Updated 5-17-11
89
2-19-30: remove “vehicles” before the “.” 2-22-29. This last sentence, while true and I believe more correct than one might garner from the
bulk of the text, is not really in the prior parts of the chapter. The prior part of the chapter should provide a foundation for this statement.
Section 2.5 in general: Should be more concrete about the current performance of CTMs. Is there significant doubt as to their ability to be used to help assess controls and to be used for scientific investigation? (no). 2-27: Zhang et al (1997) reference is incomplete. Annex: Specific comments on the Annex are contained on the hard copy. Generally, the Annex is a relatively complete assessment of our knowledge, but suffers from many of the same problems as the chapter: emphasizing less important issues and being couched more as “what we do not know” than “what we know”. Chapter 3: Environmental Concentrations, Patterns and Exposure Estimates Overall: While I think Chapter 3 provides an adequate foundation for supporting standard setting, like Chapter 2, I found this chapter a bit scattered, and when I got done wondered what was meant to be conveyed. On the other hand, there has been a substantial increase in our knowledge in terms of ozone trends, background levels, intercontinental transport and exposures since the last OCD. In this chapter, they recapped much of the new information, though rather selectively, and this led to an imbalance in the presentation. In terms of the sections on Ambient Air Quality Data for Ozone, I think they would have been better off to present various ozone maps that are common to EPA, except showing the metrics of interest, and the diurnal variations of ozone at representative stations. This is done in the Annex on a region-by-region basis, which sort of chops things up (and the graphics leave a bit to be desired). Many of the tables they have are usually too long to make a point, and can be put in the Annex (e.g., Table 3-2, 3-3 and3-5). In discussing trends, at the end of the section I was left wondering what point they were trying to make: is ozone going down or not, where is it going down, etc. Again, EPA has some nice figures showing trends in various locations, and those might help (e.g., the Figs. AX3-49 and 50 do this better than their current discussion). The discussion of “co-occurrence” with other pollutants, as discussed below, did not contribute much. One section that I liked was the discussion of policy-relevant background ozone. This was relatively short, to the point, and had a good foundation. I have some issues with a bit of the interpretation, as discussed below. The discussion of indoor sources of ozone did a good job of presenting the state of knowledge, though it would have helped if they had made a better linkage between the rate of ozone emissions of some indoor sources, AERs and resulting concentrations, even if just approximate.

Preliminary Individual Comments from Ozone Review Panel. These are individual panelists’ comments that do not represent consensus CASAC advice or EPA policy. Updated 5-17-11
90
The human exposure section did give a reasonable view of that part of the exposure assessment issue, though I would have liked to see more hard results, though this was covered in relatively good detail in the Annex. I did like where in the subsection on Personal Exposure and Ambient Concentrations they gave a nice, solid, bottom line, i.e., the last sentence beginning with “Results from these…”. More of the chapter would benefit from having similar bottom lines at the ends of the subsections and are as motivated by the preceding discussion and extended discussion from the Annex. Detailed Comments: 3-1-21-23: There are a lot of special study data that can provide additional information on the relationship between ozone and other oxidants, and one can also use the results of various models. 3-3-1 to 3-3-7: This should not be couched in urban vs. rural. Many power plants and other facilities with large emissions are not in urban areas. Likewise, major highways can have marked local impacts in non-urban areas. 3-3-6 (and other areas): NO emissions depress ozone both by direct titration as well as radical destruction. As noted in the prior chapter, this NOx-saturation (often called radical-limited) region of the ozone formation regimes can be very important in lowering ozone locally. 3-3-12: Again, why just urban? 3-3-17: What do you mean “allowable” ozone season? 3-5-11: Not sure what the point is: They start out saying that “Ozone concentrations measured at
the center city sites are often lower” Then give some statistic about the frequency of levels which is a nonsequiter from the prior sentence. Then they talk about where the highest values are found (Texas and So.Cal) at a very different scale. They end up talking about more exceedences of the one hour than eight hour standard.
3-5-30: Variation in what? Years, sites, regions? The way this sentence is worded, it seems as
though they are using it as causal in reference to Table 3-4. The concluding sentence (3-6-1) is rather vague: what else is there to significant importance?
Tables 3-3, 3-4: So long as to make them contribute little. Relegate to the Annex. 3-27-29 and on to 3-28-10: This paragraph really does not provide much support to using the Mt.
Lassen data for estimating background trends. In fact, it provides significant evidence (particularly along with the later analysis from Fiore et al.) that it is impacted, and should not be used.
3-28-25: This is not primarily a high vs. low elevation issue. It is primarily urban vs. rural issue
(or near sources of NOx vs. more removed).

Preliminary Individual Comments from Ozone Review Panel. These are individual panelists’ comments that do not represent consensus CASAC advice or EPA policy. Updated 5-17-11
91
3-31-5: Should be “as” 3-31-21: This paragraph seems to start out with a (rather weak) conclusion, then provide some
support. Suggest revising it, and strengthening the foundation. Table 3-6: Define CoD 3-35-7 though 10: Be specific as to where it would take 70-90% reduction. Tha is not universal. 3-35-13: Not appropriate use of process analysis unless integrated over the whole domain
(vertically and horizontally). They should note, in this case, that process analysis does not distinguish if the CO is emitted or produced in the atmosphere.
3-35-13: The impact of the Asian emissions increase on surface ozone is still very uncertain, and
the Fiore et al. results suggest it is not big. 3-36-3: Note the type of test used. Section 3.6: Relationships Between Ozone and Other Species: This section is rather weak, and
often arbitrary in the approach taken. While the data shown in Figure 3-6 mean something, the data presentation approach used to develop Figs. 3-7 to 3-9 relies on an arbitrary value for high ozone and the other pollutant. What if they chose 0.02 ppm: then they might get a high frequency of co-occurrence. I would shorten this whole section, and present the data as in Fig. 3-6 or something similar. Also, I don’t see a big need for this section.
Section 3-7: As noted above, nice piece. 3-45-13: Strange citation format. 3-46-19 (and other places) Do not need the “a” in 2002 and 2003 Fiore et al. references. 3-47-5: From what is shown, the cutoff should be 1.5 km. Also, When I look at 3-11, Apr-May
low lying sites, the background is NOT consistently lower. 3-49-1: This statement, which is true, should be reflected in the discussions in Chapter 2. Fig. 3-12: Context? 3-51-14: Remove “and”. Table 3-9: Define the regions used. 3-57-4: How important are the OH reactions? This is a bit weak.

Preliminary Individual Comments from Ozone Review Panel. These are individual panelists’ comments that do not represent consensus CASAC advice or EPA policy. Updated 5-17-11
92
3-59-5: The co-occurrence with fine particles does not make it difficult to assess ozone dynamics and exposure patterns. It may make it difficult to assess the impacts of exposure.
3-59-11: Should also reference Chapter 2 which has a more complete discussion. 3-60-9: Need to define breathing zone to make this paragraph meaningful. How big is this
breathing zone? Other corrections contained on the hard copies. Annex: Comments on the hard copies, though is a rather massive amount of information,
presented in a somewhat scattered fashion. However, some approaches to data presentation are better than the Chapter.

Preliminary Individual Comments from Ozone Review Panel. These are individual panelists’ comments that do not represent consensus CASAC advice or EPA policy. Updated 5-17-11
93
Dr. Helen Suh
CASAC Review of First External Review Draft Integrated Science Assessment for Ozone and Related Photochemical Oxidants
Helen Suh, Sc.D. May 19-20, 2011
Response to Charge Question 3: Chapter 2 presents the integrative summary and conclusions from the O3 ISA with detailed discussion of evidence in subsequent chapters. Is this a useful and effective summary presentation? How does the Panel view the appropriateness of the causal determinations?
General Comments Chapter 2 is an effective and useful presentation of the health and welfare findings for ozone. The Chapter clearly and cogently summarizes and integrates findings, successfully relating new findings to those from the earlier 2006 AQCD and highlighting whether and how the new findings support or contrast these earlier findings. The inclusion of welfare, climate change, and UF-B effects in this summary chapter was welcomed. I In general, the Agency’s determinations of causality were appropriate, with the exceptions of the causal determinations of “suggestive” for the effects of short- and long-term ozone exposure on cardiovascular effects. The causal determinations of “suggestive” for the effects of short- and long-term ozone exposure on cardiovascular effects should be better justified or possibly revisited. Although findings from toxicological studies provide some evidence of short- and long-term ozone impacts on cardiovascular effects, very few epidemiological studies examining ozone-mediated cardiovascular effects have been conducted, with their findings inconsistent (as summarized in Section 6.3.2.9 and Section 7.3.3) and possibly confounded by PM2.5 or sulfates. Further, substantial questions remain regarding the biological mechanisms by which ozone may impact cardiovascular health. It is not clear from the criteria described in Table 1-3 whether together the body of evidence is sufficient for a causal determination of “suggestive”. To serve as a more effective integrative summary, the Chapter would benefit from a reorganization or more distinct delineation of the sections, with the primary goal to reduce repetition of health findings. Section 2.6 (Integration of Ozone Health Effects) repeats much of the health evidence presented in Sections 2.3.2 (Possible Pathways/Modes of Action) and 2.4 (Health Effects). Of the sections, I found Section 2.6 to be the best, as it was a cogent and concise summary of our understanding of ozone health effects that integrated findings from the different disciplines. Section 2.6 was enhanced further by its effective use of tables and figures and by its noting of the ozone levels at which relationships or effects were observed. If the Chapter were to be reorganized, it is possible that Section 2.4 and Section 2.3.2 could be replaced by Section 2.6, with the summary tables of causality determinations (Tables 2-1 and 2-2) kept at the beginning of Section 2.6. Absent of a reorganization, the purpose of the sections should be more narrowly defined to minimize their overlap. Specific Comments
Preliminary Individual Comments from Ozone Review Panel. These are individual panelists’ comments that do not represent consensus CASAC advice or EPA policy. Updated 5-17-11
94
• Study Citations: Study citations should be included for the best of the relevant studies and for major statements (for example, the sentence beginning “recent studies in humans and animal models…” on Page 2-20, line 6-7). Such citations would help connect the summary to later discussions and would provide more scientific context.
• Exposure Error: o Page 2-13, lines 36-39; Page 2-16 lines 13-15: The document states that “Taken
together, results from previous and recently published studies indicate that while….O3 concentrations measured at central-site monitors are representative of day-to-day changes in average personal O3 exposures. This conclusion does not follow the preceding phrase nor is well supported by the scientific literature. The agency should either revisit its conclusion or provide a better basis for its conclusion.
o Page 2-15, lines 21-25: The phrase beginning “although this may be less of an issue for ozone …” appears to contradict findings of intra-urban, traffic-related variability in ozone levels. Since many epidemiological studies are based on MSAs, with populations living in both urban and suburban environments, it is not clear that this is less of an issue for ozone as compared to other pollutants. Further, evidence from Atlanta study may not be directly applicable, given that an alternative explanation could be that ozone is not related to changes in HRV in this study.
o Page 2-15, lines 27-29: Even though ozone may exhibit low spatial variability in comparison to CO and NOx, ozone may still vary enough spatially to impact epidemiological studies and exposure error. Further, issues related to confounding in epidemiological studies have to do more with PM2.5, for which spatial variability is less than that for ozone.
• Diagram: Page 2-17, Section 2.3.2: This section would benefit from a flow diagram or other figure, such Figure 2-2, describing the possible pathways and modes of action by which ozone causes damage. The addition of such a diagram again speaks to the need for possible consolidation of section 2.3.2 with section 2.6.
• Organization: o Page 2-24, lines 4-12: This section includes discussion of ozone-related impacts
on respiratory mortality, which is misplaced and may confuse the reader with regard to the causal determination that follows, which does not include mortality.
o Page 2-25, lines 8-14: This section includes discussion of ozone-related impacts on cardiovascular mortality, which is seemingly misplaced. Since ozone-mediated cardiovascular mortality impacts were considered in the causal determination for O3 and cardiovascular effects, it is possible that this section of the chapter should be reorganized to improve its flow.
Preliminary Individual Comments from Ozone Review Panel. These are individual panelists’ comments that do not represent consensus CASAC advice or EPA policy. Updated 5-17-11
95
o Page 2-28, Section 2.4.2.1: This section should be reorganized to make a clearer case supporting the Agency’s causal determination. For example, lines 7-13 should be incorporated into the paragraph beginning on line 19, as they discuss the same effects. In addition, the evidence from rodents and primates was not introduced in this section, but referred to here.
o Page 2-29, lines 23-27: The sentence beginning “Although questions exist…” refers to possible modes of action, which should have been first introduced in Section 2.3.2.
o Page 2-29, Section 2.4.2.3: Section 7.4.10 is essentially the same section. It, however, summarizes and supports the causal determination of the impact of ozone on reproductive and developmental effects more effectively in almost the same amount of space.
• Potential for Confounding: Page 2-25, Section 2.4.1.2: his section should discuss the potential for confounding of ozone-mediated cardiovascular effects by other pollutants and acknowledge the general lack of studies investigating this issue.
• Susceptible Populations: Page 2-25, lines 6-8: This sentence about susceptible populations is conjecture and should be rephrased.
• Cardiovascular Effects: Page 2-25, lines 17-19: The literature examining the relation between ozone and HRV is mixed. A phrase or sentence to this effect should be added.
• Mortality: Page 2-26, lines 15-18: This section should clearly state whether research post-2006 more fully established the underlying mechanisms by which ozone contributes to mortality. If so, what are these mechanisms?
• Welfare Impacts: Section 2.7 would benefit from the addition of information about the ozone levels at which the adverse impacts were observed.
Climate Change: A summary causal determination table is missing.

Preliminary Individual Comments from Ozone Review Panel. These are individual panelists’ comments that do not represent consensus CASAC advice or EPA policy. Updated 5-17-11
96
Dr. James Ultman
Chapter 5. Dosimetry and Mode of Action
The new literature on O3 dosimetry and mode-of-action and its integration with the literature available in the 2006 ACQD is presented in sufficient detail to serve as a background for the health risk assessment. The material is organized in a logical fashion. However, I do think that there was not a clear distinction between the material on O3-ELF reactions as presented in sections 5.1.2 and 5.2.2. I recommend that the former section focus on issues that are primarily directly connected on dosimetric aspects such as the structure of kinetic rate equations, rate constant values of different substrates, and diffusion-reaction models that estimate O3 penetration into ELF. The latter section should be more concerned with issues that influence mode-of-action such as mechanisms of the O3-ELF substrate reactions and the toxicology of the possible reaction products. I found very few statements that I considered inaccurate. But I did feel that there is a lack of clarity regarding how breathing pattern changes affect O3 uptake. For example, figure 5-3 indicates that O3 uptake efficiency among different subjects decreased with increasing breathing frequency. The figure caption fails to point out that the subjects were coached to maintain the same minute volume. Thus, the decrease in frequency was also accompanied by an increase in tidal volume. I also think there needs to be one place in section 5.1.3 (Possibly, the paragraph beginning on line 9 on page 5-8) where all the dosimetry terms used in the chapter are carefully defined and compared. The terms I can think of are: flux, absorbed fraction, absorption efficiency, inhaled dose, net dose and tissue dose. Also, given the potential importance of exercise on physiological responses to O3, I suggest that the subsection on “Physical Activity” (page 5-14) more fully discuss the specific breath patterns (e.g.,. frequency and tidal volume) associated with different exercise levels. For example, a change from low to moderate exercise level is accompanied primarily by a change in tidal volume whereas an increase in frequency becomes more important when exercise increases from moderate to heavy levels. Based on past dosimetry measurements and dosimetry models, how do these different breathing patterns at different exercise levels expected to affect ozone uptake and uptake distribution? Page:Line, Table or Figure Specific Comments and Suggestions 5-4:3 Perez-Gil work was published after 2006. 5-7:8 to11 It is unlikely that O3 molecules are reacting in the gas phase since the substrates are not volatile. Perhaps, the concept to stress is the large surface to volume ratio of microdrops that may promote an interfacial reaction that is not evident from previous studies that used bulk liquid phase bioreactors.

Preliminary Individual Comments from Ozone Review Panel. These are individual panelists’ comments that do not represent consensus CASAC advice or EPA policy. Updated 5-17-11
97
5-9:1 Change “lung” to “lung epithelium” 5-10:20 to 22 Replace sentence “Uptake…concentration” with “Uptake efficiency is changed by a number of variables including O3 exposure concentration, exposure time and breathing pattern. For breaths of similar waveforms, respiratory patterns are uniquely described by frequency (fB) and tidal volume(VT), by minute volume(MV=fV×VT) and fB, or by MV and VT. Respiratory flow that is directly related to MV is less frequently used.: 5-10:25 The statement about Overton’s simulations that “fraction uptake increased with VT” does not indicate whether fB, MV or neither were held constant. 5-10:25&26 Subjects in the Ultman study targeted a fixed MV so that increases in VT were accompanied by decreases in fB. I think that breathing in Gerrity’s study was unconstrained. 5-10:28 Change “…the lung.” to “the lung at a particular MV.” 5-10:28 & 29 The sentence “While…fB.” is no longer needed if previous suggested changes are made. 5-10:30-32 Change the sentence “Nasal…(Fig. 5-3).” to “Nasal O3 uptake is inversely proportional to flow rate (Santiago) so that an increase in MV will increase O3 delivery to the lower airways. At a fixed MV, increasing VT (corresponding to decreasing fB) drives O3 deeper into the lungs and increases total respiratory uptake efficiency (Fig. 5.3). 5-10:32-33 State whether VT or MV (or neither) was kept constant in Overton’s simulations. 5-11: fig 5-3 Change graph and caption labels uniformly to either “uptake fraction” or uptake efficiency.” 5-11: 11 to 12 The portion of the sentence “This…inlet air…” is not accurate. Ozone uptake fraction (or efficiency) is normalized by the amount of O3 in inhaled air. Thus, when diffusion and reaction rates are proportional to O3 concentration, O3 uptake fraction is independent of inhaled O3 concentration. On the contrary, O3 uptake is an unnormalized quantity that will be proportional to inhaled O3 concentration when diffusion and reaction rates are linear (Actually, Santiago did find a slight negative dependence of uptake efficiency on inlet O3 concentration. Still, one can conclude from her results that the transport processes are essentially linear with respect to O3). 5-11: 16&17 The beginning of the sentence “Increased fB will shift the O3 uptake…..” should read “Decreased fB at a fixed penetration volume will shift O3 uptake…
Preliminary Individual Comments from Ozone Review Panel. These are individual panelists’ comments that do not represent consensus CASAC advice or EPA policy. Updated 5-17-11
98
5-12:14 &15 The sentence “Similarly…efficient” doesn’t make sense to me since fractional O3 uptake by the respiratory tract is essentially equivalent to O3 uptake efficiency. You might want to remove this statement. 5-13:6 This sentence makes more sense if “O3 uptake by the respiratory tract” is replaced by “O3 induced responses such as FEV1. 5-15:32 Define MCA, CSA2 and CSA3. 5-16:5 Change “…in smokers…” to “…in smokers during continuous O3 exposure.” 5-16:13 Change sentence “Fractional absorption will decrease with increasing fB and decreasing VT when MV is held constant.” 5-17:13 Change “structure” to “structure and ELF chemistry.” 5-54:11&18 These sentences are repeated, word for word. 5-55:4 Change “extrapulmonary effects of O3” to “extrapulmonary effects of relatively high levels of O3 exposure. 5-61:4 Define CAPS

Preliminary Individual Comments from Ozone Review Panel. These are individual panelists’ comments that do not represent consensus CASAC advice or EPA policy. Updated 5-17-11
99
Chapter 6. Integrated Health Effects of Short-Term Ozone Exposure (J.S. Ultman)
This chapter contains a huge amount of information, and the authors are to be commended on both the organization and the clarity of writing. There are only a few possible improvements that I would like to suggest. First, the exposure-response curve in figure 6.1 that is obtained from McDonnell’s publication provides strong support for the response data from laboratory research on humans at low exposure concentrations. Thus, more detail concerning the nature of the model and data utilized to estimate the model parameters should be given in this chapter. Second, many of the pulmonary function responses in section 6.2 are reported as pre-to-post exposure changes in an endpoint relative to that observed in filtered air; this is referred to as “O3-induced response.” In many if not most studies on healthy subjects, pulmonary function measured after exercising and breathing filtered air improves relative to pre-exposure measurements. Thus, O3-induced response might be significantly larger than the corresponding pre-to-post changes in an endpoint. Because of this, I feel that the chapter needs to contain some specific information comparing pre-to-post responses to O3 with the corresponding O3-induced responses that are referenced to filtered air. Third, I think that many of the graphs comparing epidemiological studies with different endpoints placed above a single abscissa (figures 6-3 to 6-11) are confusing. I think it would be better if studies were grouped above different abscissa’s, each having a range of values that is logical for the endpoint in question. Page:Line, Table or Figure Specific Comments and Suggestions 6-6:35 Remind reader what is meant by “inhaled dose.” 6-6:36 Units on dose rate should be in “ppb per unit time.” 6-8:15 to 17. Does this sentence imply that a threshold exposure concentration is possible? 6-10:10 I don’t think that “clinically meaningful” can be equated to an adverse health effect. Can you be more precise in your understanding of this term? 6-13:11 Define SES. 6-19:8 I couldn’t find the values 0.76 and 48 in table 6-2. 6-20:Fig. 6-3 I suggest breaking this down into two graphs with unique units on their abscissa’s. The present use of a single absicca that accommodates two different units does not help me compare the results of the studies with two different endpoints.

Preliminary Individual Comments from Ozone Review Panel. These are individual panelists’ comments that do not represent consensus CASAC advice or EPA policy. Updated 5-17-11
100
6-27: Fig. 6-6 Please give the rationale in the text for the standardization stated in this and several other figure captions.

Preliminary Individual Comments from Ozone Review Panel. These are individual panelists’ comments that do not represent consensus CASAC advice or EPA policy. Updated 5-17-11
101
Dr. Kathleen Weathers Question 10: Chapter 9 describes effects of O3 on vegetation and ecosystems. Are the major effects of O3 exposure on vegetation and ecosystems identified and characterized? To what extent do the discussions and integration of evidence across scales (e.g., species, communities and ecosystems) correctly represent and clearly communicate the state of the science? Has the ISA adequately characterized the available information on the relationship between O3 exposure and effects on individual plants and ecosystems? Are there subject areas that should be added, expanded upon, shortened or removed? In general, I think that this chapter is quite clear, and clearly presented; it describes in some detail the major effects and pathways that ozone impacts species and ecosystems. It was helpful that the new knowledge-- and to what extent this information supported (or did not) previous ISA conclusions –was identified in the text. It appears, however, that there is little additional, directly relevant (to standard setting) scientific literature that has been published since the last ISA. Nonetheless, the last part of Chapter 9, where the newly-published data and studies were integrated and compared was quite useful. While a significant part of the chapter was focused on the results from new tools that reveal physiological mechanisms of damage due to ozone, and there was some redundancy among sections, I did not find it problematic. General and specific comments: It would be useful to include a conceptual diagram of how ecosystem processes (the flow of energy, materials and information—e.g., productivity and nutrient cycling) have been shown to be, or are likely to be affected, based on the research presented. To wit, I found Figure 9.1 to be a bit too simple, somewhat misleading and overly descriptive; I think that actual effects on processes at interacting plant, community and ecosystem scales could be demonstrated, even when there is still considerable uncertainty. Many of the processes shown in the “plant” scale, for example, are those that are central to biogeochemistry/ecosystem fluxes of nutrients (e.g., decomposition). Similarly, many of the processes outlined in Table 9-1 are linked (reduced productivity and C-sequestration, for example). In fact, later in the chapter, Figure 9.7 might be reused and modified to illustrate relative magnitudes of ozone effects (based on the literature). “Scale” should be defined when it is used throughout the document—spatial, temporal, or? I found water production to be awkward phrasing. Water redistribution might be a better way to characterize this “ecosystem service” (page 9-3). The meta analyses that have been performed since 2006 are quite important to this ISA. They are central to “what’s new” in this document. Some clarification about those results is needed, for example, do the results from the meta analysis (page 9.8) refer to current annual average ambient concentrations? 9-64: I’m confused about the sentence that starts with “Conversely” on line 25.

Preliminary Individual Comments from Ozone Review Panel. These are individual panelists’ comments that do not represent consensus CASAC advice or EPA policy. Updated 5-17-11
102
9-68: The description and definition of ecosystem could be strengthened. What’s most important is that ecosystems “have” boundaries—they are defined by the researcher (or whomever is discussing an ecosystem), and are often connected to some physical process (e.g., watershed), but it is an important part of the ecosystem concept. I suggest adopting, or at least comparing/examining The Millennium Ecosystem Assessment’s definition and description of ecosystem services (9-69). See my general comment about use of “scale” throughout the ISA. It would be useful to include the range of spatial scales inferred on 9-69, line 24. 9-69: I’d get rid of the first line on line 24—it suggests that ecosystem effects are the sum of the (plant) parts, which is unlikely to be true. Storage and transformation of carbon in an ecosystem, for example, often has much to do with microbial function in the soil as it does with plant fixation and respiration. 9-70: Again—see my comment about scale (line 2)—there’s nothing that suggests that ecosystems have to be large in spatial scale. 9-70: “Stand” should be modified, e.g., “forest stand," and, it is not a set spatial scale. 9-71: Zelig. MOSES-TRIFFID, etc. should be very briefly described, or at least classified (as in section 9.6.2). In fact, Table 9-5 should include both “spatial” scale in the column header and perhaps another column for the models that give a descriptor of the type of model. Further, a table of models in the ecosystem/landscape section, their classification (in this ISA), and a column that describes the primary mechanism invoked (e.g., 9-75, lines 13 and 14) would be a useful addition. Figure 9-7 could/should indicate that litter quality can be affected (e.g., C:N) in addition to litter inputs (amount) to the soil. It’s in the text, and should be in the figure. Further, Table 9-6 might include not just the effect on various metals or nutrients (“response” column), but also the carbon:nutrient or metal effect, if it was reported. 9-82, line 1: This section might start with a brief introduction to mineralization, and then note that nutrient cycling is a fundamental ecosystem function. Nitrogen is thought to be the limiting nutrient for most temperate terrestrial ecosystems. 9-85: I’m confused that a lysimeter (used to collect soil water) study was used to examine PLFA profiles. Qualify and/or describe. The description of the UNECE critical levels and differences between the UNECE and US in setting standards and planning targets for reductions is a useful and interesting contrast/discussion. The Table legend and column labels in Tables 9-11and 9-13 should be clearer in regard to the relative numbers (e.g., relative = ratio of elevated to ambient), or convert them to percentages and identify them as such. It would be helpful to add a comparative column in Tables 9-12, 1-13 and 9-14 that contrasts directly the methods/results. And, to further reinforce the results of these comparisons, I suggest adding some measure of “notably close” (page 9-135, line 2) in parentheses in the text. 9-125: “Nuisance variables…now there’s a euphemism for the research world! Adding a column that shows the general result of the meta-analyses listed in Table 9-15 would be useful as well.

Preliminary Individual Comments from Ozone Review Panel. These are individual panelists’ comments that do not represent consensus CASAC advice or EPA policy. Updated 5-17-11
103
Overall, I was struck by the fact that there remains a paucity of data and research about the impact of ozone in real field situations and/or that is useful to standard setting. The recent biomonitoring results and programs notwithstanding; much important monitoring and research is yet to be done.

Preliminary Individual Comments from Ozone Review Panel. These are individual panelists’ comments that do not represent consensus CASAC advice or EPA policy. Updated 5-17-11
104
Dr. Peter B. Woodbury Chapter 9 Comments Charge Question: Are the major effects of O3 exposure on vegetation and ecosystems identified and characterized? In general terms, yes. Charge Question: To what extent do the discussions and integration of evidence across scales (e.g., species, communities and ecosystems) correctly represent and clearly communicate the state of the science? In general the discussions do represent the state of the science, a few specific suggestions are presented below. Charge Question: Has the ISA adequately characterized the available information on the relationship between O3 exposure and effects on individual plants and ecosystems? In general terms, yes. The comparison of exposure response from the NCLAN and NHEERL studies with recent SoyFACE and Aspen FACE results is particularly useful as it clearly confirms that both approaches provide extremely similar results. The fact that these comparisons are so extremely close is quite important because it provides very strong evidence that we can have confidence in using these exposure response functions to estimate effects across multiple species and varieties and across multiple regions of the county. Charge Question: Are there subject areas that should be added, expanded upon, shortened or removed? It is difficult to strike the balance of being reasonably comprehensive, but not excessively long. The summary in Chapter 2 helps this issue by providing a brief summary of key results. The summary at the beginning of the chapter was initially confusing to me, but I think it should be retained because it is more thorough than the initial summary in Chapter, and provides key citations. Additional Chapter 9 Comments Page-Line 9-74. Table 9-5 should include “modeled” in the title. 9-71. Section 9.6.2.2. A more critical discussion and interpretation of model results would be useful. This draft just briefly lists a main conclusion from each of a number of studies. However, the models discussed are very different in scope and complexity. Some models represent all vegetation as a single “big leaf”. Other studies use detailed physiological models of single trees linked to stand-level models to represent competition among individual trees of different species. Not surprisingly, such different models produce different results. A more critical discussion focusing on the strengths and weaknesses of different approaches would be much more useful. 9-75. A more critical discussion of the differences in effects of ozone on transpiration from different models and from different experiments is warranted, focused on likely effects on streamflow at the catchment scale. Many such studies are discussed, including studies of tree

Preliminary Individual Comments from Ozone Review Panel. These are individual panelists’ comments that do not represent consensus CASAC advice or EPA policy. Updated 5-17-11
105
seedlings, mature trees in forests, and various modeling studies. But further critical discussion to clarify reasons for discrepancies among such studies is warranted as this is an important topic and with substantial supporting literature. 9-77. Better resolution for Figure 9-7 and other figures would make them easier to read. Additionally, the font on some of the smaller text in figures could be increased. 9-77. In Figure 9-7 and many other figures, an erroneous box appears often overlapping with the first letter of a sentence. 9-83. A more critical discussion of effects of ozone on forests, including the sacred fir forests in Mexico and forests in the Carpathian Mountains is warranted. The text briefly mentions that there are potentially confounding variables such as drought, but further discussion of the strength or weakness of the evidence for ozone effects is warranted. 9-90. Line 26-28 regarding pheromones does not fit within the subheading topic. 9-96. Line 10. There is a typo here and elsewhere for the citation – see “MEmberson” 9-114. In the legend for Equation 9-2, there is an erroneous box. 9-122. Line 4. Change “between prediction” to “between these predictions”. 9-122. Please clarify the 2 scaling methods. For example, on Line 24, are data from the SoyFACE study used in the scaling? 9-123. Table 9-12. Move column headings to match those in Table 9-11. 9-127. Table 9-14. Aligning data on decimal point, eliminating the 10ths place, and adding a comma for the thousandths place would improve readability. 9-131. Would it be possible to compare one of more of the recent meta-analyses to the NCLAN and NHEERL data by using a concentration metric to interpret the NCLAN and NHEERL results? Obviously, this is not as useful as comparing them using a metric such as W126, but would be better than no comparison at all. Chapter 10 Comments Charge Question: What are the views of the Panel on the scientific soundness and usefulness of the discussion in Chapter 10 on the role of O3 in global climate change and changes in mean global temperatures? In general, this chapter is useful, but this is a complex topic, with many interactions among gases, for example ozone concentrations can affect methane concentrations. Additionally, there may be important effects of ozone at the regional or continental scale in addition to the global scale, as discussed on Page 10-12. Could such regional impacts be additional to the range of impacts on radiative forcing cited from IPCC? If so, this topic warrants further discussion.
Preliminary Individual Comments from Ozone Review Panel. These are individual panelists’ comments that do not represent consensus CASAC advice or EPA policy. Updated 5-17-11
106
There could also be effects of climate change on circulation, thus on mixing of stratospheric ozone into the troposphere, although effects on surface-level ozone might not be large.
There may be complex feedbacks with vegetation, but there are substantial uncertainties in modeling such feedbacks due to limitations of models and heterogeneous responses of different types of vegetation to various aspects of climate change. For example, the publication by Sitch et al. (2007) may not adequately include the variation in response to ozone among genotypes within a species and among species. As discussed in Chapter 9, numerous experimental and modeling studies support the observation that in mixed-species communities, some species may increase growth in response to increased ozone exposure due to competition with species or genotypes that are more sensitive to ozone. Thus it is too simplistic to assume that ozone will decrease the growth of vegetation communities composed of mixtures of species, growth (and CO2 uptake) may not change if less sensitive species grow more quickly when released from competition by more ozone-sensitive neighbors. As discussed on Page 10-8, models currently seem to overestimate preindustrial ozone concentrations, indicating a lack of data, inadequate parameterization, or lack of inclusion of key processes in ozone chemistry models. Such uncertainty implies that there is substantial uncertainty about non-anthropogenic ozone concentrations. Discussion of this topic in relation to the policy-relevant background may be warranted. The conclusion that there is a causal relationship between tropospheric ozone and radiative forcing is warranted based on the scientific literature, as is the conclusion that there is likely to be a causal relationship between tropospheric ozone and climate change. Charge Question: Is there any information regarding the climatic effects of domestically produced O3 on climate in the U.S. that should have been included? As mentioned above, further discussion of potential regional and continental effects of ozone on radiative forcing and climate may be warranted. Charge Question: Is there important new information on UV-B effects or other welfare effects such as materials damage that have been overlooked and should be incorporated into this chapter? To my knowledge, the discussion of these topics is adequate.
Related Documents