Walden University ScholarWorks Walden Dissertations and Doctoral Studies Walden Dissertations and Doctoral Studies Collection 2015 Prehospital Staffing and Road Traffic Accidents: Physician Versus Trained Nonphysician Responders Timothy A. Grant Walden University Follow this and additional works at: hps://scholarworks.waldenu.edu/dissertations Part of the Public Health Education and Promotion Commons is Dissertation is brought to you for free and open access by the Walden Dissertations and Doctoral Studies Collection at ScholarWorks. It has been accepted for inclusion in Walden Dissertations and Doctoral Studies by an authorized administrator of ScholarWorks. For more information, please contact [email protected]. brought to you by CORE View metadata, citation and similar papers at core.ac.uk provided by Walden University

Welcome message from author
This document is posted to help you gain knowledge. Please leave a comment to let me know what you think about it! Share it to your friends and learn new things together.
Transcript
Walden UniversityScholarWorks
Walden Dissertations and Doctoral Studies Walden Dissertations and Doctoral StudiesCollection
2015
Prehospital Staffing and Road Traffic Accidents:Physician Versus Trained NonphysicianRespondersTimothy A. GrantWalden University
Follow this and additional works at: https://scholarworks.waldenu.edu/dissertations
Part of the Public Health Education and Promotion Commons
This Dissertation is brought to you for free and open access by the Walden Dissertations and Doctoral Studies Collection at ScholarWorks. It has beenaccepted for inclusion in Walden Dissertations and Doctoral Studies by an authorized administrator of ScholarWorks. For more information, pleasecontact [email protected].
brought to you by COREView metadata, citation and similar papers at core.ac.uk
provided by Walden University

Walden University
College of Health Sciences
This is to certify that the doctoral dissertation by
Timothy A. Grant
has been found to be complete and satisfactory in all respects, and that any and all revisions required by the review committee have been made.
Review Committee Dr. Bernice Kennedy, Committee Chairperson, Public Health Faculty
Dr. Chester Jones, Committee Member, Public Health Faculty Dr. Dorothy Browne, University Reviewer, Public Health Faculty
Chief Academic Officer Eric Riedel, Ph.D.
Walden University 2015
Abstract
Prehospital Staffing and Road Traffic Accidents:
Physician Versus Trained Nonphysician Responders
by
Timothy A. Grant
MSW, University at Albany, 1994
BA, Russell Sage, 1992
Dissertation Submitted in Partial Fulfillment
of the Requirements for the Degree of
Doctor of Philosophy
Public Health
Walden University
February 2015
Abstract
Road traffic deaths, which affect people in their productive years, are projected to be the
third leading cause of death by the year 2030. While most studies have focused on road
infrastructure and vehicle safety, this study examined something new: the impact of
prehospital response to road traffic accidents on the rate of death. Some countries send
physicians to the scene of an accident; some send paramedics or registered nurses. The
question this research sought to answer was whether the use of physician responders
resulted in a lower rate of death compared to the use of nonphysician responders. The
literature makes it clear that rate of road traffic death is related to country income and
governance indicators, so first those variables needed to be equalized. My conceptual
framework for this cross-sectional correlation study was the Haddon matrix, which
organizes injuries by temporal (pre-event, event, and postevent) and epidemiological
(host, agent, and environment) factors. Using World Health Organization data on road
traffic injury and country income, World Bank data on governance indicators, and a
literature search of 67 countries’ prehospital response profiles, significant negative
correlations (p > 0.001) were found for road traffic deaths and income, r (65) = –0.68,
and governance indicators, r (65) = –0.646. No significant difference in the rate of road
traffic death was found between physician and nonphysician prehospital staffing.
Because increasing countries’ income and improving governance are long-term,
ambitious goals for developing countries, training nonphysician prehospital responders
appears to be the most effective social change to decrease the burden of road traffic
deaths.

Prehospital Staffing and Road Traffic Accidents:
Physicians Versus Trained Nonphysician Responders
by
Timothy A. Grant
MSW, University at Albany, 1994
BA, Russell Sage, 1992
Dissertation Submitted in Partial Fulfillment
of the Requirements for the Degree of
Doctor of Philosophy
Public Health
Walden University
February 2015

Dedication
Copyeditors do more than fix grammar, spelling, and punctuation.
They solve problems every hour of every day and plant the flag for good
English and clear writing—a worthy goal in the age of emoticons and
Twitter shorthand. They save writers and the publications they work for
from embarrassment.
A copyeditor asks questions and makes suggestions that, for
whatever reason during the editing process, no matter how good the
assigning editors are, never got asked or suggested: What do you mean?
Who is this person ID’d by only a last name? That last sentence doesn’t
add much—it might be stronger to end with the previous one. This sounds
choppy. Oh, and nice lede.
The best copyeditors are born, not made. You can be decent at the
job with training and hard work, but it helps if you take pleasure in tasks
many people would find mind-numbing. (O’Sullivan, 2013)
This dissertation is dedicated to the unsung heroes of publishing.

Acknowledgments
People benefit from those who support and encourage them. I would like to thank
some of those who have help me achieve this goal. I thank my committee members, Dr.
Bernice Kennedy, Dr. Chester Jones, and Dr. Dorothy Browne, without whom I could not
have finished this project. I also thank Dr. Annie Pezalla, Dr. Nancy Rea, Dr. Tammy
Root, Dr. Jorg Westerman, Robert Brandt, Robert Vansco, Maria Jaworski, Lou
Milanesi, Martha King, and the administration of Walden University. I would be remiss if
I did not thank my form and style reviewer, Dayna Herrington, and the members of my
dissertation cohort for their support: Sharon Muff, Victoria Stewart, Regina Watson,
Bernadette Lonchke, Nalini Narotam, Ebony Gafferey, Catrena Burivck, and Tiffany
Simmons.
The person who deserves the greatest thanks is the person to whom I have
incurred a debt I can never repay, who for 25 years supported me through three degrees,
editing my work while striving to make the work of hundreds of other authors more
understandable and to keep our family together. I wish to thank Judith Hoover, my wife
and the mother of our child, Sophia. Judith is the person who deserves the reward from
my completing this program.
i
Table of Contents
List of Tables ..................................................................................................................... vi
List of Figures ................................................................................................................... vii
Chapter 1: Introduction to the Study ....................................................................................1
Background ....................................................................................................................3
Prehospital Emergency Medical Care ..................................................................... 3
Road Traffic Death ................................................................................................. 8
Injury by Type of Road Use.................................................................................. 10
Governance and Income ....................................................................................... 11
Framework for Studying Prehospital Response to Road Traffic Death ......................12
Purpose of the Study ....................................................................................................16
Research Questions ......................................................................................................17
Definitions....................................................................................................................19
Nature of the Study ......................................................................................................20
Assumptions .................................................................................................................21
Scope and Delimitations ..............................................................................................21
Generalizability and Internal and External Validity ....................................................22
Limitations ...................................................................................................................23
Significance..................................................................................................................23
Summary ......................................................................................................................24
Chapter 2: Literature Review .............................................................................................26
Introduction ..................................................................................................................26
ii
Literature Review.........................................................................................................27
Theoretical Foundations...............................................................................................27
Rationale for Theory Choice ................................................................................. 35
Approaches to the Study of Prehospital Services and Road Traffic Fatalities ............37
Factors Influencing Road Traffic Injury ......................................................................40
Vehicle Safety ....................................................................................................... 40
Seat Belt Use and Child Restraints ....................................................................... 41
Helmet Laws for Motorcycle and Bicycle Riding ................................................ 41
Speed as a Factor .................................................................................................. 42
Alcohol, Drugs, and Distracted Driving ................................................................43
Age as a Factor.......................................................................................................43
Other Factors ......................................................................................................... 44
The Social and Economic Costs of Road Traffic Injury ..............................................48
Key Variables and Concepts ........................................................................................49
Income and Road Traffic Injury ..................................................................................49
Governance ..................................................................................................................53
Governance and Income ........................................................................................69
Governance, Income, and Road Traffic Fatalities .................................................72
Governance, Income, and Prehospital Services .................................................... 73
Prehospital Services .....................................................................................................74
Prehospital Responder Training .............................................................................75
Prehospital Service and Health ..............................................................................77
iii
Prehospital Response and Road Traffic Fatalities .................................................80
Physician Versus Nonphysician Prehospital Providers ........................................ 83
Governance, Income, Prehospital Staffing, and Road Traffic Death ..........................87
Rationale for Selection of the Variables or Concepts ..................................................87
Summary and Conclusions ..........................................................................................89
Chapter 3: Research Method ..............................................................................................91
Introduction ..................................................................................................................91
Research Design ...........................................................................................................91
Methodology ..........................................................................................................92
Target Population ...................................................................................................92
Sampling ................................................................................................................92
Databases ...............................................................................................................93
Power Analysis ......................................................................................................94
Ethics of the Study .......................................................................................................95
Instrumentation and Operational Definitions...............................................................95
Operational Definitions ................................................................................................96
Prehospital Care System ........................................................................................96
Road Traffic Fatality ..............................................................................................96
Data Manipulation .......................................................................................................97
Research Questions ......................................................................................................98
Threats to Validity .....................................................................................................101
Ethical Procedures .....................................................................................................101
iv
Summary ....................................................................................................................101
Chapter 4: Results ............................................................................................................103
Introduction ................................................................................................................103
Purpose, Research Questions, and Hypotheses......................................................... 103
Data Collection ..........................................................................................................105
Results from the Study ...............................................................................................107
Descriptive and Demographic Characteristics of the Sample ..............................107
Death Rate for Road Traffic Events per 100,000 ................................................107
Income and Road Traffic Death ...........................................................................108
Correlation of Governance and Road Traffic Death ............................................118
Countries by Sign of the Average Governance Indicator ................................... 119
Prehospital Staffing and Road Traffic Death ...................................................... 125
Effect of GNI per Capita and Prehospital Staffing on Road Traffic Death ........ 132
Effect of Governance and Prehospital Staffing on Road Traffic Death ............. 138
Income, Governance Sign, and Staffing Interaction ............................................146
Summary ....................................................................................................................161
Chapter 5: Discussion, Conclusions, and Recommendations ..........................................166
Introduction ................................................................................................................166
Insignificant Results.................................................................................................. 169
Limitations of the Study.............................................................................................171
Recommendations ......................................................................................................172
Implications................................................................................................................174
v
Social Change ........................................................................................................... 174
Conclusion .................................................................................................................175
References ........................................................................................................................176
Appendix A: Disability Adjusted Life Years Saved and Cost by Intervention and
Subregion .............................................................................................................212
Appendix: B: Countries With Profiles in English ............................................................213
Appendix C: Countries and Author With Complete Prehospital Style, With WHO
Traffic Death, and Governance Data ...................................................................214
Curriculum Vitae .............................................................................................................217
vi
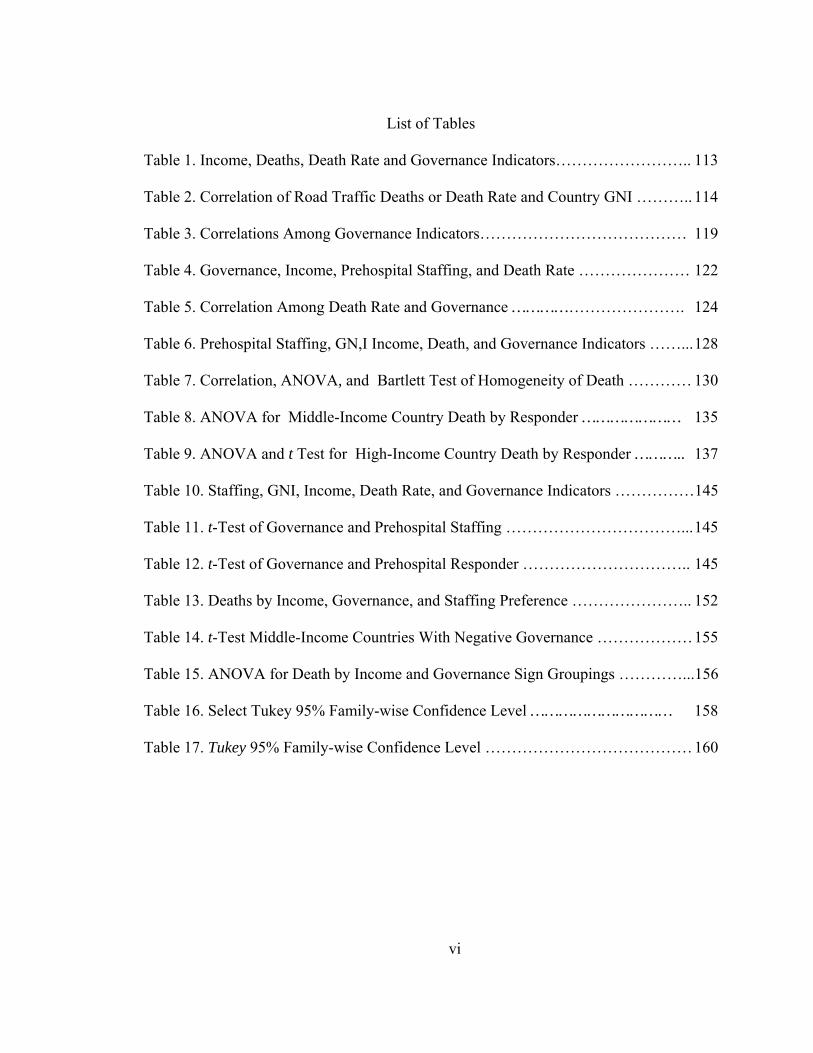
List of Tables
Table 1. Income, Deaths, Death Rate and Governance Indicators…………………….. 113
Table 2. Correlation of Road Traffic Deaths or Death Rate and Country GNI ……….. 114
Table 3. Correlations Among Governance Indicators………………………………… 119
Table 4. Governance, Income, Prehospital Staffing, and Death Rate ………………… 122
Table 5. Correlation Among Death Rate and Governance ……………………………. 124
Table 6. Prehospital Staffing, GN,I Income, Death, and Governance Indicators ……... 128
Table 7. Correlation, ANOVA, and Bartlett Test of Homogeneity of Death ………… 130
Table 8. ANOVA for Middle-Income Country Death by Responder ………………… 135
Table 9. ANOVA and t Test for High-Income Country Death by Responder ……….. 137
Table 10. Staffing, GNI, Income, Death Rate, and Governance Indicators ……………145
Table 11. t-Test of Governance and Prehospital Staffing ……………………………... 145
Table 12. t-Test of Governance and Prehospital Responder ………………………….. 145
Table 13. Deaths by Income, Governance, and Staffing Preference ………………….. 152
Table 14. t-Test Middle-Income Countries With Negative Governance ……………… 155
Table 15. ANOVA for Death by Income and Governance Sign Groupings …………...156
Table 16. Select Tukey 95% Family-wise Confidence Level ………………………… 158
Table 17. Tukey 95% Family-wise Confidence Level ………………………………… 160
vii
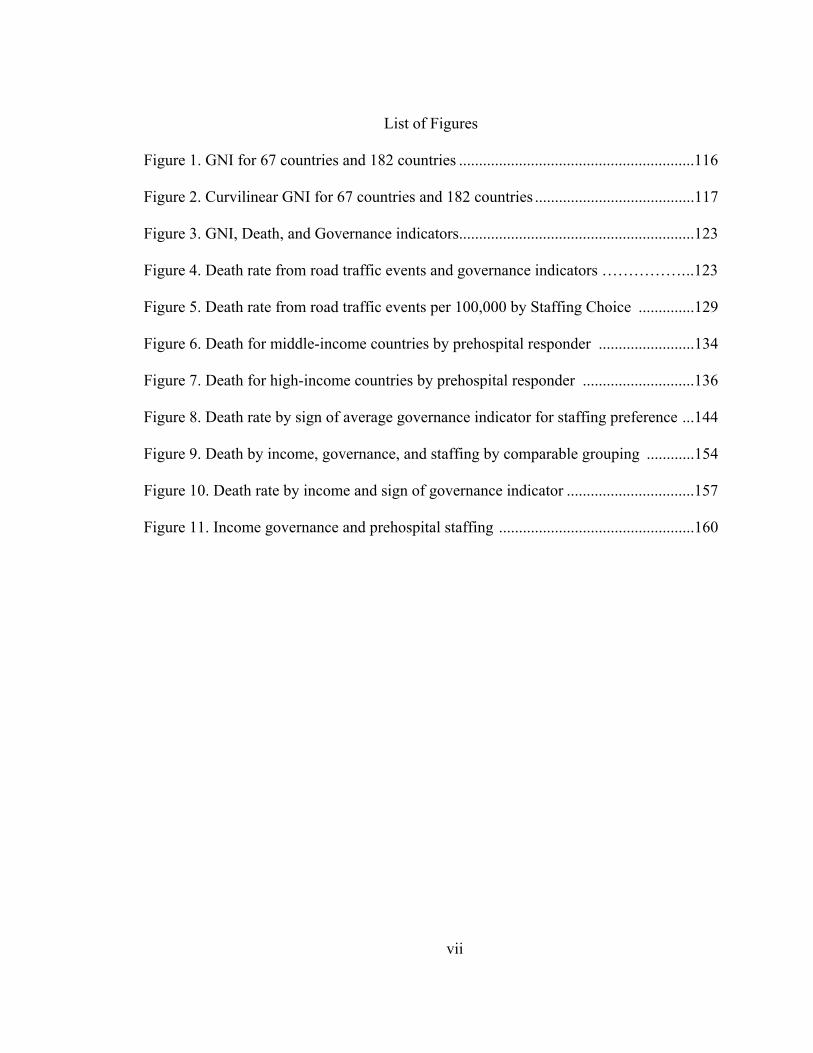
List of Figures
Figure 1. GNI for 67 countries and 182 countries ...........................................................116
Figure 2. Curvilinear GNI for 67 countries and 182 countries ........................................117
Figure 3. GNI, Death, and Governance indicators ...........................................................123
Figure 4. Death rate from road traffic events and governance indicators ……………. ..123
Figure 5. Death rate from road traffic events per 100,000 by Staffing Choice ..............129
Figure 6. Death for middle-income countries by prehospital responder ........................134
Figure 7. Death for high-income countries by prehospital responder ............................136
Figure 8. Death rate by sign of average governance indicator for staffing preference ...144
Figure 9. Death by income, governance, and staffing by comparable grouping ............154
Figure 10. Death rate by income and sign of governance indicator ................................157
Figure 11. Income governance and prehospital staffing .................................................160
1
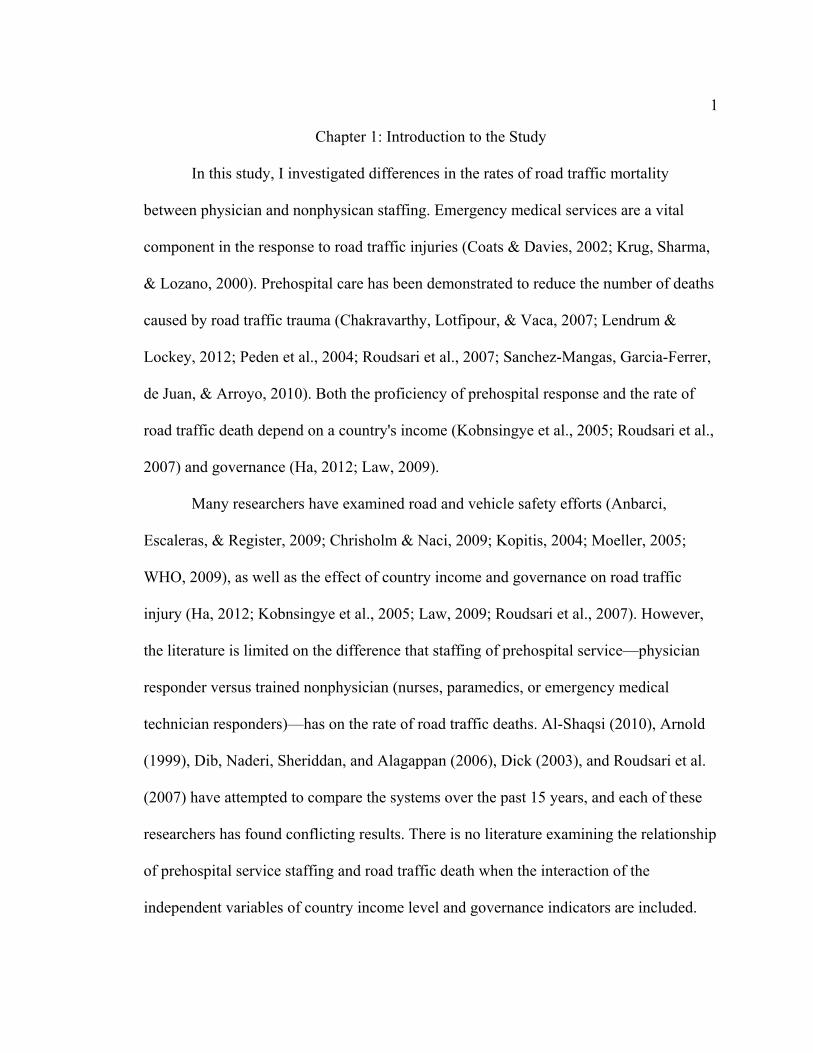
Chapter 1: Introduction to the Study
In this study, I investigated differences in the rates of road traffic mortality
between physician and nonphysican staffing. Emergency medical services are a vital
component in the response to road traffic injuries (Coats & Davies, 2002; Krug, Sharma,
& Lozano, 2000). Prehospital care has been demonstrated to reduce the number of deaths
caused by road traffic trauma (Chakravarthy, Lotfipour, & Vaca, 2007; Lendrum &
Lockey, 2012; Peden et al., 2004; Roudsari et al., 2007; Sanchez-Mangas, Garcia-Ferrer,
de Juan, & Arroyo, 2010). Both the proficiency of prehospital response and the rate of
road traffic death depend on a country's income (Kobnsingye et al., 2005; Roudsari et al.,
2007) and governance (Ha, 2012; Law, 2009).
Many researchers have examined road and vehicle safety efforts (Anbarci,
Escaleras, & Register, 2009; Chrisholm & Naci, 2009; Kopitis, 2004; Moeller, 2005;
WHO, 2009), as well as the effect of country income and governance on road traffic
injury (Ha, 2012; Kobnsingye et al., 2005; Law, 2009; Roudsari et al., 2007). However,
the literature is limited on the difference that staffing of prehospital service—physician
responder versus trained nonphysician (nurses, paramedics, or emergency medical
technician responders)—has on the rate of road traffic deaths. Al-Shaqsi (2010), Arnold
(1999), Dib, Naderi, Sheriddan, and Alagappan (2006), Dick (2003), and Roudsari et al.
(2007) have attempted to compare the systems over the past 15 years, and each of these
researchers has found conflicting results. There is no literature examining the relationship
of prehospital service staffing and road traffic death when the interaction of the
independent variables of country income level and governance indicators are included.
2
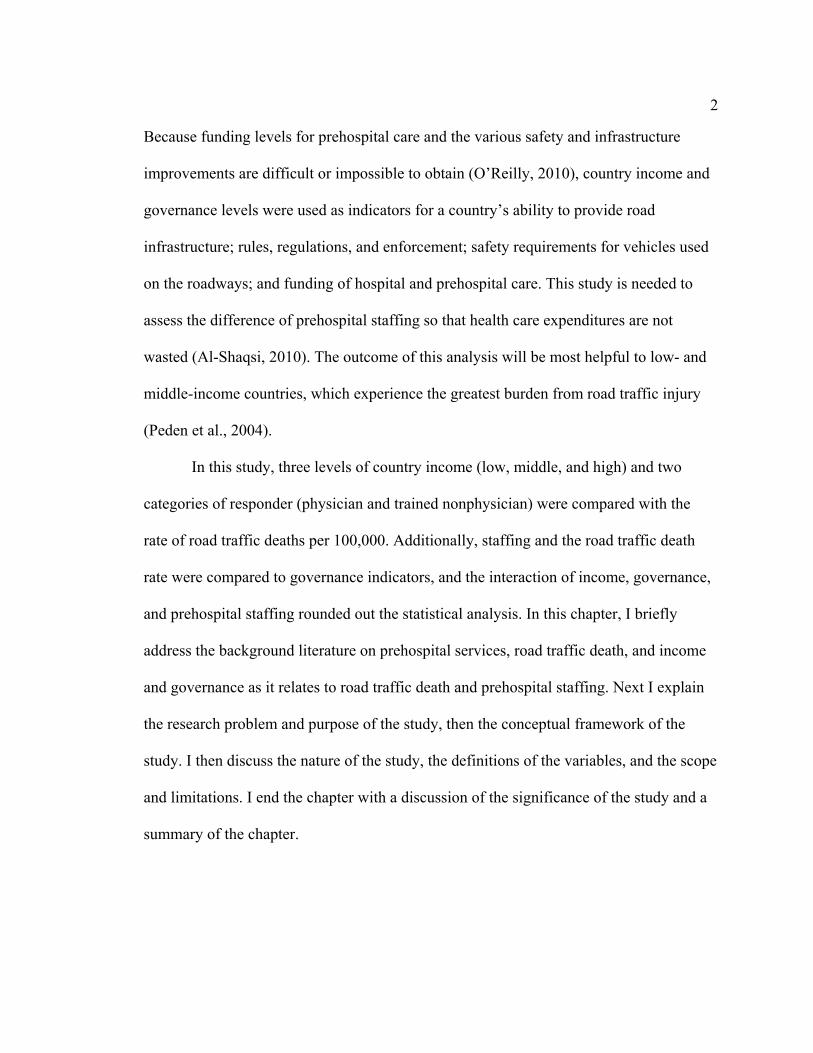
Because funding levels for prehospital care and the various safety and infrastructure
improvements are difficult or impossible to obtain (O’Reilly, 2010), country income and
governance levels were used as indicators for a country’s ability to provide road
infrastructure; rules, regulations, and enforcement; safety requirements for vehicles used
on the roadways; and funding of hospital and prehospital care. This study is needed to
assess the difference of prehospital staffing so that health care expenditures are not
wasted (Al-Shaqsi, 2010). The outcome of this analysis will be most helpful to low- and
middle-income countries, which experience the greatest burden from road traffic injury
(Peden et al., 2004).
In this study, three levels of country income (low, middle, and high) and two
categories of responder (physician and trained nonphysician) were compared with the
rate of road traffic deaths per 100,000. Additionally, staffing and the road traffic death
rate were compared to governance indicators, and the interaction of income, governance,
and prehospital staffing rounded out the statistical analysis. In this chapter, I briefly
address the background literature on prehospital services, road traffic death, and income
and governance as it relates to road traffic death and prehospital staffing. Next I explain
the research problem and purpose of the study, then the conceptual framework of the
study. I then discuss the nature of the study, the definitions of the variables, and the scope
and limitations. I end the chapter with a discussion of the significance of the study and a
summary of the chapter.
3
Background
Prehospital Emergency Medical Care
The International Federation for Emergency Medicine “believes that a society has
a right to expect immediate care in an emergency situation” (Bodiwala, 2010, p. xiii).
Emergency response to injury is common in most countries, and the form and funding
often determine the success of the service in reducing death and disability caused by road
traffic injury (Sarlin & Alagappan, 2010). The World Health Organization ([WHO] 2009,
p. 33) found that 78% of the 178 countries surveyed (138 countries; 178 countries are
82% of the 215 UN member states; 138 countries are 64% of the member states) had
formal prehospital care systems, which vary in quality. Of these 178 countries, 123 (69%
of the sample, 52% of UN member states) had national regulations governing the delivery
of prehospital care (WHO, 2009, pp. 284–287).
Prehospital services are delivered by a governmental agency (centralized, state or
provincial, district, or local), an international agency (e.g., International Red Cross or St.
John Ambulance Association), private entities, or a volunteer service (O’Reilly &
Fitzgerald, 2010). Funding for prehospital services follows a similar structure of
government, international donation, private, and voluntary payments administered by a
variety of organizations (O’Reilly, 2010). Determining cost-effectiveness for prehospital
services is problematic due the complexity of the structures across countries, but funding
for equipment, communications, supplies, staffing and education, administration, and
other expenses can strain money allocated to a country’s health care (O’Reilly, 2010). An
additional consideration is that assigning relative benefit to any particular procedure or
4
intervention in health care is very difficult without well-constructed random controlled
experiments; this is a very problematic study form for health care because of the need for
informed consent and the duty to treat (Coats & Davies, 2002; Schneiderman, Gilmer, &
Teetzel, 2000).
A 2004 estimate claimed that for every death that occurred from a road traffic
accident, 15 people were hospitalized for rehabilitation, and 70 suffered minor injuries
(Peden et al., 2004, p. 5). This leads to a medical system strained from preventable road
traffic injuries, representing "45%–60% of all admissions to surgical wards" (WHO,
2009, p. 3). Grimm and Treibich (2012) concluded that the quality and availability of
health care and trauma services have an impact on road traffic injury risk and need to be
considered in the analysis of road traffic injury. In "many low- and middle-income
countries … traffic-related injuries … [are] between 30% and 86%"[of the total number
of injuries sustained] (Peden et al., 2004, p. 5). In some European studies, 50% of deaths
occurred within a few minutes of the incident; about 15% of the injured died at the
hospital within 4 hours of the incident; and 35% died at the hospital beyond 4 hours
(Peden et al., 2004, p. 94). The vast majority of deaths in low- and middle-income
countries occurred during the prehospital stage (Peden et al., 2004, p. 93).
Mock, Kobusingye, Vu Anh, Afukaar, and Arreola-Risa (2005) placed prehospital
care on a continuum between preventing road traffic events and postevent definitive
hospital care and rehabilitation. They reviewed studies that demonstrated a “six-fold
lower [mortality from trauma] in countries with high income than in countries with low
income” due to the different trauma care systems employed (Mock et al., 2005, p. 295).
5
Improving prehospital care is an affordable intervention for countries with an established
trauma care system, and, even though it requires a greater proportion of their health care
budget, it is a good way to reduce the trauma burden in low-income countries (Mock et
al., 2005, p. 295). Mock et al. (2005) explained that even for countries without a formal
prehospital system, training lay people to deliver first aid and basic life support prior to
transport to health facilities lowered a country’s burden of trauma death. Anderson et al.
(2012, p. 2) highlighted four fundamental emergency medicine factors that benefit
populations:
1. Universal telephone access and education about how and when to use that
access.
2. Effective training of lay first responders in the timely recognition of injury or
disease and application of basic first aid.
3. Rapid-response providers, ranging from emergency medical technicians to
paramedics and emergency care physicians, mobilized to assess, intervene,
and transport in the out-of-hospital setting.
4. Emergency medicine clinics in hospitals.
Coats and Davies (2002), writing from personal experience and a literature
review, explained that prehospital care is the first link in the chain of trauma care that
starts 30 minutes or more before a patient arrives at the hospital. They advocated for
advanced training for both physicians and nonphysicians alike, to form a system to
continuously improve the response to road traffic crashes. Coats and Davies are
6
proponents of advanced trained physician staffing, known as the Franco-German
philosophical form of prehospital services.
Two major philosophical styles of prehospital emergency medical services are
discussed in the literature: the Franco-German style and the Anglo-American style (Sarlin
& Alagappan, 2010). In the Franco-German style, emergency medical physicians are
dispatched to severe trauma and medical conditions, treating the patient at the scene
before transport and admission to hospital floors. In the Anglo-American style,
emergency medical technicians (ambulance drivers, first responders, basic emergency
medical technicians, advanced or paramedic emergency medical technicians, and nurses)
treat life-threatening problems at the scene, then rapidly transport the patient to the
emergency room for assessment and care (Sarlin & Alagappan, 2010).
The merits of these respective systems, however, are difficult to analyze, and
authors are reluctant to conclude that one is superior to the other (Al-Shaqsi, 2010; Sarlin
& Alagappan, 2011). Indeed, Sarlin and Alagappan (2010, p. 9) explained that there are
four systems of emergency care in the world:
1. Unorganized, emergency response is a haphazard mixture of untrained and
minimally trained lay people, attempting first aid and transporting sufferers to
health clinics by any means available.
2. Basic life support is provided by personnel trained in basic first response with
the ability to transport sufferers in modified transport vehicles.
3. Advanced life support is provided by personnel with greater knowledge in and
permission to use more advanced life-support techniques.
7
4. Doctor-staffed advanced life support involves physicians and advanced life-
support personnel able to treat life-threatening conditions on scene prior to
transport to emergency care facilities.
O’Reilly and Fitzgerald (2010) elaborated further on the component structure of
an emergency medical system (EMS) that makes the prehospital situation unique to a
particular country. Each country
• Is at a different developmental stage—undeveloped, developing, or
developed.
• Has a different sociopolitical framework, health system priorities, and
geography.
• Has different administrative structure for
o Authority for providing prehospital services—national, state or provincial,
regional or district, community, or individual.
o Agency responsible for EMS—government, volunteer, not-for-profit
entities, private contractor, or none.
o Funding prehospital services—government or publicly funded, voluntary,
private, or none.
• Have different resources
o For EMS transportation—vehicles, and road, air, or water routes.
o For human resources (i.e., number of and levels of training of responders).
• Has different processes for
8
o Operations based on response philosophy—Franco-German or Anglo-
American— and clinical leadership.
o Triage and dispatch—centralized, local, hospital, ad hoc, or none.
(Adapted from O’Reilly and Fitzgerald, 2010, pp. 39–40).
Road Traffic Death
Road traffic fatalities, most of which are preventable, are global problems with a
wide range of causes. Road traffic death impacts individuals and families within all
socioeconomic groups throughout the world (Ameratunga, Hijar, & Norton, 2006).
In 2000, Krug et al. detailed the burden caused by road traffic injury, using two
1998 WHO tables. They related the specific causes of death to income (high-income in
one and low- and middle-income countries in the other), showing road traffic death was
the leading cause of death for people from 5 to 44 years of age in high-income countries
(Krug et al , 2000, p. 524). Road traffic death is the seventh leading cause of death for
children to age 4 in high-income countries and the eighth leading cause of death for those
45 to 59. In 1998, road traffic crashes were the 10th overall cause of death in high-
income countries (Krug et al., 2000, p. 254). In low- and middle-income countries, road
traffic deaths were the third and second leading causes of death for those 5 to 14 and 15
to 44, respectively (Krug et al., 2000, p. 255). Road traffic deaths ranked 14th and 10th
for those 0 to 4 years and 45 to 59 years, respectively (Krug et al., 2000, p. 255). Road
traffic deaths ranked 10th as the overall cause of death in low- and middle-income
countries in 1998 (Krug et al., 2000, p. 254). By 2011, road traffic deaths had moved to
the ninth leading cause of death worldwide (WHO, 2013). Road traffic deaths are not
9
expected to decrease as populations increase and developing countries become wealthier;
in fact, road traffic deaths are projected to be the overall third leading cause of death
worldwide by 2030 (Mathers & Loncar, 2006).
The patterns of injuries vary by road user, vehicle, and country (Peden et al.,
2004). Low-income countries have higher road traffic mortality and disability rates than
high-income countries, and the more a country invests in its health care system, the lower
its burden caused by road traffic fatalities (Ameratunga et al., 2006, p. 3). Some
researchers have explored the relation of road infrastructure, vehicle safety, driving
legislation and enforcement, and individual behavior to road traffic events; others have
explored the effects of income and health care funding on traffic injury outcomes (e.g.,
Peden et al., 2004; WHO, 2009). Country income appears to be the biggest factor in road
traffic injury, with an inverted U-shape curve of injury as income rises from low to
middle and then decreases as income continues to rise from middle to high (Kopitis,
2004).
Globally in 2009, rates of road traffic fatalities per 100,000 population were 18.8
overall; 10.3 in high-income countries; 19.5 in middle-income countries; and 21.5 in low-
income countries (WHO, 2009, p. 13). Five years earlier, Peden et al. (2004, pp. 172–
173) reported similar numbers: 19.0 deaths per 100,000 people worldwide; 27.6 per
100,000 males and 10.4 per 100,000 females. Peden et al. further broke down the deaths
per 100,000 into male/female by age: 0–4 years, 8.8/7.3; 5–14 years, 13.2/8.2; 15–29
years, 29.7/7.6; 30–44 years, 33.5/9.8; 45–59 years, 37.6/14.3; and greater than 60 years,
45.1/19.1.
10
Injury by Type of Road Use
In the United States, there were 9.53 million vehicles involved in the 2009 crash
statistics: 5.2 million passenger cars, 4.25 million light trucks, 0.3 million large trucks,
0.06 million buses, and 0.019 million other/unknown vehicles (U.S. Census Bureau,
2012c). Additionally, 40,840 people died immediately from those incidences: 18,350 in
passenger cars, 17,902 in light trucks, 3,215 in large trucks, 221 in buses, and 1,152 in
other/unknown vehicles (U.S. Census Bureau, 2012c). A different report, also in 2009 but
focusing on a different category, found that 4,462 motorcycle riders perished in traffic
accidents as well as 4,092 pedestrians and 630 pedal cyclists (U.S. Census Bureau,
2012b).
Chisholm and Naci (2009) attempted to break down road user injury by type and
world subregion, with the caveat that the data for all countries are incomplete or derived
from varying and often incompatible methodological strategies. Occupants of four-wheel
vehicles make up the bulk of the mortality and morbidity events in road traffic crashes in
highly motorized subregions of the Americas (78%) and Europe (62%; p. 10). In
Southeast Asia, motorcycle accidents caused between 43% and 50% of fatalities (p. 10).
Pedestrian fatalities (55%) took a large toll in regions of Africa (p. 10). Chrisholm and
Naci provided a visual and numeric compilation of these findings: Pedestrian injuries are
as low as 10% in the Americas and as high as 57% in East Africa; bicycle riders suffer
2% of the fatalities in some Southeast Asian countries and are as high as 13% in western
Pacific island countries; motorcycle fatalities are 4% of road fatalities in European
countries and up to 53% in Southeast Asia; passenger car fatalities were highest in the
11
Americas (up to 75%) and lowest in some East African countries (6%); bus and truck
fatalities ranged from 3% in the Americas to 46% in some European and Southeast Asian
countries (p. 11).
Globally, about 46% of road traffic deaths were of "pedestrians, cyclists, and
riders of two-wheelers and their passengers" (WHO, 2009, p. 13). Rates of fatalities for
each of these categories were quite variable. Peden et al. (2004, p. 41) reported a range
from 41% to 75% for pedestrian deaths and 38% to 51% for vehicle passengers. In many
low-income countries, both motorcycles and public transportation significantly
contributed to road traffic death (p. 41) because fewer individuals owned cars in these
countries. Buses, designed to transport many people, were not frequently involved in
occupant road traffic fatalities, but they were a significant contributor to mass casualty
events that involved 10 or more fatalities and injuries (Albertsson et al., 2003, p. 109).
Rolison et al. (2012) assessed the safety associated with motorcycle riding in the United
Kingdom. They found that there is a 76 times greater likelihood of casualty for drivers of
motorcycles over all other types of vehicle, independent of the driver’s age and
experience (p. 568).
Governance and Income
Gaygisiz (2009b, pp. 536–537) compared economic indicators of gross domestic
product (GDP) per capita, the unemployment rate, and the Gini index (a measure of
income disparity among individuals or households; Organization of Economic Co-
operation and Development, 2002) and found high values for each associated with high
traffic safety. GDP per capita had a strong negative correlation with road traffic injury (r
12
= –0.60), as did the related Gini index, “implying that high road-traffic fatality rates are
associated with more unequal distribution of resources” (Gaygisiz, 2009b, p. 537). The
unemployment rate had a correlation of r = 0.33, not statistically significant but leaning
in the positive direction of reduced road traffic fatality (pp. 536–537).
Pratte (1998, p. 58) stated that "almost every developing country suffers from a
lack of financial resources, and therefore the capital available to spend on road safety
improvements, road rehabilitation and maintenance, police enforcement and other
governmental-level investments [is] severely limited." It appears that the greater the
wealth of people in a country, the better their health care system, including emergency
care. Likewise, the greater the wealth of a country, the greater the emphasis on road
infrastructure and traffic law enactment and enforcement, resulting in fewer road traffic
injuries. Increased and targeted spending on preventative and emergency health care,
traffic and driving policies, and road infrastructure in all countries will reduce road traffic
injuries and the resulting personal, physical, and financial costs, leading to a healthier and
more productive global population.
Framework for Studying Prehospital Response to Road Traffic Death
Accidents are not random events (Peden et al., 2004, p. 7). Many factors interact
to make an accident or prevent one. In the field of public health, the examination of road
fatalities generally uses an epidemiological approach, such as the one proposed by
Haddon (1968, 1980) and widely expanded on by a number of researchers.
For this study, I used the Haddon matrix as the theoretical framework. The
Haddon matrix (Haddon, 1968, 1980) was developed to study injury prevention and has
13
subsequently been enhanced by authors such as Runyan (1998, 2003), who added factors
to consider in establishing policy and interventional approaches.
The 3-by-3 Haddon matrix organizes factors into rows for pre-events, events, and
postevents and into columns for the epidemiological concepts of host (person at risk),
agent/vehicle (person or organism/inanimate object involved in the incident), and
physical and social environment to assist in the analysis of an event (Barnett et al. 2005;
Haddon, 1980). Pre-event factors include vehicle type and safety features, road
infrastructure (i.e., road design and lighting), road use regulations and police enforcement
of regulations, the condition of the driver (e.g., any impairments), attitudes, beliefs, and
behaviors (e.g., about driving and speeding), devices to prevent impaired drivers from
starting the vehicle, sensors that warn of potential hazards, traffic signs with posted speed
limits, and condition of roads (Wall, 2013). Event factors deal with the prevention of
fatalities or injuries, for instance, whether the airbags inflated, if the seat belts were in
use, and if crash-resistant rails along the roadways functioned properly (Albertsson et al.,
2003). Postevent factors address the actions or events that sustained the lives of
individuals who were injured and include such factors as the age of the host and existing
health status of those injured, the first aid skills of the bystanders, the accessibility of
trained prehospital personnel, access to the crash (i.e., congested roads and location of
and condition of the vehicle; Thyer, Leditschke, & Briggs, 2009).
Runyan (1998, 2003) also provided an overview of the Haddon matrix and some
adaptations that, she believed, improve the user’s ability to make informed judgments and
develop best practice policies. Runyan explained and expanded on the Haddon matrix by
14
discussing additional dimensions. She applied the factors of “effectiveness, equity,
freedom, cost, stigmatization,” and other identified issues useful to “decision makers” in
judging best approaches to each of the nine cells of the Haddon matrix (forming a cube of
45 cells; 2003, p. 61). The additional considerations increase the complexity of
information and opinions available for decision making. Runyan (2003, pp. 62–63) also
integrated Bronfenbrenner’s social ecological model so each of the cells can be further
scrutinized by the additional concepts of cultural, institutional, interpersonal, and
intrapersonal influences.
The Haddon matrix appears to be based on a pragmatic worldview, which allows
researchers the “freedom” to pick and choose techniques and methodologies that help to
explain behaviors relating to the object of interest (Creswell, 2009, pp. 10–11). It values
“the what and how to research, based on intended consequences” and is best undertaken
using mixed method techniques (Creswell, 2009, p. 11). For example, in their study of
injury and injury prevention, Runyan (1998, 2003) and Runyan and Yonas (2008)
blended the Haddon matrix with the social-ecologic model, and Gates et al. (2011)
blended the Haddon with the action research model.
The extended Haddon matrix is described as a robust model that allows
researchers to approach a study by qualitative, qualitative, or mixed methods (Runyan,
1998). The model is flexible and adaptable to brainstorming and other idea-generation
techniques as well as guiding decision making (Runyan, 1998, p. 304). The matrix is set
up for identifying a problem, options, and values, but care is needed in prioritizing values
or interventions so that just, equitable, and effective policies are implemented (Runyan,
15
1998, pp. 305–306). To use the Haddon matrix, the problem needs to be identified, the
factors identified as contributing to the problem need to be categorized by event time and
epidemiological concept, and then analysis and intervention development need to be
accomplished (Runyan, 1998, 2003).
For this study, the problem was to determine the difference between prehospital
response staffing in relation to the reduction of the rate of road traffic deaths per 100,000.
Many of the vehicle or agent factors involving specific infrastructure, vehicle design, and
policy or rule development and enforcement extend across cells of the Haddon matrix;
these are discussed briefly in the next section. Likewise the effect of income and
governance on road traffic death influences many of the cells of the matrix and, along
with prehospital services, constitute the pre-event, event, and postevent environmental
factors with which this study is primarily concerned.
Road traffic deaths are major health-related burdens worldwide (Ameratunga et
al., 2006; Mathers & Loncar, 2006; Peden et al., 2004). For countries with prehospital
response services, two broad philosophical approaches exist regarding the staffing: the
physician-staffed Franco-German style and the trained nonphysician–staffed Anglo-
American style. In the Franco-German style, severely injured road traffic crash patients
are treated extensively at the scene with advanced interventions before transport and
admission to the hospital. In the Anglo-American style, severely injured patients are
rapidly assessed and treated for urgent or life-threatening injury and rapidly transported
to an emergency room for more in-depth assessment and intervention prior to transfer to
the hospital floor.
16
There are costs and benefits to each style, and this study aimed at determining if
the rate of road traffic deaths per 100,000 is lower in countries with physician-staffed
prehospital response units than in countries with trained nonphysician–staffed units.
Gross income, country wealth, and income-level groupings or per capita GNP were
correlated with the number and rate of road traffic injury and appeared as a common
variable used in studies (Anbarci et al., 2009; Grimm & Tribich, 2012; Kopitis, 2004). A
country’s income influences the ability of the government to develop policy and
regulations, enforce laws, and provide for the health care of its people; this is known as
governance (Gradstein, 2004; Ha, 2012; Khan, 2007; Lewis, 2006; Pillai, Díaz, Basham,
& Ramírez-Johnson, 2011; Qadri, 2012). Because income and governance are shown to
influence rates of road traffic death, the interaction of both of these independent variables
needs to be to accounted for to evaluate the staffing of prehospital systems in similar
levels of the variables. To my knowledge, no studies have compared prehospital staffing
systems within these income or governance groupings. That comparison will reduce the
effect of varied health care, funding, and policy across countries.
Purpose of the Study
The purpose of this cross-sectional correlation study was to use the Haddon
matrix postevent agent and environmental conditions to examine the difference James J.
Menegazzi, PhD. in prehospital staffing choice on road traffic deaths per 100,000. The
independent variable of staffing of prehospital response was defined as one of two
conditions: the attendance of (a) a physician or (b) a trained nonphysician responder—a
registered nurse, paramedic, or emergency medical technician—at the scene of a road

17
traffic accident. The independent variable of income was defined as the WHO (2013
Global Status) reported income level, based on the gross national income per capita, of
sampled countries—low, US$1,025 or less; middle, $1,026 to $12,225; and high $12,226
or more. The independent variable of governance was defined as the sign of the
standardized values for the World Governance Indicators (World Bank, 2013) in the
selected countries.
The dependent variable of rate of road traffic death per 100,000 was determined
by dividing the estimated deaths in a country provided by WHO (2013) by the quotient of
the total population for 2010 provided by the WHO (2013) divided by 100,000.
Research Questions
The quantitative research questions for this study are as follows:
1. Is there a significant association between income level of a country and the rate of
road traffic fatalities per 100,000?
Ha1: There is a significant negative correlation between income level of countries
and road traffic fatalities.
Ho1: There is no association between income level of countries and road traffic
fatalities.
2. Is there an association between the sign of standardized governance indicators of
a country and road traffic fatalities per 100,000?
Ha2: There is a significant negative correlation between the sign of standardized
governance indicators of countries and road traffic fatalities.

18
Ho2: There is no association between the sign of standardized governance indicators
of countries and road traffic fatalities.
3. Does the staffing of prehospital response services by physicians reduce the rate
of road traffic fatalities per 100,000?
Ha3: There is a significant reduction in the rate of road traffic fatalities per 100,000
when prehospital services are staffed by physicians.
Ho3: There is no significant difference between physician-staffed and nonphysician-
staffed prehospital services and the rate of road traffic fatalities per 100,000.
4. When grouped by income, do countries with physician-staffed response services
have a lower rate of road traffic fatalities per 100,000?
Ha4: There is a significant reduction in the rate of road traffic fatalities per 100,000 in
physician-staffed prehospital services when countries are grouped by income.
Ho4: There is no significant reduction in the rate of road traffic fatalities per 100,000
in physician-staffed prehospital services when countries are grouped by income.
5. When grouped by the sign of standardized governance indicators, do countries
with physician-staffed prehospital services have a significantly lower rate of road
traffic deaths per 100,000 than countries with trained nonphysician–staffed
prehospital response?
Ha5: When grouped by the sign of standardized governance indicators, there is a
significant reduction in road traffic fatalities per 100,000 in countries with physician-
staffed prehospital services.
19
Ho5: When grouped by the sign of standardized governance indicators, there is no
significant reduction in road traffic fatalities per 100,000 in countries with physician-
staffed prehospital services.
6. When grouped by income and sign of standardized governance indicators, do
countries with physician-staffed prehospital services have a significantly lower
rate of road traffic deaths per 100,000 than countries with trained nonphysician–
staffed prehospital response?
Ha6: When grouped by income and sign of standardized governance indicators,
countries with physician-staffed prehospital services have a significantly lower rate of
road traffic deaths per 100,000 than countries with trained nonphysician–staffed
prehospital response.
Ho6: When grouped by income and sign of standardized governance indicators,
countries with physician-staffed prehospital services do not have a significantly lower
rate of road traffic deaths per 100,000 than countries with trained nonphysician–
staffed prehospital response.
Ho6: When grouped by income and sign of standardized governance indicators,
countries with physician-staffed prehospital services do not have a significantly lower
rate of road traffic deaths per 100,000 than countries with trained nonphysician–
staffed prehospital response.
Definitions
Dependent variable: Rate of road traffic deaths per 100,000 determined by
dividing the WHO (2013) estimated deaths for each country by the quotient of the WHO
20
(2013) reported population for each country divided by 100,000. Peden et al. (2004, p.
57) stated that the number of deaths is a good indicator for planning emergency medical
needs and that fatalities per 100,000 population are a good indicator of the “impact of
road traffic crashes on human populations.”
Independent variables: Prehospital staffing. Two levels of prehospital staffing
were considered in this study: (a) physicians and (b) nonphysician prehospital trained
nurses, paramedics, and emergency medical technicians.
Income category provided by the WHO (2013) in levels of low, US$1,225 or
less; middle, $1,226 to $12,225; and high, $12,226 or greater.
Governance indicators: The standardized indicators provided by the World Bank
(2013) for each selected country.
Nature of the Study
I used archival data in the public domain from the World Health Organization
(2013 Global Status) and World Bank (2013) and country prehospital service profiles
available over the Internet (see appendix C for a list of country profiles and sources
currently identified). Archival data are appropriately included in correlational studies
where strict randomization or nonrandom sampling techniques are used (Creswell, 2009).
I employed bivariate correlational and univariate t test, ANOVA (analysis of variation),
and MANOVA (multiple analysis of variation) computation. Correlation studies are often
used by both positivists/postpositivists and pragmatists when designing quantitative and
mixed methods studies (Creswell, 2009). Therefore, correlation studies are good choices
for studies looking to find the relationships between or among factors (Creswell, 2009).
21
Either the t test or the Mann-Whitney U test, depending on the distribution of the data,
and ANOVA/MANOVA are appropriate for the categorical and continuous data used in
this study (Creswell, 2009, p.153).
Assumptions
First, I assumed that the prehospital service influence on road traffic deaths can be
measured by the rate of road traffic deaths per 100,000. This assumption was made in the
belief that income and governance influences are equivalent within groupings, will cancel
out the effects of trauma care once the victim arrives at the hospital, and will make other
factors equal.
Second, I assumed that credentials for the prehospital providers are equivalent
within each category of provider—physician, nurse, paramedic, or emergency medical
technician (EMT)—in each of the conditions of income level and governance value.
Third, I assumed that nonmedical road traffic death factors—road use rules and
enforcement, vehicle safety requirements, road infrastructure, and the like—are
equivalent within income and governance values divisions.
Scope and Delimitations
Profile data were not available for all countries, and not all country profile data
were available for the same years.
Data for this study were cross-sectional, with data taken at one point in time
(Creswell, 2009). This study used a single-stage sampling strategy, collecting data from
all countries with usable data. Unfortunately, the constraints of the profile data made this
a convenient sample of countries that have prehospital system profiles available in
22
English and that supplied data to the World Bank (2013) Governance Indicators data set
and the WHO (2013) Global Status Report on Road Safety 2013: Supporting a Decade of
Action.
Generalizability and Internal and External Validity
Atkinson and Brandolini (2001) described the difficulty of using cross-country
income data aggregated from multiple sources. They demonstrated how various
assumptions and data collection techniques alter the within- and across-country values for
income per capita and for income disparity. World Bank (2013) Development Indicators,
however, are considered reliable and measured consistently across the time series. Bhalla,
Harrison, Shahraz, and Fingerhut (2010) described the difficulty of tracking road traffic
deaths across countries for similar reasons. However, the WHO (2013) databases are
considered reliable and are used as a standard in research.
The conclusions of this study are generalizable to the countries studied and could
be considered generalizable to all countries because all countries were subject to
inclusion in the study (“Measured Progress,” n.d.). The error that would interfere with the
generalizability of the study was spread equally across the countries studied (“Measured
Progress,” n.d.).
Because of the imperfect randomization of the sample and the vagaries of the
secondary data definitions and collections, in general, the data may not be truly valid and
may cause internal and external validity problems (Creswell, 2009). The data used,
however, were from sources that made the best data available and were used across
studies, making results comparable (WHO, 2013; World Bank, 2013).
23
Limitations
This was a correlational study that demonstrated relationships among factors but
was not able to attribute the cause. The nature of the data sets was also a limitation, as
data were collected using a variety of methods and definitions (Koziol & Arthur, n.d.).
The latter issue, however, is the same for other researchers using the data; therefore, the
results are comparable to results in other studies (World Bank, 2013).
The mentioned disadvantages of using secondary data (Atkinson & Brandolini,
2001; Bhalla, 2010) certainly posed limitations on the resulting analysis because
uncertainty was injected into the data collection. However, this uncertainty was spread
across all countries that have data, and other researchers have used the data, giving some
continuity to cross-study analysis.
There was a bias built into the study caused by lower-income countries not
reporting data to the databank managers as frequently as higher income countries report.
There were fewer results for income, governance, road traffic fatalities, and prehospital
staffing to be found from lower-income countries. This shifted the burden of evidence
toward middle- and high-income countries. Little could be done to overcome this
difficulty, there were enough compelling results to allow further exploration.
Significance
Road traffic fatalities burden countries by killing income earners in their most
productive years (McKenzie, Pinger, & Kotecki, 2008). Road traffic fatalities are
estimated to be the third leading cause of death for 15- to 35-year-olds worldwide by
2030 (Mathers & Loncar, 2006).

24
This research was intended to give governments and policymakers information to
evaluate the system of and control over prehospital systems with respect to traffic death.
This knowledge will be beneficial to governments in developing policies and training that
will provide cost-effective and beneficial results for their people. People injured in road
traffic accidents will benefit from a prehospital response that meets their immediate needs
and reduces the burden placed on families from the loss of loved ones, family structure,
and income.
Summary
Road traffic death is a major problem worldwide, and road traffic crash events are
the focus of much research. Overall, income is the best determinant of road traffic death.
Income and governance interact to affect the health and wealth of a country.
Prehospital services have two main styles: the Anglo-American and the Franco-
German. The former uses nurses, paramedics, and emergency medical technicians, who
rapidly transport victims to an emergency facility for care; the latter uses emergency
physicians treating victims more extensively at the scene before transport to medical
facilities. There are arguments supporting and opposing both systems, but the Anglo-
American style offers lower initial expense per patient for prehospital services. In this
study, I investigated the benefits of each system with respect to death from road traffic
crashes.
In Chapter 2, I take a closer look at the studies on prehospital staffing and
response to road traffic crashes, including exploring the literature on income and
governance on prehospital response. I conclude with a discussion of data sets and

25
analysis techniques necessary to understand the difference among country road traffic
fatality rates.
26
Chapter 2: Literature Review
Introduction
Prehospital services respond to calls for road traffic crashes as a major function of
their mandate. Road traffic injuries, an important public health concern, are the "leading
cause of death to those in the first [3] decades of life" and are important enough for the
"United Nations and World Health Organization to declare [2010–2020 the] decade of
action for road safety" (Centers for Disease Control and Prevention, 2012). Income per
capita governs the ability of people to buy and use road vehicles (Anbarci et al., 2009;
Kopitis, 2004), and the safety of vehicles has been shown to increase as the per capita
income increases (Anbarci et al., 2009). The number of pedestrians and the number of
two-wheeled vehicles both decreased as higher income levels were reached, reducing
road traffic fatality rates (Anbarci et al., 2009; Grimm & Treibich, 2012). Additionally,
income influences governance, which in turn influences road traffic death rates through
rules of law, enforcement, regulation, and finance of health care (Ha, 2012; Law, 2009).
Income and governance are important factors in the postcrash response and prehospital
care of crash victims and have been demonstrated to save lives (Ha, 2012; Law, 2009).
The Haddon matrix was used as a framework for the study of the effects of
prehospital staffing on road traffic death The relationship among income, governance,
road traffic death, and prehospital services was explored, as well as the effects of
prehospital services on the overall health care of a country and the effect of staffing
prehospital services with physicians or trained nonphysician responders.
27
Literature Review
The literature search was conducted using the multiple database search engine
Thoreau from the Walden University Library, the Cochrane Library, Google, and Google
Scholar. Search terms used include combinations of road traffic injury, income,
governance, indicators, prehospital and emergency medical services.
Peer-reviewed articles, in English, primarily from 2000 to the present, with a
preference for 2008 onward, were sought. Randomly controlled studies would have been
desirable, but such studies are difficult to perform and few are available. Meta-analyses
of descriptive studies predominate in the literature. The WHO was a key sponsor of
seminal reports on road traffic injury. However, there is a complete lack of literature on
the effects of country income and governance on prehospital service staffing and road
traffic death.
Theoretical Foundations
The WHO (2009) framework for the determination of road traffic mortality
includes grouping independent variables into exposure factors (vehicle and road density);
risk factors, defined as preventative or moderating measures (policies and interventions
for and enforcement of alcohol and speed regulations and investment in public
transportation); mitigating factors (health care system and prehospital emergency care);
and income in relation to the outcome of mortality. A similar approach is the Haddon
matrix of categorizing and analyzing factors that influence injury.
Haddon (1968, 1980) believed that descriptive approaches to injury lacked
scientific rigor and proposed that multiple factors influenced a vehicle crash event. The
28
basic epidemiologic structure of this matrix is that a crash and the impact of the crash are
a combination of pre-event, event, and postevent occurrences influenced by human/host,
vehicle/agent, and social, political, and environmental conditions (Haddon, 1980).
Haddon (1968) posited that occurrences in the social, psychological, and behavioral
environments are as important as vehicle safety and road infrastructure. The Haddon
matrix is a flexible tool for "investigating the series of events leading toward a final
outcome," both in analysis and to suggest countermeasures (Albertsson et al., 2003, p.
110). Barnett et al. (2005), in their discussion of preparedness for mass casualty events,
explained that the Haddon matrix can be used as a tool to identify and develop primary
(e.g., before a crash), secondary (e.g., at the time of the crash), and tertiary (e.g., after the
crash) prevention interventions.
The one-time director of the National Highway Safety Bureau, Dr. William
Haddon (1968, p. 1431), wrote, “The phenomena of trauma to be dealt with scientifically
must be based not on descriptive categorizations, but on etiologic ones.” As knowledge
about a phenomenon develops, it is subdivided into smaller, distinct phenomena; Haddon
used the example of the one-time diagnostic categories of wasting and fever being
subsequently redefined as syphilis, protein deficiency, amebiasis, and tuberculosis, all
sharing some symptoms but with different etiologies. Haddon believed it followed that
accidents are not random or chance occurrences but phenomena with causation which can
be understood when the etiology is investigated and new definitions are applied to these
events. To identify the etiologic causes of and countermeasures to crash events Haddon
devised a “two-dimensional matrix” that labels rows as precrash (pre-event), crash

29
(event), and postcrash (postevent) and columns as the identified factors needing
consideration; for example, Haddon’s (1968, pp. 1435–1436) factors were driver,
passenger, pedestrian, bicyclist, motorcyclist, vehicles, highway, and police.
By the 1980s, Haddon had developed his matrix to focus on epidemiological
considerations and replaced the vaguer identified factor columns with host or human,
agent or vehicle, and environment. He had operationally defined the columnar categories
and simplified them into the prescribed three used today. Haddon (1980) also recounted
the 10 strategies he developed, along with his safety and hazards research (i.e., the
Haddon matrix):
1. Prevent the creation of the hazard in the first place.
2. Reduce the amount of hazard created.
3. Contain or prevent the release of the preexisting hazard.
4. Modify the rate or spatial distribution of the released hazard from its source.
5. Separate the hazard from the potential host or target by time or space.
6. Erect barriers between the hazard and the host/target.
7. Modify the relevant basic qualities of the hazard.
8. Strengthen the defenses of the host.
9. Begin to counter the damage already done by the hazard.
10. Stabilize, repair, and rehabilitate the host/target once the damage has been
done. (Adapted from Haddon, 1980, p. 418)
In the current research, I was interested in the postevent host and environment
cells of the Haddon matrix, as well as the last two strategies Haddon developed: (9) begin
30
to counter the damage done and (10) stabilize, repair, and rehabilitate the host once the
damage has been done.
The Haddon matrix is useful for a variety of proposes and blends well with other
frameworks. Four frameworks related to prehospital care and injury prevention were
proposed by Runyan (1998), Gates et al. (2011), Meisel, Hargarten, and Vernick (2008),
and Gofin (2005). Runyan’s (1998) adaptation of the Haddon matrix separates the
environment column into a column for the physical environment and a column for social
environment. She wished to highlight the influence of the environment as an important
element in the complete picture developed when using the Haddon matrix. Runyan
(1998) was eager to point out that the matrix rows of pre-event, event, and postevent
constitute a temporal relationship in which the time periods blend into the antecedent and
the future, as do the issues affecting the host, the agent, and the physical and social
environments.
Runyan (1998, p. 303) used a house fire as an example, but in keeping with the
topic of this paper, I used road traffic crashes. The lack of social or political will against
drunk driving leads to the lack of regulations against drunk driving (social or political
environment for pre-event and event). Some drunk drivers are able to start and drive
vehicles because anti-drunk-driving ignition disablers are not required (depending on the
focus, pre-event or event agent, and host behavior). Some of those drunk drivers are
involved in road traffic crashes, often at a high speed because the driver’s behavior is
disinhibited, the driver’s judgment is impaired, and there is little or no law enforcement
available to deter or stop the drunk driver (event host behavior, pre-event social or
31
political environment). The road traffic crash event may involve only the drunk driver or
it may involve other road users (event agent). If the people involved are fortunate, there
will be a rescue and prehospital system available to treat and transport them to emergency
care; otherwise, they will need to rely on themselves or the kindness of bystanders for
rescue and transport to a health care facility (pre-event social/political environment,
postevent agent and environment). If they are fortunate, they will have advanced medical
care available in their country, supported by the political and social will of their fellow
citizens, and will recover physical and social functions. If no advanced health care or
social and political will exists, the crash victim’s prospects are bleaker.
In each phase of the drunk driving scenario, the factors of host, agent, and
physical or social environment are present and interact to influence the outcome; these
are each available points for interventions aimed at the prevention of the event or the
reduction of the severity of its aftermath. Runyan (1998) stressed that Haddon warned
that care needs to be taken not to place a factor or intervention in the wrong cell or fail to
realize that the factor or intervention may be in more than one cell. Haddon (1980) used
the example of seat belts, an intervention that is primarily in the agent-event cell, where it
is intended to prevent injury to the wearer from impact with the internal surfaces of the
vehicle. The seat belt is also in the political environment pre-event and event and the host
pre-event and event behavioral factor cells of the Haddon matrix. Sleet et al. (2011, p.
79), writing about the history of injury prevention, saluted the Haddon matrix (and
Haddon himself) as an important tool in saving “328,551 lives” from 1960 to 2002.
32
Runyan (1998) adapted the Haddon matrix to include costs and benefits of
interventions, effectiveness of interventions, social and political values interpretations,
and feasibility of interventions, allowing for additional categories as needed, so the
matrix becomes a useful tool in decision making and policy development. Runyan (2003)
compared and blended the Haddon matrix with the social-ecologic framework of
Bronfenbrenner. The social-ecologic framework, as explained by Runyan (2003), states
that factors of, for example, human developmental state are influential in the interactions
people have with each other. These interactions, in turn, influence the institutional or
political interactions so that the larger society is influenced by and influences the
individual. Runyan (2003) used the image of Chinese boxes (also appropriate are Russian
Matryoshka dolls), each nestled within the next size larger, to describe these influences.
For a road traffic use analogy, consider the adolescent male who, in his inexperience,
defiance, and fearless nature, drives too fast for conditions, egged on by friends in the
car. The accidents that result from these conditions cause insurance rates to increase for
all adolescent males and drive policymakers to impose regulations on driving age, the
amount of training needed to obtain a driver’s license, the number of passengers that can
be in the car with the adolescent, and the time of day the adolescent is allowed to drive.
(After I devised this analogy, I discovered that Runyan and Yonas [2008] used a similar
analogy.)
Another example of how the Haddon matrix encourages blending with other
theoretical constructs is presented by Gates et al. (2011). They used the Haddon matrix to
identify issues and subsequently suggest interventions to reduce violence against
33
prehospital and emergency room workers. Using the action research model, Gates et al.
(2011) developed questions or focus points for structured group interviews of emergency
care workers. Action research is a qualitative framework that engages the subjects of the
research in the research developmental process. Sagor’s (2000, n.p.) succinct definition is
this: “[Action research] is a disciplined process of inquiry conducted by and for those
taking the action. The primary reason for engaging in action research is to assist the
‘actor’ in improving and/or refining his or her actions.” Gates et al. (2011) developed
focus group content for host, vector, physician, and social environment in each of the
time periods (pre-event, event, and postevent) that seem remarkably similar to Runyan’s
(1998) social-ecological model, emphasizing education, policy, awareness of others’
emotional and behavioral state, building relationships with coworkers and patients, and
other features. Participants in Gates et al.’s (2011) study talked through their thoughts
and opinions regarding each of the topics, and a set of recommendations were developed
for the participating hospital. The similarity with the social-ecological model (Runyan,
1998) is that the third dimension of value and benefits was used to generate the research
questions, and the relationships among the participants and with the perpetrators of
violent actions were analyzed.
Meisel et al. (2008) used the Haddon matrix as the organizing model for a study
using the injury prevention and control approach. This approach seeks for root causes of
an event, in this case prehospital safety lapses, and looks for the “readily modifiable
factors” that can be modified by automatic interventions (Meisel et al., 2008, p. 413). The
injury prevention model seeks to change the pre-event host behavior, the vector or agent
34
of injury, and the physical and social environment that leads to the event. This approach
is beneficial for prehospital providers because those using it hope to deemphasize blame
and fault finding, while changing the way procedures are accomplished and materials are
packaged (Meisel et al., 2008). The connection to the Haddon matrix should be obvious;
the matrix was used in this study as the organizing tool for identifying medial and
procedural errors prior to the development of corrective interventions.
Despite a USA-centric bias, the epidemiological triangle model (Gofin, 2005) is
useful for explaining the need and rationale for preparedness and response to terrorism, a
major concern to prehospital care providers. The epidemiological triangle is the
interaction of the behavior of the host and the influence of the agent or vector and the
environment (Gofin, 2005). The similarity with the Haddon matrix is apparent if a
temporal element of pre-event, event, and postevent is introduced. The interaction among
the factors is also similar to the social-ecologic framework of Runyan (1998). Indeed,
Gofin acknowledged Runyan for influencing his decision to write his article.
Albertsson et al.’s (2003, p. 110) investigation of mass transit crashes found the
Haddon matrix to be a flexible tool for "investigating the series of events leading toward
a final outcome," both in analysis and to suggest countermeasures. Other authors using
the Haddon matrix included Chrisholm and Nanci (2009), describing road traffic safety
interventions; Peden et al. (2004), when reporting on worldwide road traffic injury for the
WHO; Khankeh, Khorasani-Zavareh, and Masoumi (2012), to help explain the road
traffic fatality rate in Iran; and Pratte (1998), in a discussion of road traffic deaths in
Africa. Additionally, Stav, Arbesman, and Lieberman (2008) incorporated the Haddon
35
matrix in their literature review of older drivers’ safety; Yancey, Martinez, and
Kellermann (2002) referenced the Haddon matrix in the development of their “Accidents
Aren’t” pre-event intervention program to be delivered by EMS personnel; and Grimm
and Treibich (2012), while investigating the subsequent rise in road traffic deaths as
people’s ability to purchase vehicles increases with prosperity, used the Haddon matrix to
categorize influential topics.
In a talk before the Australasian Road Safety Research, Policing, and Education
Conference, Wall (2013) explained the importance of the Haddon matrix in all aspects of
vehicle crash science and the response in the postcrash phase. Meisel et al. (2008) also
described the power of the Haddon matrix in the prehospital and emergency room
settings. Moreover, Thyer et al. (2009) described their use of the Haddon matrix in the
evaluation of the postcrash, prehospital use of cervical collars to immobilize the victim’s
neck until potential injury can be ruled out. Many other combinations and adaptations of
the Haddon matrix can be found in the literature.
Rationale for Theory Choice
Road traffic accidents have a variety of causes and outcomes that can be
categorized by the Haddon matrix. Along with the addition of Runyan’s (1998) social-
ecologic model, it served as a good backdrop for evaluation of the overarching influence
of income and governance on prehospital systems factors on road traffic deaths. The pre-
event and postevent sociopolitical environment, as well as the pre-event and postevent
agents—physicians, nurses, paramedics, EMTs—were the focus in this study. The
36
Haddon matrix is quite common in the literature, and several more studies will be
addressed.
The Haddon matrix was used in a report conducted by Peden et al. (2004) for the
WHO on road traffic injury prevention and on studies on attributable risks of road traffic
accidents and injuries by Chrisholm and Nanci (2009), income and road traffic deaths by
Grimm and Treibich (2012), and road traffic death in developing countries by Pratte
(1998). Albertsson et al. (2003) used the Haddon matrix in their investigation of crashes
involving buses and motor coaches. Chakravarthy et al. (2007) described the factors of
pedestrian road traffic fatalities using the Haddon matrix.
Peden et al. (2004, p. 93) place prehospital systems in the category of risk factors
for postevent outcome, or what Runyan (1998) might call the effectiveness value of the
pre-event and postevent social or political environment:
Weak public health infrastructure in many low-income and middle-income
countries is a major risk factor. In high-income countries, the pre-hospital risk
factors are not so pronounced, but where they exist, are associated with the need
to improve the existing elements of post-impact care. (Peden et al., 2004, p. 94).
The use of advanced life support and rapid transport for road traffic victims can
likewise be categorized as a postevent risk factor and intervention that can be placed in
the agent and environment cells and evaluated for effectiveness (Peden et al., 2005). The
training of first responders is an important factor in reducing death from road traffic
crashes, as police and firefighters often arrive before prehospital care providers and can
significantly influence the victim’s outcome in a crash (Peden et al., 2005). Educating
37
both physicians and paramedics in advanced life-support procedures has been shown to
improve the outcome for road crash victims (Peden et al., 2005). Peden et al. (2004)
concluded that prehospital services are an important factor in the reduction of road traffic
deaths. In their study, Chrisholm and Naci (2009, p. 6) populated their Haddon matrix
postcrash human, vehicle, and environment cells with first aid skills and access to
hospital, ease of access, fire risk, rescue facilities, and congestion as factors to explain
their identification of risk and interventions.
Approaches to the Study of Prehospital Services and Road Traffic Fatalities
Two main approaches have been used by researchers when studying emergency
medical systems and interventions. Retrospective studies use archival data, and
prospective studies collect data from participants as they occur. Prospective studies watch
for outcomes during the study period, but the outcome needs to be common or the study
very large for statistically significant results to be found (StatsDirect, n.d.). Although
biases, such as loss of participants during the study period, need to be avoided,
prospective studies have fewer sources of bias and confounding than retrospective studies
because the researcher controls the definitions and data collection (StatsDirect, n.d.).
Retrospective studies examine the risks that precede the current outcome (StatsDirect,
n.d.). Because the researcher is using data collected under someone else’s definitions and
purpose, more bias and confounding plague these studies (StatsDirect, n.d.). Prospective
studies take longer to perform because data are collected from the start of the collection
period through the end of the period and data analysis cannot occur until the end of the
38
data collection (LaMorte, 2013). Data analysis in retrospective studies can happen
quickly because the data already exist in databases (LaMorte, 2013).
Randomized controlled trials (RCT), one of the prospective study styles, are
difficult to design for medical-related topics because of the ethical considerations of
withholding treatment to injured patients. RCTs control all variables except the variable
of interest and form groups with and without the variable present (Himmelfarb Health
Sciences Library [HHSL], 2011). RCTs reduce population bias, are easier to blind
participants and researchers, and are amenable to known statistical tools (HHSL, 2011).
The disadvantages are that RCTs are more expensive and time-consuming, willing
participants may not be representative of the whole population, they do not reveal
causation, and participants may not follow up after receiving the intervention (HHSL,
2011).
A number of retrospective studies on the topic of road traffic safety have been
conducted. Baker, O’Neill, Haddon, and Long (1974) used archival medical records and
chart reviews of injured road users in eight Baltimore hospitals during 1968 and 1969 to
test a predictive grading scale for posthospital outcomes. Canto et al. (2002) surveyed
772,586 hospitalized patients suffering myocardial infarction between 1994 and 1998,
finding that more than half of the patients used EMS and received definitive care more
rapidly than did non-EMS users. Albertsson et al. (2003) used a case study to investigate
a bus crash and recommended, among other things, that more people be trained and
available to respond to road traffic crashes. Wall (2013) used a literature review to
discuss the benefit of prehospital response to road traffic crashes.
39
Gaygisiz (2010) accessed archival data to investigate culture, governance, and
road traffic fatalities, finding a reduction in road traffic deaths in higher-income
countries. Based on their study of archived deidentified patient-level data (i.e., chart
reviews) from nine countries’ trauma systems, Roudsari et al. (2007) recommended
increased prehospital care services and training of laypeople in basic first-response
medical care in developing African countries.
Kirves, Handolin, Niemela, Pitkaniem, and Randell (2010) used restrospective
chart reviews to evaluate physician versus nonphysician injury assessments, finding that
physicians were better than paramedics at identifying the extent of injury. Zwerling et al.
(2005) used archival data from governmental data sets in reviewing road traffic deaths in
rural versus urban settings. Ramanujam and Aschkenasy (2007) used published and
unpublished survey data in their study of the need for prehospital and emergency care.
Nathens, Jurkovich, Rivara, and Maier (2000) used archival data from registries and
governmental sources as well as survey results from emergency medical service directors
in their study of the effectiveness of information from state trauma registries in reducing
injury-related mortality.
There are few prospective studies, especially random controlled trial studies, on
the topic of road traffic safety. In one prospective study, Bobrow et al. (2008) compared
the results of 886 out-of-hospital cardiac arrests between 2005 and 2007 and found that
minimally interrupted chest compression performed by EMS personnel increased survival
rates by 5.3%. Silivestri et al. (2004) conducted a prospective, observational analysis of
153 out-of-hospital intubated patients, finding a 9% rate for misplacement, but no

40
misplacement when end tidal carbon dioxide monitoring was used. Fischer et al. (2011)
used data collected between January 2001 and December 2004 in their prospective study
of physician versus nonphysician prehospital response to cardiac problems. Roudisari et
al. (2007) used observational techniques to follow advanced life-support providers—
nurses and paramedics trained in advanced technique—and physician providers in a
comparison study of prehospital staffing on fatality.
Factors Influencing Road Traffic Injury
In the literature on road traffic injury, the commonly referenced factors are
vehicle safety, seat belt use, speeding, and alcohol and drug use (Anbarci et al., 2009;
Chrisholm & Naci, 2009; Kopitis, 2004; Moeller, 2005; WHO, 2009). In one way or
another, these factors influence across the cells of the Haddon matrix and may be either
advantages or disadvantages to those involved in a road traffic crash.
Vehicle Safety
The vehicle itself—its size, body style, and safety equipment—is an area where
intervention before a crash can reduce injury (Moeller, 2005). Anbarci et al. (2009, p.
245) report on studies demonstrating that a 1% increase in weight of one involved vehicle
resulted in a 5% increase in fatality rate for the driver of the lighter vehicle, and that a
2.5% increase in fatality resulted for the operator of the lighter vehicle for every 100
pounds of weight difference. Additionally, because the weight of a vehicle usually
increases as its price increases, “the average injury rate for vehicle occupants can be
expected to fall by about 0.57% for each 1% increase in vehicle price” (Moeller, 2005, p.
254). But, although higher price and weight of the vehicle increased safety for the

41
occupants of that vehicle, they also increased the chance that occupants of other involved
vehicles (and other vulnerable road users) will be injured (Moeller, 2005, p. 252).
Vehicle safety is a factor in all three rows and columns of the Haddon matrix.
Seat Belt Use and Child Restraints
Seat belts and child restraints were effective interventions in the severity of road
traffic injury (Chrisholm & Naci, 2009; Kopitis, 2004). Chrisholm and Naci (2009, p. 7)
found a 2% to 12% reduction in death when restraints were in use.
Seat belt use reduced crash fatalities by 40% to 50% for passengers and drivers in
the front seat and up to 75% for passengers in the rear seats (WHO, 2009, p. 24). Eighty-
eight percent of countries reported having seat belt use laws, but only 57% required all
passengers to use seat belts (76% of high-income, 54% of middle-income, and 38% of
low-income countries; WHO, 2009, p. 24). Use of child restraint systems can reduce
infant and child deaths in crashes by 80%, but only about 50% of countries reported
having child restraint laws: 90% of high-income and only 20% of low-income countries
(WHO, 2009, p. 26). Few countries reported significant enforcement of child restraint
laws (p. 26). Seat belts fit into pre-event and event factors for the host, the agent of
injury, and environment.
Helmet Laws for Motorcycle and Bicycle Riding
Wearing a motorcycle helmet can reduce risk of death by almost 40% and risk of
severe injury by 70% (WHO, 2009, pp. 22–23). Ninety percent of countries have
motorcycle helmet laws (WHO, 2009). Kopitis (2004, pp. 15–28) found that not wearing
a helmet increased the injury and death rate in motorcycle accidents by 1% to 12%.

42
Chrisholm and Naci (2009, p. 17) reported in their study that not wearing a helmet
increased injury and death in bicycle accidents by up to 5%, depending on the country
and income level. Helmets are event host cell factors.
Speed as a Factor
Driving too fast for conditions increased the chance of a crash by 10%; in fact,
there was a 20% increase in fatal injury for every 5% increase in speed (WHO, 2009, p.
18). Pedestrians have a 90% survival rate when hit by a vehicle traveling at 30 km/h (22
mph), but less than a 50% chance of survival at 45 km/h (28 mph; p. 18). Yet, despite the
fact that a difference of only 6 mph doubles the chance of death, "only 29% of countries
have speed limits of 50 km/h [30 mph] or below on [urban roads] and allow authorities to
reduce them further" (p. 19). Speed was the greatest risk factor for up to 28% of the
incidents in Chrisholm and Naci’s (2009) study.
Driving too fast for road conditions also increases the severity of injury when a
crash occurs, making speed limits and enforcement two of the best interventions to
reduce road traffic accidents (Chrisholm & Naci, 2009; WHO, 2009, p. 18; Moeller,
2005, pp. 275–280). Reporting on risk factors in fatalities across the World Health
Organization’s 14 subregions, Chrisholm and Naci (2009, p. 17) found that speeding
caused 21% to 28% of injuries and fatalities and that speed limits were an effective
intervention. Speeding is a pre-event and event factor in the host, agent, and environment
cells of the Haddon matrix.

43
Alcohol, Drugs, and Distracted Driving
Alcohol use is by far the most important factor in driving too fast for conditions,
followed by drug use and distracted driving (Chrisholm & Naci, 2009; Moeller, 2005, pp.
275–280; WHO 2009, p. 21). Drinking and driving contributed to 1% to 21% of crash
injuries and fatalities, depending on region (Chrisholm & Naci 2009, p. 17). Use of
mobile phones and other distractions were also contributing factors to pre-event and
event road traffic injury (Peden et al., 2004).
The risk of a crash "increased significantly with a blood alcohol content (BAC) of
0.04 g/dl (grams of alcohol per deciliter of blood) and laws that establish a BAC between
0 and 0.02 g/dl led to a 4% to 24% reduction in young driver crashes” (WHO, 2009, p.
21). Sobriety enforcement is cost-effective and reduces alcohol-related crashes by 20%
(p. 21). Seventy-nine percent of countries reported using either sobriety checkpoints or
random breath tests: 21% of high-income, 11% of middle-income, and 9% of low-income
countries (p. 22). Ninety-six percent of countries had "drinking-driving" laws, but only
49% used a BAC of 0.05 g/dl or less as a threshold (p. 21). Alcohol, drugs, and distracted
driving fit into the pre-event and postevent cells for host, agent, and environment in the
Haddon matrix.
Age as a Factor
Driver age has been of interest in road traffic injury. Both youths’ inexperience
and seniors’ slow reaction contributed to road traffic injury (Chrisholm & Naci, 2009;
Moeller, 2005; WHO 2009, p. 21). Atubi (2012) noted a 16-year cycle and a 32-year
44
cycle in road traffic injury, which he attributed to the addition of new drivers on the road
and a reduction of veteran drivers.
The WHO (2007 Youth and road safety) points to inexperience and bravado as
the major causes for youthful road traffic crashes, specifically inexperience with road
environments and bravado from developmental factors, such as risk taking and social
influences, and gender. Subzwari et al. (2009) note that older drivers have a higher crash
rate than younger drivers, excluding adolescent males, due to physical and mental
slowing as well as reduction in vision. Age is a factor of the Haddon matrix cell for pre-
event, event, and postevent host, agent, and environment.
Other Factors
Economic and social deprivation, demographics, the mixture of high speed and
vulnerable road users (i.e., pedestrians and pedal-powered and motor-driven two-wheeled
vehicles), driver fatigue, gender, and time of day were additional risk factors for road
traffic injury and fatality (Peden et al, 2004). Pre-event interventions that have been
shown to reduce road traffic injury include engineering speed and traffic flow, road
design for weather-related and topographic conditions and population density, vehicle
safety inspections, public safety campaigns on speed and alcohol and drug use, and
campaigns against distracted driving (Chrisholm & Naci, 2009; Kopitis, 2004).
Chrisholm and Naci (2009) add to their list the need for increased visibility of pedestrians
and barriers to protect pedestrians and bicycle riders from motorized traffic. Some factors
increasing postcrash severity are delay in detection, fire, hazardous material leakage,
45
inability to extricate people from vehicles, and the lack of prehospital and emergency
medical care (Peden et al., 2004).
Atubi’s (2012) findings from his study of road traffic injury and population
density in Lagos, Nigeria, suggested, counterintuitively, that the better the conditions of
the road in a country, the greater the chance for fatalities. He tempers the fatality rate in
his study with the influence of crowding in urban areas, which forces vehicles to travel
more slowly and encourages a greater presence of law enforcement officers. Over the
years of his study, frequency of accidents and severity of injury increased as the road
infrastructure improved. He also notes the increased frequency of accidents at places
where road improvement ends and more rustic roadways begin. This seeming
contradiction to other studies may be explained by the increasing wealth of the Nigerian
people and the subsequent increase in motorized two- and three-wheeled vehicles on the
road that provide less safe transport at higher speed. When speeding vehicles reached an
abrupt change in road development, drivers were unable to maintain control of their
vehicles.
Chrisholm and Naci (2009) reviewed the risks of different road user types in
different world regions. They found that broad interventions were less effective and less
cost-effective compared to tailored and targeted interventions when considered at the
population level; that is, messages about safe driving should be targeted to specific
populations. Chrisholm and Naci (2009, p. 5) concluded that law enforcement is the most
effective deterrent to speeding and that drinking and driving laws and enforcement
combined with seat belt laws and enforcement showed the most effectiveness in reducing
46
road traffic injury. Motorcycle and bicycle helmet use were most effective in less
motorized countries but were less significant in heavily motorized countries (Chrisholm
& Naci, 2009, p. 5).
Appendix A summarizes Chrisholm and Naci’s (2009, pp. 30–33) findings across
the four subregions they studied for the most effective interventions to reduce road traffic
injury: Africa (AfrE), America (AmrA), Southeast Asia (SearD), and western Pacific
(WprB). They reported on five interventions and three combinations of interventions
measured in disability adjusted life years (DALY) saved in total and per 1 million
population and measured in "annualized costs per year" in millions of dollars, with a 3%
reduction correcting sample error, or cost per capita. One DALY is the accounting for
“one lost year of healthy life” across the population by summing the years lost to
premature death and the years lost to disability, tempered by a calculation of the length of
time a disability is present prior to death (WHO, Health Statistics and Health Information
Systems, 2013).
The single most cost-effective strategy varied by subregion, but generally
speaking, a combined intervention strategy that simultaneously enforced multiple road
safety laws produced the most health gain for a given amount of investment. For
example, using the standardized international dollar (I$) value, the combined
enforcement of speed limits, drinking and driving laws, and motorcycle helmet use
appeared on the cost-effectiveness "frontier" in three out of four subregions, with each
DALY averted costing I$1,181 (SearD), I$4,550 (WprB), and I$14,139 (AmrA),
respectively. In AfrE, the single most cost-effective strategy was enforcement of bicycle
47
helmets (I$1,233), which, at least in part, reflected the very different road traffic patterns
in this subregion (fewer cars and motorcycles). In AmrA, by contrast, legislation and
enforcement of bicycle helmet use was by far the least cost-effective option, with each
healthy life year gained costing nearly I$300,000 (Chrisholm and Naci, 2009, p. 34).
Other variables affecting road safety included country population (WHO, 2009, p.
234), road use policy, road density and infrastructure (Kopitis, 2004, pp. 15–28), vehicle
density and road density (WHO, 2009, p. 234), walking and cycling patterns, and public
transportation (WHO, 2009; Kopitis, 2004).
An interesting investigation found relationships between road accident mortality
rates and economic conditions, cultural characteristics, personality dimensions, and
intelligence scores in some high-income Organization of Economic Cooperation and
Development (OECD) member states (Gaygisiz, 2009b). Countries with higher fatality
rates had greater power disparity in the society (power distance), more emotionally
mediated reactions to change (uncertainty avoidance, which encourages slow, safe
changes in society and proliferation of laws and rules), and greater focus on the
relationships among people (embeddedness), highlighted by a strong social hierarchy.
“Countries with lower road-traffic accident fatality rates were more individualistic,
egalitarian, and emphasized autonomy of individuals. Conscientiousness and IQ
correlated negatively with road-traffic accident fatalities” (Gaygisiz, 2009b , p. 531). The
correlation between traffic accident fatalities and individualism was as high as r = –0.52.
“Embeddedness (r = 0.61) and hierarchy (r = 0.49) had positive correlations, and
affective autonomy (r = –0.55), intellectual autonomy (r = –0.56), and egalitarianism (r =
48
–0.47) negative correlations with road-traffic accident fatalities” (Gaygisiz, 2009b , p.
540). Finally, conscientiousness (r = –0.53) correlated negatively with traffic injury and
accident (Gaygisiz, 2009b , p. 542).
Hofstede’s “power distance” dimension and Schwartz’s value dimensions
(“embeddedness,” “hierarchy,” and “mastery”) were positively related to traffic fatalities,
and “intellectual autonomy” and “egalitarianism” were negatively related (Gaygisiz,
2009b, p. 540). Gaygisiz’s (2009) findings fit nicely into Runyan’s (1998, 2003)
expanded model considering how culture and other human factors influence the greater
Haddon matrix.
The Social and Economic Costs of Road Traffic Injury
Working-age members of society (ages 15–34) incurred the greatest burden in
terms of the cost of human suffering and the economic cost to society for the number of
productive years lost by disability or death (McKenzie et al., 2008). Road traffic
accidents cost the world economy an estimated US$518 billion per year (WHO, 2009, p.
2). Peden et al. (2004, p. 5) reported that "road crash injury costs an estimated 1% of
gross national product in low-income countries, 1.5% in middle-income countries, and
2% in high-income countries." According to Grimm and Triebich (2012, p. 3), however,
in India, for example, the social cost of road traffic injury was estimated to be as high as
3.2% of GNP. "About three-quarters of road traffic deaths are among men and … the
highest impact is in the economically active age range" (WHO, 2009, p. 11). Besides
suffering medical and funeral costs, many families were unable to recover from the loss
of their breadwinner (WHO, 2009, p. 3). "Given that these fatalities are concentrated in
49
the economically active population, reducing the number of road traffic injuries and
fatalities could confer large welfare gains to households" (Grimm & Treibich, 2012, p. 2).
Key Variables and Concepts
Income and Road Traffic Injury
Country income is a very important factor in road traffic, cutting across the cells
of the Haddon matrix. Income is the environmental factor that influences the other cells.
Country income forms an inverted curvilinear relationship with road traffic injury
and death (the inverted U or Kuznets curve; Anbarci et al., 2009; Grimm & Treibich,
2012; Kopitis, 2004). As income trickles through the society and people become
wealthier, they are able to progress from walking to human-powered and motorized two-
wheeled vehicles to safer four-wheeled vehicles (Anbarci et al., 2009; Grimm & Tribich,
2012; Kopitis, 2004). At the government level, with greater economic development
comes greater safety interventions, more investment in road and health infrastructure, and
more police and law enforcement, all of which help reduce the number of road traffic
fatalities (Anbarci et al., 2009; Grimm & Treibich, 2012; Kopitis, 2004). Grimm and
Treibich (2012, p. 8) reported that in India, when the per capita income rose to Rs 9,971
(rupees), the number of road traffic injuries leveled off and then began to decline at Rs
12,500 as more four-wheeled vehicles were on the roads.
Anbarci et al. (2009) believed that the decrease in fatalities may happen in
aggregate as income increases, but within-country and between-country income disparity
led to within- and between-country road traffic fatality disparity. This effect, or
externality, appeared in all countries independent of the country’s mean income (Anbarci
50
et al., 2009, p. 244). Anbarci et al. (2009) explained that vehicles are a luxury item that
increase in safety as the price increases; higher-income people can afford more crash-
worthy vehicles, while lower-income people need cheaper, less safe vehicles (if they can
afford a vehicle at all) to match their budget. The interaction between the transportation
types results in more fatalities for the cheaper, less safe transportation mode (Anbarci et
al., 2009, p. 244). Additionally, although overall income in a society results in the ability
of countries to develop and enforce safety standards in vehicles, road infrastructure, and
policy and enforcement of speed, alcohol use, and the like, income disparity still results
in higher fatality rates for vulnerable road users (Anbarci et al., 2009, p. 248).
As income and economic development increase for a country, especially beyond
the middle-income range, fewer people die in the road traffic crashes that do occur
(Ameratunga et al., 2006). However, the resulting minor to very serious injuries still
leave people with the need for rehabilitation (Ameratunga et al., 2006).
The WHO (2009, p. 234) found that the rate of road traffic injury was influenced
by country income level: the higher the income, the lower the rate of injury. In their
review of the literature on population health and governance, Klomp and de Haan (2008,
pp. 604–605) found that income has a positive effect on access to health resources: "With
increasing income comes increasing life-expectancy, lower levels of poverty, and greater
access to nutrition and health care." Chrisholm and Naci (2009) also pointed to economic
development as an independent variable that influenced the burden of road traffic injury
placed on road user groups; lower-income countries experienced greater pedestrian and
51
bicycle road traffic injuries, while higher-income countries saw more four-wheeled
occupant injury.
Grimm and Treibich (2012) compared 25 areas in India and presented evidence
they believe points to income, the ability to afford increasingly more complex vehicles,
and urbanization as the factors contributing the most to the burden placed on the Indian
people from motor vehicle accidents. Grimm and Treibich (2012) discussed the same
curious increase in road traffic fatalities as a country (or region) transitions from low- to
middle- to high-income that others have found (e.g., Anbarci et al., 2009; Kopitis, 2004).
Grimm and Treibich (2012) speculated that as people can afford more four-wheeled
vehicles and abandon walking on busy roads or driving less safe two-wheeled bicycles or
motorcycles, the rate of injuries increased and then decreased at a point of saturation for
four-wheeled vehicles. Grimm and Treibich (2010) suggested that during the transition,
injuries increased because a significant number of people still walk or ride bicycles or
motorcycles and suffer collisions with the four-wheeled vehicles the newly wealthier
people can afford. Grimm and Treibich (2010) reported that increased motorization,
urbanization, and pedestrian and two-wheeled traffic are the major factors leading to an
increase in road traffic injury rates in India. Indian women were a particularly high-risk
group of vulnerable road users. Grimm and Treibich (2010, p. 1) recommend that Indian
officials focus on road infrastructure, separation from traffic of pedestrians and other
vulnerable road users, and traffic regulation and enforcement, and should be particularly
mindful of women road users as India develops. Specifically, Grimm and Treibich (2010)
looked at how much money was allocated to enforcement of traffic laws, which they
52
measured as expenditure per police officer, and found that "higher expenditure per
policeman is associated with lower fatality rates”; an increase of 1% led to a decline in
fatality rate by about 0.15% (Grimm & Treibich, 2010, p. 13).
Mohan (2002; cited in Grimm and Treibich, 2012, p. 3) believed the issues
surrounding road crash injuries were more complicated in low- and middle-income
countries due to the following:
• A high proportion of [low-income] road users.
• A high proportion of vulnerable road users sharing the road with motorized
vehicles.
• A high population density in urban areas.
• A low enforcement level of road traffic rules and regulations.
• Severe limitations on public resources available for road and other
infrastructure.
Bishai, Quresh, James, and Ghaffar (2006, p. 65) found that
a 10% increase in GDP in a lower income country (GDP per capita < $1,600) . . .
[raises] the number of crashes by 7.9%, the number of traffic injuries by 4.7%,
and the number of deaths by 3.1% through a mechanism that is independent of
population size, vehicle count, oil use, and roadway availability. Increases in GDP
in richer countries appear to reduce the number of traffic deaths, but do not reduce
the number of crashes or injuries.
In contrast, Anbarci et al. (2009, p. 251) discussed a controversy in the literature
regarding the use of aggregate data to determine the death rate from road traffic fatalities.
53
The use of aggregate data is a prime ingredient in the ecological fallacy, whereby the
behavior of individuals is concluded from observation and analysis of data on the group
the individual belongs to (Anbarci et al. 2009, p. 251). The assertion that as income
increases in a country the road traffic injury rate decreases is an ecological fallacy,
especially the assertion that income inequity is an exception to the reduction. The issue is
the ability of relatively wealthier individuals in a society to afford heavier, safer vehicles
while the less wealthy can afford only the lighter, less safe vehicles (Anbarci et al. 2009,
p. 251). In their defense, Anbarci et al. (2009) argued that their assertion—that income
inequality, independent of the overall wealth of a country, results in higher injury rates
from traffic accidents—is supported by disaggregate data about specific subpopulations
in a country, not the aggregated death rate for the whole population.
Governance
Control of resources (material, intellectual, emotional and behavioral, and
political) is the source of a person's or group’s power to "influence others' thoughts and
self interests … or the satisfaction of human needs and aspirations" (Neal & Neal, 2011,
pp. 159–160). Individuals or groups with higher power are able to reward or punish, set
agendas, and/or influence shared consciousness to exercise their status (Neal & Neal,
2011, p. 159). Power relationships are available only when there is an asymmetrical
distribution of resources (Neal & Neal, 2011, pp. 161–162).
There are forces within countries to include and exclude the participation of
citizens (Babajanian & Hagen-Zanker, 2012). Citing the International Labour
Organization, UNICEF, and the World Bank, Babajanian and Hagen-Zanker (2012)

54
develop the argument that greater inclusion in the society reduces poverty, improves
participation in and strengthening of economic growth, reduces the cost of health care,
improves satisfaction with government, and promotes general well-being. Conflict is
often present during social change to redistribute power but does not necessarily
accompany all power relationships. “Conflict-free power might be observed in at least
three forms: acquiescence [to the power differential], authority [of the individuals
welding power], and unawareness [that a power difference exists]” (Neal & Neal, 2011,
p. 162).
Application of power and governance lies on a continuum from anarchy to
totalitarian systems, with democracy and republican representation in between. The
difference among these types of governance is the amount of control over the people
ruled. When there is no controlling government, anarchy exists and people are forced to
protect themselves, their family and property, while gathering the resources necessary to
live. When all control over the people is held by one person, a monarchy or dictatorship
exists, and the people are subjected to the whim of the ruler (adams4nchouse, 2012).
Between these extremes are oligarchy, rule by a group; democracy, rule by the majority
(subject to the current whims of the majority); and republic (rule by established law),
which is the least volatile and a constraint to mob rule (adams4nchouse, 2012). In effect
there are only oligarchies and republics, as one person cannot control all of a society and
anarchy rapidly forces people to band together and find protectors to stabilize the society.
Democracy is too susceptible to the mood of the day; people in the minority are at risk
from the whims of the majority. A democratic form of government rapidly moves toward
55
an oligarchy or a republic (adams4nchouse, 2012). Republics rely on formal rules agreed
on and used to protect people from vigilantism. It follows that in most republics
(commonly referred to as democratic systems), democracy happens at nodes: the public
elects, by a majority vote, the executive, legislative, and (some of) the judicial
representatives, which in turn vote on, approve, or constrain the majority actions at hand
(adams4nchouse, 2012).
Governance principles apply in societies economically structured around
capitalism, socialism, or a mixture of the two. “Governance involves [the] means for
achieving direction, control, and coordination of individuals and organizations on behalf
of [the] interests they have in common” (Forbes, Hill, & Lynn, 2007, p. 455). Kooiman
(1999 ; cited in Forbes et al., 2007, p. 453) identifies common elements in these
definitions as “the emphasis on rules and qualities of systems, co-operation to enhance
legitimacy and effectiveness and the attention for new processes and public-private
arrangements.”
Government is the interplay of legislative lawmaking, judicial decisions, and
executive action in place to administrate social order and social welfare; “multiple layers
of governing institutions,” in cooperation with public and private stakeholders, protect
and provide support to a people (Forbes et al., 2007, p. 453). Governance describes the
decision making and implementation of agencies or government bodies (McQueen,
Wismar, Lin, & Jones 2012, p. 4).
Governance takes place across all sectors of society, with government (central,
regional and local) taking responsibility for many aspects of society ranging from
56
the mundane (sewers, transportation, housing, energy, commerce) to the humane
(education, the arts, sports). . . . The tools of action . . . [are] persuasion,
regulation, law and legislation. (McQueen et al., 2012, p. 6)
To be effective governments need to focus on “political will, partnerships and
constituents’ interests, leadership, the political importance of the issue, the immediacy of
the problem, context for effectiveness, resources and implementation practicalities” (Lin,
Jones, Synnot, & Wismar, 2012, p. 40).
Indicators of all kinds are developed to simplify and rank-order complex
phenomena and are invested with a power that “shapes how the world is understood,” but
they may obscure important nuances (Davis, Kingsbury, & Merry, 2012, p. 76).
Important decisions can be made based on the oversimplifications present in indicators
(Davis et al., 2012). Yet this simplification provides a consistent representation, with
discernible biases, across countries (Davis et al., 2012).
Governance and political style are also important factors and are related to
country income (Ha, 2012; Gradstein, 2004; Khan, 2007; Lewis, 2006; Pillai et al., 2011;
Qadri, 2012). Kirigia and Kirigia (2011, p. 3) demonstrate the links between a nation’s
economic situation, poverty reduction, national health, and political stability, pointing to
a transmatrix influence of the factors of governance.
Governance is the interplay of laws and rules, judicial decisions, and executive
actions in place to administer social order and social welfare through cooperation with
public and private stakeholders. A country’s cultural heritage, ethnic diversity, religious
affiliations, and geography all have a place in the makeup of the governance of a people
57
(Al-Marhubi, 2005, p. 459). In “ethno-linguistically fractionalized” and “ethnically
diverse” countries, for instance, there is likely to be more restriction on political
freedoms, more intervention to regulate social mobility, and greater governmental
inefficiency and corruption (Al-Marhubi, 2005, p. 459). La Porta, Lopez-de-Silanes,
Shleifer, and Vishny (1999) found that governance is also directly related to the way a
society redistributes its wealth and protects the rights and well-being of its citizens.
In a pure form, "governance involves [the] means for achieving direction, control,
and coordination of individuals and organizations on behalf of [the] interests they have in
common" (Forbes et al., 2007, p. 455). Olafsdotir, Reidpath, Pokhrel, and Allotey (2011,
p. 2 of 8) defined governance as "the process whereby societies or organizations make
their important decisions, determine whom they involve in the process, and how they
render accountability.” Governance can be defined as the process of decision making by
the government and the process by which decisions are implemented (or not
implemented; Klomp & de Haan, 2008, p. 599). “Governance, broadly defined as the
framework of rules, institutions and practices by which authority is exercised, is a key
element for a well-functioning market economy and indispensable for sustained growth
and equitable development” (Al-Marhubi, 2005, p. 453).
Governance refers broadly to the manner in which authority is exercised. Defined
in this way, governance transcends government to include relationships between
the state, civil society organizations and the private sector. It includes the norms
defining political action, the institutional framework in which the policy-making
process takes place, and the mechanisms and processes by which public policies

58
are designed, implemented and sustained. Common governance issues include the
limits of authority and leadership accountability, transparency of decision-making
procedures, interest representation and conflict resolution mechanisms. (Al-
Marhubi, 2005, p. 454)
McQueen et al. (2012, pp. 4– 6) asserted:
Governance is a verb; it describes decision making and implementation of actions
of agencies or government bodies. . . . Governance takes place across all sectors
of society, with government (central, regional, and local) taking responsibility for
many aspects of society ranging from the mundane (sewers, transportation,
housing, energy, commerce) to the humane (education, arts, sports). … The tools
of action … [are] persuasion, regulation, law and legislation.
Forbes et al. (2007, p. 453) list the common elements of governance:
• Emphasis on rules and qualities of the system.
• Cooperation to enhance legitimacy and effectiveness.
• Development and implementation of new processes and public-private
arrangements.
There seems to be broad consensus that good governance implies that a
government is accountable, transparent, responsive, effective, and efficient and follows
the rule of law, thereby assuring that corruption is minimized (Klomp & de Haan, 2008,
p. 600). Weale (2011, p. 63) discussed governance as a range of hierarchical procedures
and players who "through bargaining and negotiating form a policy making body."
Governance is accomplished by "multiple layers of governing institutions" working to
59
develop, implement, and evaluate rules and regulations for the governed (Forbes et al.,
2007, p. 453).
An army of civil servants fills the ranks of cabinets, agencies, bureaus, and
departments that form the bureaucracy that gets the work of government done (McQueen
et al., 2012, p. 16). To be effective governments need to focus on “political will,
partnerships and constituents’ interests, leadership, the political importance of the issue,
the immediacy of the problem, context for effectiveness, resources and implementation
practicalities” (McQueen et al., 2012, p. 40).
Kirigia and Kirigia (2011) reviewed the literature on indicators used to measure
governance in health development to form an index of governance. They offered a broad
definition for health governance that incorporates a number of facets of citizens’ well-
being:
Sectors that assure human rights to education, employment, food, housing,
political participation, and security combined have greater impact on health
development than the health system. For example, the significant negative impact
of political and macroeconomic instability on health development has been starkly
demonstrated in the diminished health indicators of the African countries that
have undergone various forms of political and macroeconomic turmoil. (Kirigia &
Kirigia, 2011, p. 2)
Klomp and de Haan (2008) studied governance as a factor driving mortality. They
found that governance indirectly influences the mortality rate through the financial
support of a country's health care sector to provide quality care. Klomp and de Haan
60
(2008) looked at the governance indicators of legislative effectiveness, control of
corruption, bureaucratic quality, law and order, regulation, and legal system and property
rights. They correlated governance with the measures of life expectancy, mortality rates,
years lost to disease, number of health care professionals, number of hospital beds, and
the level of basic health care preventative services provided. Then they segmented their
data by country income level and concluded that especially in low- and middle-income
countries, income is the primary determinant of health. This finding is similar to the
observation that income affects rates of traffic deaths.
"It is widely believed that poor governance causes well-intentioned spending to
have no impact due to bribes, corrupt officials, and mis-procurement. Indeed the scant
available evidence suggests that poor governance has a negative impact on health"
(Klomp & de Haan, 2008, p. 599). Klomp and de Haan (2008, p. 605) found that good
governance has a positive effect, particularly on health and the health care sector, but
does not directly improve the health and income of individuals. A 1% increase in good
governance leads to an increase of 0.55% in the quality of the health care sector and an
increase in the health of individuals of about 3.54% (Klomp & de Haan, 2008, p. 607).
Kickbusch and Gleicher (2012, p. 15) suggested that in European Union countries
health governance was the direct outcome of the "knowledge revolution." They argued
that education is the best intervention and that a 10% increase in education funding would
significantly improve health (Kickbusch and Gleicher, 2012, pp. 4–7).
Indicators simplify and rank-order complex phenomena and are invested with a
power that "shapes how the world is understood," but they may not allow for important
61
nuances (Davis et al., 2012, p. 76). Important decisions can be made based on the
oversimplifications present in indicators, yet the simplification inherent in these
indicators provides a consistent representation from all parties across countries (Davis et
al., 2012). Andrews et al. (2010, p. 391) argued that indicators may do little more than
reflect a country's development and should have "a . . . focus on specific fields of
engagement, and the size of outcome, and control for key contextual differences in
comparing countries."
With this caveat in mind, World Governance Indicators (WGI) can be used as a
comparison or evaluation tool among countries for a given time period, but the aggregate
measures may be too vague to use to measure a specific topic or program in an individual
country (World Bank, 2013). “More detailed and country-specific diagnostic data that
can identify the relevant constraints on governance in particular country circumstances”
are needed (World Bank, 2013). Disaggregated data used to compile the individual
indicators are available from the World Bank if a view of a particular area is desired
(World Bank, 2013).
A key feature of the WGI is that all country scores are accompanied by standard
errors. These standard errors reflect the number of sources available for a country
and the extent to which these sources agree with each other (with more sources
and more agreement leading to smaller standard errors). These standard errors
reflect the reality that governance is difficult to measure using any kind of data. In
most measures of governance or the investment climate they are however left
implicit or ignored altogether. (World Bank, 2013)
62
The six WGI used by the World Bank (2013) are (a) voice and accountability, (b)
political instability and violence, (c) government effectiveness, (d) regulatory quality or
burden, (e) rule of law, and (f) control of corruption. Governance indicators are a
summation of the observations and opinions of key stakeholders in a country, as well as
those of experts in the fields of world government and finance (World Bank 2013).
Voice and accountability: “Voice and accountability captures perceptions of the
extent to which a country's citizens are able to participate in selecting their government,
as well as freedom of expression, freedom of association, and a free media” (World
Bank, 2013).
Weale (2011, p. 64) defined the components of accountability as "explanation and
sanctions." In a democracy with free elections, accountability is inherent in the electoral
process, but it "induces blame shifting and blame avoidance behaviors by officeholders,
so that it may be impossible for even well-informed members of the electorate to know
how well or badly a particular group of actors has performed" (Weale, 2011, p. 66). As
the governance policies become more vague, accountability decreases and policies are
enacted less often (Weale, 2011).
Grimmelikhuijsen (2011) described the importance of media access to
governmental information to assure accountability. This author focused on three aspects
of transparency: in decision-making processes (steps taken and rationale), in policy
content, and in policy outcome or effects (Grimmelikhuijsen, 2011, p. 38). The key
considerations were the completeness of information, the usability of the information,
and the understandability of the information. However, government information can be
63
manipulated to serve the political agenda and to "divert attention, counter transparency
information, provide favorable or positive interpretations of specific information
(including the use of statistics), present positive effects while ignoring negative
information or present lies" (Grimmelikhuijsen, 2011, p. 36).
Political instability and violence: This indicator “measures perceptions of the
likelihood that the government will be destabilized or overthrown by unconstitutional or
violent means, including politically-motivated violence and terrorism” (World Bank,
2013). Ha (2012), for instance, discusses the role the free market and social welfare play
in the development of a country. An unstable political environment is counterproductive
to attempts to attract economic improvement due to potential investors’ fear of loss. A
government that is unstable is also unlikely to promote infrastructure or social welfare
programs.
Government effectiveness: One way governments can be efficient is when the
population is concentrated in geographical areas. Klomp and de Haan (2008), for
instance, suggested that the denser the population, the easier it is for the government to
provide efficient health care, but overall population and rapid population growth can
overwhelm the health care sector, diminishing its effectiveness. The level or density of
the rural population has a negative effect on health, and population growth has a
significant negative impact on the health care sector (Klomp and de Haan, 2008, p. 605).
Government effectiveness captures perceptions of the quality of public services,
the quality of the civil service and the degree of its independence from political
64
pressures, the quality of policy formulation and implementation, and the
credibility of the government's commitment to such policies. (World Bank, 2013)
Regulatory quality: Regulatory quality “captures perceptions of the ability of the
government to formulate and implement sound policies and regulations that permit and
promote private sector development” (World Bank, 2013).
The ability of the state to provide effective regulatory institutions can be expected
to be a determinant of how well markets and the economy perform. The impact of
regulatory institutions on economic growth will depend on both the efficiency of
the regulatory policies and instruments that are used and the quality of the
governance processes that are practised by the regulatory authorities. (Jalilian,
Kirkpatrick, & Parker, 2007, p. 28)
Rule of law: Atubi (2012), studying the relation of population density to road
fatality in Nigeria, found a reduced fatality rate in densely populated areas. This he
attributed to the funding levels for enforcement. Atubi calls for consistent funding and
political attention to the development of policies to protect Nigerian citizens and for
public health interventions and campaigns aimed at promoting safety as well as greater
funding for law enforcement efforts.
Rule of law captures perceptions of the extent to which agents have confidence in
and abide by the rules of society, and in particular the quality of contract
enforcement, property rights, the police, and the courts, as well as the likelihood
of crime and violence. (World Bank, 2013)

65
La Porta et al. (1999) measured rule of law according to whether a country has
British Common Law as the origin of its legal system, believing that this should have a
positive effect on governance. British Common Law represents greater protection of
property rights against the state and “can be taken as a proxy for the intent to limit rather
than strengthen the state” (La Porta et al., 1999, p. 232).
Control of corruption: “Control of corruption captures perceptions of the extent to
which public power is exercised for private gain, including both petty and grand forms of
corruption, as well as ‘capture’ of the state by elites and private interests” (World Bank,
2013).
Nwabuzor (2005) reported that bribery, over $1 trillion per year worldwide,
accounted for up to 12% of the GDP in some nations. Corruption sustains high or
increasing property rents, reduces product quality, and reduces economic development
and incomes, resulting in the reduced overall well-being of citizens.
At moderate levels, corruption is self-sustaining and accepted by a society.
Rosenblatt (2012, p. 237) defined corruption as the "misuse of power or position for
personal or organizational gain … [and] suggests that organizational corruption is driven
by the individual and institutional tendency to structure society as group-based social
hierarchies." Additionally, "it seems that certain individuals associate power, status, and
authority with a get out of jail free card" (Rosenblatt, 2012, p. 237). Rosenblatt (2012)
referenced social dominance theory to discuss the adjustments people make to and their
mundane acceptance of the organizations they are a part of.
66
Corruption is reduced in more open economies because competition forces prices
down, giving less leverage to those who would extract additional fees to provide services
(Al-Marhubi, 2005, pp. 455–456). The more corruption and the poorer the governance
technique, the less international trade will be attracted to a country (Al-Marhubi, 2005).
A large economy in a good geographic location encourages more openness to trade than
does the enactment of financial policy, further discouraging corrupt practices (Al-
Marhubi, 2005).
One of the factors Law (2009) looked at in her study was the effects of corruption
on motor vehicle deaths. Two findings emerged from her work: in low-income countries,
corruption was correlated with a decrease in road traffic accidents and with reduced
economic development. Both of these correlations are the effect of decentralized
corruption increasing the cost to the population, which decreased the GDP per capita.
Lower income results in fewer vehicles on the road and fewer road traffic fatalities.
Higher income countries, Law (2009) explained, had more centralized corruption, which
reduced the number of corruption events individuals needed to contend with, reducing the
waiting cost and increasing the economic status of the country. An improved economy, or
the aggregate increase in GDP per capita, is correlated with an increase and then a
decrease in road traffic fatality.
Nwabuzor (2005, abstract) cites reports finding that bribery worldwide costs
“over $1 trillion per year, accounting for up to 12% of the GDP” of some nations.
Corruption results in sustaining or increasing poverty and reducing product quality,
economic development, and the overall well-being of a country’s people (Nwabuzor,
67
2005, abstract). Rosenblatt (2012, p. 237) writes, “Organizational corruption is driven by
the individual and institutional tendency to structure societies as group-based social
hierarchies.”
Openness: The openness of a country to internal and world inclusion and
investment is not currently considered a governance indicator, but it is an important
factor in economic development.
Al-Marhubi (2005, p. 468) believes that the quality of governance and openness
to trade are significantly related:
The significance of trade suggests that globalization, which is a major dynamic of
our time, can enhance countries’ incentives to build good governance. By
reducing the costs of transportation and communication through technological
advancement, globalization can potentially increase the extent to which countries
are integrated with the rest of the world. As a result, and contrary to popular
perceptions, openness to the world economy could be an important force for
positive social change with important spillover effects on governance.
Al-Marhubi (2005, pp. 455–458) found six explanations in the literature that are
proposed to account for the effect of the openness of an economy to trade on governance:
(a) corruption, (b) membership in international institutions, (c) a constrained and stable
policymaking philosophy, (d) independent central banks and autonomous tax agencies,
(e) gradual social and cultural changes, and (f) resilience in governing.
Membership in international institutions demonstrates a thoughtful approach to
policy development and forces a government to adopt policy that “harmonizes” relations
68
among countries (Al-Marhubi, 2005, p. 457). A constrained and stable policymaking
philosophy gives investors the sense of safety in the investments they make in a country
(Al-Marhubi, 2005, p. 457). Countries with division of powers (the separation of powers
among the legislative, executive, and judicial branches) tend to constrain economic
policy and provide investors with a stable environment in which to invest (Al-Marhubi,
2005, p. 457).
Independent central banks and autonomous tax agencies reduce the low
investment return when countries undergo surprise growth without inflation but high
depreciation of investments (as recently happened prior to the downturn in 2008; Al-
Marhubi, 2005, p. 457). Additionally, gradual social and cultural changes might
encourage integration into the global economy, which encourages knowledge acquisition
and the pursuit of representative forms of government. Representative forms of
government tend toward openness and global integration (Al-Marhubi, 2005, p. 457).
Finally, quality governance guarantees that investors will not suffer losses due to political
or economic instability and provides rule of law and accepted procedures for economic
stability (Al-Marhubi, 2005, p. 458). “More open economies heave better governance
structures. . . . The quality of governance is related significantly to openness in
international trade” (Al-Marhubi, 2005, p. 468).
The WGI were correlated at 0.94 across countries, yet Al-Marhubi (2005, p. 455)
adjusted the index to address the criticism that the indicators may not be measuring the
same thing in each country; it may be that if a country governs in a particular way in one
69
area, it will govern with the same quality in others (i.e., good governance leads to good
governance and bad to bad).
In his study, Al-Marhubi (2005) reduced the indicators to three:
1. Voice and accountability and political instability are averaged into a single
indicator to represent how governments are selected, monitored, and replaced.
2. Government effectiveness and regulatory burden are averaged into a single
indicator to represent the capacity of the state to implement sound policies.
3. Rule of law and graft are averaged to produce an indicator that summarizes
the respect of the citizens and the state for the rule of law. (Adapted from Al-
Marhubi 2005, pp. 455–456)
Governance and Income
Forms of government, rule of law, and corruption affect the wealth and welfare of
citizens across countries (Pillai, 2011; Gradstein, 2004; Lewis, 2006). Democracy
increases trade and is shown to improve income (Pillai, 2011, p. 69). A “political
climate” that wills the legislature to enact and implement social or wealth-distributive
programs is an important additional factor in income equality and country wealth (Pillai,
2011, p. 69). Gradstein (2004) explored the relation between property rights and growth
and found that protection of property without undue constraint on trade improves country
wealth. Lewis (2006, p. 7) described corruption not only as direct payments in cash but
payment for absenteeism or for services not provided and other “uses of public office for
private gains.” Corruption is demonstrated to inhibit both the GDP and the effectiveness
of social improvement programs (Lewis, 2006).
70
Much of the recent literature on governance and income has focused on openness
to trade in countries, using the WGI (e.g., openness, corruption, rule of law) and
governmental style. Income inequality tends to be greater the freer the market economy
becomes (Ha, 2012). There are governments that lean toward free markets and less
regulation, allowing income to be redistributed from entrepreneurs to employees; other
governments, generally leftist or socially oriented, are more controlling of markets and
trade, and the redistribution of wealth across the population is accomplished through
taxation and social programs (Ha, 2012).
Historically, freer markets have increased the wealth of a country and improved
wages for unskilled workers, but, as Ha (2012) points out, only citizens who work benefit
from wage increases because the government may not devote money to social
improvements like health care, education, and public works. Ha (2012) further explains
that, just like the rebuilding after World War II, a blending of liberal market policies with
social protective programs is the recipe for economic gain and citizens’ welfare.
Governments that do not attend to social programs risk social unrest, which hampers or
completely disrupts the economic gains from free markets (Ha, 2012).
Both Khan (2007) and Qadri (2012) concurred that the openness of markets needs
to be tempered by adequate funding of social programs to ensure minimal social unrest
and impediments to the growth potential of the free market. In other words, concern for
both individual profit and the good of the people is needed for responsible and
sustainable economic growth. Qadri compared low-, middle-, and high-income countries
for the effects of spending on human capital or social improvement programs. He found
71
that different benefits could be reported for each of the income levels: low-income
countries received the greatest economic growth benefit from improved services and
programs for the population, and high-income countries benefited least because the
resources in those countries were already in place and already improving the lives of the
population. Qadri concluded that only new spending improves the well-being and
happiness of the citizens. This point, that happiness is diminished as income increases, is
also the focus of a paper by Easterlin (2005), which followed the happiness of people in
low- through high-income states. Easterlin (2005) found that as income rises, each
additional monetary unit becomes a smaller portion of the total income. At some point
basic needs are met and discretionary income is available, which allows people to
consume nonessential and often competitively priced items, the “keeping up with the
Joneses” spending that is often characterized as hollow (Easterlin, 2005). Happiness
increases faster when basic needs are being meet and slows as more luxury items become
available.
Gradstein (2004) explored the protection of property rights, equivalent to the rule
of law and protection against corruption, and found that low levels of property rights
protection exist in low-income countries, where the cost of enforcing property rights is
either financially or politically too costly, resulting in slow economic development, if
any, occurring in these countries. At moderate to high levels of property rights protection,
law enforcement is less of a burden on the budget, spurring people to invest in more
economic-stimulating activities and hastening the growth of the economy.
72
Governance, Income, and Road Traffic Fatalities
Gaygisiz (2010) compared road traffic fatalities with the six World Bank World
Governance Indicators from 46 countries and determined that for each of the six
indicators safety improved as governance improved. Gaygisiz (2010) found a high
positive correlation among the WGI and combined the six indicators into one value,
which was correlated with road traffic accidents. The six WGI had a negative correlation
with road traffic fatalities, such that the higher the quality of government, the lower the
number of road traffic deaths (Gaygisiz, 2010, p. 1894). However, Law (2009) looked at
governance, policymaking, and road traffic fatalities and concluded that fatalities follow
the Kuznets curve. This, Law (2009) explained, is the relationship between increasing
prosperity and the ability of governments to afford institutions and policy interventions
aimed at improving the driving experience and driving safety.
Law (2009) compared governance with road traffic deaths to find the inverted U
of the Kuznets curve in the increase in road traffic deaths as governance indicators
improved to a threshold and then a decrease in road traffic deaths as the indicators
continued to improve. She attributed this to the same explanation as the relation of
income to road traffic deaths: that the improved well-being and wealth of a citizenry
allow for greater, but less safe, road use until regulation, enforcement, and safety
standards improve to reduce road traffic fatalities.
Law (2009) identified corruption as a factor that can affect the rate of road traffic
deaths. Corruption reduces the enforcement of road traffic regulations and impacts the
rate of economic development in low- and middle-income countries, both factors in road
73
traffic death rates. When comparing corruption, political freedom, per capita income, and
motor vehicle crash deaths, Law (2009) found the inverted U shape of death rate as
income increased. But for corruption she found that lower-income countries had greater
levels of corruption and higher-income countries had less corruption with a negative
correlation (r = –0.17, p. < 0.05). Law calculated the death rate per gross domestic
product, which increased “from –1.398 to 1.754 for highly developed countries and
increased from –0.599 to 1.885 for less developed countries” (Law, 2009, p. 129).
Although Law’s (2009) report is on corruption, other authors (e.g., Al-Marhubi, 2005)
demonstrate strong correlations among governance indicators (r = 0.94 in Al-Marhubi’s
study), suggesting that one indicator can approximate the effect of any of the other
indicators.
Governance, Income, and Prehospital Services
Governmental involvement is vital for a prehospital system to meet the needs of a
country’s people (Jakubazko, Hori, Khruekarnchana, & Kanchanasut, 2010).
Governments need to improve “health care, health insurance, economic growth, and
provide leadership” to make prehospital services efficient and effective (Jakubazko et al.,
2010, p. 51). Aguilera, Cabañas, and Machado (2010) assert that prehospital delivery
systems are dependent on governmental regulations to justify their existence, regulate
personnel and scope of practice, and determine which agency and fiscal arrangements
(i.e., public, private, voluntary) will provide services. Yet there is a lack of common
knowledge, language, and priorities between governments and prehospital providers,
which hampers development of consistent improvements in quality (Jakubazko et al.,
74
2010). Advocacy from key stakeholders and media in conjunction with education of
professionals and laypeople on the benefits of and skills needed in providing prehospital
care are very important tools in influencing policymakers in strengthening prehosptal
legislation (Jakubazko et al., 2010, p. 52).
Roberts et al. (2014) found that the improving economy of Canada brought with it
an increase in recreational injuries (including from off-road vehicles), but not an increase
in road traffic deaths. Roberts et al. (2014) believed their data reveal that the number of
crashes has increased due to a greater number of vehicles on the road, but advances in
trauma care have improved the crash victims’ outcome.
Prehospital Services
Although prehosital services can be placed in several cells of the Haddon matrix,
it is the postevent agent and environment cells that are of interest in this study. A pre-
event cell position for prehospital services, however, is for training and preparedness.
Anderson et al. (2011, p. 2) pointed out that countries require different strategies for
implementing improvements in their emergency medical systems. “Optimizing the use of
existing resources can be an effective strategy for strengthening [a prehospital] system";
such structural refinement has been shown to reduce mortality from 50% to 8% when
using a definition of reduction based on either all injuries or only those "individuals who
reach the hospital alive" (Anderson et al., 2011, p. 2).
Advocacy for strong prehospital services can be surmised from the literature.
Jakubaszko et al. (2010), for instance, advocate for high levels of civil engagement in
health care and emergency services. They believed that citizens can stimulate and
75
encourage interactions among health care professionals, EMS, politicians, and mass
media to promote legislation that ensures public health and stimulates economic growth.
Kazzi and Jabr (2010) used Lebanon as a case study to demonstrate how EMS and public
services interplay for the benefit of citizens and national interests; they also argued that
commitment and persistence among advocates are needed to build and maintain
relationships with the government for the betterment of the system. Kazzi and Jabr (2010)
recognized that a stable political system is a requirement for the development of an
emergency medical system. Finally, Brice, Brown, and Snooks (2010) supported the
development of a strong emergency medical system and called for funding, information
systems, and rigorous evidence-based research models, as well as for future multicenter
and multinational research for quicker and higher quality response to EMS needs.
Prehospital Responder Training
In the United States people responding to emergencies fall into a number of job
classifications. Holliman (2010, pp. 3–6) defined advanced life support as the level of
care provided by paramedics trained in emergency care for between 450 and 1,500 hours,
or more extensively trained nurses trained in prehospital services for two to six years, or
physicians trained for six to 13 years. Emergency medical technicians are trained at a
lower level than paramedics, at 10 to 500 hours, to provide basic medical assistance,
stabilization, and rapid transport to a care facility; they provide basic life support
(Holliman, 2010, p. 4). First responders arrive at a scene first and are trained in
rudimentary medical management until more advanced help arrives (Holliman, 2010, p.
5); these include police and firefighters. Bystanders and passersby are not trained or
76
authorized to perform medical care but are in the vicinity and may offer assistance
(Holliman, 2010, p. 4).
Aguilera et al. (2010, p. 126) described providers of basic life support, the lowest
level of training, as people trained to provide “airway support . . . , cardiopulmonary
resuscitation, bleeding control, spine immobilization, and splinting techniques.” This
describes the emergency medical technician—basic (EMT-B), who is trained to perform
“scene triage, patient assessment, and patient monitoring during transport” and may be
approved to administer certain drugs based on local protocol (e.g., epinephrine for
allergic reactions or bronchodilator metered dose inhaler for wheezing airways; Aguilera
et al., 2010, p. 126). Advanced life-support providers, often called paramedics or EMT-P,
receive additional training in basic and more advanced invasive (e.g., endotracheal
intubation) and drug administration techniques (i.e., intramuscular, intravenous, and
intraosseous [bone marrow] routes, as well as electrographic monitoring and electrical
intervention of heart arrhymias; Aguilera et al., 2010, pp. 126–127). Registered nurses,
with similar or more advanced training, are more often based in the hospital but may staff
prehospital response vehicles or provide critical care in interfacility transport, via ground
or air (Aguilera et al., 2010, p. 127). Physicians are involved in most prehospital services,
some as medical directors and others as direct care providers able to intervene with the
most invasive techniques (Aguilera et al., 2010, pp. 128–131). Physicians are the most
highly trained response personnel; in many countries, they provide more extensive care
and intervention at the scene of a road traffic crash (Aguilera et al., 2010, p. 127). The
77
tasks and responsibilities of physicians in prehospital services vary widely among
countries (Aguilera et al., 2010, pp. 128–131).
Rainer, Graham, and Cattemole (2010) expanded the standard set of skills and
training programs across country systems. As can be expected, they described great
variation among countries regarding priorities for and effectiveness in training
prehospital response personnel. Each country has a unique set of needs that must be
accounted for (e.g., a remote community may need training in specific diseases and
injuries common in the area that other providers do not need; Rainer et al., 2010, p. 143).
The standard set of elements recommended for competency in knowledge and skill needs
to be tailored to the situation but should provide for basic life support (e.g., airway
management and hemorrhage control) through advanced life-saving techniques (e.g.,
intubation, cardiac monitoring, and drug administration; Rainer et al., 2010, pp. 144–
152). The ability to train prehospital response staff is governed by the financial ability
and policy necessities of each country (Rainer et al., 2010).
Prehospital Service and Health
Anderson et al. (2011, p. 1) discussed the importance of the World Health
Assembly Resolution 60.22, Health Systems: Emergency Care Systems “as a policy tool
for improving emergency care access and availability globally." Emergency care
providers have been shown to be an effective primary agent in the prevention and
reduction of disease and injury, and policies strengthening emergency medical systems
can serve all countries as they attempt to improve the health and welfare of their people
(Anderson et al., 2011, p. 1).
78
One major problem that low- and middle-income countries have in their
emergency response to road traffic injury is the lack of medical providers available
within the first few minutes or hours after the incident. Training health care providers in
the community may be an answer to this problem. Jennings (2010) discussed the role that
the emergency medical system (generally called prehospital providers in this paper) can
play in public health and public education. Prehospital providers operate at the entrance
to the health care system and provide disease surveillance, primary treatment, and health
education. Jennings (2010) advocated for an expanded role for prehospital personnel in
the field. Incorporation or enhancement of prehospital providers can benefit the
population in low- and medium-income countries by dealing with injuries and other
health-related difficulties (Kobusingye et al., 2005; Razzak & Kellermann, 2002).
Kobusingye et al. (2010) encourage community and country leaders to see the benefit of
emergency care to cost-effective public health, population health, and health care systems
in general in low- and medium-income countries and to support prehospital care in their
country. Likewise, Brown and Devine (2008) suggest that resources can be stretched,
costs reduced, and the public educated more effectively with the collaboration of
prehospital and other health care–providing agencies.
Stirling, O’Meara, Pedler, Tourle, and Walker (2007) supported the expanding
scope of practice of emergency medical technicians and paramedics as a cost-effective
way to provide health care services to rural and other hard-to-reach populations. To that
end, Shah, Rajasekaran, Sheahan, Wimbush, and Karuza (2008) developed a geriatric
training for EMTs that is aimed at increased access to health care in the rural United
79
States. Likewise, Reeve, Pashen, Mumme, and Cheffins (2008) described the rural
paramedic certification program in Australia and the satisfaction of the participants in the
program, who take pride in having a greater role in the health of rural Australians. Closer
to home, Liebowitz and Taigman (2008) reported on the expansion of EMT and
paramedic personnel into the arena of community health for chronic disease treatment,
prevention, and health promotion in Pittsburgh, Pennsylvania. These efforts are reported
to have benefited the residents of the catchment area involved. The success of the
Pittsburgh trials has spurred an expanded investigation into the use of prehospital
personnel in community health and illness prevention (K. Walk, director of Allegheny
County Emergency Medical Services, personal communication, September 1, 2013).
Holliman et al. (2011, p. 1) performed a literature review of the efficacy and value
of emergency medicine and identified 282 articles demonstrating the efficacy of
emergency critical care and procedures, cost-benefit value of emergency care for "public
health and preventative medicine,” "trauma and airway,” “ultrasound and radiology,” and
“medical residencies in emergency care.” Holliman et al. (2011) concluded that
emergency medical care is a vital component of the health care system and, especially in
low-income countries, should be allotted funds to provide much of the general medical
care of the citizens.
Likewise, Sarlin and Alagappan (2010) recommended that emergency medical
services be a coordinated component of the overall health care system in all countries.
O'Reilly and Fitzgerald (2010, p. 40) encouraged countries to incorporate responsible
authority, agents, and human resources when developing and improving their emergency

80
medical services system and to provide access to care. Levels of training and
responsibility should be systematized, starting with primary care (at the scene) and
proceeding through subsequent levels of care to the doctors at the emergency hospital.
Al-Shaqsi (2010, p. 319) specified four components of a successful health care system in
the case of traffic accidents: (a) access to emergency care, (b) care in the community, (c)
care en route to the emergency facility, and (d) care upon arrival at the facility.
Anderson et al. (2012) proposed six steps (compressed into five here) necessary to
strengthen emergency care, based on the World Health Assembly Resolution 60.22:
Assess Worldwide and Individual Country Systems:
1. Encourage governments to plan and provide for a basic level of emergency
services.
2. Develop data and tracking to provide objective outcomes for emergency care
services.
3. Develop or encourage standardized protocols and procedures for prehospital and
hospital treatment.
4. Support World Health Organization member states "with assessing and improving
their emergency care system."
5. Encourage member states to establish evidence-based intervention. (Adapted from
Anderson et al., 2012, p. 6)
Prehospital Response and Road Traffic Fatalities
Coats and Davis (2002), writing from personal experience and a literature review,
detailed the experience of responding to road traffic crashes with causalities. Trauma care
81
for victims (in developed countries) starts with the crash event notification, then the
dispatch and the arrival of rescue and prehospital medical units on scene. Depending on
the complexity of the crash and subsequent extrication of victims there is a “30–45
minute interval [or longer] between the time of the crash and arrival at hospital” (Coats &
Davis, 2002, p. 1135). The scene is “a disorienting environment … [with] sights (flashing
lights and wreckage), sounds (noise of generators and engines), and smells (fuel and
exhaust).… Lighting may be poor at night, weather conditions may be adverse …
ambulance equipment may be unfamiliar [to physicians stopping to give aid at the
scene]” (Coats & Davis, 2002, pp. 1135–1136). The victims need rapid assessment of
basic life threats (e.g., airway blockage, hemorrhage, and cervical spine fracture), but
further treatment needs to be delayed until the victim is extricated (Coats & Davis, 2002,
p. 1137). Extrication may include removing window glass, doors, roof support posts, or
entire roofs. There is a potential for undeployed airbags to spontaneously activate with
explosive force, and sharp metal edges are a safety concern, as is the potential for fire.
Before being sent to an appropriate hospital for definitive care, the victim is packaged for
transport in a cervical collar strapped to a straight, hard backboard, possibly with
bleeding-control bandages and direct pressure needed to stop or slow hemorrhage, and
possibly with cardiopulmonary resuscitation in progress (Coats & Davies, 2002).
The idea that emergency medical services are beneficial to increase survival from
road traffic accidents is well accepted. Sanchez-Mangas et al. (2010), for instance,
demonstrated outcomes of emergency medical systems and road traffic fatality. Noland
and Quddus (2004) measured lengths of stay in the emergency room and subsequently in
82
the hospital to evaluate the effectiveness of prehospital and early hospital care in a cross-
sectional time series, showing that as medical technology in emergency care increased in
sophistication, fatality rates from road traffic accidents decreased. Henry and Reingold
(2012, abstract) performed a Cochran Library systematic review and meta-analysis of
trauma systems in the developing world. After analyzing 14 studies, they found a 25%
reduction in loss of life from trauma when prehospital services were available (relative
risk [RR] of death 0.75: 95% confidence interval [CI], 0.66–0.85). The reduction in loss
of life in rural areas was notable (RR 0.71: 95% CI, 0.59–0.86).
Grimm and Treibich (2012, p. 5) asserted that health care supply and the quality
of trauma and medical care matter for the chances of accident victim survival. Moreover,
the quality and accessibility of health facilities may also have an indirect impact on the
risk attitude of road users. Bishai et al. (2006) found that governance has the ability to
reduce the number of road traffic crashes and, by extension, the death rate from crashes
through improved safety, reducing the need to fund competing priorities (i.e., effectively
meeting other needs of the society), and influencing economic growth (including people’s
ability to purchase safer vehicles); death rate alone was a factor in improving emergency
medical care in both the prehospital and hospital arenas. Van Beeck, Borsboom, and
Mackenbach (2000) credited the improvement of health care in the reduction of road
traffic fatalities they saw in a longitudinal study of economic development and road
traffic death from the 1960s to the 1990s.
83
Physician Versus Nonphysician Prehospital Providers
Both Al-Shaqsi (2010) and O'Reilly and Fitzgerald (2010) described the prevalent
models for emergency care worldwide. There are two main methods: the Franco-German
model of extensively treating the patient in the field, transporting to the hospital, and
directly admitting to the floors, and the Anglo-American style of rapidly assessing and
treating life-threatening injuries or conditions in the field and rapidly transporting the
patient to the hospital to receive definitive treatment from emergency medicine staff and
physicians there. Emergency rooms are more important in the Anglo-American system,
as are the emergency medical technician and paramedic. The Franco-German style favors
emergency physicians in the field, although this increases the cost of care. Some
countries with the Franco-German style are Germany, France, Greece, Malta, and
Austria; some countries with the Anglo-American system are the United States, Canada,
the Sultanate of Oman, and Australia (Al-Shaqsi, 2010, p. 320).
Botker, Bakke, and Christensen (2009) found an increase in survival rate for
myocardial infarction and respiratory disease patients under the Franco-German model,
but they did not find any difference in outcome in a larger group of patients with less
severe maladies who received invasive airway-protecting endotracheal intubation done
either by physicians or paramedics.
Al-Shaqsi (2010) was reluctant to make head-to-head comparisons between the
two systems, thinking that they are too dissimilar for meaningful comparisons. Al-Shaqsi
(2010) does describe a third, hybrid system taking hold in Great Britain. That country is
experimenting with a community triage model, in which advanced practice health care
84
providers visit patients in their home or in their community to determine the necessity of
emergency health care (Al-Shaqsi, 2010). According to Al-Shaqsi (2010), in the U.K.
health care system, roughly 50% of the calls for services are released from the emergency
room without significant treatment or referral. Because the National Health Service is
socialized, system cost containment is paramount and referral to appropriate services
must take place. In the United Kingdom and elsewhere, emergency medical services
often act as the gatekeeper to other levels of care (Al-Shaqsi, 2010).
Hass and Nathens (2008) reviewed the current literature comparing the two major
theoretical approaches to prehospital emergency care, which they called the "scoop-and-
run" (Anglo-American style) and the "stay-and-play" (Franco-German style). In the
scoop-and-run system the patient is rapidly assessed and "packaged" for transportation
after urgent and life-threatening conditions are attended to. In the stay-and-play system
intensive medical intervention is performed at the scene in hopes of stabilizing the patient
prior to transport to the hospital. Hass and Nathens (2008) reported that approximately
half of severe trauma patients die at the scene and a quarter die within 24 hours of
admission to the hospital. These authors asserted that, based on their literature review and
analysis, more patients benefit from diagnostic radiology and surgery in the hospital than
from physician stabilization at the scene. Hass and Nathens (2008) made a similar
argument for cardiac arrest and respiratory failure. They concluded that the benefit of a
physician's extended time at the scene needed to stabilize a patient does not outweigh the
benefits of definitive care at the hospital, independent of the skill level of the prehospital
care provider. One notable study Hass and Nathens (2008) discussed is Roudsari et al.
85
(2007, p. 998), who reported that even among physician-staffed systems there was a
"fourfold difference" in patient outcome for the same initial condition but that having a
physician on the scene produced a "lower early trauma fatality rate." On the other hand,
Kirves et al. (2010) performed a post hoc analysis of the ability of physicians and
paramedics in the field to predict or estimate the degree of trauma a patient had suffered
and found inconclusive results across their study populations. Kirves et al. (2010)
summed up the literature as lacking the substance to be a valuable source for determining
the relative benefits of physician or lesser trained responders in emergency medical care
in the field.
Timmermann, Russo, and Hollman (2008) reviewed the literature on paramedic
versus emergency physician on scene at prehospital incidents. Their findings were
inconclusive in large part, yet they were willing to state that there is evidence suggesting
"that some critically ill patients benefit from the care provided by an emergency
physician-based emergency medical service, but further studies are needed to identify the
characteristics and early recognition of these patients” (Timmermann et al., 2008, p. 222).
Looking at worldwide trends, O'Reilly and Fitzgerald (2010) reported that a centralized
system of emergency medical care, like the Anglo-American system, is becoming the
preferred system.
Fischer et al. (2011) compared four common systems of providing prehospital
emergency care: (a) care by bystanders and minimally trained first responders, (b) basic
life support provided by more extensively trained emergency medical technicians, (c)
advanced life support provided by even better trained paramedic and prehospital nurses,
86
and (d) advanced life support provided by physicians. Fischer et al. (2011)compared
these systems in four cities: Bonn, Germany; Coventry, England; Richmond, Virginia;
and Cantabria, Spain. Fischer et al. (2011, p. 285) stated, "The hypothesis … was [that
patients get] better pre-hospital medical care by physicians compared to paramedics.”
These authors compared the four emergency care systems on the outcomes of cardiac
pain relief, reduced respiratory rate, and patient response to out-of-hospital cardiac arrest
resuscitation and concluded that, compared to other sites, prehospital emergency
physicians in Bonn provided an increased survival rate for patients suffering out-of-
hospital cardiac arrest and improved status for cardiac chest pain and respiratory failure.
However, Fischer et al. (2011) limited their investigation to the most severe patients and
made no mention of the percentage of responses these patients represent compared to the
overall response for all sites.
Lee, Garner, Fearnside, and Harrison (2003) took a different approach, comparing
responders qualified in basic life support (BLS; e.g., EMTs) or advanced life support
(ALS; e.g., paramedics) and emergency care physicians when responding to patients with
or without severe blunt head trauma. Lee et al. (2003) found an interesting phenomenon:
among patients who were not subsequently admitted to an intensive care unit (ICU) at a
hospital, more died (i.e., in the field or emergency department) when the responders were
physicians (odds ratio [OR] 4.27: 95% CI, 1.46–12.45) than those treated by ALS
providers (OR 2.18: 95% CI, 1.05–4.55) or BLS providers (OR 1.0, no CI reported; p.
817). For those surviving to be admitted to the ICU, the OR/CI were 0.63 (0.28–1.39),
0.79 (0.53–1.18), and 1 (no CI reported), respectively, reported as an insignificant
87
difference (Lee et al., 2003, p. 817). The odds ratios for dying at the scene or within 24
hours were greatest when the responder was a physician and lowest if the responder was
only a BLS provider. An opposing result comes from Roudsari et al. (2007), who also
measured death rate in the first 24 hours comparing ALS-staffed (paramedics) and
physician-staffed services. Roudsari et al. (2007) compared trauma registry data and
concluded that physician-staffed services have a lower death rate for trauma-related
injury than ALS services did. Roudsari et al. did not report individual OR for the
physician groups or ALS groups, making comparison with Lee et al. (2003) impossible.
Governance, Income, Prehospital Staffing, and Road Traffic Death
To my knowledge no studies have been conducted that relate the effects of
prehospital staffing on road traffic deaths when income or governance is held constant.
Income influences road traffic death rates, and governance influences the funding of
health care and so ultimately road traffic death rates. To look at the effect that differing
approaches to prehospital care have on road traffic death rates, countries need to be
categorized by income level and governance factors so these effects are canceled out.
Rationale for Selection of the Variables or Concepts
The income of a country is associated with the rate of road traffic deaths in that
country (Anbarci et al., 2009; Grimm & Treibich, 2012; Kopitis, 2004; Pratte, 1998). As
income rises, more people use motorized vehicles, traveling at greater speed on
unimproved roads, putting themselves, their passengers, and other road users at risk of
road traffic crashes and death. As income continues to rise, vehicles become safer, road
use rules and enforcement become more stringent, and road infrastructure improves.
88
Fewer pedestrians and pedaled or motorized two-wheeled vehicles share the road with
larger (and safer) four-wheeled vehicles. The pattern of road traffic death thus changes
with income (Chrisholm and Naci, 2009).
Income and governance are directly related (Gradstein, 2004; Ha, 2012; Law,
2009; Lewis, 2006; Pillai, 2011). Governance is related to health (Andrews et al, 2010;
Chisholm & Naci, 2009; Dao, 2012; Grimm & Treibich, 2012; Klomp & de Haan, 2008;
Kopitis, 2004; Yu et al., 2009, Olafsdottir et al., 2011) and likewise related to road traffic
deaths (Gaygisiz, 2010a, 2000b; Law, 2009).
Governance and income have a direct effect on prehospital services through
regulation, direction, and funding (Aguilera et al. 2010; Jakubazko et al., 2010; Roberts et
al., 2014). Prehospital services are an important factor in the health of a people and their
survival from road traffic crashes (Anderson et al., 2011; Brown & Devine, 2008; Henry
& Reingold, 2012; Holliman et al., 2011; Jennings, 2010; Kobusingye et al., 2005;
Razzak & Kellermann, 2002; Sarlin & Alagappan, 2010; Sanchez-Mangas et al., 2010;
Stirling, 2007). But the best type of staffing for the response to road traffic crashes is
controversial (Al-Shaqsi, 2010; O'Reilly & Fitzgerald, 2010). Some authors find greater
benefits from the physician-staffed response system (Botker et al., 2009; Fischer et al.,
2011; Roudsari et al., 2007), some from the trained nonphysician systems (Hass &
Nathens, 2008), and some are reluctant to point to either as better (Al-Shaqsi, 2010;
Kirves et al., 2010; Timmermann et al., 2008 ). O'Reilly and Fitzgerald (2010) did report
that the trained nonphysician staffing services appear to be the preference of new and
developing prehospital services. Lee et al. (2003) looked at the related factor of advanced

89
versus basic prehospital skills and techniques (but still separated advanced practitioners
into groups of physician or paramedics) and could find no significant difference between
the two groups of advanced providers.
In this study, I assumed that within comparable income and governance
groupings, the prehospital services for both physician and trained nonphysician staffing
sequelae are equivalent within each group. Therefore, it should be possible to see
significant differences between the groups, if one exists, when the income and
governance factors are constant.
Summary and Conclusions
Much is known about safety for road travelers, but that knowledge is not equally
distributed across or among countries. Infrastructure, laws and enforcement, and vehicle
components have all received scrutiny. The effects of prosperity and governance have
been shown to influence the rate at which people die from road traffic accidents.
Prehospital response is demonstrated to reduce mortality from road traffic crashes. What
is not known is what form of prehospital staff response is best suited for the greatest
decrease in road traffic fatality. Assuming physician-staffed services are equivalent and
trained nonphysician–staffed services are equivalent within income and governance
groupings, a significant difference may be found to demonstrate a reduction in fatality
from road traffic crashes due to the staffing preference.
In chapter 3, “Research Design and Rationale,” methodology and threats to
validity are discussed in detail. Design choice, populations, sampling techniques, data
sets, operational definitions of variables, and data analysis software and techniques are

90
also detailed, as are threats to validity from internal and external sources, the ethical
treatment of subjects, and approval of the internal review board.
91
Chapter 3: Research Method
Introduction
The purpose of this cross-sectional correlation study was to test for differences
between the independent variable, prehospital staffing choices on road traffic deaths per
100,000, using the Haddon matrix postevent agent and environment conditions when the
social political considerations of the independent variable of country income are grouped
into low, middle, and high and when governance indicator assessments are grouped into
either positive or negative standardized groupings. In this chapter, I detail the research
design and rationale of the methods used, the methodology to be used, and the
instrumentation of the data collection, operationalization of variables, threats to validity,
and ethical considerations. The population, sampling considerations, and data collection
and analysis are defined. Finally, the summary of methodological considerations is
presented.
Research Design
The plan of this cross-sectional correlation study was to determine whether an
association exists between road traffic death and staffing of the prehospital responders
dispatched to the crash scene, income level, and governance indicators. The independent
variable of staffing of prehospital response is defined as one of two conditions: the
attendance of (a) a physician or (b) a registered nurse, paramedic, or emergency medical
technician. The variable of income is divided into the categories provided by the WHO
(2013): low, US$1,225 or less; middle, $1,226 to $12,225; and high, $12,226 or greater.
92
The variable of governance indicators was provided by the World Bank (2013) for each
selected country.
The simplest analysis of this question comes from discovering if there is a
relationship between emergency medical style and road traffic injury, using a
correlational study, with the caveat that it is not possible to assign cause and effect with a
correlational study. Research may only suggest cause and effect based on the temporal
relation of the variables (Babbie, 2010; Sayer, 1992). Additionally, the exploration of the
difference can be undertaken using t tests and possibly ANOVA to explore the means
among groups (Babbie, 2010). No time constraints were anticipated as archival data were
used. The only resources required were the Internet, computer software, and processing
time.
Methodology
Target Population
The target population was a set of 183 countries that have numeric values for road
traffic fatalities and income (approximately 85% of the 215 member states in the United
Nations; WHO, 2013), reduced to the number of countries, yet unknown, with available
prehospital systems profiles published in English.
Sampling
The WHO (2013) Global Status Report on Road Safety surveyed 183 countries;
77 countries with available profiles in English were identified (36% of UN member
states, 42% of WHO states).
93
Databases
I used the Global Status Report on Road Safety (WHO, 2013) collected from 183
(98.6% of total) UN member countries through survey and consensus of key stakeholders
in each country. Income in the WHO (2013, p. 45) was taken from the World Bank
income levels for each country and are defined as gross national income (GNI) per capita
with the following income levels: low, US$1,225 or less; middle, $1,226 to $12,225; and
high, $12,226 or greater. Road traffic deaths were counted from those actually reported,
and estimates were based on a formula developed to equalize reporting among countries
and capture underreporting due to collection technique and definitions. The WHO (2013)
listed both reported and estimated road traffic deaths in their database. Reported road
traffic deaths are those reported to the WHO (2013, p. 45) from “police, transportation,
health, or vital statistic records.” Estimated road deaths (correlated with reported deaths
at r = 0.9, p < 0.0000, Figure 1) were calculated by computing the regression of reported
deaths, adjusted numbers, and values from comparable countries over the period 1950–
2010 (for a fuller explanation, see WHO, 2013, p. 48). To make meaningful comparisons
across countries with a variety of incomes, populations, and reported and estimated death
rates, the rate per 100,000 was calculated from the WHO estimated road traffic deaths
divided by the quotient of the WHO reported population for the country divided by
100,000. Data were formatted into a comma-separated spreadsheet file suitable for the
statistical software computation.
Worldwide Governance Indicators (World Bank, 2013) were collected from a
consensus of survey responses from key stakeholders from 215 countries. Six dimensions
94
of governance were reported: Control of Corruption, Political Stability, Regulatory
Quality and Absence of Violence, Rule of Law, Voice, and Accountability. Governance
indicators “[were] reported . . . in their standard normal units, ranging from
approximately –2.5 to 2.5 . . . with higher values corresponding to better outcomes”
(World Bank, 2013, n.p.).
A matrix of country prehospital staffing data was constructed from a literature
search for prehospital system profiles, written in English (Appendix B). Prehospital
staffing was recorded from these articles, coded as (1) physician and (2) trained
nonphysician—nurse, paramedic, or EMT. Countries without a formalized prehospital
response or a description of the staffing credentials were eliminated from the study.
Power Analysis
A sample size sufficient to provide a 0.80 power analysis is considered adequate
for rejecting the null hypnosis (Burkholder, 2010, slide 9). This was a correlational study,
however, and correlations of 0.06 to 0.14, based on the correlation coefficient squared,
were reasonable to find a medium effect (Burkholder, 2010, slide 22). For an α of 0.05
and power of 0.8, the sample size of 0.06 significance may be problematic.
Statistical Significance of Correlations (n.d.) provides guidance and a table of
significance for one- and two-tailed hypothesis tests, presumably at the 0.8 power level.
To meet the criterion of correlation coefficient squared (r2) of 0.06 to 0.14 or a
correlation coefficient (r) of 0.24 to 0.37 between 28 and 60, subjects need to be in the
condition (Statistical Significance of Correlations, n.d.). If, however, a correlation
coefficient of 0.75 (r2 = 0.54) is found, only 16 subjects are needed to assert significance
95
(Statistical Significance of Correlations, n.d). StatsToDo (n.d.) estimated a sample
between 44 and 314 for the same criterion of 0.06 to 0.14. (This calculation required an
identified power, and 0.8 was used.) To assure that a sufficient number of participants
met the requirements for power considerations, the 49 countries identified or more were
needed. However, assuming the unlikely condition that all 77 countries currently
identified are the number of observations, R statistical software predicts a single-tailed r
of 0.28 is needed to reach a significant p < or = 0.05 with a power of 0.8 (arctangh
transformation) for correlation calculations.
Ethics of the Study
No informed consent was needed for this study, which used archival data from
countries. No participants were engaged in the study, and no exit strategy was needed. No
follow-up procedures were needed. The intended data were freely available from the
World Bank and World Health Organization. Journal articles describing country
emergency medical systems were generally part of the holdings of Walden University or
available through document delivery systems. Therefore, permission to use data was
unnecessary.
Instrumentation and Operational Definitions
No published instruments were used in this study. A simple matrix (Appendix C)
was used to collect data from literature on country prehospital system profiles: country,
style (dummy coded with the nominal 1 for physician-based and 2 for paramedic-based),
and author identification.
96
No reliability issues regarding instrumentation were anticipated. Recording of
prehospital staffing components is a straightforward process of transcription from
literature sources. Many country-specific articles were available on the specifics of
individual prehospital systems, providing straightforward access for data collection.
Operational Definitions
Prehospital Care System
Two types of responses were assessed: a service using a response vehicle staffed
by a physician (dummy code 1) and a service using a response vehicle staffed by a
trained nonphysician (nurse, paramedic, EMT, or equivalent; dummy code 2).
Road Traffic Fatality
The WHO (2013) estimated road traffic fatalities by “classif[ying] the countries
into four groups as follows”:
1. Countries with death registration data completeness of at least 80%.
For this category, I used one of the following: death registration, projection of the
most recent death registration, reported death, or projected reported death.
2. Countries with other sources of information on cause of death.
This group includes India, Iran, Thailand, and Vietnam. For these countries, a
regression method was used to project forward the most recent year for which an estimate
of total road traffic deaths was available.
3. Countries with population less than 150,000 and [that] did not have eligible
death registration data.
97
For these countries, the deaths reported in the survey were used directly, without
adjustment.
4. Countries without eligible death registration data.
For these countries, a negative binomial regression model was used. For more
information about this process, see Global Status Report on Road Safety 2013 (WHO,
2013, pp. 48–51).
Income: The WHO (2013, p. 45) uses the World Bank designation for Gross
National Income per capita: “low US$1,025 or less, middle $1,026 to $12,225, and high
$12,226 or more.”
Road traffic deaths: Road traffic deaths are deaths reported by “police, transport
agencies, health or vital statistics registration records or combined sources” (WHO, 2013,
Global, p. 45).
World Governance Indicators: Indicators for voice and accountability, political
stability and absence of violence, government effectiveness, regulatory quality, rule of
law, and control of corruption came from Kaufmann, Kraay, and Mastruzzi (2013) and
were individually derived from various sources, including business surveys, political
surveys, and key citizen reviews.
Data Manipulation
R statistical software (R Core Team, 2013, Vienna, Austria: R Foundation for
Statistical Computing) was used to analyze correlations, t tests, ANOVA, or multiple
regressions as appropriate. Data needed to be selected and formatted using Microsoft
98
Excel (Redman, Washington; data from the WHO and World Bank are presented in Excel
tables) prior to use in R software.
Research Questions
The purpose of this cross-sectional correlation study was to test the Haddon
matrix postevent agent and environment conditions for a difference in road traffic deaths
per 100,000 in relation to the independent variables of country income level, governance
indicator, and prehospital staffing. The independent variable of staffing of prehospital
response was defined as one of two conditions: the attendance of (a) a physician or (b) a
trained nonphysician responder—a registered nurse, paramedic, or emergency medical
technician—at the scene of a road traffic accident. The independent variable of income
was defined as the WHO (2013) reported income level, based on the gross national
income per capita, of sampled countries: low, US$1,025 or less; middle, $1,026 to
$12,225; and high, $12,226 or more. The independent variable of governance was
defined as the sign of the standardized values for the World Governance Indicators
(World Bank, 2013) in the selected countries.
1. Is there a significant association between income level of a country and the rate of
road traffic fatalities per 100,000?
Ha1: There is a significant negative correlation between income level of countries
and road traffic fatalities.
Ho1: There is no association between income level of countries and road traffic
fatalities.

99
2. Is there an association between the sign of standardized governance indicators of
countries and road traffic fatalities per 100,000?
Ha2: There is a significant negative correlation between the sign of standardized
governance indicators of countries and road traffic fatalities.
Ho2: There is no association between the sign of standardized governance indicators
of countries and road traffic fatalities.
3. Does the staffing of prehospital response services by physicians reduce the rate
of road traffic fatalities per 100,000?
Ha3: There is a significant reduction in the rate of road traffic fatalities per 100,000
when prehospital services are staffed by physicians.
Ho3: There is no significant difference between physician-staffed and nonphysician-
staffed prehospital services and the rate of road traffic fatalities per 100,000.
4. When grouped by income, do countries with physician-staffed response services
have a lower rate of road traffic fatalities per 100,000?
Ha4: There is a significant reduction in the rate of road traffic fatalities per 100,000 in
physician-staffed prehospital services when countries are grouped by income.
Ho4: There is no significant reduction in the rate of road traffic fatalities per 100,000
in physician-staffed prehospital services when countries are grouped by income.
5. When grouped by the sign of standardized governance indicators, do countries
with physician-staffed prehospital services have a significantly lower rate of road
traffic deaths per 100,000 than countries with trained nonphysician–staffed
prehospital response?
100
Ha5: When grouped by the sign of standardized governance indicators, there is a
significant reduction in road traffic fatalities per 100,000 in countries with physician-
staffed prehospital services.
Ho5: When grouped by the sign of standardized governance indicators, there is no
significant reduction in road traffic fatalities per 100,000 in countries with physician-
staffed prehospital services.
6. When grouped by income and sign of standardized governance indicators, do
countries with physician-staffed prehospital services have a significantly lower
rate of road traffic deaths per 100,000 than countries with trained nonphysician–
staffed prehospital response?
Ha6: When grouped by income and sign of standardized governance indicators,
countries with physician-staffed prehospital services have a significantly lower rate of
road traffic deaths per 100,000 than countries with trained nonphysician–staffed
prehospital response.
Ho6: When grouped by income and sign of standardized governance indicators,
countries with physician-staffed prehospital services do not have a significantly lower
rate of road traffic deaths per 100,000 than countries with trained nonphysician–
staffed prehospital response.
Correlation coefficient, t tests, and ANOVA/multiple regressions were applied to
the data as appropriate. Correlations were used to detect relationships among the
variables; t tests were used for comparing the means of road traffic fatalities by
emergency medical system style within income and government groupings;
101
ANOVA/multiple regressions tested the variation in road traffic fatalities among the
groupings.
Threats to Validity
Threats to validity were the inability to gather a random sample and fewer data
available for lower income countries. Another validity issue arose from the use of surveys
of key stakeholders when gathering data on road traffic deaths, governance indicators,
and the like used to develop the databases. The databases used for this study, however
were from reputable sources and were considered reliable data for comparison of
countries.
Ethical Procedures
No access agreement was needed for data to be used in the study; only
documentation of the database was required. No human subjects participated in this
study. No recruitment materials were needed for this study. All data used were collected
from country sources and are publicly available. No confidential data were stored for this
study. No other ethical issues were anticipated.
Summary
I proposed to determine whether there is a difference in the number of road traffic
fatalities due to the prehospital system staffing. Countries were grouped by income level
and governance indicators to control for those influences. Data came from the World
Health Organization and the World Bank, as well as a literature search for country
prehospital profiles.
102
Unfortunately the sample was a convenience sample due to the nature of the
available data; some countries reported the data needed for analysis, but others did not.
All of the available country data were needed to raise the power of the study as high as
possible, while abandoning the random sample assumption for correlations, t-tests, and
ANOVA/multiple regression.
Because the data came from archival sources there were no ethical considerations
for the safety of human subjects. And because published instruments were not used and
the data were in the public domain no permission from participants was needed.
The results of the data analysis are described in Chapter 4.

103
Chapter 4: Results
Introduction
Purpose, Research Questions, and Hypotheses
Road traffic injuries and deaths are major health-related burdens worldwide
(Ameratunga et al., 2006; Mathers & Loncar, 2006; Peden et al., 2004). In this study, I
considered whether the rate of death per 100,000 is lower in systems employing
physicians at the scene of a road traffic event compared to systems employing trained
nonphysician responders. I explored the relationship to road traffic death rates between
that staffing preference and a country’s income level or per capita GNP and governance
indicators. The research questions and hypothesis for this study are as follows:
1. Is there a significant association between income level of a country and the rate of
road traffic fatalities per 100,000?
Ha1: There is a significant negative correlation between income level of countries
and road traffic fatalities.
Ho1: There is no association between income level of countries and road traffic
fatalities.
2. Is there an association between the sign of standardized governance indicators of
countries and road traffic fatalities per 100,000?
Ha2: There is a significant negative correlation between the sign of standardized
governance indicators of countries and road traffic fatalities.
Ho2: There is no association between the sign of standardized governance indicators
of countries and road traffic fatalities.

104
3. Does the staffing of prehospital response services by physicians reduce the rate
of road traffic fatalities per 100,000?
Ha3: There is a significant reduction in the rate of road traffic fatalities per 100,000
when prehospital services are staffed by physicians.
Ho3: There is no significant difference between physician-staffed and nonphysician-
staffed prehospital services and the rate of road traffic fatalities per 100,000.
4. When grouped by income, do countries with physician-staffed response services
have a lower rate of road traffic fatalities per 100,000?
Ha4: There is a significant reduction in the rate of road traffic fatalities per 100,000 in
physician-staffed prehospital services when countries are grouped by income.
Ho4: There is no significant reduction in the rate of road traffic fatalities per 100,000
in physician-staffed prehospital services when countries are grouped by income.
5. When grouped by the sign of standardized governance indicators, do countries
with physician-staffed prehospital services have a significantly lower rate of road
traffic deaths per 100,000 than countries with trained nonphysician–staffed
prehospital response?
Ha5: When grouped by the sign of standardized governance indicators, there is a
significant reduction in road traffic fatalities per 100,000 in countries with physician-
staffed prehospital services.
Ho5: When grouped by the sign of standardized governance indicators, there is no
significant reduction in road traffic fatalities per 100,000 in countries with physician-
staffed prehospital services.
105
6. When grouped by income and sign of standardized governance indicators, do
countries with physician-staffed prehospital services have a significantly lower
rate of road traffic deaths per 100,000 than countries with trained nonphysician–
staffed prehospital response?
Ha6: When grouped by income and sign of standardized governance indicators,
countries with physician-staffed prehospital services have a significantly lower rate of
road traffic deaths per 100,000 than countries with trained nonphysician–staffed
prehospital response.
Ho6: When grouped by income and sign of standardized governance indicators,
countries with physician-staffed prehospital services do not have a significantly lower
rate of road traffic deaths per 100,000 than countries with trained nonphysician–
staffed prehospital response.
In this chapter, I describe the data collection procedures, discrepancies in data
collection from the proposed data collection scheme, and descriptive and hypothesis-
testing statistics.
Data Collection
Data were collected in a literature search of Google Scholar, Walden University’s
library multidatabase search engine Thoreau, and the National Institutes of Health.
Search terms included the following: emergency medical system by country, prehospital
care by country, and emergency medicine by country, and in combination with
international emergency, medical care, and prehospital care. Traffic death and income
information came from the World Health Organization (2013) Global Status Report on
106
Road Safety 2013: Supporting a Decade of Action, which provided information on 181 of
the 215 (84.1%) UN member states. Governance indicators came from the World Bank
(2013) Worldwide Governance Indicators.
During the literature search and review of prehospital and emergency services
demographics, new assumptions were made to respond to unanticipated results. First, the
literature pointed to a great variation across both types of services, describing differences
in the authority directing service, the agencies providing service, training of personnel,
protocols allowed, type and technical capacity of transport vehicles, type and quality of
triage, response in rural areas, and use of standard phone numbers to summon service.
This revelation confirmed the warning by Al-Shaqsi (2010) and O'Reilly and Fitzgerald
(2010) that an analysis of style of prehospital services is problematic for these and other
reasons. To explore this variation, a more in-depth qualitative or mixed-methods study,
which is beyond the resources available, is needed; this is addressed in Chapter 5.
However, the results did allow for a separation of trained nonphysician prehospital
responders into advanced life-support responders (ALS: registered nurse, paramedic, or
equivalent, Code 2), basic life-support responders (BLS: emergency medical technician,
first responder, or equivalent, Code 3), and minimally or not trained responders (NT,
Code 4; physician (PHY) responders remain coded 1).
The number of observations made the power to exclude a type II error only 50%.
For a sample of 67 observations an r = 0.336 is required to obtain a p = 0.05 with a 0.8
power to prevent type II errors. This result is different from the weak r = 0.16 to r = 0.24
107
suggested by Burkholder (2010). Analysis considering both suggested r will be reported
as appropriate in the analysis.
Results from the Study
Descriptive and Demographic Characteristics of the Sample
Descriptions, in English, for 70 of 215 (32.5%) United Nation member countries
(37% of the WHO, 2013) were identified in the literature (Appendix B). Of those
countries, 67 (31.2% of UN members, 35.8% of WHO, 2013) had usable data for all
variables (Appendix C).
Death Rate for Road Traffic Events per 100,000
The WHO (2013) included both reported road traffic deaths and estimated road
traffic deaths in its database. Reported road traffic deaths are those reported to the WHO
from “police, transportation, health, or vital statistic records” (p. 45). Estimated road
deaths (correlated with reported deaths at r = 0.9, p < 0.0000) were calculated by
computing the regression of reported and adjusted rates and values from comparable
countries over the period 1950 to 2010. (For a fuller explanation, see WHO, 2013, p. 48.)
To make meaningful comparisons across countries with a variety of incomes and reported
and estimated death rates, the rate per 100,000 was calculated from the WHO (2013)
estimated road traffic deaths divided by the quotient of the WHO (2013) reported
population for the country divided by 100,000. Death rate per 100,000 population was
used as the consistent marker across countries; it correlated with the study sample of
reported deaths r = 0.26 (p = 0.0356, power = 0.5002) and estimated deaths r = 0.22 (p =
0.0805, power = 0.5168). A better maker would be the percentage of road traffic deaths
108
resulting from the number of road traffic accidents, but those data were even harder to
obtain and were not available for this study.
Income and Road Traffic Death
In Question 1. Is there a significant association between income level of a country
and the rate of road traffic fatalities per 100,000?
Ha1: There is a significant negative correlation between income level of countries
and road traffic fatalities.
Ho1: There is no association between income level of countries and road traffic
fatalities.
Road traffic deaths per 100,000 were correlated with all 182 countries included in
the WHO (2013) and with the 67 countries identified as having usable data for this study.
Income, death rate from road traffic events (for this and subsequent questions),
governance, and staffing preference (for subsequent questions) were complied, in
alphabetical order, in Appendix B for the sample of 67 countries.
Low-income countries: Four low-income countries were examined in this study
(1.9% of member states, 17.1% of low-income from WHO, 2013, 6% of sample). Their
mean GNI per capita was $640, with a death rate from road traffic events of 19.3 per
100,000. The averages for governance indicators were control of corruption, –0.63;
effectiveness of governments, –0.96; political stability, –0.75; regulatory quality, –0.93;
rule of law, –1.04; and voice and accountability, –0.87. The lone low-income country
with trained prehospital services, Zimbabwe, had an ALS service, GNI of $480, 14.6 road
traffic deaths per 100,000, and an average governance value s for control of corruption, –
109
1.31; effectiveness of government, –1.50; political stability, –1.12; regulatory quality, –
2.053; rule of law, –1.81; and voice and accountability, –1.48. The three low-income
countries with no trained prehospital services, Comoros Islands, Kenya, and Rwanda, had
an average GNI of $693.33, 20.87 per 100,000 road traffic deaths, and the following
average governance values: control of corruption, –0.40; effectiveness of government, –
0.78; political stability, –0.62; regulatory quality, –0.56; rule of law, –0.78; and voice and
accountability, –0.67.
Middle-income countries: This study examined 32 middle-income countries
(14.4% of member states, 53.4% of middle-income from WHO, 2013, 46.3% of sample);
14 systems had physician-staffed prehospital response, six had advanced life support, two
had basic life support, and 10 had minimally or not trained responders. This group had a
mean GNI per capita of $5,415.31; mean reported and WHO estimated 2010 road traffic
deaths of 13,515.19 and 25,754.69, respectively; and mean deaths per 100,000 population
of 19.14. The means of governance indicators for the 32 countries were as follows:
control of corruption, –0.29; effectiveness of government, –0.11; political stability, –0.47;
quality of government, –0.13; rule of law, –0.30; and voice and accountability, –0.21.
The 14 middle-income countries with physician-staffed prehospital services are Iran,
Russia, China, Kazakhstan, Colombia, Vietnam, Armenia, Turkey, Panama, Brazil,
Lithuania, Mauritius, Belarus, and Malaysia. Their average GNI is $6,829.29; they
average 18.9 road traffic deaths per 100,000; and their mean scores for governance
indicators are the following: control of corruption, –0.08; effectiveness of government, –
110
0.17; political stability, –0.19; quality of government, –0.14; rule of law –0.02; and voice
and accountability, –0.19.
The six middle-income countries with advanced life-support services are
Indonesia, Sri Lanka, Argentina, India, Peru, and South Africa. Their average GNI is
$4,271.67; they average 18.48 road traffic deaths per 100,000; and their mean scores for
governance indicators are the following: control of corruption, –0.37; effectiveness of
government, –0.11; political stability, –0.66; quality of government, –0.19; rule of law,
–0.31; and voice and accountability, –0.06.
Two middle-income countries, Pakistan and Mexico, had basic life-support
prehospital services. Their average GNI is $4,990.00; they average 16.05 road traffic
deaths per 100,000; and their mean scores for governance indicators are the following:
control of corruption, –0.72; effectiveness of government, –0.31; political stability, –1.71;
quality of government, –0.16; rule of law, –0.66; and voice and accountability, –0.35.
Ten middle-income countries have minimally or not trained service: Angola,
Bosnia and Herzegovina, Botswana, Cuba, Ecuador, Ghana, Lebanon, Nicaragua,
Philippines, and Thailand. Their average GNI is $4,207, with an average of 20.48 road
traffic deaths per 100,000 and the following mean scores for governance indicators:
control of corruption, –0.44; effectiveness of government, –0.47; political stability, –0.49;
quality of government, –0.47; rule of law, –0.59; and voice and accountability, –0.39.
High-income countries: Thirty high-income countries (13.9% of member states,
26.2% of middle-income from WHO, 2013, 44.8% of sample) were examined. They have
a mean GNI of $35,900.65; mean reported and WHO estimated road traffic deaths of
111
2,683.77 and 2,906, respectively; and mean 2010 deaths per 100,000 population of 8.39.
Their mean scores for governance indicators are the following: control of corruption,
1.07; effectiveness of government, 1.12; political stability, 0.62; quality of government,
1.06; rule of law, 1.10; and voice and accountability, 0.78.
Fifteen member states (53.4% of middle-income from WHO, 2013, 46.3% of
sample countries) have physician-staffed prehospital response: Spain, Greece, Italy,
Israel, Hungary, Poland, Czech Republic, Portugal, France, Germany, Iceland, Austria,
Norway, Sweden, and Finland. They have an average 2010 GNI of $35,812.00 and an
average of 6.85 road traffic deaths per 100,000. Their mean scores for governance
indicators are the following: control of corruption, 1.02; effectiveness of government,
1.18; political stability, 0.62; regulatory quality, 1.11; rule of law, 1.15; and voice and
accountability, 1.08.
Eleven high-income countries have advanced life-support prehospital services:
Saudi Arabia, Switzerland, Oman, United States, South Korea, Malta, United Kingdom,
Australia, Canada, Netherlands, and Denmark. They have an average GNI of $39,006 and
an average 2010 rate of 10.36 road traffic deaths per 100,000. Their mean scores for
governance indicators are the following: control of corruption, 1.12; effectiveness of
government, 1.11; political stability, 0.58; regulatory quality, 1.11; rule of law, 1.16; and
voice and accountability, 0.61.
Three high-income countries have basic life-support prehospital service:
Bahamas, Croatia, and Japan. They have an average GNI of $25,970, and their average
2010 rate of road traffic deaths per 100,000 is 9.77. Their mean scores for governance
112
indicators are the following: control of corruption, 0.27; effectiveness of government,
0.34; political stability, 0.43; regulatory quality, 0.14; rule of law, 0.15; and voice and
accountability, –0.02.
Two high-income countries with minimally or not trained responders are
Singapore and New Zealand. They have an average GNI of $34,380 and an average of
7.1 road traffic deaths per 100,000. There mean scores for governance indicators are the
following: control of corruption, 2.30; effectiveness of government, 2.03; political
stability, 1.18; regulatory quality, 1.78; and voice and accountability, 0.67.
Low-income countries are underrepresented. The other two income categories
represent 14.4% of the world’s middle-income and 13.9% of the world’s high-income
countries.
Table 1 lists the demographics of study countries by income level, GNI per capita,
reported road traffic deaths, estimated road traffic deaths, rate of estimated road traffic
deaths per 100,000 population, and governance indicators and by staffing preference.
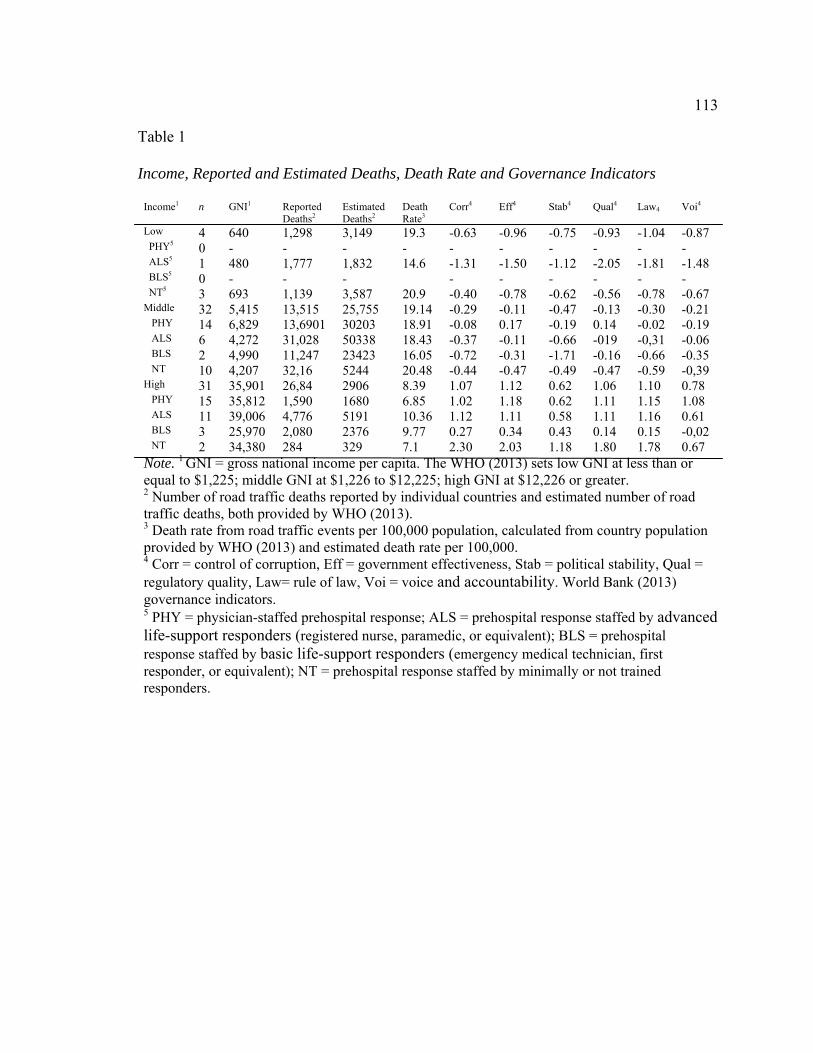
113
Table 1
Income, Reported and Estimated Deaths, Death Rate and Governance Indicators
Income1 n GNI1 Reported Deaths2
Estimated Deaths2
Death Rate3
Corr4 Eff4 Stab4 Qual4 Law4 Voi4
Low 4 640 1,298 3,149 19.3 -0.63 -0.96 -0.75 -0.93 -1.04 -0.87 PHY5 0 - - - - - - - - - - ALS5 1 480 1,777 1,832 14.6 -1.31 -1.50 -1.12 -2.05 -1.81 -1.48 BLS5 0 - - - - - - - - - NT5 3 693 1,139 3,587 20.9 -0.40 -0.78 -0.62 -0.56 -0.78 -0.67 Middle 32 5,415 13,515 25,755 19.14 -0.29 -0.11 -0.47 -0.13 -0.30 -0.21 PHY 14 6,829 13,6901 30203 18.91 -0.08 0.17 -0.19 0.14 -0.02 -0.19 ALS 6 4,272 31,028 50338 18.43 -0.37 -0.11 -0.66 -019 -0,31 -0.06 BLS 2 4,990 11,247 23423 16.05 -0.72 -0.31 -1.71 -0.16 -0.66 -0.35 NT 10 4,207 32,16 5244 20.48 -0.44 -0.47 -0.49 -0.47 -0.59 -0,39 High 31 35,901 26,84 2906 8.39 1.07 1.12 0.62 1.06 1.10 0.78 PHY 15 35,812 1,590 1680 6.85 1.02 1.18 0.62 1.11 1.15 1.08 ALS 11 39,006 4,776 5191 10.36 1.12 1.11 0.58 1.11 1.16 0.61 BLS 3 25,970 2,080 2376 9.77 0.27 0.34 0.43 0.14 0.15 -0,02 NT 2 34,380 284 329 7.1 2.30 2.03 1.18 1.80 1.78 0.67 Note. 1 GNI = gross national income per capita. The WHO (2013) sets low GNI at less than or equal to $1,225; middle GNI at $1,226 to $12,225; high GNI at $12,226 or greater. 2 Number of road traffic deaths reported by individual countries and estimated number of road traffic deaths, both provided by WHO (2013). 3 Death rate from road traffic events per 100,000 population, calculated from country population provided by WHO (2013) and estimated death rate per 100,000. 4 Corr = control of corruption, Eff = government effectiveness, Stab = political stability, Qual = regulatory quality, Law= rule of law, Voi = voice and accountability. World Bank (2013) governance indicators. 5 PHY = physician-staffed prehospital response; ALS = prehospital response staffed by advanced life-support responders (registered nurse, paramedic, or equivalent); BLS = prehospital response staffed by basic life-support responders (emergency medical technician, first responder, or equivalent); NT = prehospital response staffed by minimally or not trained responders.

114
The WHO (2013) estimated and reported death rates per 100,000 were correlated
with the gross national income per capita. Table 2 shows the results of that correlation.
Table 2 Correlation of Road Traffic Deaths or Death Rate and Country GNI per Capita n df r p ß WHO estimated1 182 180 -0.09 0.2325 0.684 WHO per 100,0001 182 180 -0.02 0.0088 0.017 Study estimated2 67 65 -0.2 0.1065 0.645 Study per 100,0002 67 65 -0.68 >0.001 0.99
Note. Correlation of deaths from road traffic events between the WHO (2013) estimated country deaths or the calculated death rate per 100,000 or between the estimated deaths of the sampled countries or with the calculated death rate per 100,000 for the sample. 1WHO (2013) estimated road traffic deaths and death rate from road traffic events per 100,000 calculated from WHO (2013) estimated road traffic deaths and country 2Estimated deaths and death rate from road traffic events from the WHO (2013) for the countries identified as having prehospital staffing information in their country profiles.
Using all 182 observations from the WHO (2013) correlations between both the
estimated deaths from road traffic events and calculated death rate per 100,000 with the
GNI per capita resulted in an insignificant correlation between the estimated road traffic
deaths and the GNI per capita, r (180) = –0.09, p = 0.23, and a significant correlation
between the GNI per capita and the calculated road traffic deaths per 10,000, r (180) = –
0.02, p = 0.009. The power (ß) for the latter correlation was only 0.017, resulting in a
very weak relationship and a good possibility of making a type II error or accepting the
null hypothesis when it is false. The correlation between the death rate from road traffic
events and the GNI per capita for the 67 countries of the sample r (65) = –0.68, p >
0.001, with a ß of 0.99 was very significant and powerful.

115
For the data compiled for this study, the correlation of the GNI per capita and
estimated road traffic deaths approached greater significance than that of the full database
from the WHO (2013), r (65) = –0.02, p = 0.11, ß = 0.65, making the relationship
stronger but not meeting the ß = 0.8 sought in this study. The relationship between the
study data GNI per capita and the study data death rate per 100,000, however, did result
in a strong correlation, r (65), p > 0.001, ß = 0.99 (see Table 3 and Figures 1 and 2).
Figure 1 shows the scatter plot of GNI per capita and the death rate from road traffic
events taken from the sample; Figure 2 shows a potential curvilinear regression line that
might echo Kopitus’s (2004) conclusion that at low- and high-income levels there are
fewer road traffic deaths, but there were not enough low-income countries in the study to
demonstrate that finding.

116
Figure 1. GNI per capita for the study for 67 countries (GNIstudy) and 182 countries in WHO (2013; GNI) in US$.

117
Figure 2. Curvilinear GNI per capita for the study 67 countries (GNIstudy) and WHO (2013; GNI) 182 countries in US$ and data death rate from road traffic events per 100,000 of the study (Deathstudy)and WHO (2013; Death).

118
Based on the results of this study of GNI per capita and study death rate from road
traffic events per 100,000, I must reject the null hypothesis and accept the alternative
hypothesis that there is a significant negative correlation between country road traffic
fatalities and country income.
Correlation of Governance and Road Traffic Death
For Question 2. Is there an association between the sign of standardized
governance indicators of countries and road traffic fatalities per 100,000?
Ha2: There is a significant negative correlation between the sign of standardized
governance indicators of countries and road traffic fatalities.
Ho2: There is no association between the sign of standardized governance
indicators of countries and road traffic fatalities.
All six governance indicators and the calculated average of all indicators had a
negative correlation with road traffic deaths.
Correlation of the governance indicators with the calculated average confirmed
that the average governance indicator is a reasonable marker for grouping countries. WGI
were strongly related to each other, with coefficients of r = 0.64 (p < 0.0000) to r = 0.98
(p < 0.0000). The individual indicators and averaged indicator have coefficients of r = .83
(p < 0.0000) to 0.98 (p < 0.0000). The average governance indicators was used to classify
the rate of road traffic deaths, income, and staffing preference as having positive or
negative governance indicators (see correlation matrix Table 3; see Figure 3 for scatter
plot).

119
Table 3 Correlations Among Governance Indicators Individually and With the Average of All Indicators Corr Eff Stab Qual Law Voi Avg1 Corr 1.000 0.932 0.789 0.848 0.947 0.754 0.952
Eff 0.932 1.000 0.729 0.929 0.969 0.803 0.968 Stab 0.789 0.729 1.000 0.689 0.779 0.639 0.830
Qual 0.848 0.929 0.689 1.000 0.932 0.824 0.942
Law 0.947 0.969 0.779 0.932 1.000 0.822 0.983 Voi 0.754 0.803 0.640 0.824 0.822 1.000 0.872
Average 0.952 0.968 0.830 0.942 0.983 0.872 1.000 Note. All correlations p > 0.001. Corr = control of corruption, Eff = government effectiveness, Stab = political stability, Quality = regulatory quality, Law = rule of law, Voi = voice and accountability. 1Calculated from World Bank (2013) values.
This is in keeping with Al-Marhubi’s (2005) combining governance indicators
(current names used here): voice and political stability, government effectiveness and
regulatory quality, and rule of law and control of corruption. All of these indicators
correlate at r = 0.82 (p = 0) or greater and correlate with the average of all indicators at r
= 0.92 (p = 0) or greater, so the average of all the governance indicators was believed to
be sufficient to represent country governance.
Countries by Sign of the Average Governance Indicator
Of the 67 countries in this study, 30 had a negative and 37 a positive sign for their
average governance indicator. For the sample, the income level was 2.4 (leaning toward
high income), with a GNI per capita of $19,235. There was a staffing value of 2.09,
slightly leaning toward BLS and NT. The death rate from road traffic events was 14.18

120
per 100,000. The scores for governance indicators were as follows: control of corruption,
0.32; effectiveness of government, 0.41; political stability, 0.02; regulatory quality, 0.37;
rule of law, 0.31; voice and accountability, 0.20; and average governance value, 0.27. All
skewed slightly positive.
There were 30 countries with a negative average sign for their governance
indicators: Angola (–1.01), Argentina (–0.29), Armenia (–0.30), Belarus (–0.96), Bosnia
and Herzegovina (–0.39), China (–0.56), Colombia (–0.37), Comoros Islands (–0.99),
Cuba (–0.59), Ecuador (–0.80), India (–0.29), Indonesia (–0.48), Iran (–1.22), Kazakhstan
(–0.50), Kenya (–0.66), Lebanon (–0.62), Mauritius (–0.89), Mexico (–0.19), Nicaragua
(–0.64), Pakistan (–1.11), Peru (–0.25), Philippines (–0.55), Russia (–0.76), Rwanda (–
0.26), Saudi Arabia (–0.24), Sri Lanka (–0.38), Thailand (–0.34), Turkey (–0.05),
Vietnam (–0.57), and Zimbabwe (–1.54). The scores for governance indicators were as
follows: control of corruption, –0.60; effectiveness of government, –0.47; political
stability, –0.76; regulatory quality, –0.49; rule of law, –0.64; and voice and
accountability, –0.65. The average governance value is –0.60.
For the 37 countries with a positive average sign for their governance indicators,
the average income level was 2.76 (1 = low, 2 = middle, 3 = high income) with an
average GNI per capita of $29,910, skewed toward high income. The staffing value of
2.53 was skewed toward BLS and NT. The death rate from road traffic events per
100,000 was 18.5. The scores for governance indicators were as follows: control of
corruption, 1.06; effectiveness of government, 1.12; political stability, 0.66; regulatory
quality,1.08; rule of law, 1.08; and voice and accountability, 0.90. The average

121
governance value was 0.98; all scores skewed positive. The 37 countries and their
average governance values were Australia (1.60), Austria (1.55), Bahamas (0.93),
Botswana (0.67), Brazil (0.11), Canada (1.61), Croatia (0.39), Czech Republic (0.89),
Denmark (1.82), Finland (1.87), France (1.26), Germany (1.43), Ghana (0.10), Greece
(0.40), Hungary (0.71), Iceland (1.43), Israel (0.57), Italy (0.52), Japan (1.22), Lithuania
(0.72), Malaysia (0.34), Malta (1.21), Netherlands (1.64), New Zealand (1.78), Norway
(1.72), Oman (0.23), Panama (0.08), Poland (0.78), Portugal (0.94), Singapore (1.48),
South Africa (0.25), South Korea (0.76), Spain (0.86), Sweden (1.77), Switzerland (1.71),
United Kingdom (1.39), and the United States (1.24).
Table 4 displays the 67 countries in relation to their negative and positive
standardized governance signs. Figure 3 shows the scatter plots of GNI per capita, road
traffic deaths per 100,000, the six individual governance indicators, and the average of all
indicators. Please note the negative relationship between GNI per capita and death rate
per 100,000, the negative relationship between death rate per 100,000 and each of the
governance indicators, the positive relationship between GNI per capita and governance
indicators (an unintended, serendipitous graphic finding generated by the statistical
program), and the positive relationship among the governance indicators individually and
with the calculated average.

122
Table 4 Sign of Average Governance Indicators, Income, Prehospital Staffing, GNI per Capita, and Death Rate per 100,000 from Road Traffic Events Sign1 n Inc2 Staff3 GNI2 Death4 Corr5 Eff5 Stab5 Qual5 Law5 Voi5 Avg5 Spl6 67 2.40 2.09 19,235 14.18 0.32 0.41 0.02 0.37 0.31 0.2 0.27 Neg 30 1.97 2.53 6,070 18.5 -0.60 -0.47 -0.76 -0.49 -0.64 -0.65 -0.60 Pos 37 2.76 1.73 29,910 10.56 1.06 1.12 0.66 1.08 1.08 0.90 0.98 Note. 1 Countries assigned to governance group bases on average governance value. World Bank (2013) governance indicators standardized from -2.5 to +2.5. 2 Income; dummy coded as 1 = low, 2 = middle, and 3 = high. For this sample the total sample (Spl) and the positive (Pos) group are between 2 and 3 or middle to high income. The negative (Neg) group is between low and middle income. 3 Indicates that the sample (Spl) and positive (Pos) groups are made up of more nonphysician responders than physician responders. The negative (Neg) group has more physicians included. Staffing is coded as physicians, 1; advanced life-support responders (ALS: registered nurse, paramedic, or equivalent), 2; basic life-support responders (BLS: emergency medical technician, first responder, or equivalent), 3; minimally or not trained responders (NT), 4. 4 Death rate from road traffic events per 100,000 population calculated from country population provided by WHO (2013) and estimated death rate per 100,000. 5 Corr = control of corruption, Eff = government effectiveness, Stab = political stability, Qual = regulatory quality, Law = rule of law, Voi = voice and accountability. World Bank (2013) governance indicators average (Avg) is calculated from the average of the indicators. 6 Spl = sample as a whole.
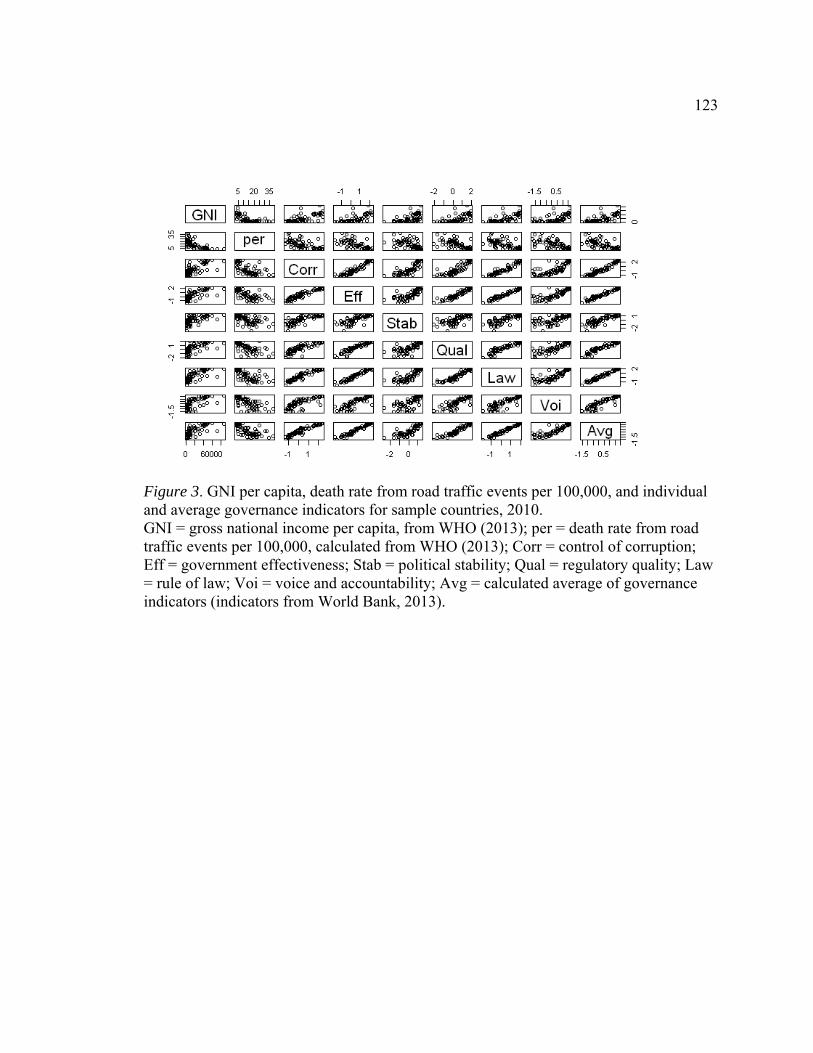
123
Figure 3. GNI per capita, death rate from road traffic events per 100,000, and individual and average governance indicators for sample countries, 2010. GNI = gross national income per capita, from WHO (2013); per = death rate from road traffic events per 100,000, calculated from WHO (2013); Corr = control of corruption; Eff = government effectiveness; Stab = political stability; Qual = regulatory quality; Law = rule of law; Voi = voice and accountability; Avg = calculated average of governance indicators (indicators from World Bank, 2013).

124
Table 5 Correlation Among Death Rate From Road Traffic Events per 100,000 and Governance Indicators Death Corr Eff Stab Qual Law Voi Avg Death 1.00 -0.61 -0.63 -0.48 -0.59 -0.63 -0.64 -0.65 p - >0.01 >0.01 >0.01 >0.01 >0.01 >0.01 >0.01 95% conf
- -1.0 -0.5
-1.0 -0.4
-1.0 -0.3
-1.0 -0.5
-1.0 -0.5
-1.0 -0.5
-1.0 -0.5
ß - 0.97 0.99 0.66 0.95 0.99 0.99 0.99 Note. Death rate from road traffic events per 100,000 population calculated from country populations provided by WHO (2013) and estimated death rate per 100,000. Corr = control of corruption, Eff = government effectiveness, Stab = political stability, Qual = regulatory quality, Law = rule of law, Voi = voice and accountability. World Bank (2013) governance indicators average (Avg) is calculated from the average of the indicators. The 95% conf= the value at which the middle 95% of the population ends it denotes the tails of the distribution. The lower value is the value below which the middle ends at the left side of the distribution and the upper value the value above which on the right tail of the distribution the middle 95% ends. ß= the power calculated describing the assurance that the finding is not a type II error, that a true finding is on correct.
Figure 4. Death rate from road traffic events per 100,000 with governance indicators. Per = death rate from road traffic events per 100,000 (calculated from WHO, 2013); Corr = control of corruption; Eff = government effectiveness; Stab = political stability; Qual = regulatory quality; Law = rule of law; Voi = voice and accountability (World Bank, 2013).

125
Table 6 displays the correlations of each of the governance indicators with the
road traffic deaths per 100,000; all are negative and significant at the p > 0.001. Figure 4
is the detail of the scatter plot of the death rate per 100,000 and each governance
indicator, enlarged for better viewing.
Pearson correlations between death rates from road traffic events per 100,000 and
governance indicators (World Bank, 2013) resulted in the following significant negative
correlations: death rate and control of corruption, r (65) = –0.607, p > 0.001, 95% CI [–
1.0, –0.46], ß = 0.972; death rate and effectiveness of government, r (65) = –0.634, p >
0.001, 95% CI [–1.0, –0.49], ß = 0.985; death rate and political stability, r (65) = –0.478,
p > 0.001, 95% CI [–1.0, –0.31], ß = 0.661; death rate and regulatory quality, r (65) = –
0.594, p > 0.001, 95% CI [–1.0, –0.45], ß = 0.951; death rate and rule of law, r (65) = –
0.627, p > 0.001, 95% CI [–1.0, –0.49], ß = 0.985; death rate and voice and
accountability, r (65) = –0.643, p > 0.001, 95% CI [–1.0, –0.51], ß = 0.989; and death
rate and average of governance indicators, r (65) = –0.646, p > 0.001, 95% CI [–1.0, –
0.51], ß = 0.993. Based on the results from this sample of countries there was a
significant negative correlation between all governance indicators, including the
calculated average, and the death rate from road traffic events per 100,000. Base on these
results I rejected the null hypothesis and accepted the alternative, that there is a
significant negative correlation between governance indicators and road traffic death.
Prehospital Staffing and Road Traffic Death
For Question 3. Does the staffing of prehospital response services by physicians
reduce the rate of road traffic fatalities per 100,000?

126
Ha3: There is a significant reduction in the rate of road traffic fatalities per 100,000
when prehospital services are staffed by physicians.
Ho3: There is no significant difference between physician-staffed and nonphysician-
staffed prehospital services and the rate of road traffic fatalities per 100,000.
No significant difference was found between systems staffed by physicians and
those staffed by advanced life-support trained responders. Likewise, no significant
difference was found among systems staffed by physicians, advanced life-support
providers, or basic life-support providers.
In the sample of 67 countries, 29 (43%) were staffed by physician responders;
these countries had a GNI per capita of $21,820, income level leaning toward high
income (2.40 on the 3-point scale), and a death rate from road traffic events of 12.67 per
100,000. The scores for governance indicators of physician-staffed systems were as
follows: control of corruption, 0.49; effectiveness of government, 0.69; political stability,
0.23; regulatory quality, 0.64; rule of law, 0.59; and voice and accountability, 0.47. In the
18 countries employing advanced life-support systems (27%), the GNI per capita was
$25,288, income level leans toward high income (2.56), and the death rate from road
traffic events was 13.31 per 100,000. The scores for governance indicators of ALS-
staffed systems were as follows: control of corruption, 0.49; effectiveness of government,
0.56; political stability, 0.08; regulatory quality, 0.49; rule of law, 0.51; and voice and
accountability, 0.31.
The five countries with BLS responders (7%) had a GNI per capita of $17,578,
income level leaning toward high income (2.6), and a death rate from road traffic events

127
of 12.28 per 100,000. The scores for governance indicators of BLS-staffed systems were
as follows: control of corruption, –0.13; effectiveness of government, 0.08; political
stability, –0.42; regulatory quality, 0.02; rule of law, –0.17; and voice and accountability,
–0.15. In the 15 countries with minimally or not trained responder systems (22%), the
GNI per capita was $7,527, income level leaning toward middle income (1.93), and the
death rate from road traffic events was 18.77 per 100,000. The scores for governance
indicators of NT-staffed systems were as follows: control of corruption, –0.06;
effectiveness of government, –0.20; political stability, –0.29; regulatory quality, –0.18;
rule of law, –0.31; and voice and accountability, –0.31. Table 6 presents these findings,
and Figure 5 provides box plots of physician, advanced life support, basic life support,
and minimally or not trained responder group death rates per 100,000 from road traffic
events.

128
Table 6
Prehospital Response Staffing, GNI per Capita, Country Income Level, Death Rate from Road Traffic Events, and) Governance Indicators Staffing1 n GNI2 Inc3 Death4 Corr5 Eff5 Stab5 Qual5 Law5 Voi5 Spl 2.46 67 19,235 2.40 14.26 0.32 0.41 0.02 0.37 0.31 0.21 PHY 29 21,820 2.52 12.67 0.49 0.69 0.23 0.64 0.59 0.47 ALS 18 25,288 2.56 13.31 0.49 0.56 0.08 0.49 0.51 0.31 BLS 5 17,578 2.6 12.28 -0.13 0.08 -0.42 0.02 -0.17 -0.15 NT 15 7,527 1.93 18.77 -0.07 -0.20 -0.29 -0.18 -0.31 -0.31
Note. 1Staffing: PHY = physicians; ALS = advanced life-support responders (registered nurse, paramedic, or equivalent); BLS = basic life-support responders (emergency medical technician, first responder, or equivalent); NT = minimally or not trained responders. 2 GNI = gross national income per capita (WHO, 2013). Low GNI = less than or equal to $1,225; 2 = middle, $1,226 to $12,225; 3 = high, $12,226 or greater. 3 Income; dummy coded as 1 = low, 2 = middle, and 3 = high. For this sample all but NT are between 2 and 3, or middle to high income. NT is between low and middle income. 4 Death rate from road traffic events per 100,000 population calculated from country population provided by WHO (2013) and estimated death rate per 100,000. 5 Corr = control of corruption, Eff = government effectiveness, Stab = political stability, Qual = regulatory quality, Law = rule of law, Voi = voice and accountability. World Bank (2013) governance indicators. 6 Spl = sample; 2.4 indicates that the sample is made up of more nonphysician responders than physician responders. PHY coded as 1; ALS, 2; BLS, 3; NT, 4.

129
Figure 5. Death rate from road traffic events per 100,000 by Staffing Choice. Physician-staffed system (1), system staffed by advanced life-support responders (ALS: registered nurse, paramedic, or equivalent, 2), system staffed by basic life-support responders (BLS: emergency medical technician, first responder, or equivalent, 3), and system staffed by minimally or not trained responders (NT, 4).

130
Table 7 provides the results of both correlational evaluation and analysis of
variance for physician versus ALS and BLS and for physician versus ALS alone.
Table 7
Correlation, ANOVA, and Bartlett Test of Homogeneity of Death Rate From Road Traffic Events per 100,000 and Systems Using Physician, ALS, and BLS Responders Physician, ALS, BLS Correlation r df p 95% Conf ß
0.008 50 0.95 -0.26/0.28 0.042 Analysis of Variance Table df Sum of
Squares Mean of Squares
F p
Staff 2 6.3 3.137 0.0485 0.9527 Residuals 49 3167.0 64.633 Bartlett test of homogeneity of variances K-squared = 2.002, df = 2, p = 0.36 Physician and ALS Correlation r df p 95% Conf ß 0.0379 45 0.800 -0.25/0.32 0.277 Analysis of Variance Table df Sum of
Squares Mean of Squares
F p
Staff 1 4.45 4.452 0.0651 0.7998 Residuals 45 3079.25 68.428 Bartlett test of homogeneity of variances K-squared = 0.3475, df = 1, p = 0.56 Note. ALS = system staffed by advanced life-support responders (registered nurse, paramedic, or equivalent). BLS = system staffed by basic life-support responders (emergency medical technician, first responder, or equivalent).

131
Pearson correlations between death rates from road traffic events per 100,000 and
prehospital staffing did not result in significant correlations of death rate and staffing by
physicians, advanced life support, and basic life support, r (52) = –0.95, p = 0.042, 95%
CI [–0.26, 0.28], ß = 0.042, or for death rate and staffing by physicians or ALS, r (47) = –
0.95, p = 0.8, 95% CI [–0.25, 0.32], ß = 0.277. Likewise, one-way between-subjects
ANOVA was conducted to compare the effect of the staffing of prehospital responders on
the rate of deaths from road traffic events and found no significant difference at the p <
0.05 level, either in the physician, advanced life-support, and basic life-support provider
conditions, F(2, 49) = 0.0485, p = 0.9527, or in the physician and advanced life-support
provider conditions, F(1,45) = 0.0651, p = 0.07998.
The homogeneity or relative equal variance of the samples was problematic
(Karen, 2010). Although ANOVA is robust to moderate variation from the assumed equal
variation of homogeneity because the sample size of the physician (28), ALS (18), and
BLS (5) conditions had a large size and population difference, the ANOVA may be
incorrect. The Bartlett test of homogeneity for the physician, advanced life-support, and
basic life-support conditions resulted in K-squared (2) = 2.02, p = 0.36, and for the
physician and advanced life-support conditions, K-squared (1) = 0.3475, p = 0.56. The
Levene test to determine if the Bartlett test was due to a non-normal sample distribution
was unavailable at the time of this writing.
Based on the results of both the correlation study and ANOVA, power and
homogeneity issues notwithstanding, the null hypothesis must be accepted: there is no

132
significant difference between the rate of death from road traffic event due to the staffing
of physicians, ALS providers, or BLS providers.
Effect of GNI per Capita and Prehospital Staffing on Road Traffic Death
For Question 4. When grouped by income, do countries with physician-staffed
response services have a lower rate of road traffic fatalities per 100,000?
Ha4: There is a significant reduction in the rate of road traffic fatalities per 100,000 in
physician-staffed prehospital services when countries are grouped by income.
Ho4: There is no significant reduction in the rate of road traffic fatalities per 100,000
in physician-staffed prehospital services when countries are grouped by income.
No significant difference was detected.
Fourteen middle-income countries used physicians for their prehospital response:
Armenia, Belarus, Brazil, China, Colombia, Iran, Kazakhstan, Lithuania, Malaysia,
Mauritius, Panama, Russia, Turkey, and Vietnam. Six middle-income countries used
advanced life-support prehospital providers: Argentina, India, Indonesia, Peru, South
Africa, and Sri Lanka. Two middle-income countries used basic life-support prehospital
providers: Mexico and Pakistan.
Fifteen high-income countries had prehospital services staffed with physicians:
Austria, Czech Republic, Finland, France, Germany, Greece, Hungary, Iceland, Israel,
Italy, Norway, Poland, Portugal, Spain, and Sweden. Eleven high-income countries used
advanced life-support prehospital providers: Australia, Canada, Denmark, Malta,
Netherlands, Oman, Saudi Arabia, South Korea, Switzerland, the United Kingdom, and

133
the United States. Finally, three high-income countries used basic life-support providers:
Bahamas, Croatia, and Japan.
Table 1 (p. 116) presents the demographic data for low-, middle-, and high-
income countries.
Middle-income countries had an average GNI per capita of $5,415 with a road
traffic death rate per 100,000 of 19.14. The physician-staffed countries had a GNI per
capita of $6,829 and a death rate of 18.91. The advanced life-support middle-income
countries had a GNI of $4,272 with a death rate of 18.43. The middle-income countries
with basic life-support providers had a GNI of $4,990 and a death rate of 16.05.
High-income countries had an average GNI per capita of $35,812 with a road
traffic death rate per 100,000 of 8.39. The physician-staffed countries had a GNI per
capita of $35,812 and a death rate of 6.85. The advanced life-support high-income
countries had a GNI of $39,006 with a death rate of 10.36. The high-income countries
with basic life-support providers had a GNI of $25,970 and a death rate of 9.77.
Figure 6 provides the box plot of the physician, advanced life-support, basic life-
support, and combined advanced life-support/basic life-support conditions. Table 8
reproduces the ANOVA results of the physician, advanced life-support, and basic life-
support conditions, and the physician and advanced life-support/basic life-support
combined conditions for middle-income countries. Table 9 presents the results for high-
income countries for the road traffic death rate per 100,000. Figure 6 plots the physician,
advanced life-support, basic life-support, and combination advanced life-support/basic
life-support data.

134
Figure 6. Death rate from road traffic events per 100,000 for middle-income countries grouped by prehospital responder staffing. 1 = physician responders, 2 = advanced life-support responders (ALS: registered nurse, paramedic, or equivalent), 3 = basic life-support responders (BLS: emergency medical technician, first responder, or equivalent), 4 = ALS/BLS combined responders.

135
Table 8
ANOVA for Middle-Income Country Death Rate From Road Traffic Events for Physician Responders, ALS Responders, BLS Responders, and for Physician and ALS/BLS Responders 2010 Death Rate for Physician, ALS responders df Sum of the
Squares Mean of the Square
F p
Staff 1 0.78 0.78 0.181 0.8946 Residuals 18 777.31 43.184 t test Physician versus ALS means t df p 95% conf ß 18.91 18.48
0.13 8.84 0.55 -Inf /6.53 0.4349
2010 Death Rate for Physician and ALS/ BLS Responders Combined df Sum of the
Squares Mean of the Square
F p
1 5.50 5.499 0.1392 0.713 20 789.83 39.492 t test Physician versus ALS/BLS means n df p 95% conf ß 18.91 17.88
0.3796 15.472 0.6453 -Inf 5.829 0.289
Table 9 reproduces the ANOVA results for the physician, advanced life-support,
and basic life-support conditions and physician and advanced life-support/basic life-
support combined conditions in high-income countries. Figure 7 plots those results.

136
Figure 7. Death rate from road traffic events per 100,000 for high-income countries grouped by prehospital responder staffing: 1 = physician responders, 2 = advanced life-support responders (ALS: registered nurse, paramedic, or equivalent), 3 = basic life-support responders (BLS: emergency medical technician, first responder, or equivalent), 4 = ALS/BLS combined responders.

137
Table 9 ANOVA and t Test for High-Income Country Death Rate From Road Traffic Events for Physician Responders, ALS Responders, BLS Responders, and for Physician and ALS/BLS Responders 2010 Death Rate for Physician and ALS Responders df Sum of the
Squares Mean of the Square
F p
Staff 1 78.55 78.496 1.9036 0.1804 Residuals 24 989.66 41.236 means t df 95%conf p ß 6.837/10.36 -1.2128 11.68 -inf,1.663 0.12 0.98 2010 Death Rate for Physician and ALS/BLS Responders Combined df Sum of the
Squares Mean of the Square
F p
1 83.17 83.172 2.1861 0.1508 27 1027.23 38.046 means t df 95% conf p ß 6.83, 10.24 -1.4393 16.393 -Inf 0.716 0.08445 0.99 Note. The statistical software reports inf or –inf in cases where the data are skewed and not in a normal distribution.
Wilcox t test did not result in significance in either middle- or high-income
countries for road traffic death rate per 100,000 between physicians or advanced life-
support providers. For middle-income t (8/84) = –0.13, p = 0.55, 95% CI [–Inf 6.53], ß =
0.043, or those using physicians, advanced life support, or basic life support, t (15.47) =
0.38, p = 0.65, 95% CI [–Inf 5.829], ß = 0.289. Likewise, one-way between-subjects
analysis of variation (ANOVA) was conducted to compare the effect of the staffing of
prehospital responders on the rate of death from road traffic events; no significant
difference was found at the p < 0.05 level in the physicians, ALS, and BLS provider
conditions, F(1, 20) = 0.139, p = 0.713, or in the physician and ALS provider conditions,
F(1,18) = 0.181, p = 0.8946. In the high-income group, no significant difference was

138
found in the death rate between physicians and advanced life-support responders t (11.68)
= –1.213, p = 0.12, 95% CI [–Inf 1.663], ß = 0.98, or between physicians and advanced
life-support/basic life-support combined provider countries, t (16.39) = –1.434, p = 0.084,
95% CI [–Inf 0.716], ß = 0.99. One-way between-subjects ANOVA was also conducted
to compare the effect of prehospital staffing on the rate of death in high-income countries
and found no significant difference at the p < 0.05 level in the physicians and ALS/BLS
provider conditions, F(1, 27) = 1.904, p = 0.18, or in the physician and ALS provider
conditions, F(1,27)=2.1861, p = 0.1508.
Based on these findings the null hypothesis must be accepted: there is no
significant difference between the staffing of physician, advanced life-support, or basic
life-support responders in the prehospital setting when income is held constant.
Effect of Governance and Prehospital Staffing on Road Traffic Death
For question 5. When grouped by the sign of standardized governance indicators,
do countries with physician-staffed prehospital services have a significantly lower
rate of road traffic deaths per 100,000 than countries with trained nonphysician–
staffed prehospital response?
Ha5: When grouped by the sign of standardized governance indicators, there is a
significant reduction in road traffic fatalities per 100,000 in countries with physician-
staffed prehospital services.
Ho5: When grouped by the sign of standardized governance indicators, there is no
significant reduction in road traffic fatalities per 100,000 in countries with physician-
staffed prehospital services.

139
Results showed a significant difference in death rate for prehospital services in the
positive and negative conditions, but no other significant difference among the groupings.
For conditions grouped by sign of the average governance value and physician-
staffed services, there were ten countries with negative signs: Armenia, Belarus, China,
Colombia, Iran, Kazakhstan, Mauritius, Pakistan, Russia, and Turkey. They had an
income level of 2.1 (slightly greater than middle income), an average GNI per capita of
$8,597, and a death rate from road traffic events of 18.99 per 100,000. Their average
scores on governance factors were as follows: control of corruption, –0.61; effectiveness
of government, –0.29; political stability, –0.68; regulatory quality, –0.36; rule of law, –
0.50; and voice and accountability, –0.81. Their average overall score was –0.54. Sixteen
countries with positive signs use physician-staffed services; these countries had an
income level of 2.7 (approaching high income): Austria, Czech Republic, Finland,
France, Germany, Greece, Hungary, Iceland, Israel, Italy, Malaysia, Norway, Panama,
Poland, Spain, Sweden, They had an average GNI per capita of $27,771, and a death rate
from road traffic events of 9.83 per 100,000. Their average scores on governance factors
were as follows: control of corruption, 0.99; effectiveness of government, 1.13; political
stability and control of violence, 0.64; regulatory quality, 1.10; rule of law, 1.07; and
voice and accountability, 1.04. Their average overall score was 0.99.
Eight countries with negative signs use advanced life-support services: Argentina,
India, Indonesia, Peru, Saudi Arabia, Sri Lanka, Vietnam, and Zimbabwe. They had an
income level of 2 (middle income), an average GNI per capita of $5,233, and a death rate
from road traffic events of 16.91 per 100,000. Their average scores on governance factors

140
were as follows: control of corruption, –0.51; effectiveness of government, –0.32;
political stability and control of violence, –0.77; regulatory quality, –0.45; rule of law, –
0.50; and voice and accountability, –0.79. Their overall average score was –0.50.
Eleven countries with positive signs used advanced life-support services:
Australia, Denmark, Malta, Netherlands, Oman, Singapore, South Africa, South Korea,
Switzerland, UK, and USA. They had an income level of 2.91 (close to high income), an
average GNI per capita of $38,050, and a death rate from road traffic events of 11.019
per 100,000. Their average scores on governance factors were as follows: control of
corruption, 1.13; effectiveness of government, 1.12; political stability and control of
violence, 0.62; regulatory quality, –1.10; rule of law, 1.15; and voice and accountability,
0.78. Their average overall score was 0.98.
Three countries with negative signs use basic life-support services: Bahamas,
Mexico, and Pakistan. They had an income level of 2.5 (between middle and high
income), an average GNI per capita of $11,460, and a death rate from road traffic events
of 14.05 per 100,000. Their average scores on governance factors were as follows:
control of corruption, –0.55; effectiveness of government, –0.28; political stability and
control of violence, –0.74; regulatory quality, –0.23; rule of law, –0.55; and voice and
accountability, –0.45. Their average overall score was –0.47.
Two countries with positive signs used basic life-support services: Croatia, and
Japan. They had an income level of 3 (high income), an average GNI per capita of
$27,970, and a death rate from road traffic events of 7.80 per 100,000. Their average
scores on governance factors were as follows: control of corruption, 0.77; effectiveness

141
of government, 1.08; political stability and control of violence, 0.72; regulatory quality,
0.79; rule of law, 0.75; and voice and accountability, 0.73. Their average overall score
was 0.81.
Eleven countries with negative signs used minimally or not trained responder
services: Angola, Bosnia and Herzegonvinia, Comoros Islands, Cuba, Ecuador, Kenya,
Lebanon, Nicaragua Philippines, Rwanda, and Thailand, They had an income level of
1.7 (slightly less than middle income), an average GNI per capita of $3,219, and a death
rate from road traffic events of 20.13 per 100,000. Their average scores on governance
factors were as follows: control of corruption, –0.53; effectiveness of government, –0.63;
political stability and control of violence, –0.75; regulatory quality, –0.59; rule of law, –
0.76; and voice and accountability, –0.58. Their average overall score was –0.64.
Four countries with positive signs used minimally or not trained responder
services: Botswana, Ghana, New Zealand, and Singapore. They had an income level of
2.5 (between middle and high income), an average GNI per capita of $19,190, and a
death rate from road traffic events of 14.30 per 100,000. Their average scores on
governance factors were as follows: control of corruption, 1.42; effectiveness of
government, 1.12; political stability and control of violence, 0.84; regulatory quality,
1.05; rule of law, 1.04; and voice and accountability, 0.57. Their average overall score
was 1.01.
Table 10 summarizes the demographics of countries grouped by governance sign
and prehospital staffing preference. Figure 8 plots the death rates of countries with

142
negative and positive governance signs when staffed by physician, advanced life support,
basic life support, and minimally or not trained responders.
Table 11 shows the t Test results between positive and negative staffing
conditions . Only physician staffing conditions reached a significant difference between
governance indicator groupings. The ALS and BLS conditions approached significance,
but failed to reach it.
The Wilcox t test comparing death rates and prehospital staffing within negative
or positive governance conditions found a significant death rate between negative and
positive conditions for physicians, t (11.52) = –4.12, p > 0.001, 95% CI [6.27, Inf], ß = 1.
There was a near significant death rate between negative and positive ALS, t (14.0) =
1.67, p = 0.058, 95% CI [–0.31, Inf], ß = 0.96. Death rate between negative and positive
BLS was t (–1.37) = 2.64, p = 0.086, 95% CI [–4.04, Inf], ß = 0.83. As Table 12 reveals,
no significant findings were obtained when comparing staffing by physicians versus ALS
or combined ALS/BLS.

143
Table 10
Staffing, GNI, Income, Death Rate From Road Traffic Events per 100,000, and Sign of Governance Indicators Staff n GNI2 Inc3 Death4 Corr5 Eff5 Stab5 Qual5 Law5 Voi5 Avg5
Phys n 10 8,597 2.1 18.99 -0.61 -0.29 -0.68 -0.36 -0.50 -0.81 -0.54 Phys p 16 27,771 2.7 9.83 0.99 1.13 0.64 1.10 1.07 1.04 0.99 ALS n 8 5,233 2 16.91 -0.51 -0.32 -0.77 -0.45 -0.50 -0.43 -0.50 ALS p 11 38,050 2.91 11.01 1.13 1.12 0.62 1.10 1.15 0.79 0.98 BLS n 3 11,460 2.5 14.05 -0.55 -0.28 -0.74 -0.23 -0.55 -0.45 -0.47 BLS p 2 27,970 3 7.8 0.77 1.08 0.72 0.79 0.75 0.73 0.81 NT n 11 3,219 1.7 20.13 -0.53 -0.63 -0.75 -0.59 -0.76 -0.58 -0.64 NT p 4 19,190 2.5 14.3 1.42 1.12 0.84 1.05 1.04 0.57 1.01 Note.1Staffing: Phys = physician-staffed prehospital response; ALS = system staffed by advanced life-support responders (registered nurse, paramedic, or equivalent); BLS= system staffed by basic life-support responders (emergency medical technician, first responder, or equivalent); NT= minimally or not trained responders. n = negative average World Bank (2013) governance indicator group; p = positive average governance indicator group. 2 GNI = gross national income per capita (WHO, 2013). Low GNI = less than or equal to $1,225; 2 = middle, $1,226 to $12,225; 3 = high, $12,226 or greater. 3 Income; dummy coded as 1 = low, 2 = middle, and 3 = high. 4 Death rate from road traffic events per 100,000 population calculated from country population provided by WHO (2013) and estimated death rate per 100,000. 5 Corr = control of corruption, Eff = government effectiveness, Stab = political stability, Qual = regulatory quality, Law = rule of law, Voi = voice and accountability. World Bank (2013) governance indicators average (Avg) is calculated from the average of the indicators.

144
Figure 8. Death rate by sign of average governance indicator for staffing preference. nPhy= negative signed physician responder service; pPhy= positively signed physician staffed service; nALS= negatively signed advanced life-support service; pALS= positively signed advanced life-support service. nBLS= negatively signed basic life-support service; pBLS= positively signed life-support service; nNT= negatively signed minimally or not trained service; pNT= positively signed minimally or not trained service.

145
Table 11
t-Test Comparing Negative and Positive Governance Signs With Prehospital Staffing
n
neg
n
pos
t df p 95% conf Mean negative, positive
ß
PHY 8 21 4.12 11.52 >0.001 6.27, Infinity
20.69, 9.62 1
ALS 7 11 1.67 14.00 0.058 -0.31, Infinity
16.91, 11.01 0.96
BLS 3 2 2.64 -1.37 0.086 -4.04, Infinity
15.27, 7.80 0.83
NT 11 4 -1.24 5.23 0.134 -3.72. Infinity
20.4, 14.3 0.83
Note. PHY= physician, ALS= advanced life support (registered nurse, paramedic or equivivalent), BLS= basic life support, NT= minimally or not trained responders.
Table 12
t-Test Comparing Negative and Positive Governance Signs With Prehospital Staffing by Physicians or ALS Responders Test Tail x > y n T df p 95% conf means ß nPHY/nALS 8/7 1.34 11.79 0.102 -1.25, inf 20.69,16.91 0.892 nPHY/nNPHY 8/10 -1.64 10.14 0.066 -0.45, inf 20.69,16.42 >0.001 pPHY/pALS 21/11 -0.41 13.44 0.654 -7.44, inf 9.62,11.01 0.244 pPHY/pNPHY 21/13 -3.00 17.61 0.616 -6.09, inf 9.62,10.52 >0.001 Note. n signifies negative standard governance indicator value. p signifies positive standardized governance indicator value. PHY = physician responder, ALS = advanced life-support responder (registered nurse, paramedic, or equivalent), NPHY = combined advanced and basic life-support providers.
Based on the results of this analysis, the alternative hypothesis must be accepted,
that there is a difference in the death rate from road traffic events between physician
staffing in countries with negative governance signs versus physician staffing in countries
with positive governance signs and nearly for advanced life-support providers in the same
conditions. The null hypothesis must be accepted in the case of physicians versus

146
advanced life-support or advanced life-support/basic life-support providers within each of
the governance groups. This turns out to be a poorly conceived and worded question.
Income, Governance Sign, and Staffing Interaction
For Question 6. When grouped by income and sign of standardized governance
indicators, do countries with physician-staffed prehospital services have a
significantly lower rate of road traffic deaths per 100,000 than countries with
trained nonphysician–staffed prehospital response?
Ha6: When grouped by income and sign of standardized governance indicators,
countries with physician-staffed prehospital services have a significantly lower rate of
road traffic deaths per 100,000 than countries with trained nonphysician–staffed
prehospital response.
Ho6: When grouped by income and sign of standardized governance indicators,
countries with physician-staffed prehospital services do not have a significantly lower
rate of road traffic deaths per 100,000 than countries with trained nonphysician–staffed
prehospital response.
I could not properly analyze this question due to the inconsistent sample size and
group sizes available.
The grouping of road traffic deaths per 100,000 by income, governance sign, and
staffing preference yielded 18 groups. Four low-income countries with negative
governance signs could be split into two groups. Alone in its own group was Zimbabwe,
with a road traffic death rate per 100,000 of 14.6. It used paramedic or nursing personnel
to staff its prehospital response and had an average governance value of –1.54, calculated

147
from the following scores: control of corruption, –1.31; effectiveness of government, –
1.50; political stability and control of violence, –1.12; regulatory quality, –2.05; rule of
law, –1.81; and voice and accountability, –1.48. In the other group were the Comoros
Islands, Kenya, and Rwanda, with a road traffic death rate per 100,000 of 20.87. These
countries used minimally or not trained personnel in their prehospital response systems.
They had an average governance value of –0.64, calculated from the following scores:
control of corruption, –0.41; effectiveness of government, –0.78; political stability and
control of violence, –0.62; regulatory quality, –0.56; rule of law, –0.79; and voice and
accountability, –0.67.
Among the middle-income countries 32 could be divided into six groups. Eight
countries with prehospital physician responders and a negative average governance sign
were Armenia, China, Colombia, Iran, Kazakhstan, Russia, Turkey, and Vietnam. These
countries had an average road traffic death rate per 100,000 of 20.696 and an average
governance value of –0.55, calculated from the following scores: control of corruption, –
0.63; effectiveness of government, –0.27; political stability and control of violence, –
0.71; regulatory quality, –0.35; rule of law, –0.51; and voice and accountability, –0.86.
Six middle-income countries with positive governance signs had physician-staffed
prehospital response systems: Belarus, Brazil, Lithuania, Malaysia, Mauritius, and
Panama. These countries had a road traffic death rate per 100,000 of 14.10 and an
average governance value of 0.67, calculated from the following scores: control of
corruption, 0.65; effectiveness of government, 0.74; political stability and control of

148
violence, 0.50; regulatory quality, 0.81; rule of law, 0.62; and voice and accountability,
0.70.
There were five countries with advanced life-support prehospital responders and a
negative average governance sign: Argentina, India, Indonesia, Peru, and Sri Lanka.
These countries had an average road traffic death rate per 100,000 of 15.80 and an
average governance value of –0.34, calculated from the following scores: control of
corruption, –0.46; effectiveness of government, –0.15; political stability and control of
violence, –0.81; regulatory quality, –0.25; rule of law, –0.39; and voice and
accountability, –0.05.
One middle-income country had a positive governance sign, South Africa; it used
advanced life-support responders to staff its prehospital system. It had a road traffic death
rate per 100,000 of 31.9 and an average governance value of 0.25, calculated from the
following scores: control of corruption, 0.09; effectiveness of government, 0.39; political
stability and control of violence, –0.02; regulatory quality, 0.36; rule of law, 0.11; and
voice and accountability, 0.58.
Two countries used basic life-support prehospital responders and had a negative
average governance sign: Mexico and Pakistan. These countries had an average road
traffic death rate per 100,000 of 16.05 and an average governance value of –0.65,
calculated from the following scores: control of corruption, –0.72; effectiveness of
government, –0.31; political stability and control of violence, –1.71; regulatory quality, –
0.16; rule of law, –0.65; and voice and accountability, –0.35.

149
Eight countries used prehospital responders that were minimally trained or not
trained and had a negative average governance sign: Angola, Bosnia and Herzegovinian,
Cuba, Ecuador, Lebanon, Nicaragua, Philippines, and Thailand. These countries had an
average road traffic death rate per 100,000 of 20.23 and an average governance value of –
0.69, calculated from the following scores: control of corruption, –0.68; effectiveness of
government, –0.64; political stability and control of violence, –0.74; regulatory quality, –
0.66; rule of law, –0.81; and voice and accountability, –0.69.
Two middle-income countries had prehospital response systems that used
minimally trained or not trained staff and a positive governance sign: Botswana and
Ghana. These countries had a road traffic death rate per 100,000 of 21.5 and an average
governance value of 0.38, calculated from the following scores: control of corruption,
0.53; effectiveness of government, 0.21; political stability and control of violence, 0.49;
regulatory quality, 0.29; rule of law, 0.30; and voice and accountability, 0.47.
Fifteen high-income countries with a positive governance sign used physicians as
prehospital responders: Austria, Czech Republic, Finland, France, Germany, Greece,
Hungary, Iceland, Israel, Italy, Norway, Poland, Portugal, Spain, and Sweden. These
countries had a road traffic death rate per 100,000 of 6.85 and an average governance
value of 1.11, calculated from the following scores: control of corruption, 1.12;
effectiveness of government, 1.28; political stability and control of violence, 0.62;
regulatory quality, 1.22; rule of law, 1.26; and voice and accountability, 1.41.
Saudi Arabia was the lone high-income country with a negative governance sign
that used advanced life-support staff in its prehospital response system. It had a road

150
traffic death rate per 100,000 of 24.8 and an average governance value of –0.24,
calculated from the following scores: control of corruption, 0.06; effectiveness of
government, 0.03; political stability and control of violence, –0.22; regulatory quality,
0.18; rule of law, 0.25; and voice and accountability, –1.74.
There were 10 high-income countries with a positive governance sign that used
advanced life-support staff in their prehospital response systems: Australia, Canada,
Denmark, Malta, Netherlands, Oman, South Korea, Switzerland, the United Kingdom,
and the United States. They had a road traffic death rate per 100,000 of 8.92 and an
average governance value of 0.20, calculated from the following scores: control of
corruption, 1.52; effectiveness of government, 1.52; political stability and control of
violence, 0.79; regulatory quality, 1.46; rule of law, 1.55; and voice and accountability,
1.32.
The Bahamas was the lone high-income country with a negative governance sign
that used basic life-support prehospital response. It had a road traffic death rate per
100,000 of 13.7 and an average governance value of –0.96, calculated from the following
scores: control of corruption, 0.73; effectiveness of government, –1.13; political stability
and control of violence, –0.13; regulatory quality, –1.16; rule of law, –1.04; and voice
and accountability, –1.54.
There were two high-income countries with a positive governance sign that used
basic life-support prehospital response systems: Croatia and Japan. They had a road
traffic death rate per 100,000 of 10.4 and an average governance value of 0.38, calculated
from the following scores: control of corruption, 0.77; effectiveness of government, 1.07;

151
political stability and control of violence, 0.72; regulatory quality, 0.79; rule of law, 0.74;
and voice and accountability, 0.81.
Finally, there were two high-income countries with a positive governance sign
that used minimally trained or not trained prehospital responders: New Zealand and
Singapore. They had a road traffic death rate per 100,000 of 7.1 and an average
governance value of 1.63, calculated from the following scores: control of corruption,
2.30; effectiveness of government, 2.03; political stability and control of violence, 1.18;
regulatory quality, 1.81; rule of law, 1.78; and voice and accountability, 0.67.
Table 13 summarizes the findings of the demographic results for road traffic event
deaths in relation to income, governance, and prehospital staffing for these countries.
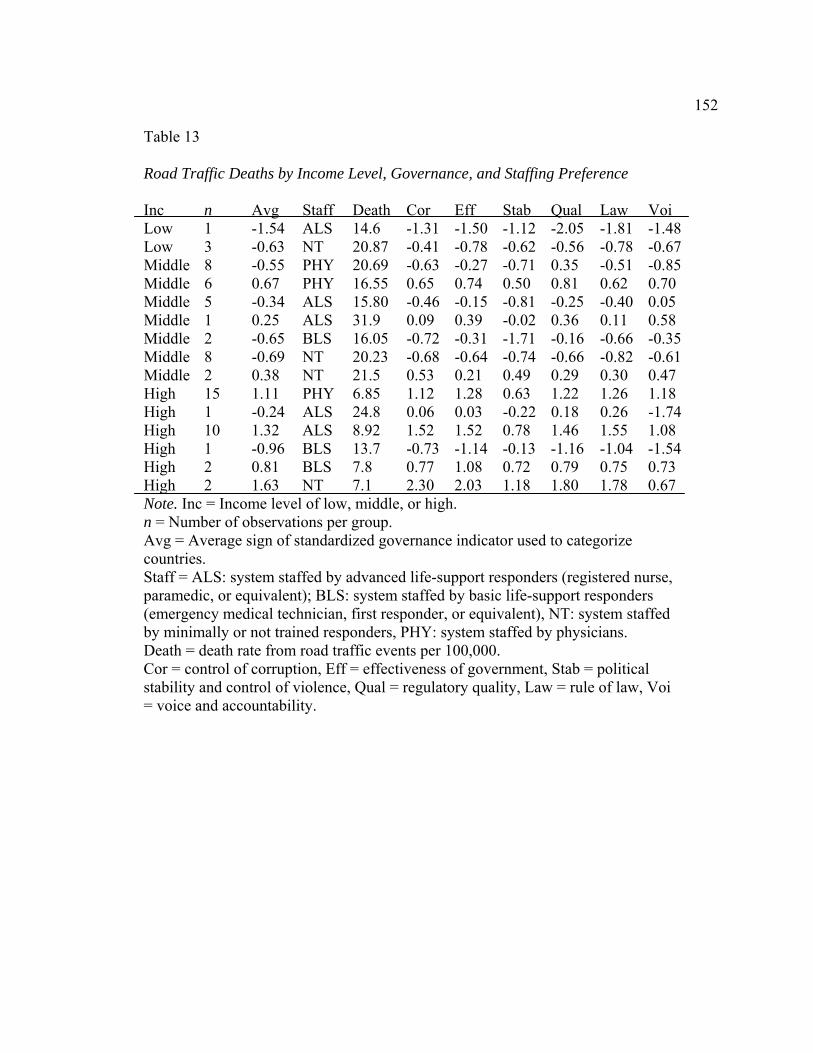
152
Table 13
Road Traffic Deaths by Income Level, Governance, and Staffing Preference
Inc n Avg Staff Death Cor Eff Stab Qual Law Voi Low 1 -1.54 ALS 14.6 -1.31 -1.50 -1.12 -2.05 -1.81 -1.48Low 3 -0.63 NT 20.87 -0.41 -0.78 -0.62 -0.56 -0.78 -0.67Middle 8 -0.55 PHY 20.69 -0.63 -0.27 -0.71 0.35 -0.51 -0.85Middle 6 0.67 PHY 16.55 0.65 0.74 0.50 0.81 0.62 0.70 Middle 5 -0.34 ALS 15.80 -0.46 -0.15 -0.81 -0.25 -0.40 0.05 Middle 1 0.25 ALS 31.9 0.09 0.39 -0.02 0.36 0.11 0.58 Middle 2 -0.65 BLS 16.05 -0.72 -0.31 -1.71 -0.16 -0.66 -0.35Middle 8 -0.69 NT 20.23 -0.68 -0.64 -0.74 -0.66 -0.82 -0.61Middle 2 0.38 NT 21.5 0.53 0.21 0.49 0.29 0.30 0.47 High 15 1.11 PHY 6.85 1.12 1.28 0.63 1.22 1.26 1.18 High 1 -0.24 ALS 24.8 0.06 0.03 -0.22 0.18 0.26 -1.74High 10 1.32 ALS 8.92 1.52 1.52 0.78 1.46 1.55 1.08 High 1 -0.96 BLS 13.7 -0.73 -1.14 -0.13 -1.16 -1.04 -1.54High 2 0.81 BLS 7.8 0.77 1.08 0.72 0.79 0.75 0.73 High 2 1.63 NT 7.1 2.30 2.03 1.18 1.80 1.78 0.67 Note. Inc = Income level of low, middle, or high. n = Number of observations per group. Avg = Average sign of standardized governance indicator used to categorize countries. Staff = ALS: system staffed by advanced life-support responders (registered nurse, paramedic, or equivalent); BLS: system staffed by basic life-support responders (emergency medical technician, first responder, or equivalent), NT: system staffed by minimally or not trained responders, PHY: system staffed by physicians. Death = death rate from road traffic events per 100,000. Cor = control of corruption, Eff = effectiveness of government, Stab = political stability and control of violence, Qual = regulatory quality, Law = rule of law, Voi = voice and accountability.

153
Figure 9 plots road traffic deaths for the sample grouped by income, sign of
governance indicator, and prehospital staffing. The figure demonstrates the inconsistent
pairing of groups and lack of sufficient sample size in some of the groups.

154
Figure 9. Death by income, governance sign, and staffing by comparable grouping. A. Low-income, negative governance, ALS. B. Low-income, negative governance, NT. C. Middle-income, negative governance, physician. D. Middle-income, positive governance, physician. E. Middle-income, negative governance, ALS. F. Middle-income, positive governance, ALS. G. Middle-income, negative governance, BLS. H. Middle-income, negative governance, NT. I. Middle-income, positive governance, NT. J. High-income, positive governance, physician. K. High-income, negative governance, ALS. L. High-income, positive governance, ALS. M. High-income, negative governance, BLS. N. High-income, positive governance, BLS. O. High-income, positive governance, NT. ALS=advanced life support, NT=minimally or not trained, BLS= basic life support.

155
Only one analysis, a t test, was feasible for these groups (Table 14). It suggested a
significant difference between the death rates from road traffic events of middle-income
countries with a negative governance sign using advanced life-support prehospital staff
and middle-income countries with a negative governance sign using physician prehospital
staff: t (9.78) = 1.865, p = 0.046, 95% CL[0.13, Inf] , ß = 0.998. In Table 15, we can see a
difference between governance and income for rate of road traffic deaths, but the
difference is not due to prehospital staffing.
Table 14
t-Test of Mi
ddle-Income Countries With a Negative Governance Sign Using Physician versus ALS Providers
X<Y means T df p 95% confidence ß m1A/m1P 20.6875
15.8000 1.8652 9.783 0.04619 0.1275745 Inf
0.9982
Note. m1A/m1P= middle-income negative governance advanced life support is greater than middle-income negative physician staffed services.

156
Table 15
ANOVA Table for Death Rate by Income and Governance Sign Groupings
df Sum Sq Mean Sq F value Pr(>F) Income and sign
14 2618.4 187.030 4.9355 1.062e-05 ***
Residuals 52 1970.5 37.895 Signif. codes: 0 ‘***’ 0.001 ‘**’ 0.01 ‘*’ 0.05 ‘.’ 0.1 ‘ ’ 1
Although the look of Figure 9 is intriguing, it is not possible to analyze its
question based on the available data. Looking at the World Health Organization’s (2013)
evaluation of road traffic deaths by income and governance sign (ignoring the staffing
preference by country), Figure 9 graphically demonstrates there is no significant
difference in the death rate among the groups.
The only significant interaction reported in Table 16 is the interaction between
middle-income, negative indicator (2) and high-income, positive indicator (5) countries, p
= 0.0047. This is represented in Figure 8 by the letters C, E, G, H and J, L, N, O: the
middle-income, negative indicator, physician, ALS, BLS, and NT groups and high-
income, positive indicator, physician, ALS, BLS, and NT groups.
A look at what can be gleaned from analyzing income, governance, and
prehospital responder preference is presented in Figure 10, which plots income,
governance, and prehospital staffing, and Figure 11,<introduce following tables and
figures> the Tukey stepwise comparison of groups.

157
Figure 10. Death rate by income and sign of governance indicator. 1 = low-income, negative indicator; 2 = middle-income, negative indicator; 3 = middle-income, positive indicator; 4 = high-income, negative indicator; 5 = high-income, positive indicator.

158
Table 16
Tukey Multiple Comparisons of Means 95% Family-wise Confidence Level
Group 1 Group 2 difference lower upper p adj
Middle-income negative High-income positive 7.262 -10.5410 25.064 0.793
High-income negative High-income positive 9.616 -42.793 62.025 0.987
Low income-negative High-income positive 12.351 -4.5092 29.211 0.261
Middle-income negative High-income positive 17.567 3.872 31.262 0.005
High-income negative Middle-income positive 2.354 -50.888 55.597 0.100
Low-income negative/ Middle-income positive 5.090 -14.206 24.385 0.950
Middle-income negative Middle-income positive 10.306 -6.296 26.907 0.430
Low-income negative/ High-income negative 2.735 -50.199 55.670 0.100
Middle-income negative High-income negative 7.951 -44.062 59.9648 0.993
Middle-income negative Low-income negative 5.216 -10.371 20.803 0.888

159
Figure 11. Income governance and prehospital staffing.1 = high-income, positive governance, physician staffing; 2 = high-income, positive governance, ALS staffing; 3 = middle-income, negative governance, ALS staffing; 4 = middle-income, negative governance, physician staffing; 5 = middle-income, positive governance, physician staffing.

160
Table 17
Tukey Multiple Comparisons of Means 95% Family-wise Confidence Level
Group difference
lower upper
p
high-income positive ALS
high-income positive physician
-2.073 -8.717 4.570 0.898
middle income negative ALS
high-income positive physician
6.880 -2.033 15.793 0.198
middle income negative physician
high-income positive physician
11.768 4.049 19.486 0.001
middle income positive physician
high-income positive physician
7.630 -0.773 16.0332 0.091
middle income negative ALS
high-income positive ALS 8.953 0.550 17.357 0.032
middle income negative physician
high-income positive ALS 13.841 6.717 20.965 0.000
middle income positive physician
high-income positive ALS 9.703 1.843 17.564 0.009
middle income negative physician
middle income negative ALS
4.888 -4.389 14.164 0.563
middle income positive physician
middle income negative ALS
0.750 -9.104 10.604 0.999
middle income positive physician
middle income negative physician
-4.138 -12.926 4.651 0.665
Note. 1=high-income positive physician, 2= high-income positive ALS, 3= middle income negative ALS, 4= middle income negative physician, and 5= middle income positive physician. ALS= registered nurse, paramedic, or equivalent,

161
There were significant differences between middle-income countries with
negative governance and physician staffing and high-income countries with positive
governance and physician staffing, p > 0.001; between middle-income countries with
negative governance and advanced life-support staffing and high-income countries with
advanced life-support staffing, p = 0.032; and between middle-income countries with
negative governance and physician staffing and high-income countries with positive
governance and advanced life-support staffing, p > 0.001. The difference between
physician and advanced life-support providers was difficult to interpret because of the
variation in the sample size, but it appears that income and governance were the factors
responsible for the difference in death rate, not prehospital staffing. Middle-income
countries with positive governance and physician staffing and high-income countries with
positive governance and advanced life-support staffing had a significant difference, p =
0.01, The difference between physician and advanced life-support providers was difficult
to interpret; here too the income and governance factor appear to be the determining
factor.
Based on the data for this question, there seems no way to interpret the findings.
Neither the null nor the alternative hypothesis can be accepted.
Summary
Sixty-seven countries were identified as having English-language profiles and
complete data for income, road traffic deaths, governance values, and prehospital staffing
preferences. The literature review of country emergency medicine profiles resulted in a

162
finer distinction of prehospital staffing than was anticipated. Trained nonphysician
response staff was separated into advanced life-support and basic life-support categories.
All but four of the sample countries had middle or high income. Statistical analysis of the
first five of the six research questions was conducted. The final research question had too
many groups with too few data per group to perform reliable computations.
1. Is there a significant association between income level of a country and the rate of
road traffic fatalities per 100,000?
Ha1: There is a significant negative correlation between income level of countries
and road traffic fatalities.
Ho1: There is no association between income level of countries and road traffic
fatalities.
The literature review resulted in 67 countries with usable data. Comparing the
total estimated deaths from road traffic events and the death rate per 100,000 (WHO,
2013) as well as the total deaths and death per 100,000 for the 182 countries in the WHO
(2013) resulted in a significant correlation between death rate per 100,000 from road
traffic events and country income measures as GNI per capita.
2. Is there an association between the sign of standardized governance indicators of
a countries and road traffic fatalities per 100,000?
Ha2: There is a significant negative correlation between the sign of standardized
governance indicators of countries and road traffic fatalities.
Ho2: There is no association between the sign of standardized governance
indicators of countries and road traffic fatalities.

163
Based on the sample data, there was a negative correlation between the value of
the governance indicator and the death rate per 100,000 from road traffic events.
3. Does the staffing of prehospital response services by physicians reduce the rate
of road traffic fatalities per 100,000?
Ha3: There is a significant reduction in the rate of road traffic fatalities per 100,000
when prehospital services are staffed by physicians.
Ho3: There is no significant difference between physician-staffed and nonphysician-
staffed prehospital services and the rate of road traffic fatalities per 100,000.
Based on correlation and ANOVA of the sample, no significant difference in the
death rate from road traffic events per 100,000 was found between staff conditions for
middle- or high-income countries. Low-income data were too sparse to analyze.
4. When grouped by income, do countries with physician-staffed response services
have a lower rate of road traffic fatalities per 100,000?
Ha4: There is a significant reduction in the rate of road traffic fatalities per 100,000 in
physician-staffed prehospital services when countries are grouped by income.
Ho4: There is no significant reduction in the rate of road traffic fatalities per 100,000
in physician-staffed prehospital services when countries are grouped by income.
Based on the sample data, there was a significant difference between the death
rate per 100,000 from road traffic events between the middle- and high-income countries,
but not among the staffing preferences within each group.
5. When grouped by the sign of standardized governance indicators, do countries
with physician-staffed prehospital services have a significantly lower rate of road

164
traffic deaths per 100,000 than countries with trained nonphysician–staffed
prehospital response?
Ha5: When grouped by the sign of standardized governance indicators, there is a
significant reduction in road traffic fatalities per 100,000 in countries with physician-
staffed prehospital services.
Ho5: When grouped by the sign of standardized governance indicators, there is no
significant reduction in road traffic fatalities per 100,000 in countries with physician-
staffed prehospital services.
Base on the sample data, there was a significant difference between the negative
and positive groups of averaged governance indicators in the death rate from road traffic
events for all staffing preferences. The significance within groups (staff preference) is, as
yet, undetermined.
6. When grouped by income and sign of standardized governance indicators, do
countries with physician-staffed prehospital services have a significantly lower
rate of road traffic deaths per 100,000 than countries with trained nonphysician–
staffed prehospital response?
Ha6: When grouped by income and sign of standardized governance indicators,
countries with physician-staffed prehospital services have a significantly lower rate of
road traffic deaths per 100,000 than countries with trained nonphysician–staffed
prehospital response.
Ho6: When grouped by income and sign of standardized governance indicators,
countries with physician-staffed prehospital services do not have a significantly lower

165
rate of road traffic deaths per 100,000 than countries with trained nonphysician–
staffed prehospital response.
The analysis of the sixth question was not available. The group sizes and
composition did not allow for any meaningful comparison. The only group difference
that could be found was for middle-income countries with negative governance and
physician-staffed response systems versus middle-income countries with negative
governance and advanced life-support responders.
In Chapter 5 these results are discussed and conclusions drawn.
Recommendations based on the conclusions are presented. Additionally, limitations of
the study are highlighted.

166
Chapter 5: Discussion, Conclusions, and Recommendations
Introduction
In this archival cross-sectional study, I looked at the influence of income,
governance, and style of prehospital services on the death rate from road traffic events in
67 countries. The literature review revealed that there is a great variety in the provision of
prehospital services, making a comparison of styles difficult.
In this study, the commonly referenced factors of vehicle safety, seat belt use,
speeding, and alcohol and drug use (Anbarci et al., 2009; Chrisholm & Naci, 2009;
Kopitis, 2004; Moeller, 2005; WHO, 2009) were represented by country income level
(Kopitis, 2004) or governance (Law, 2010).
Income and governance indicators (control of corruption, effectiveness of
government, political stability and lack of violence, regulatory quality, rule of law, and
voice and accountability) were negatively correlated with road traffic death, in line with
Kopitus (2009) for the former and Law (2009) and Gaygisiz (2010) for the latter.
Although Law (2009) found an inverted U when comparing governance and road traffic
deaths, this study could not corroborate that observation. These findings do support
those of Gaygisiz (2010) and Bishai (2006), that higher governance scores are related to
lower rates of road traffic death. The results did not form a Kuznets curve, as found by
Law (2009), which may be due to the absence of data for low-income countries in this
study.
Law (2009) identified corruption as a contributing factor in road traffic deaths,
and this study corroborates that finding. Indeed all of the governance factors had a

167
negative correlation with road traffic deaths: corruption r = –0.61, government
effectiveness r = –0.63, political stability and control of violence r = –0.48, regulatory
quality r = –0.59, rule of law r = –0.63, and voice and accountability r = –0.64. All
correlations had p < 0.01, and all except political stability and control of violence (ß =
0.66) had a power of 0.95 or greater. These correlations are also in keeping with Al-
Marhubi’s (2005) negative correlations for governance indicators.
No significant difference was found with regard to style of emergency medical or
prehospital service, echoing Timmermann et al. (2008), and the null hypothesis was
accepted. This finding would suggest that, especially if funding or medical staffing is an
issue for a country, nonphysician emergency staff provide suitable out-of-hospital care
for victims of road traffic accidentsand may be more cost-effective for resource-stressed
countries, supporting Holliman et al. (2011) and other authors.
<no para break?>All the findings in this study support <how?>Sarlin and
Alagappan (2010), Brown and Devine (2008), Holliman et al. (2011), Jennings (2010),
Kobusingye et al. (2005), O'Reilly and Fitzgerald (2010), and Razzak and Kellermann
(2002).
The results of this study neither support nor refute Hass and Nathens’s (2008)
conclusion that patients benefit more from the resources in the emergency room than at
the scene of the accident. Nor do they support the fourfold difference in outcome
Roudsari et al. (2007) found for physician-staffed services.
O’Reilly and Fitzgerald’s (2010) claim that prehospital systems are becoming
more like the Anglo-American system was not seen in this study. In the countries

168
analyzed in this study, there were more physician-staffed than nonphysician-staffed
services, although this result may be due to the limitation that only country profiles in
English were considered and also because middle-income countries had a preponderance
of physician-staffed services and high-income a preponderance of nonphysician-staffed
services.
The factors contributing to road traffic death, such as type and number of vehicles
on the roadways, infrastructure of road systems, vehicle design and safety features, and
laws and law enforcement, were all combined into the variables of income per capita and
governance quality across the pre-event, event, and postevent times in Haddon’s (1968)
original matrix and also occupy strategic positions in the political and social arenas
included by Runyan (1998). This study looked at the pre-event structure of the
prehospital system and the postevent outcome of road traffic events measured as road
traffic deaths per 100,000 people, focusing on the environmental, political, and policy
cells of the Haddon matrix. In the postevent areas, I covered the agents and environment
in the policy and social cells. Based on the data collected in this study, the staffing
preference did not make a significant difference in any area. A significant difference was
seen in the income per capita and the governance quality of the same cells.
The conclusion from the analysis of these data with respect to the Haddon matrix
is that countries get the same benefit from physician-staffed services as they do from
nonphysician-staffed services. In the social and political arenas, this results in a
recommendation to increase the number of personnel trained in advanced life-support

169
skills and concentrate physicians in the hospital, where they can have an impact on a
greater number of patients.
The findings of this study support the notion that income and governance are the
major determinants of death from road traffic incidents. Based on the available data, there
is a significant negative correlation between a country’s rate of road traffic fatalities and
that country’s income and between the rate of road traffic fatalities and a country’s
governance indicators.
The final question was difficult to analyze due to the grossly unequal sample size.
However, what could be analyzed pointed to a significant difference in rates of road
traffic death when countries are grouped by income and sign of the standardized
governance indicators, but not by prehospital staffing within each of the income and
governance groupings.
Insignificant Results
The data in this study were not normally distributed. At modest levels, this is not
a problem, but in extreme cases, it makes the statistical analysis invalid (Karen, 2010).
For analysis of income, governance, and prehospital staffing as individual factors, the
group sizes and distribution may meet the modest normal distribution requirement of
valid statistics. However, as the groupings become greater in number and more complex,
the normality of distribution disappears; in fact, the lack of a representative low-income
group skews the results right from the onset.
When trying to compare means, the degrees of freedom (based on the number of
observations per group) need to be close among the groups, or the resultant population

170
means can be underestimated and the mean difference overestimated (Hsiung, Olejnik, &
Huberty, 1994). Additionally, because this is a convenience sample, the similarity in the
population variance is difficult to guarantee (Hsiung et al., 1994). Figure 8 graphically
demonstrates the problem of group size and variability and the extreme of the problem of
group size in this study: there are not enough groups to compare against each other.
The conservative conclusion of this study, based on these results, is that the traffic
safety laws and enforcement and the quality of the health care system (including
prehospital and hospital treatments) in high-income countries result in lower death rates
from traffic events than in middle-income countries. A conclusion about the merits of
different types of prehospital staffing—whether by physicians, advanced life-support
responders, or basic life-support responders—is hard to make. Yet efforts to improve
health care capacity and policy, regulation, and enforcement of road safety can be
reasonably recommended from this analysis.
At the onset of this study, capacity building was not foreseen as a possible
recommendation, yet the results clearly point to capacity building as a way to reduce road
traffic fatalities. This will be a daunting challenge for low- and middle-income countries.
The goals of capacity building are “autonomy and self-reliance, local capacity, and
sustainability” (Guha-Sapir, 2005, p. 480). Five elements for building sustainable
capacity are “training for identified key competencies, country-specific approaches,
targeted technical assistance, qualification and quality control, and funding” (Guha-Sapir,
2005, p. 481). Areas where capacity building should be undertaken are organizational and

171
managerial, human resource development, leadership, partnership development, and
networks (Guha-Sapir, 2005).
Grindle (2004, p. 525) stated, “It is all too clear that when governments perform
poorly, resources are wasted, services go undelivered, and citizens—especially the
poor—are denied social, legal, and economic protection.”Governance is difficult to
change. Guha-Sapir (2005) agreed, remarking that capacity building is a complex topic
that quickly comes to a standstill when all of the stakeholders desire to have their
priorities represented.
Limitations of the Study
This is a cross-sectional study that only recorded observations on the chosen
variable across many subjects during one specified time period, a snapshot of the
population (Institute for Work and Health, 2009). Cross-sectional studies do not allow for
a look at the history of precursors or subsequent development of the variables over time,
limiting or prohibiting determinations of cause and effect. Similarly, as a correlational
study this work was able to demonstrate relationships among factors but was not able to
attribute cause (Research Limitations, n.d.).
The nature of the data sets is also a limitation, as data were collected using a
variety of methods and definitions (Koziol & Arthur, n.d.). The latter issue, however, is
the same for other researchers using the data; therefore, results will be comparable to
results in other studies (World Bank, 2013).
Additionally, using secondary data poses limitations on the resulting analysis
because there is uncertainty injected into the data collection (Atkinson & Brandolini,

172
2001; Bhalla, 2010). However, this uncertainty is spread across all countries that have
data, and other researchers have used the data, giving some continuity to cross-study
analysis.
There is also a bias built into the study caused by lower-income countries not
reporting data to the databank managers as frequently as higher-income countries report.
There are fewer results for income, governance, road traffic fatalities, and prehospital
staffing to be found from lower-income countries. This shifted the burden of evidence
toward middle- and high-income countries. Given the data available, there was little that
could be done to overcome this difficulty.
The grossly unequal sample size made the data difficult to analyze with
confidence. Confounding and bias could be introduced by the presence of more and
possibly erroneously larger or smaller observations from the groups (Lane, n.d.). In this
case, having data from only four low-income countries adds uncertainty to the
conclusions.
Another limiting factor is the lack of data on the death rate from road traffic
events after the patient reaches the hospital. Had some measure that separated the hospital
and prehospital deaths been available, a result with greater fidelity could have been
obtained.
Recommendations
A fuller search of country prehospital systems could be undertaken, searching for
data from ministries of health and literature that is not in English. A more detailed search

173
for the costs associated with providing prehospital care might also provide a keener sense
of whether physician response is cost-efficient in the long run.
Anderson et al. (2011), Brice et al. (2010), and Jakubasko et al. (2010) advocated
optimizing existing resources in prehospital systems. This research supports the further
investigation of prehospital staffing as a resource to be strengthened and for the
development of effective staffing patterns that reduce the burden placed on families
affected by road traffic deaths.
Jennings (2010) encouraged the expansion of advanced life-support professionals
as a cost-effective and rapidly implementable intervention to reduce the burden of road
traffic and other forms of death, especially for countries struggling to provide for the
health of their people. The results of this study support additional investigation into the
best training and practice standards for prehospital health providers. No significant
difference was detected between physician responders and trained nonphysician
providers, so training advanced life-support responders should be a valuable asset for a
country. Kobusingye et al. (2002), Brown and Devine (2008), Sterling et al. (2007),
Holiman (2010), and Sarlin and Alagappan (2010) are all in concurrence that best
practices and cost-effective health care can be provided by paramedics, nurses, and their
equivalents and should be considered as the approach to prehospital care for developing
countries.
Anderson et al. (2012) suggested five strategies for developing good prehospital
health care:

174
1. Encourage governments to plan and provide for a basic level of emergency
services.
2. Develop data and tracking to provide objective outcomes for emergency care
services.
3. Develop or encourage standardized protocols and procedures for prehospital
and hospital treatment.
4. Support World Health Organization member states "with assessing and
improving their emergency care system."
5. Encourage member states to establish evidence-based intervention. (Adapted
from Anderson et al., 2012, p. 6)
Implications
Social Change
This research is intended to give governments and policymakers information to
evaluate the system of and control over prehospital systems with respect to traffic death.
This knowledge will be beneficial to countries in developing policies, funding, and
training endeavors that will provide cost-effective and beneficial results for their people. I
hope people injured in road traffic accidents will benefit from a prehospital response that
meets their immediate needs and reduces the burden placed on families from the loss of
loved ones, family structure, and income. The social change will be improved recovery
from road traffic crashes and reduced burden caused by road traffic deaths.
175
Conclusion
Based on the data from this study, personal wealth and positive standardized
governance indicators are the main determinants of death from road traffic incidents. The
staffing of the prehospital response within income and governance groupings had no
effect on the death rate per 100,000. Improving wealth and governance practices should
be the main goal for decision makers. The cost-effectiveness of the responder’s
credentials ought to be considered, especially when budgetary constraints are an issue.
Increased capacity in a country to provide for the welfare of its people needs to be at the
forefront of interventions aimed at reducing the burden of road traffic deaths.
176
References
adams4nchouse. (2012). Types of government explained: Republic vs. Democratic [Video
file]. Retrieved from
http://www.youtube.com/watch?v=cvZADC9dW3s&feature=c4-
overview&list=UUs-RLico7LHz6t893OOPw9g.
Adnet, F. & Lapostolle, F. (2004). International EMS systems: France. Resuscitation, 63,
7–9. doi: 10.1016/j.resuscitation.2004.04.001.
Aghababian, R. V., Levy, K., Moyer, P., Mottley, L., Ciottone, G.,Fretas, R., &
Minasian, A.( 1995). Integration of United States emergency medicine concepts
into emergency services in new independent states. Annals of Emergency
Medicine, 26(3), 368–375. doi:10.1016/S0196-0644(95)70088-9.
Aguilera, S., Cabañas, J. G., & Machado, A. (2010). Staffing of ambulances. In J. E.
Tintinalli, P. Cameron, & C. J. Holliman (Eds). EMS:A practice global handbook
(pp. 125– 132). Shelton, CT: People's Medical Publishing House: USA.
Alanazai, A. F.( 2012). Emergency medical services in Saudi Arabia: A study on the
significance of paramedics and their experience on barriers as inhibitors of their
efficiency. International Journal of Applied and Basic Medical Research, 2(1):
34–37. doi:10.4103/2229-516X.96803.
Albertsson, P., Björnstig, U., & Falkmer, T. (2003). The Haddon matrix, a tool for
investigating severe bus and coach crashes. International Journal of Disaster
Medicine, 1(2), 109-119. doi:10.1080/15031430310035272.
Al-Marhubi, F. A. (2005). Openness and governance: Evidence across countries. Oxford
177
Developmental Studies, 33(3&4), 453--471. doi:10.1080/13600810500199269.
Al-Shaqsi, S. Z. K. (2009). EMS in the Sultanate of Oman. Resuscitation, 80, 740–742.
doi:10.1016/j.resuscitation.2009.04.011.
Al-Shaqsi, S. (2010). Models of international emergency medical service (EMS)
Systems. Oman Medical Journal, 25(4), 320-323. doi:10.5001/omj.2010.92.
Ameratunga, S, Hijar, M., & Norton, R. (2006). Road-traffic injuries: Confronting
disparities to address a global health problem. Lancet, 367, 1-8.
doi.org/10.1016/S0140-6736(06)68654-6
Anbarci, N., Escaleras, M., & Register, C. A. (2009). Traffic fatalities: Does income
inequality create externality? Canadian Journal of Economics, 42(1), 244–266.
doi: 10.1111/j.1540-5982.2008.01507.x.
Anderson, P. D., Suter, R. E., Mulligan, T., Bodiwala, G., Razzak, J. A., & Mock, C.
(2012). World Health Assembly Resolution 60.22 and its importance as a health
care policy tool for improving emergency care access and availability globally.
Annals of Emergency Medicine, 60(1), 35-44.
doi:10.1016/j.annemergmed.2011.10.018.
Andrews, M., Hay, R., & Myers, J. (2010). Can governance indicators make sense?
Toward a new approach to sector-specific measures of governance. Oxford
Developmental Studies, 38 (4), 391–410. doi:10.1080/13600818 2010.524696.
Arnold, J. L. (1999). International emergency medicine and recent development of
emergency medicine worldwide. Annals of Emergency Medicine 33(1), 97–103.
http://www.cjem-online.ca/v3/n2/p109/ii

178
Arnold, J. L., Dickinson, G., Tsai, M., & Han, D. (2001). A survey of emergency
medicine in 36 countries. Canadian Journal of Emergency Medicine, 3(2), 109–
118. doi:10.1016/j.jemermed.2006.12.007.
Arnold, J. J., Song, H.S., & Chung, J.M. (1998). The recent development of emergency
medicine in South Korea. Annals of Emergency Medicine, 32(6), 730–735.
doi:10.1016/S0196-0644(98)70074-5.
Atkinson, A. B., & Brandolini, A. (2001). Promise and pitfalls in the use of" secondary"
data-sets: Income inequality in OECD countries as a case study. Journal of
Economic Literature, 39(3), 771-799. doi: 10.1080/00220380701384406.
Atubi, A. O. (2012) Determinants of road traffic accident occurrences in Lagos State:
Some lessons for Nigeria. International Journal of Humanities and Social
Sciences, 2(6/special issue), 252–259. http://www.ijhssnet.com/
Babajanian, B., & Hagen-Zanker, J. (2012). Social protection and social exclusion: An
analytical framework to assess the links. London, UK: Overseas Development
Institute.
Babbie, E. (2010). The practice of social research, 12th ed. Belmont, CA: Wadsworth.
Baker, S. P., O’Neill, B., Haddon Jr, W., & Long, W. B. (1974). The injury severity
score: a method for describing patients with multiple injuries and evaluating
emergency care. Journal of Trauma and Acute Care Surgery, 14(3), 187-196.
http://openabdomen.org/files/publication/Baker08091010101682753.pdf.
Baqir, M. & Ejaz, K. (2011). Role of pre-hospital care and ambulance services in
Karachi. Journal of the Pakistan Medical Association,61(12), 1167–1169.

179
https://www.researchgate.net/publication/221852721_Role_of_pre-
hospital_care_and_ambulance_services_in_Karachi.
Barnett, D. J., Balicer, R. D., Blodgett, D., Fews, A. L., Parker, C. L., & Links, J. M.,
(2005). The application of the Haddon matrix to public health readiness and
response planning. Environmental Health Perspectives, 113(5), 561-566.
doi:10.1289/ehp.7491.
Basu1, S., Andrews, J., Kishore, S., Panjabi, R., &. Stuckler, D (2012). Comparative
performance of private and public healthcare systems in low- and middle-income
countries: A systematic review. PLOS Medicine 9(6), e1001244. 1– 14.
doi:10.1371/journal.pmed.1001244
Bayram, J. D. (2007). Emergency medicine in Lebanon: Overview and prospects. Journal
of Emergency Medicine, 32(2), 217–222. doi:10.1016/j.jemermed.2006.12.007.
Bhalla, K., Harrison, J., Shahraz, S., & Fingerhut, L. (2010). Availability and quality of
cause-of-death data for estimating the global burden of injuries. Bulletin of the
World Health Organization, 88(11), 831. doi:10.2471/BLT.09.068809.
Bhalla, K., Harrison, J., Fingerhut, L., Shahraz, S., Abraham, J., Hsiu-Yeh, P., on behalf
of the GBD Injury Expert Group. (2011). The global injury mortality data
collection of the GBD-Injury Expert Group: a publicly accessible research tool.
International Journal of Injury Control and Safety Promotion, 18(3), 249-253.
Retrieved from www.globalburdenofinjuries.org.
Bishai, D., Quresh, A., James, P., & Ghaffar, A. (2006). National road casualties and
economic development. Health Economics, 15, 65–81. doi: 10.102/hec.1020

180
Black, J. J. M., & Davies, G. D. (2005). International EMS systems: United Kingdom.
Resuscitation, 64, 21–29. doi:10.1016/j.resuscitation.2004.10.004.
Bobrow, B. J., Clark, L. L., Ewy, G. A., Chikani, V., Sanders, A. B., Berg, R. A., ...
Kern, K. B. (2008). Minimally interrupted cardiac resuscitation by emergency
medical services for out-of-hospital cardiac arrest. JAMA: the journal of the
American Medical Association, 299(10), 1158-1165.
doi:10.1001/jama.299.10.1158.
Bodiwala, G. G. (2010). Forward. In J. E. Tintinalli, P. Cameron, & C. J. Holliman (Eds).
EMS:A practice global handbook (pp. 91–106). Shelton, CT: People's Medical
Publishing House: USA.
Bøtker, M. T., Bakke, S. A., & Christensen, E. F. (2009). A systematic review of
controlled studies: do physicians increase survival with prehospital treatment?
Scandinavian Journal of Trauma, Resuscitation and Emergency Medicine,
17(12),1–8. doi:10.1186/1757-7241-17-12.
Breshnahan, K. A. & Fowler, J. F. (1995). Emergency medical care in Turkey: Current
status and future directions. Annals of Emergency Medicine 26(3), 357–360.
doi:10.1016/S0196-0644(95)70086-2.
Brice, J. H., Brown, L. H., & Snooks, H. (2010). EMS research. In J. E. Tintinalli, P.
Cameron, & C. J. Holliman (Eds). EMS:A practice global handbook (pp. 91–
106). Shelton, CT: People's Medical Publishing House: USA.
Brown, M. D. (1999). Emergency medicine in Eritrea: Rebuilding after a 30-year war of
independence. American Journal of Emergency Medicine, 17, 412–413.

181
doi:10.1016/S0735-6757(99)90099-2.
Brown, L., & Devine, S. (2008). EMS & health promotion: a next step in the
collaboration between EMS and public health. EMS Magazine, 37(10), 110-114.
doi: 19464967
Bullard, M. J., Liaw, S-J., & Chen, J-C. (1996). Emergency medicine development in
Taiwan. Annals of Emergency Medicine, 28(5), 542–548. doi:10.1016/S0196-
0644(96)70118-X.
Burkholder, G. (2010). The Absolute Essentials of Sample Size Analysis: Or: You too
can be a statistical power guru. [PowerPoint slides]. Retrieved from
https://class.waldenu.edu/webapps/portal/frameset.jsp?tab_tab_group_id=_2_1&u
rl=%2Fwebapps%2Fblackboard%2Fexecute%2Flauncher%3Ftype%3DCourse%
26id%3D_4081152_1%26url%3D.
Canto, J. G., Zalenski, R. J., Ornato, J. P., Rogers, W. J., Kiefe, C. I., Magid, D., ... &
Barron, H. V. (2002). Use of emergency medical services in acute myocardial
infarction and subsequent quality of care observations from the national registry
of myocardial infarction. Circulation, 106(24), 3018-3023.
doi:10.1161/01.CIR.0000041246.20352.03.
Caruso, N., Chandra, A., & Kestler, A. (2011). Development of emergency medicine in
Botswana. Africa Journal of Emergency Medicine, 1, 108–112.
doi:10.1016/j.afjem.2011.08.002.
Causality Criteria. (n.d.). pdf retrieved August 19, 2013, from
www.southalabama.edu/.../Causality%20c...

182
Centers for Disease Control and Prevention. (2012). Announcements: World day of
remembrance for road traffic victims—November 18, 2012. Morbidity and
Mortality Weekly Report 16(45), 928.
http://www.cdc.gov/mmwr/preview/mmwrhtml/mm6145a8.htm.
Chakravarthy, B., Lotfipour, S., & Vaca, F. (2007). Pedestrian injuries: Emergency care
considerations. California Journal of Emergency Medicine, 8(1), 15–21.
http://sfxhosted.exlibrisgroup.com/waldenu?sid=google&auinit=B&aulast=Chakr
avarthy&atitle=Pedestrian+injuries:+emergency+care+considerations&id=pmid:2
0440388.
Charlton, S., O'Reilly, G., & Jones, T. (2011). Emergency care in developing nations:
The role of emergency nurses in Galle, Sri Lanka. Australasian Emergency
Nursing Journal, 14, 69–74. doi:10.1016/j.aenj.2011.03.004.
Chisholm, D. & Naci, H. (2009). Road traffic injury prevention: An assessment of risk
exposure and intervention cost-effectiveness in difference world regions. Geneva,
Switzerland: World Health Organization.
Choi, S., Hong, Y., Lee, S., Jung, I., & Kim, C. (2007). Prehospital and emergency
department care in South Korea. Canadian Journal of Emergency Medicine,9(3),
171–173. http://www.cjem-online.ca/v9/n3/p171.
Church, A. L. Plitponkarnpim, A. (1998). Emergency medicine in Thailand. Annals of
Emergency Mediciine, 32(1), 93–97. doi:10.1016/S0196-0644(98)70104-0.
Coats, T. J. & G. Davies. (2002). Prehospital care for road traffic casualties. British
Medical Journal, 324(7346) 1135–1138.

183
http://search.proquest.com.ezp.waldenulibrary.org/docview/204029273?accountid
=14872.
Connor, C., Averbug,D., & Miralles. M. (2010). Angola health system assessment 2010.
Bethesda,MD: Health Systems 20/20, Abt Associates Inc.
Creswell, J. W. (2009). Research design: Qualitative, quantitative, and mixed methods
approaches, (3rd ed). Los Angeles, CA: Sage.
Dao, M. Q. (2012). Government expenditure and growth in developing countries.
Progress in Development Studies, 12(1), 77–82. doi:
10.1177/146499341101200105.
Davis, K. E., Kingsbury, B., & Merry, S. (2012). Indicators as a Technology of Global
Governance. Law & Society Review,46(1), 71-104. doi:10.1111/j.1540-
5893.2012.00473.x.
Dick, W. F. (2003). Anglo-American vs. Franco-German emergency medical services
system. Prehospital and disaster medicine,18(01), 29-37.
doi.org/10.1017/S1049023X00000650.
Derlet, R. W. & Gratchev, S. (2000). Emergency medicine in Belarus. Journal of
Emergency Medicine, 18(3), 327–329. doi:10.1016/S0736-4679(99)00223-1.
Dib, J. E., Naderi, S., Sheriddan, I. A., & Alagappan, K. (2006). Analysis and
applicability of the Dutch EMS system in developing countries. Journal of
Emergency Medicine, 30(1), 111–115. doi:10.1016/j.jemermed.2005.05.014.
Easterlin, R. A. (2005). Diminishing marginal utility of income? Caveat emptor. Social
Indicators Research, 70(3), 243-255.

184
Eid, H. O., Lunsjo, K., Torab, F. C., & Abu-Zidan, F. M. (2008). Trauma research in the
United Arab Emirates: reality and vision. Singapore Medical Journal, 49(10),
827.
http://scholar.google.com/scholar?cluster=17017607574624524756&hl=en&as_s
dt=0,39
Ellis, D. Y. & Sorene, E. (2008). Magen David Adom: The EMS in Israel. Annals of
Emergency Medicine, 28(6), 648–651. doi:10.1016/j.resuscitation.2007.07.014.
Erickson, T. B., VanRooyen, M. J., Werbiski, P., Mycyk, M., & Levy, P. (1996).
Emergency medicine education intervention on Rwanda. Annals of Emergency
Medicine, 28(6), 648–651. doi:10.1016/S0196-0644(96)70088-4.
Ezenkwele, U. A,. Burnett-Garraway, C., & Green, G. B.( 2001). Emergency medicine in
the Bahamas. Annals of Emergency Medicine, 38(6)684–688.
doi:10.1067/mem.2001.118865
Fageda, X., Castillo Manzano, J. I., & Castro Nuño, M. (2014). Are traffic violators
criminals? Searching for answers in experiences of European countries. IREA–
Working Papers, 2014, IR14/015.
http://diposit.ub.edu/dspace/bitstream/2445/57511/1/IR14-015_Castillo.pdf
Fares, S., Zubaid, M., Al-Mahmeed, W., Ciottone, G., Sayah, A., Suwaidi, J. A. . .
Alsheikh-Ali, A. A. (2011). Utilization of emergency medical services by patients
with acute coronary syndromes in Arab Gulf states. Journal of Emergency
Medicine, 41(3)310–316. doi:10.1016/j.jemermed.2010.05.002.
Fischer, M., Kamp, J, Garcia=Castrillo Riesgo, L., Roberson-Steel, I., Overton, J.

185
Ziemann, A. . . .for the EED Group. (2011). Comparing emerency medical service
systems: A project of the European Emergency Data (EED) project.
Resuscitation, 82, 285–293. doi:10.1016/j.resuscitation.2010.11.001.
Forbes, M., Hill, C. J., & Lynn, L. E. (2007). The logic of governance in health care
delivery: An analysis of the empirical literature. Public Management Review,
9(4), 453–477. doi: 10.1080/14719030701726457.
Fu tat, E.L, Chan, K. H., & VanRooyen, M. J. (1998). Emergency medicine in Hong
Kong. Annals of Emergency Medicine, 32(1), 83–85. doi:10.1016/S0196-
0644(98)70102-7.
Gaitan, M., Mendez, W., Sirker, N. E., & Green, G. B. (1998). Growing pains: Status of
emergency medicine in Nicaragua. Annals of Emergency Medicine, 31(3), 402–
405. doi:10.1016/S0196-0644(98)70355-5.
Garcia-Rosas, C. & Iserson, K. V. (2006). Emergency medicine in Mexico. Journal of
Emergency Medicine, 31(4), 441–445. doi:10.1016/j.jemermed.2006.05.024.
Gates, D., Gillespie, G., Smith, C., Rode, J., Kowalenko, T., & Smith, B. (2011). Using
action-research to plan a violence prevention program for emergency
departments. Journal of Emergency Nursing, 37(1), 32–39.
doi:10.1016/j.jen.2009.09.013.
Gaygisiz, E. (2010). Cultural values and governance quality as correlates of road traffic
fatalities: A national level analysis. Accident Analysis and Prevention, 42 1894–
1901. doi 10.1016/jaap.2010.05.010.
Gaygisiz, E. (2009b). Economic and cultural correlates of road traffic accident fatality

186
rates in OECD countries. Perceptual and Motor Skills, 109, 531–545. doi:
10.2466/PMS.109.2.531-545.
Gielen, A. C., McDonald, E. M., Gary, T. L., & Bone, L. R. (2008). Using the Precede-
Proceeded model to apply health behavior theories(pp.408–438). In K. Glanz, B.
K. Rimer, & K. Viswanath, (eds.) Health Behavior (4th ed). San Francisco, CA:
Jossey-Bass.
Global Media. (2013). ExpatArrivals: Healthcare in Angola. Retrieved from
http://www.expatarrivals.com/angola/healthcare-in-angola.
Gofin, R. (2005). Preparedness and response to terrorism: A framework for public health
action. European Journal of Public Health 15(1), 100-104. doi:
10.1093/eurpub/cki127.
Gomes, R., Araujo, R., Soares-Oliveira, M., & Pereira, N. (2004). International EMS
systems: Portugal. Resuscitation, 63, 257–260.
10.1016/j.resuscitation.2004.04.013.
Gondocs, Z., Olah, A., Marton-Simora, Nagy, G., Schaefer, J., & Bethlem, J. (2010).
Prehospital emergency care in Hungry: What can we learn from the past? Journal
of Emergency Medicine, 39(4), 512–518. doi:10.1016/j.jemermed.2009.09.029.
Gradstein, M. (2004). Governance and growth. Journal of Development Economics,
73(2), 505-518. doi:10.1016/j.jdeveco.2003.05.002
Graham, C. A. & Rainer, C. T. H. (2009). EMS system in Hong Kong. Resuscitation, 80,
736–739. doi:10.1016/j.resuscitation.2009.04.018.
187
Graves, S (2011, November 11). Track, measure, report. Retrieved November 30, 2014,
from http://scottgroves.com/marketing/track-measure-report/.
Green, L.W. (1974). Toward cost-benefit evaluations of health education: Some
concepts, methods, and examples. Health Education Monographs: Proceedings of
the Will Rogers Conference on Heath Education, 2(Supplement 1), 34–64.
http://files.eric.ed.gov/fulltext/ED437722.pdf.
Green, L. W. & Rabinowitz, P. (nd). Chapter 2. Some other models for promoting
community health: Section 2., PRECEDE/PROCEDE. The Community Tool Box.
Retrieved March 2, 2012 from
http://ctb.ku.edu/en/tablecontents/section_1008.aspx.
Grimm, M. & Treibich, C. (2012). Determinants of road traffic crash fatalities across
Indian States. The Hague, Netherlands: Institute of Social Studies.
Grimmelikhuijsen, S. (2011). Being transparent or spinning the message? An experiment
into the effects of varying message content on government trust. Information
Polity, 16, 35 – 49. doi: 10. 3233/IIP20110222.
Grindle, M. S. (2004). Good enough governance: poverty reduction and reform in
developing countries. Governance, 17(4), 525-548. doi:10.1111/j.0952-
1895.2004.00256.x.
Guha-Sapir, D. (2005). What have we learned? Capacity building for health responses in
disasters. Prehospital and Disaster Medicine, 20(06), 480-482.
http://www.unisdr.org/files/1922_VL206123.pdf.
Ha, E. (2012). Globalization, Government Ideology, and Income Inequality in
188
Developing Countries. Journal of Politics, 74(2), 541-557. doi:
0.1017/S0022381611001757.
Haas, B. & Nathens, A. B. (2008). Pro/con debate: Is the scoop and run approach the
best approach to trauma services organizations? Critical Care, 28(5), 1–11.
doi:10.1186/cc6980.
Haddon Jr, W. (1968). The changing approach to the epidemiology, prevention, and
amelioration of trauma: the transition to approaches etiologically rather than
descriptively based. American Journal of Public Health and the Nations Health,
58(8), 1431-1438.
http://sfxhosted.exlibrisgroup.com/waldenu?sid=google&auinit=W&aulast=Hadd
on+Jr&atitle=Advances+in+the+epidemiology+of+injuries+as+a+basis+for+publ
ic+policy.&id=pmid:7422807.
Haddon Jr, W. (1972). A logical framework for categorizing highway safety phenomena
and activity. Journal of Trauma-Injury, Infection, and Critical Care,12(3), 193-
207.
http://journals.lww.com/jtrauma/Citation/1972/03000/A_LOGICAL_FRAMEWO
RK_FOR_CATEGORIZING_HIGHWAY.2.aspx
Haddon Jr, W. (1980). Advances in the epidemiology of injuries as a basis for public
policy. Public Health Reports, 95(5), 411–421.
http://sfxhosted.exlibrisgroup.com/waldenu?sid=google&auinit=W&aulast=Hadd
on+Jr&atitle=Advances+in+the+epidemiology+of+injuries+as+a+basis+for+publ
ic+policy.&id=pmid:7422807.
189
Haghparas-Bidgoli, H., Hasselberg, M., Khankeh, H., Khorani-Zavareh, D. & Johansson,
E.(2010). Barriers and facilitators to provide effective pre-hospital trauma care for
road traffic injury victims in Iran: A grounded theory approach. Emergency
Medicine, 10(20), 1–11. http://www.biomedcentral.com/1471-227X/10/20.
Haneawinckel, R., Jongman, H. P., Wallis, L. A., & Mulligan, T. M. (2010). Emergency
medicine in Paarl, South Africa: A cross-sectional descriptive study. International
Journal of Emergency Medicine, 3, 143–150. doi 10.1007/s12245-010-0185-9.
Health Statistics and Informatics Department. (2011). Causes of Death 2008 Summary
Tables. Geneva, Switzerland: World Health Organization,
http://www.who.int/evidence/bod.
Henry, J. A., & Reingold, A. L. (2012, abstract). Prehospital trauma systems reduce
mortality in developing countries: A systematic review and meta-analysis.
Journal of Trauma and Acute Care Surgery, 73(1), 261–268. doi:
10.1097/TA.0b013824bde1e.
Heston, A., Summers, R., & Aten, B. (2009). Penn World Table Version 6.3. Center for
International Comparisons of Production, Income and Prices at the University of
Pennsylvania, Retrieved August 2, 2013 from
http://datacentre.chass.utoronto.ca/pwt/.
Himmelfarb Health Sciences Library. (2011). Study design 101: Randomized controlled
trial. Retrieved January 24, 2014, from
http://www.gwumc.edu/library/tutorials/studydesign101/rcts.html.
Hisamuddin, N.A.R. N, Hamzah, M. S., & Holliman, C. J. (2007). Prehospital emergency

190
medical services in Malaysia. Journal of Emergency Mediciine, 32(4), 415–421.
doi:10.1016/j.jemermed.2006.08.021.
Hladki, W. Andres, J., Trybus, M., & Drwila, R. (2007). Emergency medicine in Poland.
Resuscitation, 75, 213–218. doi:10.1016/j.resuscitation.2007.06.005.
Holliman, C. J. (2010). Standard EMS terms and definitions In J. E. Tintinalli, P.
Cameron, & C. J. Holliman (Eds). EMS:A practice global handbook (pp. 51–70).
Shelton, CT: People's Medical Publishing House: USA.
Holliman, C. J., Mulligan , T.M., Suter, R. E., Cameron, P., Wallis, L., Andeson, &
Clem, K. (2011)The efficacy and value of emergency medicine: a supportive
literature review. International Journal of Emergency Medicine.4 (44), 1–10.
http://www.intjem.com/content/4/1/44.
Hung, K. K. C., Cheuung, C. S. K., Rainer, T. H., & Graham, C. A. (2009). EMS
systems in China. Resuscitation, 80, 732–735.
doi:10.1016/j.resuscitation.2009.04.016.
Hsiung, T-H, Olejnik, S., & Huberty, C. J. (1994). Comment on a Wilcox Test statistic
for comparing means when variances are unequal.Journal of Educational and
Behavioral Statistics (Impact Factor: 1.07).19(2):111-118.
doi: 10.3102/10769986019002111.
Institute for Work and Health., (2009). What researchers mean by cross-sectional vs.
longitudinal studies. Retrieved October 19, 2014, from
hppt://www.iwh.on.ca/wrmb/cross-sectional-vs-longitudinal-studies.
Jakubaszko, J., Hori, S., Khruekarnchana, P. & Kanchanasut, S. (2010). EMS

191
interactions with governments. In J. E. Tintinalli, P. Cameron, & C. J. Holliman
(Eds). EMS:A practice global handbook (pp. 51–70). Shelton, CT: People's
Medical Publishing House: USA.
Jalilian, H., Kirkpatrick, C., & Parker, D. (2007). The impact of regulation on economic
growth in developing countries: A cross-country analysis. World
Development, 35(1), 87-103. doi:10.1016/j.worlddev.2006.09.005
Jennings, P. A. (2010). EMS role in public health and public education. In J. E.
Tintinalli, P. Cameron, & C. J. Holliman (Eds). EMS:A practice global handbook
(pp. 79 – 89). Shelton, CT: People's Medical Publishing House: USA.
Jones, A. P. & Bentham, G. (1995). Emergency medical service accessibility and
outcome from road traffic accidents. Public Health, 109(3), 169-177.
doi:10.1016/S0033-3506(05)80049-6.
Karen. (2010).When unequal sample sizes are and are not a problem in ANOVA. The
Analysis Factor. Retrieved September 7, 2014, from
http://www.theanalysisfactor.com/when-unequal-sample-sizes-are-and-are-not-a-
problem-in-anova/comment-page-1/#comments/
Kaufmann, D., Kraay, A., & Mastruzzi, M. (2013).Worldwide Governance Indicators.
Washington, DC.: World Bank.
Kaufmann, D., Kraay, A., and Zoido-Lobatón, P. (2002). ‘Governance matters II –
updated indicators for 2000/01’, World Bank Policy Research Department
Working Paper No. 2772, Washington D.C.: World Bank.
Kazzi, A. A., & Jabr, N. (2010). EMS and public services: Lessons learned in Lebanon.

192
In J. E. Tintinalli, P. Cameron, & C. J. Holliman (Eds). EMS:A practice global
handbook (pp. 71–78) Shelton, CT: People's Medical Publishing House: USA.
Khan, M. (2007). Governance, Economic Growth and Development since the 1960s. New
York: United Nations, Department of Economics and Social Affairs. DESA
Working Paper No. 54 ST/ESA/2007/DWP/54
Khankeh, H. R., Khorasani-Zavareh, D., & Masoumi, G. (2012). Why the prominent
improvement in prehospital medical response in Iran couldn’t decrease the
number of death related road traffic injuries. Journal of Trauma Treatment, 1,
e103. http://omicsgroup.org/journals/2167-1222/2167-1222-1-e103.pdf.
Kickbusch, I., Hwin, W., & Silberschmidt, G. (2010). Addressing global health
governance challenges through a new mechanism: The proposal for a committee
C of the World Health Assembly. Journal of Law, Medicine, & Ethics, (fall),
550–563. doi.org.ezp.waldenulibrary.org/10.1111/j.1748-720X.2010.00511.x.
Kirigia, J.& Kirigia, D. (2011). The essence of governance in health development.
Archives of Medicine, 4 (1), 11 – 23. doi: 10. 1186/1755 – 4 – 11.
http://www.biomedcentral.com/content/pdf/1755-7682-4-11.pdf.
Kirves, H, Handolin, L., Niemela, M., Pitkaniem, J., & Randell, T. (2010). Paramedics'
and pre-hospital physicians' assessment of anatomic injury in trauma patients: A
cohort study. Scandinavian Journal of Trauma, Resuscitation, and Emergency
Medicine, 18. http://www.sjtrem.com/content/18/1/60.
Klomp, J., & de Haan, J. (2008). Effects of governance on health: A cross-national
analysis of 101 countries. Kyklos, 61(4), 599-614. doi:10.1111/j.1467-

193
6435.2008.00415.x.
Knack, S. and Keefer, P. (1995). ‘Institutions and economic performance: Empirical tests
using alternative measures of institutions’, IRIS Working Paper #109,
Washington, D.C.: IRIS.
Kobusingye, O. C., Hyder, A. A., Bishai, D., Hicks, E. R., Mock, C., & Joshipura M.
(2005). Emergency medical systems in low- and middle-income countries:
recommendations for action. Bulletin of the World Health Organization, 83,626-
631. http://www.who.int/bulletin/volumes/83/8/en/.
Kooiman, J. (1999). Social-political governance. Public Management, 1(1), pp. 67 – 92.
doi:10.1080/14719037800000005.
Kopitis, E. A. (2004). Traffic Fatalities and Economic Growth (University of Maryland,
College Park). Drum Library 190 p. Retrieved from
http://drum.lib.umd.edu/bitstream/1903/1982/1/umi-umd-1934.pdf.
Koziol, N. & Arthur, A. (n.d.). An Introduction to secondary data analysis. Author:
Children, Youth, Families and schools. Retriever Febuary 14, 2014, from
http://r2ed.unl.edu/presentations/2011/RMS/120911_Koziol/120911_Koziol.pdf.
Krug EG, Sharma GK, Lozano R. (2000). The global burden of injuries. American
Journal of PublicHealth, 2000, 90(4), 523–526. doi: 10.2105/AJPH.90.4.523.
Krϋger, A. J, Skogvoll, E., Castrén, M., Kurola, J., Lossius, H. M., & The ScanDoc Phase
1a Study Group. (2010). Scandinavian pre-hospital physician-manned emergency
medical services: Same concept across borders? Resuscitation, [Article in Press]
doi:10.1016/j.resuscitation.2009.12.019.

194
Lamarre, M. C. (2012).Foreword. In D. V. McQueen, M. Wismar, V. Lin, C. M. Jones,
and M. Davies (eds). Intersectoral governance for health in all policies:
Structures, actions, and experiences (pp. vii–viii). Copenhagen, Denmark: World
Health Organization, European Observatory on Health Systems and Policy.
LaMorte, W. W. (2013). Prospective versus retrospective cohort studies. Retrieved
January 24, 2014 from http://sphweb.bumc.bu.edu/otlt/MPH-
Modules/EP/EP713_CohortStudies/EP713_CohortStudies2.html.
Lane, D.M.( n.d.) Unequal sample sizes. Retrieved October 19,2014, from
onlinestatbook.com/2analysis_of_variance/unequal.html.
Langhella, A., Lossius, H. M., Silfvast, T., Björnsson, H. M., Lippert, F. K., Ersson, A.
E., & Søreide, E. (2004). International EMS: The Nordic Countries. Resuscitation
61, 9–21. doi:10.1016/j.resuscitation.2003.12.008.
La Porta, R., Lopez-de-Silanes, F., Shleifer, A., & Vishny, R. (1999). The quality of
government. Journal of Law, Economics, and organization, 15(1), 222-279.
doi:10.1016/S0304-405X(00)00065-9.
Lasseter, J. A., Pyles, J. P., & Galijasevic (1997). Emergency medicine in Bosnia and
Herzegovina. Annals of Emergency Medicine, 30(4), 527–530.
doi:10.1016/S0196-0644(97)70014-3.
Lateef, F.( 2006). The emergency medical services in Singapore. Resuscitation, 68, 323–
328. doi:10.1016/j.resuscitation.2005.12.007.
Law, T. H. (2009). The effects of political governance, policy measures and economic
growth on the Kuznets relationship in motor vehicle crash deaths (Doctoral

195
dissertation, Department of Civil and Environmental Engineering, Imperial
College London, United Kingdom).
Lee, A., Garner, A., Fearnside, M., & Harrison, K. (2003). Level of prehospital care and
risk of mortality in patients with and without severe blunt head injury.Injury,
International Journal of the Care of the Injured, 34, 815–819. doi:
10.1016/Soo2o-1383(02)00395-9.
Lendrum, R. A. & Lockey, D. J. (2012). Trauma system development. Anaesthesia,
68(Suppl.1), 30–39. Doi: 10.1111/anae.12049.
Lewis, M. (2006). Governance and corruption in public health care systems (No. 78).
Washington, DC: Center for Global Development.
Liebowitz, S., & Taigman, M. (2008). Advocates for health: Emed Health turns to EMS
for patient education, disease management. EMS Magazine, 37(10), 115.
doi.org/10.1016/s1081-4507(08)70010-x .
Lin, V., Jones, C. M., Symnot, A., & Wismar, M. (2012). Synthesizing the evidence:
How governance structures can trigger governance actions to support health in all
policies. In D. V. McQueen, M. Wismar, V. Lin, C. M. Jones, & M. Davies, (eds.)
Health in All Policies: Structure, actions and experiences. Copenhagen,
Denmark: World Health Organization.
Maio, R. F., Garrison, H. G., Spaite, D. W., Desmond, J. S., Gregor, M. A., Cayten, C., ...
& Stiell, I. G. (1999). Emergency medical services outcomes project I (EMSOP
I): prioritizing conditions for outcomes research. Annals of Emergency Medicine,
33(4), 423-432. doi:10.1016/S0196-0644(99)70307-0.

196
Mathers, C. D. & Loncar, D. (2006). Projections of global mortality and burden of
disease from 2002 to 2030. PLOS Medicine 3(11): e442.
doi:10.1371/journal.pmed.0030442.
Mayne, J. (2008). Contribution analysis: An approach to exploring cause and effect.
ILAC Brief, 16, 1-4. doi:10.1016/j.stueduc.2014.03.003.
McKenzie, J. F., Pinger, R. R., & Kotecki, J. E. (2008) An Introduction to Community
health (6th ed.).Sudbury, MA: Jones and Bartlett.
McQueen, D. V., Wismar, M., Lin, V., & Jones, C. M. (2012). Introduction: Health in
all policies, the social determinants of health and governance. In D. V. McQueen,
M. Wismar, V. Lin, C. M. Jones, & M. Davies (eds). Intersectoral governance for
health in all policies: Structures, actions, and experiences (pp. 3–21).
Copenhagen, Denmark: World Health Organization, European Observatory on
Health Systems and Policy. ISBN 978 92 890 0281.
http://www.euro.who.int/__data/assets/pdf_file/0005/171707/Intersectoral-
governance-for-health-in-all-policies.pdf.
Meisel, Z., Hargarten, S., & Vernick, J. (2008). Addressing prehospital patient safety
using the science of injury prevention and control. Prehospital Emergency Care,
12, 411-416. doi: 10.1080/1090312082290851.
Measured Progress (nd). What is generalizability theory? Retrieved from
http://www.measuredprogress.org/learning-tools-statistical-analysis-what-is-
generalizability.
Meisel, Z. F., Hargarten, S., & Vernick, J. (2008). Addressing prehospital patient safety

197
using the science of injury prevention andcontrol. Prehospital Emergency Care,
12(4), 411-416. doi: 10.1080/10903120802290851.
Mock, D., Kobusingye, O., Vu Anh, L., Afukaar, F., & Arreola-Risa, C. (2005). Human
resources for the control of road traffic injury. Bulletin of the World Health
Organization, 83, 294–300. http://www.who.int/bulletin/volumes/83/4/en/.
Mock, C., Quansah, R., Krishnan, R., Arreola-Risa, C., & Rivara, F. (2004).
Strengthening the prevention and care of injuries worldwide. Lancet, 363(9427),
2172-2179. doi:10.1016/S0140-6736(04)16510-0.
Moeller, D. W. (2005). Environmental health (3rd ed.). Cambridge, MA: Harvard Press.
Monzón, Peralta, & Iserson. (2010). Emergency medicine in Argentina: Astepwise
process to specialty recognition. Journal of Emergency Medicine, 38(3). 395–400.
doi:10.1016/j.jemermed.2009.08.015.
Mencl, F. & Puppala, N. (2010). Historical timeline of international events. In J. E.
Tintinalli, P. Cameron, & C. J. Holliman (Eds). EMS:A practice global handbook
(pp. 19–37). Shelton, CT: People's Medical Publishing.
Mrazova, I., & Dagli, C. H. (2008). Semantic clustering of the World Bank data.
International Journal of General Systems, 37(4), 417-442.
doi:10.1080/03081070701210345.
Nagata, T., Takamori, A., Kimura, Y., Hashizume, M., & Nakahara, S. (2011). Trauma
center accessibility for road traffic injuries in Hanoi, Vietnam. Journal of Trauma
Management & Outcomes,5(11), 1–7. doi: 10.1186/1752-2897-5-11.
Nathens, A. B., Jurkovich, G. J., Rivara, F., & Maier, R. V.(2000). Effectiveness of state

198
trauma systems in reducing injury-related mortality: A national evaluation.
Journal of Trauma-Injury Infection and Critical Care, 48(1), 25.
http://journals.lww.com/jtrauma/Abstract/2000/01000/A_Functional_Recovery_S
core_for_Elderly_Hip.5.aspx.
Neal, J. W. & Neal, Z. P. (2011). Power as a structural phenomenon. American Journal
of Community Psychology, 48, 157–167. doi: 10.1007/s10464-010-9356-3.
Nielsen, k., Mock, C., Joshipura, M. Rubiano, A. M., Zakariah, A. & Rivara, F. (2012).
Assessment of the status of prehospital care in 13 low-and middle-income
countries. Prehospital Emergency Care, 16(3), 381–389.
doi:10.3109/10903127.2012.664245.
Noland, R. B., & Quddus, M. A. (2004). Improvements in medical care and technology
and reductions in traffic-related fatalities in Great Britain. Accident Analysis and
Prevention, 36(1), 103-113. doi:10.1016/S0001-4575(02)00132-X.
Nwabuzor, A. (2005).Corruption and development: New initiatives in economic openness
and strengthened rule of law. Journal of Business Ethics, June, Part 2, 121–138.
doi10.1007/s10551-005-3402-3.
Olafsdottir ,A. E., Reidpath, D. D., Pokhrel, S., & Allotey, P. (2011). Health systems
performance in sub-Saharan Africa: governance, outcome and equity. Public
Health, 11. http://www.biomedcentral.com/1471-2458/11/237.
O'Neill, B., & Mohan, D. (2002). Reducing motor vehicle crash deaths and injuries in
newly motorising countries. British Medical Journal, 324(7346), 1142.
http://sfxhosted.exlibrisgroup.com/waldenu?sid=google&auinit=B&aulast=O%27

199
Neill&atitle=Reducing+motor+vehicle+crash+deaths+and+injuries+in+newly+m
otorising+countries&id=pmid:12003889.
O'Reilly, G. (2010). Financing of EMS systems and cost-effectiveness. In J. E. Tintinalli,
P. Cameron, & C. J. Holliman (Eds). EMS:A practice global handbook (pp. 285–
292). Shelton, CT: People's Medical Publishing House: USA.
O'Reilly, G. & Fitzgerald, M. (2010). Structures of different national EMS systems. In J.
E. Tintinalli, P. Cameron, & C. J. Holliman (Eds). EMS:A practice global
handbook (pp. 39–49). Shelton, CT: People's Medical Publishing House: USA.
Organization for Economic Co-operation and Development. (2002). Glossary of
Statistical Terms: GINI Index. Retrieved July 20, 2013 from
http://stats.oecd.org/glossary/detail.asp?ID=4842. Last update February 16, 2006.
Oseghale, B.D. (2010). Good governance in developing and emerging host countries and
reinvestment of retained earnings by United States multinationals: A pooled
cross-sectional time-series analysis. Journal of International Business Research,
9(2), 1–19.
http://alliedacademies.org/Publications/Papers/JIBR%20Vol%209%20No%202%
202010%20p%201-19.pdf.
Osei-Ampofo, M., Oduro, G., Otrng, R., Zakariah, A., Jacquet, G., & Donkor, P. (2013).
The evolution and current state of emergency care in Ghana. African Journal of
Emergency Medicine 3, 52-58. http://dx.doi.org/10.1016/j.afjem.2012.11.006.
Osterwalder, J. J. (1998). Emergency medicine in Switzerland. Emergency medicine in
Switzerland. Annal of Emergency Medicine 32(2), 243–247. doi:10.1016/S0196-

200
0644(98)70144-1.
O’Sullivan, B. (2013) Nine things good copyeditors do. (blogpost).
http://jacklimpert.com/2013/01/nine-things-good-copyeditors-do.
Page, C. (2013). Analysis of emergency medical systems across the world (Doctoral
dissertation, Worchester Polytechnic Institute).
Papaspyroua, E., Setzisb, D., Grosomanidisc, V., Manikisd, D., Boutlise, D., & Ressosf,
C. (2004). International ENS systems: Greece. Resuscitation, 63, 255–259.
doi:10.1016/j.resuscitation.2004.06.009.
Partridge, R. A. (1998). Emergency medicine in West Kazakhstan. Annals of Emergency.
Medicine, 32(4), 493–497. doi:10.1016/S0196-0644(98)70180-5.
Peden, M., McGee, K., & Sharma, G. (2002). The injury chart book: a graphical
overview of the global burden of injuries. Geneva: World Health Organization
Peden, M, Scurfield, R. Sleet, D., Mohan, D., Hyder, A. A., Jarawan, E., & Mather, C.
(Eds.). (2004).World report on road traffic injury prevention. Geneva: World
Health Organization.
Peralta, P. G. & Sinon, J. B. (1995). Emergency medicine in the Philippines. Annals of
Emergency Medicine, 26(6), 743–745. doi:10.1016/S0196-0644(95)70048-X.
Pillai, V. K., Díaz, H. L., Basham, R. E., & Ramírez-Johnson, J. (2011). Democratic
attitudes and social capital in Latin America. International Social Work, 54(6),
767-779. doi:10.1177/0020872811403518.
Pitt, E. & Pusponegro, A. (2005). Prehospital care in Indonesia. Emergency Medicine
Journal, 22, 144– 147. doi: 10.1136/emj.2003.007757.

201
Pratte, D. (1998). Road to ruin: Road traffic accidents in the developing world. NEXUS
(13), 46– 62. Retrieved from
http://digitalcommons.mcmaster.ca/cgi/viewcontent.cgi?article=1109&context=ne
xus&sei-
redir=1&referer=http%3A%2F%2Fwww.google.com%2Furl%3Fsa%3Dt%26rct
%3Dj%26q%3Ddeterminants%2520of%2520worldwide%2520traffic%2520fatali
ties%26source%3Dweb%26cd%3D14%26ved%3D0CFYQFjADOAo%26url%3
Dhttp%253A%252F%252Fdigitalcommons.mcmaster.ca%252Fcgi%252Fviewco
ntent.cgi%253Farticle%253D1109%2526context%253Dnexus%26ei%3DTj6sT9
unOoLt0gGn48mfDA%26usg%3DAFQjCNELiGyd9YKJNlxUDY8yThenFZFm
bg%26sig2%3DigsV6xcl3ZqrWKiNrpAb6g#search=%22determinants%20world
wide%20traffic%20fatalities%22.
Predavec. (2010 English). Quality improvement of health care services in Croatian
emergency medicine. Acta Medicine Croatica, 64(5), 404–414.
https://mef.hr/meddb/slike/pisac19/file5358p19.pdf.
Qadri, H. M. U. D. (2012). An analysis of trade flows among ECO member countries and
potential for a free trade area (Doctoral dissertation, Victoria University).
Queipo de Llano, E., Mantero Ruiz, A., Sanchez Vicioso, P., Bosca Crespo, A.,
Carpintero Avellanda, J. L., & de la Torre Prado.( 2003). Trauma care systems in
Spain.. International Journal of the Care of the Injured, 34, 709–719.
doi:10.1016/S0020-1383(03)00154-2.
Quick, J. (2011) R tutorial series: Two-way ANOVA with unequal sample sizes. R-

202
Blogger (Blog post). http://www.r-bloggers.com/r-tutorial-series-two-way-anova-
with-unequal-sample-sizes/.
R Core Team. (2013) R: A Language and Environment for Statistical Computing.
Vienna, Austria: R Foundation for Statistical Computing. http://www.R-
project.org.
Rainer, T., Graham, C., & Cattemole, G. (2010). Training programs and standardized
curricula. In J. E. Tintinalli, P. Cameron, & C. J. Holliman (eds). EMS:A practice
global handbook (pp. 143– 152). Shelton, CT: People's Medical Publishing
House: USA.
Ramalanjaona, G. (2008). Emergency medicine in the Comoros Islands. Resuscitation 77,
18–20. doi:10.1016/j.resuscitation.2007.07.033.
Ramalanjaona, G. & Brogan, G. X. (2009). EMS in Mauritius. Resuscitation, 80, 163–
164. doi:10.1016/j.resuscitation.2008.10.006.
Ramanujam, P., & Aschkenasy, M. (2007). Identifying the need for pre-hospital and
emergency care in the developing world:A case study in Chennai, India. Journal
of the Association of Physicians India, 55(5), 491–495.
https://www.researchgate.net/publication/5936532_Identifying_the_need_for_pre
hospital_and_emergency_care_in_the_developing_world_a_case_study_in_Chen
nai_India.
Razzak, J. A., Hyder, A. A. , Akhtar, T., Khan, M., &Khan, U. R. (2008). Assessing
emergency medical care in low income countries: A pilot study from Pakistan.
Emergency Medicine, 6(8), 1–8. doi:10.1186/1471-227X-8-8.

203
Razzak, J., & Kellermann, A. (2002). Emergency medical care in developing countries: is
it worthwhile? Bulletin Of The World Health Organization, 80(11), 900-905.
http://www.who.int/bulletin/archives/volume80_11/en/.
Regans, R. E. & Zuckerman, E. W. (2008). Why knowledge does not equal power: The
network redundancy trade-off. Industrial and Corporate Change, 17(5), 903–944.
doi:10.1093/icc/dtn036.
Reeve, C., Pashen, D., Mumme, H., S, & Cheffins, T. (2008). Expanding the role of
paramedics in northern Queensland: an evaluation of population health training.
Australian Journal of Rural Health, 16(6), 370-375. doi: 10.1111/j.1440-
1584.2008.01018.x.
Repetto, C., Casgaranda, I, Overton, D., & Gail, G. (1998). Emergency Medicine: The
Italian experience. Annals of emergency Medicine, 32(2), 248–252.
doi:10.1016/S0196-0644(98)70145-3.
Research Limitations, n.d. limitations of correlational studies. Retrieved from
www.psychologyandsociaety.com/researchlimitations.html.
Richards, J. R. (1997). Emergency medicine in Cuba: Report from a country in isolation.
Americian Journal of Emergency Medicine. 15(4), 424–426. doi:10.1016/S0735-
6757(97)90143-1.
Rigobon, R. & Rodrik, D. (2005). Rule of law, democracy, openness, and income:
Estimating the interrelationships. Economics of Transition, 13 (3), 355 – 364.
doi.org/10.3386/w10750 .
Roberts, D. J., Das, D., Mercado, M., Vis, C., Kortbeek, J. B., Kirkpatrick, A. W., & Ball,

204
C. G. (2014). A Booming Economy Means a Bursting Trauma System:
Association Between Hospital Admission for Major Injury and Indicators of
Economic Activity in a Large Canadian Health Region. The American Journal of
Surgery, 207(5):653-7; discussion 657-8. doi: 10.1016/j.amjsurg.2013.12.011.
Rolison, J. J., Hewson, P. J., Hellier, E., & Hurst, L. (2012). Risk of high-powered
motorcycles among younger adults. American Journal of Public Health, 103(3),
568–571. doi: 10.2105/AJPH.2012.300827.
Rosenblatt, V. (2012). Hierarchies, Power Inequalities, and Organizational Corruption.
Journal of Business Ethics, 111(2), 237-251. doi:10.1007/s10551-012-1204-y.
Roudsari, B. S, Nathens, A. B., Cameron, P., Civil. I, Gruen, R. L., Koepsell, T. D. . .
Rivara, F. P. (2007). International comparison of prehospital trauma care systems.
Injury, 38,993-1000. doi:10.1016/j.injury.2007.03.028.
Ruda, N. (2004). Openness, welfare spending, and in equity in the developing world.
International Studies Quarterly, 48, 683 – 709. doi:10.1111/j.0020-
8833.2004.00320.x
Runyan, C. W. (1998). Using the Haddon matrix: Introducing the third dimension. Injury
Prevention, 4, 302–307. doi:10.1136/ip.4.4.302.
Runyan, C. W. (2003). Introduction: back to the future—revisiting Haddon’s
conceptualization of injury epidemiology and prevention. Epidemiologic Reviews,
25(1), 60-64. doi: 10.1093/epirev/mxg005.
Runyan, C. W. & Yonas, M. (2008). Conceptual frameworks for developing and
comparing approaches to improve adolescent motor-vehicle safety. American
205
Journal of Preventative Medicine , 35(3S), S336–S342. doi:
10.1016/.amepre.2008.06.019.
Sagor, G. (2000). Chapter 1. What is action research? Guiding School Improvement with
Action Research retrieved April 22, 2014, from
http://www.ascd.org/publications/books/100047/chapters/What-Is-Action-
Research%C2%A2.aspx
Sanchez-Mangas, R., Garcia-Ferrer, A., de Juan, A., & Arroyo, A. M. (2010). The
probability of death in road traffic accidents. How important is a quick medical
response? Accident Analysis and Prevention, 42, 1048–1056.
doi:10.1016/j.aap.2009.12.012.
Sarlin, E. & Alagappan, K. (2010). International EMS development. In J. E. Tintinalli, P.
Cameron, & C. J. Holliman (Eds). EMS:A practice global handbook (pp. 9– 18).
Shelton, CT: People's Medical Publishing House: USA.
Sayer, A. (1992). Methods in Social Science: A Realist Approach, 2nd Ed. London:
Routledge.
Schneiderman, L. J., Gilmer, T., & Teetzel, H. D. (2000). Impact of ethics consultations
in the intensive care setting: a randomized, controlled trial.Critical care
medicine, 28(12), 3920-3924.
Shah, M. N., Rajasekaran, K., Sheahan, W. D., Wimbush, T., & Karuza, J. (2008). The
effect of the geriatrics education for emergency medical services training program
in a rural community. Journal of the American Geriatrics Society, 56(6), 1134-
1139. doi:10.1111/j.1532-5415.2008.01738.x.
206
Silvestri, S., Ralls, G. A., Krauss, B., Thundiyil, J., Rothrock, S. G., Senn, A., ... & Falk,
J. (2005). The effectiveness of out-of-hospital use of continuous end-tidal carbon
dioxide monitoring on the rate of unrecognized misplaced intubation within a
regional emergency medical services system. Annals of emergency medicine,
45(5), 497-503. doi:10.1016/j.annemergmed.2004.09.014.
Sleet, D. A., Dahlberg, L. L., Basavaraju, S. V., Mercy, J. A., McGuire, L. C., &
Greenspan, A. (2011). Injury prevention, violence prevention, and trauma care:
Building the scientific base. Morbidity & Mortality Weekly Report Surveillance
Summaries, 60, 78-85.
http://www.cdc.gov/mmwr/preview/mmwrhtml/su6004a13.htm.
Spiteri, A. (2008). EMS systems in Malta. Resuscitation, 76, 165–167.
doi:10.1016/j.resuscitation.2007.07.029.
StatsDirect(n.d.)Prospective vs. retrospective studies. Retrieved January 24, 2014 from
http://www.statsdirect.com/help/default.htm#basics/prospective.htm.
Statistical Significance of Correlations. (n.d.). retrieved December 19, 2013 from
http://www.oneonta.edu/faculty/vomsaaw/w/psy220/files/SignifOfCorrelations.ht
m.
StatsToDo. (n.d.). Sample Size for Correlations Program. Retrieved December 19, 2013,
from http://www.statstodo.com/SSizCorr_Pgm.php#top.
Stav, W. B., Arbesman, M., & Lieberman, D. (2008). Background and methodology of
the older driver evidence-based systematic literature review. The American
Journal of Occupational Therapy, 62(2), 130-135.
207
doi:10.1002/14651858.CD006252.pub2.
Stirling, C., O'Meara, P., Pedler, D., Tourle, V., & Walker, J. (2007). Engaging rural
communities in health care through a paramedic expanded scope of practice.
Rural and Remote Health, 7(4), 839. http://eprints.utas.edu.au/3695/1/3695.pdf.
Subzwari, S., Desapriya, E., Babul-Wellar, S., Pike, I., Turcotte, K., Rajabali, F., &
Kinney, J. (2009). Vision screening of older drivers for preventing road traffic
injuries and fatalities. Cochrane Database Sysemt Review, 21(1).
http://www.update-software.com/BCP/WileyPDF/EN/CD006252.pdf.
Symons, P & Shuster, M. (2004). International EMS systems: Canada. Resuscitation, 63,
119–122. doi:10.1016/j.resuscitation.2004.06.010.
Tanigawa, K & Tanaka, K. (2006). Emergency medical service systems in Japan: Past,
present, and future. Resuscitation, 69, 365–370.
doi:10.1016/j.resuscitation.2006.04.001.
Thomas, N. (2005). Emergency medical services in Zimbabwe. Resiscitation, 65, 15–19.
doi:10.1016/j.resuscitation.2005.01.008.
Thyer, E., Leditschke, J., & Briggs, C. (2009). Incidence and management of cervical
spine injuries in fatal road traffic accidents. In Australasian College of Road
Safety National Conference, 2009, Perth, Western Australia, Australia;
http://acrs.org.au/wp-content/uploads/Thyer.pdf.
Timmermann, A., Russo, S. G., & Hollmann, M. W. (2008). Paramedic versus
emergency physician emergency medical service: role of the anesthesiologist and
the European versus the Anglo-American concept. Current Opinion in
208
Anesthesiology, 21(2), 222-227.
http://www.anesthesiologie.nl/uploads/150/635/mmt_les.Siegers__Frassdorf.pdf.
Towenes, D. A., Lee, T. E., Gulo, S., & VanRooyen, M. J. (1998). Emergency medicine
in Russian. Annals of Emergency Medine, 32(2), 239–242. doi:10.1016/S0196-
0644(98)70143-X.
Trevithick, S., Flabouris, A., Tall, G., & Webber, C. F. (2003). International EMS
systems: New South Wales, Australia. Resuscitation, 59, 165–170.
doi:10.1016/80300-9572(03)00343-5.
United States Census Bureau. (2012a).The statistical abstract: The national data book:
Transportation: Motor Vehicle Accidents and fatalities , 1103 motor vehicle
accidents: Numbers and deaths. U.S. Department of Commerence. Washington,
DC: Author. Retrieved October 6, 2012 from
http://www.census.gov/compendia/statab/cats/transportation/motor_vehicle_accid
ents_and_fatalities.html.
United States Census Bureau. (2012b).The statistical abstract : The national data book:
Transportation: Motor Vehicle Accidents and fatalities , 1106 motor vehicle
occupants and non occupants killed and injured. U.S. Department of
Commerence. Washington, DC: Author. Retrieved October 6, 2012 from
http://www.census.gov/compendia/statab/cats/transportation/motor_vehicle_accid
ents_and_fatalities.html.
United States Census Bureau. (2012c).The statistical abstract : The national data book:
Transportation: motor vehicle accidents and fatalities , 1107 vehicle involved in
209
crashes by vehicle type, roll over occurrence , and crash severity: 2009. U.S.
Department of Commerence. Washington, DC: Author. Retrieved October 6,
2012 from
http://www.census.gov/compendia/statab/cats/transportation/motor_vehicle_accid
ents_and_fatalities.html.
Vaitkaitis, D. (2008). EMS systems in Lithuania. Resuscitation, 76, 329–332.
doi:10.1016/j.resuscitation.2007.07.028.
van Beeck, E. F., Borsboom, G. J., & Mackenbach, J. P. (2000). Economic development
and traffic accident mortality in the industrialized world, 1962–
1990. International Journal of Epidemiology, 29(3), 503-509.
doi: 10.1093/ije/29.3.503.
Verner, R. (2008). Emergency medical sin the Czech Rebublic (Abstract). Annals of
Emergency Medicine, 51(4), 486. http://www.annemergmed.com/issue/S0196-
0644%2808%29X0004-6?page=1.
Wall, J. P. (2013, August). Post crash response: Low hanging fruit or just an after
thought. In Australasian Road Safety Research Policing Education Conference,
2013, Brisbane, Queensland, Australia.
http://arsrpe.acrs.org.au/pdf/Paper%2075%20-%20Wall%20-
%20Post%20Crash%20Response.pdf.
Weale, A. (2011). New models of governance, political accountability, and political
reason. Government and Opposition, 46 (1), 58 – 80. doi:10,1111/j.1477-
7053.2010.01330.x.
210
Weninger, P., Hertz, H., & Mauritz, W. (2005). International EMS: Austria.
Resuscitation, 65, 249–254. doi:10.1016/j.resuscitation.2005.03.006.
World Bank. (2011a). World Bank's IBRD/IDA lending for health, nutrition and
population (HNP) for the fiscal years 1970 – 2011.Washington, DC: Author.
http://data.worldbank.org/data-catalog/.
World Bank. (2011b). World Development Indicators & Global Development Finance.
Washington, DC: Author. http://data.worldbank.org/data-catalog.
World Bank. (2013). World Development Indicators Washington, DC: Author. Retrieved
August 6, 2013, from http://data.worldbank.org/data-catalog/world-development-
indicators.
World Health Organization. (2005). Health action in crisis: Angola. Geneva, Switerland:
Author.
http://www.google.com/url?sa=t&rct=j&q=&esrc=s&frm=1&source=web&cd=1
&ved=0CEkQFjAA&url=http%3A%2F%2Fwww.who.int%2Fhac%2Fcrises%2F
ago%.
World Health Organization. (2007). Youth and road safety. Geneva:Author.
World Health Organization, Department of Violence & Injury Prevention & Disability.
(2009). Global status report on road safety: Time for action. Geneva Switzerland:
Author. http://www.un.org/ar/roadsafety/pdf/roadsafetyreport.pdf.
World Health Organization. (2013). Global status report on road safety 2013: Supporting
a decade of action. Geneva, Switzerland: Author.
World Health Organization, Health Statistics and Health Information Systems. (2013).
211
Metrics: Disability-Adjusted Life Years (DALY). Retrieved July 18, 2013 form
http://www.who.int/healthinfo/global_burden_disease/metrics_daly/en/.
Yancey, A. H., Martinez, R., & Kellermann, A. L. (2002). Injury prevention and
emergency medical services: The “Accidents Aren’t Program.” Prehospital
Emergency Care, 6(2), 204-209.
http://sfxhosted.exlibrisgroup.com/waldenu?sid=google&auinit=AH&aulast=Yan
cey&atitle=I+NJURY+P+REVENTION+AND+E+MERGENCY+M+EDICAL+
S+ERVICES:+T+HE+%E2%80%9CA+CCIDENTS+A+REN%27T%E2%80%9
D+P+ROGRAM&id=doi:10.1080/10903120290938553&title=Prehospital+Emer
gency+Care&volume=6&issue=2&date=2002&spage=204&issn=1090-3127.
Yu, B., Fan, S., & Saurkar. (2009). Does composition of government spending matter to
economic growth? Washington, DC: Author.
Zwerling, C. , Peek-Asa, C., Whitten, P. S., Choi, S-W., Sprince, .L., & Jones, M.P.
(2005). Fatal motor vehicle crashes in rural and urban areas: Decomposing rates
into contributing factors. Injury Prevention,11, 24–28. Doi:
10.1136/ip.2004.005959.
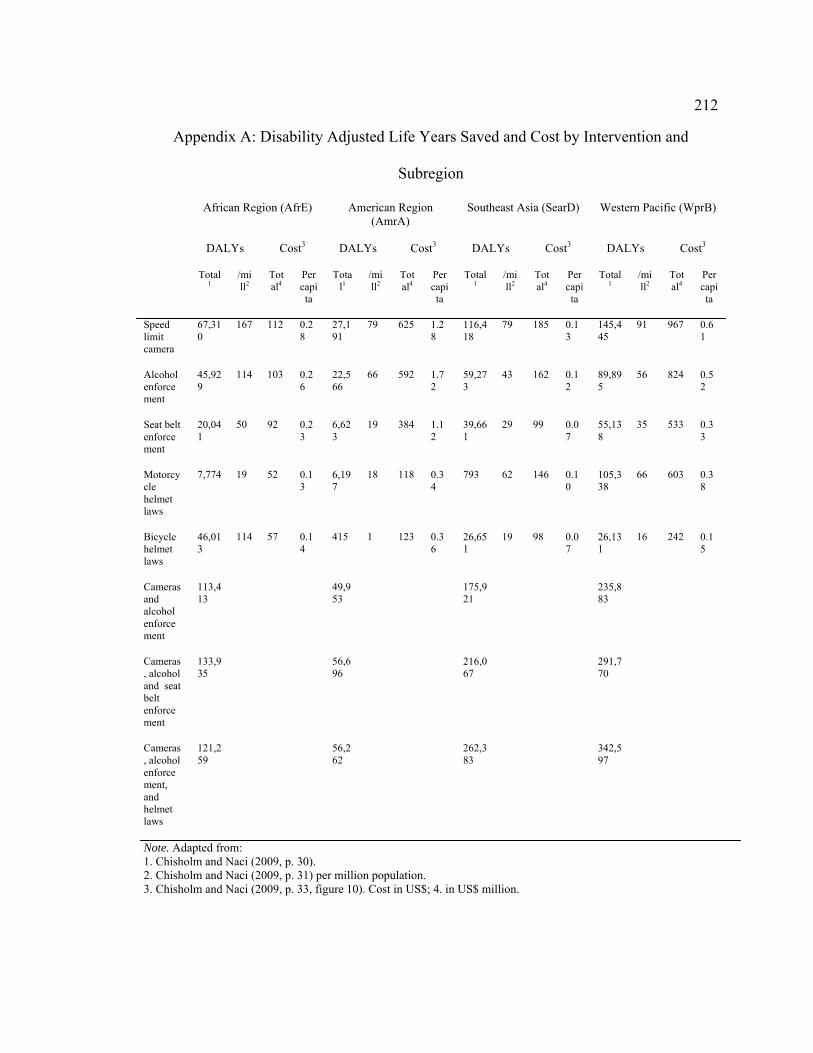
212
Appendix A: Disability Adjusted Life Years Saved and Cost by Intervention and
Subregion
African Region (AfrE) American Region (AmrA)
Southeast Asia (SearD) Western Pacific (WprB)
DALYs Cost3 DALYs Cost3 DALYs Cost3 DALYs Cost3
Total1
/mill2
Total4
Per capita
Total1
/mill2
Total4
Per capita
Total1
/mill2
Total4
Per capita
Total1
/mill2
Total4
Per capita
Speed limit camera
67,310
167 112 0.28
27,191
79 625 1.28
116,418
79 185 0.13
145,445
91 967 0.61
Alcohol enforcement
45,929
114 103 0.26
22,566
66 592 1.72
59,273
43 162 0.12
89,895
56 824 0.52
Seat belt enforcement
20,041
50 92 0.23
6,623
19 384 1.12
39,661
29 99 0.07
55,138
35 533 0.33
Motorcycle helmet laws
7,774 19 52 0.13
6,197
18 118 0.34
793 62 146 0.10
105,338
66 603 0.38
Bicycle helmet laws
46,013
114 57 0.14
415 1 123 0.36
26,651
19 98 0.07
26,131
16 242 0.15
Cameras and alcohol enforcement
113,413
49,953
175,921
235,883
Cameras, alcohol and seat belt enforcement
133,935
56,696
216,067
291,770
Cameras, alcohol enforcement, and helmet laws
121,259
56,262
262,383
342,597
Note. Adapted from: 1. Chisholm and Naci (2009, p. 30). 2. Chisholm and Naci (2009, p. 31) per million population. 3. Chisholm and Naci (2009, p. 33, figure 10). Cost in US$; 4. in US$ million.

213
Appendix: B: Countries With Profiles in English
Angola France Nicaragua UK
Argentina Germany North Korea USA
Armenia Ghana Norway Vietnam
Australia Greece Oman Zimbabwe
Austria Hungary Pakistan
Belarus Iceland Panama
Bahamas India Peru
Bosnia and Herzegovina Indonesia Philippines
Botswana Iran Poland
Brazil Israel Portugal
Canada Italy Rwanda
China Japan Russia
China Rep, Taiwan Kazakhstan Saudi Arabia
Colombia Kenya Singapore
Comoros Islands Lebanon South Africa
Croatia Lithuania South Korea
Cuba Malaysia Spain
Czech Republic Malta Sri Lanka
Denmark Mauritius Sweden
Ecuador Mexico Switzerland
Eritrea Netherlands Thailand
Finland New Zealand Turkey
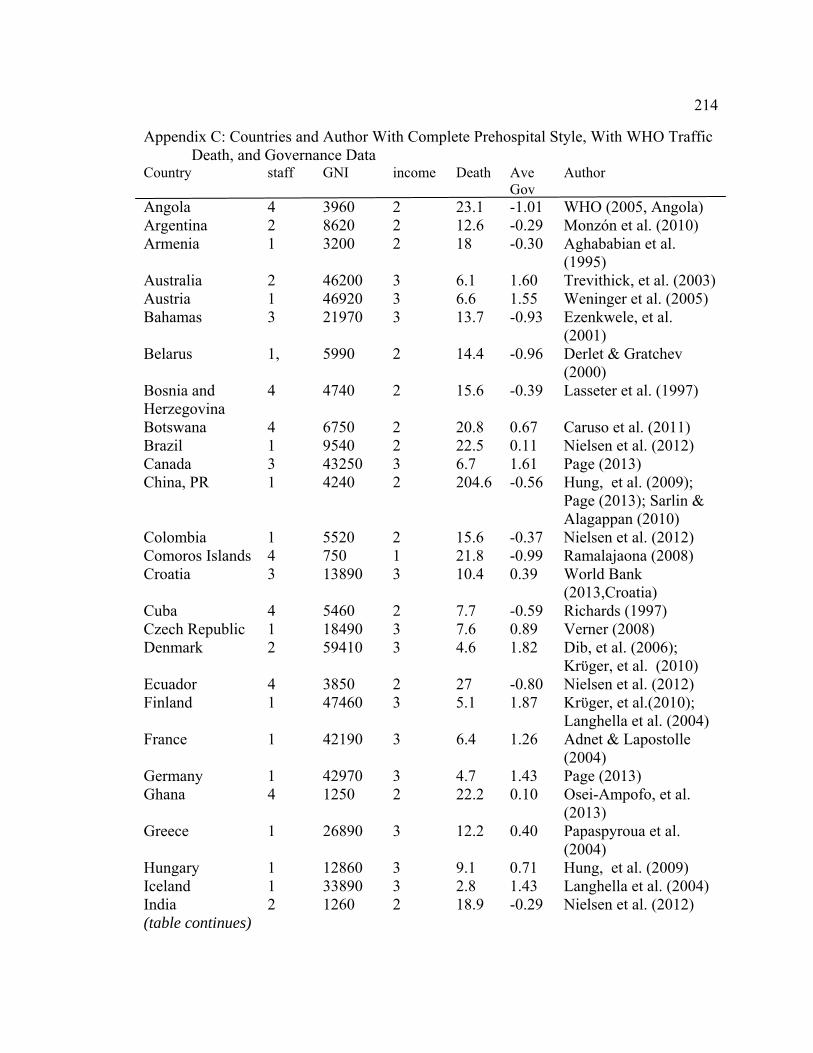
214
Appendix C: Countries and Author With Complete Prehospital Style, With WHO Traffic Death, and Governance Data
Country staff GNI income Death Ave Gov
Author
Angola 4 3960 2 23.1 -1.01 WHO (2005, Angola) Argentina 2 8620 2 12.6 -0.29 Monzón et al. (2010) Armenia 1 3200 2 18 -0.30 Aghababian et al.
(1995) Australia 2 46200 3 6.1 1.60 Trevithick, et al. (2003) Austria 1 46920 3 6.6 1.55 Weninger et al. (2005) Bahamas 3 21970 3 13.7 -0.93 Ezenkwele, et al.
(2001) Belarus 1, 5990 2 14.4 -0.96 Derlet & Gratchev
(2000) Bosnia and Herzegovina
4 4740 2 15.6 -0.39 Lasseter et al. (1997)
Botswana 4 6750 2 20.8 0.67 Caruso et al. (2011) Brazil 1 9540 2 22.5 0.11 Nielsen et al. (2012) Canada 3 43250 3 6.7 1.61 Page (2013) China, PR 1 4240 2 204.6 -0.56 Hung, et al. (2009);
Page (2013); Sarlin & Alagappan (2010)
Colombia 1 5520 2 15.6 -0.37 Nielsen et al. (2012) Comoros Islands 4 750 1 21.8 -0.99 Ramalajaona (2008) Croatia 3 13890 3 10.4 0.39 World Bank
(2013,Croatia) Cuba 4 5460 2 7.7 -0.59 Richards (1997) Czech Republic 1 18490 3 7.6 0.89 Verner (2008) Denmark 2 59410 3 4.6 1.82 Dib, et al. (2006);
Krϋger, et al. (2010) Ecuador 4 3850 2 27 -0.80 Nielsen et al. (2012) Finland 1 47460 3 5.1 1.87 Krϋger, et al.(2010);
Langhella et al. (2004) France 1 42190 3 6.4 1.26 Adnet & Lapostolle
(2004) Germany 1 42970 3 4.7 1.43 Page (2013) Ghana 4 1250 2 22.2 0.10 Osei-Ampofo, et al.
(2013) Greece 1 26890 3 12.2 0.40 Papaspyroua et al.
(2004) Hungary 1 12860 3 9.1 0.71 Hung, et al. (2009) Iceland 1 33890 3 2.8 1.43 Langhella et al. (2004) India 2 1260 2 18.9 -0.29 Nielsen et al. (2012) (table continues)
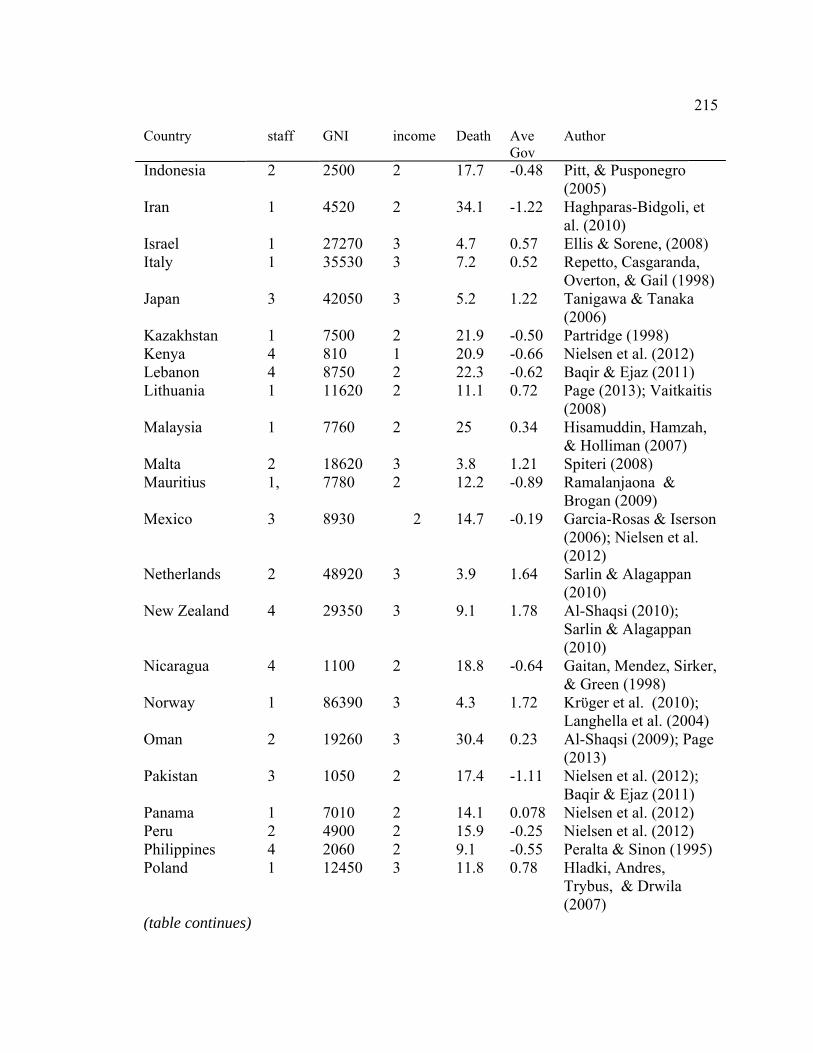
215
Country staff GNI income Death Ave Gov
Author
Indonesia 2 2500 2 17.7 -0.48 Pitt, & Pusponegro (2005)
Iran 1 4520 2 34.1 -1.22 Haghparas-Bidgoli, et al. (2010)
Israel 1 27270 3 4.7 0.57 Ellis & Sorene, (2008) Italy 1 35530 3 7.2 0.52 Repetto, Casgaranda,
Overton, & Gail (1998) Japan 3 42050 3 5.2 1.22 Tanigawa & Tanaka
(2006) Kazakhstan 1 7500 2 21.9 -0.50 Partridge (1998) Kenya 4 810 1 20.9 -0.66 Nielsen et al. (2012) Lebanon 4 8750 2 22.3 -0.62 Baqir & Ejaz (2011) Lithuania 1 11620 2 11.1 0.72 Page (2013); Vaitkaitis
(2008) Malaysia 1 7760 2 25 0.34
Hisamuddin, Hamzah, & Holliman (2007)
Malta 2 18620 3 3.8 1.21 Spiteri (2008) Mauritius 1, 7780 2 12.2 -0.89 Ramalanjaona &
Brogan (2009) Mexico 3 8930 2 14.7 -0.19 Garcia-Rosas & Iserson
(2006); Nielsen et al. (2012)
Netherlands 2 48920 3 3.9 1.64 Sarlin & Alagappan (2010)
New Zealand 4 29350 3 9.1 1.78 Al-Shaqsi (2010); Sarlin & Alagappan (2010)
Nicaragua 4 1100 2 18.8 -0.64 Gaitan, Mendez, Sirker, & Green (1998)
Norway 1 86390 3 4.3 1.72 Krϋger et al. (2010); Langhella et al. (2004)
Oman 2 19260 3 30.4 0.23 Al-Shaqsi (2009); Page (2013)
Pakistan 3 1050 2 17.4 -1.11 Nielsen et al. (2012); Baqir & Ejaz (2011)
Panama 1 7010 2 14.1 0.078 Nielsen et al. (2012) Peru 2 4900 2 15.9 -0.25 Nielsen et al. (2012) Philippines 4 2060 2 9.1 -0.55 Peralta & Sinon (1995) Poland 1 12450 3 11.8 0.78 Hladki, Andres,
Trybus, & Drwila (2007)
(table continues)
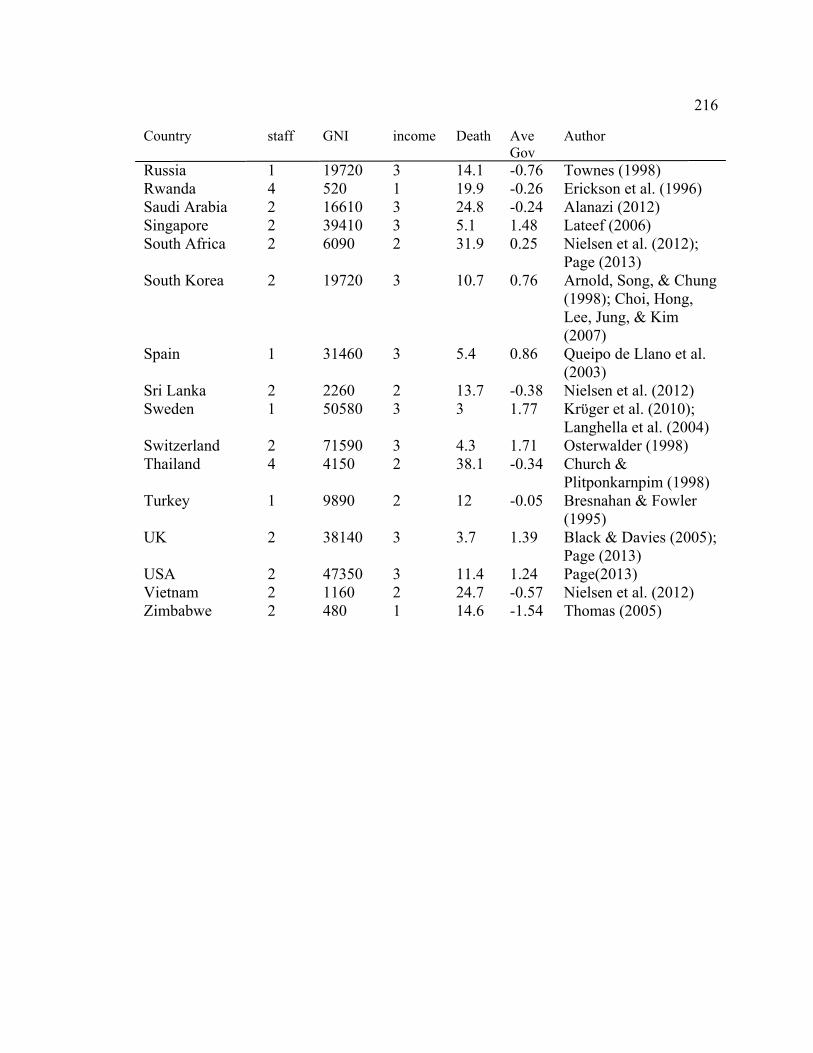
216
Country staff GNI income Death Ave Gov
Author
Russia 1 19720 3 14.1 -0.76 Townes (1998) Rwanda 4 520 1 19.9 -0.26 Erickson et al. (1996) Saudi Arabia 2 16610 3 24.8 -0.24 Alanazi (2012) Singapore 2 39410 3 5.1 1.48 Lateef (2006) South Africa 2 6090 2 31.9 0.25
Nielsen et al. (2012); Page (2013)
South Korea 2 19720 3 10.7 0.76 Arnold, Song, & Chung (1998); Choi, Hong, Lee, Jung, & Kim (2007)
Spain 1 31460 3 5.4 0.86
Queipo de Llano et al. (2003)
Sri Lanka 2 2260 2 13.7 -0.38 Nielsen et al. (2012) Sweden 1 50580 3 3 1.77 Krϋger et al. (2010);
Langhella et al. (2004) Switzerland 2 71590 3 4.3 1.71 Osterwalder (1998) Thailand 4 4150 2 38.1 -0.34 Church &
Plitponkarnpim (1998) Turkey 1 9890 2 12 -0.05 Bresnahan & Fowler
(1995) UK 2 38140 3 3.7 1.39 Black & Davies (2005);
Page (2013) USA 2 47350 3 11.4 1.24 Page(2013) Vietnam 2 1160 2 24.7 -0.57 Nielsen et al. (2012) Zimbabwe 2 480 1 14.6 -1.54 Thomas (2005)
217
Curriculum Vitae
Timothy A. Grant, MSW, RRT, EMT-B
Education PhD Public Health Community Health and Health Promotion (2015) Walden University Minneapolis, Minnesota Prehospital Response to Road Traffic Accidents: Physician versus Nonphysician Responders. Master of Social Work 1994 University at Albany Albany, New York BA Psychology 1992 Russell Sage College, Troy, NY AAS, Respiratory Care 1982 Hudson Valley Community College, Troy, NY EMT-B certificate 2012 Community College of Allegheny County, Pittsburgh, PA Employment: Respiratory Care Jefferson Hospital, part of the Allegheny Health Network, Jefferson Hills, PA 2014–present National Disaster Medical System, Department of Health and Human Services 2013–present Washington, DC. ePeople health care staffing Sewickley PA 2012–2014 Capital Nursing Solutions Pittsburgh, PA 2012–2014 Butler Memorial Hospital, Butler, PA 2004–2011 Health South of Greater Pittsburgh Monroeville, PA 2002–2004 Glens Falls Hospital Glens Falls, NY 1992–1994 New Medico Rehabilitation Hospital, Niskayuna, NY 1989–1994 Green and Kellogg Home Care, Albany, NY, 1984–1988 Albany Medical Center, Albany, NY 1981–1984
218
St. Peter’s Hospital, Albany, NY 1979–1981 Emergency Medical Technician Securitas Pittsburgh, PA 2012–2014 Foxwall EMS Fox Chapel, PA (volunteer) 2012–present Social Work Private practice, Allison Park, PA and Everett, PA 2001–2003 Isaly Counseling, Pittsburgh, PA Pittsburgh, PA 2000–2001 Magellan Behavioral Health, Pittsburgh, PA 1999–2000 Wilson Greene Mental Health, Mental Retardation, and, 1996–1998 Substance Abuse Center Wilson, NC Methodist Home for Children, Raleigh, NC 1995–1996 Whitney M. Young Health Center, Alcohol and Drug Abuse Clinic, Albany, NY 1989–1992
Related Documents