Preference Learning and Demand Forecast * Xinyu Cao † Juanjuan Zhang ‡ April 29, 2020 Abstract Understanding consumer preferences is important for new product management, but is famously challenging in the absence of actual sales data. Stated-preferences data are rel- atively cheap but less reliable, whereas revealed-preferences data based on actual choices are reliable but expensive to obtain prior to product launch. We develop a cost-effective solution. We argue that people do not automatically know their preferences, but can make an effort to acquire such knowledge when given sufficient incentives. The method we develop regulates people’s preference-learning incentives using a single parameter, re- alization probability, meaning the probability with which an individual has to actually purchase the product she says she is willing to buy. We derive a theoretical relation- ship between realization probability and elicited preferences. This allows us to forecast demand in real purchase settings using inexpensive choice data with small to moderate realization probabilities. Data from a large-scale field experiment support the theory, and demonstrate the predictive validity and cost-effectiveness of the proposed method. Keywords : preference elicitation, demand forecasting, incentive alignment, choice exper- iment, field experiment, external validity. * The authors thank the MIT Sloan Marketing Group for their support of this paper since its inception. The authors also received helpful comments from Jie Bai, Andrew Caplin, Sylvain Chassang, Glen Weyl; con- ference attendees of the 2017 AMA-Sheth Foundation Doctoral Consortium, 2017 AMA Summer Academic Conference, 2018 International Industrial Organization Conference, 2018 Marketing Modelers’ Meeting, 2018 Marketing Science Conference, 2018 Quantitative Marketing and Economics Conference, 2018 Summer Institute in Competitive Strategy, 2019 Triennial Invitational Choice Symposium; seminar participants at Cheung Kong Graduate School of Business, Columbia University, Cornell University, Fudan University, Georgia Institute of Technology, Massachusetts Institute of Technology, Microsoft Research New England, National University of Singapore, New York University, Ohio State University, Peking University, Singapore Management University, Stanford University, Temple University, University of British Columbia, University of California Berkeley, Uni- versity of Central Florida, University of Chicago, University of Hong Kong, University of Minnesota, University of Southern California, University of Texas Dallas, and Washington University in St. Louis. The authors thank the editor, associate editor, and reviewers for their excellent comments. † Assistant Professor of Marketing, New York University, Stern School of Business, 40 West Fourth Street, New York, NY 10012, [email protected]. ‡ John D. C. Little Professor of Marketing, Massachusetts Institute of Technology, MIT Sloan School of Management, 100 Main Street, Cambridge, MA 02142, [email protected].

Welcome message from author
This document is posted to help you gain knowledge. Please leave a comment to let me know what you think about it! Share it to your friends and learn new things together.
Transcript

Preference Learning and Demand Forecast ∗
Xinyu Cao† Juanjuan Zhang‡
April 29, 2020
Abstract
Understanding consumer preferences is important for new product management, but isfamously challenging in the absence of actual sales data. Stated-preferences data are rel-atively cheap but less reliable, whereas revealed-preferences data based on actual choicesare reliable but expensive to obtain prior to product launch. We develop a cost-effectivesolution. We argue that people do not automatically know their preferences, but canmake an effort to acquire such knowledge when given sufficient incentives. The methodwe develop regulates people’s preference-learning incentives using a single parameter, re-alization probability, meaning the probability with which an individual has to actuallypurchase the product she says she is willing to buy. We derive a theoretical relation-ship between realization probability and elicited preferences. This allows us to forecastdemand in real purchase settings using inexpensive choice data with small to moderaterealization probabilities. Data from a large-scale field experiment support the theory, anddemonstrate the predictive validity and cost-effectiveness of the proposed method.
Keywords: preference elicitation, demand forecasting, incentive alignment, choice exper-iment, field experiment, external validity.
∗The authors thank the MIT Sloan Marketing Group for their support of this paper since its inception.The authors also received helpful comments from Jie Bai, Andrew Caplin, Sylvain Chassang, Glen Weyl; con-ference attendees of the 2017 AMA-Sheth Foundation Doctoral Consortium, 2017 AMA Summer AcademicConference, 2018 International Industrial Organization Conference, 2018 Marketing Modelers’ Meeting, 2018Marketing Science Conference, 2018 Quantitative Marketing and Economics Conference, 2018 Summer Institutein Competitive Strategy, 2019 Triennial Invitational Choice Symposium; seminar participants at Cheung KongGraduate School of Business, Columbia University, Cornell University, Fudan University, Georgia Institute ofTechnology, Massachusetts Institute of Technology, Microsoft Research New England, National University ofSingapore, New York University, Ohio State University, Peking University, Singapore Management University,Stanford University, Temple University, University of British Columbia, University of California Berkeley, Uni-versity of Central Florida, University of Chicago, University of Hong Kong, University of Minnesota, Universityof Southern California, University of Texas Dallas, and Washington University in St. Louis. The authors thankthe editor, associate editor, and reviewers for their excellent comments.†Assistant Professor of Marketing, New York University, Stern School of Business, 40 West Fourth Street,
New York, NY 10012, [email protected].‡John D. C. Little Professor of Marketing, Massachusetts Institute of Technology, MIT Sloan School of
Management, 100 Main Street, Cambridge, MA 02142, [email protected].

1 Introduction
Each year, more than 30,000 new consumer products are brought into the market (Olenski
2017). Accurately forecasting market demand of a product is essential for its design, distri-
bution, promotion, and pricing strategies. More broadly, demand forecasting affects a range
of managerial decisions such as manufacturing, R&D investment, and market entry. However,
demand forecasting is also famously difficult for new products, due to the lack of historical
sales data which would otherwise reveal valuable information about consumer preferences (see
Ben-Akiva et al. (2019) for a recent survey).
One of the most direct, and in a sense heroic, solutions to this problem is to create actual
sales data in experimental test markets prior to full-scale launch (e.g., Silk and Urban 1978,
Urban and Katz 1983). Derived from real purchase environments, the resulting demand forecast
tends to have high external validity. However, test-market data are costly to obtain. Even in
the 1970s, the cost could surpass one million U.S. dollars for each test (Silk and Urban 1978).
Besides high operational overhead, firms incur opportunity costs of selling actual products at
suboptimal prices in the test market – by definition, a firm will probably not know the optimal
price to charge before it is able to forecast demand.1 In addition, it may be challenging for
some firms to provide a sufficient number of new products prior to launch, which limits the test
market’s power of statistic inference.
A different approach to demand forecasting, opposite to test markets in terms of cost, is to
rely on consumers’ stated-preference data. Consumers answer questions about their preferences
or participate in choice experiments without actual consequences of purchase. Various methods
have been developed and refined. For example, contingent valuation methods estimate people’s
willingness-to-pay for public goods (e.g., Mitchell and Carson 1989), and choice-based conjoint
analysis measures consumers’ tradeoffs among multi-attribute products (see Hauser and Rao
2004 and Rao 2014 for an overview). Stated-preference data can be obtained at relatively low
costs because no actual transaction is needed, but their ability to predict market demand has
1The company we collaborate with for the field experiment presented in this paper indicated that managementhad refrained from running test markets for this reason.
2

been questioned. In fact, hypothetical contingent valuation and hypothetical choice experiments
are both found to overestimate product valuation (Diamond and Hausman 1994, Cummings
et al. 1995, Wertenbroch and Skiera 2002, Miller et al. 2011). A primary reason is participants’
lack of incentive to provide accurate statements of preferences in a non-market setting (Camerer
and Hogarth 1999, Ding 2007).
A stream of research tries to overcome the hypothetical bias of stated-preference data while
avoiding the full cost of test markets. A well-known approach is called “incentive alignment”
(e.g., Becker et al. 1964, Ding 2007, Toubia et al. 2012). The idea is to incentivize truth-
telling by making participants partially responsible for the consequences of their choices. In its
simplest yet representative form, an incentive-aligned choice task appears as follows.
The price of [a product] is p. If you state you are willing to buy the product at this
price, with probability r, you will actually pay this price and purchase the product.
Are you willing to buy?
The probability r is called the “realization probability” in the literature. In theory, incentive
alignment induces truth-telling for any positive r. Mathematically, denoting the participant’s
product valuation as v, sign(v − p) = r × sign(v − p) for any r > 0.2 At the same time,
incentive alignment should be less costly than test markets for any r < 1. To achieve the same
sample size of choice data, one only expects to sell a fraction of the number of actual products
that would otherwise be required in a test market. Despite its theoretical soundness, empirical
performance of incentive alignment is mixed. It often outperforms its hypothetical counterpart
(e.g., Ding et al. 2005, Ding 2007), but its accuracy in forecasting demand in real purchase
settings is still questionable (e.g., Kaas and Ruprecht 2006, Miller et al. 2011).
In a particularly illuminating paper, Yang et al. (2018) show that, contrary to the theoretical
premise of incentive alignment, its empirical performance relies on the realization probability
chosen for the choice experiment. This paper predicts using the bounded rationality literature,
2A related incentive-aligned mechanism is developed by Becker et al. (1964), often called the BDM mecha-nism. Under the BDM, a participant must purchase a product if a randomly drawn price is less than or equalto her stated product valuation.
3

and shows using eye-tracking experiments, that respondents pay more attention to the choice
as realization probability increases. Moreover, the paper predicts using the psychological dis-
tance literature, and shows experimentally, that respondents become more price sensitive under
higher realization probabilities. These findings suggest that incentive alignment, at least in its
traditional form, may not guarantee external validity.
In our paper, we study the external validity of preference elicitation from the “information
acquisition” perspective. We emphasize that the validity of elicited preference data depends
on two factors: participants’ incentives to truthfully state their preferences, and to diligently
learn their preferences. Traditional incentive alignment methods have focused on truth-telling,
whereas “truth-learning” may be equally important in some contexts. Participants may need
to spend an inspection cost to understand product specifications, a search cost to evaluate
alternative options, or a cognitive cost to imagine their potential use of the product (e.g.,
Shugan 1980, Wernerfelt 1994, Villas-Boas 2009, Kuksov and Villas-Boas 2010, Wathieu and
Bertini 2007, Guo and Zhang 2012, Huang and Bronnenberg 2018).3
Indeed, there is abundant evidence from behavioral research showing that human beings
do not always know their preferences; instead, they often construct their preferences during
decision making and, in particular, incur a cost to identify their preferences from an inherent
“master list” (Payne et al. 1993, Lichtenstein and Slovic 2006, Simonson 2008). We posit that
the preferences consumers evoke and manifest through their choices in any environment depend
on their preference-learning efforts, and consumers’ incentives to engage in these efforts depend
on the stake of their choices in this environment.4 As such, traditional incentive alignment
methods may fail to predict actual demand because participants fail to think through their
3There is a growing theory literature built upon the notion of costly learning of preferences. In a recentpaper, Kleinberg et al. (2018) show that costly valuation learning renders the popular increasing-price auctionineffective. The idea of endogenous effort as a choice mediator is also related to Hauser et al. (1993) and Yanget al. (2015), who revisit bounded rationality from the lens of decision cost, and to Chassang et al. (2012), whostudy the design of randomized controlled experiments from the principal-agent perspective. More generally,the paper is related to the “rational inattention” literature, which interprets seemingly irrational behavior inlight of costly information acquisition (e.g., Caplin and Dean 2015).
4Consistent with this view, neuroeconomics research finds that, when humans choose among consumer goods,brain activation is stronger and more widespread in the real choice condition than in the hypothetical condition(Camerer and Mobbs 2017).
4

preferences as carefully as they would have in actual choice settings.
Based on the idea of endogenous preference learning, we develop a method called “aug-
mented incentive alignment” (abbreviated as AIA thereafter) to accurately forecast new product
demand without having to actually launch the product in test markets. To facilitate comparison,
we focus on the canonical application of incentive alignment, as described in the aforementioned
choice task. In this setting, participants’ stake of choices and therefore preference-learning effort
incentives are shaped by one parameter – the realization probability of their choices. Intuitively,
if a participant knows that her product choice is unlikely to be realized, she will have little in-
centive to uncover her true product valuation and will make her choice based on her prior belief.
On the contrary, if a participant knows that her product choice is for real, she will want to
think about how much she truly values the product and make her choice based on her true
valuation. As a result, there exists a microfounded relationship between realization probability
and manifested demand. Our proposed AIA method thus proceeds in two steps: first, estimate
this relationship using less costly (than test markets) incentive-aligned choice data under real-
ization probabilities that are smaller than one; second, use the estimation results to forecast
product demand in actual purchase settings where realization probability equals one.
We formalize the mechanism of the AIA method with a theory model, in which consumers
decide whether they are willing to purchase a product for a given price and a given realization
probability. The model predicts that manifested price sensitivity increases with realization
probability. To understand the intuition, imagine that the product had been offered for free.
Agreeing to buy the product would have been a no-brainer. Now, suppose the price rises
gradually. As the price approaches a consumer’s prior valuation for the product, she will have
a greater incentive to zoom in and think carefully about her true need for the product, and
the only change this thinking brings to her decision is to not buy the product. A higher
realization probability increases the gravity of the purchase decision and amplifies this negative
effect of price on demand. The same intuition applies to the mirror case of a price cut from a
prohibitively high level. Therefore, it will appear as if consumers are more price sensitive under
higher realization probabilities.
5

We run a large-scale field experiment to test the preference-learning theory and to evaluate
the AIA method. We choose the field, as opposed to the lab, in order to minimize factors
that may affect external validity other than realization probability (e.g., Simester 2017). In
particular, even if choice is realized for certain, people may still choose differently in the lab
than in an actual purchase setting due to differences in the decision environment. We conduct
the choice experiment in the field in an effort to address this potential discrepancy.
We collaborate with a mobile platform for fantasy soccer games. The new product is a
new game package that may enhance user performance. We experiment with four realization
probabilities: 0, 1/30, 1/2, and 1. The 0-probability condition is designed to capture the
effect of stated-preference approaches, the two conditions with interim probabilities 1/30 and
1/2 correspond to incentive alignment, whereas the 1-probability condition mirrors the actual
purchase setting. In addition, for each realization probability, we vary prices to measure the
corresponding demand curve. We randomly assign prices and realization probabilities across
users exposed to the experiment.
The experiment result supports the theory prediction – consumers are indeed more price
sensitive under higher realization probabilities. We rule out a number of competing explana-
tions of this effect using data from a post-choice survey. Moreover, we obtain measures of
consumers’ preference-learning effort. We find that effort does increase with realization prob-
ability, consistent with the preference-learning mechanism underlying the theory prediction.
These findings echo the conclusions of Yang et al. (2018).
Having validated its theory foundation, we empirically evaluate the AIA method, using
choice data from incentive alignment. More specifically, we estimate a model of consumer
preference learning and product choice using data from the subsample of interim realization
probabilities (1/30 and 1/2 in the field experiment). We then use the parameter estimates
to forecast product demand in real purchase settings and compare the forecast against the
holdout sample where realization probability equals 1. The AIA method performs remarkably
well. Compared with the optimal profit the seller could have made with perfect knowledge of
actual demand, the AIA demand forecast leads to a profit that only misses the optimal profit by
6

0.57%. To put this number in context, the profit loss is about 23% when realization probability
is 1/2, 50% when realization probability is 1/30, and as high as 90% when the choice task
is hypothetical – stated preferences overpredict demand and recommend a prohibitively high
price in this setting. Notably, simple extrapolation of data from incentive alignment to actual
purchase settings yields a profit loss of 7%. This suggests that the external validity of the AIA
method hinges on its ability to capture the preference-learning mechanism. Finally, we find
that, compared with test markets, the AIA method significantly reduces the cost of data on
various measures of cost.
Conceptually, this paper contributes to the growing literature that emphasizes preferences
as endogenous manifestations as opposed to endowed primitives. We develop a parsimonious
theory of how preference learning shapes manifested demand. We document supporting evi-
dence of this theory. We find evidence that the demand curve, which serves as the foundation
of various managerial decisions, is not a passive object of measurement but an active response
to the preference elicitation method.
Practically, the idea of endogenous preference learning allows us to develop a theory-based,
cost-effective demand forecasting method that helps resolve the cost-validity conundrum of
existing preference elicitation methods. The method only requires incentive-aligned choice data
with small to moderate realization probabilities, yet it is able to accurately forecast demand
in actual purchase settings. Figure 1 summarizes the contribution of this paper in relation to
existing preference elicitation methods.
The rest of the paper proceeds as follows. We continue in Section 2 with a theory model to
illustrate the preference-learning mechanism, to formulate predictions, and to lay the foundation
for the AIA method. We then present the field experiment in Section 3 and discuss evidence of
the theory in Section 4. In Section 5, we develop and evaluate the AIA method. We conclude
in Section 6 with discussions of future research.
7

Figure 1: Preference Elicitation Methods – Cost-Validity Tradeoff
Cost
ExternalValidity
Test Markets
Incentive Alignment
Stated Preferences
Augmented Incentive
Alignment (AIA)
2 Theory Model
In this section, we use a simple model to illustrate the preference-learning mechanism and
its effect on manifested demand. Consider a firm that offers a new product. The product’s
true value is potentially heterogeneous across consumers, following a distribution unknown to
both the firm and consumers. (If the distribution is known, the firm can derive the demand
curve without going through the demand forecasting exercise.) We use preference and valuation
interchangeably in this setting.
Consider a representative consumer. The consumer does not know her true product valu-
ation v but maintains a prior belief about it. The mean of her prior belief is µ, which can be
decomposed as µ = v+e, where the perception error e follows a distribution g(·). The consumer
knows g(·). We make no functional-form assumptions about g(·) except that it has a mean of
zero and has positive support everywhere over (−∞,∞). The zero-mean assumption is justifi-
able because, if it does not hold, the consumer will know that her prior belief is systematically
biased and will rationally “debias” her belief accordingly. The assumption of positive support
everywhere guarantees that Propositions 1 and 2 hold strictly. If this assumption is relaxed,
Propositions 1 and 2 will still hold at least weakly (see the Appendix for proof). An example
of g(·) is the familiar normal distribution around the mean of zero.
8
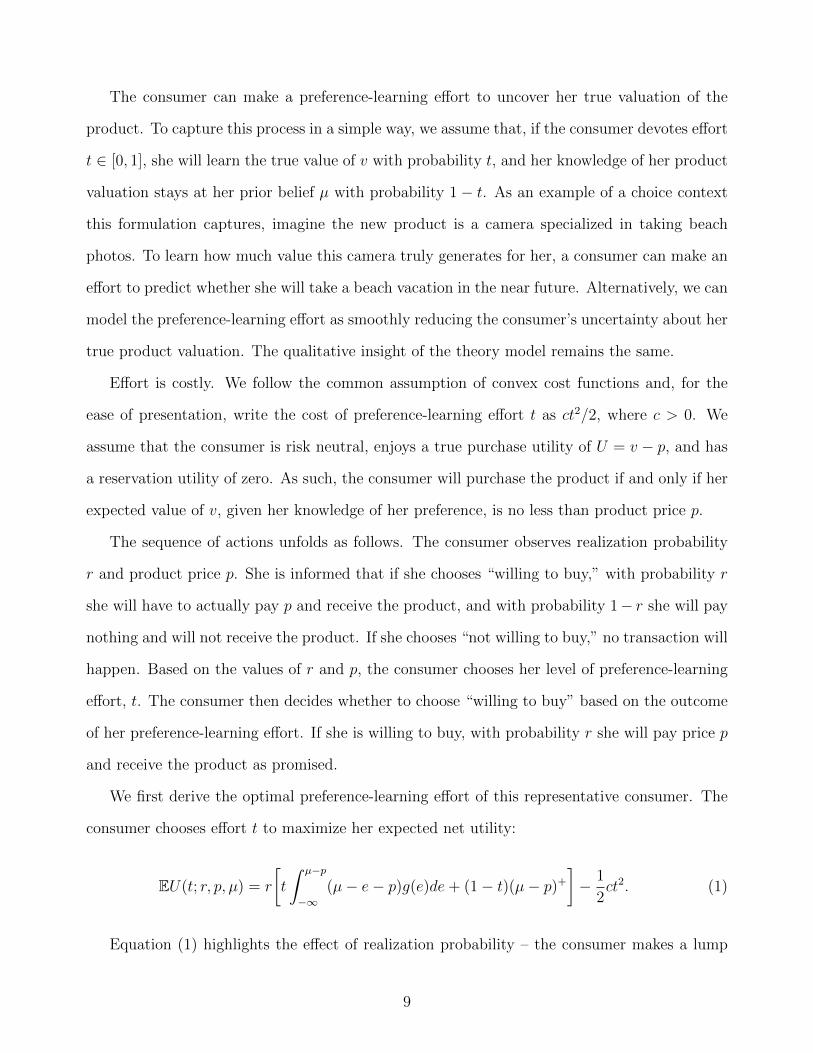
The consumer can make a preference-learning effort to uncover her true valuation of the
product. To capture this process in a simple way, we assume that, if the consumer devotes effort
t ∈ [0, 1], she will learn the true value of v with probability t, and her knowledge of her product
valuation stays at her prior belief µ with probability 1− t. As an example of a choice context
this formulation captures, imagine the new product is a camera specialized in taking beach
photos. To learn how much value this camera truly generates for her, a consumer can make an
effort to predict whether she will take a beach vacation in the near future. Alternatively, we can
model the preference-learning effort as smoothly reducing the consumer’s uncertainty about her
true product valuation. The qualitative insight of the theory model remains the same.
Effort is costly. We follow the common assumption of convex cost functions and, for the
ease of presentation, write the cost of preference-learning effort t as ct2/2, where c > 0. We
assume that the consumer is risk neutral, enjoys a true purchase utility of U = v − p, and has
a reservation utility of zero. As such, the consumer will purchase the product if and only if her
expected value of v, given her knowledge of her preference, is no less than product price p.
The sequence of actions unfolds as follows. The consumer observes realization probability
r and product price p. She is informed that if she chooses “willing to buy,” with probability r
she will have to actually pay p and receive the product, and with probability 1− r she will pay
nothing and will not receive the product. If she chooses “not willing to buy,” no transaction will
happen. Based on the values of r and p, the consumer chooses her level of preference-learning
effort, t. The consumer then decides whether to choose “willing to buy” based on the outcome
of her preference-learning effort. If she is willing to buy, with probability r she will pay price p
and receive the product as promised.
We first derive the optimal preference-learning effort of this representative consumer. The
consumer chooses effort t to maximize her expected net utility:
EU(t; r, p, µ) = r
[t
∫ µ−p
−∞(µ− e− p)g(e)de+ (1− t)(µ− p)+
]− 1
2ct2. (1)
Equation (1) highlights the effect of realization probability – the consumer makes a lump
9

sum effort to learn her preference, yet the return to this effort is scaled by realization probability
r. Meanwhile, Equation (1) captures the information value of the preference-learning effort –
the consumer’s chance of learning her true valuation increases with t, so does her ability to
make a better decision based on knowledge of her true valuation.
The first-order condition of ∂EU(t; r, p, µ)/∂t = 0 yields the consumer’s optimal level of
preference-learning effort:
t∗(r, p;µ) =r
c
[ ∫ µ−p
−∞(µ− e− p)g(e)de− (µ− p)+
]. (2)
The second-order condition is trivially satisfied.
We prove the following results.
Proposition 1 The consumer’s optimal preference-learning effort increases with realization
probability, and decreases with the distance between price and her prior belief of her product
valuation. A greater realization probability amplifies the latter effect. That is,
∂t∗(r, p;µ)
∂r> 0,
∂t∗(r, p;µ)
∂|p− µ|< 0,
∂2t∗(r, p;µ)
∂r∂|p− µ|< 0. (3)
Proof: see the Appendix.
The first result is straightforward. At one extreme, where realization probability equals 0,
choices are hypothetical with no impact on consumer utility, and the consumer has no incentive
to learn her product valuation via costly effort.5 When realization probability increases, the
consumer has more incentive to make an effort to learn her preferences. At the other extreme,
where realization probability equals 1, the consumer makes the same preference-learning effort
as in real purchase decisions.
The remaining results are more subtle yet still intuitive. When price is extremely low (or
high), the consumer may trivially decide to buy (or not buy) regardless of her true valuation,
which makes it unnecessary to make an effort to learn her preference. When price is closer to a
5When choices are hypothetical, consumers may choose randomly or be pro-social towards the researcherand choose truthfully based on her prior belief. Identifying the exact process is outside the scope of this paper.
10

consumer’s prior valuation, making a purchase decision based on the prior belief alone is more
likely to lead to a mistake, and the consumer will want to invest more effort to discern her true
valuation. A greater realization probability amplifies this effect because the consequence of a
wrong purchase decision is more severe when purchase is more likely to be realized.
Based on the consumer’s optimal choice of preference-learning effort, we can derive her
manifested demand of the product, defined as the expected probability for a consumer of prior
belief µ to choose “willing to buy” given realization probability r and price p:
D(r, p;µ) =
∫ [t∗(r, p;µ)1(µ− e ≥ p) +
(1− t∗(r, p;µ)
)1(µ ≥ p)
]g(e)de, (4)
where t∗(r, p;µ) is given by Equation (2).
We emphasize the notion of manifested demand, as opposed to estimated demand, to high-
light the theoretical effect of preference learning on consumer choice. In other words, even if
consumers are behaving truthfully given all they know about their product valuation and even
if there is no empirical error in estimation, manifested demand may still differ from actual
demand if consumers fail to learn their preferences as diligently as they would have in actual
purchase environments. This notion is consistent with the view of Yang et al. (2018).
A key result of interest is the effect of realization probability on manifested demand. We
prove the following proposition.
Proposition 2 Manifested consumer price sensitivity increases with realization probability when-
ever it is well-defined. That is,
∂2D(r, p;µ)
∂r∂p< 0 (5)
whenever ∂D(r, p;µ)/∂p exists.
Proof: see the Appendix.
To understand the intuition, imagine that a consumer is offered a trivially low price. The
consumer can safely choose to buy without bothering to learn her true preference. Now imagine
a small price increase. According to Proposition 1, such a price increase (from a trivially low
11

level) will induce the consumer to deliberate more on her true preference, especially so under
greater realization probabilities. The only change to consumer choice (of trivially deciding to
buy) this extra deliberation brings is a decision to not buy after learning the true preference, as
if the consumer has become more price sensitive than what the standard demand-reducing effect
of higher prices would indicate. A greater realization probability further amplifies this effect,
because product choice is more consequential if it is more likely to be real. Similarly, imagine
a small price cut from a trivially high level. Due to the preference-learning mechanism, the
consumer will deliberate more and will respond to the price cut more than what the standard
price effect would indicate, especially so under greater realization probabilities. Therefore, the
consumer’s manifested price sensitivity increases with realization probability.
A remark on this paper’s theoretical relationship with Yang et al. (2018) is in order. Drawing
on the bounded rationality literature, Yang et al. (2018) successfully predict that respondents
will process choice-relevant information more carefully under higher realization probabilities.
Our Proposition 1 can be seen as formalizing this prediction with a model of preference learn-
ing. Yang et al. (2018) also build on the psychological distance literature to successfully predict
greater price sensitivity under higher realization probabilities. Our Proposition 2 shows that
preference learning alone can predict this result, which provides a parsimonious way to un-
derstand the relationship between realization probability, preference-learning effort, and price
sensitivity in a unified framework.
To recap, using a simple theory model, we demonstrate how a higher realization probability
induces a consumer to invest more preference-learning effort and in turn manifest greater price
sensitivity. In what follows, we test the theory and evaluate the AIA method derived from the
theory.
3 Field Experiment
We use data from a field experiment to validate the theory prediction and mechanism, and to
evaluate the AIA method. As discussed earlier, we choose the field experiment approach to
12

minimize threats to external validity. This allows us to focus on realization probability as a
determinant of the external validity of various preference elicitation methods.
We collaborate with a top mobile platform of fantasy soccer games in China. Founded in
2013, the platform currently hosts 80,000 daily active users, generating 2 million US dollars
in monthly revenue. In the game, each user manages a soccer team with the goal to win as
many times as possible. A team’s likelihood of winning depends on the number of high-quality
players it enlists. The new product we sell in the field experiment is a “lucky player package”
that consists of six high-quality players. This player package had never been sold on the game
platform prior to the experiment.6
The design of the field experiment consists of two orthogonal dimensions of exogenous
variation. First, we exogenously vary realization probability to identify its causal impact on
manifested demand. We set four realization probabilities: 0, 1/30, 1/2, and 1. The 0-probability
condition is designed to replicate the stated-preferences method, the 1-probability condition
captures the actual purchase setting, whereas the interim realization probability conditions
mirror the incentive alignment approach. We assign two interim realization conditions because
the AIA method needs at least two realization probability levels for empirical identification
and we choose only two for a conservative test of the method’s predictive power. In terms of
specific values of interim realization probabilities, 1/2 is a natural choice to observe the effect of
a moderate realization probability. For a small realization probability, we choose 1/30 because
a minimum sample size of 30 has been suggested in the literature for statistical inference (Pett
1997). In future applications of the AIA method using this minimum number of 30 participants
per condition, the realization probability of 1/30 can be implemented as one out of the 30
participants getting to buy the product for real, which makes the experiment appear more
trustworthy than using a smaller realization probability.
Second, we exogenously vary price to identify its causal impact on manifested demand for
any given realization probability. We set five price levels, measured as 1600, 2000, 2400, 2800,
6In this game, most users can only play against the computer. Only when users advance to very high levelscan they have the chance to play against other users. Thus the network effect of obtaining high-quality soccerplayers is negligible.
13

or 3200 “diamonds.” Diamond is the currency of the game. Users need to pay real money to
obtain diamonds. The exchange rate is about 1 US dollar for 100 diamonds. We discuss with
the company to make sure this price range is reasonable and at the same time the gap between
prices is large enough to elicit different purchase rates at different prices.
The five price levels, orthogonally combined with the four realization probabilities, lead to
20 conditions for the experiment. Once a user enters the experiment, she is randomly assigned
to one of the 20 conditions.
More specifically, once a user enters an experimental condition, she is presented a screen of
the choice task. (Figure OA1 in the Online Appendix shows the screen for the 1/30-probability
condition.) On this screen, the user is informed that she has a chance to purchase a lucky player
package at price p and is asked to choose between “willing to buy” and “not willing to buy.”
For the 0-probability condition, the user is informed that this is a hypothetical survey and no
actual transaction will take place. For the 1-probability condition, the user is told that she
will receive the package if she chooses “willing to buy.” For the interim probability conditions
(r ∈ {1/30, 1/2}), the user is told that if she chooses “willing to buy,” a lottery will be drawn
and there is probability r that she will actually receive the player package and will be charged
price p automatically. If the user chooses “not willing to buy” or does not win the lottery,
she will not receive the player package and will not be charged. Users can click on the player
package icon and see the set of players contained therein (Figure OA2 of the Online Appendix).
They can also click on each player and see what skills the player has. After making the purchase
decision, the user will be directed to a follow-up survey, which is designed to obtain auxiliary
data for further tests of the theory.
The experiment took place from 12AM, December 2, 2016 to 12PM, December 4, 2016.
We randomly selected half of the platform’s Android servers, and all users on these servers
automatically entered the experiment once they accessed the game during the period of the
experiment. We chose a short time window and a fraction of users for the experiment to limit
communications among users about the potentially different experimental treatments they were
14
receiving.7
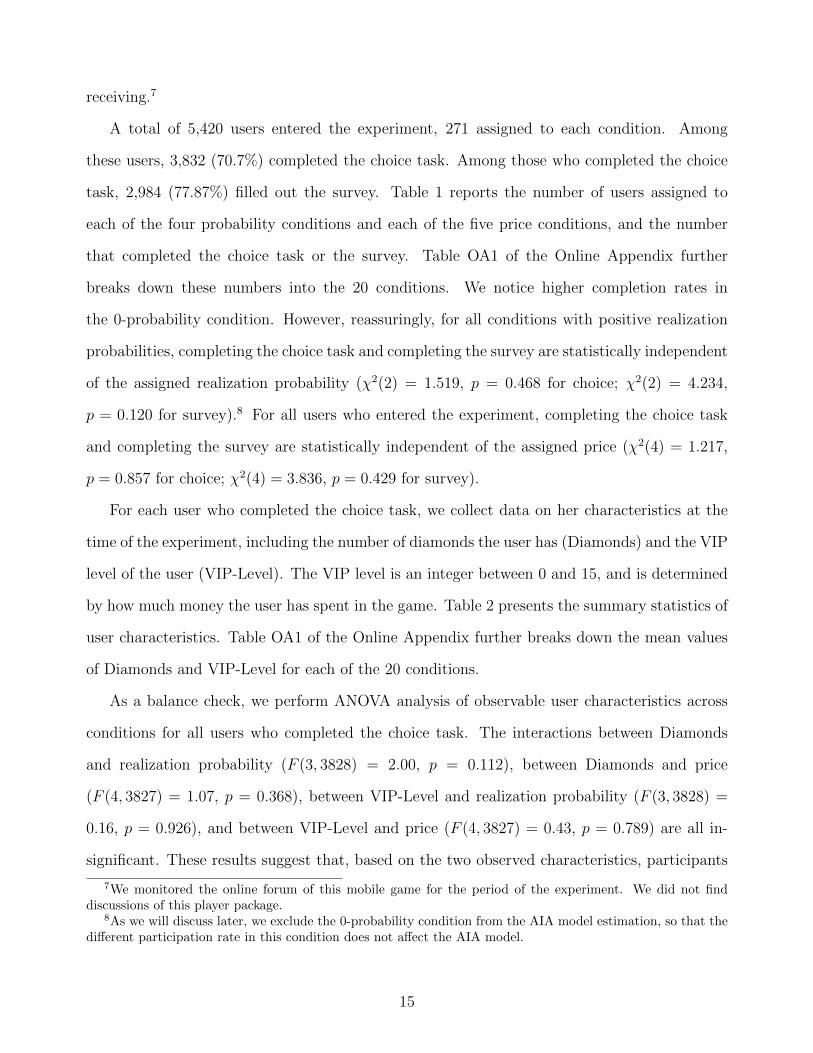
A total of 5,420 users entered the experiment, 271 assigned to each condition. Among
these users, 3,832 (70.7%) completed the choice task. Among those who completed the choice
task, 2,984 (77.87%) filled out the survey. Table 1 reports the number of users assigned to
each of the four probability conditions and each of the five price conditions, and the number
that completed the choice task or the survey. Table OA1 of the Online Appendix further
breaks down these numbers into the 20 conditions. We notice higher completion rates in
the 0-probability condition. However, reassuringly, for all conditions with positive realization
probabilities, completing the choice task and completing the survey are statistically independent
of the assigned realization probability (χ2(2) = 1.519, p = 0.468 for choice; χ2(2) = 4.234,
p = 0.120 for survey).8 For all users who entered the experiment, completing the choice task
and completing the survey are statistically independent of the assigned price (χ2(4) = 1.217,
p = 0.857 for choice; χ2(4) = 3.836, p = 0.429 for survey).
For each user who completed the choice task, we collect data on her characteristics at the
time of the experiment, including the number of diamonds the user has (Diamonds) and the VIP
level of the user (VIP-Level). The VIP level is an integer between 0 and 15, and is determined
by how much money the user has spent in the game. Table 2 presents the summary statistics of
user characteristics. Table OA1 of the Online Appendix further breaks down the mean values
of Diamonds and VIP-Level for each of the 20 conditions.
As a balance check, we perform ANOVA analysis of observable user characteristics across
conditions for all users who completed the choice task. The interactions between Diamonds
and realization probability (F (3, 3828) = 2.00, p = 0.112), between Diamonds and price
(F (4, 3827) = 1.07, p = 0.368), between VIP-Level and realization probability (F (3, 3828) =
0.16, p = 0.926), and between VIP-Level and price (F (4, 3827) = 0.43, p = 0.789) are all in-
significant. These results suggest that, based on the two observed characteristics, participants
7We monitored the online forum of this mobile game for the period of the experiment. We did not finddiscussions of this player package.
8As we will discuss later, we exclude the 0-probability condition from the AIA model estimation, so that thedifferent participation rate in this condition does not affect the AIA model.
15

Table 1: Number of Users by Realization Probability andby Price
Realization # Entered # Completed # CompletedProbability Experiment Choice Survey
0 1355 1095 8821/30 1355 920 7081/2 1355 922 7231 1355 895 671
Sum 5420 3832 2984
Price # Entered # Completed # Completed(Diamonds) Experiment Choice Survey
1600 1084 774 5992000 1084 757 5752400 1084 764 5892800 1084 761 6033200 1084 776 618Sum 5420 3832 2984
Notes. Diamond is the currency of the game. Users need to pay realmoney to obtain diamonds, at an exchange rate of about 1 US dollarfor 100 diamonds.
Table 2: Summary Statistics of User Characteristics
Mean SD Median Min Max NDiamonds 3134.44 5498.09 1614.00 0 150969 3832VIP-Level 3.00 3.10 2.00 0 15 3832
Notes. The sample consists of all users who completed the choice task.
in the choice task are balanced across treatment conditions.
4 Evidence of the Preference-Learning Theory
In this section, we present evidence of the preference-learning theory, in terms of both prediction
and mechanism, using data from the field experiment.
We first examine aggregate demand, defined as the proportion of users who choose “willing
to buy” out of those who completed the choice task in each condition. Figure 2 shows how
aggregate demand changes with price under each realization probability. We see a pattern –
16

as realization probability increases, demand decreases faster with price; in addition, the overall
level of demand decreases.
Figure 2: Realization Probability and Manifested Demand
0.0
0.1
0.2
0.3
0.4
0.5
0.6
0.7
Prob=0 Prob=1/30 Prob=1/2 Prob=1
Pur
chas
e R
ate
Price (Diamonds)16002000240028003200
Notes. Purchase rate is the fraction of users who choose “willing to buy” out of those who completed thechoice task in each experimental condition. Prob means realization probability.
To verify these observations statistically, we fit a logistic demand curve for each realization
probability condition by regressing individual-level purchase decisions on price. The dependent
variable Purchase equals 1 if the user chooses “willing to buy” and 0 if the user chooses “not
willing to buy.” For the ease of presentation, we normalize the five price levels to 4, 5, 6, 7, 8
respectively in this regression and subsequent analysis. Table 3 presents the estimated price
coefficients and intercepts of the demand curves. The price coefficient decreases with realization
probability, consistent with the prediction of the theory.
We further examine how individual-level purchase decisions are jointly influenced by price
and realization probability. We estimate a logistic model of purchase decisions pooling data
17

Table 3: Manifested Demand Curves by Realization Probability
(Prob=0) (Prob=1/30) (Prob=1/2) (Prob=1)Purchase Purchase Purchase Purchase
Price -0.0851∗ -0.124∗∗∗ -0.170∗∗∗ -0.303∗∗∗
(0.0442) (0.0466) (0.0480) (0.0532)Constant 1.067∗∗∗ 0.503∗ 0.729∗∗ 1.089∗∗∗
(0.276) (0.285) (0.293) (0.316)N 1095 920 922 895Pseudo R2 0.003 0.006 0.010 0.031
Notes. Logistic regression. Prob means realization probability. Dependentvariable is the Purchase dummy variable. Prices are normalized to {4, 5, 6, 7,8}. Standard errors in parentheses.* p < 0.10, ** p < 0.05, *** p < 0.01.
from all realization probability conditions. Following Balli and Sørensen (2013), we normalize
the mean values of price and realization probability to zero in this model, so that the magnitude
of the main effects and interaction effect can be visualized more transparently. Columns (1)-(3)
of Table 4 present the estimation results. Column (1) shows that individual users’ purchase
likelihood decreases with price, as expected. Purchase likelihood also decreases with realization
probability, consistent with the prediction of Proposition 2 – if demand declines faster with
price under higher realization probabilities, it is not surprising that demand is lower for higher
realization probabilities at a given price. The result echoes findings from the literature that
hypothetical preference elicitation tends to overestimate demand (e.g., Diamond and Hausman
1994, Cummings et al. 1995).
An alternative explanation to the negative effect of realization probability on manifested
demand is that a smaller realization probability induces consumers to perceive the product as
being more precious and of higher quality. In the post-choice survey (see the Online Appendix
for details), we ask users whether they think the opportunity to buy this player package is
rare. The answer could be yes, indifferent, or no (coded as 1, 2, and 3, respectively). We find
that perceived rarity is not significantly correlated with realization probability (Corr = 0.0100,
p = 0.646) for positive realization probabilities. We also ask users to rate how they perceive the
quality of this player package on a 5-point scale. The rating is not significantly correlated with
18

realization probability either (Corr = 0.0078, p = 0.721) for positive realization probabilities.
These results help mitigate the alternative explanation of rarity to some degree.
Table 4: Manifested Price Sensitivity Increases with Realization Probability
(1) (2) (3) (4)Purchase Purchase Purchase Purchase(Logistic) (Logistic) (Logistic) (Linear)
Price -0.155∗∗∗ -0.161∗∗∗ -0.157∗∗∗ -0.0360∗∗∗
(0.0236) (0.0237) (0.0239) (0.00554)Realization Probability -0.944∗∗∗ -0.960∗∗∗ -0.965∗∗∗ -0.224∗∗∗
(0.0836) (0.0848) (0.0848) (0.0189)Price × Realization Probability -0.209∗∗∗ -0.196∗∗∗ -0.0390∗∗∗
(0.0607) (0.0610) (0.0134)Log-Diamonds 0.0939∗∗∗ 0.0217∗∗∗
(0.0219) (0.00499)VIP-Level -0.0690∗∗∗ -0.0159∗∗∗
(0.0113) (0.00255)Constant -0.138∗∗∗ -0.144∗∗∗ -0.605∗∗∗ 0.362∗∗∗
(0.0332) (0.0333) (0.154) (0.0352)N 3832 3832 3832 3832Pseudo/adj. R2 0.033 0.035 0.044 0.058
Notes. Logistic regression for Columns (1)-(3). OLS regression for Column (4). Dependentvariable is the Purchase dummy variable. Prices are normalized to {4, 5, 6, 7, 8}. Following Balliand Sørensen (2013), we further normalize the mean values of Price and Realization Probabilityto zero to facilitate interpretation. Standard errors in parentheses.* p < 0.10, ** p < 0.05, *** p < 0.01.
For a direct test of Proposition 2, we add the interaction term of price and realization
probability to the aforementioned regression of individual purchase decisions on these two
factors. As column (2) of Table 4 shows, this interaction term has a significantly negative
coefficient. In column (3), we further control for user characteristics, namely, Diamonds and
VIP-Level. Since Diamonds is a highly right-skewed variable, we transform it into a new vari-
able Log-Diamonds = log(Diamonds + 1) and will use this new variable in subsequent analysis.
We find that having more diamonds and having lower VIP levels are associated with higher
purchase rates. All other coefficients remain stable. Furthermore, because interaction terms in
nonlinear models may not be straightforward to interpret (Greene 2010), we estimate the linear
counterpart of Column (3). As Column (4) shows, the conclusion is robust – users are more
19

price sensitive under higher realization probabilities, consistent with Proposition 2.
So far, data support the predicted effect of realization probability on manifested demand.
Next we examine whether this effect is indeed driven by the preference-learning mechanism
we propose. To this end, we need a measure of users’ preference-learning effort. Measuring
individuals’ effort engagement in choice tasks is difficult (Bettman et al. 1990). We approach
this problem using different proxies of preference-learning effort.
For a first proxy of preference-learning effort, we draw upon the classic measure of decision
effort as decision time (Wilcox 1993). We record decision time as the number of seconds it takes
from the point the user first arrives at the choice task page to the point she makes a choice.
Table 5 reports the summary statistics. It turns out the decision time variable is right-skewed
with some extremely large values. Therefore, we also examine a log transformation of this
variable, Log-Decision Time, which is calculated as log(Decision Time + 1).9
Admittedly, decision time may not be an accurate measure of preference-learning effort,
as some users may think quickly but diligently. Therefore, we supplement the mechanism
test with another proxy of preference-learning effort, leveraging the unique context of the field
experiment. Recall that users can click on the player package to acquire information about
the players contained therein. If a user has carefully thought about her valuation of the player
package, arguably, she should know its content. Therefore, in the post-choice survey, we ask
each user to answer “which of the following soccer players was not included in the player
package” (see the Online Appendix for details). The corresponding measure of effort equals 1 if
the user provides the correct answer (there is only one correct answer), and 0 if the user gives
the wrong answer or chooses “I don’t know.”
As a direct mechanism test, we regress these three measures of preference-learning effort
on realization probability, price, and their interaction term. We again normalize the mean
values of realization probability and price to zero following Balli and Sørensen (2013). Table 6
presents the result. For all three measures, users’ preference-learning effort increases with real-
9All users in the sample did complete the choice task. Therefore, we choose not to simply remove users withextremely long decision time from the data.
20

Table 5: Summary Statistics of Preference-Learning Effort Measures
Mean Std Dev Median Min Max NDecision Time (seconds) 1630.87 4892.93 7.08 0.56 23999.17 3832Log-Decision Time (seconds) 3.07 2.56 2.09 0.44 10.09 3832Correct Answer (binary) 0.55 0.50 1.00 0 1 2984
Notes. Decision Time is recorded for all users who completed the choice task. Log-Decision Timeis calculated as log(Decision Time + 1). Correct Answer is recorded for all users who completed thesurvey.
ization probability, consistent with Proposition 1. The effects of price and its interaction with
realization probability are largely insignificant. One possible explanation is that Proposition 1
offers ambiguous predictions regarding these two effects; their signs depend on how each user’s
assigned price compares with her prior belief of her product valuation.
Table 6: Preference-Learning Effort Increases with Realization Probability
(1) (2) (3) (4) (5) (6)Decision Decision Log-Decision Log-Decision Correct Correct
Time Time Time Time Answer AnswerRealization Probability 916.4∗∗∗ 916.3∗∗∗ 0.281∗∗∗ 0.281∗∗∗ 0.0549∗∗ 0.0537∗∗
(204.4) (204.5) (0.106) (0.106) (0.0227) (0.0227)Price -52.62 -52.54 -0.0372 -0.0371 -0.00314 -0.00276
(54.75) (54.93) (0.0293) (0.0293) (0.00639) (0.00638)Price × Realization Prob. 15.34 0.0148 0.0358∗∗
(141.4) (0.0739) (0.0158)Constant 1630.9∗∗∗ 1630.8∗∗∗ 3.070∗∗∗ 3.070∗∗∗ 0.553∗∗∗ 0.553∗∗∗
(78.83) (78.84) (0.0413) (0.0413) (0.00910) (0.00909)N 3832 3832 3832 3832 2984 2984Adj. R2 0.005 0.005 0.002 0.002 0.001 0.003
Notes. OLS regression. Prices are normalized to {4, 5, 6, 7, 8}. Following Balli and Sørensen (2013), wefurther normalize the mean values of Price and Realization Probability to zero to facilitate interpretation.Standard errors in parentheses.* p < 0.10, ** p < 0.05, *** p < 0.01.
In summary, data from the field experiment support the theory in both its prediction (Propo-
sition 2) and its underlying mechanism (Proposition 1). These results are consistent with Yang
et al. (2018)’s finding that consumers’ price sensitivity increases with realization probability, al-
though we do not evoke the psychological distance explanation. In fact, our preference-learning
explanation is consistent with Yang et al. (2018)’s finding that consumers’ attention to the
choice task increases with realization probability. Built on these findings, in the following sec-
21

tion, we develop and evaluate a method to forecast demand with low-cost choice experiment
data.
5 AIA Demand Forecasting Method
In this section, we develop the AIA demand forecasting method and evaluate its performance
using data from the field experiment. The core of the method is an AIA model of consumer
product choice based on the preference-learning mechanism developed in the theory section.
We estimate the AIA model drawing on choice data from the incentive alignment conditions
(i.e., the 1/2-probability and 1/30-probability conditions), leaving data from the actual pur-
chase condition (i.e., the 1-probability condition) as the holdout sample. We then use the
model estimates to forecast demand in actual purchase settings (i.e., settings where realization
probability equals 1), and compare the forecast with actual demand in the holdout sample. To
assess the value of having a theory-based model, we also compare the AIA forecast with simple
extrapolation of data from incentive alignment conditions to real purchase settings. Finally, we
compare the AIA method with the test-market approach on cost of data.
5.1 AIA Model of Consumer Product Choice
The AIA model of consumer product choice captures the behavioral process described in the
theory section but operationalizes it to match the empirical context. For a conservative evalu-
ation of the AIA method, we strive to keep the model parsimonious.
We operationalize product valuation following the established multi-attribute linear utility
framework (e.g., Roberts and Urban 1988). Let user i’s true valuation of the product be
vi = b0 + b1Log-Diamondsi + b2VIP-Leveli + εvi, (6)
where εvi represents the unobserved heterogeneity in users’ true product valuation, which fol-
lows a normal distribution N(0, σ2v). Recall that Log-Diamondsi = log(Diamondsi + 1), where
22

Diamondsi is the number of diamonds user i has at the time of the experiment. VIP-Leveli
denotes the VIP level of user i at the time of the experiment, which is determined by how much
this user has spent in the game. For the ease of interpretation, we scale both Log-Diamondsi
and VIP-Leveli to [0, 1] by dividing each variable by its maximum value. We conjecture that a
user with more diamonds at hand is likely to have a higher willingness-to-pay for the product.
The sign of VIP-Level is a priori ambiguous. A user who has spent a lot may be more likely to
spend on the new product out of habit or ability, or less likely to spend because she has already
recruited enough players she wanted for her team.
User i’s prior belief about her product valuation follows the normal distribution N(vi, σ20i),
where the prior uncertainty term σ0i is operationalized as
σ0i = exp (a0 + a1VIP-Leveli) . (7)
We use the exponential function here to guarantee that σ0i is positive. We expect VIP-Level to
have a negative coefficient because, other things being equal, more spending arguably means
greater experience with the game and hence less uncertainty about product valuation. As
such, the estimated sign of VIP-Level helps assess the face validity of the preference-learning
mechanism.
Knowing her prior mean valuation of the product µi and her prior uncertainty σ0i, user i
can derive her optimal level of effort in the same way as in the theory model:
t∗i = min{rici
(E[(vi − pi)+]− (µi − pi)+
), 1}, (8)
where the expectation is taken over consumer i’s prior belief vi ∼ N(µi, σ20i). pi and ri are the
price and realization probability randomly assigned to user i in the experiment. We restrict
effort t∗i to be no larger than 1 because it is defined as the probability that the consumer will
learn her true valuation (see Section 2). As we will discuss later, estimated effort levels are well
below 1, which reduces the concern that capping effort levels affects the estimation results. We
23

further operationalize user i’s effort cost ci as
ci = exp (c0 + c1εci) , (9)
where εci ∼ N(0, 1). The exponential transformation again guarantees that effort cost is
positive. The εci term allows effort cost to be heterogeneous among users.
Given her effort level t∗i , with probability t∗i , user i learns her true product valuation vi and
buys the product if vi ≥ pi. With probability 1 − t∗i , user i retains her prior belief and buys
if µi ≥ pi. We make the common assumption that users have a response error when making
purchase decisions, and that the response error follows the i.i.d. standard Type I extreme
value distribution. It follows that user i’s probability of choosing “willing to buy,” encoded as
Buyi = 1, is given by the standard logit formula:
Pr(Buyi = 1) = t∗iexp(vi − pi)
1 + exp(vi − pi)+ (1− t∗i )
exp(µi − pi)1 + exp(µi − pi)
. (10)
The log-likelihood function of the observed purchase decision data is
LL =N∑i=1
[1(Buyi = 1) log Pr(Buyi = 1) + 1(Buyi = 0) log (1− Pr(Buyi = 1))
], (11)
where N is the number of users who completed the choice task.
The above formulation of the log-likelihood function does not rely on actual data on con-
sumer effort choices. Instead, it calculates effort choices based on model parameters following
the process described in the theory model. We do have proxies of effort from the field exper-
iment. We could in theory incorporate these measures to derive additional moments for the
estimation. However, for a fair evaluation of the AIA method, we deliberatively avoid relying on
effort data for model calibration. We would like the AIA method to perform well (in particular,
outperform incentive alignment) not because it uses more data, but because it uses the same
incentive alignment data better. In addition, being able to perform well in the absence of effort
measures lowers the data requirement and broadens the applicability of the AIA method.
24

5.2 Estimation Procedure
The AIA model is estimated using the simulated maximum-likelihood estimation approach
(Train 2009). For a given set of parameter values, we calculate the purchase probability of
each user averaged over a large number of pre-simulated random draws, and then calculate
the log-likelihood by summing up the log-likelihood of each user. The estimated parameter
values are found by maximizing the simulated log-likelihood. The standard error is estimated
using the inverse of Hessian matrix at the estimated parameter values. We present the detailed
estimation procedure in the Online Appendix.
As discussed, we use data from incentive alignment conditions, where realization probability
equals 1/30 or 1/2, to estimate the model parameters. We leave the 1-probability condition
as the holdout sample to assess the predictive validity of the AIA method. We do not use
data from the 0-probability condition in estimation for two reasons. First, our theory does not
predict how consumers will choose in the hypothetical setting. Thus we need to make further
assumptions to interpret choice data from this condition. For instance, we could estimate
an additional parameter that captures consumers’ tendency to act on their true beliefs when
indifferent. The identification of this parameter, however, still has to rely on information
from the 1/30-probability and 1/2-probability conditions. Second, we include the 0-probability
condition in the field experiment to assess how stated preferences perform compared with other
preference elicitation methods within the same empirical context. Application of the AIA
method, however, does not require data from the 0-probability condition. We exclude this
condition from the estimation to keep the AIA method “lean” in terms of data requirement.
5.3 Identification
The parameters we need to estimate are the constant and coefficients in users’ true valuation
equation (b0, b1, b2), prior uncertainty equation (a0, a1), and effort cost equation (c0, c1), as
well as the standard deviation of users’ unobserved heterogeneity in true valuation (σv). b0
is identified from the overall level of demand. b1 and b2 are identified from users’ variations
25
in observable characteristics (i.e., Log-Diamonds and VIP-Level) and in purchase decisions.
(a0, a1) and (c0, c1) together determine users’ optimal preference-learning effort and, in turn,
their manifested demand. (a0, a1) can be separately identified from (c0, c1) because, according
to Equation (8), even if effort cost is held constant, variations in price help reveal the effect
of prior uncertainty (via the E operator) on optimal effort and thus manifested demand. a1 is
further identified from how VIP level moderates this effect. Finally, since every user only makes
one purchase decision in our data, unobserved heterogeneity σv is identified from the part of
heterogeneity in product valuation (as revealed in product choices) that cannot be captured by
observable user characteristics.
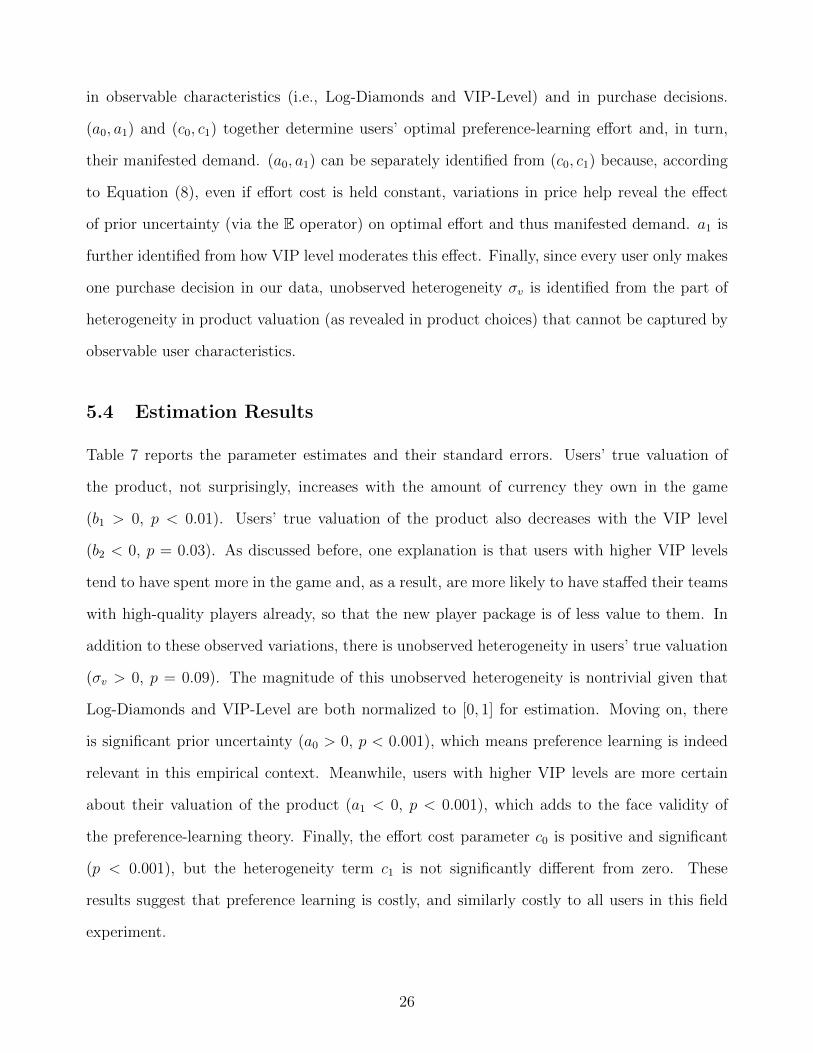
5.4 Estimation Results
Table 7 reports the parameter estimates and their standard errors. Users’ true valuation of
the product, not surprisingly, increases with the amount of currency they own in the game
(b1 > 0, p < 0.01). Users’ true valuation of the product also decreases with the VIP level
(b2 < 0, p = 0.03). As discussed before, one explanation is that users with higher VIP levels
tend to have spent more in the game and, as a result, are more likely to have staffed their teams
with high-quality players already, so that the new player package is of less value to them. In
addition to these observed variations, there is unobserved heterogeneity in users’ true valuation
(σv > 0, p = 0.09). The magnitude of this unobserved heterogeneity is nontrivial given that
Log-Diamonds and VIP-Level are both normalized to [0, 1] for estimation. Moving on, there
is significant prior uncertainty (a0 > 0, p < 0.001), which means preference learning is indeed
relevant in this empirical context. Meanwhile, users with higher VIP levels are more certain
about their valuation of the product (a1 < 0, p < 0.001), which adds to the face validity of
the preference-learning theory. Finally, the effort cost parameter c0 is positive and significant
(p < 0.001), but the heterogeneity term c1 is not significantly different from zero. These
results suggest that preference learning is costly, and similarly costly to all users in this field
experiment.
26

Table 7: Estimation Results of the AIA Model
Variable Parameter Estimate S.E.
True Valuation
Constant b0 -2.342 2.943Log-Diamonds b1 12.479∗∗∗ 4.756VIP-Level b2 -8.062∗∗ 3.788Unobserved Heterogeneity Magnitude σv 0.857* 0.505
Prior UncertaintyConstant a0 4.822∗∗∗ 0.619VIP-Level a1 -3.100∗∗∗ 0.902
Effort CostConstant c0 3.245∗∗∗ 0.571Heterogeneity Magnitude c1 3.839e-6 0.169
N 1842Log-Likelihood -1238.68
Notes. The sample for estimation consists of conditions in which realization probability equals 1/30 or 1/2.Prices are normalized to {4, 5, 6, 7, 8}. Log-Diamonds and VIP-Level are normalized to [0, 1].∗ p < 0.10, ∗∗ p < 0.05, ∗∗∗ p < 0.01.
To put the estimation results in context, we calculate each user’s optimal preference-learning
effort (t∗i ) based on the parameter estimates. Table 8 presents the mean and standard deviation
of estimated effort by realization probability. Estimated effort does increase with realization
probability. It equals zero in the 0-probability condition by definition. In the actual purchase
condition with realization probability equal to 1, users on average spend an effort of 0.452 out
of a normalized range of 0 to 1. The fact that estimated effort largely lies in the interior of the
0-to-1 interval suggests that, reassuringly, model estimation is not driven by corner solutions
in users’ effort choices.
Table 8: Estimated Preference-Learning Effort
Estimated Effort Level(t∗i )
Condition Mean S.D.Realization Probability=0 0 0Realization Probability=1/30 0.017 0.008Realization Probability=1/2 0.254 0.117Realization Probability=1 0.452 0.183
Notes. Effort level is normalized between 0 and 1. Effort equals 0in the 0-probability condition by definition.
In addition, based on the estimation results, we calculate users’ mean valuation of the player
27

package as 1384 diamonds. Recall that the lowest price offered in the field experiment is 1600
diamonds, which is significantly higher than users’ mean valuation (S.E. = 14.7, p < 0.001).
As an auxiliary test of the AIA model’s face validity, in the post-choice survey we ask users to
rate how they perceive the price of the product on a scale from 1 (very low) to 5 (very high)
(see the Online Appendix for details). Indeed, the answers confirm that users view the price as
being relatively high; the mean answer is 3.99, significantly higher than the neutral level of 3
(t = 52.84, p < 0.001).
5.5 Forecasting Demand in Real Purchase Settings
Based on the parameter estimates, we simulate the purchase decision of each user in the AIA
model for the counterfactual case of realization probability equal to 1 (see the Online Appendix
for details). The simulation results form the AIA forecast of demand in real purchase settings.
We compare the forecast against actual demand in the holdout sample, that is, in the 1-
probability condition we have set aside. To put the forecast in context, we also compare it
with manifested demand in the other three realization probability conditions. For the ease of
visualization, we fit a logistic demand curve for each preference elicitation method.
Figure 3 visualizes the comparison. Consistent with prior findings from the literature,
the stated-preferences approach (i.e., the 0-probability condition) performs poorly; compared
with actual demand, it overestimates demand considerably and it underestimates the degree of
price sensitivity. Incentive alignment (i.e., the 1/30-probability and 1/2-probability conditions)
improves forecast accuracy, especially if realization probability is higher (1/2 as opposed to
1/30). The AIA forecast generates a demand curve the closest to the actual demand curve of
the holdout sample.
A natural question at this point is whether one can forecast demand as accurately using
simple extrapolation methods instead of the more-complex AIA model. One can use data from
incentive alignment (i.e., the two interim probability conditions) and extrapolate to the case
where realization probability equals 1. To answer this question, we estimate an individual-level
28

Figure 3: Preference Elicitation Methods – A Comparison of Demand Forecast
1600 1800 2000 2200 2400 2600 2800 3000 3200
Price (Diamonds)
0.2
0.25
0.3
0.35
0.4
0.45
0.5
0.55
0.6
0.65
0.7
Dem
and
Incentive Alignment (Prob=1/30)
Incentive Alignment Simple Extrapolation
Stated Preferences (Prob=0)
Actual Demand(Prob=1)
AIA Forecast
Incentive Alignment (Prob=1/2)
Notes. Logistic demand curves. Prob means realization probability.
logistic regression model of purchase decisions as a function of price, realization probability
(1/30 or 1/2), their interaction terms, as well as observed user characteristics (Log-Diamonds
and VIP-Level). The estimates then allow for extrapolation of purchase decisions to the case
of realization probability being 1.
We plot the fitted demand curve, labeled “incentive alignment simple extrapolation,” in Fig-
ure 3. This fitted demand curve is closer to actual demand than the demand curves manifested
in the two incentive alignment conditions. However, simple extrapolation performs notably
worse than the AIA forecast (formal test to follow). This is true although simple extrapolation
uses exactly the same data as the AIA forecast. The AIA forecast performs better here because
it uses the data in a better way by imposing a theoretically sound and empirically validated
behavioral process.
We formally quantify and compare the predictive validity of the preference elicitation meth-
ods presented in Figure 3. The first column of Table 9 reports the estimated logistic price
29

coefficient of each method. Stated preferences perform the worst, with estimated price coeffi-
cient 72% lower in absolute value than in actual purchase settings. Incentive alignment with
realization probabilities of 1/30 and 1/2 perform progressively better, but still produce no-
ticeable forecast errors. The forecast error reduces to around 25% for simple extrapolation of
incentive alignment, and is only 6.6% for the AIA forecast.
Table 9: Preference Elicitation Methods – A Comparison of Predictive Validity
Price Likelihood Ratio Optimal ProfitPreference Elicitation Method Coefficient (vs. Actual) Price LossStated Preferences (Prob=0) -0.0851 198.59∗∗∗ $74.85 90.48%Incentive Alignment (Prob=1/30) -0.1243 29.37∗∗∗ $45.24 49.85%Incentive Alignment (Prob=1/2) -0.1702 22.15∗∗∗ $34.65 22.61%Incentive Alignment Simple Extrapolation -0.2262 16.39∗∗∗ $27.87 6.95%AIA Forecast -0.2833 3.18 $22.92 0.57%Actual Demand (Prob=1) -0.3034 0 $21.09 0
Notes. Calculations are based on logistic demand. Prob means realization probability.∗ p < 0.10, i.e., LR> qχ2(0.9, 2) = 4.6052;∗∗ p < 0.05, i.e., LR> qχ2(0.95, 2) = 5.9915;∗∗∗ p < 0.01, i.e., LR> qχ2(0.99, 2) = 9.2103.
Besides price sensitivity, Figure 3 suggests that different preference elicitation methods
predict different levels of demand. We perform a likelihood ratio (LR) test to determine the
overall fit of forecast demand with actual demand. For each preference elicitation method
k ∈ {Prob = 0, Prob = 1/30, Prob = 1/2, Extrapolation, AIA}, its likelihood ratio is
calculated as LRk = −2[LLPooled− (LLActual +LLk)], where LL represents the log-likelihood of
a logistic demand curve based on observed purchases or simulated purchase probabilities. The
likelihood ratio follows a chi-square distribution with degrees of freedom equal to the difference
in the number of free parameters, which is 2 in our case. The second column of Table 9 reports
the likelihood ratio of each method relative to actual demand. We cannot reject the null
hypothesis that the AIA forecast coincides with actual demand, whereas all the other methods
significantly deviate from actual demand at the p < 0.01 level.
To illustrate the practical value of the AIA method, we calculate the optimal price implied
by the actual demand curve and by the various preference elicitation methods, respectively. We
30
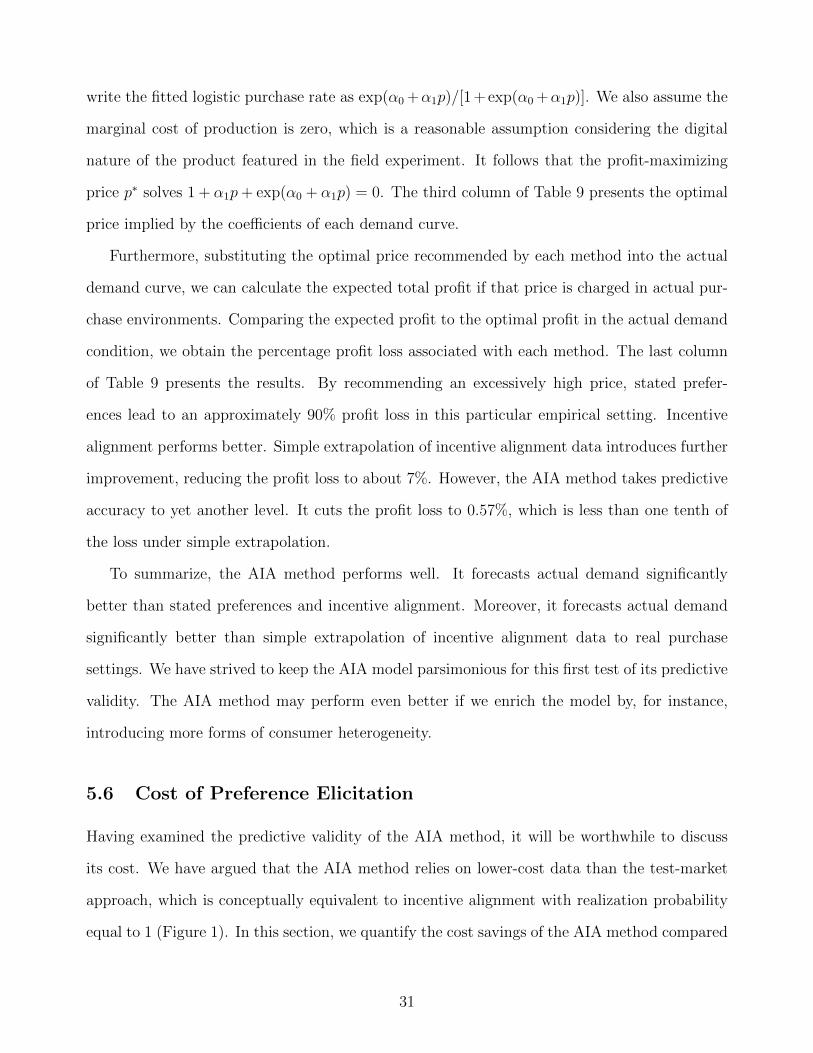
write the fitted logistic purchase rate as exp(α0 +α1p)/[1 + exp(α0 +α1p)]. We also assume the
marginal cost of production is zero, which is a reasonable assumption considering the digital
nature of the product featured in the field experiment. It follows that the profit-maximizing
price p∗ solves 1 + α1p+ exp(α0 + α1p) = 0. The third column of Table 9 presents the optimal
price implied by the coefficients of each demand curve.
Furthermore, substituting the optimal price recommended by each method into the actual
demand curve, we can calculate the expected total profit if that price is charged in actual pur-
chase environments. Comparing the expected profit to the optimal profit in the actual demand
condition, we obtain the percentage profit loss associated with each method. The last column
of Table 9 presents the results. By recommending an excessively high price, stated prefer-
ences lead to an approximately 90% profit loss in this particular empirical setting. Incentive
alignment performs better. Simple extrapolation of incentive alignment data introduces further
improvement, reducing the profit loss to about 7%. However, the AIA method takes predictive
accuracy to yet another level. It cuts the profit loss to 0.57%, which is less than one tenth of
the loss under simple extrapolation.
To summarize, the AIA method performs well. It forecasts actual demand significantly
better than stated preferences and incentive alignment. Moreover, it forecasts actual demand
significantly better than simple extrapolation of incentive alignment data to real purchase
settings. We have strived to keep the AIA model parsimonious for this first test of its predictive
validity. The AIA method may perform even better if we enrich the model by, for instance,
introducing more forms of consumer heterogeneity.
5.6 Cost of Preference Elicitation
Having examined the predictive validity of the AIA method, it will be worthwhile to discuss
its cost. We have argued that the AIA method relies on lower-cost data than the test-market
approach, which is conceptually equivalent to incentive alignment with realization probability
equal to 1 (Figure 1). In this section, we quantify the cost savings of the AIA method compared
31

with test markets. To facilitate comparison, we abstract away from the operational overhead
of obtaining consumer choice data, which is arguably higher for test markets. We focus on the
variable cost of data, which we measure in three ways.
The first cost measure is the expected number of actual products required to achieve a
given sample size of consumer choice data. The number of products matters because it can be
costly and even infeasible for a firm to provide many products before launch. For instance, the
number of products required can impose a serious constraint for new, physical products, or for
small firms that are relying on demand forecast to raise venture funding. For each preference
elicitation method, we compute this cost measure as the sum of expected demand under different
price levels multiplied by the realization probability associated with this elicitation method.
The second cost measure is the amount of budget provided to participants of the choice
task. If participants face liquidity concerns, a common solution in the literature and in practice
is to endow them with a budget. In incentive-aligned choice tasks, a participant whose lottery
succeeds will be provided a certain amount of money (denoted as B) that is enough to buy the
product (i.e., B is greater than the maximum price in the experiment). If the participant has
chosen “willing to buy” at price p, she will receive the product and keep the remaining money
of B − p; if she has chosen “not willing to buy” at price p, she will retain the entire budget
B. The expected cost of endowing participants with this budget equals B multiplied by the
expected number of lottery winners, and is thus proportional to realization probability. This
budgeting cost can be prohibitive if the product is expensive and if realization probabilities are
high.
The third cost measure is more “theoretical.” By definition, to calibrate the demand curve
by varying prices in an experiment, the firm must sell the product at multiple price levels,
some if not all of which will be suboptimal. We thus define this data cost as the opportunity
cost of selling the product at suboptimal prices for the purpose of experimentation. More
specifically, for all products sold in the experiment, we calculate this opportunity cost as the
additional amount of profit the firm could have expected to earn had it sold this product with
perfect information of demand in real purchase settings. Intuitively, the opportunity cost should
32

increase with realization probability as more products will be sold for real at suboptimal prices.
To summarize, by using incentive alignment data with less-than-one realization probabilities,
the AIA method is likely to save costs compared with test markets. We quantify the cost
comparison based on data from the field experiment. Note that the first two aspects of cost
are not a concern in our field experiment – the product is virtual with zero marginal cost
of production, and liquidity is not a problem because users are able to pay for the product
automatically using diamonds banked in their accounts. Nevertheless, for completeness, we
draw on data from the field experiment to illustrate the cost-effectiveness of the AIA method
on all three cost measures.
Indeed, we find that the AIA method dramatically reduces the cost of data on all three mea-
sures. Compared with test markets, the AIA method requires 34.5% of the number of products,
26.7% of participant budget, and -116.3% of opportunity cost of selling. The opportunity cost
even turns out negative because, compared with actual purchase settings, participants are less
price sensitive and more willing to buy at high prices in interim-probability conditions. As such,
the AIA method ends up generating even more profits in the field experiment than the firm
would have earned with perfect knowledge of demand in real purchase environments. Whether
this will happen in other applications of the AIA method depends on the specific choices of
prices, realization probabilities, and the shape of manifested demand under these realization
probabilities. However, we expect the cost-saving feature of the AIA method compared with
test markets to be generally applicable.
Finally, note that the three cost measures are calculated based on the field experiment which
assigns an equal number of participants to the 1/30-probability and 1/2-probability conditions.
In future applications of the AIA method, one may be able to cut costs further by optimizing
the allocation of sample size across probability conditions, and by optimizing the choice of
realization probabilities.
33

6 Concluding Remarks
In this paper, we advocate the view that humans do not automatically know their preferences,
but can learn their preferences through costly effort when given the proper incentive. In the
context of preference elicitation, we argue that the relationship between price and demand,
which forms the basis of many economic and managerial decisions, is not exogenously given
as often assumed, but is an endogenous function of the elicitation method. In other words,
preference is a manifestation of what people are willing to uncover.
To fix ideas, we focus on the effect of realization probability on manifested demand. Com-
monly used in choice experiments, realization probability refers to the probability with which a
participant’s stated product choice is realized as an actual transaction. Our theory model pre-
dicts that manifested price sensitivity increases with realization probability. We find supporting
evidence of this prediction and of the preference-learning mechanism from a large-scale field
experiment on a mobile game platform. These findings allow us to develop an augmented in-
centive alignment (AIA) method that accurately forecasts real demand from inexpensive choice
experiment data of small to moderate realization probabilities.
There are a number of ways to extend this research. We have chosen realization probabilities
somewhat arbitrarily for a first test of the AIA method. As mentioned in the previous section,
it will be meaningful to investigate the optimal choice of realization probabilities, as well as
the size of each probability condition, especially if the cost of experimentation is a concern. To
provide a clean proof of concept, we have also kept the choice task simple. A valuable extension
is to study preference learning about multi-attribute products. More broadly, the findings of
the paper are relevant to incentive compatibility design in choice experiments. While inducing
truth-telling has been the focus of many research efforts to date, our results suggest that the
notion of truth-finding also deserves attention.
The paper has several limitations worth addressing in future research.10 First, we present a
simple model that abstracts away from established behavioral decision theories such as prospect
10We thank an anonymous reviewer for pointing out these limitations.
34

theory. Consumers’ preference-learning incentives may depend on how actual price compares
with their reference price, and how loss averse these consumers are. Second, although our model
allows for varying degrees of prior valuation uncertainty, for radically new products, consumers
may have difficulty forming prior beliefs, and the price itself may impose an anchoring effect
on consumers’ perception of product value. Third, our model focuses on risk-neutral purchase
decisions without income constraints, and may not generalize to situations where products are
difficult to liquidate or are substantially expensive. Last but not least, the product featured in
the field experiment is a virtual package on a mobile game platform. It will be important to
examine the performance of the AIA method in other contexts with different products, including
physical products and products that need to be purchased with real currencies.
We would like to conclude by emphasizing one implication of our findings – that even
microfounded models are not necessarily immune to the critique of Lucas (1976). To the
extent that individual consumer price sensitivity is endogenous to the preference elicitation
method, it will be worthwhile to ask if what have been commonly accepted as “deep preference
parameters” are always policy-invariant. In fact, the reason our method is able to forecast
well out-of-sample is that it allows consumer preferences to change under different policies
(i.e., different realization probabilities), whereas its underlying decision process remains policy-
invariant. Correspondingly, our modeling approach is structural in the sense of Marschak (1953)
and the Cowles Commission, which has been pursued by many others, most notably Heckman
(e.g., Heckman and Vytlacil 2007). Our findings echo their view that policy invariance is an
important driver of externality validity.
35

References
Balli, H. O. and B. E. Sørensen (2013). Interaction effects in econometrics. Empirical Eco-
nomics 45 (1), 583–603.
Becker, G. M., M. H. DeGroot, and J. Marschak (1964). Measuring utility by a single-response
sequential method. Behavioral science 9 (3), 226–232.
Ben-Akiva, M., D. McFadden, and K. Train (2019). Foundations of stated preference elicita-
tion: Consumer behavior and choice-based conjoint analysis. Foundations and Trends R© in
Econometrics 10 (1–2), 10–144.
Bettman, J. R., E. J. Johnson, and J. W. Payne (1990). A componential analysis of cognitive
effort in choice. Organizational Behavior and Human Decision Processes 45 (1), 111–139.
Camerer, C. and R. Hogarth (1999). The effects of financial incentives in experiments: A review
and capital-labor-production framework. Journal of Risk and Uncertainty 19 (1-3), 7–42.
Camerer, C. and D. Mobbs (2017). Differences in behavior and brain activity during hypothet-
ical and real choices. Trends in Cognitive Sciences 21 (1), 46–56.
Caplin, A. and M. Dean (2015). Revealed preference, rational inattention, and costly informa-
tion acquisition. American Economic Review 105 (7), 2183–2203.
Chassang, S., G. P. I. Miquel, and E. Snowberg (2012). Selective trials: A principal-agent
approach to randomized controlled experiments. American Economic Review 102 (4), 1279–
1309.
Cummings, R. G., G. W. Harrison, and E. E. Rutstrom (1995). Homegrown values and hy-
pothetical surveys: Is the dichotomous choice approach incentive-compatible? American
Economic Review 85 (1), 260–266.
Diamond, P. A. and J. A. Hausman (1994). Contingent valuation: Is some number better than
no number? Journal of Economic Perspectives 8 (4), 45–64.
36

Ding, M. (2007). An incentive-aligned mechanism for conjoint analysis. Journal of Marketing
Research 44 (2), 214–223.
Ding, M., R. Grewal, and J. Liechty (2005). Incentive-aligned conjoint analysis. Journal of
Marketing Research 42 (1), 67–82.
Greene, W. (2010). Testing hypotheses about interaction terms in nonlinear models. Economics
Letters 107 (2), 291–296.
Guo, L. and J. Zhang (2012). Consumer deliberation and product line design. Marketing
Science 31 (6), 995–1007.
Hauser, J. R. and V. R. Rao (2004). Conjoint analysis, related modeling, and applications. In
Marketing Research and Modeling: Progress and Prospects, pp. 141–168. Springer.
Hauser, J. R., G. L. Urban, and B. D. Weinberg (1993). How consumers allocate their time
when searching for information. Journal of Marketing Research 30 (4), 452–466.
Heckman, J. J. and E. J. Vytlacil (2007). Econometric evaluation of social programs, part i:
Causal models, structural models and econometric policy evaluation. In J. J. Heckman and
E. E. Leamer (Eds.), Handbook of Econometrics, Volume 6B, pp. 4779–4874. Elsevier.
Huang, Y. and B. J. Bronnenberg (2018). Pennies for your thoughts: Costly product consider-
ation and purchase quantity thresholds. Marketing Science 37 (6), 1009–1028.
Kaas, K. P. and H. Ruprecht (2006). Are the Vickrey auction and the BDM mechanism really
incentive compatible? Empirical results and optimal bidding strategies in cases of uncertain
willingness-to-pay. Schmalenbach Business Review 58 (1), 37–55.
Kleinberg, R., B. Waggoner, and E. G. Weyl (2018). Descending price optimally coordinates
search. Working paper .
Kuksov, D. and J. M. Villas-Boas (2010). When more alternatives lead to less choice. Marketing
Science 29 (3), 507–524.
37

Lichtenstein, S. and P. Slovic (2006). The Construction of Preference. Cambridge University
Press.
Lucas, R. (1976). Econometric policy evaluation: A critique. The Phillips Curve and La-
bor Markets. Carnegie-Rochester Conference Series on Public Policy , New York: American
Elsevier.
Marschak, J. (1953). Economic measurement for policy and prediction. In W. C. Hood and
T. C. Koopmans (Eds.), Studies in Econometric Method, pp. 1–26. New York: Wiley.
Miller, K. M., R. Hofstetter, H. Krohmer, and Z. J. Zhang (2011). How should consumers’
willingness to pay be measured? An empirical comparison of state-of-the-art approaches.
Journal of Marketing Research 48 (1), 172–184.
Mitchell, R. C. and R. T. Carson (1989). Using Surveys to Value Public Goods: The Contingent
Valuation Method. Resources for the Future.
Olenski, S. (2017). How to launch your first proof of concept. Forbes , September 27.
Payne, J. W., J. R. Bettman, and E. J. Johnson (1993). The Adaptive Decision Maker. Cam-
bridge University Press.
Pett, M. A. (1997). Nonparametric Statistics for Health Care Research: Statistics for Small
Samples and Unusual Distributions. Sage Publications.
Rao, V. R. (2014). Applied Conjoint Analysis. Springer-Verlag Berlin Heidelberg.
Roberts, J. H. and G. L. Urban (1988). Modeling multiattribute utility, risk, and belief dynamics
for new consumer durable brand choice. Management Science 34 (2), 167–185.
Shugan, S. M. (1980). The cost of thinking. Journal of Consumer Research 7 (2), 99–111.
Silk, A. J. and G. L. Urban (1978). Pre-test-market evaluation of new packaged goods: A
model and measurement methodology. Journal of Marketing Research 15 (2), 171–191.
38

Simester, D. (2017). Field experiments in marketing. In E. Duflo and A. Banerjee (Eds.),
Handbook of Economic Field Experiments, 1st Edition. North Holland: Elsevier.
Simonson, I. (2008). Will I like a “medium” pillow? Another look at constructed and inherent
preferences. Journal of Consumer Psychology 18 (3), 155–169.
Toubia, O., M. G. de Jong, D. Stieger, and J. Fuller (2012). Measuring consumer preferences
using conjoint poker. Marketing Science 31 (1), 138–156.
Train, K. E. (2009). Discrete Choice Methods with Simulation. Cambridge University Press.
Urban, G. L. and G. M. Katz (1983). Pre-test-market models: Validation and managerial
implications. Journal of Marketing Research, 221–234.
Villas-Boas, J. M. (2009). Product variety and endogenous pricing with evaluation costs. Man-
agement Science 55 (8), 1338–1346.
Wathieu, L. and M. Bertini (2007). Price as a stimulus to think: The case for willful overpricing.
Marketing Science 26 (1), 118–129.
Wernerfelt, B. (1994). Selling formats for search goods. Marketing Science 13 (3), 298–309.
Wertenbroch, K. and B. Skiera (2002). Measuring consumers’ willingness to pay at the point
of purchase. Journal of Marketing Research 39 (2), 228–241.
Wilcox, N. T. (1993). Lottery choice: Incentives, complexity and decision time. Economic
Journal 103 (421), 1397–1417.
Yang, L. C., O. Toubia, and M. G. de Jong (2015). A bounded rationality model of information
search and choice in preference measurement. Journal of Marketing Research 52 (2), 166–183.
Yang, L. C., O. Toubia, and M. G. de Jong (2018). Attention, information processing, and choice
in incentive-aligned choice experiments. Journal of Marketing Research 55 (6), 783–800.
39

Appendix
A.1 Proof of Proposition 1
Proof. First, consider the case of µ < p. Rearranging terms yields
t∗(r, p;µ) =r
c
∫ µ−p
−∞(µ− e− p)g(e)de. (A1)
Taking derivatives then yields
∂t∗(r, p;µ)
r=
1
c
∫ µ−p
−∞(µ− e− p)g(e)de, (A2)
∂t∗(r, p;µ)
∂|p− µ|= −r
c
∫ µ−p
−∞g(e)de, (A3)
∂2t∗(r, p;µ)
∂r∂|p− µ|= −1
c
∫ µ−p
−∞g(e)de. (A4)
(A2) ≥ 0, (A3) ≤ 0, (A4) ≤ 0, where the inequality holds strictly if g(·) has positive support
everywhere over (−∞,∞).
Second, consider the remaining case of µ ≥ p. Note that µ − p =∫∞−∞(µ − p − e)g(e)de
because∫∞−∞ g(e)de = 1 by definition and
∫∞−∞ eg(e)de = 0 by assumption. Rearranging terms
yields
t∗(r, p;µ) =r
c
∫ ∞µ−p
(e− µ+ p)g(e)de. (A5)
Taking derivatives then yields
∂t∗(r, p;µ)
r=
1
c
∫ ∞µ−p
(e− µ+ p)g(e)de, (A6)
∂t∗(r, p;µ)
∂|p− µ|= −r
c
∫ ∞µ−p
g(e)de, (A7)
∂2t∗(r, p;µ)
∂r∂|p− µ|= −1
c
∫ ∞µ−p
g(e)de. (A8)
(A6) ≥ 0, (A7) ≤ 0, (A8) ≤ 0, where the inequality holds strictly if g(·) has positive support
everywhere over (−∞,∞).
40

A.2 Proof of Proposition 2
Proof. First, consider the case of µ < p. Rearranging terms yields
D(r, p;µ) =
∫t∗(r, p;µ)1(µ− e ≥ p)g(e)de
= t∗(r, p;µ)
∫ µ−p
−∞g(e)de. (A9)
Taking derivatives yields
∂D(r, p;µ)
∂p=∂t∗(r, p;µ)
∂p
∫ µ−p
−∞g(e)de− t∗(r, p;µ)g(µ− p), (A10)
and that
∂2D(r, p;µ)
∂r∂p=∂2t∗(r, p;µ)
∂r∂p
∫ µ−p
−∞g(e)de− ∂t∗(r, p;µ)
∂rg(µ− p). (A11)
Recall from Proposition 1 that ∂2t∗(r, p;µ)/∂r∂p ≤ 0 when µ < p and that ∂t∗(r, p;µ)/∂r ≥ 0,
where the inequality holds strictly if g(·) has positive support everywhere over (−∞,∞). It
follows that (A11) ≤ 0, where the inequality holds strictly if g(·) has positive support everywhere
over (−∞,∞).
Second, consider the case of µ > p. (Note that D(r, p;µ) may not be continuous at µ = p,
in which case ∂D(r, p;µ)/∂p does not exist.) Rearranging terms yields
D(r, p;µ) =
∫ [t∗(r, p;µ)1(µ− e ≥ p) +
(1− t∗(r, p;µ)
)]g(e)de
= 1− t∗(r, p;µ)
∫ ∞µ−p
g(e)de. (A12)
Taking derivatives yields
∂D(r, p;µ)
∂p= −∂t
∗(r, p;µ)
∂p
∫ ∞µ−p
g(e)de− t∗(r, p;µ)g(µ− p), (A13)
41

and that
∂2D(r, p;µ)
∂r∂p= −∂
2t∗(r, p;µ)
∂r∂p
∫ ∞µ−p
g(e)de− ∂t∗(r, p;µ)
∂rg(µ− p). (A14)
Recall from Proposition 1 that ∂2t∗(r, p;µ)/∂r∂p ≥ 0 when µ > p and that ∂t∗(r, p;µ)/∂r ≥ 0,
where the inequality holds strictly if g(·) has positive support everywhere over (−∞,∞). It
follows that (A14) ≤ 0, where the inequality holds strictly if g(·) has positive support everywhere
over (−∞,∞).
42
Related Documents