B O N N E V I L L E P O W E R A D M I N I S T R A T I O N 2012 BPA Final Rate Proposal Power Loads and Resources Study July 2011 BP-12-FS-BPA-03

Welcome message from author
This document is posted to help you gain knowledge. Please leave a comment to let me know what you think about it! Share it to your friends and learn new things together.
Transcript

B O N N E V I L L E P O W E R A D M I N I S T R A T I O N
2012 BPA Final Rate Proposal
Power Loads and Resources Study
July 2011
BP-12-FS-BPA-03

POWER LOADS AND RESOURCES STUDY
TABLE OF CONTENTS
Page
Commonly Used Acronyms .......................................................................................................... iii
1. INTRODUCTION AND OVERVIEW ...............................................................................1 1.1 Introduction..............................................................................................................1 1.2 Overview of Methodology.......................................................................................2
2. FEDERAL SYSTEM LOAD OBLIGATION FORECAST................................................5 2.1 Overview..................................................................................................................5 2.2 Public Agencies’ Total Retail Load and Firm Requirement PSC Obligation
Forecasts ..................................................................................................................5 2.2.1 Load-Following PSC Obligation Forecasts .................................................6 2.2.2 Slice/Block PSC Obligation Forecasts.........................................................7 2.2.3 Sum of Load-Following and Slice/Block PSC Obligation Forecasts ..........9
2.3 Investor-Owned Utilities Sales Forecast..................................................................9 2.4 Direct Service Industry Sales Forecast ..................................................................10 2.5 USBR Irrigation District Obligations ....................................................................10 2.6 Other BPA Contract Obligations ...........................................................................11
3. RESOURCE FORECAST .................................................................................................13 3.1 Federal System Resource Forecast ........................................................................13
3.1.1 Overview....................................................................................................13 3.1.2 Federal System Hydro Generation.............................................................13
3.1.2.1 Regulated Hydro Generation Forecast........................................13 3.1.2.2 Independent Hydro Generation Forecast ....................................23
3.1.3 Other Federal System Generation..............................................................24 3.1.4 Other Federal System Contract Purchases.................................................25
3.2 Regional Hydro Resources ....................................................................................27 3.2.1 Overview....................................................................................................27 3.2.2 PNW Regional 70 Water Year Hydro Generation.....................................27
3.3 4(h)(10)(C) Credits ................................................................................................27 3.3.1 Overview....................................................................................................27 3.3.2 Forecast of Power Purchases Eligible for 4(h)(10)(C) Credits..................28
3.4 Use of Tier 1 System Firm Critical Output Calculation ........................................30
4. FEDERAL SYSTEM LOAD-RESOURCE BALANCE...................................................31 4.1 Overview................................................................................................................31 4.2 Federal System Energy Load-Resource Balance...................................................32
BP-12-FS-BPA-03 Page i

TABLES Table 1 Regional Dialogue Preference Load Obligation Forecast By Product Annual
Energy in aMW...............................................................................................................33 Table 2 Loads and Resources – Federal System Summary Annual Energy in aMW................. 33 Table 3 Loads and Resources – Federal System Components Annual Energy in aMW............ 34
BP-12-FS-BPA-03 Page ii
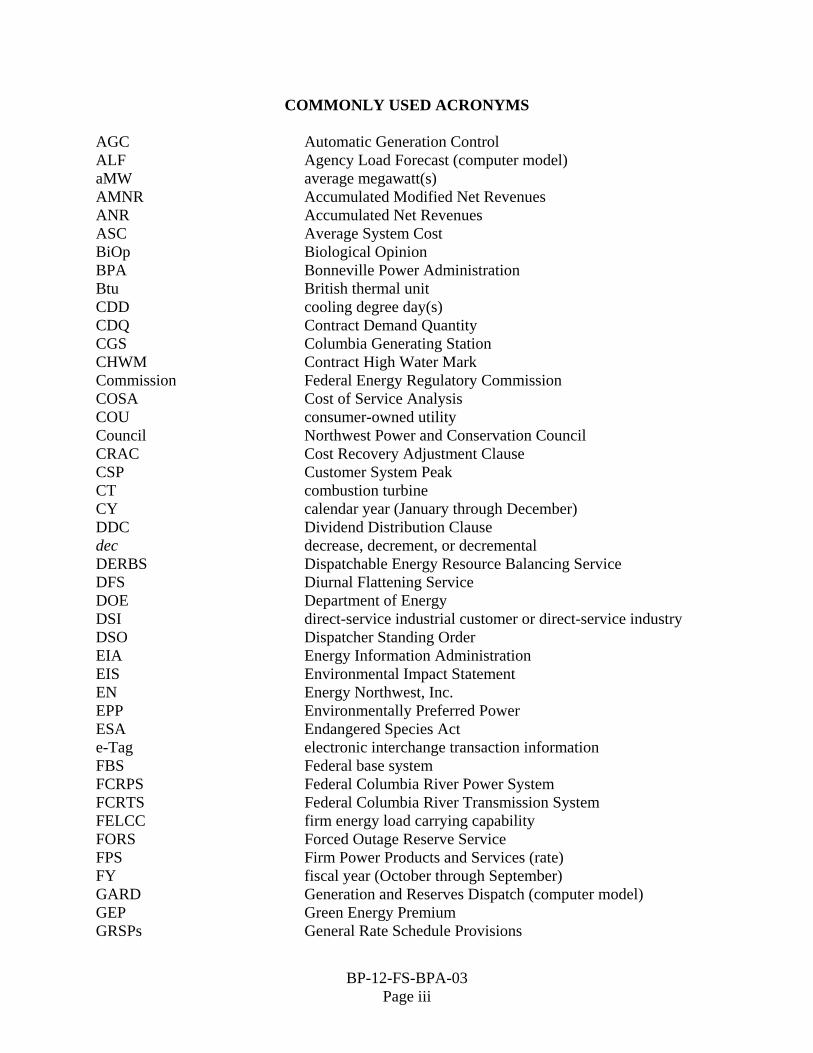
COMMONLY USED ACRONYMS AGC Automatic Generation Control ALF Agency Load Forecast (computer model) aMW average megawatt(s) AMNR Accumulated Modified Net Revenues ANR Accumulated Net Revenues ASC Average System Cost BiOp Biological Opinion BPA Bonneville Power Administration Btu British thermal unit CDD cooling degree day(s) CDQ Contract Demand Quantity CGS Columbia Generating Station CHWM Contract High Water Mark Commission Federal Energy Regulatory Commission COSA Cost of Service Analysis COU consumer-owned utility Council Northwest Power and Conservation Council CRAC Cost Recovery Adjustment Clause CSP Customer System Peak CT combustion turbine CY calendar year (January through December) DDC Dividend Distribution Clause dec decrease, decrement, or decremental DERBS Dispatchable Energy Resource Balancing Service DFS Diurnal Flattening Service DOE Department of Energy DSI direct-service industrial customer or direct-service industry DSO Dispatcher Standing Order EIA Energy Information Administration EIS Environmental Impact Statement EN Energy Northwest, Inc. EPP Environmentally Preferred Power ESA Endangered Species Act e-Tag electronic interchange transaction information FBS Federal base system FCRPS Federal Columbia River Power System FCRTS Federal Columbia River Transmission System FELCC firm energy load carrying capability FORS Forced Outage Reserve Service FPS Firm Power Products and Services (rate) FY fiscal year (October through September) GARD Generation and Reserves Dispatch (computer model) GEP Green Energy Premium GRSPs General Rate Schedule Provisions
BP-12-FS-BPA-03 Page iii
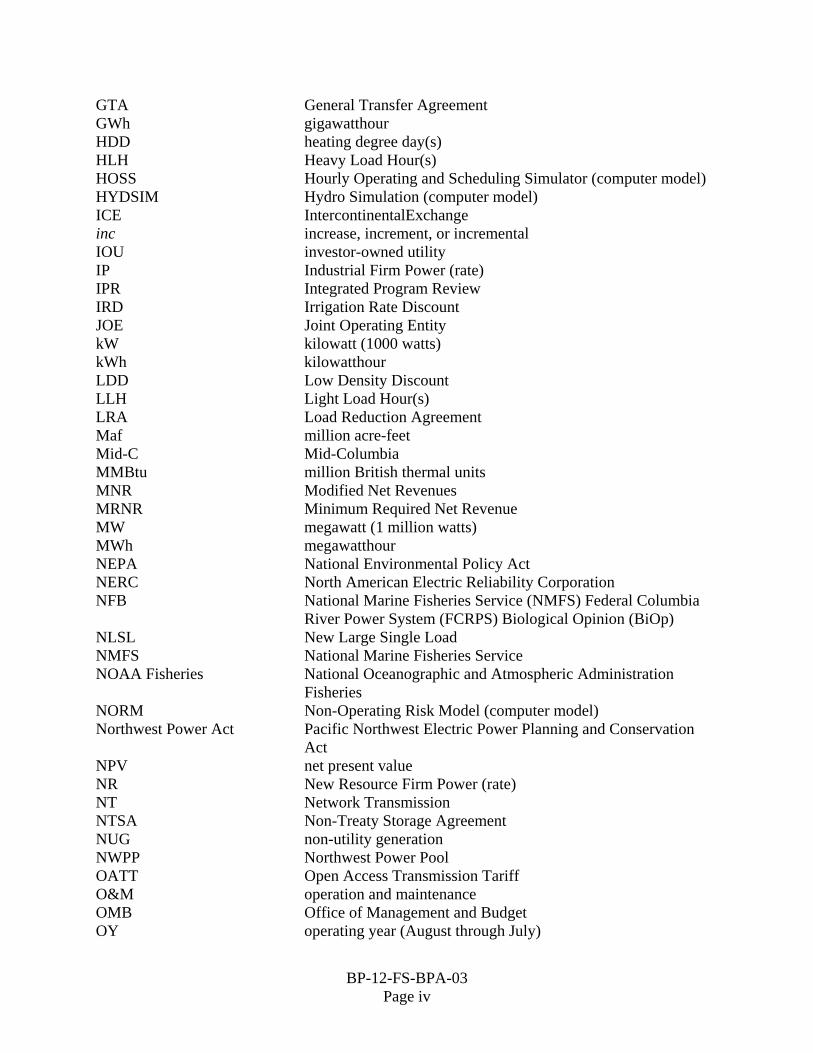
GTA General Transfer Agreement GWh gigawatthour HDD heating degree day(s) HLH Heavy Load Hour(s) HOSS Hourly Operating and Scheduling Simulator (computer model) HYDSIM Hydro Simulation (computer model) ICE IntercontinentalExchange inc increase, increment, or incremental IOU investor-owned utility IP Industrial Firm Power (rate) IPR Integrated Program Review IRD Irrigation Rate Discount JOE Joint Operating Entity kW kilowatt (1000 watts) kWh kilowatthour LDD Low Density Discount LLH Light Load Hour(s) LRA Load Reduction Agreement Maf million acre-feet Mid-C Mid-Columbia MMBtu million British thermal units MNR Modified Net Revenues MRNR Minimum Required Net Revenue MW megawatt (1 million watts) MWh megawatthour NEPA National Environmental Policy Act NERC North American Electric Reliability Corporation NFB National Marine Fisheries Service (NMFS) Federal Columbia
River Power System (FCRPS) Biological Opinion (BiOp) NLSL New Large Single Load NMFS National Marine Fisheries Service NOAA Fisheries National Oceanographic and Atmospheric Administration
Fisheries NORM Non-Operating Risk Model (computer model) Northwest Power Act Pacific Northwest Electric Power Planning and Conservation
Act NPV net present value NR New Resource Firm Power (rate) NT Network Transmission NTSA Non-Treaty Storage Agreement NUG non-utility generation NWPP Northwest Power Pool OATT Open Access Transmission Tariff O&M operation and maintenance OMB Office of Management and Budget OY operating year (August through July)
BP-12-FS-BPA-03 Page iv

PF Priority Firm Power (rate) PFp Priority Firm Public (rate) PFx Priority Firm Exchange (rate) PNCA Pacific Northwest Coordination Agreement PNRR Planned Net Revenues for Risk PNW Pacific Northwest POD Point of Delivery POI Point of Integration or Point of Interconnection POM Point of Metering POR Point of Receipt Project Act Bonneville Project Act PRS Power Rates Study PS BPA Power Services PSW Pacific Southwest PTP Point to Point Transmission (rate) PUD public or people’s utility district RAM Rate Analysis Model (computer model) RAS Remedial Action Scheme RD Regional Dialogue REC Renewable Energy Certificate Reclamation or USBR U.S. Bureau of Reclamation REP Residential Exchange Program RevSim Revenue Simulation Model (component of RiskMod) RFA Revenue Forecast Application (database) RHWM Rate Period High Water Mark RiskMod Risk Analysis Model (computer model) RiskSim Risk Simulation Model (component of RiskMod) ROD Record of Decision RPSA Residential Purchase and Sale Agreement RR Resource Replacement (rate) RSS Resource Support Services RT1SC RHWM Tier 1 System Capability RTO Regional Transmission Operator SCADA Supervisory Control and Data Acquisition SCS Secondary Crediting Service Slice Slice of the System (product) T1SFCO Tier 1 System Firm Critical Output TCMS Transmission Curtailment Management Service TOCA Tier 1 Cost Allocator TPP Treasury Payment Probability Transmission System Act Federal Columbia River Transmission System Act TRL Total Retail Load TRM Tiered Rate Methodology TS BPA Transmission Services TSS Transmission Scheduling Service UAI Unauthorized Increase
BP-12-FS-BPA-03 Page v

BP-12-FS-BPA-03 Page vi
ULS Unanticipated Load Service USACE U.S. Army Corps of Engineers USBR or Reclamation U.S. Bureau of Reclamation USFWS U.S. Fish and Wildlife Service VERBS Variable Energy Resources Balancing Service (rate) VOR Value of Reserves WECC Western Electricity Coordinating Council (formerly WSCC) WIT Wind Integration Team WSPP Western Systems Power Pool

1. INTRODUCTION AND OVERVIEW 1
2
4
5
6
7
8
9
10
11
12
13
14
15
16
17
18
19
20
21
22
23
24
25
26
1.1 Introduction 3
The Power Loads and Resources Study (Study) contains the load and resource data used to
develop Bonneville Power Administration’s (BPA’s) wholesale power rates. This Study
illustrates how each component of the loads and resources analysis is completed, how the
components relate to each other, and how they fit into the rate development process. The Power
Loads and Resources Study Documentation (Documentation), BP-12-FS-BPA-03A, contains
details and results supporting this Study.
This Study has two primary purposes: (1) to determine BPA’s load and resource balance
(load-resource balance), and (2) to calculate various inputs that are used in other studies and
calculations within the rate case. The purpose of BPA’s load-resource balance analysis is to
determine whether BPA’s resources meet, are less than, or are greater than BPA’s load for the
rate period, fiscal years (FY) 2012–2013. If BPA’s resources are less than the amount of load
forecast for the rate period, some amount of system augmentation is required to achieve
load-resource balance.
This Study provides inputs into various other studies and calculations in the ratemaking process.
The results of this Study provide data to: (1) the Power Revenue Requirement Study,
BP-12-FS-BPA-02; (2) the Power Rates Study (PRS), BP-12-FS-BPA-01; (3) the Power
Risk and Market Price Study, BP-12-FS-BPA-04; and (4) the Generation Inputs Study,
BP-12-FS-BPA-05.
BP-12-FS-BPA-03 Page 1
1.2 Overview of Methodology 1
This Study includes three main components: (1) load data, including a forecast of the Federal
system load and contract obligations; (2) resource data, including Federal system resource and
contract purchase estimates, total Pacific Northwest (PNW) regional hydro resource estimates,
and the estimated amount of power purchases that are eligible for section 4(h)(10)(C) credits;
and (3) the Federal system load-resource balance, which compares Federal system sales, loads,
and contract obligations to the Federal system generating resources and contract purchases.
2
3
4
5
6
7
8
9
10
11
12
13
14
15
16
17
18
19
20
21
22
23
24
25
26
27
The first component of the Study, the Federal system load obligation forecast, estimates the firm
energy that BPA expects to serve during FY 2012–2013 under firm requirements contract
obligations and other BPA contract obligations. The load estimates are discussed in section 2 of
this Study and are detailed in the Documentation.
The second component of the Study is the resource component, which includes the forecast of
(1) Federal system resources, (2) PNW regional hydro resources, and (3) power purchases
eligible for 4(h)(10)(C) credits. The Federal system resource forecast includes hydro and
non-hydro generation estimates plus power deliveries from BPA contract purchases. The
Federal system resource estimates are discussed in section 3.1 of this Study and are detailed in
the Documentation. The PNW regional hydro resources include all hydro resources in the
Pacific Northwest, whether Federally or non-Federally owned. Energy generation estimates of
the PNW regional hydro resources are used in the forecast of electricity market prices in the
Power Risk and Market Price Study, BP-12-FS-BPA-04. The regional hydro estimates are
discussed in section 3.2 of this Study and are detailed in the Documentation. The resource
estimates used to calculate the 4(h)(10)(C) credits are discussed in section 3.3 of this Study, and
the estimated power purchases eligible for 4(h)(10)(C) credits are detailed in the Documentation.
These 4(h)(10)(C) credits are taken by BPA to offset the non-power share of fish and wildlife
costs incurred as mitigation for the impact of the Federal hydro system. See section 3.3.1.
BP-12-FS-BPA-03 Page 2
BP-12-FS-BPA-03 Page 3
1
2
3
4
5
6
7
8
9
10
11
12
13
14
15
16
17
18
19
20
21
22
23
24
25
26
27
The third component of this Study is the Federal system load-resource balance, which completes
BPA’s load and resource picture by comparing total Federal system load obligations to Federal
system resource output for FY 2012–2013. Federal system resources under critical water
conditions minus loads yields BPA’s estimated Federal system monthly and annual firm energy
surplus or deficit. If there is an annual average firm energy deficit, system augmentation is
added to Federal system resources to balance loads and resources. The load-resource balance is
discussed in section 4 of this Study and is detailed in the Documentation.
Throughout the Study and Documentation, the loads and resource forecasts are shown using
three different measurements. The first, energy in average megawatts (aMW), is the average
amount of energy produced or consumed over a month. The second measurement, heavy load
hours in megawatthours (MWh), is the total MWh generated or consumed over heavy load hours.
Heavy load hours (referred to as either Heavy or HLH) can vary by contract, but generally are
hours 6 a.m. to 10 p.m. (or Hour Ending (HE) 0007 to HE 2200), Monday through Saturday,
excluding NERC holidays. The third measurement, light load hours in MWh, is the total MWh
generated or consumed over light load hours. Light load hours (referred to as either Light or
LLH) can vary by contract, but generally are hours 10 p.m. to 6 a.m. (or HE 2300 to HE 0006),
Monday through Saturday, all day Sunday, and holidays defined by NERC. These
measurements are used to ensure that BPA will have adequate resources to meet the variability
of loads.

This page intentionally left blank.
BP-12-FS-BPA-03 Page 4

2. FEDERAL SYSTEM LOAD OBLIGATION FORECAST 1
2
4
5
6
7
8
9
10
11
12
13
15
16
17
18
19
20
21
22
23
24
25
26
27
2.1 Overview 3
The Federal System Load Obligation forecast includes: (1) BPA’s projected firm requirements
power sales contract (PSC) obligations to consumer-owned utilities (COUs) and Federal
agencies (together, for purposes of this Study, called Public Agencies or Public Agency
Customers); (2) PSC obligations to investor-owned utilities (IOUs); (3) PSC obligations to
direct-service industries (DSIs); (4) contract obligations to the U.S. Bureau of Reclamation
(USBR); and (5) other BPA contract obligations, including contract obligations outside the
Pacific Northwest region (Exports) and contract obligations within the Pacific Northwest region
(Intra-Regional Transfers (Out)). Summaries of BPA’s forecast of these obligations follow in
this section.
2.2 Public Agencies’ Total Retail Load and Firm Requirement PSC Obligation 14 Forecasts
In December of 2008, BPA executed power sales contracts with Public Agencies under which
BPA is obligated to provide power deliveries starting on October 1, 2011, and continuing
through September 30, 2028. These Contract High Water Mark (CHWM) contracts replace
BPA’s previous power sales contracts, known as Subscription contracts. Three types of these
CHWM contracts were offered to customers: Load-Following, Slice/Block, and Block (with or
without Shaping Capacity). One hundred eighteen Public Agency customers signed the
Load-Following contracts, 17 signed the Slice/Block contract, and none signed the Block
contract.
Under the CHWM contracts, customers must make elections to serve their Above Rate Period
High Water Mark (RHWM) load by (1) adding new non-Federal resources, (2) buying power
from sources other than BPA, and/or (3) requesting BPA to supply power. Above-RHWM load
BP-12-FS-BPA-03 Page 5

is the amount of load established by BPA every two years for each customer that is in excess of
the customer’s right to purchase at Tier 1 rates. Power Rates Study, BP-12-FS-BPA-01,
section 1.6. Any Above-RHWM load that customers elect to meet by either adding new
non-Federal resources or buying power from sources other than BPA is not included in this
Study because BPA does not have an obligation to serve that load. Based on the Public Agency
customers’ elections, this Study assumes BPA will supply 21 aMW of Above-RHWM load in
FY 2012 and 57 aMW in FY 2013.
1
2
3
4
5
6
7
8
10
11
12
13
14
15
16
17
18
19
20
21
22
23
24
25
26
2.2.1 Load-Following PSC Obligation Forecasts 9
The Load-Following product provides firm power to meet the customer’s total retail load, less
the firm power from the customer’s non-Federal resource generation amounts and purchases
from other suppliers used to serve its total retail load.
The total monthly firm energy requirements PSC obligation forecast for Public Agency
customers that purchase the Load-Following product is based on the sum of the utility-specific
firm requirements PSC obligation forecasts, which are customarily produced by BPA analysts.
The method used for preparing the firm requirements PSC obligation forecasts is as follows.
First, utility-specific forecasts of total retail load are produced using least-squares
regression-based models on historical monthly energy loads. These models may include several
independent variables, such as a time trend, heating degree days, cooling degree days, and
monthly indicator variables. Heating and cooling degree days are measures of temperature
effects to account for changes in electricity usage related to temperature changes. Heating
degree days are calculated when the temperature is below a base temperature, such as
65 degrees, and similarly, cooling degree days are calculated when the temperature is above a
base temperature. The results from these computations are utility-specific monthly forecasts of
BP-12-FS-BPA-03 Page 6

total retail energy load. The total retail energy load is then split into HLH and LLH time periods
using recent historical relationships.
1
2
3
4
5
6
7
8
9
10
11
12
13
14
15
16
17
18
19
20
22
23
24
25
26
27
The monthly peak loads are forecast in a similar fashion as the energy loads, including the use of
historical data for the customers’ peaks.
Second, estimates of customer-owned and consumer-owned dedicated resource generation and
contract purchases dedicated to serve retail loads are subtracted from the utility-specific total
retail load forecasts to produce a firm requirement PSC obligation forecast for each utility.
These firm requirement PSC obligation forecasts provide the basis for the Load-Following
product sales projections incorporated in BPA ratemaking.
A list of the 118 Public Agency customers that have purchased the Load-Following product is
shown in the Documentation, Table 1.1.1. BPA’s forecast of the total Public Agency PSC
obligation is summarized in Documentation Table 1.2.1 for energy, Table 1.2.2 for HLH, and
Table 1.2.3 for LLH, on lines 2 (Federal Entities) and 8 (Load-Following 2012 PSC). This
forecast is also included in the calculation of the load-resource balance, Table 4.1.1 for energy,
Table 4.1.2 for HLH, and Table 4.1.3 for LLH, on lines 1 (Federal Entities) and
5 (Load-Following 2012 PSC).
2.2.2 Slice/Block PSC Obligation Forecasts 21
The Slice/Block product provides firm requirements power to serve the customer’s total retail
load up to its planned net requirement. For each Fiscal Year, the planned annual Slice amount
will be adjusted based on BPA’s calculation of the customer’s planned net requirement under the
contract. The Block portion of the Slice/Block product provides a planned amount of firm
requirements power in a fixed monthly shape, while the Slice portion provides planned amounts
of firm requirements power in the shape of BPA’s generation from the Tier 1 System.
BP-12-FS-BPA-03 Page 7
The PSC obligation of the total Slice product monthly energy firm requirements is forecast by
multiplying the monthly RHWM Tier 1 System Capability by the sum of the individual
customers’ Slice Percentages as stated in Slice/Block contracts. The sum of the individual
customers’ Slice Percentages for FY 2012 and 2013 is 26.8541 percent.
1
2
3
4
5
6
7
10
11
12
13
14
15
16
17
18
19
20
21
22
23
24
25
26
The PSC obligation of the Block product monthly energy firm requirements for each Slice/Block
customer is forecast as follows:
1. Forecast the planned annual net requirements load. 8
2. Compute the planned annual amount of firm requirements power available through the 9
Slice Product by multiplying the annual RHWM Tier 1 System Capability by the Slice
Percentage stated in the customer’s Slice/Block contract.
3. Compute the annual Block product firm requirements obligation by subtracting the Slice
annual amount of firm requirements power (Step 2) from the planned annual net
requirement (Step 1).
4. Compute each month’s Block product firm requirements obligation by multiplying the
annual Block product firm requirements obligation (Step 3) by each month’s block
shaping factor stated in the customer’s Slice/Block contract.
The total monthly Block product firm requirements obligation is computed as the sum of the
monthly Block product firm requirements obligations, computed in step 4 above, for each
Slice/Block customer.
A list of the 17 Slice/Block customers is shown in the Documentation, Table 1.1.2. BPA’s
forecast of the total Slice/Block PSC Obligation is summarized in Documentation Table 1.2.1 for
energy, in Table 1.2.2 for HLH, and in Table 1.2.3 for LLH, on Lines 12 (Slice 2012 PSC) and
14 (Slice/Block 2012 PSC)). This forecast is also included in the calculation of the load-resource
BP-12-FS-BPA-03 Page 8
balance, Table 4.1.1 for energy, Table 4.1.2 for HLH, and Table 4.1.3 for LLH, on
lines 7 (Slice 2012 PSC) and 8 (Slice/Block 2012 PSC).
1
2
3
5
6
7
8
9
10
11
12
13
14
15
16
18
19
20
21
22
23
24
25
26
2.2.3 Sum of Load-Following and Slice/Block PSC Obligation Forecasts 4
The sum of the projected firm requirements PSC obligations for customers with CHWM
contracts comprises the Public Agencies (Preference) portion of the Priority Firm Public (PFp)
load obligation forecast. Each customer’s load obligation forecast accounts for the reported
amount of conservation that the customer plans to achieve during the FY 2012–2013 rate period.
The amount of anticipated BPA-funded conservation beyond what the customers have reported is
also accounted for in the total load obligation forecast. Thus, the sum of the projected firm
requirements PSC obligations for customers with CHWM contracts is reduced based on the total
anticipated BPA-funded conservation savings during the rate period. The total conservation
reductions are estimated to be 22.6 aMW for FY 2012 and 29.7 aMW for FY 2013. Table 1
presents the PF load obligation by product and total PF load obligation adjusted for conservation
savings.
2.3 Investor-Owned Utilities Sales Forecast 17
The six IOUs in the PNW region are Avista Corporation, Idaho Power Company, NorthWestern
Energy Division of NorthWestern Corporation (formerly Montana Power Company), PacifiCorp,
Portland General Electric Company, and Puget Sound Energy, Inc. Most of the IOUs have
signed BPA power sales contracts for FY 2011 through 2028; however, no IOUs choose to take
service under these contracts. If requested, BPA would serve any net requirements of an IOU at
the New Resource Firm Power (NR-12) rate. No net requirements power sales to regional IOUs
are forecast for FY 2012–2013 based on BPA’s current contracts with the regional IOUs. The
IOUs will receive benefits under the settlement of the Residential Exchange Program (REP), but
these benefits are not in the form of actual power deliveries.
BP-12-FS-BPA-03 Page 9

2.4 Direct Service Industry Sales Forecast 1
Currently BPA is making power sales deliveries to Alcoa, Inc. (Alcoa) and Port Townsend Paper
Corporation (Port Townsend). The Port Townsend contract is for 20 aMW and terminates
August 31, 2012. The Alcoa contract is for 320 aMW, and the “initial period” of the contract
extends through May 2012. The Alcoa contract also provides for a contingent power sale, if
certain conditions are met, that would extend the sale for an additional five years. This Study
assumes power sales to the DSIs totaling 340 aMW for each year of the rate period, composed of
320 aMW for Alcoa and 20 aMW for Port Townsend, all sold at the IP-12 rate.
2
3
4
5
6
7
8
9
10
11
12
13
14
16
17
18
19
20
21
22
23
24
25
26
27
The DSI forecast is summarized in Documentation Table 1.2.1 for energy, Table 1.2.2 for HLH,
and Table 1.2.3 for LLH, on Line 6 (Total Direct Service Industry). This forecast is also
included in the calculation of the load-resource balance, Table 4.1.1 for energy, Table 4.1.2 for
HLH, and Table 4.1.3 for LLH, on Line 3 (DSI Obligation).
2.5 USBR Irrigation District Obligations 15
BPA is obligated to provide power from the Federal system to several irrigation districts
associated with USBR projects in the Pacific Northwest. These irrigation districts have been
Congressionally authorized to receive power from specified Federal Columbia River Power
System (FCRPS) projects as part of the USBR project authorization. BPA does not contract
directly with these irrigation districts; instead, there are several agreements between BPA and
USBR that provide details on the power deliveries.
A list of USBR irrigation district obligation customers is shown in Documentation Table 1.1.3.
BPA’s forecast of the total USBR customer load is summarized in Table 1.2.1 for energy,
Table 1.2.2 for HLH, and Table 1.2.3 for LLH, on Line 4 (Total U.S. Bureau of Reclamation).
This forecast is also included in the calculation of the load-resource balance, Table 4.1.1 for
energy, Table 4.1.2 for HLH, and Table 4.1.3 for LLH, on Line 2 (USBR Obligation).
BP-12-FS-BPA-03 Page 10
BP-12-FS-BPA-03 Page 11
2
3
4
5
6
7
8
9
10
11
12
13
14
15
16
17
18
19
20
21
22
23
24
25
26
2.6 Other BPA Contract Obligations 1
BPA provides Federal power to customers under a variety of contract arrangements not included
in the Public Agencies, IOU, DSI, or USBR forecasts. These contracts include obligations
outside the Pacific Northwest region (Exports) and obligations within the Pacific Northwest
region. Intra-Regional Transfers (Out) are categorized as: (1) power sales; (2) power or energy
exchanges; (3) capacity sales or capacity-for-energy exchanges; (4) power payments for services;
and (5) power commitments under the Columbia River Treaty. These arrangements, collectively
called “Other Contract Obligations,” are specified by individual contract provisions and can have
different delivery arrangements and rate structures. BPA’s Other Contract Obligations are
assumed to be served by Federal system firm resources regardless of weather, water, or
economic conditions. These Other Contract Obligations are modeled individually and are
specified or estimated for monthly energy in aMW, HLH MWh, and LLH MWh.
Trading floor sales during the rate period are not included in BPA’s load-resource balance used
in ratemaking. Revenue impacts of these contract obligations are reflected as presales of
secondary energy and are included as secondary revenues credited to non-Slice customers’ rates.
These contracts are accounted for in the Power Risk and Market Price Study, BP-12-FS-BPA-04,
section 2.5.
The Pacific Northwest region Contract Obligations (Exports) are detailed in Documentation
Table 1.3.1 for energy, Table 1.3.2 for HLH, and Table 1.3.3 for LLH. The Pacific Northwest
Intra-Regional Transfers (Out) Contract Obligations are detailed in Documentation Table 2.8.1
for energy, Table 2.8.2 for HLH, and Table 2.8.3 for LLH, on Line 22 (Total Contracts Out).
This forecast is also included in the calculation of the load-resource balance, Table 4.1.1 for
energy, Table 4.1.2 for HLH, and Table 4.1.3 for LLH, on Lines 10 (Exports) and 11 (Regional
Transfers (Out)).

This page intentionally left blank.
BP-12-FS-BPA-03 Page 12
3. RESOURCE FORECAST 1
2
5
6
7
8
9
10
11
12
13
14
16
17
18
19
20
21
22
23
25
26
27
3.1 Federal System Resource Forecast 3
3.1.1 Overview 4
In the Pacific Northwest, BPA is the Federal power marketing agency charged with marketing
power and transmission to serve the firm electric load needs of its customers. BPA does not own
generating resources; rather, BPA markets power from Federal and non-Federal generating
resources to meet Federal load obligations. In addition, BPA purchases power through contracts
that add to the Federal system generating capability. These resources and contract purchases are
collectively called “Federal system resources” in this Study. Federal system resources are
classified as Federal regulated and independent hydro projects, non-Federal independent hydro
projects, other non-Federal resources (renewable, cogeneration, large thermal, wind, and
non-utility generation (NUG) projects), and Federal contract purchases.
3.1.2 Federal System Hydro Generation 15
Federal system hydro resources are comprised of the generation from regulated and independent
hydro projects. Regulated projects and the process used for estimating the generation of
regulated hydro projects are detailed in section 3.1.2.1. Independent hydro projects and the
methodology for forecasting generation of independent hydro projects are described in
section 3.1.2.2. BPA also purchases the output from a small NUG hydro project with generation
estimates provided by the project’s owner. NUG hydro project output estimates are assumed not
to vary by water year and are described in section 3.1.3.
3.1.2.1 Regulated Hydro Generation Forecast 24
BPA markets the generation from the Federal system hydro projects, listed in Documentation
Table 2.1.1, Lines 1-14. These projects are owned and operated by either the USACE or USBR.
BP-12-FS-BPA-03 Page 13
This Study uses BPA’s hydro regulation model, HYDSIM, to estimate the Federal system energy
production that can be expected from specific hydroelectric power projects in the PNW
Columbia River Basin when operating in a coordinated fashion and meeting power and
non-power requirements for 70 water years (October 1928 through September 1998). The hydro
projects modeled in HYDSIM are called regulated hydro projects. The hydro regulation study
uses individual project operating characteristics and conditions to determine energy production
expected from each specific project. Physical characteristics of each project come from annual
Pacific Northwest Coordination Agreement (PNCA) data submittals from regional utilities and
government agencies involved in the coordination and operation of regional hydro projects. The
HYDSIM model incorporates the physical characteristics along with power and non-power
operating requirements to provide project-by-project monthly energy generation estimates for the
Federal system regulated hydro projects that vary by water year.
1
2
3
4
5
6
7
8
9
10
11
12
13
14
15
16
17
18
19
20
21
22
23
24
25
26
27
There are two main steps of the hydro regulation studies that estimate regulated hydro generation
production. First, an Actual Energy Regulation study (AER step) is run in HYDSIM to
determine the operation of the hydro system under each of the 70 historical water conditions
while meeting the Firm Energy Load Carrying Capability (FELCC) produced in the PNCA final
hydro regulation. In this step, the Canadian operation is fixed to the best available assured
operating plan (AOP) or detailed operating plan (DOP) for the Study, which is the 2012 DOP in
this Study. Also in this step, the U.S. Federal, U.S. non-Federal, and Canadian reservoirs draft
water to meet the Coordinated System FELCC, while continuing to meet individual reservoir
non-power operating requirements. Second, a 70-year operational study (OPER step) is run in
HYDSIM with the estimated regional firm loads developed for each year of the Study and with
any deviations from the PNCA data submittals necessary to reflect expected operations during
the rate period. In the OPER step the non-Federal projects are fixed to their operations from the
AER step, and the Federal projects operate differently based on the deviations from PNCA data
and the estimated regional firm load. In summary, the AER step is run based on PNCA data to
BP-12-FS-BPA-03 Page 14

determine the operation of the non-Federal projects, and the OPER step is run to determine the
operation of the Federal projects based on PNCA data plus additional assumptions needed to
reflect expected operations. The end result of these two steps is generally referred to as the
hydro regulation study.
1
2
3
4
5
6
7
8
9
10
11
12
13
14
15
16
17
18
19
20
21
22
23
24
25
26
27
Separate hydro regulation studies are incorporated for each year of the rate period for this Study.
By modeling hydro regulation studies for individual years, the hydro generation estimates
capture changes in variables that characterize yearly variations in the hydro operations due to
firm loads, firm resources, markets for hydro energy products in better than critical water
conditions, and project operating limitations and requirements. These variables affect the
amount and timing of energy available from the hydro system and are changed as necessary to
reflect current expectations. Sections 3.1.2.1.1 through 3.1.2.1.4 contain additional details on the
process of producing the regulated hydro generation estimates used in this Study.
BPA’s forecast for the Federal system regulated hydro generation is detailed in Documentation
Table 2.1.1 for energy. An aggregate of the Federal system regulated hydro generation is
summarized for HLH in Table 2.1.2, and for LLH in Table 2.1.3. See Line 8 (Total Regulated
Hydro w/Enc.). The HLH and LLH split is based on the aggregated Federal system regulated
hydro generation estimates produced by BPA’s Hourly Operating and Scheduling Simulator
(HOSS) analyses, which incorporates the same HYDSIM hydro regulation studies as its base
input. The HOSS model is described in the Generation Inputs Study, BP-12-FS-BPA-05,
Section 3.2.4. This forecast is also included in the calculation of the load-resource balance,
Table 4.1.1 for energy, Table 4.1.2 for HLH, and Table 4.1.3 for LLH, on Line 15 (Regulated
Hydro).
The energy for the net regulated hydro generation is provided to the Power Risk and Market
Price Study, BP-12-FS-BPA-04. The HLH and LLH Federal system regulated hydro generation
BP-12-FS-BPA-03 Page 15

estimates are later combined with the Federal system independent hydro HLH-LLH split in the
Power Risk and Market Price Study.
1
2
3
5
6
7
8
9
10
11
12
13
14
15
16
17
18
19
20
21
22
23
24
25
3.1.2.1.1 Assumptions in the HYDSIM Hydro Regulation Study 4
The HYDSIM studies incorporate the power and non-power operating requirements expected to
be in effect during the rate period, including those described in the NOAA Fisheries FCRPS
Biological Opinion (BiOp) regarding salmon and steelhead, published May 5, 2008; the U.S.
Fish and Wildlife Service (USFWS) FCRPS BiOp regarding bull trout and sturgeon, published
December 20, 2000; the USFWS Libby BiOp regarding bull trout and sturgeon, published
February 18, 2006; relevant operations described in the Northwest Power and Conservation
Council’s (NPCC’s) Fish and Wildlife Program; and other fish mitigation measures. Each hydro
regulation study specifies particular hydroelectric project operations for fish, such as seasonal
flow objectives, minimum flow levels for fish, spill for juvenile fish passage, reservoir target
elevations and drawdown limitations, and turbine operation efficiency requirements.
Additionally, HYDSIM uses hydro plant operating characteristics in combination with power
and non-power requirements to simulate the coordinated operation of the hydro system. These
operating requirements include but are not limited to storage content limits determined by rule
curves, maximum project draft rates determined by each project owner, and flow and spill
objectives described in the NOAA Fisheries and USFWS BiOps listed above and as provided by
the 2010 PNCA data submittals. Some deviations from the 2010 PNCA data submittals are
necessary in order to more accurately model anticipated operations for the rate period, such as
fine-tuning the study to reflect typical in-season management decisions that are not reflected in
the 2010 PNCA data submittals.
BP-12-FS-BPA-03 Page 16

The hydro regulation studies include sets of power and non-power requirements for each year of
the rate period. Specific assumptions for the HYDSIM hydro regulation study are detailed in the
Documentation, BP-12-FS-BPA-03A, section 3.
1
2
3
4
5
6
7
8
9
10
11
12
13
14
15
16
17
18
19
20
21
22
23
24
25
26
27
Several changes have been made to the hydro modeling since the WP-10 Loads and Resources
study. These changes have been made as part of BPA’s continuous efforts to incorporate the
most recent available data in the model and to improve hydro regulation modeling to more
accurately reflect operations. The following are the updates to the HYDSIM hydro regulation
studies included in this Study:
All projects have been updated to 2010 PNCA data. These updates are too numerous
to list in their entirety and tend to be minor. The following are some of the more
noteworthy PNCA data updates:
Libby September minimum flows for bull trout decreased to 6000 cfs (previously
7000–9000 cfs in the WP-10 Loads and Resources Study).
Hungry Horse maximum outflow decreased to 9500 cfs.
Grand Coulee generation table increased 1 percent to account for efficiency
improvements that were previously being added in Loads and Resources Studies
after HYDSIM modeling.
Grand Coulee pumping data have been updated.
Mica, Arrow, and Duncan plant data have been updated to better reflect physical
project characteristics.
Flood Control rule curves have been updated to the most recent data provided by the
USACE. The new flood control rule curves reflect:
BC Hydro’s change to Duncan’s storage reservation diagram, which results in
small differences in February (0–28 ksfd).
1600 cfs minimum outflow at Dworshak, which primarily affects the rule curves
in March, April, and May.
BP-12-FS-BPA-03 Page 17
Libby December flood control based on December forecasts when available
(1949–1998), while other years are still based on January forecasts.
1
2
3
4
5
6
7
8
9
10
11
12
13
14
15
16
17
18
19
20
21
22
23
24
25
Grand Coulee’s updated rule curves to account for the Dworshak and Duncan
changes.
Canadian project operations have been updated to the 2012 DOP, which generally
decreased Arrow outflow on average in October, December, January, April, May,
June, and September and increased Arrow outflow on average in November,
February, March, July, and August.
Loads and Hydro Independents have been updated to the 2010 White Book Study
analysis. HYDSIM uses the residual hydro load for the region, which is calculated by
subtracting the regional firm non-hydro resources from the total regional firm load.
The Total Retail Loads in FY 2012 and FY 2013 have decreased and the non-hydro
resources have increased since the WP-10 Loads and Resources Study. As a result,
the updated residual hydro loads in HYDSIM are about 1,990 aMW lower in
FY 2012 and about 2,120 aMW lower in FY 2013 when compared to the WP-10
Study.
Miscellaneous updates have been made to better reflect expected actual operations:
Libby modeling includes a refill flow calculation in May, improved sturgeon
pulse modeling, smoothed summer flows, and slightly reshaped fall draft to
completely avoid spill in all years.
Dworshak’s outflow has been reshaped to reduce spill February through June and
to smooth July through August flows.
Hungry Horse’s summer draft has been reshaped to smooth flows better, avoid a
double-peak of flows in the summer, and still reach the Montana proposal
end-of-September draft elevations.
BP-12-FS-BPA-03 Page 18

Albeni Falls has been held at the winter elevation (2053 feet) only through
April 15 instead of through April 30, allowing Albeni Falls to fill in the second
half of April.
1
2
3
4
5
6
7
8
9
10
11
12
13
14
15
16
17
18
19
20
21
22
23
24
25
26
27
Grand Coulee’s January through March operation has been reshaped when
possible to spread the secondary energy more evenly and place more secondary
energy in January and February.
Updated modeling has been incorporated to more accurately reflect the frequency
of forced drafts for drum gate maintenance at Grand Coulee. This update reduces
the frequency of forced drafts for maintenance, as the project drafts deep enough
for other reasons to perform the maintenance in most years without forcing the
draft specifically for maintenance purposes.
Kerr’s operation has been updated to reflect more recent typical operations.
There are several minor spill updates compared to the WP-10 Loads and Resources
Study:
Ice Harbor is assumed to spill 30 percent of the total river discharge during the
summer (the WP-10 Study assumed 35 percent) June 16–August 16 (previously
assumed June 16–August 15).
John Day is assumed to spill 30 percent of the total river discharge during the
spring and summer April 10–August 31 (the WP-10 Study assumed 30 percent
April 10–19, 35 percent April 20–July 20, and 30 percent July 21–August 31).
The Dalles sluiceway is assumed to operate March 1–December 15 using about
3 kcfs flow for fish passage (the WP-10 Study assumed April 1–November 30).
This is treated as miscellaneous flow and included as “other” spill in HYDSIM.
Bonneville’s total dissolved gas cap has been updated to 120 kcfs given the
discontinued use of the Camas-Washougal gage for limiting spill. Therefore,
Bonneville’s spring spill operation of 100 kcfs is no longer limited by the
dissolved gas cap (previously 96 kcfs during the spring).
BP-12-FS-BPA-03 Page 19
Bonneville’s summer spill operation has been updated to reflect the 2010 test of
two different alternating operations June 16–August 31: (1) 95 kcfs spill 24 hours
per day, and (2) 85 kcfs day spill and 121 kcfs night spill. These two operations
provide roughly the same amount of spill on average as the previous spill
assumption of 85 kcfs day spill and dissolved gas cap night spill.
1
2
3
4
5
6
7
8
9
10
11
12
13
14
15
16
17
18
19
20
21
22
23
24
25
26
27
Federal powerhouse availability factors have been updated to include the average
2001–2009 powerhouse outages, additional large planned outages, and more recent
wind and operating reserve requirement assumptions. See Generation Inputs Study,
BP-12-FS-BPA-05, sections 2 and 4.5, for details on reserve requirements. These
wind and operating reserve requirement updates are incorporated into the availability
factors in HYDSIM and reduce the powerhouse generating capability. The additional
large planned outages at Chief Joseph are reflected by reducing the 2001–2009
average availability factors by an additional two 88-MW units out of service from
April 2010 through August 2014. The additional large planned outages at Grand
Coulee are reflected by basing Grand Coulee availability factors on 2009 and 2010
average actual outages and reducing these availability factors by one additional
805 MW unit.
The method of estimating lack of market spill has been changed from the method
used in the WP-10 Loads and Resources Study. The WP-10 Study used a constant
10,000 aMW secondary market limit in all periods of all years in HYDSIM to
estimate lack-of-market spill. For BP-12, the AURORAxmp model was used to
estimate lack-of-market spill.
These combined changes generally increase annual average Federal generation about 178 aMW
in FY 2012 and 175 aMW in FY 2013 under 1937 critical water conditions and increase the
70-year average Federal generation about 161 aMW in FY 2012 and 0 aMW in FY 2013
compared to the WP-10 Loads and Resources Study. The separate effects of each modeling
BP-12-FS-BPA-03 Page 20
change have not been analyzed; however, it does not appear that any one single change caused
significant effects. The increases are probably attributable to a few of the more significant
changes, which include the updated Canadian project operations, the updated operations at Libby
and Kerr, and the updated estimates of lack-of-market spill.
1
2
3
4
5
6
7
8
9
10
11
12
13
14
15
16
17
18
19
20
21
22
24
25
26
The differences in the hydro regulation studies for FY 2012 and FY 2013 are:
(1) The hydro availability factors used to model anticipated unit outages and the standard
reserve requirements are estimated for each study year. The outages associated with
anticipated maintenance are the same in the FY 2012 and FY 2013 studies. The
availability factors are adjusted to reflect the different amount of reserve requirements
estimated for each year, including the forecast wind reserve requirements (operating
reserves and increases and decreases in balancing reserve capacity (incs and decs)).
See Generation Inputs Study, BP-12-FS-BPA-05, sections 2 and 4.5, for details on
wind reserve assumptions.
(2) The residual hydro loads assumed in HYDSIM are different in the two hydro
regulation studies. The loads incorporated in the FY 2013 hydro regulation study are
slightly higher than the loads projected for the FY 2012 hydro regulation study,
mainly due to load growth, but also due to changes in regional thermal resources.
(3) The amounts of spill due to lack of market are different in the two hydro regulation
studies. These differences come from the AURORAxmp model, which simulated the
different anticipated market conditions in the two years.
3.1.2.1.2 70-Year Modified Streamflows 23
The HYDSIM model uses streamflows from historical years as the basis for estimating power
production of the hydroelectric system. The AER step and OPER step HYDSIM studies are
developed using the year-2000 level of modified historical streamflows. Historical streamflows
BP-12-FS-BPA-03 Page 21
are modified to reflect the changes over time due to the effects of irrigation and consumptive
diversion demand, return flow, and changes in contents of upstream reservoirs and lakes. These
modified streamflows were developed under a BPA contract funded by the PNCA parties. The
modified streamflows are also adjusted in this study to include updated estimates of Grand
Coulee irrigation pumping and resulting downstream return flows, using data provided by USBR
in its 2010 PNCA data submittal.
1
2
3
4
5
6
7
8
9
10
11
12
13
14
15
16
17
18
19
20
21
22
23
24
25
26
Seventy years of streamflow data are used because hydro is a variable resource with a high
degree of variability in output from year to year. The Study uses a 70-year hydro regulation
study to forecast the expected operations of the regulated hydro projects for varying hydro
conditions. Approximately 80 percent of BPA’s Federal system resource stack is comprised of
hydro generation, which can vary annually by about 5,000 aMW depending on water conditions.
The hydro regulation simulation model HYDSIM estimates regulated hydro project generation
for varying water conditions, which takes into account specific flows, volumes of water,
elevations at dams, biological opinions, and many other aspects of the hydro system. Given the
variability of hydro generation, as many years as possible should be modeled; 70 years is the
largest number of years for which all the historical data are available as needed by HYDSIM.
Additionally, BPA has generation estimates for other hydro projects that are based on
70 historical water conditions, October 1928 through September 1998. These projects are called
“independent hydro” projects because their operations are not regulated in this HYDSIM study,
primarily because they have much less storage capability than the hydro projects in the Columbia
River Basin regulated in the HYDSIM study. The independent hydro projects usually have
generation estimates for each of the 70 water years of record. Most of these hydro projects are
not Federally owned, and their generation estimates are updated with the cooperation of each
project owner. For those independent hydro projects that did not have data for all 70 water
BP-12-FS-BPA-03 Page 22
years, generation estimates were expanded using the project’s median generation to estimate
generation for the additional water years.
1
2
3
5
6
7
8
9
10
11
12
13
14
15
16
18
19
20
21
23
24
25
26
3.1.2.1.3 1937 Critical Water for Firm Planning 4
To ensure that it has sufficient generation to meet load, BPA bases its resource planning on
critical water conditions. Under critical water conditions, the PNW hydro system would produce
the least amount of power while taking into account the historical streamflow record, power and
non-power operating constraints, the planned operation of non-hydro resources, and system load
requirements. For operational purposes, BPA assumes critical water conditions during the
eight-month critical period of September 1936 through April 1937. For planning purposes and to
align with the fiscal years used in this Study, however, the Study uses the historical streamflows
from October 1936 through September 1937 water conditions as the critical period. This is
termed “1937 critical water conditions.” The hydro generation estimates under 1937 critical
water conditions determine the critical period firm energy for the regulated and independent
hydro projects. This is called the FELCC, or firm energy load carrying capability.
3.1.2.1.4 Generation Performance Curves 17
The HYDSIM generation forecast for this analysis incorporates updated generation performance
curves for the regulated hydro Federal hydro projects, and therefore no generation additions for
additional efficiency improvements are needed.
3.1.2.2 Independent Hydro Generation Forecast 22
Federal system independent hydro includes hydro projects whose generation output typically
varies by water conditions; however, the generation forecasts for these projects are not modeled
or regulated in the HYDSIM model. BPA markets the power from independent hydro projects
that are owned and operated by USBR, USACE, or other project owners. Federal system
BP-12-FS-BPA-03 Page 23

independent hydro generation estimates are provided by individual project owners for 70 water
years (October 1928 through September 1998). These include power purchased from hydro
projects owned by Lewis County Public Utility District (Cowlitz Falls), Mission Valley
(Big Creek), and Idaho Falls Power (Bulb Turbine projects). Tables 2.2.1, 2.2.2, and 2.2.3,
lines 1-21, list the hydro projects included in BPA’s Independent Hydro Generation forecast.
1
2
3
4
5
6
7
8
9
10
11
12
13
14
15
16
18
19
20
21
22
23
24
25
26
The energy estimates for Federal system independent hydro generation used in this Study are
described in the Documentation, Section 2.2, Table 2.2.1 for energy, Table 2.2.2 for HLH, and
Table 2.2.3 for LLH. This forecast is also included in the calculation of the load-resource
balance, Table 4.1.1 for energy, Table 4.1.2 for HLH, and Table 4.1.3 for LLH, on Line 16
(Independent Hydro).
The HLH-LLH split for the independent hydro generation estimates is developed based on actual
historical data. This Study provides the HLH and LLH Federal system independent hydro
generation to the Power Risk and Market Price Study, BP-12-FS-BPA-04.
3.1.3 Other Federal System Generation 17
Other Federal system generation includes the purchased output from non-Federally owned
projects and project generation that is directly assigned to BPA. Other Federal system
generation estimates are detailed for monthly energy in aMW and HLH and LLH megawatthours
as follows.
(1) Renewable resources, which include wind resources (Federal purchases of shares of
the Condon Wind Project; Foote Creek 1, 2, and 4 Wind Projects; Klondike I Wind
Project; Klondike III Wind Project; and Stateline Wind project). These projects are
detailed in the Documentation, Section 2.4, Table 2.4.1 for energy, Table 2.4.2 for
HLH, and Table 2.4.3 for LLH. This forecast is also included in the calculation of the
BP-12-FS-BPA-03 Page 24

load-resource balance, Table 4.1.1 for energy, Table 4.1.2 for HLH, and Table 4.1.3
for LLH, on Line 21 (Renewables).
1
2
3
4
5
6
7
8
9
10
11
12
13
14
15
16
17
18
19
20
21
22
23
25
26
27
(2) Cogeneration resources include the Georgia Pacific (Wauna) project. This project is
detailed in the Documentation, Table 2.5.1 for energy, Table 2.5.2 for HLH, and
Table 2.5.3 for LLH. This forecast is also included in the calculation of the load-
resource balance, Table 4.1.1 for energy, Table 4.1.2 for HLH, and Table 4.1.3 for
LLH, on Line 22 (Cogeneration).
(3) Columbia Generating Station (CGS), which incorporates facility improvements and a
two-year refueling cycle. CGS details are shown in the Documentation, Table 2.6.1
for energy, Table 2.6.2 for HLH, and Table 2.6.3 for LLH. This forecast is also
included in the calculation of the load-resource balance, Table 4.1.1 for energy,
Table 4.1.2 for HLH, and Table 4.1.3 for LLH, on Line 27 (Large Thermal).
(4) Non-Utility Generation, which includes: solar resources (Ashland Solar Project and
White Bluffs Solar); and small hydro (Dworshak/Clearwater Small Hydro project).
Non-Utility Generation is detailed in the Documentation, Table 2.9.1 for energy,
Table 2.9.2 for HLH, and Table 2.9.3 for LLH. This forecast is also included in the
calculation of the load-resource balance, Table 4.1.1 for energy, Table 4.1.2 for HLH,
and Table 4.1.3 for LLH, on Line 28 (Non-Utility Generation).
The decommissioning of the Elwha and Glines Canyon hydro projects began on June 1, 2011,
which is before the beginning of the rate period. Therefore, generation estimates for these
projects are not included in the Study.
3.1.4 Other Federal System Contract Purchases 24
BPA purchases or receives power under a variety of contractual arrangements to help meet
Federal load obligations. The contracts are categorized as: (1) power purchases; (2) power or
energy exchange purchases; (3) capacity sales or capacity-for-energy exchange contracts;
BP-12-FS-BPA-03 Page 25

(4) power purchased or assigned to BPA under the Columbia River Treaty; and (5) transmission
loss returns under Slice/Block contracts. These arrangements are collectively called “Other
Contract Purchases.” BPA’s Other Contract Purchases are considered firm resources that are
delivered to the Federal system regardless of weather, water, or economic conditions. The
transmission loss returns category captures the return of Slice transmission losses to the Federal
system as part of the Slice/Block contracts, which acts as a Federal system resource.
1
2
3
4
5
6
7
8
9
10
11
12
13
14
15
16
17
18
19
20
21
22
23
24
25
BPA’s within-year balancing and trading floor purchases during the rate case period are not
included in BPA’s load-resource balance. Revenue impacts for within-year balancing purchases
are reflected in the Power Risk and Market Price Study, BPA-12-FS-BPA-04, section 2.6.3.
Revenue impacts from trading floor purchases are reflected in the Power Risk and Market Price
Study, section 2.5.
BPA’s expected Other Contract Purchases are detailed in the Documentation as follows: Imports
are found in Table 2.3.1 for energy, Table 2.3.2 for HLH, and Table 2.3.3 for LLH; Canadian
Entitlement Returns are found in Table 2.7.1 for energy, Table 2.7.2 for HLH, and Table 2.7.3
for LLH; and Intra-Regional Transfers are found in Table 2.8.1 for energy, Table 2.8.2 for HLH,
and Table 2.8.3 for LLH. (Federal Transmission Loss Returns does not have its own table but is
included in the load-resource balance calculation described below.)
The forecast for Other Contract Purchases is also included in the calculation of the load-resource
balance, Table 4.1.1 for energy, Table 4.1.2 for HLH, and Table 4.1.3 for LLH, on lines 23
(Imports), 24 (Regional Transfers (In)), 25 (Non-Fed CER (Canada)), and 26 (Transmission Loss
Returns).
BP-12-FS-BPA-03 Page 26

3.2 Regional Hydro Resources 1
3.2.1 Overview 2
This Study produces total PNW regional hydro resource estimates for FY 2012–2013 to provide
input into the AURORAxmp model for the Power Risk and Market Price Study,
BP-12-FS-BPA-04.
3
4
5
6
8
9
10
11
12
13
14
15
16
17
18
19
20
23
24
25
26
27
3.2.2 PNW Regional 70 Water Year Hydro Generation 7
PNW regional hydro resource estimates are one of the inputs into the AURORAxmp model and
are comprised of regulated and independent hydro, plus NUG hydro for FY 2012–2013 for all
PNW hydro resources, federal and nonfederal. Regulated hydro project generation estimates for
this Study are developed, by month, for each of the 70 water years (October 1928 through
September 1998) using the same HYDSIM study described in section 3.1.2.1. Independent
hydro generation estimates were provided by the project owners for the same 70 water years.
Generation estimates for the NUG hydro projects are provided by the individual project owners
and are assumed not to vary by water year.
The regional regulated, independent, and NUG hydro totals are summarized for 70 water years
for FY 2012–2013 and are shown in the Documentation, section 2.9, Tables 2.9.1, 2.9.2,
and 2.9.3.
3.3 4(h)(10)(C) Credits 21
3.3.1 Overview 22
The Pacific Northwest Electric Power Planning and Conservation Act (Northwest Power Act)
directs BPA to make expenditures to protect, mitigate, and enhance fish and wildlife affected by
the development and operation of Federal hydroelectric projects in the Columbia River Basin
and its tributaries in a manner consistent with the Power Plan and Fish and Wildlife Program
developed by the NPCC and other purposes of the Northwest Power Act. 16 U.S.C. §§ 839–
BP-12-FS-BPA-03 Page 27
839h. BPA recovers, through power rates, the power costs for the Federal hydro projects from
which BPA markets power. However, pursuant to section 4(h)(10)(C) of the Northwest Power
Act, BPA ratepayers are not required to pay for costs allocated to non-power uses of the projects.
These non-power uses include flood control, irrigation, recreation, and navigation. The
percentage of costs attributable to non-power purposes is 22.3 percent. The 22.3 percent is the
systemwide average cost allocation for non-power purposes of the FCRPS such as flood control,
recreation, irrigation, and navigation. These cost allocations are provided by the USBR and
USACE for their hydropower projects.
1
2
3
4
5
6
7
8
9
10
11
12
13
14
15
16
18
19
20
21
22
23
24
25
26
27
The Northwest Power Act allows BPA to annually recoup the portion of costs associated with
fish measures that should be allocated to other non-power uses of the dams through
section 4(h)(10)(C) credits against BPA’s payments to the U.S. Treasury. This Study estimates
the replacement power purchases resulting from changes in hydro system operations to benefit
fish and wildlife, and these power purchases are part of the calculation of estimated 4(h)(10)(C)
credits. These operations to benefit fish and wildlife are described in section 3.1.2.1.1.
3.3.2 Forecast of Power Purchases Eligible for 4(h)(10)(C) Credits 17
BPA receives section 4(h)(10)(C) credits for the non-power portion of additional power
purchases made as a result of operations to benefit fish and wildlife. These power purchases are
estimated by comparing power purchase estimates between two HYDSIM hydro regulation
studies. The first hydro regulation study, termed the “with-fish” study, models hydro system
operations using current requirements for fish mitigation and wildlife enhancement under
70 historical water year conditions (October 1928 through September 1998). The FY 2012
HYDSIM study is used as the “with-fish” study. The second hydro regulation study, called the
“no-fish” study, models the hydro system operation assuming no operational changes were made
to benefit fish and wildlife, using the same 70 historical water-year conditions.
BP-12-FS-BPA-03 Page 28

BPA estimates the power purchases that would be required to meet a specific firm load
(described later) under the with-fish study and the power purchases that would be required to
meet the same specific firm load under the no-fish study. The 4(h)(10)(C) credits do not pertain
to the entire generation difference between the with-fish study and the no-fish study, but instead
the credits pertain only to a portion of the additional power purchases in the with-fish study
compared to the power purchases in the no-fish study. BPA receives section 4(h)(10)(C) credits
for the non-power portion of the additional power purchases it must make in the with-fish study
relative to the no-fish study. The non-power portion is 22.3 percent, which represents the
non-power purposes of the hydro system.
1
2
3
4
5
6
7
8
9
10
11
12
13
14
15
16
17
18
19
20
21
22
23
24
25
26
The specific firm load used in the calculation of 4(h)(10)(C) credits was a part of the original
negotiated arrangement between the U.S. Department of Energy and U.S. Department of
Treasury allowing BPA to claim the credits. A fundamental principle of this arrangement for
claiming section 4(h)(10)(C) credits is that the calculation is not to be affected by BPA’s
marketing decisions. In order to separate the credit calculation from BPA marketing decisions,
4(h)(10)(C) credits are calculated using the load that could have been served with certainty while
drafting the system from full to empty without fish operations and under the worst
energy-producing water conditions in the 70-year record (referred to as the critical period, which
is 1929–1932 in the no-fish study). This FELCC is the amount of firm load that BPA would
have been entitled to sell without fish operations and is used as the firm load in the
section 4(h)(10)(C) power purchases analysis. The differences between the Federal FELCC and
the Federal generation in the with-fish study determine the power purchases under the with-fish
study. The differences between the Federal FELCC and the Federal generation in the no-fish
study determine the power purchases under the no-fish study. The instances where power
purchases are greater in the with-fish study compared to the no-fish study result in power
purchases eligible for section 4(h)(10)(C) credits. Alternatively, when power purchases are less
BP-12-FS-BPA-03 Page 29

BP-12-FS-BPA-03 Page 30
1
2
3
4
5
6
7
8
9
10
11
13
14
15
16
17
18
19
20
21
22
23
24
25
26
in the with-fish study than in the no-fish study, the difference constitutes a negative section
4(h)(10)(C) credit.
The differences in energy purchase amounts between the with-fish and no-fish hydro studies are
calculated for each period and water condition of the 70 water year studies. The differences are
shown in the Documentation, Table 2.11. These power purchases are used as inputs to the
Power Risk and Market Price Study, BP-12-FS-BPA-04, where, combined with AURORAxmp
market price estimates, they are used to calculate the 4(h)(10)(C) credits for power purchases.
The non-power portion (22.3 percent) of the average expense for these purchases is used as the
forecast of section 4(h)(10)(C) credits for Federal hydro system fish operations.
3.4 Use of Tier 1 System Firm Critical Output Calculation 12
The Tier 1 System Firm Critical Output (T1SFCO) is calculated pursuant to section 3.1 of the
Tiered Rate Methodology. Pursuant to the TRM, the T1SFCO is used to calculate each
customer’s RHWM, as well as various billing determinants and other rate components set out in
the Power Rate Study, BP-12-FS-BPA-01. The determination of T1SFCO is not part of this rate
case, and in the future, the T1SFCO will be calculated in advance of the start of the rate case
pursuant to the TRM. However, this year the T1SFCO was used to calculate customers’
RHWMs determined in the CHWM Process that was completed in May 2011. See Power Rate
Study, BP-12-FS-BPA-01, section 1.6. Supporting tables are provided in the Documentation,
section 2.12. Table 2.12.1 contains the summary of the T1SFCO for FY 2012–2013.
Table 2.12.2 contains the Federal System Hydro Generation. Table 2.12.3 contains the
Designated Non-Federally Owned Resources. Table 2.12.4 contains the Designated BPA
Contract Purchases. Table 2.12.5 contains the Designated BPA System Obligations. In tables
2.12.2 through 2.12.5, edits to the categories from the September 2009 TRM tables 3.1 through
3.4 are shown in blue.

4. FEDERAL SYSTEM LOAD-RESOURCE BALANCE 1
2
4
5
6
7
8
9
10
11
12
13
14
15
16
17
18
19
20
21
22
23
24
25
26
27
4.1 Overview 3
In order for BPA to do operational planning and set power rates, the Federal system must be in
load and resource balance; that is, BPA must forecast that it has enough resources available to
serve its forecast loads during critical water conditions. The load-resource balance is composed
of the monthly energy amounts of BPA’s resources, which include hydro, non-hydro, and
contract purchases; less BPA’s load obligations, which are comprised of BPA’s PSC obligations
and Other Contract Obligations.
To determine whether the Federal system is in load-resource balance, the amount of BPA’s
annual forecast firm energy resources under 1937 critical water conditions is estimated. If
BPA’s expected firm energy resources under critical water conditions are sufficient to serve
BPA’s expected load obligations, then BPA is considered to be in load-resource balance. If
BPA’s resources under critical water conditions are less than its load obligations, BPA is
assumed to purchase power or otherwise secure resources to avoid Federal system annual energy
deficits. Purchases to meet these annual firm energy deficits are called system augmentation
purchases. Annual system augmentation purchases may not fully meet monthly Federal system
HLH or LLH energy deficits. Additional purchases made to meet these monthly HLH or LLH
energy deficits are called balancing purchases.
BPA has purchased within-year balancing purchases to cover increasing amounts of forecast
winter HLH energy deficits for FY 2012 and 2013. These purchases are called “winter hedging
purchases.” In addition, BPA has made some surplus purchases and sales that continue into
FY 2012 and 2013. These winter hedging purchases and trading floor activities are not included
in the calculation of BPA’s firm annual load and resource balance in the Loads and Resources
Study. Rather, they are reflected in the Power Risk and Market Price Study, BP-12-FS-BPA-04.
BP-12-FS-BPA-03 Page 31
BP-12-FS-BPA-03 Page 32
2
3
4
5
6
7
8
9
10
11
12
13
14
15
16
17
18
19
20
21
22
23
24
25
26
27
4.2 Federal System Energy Load-Resource Balance 1
Table 2 shows a summary of the Federal system annual energy load-resource balance. Under
1937 critical water conditions, the Federal system is expected to be in firm annual energy surplus
of 25 aMW for FY 2012 and in load-resource balance for FY 2013 assuming 176 aMW of
augmentation purchases. The components of the Federal system load-resource balance are
shown in Table 3, for energy; and in the Documentation, section 4, Table 4.1.1 for energy,
Table 4.2.1 for HLH, and Table 4.3.1 for LLH. Specific system augmentation purchase
estimates are detailed in Documentation Tables 4.1.1, 4.2.1, and 4.3.1, Line 29 (Augmentation
Purchases).

Table 1
Regional Dialogue Preference Load Obligation Forecast By Product
Annual Energy in aMW
A B C Fiscal Year 2012 2013
1. Load-Following Customers (Including Federal Agencies and reduced for BPA-funded conservation) 1/
3,167 3,219
2. Block Only 0 03. Slice 1,934 1,8984. Slice/Block 1,773 1,8495. Total Preference Load Obligations (sum of Lines 1 through 5)
6,874 6,966
1/ BPA-Funded conservation is estimated at 22.6 aMW for FY 2012 and 29.7 aMW for FY 2013.
Table 2
Loads and Resources – Federal System Summary Annual Energy in aMW
A B C
Fiscal Year 2012 2013
1. Loads
2. Firm Obligations 8,305 8,379 3. Resources
4. Total Resources w/o System Augmentation 8,572 8,446 5. System Augmentation Purchases 0 176 6. Federal System Transmission Losses -242 -243
7. Net Total Resources (line 4 +line 5 + Line 6) 8,330 8,379
8. Surplus/Deficit
9. Firm Surplus/Defict (Line 7 - Line 2) 25 0
BP-12-FS-BPA-03 Page 33

BP-12-FS-BPA-03 Page 34
Table 3 Loads and Resources – Federal System Components
Annual Energy in aMW
A B C
Energy (aMW) 2012 2013
Non-Utility Obligations 1. Fed. Agencies 2012 PSC 116 119 2. USBR Obligation 173 174 3. DSI Obligation 341 341 4. Total Firm Non-Utility Obligations 630 633
Transfers Out 5. Load Following 2012 PSC 3,051 3,100 6. Block Only 2012 PSC 0 0 7. Slice 2012 PSC 1,934 1,898 8. Slice/Block 2012 PSC 1,773 1,849 9. IOU 2012 PSC 0 0 10. Exports 625 608 11. Regional Transfers (Out) 291 291 12. Federal Diversity 0 0 13. Total Transfers Out 7,675 7,746 14. Total Firm Obligations 8,305 8,379
Hydro Resources 15. Regulated Hydro 6,565 6,563 16. Independent Hydro 378 379 17. Hydro Maintenance 0 0 18. Total Hydro Resources 6,943 6,942
Other Resources 19. Small Thermal & Misc. 0 0 20. Combustion Turbines 0 0 21. Renewables 67 67 22. Cogeneration 19 19 23. Imports 241 241 24. Regional Transfers (In) 91 122 25. Non-Fed CER (Canada) 141 138 26. Transmission Loss Returns 37 36 27. Large Thermal 1,030 878 28. Non-Utility Generation 3 3 29. Augmentation Purchases 0 176 30. Augmentation Resources 0 0 31. Total Other Resources 1,629 1,680 32. Total Resources 8,572 8,622
Reserves & Losses 33. Contingency Reserves (Non-Spinning) 0 0 34. Contingency Reserves (Spinning) 0 0 35. Generation Imbalance Reserves 0 0 36. Load Following Reserves 0 0 37. Federal Transmission Losses -242 -243
38. Total Reserves & Losses -242 -243
39. Total Net Resources 8,330 8,379
40. Total Firm Surplus/Deficit 25 0


BONNEVILLE POW ER ADMINISTRATION DOE/BP-4337 • July 2011
Related Documents
![2 The Refuge - United States Fish and Wildlife Service...12 CCP, Pathfinder National Wildlife Refuge, WY Nebraska (U.S. Department of the Interior, Bureau of Reclamation [USBR]). The](https://static.cupdf.com/doc/110x72/5ec78801faccff30932e0bbd/2-the-refuge-united-states-fish-and-wildlife-service-12-ccp-pathfinder-national.jpg)


