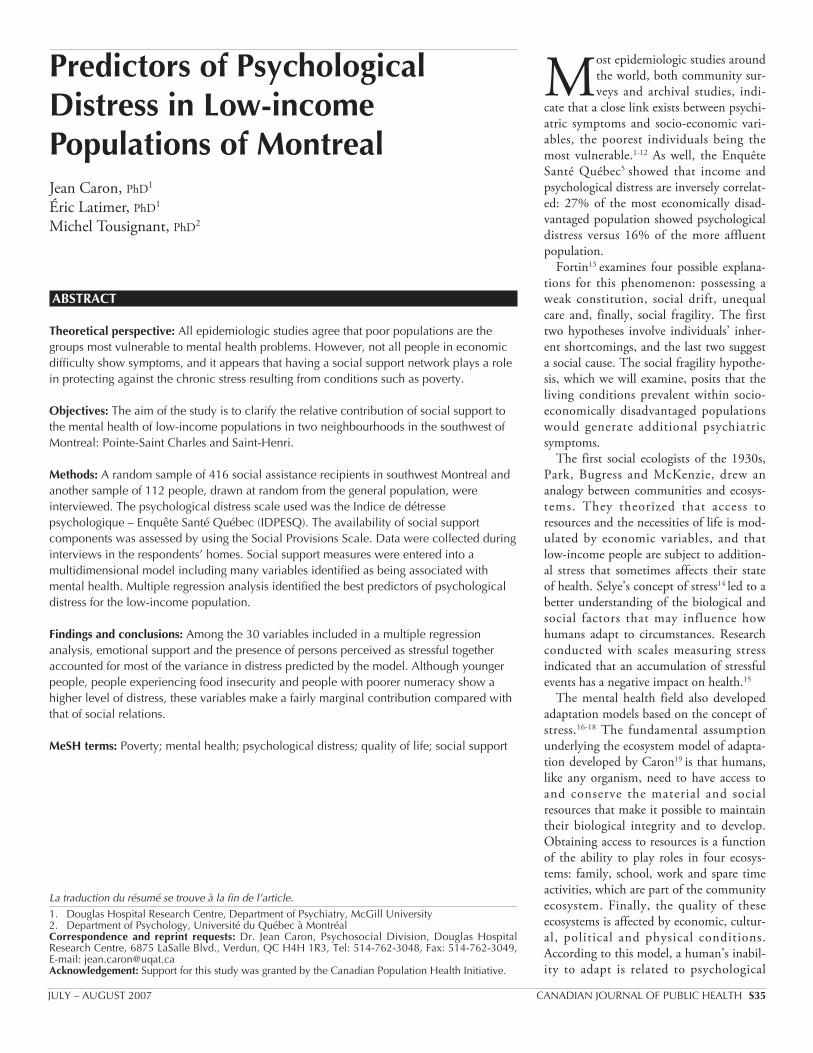
Predictors of Psychological Distress in Low-income Populations of Montreal Jean Caron, PhD 1 Éric Latimer, PhD 1 Michel Tousignant, PhD 2 ABSTRACT Theoretical perspective: All epidemiologic studies agree that poor populations are the groups most vulnerable to mental health problems. However, not all people in economic difficulty show symptoms, and it appears that having a social support network plays a role in protecting against the chronic stress resulting from conditions such as poverty. Objectives: The aim of the study is to clarify the relative contribution of social support to the mental health of low-income populations in two neighbourhoods in the southwest of Montreal: Pointe-Saint Charles and Saint-Henri. Methods: A random sample of 416 social assistance recipients in southwest Montreal and another sample of 112 people, drawn at random from the general population, were interviewed. The psychological distress scale used was the Indice de détresse psychologique – Enquête Santé Québec (IDPESQ). The availability of social support components was assessed by using the Social Provisions Scale. Data were collected during interviews in the respondents’ homes. Social support measures were entered into a multidimensional model including many variables identified as being associated with mental health. Multiple regression analysis identified the best predictors of psychological distress for the low-income population. Findings and conclusions: Among the 30 variables included in a multiple regression analysis, emotional support and the presence of persons perceived as stressful together accounted for most of the variance in distress predicted by the model. Although younger people, people experiencing food insecurity and people with poorer numeracy show a higher level of distress, these variables make a fairly marginal contribution compared with that of social relations. MeSH terms: Poverty; mental health; psychological distress; quality of life; social support M ost epidemiologic studies around the world, both community sur- veys and archival studies, indi- cate that a close link exists between psychi- atric symptoms and socio-economic vari- ables, the poorest individuals being the most vulnerable. 1-12 As well, the Enquête Santé Québec 5 showed that income and psychological distress are inversely correlat- ed: 27% of the most economically disad- vantaged population showed psychological distress versus 16% of the more affluent population. Fortin 13 examines four possible explana- tions for this phenomenon: possessing a weak constitution, social drift, unequal care and, finally, social fragility. The first two hypotheses involve individuals’ inher- ent shortcomings, and the last two suggest a social cause. The social fragility hypothe- sis, which we will examine, posits that the living conditions prevalent within socio- economically disadvantaged populations would generate additional psychiatric symptoms. The first social ecologists of the 1930s, Park, Bugress and McKenzie, drew an analogy between communities and ecosys- tems. They theorized that access to resources and the necessities of life is mod- ulated by economic variables, and that low-income people are subject to addition- al stress that sometimes affects their state of health. Selye’s concept of stress 14 led to a better understanding of the biological and social factors that may influence how humans adapt to circumstances. Research conducted with scales measuring stress indicated that an accumulation of stressful events has a negative impact on health. 15 The mental health field also developed adaptation models based on the concept of stress. 16-18 The fundamental assumption underlying the ecosystem model of adapta- tion developed by Caron 19 is that humans, like any organism, need to have access to and conserve the material and social resources that make it possible to maintain their biological integrity and to develop. Obtaining access to resources is a function of the ability to play roles in four ecosys- tems: family, school, work and spare time activities, which are part of the community ecosystem. Finally, the quality of these ecosystems is affected by economic, cultur- al, political and physical conditions. According to this model, a human’s inabil- ity to adapt is related to psychological La traduction du résumé se trouve à la fin de l’article. 1. Douglas Hospital Research Centre, Department of Psychiatry, McGill University 2. Department of Psychology, Université du Québec à Montréal Correspondence and reprint requests: Dr. Jean Caron, Psychosocial Division, Douglas Hospital Research Centre, 6875 LaSalle Blvd., Verdun, QC H4H 1R3, Tel: 514-762-3048, Fax: 514-762-3049, E-mail: [email protected] Acknowledgement: Support for this study was granted by the Canadian Population Health Initiative. JULY – AUGUST 2007 CANADIAN JOURNAL OF PUBLIC HEALTH S35

Welcome message from author
This document is posted to help you gain knowledge. Please leave a comment to let me know what you think about it! Share it to your friends and learn new things together.
Transcript
Predictors of PsychologicalDistress in Low-incomePopulations of MontrealJean Caron, PhD1
Éric Latimer, PhD1
Michel Tousignant, PhD2
ABSTRACT
Theoretical perspective: All epidemiologic studies agree that poor populations are thegroups most vulnerable to mental health problems. However, not all people in economicdifficulty show symptoms, and it appears that having a social support network plays a rolein protecting against the chronic stress resulting from conditions such as poverty.
Objectives: The aim of the study is to clarify the relative contribution of social support tothe mental health of low-income populations in two neighbourhoods in the southwest ofMontreal: Pointe-Saint Charles and Saint-Henri.
Methods: A random sample of 416 social assistance recipients in southwest Montreal andanother sample of 112 people, drawn at random from the general population, wereinterviewed. The psychological distress scale used was the Indice de détressepsychologique – Enquête Santé Québec (IDPESQ). The availability of social supportcomponents was assessed by using the Social Provisions Scale. Data were collected duringinterviews in the respondents’ homes. Social support measures were entered into amultidimensional model including many variables identified as being associated withmental health. Multiple regression analysis identified the best predictors of psychologicaldistress for the low-income population.
Findings and conclusions: Among the 30 variables included in a multiple regressionanalysis, emotional support and the presence of persons perceived as stressful togetheraccounted for most of the variance in distress predicted by the model. Although youngerpeople, people experiencing food insecurity and people with poorer numeracy show ahigher level of distress, these variables make a fairly marginal contribution compared withthat of social relations.
MeSH terms: Poverty; mental health; psychological distress; quality of life; social support
Most epidemiologic studies aroundthe world, both community sur-veys and archival studies, indi-
cate that a close link exists between psychi-atric symptoms and socio-economic vari-ables, the poorest individuals being themost vulnerable.1-12 As well, the EnquêteSanté Québec5 showed that income andpsychological distress are inversely correlat-ed: 27% of the most economically disad-vantaged population showed psychologicaldistress versus 16% of the more affluentpopulation.
Fortin13 examines four possible explana-tions for this phenomenon: possessing aweak constitution, social drift, unequalcare and, finally, social fragility. The firsttwo hypotheses involve individuals’ inher-ent shortcomings, and the last two suggesta social cause. The social fragility hypothe-sis, which we will examine, posits that theliving conditions prevalent within socio-economically disadvantaged populationswould generate additional psychiatricsymptoms.
The first social ecologists of the 1930s,Park, Bugress and McKenzie, drew ananalogy between communities and ecosys-tems. They theorized that access toresources and the necessities of life is mod-ulated by economic variables, and thatlow-income people are subject to addition-al stress that sometimes affects their stateof health. Selye’s concept of stress14 led to abetter understanding of the biological andsocial factors that may influence howhumans adapt to circumstances. Researchconducted with scales measuring stressindicated that an accumulation of stressfulevents has a negative impact on health.15
The mental health field also developedadaptation models based on the concept ofstress.16-18 The fundamental assumptionunderlying the ecosystem model of adapta-tion developed by Caron19 is that humans,like any organism, need to have access toand conserve the material and socialresources that make it possible to maintaintheir biological integrity and to develop.Obtaining access to resources is a functionof the ability to play roles in four ecosys-tems: family, school, work and spare timeactivities, which are part of the communityecosystem. Finally, the quality of theseecosystems is affected by economic, cultur-al, political and physical conditions.According to this model, a human’s inabil-ity to adapt is related to psychological
La traduction du résumé se trouve à la fin de l’article. 1. Douglas Hospital Research Centre, Department of Psychiatry, McGill University2. Department of Psychology, Université du Québec à MontréalCorrespondence and reprint requests: Dr. Jean Caron, Psychosocial Division, Douglas HospitalResearch Centre, 6875 LaSalle Blvd., Verdun, QC H4H 1R3, Tel: 514-762-3048, Fax: 514-762-3049,E-mail: [email protected]: Support for this study was granted by the Canadian Population Health Initiative.
JULY – AUGUST 2007 CANADIAN JOURNAL OF PUBLIC HEALTH S35
stress. Symptoms, which may be transi-tional or become psychopathological, origi-nate with a person’s inability to accessecosystems’ material and socio-affectiveresources. Several factors may be involved,alone or in combination, namely: 1) pover-ty in ecosystem resources, 2) ecosystem dis-turbances that lead to resource losses20 orthat temporarily block access to resources,3) the inability to acquire the skills or cog-nitive competencies required to accomplishexpected roles in the ecosystems and4) biological predispositions that make anindividual more sensitive to the stress gen-erated through his or her efforts to useresources.
Since the mental health of economicallydisadvantaged populations is less stable,this model predicts higher stress in thesepopulations and/or deficits in the qualityor quantity of resources available in theirsocial networks.
Poor populations experience inherentlyhigher levels of the permanent stress creat-ed by striving to meet basic biologicalneeds (food, shelter, etc.) and of the stresscreated by awareness of the gap betweenavailable resources and the resources seenas essential according to industrial soci-eties’ cultural model of well-being. Dressleret al.21suggest that the greater health prob-lems occurring in poor populations resultfrom their inability to live in accordancewith lifestyles reflecting cultural norms.Studies show that the significant inter-action between the occurrence of stressfulevents and serious pre-existing chronicconditions (such as housing, financial,work, and relationship conditions) is asso-ciated with symptoms of depression inpoor populations.22,23 Other studies alsodemonstrate that these populations experi-ence stressful life events more frequentlythan more affluent populations do.13,22-25
Mental health studies clearly demon-strate that a relationship exists between theseverity of mental disorders and the qualityof available social support,26-29 and muchresearch has identified a lack of availablesocial support within poor popula-tions.13,22,30-33
Cutrona and Russell34 developed a theo-retical model suggesting that optimalmatching exists between stressful eventsand the need for specific types of support.Several studies using different methodolo-gies and focusing on a range of economi-
cally disadvantaged populations suggestthat the availability of specific supports,such as emotional support, material assis-tance and, to a lesser extent, support forpersonal worth and social integration,would allow these populations to adaptmore successfully.27,34-36
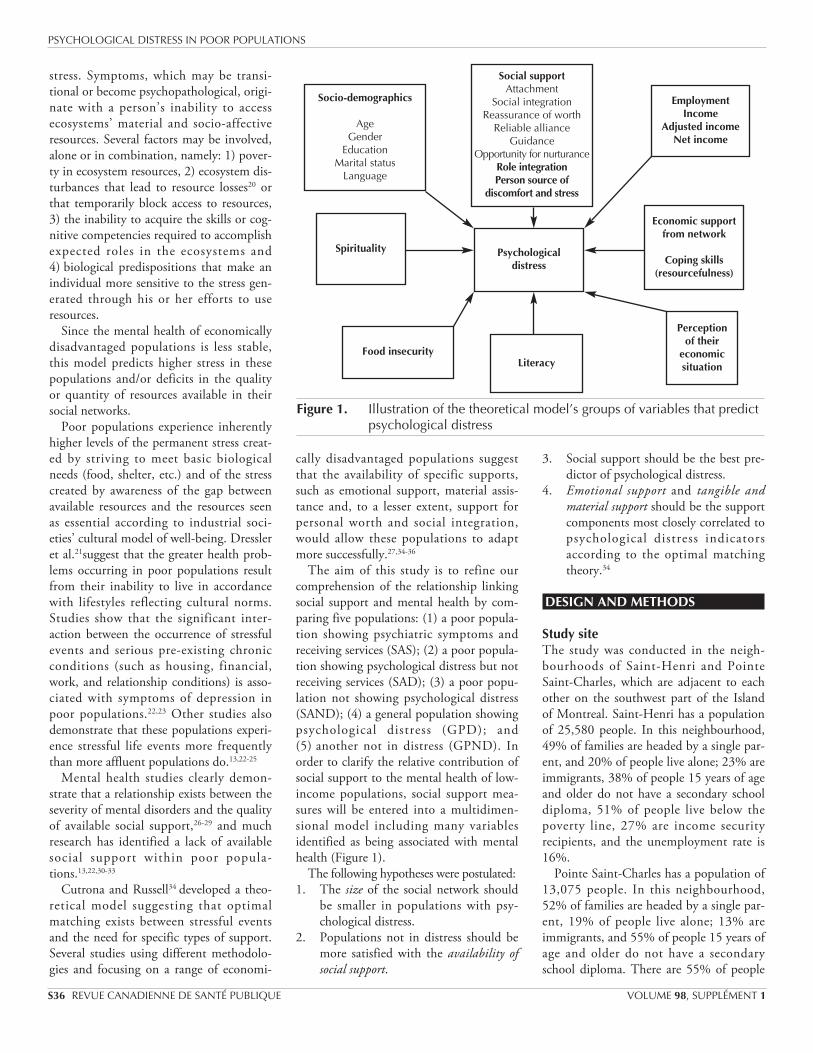
The aim of this study is to refine ourcomprehension of the relationship linkingsocial support and mental health by com-paring five populations: (1) a poor popula-tion showing psychiatric symptoms andreceiving services (SAS); (2) a poor popula-tion showing psychological distress but notreceiving services (SAD); (3) a poor popu-lation not showing psychological distress(SAND); (4) a general population showingpsychological distress (GPD); and(5) another not in distress (GPND). Inorder to clarify the relative contribution ofsocial support to the mental health of low-income populations, social support mea-sures will be entered into a multidimen-sional model including many variablesidentified as being associated with mentalhealth (Figure 1).
The following hypotheses were postulated:1. The size of the social network should
be smaller in populations with psy-chological distress.
2. Populations not in distress should bemore satisfied with the availability ofsocial support.
3. Social support should be the best pre-dictor of psychological distress.
4. Emotional support and tangible andmaterial support should be the supportcomponents most closely correlated topsychological distress indicatorsaccording to the optimal matchingtheory.34
DESIGN AND METHODS
Study siteThe study was conducted in the neigh-bourhoods of Saint-Henri and PointeSaint-Charles, which are adjacent to eachother on the southwest part of the Islandof Montreal. Saint-Henri has a populationof 25,580 people. In this neighbourhood,49% of families are headed by a single par-ent, and 20% of people live alone; 23% areimmigrants, 38% of people 15 years of ageand older do not have a secondary schooldiploma, 51% of people live below thepoverty line, 27% are income securityrecipients, and the unemployment rate is16%.
Pointe Saint-Charles has a population of13,075 people. In this neighbourhood,52% of families are headed by a single par-ent, 19% of people live alone; 13% areimmigrants, and 55% of people 15 years ofage and older do not have a secondaryschool diploma. There are 55% of people
PSYCHOLOGICAL DISTRESS IN POOR POPULATIONS
S36 REVUE CANADIENNE DE SANTÉ PUBLIQUE VOLUME 98, SUPPLÉMENT 1
Figure 1. Illustration of the theoretical model’s groups of variables that predictpsychological distress
Socio-demographics
AgeGender
EducationMarital status
Language
Social supportAttachment
Social integrationReassurance of worth
Reliable allianceGuidance
Opportunity for nurturanceRole integrationPerson source of
discomfort and stress
EmploymentIncome
Adjusted incomeNet income
Economic supportfrom network
Coping skills(resourcefulness)
Perception of their
economic situationLiteracy
Food insecurity
Spirituality Psychologicaldistress
living below the poverty line, 35% areincome security recipients, and the unem-ployment rate is 20% (Direction de lasanté publique de Montréal-Centre: per-sonal communication, 2001).
Poor health outcomes have been docu-mented in Saint-Henri for years.38
The population’s life expectancy is 4.4years lower in Saint-Henri than inMontreal and 5.3 years lower in PointeSaint-Charles, and both neighbourhoodshave higher rates of cancer and circulatoryand respiratory disorders (Direction de lasanté publique de Montréal-Centre: per-sonal communication, 1999).
SampleThe sample was made up of 528 peoplebetween 18 and 65 years of age, 416 ofwhom were social assistance recipients.This subsample was drawn from 2,000names randomly pre-selected by theMinistère de la Sécurité du revenu. Inorder to asses the level of psychological dis-tress in higher income populations of thesame neighbourhoods, 112 people fromthe general population living in the sameneighbourhoods and not receiving socialassistance benefits were also sampled. Thissubsample was randomly drawn using theProphone software application, which con-tained the telephone numbers of peopleresiding in these two neighbourhoods in2001.
MeasuresThe psychological distress scale used wasthe Indice de détresse psychologique –Enquête Santé Québec (IDPESQ-14).This tool includes 14 items (Likert scale)that detect symptoms of anxiety, depres-sion and irritability as well as cognitiveproblems without giving a specific psychi-atric diagnosis. Respondents scoring abovethe fifth quintile of psychological distressare considered to have a high level of psy-chological distress. It was used in theEnquête Santé Québec5 survey for assess-ing psychological distress in Quebec’s pop-ulation and is based on Ilfeld’s37
Psychiatric Symptom Index.Various aspects of formal social net-
works, such as their size, make-up (family,friends and neighbours), density, frequencyof contact and type of help received wereevaluated both qualitatively and quantita-tively.
Components of social support weremeasured by the Social Provisions Scale39
and validated in Quebec by Caron.40 Thissocial provisions scale measures people’sperceptions about the availability of sixaspects of social support, namely emotionalsupport, social integration, reassurance ofone’s worth, material assistance, advice andinformation, and the need to feel useful.
Social and community integration wasmeasured using the Social NetworkIndex.41 This index documents the numberof active roles that an individual plays(spouse, parent, mother/father-in-law,child, extended family member, neigh-bour, friend, co-worker, student, volun-teer, member of a religious group).
Food insecurity was measured using theRadimer/Cornell Hunger and FoodInsecurity Measure,42,43 the only question-naire based on formal knowledge of theexperience of food insecurity.44 The ques-tionnaire has 11 statements related to thepsychological, quantitative and qualitativeaspects of the experience as it affects house-holds and the individuals within them(adults and children). This instrument wassuccessfully tested in Quebec.45
To measure an individual’s financialresources, questions were asked in the fol-lowing areas: total income per month,including income security benefits, gifts,employment and alimony/child supportincome, disability or old age pension bene-fits and family or housing allowances.Expenses were also evaluated in the follow-ing areas: number of people in the house-hold and their ages, rent and householdexpenses (gas, hydro, heating oil, etc.),property taxes and monthly debt pay-ments. The difference between income andexpenses equalled net income. An adjustedincome was calculated to factor in the num-ber of people in the household.
As well, we developed an apparent wealthindex to examine whether a household hasvarious common consumer items (cellulartelephone, car, dishwasher, video camera,DVD, or cable). The ability to manage dif-ficult financial circumstances may varyfrom one person to another. We developedan economic resourcefulness index containing12 questions based on a Likert-type scale:five on community resources (e.g., foodbanks, thrift shops), two on a person’s net-work and five others on personal strategies.We also developed a social network material
support scale containing 10 questions onpractical services received from a person’snetwork.
We used four questions from theEnquête Santé Québec to assess respon-dents’ perceptions about their financial situ-ation: (1) their perception of their econom-ic situation compared with that of otherpeople the same age, (2) how long theyhad had this perception, (3) their beliefthat their situation would improve and(4) difficulties making ends meet.
Four questions were asked about respon-dents’ spirituality. These questions weredeveloped for the Canadian CommunityHealth Survey 1.2: mental health and well-being. They were designed to determine(1) the importance of spirituality,(2) whether it gives meaning to life,(3) whether it leads to a better understandingof life’s difficulties and (4) whether itmakes facing these difficulties easier.
Literacy level was measured throughthree questions on reading, writing andnumeracy that were used in theInternational Adult Literacy Survey.46
Procedures and ethical considerationsAfter approval by a research ethics com-mittee and authorization given by theCommission d’accès à l’information, theMinistère de la Main-d’œuvre et de laSécurité du revenu was able to provide uswith a list of 2,000 social assistance recip-ients and their addresses, selected at ran-dom by the Ministry. This list excludedpersons receiving benefits because of amental or physical disability (mainly casesof psychosis). A second random samplingwas performed to select the order inwhich the respondents were to be contact-ed. Respondents were eliminated follow-ing a refusal or 10 unsuccessful calls.Income security recipients were contactedby telephone to set up meetings at whichtheir participation in the research projectwas explained; 416 of these people agreedto take part in the study (50.4% accep-tance rate). Measures were implementedto ensure that the information collectedremained anonymous and confidential.The sample of income security recipientsreceiving mental health services (49 peo-ple) was drawn from the preceding sampleby asking a series of interview questionson the use of mental health services.These people were receiving services from
PSYCHOLOGICAL DISTRESS IN POOR POPULATIONS
JULY – AUGUST 2007 CANADIAN JOURNAL OF PUBLIC HEALTH S37
local community service centres, medicalclinics or community agencies in theSaint-Henri and Pointe Saint-Charlesneighbourhoods.
The general population sample wasderived using the Prophone software appli-cation containing all telephone numbers in2001 in these two neighbourhoods. Peoplewere contacted in random order, and theaforementioned procedure was applied.The persons reached were not required tobe income security recipients to be eligible,and the acceptance rate for this group was40%. Data collection took place from June2001 to May 2002. The data were collect-ed through interviews conducted at therespondents’ homes or at other premisesreserved for this purpose.
Experimental designThis cross-sectional study was conductedwith five groups. The first group was madeup of income security recipients who werereceiving mental health services (SAS) (n =49). Two other groups were established onthe basis of a psychological distress threshold,47 one group consisting of respon-dents scoring above the fifth quintile ofpsychological distress in IDEPSQ (n = 174)and a second group consisting of respon-
dents scoring below this psychological dis-tress threshold (n = 194). The fourthgroup was made up 73 people from thegeneral population not in distress, and thefifth group was made up of 38 people fromthe general population in distress.
AnalysesDescriptive data in the form of numbers ofoccurrences and percentages were analyzedthrough likelihood ratios.48 Multivariateanalysis of variance (MANOVA) withTukey’s post hoc test was used to assessdifferences among groups on social supportcomponents. Hierarchical-type multiplelinear regression methods were used toidentify significant predictors of psycho-logical distress.49
RESULTS
Socio-demographic characteristicsTable I shows the socio-demographic char-acteristics of the five groups studied. Thegroups were comparable with respect to sexand age. The two general population groupshad a higher proportion of married people,and the social assistance recipients weremore likely to live in common-law relation-ships (G = 33.16, df = 8, p < 0.001).
Other differences were identified withrespect to educational level and income.People in the general population had morefrequently undertaken or completed collegeor university studies (G = 52.50, df = 8, p <0.001). Their income was approximately80% higher than that of social assistancerecipients, i.e., almost $11,000 a year more(F = 7.06, df = 4, p < 0.001). (The povertyline in 1999 was $13,982 for one personliving alone and $25,168 for a family oftwo adults and one child [StatisticsCanada]). Finally, social assistance recipi-ents without distress were different fromthe four other groups in terms of theirhome language: they were more frequentlyallophones (G = 26.30, df = 8, p < 0.001).
Psychological distressOne welfare recipient out of two in oursample was experiencing psychological dis-tress: 55% of Pointe Saint Charles residentsand 46% of Saint-Henri residents. The rateof distress among poor people in theseneighbourhoods was significantly higherthan in the population not receiving incomesecurity benefits of these same neighbour-hoods (33%) (G = 9.30, df = 1, p < 0.01).
Average distress levels were not signifi-cantly different among the three groups
PSYCHOLOGICAL DISTRESS IN POOR POPULATIONS
S38 REVUE CANADIENNE DE SANTÉ PUBLIQUE VOLUME 98, SUPPLÉMENT 1
TABLE ISocio-Demographic Characteristics of the Groups, Occurrences (Percentages)
Social Assistance Social Assistance Social Assistance General General TotalRecipients in Recipients not Recipients Population Not Population
Distress in Distress Receiving Services in Distress in Distress(n = 174) (n = 194) (n = 49) (n = 73) (n = 38) (n = 528)
SexWomen 86 (50) 80 (41) 27 (55) 36 (49) 16 (42) 252 (48)Men 87 (50) 114 (59) 22 (40) 37 (51) 22 (58) 275 (52)
Age20 and under 0 0 0 1 (1.5) 0 1 (0.2)20–29 21 (14.1) 17 (10) 4 (8.1) 16 (24.6) 12 (36.4) 70 (15.2)30–39 57 (38.3) 47 (27.8) 17 (37.8) 18 (27.7) 5 (15.2) 144 (31.2)40–49 49 (32.9) 75 (44.4) 21 (46.7) 13 (20) 7 (21.2) 165 (35.8)50–59 21 (14.1) 29 (17.2) 3 (6.7) 10 (15.4) 7 (21.2) 70 (15.2)60 and over 1 (0.7) 1 (0.6) 0 (0) 7 (10.8) 2 (6.1) 11 (2.4)Average age (sd) 45.7 (11.1) 41.8 (8.9) 41.1 (11.9) 40.3 (13.3) 39.0 (13.0) 40.1 (10.9)
Civil statusCommon-law 88 (51.2) 83(42.8) 33 (63.3) 26 (35.6) 13 (34.2) 241 (45.8)Married 46 (26.7) 69 (37.8) 10 (20.4) 32 (46.6)* 18 (47.3)* 187 (35.5)Separated/divorced 36 (20.9) 31 (16.5) 7 (16) 11 (15.1) 5 (13.2) 91 (17.3)Widowed 2 (1.2) 0 (0) 1 (2.0) 2 (2.7) 2 (5.3) 7 (1.3)
Educational levelElementary 11 (6.0) 31 (16) 3 (16.9) 6 (8.2) 4 (10.5) 55 (10.5)Secondary 111(64.5) 105 (54.1) 32(65.3) 20 (27.4) 12 (36.6) 280 (53.2)CÉGEP†/university 50 (29.1) 58 (29.9) 14 (28.6) 47 (64.4)* 25 (57.9)* 191 (36.3)
Average family income (annual) 14,346 14,760 13,824 25,896* 26,088* Home language
French 109 (63.4) 112 (55.5) 36 (73.6) 49 (67.1) 29 (76.3) 335 (63.7)English 44 (25.5) 29 (14.9) 8 (16.3) 11 (15.1) 15.8 (18) 98 (18.6)Other 19 (11.1) 53 (27.3)* 5 (10.2) 13 (17.8) 3 (7.9) 93 (17.7)
NeighbourhoodPointe St-Charles 97 (55.8) 93 (46.1) 23 (46.6) 38 (50.2) 15 (39.2) 266 (50.3) Saint-Henri 77 (44.2) 101 (53.9) 26 (53.4) 35 (49.8) 23 (59.8) 262 (49.7)
† Collège d’enseignement générale et professionnel : College of General and Professional Education* Significantly different from the social assistance groups, p < 0.001
experiencing high psychological distress. Thegroups not in distress, whether social assis-tance recipients or from the general popula-tion, had comparable distress levels that wereconsiderably lower than the groups in dis-tress (F = 162.27, df = 3, p < 0.001).
The following socio-demographic analy-ses focus solely on the population of socialassistance recipients (N = 416). Womensocial assistance recipients in these neigh-bourhoods experienced a higher level ofdistress (55.7%) than men (45.5%) (G =4.29, df = 1, p < 0.05), a tendency that hasbeen observed in the Quebec population asa whole but at significantly lower rates(women = 30.4%; men = 21.8%, SantéQuébec, 1998).
Distress is not equally distributed amongthe age categories. In fact, the level of dis-tress for those 25-44 years of age (55.3%)was slightly higher than for those 18-24years of age (50%) but much higher thanfor those 45 years of age and over (41.3%)(G = 6.92, df = 2, p < 0.05). With respectto civil status, the same phenomenonobserved by the Enquête Santé Québec
was present among social assistance recipi-ents in these neighbourhoods: legally mar-ried people (32.6%) had a lower level ofdistress than those living in common-lawrelationships (53.1%) or those who wereseparated, divorced (53.8%) or single(55.4%) (G = 13.5, df = 3, p < 0.01).Educational level was unrelated to distress(F = 0.41, df = 2, p > 0.05).
People with English as a the first lan-guage had the highest level of distress(63%), followed by francophones (52.1%).Allophones had a significantly lower level(29.9%) than the two other groups in thesame neighbourhoods (G = 18.8, df = 1,p < 0.001), although this level was higherthan in the Quebec population as a whole.
Social networks and the availability ofsocial support in the variouspopulations
Social networksThis section analyses the networks of thefive groups in the sample. Table II showsthat the average number of people in social
networks in the sample was 9.44 (SD =4.89) and that there were no differencesamong the groups (F = 0.76, df = 4, p >0.05). Although the analyses did not revealsignificant differences in the number oflinks among network members, they didsignal marked differences among thegroups (F = 2.14, df = 4, p > 0.05).Cohen’s social integration index capturesthe diversity of active roles in which peopleare involved. The average number of rolesfor the entire sample was 3.94, and therewere no differences among the groups (F =3.71, df = 4, p > 0.05).
Within populations experiencing dis-tress, networks more frequently includedindividuals who were sources of discomfortand stress (G = 19.41, df = 4, p < 0.001).In fact, 60% of social assistance recipientsreceiving mental health services and 51.5%of social assistance recipients with high lev-els of distress reported that their networkscontained stressful individuals, versus only31.3% of social assistance recipients not indistress. Such individuals were found inthe networks of 52.8% of the general pop-ulation in distress versus 42.5% of the gen-eral population not in distress.
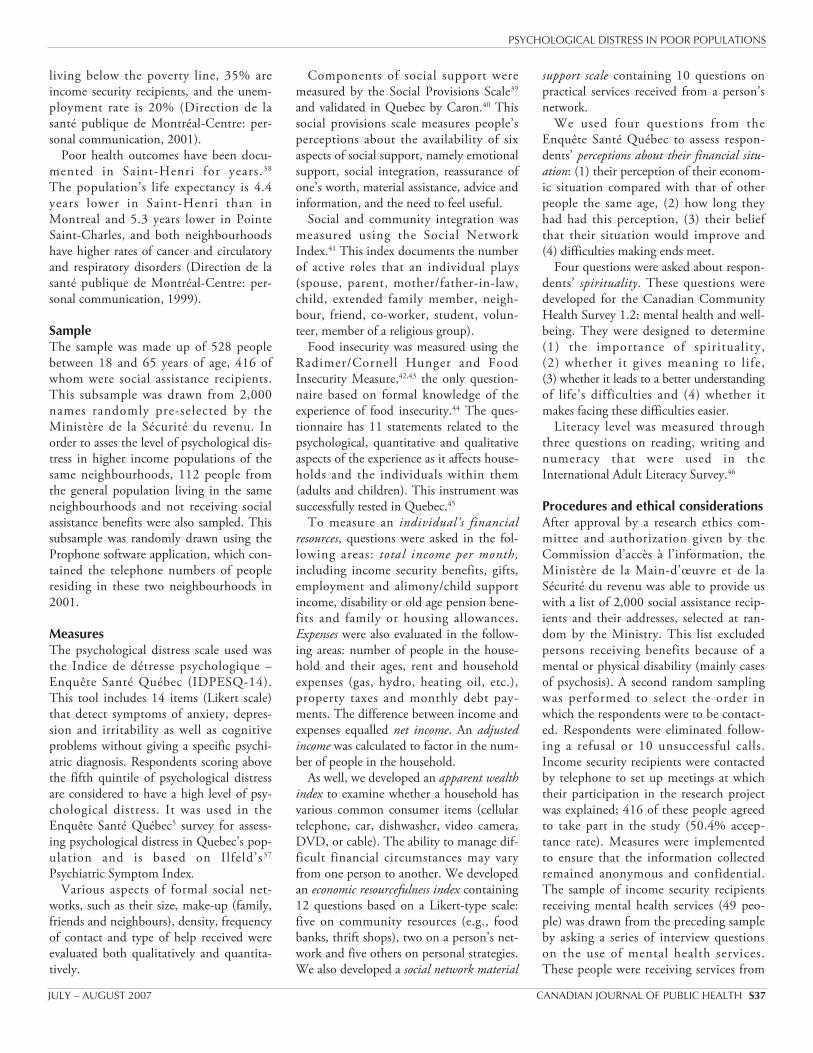
Perceptions about the availability ofsocial support in various populationsIn line with the proposed hypotheses, thetwo groups not in distress saw social supportas more available than their counterpartgroups experiencing a high level of psycho-logical distress (F = 16.92, df = 4, p <0.001). Comparison of the groups did notreveal any differences between social assis-tance recipients not in distress and the gen-eral population not in distress (Figure 2).The general population not in distress per-ceived more support than the other groups.
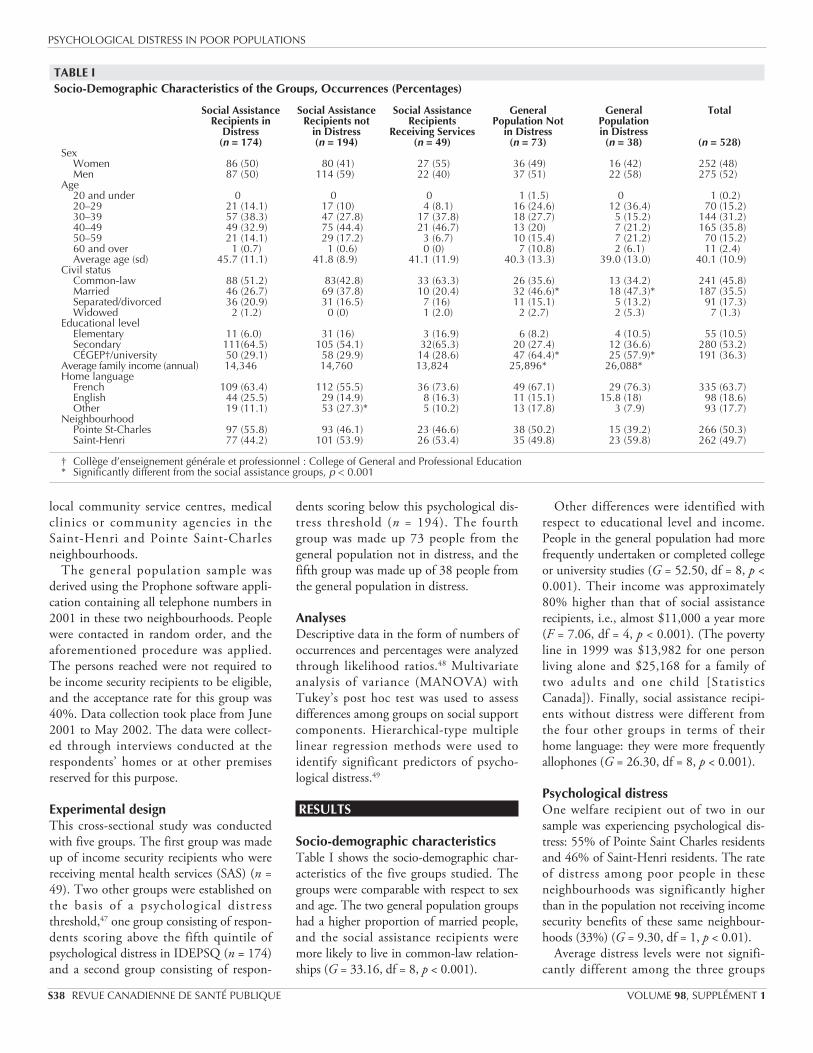
Figure 3 depicts people’s perceptionsabout the availability of various compo-nents of social support.
Multivariate analysis of overall variancerevealed significant differences (Wilks’lambda F = 4.32, p < 0.001). These signifi-
PSYCHOLOGICAL DISTRESS IN POOR POPULATIONS
JULY – AUGUST 2007 CANADIAN JOURNAL OF PUBLIC HEALTH S39
TABLE IIAverage Number of People Forming a Network and the Number of Links Among Them
Number of Persons in a Network Number of Links Within a Network Number of Active RolesPopulations Average Standard Deviation Average Standard Deviation Average Standard DeviationSocial assistance receiving services 8.51 4.56 27.51 29.53 3.77 1.66Social assistance with distress 9.36 5.33 41.29 51.31 3.84 1.73Social assistance without distress 9.82 4.92 45.37 54.17 3.90 1.69General population without distress 9.38 4.30 34.95 34.55 4.29 1.58General population with distress 9.21 4.15 29.89 26.85 4.21 1.80Total 9.44 4.89 39.81 47.62 3.94 1.70
Figure 2. Average level of perceived availability of social support in the differ-ent populations of the study
72.374.3
79.4
83.2
75.6
40
50
60
70
80
90
Social assistancereceiving services
(SAS)
Social assistance withdistress (SAD)
Social assistancewithout distress
(SAND)
General populationwithout distress
(GPND)
General populationwith distress (GPD)
Ave
rage
Lev
el, %
GPND>(SAS=SAD=GPD) p<0.001 SAND>(SAS=SAD) p<0.001 GPND> (SAND=GPD) p<0.05
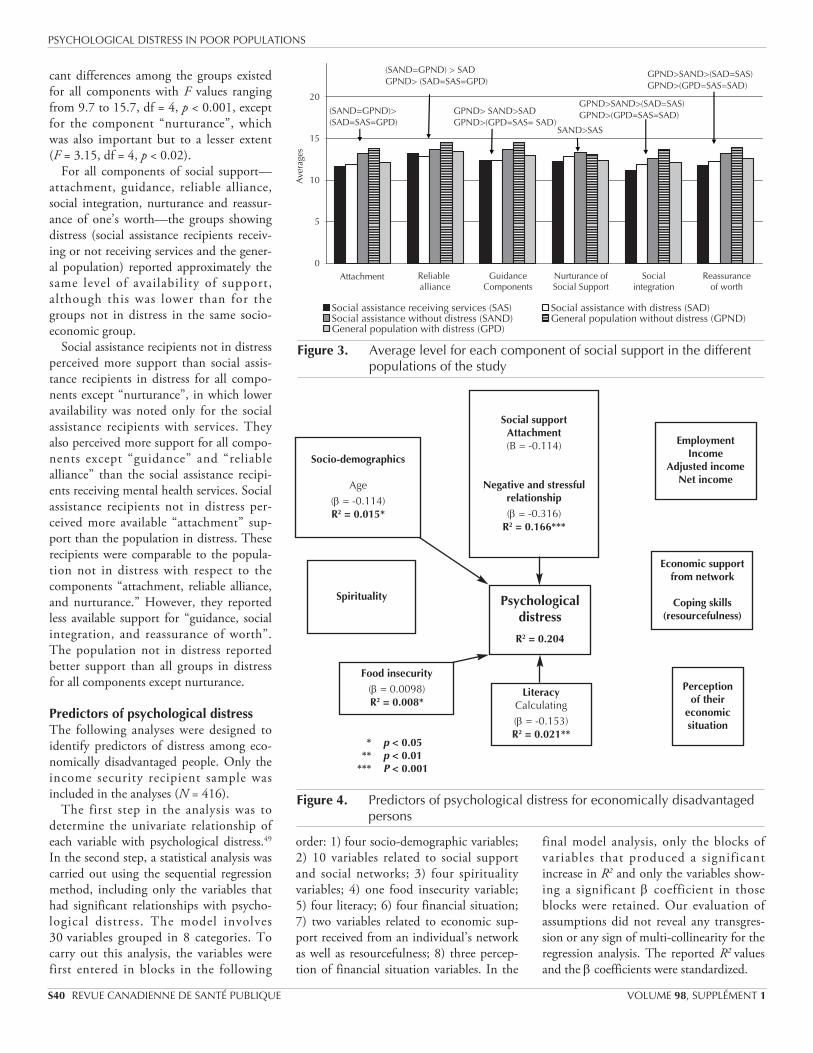
cant differences among the groups existedfor all components with F values rangingfrom 9.7 to 15.7, df = 4, p < 0.001, exceptfor the component “nurturance”, whichwas also important but to a lesser extent(F = 3.15, df = 4, p < 0.02).
For all components of social support—attachment, guidance, reliable alliance,social integration, nurturance and reassur-ance of one’s worth—the groups showingdistress (social assistance recipients receiv-ing or not receiving services and the gener-al population) reported approximately thesame level of availability of support,although this was lower than for thegroups not in distress in the same socio-economic group.
Social assistance recipients not in distressperceived more support than social assis-tance recipients in distress for all compo-nents except “nurturance”, in which loweravailability was noted only for the socialassistance recipients with services. Theyalso perceived more support for all compo-nents except “guidance” and “reliablealliance” than the social assistance recipi-ents receiving mental health services. Socialassistance recipients not in distress per-ceived more available “attachment” sup-port than the population in distress. Theserecipients were comparable to the popula-tion not in distress with respect to thecomponents “attachment, reliable alliance,and nurturance.” However, they reportedless available support for “guidance, socialintegration, and reassurance of worth”.The population not in distress reportedbetter support than all groups in distressfor all components except nurturance.
Predictors of psychological distressThe following analyses were designed toidentify predictors of distress among eco-nomically disadvantaged people. Only theincome security recipient sample wasincluded in the analyses (N = 416).
The first step in the analysis was todetermine the univariate relationship ofeach variable with psychological distress.49
In the second step, a statistical analysis wascarried out using the sequential regressionmethod, including only the variables thathad significant relationships with psycho-logical distress. The model involves30 variables grouped in 8 categories. Tocarry out this analysis, the variables werefirst entered in blocks in the following
order: 1) four socio-demographic variables; 2) 10 variables related to social supportand social networks; 3) four spiritualityvariables; 4) one food insecurity variable;5) four literacy; 6) four financial situation;7) two variables related to economic sup-port received from an individual’s networkas well as resourcefulness; 8) three percep-tion of financial situation variables. In the
final model analysis, only the blocks ofvariables that produced a significantincrease in R2 and only the variables show-ing a significant β coefficient in thoseblocks were retained. Our evaluation ofassumptions did not reveal any transgres-sion or any sign of multi-collinearity for theregression analysis. The reported R2 valuesand the β coefficients were standardized.
PSYCHOLOGICAL DISTRESS IN POOR POPULATIONS
S40 REVUE CANADIENNE DE SANTÉ PUBLIQUE VOLUME 98, SUPPLÉMENT 1
Figure 3. Average level for each component of social support in the differentpopulations of the study
0
5
10
15
20
Ave
rage
sSocial assistance receiving services (SAS) Social assistance with distress (SAD)Social assistance without distress (SAND) General population without distress (GPND)General population with distress (GPD)
(SAND=GPND)>(SAD=SAS=GPD)
(SAND=GPND) > SADGPND> (SAD=SAS=GPD)
GPND> SAND>SAD GPND>(GPD=SAS= SAD)
SAND>SAS
GPND>SAND>(SAD=SAS) GPND>(GPD=SAS=SAD)
GPND>SAND>(SAD=SAS) GPND>(GPD=SAS=SAD)
Reliable alliance
Attachment GuidanceComponents
Nurturance ofSocial Support
Socialintegration
Reassuranceof worth
Figure 4. Predictors of psychological distress for economically disadvantagedpersons
Socio-demographics
Age(β = -0.114)R2 = 0.015*
Social supportAttachment(B = -0.114)
Negative and stressfulrelationship(β = -0.316)
R2 = 0.166***
EmploymentIncome
Adjusted incomeNet income
Economic supportfrom network
Coping skills(resourcefulness)
Perception of their
economic situation
LiteracyCalculating(β = -0.153)R2 = 0.021**
Food insecurity(β = 0.0098)R2 = 0.008*
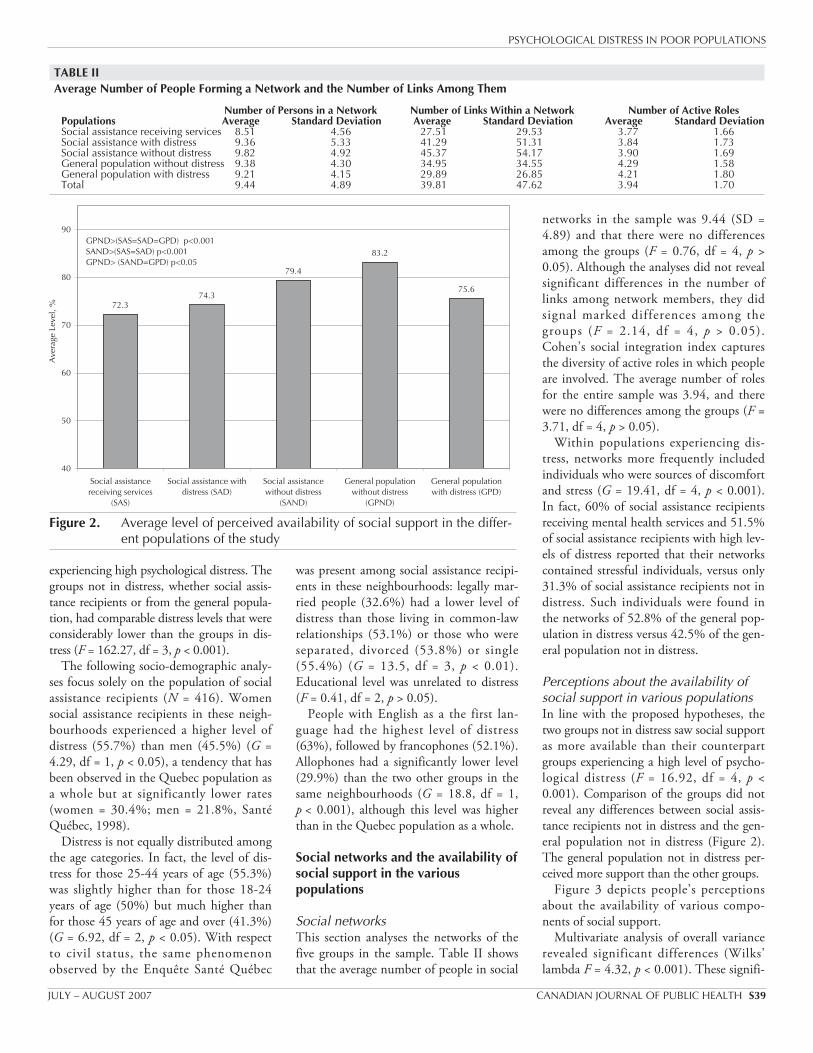
* p < 0.05** p < 0.01
*** P < 0.001
Spirituality Psychologicaldistress
R2 = 0.204
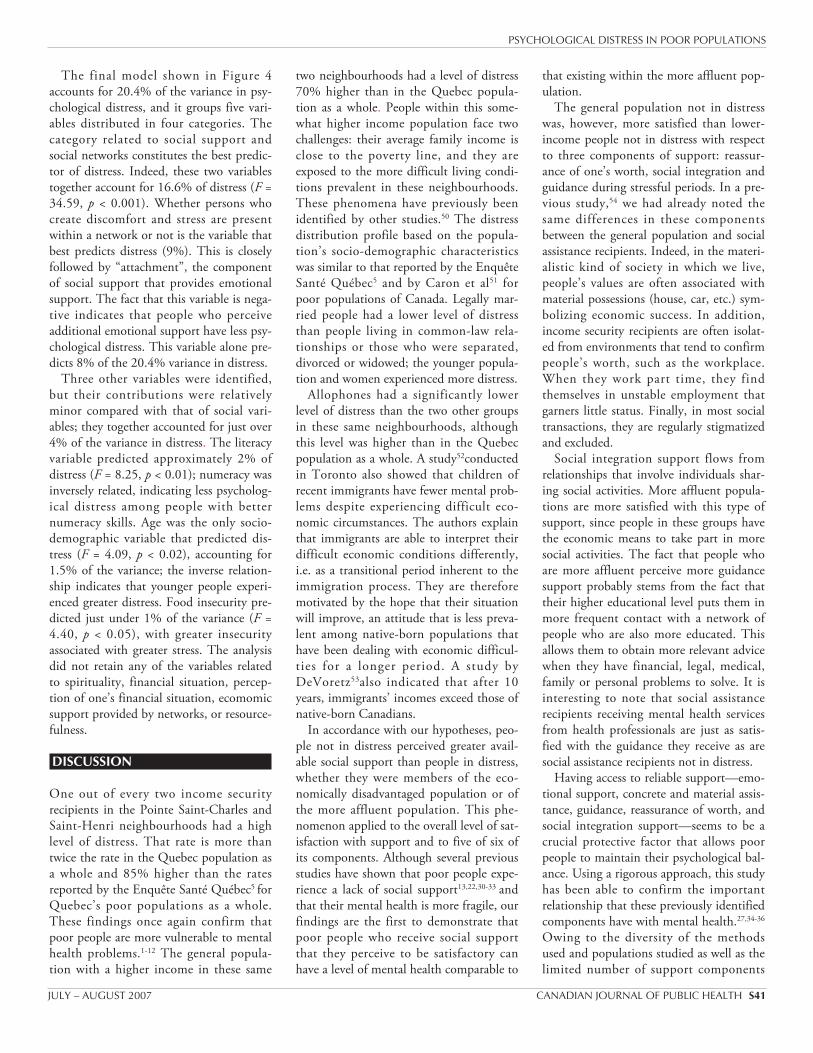
The final model shown in Figure 4accounts for 20.4% of the variance in psy-chological distress, and it groups five vari-ables distributed in four categories. Thecategory related to social support andsocial networks constitutes the best predic-tor of distress. Indeed, these two variablestogether account for 16.6% of distress (F =34.59, p < 0.001). Whether persons whocreate discomfort and stress are presentwithin a network or not is the variable thatbest predicts distress (9%). This is closelyfollowed by “attachment”, the componentof social support that provides emotionalsupport. The fact that this variable is nega-tive indicates that people who perceiveadditional emotional support have less psy-chological distress. This variable alone pre-dicts 8% of the 20.4% variance in distress.
Three other variables were identified,but their contributions were relativelyminor compared with that of social vari-ables; they together accounted for just over4% of the variance in distress. The literacyvariable predicted approximately 2% ofdistress (F = 8.25, p < 0.01); numeracy wasinversely related, indicating less psycholog-ical distress among people with betternumeracy skills. Age was the only socio-demographic variable that predicted dis-tress (F = 4.09, p < 0.02), accounting for1.5% of the variance; the inverse relation-ship indicates that younger people experi-enced greater distress. Food insecurity pre-dicted just under 1% of the variance (F =4.40, p < 0.05), with greater insecurityassociated with greater stress. The analysisdid not retain any of the variables relatedto spirituality, financial situation, percep-tion of one’s financial situation, ecomomicsupport provided by networks, or resource-fulness.
DISCUSSION
One out of every two income securityrecipients in the Pointe Saint-Charles andSaint-Henri neighbourhoods had a highlevel of distress. That rate is more thantwice the rate in the Quebec population asa whole and 85% higher than the ratesreported by the Enquête Santé Québec5 forQuebec’s poor populations as a whole.These findings once again confirm thatpoor people are more vulnerable to mentalhealth problems.1-12 The general popula-tion with a higher income in these same
two neighbourhoods had a level of distress70% higher than in the Quebec popula-tion as a whole. People within this some-what higher income population face twochallenges: their average family income isclose to the poverty line, and they areexposed to the more difficult living condi-tions prevalent in these neighbourhoods.These phenomena have previously beenidentified by other studies.50 The distressdistribution profile based on the popula-tion’s socio-demographic characteristicswas similar to that reported by the EnquêteSanté Québec5 and by Caron et al51 forpoor populations of Canada. Legally mar-ried people had a lower level of distressthan people living in common-law rela-tionships or those who were separated,divorced or widowed; the younger popula-tion and women experienced more distress.
Allophones had a significantly lowerlevel of distress than the two other groupsin these same neighbourhoods, althoughthis level was higher than in the Quebecpopulation as a whole. A study52conductedin Toronto also showed that children ofrecent immigrants have fewer mental prob-lems despite experiencing difficult eco-nomic circumstances. The authors explainthat immigrants are able to interpret theirdifficult economic conditions differently,i.e. as a transitional period inherent to theimmigration process. They are thereforemotivated by the hope that their situationwill improve, an attitude that is less preva-lent among native-born populations thathave been dealing with economic difficul-ties for a longer period. A study byDeVoretz53also indicated that after 10years, immigrants’ incomes exceed those ofnative-born Canadians.
In accordance with our hypotheses, peo-ple not in distress perceived greater avail-able social support than people in distress,whether they were members of the eco-nomically disadvantaged population or ofthe more affluent population. This phe-nomenon applied to the overall level of sat-isfaction with support and to five of six ofits components. Although several previousstudies have shown that poor people expe-rience a lack of social support13,22,30-33 andthat their mental health is more fragile, ourfindings are the first to demonstrate thatpoor people who receive social supportthat they perceive to be satisfactory canhave a level of mental health comparable to
that existing within the more affluent pop-ulation.
The general population not in distresswas, however, more satisfied than lower-income people not in distress with respectto three components of support: reassur-ance of one’s worth, social integration andguidance during stressful periods. In a pre-vious study,54 we had already noted thesame differences in these componentsbetween the general population and socialassistance recipients. Indeed, in the materi-alistic kind of society in which we live,people’s values are often associated withmaterial possessions (house, car, etc.) sym-bolizing economic success. In addition,income security recipients are often isolat-ed from environments that tend to confirmpeople’s worth, such as the workplace.When they work part time, they findthemselves in unstable employment thatgarners little status. Finally, in most socialtransactions, they are regularly stigmatizedand excluded.
Social integration support flows fromrelationships that involve individuals shar-ing social activities. More affluent popula-tions are more satisfied with this type ofsupport, since people in these groups havethe economic means to take part in moresocial activities. The fact that people whoare more affluent perceive more guidancesupport probably stems from the fact thattheir higher educational level puts them inmore frequent contact with a network ofpeople who are also more educated. Thisallows them to obtain more relevant advicewhen they have financial, legal, medical,family or personal problems to solve. It isinteresting to note that social assistancerecipients receiving mental health servicesfrom health professionals are just as satis-fied with the guidance they receive as aresocial assistance recipients not in distress.
Having access to reliable support—emo-tional support, concrete and material assis-tance, guidance, reassurance of worth, andsocial integration support—seems to be acrucial protective factor that allows poorpeople to maintain their psychological bal-ance. Using a rigorous approach, this studyhas been able to confirm the importantrelationship that these previously identifiedcomponents have with mental health.27,34-36
Owing to the diversity of the methodsused and populations studied as well as thelimited number of support components
PSYCHOLOGICAL DISTRESS IN POOR POPULATIONS
JULY – AUGUST 2007 CANADIAN JOURNAL OF PUBLIC HEALTH S41
simultaneously examined by these studies,it was not possible to determine the magni-tude of the contribution of each type ofsupport in the relationship with mentalhealth.
As well, relationships that allow peopleto feel “useful and necessary” measured by“nurturance” play a very limited role indistinguishing groups in distress fromthose not in distress, just as they do notdistinguish between poor people and peo-ple who are more affluent, as our previousstudy determined.54
A lower level of satisfaction with avail-able emotional support, as measured by the“attachment” component, is one of twovariables that best predict distress amongpoor people. This type of support is actual-ized through relationships with close net-work members, such as spouses, parents,brothers, sisters and close friends. Thesefindings support one of our hypothesesbased on Cutrona and Russell’s theory ofoptimal matching,34 which posits that difficult-to-control events, such as eco-nomic problems, throw people into a stateof shock, and emotional support becomesthe basic factor allowing them to deal withthese events.
The quality of relationships, particularlythose enhancing emotional support,appears to be much more important than anetwork’s size or density. Although severalstudies indicate that people who are betterintegrated socially and in their communi-ties through the range of social roles theyplay are healthier,55 our study did not iden-tify differences among groups. The pres-ence of harmful persons within an individ-ual’s network was one of the two mostpowerful predictors of distress among poorpeople. Social relations are therefore thebest predictors of distress, and they play,for better or worse, a role in maintainingmental health. Negative social interactionshave been identified as predictors of men-tal health problems,51,56 lower quality oflife57-60 and child abuse32 in previous stud-ies.
Finally, regression analysis also identifiedthree other variables: numeracy, age andfood insecurity. Their contribution is quitesmall compared with that of social rela-tions. It is understandable that having bet-ter numeracy skills reduces distress amonglow-income people, since these skills likelyallow them to better manage their limited
financial resources. In this area, Boyer etal.61 report more distress among peoplewith lower literacy levels. As previouslymentioned, younger populations are morevulnerable. Finally, food insecurity is asso-ciated with a higher level of distress.Hamelin43 also made this observation.
None of the variables related to spiritual-ity, financial situation, perception of one’sfinancial situation, material support from anetwork or resourcefulness predicted dis-tress within poor populations. It shouldnot be concluded that income is not gener-ally related to distress, since, in the pastquarter century, most research has shownthat poor populations are more vulnerable.Moreover, the more affluent populationsin these two neighbourhoods have consid-erably lower levels of distress. However, inthe poor population, income does not pre-dict distress, probably because income dif-ferences are small and people with higherincomes are only slightly less poor. Thereappears to be an income threshold underwhich certain basic needs cannot be met,which makes this population more vulner-able. It is also plausible that the materialassistance people obtain from networksand through their own resourcefulnessdoes not allow them to reach the thresholdof material comfort that would meet theirbasic needs.
Several limitations in our study must berecognized. First, we cannot exclude thepossibility that the higher rate of psycho-logical distress in our samples was a resultof the relatively low response rate. Second,the present study design (cross-sectional)cannot assess the direction of this relation-ship between social support and psycholog-ical distress. In the scientific literaturesocial support is described as a protectivefactor for mental health, but it is also pos-sible that people with more distress per-ceive less support from their network; wecannot exclude either the possibility thattheir symptoms can impede their access tovarious components of support.Longitudinal studies are needed to clarifythe direction of causality underlying theseassociations between mental health andsocial support.
CONCLUSION
This study has thus confirmed the greatervulnerability of poor people to mental
health problems, a result that has emergedfrom numerous other studies.Furthermore, it corroborates the healthproblems encountered by the populationin the neighbourhoods of Pointe Saint-Charles and Saint-Henri in relation tomental health. Life expectancy in these twoneighbourhoods is clearly lower than inmore affluent neighbourhoods ofMontreal; morbidity related to cancer andcardiovascular and respiratory problems isclearly higher. These neighbourhoods thathave a high concentration of poor residentscombine a number of risk factors that hin-der the population’s harmonious develop-ment, such as poor housing, food insecuri-ty, a high rate of single-parent families andpeople living alone, and disadvantagedschools. As for adolescence, the populationin these neighbourhoods shows signs ofvulnerability, such as high drop-out anddelinquency rates (Montreal Public HealthDepartment/Direction de la santépublique de Montréal: personal communi-cation, 2001).
This study has also clarified the impor-tance of the relation between social sup-port and psychological distress. Poor peo-ple who can count on a social network toobtain various kinds of support have a levelof mental health comparable to that ofothers who have higher incomes. The per-ceived availability of emotional supportfrom their social network and a smallernumber of harmful persons are the twovariables most strongly associated with bet-ter mental health. A high concentration ofpoor residents subjected to conditions ofchronic stress related to the precariousnessof their living conditions is clearly not con-ducive to obtaining adequate social sup-port when stress-inducing life events occur,as was demonstrated by Tousignant andCaron62 in these same neighbourhoods.Very high levels of psychological distresswere found among these neighbourhoods’poor residents but also among their otherresidents, who have a much higher level ofdistress than the general population on theIsland of Montreal. The minimum annualeconomic burden of psychological distressin Canada comes to $14.4 billion dollars.63
A social housing policy leading to a greaterblending of the poor and more affluentpopulations could be a solution to avoidconcentrating distress and would likelyreduce it by promoting greater diversity
PSYCHOLOGICAL DISTRESS IN POOR POPULATIONS
S42 REVUE CANADIENNE DE SANTÉ PUBLIQUE VOLUME 98, SUPPLÉMENT 1
within social networks, which have animpact on this condition.
REFERENCES
1. Dohrenwend BP, Dohwenrend BS.Socioenvironnemental factors, stress, and psy-chopathology. Am J Commun Psychol1981;9:128-29.
2. Leighton DC, Hagnell O, Leighton AH, et al.Psychiatric disorders in a Swedish and aCanadian community: an exploratory study. SocSci Med 1971;5:189-209.
3. Gonzales V, Yamure A, Garcia R, Pardo F,Bethancourth E. Epidemiology of mental disor-ders in Bogota. Acta psiquiatra y psicol Am Lat1978;24:93-99.
4. Dilling H, Wereyer S. Prevalence of mental dis-orders in a small town-rural region of Traunstein(Upper Bavaria). Acta Psychiatr Scand1984;69:60-70.
5. Légaré G, Préville M, Massé R, Poulin C, St-Laurent D, Boyer R. Santé Mentale Rapport del’enquête Santé Québec. Ministry of Health andSocial Services, 1998: chapter 16.
6. Caron J, Martel F, Vitaro F. Les groupes vulné-rables en santé mentale: études d’archives. Can JCommunity Mental Health 1988;7(10):99-116.
7. Catalano R. Health, Behaviour and theCommunity: an Ecological Perspective. New York:Pergamon Press.
8. Aber JL, Jones S, Cohen S. The impact of pover-ty on the mental health and development of veryyoung children. In: Zeanah CH Jr. ed. Handbookof Infant Mental Health, 2nd ed. New York, NY,US: The Guilford Press, 2002;113-28.
9. Dore MM. Family preservation and poor fami-lies: When “homebuilding” is not enough.Families in Society 1993;74(9):545-56.
10. McLeod JD, Shanahan MJ. Poverty, parentingand children’s mental health. Am Sociol Rev1993;58(3):351-66.
11. McLoyd VC, Wilson L. The strain of living poor:parenting, social support, and child mental health.In: Huston AC, ed. Children in Poverty: ChildDevelopment and Public Policy. Cambridge, England:Cambridge University Press, 1994;105-35.
12. Sameroff AJ, Seifer R. Accumulation of environ-mental risk and child mental health. In:Fitzgerald HE, Lester BM, eds. Children ofPoverty: Research, Health, and Policy Issues.Reference Books on Family. New York: GarlandPublisher Inc., 1995;3-41.
13. Fortin D. La pauvreté et la maladie mentale: est-ce que les pauvres sont plus malades and si oui,pourquoi? Santé mentale au Québec1989;14(2):104-13.
14. Selye H. Stress sans détresse. Montreal: Édition LaPresse, 1974.
15. Holmes TH, Rahe RH. The social readjustmentscale. J Psychosom Res 1967;11:213-18.
16. Dohrenwend BP, Dohwenrend BS. Some issueson research on stressful life events. J NervousMent Dis 1978;166:7-15.
17. Antonovsky A. Unravelling the Mystery of Health:How People Manage Stress and Stay Well. SanFrancisco: Jossey Bass, 1987.
18. Kessler RC, Shanyang Z, Blazer DG, Swartz M.Prevalence, correlates and course of minordepression and major depression in the nationalcomorbidity study. J Affective Dis 2001;45:19-30.
19. Caron J. Una teoria ecologica de la intervencioncomunitaria: acceso y conservacion de los recur-sos. Intervencion psicosocial. 1996;5(14):53-68.
20. Hobfoll S. Stress, Culture, and Community: ThePsychology and Philosophy of Stress. New York,NY: Plenum Press, 1998.
21. Dressler WW, Bindon JR, Neggers YH. Culture,socioeconomic status, and coronary heart disease
risk factors in an African American community.J Behav Med 1998;21(6):527-44.
22. Brown GW, Bifulco A, Harris T. Life-events,vulnerability and onset of chronic depression.J Affect Disord 1987;11:1-19.
23. Dohrenwend BP, Dohwenrend BS. Social Statusand Psychological Disorders: a Causal Inquiry. NewYork: Wiley, 1969.
24. Dohrenwend BP, Dohwenrend BS. Social andcultural influences on psychopathology. Am RevPsychol 1974;25:417-51.
25. BrunelleY, Tremblay D. Environnement social. Etla Santé, ça va? Rapport d’enquête de Santé Québec.Les publications du Québec, 1988, 67–86.
26. Andrews G, Tennant D, Hewson V. Life stress,social support, coping style and risk of psycholog-ical impairment. J Nervous Ment Dis1978;166:307-16.
27. Kessler RC. A disaggregation of the relationshipbetween socio-economic status and psychologicaldistress. Am Sociolog Rev 1982;46:752-64.
28. Biegel DE, Naparstek AJ, Khan MM. Social sup-port and mental health in ethnic neighbour-hoods. In: Biegel DE, Naparstek A, eds.Community Support Systems and Mental Health.New York: Springer, 1982.
29. Caplan G, Killilea M. Support System and MutualHelp: Multidisciplinary Explorations. New York:Grune and Stanton, 1976.
30. Brennan T. Loneliness at adolescence. In:Pepleau LA, Perlman D, eds. Loneliness: ASourcebook of Current Theory, Research andTherapy. New York: Wiley, 1982; 269-91.
31. Ouellet F. Enquête promotion de la santé àMontréal: Le réseau social. Montreal: DSC Sacré-Coeur, 1988.
32. Bouchard C, Chamberland C, Beaudry J. Le mau-vais traitement envers les enfants: une étude desfacteurs macro et micro-économiques. In: Guay J,ed. Manuel québécois de psychologie communautaire.Chicoutimi: Gaëtan Morin, 1987; 271-86.
33. Bouchard C. Lutter contre la pauvreté ou seseffets? Les programmes d’intervention précoce.Santé mentale au Québec 1989;14:138-49.
34. Cutrona CE, Russell DW. Type of social supportand specific stress: toward a theory of optimalmatching. In: Sarason BR, Sarason IG, PierceGR, eds. Social Support: An Interactional View.New York: John Wyley and Sons, 1990.
35. Bolton W, Oatley K. A longitudinal study ofsocial support and depression in unemployedmen. Psychol Med 1987;17:453-60.
36. Ullah P, Banks M, Warr P. Social support, socialpressures and psychological distress during unem-ployment. Psychol Med 1985;15:283-95.
37. Ilfeld FW. Further validation of a PsychiatricSymptom Index in a normal population. PsycholRep 1976;39:1215-28.
38. Brown Ames H. The City below the Hill: ASociological Study of a Portion of the City ofMontreal, Canada. Social History of Canada Series,Montréal: Engraving & Printing Co. Ltd., 1972.
39. Cutrona CA. Behavioral manifestation of socialsupport: a micro-analytic study. J Personal SocPsychol 1989;51:201-208.
40. Caron J. L’Échelle de Provisions Sociales: la vali-dation québécoise du Social Provisions Scale.Santé Mentale au Québec 1976;21(2):158-80.
41. Cohen S, Doyle WJ, Skoner DP, Rabin BS,Gwaltney JM, Jr. Social ties and susceptibility tothe common cold. JAMA 1997;277:1940-44.
42. Olson CM, Frongillo E, Kendall A. Measuringthe Prevalence of Hunger and Food Insecurity inCommunities: Principles and Methods.Food Security in the United States: A Guide Bookfor Public Education. Ithaca, New York: CornellCooperative Extension System, 1994.
43. Hamelin AM. L’insécurité alimentaire des ménagesdans la région de Québec: une exploration.Doctoral dissertation. Université Laval, 1999.
44. Radimer KL, Olson CM, Greene JC, CampbellC, Habicht JC. Understanding hunger and devel-oping indicators to assess it in women and chil-dren. J Nutr Educ 1992;24:36S-45S.
45. Kendall A, Olson CM, Frongillo E. Validation ofthe Radimer/Cornell Hunger and FoodInsecurity Measures. J Nutr 1995;125:2793-801.
46. Literacy, Economy and Society: Results of the firstInternational Adult Literacy Survey database.Organisation for Economic Co-operation andDevelopment and Statistics Canada, 1995.
47. Boyer R, Préville M, Légaré G, Valois P. Ladétresse psychologique dans la population duQuébec non institutionalisée: résultats normatifsde l’enquête santé Québec. Can J Psychiatry1993;38:339-43.
...continues
PSYCHOLOGICAL DISTRESS IN POOR POPULATIONS
JULY – AUGUST 2007 CANADIAN JOURNAL OF PUBLIC HEALTH S43
RÉSUMÉ
Contexte : Toutes les études épidémiologiques le confirment : les populations pauvres sont les plusvulnérables aux problèmes de santé mentale. Cependant, les personnes qui éprouvent desdifficultés financières ne présentent pas toutes des symptômes; le fait d’avoir un réseau de soutiensocial semble offrir une certaine protection contre le stress chronique engendré par les situationscomme la pauvreté.
Objectifs : Notre étude vise à clarifier la contribution relative du soutien social à la santé mentaledes populations à faible revenu dans deux quartiers du sud-ouest de Montréal : Pointe-Saint-Charles et Saint-Henri.
Méthode : Nous avons interviewé un échantillon aléatoire de 416 bénéficiaires d’aide sociale dusud-ouest de Montréal et un autre échantillon de 112 personnes sélectionnées au hasard dans lapopulation générale. Nous avons utilisé l’Indice de détresse psychologique de l’enquête SantéQuébec (IDPESQ) et évalué la disponibilité du soutien social à l’aide de l’Échelle de provisionssociales. Les données ont été recueillies à la faveur d’entretiens au domicile des répondants. Lesmesures du soutien social ont été introduites dans un modèle pluridimensionnel comportant denombreuses variables connues comme étant associées à la santé mentale. Une analyse derégression multiple a permis de cerner les meilleurs indicateurs prévisionnels de la détressepsychologique dans les populations à faible revenu.
Constatations et conclusion : Des 30 variables incluses dans l’analyse de régression multiple, lesoutien affectif et la présence de personnes jugées stressantes ont contribué à elles deux à lamajorité des écarts dans les niveaux de détresse prédits par le modèle. Les jeunes, les personnessouffrant d’insécurité alimentaire et les personnes ayant de faibles connaissances en mathématiquesprésentaient un niveau de détresse plus élevé, mais le rôle de ces variables était marginal comparéà celui des relations sociales.
48. Sokal RR, Rohlf FJ. Biometry, the Principle andPractice of Statistics in Biological Research. SanFrancisco: W.H. Freeman, 1969.
49. Tabachnick BG, Fidell LS. Using MultivariateStatistics. New York: McGraw Hill, 2001.
50. Kawagachi I, Berkman L. Social cohesion, socialcapital, and health. In: Berkman L, Kawagachi I,eds. Social Epidemiology. New York: OxfordUniversity Press, 2000.
51. Caron J, Latimer E, Tousignant M, Raynault MF,Huang JH. The Mental Health and Well-being ofPoor Populations in Canada. Presented at the XthInternational Congress of the InternationalFederation of Psychiatric Epidemiology, Bristol,England, September 2004.
52. Beiser M, Hou F, Hyman Y, Tousignant M.Poverty, family process, and mental health ofimmigrant children in Canada. Am J PublicHealth 2000;92(2):220-27.
53. DeVorezt D. Diminishing Returns; The Economicsof Immigration Policy. Toronto, Ontario:University of Toronto Press, 1995.
54. Caron J, Tempier R, Mercier C, Leouffre P.Components of social support and quality of lifein long term psychiatric patients, in low incomeindividuals and in the general population.Community Mental Health J 1988;34(5)469-76.
55. Brissette I, Cohen S, Seeman TE. Measuringsocial integration and social networks. In: CohenS, Underwood LG, Gottlieb BH, eds. SocialSupport Measurement and Intervention. NewYork: Oxford University Press, 2000.
56. Kessler RC, Shanyang Z, Blazer DG, Swartz M.Prevalence, correlates, and course of minor depres-sion and major depression in the national comor-bidity survey. J Affective Dis 1997;45:19-30.
57. Rook KS. The negative side of social interaction:impact on psychological well-being. J Personal SocPsychol 1984;46:109-18.
58. Sarason BR, Pierce GR, Bannerman A, SarasonIG. Investigating the antecedants of perceivedsocial support: parents’ view of and behaviortoward their children. J Personal Soc Psychol1993;6:1071-85.
59. Helgeson VS. Social support and quality of life.Qual Life Res 2003;12(Suppl 1):25-31.
60. Yanos PT, Rosenfield S, Horwitz AV. Negativeand supportive social interactions and quality oflife among persons diagnosed with severe mentalillness. Community Ment Health J2001;37(5):405-19.
61. Boyer R, Lavallée M, Boucher C. La détresse psy-chologique et le suicide chez les personnes en proces-sus d’alphabétisation. Paper given on the 5th scien-tific day of the Réseau de Santé Mentale duQuébec. Quebec, June, 1999.
62. Tousignant M, Caron J. Quand le malheur frappe les bénéficiaires de la sécurité du revenu.Sur qui peuvent-ils s’appuyer? Santé mentale auQuébec 2005;30(2):85-100.
63. Stevens T, Joubert N. Le fardeau économique desproblèmes de santé mentale au Canada. ChronDis Can 2001;22(1):19-25.
PSYCHOLOGICAL DISTRESS IN POOR POPULATIONS
S44 REVUE CANADIENNE DE SANTÉ PUBLIQUE VOLUME 98, SUPPLÉMENT 1
Related Documents