PREDICTION OF FLOW DURATION CURVES FOR USE IN HYDROPOWER ANALYSIS AT UNGAGED SITES IN POHNPEI, FSM By Dr. Leroy F. Heitz P.E. Dr. Shahram Khosrowpanah P.E. Technical Report No. 129 July 2010

Welcome message from author
This document is posted to help you gain knowledge. Please leave a comment to let me know what you think about it! Share it to your friends and learn new things together.
Transcript

PREDICTION OF FLOW DURATION
CURVES FOR USE IN HYDROPOWER ANALYSIS AT
UNGAGED SITES IN POHNPEI, FSM
By
Dr. Leroy F. Heitz P.E. Dr. Shahram Khosrowpanah P.E.
Technical Report No. 129 July 2010

ii
PREDICTION OF FLOW DURATION CURVES FOR USE IN HYDROPOWER ANALYSIS AT UNGAGED SITES IN
POHNPEI, FSM
by
Dr. Leroy F. Heitz Dr. Shahram Khosrowpanah
University of Guam Water and Environmental Research Institute
of the Western Pacific UOG Station, Mangilao, Guam 96923
Technical Report No. 129 July 2010
The work reported herein was funded, in part by the Department of the Interior, via the Water Resources Research Institute Program of the U.S. Geological Survey (Award No. 06HQGR0112), administered through the Water and Environmental Research Institute of the Western Pacific (WERI) at the University of Guam. The content of this report does not necessarily reflect the views and policies of the Department of the Interior, nor does the mention of trade names or commercial products constitute their endorsement by the United States Government.
iii
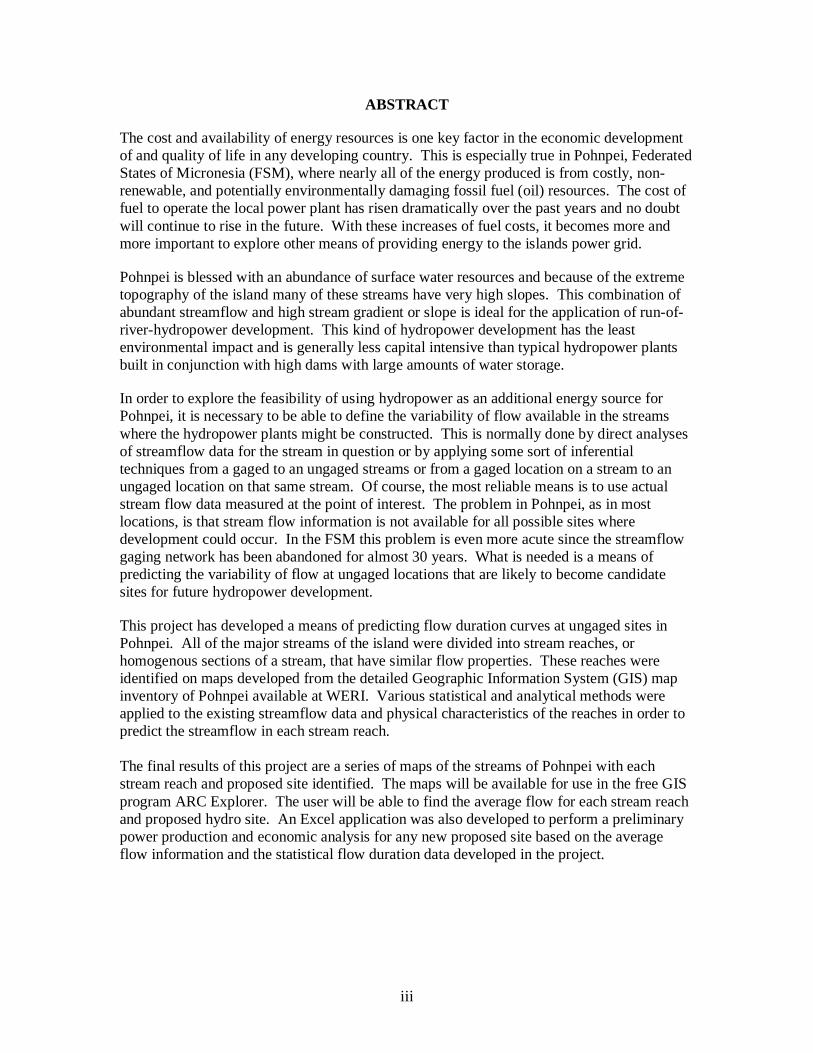
ABSTRACT
The cost and availability of energy resources is one key factor in the economic development of and quality of life in any developing country. This is especially true in Pohnpei, Federated States of Micronesia (FSM), where nearly all of the energy produced is from costly, non-renewable, and potentially environmentally damaging fossil fuel (oil) resources. The cost of fuel to operate the local power plant has risen dramatically over the past years and no doubt will continue to rise in the future. With these increases of fuel costs, it becomes more and more important to explore other means of providing energy to the islands power grid.
Pohnpei is blessed with an abundance of surface water resources and because of the extreme topography of the island many of these streams have very high slopes. This combination of abundant streamflow and high stream gradient or slope is ideal for the application of run-of-river-hydropower development. This kind of hydropower development has the least environmental impact and is generally less capital intensive than typical hydropower plants built in conjunction with high dams with large amounts of water storage.
In order to explore the feasibility of using hydropower as an additional energy source for Pohnpei, it is necessary to be able to define the variability of flow available in the streams where the hydropower plants might be constructed. This is normally done by direct analyses of streamflow data for the stream in question or by applying some sort of inferential techniques from a gaged to an ungaged streams or from a gaged location on a stream to an ungaged location on that same stream. Of course, the most reliable means is to use actual stream flow data measured at the point of interest. The problem in Pohnpei, as in most locations, is that stream flow information is not available for all possible sites where development could occur. In the FSM this problem is even more acute since the streamflow gaging network has been abandoned for almost 30 years. What is needed is a means of predicting the variability of flow at ungaged locations that are likely to become candidate sites for future hydropower development.
This project has developed a means of predicting flow duration curves at ungaged sites in Pohnpei. All of the major streams of the island were divided into stream reaches, or homogenous sections of a stream, that have similar flow properties. These reaches were identified on maps developed from the detailed Geographic Information System (GIS) map inventory of Pohnpei available at WERI. Various statistical and analytical methods were applied to the existing streamflow data and physical characteristics of the reaches in order to predict the streamflow in each stream reach. The final results of this project are a series of maps of the streams of Pohnpei with each stream reach and proposed site identified. The maps will be available for use in the free GIS program ARC Explorer. The user will be able to find the average flow for each stream reach and proposed hydro site. An Excel application was also developed to perform a preliminary power production and economic analysis for any new proposed site based on the average flow information and the statistical flow duration data developed in the project.

iv
TABLE OF CONTENTS
Page
ABSTRACT ................................................................................................................... iii
LIST OF FIGURES ......................................................................................................... v
LIST OF TABLES ......................................................................................................... vi
INTRODUCTION ........................................................................................................... 1
STUDY AREA ............................................................................................................... 2
OBJECTIVES ................................................................................................................. 4
RELATED RESEARCH ................................................................................................. 4
METHODS AND PROCEDURES .................................................................................. 5 PHASE I. Development Flow Duration Curves for Each Gage Site ………….... 5 PHASE II. Prediction of Duration Curves at Ungaged Sites ……………………. 9 PHASE III. Predict Average Flow at Ungaged Point on Stream ………………..10 PHASE IV. Stream Reach Delineation and Average Flow ……………………..18 PHASE V. Hydro Power Production and Economic Analysis ………………… 20
RESULTS…………….. ................................................................................................ 22
SUMMARY AND CONCLUSIONS ............................................................................. 22
ACKNOWLEDGEMENTS ........................................................................................... 23
LITERATURE CITED .................................................................................................. 24
APPENDIX ................................................................................................................... 25
v
LIST OF FIGURES
Page
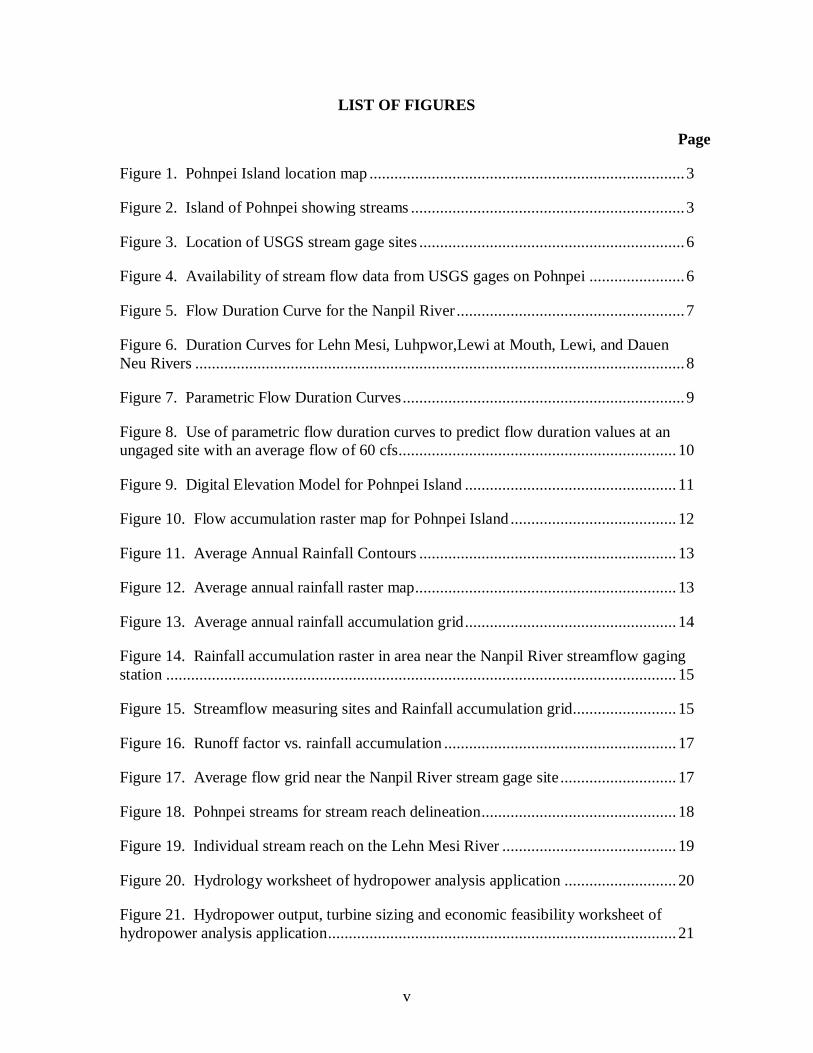
Figure 1. Pohnpei Island location map ............................................................................ 3
Figure 2. Island of Pohnpei showing streams .................................................................. 3
Figure 3. Location of USGS stream gage sites ................................................................ 6
Figure 4. Availability of stream flow data from USGS gages on Pohnpei ....................... 6
Figure 5. Flow Duration Curve for the Nanpil River ....................................................... 7
Figure 6. Duration Curves for Lehn Mesi, Luhpwor,Lewi at Mouth, Lewi, and Dauen Neu Rivers ...................................................................................................................... 8
Figure 7. Parametric Flow Duration Curves .................................................................... 9
Figure 8. Use of parametric flow duration curves to predict flow duration values at an ungaged site with an average flow of 60 cfs ................................................................... 10
Figure 9. Digital Elevation Model for Pohnpei Island ................................................... 11
Figure 10. Flow accumulation raster map for Pohnpei Island ........................................ 12
Figure 11. Average Annual Rainfall Contours .............................................................. 13
Figure 12. Average annual rainfall raster map ............................................................... 13
Figure 13. Average annual rainfall accumulation grid ................................................... 14
Figure 14. Rainfall accumulation raster in area near the Nanpil River streamflow gaging station ........................................................................................................................... 15
Figure 15. Streamflow measuring sites and Rainfall accumulation grid......................... 15
Figure 16. Runoff factor vs. rainfall accumulation ........................................................ 17
Figure 17. Average flow grid near the Nanpil River stream gage site ............................ 17
Figure 18. Pohnpei streams for stream reach delineation ............................................... 18
Figure 19. Individual stream reach on the Lehn Mesi River .......................................... 19
Figure 20. Hydrology worksheet of hydropower analysis application ........................... 20
Figure 21. Hydropower output, turbine sizing and economic feasibility worksheet of hydropower analysis application .................................................................................... 21

vi
LIST OF TABLES
Page
Table 1. Flow Duration Table Nanpil River, Pohnpei ..................................................... 7
Table 2. Average runoff and Precipitation Area products (average rainfall accumulation) for Pohnpei's stream gage stations ................................................................................. 16
1
INTRODUCTION
The cost and availability of energy resources is one key factor in the economic development and quality of life of any developing country. This is especially true in Pohnpei, Federated States of Micronesia (FSM), where nearly all of the energy produced is from costly, non-renewable, and potentially environmentally damaging fossil fuel (oil) resources. The cost of fuel to operate the local power plant has risen dramatically over the past years and no doubt will continue to rise in the future. With these increases of fuel costs, it becomes more and more important to explore other means of providing energy to the island’s power grid.
Pohnpei is blessed with an abundance of surface water resources and because of the extreme topography of the island many of these streams have very high slopes. This combination of abundant streamflow and high stream gradient or slope is ideal for the application of run-of-river-hydropower development. This kind of hydropower development has the least environmental impact and is generally less capital intensive than typical hydropower plants built in conjunction with high dams with large amounts of water storage. While in general hydropower plants are high in first cost, the cost per kilowatt hour of energy production is lower than fossil fuel plants and the annual power costs have the advantage of remaining relatively stable over the life of the project. Another advantage is the hydropower plant can be operated in a running reserve capacity and therefore can be called on to easily assist in supplying peak demands that occur at various times of the day.
In order to explore the feasibility of using hydropower as an additional energy source for Pohnpei, it is necessary to be able to define the variability of flow available in the streams where the hydropower plants might be constructed. This is normally done by direct analyses of streamflow data for the stream in question or by applying some sort of inferential techniques from a gaged to an ungaged streams or from a gaged location on a stream to an ungaged location on that same stream. Of course, the most reliable means is to use actual stream flow data measured at the point of interest. The problem in Pohnpei, as in most locations, is that stream flow information is not available for all possible sites where development could occur. In the FSM this problem is even more acute since the streamflow gaging network has been abandoned for almost 30 years. What is needed is a better means of predicting the variability of flow at ungaged locations that are likely to become candidate sites for future water resources development.
The flow duration curve provides us with a means of representing the variability of flow at a proposed hydropower site in a concise graphical fashion. Flow duration curves have proven to be useful in evaluation of surface water resources for water supply studies, hydropower design and planning studies, low flow studies such as in streamflow requirements and other studies where it is desirable to define the variability of the flows in streams. This project has developed a means of predicting flow duration curves at ungaged sites in Pohnpei. All of the major streams of the island were divided into stream reaches, or homogenous sections of a stream, that have similar flow properties. These reaches were

2
identified on maps developed from the detailed Geographic Information System (GIS) map inventory of Pohnpei available at WERI. Various statistical and analytical methods were applied to the existing streamflow data and physically characteristics of the reaches in order to predict the streamflow in each stream reach. A map was also developed that shows past proposed hydro sites. This map provides the predicted streamflow at these sites. The final result of this project is a series of maps of the streams of Pohnpei with each stream reach and proposed site identified. The maps will be available for use in the free GIS program ARC Explorer. The user will be able to find the average flow for each stream reach and proposed hydro site.
An Excel application was also developed to perform a preliminary power production and economic analysis for any new proposed site. Those wishing to explore the feasibility of hydro power at a particular site will be able to enter the average flow and available head (hydraulic drop) information into the simple spreadsheet application which will be provided as part of the study. This application will allow the user to explore various turbine sizing and economic consideration to determine the preliminary feasibility of developing a hydropower facility at a particular site.
STUDY AREA
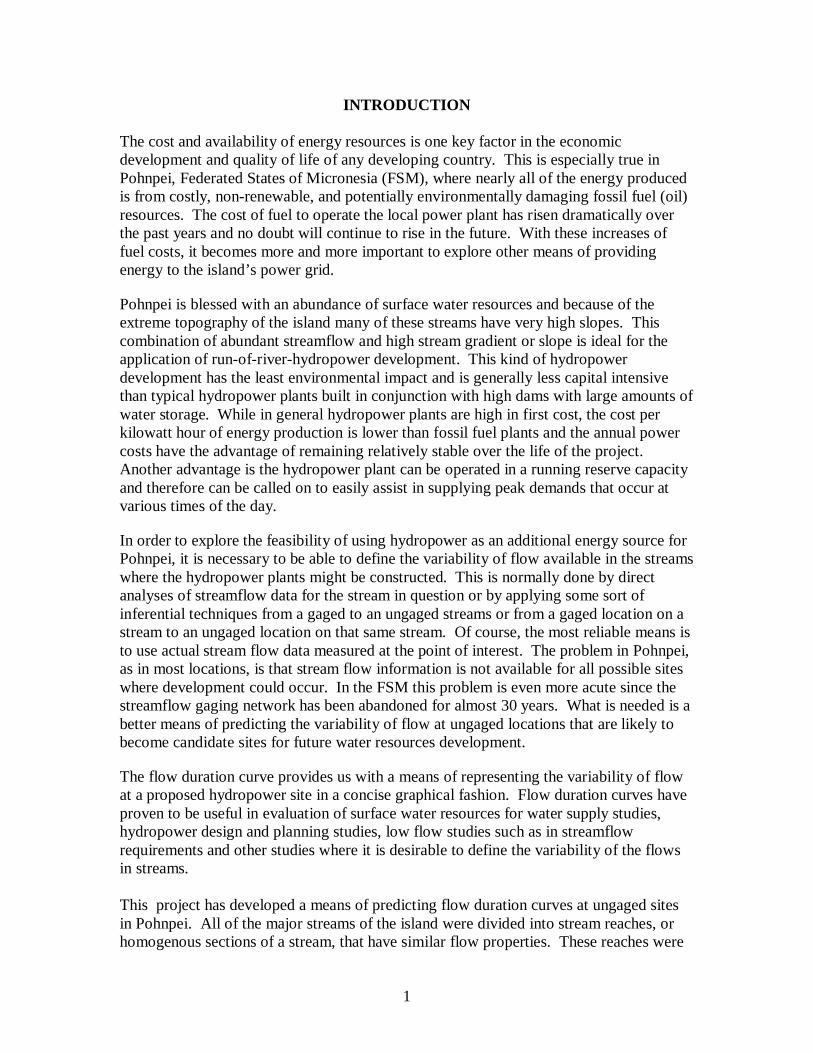
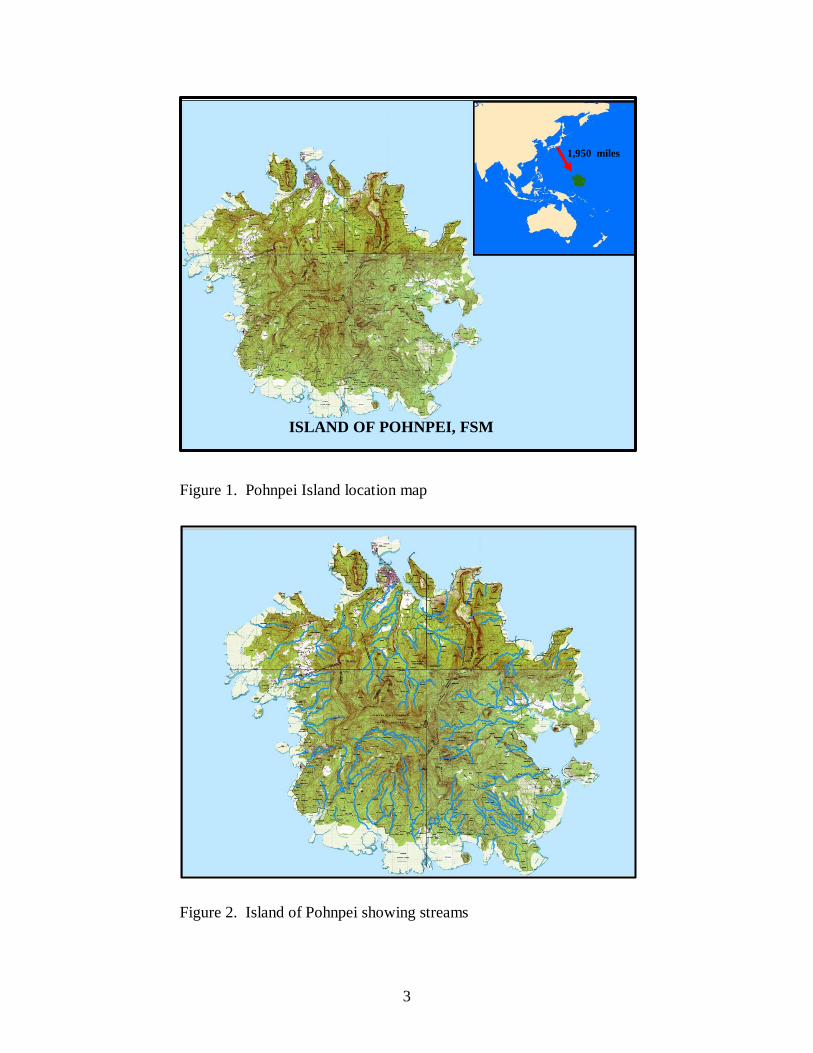
As shown in Figure 1, the Island of Pohnpei is located in the Western Pacific approximately 1,950 miles South East of the Island of Japan. Pohnpei is a state in the Federated States of Micronesia (FSM). The capital of the FSM is located in Palikir, Pohnpei State. The more detailed map in Figure 2 shows the many streams on the island. The land area of the island is approximately 110 square miles. Rainfall on the island ranges from 140 to 320 inches. The topography of almost the entire island is highly mountainous intersected with many fast flowing streams making it an ideal area for hydropower development. As of 2,000 the population of the island is approximately 34,500 the island is served by the Pohnpei Utility Corporation (PUC). The PUC provides water and power to the island. The majority of the power produced on the island is by thermal (fuel oil) power plants. There is one existing hydroelectric power plant on the Nanpil River.
3
Figure 1. Pohnpei Island location map Figure 2. Island of Pohnpei showing streams
ISLAND OF POHNPEI, FSM
1,950 miles

4
OBJECTIVES
The overall objective of this project was to develop flow durations curves for reaches of Pohnpei’s streams and for proposed hydropower development sites. These flow duration curves are essential for studying future hydropower development in the streams and will also be useful in making studies of low flow requirements and availability of water for various surface water developments and to study the impacts of mans activities on stream flows. The specific objectives of the research were to:
1. Develop flow duration curves for all of the previously gaged stream sites in Pohnpei.
2. Develop techniques, based on average stream flow, for transferring the flow duration curve information available at the gaged locations to ungaged sites in Pohnpei.
3. Develop estimates of average flow for Pohnpei's streams.
4. Divide Pohnpei’s streams into homogenous stream reaches with similar flow characteristics and assign an average flows to each reach.
5 Locate past proposed hydro development sites on GIS maps and assign an average flows to each site.
6. Develop a set of GIS based maps showing the location of all stream reaches and sites along with the average flows available and make these maps available in a free to use GIS program
7. Provide an Excel application that will compute flow duration curves for the reach and sites and also perform analyses to determine preliminary power potential and economics for specific hydropower site locations.
RELATED RESEARCH Beginning in the early 80s the co-investigator of this project was involved with a large scale project to predict the hydro potential of the streams of the Pacific Northwest. Several different approaches were explored and the co-investigator for this project along with others developed the parametric duration curve technique that was applied in this project (Gladwell et al, 1979), (Heitz, 1982). Beginning in June of 2003, WERI researchers (Lander & Khosrowpanah, 2004) assembled a network of rain gages around Pohnpei’s coast and in a transect ascending a ridge to the highest mountain, Nahna Laud, in the center of the island. Principal findings

5
included: (1) The distribution of rainfall on Pohnpei is affected by the topography, and the measured annual rainfall totals among recording stations on Pohnpei differ by over 150 inches; (2) Pohnpei’s international airport received the lowest annual total of 142 inches, and the highest measured annual total of 323 inches occurred on top of mount Nahna Laud in the highland rainforest of Pohnpei’s interior; (3) Most of the rainfall on Pohnpei occurs in the early afternoon when daily heating from the sun results in the build-up of showers over the island; and, (4) Earlier charts of Pohnpei’s mean annual rainfall using PRISM (Daly, 1994) were found to be quite accurate (the PRISM analysis of annual rainfall on Pohnpei features a maximum of rainfall in the center of the island that is twice the magnitude of the rainfall along the coast). The prism data along with the new rain gage data was used to develop a more accurate Normal Annual precipitation map of the island. This map, shown later as Figure 11, was put into GIS format and used in a previous study for Pohnpei Island. (Khosrowpanah et al, 2005). We used this GIS map of normal annual precipitation in this study. Other maps depicting the stream network which were developed for the erosion study was also are used in this project.
METHODS AND PROCEDURES
This project was divided into five phases. Each of these phases is described below.
PHASE I Develop Flow Duration Curves for Each Gage Site
The first step was to gather all the available daily streamflow data for Pohnpei’s streams into computer spreadsheet form. This was accomplished using The Water and Environmental Research Institute's (WERI's) Earth Info CD-ROM data base and accompanying data accessing programs. Figure 3 shows the location of the United States Geological Survey (USGS) stream gage sites that were used in the study. Figure 4 provides information on the period of record for each of the gages.
A spreadsheet program developed specifically for use on this project assigned each of the daily flows into flow range categories specified by the user. The number of daily flow values greater than or equal to the upper limit of each category was then calculated. This value was divided by the total number of flows to find the percent of daily flows greater than or equal to the highest flow in that category. This term is called the exceedance percentage. An example of a flow duration calculation is shown in Table 1. A graph is made by plotting the exceedance percentage versus the value for the upper limit flow in each category. This graph is the flow duration curve. Figure 5 shows a typical flow duration curve for the Nanpil River in Pohnpei. Note that the duration curve is normally plotted on a semi-log axis system. This is done because of the large variability between the high and low flows in the streams and to help straighten the flow duration curve for easier interpolation between values. This procedure was repeated for each of the gage sites in Pohnpei. In addition to the duration values, the average annual runoff was determined for each gage site. Figure 6 shows a complete set of duration curves for all of the gage sites in Pohnpei.

6
Figure 3. Location of USGS stream gage sites Figure 4. Availability of stream flow data from USGS gages on Pohnpei
1/1/
1970
1/1/
1971
1/1/
1972
12/3
1/19
72
12/3
1/19
73
12/3
1/19
74
12/3
1/19
75
12/3
0/19
76
12/3
0/19
77
12/3
0/19
78
12/3
0/19
79
12/2
9/19
80
12/2
9/19
81
12/2
9/19
82
12/2
9/19
83
12/2
8/19
84
12/2
8/19
85
12/2
8/19
86
12/2
8/19
87
12/2
7/19
88
12/2
7/19
89
12/2
7/19
90
12/2
7/19
91
12/2
6/19
92
12/2
6/19
93
12/2
6/19
94
NANPIL
LEHN MESI
LEWI
LEWI AT MOUTH
LUHPWOR
MAHND
DAUEN
POHNPEI STREAMFLOW DATA AVAILABILITY MISSING DATA

7
Table 1. Flow Duration Table Nanpil River, Pohnpei
Figure 5. Flow Duration Curve for the Nanpil River
LOW HIGH IN BIN NUMBER GREATER % GREATER0 2 80 8191 99.0328%2 5 263 7928 95.8530%5 10 990 6938 83.8834%10 12 403 6535 79.0110%12 15 548 5987 72.3854%15 20 872 5115 61.8426%20 25 666 4449 53.7904%25 30 626 3823 46.2217%30 35 458 3365 40.6843%35 40 409 2956 35.7393%40 45 330 2626 31.7495%45 55 489 2137 25.8373%55 75 642 1495 18.0752%75 100 563 932 11.2683%
100 200 686 246 2.9742%200 300 148 98 1.1849%300 400 61 37 0.4473%400 500 17 20 0.2418%500 1000 17 3 0.0363%1000 1100 2 1 0.0121%1100 2000 1 0 0.0000%2000 5505 0 0 0.0000%
TOTAL 8271
1
10
100
1000
10000
0% 10% 20% 30% 40% 50% 60% 70% 80% 90% 100%
FLO
W IN
CFS
PERCENT OF TIME FLOW IS EQUALED OR EXCEEDED
NANPIL FLOW DURATON

8
Figure 6. Duration Curves for Lehn Mesi, Luhpwor, Lewi at Mouth, Lewi, and Dauen Neu Rivers
1
10
100
1000
10000
0% 10% 20% 30% 40% 50% 60% 70% 80% 90% 100%
LEHN MESI FLOW DURATON
0.1
1
10
100
1000
0% 10% 20% 30% 40% 50% 60% 70% 80% 90% 100%
LEWI FLOW DURATON
0.1
1
10
100
1000
10000
0% 10% 20% 30% 40% 50% 60% 70% 80% 90% 100%
LEWI AT MOUTH FLOW DURATON
0.1
1
10
100
1000
0% 10% 20% 30% 40% 50% 60% 70% 80% 90% 100%
DAUEN NEU FLOW DURATON
0.1
1
10
100
1000
0% 10% 20% 30% 40% 50% 60% 70% 80% 90% 100%
LUHPWOR FLOW DURATON

9
PHASE II Prediction of Duration Curves at Ungaged Sites
Phase II involved the application of a technique to predict duration curves at ungaged sites in Pohnpei. This step is important because many of the potential hydropower sites in Pohnpei are not located at or near stream gage locations. Some may be located upstream or downstream from gaged location and some may be located on streams where no previous stream flow records are available.
The method that was applied involved the development of parametric curves of flow versus average annual flow for chosen specific exceedance percents. This method was originally developed by the co-investigator in a study of hydropower potential in the Pacific Northwest (Gladwell, et al, 1979). The method was applied to all of the streams in Idaho to assist in determining the hydropower potential for that state.
The first step in applying the method was to take the flow values for the key exceedance percentages of Q(95), Q(30), Q(50), and Q(30) from each of the duration curves developed in Phase I. These particular exceedance values were chosen because these percentages are important in the sizing of hydropower plants. Next the average annual flow was computed for each site. The values of Q vs Average Annual Flow were plotted for each exceedance value at each site and a best fit curve was matched to the data sets. An example of the resulting parametric curves is shown in Figure 7.
Figure 7. Parametric Flow Duration Curves
y = 16.433x + 130.36R² = 0.9672
y = 2.1657x + 0.7409R² = 0.9945
y = 1.0921x - 2.301R² = 0.9967
y = 0.7396x - 2.5171R² = 0.9803
y = 0.3876x - 2.3033R² = 0.9524
y = 0.1801x - 1.2486R² = 0.9562
1
10
100
1000
10000
0 10 20 30 40 50 60 70 80 90 100
EXCE
EDA
NCE
PER
CEN
T FL
OW
IN C
FS
FLOW IN CFS
Q(0)
Q(10)
Q(30)
Q(50)
Q(80)
Q(95)
Linear (Q(0))Linear (Q(10))Linear (Q(30))Linear (Q(50))
10
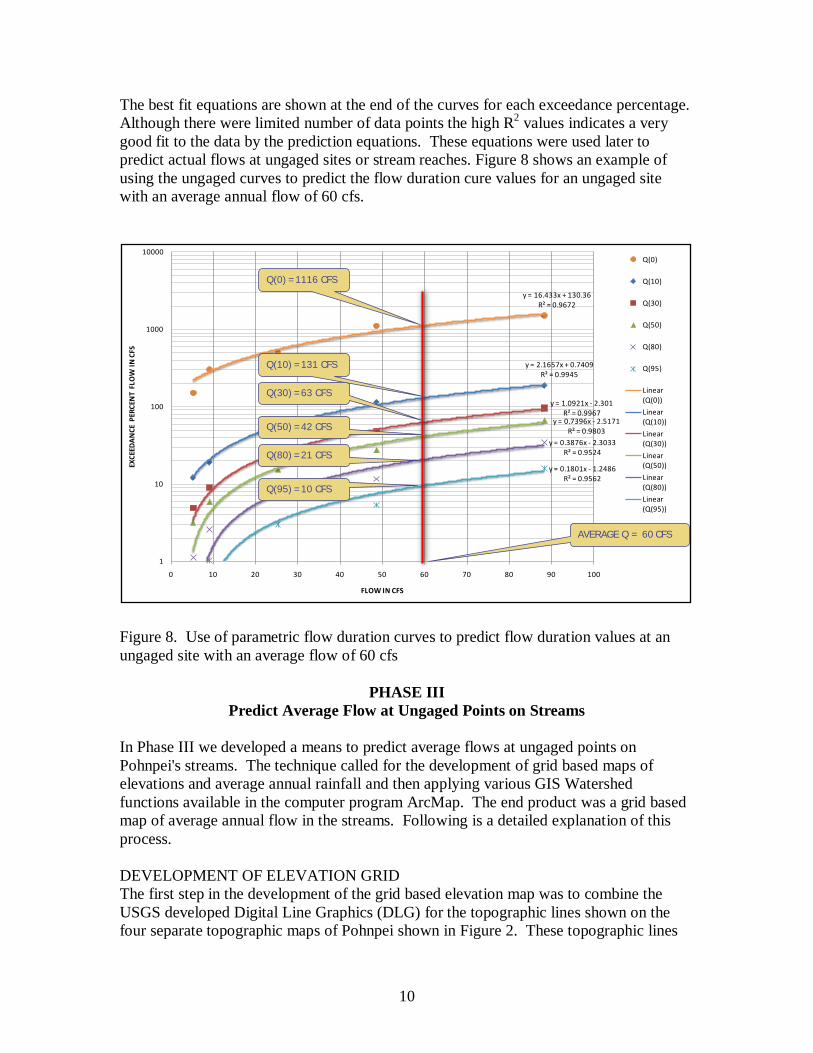
The best fit equations are shown at the end of the curves for each exceedance percentage. Although there were limited number of data points the high R2 values indicates a very good fit to the data by the prediction equations. These equations were used later to predict actual flows at ungaged sites or stream reaches. Figure 8 shows an example of using the ungaged curves to predict the flow duration cure values for an ungaged site with an average annual flow of 60 cfs. Figure 8. Use of parametric flow duration curves to predict flow duration values at an ungaged site with an average flow of 60 cfs
PHASE III Predict Average Flow at Ungaged Points on Streams
In Phase III we developed a means to predict average flows at ungaged points on Pohnpei's streams. The technique called for the development of grid based maps of elevations and average annual rainfall and then applying various GIS Watershed functions available in the computer program ArcMap. The end product was a grid based map of average annual flow in the streams. Following is a detailed explanation of this process. DEVELOPMENT OF ELEVATION GRID The first step in the development of the grid based elevation map was to combine the USGS developed Digital Line Graphics (DLG) for the topographic lines shown on the four separate topographic maps of Pohnpei shown in Figure 2. These topographic lines
y = 16.433x + 130.36R² = 0.9672
y = 2.1657x + 0.7409R² = 0.9945
y = 1.0921x - 2.301R² = 0.9967
y = 0.7396x - 2.5171R² = 0.9803
y = 0.3876x - 2.3033R² = 0.9524
y = 0.1801x - 1.2486R² = 0.9562
1
10
100
1000
10000
0 10 20 30 40 50 60 70 80 90 100
EXCE
EDA
NCE
PER
CEN
T FL
OW
IN C
FS
FLOW IN CFS
Q(0)
Q(10)
Q(30)
Q(50)
Q(80)
Q(95)
Linear (Q(0))
Linear (Q(10))
Linear (Q(30))
Linear (Q(50))
Linear (Q(80))
Linear (Q(95))
Q(10) =131 CFS
Q(30) =63 CFS
Q(50) =42 CFS
Q(80) =21 CFS
Q(95) =10 CFS
Q(0) =1116 CFS
AVERAGE Q = 60 CFS

11
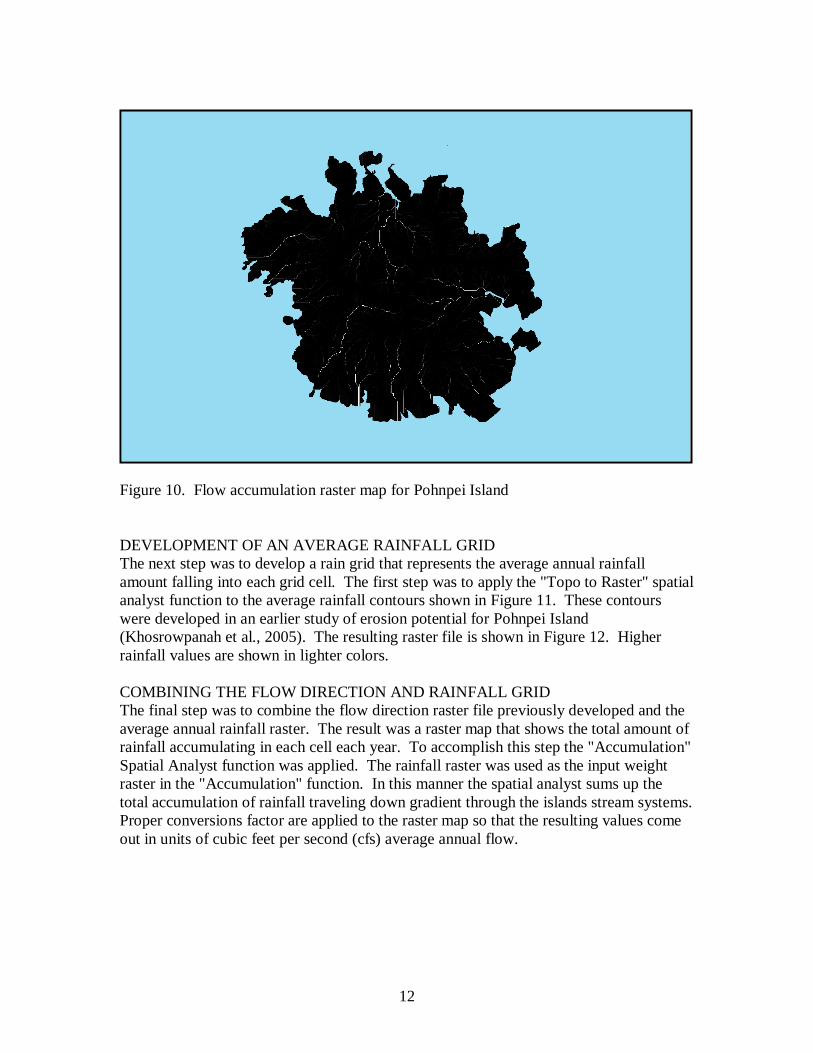
were then processed through the ArcMap 3d Analyst "TIN” function to create a Triangular Irregular Network (TIN) grid of elevations for the entire island. A simple raster map of elevation with grid sizes of 5 meters by 5 meters was created from the TIN map. This grid file is sometimes known as a Digital Elevation Model or DEM. Figure 9 shows the DEM for Pohnpei. Note that the lighter colors are the highest elevations and the dark colors are the lower elevations. In order to be useful this DEM cannot have any local water flow sinks (non outlets). A Spatial Analyst function called "Fill" is used to assure that there are no sinks in the DEM. Once the DEM is filled the filled DEM is used in the remaining Spatial Analyst functions that are applied. DEVELOPMENT OF FLOW ACCUMULATION GRID Next we applied the "Flow Direction" Spatial Analyst function. This function assigned the direction of flow from each of the filled DEM grid cells. Next we applied the "Flow Accumulation" function of the Spatial Analyst. By examining the flow direction from each cell this Spatial Analyst function determines how many upstream cells flow into each cell. Figure 10 shows the results of the accumulation function. The lighter colors show the areas of highest accumulations. These correspond to the small streams and rivers. Figure 9. Digital Elevation Model for Pohnpei Island
12
Figure 10. Flow accumulation raster map for Pohnpei Island DEVELOPMENT OF AN AVERAGE RAINFALL GRID The next step was to develop a rain grid that represents the average annual rainfall amount falling into each grid cell. The first step was to apply the "Topo to Raster" spatial analyst function to the average rainfall contours shown in Figure 11. These contours were developed in an earlier study of erosion potential for Pohnpei Island (Khosrowpanah et al., 2005). The resulting raster file is shown in Figure 12. Higher rainfall values are shown in lighter colors. COMBINING THE FLOW DIRECTION AND RAINFALL GRID The final step was to combine the flow direction raster file previously developed and the average annual rainfall raster. The result was a raster map that shows the total amount of rainfall accumulating in each cell each year. To accomplish this step the "Accumulation" Spatial Analyst function was applied. The rainfall raster was used as the input weight raster in the "Accumulation" function. In this manner the spatial analyst sums up the total accumulation of rainfall traveling down gradient through the islands stream systems. Proper conversions factor are applied to the raster map so that the resulting values come out in units of cubic feet per second (cfs) average annual flow.

13
Figure 11. Average Annual Rainfall Contours Figure 12. Average annual rainfall raster map

14
One can think of this as the average flow that would occur in the streams if there were no losses in the hydrologic system. This value is sometimes referred to as the Precipitation Area product as it is the product of the average annual precipitation in a watershed times the area of the watershed. Figure 13 shows the results of this final accumulation. Again the light colors represent the higher values of rainfall accumulation. Figure 14 shows the same map expanded on an area near the location of the Nanpil river stream gage. The cell in white nearest the gage site has a value 55.8 cfs. This represents the average flow at that location assuming no losses. This process is repeated for each stream flow gage location shown in Figure 15. Table 2 Shows the Precipitation Area (PxA) or rainfall accumulations for all of the gage stations. A Runoff Factor (RO) is computed for each gage station. This factor is the ratio of the average annual flow at the station to the average annual rainfall accumulation. Figure 13. Average annual rainfall accumulation grid

15
Figure 14. Rainfall accumulation raster in area near the Nanpil River streamflow gaging station Figure 15. Streamflow measuring sites and Rainfall accumulation grid
16
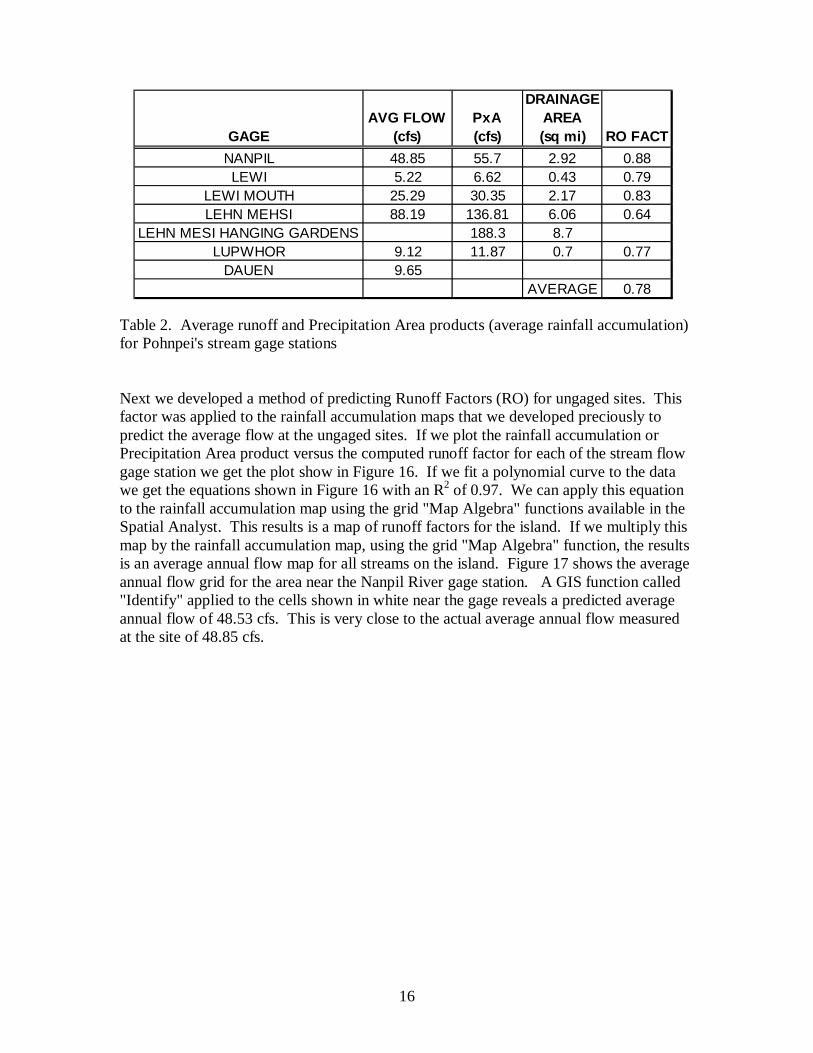
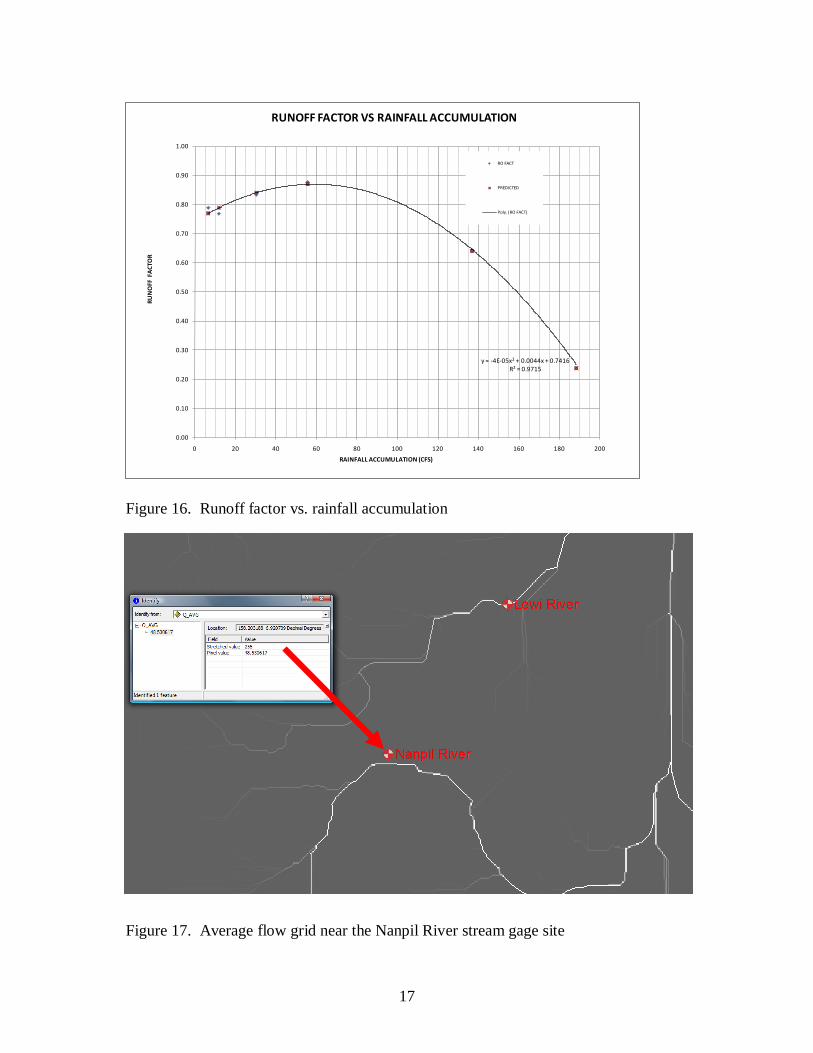
Table 2. Average runoff and Precipitation Area products (average rainfall accumulation) for Pohnpei's stream gage stations Next we developed a method of predicting Runoff Factors (RO) for ungaged sites. This factor was applied to the rainfall accumulation maps that we developed preciously to predict the average flow at the ungaged sites. If we plot the rainfall accumulation or Precipitation Area product versus the computed runoff factor for each of the stream flow gage station we get the plot show in Figure 16. If we fit a polynomial curve to the data we get the equations shown in Figure 16 with an R2 of 0.97. We can apply this equation to the rainfall accumulation map using the grid "Map Algebra" functions available in the Spatial Analyst. This results is a map of runoff factors for the island. If we multiply this map by the rainfall accumulation map, using the grid "Map Algebra" function, the results is an average annual flow map for all streams on the island. Figure 17 shows the average annual flow grid for the area near the Nanpil River gage station. A GIS function called "Identify" applied to the cells shown in white near the gage reveals a predicted average annual flow of 48.53 cfs. This is very close to the actual average annual flow measured at the site of 48.85 cfs.
GAGEAVG FLOW
(cfs)PxA (cfs)
DRAINAGE AREA (sq mi) RO FACT
NANPIL 48.85 55.7 2.92 0.88LEWI 5.22 6.62 0.43 0.79
LEWI MOUTH 25.29 30.35 2.17 0.83LEHN MEHSI 88.19 136.81 6.06 0.64
LEHN MESI HANGING GARDENS 188.3 8.7LUPWHOR 9.12 11.87 0.7 0.77
DAUEN 9.65AVERAGE 0.78
17
Figure 16. Runoff factor vs. rainfall accumulation
Figure 17. Average flow grid near the Nanpil River stream gage site
y = -4E-05x2 + 0.0044x + 0.7416R² = 0.9715
0.00
0.10
0.20
0.30
0.40
0.50
0.60
0.70
0.80
0.90
1.00
0 20 40 60 80 100 120 140 160 180 200
RUN
OFF
FA
CTO
R
RAINFALL ACCUMULATION (CFS)
RUNOFF FACTOR VS RAINFALL ACCUMULATION
RO FACT
PREDICTED
Poly. (RO FACT)
18
PHASE IV
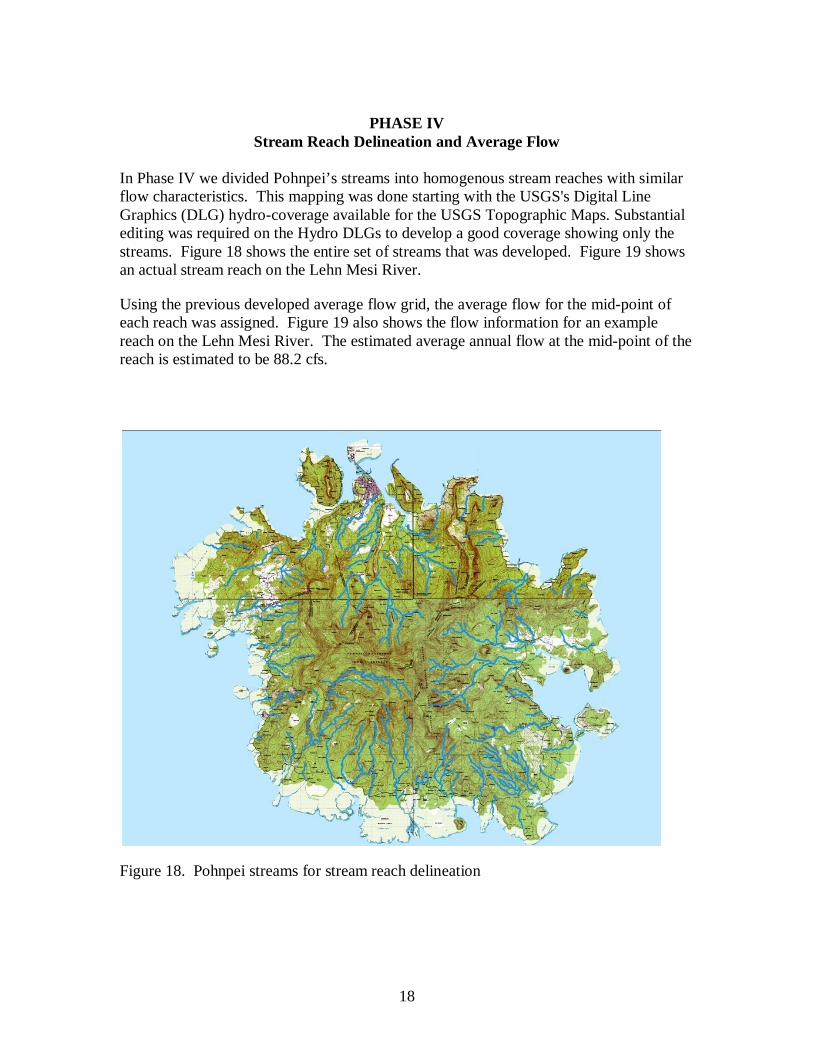
Stream Reach Delineation and Average Flow In Phase IV we divided Pohnpei’s streams into homogenous stream reaches with similar flow characteristics. This mapping was done starting with the USGS's Digital Line Graphics (DLG) hydro-coverage available for the USGS Topographic Maps. Substantial editing was required on the Hydro DLGs to develop a good coverage showing only the streams. Figure 18 shows the entire set of streams that was developed. Figure 19 shows an actual stream reach on the Lehn Mesi River.
Using the previous developed average flow grid, the average flow for the mid-point of each reach was assigned. Figure 19 also shows the flow information for an example reach on the Lehn Mesi River. The estimated average annual flow at the mid-point of the reach is estimated to be 88.2 cfs.
Figure 18. Pohnpei streams for stream reach delineation

19
Figure 19. Individual stream reach on the Lehn Mesi River

20
PHASE V Hydro Power Production and Economic Analysis
In this Phase of the work a means of calculating the power potential and economic feasibility of potential hydropower sites in Pohnpei was developed. A previously developed spreadsheet program (Heitz, 1982) was used as a basis for the new hydro power potential Excel application. The first worksheet of the application is shown in Figure 20. Input to this sheet is the potential site's average annual flow which comes from the previously described GIS maps. The application computes the flow duration values using the parametric duration curves described earlier. The application also plots the flow duration curve for the selected site. The second worksheet of the application, shown in Figure 21, computes the power production and economics of the site based on the flow duration curves computed on the first worksheet and the input site head, turbine sizing information and economic considerations. This application will allow the user to explore various turbine sizing and economic considerations to determine the preliminary feasibility of developing a hydropower facility at a particular site. A copy of the Excell Workbook is furnished to those interested in carrying out their own analysis at other sites in Pohnpei.
Figure 20. Hydrology worksheet of hydropower analysis application
AVERAGE Q = 48.53 CFS
CALCULATED FROM PARAMETIC CURVESPERCENT PARAMETRIC FLOW
Q(95) 95% 7.5Q(80) 80% 16.5Q(50) 50% 33.4Q(30) 30% 50.7Q(10) 10% 105.8Q(0) 0% 927.8535
INTERPOLATED FROM PARAMETRIC CURVESPERCENT INTERP FLOW
Q(100) 100% 5.8Q(90) 90% 9.7Q(80) 80% 16.5Q(70) 70% 20.9Q(60) 60% 26.4Q(50) 50% 33.4Q(40) 40% 41.1Q(30) 30% 50.7Q(20) 20% 73.3Q(10) 10% 105.8Q(0) 0% 927.9
SITE HYDROLOGY COMPUTATIONS
1.0
10.0
100.0
1000.0
0% 20% 40% 60% 80% 100% 120%
FLO
W IN
CFS
EXCEEDANCE PERCENT
SITE FLOW DURATION CURVE

21
Figure 21. Hydropower output, turbine sizing and economic feasibility worksheet of hydropower analysis application
TURBINE SIZING RECONNAISSANCE PACKAGEBY DR. LEROY HEITZ P.E.
TURBINE PARAMETERS OTHER DESIGN PARMETERSMAX FLOW EFFICIENCY
DESIGN MINIMUM EFF (%) RATIO RATIOQ TURBINE 1= 4 3.2 0.83 1. 0 0 COMPUTATIONAL PERIOD = 365 DAYSQ TURBINE 2= 4 3.2 0.83 2. 0.6 0.7 PENSTOCK LENGTH = 8000 FTQ TURBINE 3= 4 3.2 0.83 3. 0.8 0.8 STREAM MINIMUM Q = 1 CFS
4. 0.9 0.95GENERATOR EFFICIENCY= 0.9 5. 1 1
AVAILABLE FLOW AND HEAD POWER PRODUCTIONSTREAM GROSS AVAIL FLOW FLOW FLOW FLOW POWER POWER POWER POWER ENERGY
EXCEED FLOW HEAD FLOW TURBINE 1 TURBINE 2 TURBINE 3 UNUSED TURBINE 1 TURBINE 2 TURBINE 3 TOTAL TOTAL% CFS FT CFS CFS CFS CFS CFS KW KW KW KW MWH
100 2.00 800.00 1.00 0.00 0.00 0.00 1.00 0 0 0 090 3.50 800.00 2.50 0.00 0.00 0.00 2.50 0 0 0 0 0.0080 4.50 800.00 3.50 3.50 0.00 0.00 0.00 142 0 0 142 62.0370 6.00 800.00 5.00 4.00 0.00 0.00 1.00 192 0 0 192 146.2260 8.00 800.00 7.00 4.00 0.00 0.00 3.00 192 0 0 192 168.3750 10.50 800.00 9.50 4.00 4.00 0.00 1.50 192 192 0 384 252.5540 15.00 800.00 14.00 4.00 4.00 4.00 2.00 192 192 192 577 420.9230 22.00 800.00 21.00 4.00 4.00 4.00 9.00 192 192 192 577 505.1120 27.50 800.00 26.50 4.00 4.00 4.00 14.50 192 192 192 577 505.1110 27.50 800.00 26.50 4.00 4.00 4.00 14.50 192 192 192 577 505.110 27.50 800.00 26.50 4.00 4.00 4.00 14.50 192 192 192 577 505.11
SUM E = 3070.54
ECONOMICS COMPUTATIONS
ECONOMIC INPUTS
COST TURBINE 1 = $1,000 $/KW BORROWING PERIOD = 30 YRSCOST TURBINE 2 = $1,000 $/KW INTEREST RATE = 12 %COST TURBINE 3 = $1,000 $/KW CONSTRUCTION PERIOD = 1 YRSPENSTOCK COST = $100 $/FT TAXES = 3.5 % 1st COST
OTHER COSTS = $50,000 $ INSURANCE = 0.15 % 1st COST
ENERGY VALUE = $0.10 $/KWHCAPACITY BENEFIT= $100 $/KW
ECONOMICS RESULTS
FIRST COSTS ANNUAL COSTS ANNUAL BENEFITSTURBINE COST = $606,957 INTEREST AND PRINCIPLE= 191,724 ENERGY BENEFIT = $307,054
PENSTOCK COST = $800,000 TAX COST = 50,994OTHER COST COST = $50,000 INSURANCE COST = 2,185 CAPACITY BENEFIT = $60,696
CONSTRUCTION INTEREST = $87,417 O&M COST = 13,115TOTAL COST = $1,544,375 TOTAL ANNUAL COST = 258,019 TOTAL NET ANNUAL BENEFIT = $367,749
ANNUAL COST = $191,724 NET BENEFITS = $109,731B/C = 1.425

22
RESULTS
This study has provided a means to evaluate the hydroelectric potential at sites and on reaches of streams in Pohnpei, FSM. In order to accomplish this, average flows were developed for stream reaches on all Pohnpei's major streams. A means of computing flow duration curves from these average flows was also developed. A spreadsheet application is provided in which average flows are input along with various hydraulic and economics parameters. A power potential and economic analysis is then performed. This analysis provides preliminary estimates of the feasibility of developing a hydroelectric project at a particular site. The spreadsheet is available as part of the data package for this project (Appendix). The average flow data is made available through a GIS map of the stream reaches on all the major streams on Pohnpei. The data for this map is available for use with the free GIS application Arc Explorer (Appendix). This average flow data is useful for other applications beyond just estimating hydroelectric potential. When coupled with the hydrology worksheet in the spreadsheet application, flow duration curves can be estimated for any stream in Pohnpei. This information could be used for in stream flow requirement studies or other studies investigating man impact on the natural flow patterns in the streams.
SUMMARY AND CONCLUSIONS
The information provided in this report and its accompanying GIS data bases can be most helpful to those interested in establishing new hydroelectric facilities on Pohnpei. Hydroelectric power can provide electric power with minimal environmental impact and can also provide a hedge against rising fuel oil prices. While first costs of hydroelectric facilities are generally higher than fossil fuel plants, the operating costs of the hydro facilities area always significantly lower. Pohnpei is blessed with an abundance of stream flow resources. Hydroelectric power, as a clean renewable resource, should be seriously considered for any new power system expansions in Pohnpei. This study has developed means of predicting average flows and flow duration curves for most of Pohnpei's streams. One key starting point in making these predictions is an accurate normal annual precipitation (NAP) map. A previous study showed that the existing NAP map developed using the prism method agree well with a new array of rain gages that were stationed around the island. While this is good, any new long term precipitation records should be compared with the existing NAP maps so that improvements in these maps can be made. Any improvements in predicting NAP distribution will improve the estimates of average annual flow and flow durations made by this project. The second important starting point is the measured stream flow data. The data that was available was very limited. The longest record, which was for the Nanpil river was only twenty years in length. The USGS gage network has been inactive for almost 18 years.

23
Any new projects that establish long term recording of streamflow data would be most helpful in improving the estimates made by this study. It would be particularly helpful if the old stream gage stations were recommissioned to extend the existing records. Also establishing some completely new sites might improve the geographic distribution of stream gage sites thus leading to improved estimates.
ACHNOWLEGDMENT We would like to thank Mr. Robert Hadley, from Pohnpei Utility Corporations for his support and encouragement. Special thanks to WERI Director, Dr. Denton, and the funding agency the US Geological Survey.

24
LITERATURE CITED
Daly, C.R.P. Nielson, D.L. Phillips. 1994. A Statistical-topographic model for mapping
climatological precipitation over mountainous terrain. J. Appl. Met. 33:140-158.
Gladwell, J.S., L.F. Heitz, C.C. Warnick, C.C. Lomax, P.C. Klingeman, & A.B.
Cunningham, “A Resource Survey of Low-Head Hydroelectric Potential at Existing Dams and Proposed Sites in the Pacific Northwest Region, Phase II”, University of Idaho Water Resources Research Institute, Report No. (197905), 1979.
Heitz, L.F. “Hydrologic Analysis Programs for Programmable Calculators and Digital
Computers for Use in Hydropower Studies”, University of Idaho Water Resources Research Institute, Report No (198207), 1982 127 pages.
Khosrowpanah, S, Mark Lander, and L. Heitz, “Pohnpei-the wettest island on earth? Tools
for managing watershed”, Proceeding of the Institutions for sustainable watershed management, American Water Resources Association, Honolulu, Hawaii, June 27-29, 2005.
Lander, M. and Sh. Khosrowpanah, “Rainfall Climatology for Pohnpei Island, the
Federated States of Micronesia”, University of Guam/WERI, Technical Report No.100, October 2004.

APPENDIX
Related Documents