Predicting Securities Fraud Settlements and Amounts: A Hierarchical Bayesian Model of Federal Securities Class Action LawsuitsBlakeley B. McShane, Oliver P. Watson, Tom Baker, and Sean J. Griffith* This article develops models that predict the incidence and amount of settlements for federal class action securities fraud litigation in the post-PLSRA period. We build hierarchi- cal Bayesian models using data that come principally from Riskmetrics and identify several important predictors of settlement incidence (e.g., the number of different types of securi- ties associated with a case, the company return during the class period) and settlement amount (e.g., market capitalization, measures of newsworthiness). Our models also allow us to estimate how the circuit court a case is filed in as well as the industry of the plaintiff firm associate with settlement outcomes. Finally, they allow us to accurately assess the variance of individual case outcomes revealing substantial amounts of heterogeneity in variance across cases. I. Introduction Understanding and predicting the outcomes of class action lawsuits is a topic of theoretical and practical importance. A particular area of focus is on securities fraud litigation as such suits comprise approximately 35–40 percent of all class actions (Eisenberg & Miller 2010; Fitzpatrick 2010) and approximately 75 percent of all settlement awards (Fitzpatrick 2010). Consequently, scholars have examined a number of factors associated with these settlements. A topic of considerable investigation has been the effects of the U.S. Private Securities Litigation Reform Act of 1995 (PLSRA; Pub. L. No. 104-67, 109 Stat. 737 (1995)). This Act was designed to remedy the widely perceived belief that the “merits” of a case do not matter in class action securities fraud lawsuits (Alexander 1991) and the principal goal of the legislation was to make case outcomes depend more on the evidence of fraud and less on the avoidance of defense costs. To accomplish this, the PLSRA introduced a number of *Address correspondence to Blakeley B. McShane, Assistant Professor, Kellogg School of Management, Northwestern University, 2001 Sheridan Rd., Evanston, IL 60208; email: [email protected]. Watson is Principal and Vice President at Juridigm, Inc.; Baker is William Maul Measey Professor of Law and Health Sciences, University of Pennsylvania Law School; Griffith is T.J. Maloney Chair in Business Law, Fordham University School of Law. We are grateful to Adam Savett for providing the data examined in this article and for several helpful discussions. Journal of Empirical Legal Studies Volume 9, Issue 3, 482–510, September 2012 482

Welcome message from author
This document is posted to help you gain knowledge. Please leave a comment to let me know what you think about it! Share it to your friends and learn new things together.
Transcript
Predicting Securities Fraud Settlementsand Amounts: A Hierarchical BayesianModel of Federal Securities ClassAction Lawsuitsjels_1260 482..510
Blakeley B. McShane, Oliver P. Watson, Tom Baker, and Sean J. Griffith*
This article develops models that predict the incidence and amount of settlements forfederal class action securities fraud litigation in the post-PLSRA period. We build hierarchi-cal Bayesian models using data that come principally from Riskmetrics and identify severalimportant predictors of settlement incidence (e.g., the number of different types of securi-ties associated with a case, the company return during the class period) and settlementamount (e.g., market capitalization, measures of newsworthiness). Our models also allow usto estimate how the circuit court a case is filed in as well as the industry of the plaintifffirm associate with settlement outcomes. Finally, they allow us to accurately assess thevariance of individual case outcomes revealing substantial amounts of heterogeneity invariance across cases.
I. Introduction
Understanding and predicting the outcomes of class action lawsuits is a topic of theoreticaland practical importance. A particular area of focus is on securities fraud litigation assuch suits comprise approximately 35–40 percent of all class actions (Eisenberg & Miller2010; Fitzpatrick 2010) and approximately 75 percent of all settlement awards (Fitzpatrick2010). Consequently, scholars have examined a number of factors associated with thesesettlements.
A topic of considerable investigation has been the effects of the U.S. Private SecuritiesLitigation Reform Act of 1995 (PLSRA; Pub. L. No. 104-67, 109 Stat. 737 (1995)). This Actwas designed to remedy the widely perceived belief that the “merits” of a case do not matterin class action securities fraud lawsuits (Alexander 1991) and the principal goal of thelegislation was to make case outcomes depend more on the evidence of fraud and less onthe avoidance of defense costs. To accomplish this, the PLSRA introduced a number of
*Address correspondence to Blakeley B. McShane, Assistant Professor, Kellogg School of Management, NorthwesternUniversity, 2001 Sheridan Rd., Evanston, IL 60208; email: [email protected]. Watson is Principaland Vice President at Juridigm, Inc.; Baker is William Maul Measey Professor of Law and Health Sciences, Universityof Pennsylvania Law School; Griffith is T.J. Maloney Chair in Business Law, Fordham University School of Law.
We are grateful to Adam Savett for providing the data examined in this article and for several helpful discussions.
bs_bs_banner
Journal of Empirical Legal StudiesVolume 9, Issue 3, 482–510, September 2012
482

changes to the law, including (1) presuming that the investor with the largest financial stakein the suit (in practice, often an institutional investor such as pension fund or mutual fund)would be appointed lead plaintiff and class representative, (2) heightening pleadingrequirements, (3) prohibiting discovery prior to a decision on the defendant’s motion todismiss, (4) requiring particularity and “strong inference” of fraud, and (5) replacing jointand several liability with proportionate liability in general (Cox et al. 2008).
Consistent with the theory underlying the enactment of the PSLRA’s lead plaintiffprovision, prior research has shown that the presence of an institutional investorincreases the dollar amount of settlements (Cox et al. 2006, 2008). Other important post-PSLRA factors include provable losses (Cox et al. 2006) and the presence of an SECenforcement action (Cox et al. 2008). However, the lead plaintiff provision has also ledto controversial “pay-to-play” practices, with researchers finding evidence of “lawyersmaking campaign contributions to public pension funds’ political leadership in order togain favorable consideration by the funds for appointment as class counsel” (Johnson-Skinner 2009).
Returning to the merits of the case, Pritchard and Sale (2005), Johnson et al. (2006),and Baker and Griffith (2007, 2009) have quantitatively and qualitatively demonstrated theimportance of merits variables in the post-PLSRA period. Pritchard and Sale (2005) haveempirically demonstrated the importance of merits variables such as earnings restatements,Generally Accepted Accounting Principles (GAAP) violations, insider trading allegations,and transactions-related variables such as whether the case pertains to an initial publicoffering (IPO) or a merger. Johnson et al. (2006) have argued that not only do the meritsmatter, they actually matter more in the post-PLSRA period. Finally, Baker and Griffith(2007, 2009) focus on how the merits matter, showing, for example, that corporate gover-nance and thus merit variables are important factors in Directors’ & Officers’ liabilityunderwriting and settlement practices.
The above studies demonstrate that settlement amounts are tied to the evidence (i.e.,merits and damages) of cases in the post-PLSRA period. Although this is one path toproviding the correlation between case outcomes and evidence desired by lawmakers, thereare at least two others: a tighter correlation would also obtain (1) if fewer “frivolous”lawsuits were filed or (2) if these frivolous lawsuits were dismissed. Empirically, the numberof class action securities fraud lawsuits filed now exceeds pre-PLSRA levels (Buckberg et al.2005), thus casting doubt on the former. Nonetheless, there have been a greater percent-age of dismissals in class action securities fraud lawsuits in the post-PLSRA period, providingsome evidence for the latter (Foster et al. 2000).
Another source of evidence on filings and motions to dismiss comes from Stephen J.Choi and his colleagues. Notably, Choi et al.’s (2009) results “do not show that Congress’sefforts to discourage frivolous litigation have succeeded.” They also demonstrate the pres-ence of a “screening effect” whereby certain pre-PLSRA nonnuisance claims would be lesslikely to be filed post-PLSRA, an effect that is particularly strong for claims lacking strongevidence of fraud or insider trading. On the other hand, Choi (2003) suggests that “existingliterature on filings and settlements in the post-PSLRA time period provide[s] evidence thatfrivolous suits existed prior to the PSLRA and that a shift occurred in the post-PSLRAperiod toward more meritorious claims,” while Choi (2007) shows that nonnuisance IPO
Predicting Securities Fraud Settlements and Amounts 483
cases lacking strong evidence are less likely to be filed, more likely to be dismissed, andmore likely to be awarded lower settlement values in the post-PLSRA period.
Rather than examining the effects of the PLSRA, the present article confines itself tothe post-PLSRA period and aims to turn a corner in empirical legal scholarship by creatinga predictive model to forecast case outcomes based exclusively on information available atthe time a lawsuit is filed. Using an extensive data set on nearly 1,200 class action securitiesfraud lawsuits (constructed primarily from Riskmetrics’ securities litigation data and aug-mented with publicly available data on securities returns, industry groupings, and newssources), we create predictive models that estimate (1) the probability of settlement versusdismissal of a securities class action and (2) the amount for which the class action will settleconditional on settlement.
Our model improves on those reported by consulting firms (e.g., National EconomicResearch Associates (NERA 1999) and Cornerstone Research (Ryan & Simmons 2009)) intwo major respects. First, by using exclusively variables known at the time of filing, ourmodel can be used for early forecasting. Second, by separately estimating the probability ofdismissal or settlement and the value of settlement conditional on settlement, our modelallows for more accurate and automated identification of high versus low variance lawsuits.
Beyond these contributions, we also (1) use a data set that is more extensive both interms of the number of cases and the number of covariates as compared to prior academicstudies, (2) employ a hierarchical Bayesian model that estimates the cross-effects of thefederal circuit in which the lawsuit is filed and the industry group of the defendant, (3) usethe Google News Archive to create a measure of the notoriety of the defendant (Baker &Griffith 2009) that, as expected, has a positive relationship with settlement amounts, and(4) identify previously unreported weaknesses in the highly regarded Riskmetrics datawidely used in industry and academia (Johnson-Skinner 2009; Fitzpatrick 2010) that, unlessproperly addressed, could potentially bias estimates based on that data.
Among the relationships identified by our model, the most interesting are thefollowing. All the merits variables coded by Riskmetrics have the expected positive sign inboth the settlement/dismissal model and settlement amount model, with two noteworthyexceptions. First, there is a change in the direction of the sign of the Rule 10b-5 variable.Cases coded as Rule 10b-5 class actions are less likely to settle but, if they do settle, theamounts are somewhat higher; this is consistent with the more generous damages availablein Rule 10b-5 cases and suggests that the Rule 10b-5 variable might be better considered adamages variable than a merits variable. Second, there is the opposite change in thedirection of the sign of the GAAP violations variable. Cases coded as alleging GAAPviolations are more likely to settle but, if they do settle, the amounts are no larger. Thislatter result suggests that because a GAAP violation increases the likelihood of surviving amotion to dismiss, plaintiffs’ lawyers are willing to invest in such lawsuits even if thepotential damages award is relatively low.
All the damages variables (some collected by Riskmetrics, others by us) have theexpected positive sign in the settlement amount portion of the model, while many of thosesame variables have a negative sign in the settlement/dismissal portion of the model, thusindicating that lawsuits selected for filing may be biased in the direction of larger potentialdamage awards. Among the damages variables exhibiting this latter shift in sign are the
484 McShane et al.
market capitalization of the defendant, the company return during the class period,1 thenumber of Google News Archive hits, and the presence of an institutional investor as a leadplaintiff (which, because of the lead plaintiff rules, we regard as a proxy for damagespredictors not otherwise captured in our model). All these results are consistent withrational behavior on the part of those selecting lawsuits for filing.
The remainder of our article is organized as follows. In Section II, we discuss in depththe construction and merging of our various data sources. With a final data set in hand, wepresent summary statistics in Section III and our hierarchical Bayesian model in Section IV.In Section V, we present our coefficient estimates, predictions, and model evaluation.Finally, in Section VI, we provide a brief summary and discussion of our results.
II. Data ConstructionA. Introduction
Constructing our database of securities fraud class action lawsuits proved to be a non-trivial endeavor requiring merging data from several different sources. In this section, wediscuss those sources, the variables derived from them, and several interesting difficultiesencountered.
Our principal source of data is the Riskmetrics Group’s Securities Class ActionServices Division, which tracks securities fraud class action lawsuits on a commercial basis.Data from this group have been previously validated in other research (Johnson-Skinner2009; Fitzpatrick 2010) and are considered to be among the most high-quality of the severalextant proprietary sources of class action securities litigation data. The Riskmetrics datasethas two components: a case settlement database giving the case details for each securitiesfraud class action lawsuit and a case securities database giving financial details for thesecurities involved in each case. Since each case is identified by a unique Case ID variable,it is theoretically possible to easily merge the two data sets; in practice, there are severaldifficulties involved in doing so, which we discuss in greater depth below.
In addition to the Riskmetrics data, we use four additional sources. We use data fromYahoo! Finance (2011) and the Center for Research in Security Prices (CRSP; University ofChicago Booth School of Business (2011)) to externally validate the securities return datacontained in the Riskmetrics case securities database (see Section II.C for details). We alsouse the Yahoo! data to obtain the return of the S&P 500 over the class period of eachdefendant company—an important variable for our model (see Section II.D). In addition,we use Kenneth French’s Data Library (French 2011) in order (1) to associate eachdefendant company with an industry group and (2) to obtain industry group returns overthe class period (see Section II.D). Finally, as the literature suggests that case notoriety maybe important for predicting securities fraud settlements (Baker and Griffith 2009), we use
1The class period is defined as the period between the alleged fraud or misstatement (the class period start date) andthe corrective disclosure (the class period end date), with the class consisting of those who transacted in securitiesbetween those dates. Thus, it is the time period during which any monetary loss incurred by the plaintiffs as a resultof the alleged illegal activity of the defendants took place.
Predicting Securities Fraud Settlements and Amounts 485
the Google News Archive (2011) search functionality to construct numerical proxies forhow well-known a company was prior to the case filing (see Section II.E).
We discuss each of these sources in greater depth below.
B. Case Data
The Riskmetrics case settlement database is among the most comprehensive datasets ofsecurities fraud class actions cases gathered to date, containing information on 6,084 suchsettlements from 5,898 unique cases (we note that 136 cases have two or more partialsettlements associated with them). In addition to a unique Case ID that identifies each case,the variables available to us came in two basic flavors: legal features of the case as well aspotential merits variables. As these variables pertain to the cases themselves, they are ofcourse identical across all partial settlements associated with a given case.
The legal features available in the data set are (1) the status of the case (i.e., settled,dismissed, or other), (2) the court (e.g., federal circuit or district), and (3) the name of thelead plaintiff and whether it was an individual or an institution.
Our potential merits variables are seven binary variables indicating whether or not(1) the case was an IPO case, (2) GAAP violations were alleged, (3) the allegation mentionsthat the company’s financial statements were restated, (4) the case was a Rule 10b-5 case,(5) the case was an Securities Act Section 11 case, (6) insider trading was alleged, and (7)the case was transactional (i.e., involving a deal or merger).
Finally, we also have a variable that gives the total settlement if the case settles andthat is zero otherwise.
C. Company Financial Data
The second database provided by Riskmetrics is the case securities database. Whereas thecase settlement database contains one row for each settlement (i.e., 6,084 in total), the casesecurities database contains multiple rows per settlement (i.e., 32,068 in total). The “many-to-one” matching of securities to cases is not completely straightforward and thus we outlineour matching procedure below.
The reason for the much greater number of securities than cases is the fact that manycases have a very large number of derivative securities associated with them in addition tosimple common stock; these securities of various other classes (or types) may render theholder eligible for compensation if the case settles. The problem that faces us in preparingthe data for modeling is to (1) identify the principal securities that pertain to the case and(2) combine these securities into covariates for our statistical model.
The first thing we did was to calculate (1) whether a given case had any securitiesassociated with it in the case securities database and, if so, (2) how many classes of securitieswere associated with it. Of our 6,084 settlements records from 5,898 unique cases, 5,842 ofthe cases have at least one security and 4,530 have one and only one associated security. Thecase with the greatest number of securities of various types attached was the case filed on09/13/2002 against ABN AMRO Holding N.V. (Callable CDs), which has 4,803 securitiestypes associated with it.
To identify the principal securities, we restricted ourselves to securities with data onthe five following variables: (1) the price at the beginning of the class period, (2) the price
486 McShane et al.
at the end of the class period, (3) the number of shares outstanding at the beginning of theclass period, (4) the number of shares outstanding at the end of the class period, and (5)the SIC code of the company. This restriction effectively guarantees that the securitiesunder consideration are equity securities. More importantly, it also guarantees that we haveenough information to calculate each security’s return over the class period.
In restricting ourselves to this subset, we are left with 2,798 cases available formodeling. Of these, only 211 cases have more than one security type with defined values forall the fields above. The case with the largest number of such securities types is the IPOSecurities Litigation Master case filed on 08/09/2001, which is associated with 88 securitytypes.
For each of the cases, we sought a measure of the economic return of holding theassociated equity securities over the class period. Ideally, we would take the buy-and-holdreturn of the common stock over the class period (or, in cases where there are multiplecommon stock securities associated with a case, we would take the average return of thesesecurities over the class period where, in computing the average, each security would beweighted by its market capitalization). However, there was a significant difficulty associatedwith this endeavor: the price and shares outstanding data provided by Riskmetrics appearedto have some inaccuracies.
Consequently, we attempted to validate the Riskmetrics price and shares data againstexternal sources, namely, Yahoo! Finance and CRSP. Unfortunately, Riskmetrics providedonly a ticker for each security (i.e., as opposed to a unique security identifier). Since tickerschange when companies are de-listed and since they are often later reassigned to newstocks, we could only unambiguously obtain matched external data for approximately 70percent of the securities; not surprisingly, smaller companies were disproportionatelyunmatched.
For this subset of securities, the Riskmetrics data were generally equivalent to thoseprovided by our external sources. We therefore viewed this as establishing the accuracy ofthe Riskmetrics data for all companies, apart from some smaller ones. It is plausible thatdata errors are more likely for these small companies, and we therefore used a statisticalscreen to remove data points that seemed erroneous (i.e., companies with class periodreturns that seemed implausibly large; see Section II.F for details).
Before proceeding, we note that we cannot compute the full economic return usingRiskmetrics data; rather, we can only compute the change in market capitalization. The fullreturn and change in market capitalization are, however, very similar with differencesbetween the two normally coming from cash dividends. Thus, the change in marketcapitalization should adequately serve as a proxy for the economic return. We thereforedefine the company return during the class period as the percentage change in marketcapitalization of all securities associated with a given case.
D. Market and Industry Group Benchmark Return Data
For each security satisfying the conditions in Section II.C, we created two benchmarksagainst which we could compare the company return. As the company return was computedover the class period, we also compute our benchmarks over the class period. The firstbenchmark is the market return over the class period. In particular, we take the percentage
Predicting Securities Fraud Settlements and Amounts 487

change in the S&P 500 index (as provided by Yahoo! Finance) over the class period. Thisallows us to assess how the company’s return over the class period compared to the marketas a whole during the same period.
A potentially more relevant benchmark is to compare the return of the firm inquestion over the class period to the returns of similar firms rather than the market as awhole. For this purpose, we turned to Kenneth French’s Data Library (French 2011), whichprovides (1) a daily index for the 12 different industry groups presented in Table 1 as wellas (2) mappings from SIC codes to the 12 industry groups. Using this, we can compute theindustry group return over the class period. When multiple securities were associated witha single case and these securities were associated with different industry groups, we set ourindustry group return variable to the market capitalization-weighted average of the distinctindustry group returns over the class period.
E. Google Data
As company and case notoriety (e.g., newsworthiness) could be associated with settlementincidence and amount, we constructed a numerical proxy for notoriety via the Google NewsArchive. In particular, we counted the number of news stories returned when the companyname was entered as the search term and the results were restricted to the one year priorto the filing date of the case.
As a robustness check, we also looked at the number of news matches in the one yearsubsequent to the filing date when the company name was entered along with “class action”as the search term. This variable was highly correlated with the number of hits for theoriginal search, thus confirming our initial variable. Due to the high correlation, weomitted the second variable from our model because it was unlikely to add explanatorypower. Furthermore, it had substantially larger number of zero hits. Finally, and mostimportantly, since our goal is to produce a model that is predictive of settlement incidenceand outcome at the time of the company filing (i.e., a model that predicts the likelihoodof dismissal and expected settlement amount using only variables whose values can be
Table 1: Industry Group Descriptions
Industry Description
1. BusEq Business Equipment: Computers, Software, and Electronic Equipment2. Chems Chemicals and Allied Products3. Durbl Consumer Durables: Cars, TVs, Furniture, Household Appliances4. Enrgy Oil, Gas, and Coal Extraction and Products5. Hlth Healthcare, Medical Equipment, and Drugs6. Manuf Manufacturing: Machinery, Trucks, Planes, Office Furniture, Paper7. Money Finance8. NoDur Consumer Nondurables: Food, Tobacco, Textiles, Apparel, Leather, Toys9. Other Other: Mines, Construction, Transportation, Hotels, Entertainment
10. Shops Wholesale, Retail, and Some Services (Laundries, Repair Shops)11. Telcm Telephone and Television Transmission12. Utils Utilities
488 McShane et al.

known on the day of the filing), the number of news stories prefiling can be used for thispurpose while any postfiling variable cannot.
F. Other Data Concerns
We have already discussed the major difficulties involved in merging our various datasources; here, we briefly discuss some additional minor difficulties that arose. We do so toindicate the issues that arise when dealing with legal data sets, even those of high qualitysuch as that provided by Riskmetrics.
We have already noted that multiple securities were associated with 211 of our CaseIDs. We note that the vast majority of these cases were the result of a merger (e.g., when acompany with a case filed against it was bought out by another company and that companytook on the liabilities of the initial company). As noted, for these cases, we aggregated themarket capitalization of the underlying companies and used a market capitalization-weighted average for the company and industry group returns over the class period. Whilethis is a reasonable approach, it is not clear that it is optimal and it may lead to overesti-mation of the true market capitalization. However, since our models use the naturallogarithm of the market capitalization, this potential overestimation would likely not sub-stantially alter our conclusions—particularly since so few cases were affected by thisproblem.
As noted, after screening cases that lacked adequate data on the associatedsecurities (i.e., prices, shares outstanding, and SIC code; see Section II.C for details), wewere left with 2,798 cases. From this set, we first removed all cases that did not settle infull in one settlement (i.e., we removed those cases with multiple partial settlements) thusmitigating any potential difficulties and subjective judgments involved in aggregatingacross the multiple partial settlements. There were only 84 such cases and Enron wasthe most prominent, with eight partial settlements listed in the database. Removing thesecases left us with 2,714 unique case records and their corresponding 2,714 uniquesettlements.
Next, we wanted to confine our study to those cases governed by the PLSRA. Conse-quently, we removed the 412 cases that were filed before January 1, 1996 as well as eightadditional cases for which no filing date was available in the Riskmetrics database.
Next, we addressed survivorship bias. Ultimately, we wish to build a model thatpredicts both (1) the likelihood of the case surviving the motion to dismiss and (2) theexpected value of the final settlement. Because of the screening effect of the motion todismiss and the fact that exceedingly few cases are resolved by summary judgment or trial,the duration of cases that settle is generally longer than those that do not. According toqualitative research, this is because cases that survive the motion to dismiss generally settle(Baker & Griffith 2009). Consequently, recent cases in the database suffer from severeselection bias. We thus eliminated the 677 cases that were filed on or after January 1, 2005.We chose this date because it was five years before our data set end date of January 1, 2010and because ª 90 percent of cases are resolved by the five-year mark (Plancich & Starykh2009).
Further, we noticed that the Riskmetrics case securities data implied that several caseshad unusually large increases in market capitalization during the class period (e.g., one case
Predicting Securities Fraud Settlements and Amounts 489
had a 13,898 percent increase), indicating incorrect financial data as discussed in SectionII.C. To correct for these outliers, we assumed a maximum average daily volatility of 3percent. If the underlying return associated with the case was positive and more than threestandard deviations greater than the equivalent 3 percent daily volatility over the totallength of the class period (i.e., if the return was greater than 0.09 √T where T is the lengthof the class period in days), we inferred that the Riskmetrics price and share data wereincorrect and thus excluded the case. This led to the removal of 53 cases.
Finally, we made several other minor reductions to our data set. First, we onlyconsidered the cases that had a case status of “Dismissed” or “Settled,” leading to theremoval of 36 cases; although manual inspection revealed these cases to be still active, it isgenerally safe to assume this given the extreme rarity of trials in class actions. Second, weremoved all 159 cases in the database that were associated with the IPO Securities LitigationMaster case based on the judgment that, because this large set of cases was resolved as aunit, the individual cases would not be sufficiently representative or predictive of other,more typical cases. Third, we removed the 10 SEC cases because they were not securitiesclass actions. Fourth, we removed the 150 cases that were state court rather than federalcourt cases. Fifth, we removed the seven cases that were listed as settled but that had zerolisted as the total settlement amount, and a further seven cases that were listed as settled butthat had NA listed as the total settlement amount. Finally, we removed the five cases thathad a filing date that was prior to the class start date.
Having begun with 5,898 cases, we are left with 1,198 cases for statistical modelingafter having eliminated 3,100 cases for missing financial data (see Section II.C) and afurther 1,600 cases for various other reasons (see the above paragraphs of this section).Before proceeding, we comment on the potential biases that could be induced by thescreens we imposed on the data. For the latter set of screens (i.e., those described inthis section that led to the removal of 1,600 cases), we note that the largest reductionscame from the timing screens; these screens were necessary to ensure all cases weregoverned by the PLSRA and to avoid survivorship bias in the results. None of the othercategories of excluded cases appear to be biased with regard to settlement versusdismissal or the amount of settlement.
Of the 3,100 cases excluded because of missing financial information (see SectionII.C), only 562 cases would otherwise have been included in the final data set (i.e., 2,538 ofthe cases would have been eliminated because they were outside the 1996–2004 period,were state court cases, were associated with the IPO Securities Litigation Master case, orwere subject to the other screens identified in this section). We thoroughly reviewed these562 cases to determine whether there were any systematic differences between them andour set of 1,198 cases, finding only two. First, 44.1 percent of the 562 cases settle ascompared to 65.5 percent of the 1,198 cases in the final data set. Second, the 562 cases aremuch more likely to have an empty plaintiff variable. Both these differences are consistentwith Riskmetrics’ greater incentive to fully code cases that settled than those that did not.On the other hand, the settlement amounts of the 562 cases and the 1,198 cases are verysimilar when examined both marginally and by date; furthermore, the ratio of the numberof cases by year from the two sets of cases is roughly constant whether one examines all casesor just the settled cases.
490 McShane et al.

In sum, our screening process hinted at no major potential biases with the exceptionof the possibility that cases with missing data reflect Riskmetrics’ incentive to more fullycode the more valuable cases.
III. Data
Using the process described above, we prepared our final two databases: (1) the databaseof all 1,198 cases that we use to model the probability that a case settles or is dismissed and(2) the database of the 785 settled cases that we use to predict the total settlement amountconditional on a case being settled. The latter database is thus a proper subset of theformer. In this section, we define each of our variables and present summary statistics.
First, in Figure 1, we present the filing years of our cases, both for the full set of 1,198cases and for the subset of 785 cases that settled. As can be seen, the number of cases in thefull set and reduced set is roughly uniformly distributed over the nine years, with theexception of there being somewhat fewer cases in 1996.
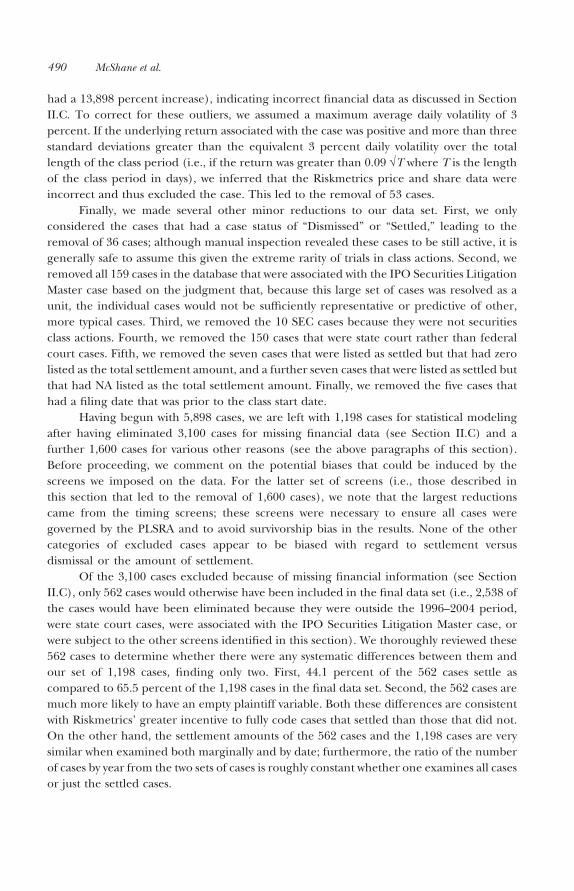
Next, we examine our two response variables. The settlement variable is a binaryvariable that indicates that 785 of the 1,198 cases settled. Our settlement amount variableis the natural logarithm of the total settlement amount that we plot in Figure 2. The meansettlement amount is 15.7 with a standard deviation of 1.5. As can be seen, there appears tobe no substantial trend to either the mean or the variance of the settlement values over timeand the histogram shows a roughly bell-shaped distribution.
Next, we present the federal circuits and industry groups for each of our cases inFigure 3. As can be seen, the Second and Ninth Circuits account for the lion’s share of ourcases with the Third, Fifth, and Eleventh also accounting for a substantial fraction. As forthe industry groups (see Table 1 for full descriptions), it appears business equipment is
Figure 1: Number of cases by year.
Note: There are 1,198 cases in total; 785 of these cases settled.
Predicting Securities Fraud Settlements and Amounts 491
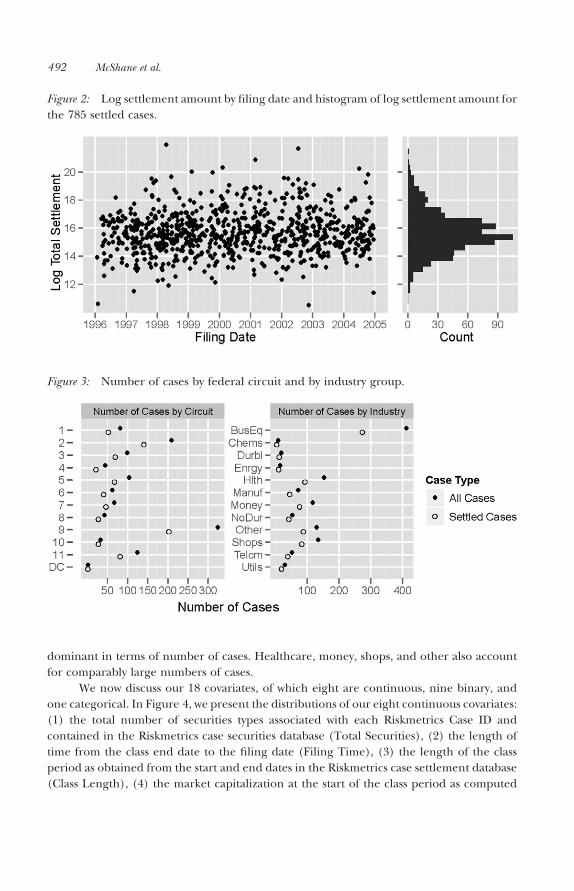
dominant in terms of number of cases. Healthcare, money, shops, and other also accountfor comparably large numbers of cases.
We now discuss our 18 covariates, of which eight are continuous, nine binary, andone categorical. In Figure 4, we present the distributions of our eight continuous covariates:(1) the total number of securities types associated with each Riskmetrics Case ID andcontained in the Riskmetrics case securities database (Total Securities), (2) the length oftime from the class end date to the filing date (Filing Time), (3) the length of the classperiod as obtained from the start and end dates in the Riskmetrics case settlement database(Class Length), (4) the market capitalization at the start of the class period as computed
Figure 2: Log settlement amount by filing date and histogram of log settlement amount forthe 785 settled cases.
Figure 3: Number of cases by federal circuit and by industry group.
492 McShane et al.
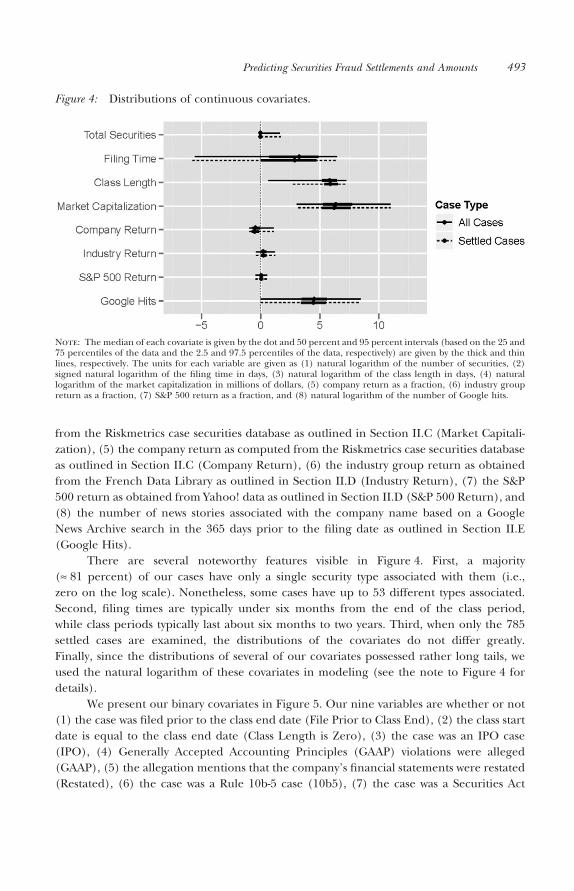
from the Riskmetrics case securities database as outlined in Section II.C (Market Capitali-zation), (5) the company return as computed from the Riskmetrics case securities databaseas outlined in Section II.C (Company Return), (6) the industry group return as obtainedfrom the French Data Library as outlined in Section II.D (Industry Return), (7) the S&P500 return as obtained from Yahoo! data as outlined in Section II.D (S&P 500 Return), and(8) the number of news stories associated with the company name based on a GoogleNews Archive search in the 365 days prior to the filing date as outlined in Section II.E(Google Hits).
There are several noteworthy features visible in Figure 4. First, a majority(ª 81 percent) of our cases have only a single security type associated with them (i.e.,zero on the log scale). Nonetheless, some cases have up to 53 different types associated.Second, filing times are typically under six months from the end of the class period,while class periods typically last about six months to two years. Third, when only the 785settled cases are examined, the distributions of the covariates do not differ greatly.Finally, since the distributions of several of our covariates possessed rather long tails, weused the natural logarithm of these covariates in modeling (see the note to Figure 4 fordetails).
We present our binary covariates in Figure 5. Our nine variables are whether or not(1) the case was filed prior to the class end date (File Prior to Class End), (2) the class startdate is equal to the class end date (Class Length is Zero), (3) the case was an IPO case(IPO), (4) Generally Accepted Accounting Principles (GAAP) violations were alleged(GAAP), (5) the allegation mentions that the company’s financial statements were restated(Restated), (6) the case was a Rule 10b-5 case (10b5), (7) the case was a Securities Act
Figure 4: Distributions of continuous covariates.
Note: The median of each covariate is given by the dot and 50 percent and 95 percent intervals (based on the 25 and75 percentiles of the data and the 2.5 and 97.5 percentiles of the data, respectively) are given by the thick and thinlines, respectively. The units for each variable are given as (1) natural logarithm of the number of securities, (2)signed natural logarithm of the filing time in days, (3) natural logarithm of the class length in days, (4) naturallogarithm of the market capitalization in millions of dollars, (5) company return as a fraction, (6) industry groupreturn as a fraction, (7) S&P 500 return as a fraction, and (8) natural logarithm of the number of Google hits.
Predicting Securities Fraud Settlements and Amounts 493
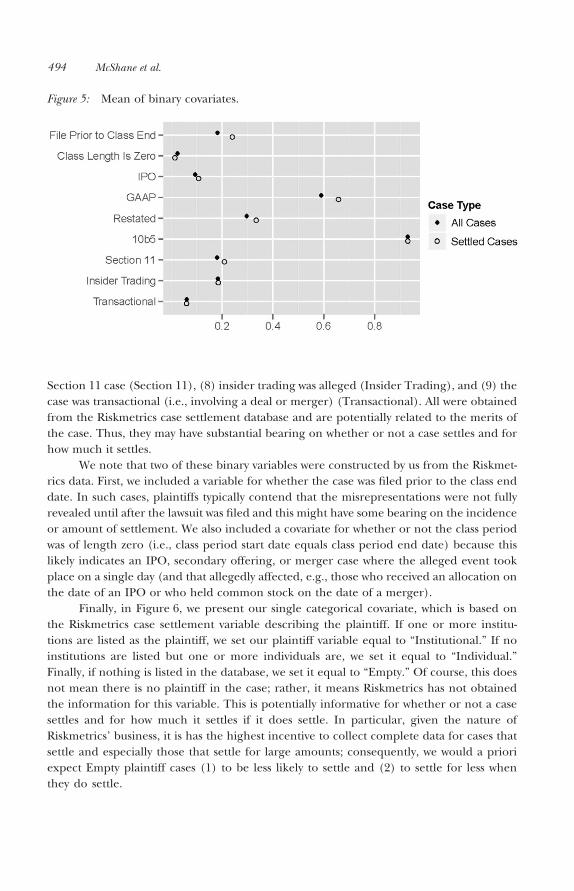
Section 11 case (Section 11), (8) insider trading was alleged (Insider Trading), and (9) thecase was transactional (i.e., involving a deal or merger) (Transactional). All were obtainedfrom the Riskmetrics case settlement database and are potentially related to the merits ofthe case. Thus, they may have substantial bearing on whether or not a case settles and forhow much it settles.
We note that two of these binary variables were constructed by us from the Riskmet-rics data. First, we included a variable for whether the case was filed prior to the class enddate. In such cases, plaintiffs typically contend that the misrepresentations were not fullyrevealed until after the lawsuit was filed and this might have some bearing on the incidenceor amount of settlement. We also included a covariate for whether or not the class periodwas of length zero (i.e., class period start date equals class period end date) because thislikely indicates an IPO, secondary offering, or merger case where the alleged event tookplace on a single day (and that allegedly affected, e.g., those who received an allocation onthe date of an IPO or who held common stock on the date of a merger).
Finally, in Figure 6, we present our single categorical covariate, which is based onthe Riskmetrics case settlement variable describing the plaintiff. If one or more institu-tions are listed as the plaintiff, we set our plaintiff variable equal to “Institutional.” If noinstitutions are listed but one or more individuals are, we set it equal to “Individual.”Finally, if nothing is listed in the database, we set it equal to “Empty.” Of course, this doesnot mean there is no plaintiff in the case; rather, it means Riskmetrics has not obtainedthe information for this variable. This is potentially informative for whether or not a casesettles and for how much it settles if it does settle. In particular, given the nature ofRiskmetrics’ business, it is has the highest incentive to collect complete data for cases thatsettle and especially those that settle for large amounts; consequently, we would a prioriexpect Empty plaintiff cases (1) to be less likely to settle and (2) to settle for less whenthey do settle.
Figure 5: Mean of binary covariates.
494 McShane et al.

IV. ModelA. Introduction
We model securities fraud class action lawsuits using a Bayesian hierarchical model. TheBayesian paradigm provides a principled method for (1) sharing information across casesthat belong to the same “group” (e.g., industry group or federal circuit) and (2) forbalancing this group-level information with the individual-level information provided byour 18 covariates (e.g., market capitalization, company return).
Throughout, we let Zj denote whether the case was settled (Zj = 1) or dismissed(Zj = 0), where j indexes all 1,198 cases, and we let Yj denote the settlement amount for casej where j indexes the 785 cases that settled. We will also let Xj denote the (column) vectorof covariates for case j; continuous covariates are scaled by two standard deviations (Gelman& Hill 2006). We first discuss the model for whether a case is settled or dismissed and thenthe model for settlement amounts conditional on a settlement.
Before proceeding, however, we note that all models are estimated using Markovchain Monte Carlo (MCMC) methods (Metropolis et al. 1953; Hastings 1970; Geman &Geman 1984). We ran 10 chains of 10,000 iterations for each model, discarding the first5,000 as burn-in and thinning every 10 iterations; criteria such as R demonstrated thatconvergence of the iterative simulation was achieved (Gelman et al. 2003).
B. Settlement/Dismissal Model
As settlement incidence is a binary variable (i.e., cases are settled or dismissed), we employa Bernoulli likelihood
Z Bern pj j∼ ( )
logit p Xj j j( ) = +α Tb
Figure 6: Fraction of cases in each level of the categorical plaintiff covariate.
Predicting Securities Fraud Settlements and Amounts 495
where aj is a case-specific intercept term and b is the vector of slopes for ourcovariates.
With only one observation on each case, clearly the terms aj are not identifiedwithout further assumptions. We consequently model them as
α α α α αj c j i j c j i j= + + +[ ] [ ] [ ] [ ],
where c[j] is the circuit in which case j was filed and i[j] is the industry group of the plaintifffirm for case j. That is, we decompose the case-specific intercept into various additive terms:(1) the overall “average” intercept given by α , (2) the overall effect of circuit c[j] given byac[j], (3) the overall effect of industry i[j] given by ai[j], and (4) the interaction of circuit c[j]and industry i[j] given by ac[j],i[j].
In studying securities fraud class action lawsuits, we will be principally interes-ted in how (1) circuits and industries associate with settlement versus dismissal (i.e.,the ac[j], ai[j], and ac[j],i[j]) and (2) covariates associate with settlement versus dismissal(i.e., b ).
Given our likelihood, we must also specify a set of priors for our parameters. Simplyput, we used standard noninformative priors for both our nonhierarchical terms (a , b)and our hierarchical terms (the various subscripted a terms ac, ai, and ac,i). Our priors forthe former are given by
α β∼ ∼N K N Ki0 02 2, ,( ) ( )
where we set K = 100 and each bi is an element of the vector b. We note that our a prioriindependent prior on the bi allows for a posteriori dependence (i.e., it does not imply thateach bi is a posteriori independent).
Our Bayesian approach allows for a principled sharing of information betweenthe parameters for our hierarchical terms. For example, the average effect of circuit c isgiven by ac. We pool each of these ac terms toward a common mean in order to stabi-lize our estimates; circuits with little data will be pulled more strongly toward thiscommon mean whereas circuits with much data will be pulled less strongly. In particular,we let
α τ τc c cN Unif M∼ ∼0 021, ,( ) ( )
for c = 1, . . . , 12 (where 12 represents the DC circuit). In this equation, the tc parametercontrols how much each ac[j] is pulled toward the common mean. When tc is large, there iscorrespondingly little shrinkage toward the common mean, and, when it is small, there iscorrespondingly greater shrinkage. As noted above, of course, the rate of shrinkage is alsodependent on the sample size for each circuit.
496 McShane et al.
We follow an identical procedure for industry groups, setting
α τ τi i iN Unif M∼ ∼0 021, ,( ) ( )
for the i = 1, . . . , 12 industries represented in Table 1. Finally, our prior for the interactionterms ac,i is quite similar
α τ τc i c i c iN Unif M, , ,, , .∼ ∼0 022( ) ( )
As of yet, our priors are not completely specified because we have not given values forM1 and M2. Indeed, we tried three different choices, each of which has different implica-tions about the nature of securities fraud class action litigation. First, we tried M1 = M2 = 0.This has the effect of setting all the subscripted a terms to zero, forcing complete shrinkageto the common intercept α . If circuits or industry groups had zero effect beyond thatcaptured by the covariates Xj, this would be our preferred model.
Our second set of priors fixes M1 = 100 and M2 = 0. Setting M1 = 100 allows the ac andai terms to vary, being pulled to a common mean at the data-determined rate of tc and ti,respectively. Nonetheless, setting M2 = 0 forces the ac,i terms to zero. This means that theeffect of a given industry is the same across all circuits or, alternatively, that the effect of acase being tried in a given circuit is the same for all industries.
This assumption may be false. For example, a telecommunications case specificallymay be more likely to settle (or be dismissed) in the Second Circuit compared to the NinthCircuit beyond whatever differences exist on average between the Second and NinthCircuits. This is indeed an empirical claim and must be determined by the data. Thus, ourthird and final set of priors sets M1 = M2 = 100 and allows all subscripted a terms to vary.
C. Settlement Amount Model
Our model for settlement amounts conditional on a settlement follows a structure almostidentical to that for the settlement amount model. However, since our response Yj is acontinuous variable, we use a Gaussian likelihood. In particular, we let
Y Z N Xj j j j=( ) +( )1 2∼ α σTb, .
Thus, for cases that settle we assume the average settlement amount is given by α j jX+ Tband there is an error component ej that is distributed normally with mean zero andhomogeneous variance s 2. In a slight abuse of notation, we again let aj be the case-specificintercept term and b be the vector of slopes for our covariates. In all presentations ofresults, we will make it clear whether we are referring to the parameters of the settlement/dismissal model or those of the settlement amount model.
Our prior specifications for the settlement amount model are identical to thosefor the settlement/dismissal model and we again set K = 100 and use (1) M1 = M2 = 0,(2) M1 = 100, M2 = 0, and (3) M1 = M2 = 100. We further require a prior for s in thesettlement amount model, which we set to
σ ∼Unif K0, .( )
Predicting Securities Fraud Settlements and Amounts 497
V. ResultsA. Model Selection
Before turning to the results of our settlement/dismissal and settlement amount models,we must select which of the three prior specifications performs “best.” We recall our threespecifications and the modeling assumptions implied by them.
1. Prior Specification 1: M1 = M2 = 0. This model sets all ac = ai = ac,i = 0, thus forcingeach case to have the same intercept α . This would be the “correct” model ifthere were no variation in the outcome variables Yj and Zj due to circuits orindustries beyond that captured by the Xj.
2. Prior Specification 2: M1 = 100, M2 = 0. This model sets all ac,i = 0 but allows the ac
and ai terms to vary, pulling them to a common mean at the data-determinedrates of tc and ti, respectively. Thus, each case has intercept α α α+ +[ ] [ ]c j i j . Thiswould be the “correct” model if there were variation in the outcome variables Yj
and Zj due to circuits or industries beyond that captured by the Xj but that thisvariation decomposes into a fixed additive “circuit” component and a fixed addi-tive “industry” component.
3. Prior Specification 3: M1 = M2 = 100. This model allows the ac, ai, and ac,i terms tovary, pulling them to a common mean at the data-determined rates of tc, ti, andtc,i, respectively. Thus, each case has intercept α α α α+ + +[ ] [ ] [ ] [ ]c j i j c j i j, . This wouldbe the “correct” model if there were variation in the outcome variables Yj and Zj
due to circuits or industries beyond that captured by the Xj and that this variationdoes not decompose into additive terms.
We note that Specification 3 is by far the most realistic. Furthermore, from a model-ing perspective, rather than picking a single “discrete” model or, indeed, averagingover several such models, we prefer to expand the model so that it estimates all param-eters. Specification 3 expands Specifications 1 and 2 by not restricting any a termsto zero; further, because these a parameters are pooled, they are essentially a weigh-ted average of the overall value (i.e., set to zero) and the observed value (i.e., as inclassical regression with interactions) where, as noted, the weights are determined by theparameters t.
Indeed, an analysis of variance (Gelman 2005) for Specification 3 shows that the ac,i
terms contribute to both the settlement/dismissal model and the settlement amount model(see Figure 7). Indeed, in both cases, the standard deviation of the magnitude of thevariation due to the ac,i is estimated to be similar to that due to the ac and ai. Thus, bothsubjective and empirical considerations suggest that we should not fix the ac,i at zero(i.e., we should not fix M2 at zero).
B. Settlement/Dismissal Model Coefficients
We begin the presentation of our results by focusing on the covariate coefficientestimates for the settlement/dismissal model, which we present in the top panel of
498 McShane et al.
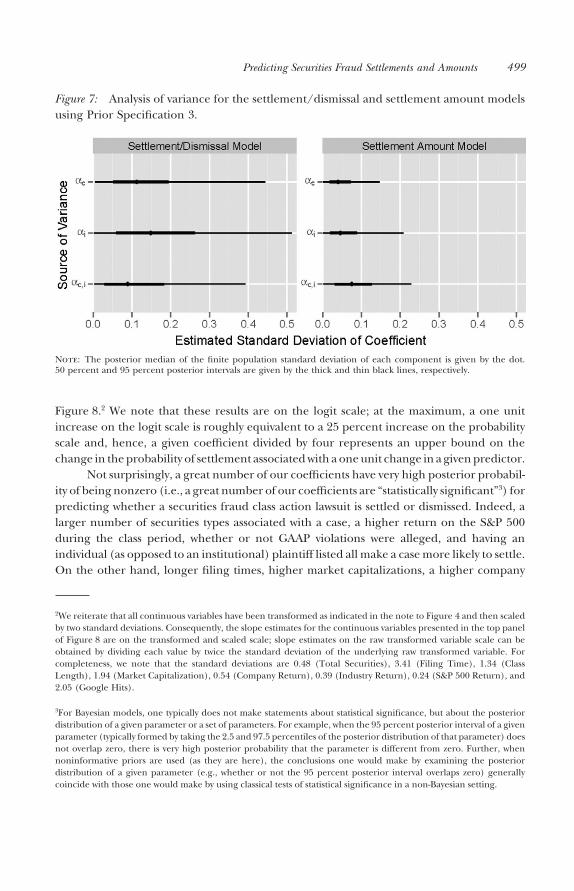
Figure 8.2 We note that these results are on the logit scale; at the maximum, a one unitincrease on the logit scale is roughly equivalent to a 25 percent increase on the probabilityscale and, hence, a given coefficient divided by four represents an upper bound on thechange in the probability of settlement associated with a one unit change in a given predictor.
Not surprisingly, a great number of our coefficients have very high posterior probabil-ity of being nonzero (i.e., a great number of our coefficients are “statistically significant”3) forpredicting whether a securities fraud class action lawsuit is settled or dismissed. Indeed, alarger number of securities types associated with a case, a higher return on the S&P 500during the class period, whether or not GAAP violations were alleged, and having anindividual (as opposed to an institutional) plaintiff listed all make a case more likely to settle.On the other hand, longer filing times, higher market capitalizations, a higher company
2We reiterate that all continuous variables have been transformed as indicated in the note to Figure 4 and then scaledby two standard deviations. Consequently, the slope estimates for the continuous variables presented in the top panelof Figure 8 are on the transformed and scaled scale; slope estimates on the raw transformed variable scale can beobtained by dividing each value by twice the standard deviation of the underlying raw transformed variable. Forcompleteness, we note that the standard deviations are 0.48 (Total Securities), 3.41 (Filing Time), 1.34 (ClassLength), 1.94 (Market Capitalization), 0.54 (Company Return), 0.39 (Industry Return), 0.24 (S&P 500 Return), and2.05 (Google Hits).
3For Bayesian models, one typically does not make statements about statistical significance, but about the posteriordistribution of a given parameter or a set of parameters. For example, when the 95 percent posterior interval of a givenparameter (typically formed by taking the 2.5 and 97.5 percentiles of the posterior distribution of that parameter) doesnot overlap zero, there is very high posterior probability that the parameter is different from zero. Further, whennoninformative priors are used (as they are here), the conclusions one would make by examining the posteriordistribution of a given parameter (e.g., whether or not the 95 percent posterior interval overlaps zero) generallycoincide with those one would make by using classical tests of statistical significance in a non-Bayesian setting.
Figure 7: Analysis of variance for the settlement/dismissal and settlement amount modelsusing Prior Specification 3.
Note: The posterior median of the finite population standard deviation of each component is given by the dot.50 percent and 95 percent posterior intervals are given by the thick and thin black lines, respectively.
Predicting Securities Fraud Settlements and Amounts 499
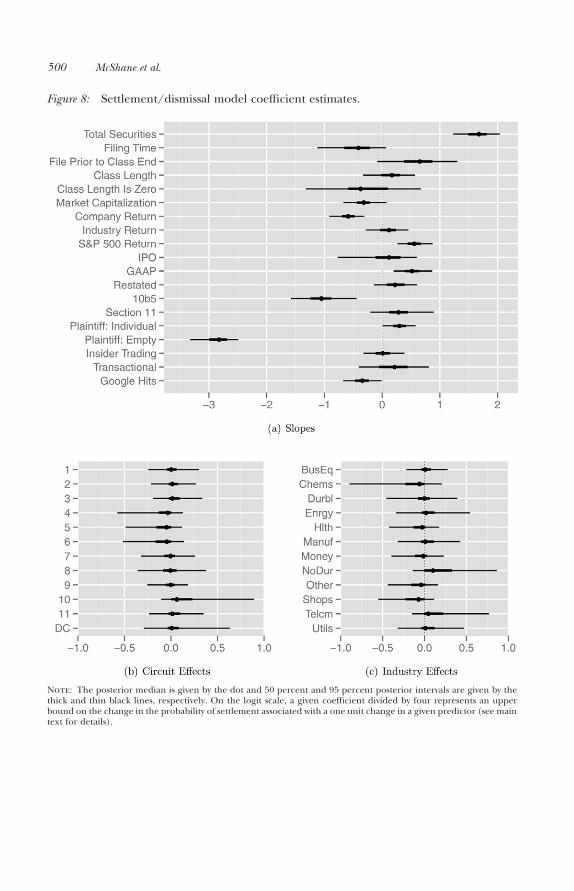
Figure 8: Settlement/dismissal model coefficient estimates.
Note: The posterior median is given by the dot and 50 percent and 95 percent posterior intervals are given by thethick and thin black lines, respectively. On the logit scale, a given coefficient divided by four represents an upperbound on the change in the probability of settlement associated with a one unit change in a given predictor (see maintext for details).
500 McShane et al.
return during the class period, being a Rule 10b-5 case, having no plaintiff listed, and a largernumber of Google hits in the year prior to filing all serve to increase the likelihood of adismissal.
There are many plausible drivers of these phenomena. The merits of the case, forinstance, should drive settlement versus dismissal and we see variables like the allegation ofGAAP violations doing exactly that. On the other hand, the outcome of the motion todismiss should also be impacted by the “plaintiff selection effect”; namely, while plaintiffsare likely to seek out cases that have a high probability of surviving a motion to dismiss, theyare also likely to make rational tradeoffs by, for example, taking on cases with lowerprobability of settlement when such cases are likely to have large settlement amountsconditional on surviving the motion to dismiss. This selection effect is most tied to variableslike market capitalization and the number of Google hits; consistent with the selectioneffect, the results in the top panel of Figure 8 show that these variables are associated withincreased likelihood of dismissal, while the results presented in the next section show thatthey are also associated with larger settlement amounts conditional on surviving the motionto dismiss. The same is true for cases with an institutional plaintiff listed, suggesting thatinstitutional plaintiffs choose to become involved in cases with larger damages potential.
In the bottom panels of Figure 8, we present our respective estimates for the effect ofeach circuit and industry. As can be seen, our hierarchical model engages in principledsharing across the various parameters for each group (i.e., circuit and industry). For instance,circuits like DC, which have relatively few cases, are pulled strongly to the overall mean ofzero. That said, if a circuit has relatively few cases but a strong enough effect in the data, itscoefficient will be moved from the overall mean; for instance, the Fourth and Tenth Circuitshave relatively few cases but, those they do have, are substantially less likely and more likely,respectively, to settle. Nonetheless, the posterior intervals for the circuits with few cases aregenerally much wider than those with a large number. For example, the Second and NinthCircuits, which each account for a large fraction of the cases, have the narrowest intervals ofall. Turning to the industries, it appears that suits brought against nondurables companiesand telecommunications companies may be somewhat more likely to settle, whereas casesbrought against chemicals and shops may be somewhat more likely to be dismissed.
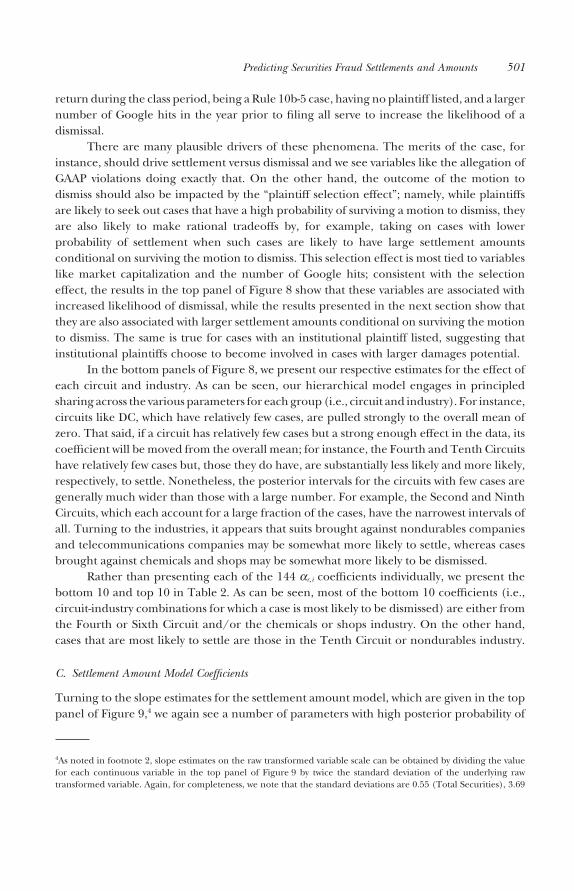
Rather than presenting each of the 144 ac,i coefficients individually, we present thebottom 10 and top 10 in Table 2. As can be seen, most of the bottom 10 coefficients (i.e.,circuit-industry combinations for which a case is most likely to be dismissed) are either fromthe Fourth or Sixth Circuit and/or the chemicals or shops industry. On the other hand,cases that are most likely to settle are those in the Tenth Circuit or nondurables industry.
C. Settlement Amount Model Coefficients
Turning to the slope estimates for the settlement amount model, which are given in the toppanel of Figure 9,4 we again see a number of parameters with high posterior probability of
4As noted in footnote 2, slope estimates on the raw transformed variable scale can be obtained by dividing the valuefor each continuous variable in the top panel of Figure 9 by twice the standard deviation of the underlying rawtransformed variable. Again, for completeness, we note that the standard deviations are 0.55 (Total Securities), 3.69
Predicting Securities Fraud Settlements and Amounts 501
being nonzero. In particular, it appears the total number of security types, the length of theclass period, the market capitalization, the company return during the class period,whether or not earnings were restated, whether or not the case was a Securities Act Section11 case, whether or not insider trading was alleged, and the number of Google hits allpositively impact settlement amounts; on the other hand, longer filing times and having noinstitutional plaintiff listed (i.e., having only an individual plaintiff listed or having noplaintiff listed) are associated with lower settlements. The latter association is consistentwith the institutional plaintiff selection effect noted above (i.e., institutional plaintiffs aremore likely to be involved in cases with higher damages potential).
Many of these results are quite plausible. For instance, firms with higher marketcapitalizations and Google hits are typically larger firms and this serves as a proxy for howmuch damage can be done and how large a settlement can be extracted. Interestingly, somemerits variables such as Restated and Insider Trading, which in theory should only affectwhether a case settles or is dismissed, also impact the settlement amounts, thus suggestingthat decisions over whether or not there were damages versus how great those damageswere may not be entirely independent. Indeed, qualitative interviews suggest that meritsvariables like Restated and Insider Trading are sufficiently “sexy” that they impact bothsettlement amounts as well as the likelihood of surviving the motion to dismiss (Baker &Griffith 2009); notably, the interviews of Baker and Griffith (2009) also suggest that GAAPviolations are not sexy but boring, consistent with our model results that such violationsimpact settlement/dismissal but not settlement amount.
(Filing Time), 1.20 (Class Length), 1.93 (Market Capitalization), 0.56 (Company Return), 0.42 (Industry Return),0.25 (S&P 500 Return), and 2.10 (Google Hits).
Table 2: Settlement/Dismissal Model: Bottom and Top Intercept Coefficients
Bottom Ten Combinations Top Ten Combinations
Circuit Industry
α α α α+ + +( )i c c i,
Circuit Industry
α α α α+ + +( )i c c i,
Mean SD Mean SD
5 Chems 1.49 0.73 10 NoDur 2.08 0.786 Chems 1.49 0.73 10 Telcm 2.05 0.795 Shops 1.49 0.69 2 NoDur 2.00 0.734 Chems 1.50 0.74 3 NoDur 1.98 0.756 Shops 1.51 0.68 DC NoDur 1.97 0.774 Shops 1.53 0.69 10 BusEq 1.97 0.726 Other 1.53 0.69 11 NoDur 1.97 0.754 Other 1.53 0.71 10 Enrgy 1.96 0.739 Chems 1.55 0.72 10 Utils 1.94 0.766 Hlth 1.55 0.67 1 NoDur 1.94 0.73
Population Level α : Mean = 1.73, SD = 0.65
Note: For each circuit-industry combination, we provide the posterior mean and posterior standard deviation for theintercept term α α α α+ + +( )i c c i, . The posterior mean and standard deviation of α is also provided for comparison.
502 McShane et al.

In the bottom panels of Figures 9, we present our circuit and industry effect sizeestimates, respectively. Again, the model engages in principled sharing across circuits andindustries and effect sizes are pooled toward the common mean. Nonetheless, it appearsthat, above and beyond any effects of our covariates Xj, there are no massive variations from
Figure 9: Settlement amount model coefficient estimates.
Note: The posterior median is given by the dot and 50 percent and 95 percent posterior intervals are given by thethick and thin black lines, respectively.
Predicting Securities Fraud Settlements and Amounts 503
circuit to circuit; the Eleventh Circuit appears to have modestly lower settlement amounts,whereas the Ninth and Tenth Circuits have modestly higher settlements amounts. Similarly,utilities firms have somewhat higher settlement amounts.
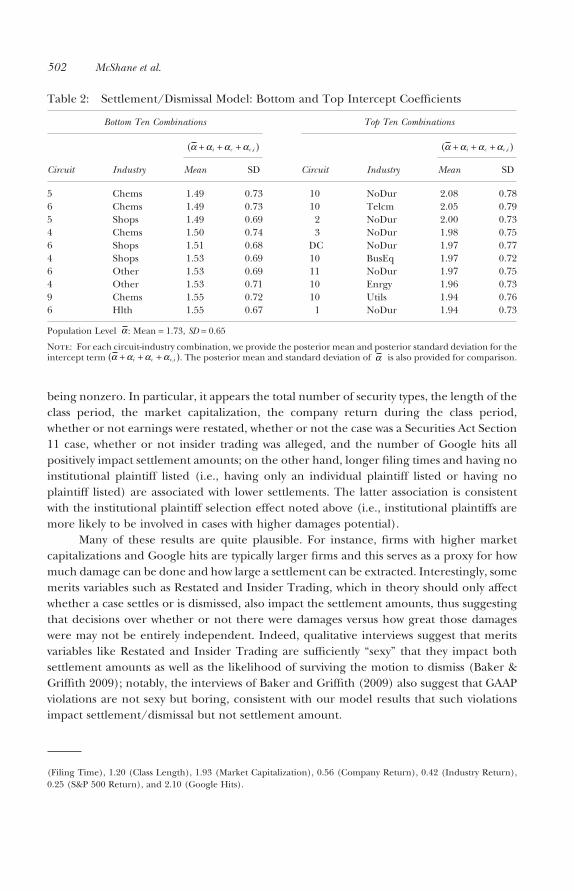
As we did for the settlement/dismissal model, rather than presenting each of the144 ac,i coefficients of the settlement amount model individually, we present the bottom 10and top 10 in Table 3. As can be seen, most of the bottom 10 coefficients (i.e., circuit-industry combinations that have the lowest settlements) come from the Eleventh Circuit.On the other hand, cases that have the highest settlements appear to be utilities firms.
D. Model Evaluation and Application
In Figure 10, we evaluate our two models against the observed data. To assess the models’ability at prediction, we held out a random 25 percent of our observations, thus leaving899 cases as in-sample and 299 as out-of-sample. All 899 observations were used to fitthe settlement/dismissal model, whereas the 592 cases that settled were used to fit thesettlement amount model. Of the 299 out-of-sample cases, 193 settled.
In the left panels of Figure 10, we put each of the 899 in-sample cases (top) and eachof the 299 out-of-sample cases (bottom) into one of 15 equally-sized “bins” based on themodel’s prediction of settlement. For each bin, we calculate the fraction of cases that actuallydid settle along with �2 standard errors. As can be seen, the model predictions appear to bewell-calibrated with little degradation in performance on the out-of-sample cases.
In the right panels of Figure 10, we plot the predicted versus observed settlements foreach of the 592 in-sample cases (top) and each of the 193 out-of-sample cases (bottom) thatsettled. Again, the model generally fits quite well, with most points lying on or near the45-degree line and no violations of linearity. The root mean square error of the model is1.03 in-sample and 1.10 out-of-sample; similarly, the median absolute error is 0.64 in-sample
Table 3: Settlement Amount Model: Bottom and Top Intercept Coefficients
Bottom Ten Combinations Top Ten Combinations
Circuit Industry
α α α α+ + +( )i c c i,
Circuit Industry
α α α α+ + +( )i c c i,
Mean SD Mean SD
6 Money 12.25 0.39 5 Utils 12.46 0.417 Money 12.27 0.39 9 Utils 12.45 0.407 Manuf 12.27 0.39 6 Utils 12.44 0.413 Other 12.27 0.39 8 Utils 12.43 0.416 Enrgy 12.27 0.40 10 Utils 12.43 0.41
11 Other 12.28 0.38 2 Hlth 12.42 0.3911 Manuf 12.28 0.39 9 NoDur 12.42 0.3811 Shops 12.28 0.38 2 Utils 12.42 0.403 Shops 12.28 0.38 4 Utils 12.42 0.40
11 Enrgy 12.29 0.39 1 Utils 12.41 0.41
Population Level α : Mean = 12.35, SD = 0.36
Note: For each circuit-industry combination, we provide the posterior mean and posterior standard deviation for theintercept term α α α α+ + +( )i c c i, . The posterior mean and standard deviation of α is also provided for comparison.
504 McShane et al.
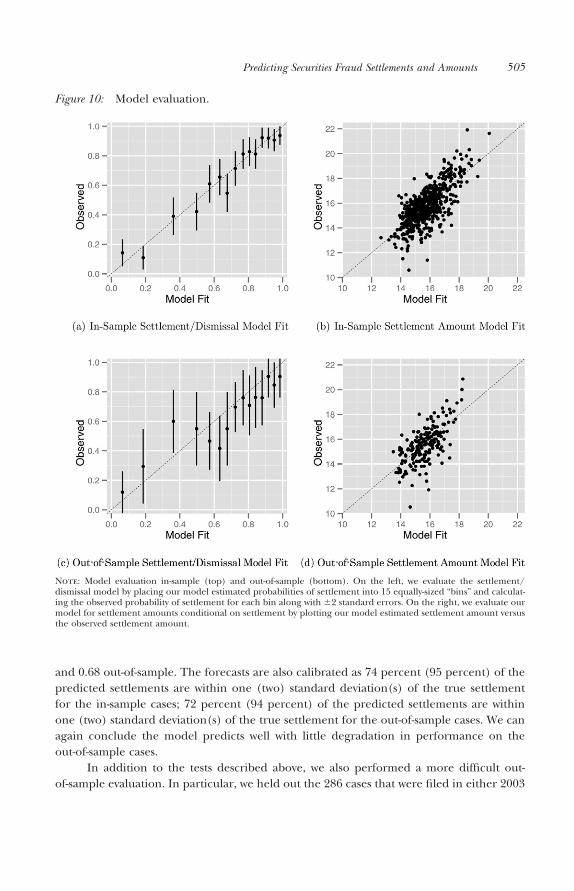
and 0.68 out-of-sample. The forecasts are also calibrated as 74 percent (95 percent) of thepredicted settlements are within one (two) standard deviation(s) of the true settlementfor the in-sample cases; 72 percent (94 percent) of the predicted settlements are withinone (two) standard deviation(s) of the true settlement for the out-of-sample cases. We canagain conclude the model predicts well with little degradation in performance on theout-of-sample cases.
In addition to the tests described above, we also performed a more difficult out-of-sample evaluation. In particular, we held out the 286 cases that were filed in either 2003
Figure 10: Model evaluation.
Note: Model evaluation in-sample (top) and out-of-sample (bottom). On the left, we evaluate the settlement/dismissal model by placing our model estimated probabilities of settlement into 15 equally-sized “bins” and calculat-ing the observed probability of settlement for each bin along with �2 standard errors. On the right, we evaluate ourmodel for settlement amounts conditional on settlement by plotting our model estimated settlement amount versusthe observed settlement amount.
Predicting Securities Fraud Settlements and Amounts 505
or 2004 (i.e., the last two years of our data; these cases account for 24 percent of the data).As above, all 912 of the remaining cases were used to fit the settlement/dismissal model,whereas the 624 cases that settled were used to fit the settlement amount model. Out-of-sample results under this more difficult hold-out schema remained strong. In particular,the diagnostic plots and fit statistics for this hold-out schema differed minimally from thosediscussed above and presented in Figure 10 for the random hold-out schema.
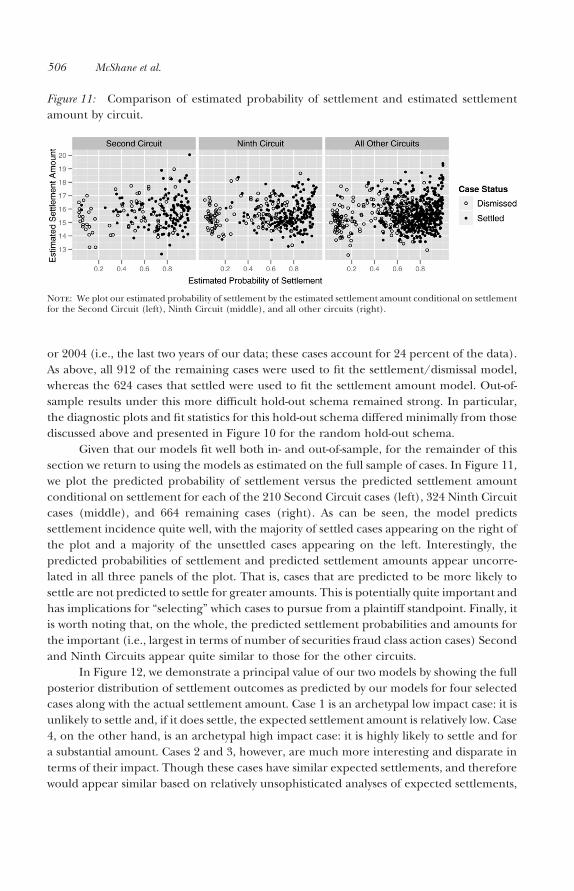
Given that our models fit well both in- and out-of-sample, for the remainder of thissection we return to using the models as estimated on the full sample of cases. In Figure 11,we plot the predicted probability of settlement versus the predicted settlement amountconditional on settlement for each of the 210 Second Circuit cases (left), 324 Ninth Circuitcases (middle), and 664 remaining cases (right). As can be seen, the model predictssettlement incidence quite well, with the majority of settled cases appearing on the right ofthe plot and a majority of the unsettled cases appearing on the left. Interestingly, thepredicted probabilities of settlement and predicted settlement amounts appear uncorre-lated in all three panels of the plot. That is, cases that are predicted to be more likely tosettle are not predicted to settle for greater amounts. This is potentially quite important andhas implications for “selecting” which cases to pursue from a plaintiff standpoint. Finally, itis worth noting that, on the whole, the predicted settlement probabilities and amounts forthe important (i.e., largest in terms of number of securities fraud class action cases) Secondand Ninth Circuits appear quite similar to those for the other circuits.
In Figure 12, we demonstrate a principal value of our two models by showing the fullposterior distribution of settlement outcomes as predicted by our models for four selectedcases along with the actual settlement amount. Case 1 is an archetypal low impact case: it isunlikely to settle and, if it does settle, the expected settlement amount is relatively low. Case4, on the other hand, is an archetypal high impact case: it is highly likely to settle and fora substantial amount. Cases 2 and 3, however, are much more interesting and disparate interms of their impact. Though these cases have similar expected settlements, and thereforewould appear similar based on relatively unsophisticated analyses of expected settlements,
Figure 11: Comparison of estimated probability of settlement and estimated settlementamount by circuit.
Note: We plot our estimated probability of settlement by the estimated settlement amount conditional on settlementfor the Second Circuit (left), Ninth Circuit (middle), and all other circuits (right).
506 McShane et al.
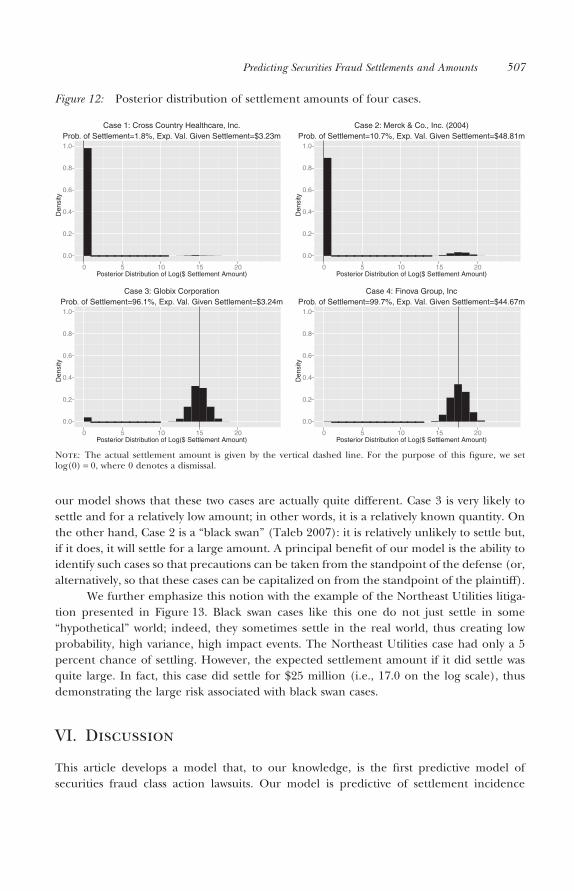
our model shows that these two cases are actually quite different. Case 3 is very likely tosettle and for a relatively low amount; in other words, it is a relatively known quantity. Onthe other hand, Case 2 is a “black swan” (Taleb 2007): it is relatively unlikely to settle but,if it does, it will settle for a large amount. A principal benefit of our model is the ability toidentify such cases so that precautions can be taken from the standpoint of the defense (or,alternatively, so that these cases can be capitalized on from the standpoint of the plaintiff).
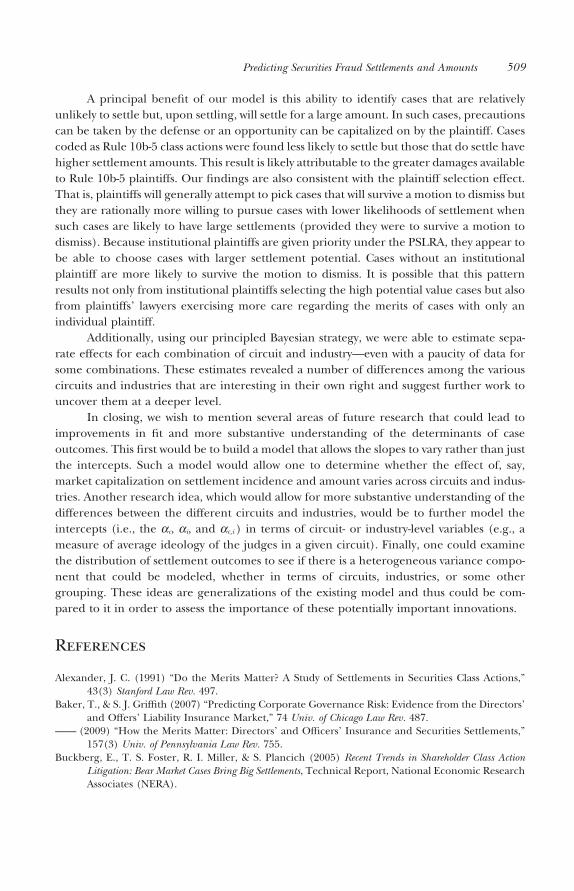
We further emphasize this notion with the example of the Northeast Utilities litiga-tion presented in Figure 13. Black swan cases like this one do not just settle in some“hypothetical” world; indeed, they sometimes settle in the real world, thus creating lowprobability, high variance, high impact events. The Northeast Utilities case had only a 5percent chance of settling. However, the expected settlement amount if it did settle wasquite large. In fact, this case did settle for $25 million (i.e., 17.0 on the log scale), thusdemonstrating the large risk associated with black swan cases.
VI. Discussion
This article develops a model that, to our knowledge, is the first predictive model ofsecurities fraud class action lawsuits. Our model is predictive of settlement incidence
Figure 12: Posterior distribution of settlement amounts of four cases.
Case 1: Cross Country Healthcare, Inc.Prob. of Settlement=1.8%, Exp. Val. Given Settlement=$3.23m
Posterior Distribution of Log($ Settlement Amount)
Den
sity
0.0
0.2
0.4
0.6
0.8
1.0
0 5 10 15 20
Case 2: Merck & Co., Inc. (2004)Prob. of Settlement=10.7%, Exp. Val. Given Settlement=$48.81m
Posterior Distribution of Log($ Settlement Amount)
Den
sity
0.0
0.2
0.4
0.6
0.8
1.0
0 5 10 15 20
Case 3: Globix CorporationProb. of Settlement=96.1%, Exp. Val. Given Settlement=$3.24m
Posterior Distribution of Log($ Settlement Amount)
Den
sity
0.0
0.2
0.4
0.6
0.8
1.0
0 5 10 15 20
Case 4: Finova Group, IncProb. of Settlement=99.7%, Exp. Val. Given Settlement=$44.67m
Posterior Distribution of Log($ Settlement Amount)
Den
sity
0.0
0.2
0.4
0.6
0.8
1.0
0 5 10 15 20
Note: The actual settlement amount is given by the vertical dashed line. For the purpose of this figure, we setlog(0) = 0, where 0 denotes a dismissal.
Predicting Securities Fraud Settlements and Amounts 507

(i.e., likelihood of dismissal) and outcome (i.e., expected settlement amount) at the timea case is filed. As such, it only uses variables whose values can be calculated on the day of thefiling, distinguishing it from other models such as those estimated by Cornerstone Researchand NERA that use variables that are known only after the filing date. Overall, both of ourmodels provided accurate fits to the data.
We found that many of our variables are predictive of whether a securities fraud classaction is settled or dismissed. Factors that indicate a case will most likely settle include agreater number of classes or types of securities associated with the case, a higher return onthe S&P 500 during the class period, whether or not GAAP violations were alleged, andhaving an individual plaintiff listed. Factors that indicate a case is less likely to settle includelonger filing times, higher market capitalization, a higher company return during the classperiod, having an institutional plaintiff listed, and greater public notoriety (as measured bythe number of Google hits in the year prior to filing).
Our analysis also revealed a number of variables that are predictive of the settlementamount. Factors found to positively impact the settlement amount include the total numberof securities, the length of the class period, the market capitalization of the company, thecompany return during the class period, whether or not earnings were restated, whether ornot the case was a Securities Act Section 11 case, whether or not insider trading was alleged,the existence of an institutional plaintiff, and the number of Google hits. Factors associatedwith lower settlement amounts include longer filing times and not having an institutionalinvestor listed (i.e., having only an individual plaintiff listed or having no plaintiff listed).
Interestingly, we found that those cases predicted to be more likely to settle were notpredicted to settle for greater amounts. Cases coded as alleging GAAP violations are morelikely to settle but those that do settle do not have higher settlement amounts. This resultis likely due to the fact that an allegation of a GAAP violation significantly bolsters themerits of the case. This in turn increases the plaintiff’s chances of surviving a motion todismiss, making it more appealing for the plaintiff to take on such a lawsuit even if thepotential damage award is relatively low.
Figure 13: Posterior distribution of settlement amounts for the Northeast Utilities case.
Case 5: Northeast Utilities (1997)Prob. of Settlement=4.9%, Exp. Val. Given Settlement=$15.24m
Posterior Distribution of Log($ Settlement Amount)
Den
sity
0.0
0.2
0.4
0.6
0.8
1.0
0 5 10 15 20
Note: The actual settlement amount is given by the vertical dashed line. For the purpose of this figure, we setlog(0) = 0, where 0 denotes a dismissal.
508 McShane et al.
A principal benefit of our model is this ability to identify cases that are relativelyunlikely to settle but, upon settling, will settle for a large amount. In such cases, precautionscan be taken by the defense or an opportunity can be capitalized on by the plaintiff. Casescoded as Rule 10b-5 class actions were found less likely to settle but those that do settle havehigher settlement amounts. This result is likely attributable to the greater damages availableto Rule 10b-5 plaintiffs. Our findings are also consistent with the plaintiff selection effect.That is, plaintiffs will generally attempt to pick cases that will survive a motion to dismiss butthey are rationally more willing to pursue cases with lower likelihoods of settlement whensuch cases are likely to have large settlements (provided they were to survive a motion todismiss). Because institutional plaintiffs are given priority under the PSLRA, they appear tobe able to choose cases with larger settlement potential. Cases without an institutionalplaintiff are more likely to survive the motion to dismiss. It is possible that this patternresults not only from institutional plaintiffs selecting the high potential value cases but alsofrom plaintiffs’ lawyers exercising more care regarding the merits of cases with only anindividual plaintiff.
Additionally, using our principled Bayesian strategy, we were able to estimate sepa-rate effects for each combination of circuit and industry—even with a paucity of data forsome combinations. These estimates revealed a number of differences among the variouscircuits and industries that are interesting in their own right and suggest further work touncover them at a deeper level.
In closing, we wish to mention several areas of future research that could lead toimprovements in fit and more substantive understanding of the determinants of caseoutcomes. This first would be to build a model that allows the slopes to vary rather than justthe intercepts. Such a model would allow one to determine whether the effect of, say,market capitalization on settlement incidence and amount varies across circuits and indus-tries. Another research idea, which would allow for more substantive understanding of thedifferences between the different circuits and industries, would be to further model theintercepts (i.e., the ac, ai, and ac,i ) in terms of circuit- or industry-level variables (e.g., ameasure of average ideology of the judges in a given circuit). Finally, one could examinethe distribution of settlement outcomes to see if there is a heterogeneous variance compo-nent that could be modeled, whether in terms of circuits, industries, or some othergrouping. These ideas are generalizations of the existing model and thus could be com-pared to it in order to assess the importance of these potentially important innovations.
References
Alexander, J. C. (1991) “Do the Merits Matter? A Study of Settlements in Securities Class Actions,”43(3) Stanford Law Rev. 497.
Baker, T., & S. J. Griffith (2007) “Predicting Corporate Governance Risk: Evidence from the Directors’and Offers’ Liability Insurance Market,” 74 Univ. of Chicago Law Rev. 487.
—— (2009) “How the Merits Matter: Directors’ and Officers’ Insurance and Securities Settlements,”157(3) Univ. of Pennsylvania Law Rev. 755.
Buckberg, E., T. S. Foster, R. I. Miller, & S. Plancich (2005) Recent Trends in Shareholder Class ActionLitigation: Bear Market Cases Bring Big Settlements, Technical Report, National Economic ResearchAssociates (NERA).
Predicting Securities Fraud Settlements and Amounts 509
Choi, S. J. (2003) “The Evidence on Securities Class Actions,” 56(6) Vanderbilt Law Rev. 1465.—— (2007) “Do the Merits Matter Less After the Private Securities Litigation Reform Act?” 23(3) J. of
Law, Economics, & Organization 598.Choi, S. J., K. K. Nelson, & A. C. Pritchard (2009) “The Screening Effect of the Private Securities
Litigation Reform Act,” 6(1) J. of Empirical Legal Studies 35.Cox, J. D., R. S. Thomas, & L. Bai (2008) “There Are Plaintiffs and . . . There Are Plaintiffs: An
Empirical Analysis of Securities Class Action Settlements,” 61(2) Vanderbilt Law Rev. 355.Cox, J. D., R. S. Thomas, & D. Kiku (2006) “Does the Plaintiff Matter? An Empirical Analysis of Lead
Plaintiffs in Securities Class Actions,” 106 Columbia Law Rev. 1587.Eisenberg, T., & G. P. Miller (2010) “Attorney Fees and Expenses in Class Action Settlements: 1993–
2008,” 7(2) J. of Empirical Legal Studies 248.Fitzpatrick, B. T. (2010) “An Empirical Study of Class Action Settlements and Their Fee Awards,” 7(4)
J. of Empirical Legal Studies 811.Foster, T. S., D. N. Martin, V. M. Juneja, & F. C. Dunbar (2000) Trends in Securities Litigation and the
Impact of the PSLRA, Techical Report, National Economic Research Associates (NERA).French, K. (2011) Kenneth French Data Library. Available at <http://mba.tuck.dartmouth.edu/pages/
faculty/ken.french/data_library.html>.Gelman, A. (2005) “Analysis of Variance—Why it is More Important than Ever,” 33(1) Annals of
Statistics 1.Gelman, A., J. Carlin, H. Stern, & D. Rubin (2003) Bayesian Data Analysis, 2d ed. Boca Raton, FL:
Chapman and Hall/CRC.Gelman, A., & J. Hill (2006) Data Analysis Using Regression and Multilevel/Hierarchical Models. New York:
Cambridge University Press.Geman, S., & D. Geman (1984) “Stochastic Relaxation, Gibbs Distributions, and the Bayesian Resto-
ration of Images,” 6 IEEE Transaction on Pattern Analysis & Machine Intelligence 721.Google News Archive (2011) Google, Inc. Available at <http://news.google.co.uk/archivesearch>.Hastings, W. (1970) “Monte Carlo Sampling Methods Using Markov Chains and Their Applications,”
57 Biometrika 97.Johnson, M. F., K. K. Nelson, & A. C. Pritchard (2006) “Do the Merits Matter More? The Impact of the
Private Securities Litigation Reform Act,” 23(3) J. of Law, Economics, & Organization 627.Johnson-Skinner, D. T. (2009) “Paying-to-Play in Securities Class Actions: A Look at Lawyers’ Campaign
Contributions,” 84(6) New York Univ. Law Rev 1725.Metropolis, N., A. Rosenbluth, M. Rosenbluth, A. Teller, & E. Teller (1953) “Equation of State
Calculations by Fast Computing Machines,” 21 J. of Chemical Physics 1087.NERA (1999) What Do NERA Experts Do for Clients in Securities Fraud Litigation? Technical Report,
National Economic Research Associates (NERA).Plancich, S., & S. Starykh (2009) Recent Trends in Securities Class Action Litigation: 2009 Year-End Update,
Technical Report, NERA Economic Consulting.Pritchard, A. C., & H. A. Sale (2005) “What Counts as Fraud? An Empirical Study of Motions to Dismiss
Under the Private Securities Litigation Reform Act,” 2(1) J. of Empirical Legal Studies 125.Ryan, E. M., & L. E. Simmons (2009) Securities Class Action Settlements: 2009 Review and Analysis,
Technical Report, Cornerstone Research.Taleb, N. N. (2007) The Black Swan: The Impact of the Highly Improbable. New York: Random House.University of Chicago Booth School of Business (2011) Center for Research in Security Prices. Available at
<http://www.crsp.com/index.html>.Yahoo! Finance (2011) Yahoo, Inc. Available at <http://finance.yahoo.com>.
510 McShane et al.
Related Documents