Predicting dissolved organic nitrogen export from a drained loblolly pine plantation Shiying Tian, 1 Mohamed A. Youssef, 1 R. Wayne Skaggs, 1 G. M. Chescheir, 1 and Devendra M. Amatya 2 Received 28 May 2012 ; revised 16 January 2013 ; accepted 20 February 2013 ; published 23 April 2013. [1] Dissolved organic nitrogen (DON) export from terrestrial ecosystems influences the ecology of receiving surface waters. The soil carbon (C) and nitrogen (N) model, DRAINMOD-N II, was modified to simulate key processes associated with DON transformations and transport in the soil profile. DON production is modeled by tracking dynamic C :N ratios of dissolved organic matter originating from various organic matter pools. The Langmuir isotherm was used to quantify the assumed instantaneous equilibrium between potentially soluble organic N in solid and aqueous phases. DON transport with soil water was simulated using a numerical solution to the advection-dispersion reaction equation. The modified model was used for simulating temporal variations of DON export from three loblolly pine (Pinus taeda L.) plantations located in eastern North Carolina. Results showed that the model can accurately predict DON export dynamics during storm events with Nash-Sutcliffe efficiency (E) of 0.5, seasonal DON losses with E above 0.6, and annual DON losses with E above 0.7. In addition to the well-recognized role of hydrological processes, reasonable quantifications of the seasonal changes in the potentially soluble soil organic matter, the DON sorption to soil particles, and the dynamic C :N ratios of dissolved organic matter were found to be essential for mechanistic representation of DON export dynamics. Specifically, adapting the dynamic C :N ratios enabled the model to reasonably describe the temporal variations of correlations between DON and dissolved organic carbon in drainage water. Citation : Tian, S., M. A. Youssef, R. Wayne Skaggs, G. M. Chescheir, and D. M. Amatya (2013), Predicting dissolved organic nitrogen export from a drained loblolly pine plantation, Water Resour. Res., 49, 1952–1967, doi:10.1002/wrcr.20157. 1. Introduction [2] Dissolved organic nitrogen (DON) represents a large portion of nitrogen (N) leaching from terrestrial ecosystems to groundwater or surface water, and sometimes even exceeds mineral N losses [Jones et al., 2008; Tian et al., 2012a; van Kessel et al., 2009]. Large DON leaching losses have been observed in forest ecosystems [Campbell et al., 2000; Currie and Aber, 1997; Jones et al., 2008; Michal- zik et al., 2001; Qualls and Haines, 1991], agricultural fields [Christou et al., 2005; Murphy et al., 2000; van Kessel et al., 2009], and grasslands [Jones et al., 2004]. Long-term and continuous DON losses could affect the sta- tus of nutrients in terrestrial ecosystems by constraining soil N accumulation and storage [Chen and Xu, 2006; Qualls, 2000]. In addition, DON has significant ecological impacts on receiving waters [McDowell, 2003] because it is a dynamic participant in microbiologically regulated N cy- cling in aquatic ecosystems [Berman and Bronk, 2003; Seitzinger and Sanders, 1997]. However, most process- based models that simulate N leaching losses do not take into account DON losses from terrestrial ecosystems [Kor- saeth et al., 2003 ; van Kessel et al., 2009]. [3] DON and dissolved organic carbon (DOC) are com- bined components of dissolved organic matter (DOM) ; thus, they are highly likely to originate from the same sour- ces [Perakis and Hedin, 2002] and be subjected to similar controlling environmental factors [Neff et al., 2003]. Previ- ous laboratory and field studies have suggested that surface stored litter, soil humus, and root exudates are major sour- ces of DOM [Kalbitz and Kaiser, 2008; Kalbitz et al., 2000]. Large portions of produced DOM are retained in the top soil profile through microbial decomposition and physi- cal adsorption to soil particles (primarily clay minerals), with the latter being recognized as the dominant mecha- nism [Guggenberger and Kaiser, 2003 ; Kalbitz and Kaiser, 2008; Kalbitz et al., 2000]. Studies have shown that DOM production, fate, and transport processes are significantly influenced by both biotic factors such as microbial commu- nity composition and activities, and abiotic factors such as temperature, soil water, and pH status [Kalbitz et al., 2000]. 1 Department of Biological and Agricultural Engineering, NCSU. D. S. Weaver Labs, Raleigh, North Carolina, USA. 2 USDA Forest Service, Center for Forested Wetland Research, Cordes- ville, South Carolina, USA. Corresponding author: S. Tian, Department of Biological and Agricul- tural Engineering, NCSU. D. S. Weaver Labs, Campus Box7625, Raleigh, NC 27695, USA. ([email protected]) ©2013. American Geophysical Union. All Rights Reserved. 0043-1397/13/10.1002/wrcr.20157 1952 WATER RESOURCES RESEARCH, VOL. 49, 1952–1967, doi :10.1002/wrcr.20157, 2013

Welcome message from author
This document is posted to help you gain knowledge. Please leave a comment to let me know what you think about it! Share it to your friends and learn new things together.
Transcript
Predicting dissolved organic nitrogen export from a drained loblollypine plantation
Shiying Tian,1 Mohamed A. Youssef,1 R. Wayne Skaggs,1 G. M. Chescheir,1 andDevendra M. Amatya2
Received 28 May 2012; revised 16 January 2013; accepted 20 February 2013; published 23 April 2013.
[1] Dissolved organic nitrogen (DON) export from terrestrial ecosystems influences theecology of receiving surface waters. The soil carbon (C) and nitrogen (N) model,DRAINMOD-N II, was modified to simulate key processes associated with DONtransformations and transport in the soil profile. DON production is modeled by trackingdynamic C:N ratios of dissolved organic matter originating from various organic matterpools. The Langmuir isotherm was used to quantify the assumed instantaneous equilibriumbetween potentially soluble organic N in solid and aqueous phases. DON transport with soilwater was simulated using a numerical solution to the advection-dispersion reactionequation. The modified model was used for simulating temporal variations of DON exportfrom three loblolly pine (Pinus taeda L.) plantations located in eastern North Carolina.Results showed that the model can accurately predict DON export dynamics during stormevents with Nash-Sutcliffe efficiency (E) of 0.5, seasonal DON losses with E above 0.6, andannual DON losses with E above 0.7. In addition to the well-recognized role of hydrologicalprocesses, reasonable quantifications of the seasonal changes in the potentially soluble soilorganic matter, the DON sorption to soil particles, and the dynamic C:N ratios of dissolvedorganic matter were found to be essential for mechanistic representation of DON exportdynamics. Specifically, adapting the dynamic C:N ratios enabled the model to reasonablydescribe the temporal variations of correlations between DON and dissolved organic carbonin drainage water.
Citation: Tian, S., M. A. Youssef, R. Wayne Skaggs, G. M. Chescheir, and D. M. Amatya (2013), Predicting dissolved organicnitrogen export from a drained loblolly pine plantation, Water Resour. Res., 49, 1952–1967, doi:10.1002/wrcr.20157.
1. Introduction
[2] Dissolved organic nitrogen (DON) represents a largeportion of nitrogen (N) leaching from terrestrial ecosystemsto groundwater or surface water, and sometimes evenexceeds mineral N losses [Jones et al., 2008; Tian et al.,2012a; van Kessel et al., 2009]. Large DON leaching losseshave been observed in forest ecosystems [Campbell et al.,2000; Currie and Aber, 1997; Jones et al., 2008; Michal-zik et al., 2001; Qualls and Haines, 1991], agriculturalfields [Christou et al., 2005; Murphy et al., 2000; vanKessel et al., 2009], and grasslands [Jones et al., 2004].Long-term and continuous DON losses could affect the sta-tus of nutrients in terrestrial ecosystems by constrainingsoil N accumulation and storage [Chen and Xu, 2006;Qualls, 2000]. In addition, DON has significant ecological
impacts on receiving waters [McDowell, 2003] because it isa dynamic participant in microbiologically regulated N cy-cling in aquatic ecosystems [Berman and Bronk, 2003;Seitzinger and Sanders, 1997]. However, most process-based models that simulate N leaching losses do not takeinto account DON losses from terrestrial ecosystems [Kor-saeth et al., 2003; van Kessel et al., 2009].
[3] DON and dissolved organic carbon (DOC) are com-bined components of dissolved organic matter (DOM);thus, they are highly likely to originate from the same sour-ces [Perakis and Hedin, 2002] and be subjected to similarcontrolling environmental factors [Neff et al., 2003]. Previ-ous laboratory and field studies have suggested that surfacestored litter, soil humus, and root exudates are major sour-ces of DOM [Kalbitz and Kaiser, 2008; Kalbitz et al.,2000]. Large portions of produced DOM are retained in thetop soil profile through microbial decomposition and physi-cal adsorption to soil particles (primarily clay minerals),with the latter being recognized as the dominant mecha-nism [Guggenberger and Kaiser, 2003; Kalbitz and Kaiser,2008; Kalbitz et al., 2000]. Studies have shown that DOMproduction, fate, and transport processes are significantlyinfluenced by both biotic factors such as microbial commu-nity composition and activities, and abiotic factors such astemperature, soil water, and pH status [Kalbitz et al.,2000].
1Department of Biological and Agricultural Engineering, NCSU. D. S.Weaver Labs, Raleigh, North Carolina, USA.
2USDA Forest Service, Center for Forested Wetland Research, Cordes-ville, South Carolina, USA.
Corresponding author: S. Tian, Department of Biological and Agricul-tural Engineering, NCSU. D. S. Weaver Labs, Campus Box7625, Raleigh,NC 27695, USA. ([email protected])
©2013. American Geophysical Union. All Rights Reserved.0043-1397/13/10.1002/wrcr.20157
1952
WATER RESOURCES RESEARCH, VOL. 49, 1952–1967, doi:10.1002/wrcr.20157, 2013

[4] Based on experimental findings of factors and mech-anisms controlling DOM dynamics in soils, Kalbitz et al.[2000] proposed a conceptual model of processes associ-ated with soil DOM dynamics, which has become the basisof many subsequent mechanistic modeling studies [Fanet al., 2010; Futter et al., 2007; Jutras et al., 2011;Michalzik et al., 2003; Neff and Asner, 2001; Xu et al.,2012; Yurova et al., 2008]. These process-based modelsused various methods to quantify the production, adsorp-tion/desorption and hydrologic transport of DOC in the soilprofile in different terrestrial ecosystems. Compared to thesignificant progress in mechanistic modeling of soil DOCdynamics, existing predictive models of DON losses areseldom process based. Current empirical-based DON mod-els, which are mostly developed for watershed scale, use dif-ferent site-specific variables such as soil C:N ratio [Hoodet al., 2003] and percentage of wetland area to predict DONproduction and transport [Agren et al., 2010; Pellerin et al.,2004]. Given the widely observed strong and positive rela-tionship between DOC and DON losses from terrestrial eco-systems [Aitkenhead-Peterson et al., 2005; Goodale et al.,2000; Hood et al., 2003; Neff et al., 2003], existing process-based DOC models can provide a basic conceptual frame-work for process-based modeling of DON dynamics andleaching losses from terrestrial ecosystems. For example,Gjettermann et al. [2008] integrated a DOM module into theDAISY model to simulate both the soil DOC and DON dy-namics by tracking the C:N ratio from the source of DOM.
[5] DRAINMOD-N II [Youssef et al., 2005] is a field-scale, process-based model that simulates soil C and N cy-cling for drained agricultural lands with different soil types,climatic conditions, and management practices. Recentmodel evaluations have shown that DRAINMOD-N II canreliably predict mineral N losses from drained agriculturallands [Bechtold et al., 2007; David et al., 2009; Luo et al.,2010; Salazar et al., 2009; Thorp et al., 2009; Youssefet al., 2006] and forests [Tian et al., 2012b, 2012c]. Likeother process-based models that simulate N export from ter-restrial ecosystems, DRAINMOD-N II does not simulateleaching losses of DON. The objectives of this study were(1) to modify the DRAINMOD-N II model to simulate theproduction, transport and leaching losses of DON from ter-restrial ecosystems and (2) to test the modified model using a20 year data set from three poorly drained loblolly pine(Pinus taeda L.) plantations in the Lower Coastal Plain ofNorth Carolina. Modifications of DRAINMOD-N II werecarried out based on the assumption that the biochemical andphysical processes controlling the dynamics of DON andDOC in terrestrial ecosystems are similar; thus approachesof existing DOC modeling can be used as a conceptualframework for modeling DON fate and transport in terrestrialecosystems. In the model development section, we describethe approach for modeling DOM instead of DOC and DON.
2. Model Development
2.1. A Brief Description of DRAINMOD-N II
[6] DRAINMOD-N II is a field-scale, process-based com-puter model that simulates soil C and N dynamics in agricul-tural ecosystems [Youssef et al., 2005]. DRAINMOD-N IIconsiders three N forms: nitrate-N, ammoniacal-N, andorganic N. It simulates detailed N transformation processes
including atmospheric deposition, application of mineral Nfertilizers and organic N sources, plant uptake, N mineraliza-tion/immobilization, nitrification, denitrification, ammoniavolatilization, and mineral N losses via deep seepage, sub-surface drainage, and surface runoff [Youssef et al., 2005]. Amultiphase form of the one-dimensional advection-disper-sion reaction (ADR) equation is used to simulate N reactivetransport through the soil profile. Soil C dynamics are simu-lated using a soil C submodel adapted from the CENTURYmodel [Parton et al., 1993]. The soil C submodel simulatesthree soil organic matter (OM) pools (active, slow, and pas-sive), two residue pools aboveground and belowground(metabolic and structural), as well as a surface microbialpool. Each of these OM pools is characterized by specific or-ganic C content, potential decomposition rate, and C:N ratio.DRAINMOD-N II also takes into account the effects of sev-eral factors that regulate soil C and N dynamics, includingsoil temperature, soil moisture, and soil pH. The reader isreferred to Youssef et al. [2005] for a detailed description ofDRAINMOD-NII model.
[7] The hydrologic model, DRAINMOD [Skaggs, 1978;Skaggs et al., 2012, 1999], provides the hydrologic varia-bles required by DRAINMOD-N II model. DRAINMODconducts a water balance on an hourly and daily basis atthe soil surface and in the soil column midway betweentwo parallel drains. It predicts infiltration using the Green-Ampt equation. Subsurface drainage is calculated usingHooghoudt’s equation for water table drawdown and Kirk-ham’s equations for ponded surface conditions. Surfacerunoff is estimated as the difference between rates of pre-cipitation and infiltration, once site-specific surface depres-sional storage is filled [Skaggs, 1978]. The soil waterdistribution in the unsaturated zone is quantified using soilwater characteristic curves under the assumption of ahydrostatic drained-to-equilibrium condition.
2.2. A Brief Description of the DRAINMOD-FORESTModel
[8] The model used in the field testing for predicting theDON losses is DRAINMOD-FOREST [Tian, 2011; Tianet al., 2012b], which was developed by linking a forestgrowth model [Landsberg and Waring, 1997] to the hydro-logic model DRAINMOD and the modified soil C and Nmodel DRAINMOD-N II. DRAINMOD-FOREST is anintegrated, process-based field-scale model that simulateswater, soil C and N dynamics, and forest growth fordrained forest lands under silvicultural and water manage-ment practices [Tian et al., 2012b, 2012c].
[9] The newly developed forest growth model simulatesnet primary production (NPP) using radiation use efficiencyand allocates fixed C to tree components using species de-pendent allometric relationships. Photosynthetic processesof the forest canopy are constrained by air temperature andthe availability of soil water and mineral N. The model alsosimulates the effects of commonly used forest managementpractices including N fertilizer application, thinning, prun-ing, harvesting, site preparation, and regeneration on water,C and N cycling in forest ecosystems. Carbon inputs to for-est floor from foliage litterfall are estimated as a function ofleaf longevity, and fine root turnover is quantified based onfine root lifespan. Predicted foliage litterfall and rootturnover are used to update OM pools simulated by
TIAN ET AL.: PREDICTING DISSOLVED ORGANIC NITROGEN EXPORT FROM FOREST
1953
DRAINMOD-N II. The leaf area index (LAI) predicted bythe forest growth model is a critical input for estimatinghydrological processes such as rainfall interception andevapotranspiration (ET). The plant growth model and modi-fications to the original hydrology model for simulating rain-fall interception, ET, and Penman-Monteith based potentialET are described by Tian et al. [2012b]. DRAINMOD-FOR-EST model has been calibrated and validated for predictingwater table fluctuation, subsurface drainage fluxes, mineralN export, and tree growth for drained loblolly pine planta-tions under limited and intensive water management and sil-vicultural management practices [Tian et al., 2012b, 2012c].
2.3. DOM Module
2.3.1. Structure of the DOM Module[10] Due to the current limited understanding of DON
dynamics in terrestrial ecosystems, the following assump-tions have been made to extend the capability of DRAIN-MOD-N II to simulate the fate and transport of DON insoil : (1) methods used for predicting DOC behavior can beutilized for modeling DON dynamics; (2) both DOC andDON losses can be quantified by tracking the C:N ratios ofvarious DOM sources; (3) the soluble OM consists of twopools: DOM in aqueous phase and adsorbed potentially solu-ble organic matter (PSOM); and (4) equilibrium betweenDOM and PSOM can be achieved instantaneously. Based onthese assumptions, the DOM module quantitatively simulatesprocesses associated with soluble OM, including productionfrom diverse soil OM pools, microbial consumption, parti-tioning between solid and aqueous phases, and physicaltransport through the soil profile (Figure 1). The new moduleis driven by hydrological predictions of DRAINMOD andthe soil C and N dynamics predictions of DRAINMOD-N II.
[11] The DOM module simulates the transport and trans-formation processes of DOM (Figure 1) using a mass bal-
ance equation (equation (1)) in a vertical soil column withmultiple nonuniform layers:
@MT
@tþ @Q
@zþ R ¼ 0 (1)
where MT is the total soluble OM content including bothDOM and PSOM (mg cm�3), t is time (d), Q is DOM flux(mg cm�2 d�1), and z is soil depth (cm), and R representssources or sinks of total soluble OM (mg cm�3 d�1). Thesoil column simulated in the model is at the midwaybetween two adjacent parallel drain ditches to represent theaverage biogeochemical processes in the field. The reliabil-ity of this approximation in shallow water table soils hasbeen validated by numbers of previous applications ofDRAINMOD-N II model [Luo et al., 2010; Thorp et al.,2009; Tian et al., 2012b, 2012c].
[12] The total soluble OM MTð Þ is divided into two pools(solid and dissolved) and can be expressed as
MT ¼ �bS þ �C; (2)
where �b is the soil bulk density at a given soil layer (gcm�3), S is the PSOM in the solid phase (mg g�1 soil), � isthe volumetric soil water content (cm3 cm�3), C is the con-centration of DOM in the aqueous phase (mg cm�3). The fol-lowing sections give a detailed description of methods usedto simulate DOM fate and transport processes (Figure 1).2.3.2. Production of Soluble OM
[13] Although there is still considerable debates regardingthe sources of soluble OM [McDowell, 2003], it has beenwidely acknowledged that the soluble OM mainly originatesfrom fresh litter, humus, and root turnover [Kalbitz et al.,2000]. In forest ecosystems, the accumulated litter on theforest floor and humus in O horizons have been identified asthe primary sources of soluble OM in the topsoil layers[Cleveland et al., 2004; Neff and Asner, 2001], while fineroot turnover has been suggested as a key source of solubleOM in deeper soil profiles [Uselman et al., 2007]. The pro-duction of DOM is influenced by substrate quality, micro-bial activity, and abiotic factors including temperature, soilpH, and soil water [McDowell, 2003; Neff and Asner,2001]. Given the current understanding of the relative im-portance of different soluble OM sources and the underlyingcontrolling mechanisms, there is still a lack of mechanisticmethods to estimate its production. Assigning a constant pro-duction rate [Fan et al., 2010] and relating production totemperature [Yurova et al., 2008] are methods that havebeen commonly adapted. Instead of assigning a productionrate empirically, Neff and Asner [2001] related soluble OMproduction to various soil OM pools represented in the CEN-TURY model. Similarly, the DAISY model uses partitioningcoefficients to estimate DOM production as a function ofsimulated soil OM pools [Gjettermann et al., 2008]. As con-ceptually assumed by Neff and Asner [2001] and Gjetter-mann et al. [2008], one main source of soluble OM is thestructural pools of standing litter on the forest floor and inforest soil. Neff and Asner [2001] separately estimated solu-ble fractions of woody litter and fine litter from foliage andfine roots as functions of the ratio of lignin to N. In contrast,
Figure 1. Schematic diagram of soluble organic matter(OM) pools and processes controlling soluble organic mat-ter dynamics. The soluble organic matter is divided intotwo pools: dissolved organic matter (DOM) and potentialdissolved soluble organic matter (PSOM).
TIAN ET AL.: PREDICTING DISSOLVED ORGANIC NITROGEN EXPORT FROM FOREST
1954

we used an empirical equation [Parton et al., 1993] to simu-late the overall soluble fraction of litter pool on the forestfloor and in forest soil:
P ¼ 0:15� 0:018� LNð Þ; (3)
where P represents the soluble fraction of the litter pool onthe forest floor and in forest soil, LN denotes the ratio oflignin to N.
[14] Microbial production is another source of solubleOM in the soil profile [Gjettermann et al., 2008; Neff andAsner, 2001]. Similar to Neff and Asner [2001], microbialproduction of soluble OM is estimated as a fixed fraction(fsom, user specified) of microbial and metabolic pools thatare simulated in DRAINMOD-N II. Effects of soil condi-tions on soluble OM generation were implicitly consideredwhen simulating decomposition of soil OM [Youssef et al.,2005]. The estimated total soluble OM MTð Þ in each soillayer is then partitioned into solid and aqueous phases(equation (2)) as regulated by the adsorption/desorptionprocesses described in the next section.2.3.3. Adsorption/Desorption of Soluble OM
[15] Physical adsorption of potentially soluble OM tosoil particles has been found to be the predominant factorregulating DOM movement through soil profile [Guggen-berger and Kaiser, 2003; Qualls, 2000; Vandenbruwaneet al., 2007]. Current DOM models assume that the releaseof DOM from soil is either instantaneous [Michalzik et al.,2003; Neff and Asner, 2001], rate-limited [Gjettermannet al., 2008; Yurova et al., 2008], or dual-process (both in-stantaneous and rate limited) [Fan et al., 2010]. For sim-plicity, we assumed that the equilibrium between solubleOM in solid and aqueous phases occurs instantaneously.Previous studies have used various linear and nonlinear iso-therms to quantify the adsorption/desorption of DOM to/from mineral soil [Kothawala et al., 2008; Vandenbruwaneet al., 2007]. Among these methods, the initial massmethod is the one most widely used in modeling studiessuch as Neff and Asner [2001] and Michalzik et al. [2003].The linear isotherm is limited to low adsorbate concentra-tions because it ignores the maximum adsorption capacityof the soil matrix. In contrast, the Langmuir isotherm con-siders the adsorption capacity of soil, and was found to bethe best model for quantifying sorption of DOC and DONin various soils [Kothawala et al., 2008; Vandenbruwaneet al., 2007]. Therefore, we selected the Langmuir isothermto quantify the assumed instantaneous DOM adsorption/de-sorption processes:
S ¼ Q0 � b � C1þ b � C (4)
where Q0 is a parameter related to the soil maximumadsorption capacity (mg g�1) and b is the constant repre-senting binding affinity between DOM and soil particles(cm3 mg�1). The maximum adsorption capacity is a keyfactor regulating the equilibrium concentration of DOMand is usually related to soil physical properties such asclay fraction [Jardine et al., 2006] and aluminum and ironoxyhydroxides [Kaiser and Guggenberger, 2000; Kotha-wala et al., 2008].
2.3.4. Microbial Decomposition of Soluble OM[16] Another key mechanism that should be taken into
consideration when modeling DOM dynamics in soils ismicrobial decomposition [Neff and Asner, 2001]. Althoughthis process acts on a much longer time scale than physicaladsorption/desorption [Yurova, et al. 2008], it is critical indetermining the availability of total soluble OM in the soilprofile. The assumption that soluble OM in soils is a singleOM pool has been widely accepted in DOM modeling stud-ies [Fan et al., 2010; Futter et al., 2007; Jutras et al.,2011; Michalzik et al., 2003; Neff and Asner, 2001; Xuet al., 2012; Yurova et al., 2008]. Microbial decompositionof DOM in previous studies widely used the first-orderdecomposition equation with constant decomposition coef-ficient [Xu et al., 2012], or variable coefficient dependingupon environmental factors such as temperature and/or soilwater condition [Fan et al., 2010; Yurova et al., 2008].Meanwhile, it has been proposed that dividing soluble OMinto two separate OM pools with different biochemicalrecalcitrance may potentially improve modeling accuracy[Jones et al., 2004; Neff et al., 2003]. However, separationof soluble OM pools could significantly increase thedegrees of freedom of the model, which increases both thecomplexity of the model and the uncertainty of its predic-tions [Fan et al., 2010].
[17] In DRAINMOD-N II, we assume that soluble OMconsists of multiple OM pools whose decomposition ratescorrespond to the source OM pools (microbial, metabolic,and structural) with different decomposition rates. Thisapproach is expected to improve modeling accuracy butwithout increasing the model’s degrees of freedom. Micro-bial decomposition of individual OM pools in DRAIN-MOD-N II is characterized by first-order kinetics and user-specified rate coefficients [Youssef et al., 2005]. TheDRAINMOD-N II model simulates influences of environ-mental factors including soil temperature, moisture, andpH, on the decomposition process.2.3.5. Transport of DOM
[18] As illustrated by Neff and Asner [2001] and severalother experimental studies [Asano et al., 2006; Dittmanet al., 2007; Solinger et al., 2001; Xu and Saiers, 2010],hydrological transport is a key physical process affectingDOM losses and soil DOM dynamics. In the modifiedDRAINMOD-N II model, the transport of DOM flux (Q) iscontrolled by three physical mechanisms: hydrodynamicdispersion caused by soil heterogeneity, diffusion resultingfrom concentration gradient, and advection:
Q ¼ �� @C
@zDað Þ þ �C; (5)
where Da is the coefficient of hydrodynamic dispersion(cm2 t�1) including dispersion and diffusion,� is the waterflux (cm t�1). The coefficient of hydrodynamic dispersioncan be estimated using methods given by Youssef et al.[2005].
[19] Integrating equations (1), (2), (3), (4), and (5) acompact form of the ADR equation can be written as
@
@t�Rf C� �
¼ @
@zDe@C
@z
� �� @
@zvCð Þ þ R; (6)
TIAN ET AL.: PREDICTING DISSOLVED ORGANIC NITROGEN EXPORT FROM FOREST
1955

where Rf is referred to as retardation factor and De is theeffective dispersion coefficient, which is the product of �and the coefficient of hydrodynamic dispersion. The ADRequation is similar to the one used in DRAINMOD-N II forsimulating mineral N reactive transport but with a differentdefinition for the retardation factor. The retardation factorðRf Þ is defined for Langmuir isotherm as follows [Zhengand Bennett, 2002]:
Rf ¼ 1þ �b
�
Q0b
1þ bCð Þ2
" #: (7)
Both Yurova et al. [2008] and Fan et al. [2010] verifiedthat the ADR equation is adequate for simulating DOC re-active transport within the soil profile. In the modified ver-sion of DRAINMOD-N II, equation (6) is solved usingnumerical methods given by Youssef et al. [2005].
3. Field Testing of the Modified DRAINMOD-NII Model
3.1. Study Site and Data Collection
[20] The study site consists of three adjacent loblollypine plantations on small (nearly 25 ha) and relatively flat(less than 0.1% slope) study sites (referred to as D1, D2,and D3) that are located in the Atlantic Coastal Plain ofNorth Carolina, USA (34�480N, 76�420W). The hydric soilon the site is characterized by fine sandy loam with clayfraction ranging from 7% to 35% (NRCS survey). Each siteis drained by four 1.2 to 1.5 m deep parallel lateral ditchesspaced 100 m apart (Figure 2). Loblolly pine trees were
planted in 1974 at a density of 2100 trees ha�1. The siteswere thinned in 1981 (to approximately 988 trees ha�1)and again (commercial thinning) to approximately 370trees ha�1 in late 1988 when the trees were about 14 yearsold. In early 1989, the three study sites received N fertiliza-tion at a rate of 195 kg N ha�1 in the form of urea. The siteswere instrumented and field measurements to document hy-drology and drainage water quality were initiated in 1988.After a two year calibration period treatments, silviculturalpractices were begun in March 1990. Through the durationof the study, D1 has been operated as a control site, whilevarious silvicultural and water management practices wereapplied to D2 and D3, as summarized in Table 1. Silvicul-tural practices conducted on the study site were thinning,harvesting, site preparation, bedding, planting, regeneration,and fertilization. Water management practices included con-trolled drainage and orifice weir treatment. Controlled drain-age was carried out by adjusting weir elevation at the outletof the main ditch draining each field. An orifice weir treat-ment was implemented by installing a rectangular weir witha 10 cm diameter orifice near the ditch bottom to dampenpeak drainage rates during storm events [Amatya et al.,2003]. A detailed description of the study site, soil and vege-tation is given by Amatya et al. [1996] and Beltran et al.[2010a].
[21] The field hydrologic data collection began in 1988when the loblolly pine trees were 15 years old. Rainfallwas measured using a tipping bucket rain gauge with a datalogger on the western side of each site (Figure 2). Air tem-peratures, relative humidity, wind speed and direction, andsolar and net radiation were measured at half-hour intervalsby a nearby weather station until 1997 and an on-siteweather station afterwards. A 120� V-notch weir with anautomatic stage recorder was installed at the outlet ditchesto measure drainage outflow from each site. An additionalrecorder was placed downstream from each weir to deter-mine weir submergence and to correct flow data if needed.Detailed description of the hydrological measurements wasdocumented by Amatya et al. [2003] and Beltran et al.[2010a].
[22] The drainage water quality was intensively moni-tored during late 1989–1994. During that period, both com-posite sampling using ISCO-2700 automatic samplers andmanual grab sampling were used for drainage water samplecollection at about 30 cm upstream of the weir outlet. Inthe automatic sampling method, water samples were col-lected every two hours during each storm event. Four con-secutive samples were mixed together to make onecomposite sample, resulting in three composite samples perday. Starting from 1995, composite samples were collectedat a 6 h interval and mixed together to make one water sam-ple every 2 weeks for laboratory analysis. Additionally,grab samples were collected weekly or every 2 weeks duringflow events for the whole study period. Filtrated water sam-ples were analyzed for nitrate and nitrite, ammonium, totalKjeldahl nitrogen (TKN). Detailed procedures of event sam-pling and chemical analysis are documented in other studies[Amatya et al., 1996, 2003; Beltran et al., 2010b]. DONconcentrations were estimated as the difference betweenmeasured concentrations of TKN and ammonium. DONfluxes during each 2 week interval was calculated as theproduct of the measured drainage during the interval and the
Figure 2. Location of the study site (upright) at CarteretCounty, North Carolina and schematic diagram of the threestudy sites (D1, D2, and D3). Modified based on Tian et al.[2012c].
TIAN ET AL.: PREDICTING DISSOLVED ORGANIC NITROGEN EXPORT FROM FOREST
1956
concentration based on the composite sample collected atthe end of the interval. Monthly and annual fluxes were cal-culated by summing the 2 week fluxes. Year of 2003 wasexcluded from model validation because of inaccurate flowmeasurements caused by frequent weir submergence at thefield outlet. In addition, there were no sufficient measure-ments to calculate DON flux from D3 site in 1991 and 1995,both of which were excluded from analysis.
3.2. Model Calibration and Validation
[23] DRAINMOD-FOREST has been evaluated for pre-dicting water, soil C and N dynamics, tree growth, andmineral N losses from these three sites [Tian et al., 2012b,2012c]. For consistency with those hydrologic and mineralN predictions, previously calibrated hydrological, biogeo-chemical and plant growth parameters have not beenchanged during the calibration of the DOM module. Thecalibration processes in this study were focused on the fournewly introduced parameters (Q0, b, De, fsom) regulatingDOM production, sorption dynamics, and transport throughthe soil profile. For the D1 site, measured daily DON lossesfrom 1990 to 1994 were used for initial model calibration.In addition, the calibrated model parameters were furtherrefined using the measured data of monthly DON lossescollected during the first 10 years (1989–1998) at D1, andvalidated using DON measurements for 9 of the next 10years (1999–2008, 2003 excluded). No further calibrationwas conducted for the D2 and D3 sites and their measureddata were used to further validate the DOM module. Thus,
the DOM module was calibrated using 10 site years (with 4year daily measurements) from D1 and validated using 45site years of data from D1 (9 years), D2 (19 years) and D3(17 years). Several statistical indices [Legates and McCabe,1999] including Nash-Sutcliffe coefficient (E), degree ofagreement (d), mean absolute error (MAE), and normalizedpercent error (NPE) were used to assess the model perform-ance for predicting DON losses via drainage water at differ-ent temporal scales. Criteria’s for judging model performanceis given by Skaggs et al. [2012]. The initial maximum soiladsorption capacity of DOM ðQ0Þ used for model calibrationwas obtained from the relationship between ðQ0Þ (mg g�1)and soil clay fraction Fcð Þ given by [Jardine et al., 2006]:
Q0 ¼ 4:74� Fc: (8)
[24] This calibrated mean Q0 of the whole soil profilewas 8.6 mg g�1, which is considered reasonable for theclay fraction (7–35%) of the soil at the study site. The mo-lecular diffusion coefficient of DOM was assumed 0.76cm2 d�1 [Jardine et al., 2006]. Calibrated values for otherkey parameters (Q0, b, fsom) for DON dynamics are givenin Table 2.
3.3. Uncertainty Analysis
[25] Uncertainty analysis is an essential procedure forevaluating and improving model performance by assessingvariances of model predictions originating from, but notlimited to, model structure and model inputs and parameters
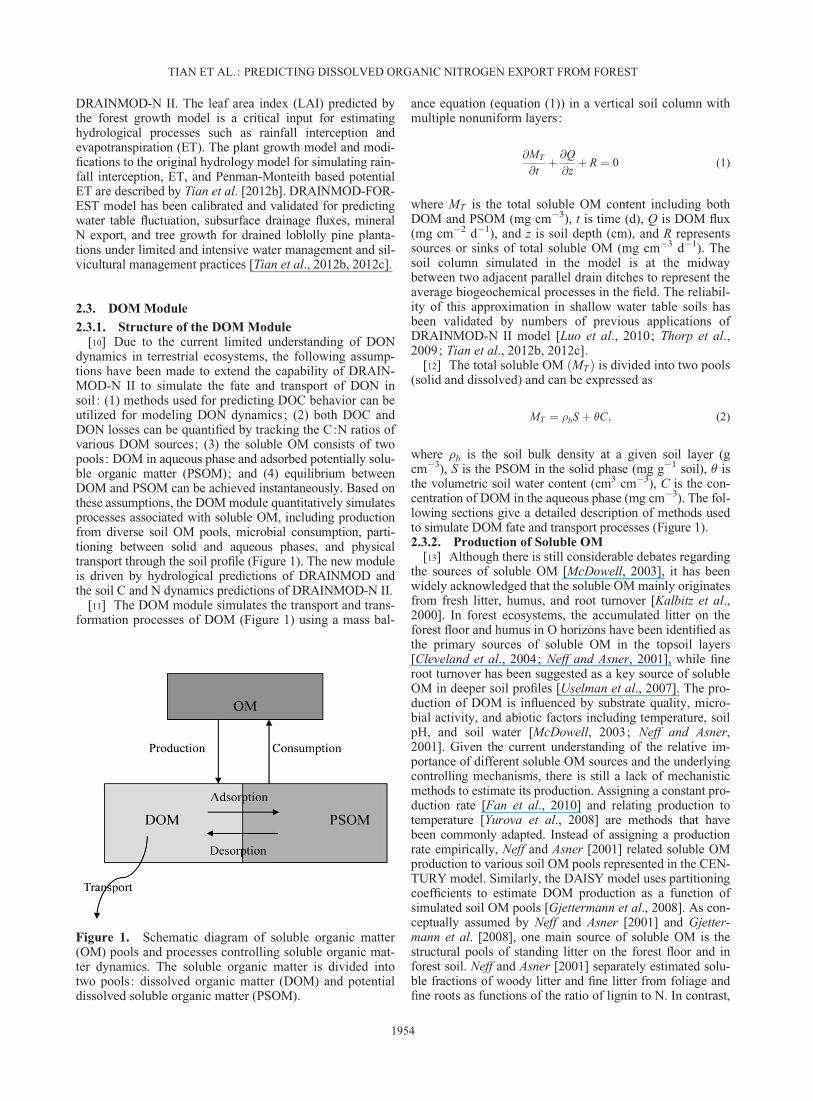
Table 1. Management History of the Three Study Watersheds at the Carteret Study Sites
Managements Time D1 D2 D3 Notes
Plantation 1974 �a � � 2100 trees ha�1
Thinning 1980 � � � Thinned to about 1000 trees ha�1
Fertilization 1981 � � � Aerial applied 169 kg N ha�1
Commercial thinning 1988 � � � Thinned to about 370 trees ha�1
Fertilizer application 1989 � � � Ground applied 225 kg N ha�1
Control drainage 1990–1994 � � Raised outlet weir levelsHarvesting 1995 � Whole tree harvestingOrifice control drainage 1995–1999 � Orifice bored near weir bottomSite preparation 1996 � BeddingRegeneration 1997 � 2100 trees ha�1
Thinning 2002 � Thinned to about 185 trees ha�1
Fertilization 2005 � � Applied 115 (D2) and 172 (D3) kg N/ha
a‘‘�’’ means that the practice was performed on the site.
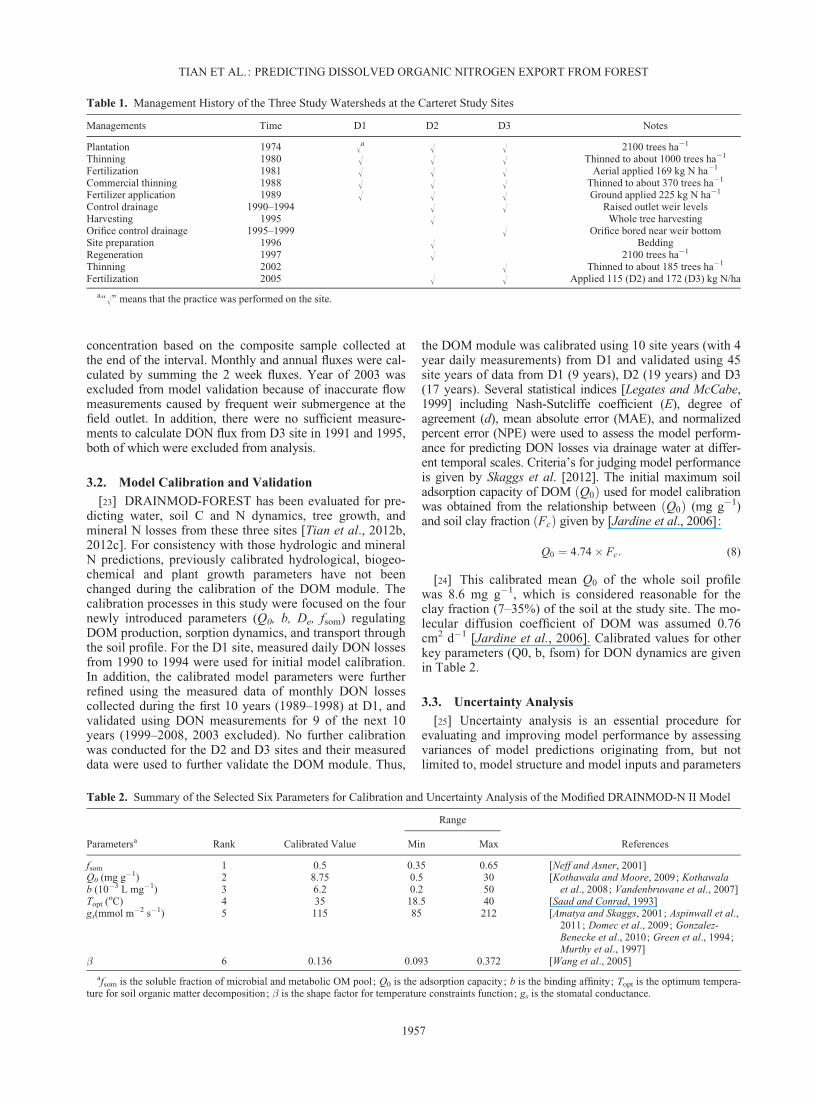
Table 2. Summary of the Selected Six Parameters for Calibration and Uncertainty Analysis of the Modified DRAINMOD-N II Model
Parametersa Rank Calibrated Value
Range
ReferencesMin Max
fsom 1 0.5 0.35 0.65 [Neff and Asner, 2001]Q0 (mg g�1) 2 8.75 0.5 30 [Kothawala and Moore, 2009; Kothawala
et al., 2008; Vandenbruwane et al., 2007]b (10�3 L mg�1) 3 6.2 0.2 50Topt (oC) 4 35 18.5 40 [Saad and Conrad, 1993]gs(mmol m�2 s�1) 5 115 85 212 [Amatya and Skaggs, 2001; Aspinwall et al.,
2011; Domec et al., 2009; Gonzalez-Benecke et al., 2010; Green et al., 1994;Murthy et al., 1997]
� 6 0.136 0.093 0.372 [Wang et al., 2005]
afsom is the soluble fraction of microbial and metabolic OM pool; Q0 is the adsorption capacity; b is the binding affinity; Topt is the optimum tempera-ture for soil organic matter decomposition; � is the shape factor for temperature constraints function; gs is the stomatal conductance.
TIAN ET AL.: PREDICTING DISSOLVED ORGANIC NITROGEN EXPORT FROM FOREST
1957

[Montanari et al., 2009]. We conducted an uncertainty anal-ysis of the modified DRAINMOD-N II model using thegeneralized likelihood uncertainty estimation (GLUE)methodology [Beven and Binley, 1992]. This method hasbeen widely used for uncertainty analysis in various disci-plines because of its conceptual simplicity and relative easeof implementation [Blasone et al., 2008; Vrugt et al.,2009]. The GLUE framework integrates Monte Carlo analy-sis and Bayesian estimation to identify multiple sets of be-havioral model parameter values that can result in similargood model predictions [Vrugt et al., 2009], which is usu-ally referred to as ‘‘equifinality’’ of computer models [Bevenand Freer, 2001]. Using different combinations of randomlysampled parameter values, the GLUE method requires alarge number of model runs to obtain various model predic-tions with different likelihood measures. The outputs ofGLUE uncertainty analysis provide the distributions of pos-terior parameters and associated uncertainty intervals ofmodel predictions.
[26] The parameters included in the uncertainty analysis(Table 2) were selected based on a global sensitivity analysisconducted for DRAINMOD-FOREST model using theextended Fourier amplitude sensitivity testing (EFAST)[Saltelli et al., 2000]. The sensitivity analysis was carriedout for the long-term (1988–2008) mean annual model pre-dictions. Results of the sensitivity analysis of the DRAIN-MOD-FOREST will be reported elsewhere (Tian, S, M. A.Youssef, D. M. Amatya, and E. Vance, A global sensitivityanalysis of DRAINMOD-FOREST, an integrated forest eco-system model. submitted to Hydrological Processes, 2013).The uncertainty analysis of the modified DRAINMOD-N IIwas carried out for annual DON losses from D1 site only. Intotal, 1200 parameter sets were generated using the LatinHypercube sampling method [Iman et al., 1981].
[27] A likelihood measure with a threshold is required byGLUE to separate behavioral and nonbehavioral parametersets [Stedinger et al., 2008]. In this study, we selected alikelihood measure based on the Nash-Sutcliffe efficiency(E), which is frequently applied in uncertainty analysisusing GLUE applications [Stedinger et al., 2008].
E ¼ 1� s"2
so2
� ��N
;
where s" and so are the standard deviations of the modelerrors and field measurements, respectively, and N is the‘‘shaping factor.’’ When N ¼ 0, all sets of parameter valueswill receive equal likelihood weights ; when N !1, onlyone single best parameter set will be selected and assignedits likelihood weight of 1. In this study, N was assumed 1as recommended by [Beven and Binley, 1992]. Two cutoffthresholds (Ecutoff) of the likelihood measure were used:0.5 for quantifying uncertainty of annual predictions, and 0.8for assessing model equifinality. Here, we assume that Nash-Sutcliffe efficiency of 0.8 is sufficiently close to 0.9, thehighest value that was obtained through model calibration.
4. Results
[28] Incorporating the DOM dynamics module did notresult in noticeable changes in model predictions of water,soil C and N dynamics because leaching loss of DOM is
much smaller compared to total soil OM. The reader isreferred to [Tian et al., 2012b, 2012c] for detailed descrip-tion of predicted drainage, water table fluctuations, dynam-ics of OM pools on forest floor and in forest soil, as well asnitrate losses and N transformation processes in the threestudy sites. Herein we present model predictions of onlylong-term DON losses dynamics from the three sites.
4.1. Predictions of Daily DON Losses
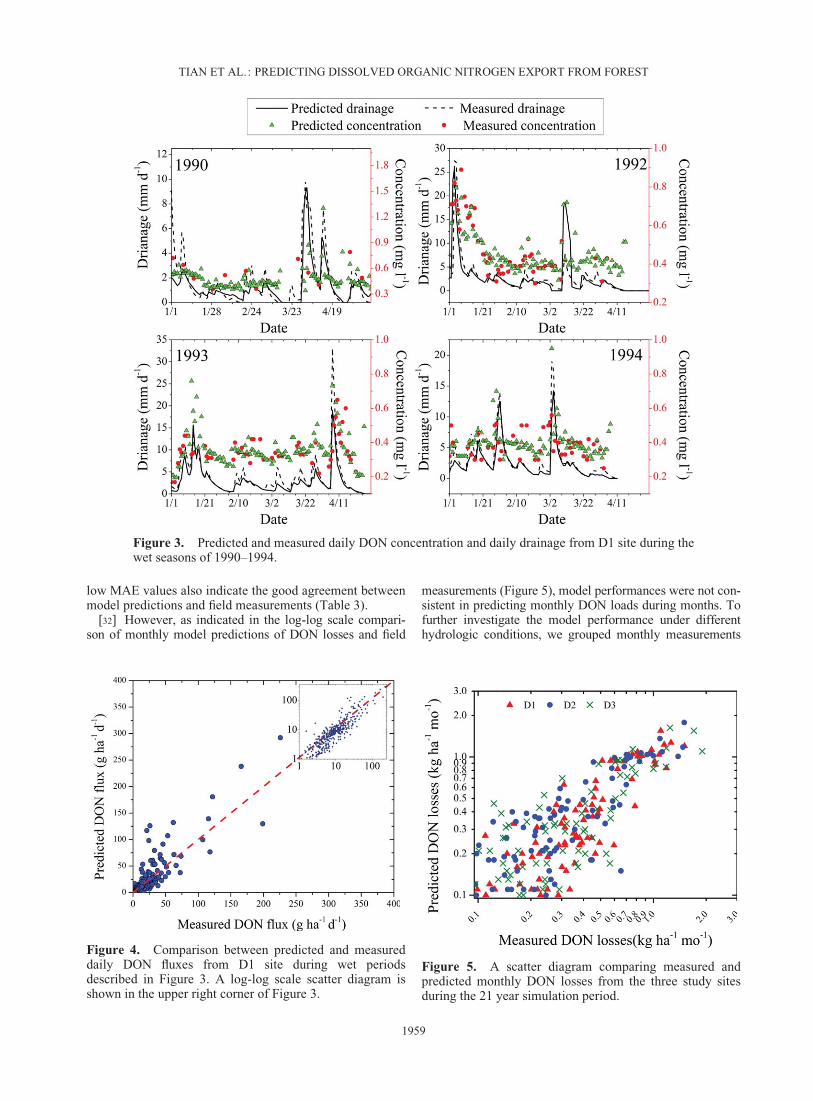
[29] DON losses from forested watersheds mainly occurduring large storm events in wet seasons [Aitkenhead-Peterson et al., 2005; Qualls and Richardson, 2003; Tianet al., 2012a]. Due to the limitations of historical data col-lection, measured daily DON concentrations and fluxeswere only available for D1 site during 1990–1994. In gen-eral, predicted DON concentrations during storm events ofthis period were comparable to field measurements (Figure3). Predicted daily DON fluxes were also in good agree-ment with field measurements with E of 0.53, MAE of 1.8g ha�1 d�1, and d of 0.82 (Figure 4). Simulated averagedaily DON losses during the wet seasons from 1990 to1994 is 12.8 g ha�1 d�1 with a standard deviation of 25.6 gha�1 d�1, compared to measured mean of 13.5 g ha�1 d�1
with a standard deviation of 21.7 g ha�1 d�1. The goodmodel performance in predicting daily DON losses islargely attributed to the accurate simulation of hydrologicalprocesses [Tian et al., 2012b]. Nevertheless, it should benoted that the model over predicted peak DON concentra-tions during storm events. For instance, predicted peak con-centration of DON was 0.92 mg L�1 during the storm eventoccurred in early March 1994, while the measured peakconcentration was 0.62 mg L�1.
[30] As illustrated by both field measurements and modelpredictions, higher DON concentrations typically occurredduring storm events (Figure 3) because of the decliningDON concentration with soil depth. Predicted soil DON con-centration along the soil profile in this study typicallydecreased from around 2.5 mg L�1 near the soil surface toabout 0.5 mg L�1 at 1m below soil surface. These values arecomparable to field measurements in other forest ecosystems[Currie and Aber, 1997; Michalzik and Matzner, 1999;Park and Matzner, 2003]. However, the temporal change ofDON concentrations with drainage flow was unclear. This isin contrast to experimental findings from upland forests thatDON concentration closely follow the changes of dischargeand peak DON concentrations usually occur synchronouslywith peak discharge [Bernal et al., 2005; Cooper et al.,2007; Inamdar and Mitchell, 2007]. The difference inhydrologic paths between lowland drained forest (dominatedby lateral subsurface drainage) and upland forest (dominatedby both surface runoff and lateral subsurface flow) wasfound to be the principle causes of the observed distinctbehavior of DON export [Tian et al., 2012].
4.2. Predictions of Monthly DON Losses
[31] In general, the model captured the monthly dynam-ics of DON losses. The log-log scale scatter diagram com-paring measured and predicted monthly DON lossesillustrates that the model captured the monthly changes ofDON losses from the three study sites (Figure 5). The com-parable means and standard deviations of model predictionsand field measurements, the relatively high E values and
TIAN ET AL.: PREDICTING DISSOLVED ORGANIC NITROGEN EXPORT FROM FOREST
1958
low MAE values also indicate the good agreement betweenmodel predictions and field measurements (Table 3).
[32] However, as indicated in the log-log scale compari-son of monthly model predictions of DON losses and field
measurements (Figure 5), model performances were not con-sistent in predicting monthly DON loads during months. Tofurther investigate the model performance under differenthydrologic conditions, we grouped monthly measurements
Figure 3. Predicted and measured daily DON concentration and daily drainage from D1 site during thewet seasons of 1990–1994.
Figure 4. Comparison between predicted and measureddaily DON fluxes from D1 site during wet periodsdescribed in Figure 3. A log-log scale scatter diagram isshown in the upper right corner of Figure 3.
Figure 5. A scatter diagram comparing measured andpredicted monthly DON losses from the three study sitesduring the 21 year simulation period.
TIAN ET AL.: PREDICTING DISSOLVED ORGANIC NITROGEN EXPORT FROM FOREST
1959
and predictions into three groups based on measuredmonthly drainage volumes (0–50, 50–100, and >100 mmmo�1) for all three sites. Goodness-of-fit statistics includingaverage monthly DON losses, mean absolute error, percenterror, Nash coefficient, and degree of agreement for each cat-egory were calculated separately for each group (Table 4).We also presented goodness-of-fit statistics for monthlydrainage predictions of each group (Table 4).
[33] Separately calculated goodness-of-fit statistics showedthat the model performances in predicting monthly DONlosses and drainage are inconsistent for different hydrologycategories (Table 4). As monthly drainage increased, meanabsolute errors increased from 0.06 for category 1 (0 to 50mm mo�1) to 0.23 kg ha�1mo�1 for category 3 (>100mmmo�1). Absolute NPE decreased from 75.5% for category1 to 35.5% for category 3 and the E and d of DON predic-tions of each category increased substantially with themonthly drainage. Thus, DRAINMOD-FOREST performedbest in predicting monthly drainage and DON losses formonths with the largest drainage volume (>100 mm mo�1),and worst for the months with small amounts of drainage (0–50 mm mo�1). This is not unexpected because DON lossesduring months with drainage> 100 mm accounted for 45%of total DON losses and 51% of total drainage. From themodel calibration perspective, it is logical to focus on eventsthat have the largest influence on total losses and thereforedominate overall model performance.
4.3. Model Predictions of Seasonal DON Losses
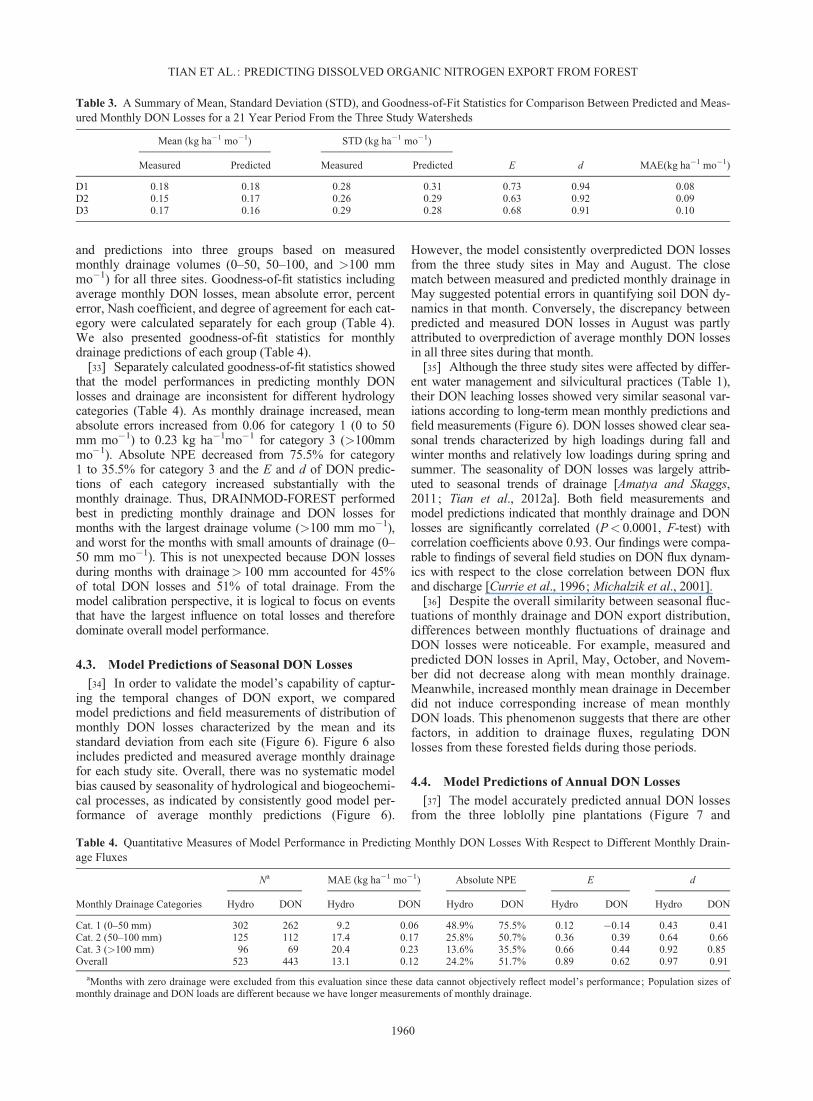
[34] In order to validate the model’s capability of captur-ing the temporal changes of DON export, we comparedmodel predictions and field measurements of distribution ofmonthly DON losses characterized by the mean and itsstandard deviation from each site (Figure 6). Figure 6 alsoincludes predicted and measured average monthly drainagefor each study site. Overall, there was no systematic modelbias caused by seasonality of hydrological and biogeochemi-cal processes, as indicated by consistently good model per-formance of average monthly predictions (Figure 6).
However, the model consistently overpredicted DON lossesfrom the three study sites in May and August. The closematch between measured and predicted monthly drainage inMay suggested potential errors in quantifying soil DON dy-namics in that month. Conversely, the discrepancy betweenpredicted and measured DON losses in August was partlyattributed to overprediction of average monthly DON lossesin all three sites during that month.
[35] Although the three study sites were affected by differ-ent water management and silvicultural practices (Table 1),their DON leaching losses showed very similar seasonal var-iations according to long-term mean monthly predictions andfield measurements (Figure 6). DON losses showed clear sea-sonal trends characterized by high loadings during fall andwinter months and relatively low loadings during spring andsummer. The seasonality of DON losses was largely attrib-uted to seasonal trends of drainage [Amatya and Skaggs,2011; Tian et al., 2012a]. Both field measurements andmodel predictions indicated that monthly drainage and DONlosses are significantly correlated (P< 0.0001, F-test) withcorrelation coefficients above 0.93. Our findings were compa-rable to findings of several field studies on DON flux dynam-ics with respect to the close correlation between DON fluxand discharge [Currie et al., 1996; Michalzik et al., 2001].
[36] Despite the overall similarity between seasonal fluc-tuations of monthly drainage and DON export distribution,differences between monthly fluctuations of drainage andDON losses were noticeable. For example, measured andpredicted DON losses in April, May, October, and Novem-ber did not decrease along with mean monthly drainage.Meanwhile, increased monthly mean drainage in Decemberdid not induce corresponding increase of mean monthlyDON loads. This phenomenon suggests that there are otherfactors, in addition to drainage fluxes, regulating DONlosses from these forested fields during those periods.
4.4. Model Predictions of Annual DON Losses
[37] The model accurately predicted annual DON lossesfrom the three loblolly pine plantations (Figure 7 and
Table 3. A Summary of Mean, Standard Deviation (STD), and Goodness-of-Fit Statistics for Comparison Between Predicted and Meas-ured Monthly DON Losses for a 21 Year Period From the Three Study Watersheds
Mean (kg ha�1 mo�1) STD (kg ha�1 mo�1)
E d MAE(kg ha�1 mo�1)Measured Predicted Measured Predicted
D1 0.18 0.18 0.28 0.31 0.73 0.94 0.08D2 0.15 0.17 0.26 0.29 0.63 0.92 0.09D3 0.17 0.16 0.29 0.28 0.68 0.91 0.10
Table 4. Quantitative Measures of Model Performance in Predicting Monthly DON Losses With Respect to Different Monthly Drain-age Fluxes
Monthly Drainage Categories
Na MAE (kg ha�1 mo�1) Absolute NPE E d
Hydro DON Hydro DON Hydro DON Hydro DON Hydro DON
Cat. 1 (0–50 mm) 302 262 9.2 0.06 48.9% 75.5% 0.12 �0.14 0.43 0.41Cat. 2 (50–100 mm) 125 112 17.4 0.17 25.8% 50.7% 0.36 0.39 0.64 0.66Cat. 3 (>100 mm) 96 69 20.4 0.23 13.6% 35.5% 0.66 0.44 0.92 0.85Overall 523 443 13.1 0.12 24.2% 51.7% 0.89 0.62 0.97 0.91
aMonths with zero drainage were excluded from this evaluation since these data cannot objectively reflect model’s performance; Population sizes ofmonthly drainage and DON loads are different because we have longer measurements of monthly drainage.
TIAN ET AL.: PREDICTING DISSOLVED ORGANIC NITROGEN EXPORT FROM FOREST
1960
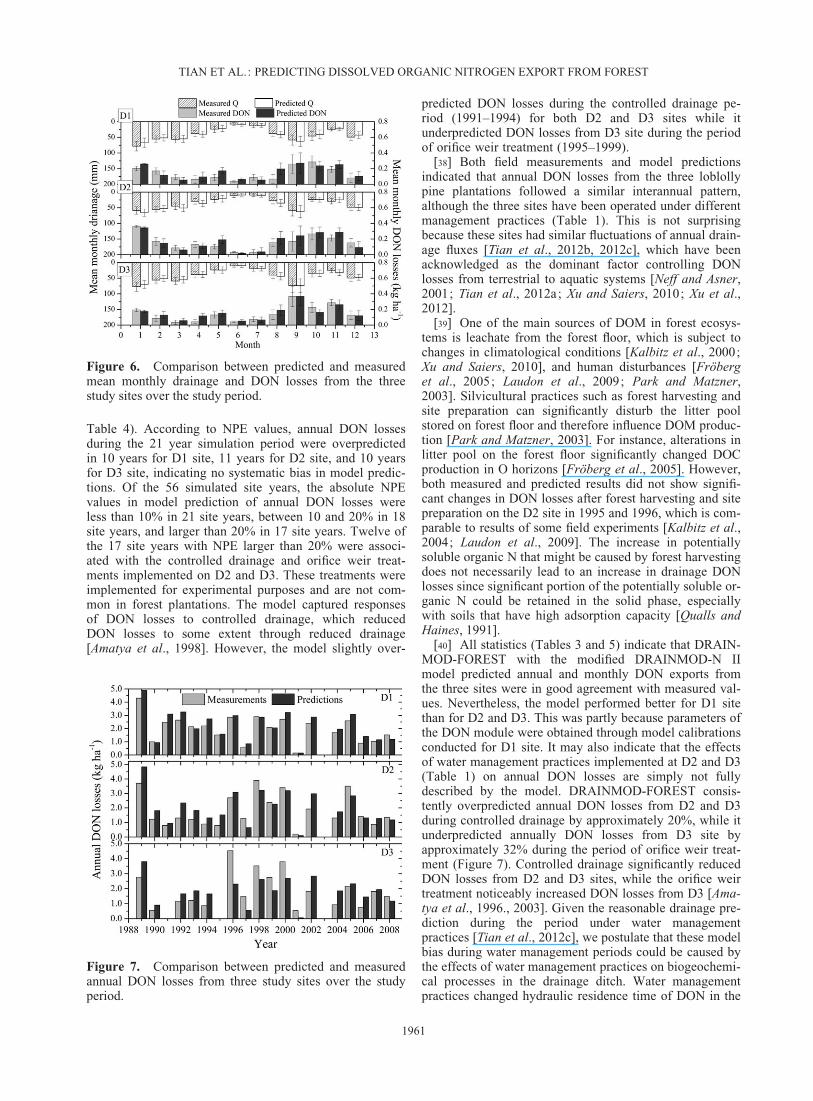
Table 4). According to NPE values, annual DON lossesduring the 21 year simulation period were overpredictedin 10 years for D1 site, 11 years for D2 site, and 10 yearsfor D3 site, indicating no systematic bias in model predic-tions. Of the 56 simulated site years, the absolute NPEvalues in model prediction of annual DON losses wereless than 10% in 21 site years, between 10 and 20% in 18site years, and larger than 20% in 17 site years. Twelve ofthe 17 site years with NPE larger than 20% were associ-ated with the controlled drainage and orifice weir treat-ments implemented on D2 and D3. These treatments wereimplemented for experimental purposes and are not com-mon in forest plantations. The model captured responsesof DON losses to controlled drainage, which reducedDON losses to some extent through reduced drainage[Amatya et al., 1998]. However, the model slightly over-
predicted DON losses during the controlled drainage pe-riod (1991–1994) for both D2 and D3 sites while itunderpredicted DON losses from D3 site during the periodof orifice weir treatment (1995–1999).
[38] Both field measurements and model predictionsindicated that annual DON losses from the three loblollypine plantations followed a similar interannual pattern,although the three sites have been operated under differentmanagement practices (Table 1). This is not surprisingbecause these sites had similar fluctuations of annual drain-age fluxes [Tian et al., 2012b, 2012c], which have beenacknowledged as the dominant factor controlling DONlosses from terrestrial to aquatic systems [Neff and Asner,2001; Tian et al., 2012a; Xu and Saiers, 2010; Xu et al.,2012].
[39] One of the main sources of DOM in forest ecosys-tems is leachate from the forest floor, which is subject tochanges in climatological conditions [Kalbitz et al., 2000;Xu and Saiers, 2010], and human disturbances [Fröberget al., 2005; Laudon et al., 2009; Park and Matzner,2003]. Silvicultural practices such as forest harvesting andsite preparation can significantly disturb the litter poolstored on forest floor and therefore influence DOM produc-tion [Park and Matzner, 2003]. For instance, alterations inlitter pool on the forest floor significantly changed DOCproduction in O horizons [Fröberg et al., 2005]. However,both measured and predicted results did not show signifi-cant changes in DON losses after forest harvesting and sitepreparation on the D2 site in 1995 and 1996, which is com-parable to results of some field experiments [Kalbitz et al.,2004; Laudon et al., 2009]. The increase in potentiallysoluble organic N that might be caused by forest harvestingdoes not necessarily lead to an increase in drainage DONlosses since significant portion of the potentially soluble or-ganic N could be retained in the solid phase, especiallywith soils that have high adsorption capacity [Qualls andHaines, 1991].
[40] All statistics (Tables 3 and 5) indicate that DRAIN-MOD-FOREST with the modified DRAINMOD-N IImodel predicted annual and monthly DON exports fromthe three sites were in good agreement with measured val-ues. Nevertheless, the model performed better for D1 sitethan for D2 and D3. This was partly because parameters ofthe DON module were obtained through model calibrationsconducted for D1 site. It may also indicate that the effectsof water management practices implemented at D2 and D3(Table 1) on annual DON losses are simply not fullydescribed by the model. DRAINMOD-FOREST consis-tently overpredicted annual DON losses from D2 and D3during controlled drainage by approximately 20%, while itunderpredicted annually DON losses from D3 site byapproximately 32% during the period of orifice weir treat-ment (Figure 7). Controlled drainage significantly reducedDON losses from D2 and D3 sites, while the orifice weirtreatment noticeably increased DON losses from D3 [Ama-tya et al., 1996., 2003]. Given the reasonable drainage pre-diction during the period under water managementpractices [Tian et al., 2012c], we postulate that these modelbias during water management periods could be caused bythe effects of water management practices on biogeochemi-cal processes in the drainage ditch. Water managementpractices changed hydraulic residence time of DON in the
Figure 6. Comparison between predicted and measuredmean monthly drainage and DON losses from the threestudy sites over the study period.
Figure 7. Comparison between predicted and measuredannual DON losses from three study sites over the studyperiod.
TIAN ET AL.: PREDICTING DISSOLVED ORGANIC NITROGEN EXPORT FROM FOREST
1961
drainage ditch and correspondingly altered DON associatedwith in-stream biogeochemical processes. It is known thatin-stream biogeochemical processes are critical in regulat-ing DON losses from forest ecosystems [Brookshire et al.,2005]. Ignoring in-stream biogeochemical alterationscaused by water management practices in this field scalemodel might accordingly introduce model bias as indicatedin Figures 4, 5, and 7.
4.5. Uncertainty and the Equifinality of DONPredictions
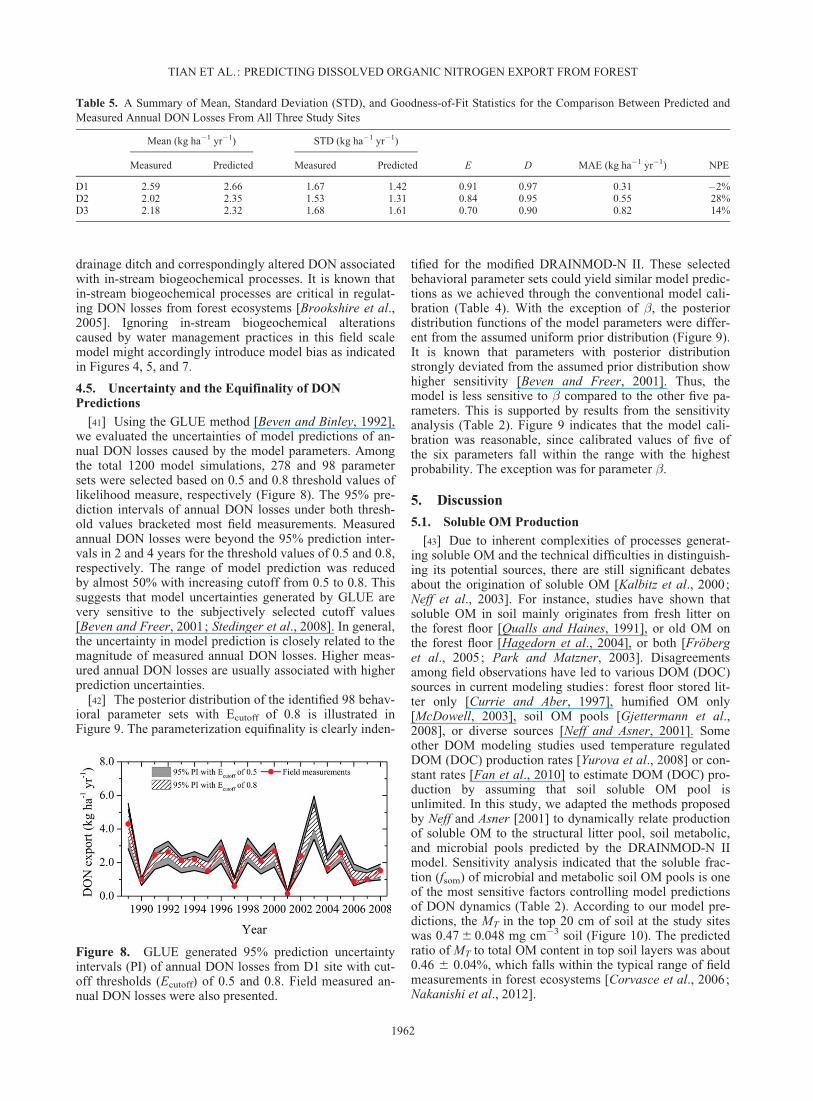
[41] Using the GLUE method [Beven and Binley, 1992],we evaluated the uncertainties of model predictions of an-nual DON losses caused by the model parameters. Amongthe total 1200 model simulations, 278 and 98 parametersets were selected based on 0.5 and 0.8 threshold values oflikelihood measure, respectively (Figure 8). The 95% pre-diction intervals of annual DON losses under both thresh-old values bracketed most field measurements. Measuredannual DON losses were beyond the 95% prediction inter-vals in 2 and 4 years for the threshold values of 0.5 and 0.8,respectively. The range of model prediction was reducedby almost 50% with increasing cutoff from 0.5 to 0.8. Thissuggests that model uncertainties generated by GLUE arevery sensitive to the subjectively selected cutoff values[Beven and Freer, 2001; Stedinger et al., 2008]. In general,the uncertainty in model prediction is closely related to themagnitude of measured annual DON losses. Higher meas-ured annual DON losses are usually associated with higherprediction uncertainties.
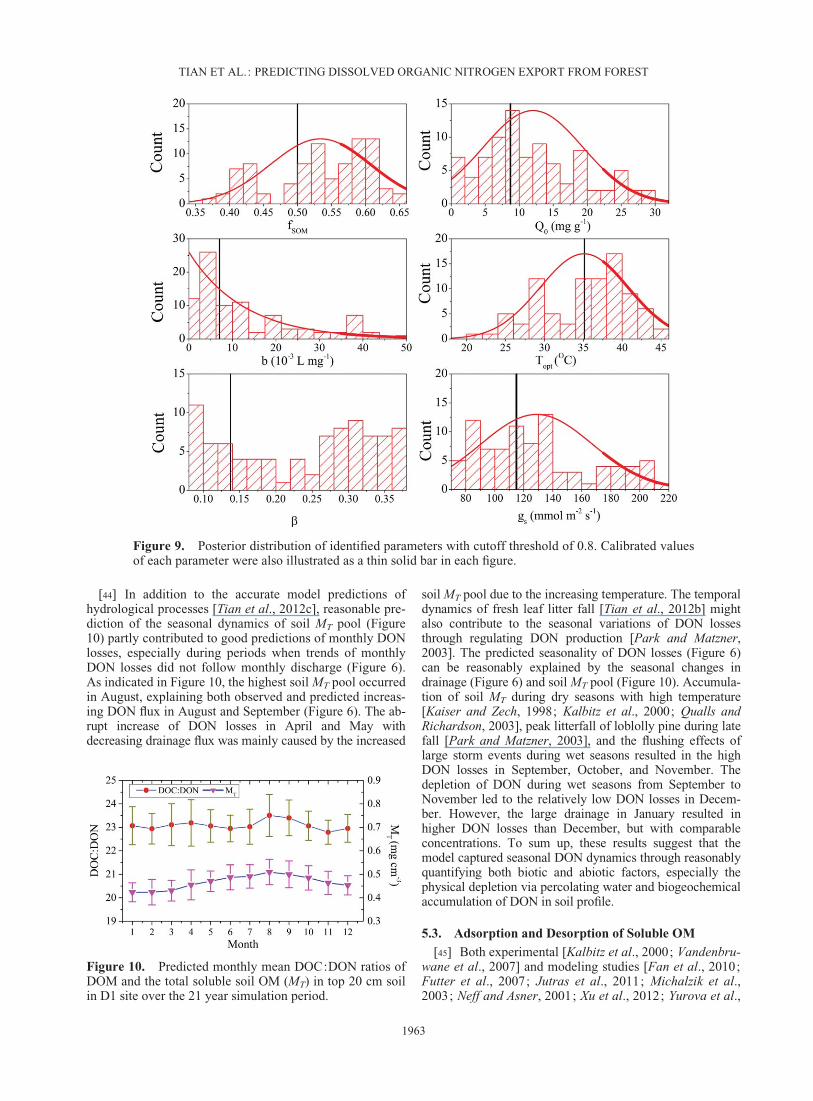
[42] The posterior distribution of the identified 98 behav-ioral parameter sets with Ecutoff of 0.8 is illustrated inFigure 9. The parameterization equifinality is clearly inden-
tified for the modified DRAINMOD-N II. These selectedbehavioral parameter sets could yield similar model predic-tions as we achieved through the conventional model cali-bration (Table 4). With the exception of �, the posteriordistribution functions of the model parameters were differ-ent from the assumed uniform prior distribution (Figure 9).It is known that parameters with posterior distributionstrongly deviated from the assumed prior distribution showhigher sensitivity [Beven and Freer, 2001]. Thus, themodel is less sensitive to � compared to the other five pa-rameters. This is supported by results from the sensitivityanalysis (Table 2). Figure 9 indicates that the model cali-bration was reasonable, since calibrated values of five ofthe six parameters fall within the range with the highestprobability. The exception was for parameter �.
5. Discussion
5.1. Soluble OM Production
[43] Due to inherent complexities of processes generat-ing soluble OM and the technical difficulties in distinguish-ing its potential sources, there are still significant debatesabout the origination of soluble OM [Kalbitz et al., 2000;Neff et al., 2003]. For instance, studies have shown thatsoluble OM in soil mainly originates from fresh litter onthe forest floor [Qualls and Haines, 1991], or old OM onthe forest floor [Hagedorn et al., 2004], or both [Fröberget al., 2005; Park and Matzner, 2003]. Disagreementsamong field observations have led to various DOM (DOC)sources in current modeling studies: forest floor stored lit-ter only [Currie and Aber, 1997], humified OM only[McDowell, 2003], soil OM pools [Gjettermann et al.,2008], or diverse sources [Neff and Asner, 2001]. Someother DOM modeling studies used temperature regulatedDOM (DOC) production rates [Yurova et al., 2008] or con-stant rates [Fan et al., 2010] to estimate DOM (DOC) pro-duction by assuming that soil soluble OM pool isunlimited. In this study, we adapted the methods proposedby Neff and Asner [2001] to dynamically relate productionof soluble OM to the structural litter pool, soil metabolic,and microbial pools predicted by the DRAINMOD-N IImodel. Sensitivity analysis indicated that the soluble frac-tion (fsom) of microbial and metabolic soil OM pools is oneof the most sensitive factors controlling model predictionsof DON dynamics (Table 2). According to our model pre-dictions, the MT in the top 20 cm of soil at the study siteswas 0.47 6 0.048 mg cm�3 soil (Figure 10). The predictedratio of MT to total OM content in top soil layers was about0.46 6 0.04%, which falls within the typical range of fieldmeasurements in forest ecosystems [Corvasce et al., 2006;Nakanishi et al., 2012].
Table 5. A Summary of Mean, Standard Deviation (STD), and Goodness-of-Fit Statistics for the Comparison Between Predicted andMeasured Annual DON Losses From All Three Study Sites
Mean (kg ha�1 yr�1) STD (kg ha�1 yr�1)
E D MAE (kg ha�1 yr�1) NPEMeasured Predicted Measured Predicted
D1 2.59 2.66 1.67 1.42 0.91 0.97 0.31 �2%D2 2.02 2.35 1.53 1.31 0.84 0.95 0.55 28%D3 2.18 2.32 1.68 1.61 0.70 0.90 0.82 14%
Figure 8. GLUE generated 95% prediction uncertaintyintervals (PI) of annual DON losses from D1 site with cut-off thresholds (Ecutoff) of 0.5 and 0.8. Field measured an-nual DON losses were also presented.
TIAN ET AL.: PREDICTING DISSOLVED ORGANIC NITROGEN EXPORT FROM FOREST
1962
[44] In addition to the accurate model predictions ofhydrological processes [Tian et al., 2012c], reasonable pre-diction of the seasonal dynamics of soil MT pool (Figure10) partly contributed to good predictions of monthly DONlosses, especially during periods when trends of monthlyDON losses did not follow monthly discharge (Figure 6).As indicated in Figure 10, the highest soil MT pool occurredin August, explaining both observed and predicted increas-ing DON flux in August and September (Figure 6). The ab-rupt increase of DON losses in April and May withdecreasing drainage flux was mainly caused by the increased
soil MT pool due to the increasing temperature. The temporaldynamics of fresh leaf litter fall [Tian et al., 2012b] mightalso contribute to the seasonal variations of DON lossesthrough regulating DON production [Park and Matzner,2003]. The predicted seasonality of DON losses (Figure 6)can be reasonably explained by the seasonal changes indrainage (Figure 6) and soil MT pool (Figure 10). Accumula-tion of soil MT during dry seasons with high temperature[Kaiser and Zech, 1998; Kalbitz et al., 2000; Qualls andRichardson, 2003], peak litterfall of loblolly pine during latefall [Park and Matzner, 2003], and the flushing effects oflarge storm events during wet seasons resulted in the highDON losses in September, October, and November. Thedepletion of DON during wet seasons from September toNovember led to the relatively low DON losses in Decem-ber. However, the large drainage in January resulted inhigher DON losses than December, but with comparableconcentrations. To sum up, these results suggest that themodel captured seasonal DON dynamics through reasonablyquantifying both biotic and abiotic factors, especially thephysical depletion via percolating water and biogeochemicalaccumulation of DON in soil profile.
5.3. Adsorption and Desorption of Soluble OM
[45] Both experimental [Kalbitz et al., 2000; Vandenbru-wane et al., 2007] and modeling studies [Fan et al., 2010;Futter et al., 2007; Jutras et al., 2011; Michalzik et al.,2003; Neff and Asner, 2001; Xu et al., 2012; Yurova et al.,
Figure 9. Posterior distribution of identified parameters with cutoff threshold of 0.8. Calibrated valuesof each parameter were also illustrated as a thin solid bar in each figure.
Figure 10. Predicted monthly mean DOC:DON ratios ofDOM and the total soluble soil OM (MT) in top 20 cm soilin D1 site over the 21 year simulation period.
TIAN ET AL.: PREDICTING DISSOLVED ORGANIC NITROGEN EXPORT FROM FOREST
1963

2008] concluded that physical adsorption and desorptionare dominant mechanisms controlling DOM dynamics insoil. Model simulation suggests that the ratio of dissolvedto total soluble soil OM storage ranges from 9% to 35% onan annual basis depending on the hydrological conditions,indicating that soil adsorption is a key mechanism con-straining hydrological losses of soil OM. This conclusionwas also supported by the results of the sensitivity analysis,summarized in Table 2.
[46] The utilization of the Langmuir isotherm in thisstudy has advantages over the commonly used initial massisotherm in simulating DOM dynamic in soils with highOM content, because the latter does not take into accountsoil adsorption capacity [Vandenbruwane et al., 2007].However, model uncertainties were introduced by theassumption that the equilibrium between soluble OM inaqueous and solid phases can be achieved instantaneously.Experimental studies have proved that sorption/desorptionprocesses of soluble OM in soil are more or less rate lim-ited [Chow et al., 2006; Kaiser and Zech, 1998; Thiho-deaux et al., 2004]. Several options are available for futuremodel improvement, such as the Elovich equation and thefractional-power model [Kaiser and Zech, 1998], simplelinear kinetic equation [Yurova et al., 2008] and the ‘‘twosites’’ method (One is rapid and another is rate limited)[Fan et al., 2010; Xu et al., 2012]. Nevertheless, none ofthese methods is absolutely superior to the other methodsand the choice of a sorption and desorption model dependson specific research objectives and the required accuracy[Travis and Etnier, 1981]. Additionally, soil chemicalproperties, such as soil pH, temperature, and iron oxidecontent, also have impacts on DOM adsorption and desorp-tion processes [Kalbitz et al., 2000]. Incorporating all thesefactors into process-based DOM models adds complexityto the model and remains a challenge [Fan et al., 2010;Yurova et al., 2008].
5.4. Correlations Between DON and DOC
[47] This study was built upon a fundamental assumptionthat biochemical and physical behaviors of DON and DOCin terrestrial ecosystems are subject to similar biotic andabiotic regulations [Neff et al., 2003]. This assumption issupported by observed strong positive relationshipsbetween DON and DOC concentrations in forest streams[Aitkenhead-Peterson et al., 2005; Goodale et al., 2000;Michalzik and Matzner, 1999] and their similar adsorptionand desorption behavior in soil [Kaiser and Zech, 1998;Kothawala and Moore, 2009]. Under this assumption,frameworks of existing DOC models [Fan et al., 2010;Neff and Asner, 2001; Yurova et al., 2008] were used topredict DON dynamics by tracking the C:N ratios from itsdiverse sources. Reasonable model predictions of DONlosses (Figure 4–7) indicated that methods of predictingDOC dynamics, with reasonable parameterization, can beutilized to predict DON losses from drained forest lands.This conclusion is of critical significance for providing amechanistic approach for simulating DON dynamics in ter-restrial ecosystems. However, this assumption has beenchallenged by some studies that found dissimilaritiesbetween soil DON and DOC dynamics. DON and DOCcould become decoupled along hydrologic flow paths[McDowell, 2003] because DON is slightly more mobile
than DOC in a forest soil profile [Kothawala and Moore,2009]. The higher mobility of DON was attributed to theexperimental findings revealing that hydrophilic fraction ofDOM contains more N whereas the hydrophobic fractionusually retains more C [Kaiser and Zech, 2000].
[48] However, due to the limited understanding of theobserved different behavior of DOC and DON in forestecosystems, simulating the bulk DOM transport, with vary-ing C:N ratio, is probably the current most feasible way tosimulate the DOC and DON dynamics. In this study, pre-dicted DOC:DON at the storm event scale usuallyincreased from as low as 15 to as high as 27 with the rise ofsoil water table and increasing drainage rates. This isbecause predicted DOC:DON of soil MT pool generallydecreased from as high as 75 for forest floor leachate toaround 10 in deep soil layers, which is comparable to fieldmeasurements from other forest ecosystems [Kaushal andLewis, 2003; Wu et al., 2010]. At the seasonal scale, pre-dicted mean monthly DOC:DON in drainage water wasabout 23.4 with a standard deviation of 0.8 (Figure 10).Highest DOC:DON in drainage typically occurred duringfall seasons after the dry summer, which is consistent withfindings from a Mediterranean stream [Bernal et al., 2005]and a glaciated forested watershed located in New YorkState, USA [Inamdar et al., 2008]. Simulated DOC:DONratios in this study low-gradient site fall into the lowerrange of values reported in the literature for upland forests[Campbell et al., 2000; Michalzik and Matzner, 1999; Per-akis and Hedin, 2007; Wu et al., 2010]. This is expectedbecause hydrological processes in upland forests are mainlycharacterized by lateral surface runoff that carrying largeamount of forest floor leachates with high DOC:DON[Kaushal and Lewis, 2003; Wu et al., 2010]. Model predic-tions suggested that hydrologic flow paths and their interac-tion with dynamics of DOM pools along the soil profile arefactors that regulates the temporal changes of DOC:DONin drainage. Intensive field testing with comprehensive fieldmeasurements of both DON and DOC dynamics would benecessary to validate the capability of the model for pre-dicting both DON and DOC dynamics in this forestecosystem.
6. Conclusion
[49] A DOM module was added to DRAINMOD-N IImodel to describe key mechanisms and processes regulat-ing DOM losses from forested lands. DOM productionrates were empirically linked with different OM compart-ments represented in DRAINMOD-NII. The Langmuir iso-therm was used to quantify the assumed instantaneousequilibrium between DOM in solid and aqueous phases.DOM transport with groundwater flow was simulated usingnumerical solutions to the ADR equation. DON concentra-tion was simulated through tracking the dynamic C:Nratios of various DOM sources. We presented results of afield test of the modified model, incorporated into theDRAINMOD-FOREST model, using 21 years of waterflow and DON loading data measured at the outlets of threeloblolly pine plantations in eastern North Carolina, USA.Results indicated the model reasonably reproduced DONexport during storm events, and annual and monthly DONlosses from three fields. In particular, the model captured
TIAN ET AL.: PREDICTING DISSOLVED ORGANIC NITROGEN EXPORT FROM FOREST
1964
the trends of monthly dynamics of DON during periods ei-ther following or diverging from the trends of monthlydrainage. Good model performance for predicting DONlosses was mainly attributed to reliable prediction of drain-age fluxes and reasonable quantification of abiotic and bi-otic controls of DON dynamics through soil profile. Inaddition, results of this study verified that physical factorsincluding hydrological processes, pathways, and sorption/desorption processes dominate DON leaching processes.Overall, this study verified that methods for predictingDOC dynamics in various landscapes could be utilized toquantify DON behaviors in terrestrial ecosystems.
[50] Acknowledgments. This work was supported in part by fundsprovided by the USDA Forest Service, Southern Research Station, andCenter for Forested Wetlands Research (federal grant 06-CA-11330 135–173) through funds provided by the National Council for Air & StreamImprovement (NCASI), Inc. Thanks to Weyerhaeuser Company for kindsupport in the form of land use and technical support.
ReferencesAgren, A., I. Buffam, K. Bishop, and H. Laudon (2010), Modeling stream
dissolved organic carbon concentrations during spring flood in the borealforest: A simple empirical approach for regional predictions, J. Geophys.Res., 115, G01012, doi:10.1029/2009JG001013.
Aitkenhead-Peterson, J. A., J. E. Alexander, and T. A. Clair (2005), Dis-solved organic carbon and dissolved organicnitrogen export from for-ested watersheds in Nova Scotia: Identifying controlling factors, Glob.Biogeochem. Cycles, 19, GB4016, doi:10.1029/2004GB002438.
Amatya, D. M., and R. W. Skaggs (2001), Hydrologic modeling of adrained pine plantation on poorly drained soils, Forest Science, 47(1),103–114.
Amatya, D. M., and R. W. Skaggs (2011), Long-term hydrology and waterquality of a drained pine plantation in North Carolina, Trans. ASABE,54(6), 2087–2098.
Amatya, D. M., R. W. Skaggs, and J. D. Gregory (1996), Effects of con-trolled drainage on the hydrology of drained pine plantations in the NorthCarolina coastal plain, J. Hydrol., 181(1-4), 211–232.
Amatya, D. M., J. W. Gilliam, R. W. Skaggs, M. E. Lebo, and R. G. Camp-bell (1998), Effects of controlled drainage on forest water quality, J. En-viron. Qual., 27(4), 923–935.
Amatya, D. M., R. W. Skaggs, J. W. Gilliam, and J. H. Hughes (2003),Effects of orifice-weir outlet on hydrology and water quality of a drainedforested watershed, South. J. Appl. For., 27(2), 130–142.
Asano, Y., J. E. Compton, and M. R. Church (2006), Hydrologic flowpathsinfluence inorganic and organic nutrient leaching in a forest soil, Biogeo-chemistry, 81(2), 191–204.
Aspinwall, M. J., J. S. King, S. E. McKeand, and J. C. Domec (2011), Leaf-level gas-exchange uniformity and photosynthetic capacity amongloblolly pine (Pinus taeda L.) genotypes of contrasting inherent geneticvariation, Tree Physiology, 31(1), 78–91.
Bechtold, I., S. Kohne, M. A. Youssef, B. Lennartz, and R. W. Skaggs(2007), Simulating nitrogen leaching and turnover in a subsurface-drained grassland receiving animal manure in Northern Germany usingDRAINMOD-N II, Agric. Water Manage., 93(1-2), 30–44.
Beltran, B. J., D. M. Amatya, M. Youssef, M. Jones, T. J. Callahan, R. W.Skaggs, and J. E. Nettles (2010a), Impacts of fertilization on water qual-ity of a drained pine plantation: A worst case scenario, J. Environ. Qual.,39(1), 293–303.
Beltran, B. J., D. M. Amatya, M. Youssef, M. Jones, T. J. Callahan, R. W.Skaggs, and J. E. Nettles (2010b), Impacts of fertilization on water qual-ity of a drained pine plantation: A worst case scenario (vol 39, pg 293,2010), J. Environ. Qual., 39(3), 1132–1132.
Berman, T., and D. A. Bronk (2003), Dissolved organic nitrogen: Adynamic participant in aquatic ecosystems, Aquat. Microb. Ecol., 31(3),279–305.
Bernal, S., A. Butturini, and F. Sabater (2005), Seasonal variations of dis-solved nitrogen and DOC:DON ratios in an intermittent Mediterraneanstream, Biogeochemistry, 75(2), 351–372.
Beven, K., and A. Binley (1992), The future of distributed models—Modelcalibration and uncertainty prediction, Hydrol. Process., 6(3), 279–298.
Beven, K., and J. Freer (2001), Equifinality, data assimilation, and uncer-tainty estimation in mechanistic modelling of complex environmentalsystems using the GLUE methodology, J. Hydrol., 249(1-4), 11–29.
Blasone, R. S., J. A. Vrugt, H. Madsen, D. Rosbjerg, B. A. Robinson, andG. A. Zyvoloski (2008), Generalized likelihood uncertainty estimation(GLUE) using adaptive Markov chain Monte Carlo sampling, Adv. WaterResour., 31(4), 630–648.
Brookshire, E. N. J., H. M. Valett, S. A. Thomas, and J. R. Webster (2005),Coupled cycling of dissolved organic nitrogen and carbon in a foreststream, Ecology, 86(9), 2487–2496.
Campbell, J. L., J. W. Hornbeck, W. H. McDowell, D. C. Buso, J. B. Shanley,and G. E. Likens (2000), Dissolved organic nitrogen budgets for upland,forested ecosystems in New England, Biogeochemistry, 49(2), 123–142.
Chen, C. R., and Z. H. Xu (2006), On the nature and ecological functions ofsoil soluble organic nitrogen (SON) in forest ecosystems, J. Soils Sedi-ments, 6(2), 63–66.
Chow, A. T., K. K. Tanji, S. D. Gao, and R. A. Dahlgren (2006), Tempera-ture, water content and wet-dry cycle effects on DOC production and car-bon mineralization in agricultural peat soils, Soil Biol. Biochem., 38(3),477–488.
Christou, M., E. J. Avramides, J. P. Roberts, and D. L. Jones (2005), Dis-solved organic nitrogen in contrasting agricultural ecosystems, Soil Biol.Biochem., 37(8), 1560–1563.
Cleveland, C. C., J. C. Neff, A. R. Townsend, and E. Hood (2004), Compo-sition, dynamics, and fate of leached dissolved organic matter in terres-trial ecosystems: Results from a decomposition experiment, Ecosystems,7(3), 275–285.
Cooper, R., V. Thoss, and H. Watson (2007), Factors influencing the releaseof dissolved organic carbon and dissolved forms of nitrogen from a smallupland headwater during autumn runoff events, Hydrol. Process., 21(5),622–633.
Corvasce, M., A. Zsolnay, V. D’Orazio, R. Lopez, and T. M. Miano (2006),Characterization of water extractable organic matter in a deep soil pro-file, Chemosphere, 62(10), 1583–1590.
Currie, W. S., and J. D. Aber (1997), Modeling leaching as a decompositionprocess in humid Montane forests, Ecology, 78(6), 1844–1860.
Currie, W. S., J. D. Aber, W. H. McDowell, R. D. Boone, and A. H. Magill(1996), Vertical transport of dissolved organic C and N under long-termN amendments in pine and hardwood forests, Biogeochemistry, 35(3),471–505.
David, M. B., S. J. Del Grosso, X. T. Hu, E. P. Marshall, G. F. McIsaac, W.J. Parton, C. Tonitto, and M. A. Youssef (2009), Modeling denitrificationin a tile-drained, corn and soybean agroecosystem of Illinois, USA, Bio-geochemistry, 93(1-2), 7–30.
Dittman, J. A., C. T. Driscoll, P. M. Groffman, and T. J. Fahey (2007), Dy-namics of nitrogen and dissolved organic carbon at the Hubbard BrookExperimental Forest, Ecology, 88(5), 1153–1166.
Domec, J. C., S. Palmroth, E. Ward, C. A. Maier, M. Therezien, and R.Oren (2009), Acclimation of leaf hydraulic conductance and stomatalconductance of Pinus taeda (loblolly pine) to long-term growth in ele-vated CO2 (free-air CO2 enrichment) and N-fertilization, Plant Cell andEnvironment, 32(11), 1500–1512.
Fan, Z. S., J. C. Neff, and K. P. Wickland (2010), Modeling the production,decomposition, and transport of dissolved organic carbon in boreal soils,Soil Sci., 175(5), 223–232.
Fröberg, M., D. B. Kleja, B. Bergkvist, E. Tipping, and J. Mulder (2005),Dissolved organic carbon leaching from a coniferous forest floor—Afield manipulation experiment, Biogeochemistry, 75(2), 271–287.
Futter, M. N., D. Butterfield, B. J. Cosby, P. J. Dillon, A. J. Wade, and P. G.Whitehead (2007), Modeling the mechanisms that control in-stream dis-solved organic carbon dynamics in upland and forested catchments,Water Resour. Res., 43, W02424, doi:10.1029/2006WR004960.
Gjettermann, B., M. Styczen, H. C. B. Hansen, F. P. Vinther, and S. Hansen(2008), Challenges in modelling dissolved organic matter dynamics inagricultural soil using DAISY, Soil Biol. Biochem., 40(6), 1506–1518.
Goodale, C. L., J. D. Aber, and W. H. McDowell (2000), The long-termeffects of disturbance on organic and inorganic nitrogen export in theWhite Mountains, New Hampshire, Ecosystems, 3(5), 433–450.
Gonzalez-Benecke, C. A., T. A. Martin, A. Clark, and G. F. Peter (2010),Water availability and genetic effects on wood properties of loblolly pine(Pinus taeda), Canadian Journal of Forest Research-Revue CanadienneDe Recherche Forestiere, 40(12), 2265–2277.
Green, T. H., R. J. Mitchell, and D. H. Gjerstad (1994), Effects of Nitrogenon the Response of Loblolly-Pine to Drought .2. Biomass Allocation andC-N.
TIAN ET AL.: PREDICTING DISSOLVED ORGANIC NITROGEN EXPORT FROM FOREST
1965
Guggenberger, G., and K. Kaiser (2003), Dissolved organic matter in soil:Challenging the paradigm of sorptive preservation, Geoderma, 113(3-4),293–310.
Hagedorn, F., M. Saurer, and P. Blaser (2004), A C-13 tracer study to iden-tify the origin of dissolved organic carbon in forested mineral soils, Eur.J. Soil Sci., 55(1), 91–100.
Hood, E. W., M. W. Williams, and N. Caine (2003), Landscape controls onorganic and inorganic nitrogen leaching across an alpine/subalpine ecotone,Green Lakes Valley, Colorado Front Range, Ecosystems, 6(1), 31–45.
Iman, R. L., J. C. Helton, and J. E. Campbell (1981), An approach to sensitiv-ity analysis of computer-models .1. Introduction, input variable selectionand preliminary variable assessment, J. Qual. Technol., 13(3), 174–183.
Inamdar, S., and M. J. Mitchell (2007), Storm event exports of dissolved or-ganic nitrogen (DON) across multiple catchments in a glaciated forestedwatershed, J. Geophys. Res. Biogeosci., 112, G02014, doi:10.1029/2006JG000309.
Inamdar, S., J. Rupp, and M. Mitchell (2008), Differences in dissolved or-ganic carbon and nitrogen responses to storm-event and ground-waterconditions in a forested, glaciated watershed in Western New York, J.Am. Water Resour. Assoc., 44(6), 1458–1473.
Jardine, P. M., M. A. Mayes, P. J. Mulholland, P. J. Hanson, J. R. Tarver,R. J. Luxmoore, J. F. McCarthy, and G. V. Wilson (2006), Vadose zoneflow and transport of dissolved organic carbon at multiple scales inhumid regimes, Vadose Zone J., 5(1), 140–152.
Jones, D. L., D. Shannon, D. V. Murphy, and J. Farrar (2004), Role of dis-solved organic nitrogen (DON) in soil N cycling in grassland soils, SoilBiol. Biochem., 36(5), 749–756.
Jones, D. L., L. T. Hughes, D. V. Murphy, and J. R. Healey (2008), Dis-solved organic carbon and nitrogen dynamics in temperate coniferousforest plantations, Eur. J. Soil Sci., 59(6), 1038–1048.
Jutras, M. F., et al. (2011), Dissolved organic carbon concentrations andfluxes in forest catchments and streams: DOC-3 model, Ecol. Modell.,222(14), 2291–2313.
Kaiser, K., and W. Zech (1998), Rates of dissolved organic matter releaseand sorption in forest soils, Soil Sci., 163(9), 714–725.
Kaiser, K., and G. Guggenberger (2000), The role of DOM sorption to min-eral surfaces in the preservation of organic matter in soils, Org. Geo-chem., 31(7-8), 711–725.
Kaiser, K., and W. Zech (2000), Sorption of dissolved organic nitrogen byacid subsoil horizons and individual mineral phases, Eur. J. Soil Sci.,51(3), 403–411.
Kalbitz, K., and K. Kaiser (2008), Contribution of dissolved organic matterto carbon storage in forest mineral soils, J. Plant Nutrit. Soil Sci., 171(1),52–60.
Kalbitz, K., S. Solinger, J. H. Park, B. Michalzik, and E. Matzner (2000),Controls on the dynamics of dissolved organic matter in soils: A review,Soil Sci., 165(4), 277–304.
Kalbitz, K., B. Glaser, and R. Bol (2004), Clear-cutting of a Norway sprucestand: Implications for controls on the dynamics of dissolved organicmatter in the forest floor, Eur. J. Soil Sci., 55(2), 401–413.
Kaushal, S. S., and W. M. Lewis (2003), Patterns in the chemical fractiona-tion of organic nitrogen in Rocky Mountain streams, Ecosystems, 6(5),483–492.
Korsaeth, A., L. R. Bakken, and H. Riley (2003), Nitrogen dynamics ofgrass as affected by N input regimes, soil texture and climate: Lysimetermeasurements and simulations, Nutrient Cycling Agroecosyst., 66(2),181–199.
Kothawala, D. N., and T. R. Moore (2009), Adsorption of dissolved nitro-gen by forest mineral soils, Canad. J. For. Res., 39(12), 2381–2390.
Kothawala, D. N., T. R. Moore, and W. H. Hendershot (2008), Adsorptionof dissolved organic carbon to mineral soils : A comparison of four iso-therm approaches, Geoderma, 148(1), 43–50.
Landsberg, J. J., and R. H. Waring (1997), A generalised model of forestproductivity using simplified concepts of radiation-use efficiency, carbonbalance and partitioning, Forest Ecol. Manage., 95(3), 209–228.
Laudon, H., J. Hedtjarn, J. Schelker, K. Bishop, R. Sorensen, and A. Agren(2009), Response of dissolved organic carbon following forest harvestingin a boreal forest, Ambio, 38(7), 381–386.
Legates, D. R., and G. J. McCabe (1999), Evaluating the use of ‘‘goodness-of-fit’’ measures in hydrologic and hydroclimatic model validation,Water Resour. Res., 35(1), 233–241.
Luo, W., G. R. Sands, M. Youssef, J. S. Strock, I. Song, and D. Canelon(2010), Modeling the impact of alternative drainage practices in thenorthern corn-belt with DRAINMOD-NII, Agric. Water Manage., 97(3),389–398.
McDowell, W. H. (2003), Dissolved organic matter in soils—Future direc-tions and unanswered questions, Geoderma, 113(3-4), 179–186.
Michalzik, B., and E. Matzner (1999), Dynamics of dissolved organic nitro-gen and carbon in a Central European Norway spruce ecosystem, Eur. J.Soil Sci., 50(4), 579–590.
Michalzik, B., K. Kalbitz, J. H. Park, S. Solinger, and E. Matzner(2001), Fluxes and concentrations of dissolved organic carbon andnitrogen—A synthesis for temperate forests, Biogeochemistry, 52(2),173–205.
Michalzik, B., E. Tipping, J. Mulder, J. F. G. Lancho, E. Matzner, C. L.Bryant, N. Clarke, S. Lofts, and M. A. V. Esteban (2003), Modelling theproduction and transport of dissolved organic carbon in forest soils, Bio-geochemistry, 66(3), 241–264.
Montanari, A., C. A. Shoemaker, and N. van de Giesen (2009), Introductionto special section on Uncertainty Assessment in Surface and SubsurfaceHydrology: An overview of issues and challenges, Water Resour.Res., 45, W00B00, doi:10.1029/2009WR008471.
Murphy, D. V., A. J. Macdonald, E. A. Stockdale, K. W. T. Goulding,S. Fortune, J. L. Gaunt, P. R. Poulton, J. A. Wakefield, C. P. Webster,and W. S. Wilmer (2000), Soluble organic nitrogen in agricultural soils,Biol. Fertil. Soils, 30(5-6), 374–387.
Nakanishi, T., M. Atarashi-Andoh, J. Koarashi, Y. Saito-Kokubu, andK. Hirai (2012), Carbon isotopes of water-extractable organic carbon in adepth profile of forest soil imply a dynamic relationship with soil carbon,Eur. J. Soil Sci., 63(4), 495–500.
Neff, J. C., and G. P. Asner (2001), Dissolved organic carbon in terrestrialecosystems: Synthesis and a model, Ecosystems, 4(1), 29–48.
Neff, J. C., F. S. Chapin, and P. M. Vitousek (2003), Breaks in the cycle:Dissolved organic nitrogen in terrestrial ecosystems, Front. Ecol. Envi-ron., 1(4), 205–211.
Park, J. H., and E. Matzner (2003), Controls on the release of dissolved or-ganic carbon and nitrogen from a deciduous forest floor investigated bymanipulations of aboveground litter inputs and water flux, Biogeochem-istry, 66(3), 265–286.
Parton, W. J., et al. (1993), Observations and modeling of biomass and soilorganic-matter dynamics for the grassland biome worldwide, Glob. Bio-geochem. Cycles, 7(4), 785–809.
Pellerin, B. A., W. M. Wollheim, C. S. Hopkinson, W. H. McDowell, M. R.Williams, C. J. Vorosmarty, and M. L. Daley (2004), Role of wetlandsand developed land use on dissolved organic nitrogen concentrations andDON/TDN in northeastern US rivers and streams, Limnol. Oceanogr.,49(4), 910–918.
Perakis, S. S., and L. O. Hedin (2002), Nitrogen loss from unpolluted SouthAmerican forests mainly via dissolved organic compounds (vol 415, pg416, 2002), Nature, 418(6898), 665–665.
Perakis, S. S., and L. O. Hedin (2007), State factor relationships of dissolvedorganic carbon and nitrogen losses from unpolluted temperate forestwatersheds, J. Geophys. Res., 112, G02010, doi:10.1029/2006JG000276.
Qualls, R. G. (2000), Comparison of the behavior of soluble organic and inor-ganic nutrients in forest soils, Forest Ecol. Manage., 138(1-3), 29–50.
Qualls, R. G., and B. L. Haines (1991), Fluxes of dissolved organic nutrientsand humic substances in a deciduous forest, Ecology, 72(1), 254–266.
Qualls, R. G., and C. J. Richardson (2003), Factors controlling concentra-tion, export, and decomposition of dissolved organic nutrients in theEverglades of Florida, Biogeochemistry, 62(2), 197–229.
Saad, O., and R. Conrad (1993), Temperature-Dependence of Nitrification,Denitrification, and Turnover of Nitric-Oxide in Different Soils, Biologyand Fertility of Soils, 15, 21–27, doi:10.1007/Bf00336283.
Salazar, O., I. Wesstrom, M. A. Youssef, R. W. Skaggs, and A. Joel (2009),Evaluation of the DRAINMOD-N II model for predicting nitrogen lossesin a loamy sand under cultivation in south-east Sweden, Agric. WaterManage., 96(2), 267–281.
Saltelli, A., S. Tarantola, and F. Campolongo (2000), Sensitivity analysis asan ingredient of modeling, Stat. Sci., 15(4), 377–395.
Seitzinger, S. P., and R. W. Sanders (1997), Contribution of dissolved or-ganic nitrogen from rivers to estuarine eutrophication, Mar. Ecol.-Progr.Ser., 159, 1–12.
Skaggs, R. W. (1978), A water management model for shallow water tablesoils. Technical report No. 134 of the Water Resources Research Institute ofthe University of North Carolina, NC State University, Raleigh, NC, USA.
Skaggs, R. W., and J. Van Schilfgaarde (1999), Drainage simulation models.,In: Skaggs, R.W., van Schilfgaarde, J. (Eds.), Agricultural Drainage:Monograph No. 38. Am. Soc. of Agronomy, Madison, WI, pp. 469–500.
Skaggs, R. W., M. A. Youssef, and G. M. Chescheir (2012), Drainmod:Model use, calibration, and validation, Trans. ASABE, 55(4), 1509–1522.
TIAN ET AL.: PREDICTING DISSOLVED ORGANIC NITROGEN EXPORT FROM FOREST
1966
Solinger, S., K. Kalbitz, and E. Matzner (2001), Controls on the dynamicsof dissolved organic carbon and nitrogen in a Central European decidu-ous forest, Biogeochemistry, 55(3), 327–349.
Stedinger, J. R., R. M. Vogel, S. U. Lee, and R. Batchelder (2008), Appraisalof the generalized likelihood uncertainty estimation (GLUE) method,Water Resour. Res., 44, W00B06, doi:10.1029/2008WR006822.
Thihodeaux, L., L. Aguilar, T. Anderson, M. Kavanaugh, and A. Flores(2004), Kinetics of peat soil dissolved organic carbon release to surfacewater: A chemodynamic process model., Abstr. Pap. Am. Chem. Soc.,228, U632–U632.
Thorp, K. R., M. A. Youssef, D. B. Jaynes, R. W. Malone, and L. Ma(2009), Drainmod-N Ii : Evaluated for an agricultural system in Iowa andcompared to Rzwqm-Dssat, Trans. ASABE, 52(5), 1557–1573.
Tian, S. Y. (2011), Development and field-testing of the DRAINMOD-FOR-EST model for predicting water, soil carbon and nitrogen dynamics, andplant growth in drained forests, xvi, 291 pp., North Carolina State Univ.,Raleigh, N. C.
Tian, S. Y., M. A. Youssef, R. W. Skaggs, D. M. Amatya, and G. M. Che-scheir (2012a), Temporal variations and controlling factors of nitrogenexport from an artificially drained coastal forest, Environ. Sci. Technol.,46(18), 9956–9963.
Tian, S. Y., M. A. Youssef, R. W. Skaggs, D. M. Amatya, and G. M. Che-scheir (2012b), DRAINMOD-FOREST: Integrated modeling of hydrol-ogy, soil carbon and nitrogen dynamics, and plant growth for drainedforests, J. Environ. Qual., 41(3), 764–782.
Tian, S. Y., M. A. Youssef, R. W. Skaggs, D. M. Amatya, and G. M. Che-scheir (2012c), Modeling water, carbon, and nitrogen dynamics for twodrained pine plantations under intensive management practices, ForestEcol. Manage., 264, 20–36.
Travis, C. C., and E. L. Etnier (1981), A survey of sorption relationships forreactive solutes in soil, J. Environ. Qual., 10(1), 8–17.
Uselman, S. M., R. G. Qualls, and J. Lilienfein (2007), Contribution of rootvs. leaf litter to dissolved organic carbon leaching through soil, Soil Sci.Soc. Am. J., 71(5), 1555–1563.
van Kessel, C., T. Clough, and J. W. van Groenigen (2009), Dissolved or-ganic nitrogen: An overlooked pathway of nitrogen loss from agricul-tural systems?, J. Environ. Qual., 38(2), 393–401.
Vandenbruwane, J., S. De Neve, R. G. Qualls, S. Sleutel, and G. Hofman(2007), Comparison of different isotherm models for dissolved organiccarbon (DOC) and nitrogen (DON) sorption to mineral soil, Geoderma,139(1-2), 144–153.
Vrugt, J. A., C. J. F. ter Braak, H. V. Gupta, and B. A. Robinson (2009),Equifinality of formal (DREAM) and informal (GLUE) Bayesianapproaches in hydrologic modeling?, Stochastic Environ. Res. RiskAssess., 23(7), 1011–1026.
Wu, Y. J., N. Clarke, and J. Mulder (2010), Dissolved organic nitrogen con-centrations and ratios of dissolved organic carbon to dissolved organicnitrogen in throughfall and soil waters in Norway spruce and Scots pineforest stands throughout Norway, Water Air Soil Pollut., 210(1-4), 171–186.
Xu, N., and J. E. Saiers (2010), Temperature and hydrologic controls on dis-solved organic matter mobilization and transport within a forest topsoil,Environ. Sci. Technol., 44(14), 5423–5429.
Xu, N., J. E. Saiers, H. F. Wilson, and P. A. Raymond (2012), Simulatingstreamflow and dissolved organic matter export from a forested water-shed, Water Resour. Res., 48, W05519, doi:10.1029/2011WR011423.
Youssef, M. A., R. W. Skaggs, G. M. Chescheir, and J. W. Gilliam (2005),The nitrogen simulation model, DRAINMOD-N II, Trans. ASAE, 48(2),611–626.
Youssef, M. A., R. W. Skaggs, G. M. Chescheir, and J. W. Gilliam (2006),Field evaluation of a model for predicting nitrogen losses from drainedlands, J. Environ. Qual., 35(6), 2026–2042.
Yurova, A., A. Sirin, I. Buffam, K. Bishop, and H. Laudon (2008), Model-ing the dissolved organic carbon output from a boreal mire using the con-vection-dispersion equation: Importance of representing sorption, WaterResour. Res., 44, W07411, doi:10.1029/2007WR006523.
Zheng, C., and G. D. Bennett (2002), Applied Contaminant Transport Mod-eling, 2nd ed., 621 pp., Wiley-Interscience, New York.
TIAN ET AL.: PREDICTING DISSOLVED ORGANIC NITROGEN EXPORT FROM FOREST
1967
Related Documents