SANDIA REPORT SAND2004-8105 Unlimited Release Printed November 2004 Precision Volume Measurement System E.E. Fischer and A.D. Shugard Prepared by Sandia National Laboratories Albuquerque, New Mexico 87185 and Livermore, California 94550 Sandia is a multiprogram laboratory operated by Sandia Corporation, a Lockheed Martin Company, for the United States Department of Energy’s National Nuclear Security Administration under Contract DE-AC04-94AL85000. Approved for public release; further dissemination unlimited.

Welcome message from author
This document is posted to help you gain knowledge. Please leave a comment to let me know what you think about it! Share it to your friends and learn new things together.
Transcript
SANDIA REPORT
SAND2004-8105 Unlimited Release Printed November 2004 Precision Volume Measurement System
E.E. Fischer and A.D. Shugard
Prepared by Sandia National Laboratories Albuquerque, New Mexico 87185 and Livermore, California 94550 Sandia is a multiprogram laboratory operated by Sandia Corporation, a Lockheed Martin Company, for the United States Department of Energy’s National Nuclear Security Administration under Contract DE-AC04-94AL85000. Approved for public release; further dissemination unlimited.

Issued by Sandia National Laboratories, operated for the United States Department of Energy by Sandia Corporation.
NOTICE: This report was prepared as an account of work sponsored by an agency of the United States Government. Neither the United States Government, nor any agency thereof, nor any of their employees, nor any of their contractors, subcontractors, or their employees, make any warranty, express or implied, or assume any legal liability or responsibility for the accuracy, completeness, or usefulness of any information, apparatus, product, or process disclosed, or represent that its use would not infringe privately owned rights. Reference herein to any specific commercial product, process, or service by trade name, trademark, manufacturer, or otherwise, does not necessarily constitute or imply its endorsement, recommendation, or favoring by the United States Government, any agency thereof, or any of their contractors or subcontractors. The views and opinions expressed herein do not necessarily state or reflect those of the United States Government, any agency thereof, or any of their contractors. Printed in the United States of America. This report has been reproduced directly from the best available copy. Available to DOE and DOE contractors from
U.S. Department of Energy Office of Scientific and Technical Information P.O. Box 62 Oak Ridge, TN 37831 Telephone: (865)576-8401 Facsimile: (865)576-5728 E-Mail: [email protected] Online ordering: http://www.osti.gov/bridge
Available to the public from
U.S. Department of Commerce National Technical Information Service 5285 Port Royal Rd Springfield, VA 22161 Telephone: (800)553-6847 Facsimile: (703)605-6900 E-Mail: [email protected] Online order: http://www.ntis.gov/help/ordermethods.asp?loc=7-4-0#online
2
1.
I .
LIBRARY DOCUMENT SAND2004-8 1 OS DO NOT DESTROY
I T UNLIMITED RELEASE
PRECISION VOLUME MEASUREMENT SYSTEM
E. E. Fischer A. D. Shugard
Gas Transfer Systems Sandia National Laboratories, Livermore
Abstract A new precision volume measurement system based on a Kansas City Plant (KCP) design was built to support the volume measurement needs of the Gas Transfer Systems (GTS) department at Sandia National Labs (SNL) in California. An engineering study was undertaken to verify or refute KCP’s claims of 0.5% accuracy. The study assesses the accuracy and precision of the sys- tem. The system uses the ideal gas law and precise pressure measurements (of low-pressure helium) in a temperature and computer controlled environment to ratio a known volume to an unknown volume.
3

Acknowledgment c s q L 4 "A"'
$ 3 ' rll .. The author gratefully acknowledges the designer and builder of the PVMS in California, Andrew Shugard. Also, Lyle Cain from KCP the designer of the original system, which this PVMS was based on. ..
..
4
Contents .. 1 Project Background
1.1 Motivation 1.2 System Features 1.3 Summary of how it works
2.1 Non-canceled tubing calculation 2.2 Theoretical Prediction Based on Error Propagation 2.3 Test Plan & System Performance
. *
2 Characterizing the Accuracy and Precision
3 Summary Appendix: Accuracy and Precision Data 4 References
Figures Front View of PVMS. ~~~~ ~~ ~~~ ~~- Side View of PVMS. Diamm of PVMS from L. J. Cain. Close up View of Actual PVMS. Chart of Predicted Accuracy% as a Function of Volume Ratio. Measured Precision & Accuracy vs. UUT Volume Range. Measured Accuracy & Precision vs. Volume Ratio. Measured and Predicted Accuracy vs. Volume Ratio. Measured and Predicted Precision vs. Volume Ratio.
Tables Reference Volume Values Final Accuracy & Precision of PVMS
Page 7 7 7 9 13 13 14 16 21 23 25
8 8 9 10 15 ~~
16 17 18 19
13 21
Abbreviations cc or cm3 GTS KCP PVMS REF UUT
cubic centimeter Gas Transfer Systems Department Kansas City Plant Precision Volume Measurement System Reference Volume Unit Under Test

This page intentionally left blank.
..
6
1 Project Background
1 .I Motivation
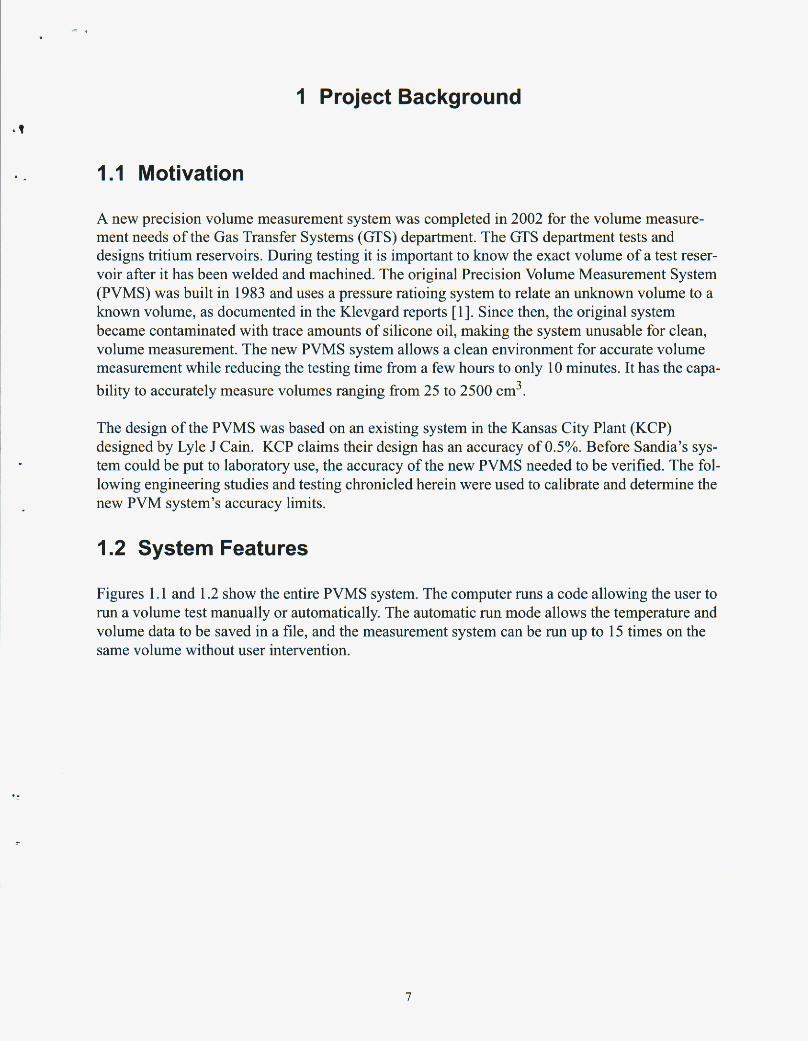
A new precision volume measurement system was completed in 2002 for the volume measure- ment needs of the Gas Transfer Systems (GTS) department. The GTS department tests and designs tritium reservoirs. During testing it is important to know the exact volume of a test reser- voir after it has been welded and machined. The original Precision Volume Measurement System (PVMS) was built in 1983 and uses a pressure ratioing system to relate an unknown volume to a known volume, as documented in the Klevgard reports [l]. Since then, the original system became contaminated with trace amounts of silicone oil, making the system unusable for clean, volume measurement. The new PVMS system allows a clean environment for accurate volume measurement while reducing the testing time from a few hours to only 10 minutes. It has the capa- bility to accurately measure volumes ranging from 25 to 2500 cm3.
The design of the PVMS was based on an existing system in the Kansas City Plant (KCP) designed by Lyle J Cain. KCP claims their design has an accuracy of 0.5%. Before Sandia’s sys- tem could be put to laboratory use, the accuracy of the new PVMS needed to be verified. The fol- lowing engineering studies and testing chronicled herein were used to calibrate and determine the new PVM system’s accuracy limits.
1.2 System Features
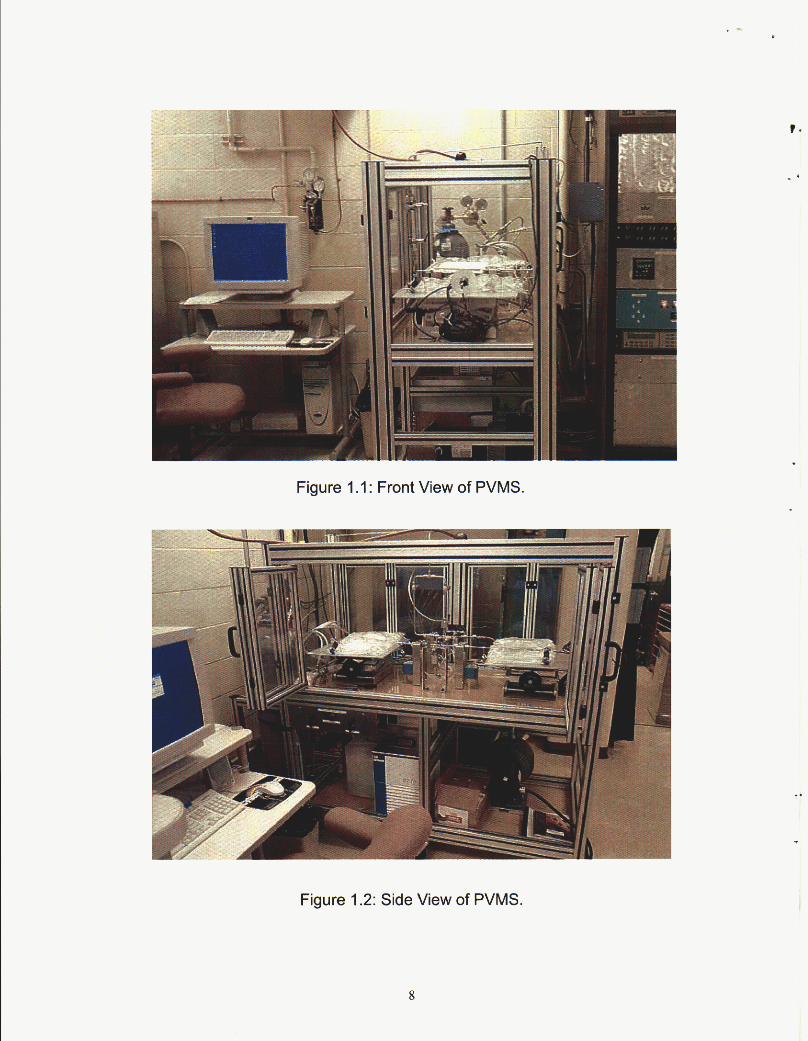
Figures 1.1 and 1.2 show the entire PVMS system. The computer runs a code allowing the user to run a volume test manually or automatically. The automatic run mode allows the temperature and volume data to be saved in a file, and the measurement system can be run up to 15 times on the same volume without user intervention.
7
I 1. . i ,, ,, ,, , . .
Figure 1.1: Front View of PVMS.
Figure 1.2: Side View of PVMS.

1.3 Operation Summary .*
The new PVMS uses a pressure ratioing system to determine the volume of a vessel. This is the same method used in the old PVMS documented by Klevgard, and it is based on the ideal gas . _ law.
P V = nRT Ideal Gas Relation (1-1)
In this relation P is pressure, V is volume, n is the number of moles, R is the ideal gas constant and T is the temperature. When using an ideal gas and holding temperature constant in a closed system, Boyle’s Law can be used to relate a known volume, Vlm, to an unknown volume, VU&.
P, . V,, = Punk. Vunk = Const Boyle’s Law (1-2)
The relation to determine Vunk becomes:
Basic Unknown Volume Equation (1-3) - P.tn Vunk - v ’ - kn ‘unk
The PVMS uses a ratioing system similar to this to determine the volume of the unknown vessel. Although the system is based on first principles, it is slightly more complicated than the ideal sce- nario. Figure 1.3 shows the diagram of the PVM system and Figure 1.4 shows the corresponding view of the actual hardware.
Figure 1.3: Diagram of PVMS from L. J. Cain [2].
9

t .
Figure 1.4: Close up View of Actual PVMS.
In order to meet the assumptions made in Boyle’s law, low pressure Helium, 30 psia, is used as the “ideal” working gas. It is also important to keep the temperatures of the unknown volume and the known volume constant, respectively UUT (Unit Under Test) and REFERENCE VOLUME in the diagram. The solution developed by KCP and implemented in this system is to envelope the two volumes with “water jackets.” Water circulates through the water jackets from a temperature controlled circulator. Thermistors are placed on the outside surface of the reservoirs and their out- puts are connected to the computer controls through a serial port. The measurement system will not run unless the temperature difference between the two volumes is less than 0.5 degrees C.
Also, pressure transducers are connected at the inlets of both volumes to verify that the system has stabilized. When the difference in pressure between subsequent readings of each individual vol- ume is less than 0.0002 psi, the system is considered stabilized. This is based on the ideal gas assumption that, with a constant volume, pressure and temperature are directly proportional, so an increase in pressure would also mean an increase in temperature. When pressure stabilizes, in turn, so does the temperature.
10
. t
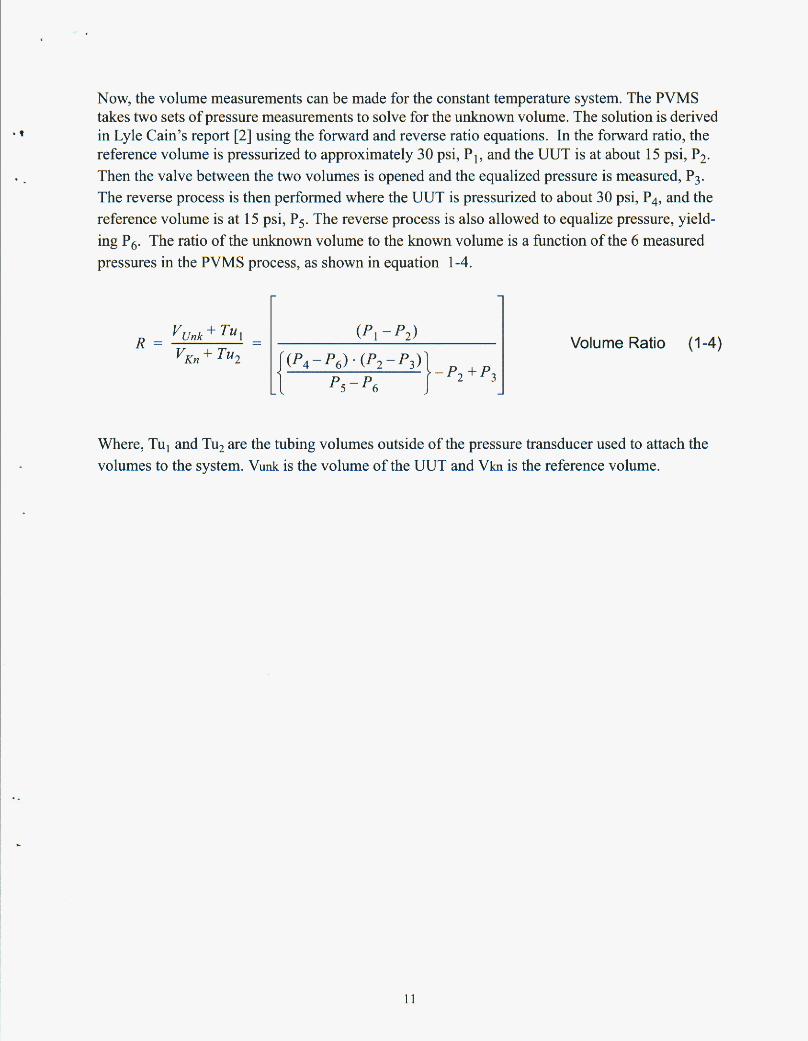
Now, the volume measurements can be made for the constant temperature system. The PVMS takes two sets ofpressure measurements to solve for the unknown volume. The solution is derived in Lyle Cain’s report [2] using the forward and reverse ratio equations. In the forward ratio, the reference volume is pressurized to approximately 30 psi, PI, and the UUT is at about 15 psi, P2. Then the valve between the two volumes is opened and the equalized pressure is measured, P3. The reverse process is then performed where the UUT is pressurized to about 30 psi, P,, and the reference volume is at 15 psi, P,. The reverse process is also allowed to equalize pressure, yield- ing P,. The ratio of the unknown volume to the known volume is a function of the 6 measured pressures in the PVMS process, as shown in equation 1-4.
Where, Tu, and Tu, are the tubing volumes outside of the pressure transducer used to attach the volumes to the system. Vunk is the volume of the UUT and Vkn is the reference volume.
11

This page intentionally left blank.

2 Characterizing the Accuracy and Precision
SHUGARD25-2
SHUGARDSO-1
In order to determine the accuracy and precision of the system, 10 reference volumes were gravi- metricly measured in KCP and used to compare the PVMS measurements. The reference vol- umes consist of sets of 2 independent: 25,50,75, 150, and 2500 cc volumes. Table 2.1 has the list of the reference volumes. All volumes have an accuracy of fO. 1 %.
25.740
51.062
Table 2.1 : Reference Volumes
SHUGARD75-1
SHUGARD75-2
I SerialNumber 1 Volume(cm3) I
76.737
76.910
SHUGARD25-1 I 25.756 I
I SHUGARDSO-2 I 50.895 I
SHUGARDl50-1 149.112
SHUGARD2500-1 2695.2
I SHUGARD2500-2 I 2693.4 I 2.1 Non-canceled tubing calculation
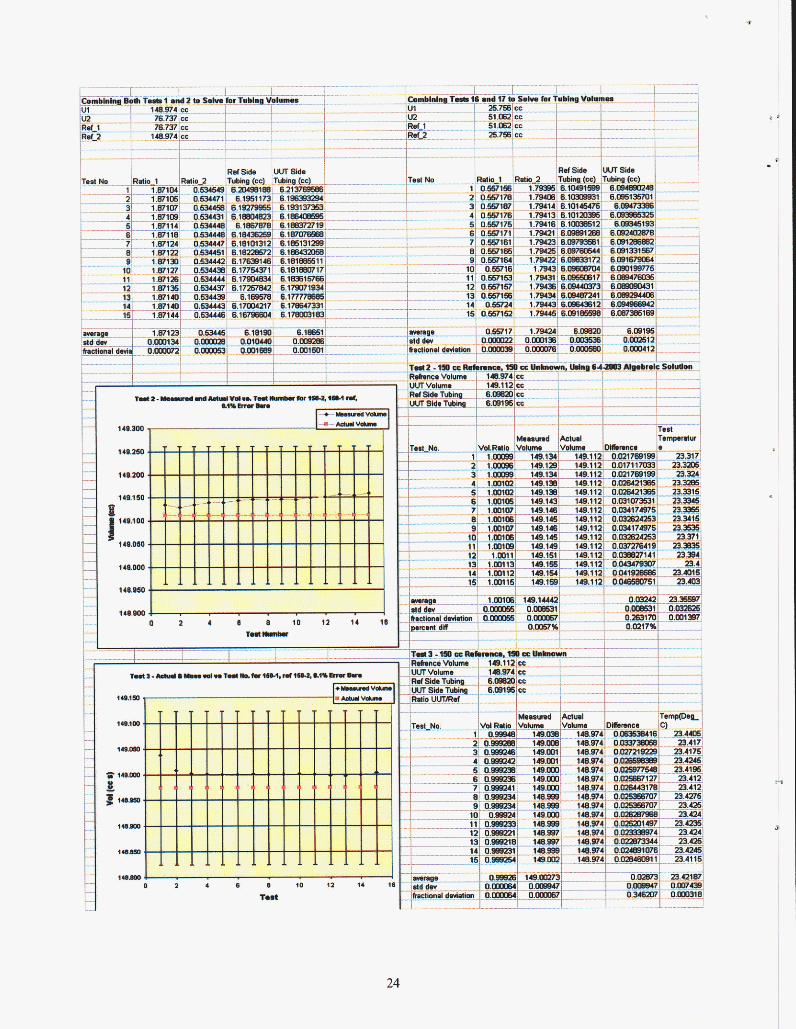
Before determining the performance of the PVMS, the tubing that connects the volumes to the PVMS had to be calculated. The tubing is located on each side of the PVMS, just outside of the pressure transducers and its volume is not factored out in the volume ratio calculation, 1-4. This tubing is used as a transition to attach the reference and unknown volumes to the system. In order to determine the tubing value, two volumes of different size were placed on each end of the PVMS. The 25-1 and the 50-1 reference volumes were used for the tubing calculation. Volumes of different sizes were chosen avoid dividing by a number close to zero in the tubing equation, equation 2-3. It was also important to use the smallest volumes, because the absolute volumetric uncertainty of the reference volumes is a percentage of the size of the volume, so a variance in a reading for a small volume will be a smaller absolute volume error than the percentage of a larger volume.
To solve for the tubing values, the basic definition of the volume ratio was used. The PVMS solves for the volume ratio of the unknown volume to the reference volume plus their respective
13
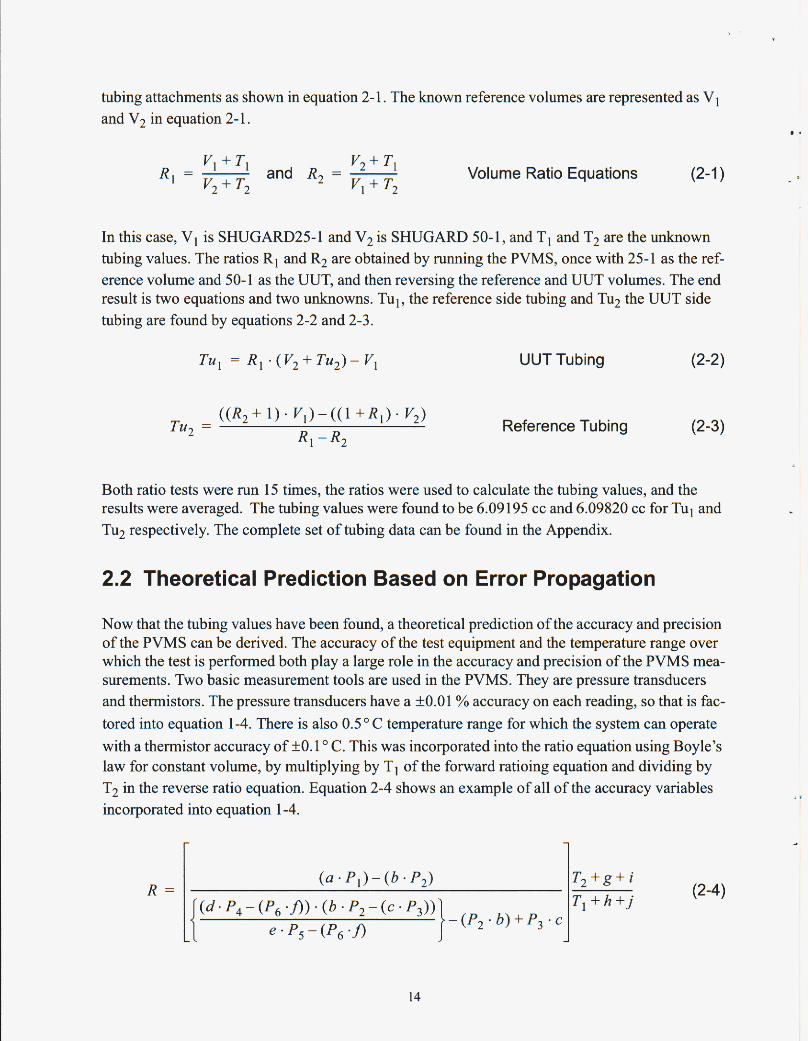
tubing attachments as shown in equation 2-1. The known reference volumes are represented as VI and V2 in equation 2-1.
vz + Tl VI + T2
and R2 = - VI +TI v2 + T2
R , = - Volume Ratio Equations
In this case, V1 is SHUGARD25-1 and V2 is SHUGARD 50-1, and T1 and Tz are the unknown tubing values. The ratios R, and Rz are obtained by running the PVMS, once with 25-1 as the ref- erence volume and 50-1 as the UUT, and then reversing the reference and UUT volumes. The end result is two equations and two unknowns. Tul, the reference side tubing and Tuz the UUT side tubing are found by equations 2-2 and 2-3.
UUT Tubing
Reference Tubing (2-3)
Both ratio tests were run 15 times, the ratios were used to calculate the tubing values, and the results were averaged. The tubing values were found to be 6.09195 cc and 6.09820 cc for Tu, and Tuz respectively. The complete set of tubing data can be found in the Appendix.
2.2 Theoretical Prediction Based on Error Propagation
Now that the tubing values have been found, a theoretical prediction of the accuracy and precision of the PVMS can be derived. The accuracy of the test equipment and the temperature range over which the test is performed both play a large role in the accuracy and precision of the PVMS mea- surements. Two basic measurement tools are used in the PVMS. They are pressure transducers and thermistors. The pressure transducers have a +0.01% accuracy on each reading, so that is fac- tored into equation 1-4. There is also 0.5' C temperature range for which the system can operate with a thermistor accuracy of k0.1' C. This was incorporated into the ratio equation using Boyle's law for constant volume, by multiplying by TI of the forward ratioing equation and dividing by Tz in the reverse ratio equation. Equation 2-4 shows an example of all of the accuracy variables incorporated into equation 1-4.
14
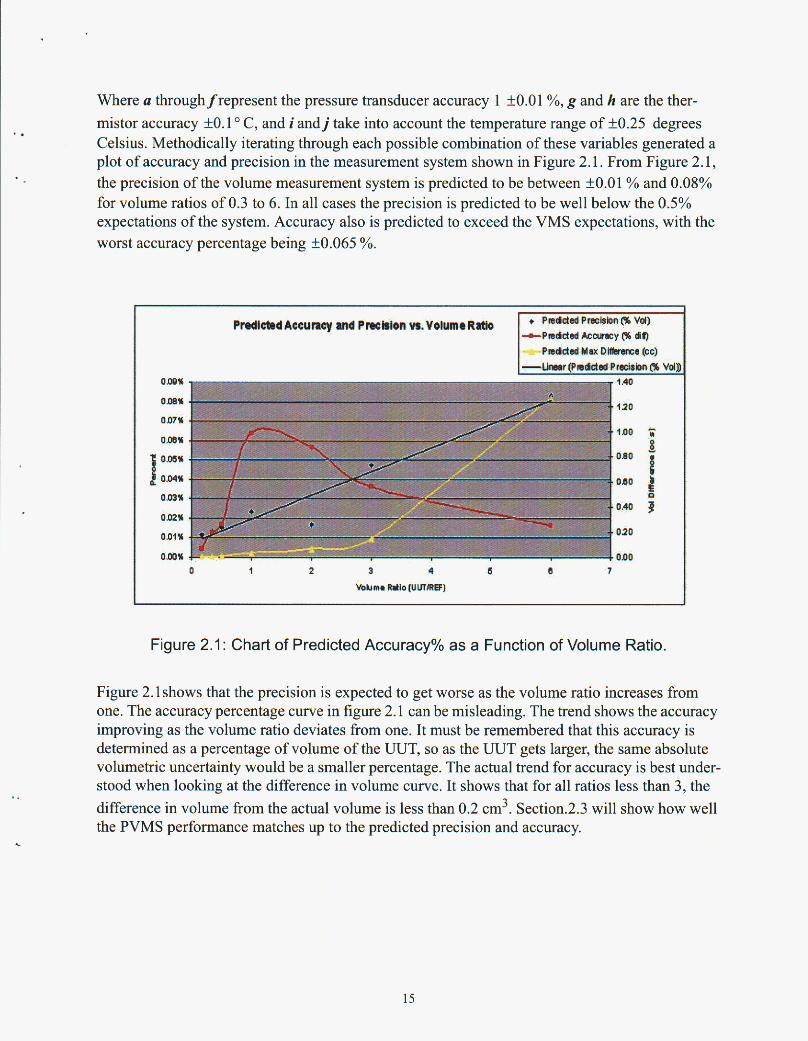
Where u throughfrepresent the pressure transducer accuracy 1 fO.01 %, g and h are the ther- mistor accuracy +O. 1 C, and i and j take into account the temperature range of f0.25 degrees Celsius. Methodically iterating through each possible combination of these variables generated a plot of accuracy and precision in the measurement system shown in Figure 2.1. From Figure 2.1, the precision of the volume measurement system is predicted to be between fO.01 % and 0.08% for volume ratios of 0.3 to 6 . In all cases the precision is predicted to be well below the 0.5% expectations of the system. Accuracy also is predicted to exceed the VMS expectations, with the worst accuracy percentage being +0.065 %.
..
Figure 2.1: Chart of Predicted Accuracy% as a Function of Volume Ratio.
Figure 2. lshows that the precision is expected to get worse as the volume ratio increases from one. The accuracy percentage curve in figure 2.1 can be misleading. The trend shows the accuracy improving as the volume ratio deviates from one. It must be remembered that this accuracy is determined as a percentage of volume of the UUT, so as the UUT gets larger, the same absolute volumetric uncertainty would be a smaller percentage. The actual trend for accuracy is best under- stood when looking at the difference in volume curve. It shows that for all ratios less than 3, the difference in volume from the actual volume is less than 0.2 cm3. Section.2.3 will show how well the PVMS performance matches up to the predicted precision and accuracy.
2.3 Test Plan & System Performance
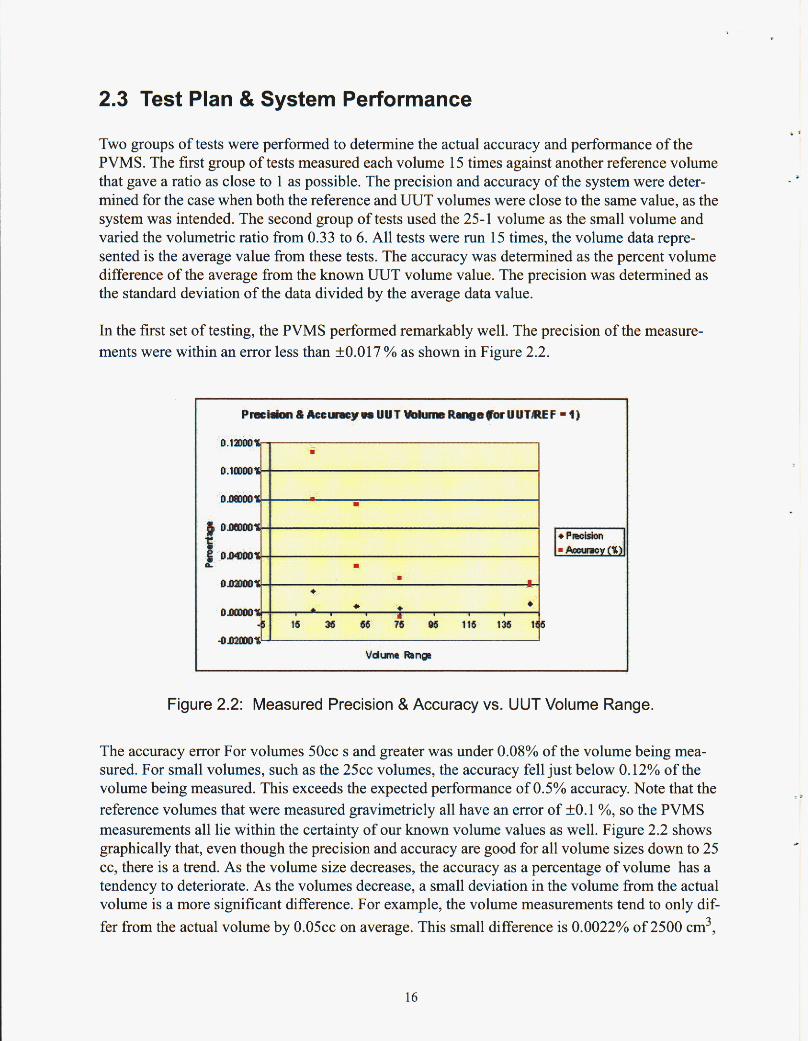
Two groups of tests were performed to determine the actual accuracy and performance of the PVMS. The first group of tests measured each volume 15 times against another reference volume that gave a ratio as close to 1 as possible. The precision and accuracy of the system were deter- mined for the case when both the reference and UUT volumes were close to the same value, as the system was intended. The second group of tests used the 25-1 volume as the small volume and varied the volumetric ratio from 0.33 to 6. All tests were run 15 times, the volume data repre- sented is the average value from these tests. The accuracy was determined as the percent volume difference of the average from the known UUT volume value. The precision was determined as the standard deviation of the data divided by the average data value.
In the first set of testing, the PVMS performed remarkably well. The precision of the measure- ments were within an error less than +0.017% as shown in Figure 2.2.
Figure 2.2: Measured Precision & Accuracy vs. UUT Volume Range.
The accuracy error For volumes 50cc s and greater was under 0.08% of the volume being mea- sured. For small volumes, such as the 25cc volumes, the accuracy fell just below 0.12% of the volume being measured. This exceeds the expected performance of 0.5% accuracy. Note that the reference volumes that were measured gravimetricly all have an error of +0.1%, so the PVMS measurements all lie within the certainty of our known volume values as well. Figure 2.2 shows graphically that, even though the precision and accuracy are good for all volume sizes down to 25 cc, there is a trend. As the volume size decreases, the accuracy as a percentage of volume has a tendency to deteriorate. As the volumes decrease, a small deviation in the volume from the actual volume is a more significant difference. For example, the volume measurements tend to only dif- fer from the actual volume by 0 . 0 5 ~ ~ on average. This small difference is 0.0022% of 2500 cm3,
16

but it is as large as 0.22% for 25 cm3. As a result, for volumes that are less than 50 cm3 the accu- racy is best stated as a volume f0.05 cm3.
It is not probable that the volume needed to be measured will always have a ratio of one with respect to the reference volume. In turn, the second set of testing vaned the ratio of UUT to refer- ence volume from 0.01 to 100. Figure 2.3 shows the results for ratios varying from 0.33 to 6.
Figure 2.3: Measured Accuracy & Precision vs. Volume Ratio.
All of the accuracies were under f0.04 % with an average precision of f0.018 %, with the excep- tion of the ratio of one. The three data points that lie above this accuracy limit are for volume of less than 50 cm3, and as stated before, their accuracy is better represented as an absolute volume of k0.05 cm3. Ratios of 0.01 and 100 were run to verify that ratios above 6 would still yield valid results. In these cases the accuracy was k0.5 % with a precision of kO.1 %. Thus, for all reason- able ratios less than 100, the accuracy and precision would fall within this limit. Typical examples of the individual test data can be found in the Appendix.
The accuracy of the PVMS depends largely on the temperature range that the system is operating in. All volume data was recorded along with the average temperature of the system, as shown in the Appendix. Consistently, the volume data points that matched the reference volumes with the least amount of absolute volume difference were found at temperatures within 23.285 kO.1 C. If the system were to be improved at all the temperature controls could be tightened, but this is not necessary since the accuracy and precision are already within the certainty of the volume values measured gravimetricly.
The other large factor that plays into the accuracy and precision is the flow rate of the helium gas. The first set of tests had to be re-run because the flow rate was initially too high for volumes of 50 cc and below. All results presented are test run with the optimized helium flow rate. For a volume
17

of 25 cm3, the flow rate was measured as a 0.5 psi per second. It was set at this rate for easy vali- dation by the operator. The PVMS program updates its data on the output screen every three sec- onds, so if the flow rate is ever changed it can be verified in the manual mode of the PVMS program by letting the helium into one 25 cc volume in the system and validating the change in pressure. For large volumes of 2500 cm3 per side or more, the second flow valve can be opened on the PVMS to let gas flow freely into the system. The second valve speeds up the measurement system for large volume without sacrificing the accuracy, because the heat created by the flow of gas is quickly dissipated into the large volume.
The actual performance turned out to exceed the predicted results although they did follow the same trends as shown in Figures 2.4 and 2.5. The only outlying point in the measured accuracy is for a ratio of 1 for the 25 cc volumes, where percent accuracy is not a good indicator, as stated before.
. I
Muund and ProdtctoU Accuracy vt.VolumrRatlo (UUTREF)
+Measured Accuriey (%
+Predicted Accuracy (96 wa)
0.14%
e O. I2% ~ 0 1 0 % a 3, o.m%
0.06%
0.04%
0.02%
om% 0 1 2 3 4 5 6 7 8
Vot Ratto (UUTtREF)
Figure 2.4: Measured and Predicted Accuracy vs. Volume Ratio.
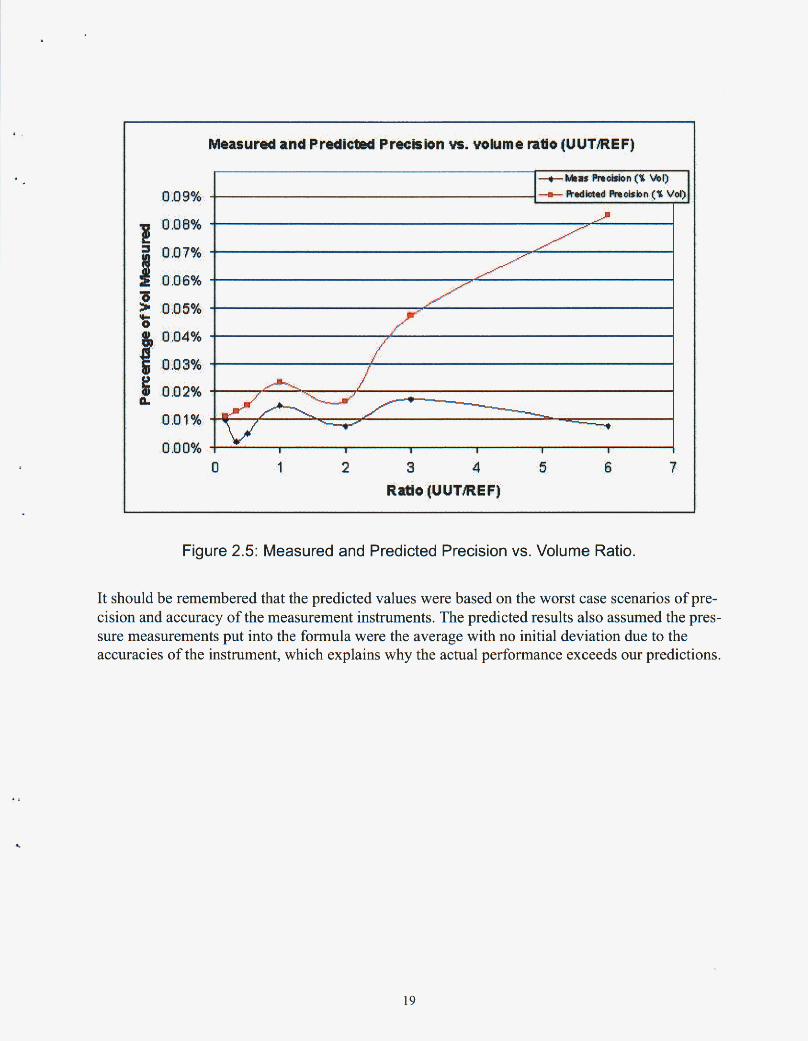
Measured precision also out performed our predictions as shown in figure 2.5. It was predicted that precision would degrade as the volume ratio increased from one. However, the actual mea- sured performance stayed fairly constant regardless of volume ratio at less than k0.018 %. This proves that the PVMS is not operating under worst case conditions, as the predicted performance assumes.
+
18
MeuureU and Prrdictul Prrobbn w. volume nUo(UUTiREF)
0.09%
e 0.06% B 'II :::: E: 0.05%
i! 0.02% P 0.01%
0.00% 0 1 2 3 4 5 6 7
Rdlo /UUTREF)
Figure 2.5: Measured and Predicted Precision vs. Volume Ratio.
It should be remembered that the predicted values were based on the worst case scenarios of pre- cision and accuracy of the measurement instruments. The predicted results also assumed the pres- sure measurements put into the formula were the average with no initial deviation due to the accuracies of the instrument, which explains why the actual performance exceeds our predictions.
19

This page intentionally left blank.
20
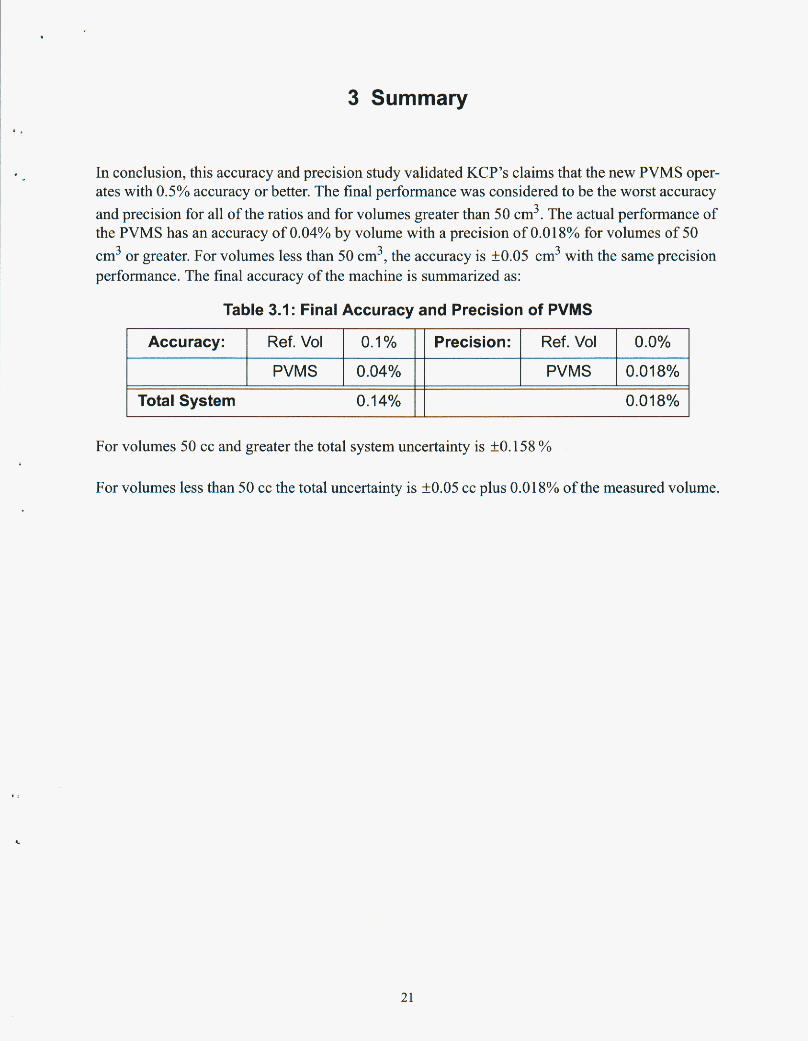
3 Summary
In conclusion, this accuracy and precision study validated KCP’s claims that the new PVMS oper- ates with 0.5% accuracy or better. The final performance was considered to be the worst accuracy and precision for all of the ratios and for volumes greater than 50 cm3. The actual performance of the PVMS has an accuracy of 0.04% by volume with a precision of 0.018% for volumes of 50 cm3 or greater. For volumes less than 50 cm3, the accuracy is k0.05 cm3 with the same precision performance. The fmal accuracy of the machine is summarized as:
Table 3.1 : Final Accuracy and Precision of PVMS
Accuracy: Ref. Vol 0.1% Precision: Ref. Vol 0.0%
PVMS 0.04% PVMS 0.018%
Total System 0.14% 0.018%
For volumes 50 cc and greater the total system uncertainty is k0.158 %D
For volumes less than 50 cc the total uncertainty is +0.05 cc plus 0.018% of the measured volume.
21

This page intentionally left blank.
22

AppendixTypical Accuracy and Precision Data
.............. ...........
. - .-. .. ..
~~ ...........
23

1 References
1. P. A. Klevgard, Precision Volume Measuring System. Sandia: SAND844014 UC-700, November 1984
2. L. J. Cain, Improved Volume Measurement Design and the Volume Criterion. Federal Manu- facturing and Technologies: DE-AC04-76-DP00613, May 2000
25

Distribution: 1 Honeywell
Federal Manufacturing and Technologies Attn: L. J. Cain, MS-FC39 P. 0. Box 419159 Kansas City, Missouri 64141 -6159
1 MS 9035 Markel,Ben8243 1 MS 9036 Cardinale, Greg 8245 1 MS 9052 Rice, Steve8361
~ MS 9108 Jones, Richard L. 8243 1 Lajeunesse,Costanzo 8243 1 Monson, Robert 8243 1 Paradiso, Nick 8243 1 Petersen, Daniel 8245 1 Pretzel, Carl 8243 1 Stieper, Sean 8243
MS 9403 Mills, Bernice 9723
1 MS 966 1 Aichlmayer, Hans 8243 1 Alvine, Cynthia 8243 1 Mara, Leo 8243 1 Sage, Tim 8243 1 Shugard, Andrew 8243 1 Van Blarigan, Peter 8243
LIBRARY DOCUMENT DO NOT DESTROY
1 MS 9914 Fischer,Erin8245 1 Wilcoxon, Don 8243
RETURN TO 3 MS 9018 Central Technical Files, 8945-1 LIBRARY VAULT 1 MS 0899 Technical Library, 9616 1 MS 902 1 Classification Office, 85 11 for Technical Library,
MS 0899,9616 DOE/OSTI via URL
26
Related Documents