C o n f i d e n t i a l 1 Program : MBA Semester : I Subject Code : MBF103 Subject Name : Statistics for management Book Code : B1129 Unit number : 4 Unit Title : Measures used to summarize Data. Lecture Number : 6 ,7 & 8 Lecture Title : Central tendency HOME NEXT

Welcome message from author
This document is posted to help you gain knowledge. Please leave a comment to let me know what you think about it! Share it to your friends and learn new things together.
Transcript

C o n f i d e n t i a l1
Program : MBA
Semester : I
Subject Code : MBF103
Subject Name : Statistics for management
Book Code : B1129
Unit number : 4
Unit Title : Measures used to summarize Data.
Lecture Number : 6 ,7 & 8
Lecture Title : Central tendency
HOME NEXT

C o n f i d e n t i a l
2
Measures to summarize data
Objectives :
• Describe the concept of statistical average• Calculate arithmetic mean for discrete and continuous data• Calculate median and mode of data• Calculate quartiles, deciles and percentiles for the statistical data• Compute coefficient of variance for the statistical data
HOME NEXT PREVIOUS
Unit-4 Measures to summarize data

C o n f i d e n t i a l
3
Lecture Outline
• Introduction
• Central Tendency
• Requisites of Good Average
• Statistical Averages
• Merits & Demerits of Arithmetic mean
• Introduction to Median
• Introduction to Mode
• Geometric Mean
• Harmonic Mean
• Positional Averages
• Measures & Realative measures of Dispersion
HOME NEXT PREVIOUS
Unit-4 Measures to summarize data

C o n f i d e n t i a l
Lecture Outline
• Pre requisite for good measure of variation
• Range
• Quartile Deviations
• Other Measures
• Summary
• Check Your Learning
• Activity
4
Unit-4 Measures to summarize data

C o n f i d e n t i a l
5
Introduction
HOME NEXT PREVIOUS
Graphical representation is a good way to represent summarised data. However, graphs provide us only an overview and thus may not be used for further analysis. Hence, we use summary statistics like computing averages to analyse the data. Mass data, which is collected, classified, tabulated and presented systematically, is analysed further to bring its size to a single representative figure.
Unit-4 Measures to summarize data

C o n f i d e n t i a l
6
Centeral Tendency
HOME NEXT PREVIOUS
•Tendency of Data to Cluster around a Figure is called Central tendency
• Measures of Central Tendency or averages of first order describes the concentration of large numbers around a value.
• It is a single value representing all units
•This single figure is the measure which can be found at central part of the range of all values. It is the one which represents the entire data set. Hence, this is called the measure of central tendency.
www.visualstatistics.net/.../Contents.htm
Unit-4 Measures to summarize data

C o n f i d e n t i a l
7
Requisites of Good Average
HOME NEXT PREVIOUS
It should be simple to calculate and easy to understand It should be based on all values It should not be affected by extreme values It should not be affected by sampling fluctuation It should be rigidly defined It should be capable of further algebraic treatment
Unit-4 Measures to summarize data

C o n f i d e n t i a l
8
Statistical Averages
HOME NEXT PREVIOUS
The commonly used statistical averages are arithmetic mean, geometric mean, harmonic mean.
Arithmetic mean: Arithmetic mean is defined as the sum of all values divided by number of values and is represented by Before you study how to compute arithmetic mean, you have to be familiar with the terms such as discrete data, frequency and frequency distribution, which are used in this unit.
Properties of Arithmetic Mean1.Algebraic sum of deviations of a set of values taken from their Mean is always zero2.Sum of squares of deviations of a set of values from their mean is always minimum3.It is capable of further algebraic treatment
Unit-4 Measures to summarize data

C o n f i d e n t i a l
Merits and Demerits of Arithmetic Mean
MERITS DEMERITS
Simple to Calculate and Easy to Understand based on all values Rigidly Defined Capable of further algebraic treatment More Stable
Affected by extreme values Can not be determined for distributions with open-end class intervals Cannot be graphically located Sometimes it’s a value which is not in the series
9
HOME NEXT PREVIOUS
Unit-4 Measures to summarize data
C o n f i d e n t i a l
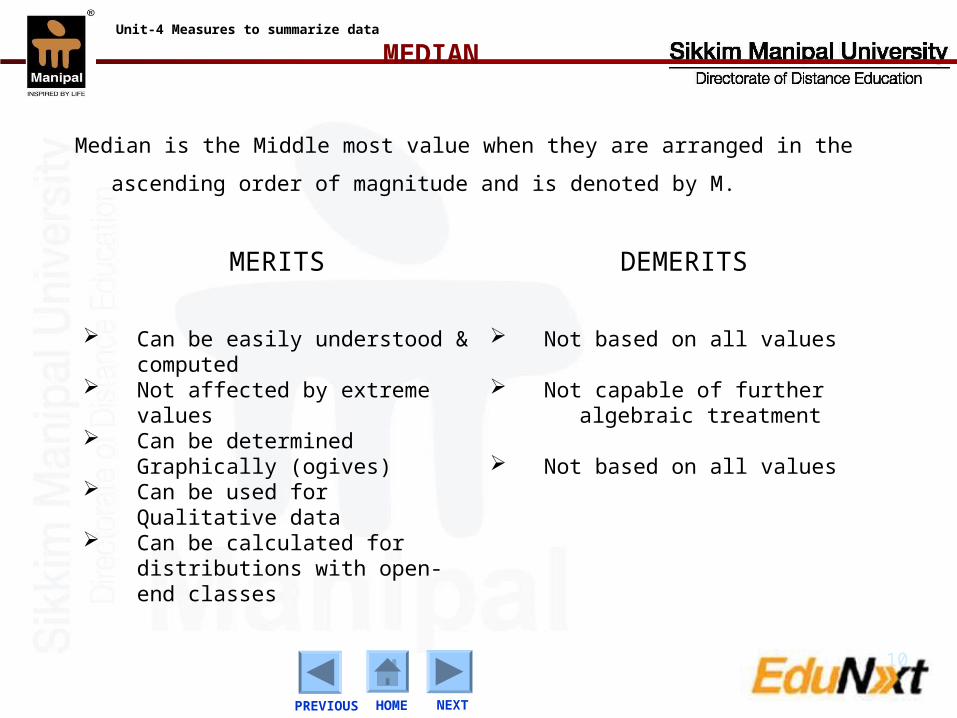
MEDIAN
MERITS DEMERITS
Can be easily understood & computed
Not affected by extreme values
Can be determined Graphically (ogives)
Can be used for Qualitative data
Can be calculated for distributions with open-end classes
Not based on all values
Not capable of further algebraic treatment
Not based on all values
10
Median is the Middle most value when they are arranged in the ascending
order of magnitude and is denoted by M.
HOME NEXT PREVIOUS
Unit-4 Measures to summarize data

C o n f i d e n t i a l
MODE
MERITS DEMERITS
Can be found by inspection in many cases
Not affected by extreme values
Can be located graphically Can be used for qualitative
data Can be calculated for
distributions with open end classes
Not based on all values
Not capable of further mathematical treatment
Much affected by sampling fluctuations
11
HOME NEXT PREVIOUS
Mode is the value which has the highest frequency
Unit-4 Measures to summarize data

C o n f i d e n t i a l
12
Geometric Mean
Geometric mean of a series of “n” positive numbers is given by –
Discrete series without frequency
Discrete series with frequency
Continuous Series
HOME NEXT PREVIOUS
nnXXXXGM .......... 321
n fn
ff nXXXGM ............. 2121
n fn
ff nXXXGM ........ 2121
X1, X2,…..,Xn are mid-points of class intervals
Unit-4 Measures to summarize data

C o n f i d e n t i a l
13
Harmonic Mean
HOME NEXT PREVIOUS
If X1, X2,…..,Xn are “n” values for discrete series without frequency then their Harmonic Mean is
)/1(..
iX
NMH
For Discrete series with frequency
)/(..
ii Xf
NMH
Here, fi is the corresponding frequencies
Unit-4 Measures to summarize data

C o n f i d e n t i a l
14
Positional Averages
HOME NEXT PREVIOUS
Median is the mid-value of series of data. It divides the distribution into two equal portions. Similarly, we can divide a given distribution into four, ten or hundred or any other number of equal portions.
For discrete series with or without frequency, Q1 and Q3 are given by: Q1 is (N+1/4)th value Q3 is [{3(n+1)}/4] value
Unit-4 Measures to summarize data
C o n f i d e n t i a l
15
Measures of Dispersion
•Property of deviations of values from the average is called Dispersion or Variations.
Various Measures of Dispersion –1. Range (R)2. Quartile (Q.D.)3. Mean Deviations (M.D.)4. Standard Deviations (S.D.)
Unit-4 Measures to summarize data

C o n f i d e n t i a l
Relative Measures of Dispersion
16
There are different relative measures of Dispersions:
Coefficient of Range Coefficient of Quartile Deviations Coefficient of Mean Deviations Coefficient of Variations
Prerequisite of Good Measure of Variation:
Should be easy to understand and simple to calculateShould be based in all valuesShould not be affected by extreme valuesShould not be affected by sampling fluctuationsShould be capable of further algebraic treatment
Unit-4 Measures to summarize data

C o n f i d e n t i a l
RANGE
MERITS DEMERITSEasily Understandable Simple to Calculate
Affected by Extreme values & not based on all values
17
Difference between highest and lowest value of data iscalled as Range. i.e. R=H-L ; where H: Highest Value L: Lowest Value
Coefficient of Range = (H-L)/(H+L)
Uses of Range: Used in Statistical Quality control. When study does not require deep analysis and when data don’t have any abnormal values
Unit-4 Measures to summarize data

C o n f i d e n t i a l
Quartile Deviations
MERITS DEMERITS
Easily Understandable, Rigidly defined and Not affected by extreme values
Not based on all values, Affected by Sampling Fluctuations and is not capable of further algebraic treatment
18
Unlike range, quartile deviation does not involve the extreme values. It is defined as:
Q.D=
Coefficient of Q.D=
Unit-4 Measures to summarize data
C o n f i d e n t i a l
Summary
19
The measures of central tendency and measures of dispersion summarise mass data in terms of its two important features. With respect to nature of data to cluster around a central value With respect to their spread from their central value
Arithmetic mean is defined as the sum of all values divided by number of values.Median of a set of values is the middle most value when the values are arranged in the ascending order of magnitude.Mode is the value which has the highest frequency
The measures of variations are:i. Range (R)ii. Quartile Deviations ( Q.D)iii. Mean Deviations (M.D)iv. Standard Deviations (S.D)
Unit-4 Measures to summarize data

C o n f i d e n t i a l
20
Check Your Learning
HOME NEXT PREVIOUS
State whether the following questions are ‘True’ or ‘False’.
1)Arithmetic mean is affected by extreme values.Ans: True.
2.It can be calculated for distributions with closed-end classes.Ans: False, it can be calculated for open-end classes.
3. Modal value is most useful for business people.Ans: True.
4. Quantiles are positional value.Ans: True.
5. Range is used When the study requires deep analysis.Ans: False, Range is used when study does not requires deep analysis
Unit-4 Measures to summarize data

C o n f i d e n t i a l
Activity
21
HOME PREVIOUS
1. For the distribution shown in table, find the median, mode ,quartile deviation and the coefficient of quartile deviation
% marks 0-10 10-20
20-30 30-40
40-50 50-60 60-70
No of smokers
24 22 42 16 12 18 24
Unit-4 Measures to summarize data
Related Documents


