COVER SHEET Powl, A and Skitmore, R M (2005) Factors hindering the performance of construction project managers. Construction Innovation 5(1):pp. 41-51. Copyright 2005 Hodder Arnold. Accessed from: http://eprints.qut.edu.au/archive/00003296

Welcome message from author
This document is posted to help you gain knowledge. Please leave a comment to let me know what you think about it! Share it to your friends and learn new things together.
Transcript
COVER SHEET
Powl, A and Skitmore, R M (2005) Factors hindering the performance of construction project managers. Construction Innovation 5(1):pp. 41-51. Copyright 2005 Hodder Arnold. Accessed from: http://eprints.qut.edu.au/archive/00003296
FACTORS HINDERING THE PERFORMANCE OF
CONSTRUCTION PROJECT MANAGERS
A Powl and R M Skitmore
School of Construction Management and Property Queensland University of Technology Gardens Point Brisbane Q4001 Australia
16 September 2004
2
FACTORS HINDERING THE PERFORMANCE OF
CONSTRUCTION PROJECT MANAGERS
ABSTRACT
It has been said that the effective performance of the Project Manager (PM) is the
single most critical factor affecting successful project outcomes. Little is known,
however, of the nature and extent of the hindrances to PM effectiveness in the
Construction Industry (CI). This paper reports on the results of a worldwide survey of
PMs concerning these issues and shows that they have the potential to be more
effective and more productive in their working. Associated with this is a need to be
more aware of progress and developments in the CI generally, more aware of progress
and developments in their own organisation, more delegation of contract
administration tasks and more general administrative support. Also highlighted is the
lengthy working hours of PMs.
Keywords: Effectiveness, productivity, hindrances, project management, survey.
INTRODUCTION
The construction industry (CI) makes a significant contribution to the economy of
many countries (eg., Banik, 2001). In the USA in 2000, for example, the CI
3
employed some 6.7 million people with an expenditure of $650 billion dollars -
representing approximately 10% of the 1999 Gross Domestic Product (Banik, 2001).
The traditions, idiosyncrasies and output of this industry have, however, also earned it
a less than favourable reputation (eg., Love et al, 2002). Various improvements have
been suggested, and many recommend the need for a competent, single point manager
to overview the project (eg., Bandow & Summer, 2001; Gobeli & Larson, 1987;
Woodward, 1997). In fact, the effective performance of the Project Manager (PM) is
said to be the single most critical factor affecting successful project outcomes
(Hartman, 2000; Bandow & Summer, 2001).
For PMs to perform effectively, it is said that they need to: be nurtured and
encouraged (Pinto & Slevin, 1989); be generalists rather than specialists (Pinto and
Kharbanda, 1995); work within a system that encourages creativity and innovation
(Webb 2000); do “the right thing at the right moment” (Ramo, 2002); and avoid
ineffective traditional ways and bad practices (McKenna 1998).
The relative extent to which these, and any other, factors actually affect project
management efficiency is not known. The research described in this paper aimed to
shed some light on this by a survey of PMs employed by a major international fast
food chain. This provided results that are both narrow, in the sense that they only
apply to the PMs employed in that specific organisation, and broad, as the PMs
involved in the survey are based in several countries and therefore allow some claim
to generality in the international community.
4
LITERATURE REVIEW
PMs must be able operate effectively on a day to day basis to ensure positive impacts
on the overall quality of their projects (Bleout, 1998; Pinto & Kharbanda, 1995). For
this to happen, PMs need to be nurtured and encouraged (Pinto & Slevin, 1989). To
stop or hinder the performance of the PM “will only stop or hinder the performance of
the team chemistry and project results” (Nicolini, 2002).
To be most efficiently used, it is said that PMs need to be ‘generalists’ rather than
‘specialists’ (Pinto and Kharbanda, 1995). They must “deal with the day-to-day
demands of their position while still maintaining a sense of strategic vision for the
project” (Pinto and Kharbanda, 1995). However, the traditional CI culture
underestimates the actual time and costs spent in resolving technical issues (Love et
al, 2002). This, together with the tendency of modern organisations to be geared for
short-term requirements (Pfeffer and Veiga, 1999), can lead to the use of PMs as ‘fire
fighters’ (Pinto and Kharbanda, 1995). Often, improving the PM’s future abilities and
long-term performance are just not considered (Adel-Razek, 1997).
Work environments that support and encourage creativity and innovation have been
associated with increased productivity in general (Veninga, 2000) and in the CI
(Love, 1999) and are likely to be of importance in influencing PM efficiency
(Cleland, 1999). This is expected to involve cross-functional interaction between
groups and people to achieve synergy, with organisations that encourage constructive
conflict, risk taking and tolerance of failure being the most likely to inspire innovation
5
and creativity (Jassawalla and Sashittal, 1999). A more bureaucratic approach to
management, on the other hand, “tends to stifle innovation” (Winch, 2000). What is
needed, it is suggested, is a trade-off between tightly defined systems - that ensure the
efficient delivery of products, but also freedom within such systems to encourage
creativity and innovation, with the ability to respond quickly to changing needs
(Webb, 2000)
Long working hours also likely to be a major source of inefficiency for PMs – these
being increasingly endemic generally worldwide (Sparks et al, 2001; Cameron, 2002;
Freeman, 2002; Cooper, 1999; Worrall and Cooper, 1999) and a major cause of
productivity loss in the CI in general (Kaming et al, 1998; Horner and Talhouni,
1995). The growth in information technology, globalisation, organisational
restructuring, changes in work contracts and work time scheduling are typically
blamed (eg., Sparks et al, 2001) together with job insecurity (Sparks, 2002). The
effects of working long hours include industrial and social problems (Cooper, 1999);
family breakdown (Cooper, 1998); physical and psychological health problems in
general (Sparks et al, 2001; Cooper, 1999); and reduced alertness and concentration
(Leonard et al, 1998). There is some protective legislation (ISR, 1995) and,
according to Kodz (1998), employers are now starting to recognise the problem
although in practice, as Strebler (1999) points out ‘it is unrealistic of employers to tell
staff to stop working long hours while still piling on the work’.
The critical consequences of time on the effectiveness of PMs has been acknowledged
by several leading researchers, such as Drucker, Taylor and Deming and Thoms and
Pinto (1999), indicating that effective PMs must “act intelligently and wisely on
6
concrete and opportune occasions” (cited in Ramo, 2002). Ramo’s (2002) research
has shown the critical effects of “doing things right”, according to the book and the
clock as well as “doing the right things at the right moments”. He further noted that
managers also have to seize new opportunities, in ‘windows of opportunity’ that exist
for a finite period. Similarly, Love et al’s (2002) research highlights the need for a
system for assertive and preventative strategies that continuously assess and evaluate
project performance based on improving management responses.
Project management especially has a large influence on project productivity, quality
and rework (Cooper, 1993 & 1994). Rework, in particular, is estimated to be greater
than 10% of the total project cost (Josephson, 2002, Love et al, 2002; Woodward,
1997). Regardless of what ‘dynamic’ is the original cause, resources need to be
diverted to resolve it, as well as money and time expended - often detrimental to other
parts of the project (Love et al, 2002).
Finally, inefficiency in the CI has been attributed on many occasions to its ineffective
traditional ways and bad practices (eg., Egan, 1998; Latham, 1994). As McKenna
(1998) observes “Some argue that productivity can be achieved/increased by working
harder, faster or longer. In the real world, productivity cannot be achieved by only
speed and harder work, without adopting best practices”. “True productivity (and
profit) gains come from identifying and implementing the most efficient work process
to satisfy the client’s needs” CIB report (1996).
7
THE SURVEY
Questionnaire design and administration
The research aimed to establish the extent of hindrances on the performance and
utilisation of PMs. A questionnaire survey, using electronic access to similar
worldwide PMs, was used to obtain representative and confidential responses
concerning what is happening in this respect, compared to what they consider should
be happening. Most responses were provided on a bipolar Likert scale.
Questions 1-3 obtained opinions concerning ‘Innovation and Creativity’, with
question 3 seeking opinions on the frequency PMs are able to convert their creativity
into application. The critical issue here was to understand if a work environment
exists that regularly encourages and allows innovation and creativity. This is
considered essential for company and individual growth and development (Love,
1999; Edum-Fotwe, 2000).
Questions 4 and 5 focused on contract and administrative support. Contract support
involves tasks and activities such as project cost control, procurement, programming
etc specific to a project. Administrative support involves activities such as filing,
typing, faxing as well as managing the project documentation such as drawings,
correspondence etc. These activities may be better performed by someone with more
technical expertise.
8
Questions 6 and 7 focused on the hours typically worked by a PM. Categories of
responses were offered to indicate, average, long and excessively long working hours.
Question 8 records the PM’s opinions of their utilisation.
Question 9 and 10 comprised simple and straight forward questions that ask the PM -
with all the constraints around him, is he able to complete tasks to his own
‘satisfaction’ and ‘on time’.
Questions 11 and 12, considered how a PM regularly spends his time away from the
critical activities of managing his projects, with particular emphasis on ‘Rework’.
Question 13, sought opinions on the impact of company ‘standards and procedures’
on the quality of CI projects, while question 14 reviewed their effectiveness by
examining how, under pressure, such systems can or must be compromised.
Finally, questions 15 and 16 were open-ended questions allowing the respondents to
elaborate specifically on their companies ‘standards and procedures’ and also
generally on the questionnaire.
Access was obtained from an international organisation that actively employs
‘Construction PMs’ (CPMs) to produce construction projects of high operational and
statutory standard. The CPMs from this organisation have a background from the CI
and are generally of a high competency and depth of experience. Projects controlled
by these managers are generally repetitive in nature, with individual project values
ranging from as small as $1000AUD to $3million AUD. The PMs handle anywhere
9
up to 15 to 25 projects simultaneously at varying stages. The use of Information
Technology systems are commonplace, enabling the questionnaires to be dispatched
electronically, via e-mail.
Following piloting, the questionnaire was issued nationally to the Australian CPMs in
September 2002, producing a 100% response. At the same time, following
permission obtained from the company’s World Development Director,
questionnaires were adjusted for international issue and dispatched to contacts
provided in the USA, UK, Japan, Hong Kong and Taiwan. An overall response rate
of 41%, i.e. - 58 responses from 141 issued, were finally received at the end of
October 2002, from the countries concerned.
Analysis of data
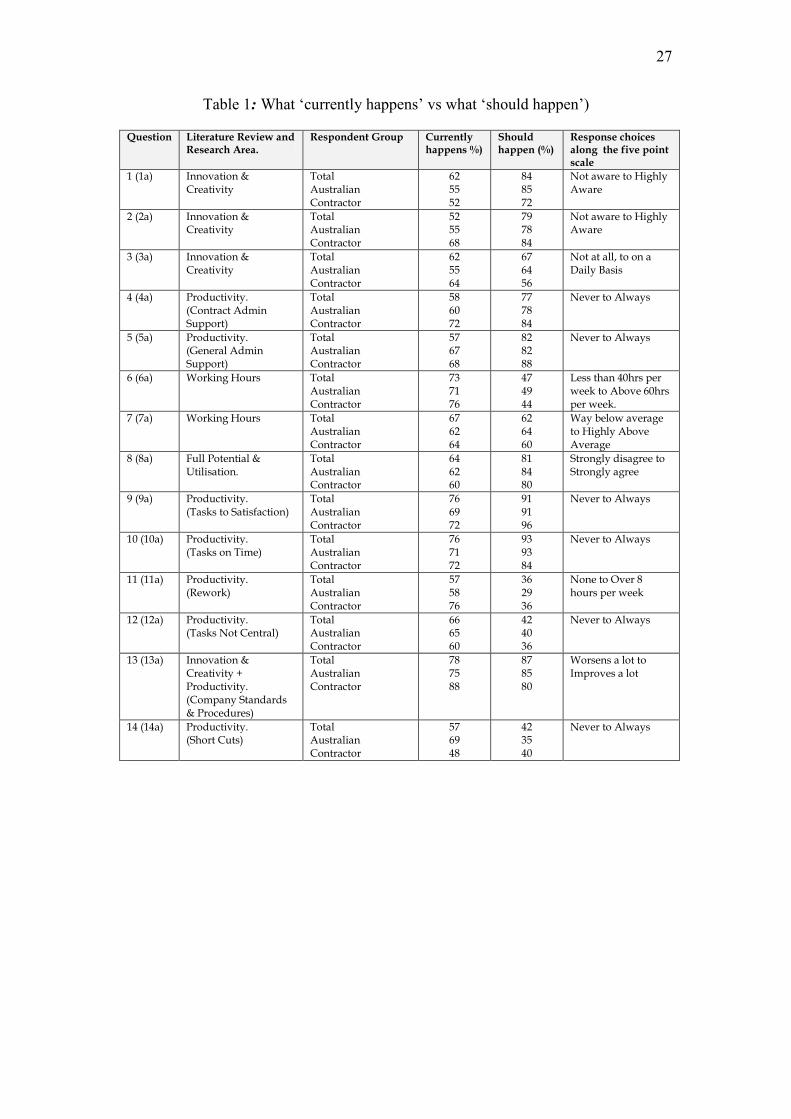
The results for each question are summarised in Table 1, the key issues of which are
reviewed separately below.
Question 1. - Innovation and Creativity I
This question relates to the respondents’ awareness of progress and developments in
the CI generally in terms of (1) what their awareness is currently and (2) what they
thought it ought to be. The overall results (Table 1), show that on average the
respondents are ‘reasonably aware’, i.e. - along the five point response scale at 3.1,
10
equates to 62%, (3.1 x 20% = 62%). However, 84% of these same respondents
consider they should be ‘highly aware’, which equates to the average response of 4.2
along the five point response scale. This represents a significant difference of 84% -
62%=22 percentage points.
It is interesting to observe that even though 85% of the Australian respondents also
consider they should be ‘highly aware’, 55% are currently only ‘neutral’ on average.
This represents a ‘gap’ of 31% (rounded), which is marginally higher than the 22%
overall gap. Table 1 shows that 52% of the Contractor CPMs (CCPMs) are currently
aware, but consider they need be 72% aware, representing a ‘gap’ of 20%.
Question 2 – Innovation and Creativity II
This question similarly inquired of the respondents’ current and desired awareness,
but specifically concerning current progress and development within their own
organisation. The trends are very similar to Question 1. Many (52%) of respondents’
awareness level is ‘neutral’, whereas most (79%) consider they should be ‘very
aware’ - a gap of 27%. In terms of the nationality of respondents, however, many
(68%) of the CCPMs have a somewhat higher current awareness while most (84%)
consider it should be a ‘high’ - a gap of 16%.
Question 3 – Innovation and Creativity III
11
The respondents’ opinions in this question were focused on how often they ‘do’ or are
‘able to’, proactively identify innovative and creative opportunities. This was
contrasted with how often they consider they ‘should’ or ‘be able to’ do this. The
trends are very consistent, with the ‘gap’ being somewhat smaller than before.
Overall, many (62%) respondents claim to regularly identify innovative and creative
opportunities, while only slightly more (67%) consider they should regularly identify
such opportunities. As these results closely border the ‘monthly’ and ‘weekly’ scales,
a more appropriate description would possibly be ‘bi-weekly’. As Table 1 indicates,
the respondents in general are closely doing what they ‘should be’ doing, i.e. -
identifying innovative and creative opportunities on a bi-weekly basis.
Question 4 – Productivity (Contract Administration Support)
The respondents were asked how often they can delegate contract administration tasks
while still keeping full control of their project workload. Again, the trend of results
was remarkably consistent between the respondent subgroups, but with a wider spread
of results concerning their current ability to delegate. There was however, more
agreement on how often contract administration tasks should be delegated. On
average, respondents are able to delegate only around half (58%) of the time, while
they consider this should be most (77%) of the time – a difference of 18% (rounded).
Of these, the CCPM subgroup had a slightly higher profile (72% and 84%).
12
Question 5 – Productivity (General Admin Support)
Similarly, respondents were asked about the level of administrative support provided
for their project tasks and activities. The trend again was similar to the contract
administration support in question 4. However, the required support of this form was
notably higher and thus the gap was greater. The respondents generally receive some
(57%) support but consider they should receive much more (82%) – an under
provision of 25%. Similarly to question 4, this also represents an opportunity cost to
the CPM, although the exact amount in hours cannot be calculated with certainty.
The gaps as indicated in Table 1 are slightly smaller for the Australian and CCPM
respondents respectively (15% and 20%); not because of the expectation levels, but
because of a slightly higher level initially.
Question 6 – Working Hours I
33% of respondents typically work 47 to 53 hours, 40% between 54 to 60 hours, with
17% typically working over 60 hours per week, i.e. - over 12 hours per working day.
The average is 3.7 - (74%), along the five point scale - representing 54 to 60 hours per
week, which interpolates as over 58 hours per week or over 11.5 hours per working
day. These typical working hours are similar for the Australian CPMs (57 hours per
week) and CCPMs (59 hours per week). Interestingly, nearly all (96%) respondents
consider a typical working week should not be over 54 hours – indicating that, on
average, they consider a typical working week should be approximately 42.5 hours,
i.e. 8.5 hours per working day.
13
This question revealed one of the largest gaps when comparing the average worked
hours to the average that respondents thought should be worked, with respondents
actually working an average of 26% (or 15 hours per week) more than they thought
they should.
Question 7 – Working Hours II
The respondents were questioned further as to how they consider their working hours
compare with hours worked in general in the CI. Their responses were very
consistent with working hours being considered to be ‘average’ by many (43%) of the
total CPMs, with slightly less (38%) considering them to be, ‘slightly above average’.
The total responses represented an average of 67%, which in real terms means the
CPM’s consider their working hours to be slightly higher (7%) than the CI average.
These results were almost identical for the Australian (62%) and CCPMs (64%).
When questioned as to how long they thought their hours should be, in comparison
with the CI in general, the gap revealed this to be only a small amount (4%) above the
average – which is consistent with the figure (7%) above. Therefore, even though
regular CI hours are considered to be very high, the CPMs nevertheless thought they
should be working only slightly more than the industry average.
14
Question 8 – Full Potential and Utilisation
Question 8 concerned the candid, direct and yet simple question - ‘do they consider
their experience and abilities to be fully and efficiently utilised’. The responses were
spread evenly across the available four response choices. Even though only 2%
‘strongly disagreed’, 28% ‘disagreed’ and 33% were ‘neutral’ - the negative response
accounts for a total of 63%. However, 24% ‘agreed’, but only 14% ‘strongly agreed’,
which accounts for a positive response of only 38% - just over one third. Yet again,
the average response was very similar across all the respondent subgroups.
The answers to the accompanying question - ‘do the CPMs consider their experience
and abilities have the potential to be more fully and efficiently utilised’ indicated a
significant (17%) gap between what is being experienced and what is thought
desirable.
Question 9 – Productivity (Tasks to Satisfaction)
This question simply asked the CPMs how often in a typical week, ‘do they’ and
‘should they’, complete tasks to their own satisfaction. Overwhelmingly (91%), the
respondents acknowledged that they should ‘always’ complete tasks to their own
satisfaction. Even though still very high, they considered they were completing tasks
to their satisfaction, ‘less than always’, at 76% on average – a difference of 16% -
rounded to the nearest decimal place. This difference was slightly higher for the
Australian CPM’s (22%) and CCPM’s (24%).
15
Question 10 – Productivity (Tasks on Time)
Another simple and yet critical question was asked of the CPMs – namely ‘how often
are tasks completed on time in a typical week?’. Again, as highlighted in question 9,
an overwhelming (93%) agreement, confirmed that tasks should be completed on
time. However, they considered they were only doing so on average, 76% of the time
– a gap of 17%. It is interesting to note that the Australian CPM difference was high
(22%) with the CCPM lower (12%).
Question 11 – Productivity (Rework)
The survey results for question 11 saw the most significant differences between the
Australian and Contractor CPM’s. Again, an important area within the CI, the PMs
were asked how much of their time is typically spent carrying out ‘rework’. From the
detailed results and spread of responses, the total CPM’s and Australian CPM’s
consider they spend between 2 to 5 hours per week on rework. However, the
Contractor CPM’s spend toward 8 hours per week with rework. Even though all
CPM’s spend more time carrying out ‘rework’ than they thought they should, there
was a difference of opinion as to what amount is acceptable – with a range of nil per
week (31% of respondents), up to 2 hrs (55%), and 2 to 5 hrs per week (10%). The
gap between what does happen and what they consider should happen therefore varies
between the total CPM’s (21%), Australian (29%) and Contractor CPMs (40%).
16
Converting these percentages into actual hours suggests the unnecessary rework hours
per week for the total CPM’s, Australian and Contractor CPM’s to be 1.75, 2.5 and
3.2 hours respectively.
Question 12 – Productivity (Tasks Not Central)
The CPMs were asked how they typically spend their working time on tasks and
activities, ‘not central’ to their project workload. The results from the total and
Australian CPM’s were slightly different to those of the Contractor CPM’s, yet the
‘gaps’ were all remarkably similar (24%). On average therefore, as extrapolated from
the survey response categories, 13% of a CPM’s time is spent on activities ‘not
central’ to their project workload. Yet it was considered that less (5%) of a CPM’s
time should be spent on such activities - a difference of 8% or 4.5 hours per 58-hour
week.
Question 13 – Company Standards and Procedures
The CPMs were asked if their companies’ standards and procedures improve the
quality of their construction projects above those of the CI in general. The results
were spread almost evenly across the three positive response categories namely, ‘no
effect’, ‘improves a little’ and ‘improves a lot’. The total CPM’s and Australian
CPMs rated the influence of their companies’ standards and procedures highly (78%
and 74%) with the Contractor CPM being very high (98%). When the same CPM’s
17
responded to the second part of the question i.e. – ‘should’ their companies’ standards
and procedures improve the quality of their projects, the responses were consistently
high again. Both the total CPM’s and Australian CPMs were high (87% and 85%),
with Contractor CPM’s being lower (80%). Therefore, the gaps for the total CPM’s
and Australian CPM’s were small. However, the gap for the Contractor CPM’s was
minus 8%, which possibly suggests that these CPM’s consider their company
standards and procedures affect the quality of their projects more than they consider
they should. It was interesting to note in both parts of this question that, almost
unanimously, no respondents considered their companies standards and procedures
adversely affected the quality of their projects against those of the CI.
Question 14 – Productivity (Short Cuts)
This question revealed the largest difference of opinions between the responses of the
total, Australian and Contractor CPMs. The CPMs were asked how often ‘shortcuts’
around procedures and/or standards are necessary to keep up with their project
workloads. The gaps between the total, Australian and Contractor CPM’s were 16%,
35% and 8%, respectively. However, there was far more agreement as to what
‘should’ happen. The question was unable to clarify specifically what kind of
‘shortcuts’ were being taken. However, there is a risk – represented by the gaps
above, of CPM’s taking unnecessary shortcuts to complete their tasks and activities.
18
Question 15 – Comments towards ‘Company Standards and Procedures
Opportunity was given at the end of the questionnaire for open comments on ‘why’ or
‘in what way’, the company procedures and standards improve construction quality
above those of the industry. Many (65%) respondents provided comments to this
question. These varied, with a mixture of positive and negative views on their
companies’ standards and procedures.
Overwhelmingly, the respondents acknowledged that systems and procedures are
necessary to streamline repetitive tasks and activities to increase speed and accuracy.
Their companies’ standards and procedures were complimented as providing an
improvement on quality, time and safety standards above those of the general CI.
Their own company was able to focus more specifically on the specific needs and
establish defined minimum standards. That the systems and procedures give critical
advantages when designed and implemented well is especially important to this high
profile company and has been fully capitalised, for example, with modular
construction techniques.
However, it was acknowledged that systems and procedures, especially when
implemented badly, can restrict motivation, enthusiasm, innovation and creativity.
Some PMs suggested that their own company’s systems were too restrictive and did
not improve the quality of their projects. Bureaucracy is seen to often have a
restrictive effect on projects that need fast moving and decisive Project Management.
19
Question 16 – General Comments
Some (41%) respondents gave further comments that again provided a mixture of
positive and negative feedback. It was acknowledged that their company does use its
strength to promote good working relations with contractors, consultants and
suppliers. This provides good working relationships, or ‘partnerships’, which often
encourage innovation and creativity towards long-term supplies and services. One
example was given in which, because of an evolving relationship, a web cast video
cam was installed to monitor the progress of the construction project to save travel
time for project update meetings.
However, several respondents highlighted a number of hindrances too. Often, staff
cuts and workload increases inhibits the ability and motivation to do quality work in a
timely way. This can create a withdrawal that prevents productive communication as
well as creativity and innovation. High workloads hinder the ability of the PMs to
actively learn and thus ‘no time to save time’. For example there is often no time to
learn more about the Company’s and Industry’s latest progress and developments,
which significantly hinders innovation and creativity on a major and significant scale.
An organisation not primarily from the CI can show a lack of understanding of its
CPM. In this case, the CPM potential is often underutilised and much time is wasted
on ineffective tasks and activities. It was also commented that PMs should be
adequately supported to project-manage effectively and thus manage the project team
and projects to a higher standard.
20
CONCLUSIONS
It has been said that the effective performance of the PM is the single most critical
factor affecting successful project outcomes (Hartman, 2000; Bandow, 2001). Insofar
as the respondents of this survey are concerned, it is clear that CPMs have the
potential to be more effective in their working and more successful in the completion
of projects, with a potential to be 17 to 22% more effective and 16 to 17% more
productive in their working. Associated with this is a need for 20% more aware of
progress and developments in the CI generally, 27% more aware of progress and
developments in their own organisation, 18% more delegation of contract
administration tasks, 25% more general administrative support. Future studies, it is
suggested, should be aimed at rectifying this situation, perhaps through the
examination of the impact of alternative working practices, organisational structures
or management approaches. More efficient use of PMs in the longer term should
provoke future cost savings and benefits from active creativity and innovation. This
in turn should help project and industry stakeholders to take a stronger involvement,
leading to the project and industries improved growth and development.
A concomitant issue is the length of PMs' working hours, which by many standards is
currently very high. It is more than likely that any reduction in these current levels
will help PM’s balance of life and careers. It is also likely that more attention towards
the sociological issues involved should also help instil more interest and motivation
within the PM’s team, which often inspires improvement in people and project
outcomes.
21
To break the inefficiencies of short term planning; allowing simple and small
investments now, should have positive and compounding effects on all future, short-
terms. With these improvements it may be possible to instil a new culture of genuine
care and attention to get ‘things right first time’, to ensure the right quality projects
are produced on time at the most cost effective price, promote cost efficiencies,
avoidance of rework and care for quality. This should help improve the attitude of
industry towards the environment, and subsequently less waste and more efficient use
of resources, together with an improved health and safety of its workforce and users.
REFERENCES
Abdel-Razek, R.H. 1997: How construction PMs would like their performance to be
evaluated. Journal of Construction Engineering and Management 123(3), 208-13.
Bandow, D. 2001: Time to create sound teamwork. The Journal for Quality and
Participation 24(2), 41-7.
Banik, G.C. 2001: Construction productivity improvement: Current US perspective,
Journal of Construction Procurement 7(2), 60–71.
Bleout, A. 1998: Effects of human resource management on project effectiveness and
success: Toward a new framework, International Journal of Project Management
16(1), 21-2.
22
Cameron, I. 2002: You’re working too long, Ee Times London, 11th February 2002.
CIB report. 1996: Economics of Technology Development for the Construction
Industry with Case Studies CIB Special Report number 202, http://www.cibworld.nl/
(accessed October 2002).
Cleland, D.I. 1999: Project Management: Strategic Design and Implementation.
McGraw-Hill Book Company, Singapore.
Cooper, K.G. 1993: The rework cycle: Benchmarks for the PM. Project Management
Journal 24(1), 17-22.
Cooper, K.G. 1994: The $2,000 hour: How managers influence project performance
through the rework cycle, Project Management Journal 25(1), 11-24.
Cooper, C.L. 1998: Quality of Working Life Survey University of Manchester
Institute of Science and Technology.
Cooper, C.L. 1999: Can we live with the changing nature of work. Journal of
Managerial Psychology 14(7), 569-76.
Edum-Fotwe, F.T. 2000: Developing project management competency: Perspectives
from the construction industry. International Journal of Project Management 8(2),
111.
23
Egan, J. 1998: Rethinking construction The Report of the Construction Task Force to
the Deputy Prime Minister, John Prescott, on the scope for improving the quality and
efficiency of UK construction, chaired by Sir John Egan (The Egan Report)
http://www.dti.gov.uk/construction/rethink/report/ (accessed 18 November 2004).
Freeman, M. 2002: Doing less time. Ee Times London, 8th February 2002.
Gobeli, D., Larson, E. 1987: Relative Effectiveness of Different Project Management
Structures. Project Management Journal 18(2), 11-24.
Hartman, F.T. 2000: The Role of Trust in Project Management. PMI Research
Conference 2000. Alberta: Canada.
Horner, R.M.W., Talhouni, B.T. 1995: Effects of accelerated working, delays and
disruption on labour productivity. The Chartered Institute of Building Kings Ride,
Englemere, UK.
Jassawalla, A.R., Sashittal, H.C. 1999: Building collaborative cross-functional new
product teams. The Academy of Management Executive 13(3), 50-63.
Josephson, P.E, Larsson, B., Li, H. 2002: Illustrative benchmarking rework and
rework costs in Swedish construction industry. Journal of Management in
Engineering 18(2), 76-83.
24
Kaming, P.F., Holt, G.D., Kometa, S.T., Olomolaiye, P.O. 1998: Severity diagnosis of
productivity problems – a reliability analysis. International Journal of Project
Management 16(2), 107-13.
Kodz, J., Kersley, B., Strebler, M. 1998: Breaking the Long Hours Culture. Institute
for Employment Studies, issue 352. 1369-4987
Latham, M. 1994: Constructing the Team. HMSO, London.
Leonard, C., Fanning, N., Attwood, J., Buckley, M. 1998: The effect of fatigue, sleep
deprivation and onerous working hours on the physical and mental wellbeing of pre-
registration house officers. Irish Journal of Medical Science 167(1), 22-5.
Love, P. 1999: Driving productivity in product innovation. Management Services
45(1), 8-13.
Love, P.E.D., Holt, G.D., Shen, L.Y., Irani, Z. 2002: Using systems dynamics to
better understand change and rework in construction project management systems.
International Journal of Project Management 20, 425-36.
McKenna, P. J. 1998: Play Nice, Partners. The American Lawyer 12(4), 40.
Nicolini, D. 2002: In search of Project Chemistry. Construction Management and
Economics 20, 167-77.
25
Odusami, K.T. 2002: Perceptions of construction professionals concerning important
skills of effective project leaders. Journal of Management in Engineering 18(2), 61-7.
Pfeffer, J., Veiga, J.F. 1999: Putting people first for organisation success. The
Academy of Management Executive 13(2), 37-48.
Pinto, J.K. 2000: Understanding the role of politics in successful project management.
International Journal of Project Management 18, 85-91.
Pinto, J.K. 2002: Project Management 2002. Research Technology Management
45(2), 22-37.
Pinto, J.K., Kharbanda, O.P., 1995: Successful PMs. New York, Van Nostrand
Reinhold.
Pinto, J.K., Slevin, D.P. 1989: The project champion: Key to implementation success.
Project Management Journal 20(4), 15-20.
Ramo, H. 2002: Doing things right and doing the right things. Time and timing in
projects. International Journal of Project Management 20(7), 569-74.
Sparks, K. 2002: The job of finding employment on the web. Library Journal 127(8),
28.
26
Sparks, K., Faragher, B., Cooper, C.L. 2001: Well being and occupational health in
the 21st century workplace. Journal of Occupational and Organisational Psychology
74(4), 489-509.
Thoms, P., Pinto, J.K. 1999: Project Leadership: A Question of timing. Project
Management Journal 30(1), 19-16.
Veninga, R.L. 2000: Productivity through people: Managing organisations in the new
millennium. Institute of Management Services 44(6), 28-9.
Webb, A. 2000: Project Management for successful Product Innovation. International
Journal of Project Management 20(8), 456.
Winch, G.M. 2000: Institutional reform in British Construction: partnering and
private finance. Building Research and Information 28(2), 141-55.
Woodward, J.F. 1997: Construction project management: Getting it right first time.
London, Thomas Telford Publishing.
Worrall, L., Cooper, C.L. 1999: Working patterns and working hours: their impact on
UK managers. Leadership and Organization Development Journal 20(1), 6-10.
27
Table 1: What ‘currently happens’ vs what ‘should happen’)
Question Literature Review and Research Area.
Respondent Group Currently happens %)
Should happen (%)
Response choices along the five point scale
1 (1a) Innovation & Creativity
Total Australian Contractor
62 55 52
84 85 72
Not aware to Highly Aware
2 (2a) Innovation & Creativity
Total Australian Contractor
52 55 68
79 78 84
Not aware to Highly Aware
3 (3a) Innovation & Creativity
Total Australian Contractor
62 55 64
67 64 56
Not at all, to on a Daily Basis
4 (4a) Productivity. (Contract Admin Support)
Total Australian Contractor
58 60 72
77 78 84
Never to Always
5 (5a) Productivity. (General Admin Support)
Total Australian Contractor
57 67 68
82 82 88
Never to Always
6 (6a) Working Hours Total Australian Contractor
73 71 76
47 49 44
Less than 40hrs per week to Above 60hrs per week.
7 (7a) Working Hours Total Australian Contractor
67 62 64
62 64 60
Way below average to Highly Above Average
8 (8a) Full Potential & Utilisation.
Total Australian Contractor
64 62 60
81 84 80
Strongly disagree to Strongly agree
9 (9a) Productivity. (Tasks to Satisfaction)
Total Australian Contractor
76 69 72
91 91 96
Never to Always
10 (10a) Productivity. (Tasks on Time)
Total Australian Contractor
76 71 72
93 93 84
Never to Always
11 (11a) Productivity. (Rework)
Total Australian Contractor
57 58 76
36 29 36
None to Over 8 hours per week
12 (12a) Productivity. (Tasks Not Central)
Total Australian Contractor
66 65 60
42 40 36
Never to Always
13 (13a) Innovation & Creativity + Productivity. (Company Standards & Procedures)
Total Australian Contractor
78 75 88
87 85 80
Worsens a lot to Improves a lot
14 (14a) Productivity. (Short Cuts)
Total Australian Contractor
57 69 48
42 35 40
Never to Always
Related Documents