POWER MONITORING SYSTEM 1 INTRODUCTION

Welcome message from author
This document is posted to help you gain knowledge. Please leave a comment to let me know what you think about it! Share it to your friends and learn new things together.
Transcript

POWER MONITORING SYSTEM
1
INTRODUCTION

POWER MONITORING SYSTEM
2
1. INTRODUCTION
With the electric industry undergoing changes, increased attention is being focused on power
supply reliability and power quality. Power providers and users alike are concerned about
reliable power, whether the focus is on interruptions and disturbances or extended outages.
One of the most critical elements in ensuring reliability is monitoring power system
performance. Monitoring can provide information about power flow and demand and help
identity the cause of power system disturbances. It can even help identity problem conditions
on a power system before they cause interruptions or disturbances.
Effective monitoring programs are important for power reliability assurance for both utilities
and customers. While power quality problems can do occur on utility power systems, many
surveys have shown that most customer power quality problems originate within the
customer facility. With this in mind, it is clear that monitoring is essential for both power
suppliers and users to ensure optimal power system performance and effective energy
management.
Key to the success of an effective monitoring program is flexibility, powerful data
processing, understandable reports and easy access to information. The emergence of the
Internet and intracompany intranets has made this possible, allowing quick viewing of data
that assures effective decision-making and fast responses time. Event notification and
program scalability are also critical for addressing the ever-changing environment of the
energy business.
Through this project we try to give an effective and cost power monitoring system.

POWER MONITORING SYSTEM
3
PROJECT
SELECTION

POWER MONITORING SYSTEM
4
2. PROJECT SELECTION
To build a power monitoring system requires that the input voltage and current be measured
and then multiplied with each other to give the active power. The power factor also needs to
be considered for complex loads. The most reliable method to do this is using digital
techniques. A popular solution to this end is developed by Analog Devices.
This device is the ADE 7756 for single phase and ADE7754 (The three phase counterpart).
This IC samples the input voltage and current waves to obtain a high resolution digital
number .It perform instant multiplication and give the output as the active power.
It further proceeds to integrate the power to obtain a 40-bit energy value. It thus combines the
functions of a power meter and an energy meter in a single monolithic IC.
The IC however was not available in the local market and the interfacing with the micro-
controller is difficult. The documentation available about this IC was also limited to the
datasheets and application notes supplied by the manufacturer.
A much more economical option is the AVR ATMEGA 16 Micro-controller [1].
Features of AT MEGA16 are:
1. It is an 8-bit AVR micro-controller with 16k Bytes In-System programmable flash.
2. It also has 8-channel, 10-bit ADC.
3. 8 single-ended channels.
4. 7 Differential Channels in TQFP Package only.
5. 2 Differential Channels with Programmable Gain at 1x, 10x, or 100x.
6. Programmable using serial UART.
7. On chip Analog Comparator. AVR Micro-controller with 16k Bytes In-System
programmable flash.

POWER MONITORING SYSTEM
5
This AVR AT MEGA 16 micro-controller is faster than the ATMEL 89C51, which works on
1MHz frequency where as AVR works on 12MHz speed. That means 12 times more number
of instructions per sample.
AVR on a general purpose board has been used for project implementation. Many extra
features have been incorporated for future use and improvements.
The kit has buzzer on board and motor driving IC, which is useful to indicate when the
voltage or power exceeds the certain threshold value. And motor IC can be used to cut of the
supply by activating a relay.

POWER MONITORING SYSTEM
6
WORKING
PRINCIPLE

POWER MONITORING SYSTEM
7
3. WORKING PRINCIPLE
The aim is to electronically measure the power consumed by a load.
P=V x I x cos phi.
R = V x I x sin phi
Where
P= active power (Watts)
R=Reactive power (Watts)
V=RMS value of voltage (Volts)
I=RMS value of current (Amperes)
Phi=phase angle between voltage and current (deg or radian)
Instead of the RMS values, some dc equivalent values have been obtained corresponding to
the amplitudes of the voltage and current sinusoidal. The equivalent values bearing a linear
relationship with the RMS values. A DC equivalent voltage for phi is also obtained. These dc
equivalent voltages are given as input to different channels of an Analog to digital converter,
which comes up with 8-bit of digital data.
This data is then read by the microcontroller and stored in the internal registers. The
microcontroller proceeds to multiply the voltages and current values to obtain V x I.
Cos (phi) is obtained by a look-up table and then multiplied to get a final result.
The power is integrated by the process of accumulation to obtain the energy.
E=Integration of PDF
The integration time is adjusted to be exactly 1 second, including he programs delays by
adding a separate delay subroutine, so as to get the energy in mW-sec.
The results are displayed on an illuminated LCD screen for direct reading as also transmitted
on the serial interface. The microcontroller being programmable can be used to link up most
of the parallel interface.

POWER MONITORING SYSTEM
8
DESIGN
IMPLEMENTATION
POWER MONITORING SYSTEM
9
4. DESIGN IMPLEMENTATION
The power monitoring system developed consists of electronic hardware as well as software
embedded inside it. The software makes the system upgradable and more flexible. More
features can be easily added and unnecessary ones removed. Various digital communication
interface can be programmable to link together many devices and to a central computer as
well.
4.1 BLOCK DIAGRAM
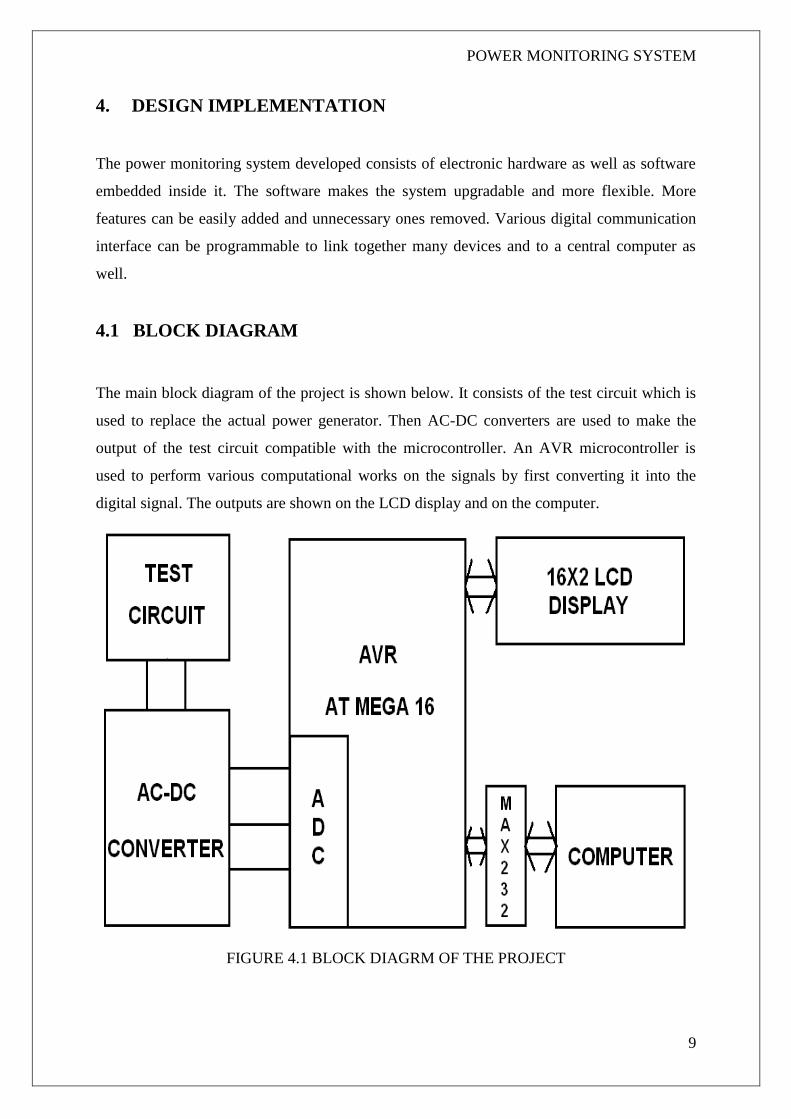
The main block diagram of the project is shown below. It consists of the test circuit which is
used to replace the actual power generator. Then AC-DC converters are used to make the
output of the test circuit compatible with the microcontroller. An AVR microcontroller is
used to perform various computational works on the signals by first converting it into the
digital signal. The outputs are shown on the LCD display and on the computer.
FIGURE 4.1 BLOCK DIAGRM OF THE PROJECT

POWER MONITORING SYSTEM
10
4.2 ANALOG CIRCUITS
The analog circuit is responsible for feeding the inputs of the ADC with the dc equivalent
values from the load circuit.
The load circuit has high values voltage and current values that are initially stepped down
using CTs and PTs (current and potential transformers) to low voltage sine waves.
These sine waves are rectified using precision rectifiers to get full-wave rectified signal. This
signal can then be low-pass filtered to obtain the dc value of the rectified wave. The precision
rectifier uses 1N4148 diodes along with the low-offset op-amp to perform rectification.
The phase detection circuit comprises of two zero crossing detectors that convert the stepped
down sine wave to square waves, the square waves are ANDed to obtain the region of
overlap. The duty cycle of this wave thus depends on the phase difference.
There are overall three analog circuits used viz., test circuit, ac-dc converter and phase
differentiator. [2] [3]
Detailed analysis and discussions will be made ahead.

POWER MONITORING SYSTEM
11
4.2.1 TEST CIRCUIT
For the test circuit, a voltage source is given to an op-amp based amplifier. The o/p is then
passed through a RC filter to introduce a phase shift and this current is given to a current
amplifier with variable gain. The phase difference between the output signals can be
adjustable from 0 to 90 degree, by using the circuit adjustment provided on the board.
Thus adjustable values of ac current and ac voltage are obtained to determine system
performance.
FIGURE 4.2.1 TEST CIRCUIT
The above circuit has been designed to get output identical to that obtained using the actual
power generator machine.
POWER MONITORING SYSTEM
12
4.2.2 AC TO DC CONVERTOR
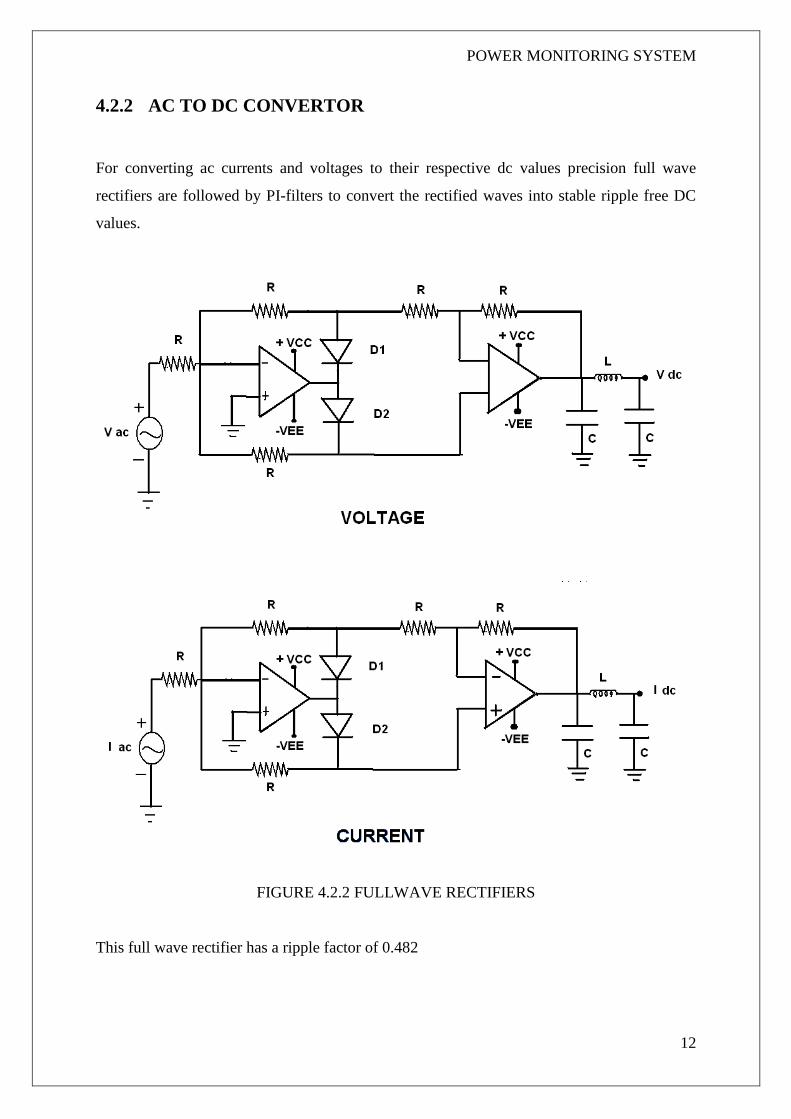
For converting ac currents and voltages to their respective dc values precision full wave
rectifiers are followed by PI-filters to convert the rectified waves into stable ripple free DC
values.
FIGURE 4.2.2 FULLWAVE RECTIFIERS
This full wave rectifier has a ripple factor of 0.482
POWER MONITORING SYSTEM
13
4.2.3 PHASE DIFFERENCE MEASUREMENT CIRCUIT
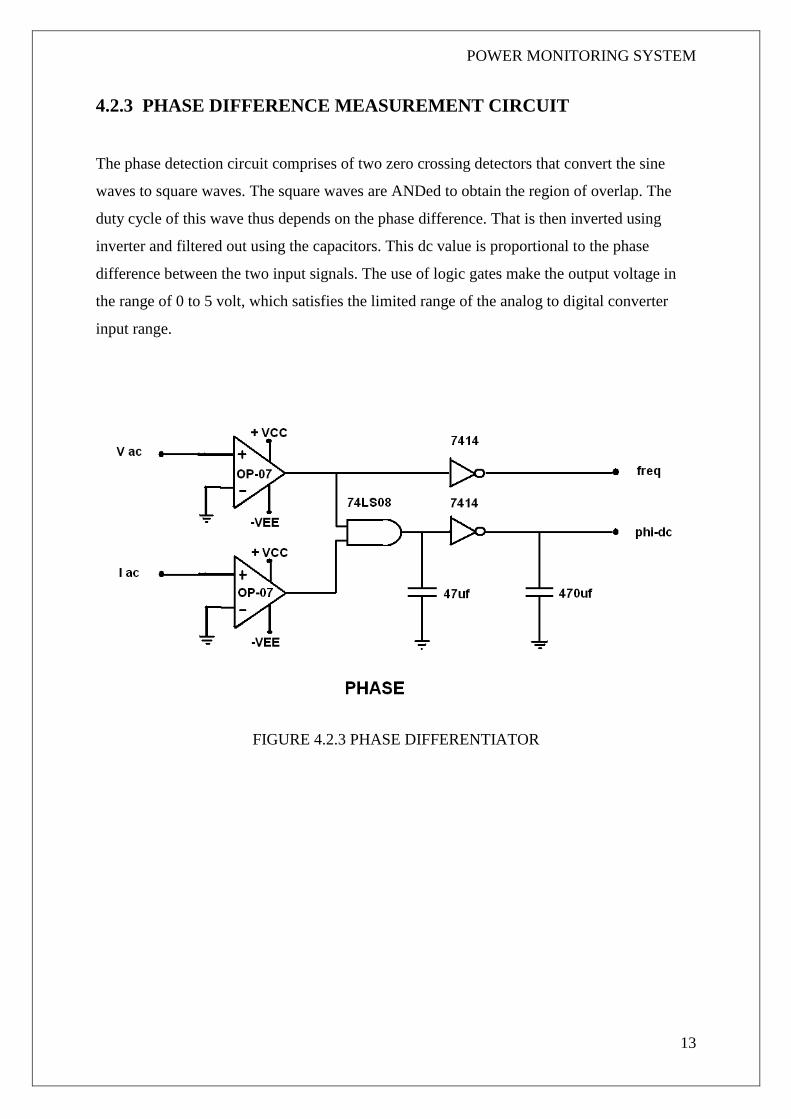
The phase detection circuit comprises of two zero crossing detectors that convert the sine
waves to square waves. The square waves are ANDed to obtain the region of overlap. The
duty cycle of this wave thus depends on the phase difference. That is then inverted using
inverter and filtered out using the capacitors. This dc value is proportional to the phase
difference between the two input signals. The use of logic gates make the output voltage in
the range of 0 to 5 volt, which satisfies the limited range of the analog to digital converter
input range.
FIGURE 4.2.3 PHASE DIFFERENTIATOR

POWER MONITORING SYSTEM
14
The working of the phase differential is explained as below.
The two OP-AMPs are used to convert the sine wave signal to square wave signal. Two such
square wave signals is shown here. One represents the voltage signal and other represents the
current signal.
FIGURE 4.2.3.a VOLTAGE SIGNAL
FIGURE 4.2.3.b CURRENT SIGNAL
These two signals are not in the same phase. When this two signals are given to an AND gate
as an input. The output is also a square wave. The wave is high only when both the signals
are high. That is, at the overlap period only. The wave which we get is as shown below.
FIGURE 4.2.3.c PHASE SIGNAL
This square wave is then passed to filter using a capacitor. The output is then a dc voltage.
When there is no phase difference in the voltage and current signal the output wave is a
perfect square wave and the equivalent output dc voltage is at some fixed high level. And
when there is 90 degree phase shift between voltage and current the output at the AND gate is
zero, with zero dc voltage. Thus at the end we have used an inverter to give output in such a
way that when there is no phase difference output is zero dc voltage and when there is 90
degree phase difference output is high dc voltage.

POWER MONITORING SYSTEM
15
4.3 THE MICROCONTROLLER
The AVR has been selected mainly for its low cost along with the built in ADC. It is fast in
operation as it performs 12 instructions per cycle. It has build in ADC which performs analog
to digital converter.
A general purpose board has been used. There are some extra components on the board which
can be used for further advancements in project.
Port A is used as ADC which is a build in the microcontroller.
Port B is used for LED interface.
Port C is used for LCD interface.
Port D is used for speaker output.
FIGURE 4.3 PIN DIAGRAM

POWER MONITORING SYSTEM
16
4.4 THE LIQUID CRYSTAL DISPLAY
A standardized 16 by 2 implies 2 lines with 16 characters each display the power and energy.
The LCD is equipped with its own RAM and has control words for a fully flexible display
scheme. Backlighting is available and is used for a power read out even during dim-light
conditions. The backlight can be switched off to reduce power consumption.
The LCD has a contrast adjustment facility which requires a 10k ohm pot to vary the
character contrast. 3 control lines and 8 data lines contribute the remainder.
Control lines:
RS (Register Select) 1 - Command register
0 – Data register
R/W 1 – Read
0 – Write
EN 1 – Enables Bus
0 – Disable Bus
Data Lines:
DB7 – DB0 To carry command and data to the LCD
FIGURE 4.4 LCD DISPLAY
16 x 2 LCD DISPLAY
CONNECTING PINS

POWER MONITORING SYSTEM
17
4.5 MAX-232
The MAX 232 is required for the RS-232 interface. The microcontroller transmits data to the
PC on the serial port (COM 5).
The RS-232 standard dictates the voltage levels as -3 to -15 volts for logic 1 and +3 to +15 V
for logic 0. It provides 2-channel RS232C port and requires external 10uF capacitors. The
MAX 232 converts the circuit voltage of 0-5 volt to the RS-232 levels.
The communication parameters are as follows:
1) 8 DATA
2) 1 stop bit
3) No parity
4) Asynchronous
The serial connector can be directly connected to serial port of the computer. Since now a day
USB is widely used, here we have used the Serial to USB converter. Using the serial to USB
convertor kit, it can be directly connected to computer through USB connector.
The microcontroller is set to transmit the data at a baud rate of 56000. At 56000 baud rate the
allowed baud rate error is 0.8%.
POWER MONITORING SYSTEM
18
4.6 CIRCUIT BOARD
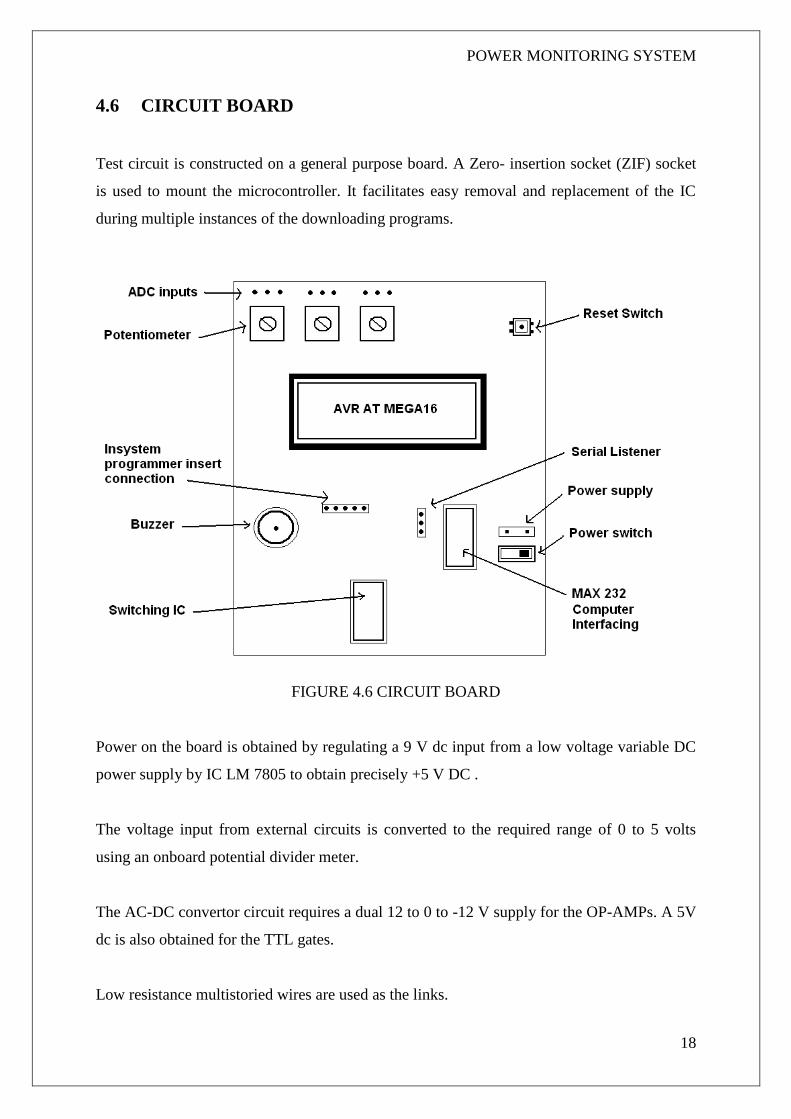
Test circuit is constructed on a general purpose board. A Zero- insertion socket (ZIF) socket
is used to mount the microcontroller. It facilitates easy removal and replacement of the IC
during multiple instances of the downloading programs.
FIGURE 4.6 CIRCUIT BOARD
Power on the board is obtained by regulating a 9 V dc input from a low voltage variable DC
power supply by IC LM 7805 to obtain precisely +5 V DC .
The voltage input from external circuits is converted to the required range of 0 to 5 volts
using an onboard potential divider meter.
The AC-DC convertor circuit requires a dual 12 to 0 to -12 V supply for the OP-AMPs. A 5V
dc is also obtained for the TTL gates.
Low resistance multistoried wires are used as the links.

POWER MONITORING SYSTEM
19
ICs are mounted in their corresponding sockets so as to make them replaceable.
A power ON pilot LED indicates the power on the board.
The 16 lines of the LCD are taken out as flat ribbon cable (FRC) and connected
independently to the LCD display.
The hardware sets up the base for the system. Rest of the work is done by the software inside
the microcontroller.

POWER MONITORING SYSTEM
20
4.7 THE MICROCONTROLLER PROGRAM
After getting the digitized current and current voltages values the micro controller has to
perform the following functions.
Initialize the LCD
Initialize the serial port
Voltage, current and phi values are multiplied and displayed on the LCD and sent to the
PC on the serial port.
The algorithm stated below is followed to develop the program-code.
1. Assign suitable variables for different parameters.
2. At the start, a function named “ read_adc ” has been declared. This function is used for
converting the analog voltage given to the microcontroller ADC pins to convert it into the
equivalent digital value.
3. Port A of the microcontroller is actually an ADC port. When the microcontroller is used
as ADC the analog voltages are given to this port. ADC conversion can be set to 8-bit or 10-
bit conversion. With 8-bit conversion maximum measurement of 0.053V is obtained which is
enough for project & 8-bit conversion is used. The input voltage range for ADC port is 0-5
Volts. The method used here is a SAR i.e. successive approximation method. The reference
voltage for the conversion is set to variable so that measurement of voltages more than the 5
V is possible by adjusting the potentiometer.
4. Port B is assigned as output port for running the LEDs. Port there are 8 LEDs
connected to the port B which are used for displaying the current status of the
microcontroller. Whenever the specific conversion is done it is displayed by its LED
indication if something exceeds its threshold value. Its respective LED set on for the
notification. When the system is halt due to some problem then it is indicated by the red LED
which blinks.
5. Port C is initialized for the LCD interface and port D is initialized for buzzer.

POWER MONITORING SYSTEM
21
6. Initialize LCD. The LCD static information includes setting of function data length to
8-bits, number of lines to be used to 2, and font of 5x7, display control word bits set
accordingly to blink cursor on/off, clearing display screen for refreshing of data (power and
energy).
7. Serial port initialization includes setting the USART parameters. It is set as receiver in
asynchronous mode. With baud rate of 56000. And communication parameters as 8-bits,
1 – stop bit and No parity.
8. The voltage, current and phase are given to pins 0 to 2 of port A respectively. Read the
voltage value includes.
a. The function named “read_adc” is used and the digital output voltage is
taken into some variable. Then accordingly it is multiplied 5000/255 ratio
to convert it into the equivalent Volts.
b. The voltage value is check against the threshold value. If it is greater than
the threshold then alarm is set to ON. If it is below the threshold value then
it continues.
9. For measuring the current and phase the same procedure as that of voltage is done.
10. In one cycle the microcontroller takes value of each parameter and then calculates the
power. This cycle continues ten times and at the end of each cycle new power is calculated.
Such ten values of the power are then added together to calculate the energy of this ten
cycles. The time period of one energy cycle is of one second i.e. after one second new value
is calculated. Whenever new energy value is calculated it is displayed on the LCD and at the
same time it is send over the serial cable to the computer.
11. In this way the microcontroller takes various parameters value and then calculates some
new parameters for the monitoring purpose.
12. The threshold limit for any parameter can be change by reprogramming the
microcontroller using the parallel port. It can also be changed by adjusting the potentiometer.

POWER MONITORING SYSTEM
22
SCREEN MONITORING
POWER MONITORING SYSTEM
23
5. SCREEN MONITORING
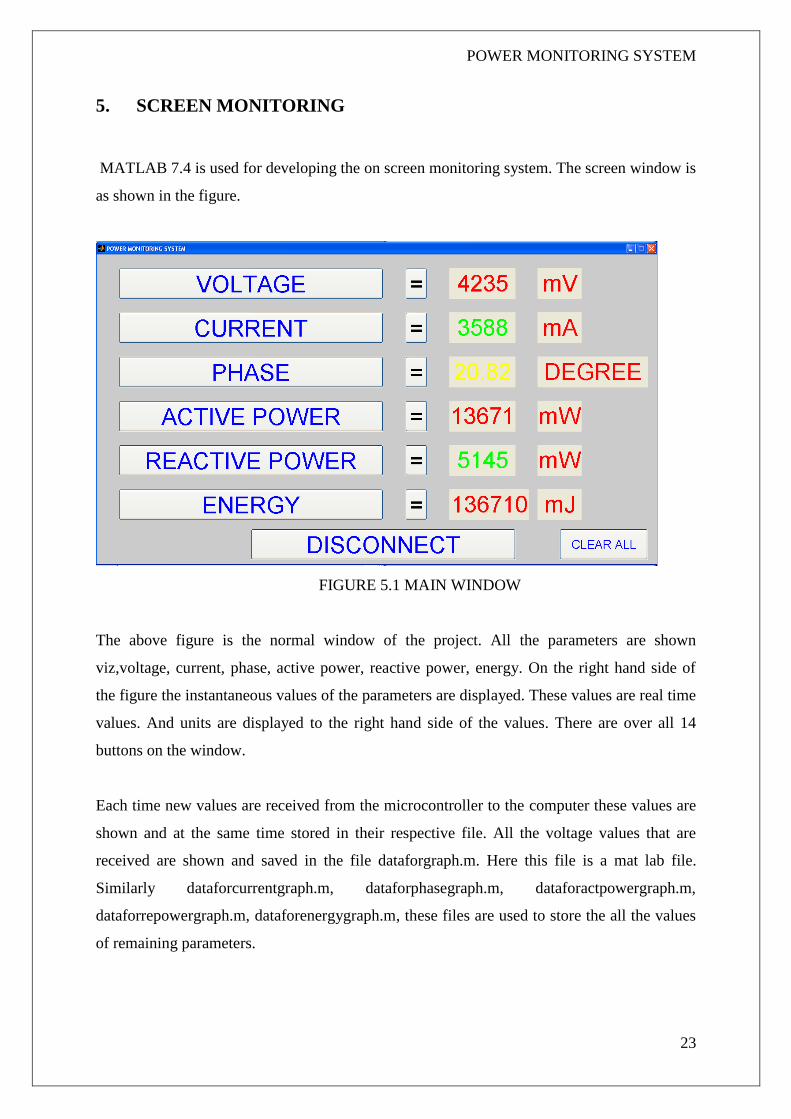
MATLAB 7.4 is used for developing the on screen monitoring system. The screen window is
as shown in the figure.
FIGURE 5.1 MAIN WINDOW
The above figure is the normal window of the project. All the parameters are shown
viz,voltage, current, phase, active power, reactive power, energy. On the right hand side of
the figure the instantaneous values of the parameters are displayed. These values are real time
values. And units are displayed to the right hand side of the values. There are over all 14
buttons on the window.
Each time new values are received from the microcontroller to the computer these values are
shown and at the same time stored in their respective file. All the voltage values that are
received are shown and saved in the file dataforgraph.m. Here this file is a mat lab file.
Similarly dataforcurrentgraph.m, dataforphasegraph.m, dataforactpowergraph.m,
dataforrepowergraph.m, dataforenergygraph.m, these files are used to store the all the values
of remaining parameters.
POWER MONITORING SYSTEM
24
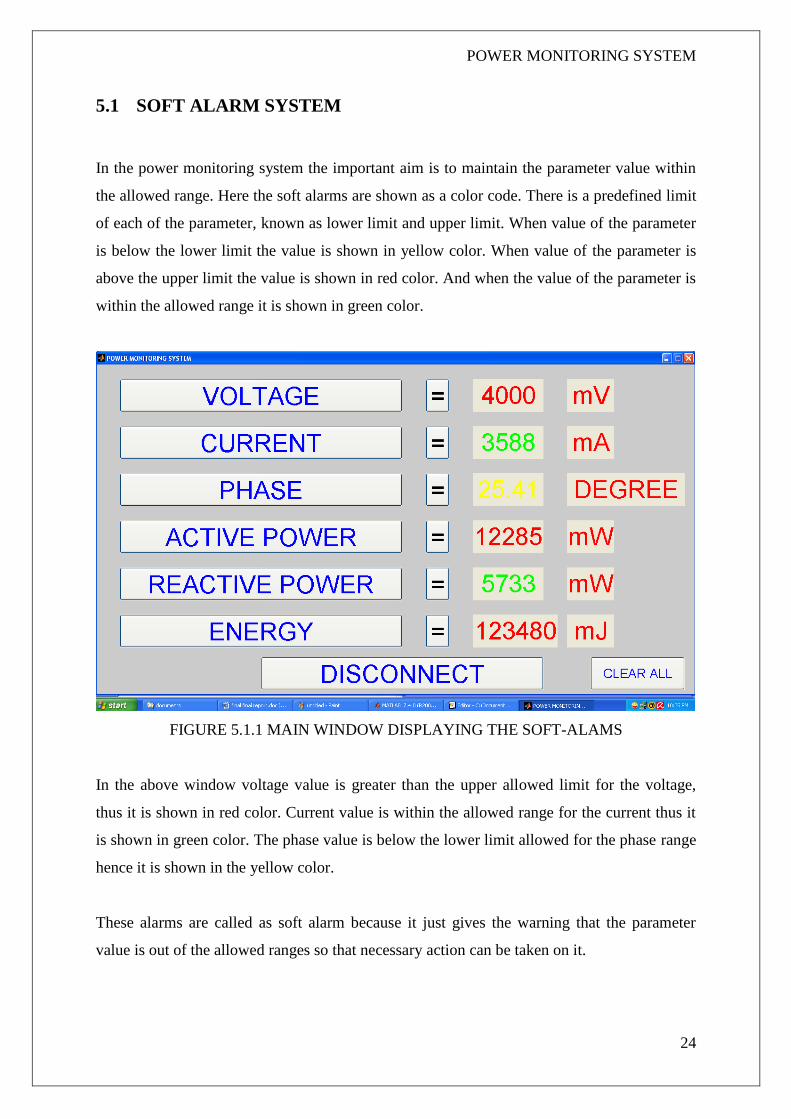
5.1 SOFT ALARM SYSTEM
In the power monitoring system the important aim is to maintain the parameter value within
the allowed range. Here the soft alarms are shown as a color code. There is a predefined limit
of each of the parameter, known as lower limit and upper limit. When value of the parameter
is below the lower limit the value is shown in yellow color. When value of the parameter is
above the upper limit the value is shown in red color. And when the value of the parameter is
within the allowed range it is shown in green color.
FIGURE 5.1.1 MAIN WINDOW DISPLAYING THE SOFT-ALAMS
In the above window voltage value is greater than the upper allowed limit for the voltage,
thus it is shown in red color. Current value is within the allowed range for the current thus it
is shown in green color. The phase value is below the lower limit allowed for the phase range
hence it is shown in the yellow color.
These alarms are called as soft alarm because it just gives the warning that the parameter
value is out of the allowed ranges so that necessary action can be taken on it.

POWER MONITORING SYSTEM
25
5.2 SOFT ALARM SETTING
All the limits that set the soft alarm can be changed at the run time.
The button marked as „=‟ in front of every parameter is used for setting the limit for that
parameter.
When the „=‟ button is pressed the command window is opened. It is as shown below.
FIGURE 5.2.1 SOFT-ALARMS SETTING
When the command window popup, values can be entered.
It can be entered as [upper limit lower limit]. First the upper limit and then the lower limit of
that parameter is entered in a square bracket. And then pressing the return key will set the
new range for that parameter.
In the above example voltage limit is to be set. So enter the new limit. The new limits are
4000 and 1000. So when voltage exceeds upper limit it will be shown in red color and when
voltage is below the lower limit it will be shown in yellow and when it is in allowable range
it will be shown in green.
POWER MONITORING SYSTEM
26
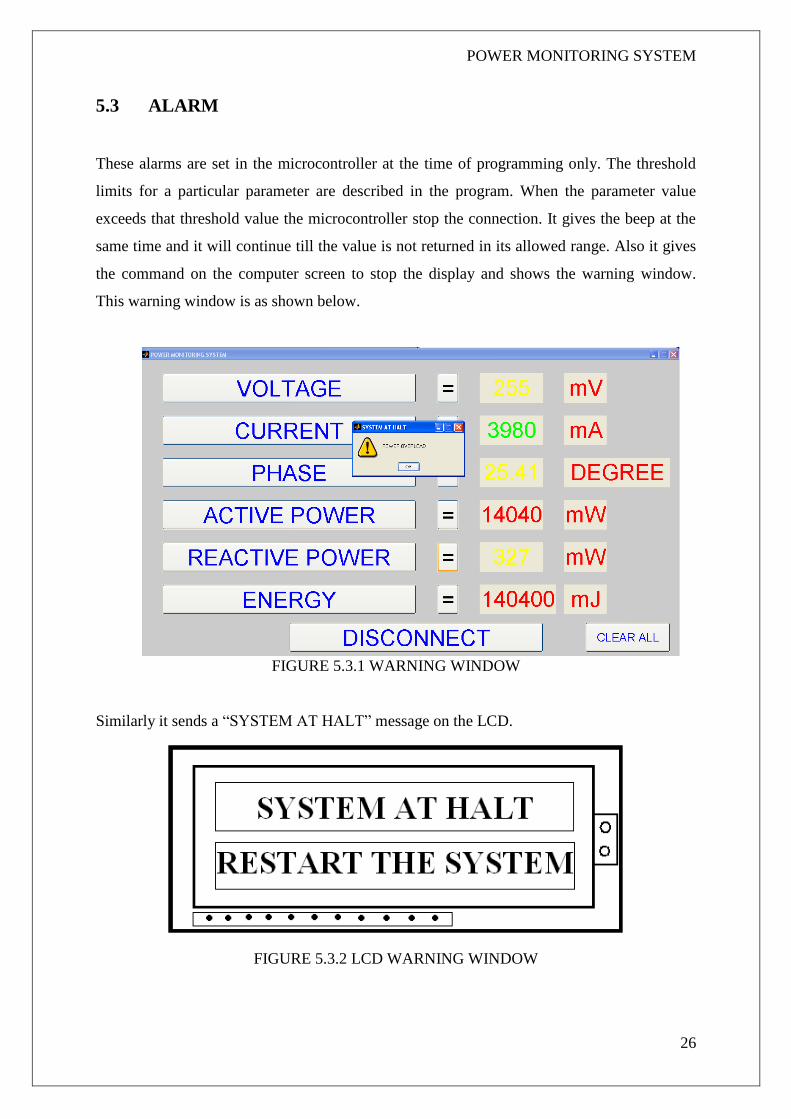
5.3 ALARM
These alarms are set in the microcontroller at the time of programming only. The threshold
limits for a particular parameter are described in the program. When the parameter value
exceeds that threshold value the microcontroller stop the connection. It gives the beep at the
same time and it will continue till the value is not returned in its allowed range. Also it gives
the command on the computer screen to stop the display and shows the warning window.
This warning window is as shown below.
FIGURE 5.3.1 WARNING WINDOW
Similarly it sends a “SYSTEM AT HALT” message on the LCD.
FIGURE 5.3.2 LCD WARNING WINDOW
POWER MONITORING SYSTEM
27
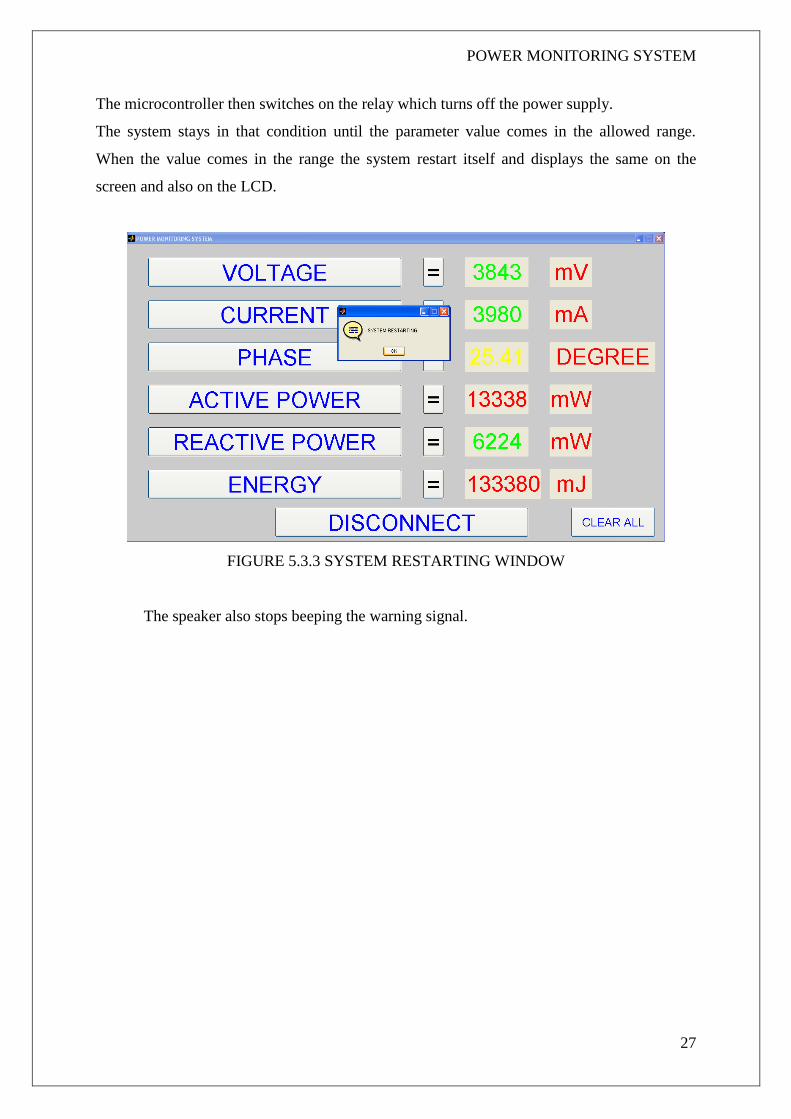
The microcontroller then switches on the relay which turns off the power supply.
The system stays in that condition until the parameter value comes in the allowed range.
When the value comes in the range the system restart itself and displays the same on the
screen and also on the LCD.
FIGURE 5.3.3 SYSTEM RESTARTING WINDOW
The speaker also stops beeping the warning signal.
POWER MONITORING SYSTEM
28
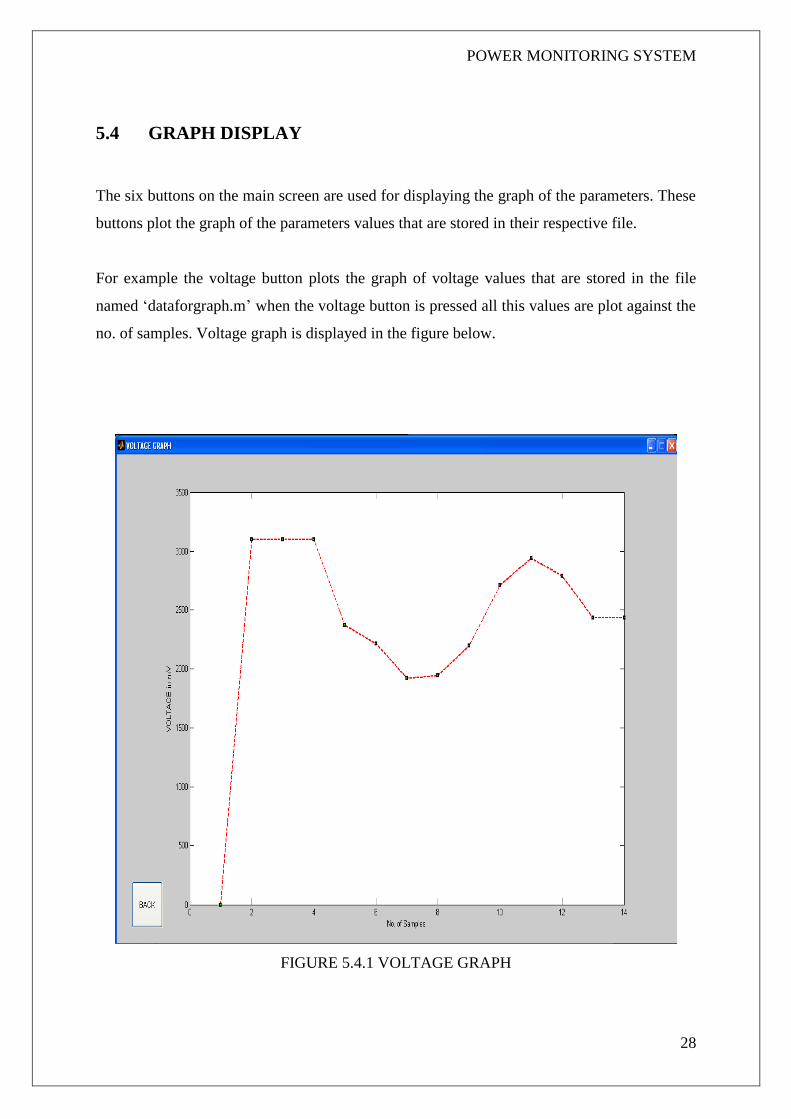
5.4 GRAPH DISPLAY
The six buttons on the main screen are used for displaying the graph of the parameters. These
buttons plot the graph of the parameters values that are stored in their respective file.
For example the voltage button plots the graph of voltage values that are stored in the file
named „dataforgraph.m‟ when the voltage button is pressed all this values are plot against the
no. of samples. Voltage graph is displayed in the figure below.
FIGURE 5.4.1 VOLTAGE GRAPH
POWER MONITORING SYSTEM
29
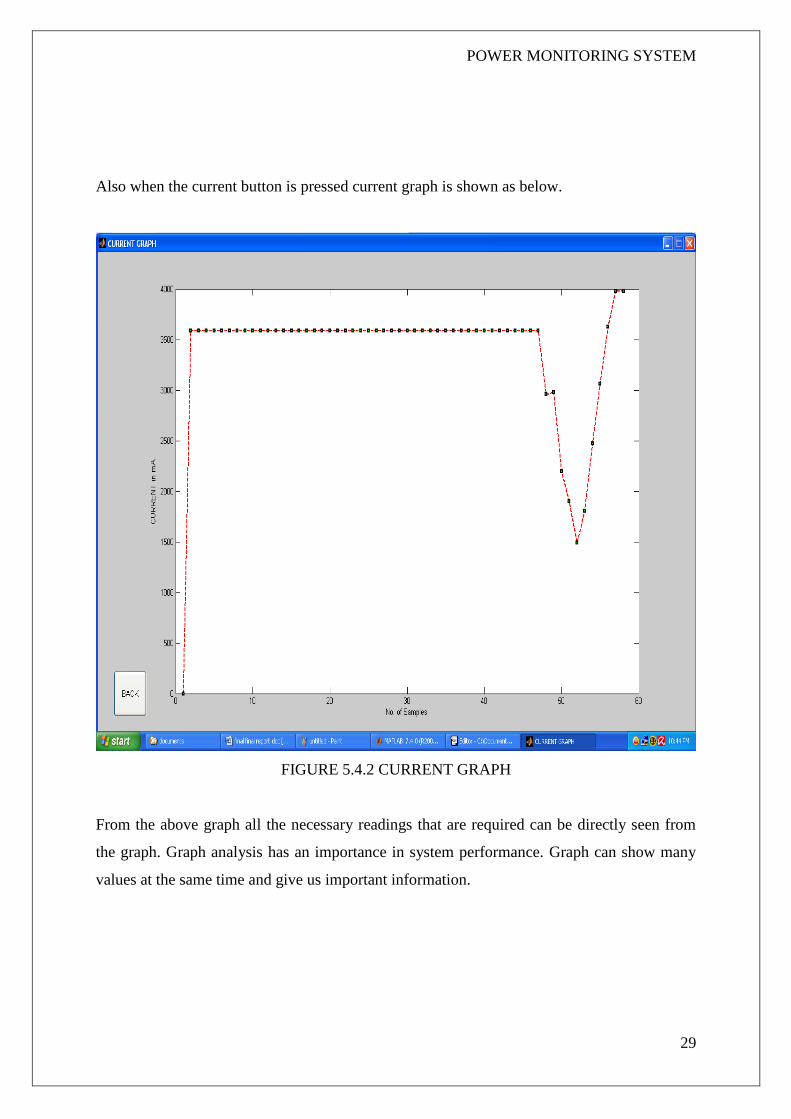
Also when the current button is pressed current graph is shown as below.
FIGURE 5.4.2 CURRENT GRAPH
From the above graph all the necessary readings that are required can be directly seen from
the graph. Graph analysis has an importance in system performance. Graph can show many
values at the same time and give us important information.
POWER MONITORING SYSTEM
30
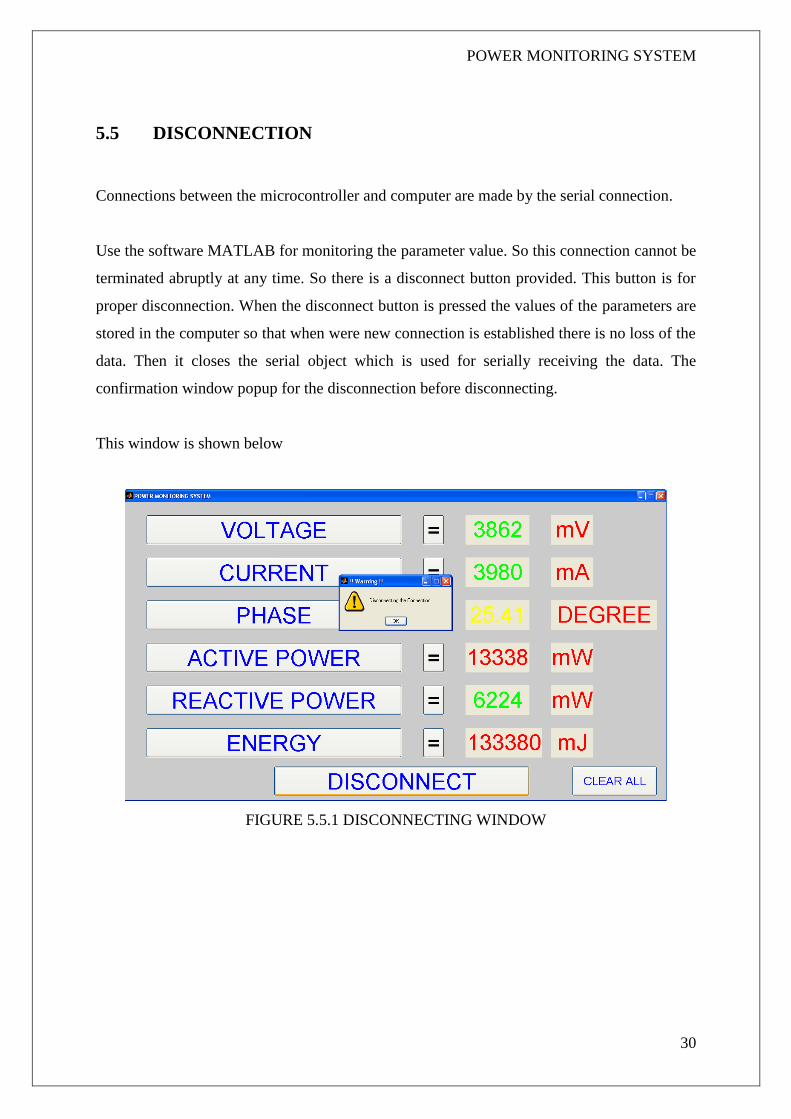
5.5 DISCONNECTION
Connections between the microcontroller and computer are made by the serial connection.
Use the software MATLAB for monitoring the parameter value. So this connection cannot be
terminated abruptly at any time. So there is a disconnect button provided. This button is for
proper disconnection. When the disconnect button is pressed the values of the parameters are
stored in the computer so that when were new connection is established there is no loss of the
data. Then it closes the serial object which is used for serially receiving the data. The
confirmation window popup for the disconnection before disconnecting.
This window is shown below
FIGURE 5.5.1 DISCONNECTING WINDOW

POWER MONITORING SYSTEM
31
5.6 CLEARING THE DATA
All the data that are stored in the computer can be cleared or delete using this „Clear All‟
button. When Clear All button is pressed the all the data that contains the all parameter values
stored in computer are deleted. This data is useful in plotting the graphs. So for plotting new
graphs this button is used.

POWER MONITORING SYSTEM
32
INDUSTRIAL
IMPLEMENTATION
POWER MONITORING SYSTEM
33
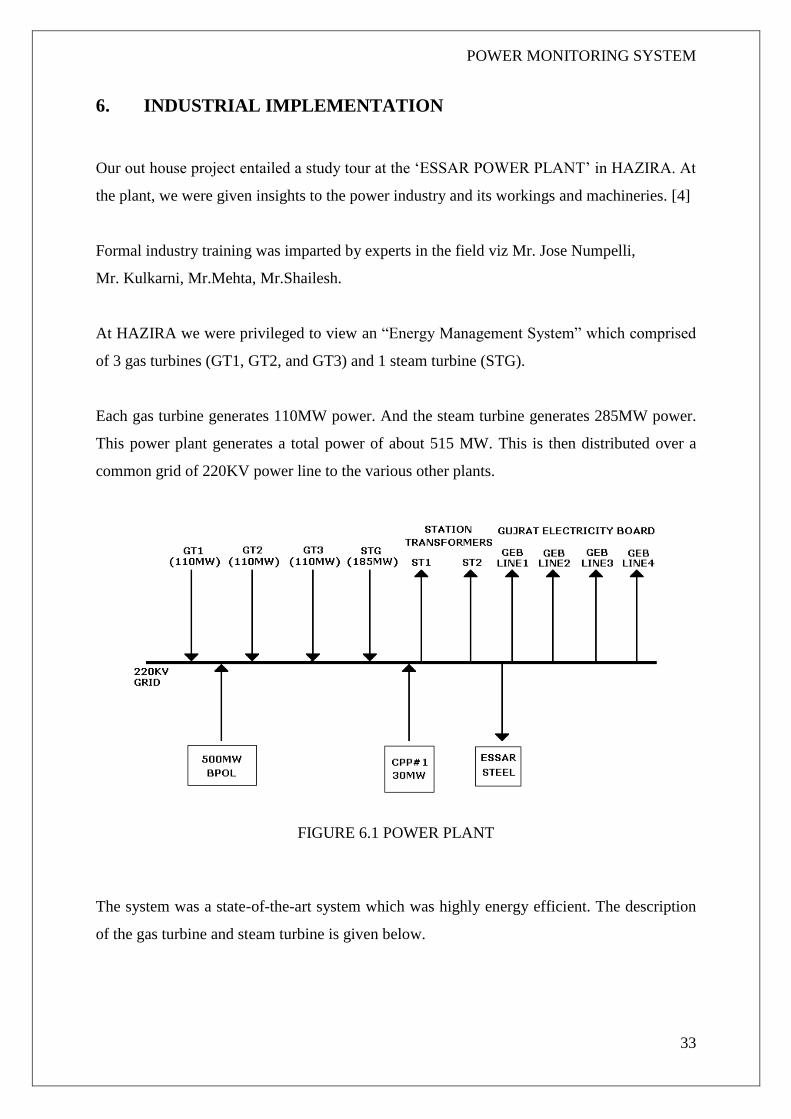
6. INDUSTRIAL IMPLEMENTATION
Our out house project entailed a study tour at the „ESSAR POWER PLANT‟ in HAZIRA. At
the plant, we were given insights to the power industry and its workings and machineries. [4]
Formal industry training was imparted by experts in the field viz Mr. Jose Numpelli,
Mr. Kulkarni, Mr.Mehta, Mr.Shailesh.
At HAZIRA we were privileged to view an “Energy Management System” which comprised
of 3 gas turbines (GT1, GT2, and GT3) and 1 steam turbine (STG).
Each gas turbine generates 110MW power. And the steam turbine generates 285MW power.
This power plant generates a total power of about 515 MW. This is then distributed over a
common grid of 220KV power line to the various other plants.
FIGURE 6.1 POWER PLANT
The system was a state-of-the-art system which was highly energy efficient. The description
of the gas turbine and steam turbine is given below.
POWER MONITORING SYSTEM
34
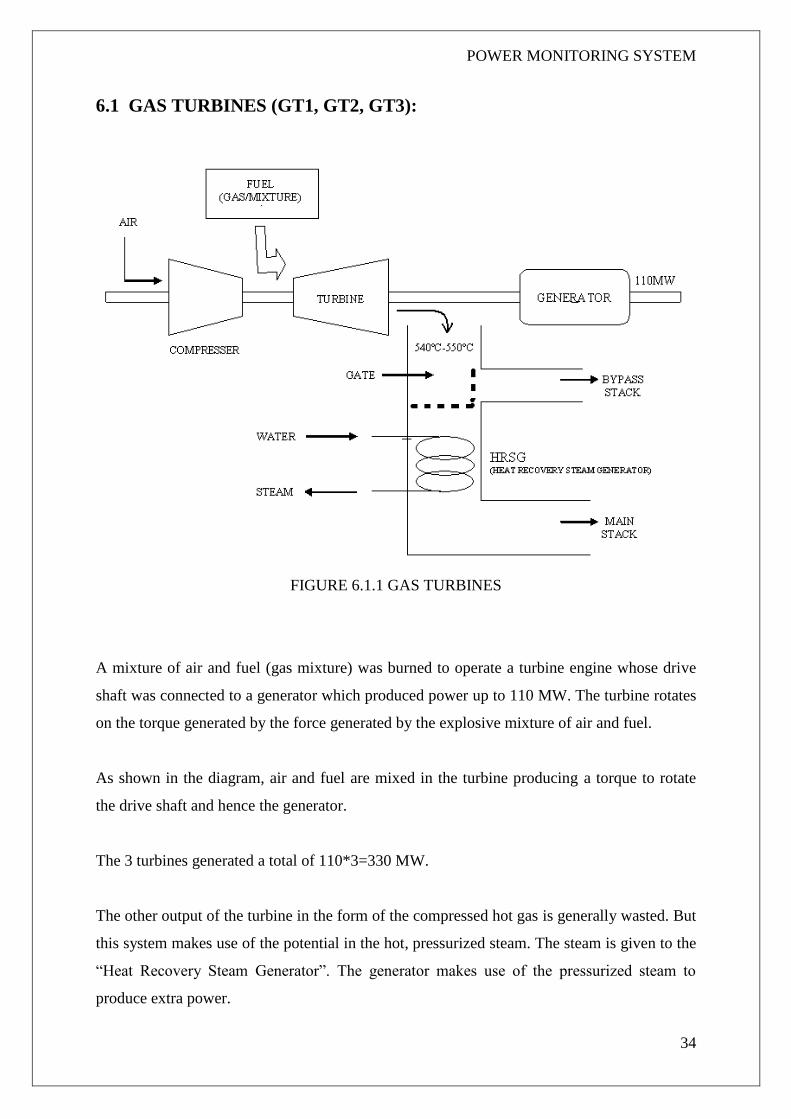
6.1 GAS TURBINES (GT1, GT2, GT3):
FIGURE 6.1.1 GAS TURBINES
A mixture of air and fuel (gas mixture) was burned to operate a turbine engine whose drive
shaft was connected to a generator which produced power up to 110 MW. The turbine rotates
on the torque generated by the force generated by the explosive mixture of air and fuel.
As shown in the diagram, air and fuel are mixed in the turbine producing a torque to rotate
the drive shaft and hence the generator.
The 3 turbines generated a total of 110*3=330 MW.
The other output of the turbine in the form of the compressed hot gas is generally wasted. But
this system makes use of the potential in the hot, pressurized steam. The steam is given to the
“Heat Recovery Steam Generator”. The generator makes use of the pressurized steam to
produce extra power.
POWER MONITORING SYSTEM
35
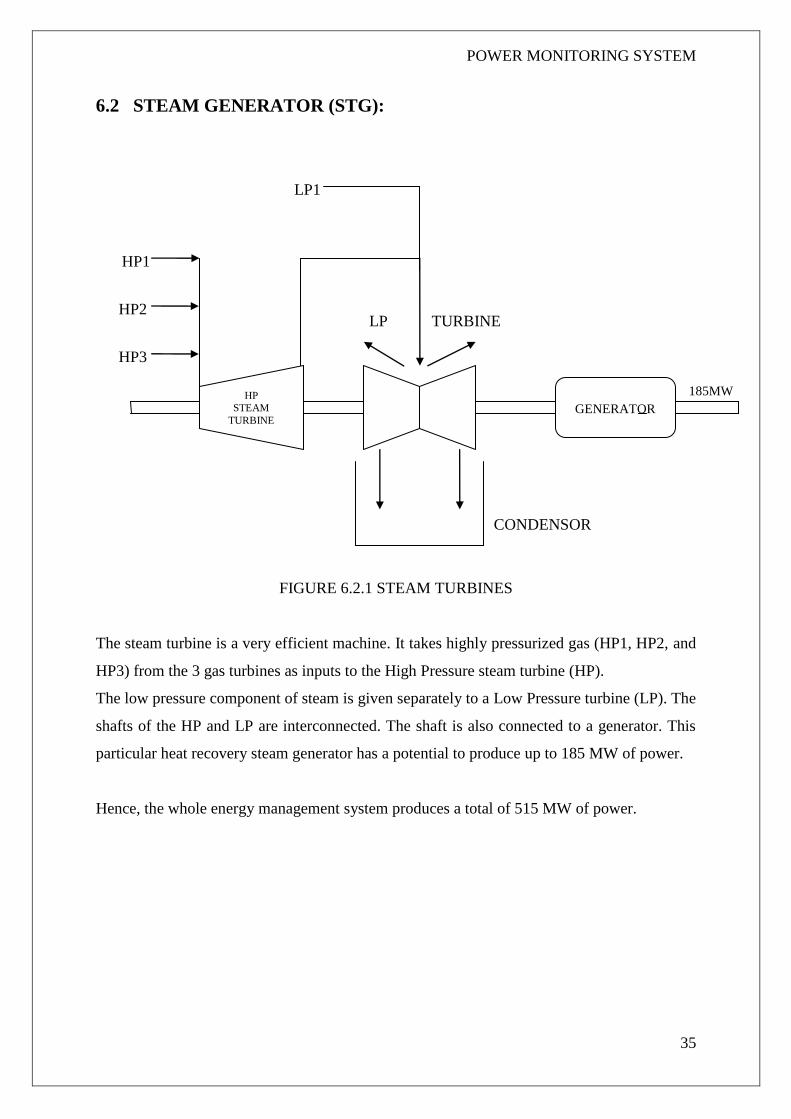
6.2 STEAM GENERATOR (STG):
FIGURE 6.2.1 STEAM TURBINES
The steam turbine is a very efficient machine. It takes highly pressurized gas (HP1, HP2, and
HP3) from the 3 gas turbines as inputs to the High Pressure steam turbine (HP).
The low pressure component of steam is given separately to a Low Pressure turbine (LP). The
shafts of the HP and LP are interconnected. The shaft is also connected to a generator. This
particular heat recovery steam generator has a potential to produce up to 185 MW of power.
Hence, the whole energy management system produces a total of 515 MW of power.
185MW
CONDENSOR
LP1
HP2
HP3
HP1
HP
STEAM
TURBINE
GENERATOR
LP TURBINE

POWER MONITORING SYSTEM
36
6.3 MEASUREMENT AND MONITORING
The Gas turbines and steam turbine are managed by MKV Control System supplied by GE.
The boilers are managed by a control system designed by Siemens called DCS.
The voltage is measure from the potential transformer and current is measure from the current
transformer. These transformers are the step down transformers. They step down the MEGA
watt power into the levels which are suitable for the measurement.
PML meters are the meters which measure the power, voltage line-to-line, voltage
line-to-neutral, voltage unbalance, current, phase and various parameters. These meters are
provided by power measurement limited. The connection between different PML meters is
shown below.
FIGURE 6.3.1 PMML METER
These meters have high input range for parameters. There are many parameters that can be
measure using these parameters. Whereas these meters are much more costly, their price is in
the range of crores. Also these meters are more bulky. And occupy much more space.
POWER MONITORING SYSTEM
37
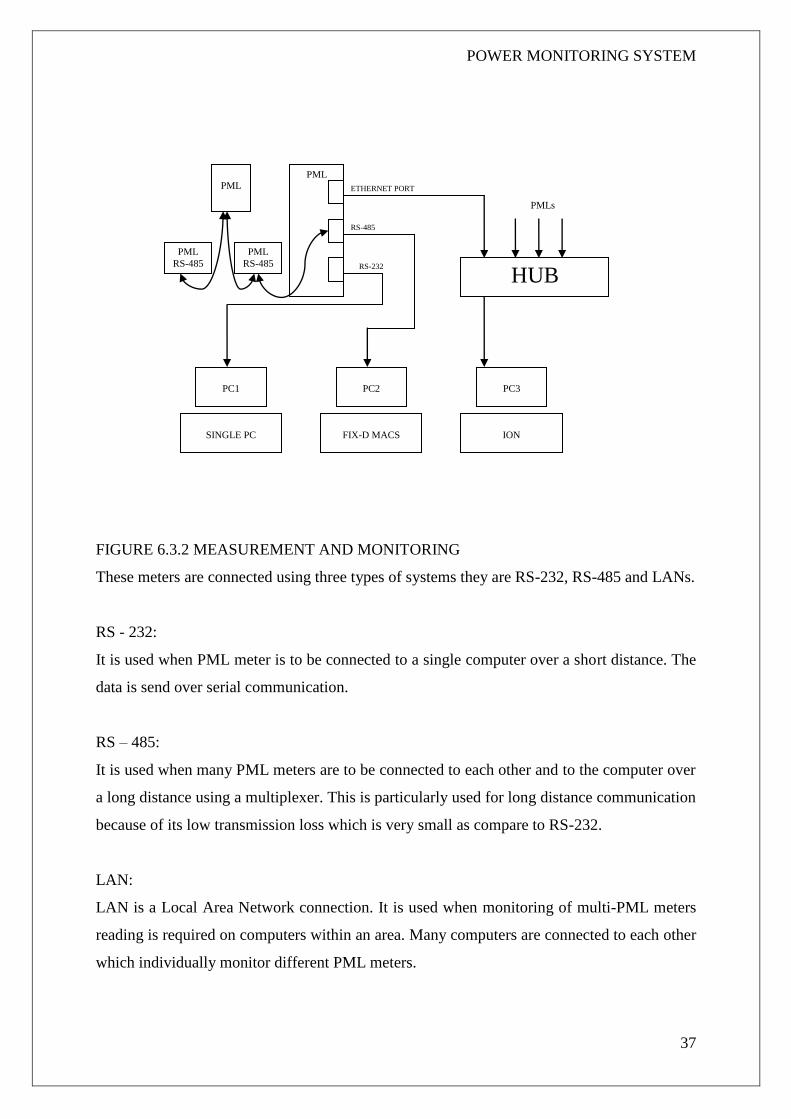
FIGURE 6.3.2 MEASUREMENT AND MONITORING
These meters are connected using three types of systems they are RS-232, RS-485 and LANs.
RS - 232:
It is used when PML meter is to be connected to a single computer over a short distance. The
data is send over serial communication.
RS – 485:
It is used when many PML meters are to be connected to each other and to the computer over
a long distance using a multiplexer. This is particularly used for long distance communication
because of its low transmission loss which is very small as compare to RS-232.
LAN:
LAN is a Local Area Network connection. It is used when monitoring of multi-PML meters
reading is required on computers within an area. Many computers are connected to each other
which individually monitor different PML meters.
PMLs
RS-232
RS-485
ETHERNET PORT
PML
SINGLE PC
PC1
FIX-D MACS
PC2
ION
PC3
HUB
PML
PML
RS-485
PML
RS-485

POWER MONITORING SYSTEM
38
TOOLS
AND
EQUIPMENT

POWER MONITORING SYSTEM
39
7. TOOLS AND EQUIPMENT
7.1 HARDWARE
The analog circuits were first tested on a breadboard and when found satisfactory soldered on
a General Purpose Board (GPB). Thin multistrand fibers were used for linking.
Soldering had to be done taking care that there were no dry solders and solid reliable joints
are formed. Continuity was tested for each link using the Digital Multimeter (DMM).
Troubleshooting had to be done after soldering to find faulty contacts as well as
malfunctioning components.
The oscilloscope was also an important tool for monitoring waveforms. The digital storage
oscilloscope proved to be of paramount importance as the low frequency waves (50 Hz) were
difficult to look on to the standard Cathode ray Oscilloscope.
The Digital Storage Oscilloscope is an excellent tool for the simplest to the most intricate
circuit designs. Its „Auto Setup‟ mode helps in detecting any type of waveform almost
instantaneously and manual tuning is seldom required.
For working on the microcontroller we have developed a board. This board is kept specific
only for this purpose. Many extra pins are provided for easy debugging. All ports are made
visible by providing connection at each pin for measuring the voltages at that pin. Some extra
components are also added for allowing the user to measure other parameters.
LCD is connected on the board. For communication with the computer, a serial to USB
connector USB is in widespread usage.
The whole hardware is fitted in the wooden box for protection.

POWER MONITORING SYSTEM
40
7.2 SOFTWARE
The programmed is developed using the CodeVisionAVR software. It provides many options
and facility for easy programming. Most of the initialization is done by the software once the
uses of the each port are entered. It has great support for debugging the program. Once the
program is compiled with no error and no warnings it is then used to generate the HEX file.
This will then be used to program the microcontroller. [5]
The software also provides the facility to show the output data that is serially transmitted by
the microcontroller to the computer.
Pony-Prog software for programming the microcontroller has been used. The HEX file which
was generated by CodeVisionAVR software is then opened. Pony Pro software allows to
program the microcontroller either using serial port or parallel port. It initially erases the
memory or data that is already present in the microcontroller and then loads the new program.
[6]
For GUI MATLAB version 7 has been used. MATLAB has great support for serial
connection. Windows of various sizes can be shown. On each window useful buttons are
provided for user interfacing. Graphs and warning signs are shown to make it more user
friendly. [7]

POWER MONITORING SYSTEM
41
TESTS
AND
RESULTS

POWER MONITORING SYSTEM
42
8. TESTS AND RESULTS
The theory behind the test circuit is as follows. A single-phase ac induction motor or a
synchronous motor will have in general the voltage and current phasors shifted as shown.
FIGURE 8.1 PHASOR DIAGRAM
Simulation of this behavior using a single stage R-C circuit is shown in the diagram.
The 10k-ohm Potentiometer used for the R can change the phase angle from 0 to nearly 90
degrees leading. The amplifiers have high input impedance and amplify the sine waves. The
gain of the amplifiers can be set individually by the pots in the feedback paths. Thus a circuit
which produces two sine waves, phase shifted (with adjustable phase shift), and variable
amplitudes is shown.
This circuit takes an input of a single sine wave from the standard laboratory function
generator. This makes the entire setup clean and controllable. A digital CRO was used for
observing the waveforms and testing the circuits. The sine waves are adjusted to a peak of 0.5
V at a frequency equal to 50.00 Hz.
The outputs from the simulation circuit were observed on the digital oscilloscope using both
its channels. Varying the phase pot showed the sine waves shifting from zero phase shifts to
ninety-degree phase shift at extreme position of the pot.
The amplitudes of these sine waves were continuously variable from 0 to 6 V peak by
varying the pot in the feedback path of the inverting amplifiers thus varying the gain of the
op-amps.
The op-amps chosen showed that near ideal behavior under the particular conditions viz.
operation in the linear region and low frequencies. The sine waves were supplied to the
analog circuit where they were rectified using op-amp precision rectifiers and then filtered so

POWER MONITORING SYSTEM
43
as to obtain the dc content of the full wave rectified wave.
The digital oscilloscope is very useful in observing that there is no diode drop and that the
inclusion of the op-amps although increases the complexity of the circuit, proves useful so as
to improve the accuracy and reliability of the system.
The dc values at the output circuit are carefully monitored so as to observe the peak value of
the ripple. The oscilloscope is kept in AC mode and the ripple content observed, to be 5mV
peak. The ADC has a resolution of 5V/255=20mV.
Thus it was concluded that the filter circuit was good enough to an accuracy of 1 Bit. Further
it has a noise margin of about 15mV. It was thus concluded that shielding is an absolute
necessity in the industrial environment for accurate operation.
The dc values are also observed to vary smoothly as the amplitudes of the sine waves are
varied as also the phase angles changed.

POWER MONITORING SYSTEM
44
APPLICATIONS

POWER MONITORING SYSTEM
45
9. APPLICATIONS
Power monitoring is a crucial element in ensuring cost optimization for energy
suppliers and users alike.
It also assumes an important role in system stability analysis.
A power monitoring system can be incorporated into a power control system.
They are used to manage inrush conditions during system startup as well as to provide
critical information about voltage irregularities.

POWER MONITORING SYSTEM
46
FUTURE SCOPE
AND
LIMITATIONS

POWER MONITORING SYSTEM
47
10.1 FUTURE SCOPE
This system can be used in a plant to monitor the power consumption of electric
machines.
It indicates whether the instantaneous power consumed is greater or lesser than the
rated value.
The Energy Meter can also be used for billing and verification.
The Alarms for Voltage-sag and high Currents also help in protection and increasing
the life of the machines.
The PC interface as of now is a very crude one, but can be improved upon to include
features like generating logs for analysis and optimization. Computer programs can be
written for automatic billing, graphical analysis and feedback control.
Several other features can be added like, frequency measurement, sag-cycles
detection, voltmeter, ammeter, and power factor measurement.

POWER MONITORING SYSTEM
48
10.2 LIMITATIONS
The power monitoring system has to be calibrated from time to time so as to ensure
accuracy.
The system cannot be used for fractional kW motors, as the current resolution is 1k
Watt.
The accuracy and regulation of the current transformers and potential transformers is
the deciding factor for the performance of the system.
The system as of now does not have any indicator, which indicates whether the power
factor is leading or lagging.
It cannot be used at very high frequencies.

POWER MONITORING SYSTEM
49
APPENDIX

POWER MONITORING SYSTEM
50
11.1 ATMEGA 16 AVR DATASHEET
Features
• High-performance, Low-power AVR®8-bit Microcontroller
• Nonvolatile Program and Data Memories
– 16K Bytes of In-System Self-Programmable Flash
Endurance: 10,000 Write/Erase Cycles
– Optional Boot Code Section with Independent Lock Bits
In-System Programming by On-chip Boot Program
True Read-While-Write Operation
– 512 Bytes EEPROM 16-bit
Endurance: 100,000 Write/Erase Cycles Microcontroller
– 1K Byte Internal SRAM with 16K Bytes
– Programming Lock for Software Security In-System
• JTAG (IEEE std. 1149.1 Compliant) Interface Programmable
– Boundary-scan Capabilities According to the JTAG Standard Flash
– Extensive On-chip Debug Support
– Programming of Flash, EEPROM, Fuses, and Lock Bits through the JTAG Interface
• Peripheral Features
– Two 8-bit Timer/Counters with Separate Prescalers and Compare Modes
– One 16-bit Timer/Counter with Separate Prescaler, Compare Mode, and Capture
Mode
– Real Time Counter with Separate Oscillator
– Four PWM Channels
– 8-channel, 10-bit ADC
8 Single-ended Channels
7 Differential Channels in TQFP Package Only
2 Differential Channels with Programmable Gain at 1x, 10x, or 200x
– Byte-oriented Two-wire Serial Interface
– Programmable Serial USART
– Master/Slave SPI Serial Interface
– Programmable Watchdog Timer with Separate On-chip Oscillator
– On-chip Analog Comparator
• Special Microcontroller Features
– Power-on Reset and Programmable Brown-out Detection
– Internal Calibrated RC Oscillator
– External and Internal Interrupt Sources
– Six Sleep Modes: Idle, ADC Noise Reduction, Power-save, Power-down, Standby
and Extended Standby
• I/O and Packages
– 32 Programmable I/O Lines
– 40-pin PDIP, 44-lead TQFP, and 44-pad QFN/MLF
• Operating Voltages
– 2.7 - 5.5V for ATmega16L
– 4.5 - 5.5V for ATmega16
• Speed Grades
– 0 - 8 MHz for ATmega16L
– 0 - 16 MHz for ATmega16
• Power Consumption @ 1 MHz, 3V, and 25°C for ATmega16L
– Active: 1.1 mA
– Idle Mode: 0.35 mA
– Power-down Mode: < 1 µA
POWER MONITORING SYSTEM
51

POWER MONITORING SYSTEM
52
POWER MONITORING SYSTEM
53
12. REFERENCES
[1] http://www.atmel.com/products/avr/default.asp
[2] http://www.analog.com
[3] J.S.Katre,” Wave Shaping Techniques”, chapter 6, pp 70-80.
[4] http://www.essar.com/power.htm
[5] http://www.hpinfotech.ro/html/cvavr.htm
[6] http://www.lancos.com/ppwin95.html
[7] http://www.mathworks.com
Related Documents