Population Studies

Population Studies. Why study Population? How land is used The amount of pressure on natural resources PLANNING – how govt formulate policies How people.
Dec 31, 2015
Welcome message from author
This document is posted to help you gain knowledge. Please leave a comment to let me know what you think about it! Share it to your friends and learn new things together.
Transcript

Population Studies
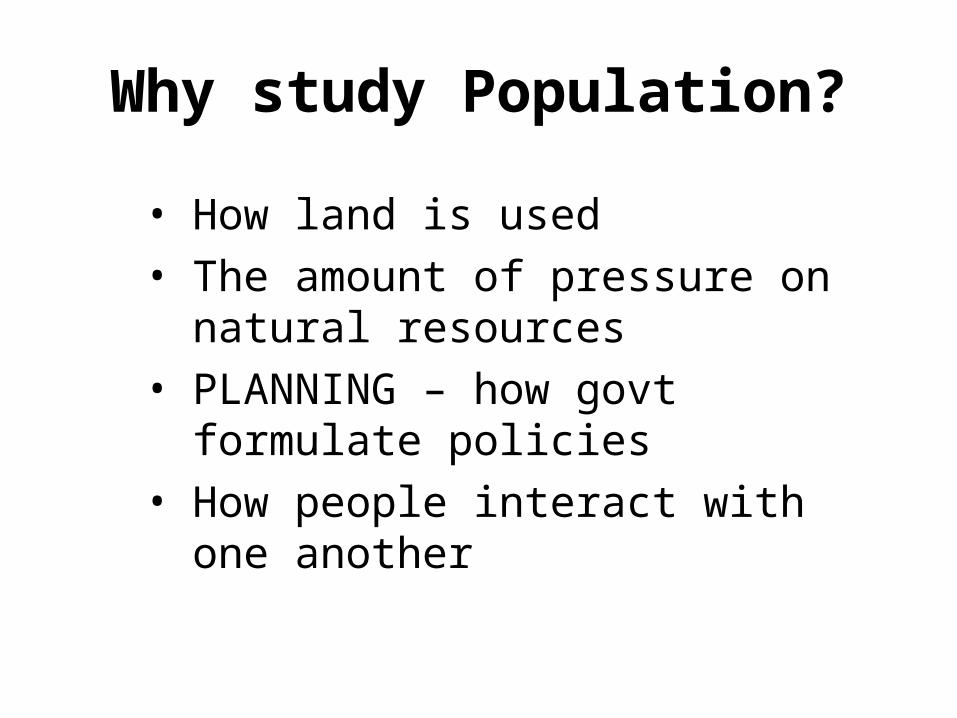
Why study Population?
• How land is used
• The amount of pressure on natural resources
• PLANNING – how govt formulate policies
• How people interact with one another

In 1999, 600 million children in the world lived in poverty – 50 million more than in 1990
United Nations
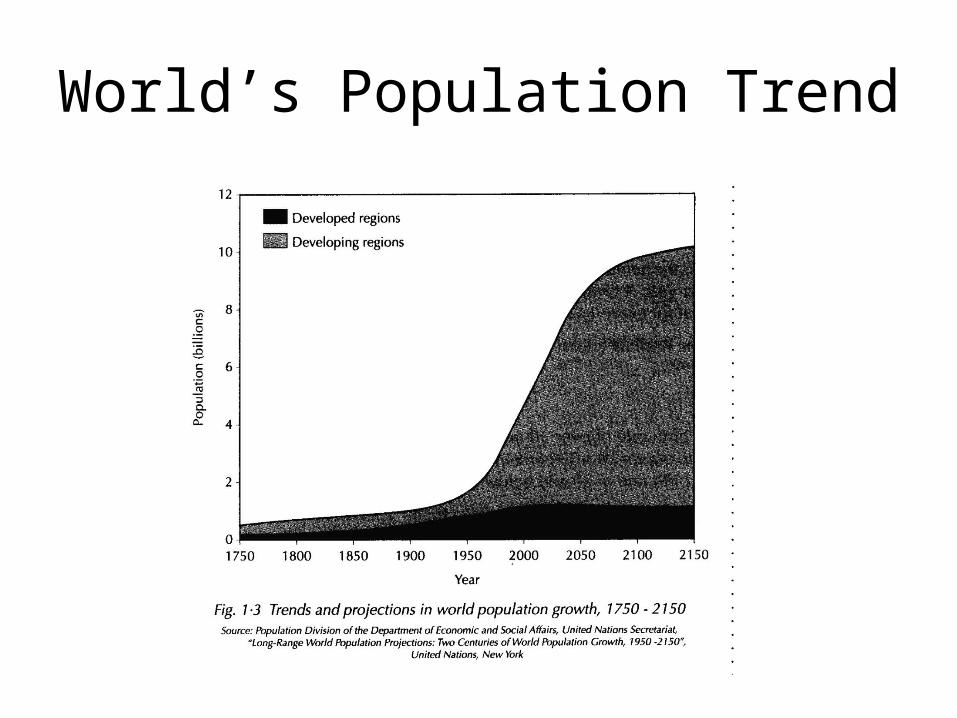
World’s Population Trend

Regional Population Trend

Population Explosion
Until about 200 years ago, population growth was slow.
Since then, there had been an enormous increase (previous graph).
Population Explosion: sudden and great increase in world’s population.
Rate of increase has become exponential. Check out the world population clock at
http://www.ibiblio.org/lunarbin/worldpop

World Population at 2008
6.7 billion
7.2 billion in 2014
Source: The Straits Times (11 Jul 2008)
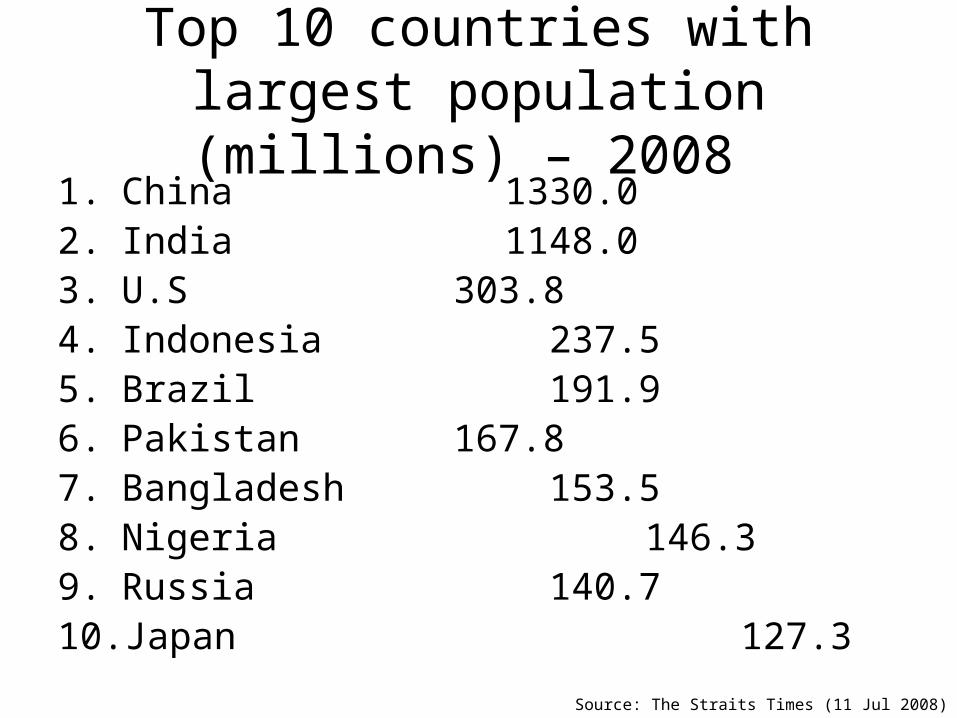
Top 10 countries with largest population (millions) – 2008
1. China 1330.02. India 1148.03. U.S 303.84. Indonesia 237.55. Brazil 191.96. Pakistan 167.87. Bangladesh 153.58. Nigeria 146.39. Russia 140.710. Japan 127.3
Source: The Straits Times (11 Jul 2008)

Terminologies• Birth rate (BR)
– Number of live births per 1000 people in the population per year
– X per thousand– What are the reasons for low and high BR?
• Death rate (DR)– Number of deaths per 1000 people in the population
per year– Y per thousand– What are the reasons for high and low DR?

Terminologies Infant Mortality (IM)
Number of infants who die before reaching one year of age per 1000 live births per year
Natural increase (NI)/rate of natural increase
• NI = BR – DR (per thousand)• NI is +ve means …• NI is –ve means …
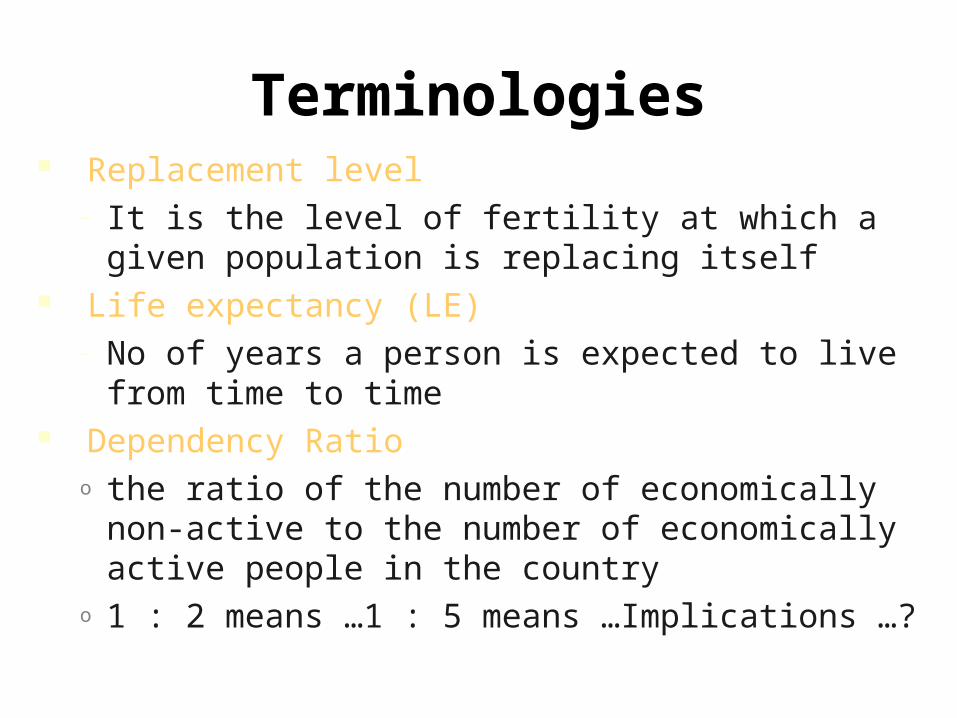
Terminologies Replacement level
– It is the level of fertility at which a given population is replacing itself
Life expectancy (LE)– No of years a person is expected to live from
time to time Dependency Ratio
o the ratio of the number of economically non-active to the number of economically active people in the country
o 1 : 2 means …1 : 5 means …Implications …?
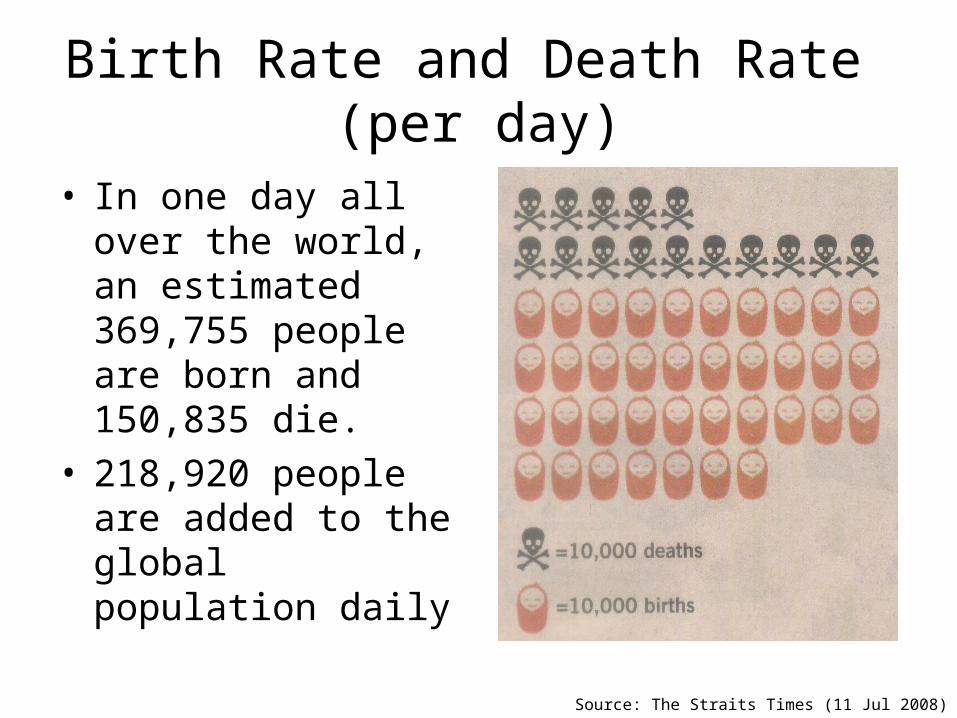
Birth Rate and Death Rate (per day)
• In one day all over the world, an estimated 369,755 people are born and 150,835 die.
• 218,920 people are added to the global population daily
Source: The Straits Times (11 Jul 2008)
Causes
• High BR - Parents want children– for labour especially in agricultural societies– to look after them in old age– to continue the family name– for added status in the community – to replace children who have died (high
infant mortality rate)

Causes
• Low DR– clean water is available– access to food supply– improve hygiene and sanitation– better vaccinations and healthcare– rising standards of living

How long are you expected to live?

Total Population Change
TOTAL POPULATION CHANGE
Birth Rate
Death Rate
Immigration
Emigration
Population Growth = natural increase + net migration
Factors that influence natural increase
1) Standard of living
• medical facilities, health care
• housing
• hygiene
• water supply
• sanitation and nutrition

Factors that influence natural increase
2. Cultural factors
• way of living, customs and beliefs
• role of children, religion
• region of the world (developed vs. under-developed)
3. Government policies
• increase/slow down BRs
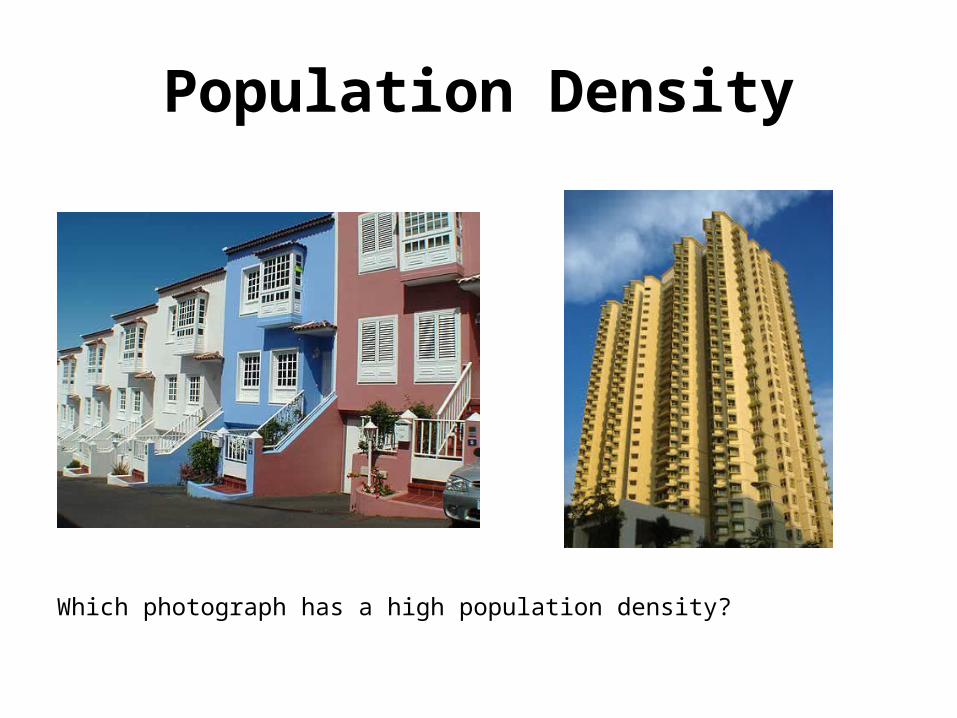
Population Density
Which photograph has a high population density?
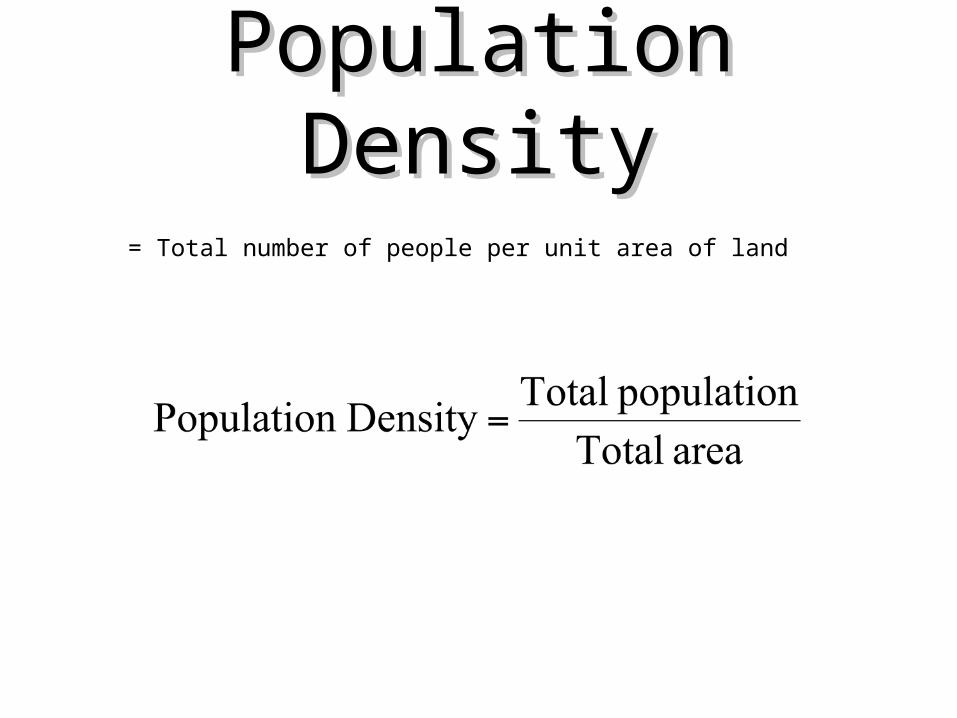
Population DensityPopulation Density
= Total number of people per unit area of land

Calculation of Population Density
• Total resident in 1997 = 3736700• Total land area = 647.8 sq km
Pop density = 5768 persons per sq km
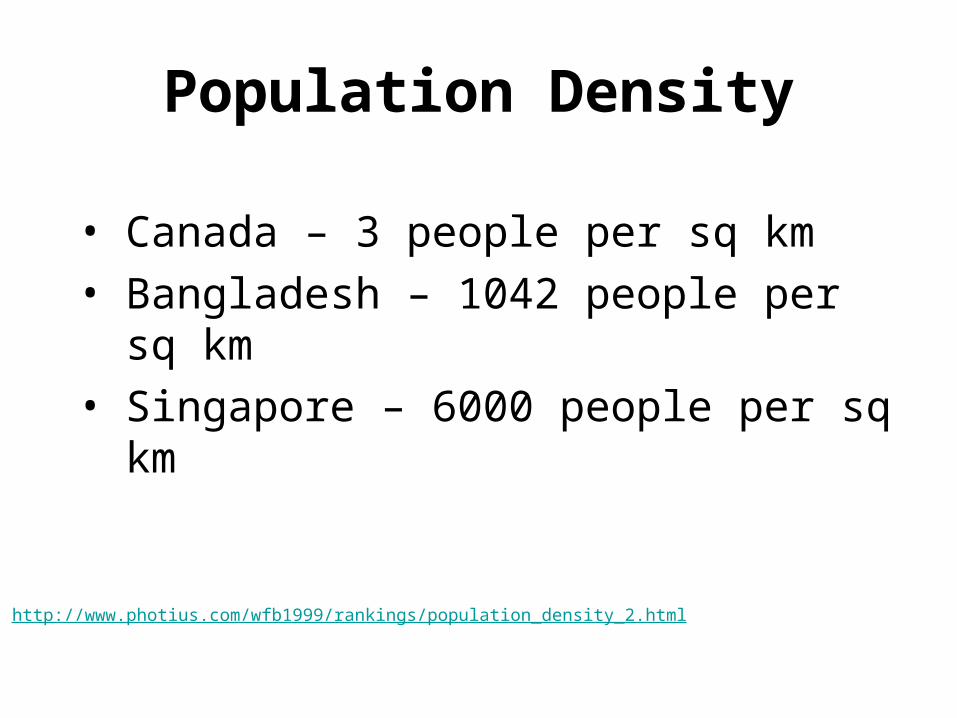
Population Density
• Canada – 3 people per sq km
• Bangladesh – 1042 people per sq km
• Singapore – 6000 people per sq km
http://www.photius.com/wfb1999/rankings/population_density_2.html
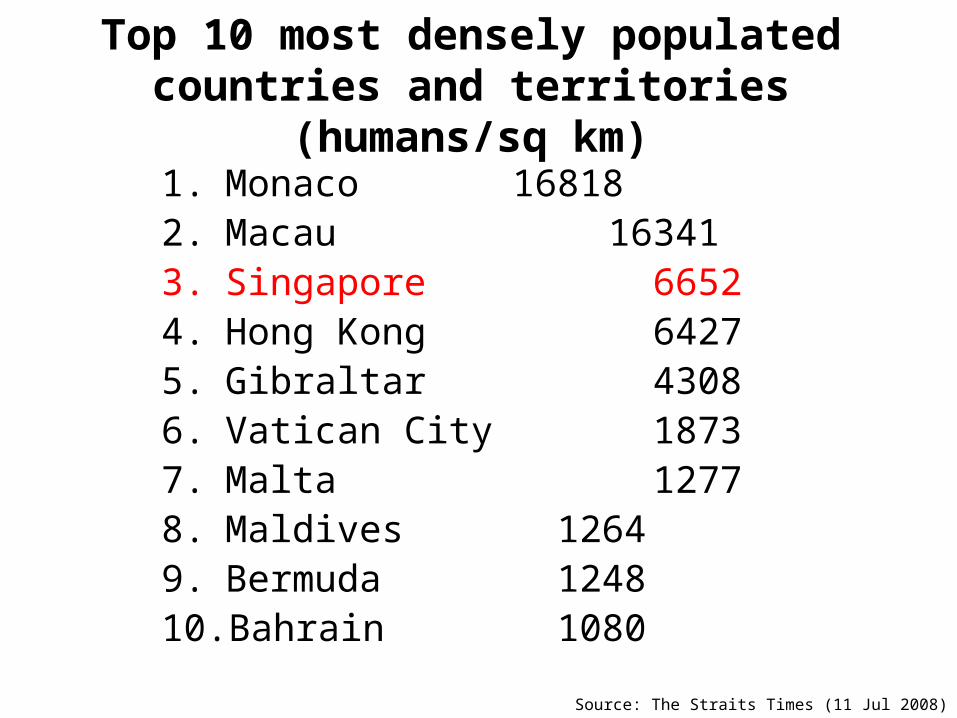
Top 10 most densely populated countries and territories (humans/sq km)
1. Monaco 168182. Macau 163413. Singapore 66524. Hong Kong 64275. Gibraltar 43086. Vatican City 18737. Malta 12778. Maldives 12649. Bermuda 124810. Bahrain 1080
Source: The Straits Times (11 Jul 2008)
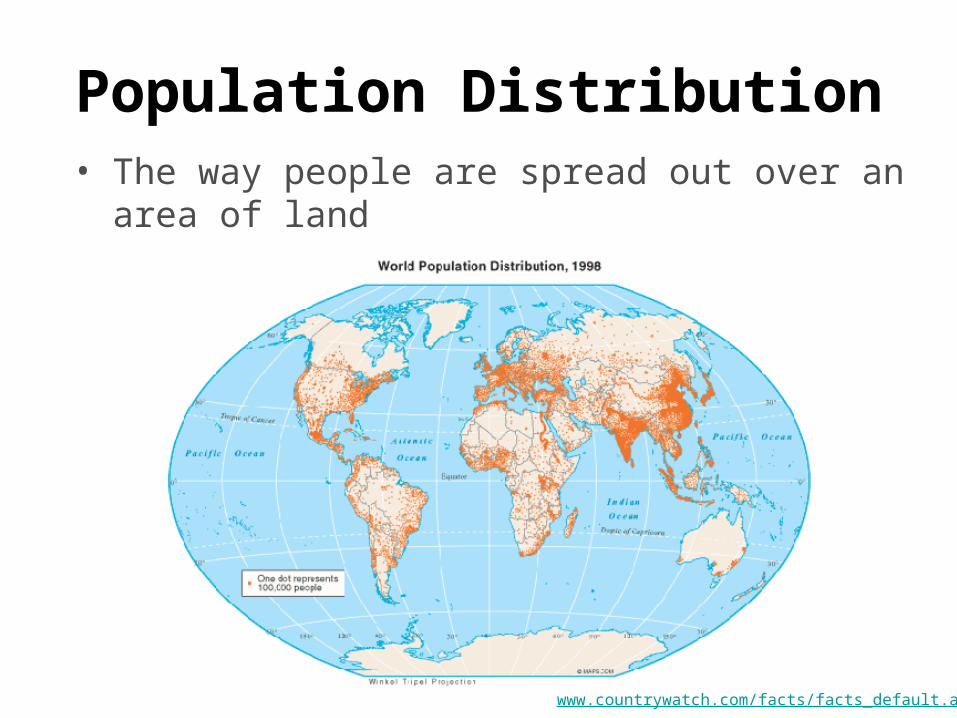
Population Distribution• The way people are spread out over an area of
land
www.countrywatch.com/facts/facts_default.aspx...

Factors Affecting Population Distribution
• Relief
• Climate
• Soils
• Mineral and energy deposits
• Accessibility
• Relief
• Climate
• Soils
• Mineral and energy deposits
• Accessibility
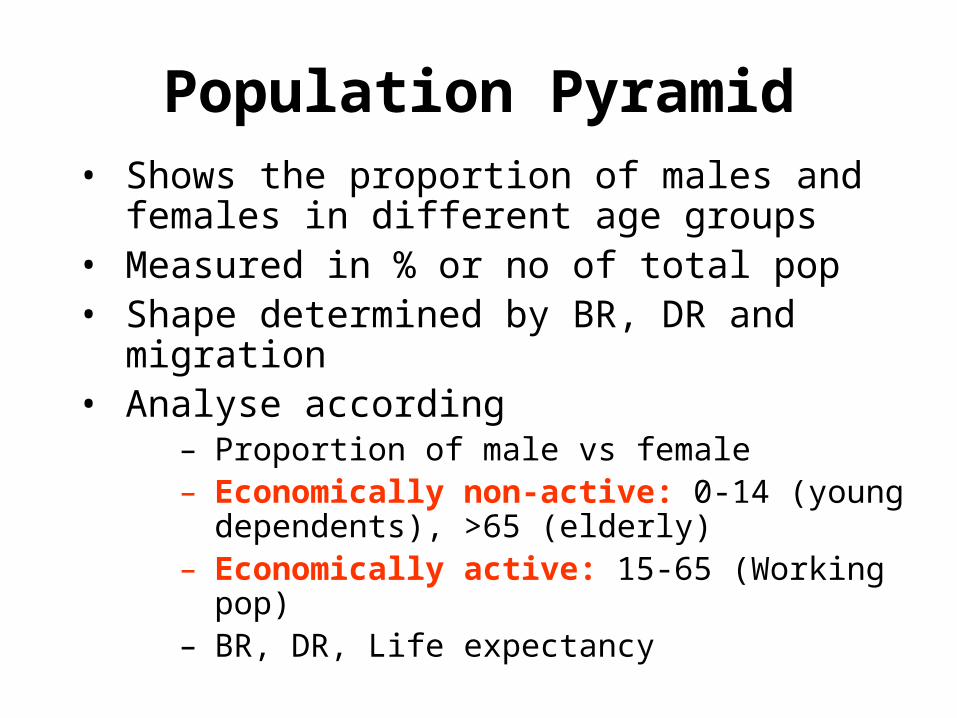
Population Pyramid• Shows the proportion of males and females in
different age groups• Measured in % or no of total pop• Shape determined by BR, DR and migration• Analyse according
– Proportion of male vs female– Economically non-active: 0-14 (young
dependents), >65 (elderly)– Economically active: 15-65 (Working pop)– BR, DR, Life expectancy
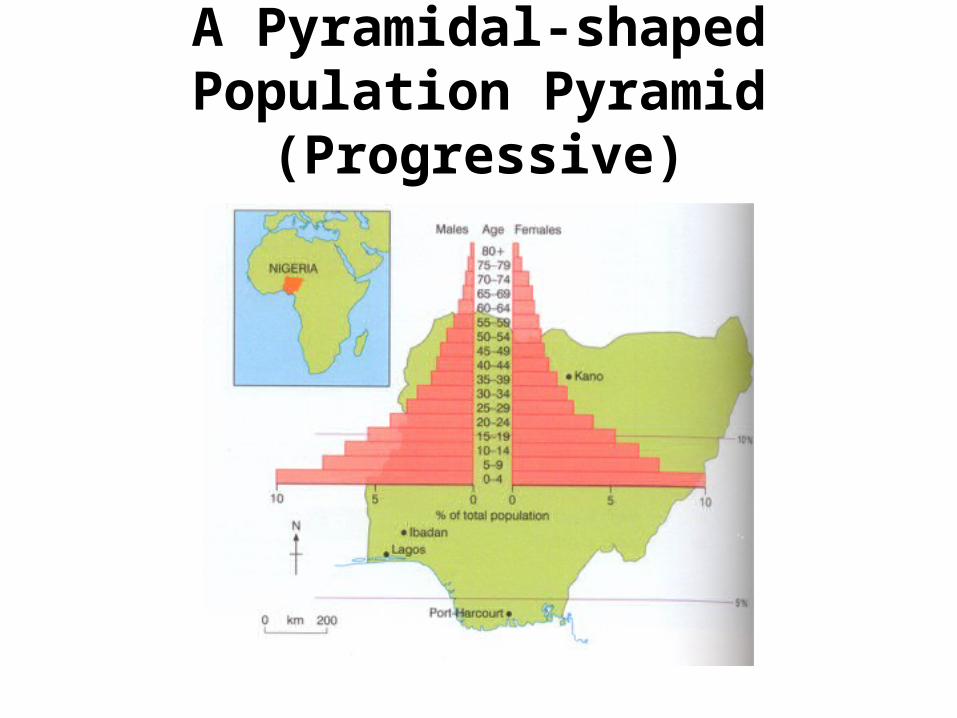
A Pyramidal-shaped Population Pyramid (Progressive)
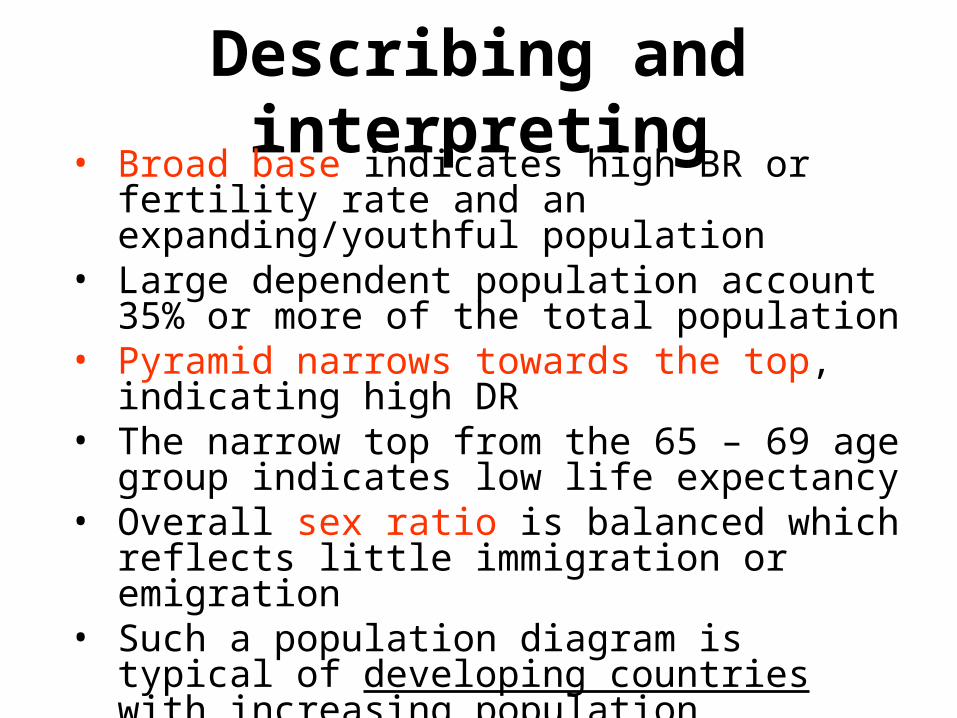
Describing and interpreting• Broad base indicates high BR or fertility rate
and an expanding/youthful population• Large dependent population account 35% or
more of the total population• Pyramid narrows towards the top, indicating
high DR• The narrow top from the 65 – 69 age group
indicates low life expectancy• Overall sex ratio is balanced which reflects little
immigration or emigration• Such a population diagram is typical of
developing countries with increasing population

A bee-hived Pyramid A bee-hived Pyramid (Regressive)(Regressive)

Describing and Interpreting• Narrow base indicates low BR and fertility rate• Young dependent makes up less than 30% of the
total population• Broader top indicates a long life expectancy and a
relatively low DR• Aged can account more than 15% of the population –
greying pop• There is a possibility of the population shrinking as
birth and population growth rates continue to drop each year
• Such a pyramid typifies the population structure of developed countries

Reasons for high growth rate:Developing countries
Low DR High BR
Better medical and health care
•low infant mortality•higher life expectancy
Lack of family planning
Better hygiene & sanitation
Early marriages
Access to clean drinking water
Preference for sons
Need for farm labour

Overpopulation
Definition: • a situation when there are too many people
relative to the resources and level of technology to provide a reasonable standard of living

Overpopulation Characteristics:•High BR•Low life expectancy•Low level of literacy•High rate of unemployment in urban areas•Rural people caught in the vicious cycle of poverty due to poor farming techniques•Many live in poor, congested, unhygienic conditions

Overpopulation
OverpopulationSolutions
• Control population through policies • Raise level of education• Improve standard of living
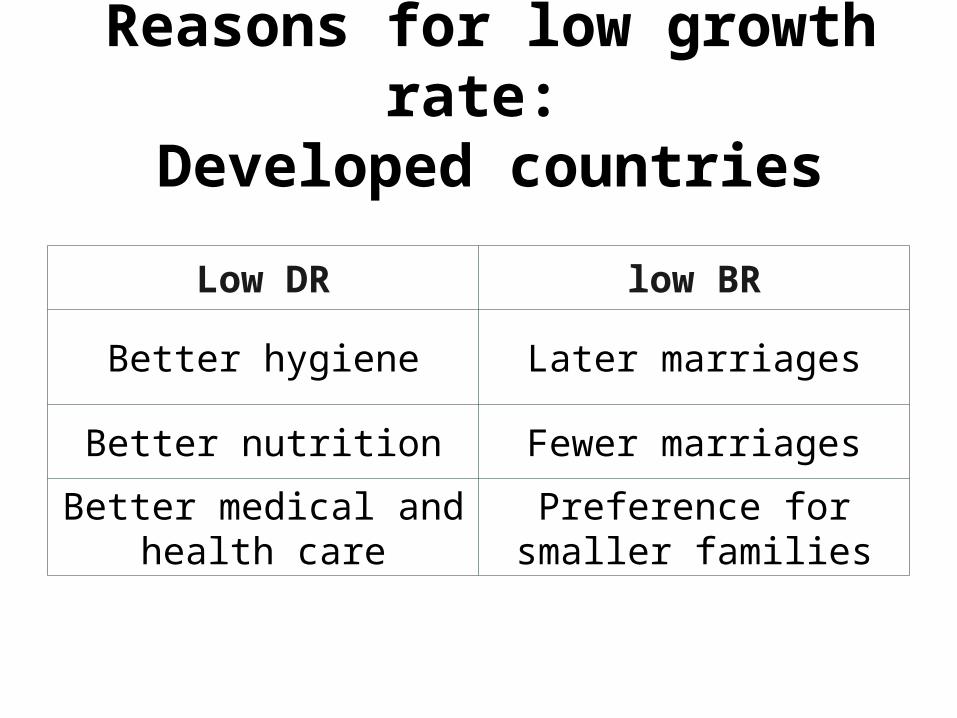
Reasons for low growth rate: Developed countries
Low DR low BR
Better hygiene Later marriages
Better nutrition Fewer marriages
Better medical and health care
Preference for smaller families

Low growth rate: Developed countries
Consequences:•Underpopulation
•Ageing population
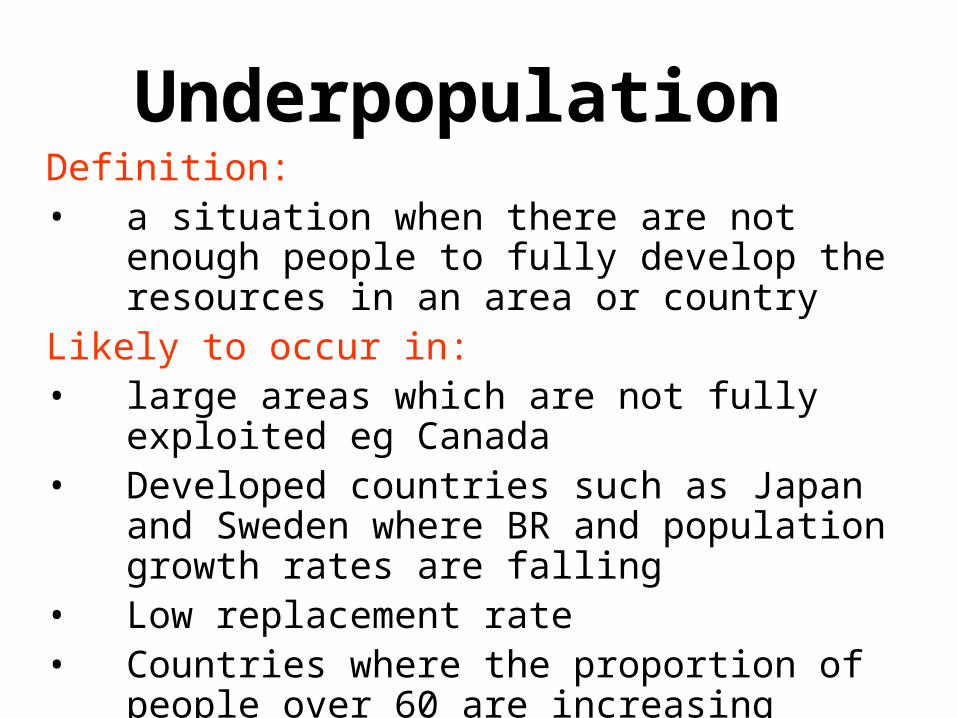
Underpopulation Definition: • a situation when there are not enough people to
fully develop the resources in an area or countryLikely to occur in:• large areas which are not fully exploited eg
Canada• Developed countries such as Japan and
Sweden where BR and population growth rates are falling
• Low replacement rate• Countries where the proportion of people over
60 are increasing
Ageing Population
Definition: a trend in which there is an increasing proportion of elderly dependents in the population.
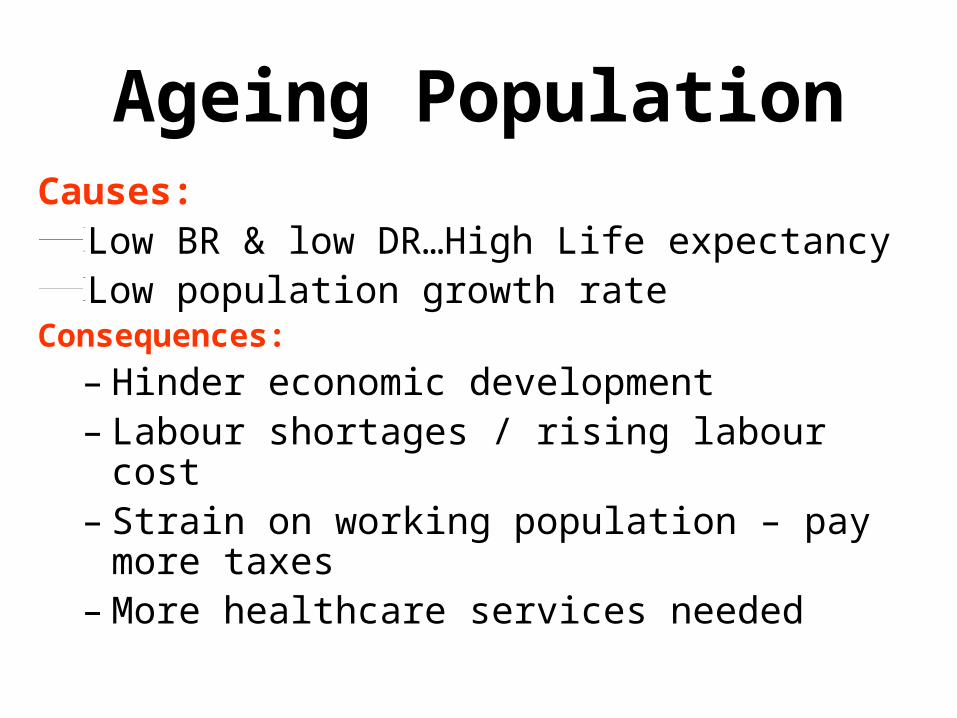
Ageing PopulationCauses:
Low BR & low DR…High Life expectancyLow population growth rate
Consequences:
– Hinder economic development– Labour shortages / rising labour cost– Strain on working population – pay more taxes– More healthcare services needed
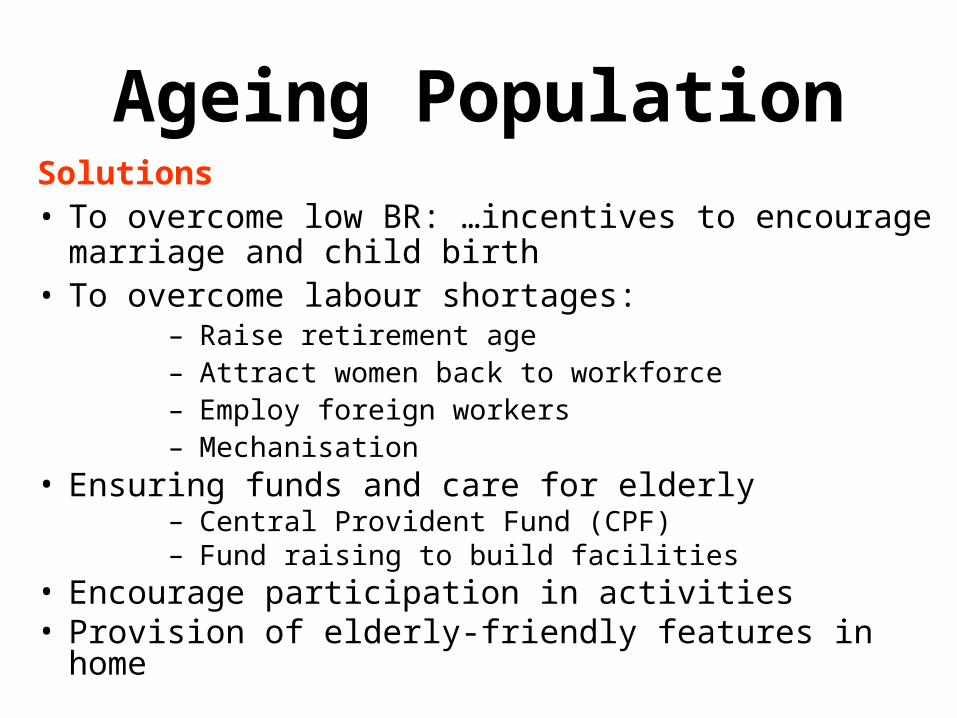
Ageing PopulationSolutions• To overcome low BR: …incentives to encourage
marriage and child birth• To overcome labour shortages:
– Raise retirement age– Attract women back to workforce– Employ foreign workers– Mechanisation
• Ensuring funds and care for elderly– Central Provident Fund (CPF)– Fund raising to build facilities
• Encourage participation in activities• Provision of elderly-friendly features in home
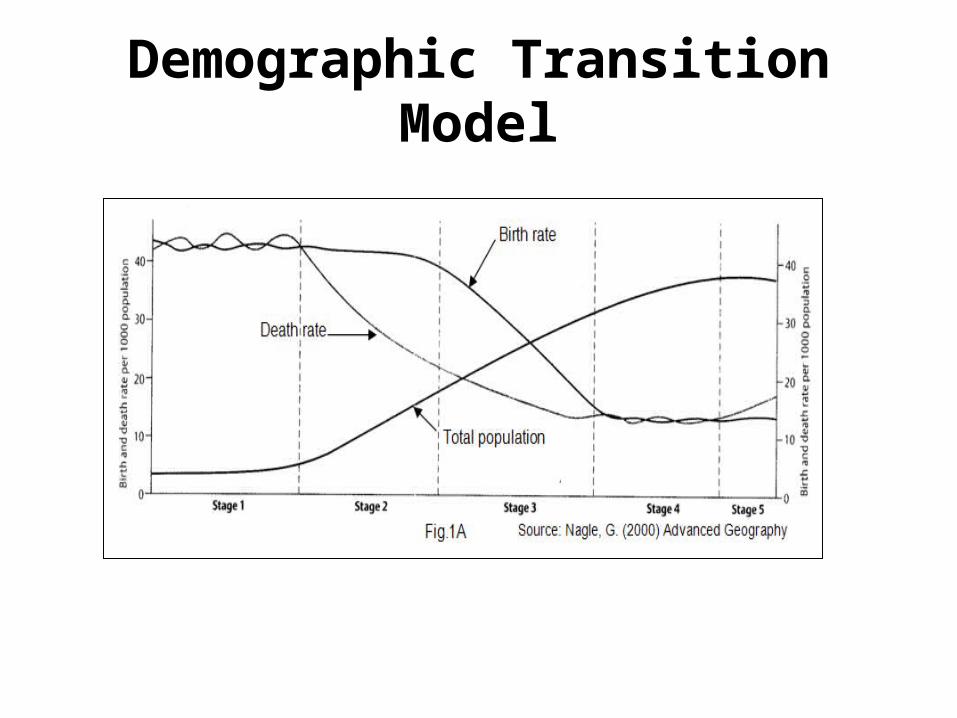
Demographic Transition Model

Demographic Transition ModelStage 1 – High Stationary Stage•Features:•High BR & DR esp among children•Population growth is small
Reasons for high DR:•Famines, wars and infectious diseases•Population Pyramid:•Broad base and a small, narrow top•NO country at Stage 1

Stage 2- Early Expanding Stage
Features:
•BR high about 40 per thousand; DR drops rapidly to 20 per thousand
•Rapid population growth
Reasons for high BR:
•No practice of family planning or birth control
•Child bearing years are long because women marry early
•Children required as farm hands in the fields
•High infant mortality rate – ensures survival
•Countries are developing and mainly agricultural
Reasons for declining DR:
•Improvements in medical care, personal hygiene, water supplies and sewage facilities
Pop Pyramid:
•A broad base with a slightly broader and higher top than Stage 1
•Countries are developing and mainly agricultural
Demographic Transition Model
Stage 3 – Late Expanding Stage
Features:•BR drops rapidly to below 20 per thousand; DR fall gradually to 15 per thousand•Population continues to grow but at slower rate than Stage 2•Stage 3 – Late Expanding Stage
Reasons for low BR:•Family planning, birth control measure•Govt incentives to keep BR low•Infant mortality rate is low •Easier to achieve a higher standard of living when family is small•Women are more career minded
Demographic Transition Model
Stage 4 – Low Stationary Stage
Features:•DR stabilised at a low rate of 15 per thousand and below•BR is low – fluctuates below 20 per thousand•Population growth is small/zero population growth•Most developed countries are at this stage – considerable economic development, affluence and a high standard of living
Stage 5 - Low and Declining•the BR is lower than the DR•the DR increases due to ageing of the population•the population declines•egs. Sweden and Japan
Demographic Transition Model

References
1. Chong, M. (2000) Aspect of Human Geography, Singapore: Pekoe Books. Chapter 1 (p.1 – 47)
2. Waugh, D. (2000) Geography An Integrated Approach, UK: Nelson. Chapter 13 (p. 344 – 383)
3. Wikipedia
Related Documents