Population pharmacokinetics of melphalan in patients with multiple myeloma undergoing high dose therapy Christa E. Nath, 1 Peter J. Shaw, 1,7 Judith Trotman, 2 Lihua Zeng, 1 Stephen B. Duffull, 8 Gareth Hegarty, 8 Andrew J. McLachlan, 2,7 Howard Gurney, 3 Ian Kerridge, 3 Yiu Lam Kwan, 2 Peter Presgrave, 4 Campbell Tiley, 5 Douglas Joshua 6 & John Earl 1 1 The Children’s Hospital at Westmead, 2 Concord Hospital, 3 Westmead Hospital, 4 Wollongong Hospital, 5 Gosford Hospital, 6 Royal Prince Alfred Hospital, 7 University of Sydney, Sydney, NSW, Australia and 8 University of Otago, Dunedin, New Zealand Correspondence Dr Christa E. Nath, Department of Biochemistry, The Children’s Hospital at Westmead, Locked Bag 4001, Westmead, NSW 2145, Australia. Tel.: + 61 29 845 3287 Fax: + 61 29 845 3332 E-mail: [email protected] ---------------------------------------------------------------------- Keywords melphalan, myeloma, optimal dosing, population pharmacokinetics, transplantation ---------------------------------------------------------------------- Received 22 October 2009 Accepted 8 January 2010 WHAT IS ALREADY KNOWN ABOUT THIS SUBJECT • There has been one previous population pharmacokinetic analysis of total melphalan given as a short infusion in 84 adults (mixed diagnoses) and creatinine clearance and body size were found to be important determinants of total melphalan clearance. Dose and exposure to total melphalan were found to correlate with the development of mucositis. WHAT THIS STUDY ADDS • This is the largest population pharmacokinetic study on melphalan conducted to date. It is the first conducted in a uniform patient population (patients with multiple myeloma) and the first in which both total and unbound melphalan pharmacokinetics are examined. Factors found to be important determinants of total and unbound plasma clearance of melphalan were creatinine clearance, fat free mass and haematocrit. Haematocrit has not previously been identified as an influential covariate in any previous study. The importance of total and unbound melphalan exposure on transplant outcome was demonstrated by preliminary pharmacodynamic results showing significant associations with melphalan-related toxicity. A preliminary analysis of the association with disease response showed promising trends, but will be examined in more detail with longer follow-up of the whole cohort. AIMS To i) investigate the pharmacokinetics of total and unbound plasma melphalan using a population approach, ii) identify clinical factors that affect melphalan disposition and iii) evaluate the role of melphalan exposure in melphalan-related toxicity and disease response. METHODS Population pharmacokinetic modelling (using NONMEM) was performed with total and unbound concentration–time data from 100 patients (36–73 years) who had received a median 192 mg m -2 melphalan dose. Model derived estimates of total and unbound melphalan exposure (AUC) in patients with serious melphalan toxicity and those who had a good disease response (90% decrease in paraprotein concentrations) were compared using the Mann-Whitney test. RESULTS A two compartment model generated population mean estimates for total and unbound melphalan clearance (CL) of 27.8 and 128 l h -1 , respectively. Estimated creatinine clearance, fat free mass and haematocrit were important determinants of total and unbound CL, reducing the inter-individual variability in total CL from 34% to 27% and in unbound CL from 42% to 30%.Total AUC (range 4.9–24.4 mg l -1 h) and unbound AUC (range 1.0–6.5 mg l -1 h) were significantly higher in patients who had oral mucositis (grade 3) and long hospital admissions (P < 0.01). Patients who responded well had significantly higher unbound AUC (median 3.2 vs. 2.8 mg l -1 h, P < 0.05) when assessed from diagnosis to post-melphalan and higher total AUC (median 21.3 vs. 13.4 mg l -1 h, P = 0.06), when assessed from pre- to post-melphalan. CONCLUSIONS Creatinine clearance, fat free mass and haematocrit influence total and unbound melphalan plasma clearance. Melphalan exposure is related to melphalan toxicity while the association with efficacy shows promising trends that will be studied further. British Journal of Clinical Pharmacology DOI:10.1111/j.1365-2125.2010.03638.x 484 / Br J Clin Pharmacol / 69:5 / 484–497 © 2010 The Authors Journal compilation © 2010 The British Pharmacological Society

Welcome message from author
This document is posted to help you gain knowledge. Please leave a comment to let me know what you think about it! Share it to your friends and learn new things together.
Transcript
Population pharmacokineticsof melphalan in patientswith multiple myelomaundergoing high dosetherapyChrista E. Nath,1 Peter J. Shaw,1,7 Judith Trotman,2 Lihua Zeng,1
Stephen B. Duffull,8 Gareth Hegarty,8 Andrew J. McLachlan,2,7
Howard Gurney,3 Ian Kerridge,3 Yiu Lam Kwan,2 Peter Presgrave,4
Campbell Tiley,5 Douglas Joshua6 & John Earl1
1The Children’s Hospital at Westmead, 2Concord Hospital, 3Westmead Hospital, 4Wollongong Hospital,5Gosford Hospital, 6Royal Prince Alfred Hospital, 7University of Sydney, Sydney, NSW, Australia and8University of Otago, Dunedin, New Zealand
CorrespondenceDr Christa E. Nath, Department ofBiochemistry, The Children’s Hospital atWestmead, Locked Bag 4001, Westmead,NSW 2145, Australia.Tel.: + 61 29 845 3287Fax: + 61 29 845 3332E-mail: christan@chw.edu.au----------------------------------------------------------------------
Keywordsmelphalan, myeloma, optimal dosing,population pharmacokinetics,transplantation----------------------------------------------------------------------
Received22 October 2009
Accepted8 January 2010
WHAT IS ALREADY KNOWN ABOUTTHIS SUBJECT• There has been one previous population
pharmacokinetic analysis of total melphalangiven as a short infusion in 84 adults (mixeddiagnoses) and creatinine clearance and bodysize were found to be important determinants oftotal melphalan clearance. Dose and exposure tototal melphalan were found to correlate with thedevelopment of mucositis.
WHAT THIS STUDY ADDS• This is the largest population pharmacokinetic
study on melphalan conducted to date. It is thefirst conducted in a uniform patient population(patients with multiple myeloma) and the first inwhich both total and unbound melphalanpharmacokinetics are examined. Factors found tobe important determinants of total and unboundplasma clearance of melphalan were creatinineclearance, fat free mass and haematocrit.Haematocrit has not previously been identifiedas an influential covariate in any previous study.The importance of total and unbound melphalanexposure on transplant outcome wasdemonstrated by preliminary pharmacodynamicresults showing significant associations withmelphalan-related toxicity. A preliminary analysisof the association with disease response showedpromising trends, but will be examined in moredetail with longer follow-up of the whole cohort.
AIMSTo i) investigate the pharmacokinetics of total and unbound plasma melphalanusing a population approach, ii) identify clinical factors that affect melphalandisposition and iii) evaluate the role of melphalan exposure inmelphalan-related toxicity and disease response.
METHODSPopulation pharmacokinetic modelling (using NONMEM) was performed withtotal and unbound concentration–time data from 100 patients (36–73 years)who had received a median 192 mg m-2 melphalan dose. Model derivedestimates of total and unbound melphalan exposure (AUC) in patients withserious melphalan toxicity and those who had a good disease response (�90%decrease in paraprotein concentrations) were compared using theMann-Whitney test.
RESULTSA two compartment model generated population mean estimates for totaland unbound melphalan clearance (CL) of 27.8 and 128 l h-1, respectively.Estimated creatinine clearance, fat free mass and haematocrit were importantdeterminants of total and unbound CL, reducing the inter-individual variabilityin total CL from 34% to 27% and in unbound CL from 42% to 30%. Total AUC(range 4.9–24.4 mg l-1 h) and unbound AUC (range 1.0–6.5 mg l-1 h) weresignificantly higher in patients who had oral mucositis (�grade 3) and longhospital admissions (P < 0.01). Patients who responded well had significantlyhigher unbound AUC (median 3.2 vs. 2.8 mg l-1 h, P < 0.05) when assessed fromdiagnosis to post-melphalan and higher total AUC (median 21.3 vs. 13.4 mg l-1 h,P = 0.06), when assessed from pre- to post-melphalan.
CONCLUSIONSCreatinine clearance, fat free mass and haematocrit influence total and unboundmelphalan plasma clearance. Melphalan exposure is related to melphalantoxicity while the association with efficacy shows promising trends that will bestudied further.
British Journal of ClinicalPharmacology
DOI:10.1111/j.1365-2125.2010.03638.x
484 / Br J Clin Pharmacol / 69:5 / 484–497 © 2010 The AuthorsJournal compilation © 2010 The British Pharmacological Society
Introduction
High dose melphalan is one of the most active agents inthe treatment of multiple myeloma, with several clinicaltrials demonstrating its superiority to conventional che-motherapy in terms of the complete (CR) and very goodpartial response (VGPR) rates, event-free survival (EFS) andoverall survival (OS) [1, 2]. Even in an era where biologicalagents such as lenalidomide and bortezomib are incorpo-rated into frontline therapy for myeloma, consolidation ofthe initial therapy with high dose melphalan remainsstandard. However the toxicity of high dose melphalan isprofound: prolonged cytopenias occur in all patients,necessitating rescue with autologous stem cell transplan-tation (ASCT). Gastrointestinal toxicity, including anorexia,mucositis, nausea, vomiting and diarrhoea, is also verycommon [3–5]. Both severity and duration of myelosup-pression are dose-dependent [5] and the gastrointestinaltoxicity is dose-limiting. Conversely, insufficient doseintensity can lead to suboptimal response, as previouslyobserved in patients with amyloidosis [6]. In this study, thepartial response rate to melphalan (�50% reduction in theserum or urine M protein) was significantly higher inthe group receiving standard high doses compared withthe group who had intermediate, risk-adjusted doses (75%vs. 53%, P < 0.01).
Melphalan is eliminated by both renal excretion andspontaneous chemical degradation to its mono- anddi-hydroxy metabolites [7, 8]. The latter pathway has beenshown to be a relatively minor contributor (<5%) [9]because plasma protein binding retards the hydrolysis rateof melphalan [9]. In water and in urine, however, melphalanundergoes rapid chemical decomposition [8]. This hasmade it difficult to study the 24 h urinary excretion of mel-phalan and has led to some confusion about the role ofrenal excretion in melphalan elimination. Highly variableestimates of the fraction of melphalan that is renallyexcreted have been obtained, ranging from 3% to 93% innine adults (mean � SD 34 � 33%), even after attempts tofreeze the urine specimens rapidly, suggesting that theremay be decomposition in the bladder [7].However, the factthat greater than 60% of the dose was recovered in theurine obtained from three patients in the study by Reeceet al. [7] suggests that renal excretion is likely to be themajor elimination pathway for melphalan.
In patients with multiple myeloma the standard mel-phalan dose for patients undergoing ASCT is 200 mg m-2.Dose modifications have been recommended in patientswith impaired renal function [3, 10], while obese patientsoften receive a dose based on adjusted ideal body weightor capped at a body surface area of 2 m2.The optimal dose,that produces a complete disease response with accept-able toxicity, is unknown. In order to ensure that everypatient is administered the optimal dose it is necessary tohave a comprehensive understanding of i) the pharmaco-kinetics of melphalan and the factors that affect disposi-
tion and ii) inter-patient variability in drug exposure and itsassociation with toxicity and efficacy in uniform diseasepopulations.
While there has been one previous population pharma-cokinetic study on melphalan in adults [11], there havebeen no previous studies in which unbound melphalanwas examined and none conducted on a uniform diseasepopulation.The aims of this study were to i) investigate thepharmacokinetics of total and unbound plasma melphalanin a large population of patients with multiple myelomaundergoing high dose therapy, ii) identify clinical factorsthat may affect the disposition of the drug, iii) developlimited sampling strategies that will aid in the pharmaco-kinetic monitoring of melphalan and iv) examine therole of exposure to total and unbound melphalan inmelphalan-related toxicity and disease response.
Methods
This study was a prospective, multi-centre, observationalinvestigation of the pharmacokinetics of melphalan inpatients who underwent ASCT as part of their treatmentfor multiple myeloma. This study was registered with theAustralian Clinical Trials Registry (Registration number:ACTRN0126000231549). The Ethics Committees at each ofthe six participating hospitals approved the study and allthe participants provided written informed consent.
Clinical and biochemical determinationsThe Vitros Fusion 5.1 analyser (Ortho Clinical DiagnosticsAustralia, Mulgrave, VIC, Australia) enzymatic assay wasused to measure plasma creatinine concentrations insamples taken on the day of melphalan pharmacokineticanalysis. Such enzymatic assay methods for plasma creati-nine have been standardized with the international refer-ence method of isotope dilution mass spectrometry [12].The Vitros 5.1 analyser was also used to determine pre-ASCT total protein, albumin and transferrin concentrations,while serum electrophoresis was used to determine pre-ASCT paraprotein concentrations. The haematocrit valuewas recorded either on the day of melphalan administra-tion (preferably) or, if this value was not available, on theclosest day prior.
Creatinine clearance (CLcr) was estimated from plasmacreatinine concentration, age and total body weight (TBW)using the Cockcroft & Gault equation [13] given as follows:
CL mL
Age yearsTBW kg if female
Plasmcr min
.−( ) =
− ( )( )× ( ) × ( )1
1400 85
aa.creatinine mol Lμ −( ) ×1 0 814.
The Cockroft & Gault formula, applied using the patient’sactual weight and a creatinine assay that is aligned withthe isotope dilution mass spectrometry method, has beenshown to provide a good estimate of isotopic glomerular
Melphalan pharmacokinetics in multiple myeloma
Br J Clin Pharmacol / 69:5 / 485
filtration rate in 167 Australian patients with body massindex (BMI) values ranging from 15 to 51 kg m-2 [14]. CLcr
was normalized to a standard weight of 70 kg by dividingby total body weight and multiplying by 70.
BMI and body surface area (BSA) were calculated usingpublished equations [15, 16].
Fat free mass (FFM, kg) was determined using the equa-tions of Janmahasatian et al. [17]:
FFM maleTBW kg
BMI
FFM female
( ) =× × ( )
× + ×
( ) =
9 27 10
6 68 10 216
9 27
3
3
.
.
. ×× × ( )
× + ×10
8 78 10 244
3
3
TBW kg
BMI.
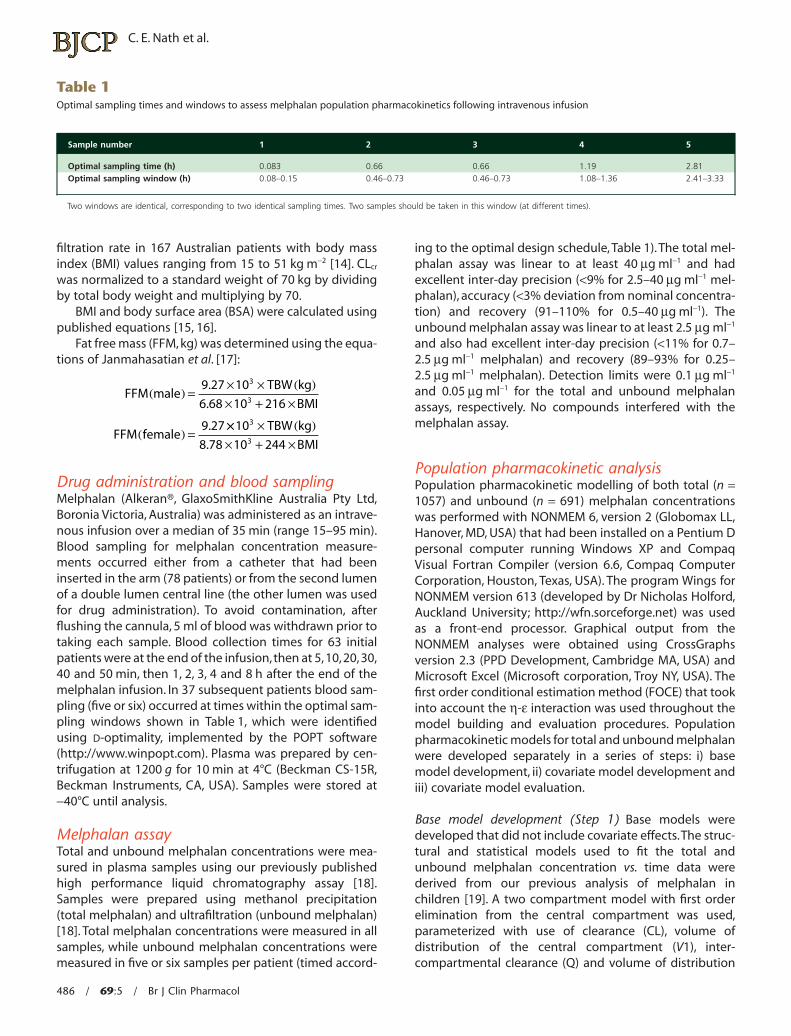
Drug administration and blood samplingMelphalan (Alkeran®, GlaxoSmithKline Australia Pty Ltd,Boronia Victoria, Australia) was administered as an intrave-nous infusion over a median of 35 min (range 15–95 min).Blood sampling for melphalan concentration measure-ments occurred either from a catheter that had beeninserted in the arm (78 patients) or from the second lumenof a double lumen central line (the other lumen was usedfor drug administration). To avoid contamination, afterflushing the cannula, 5 ml of blood was withdrawn prior totaking each sample. Blood collection times for 63 initialpatients were at the end of the infusion,then at 5,10,20,30,40 and 50 min, then 1, 2, 3, 4 and 8 h after the end of themelphalan infusion. In 37 subsequent patients blood sam-pling (five or six) occurred at times within the optimal sam-pling windows shown in Table 1, which were identifiedusing D-optimality, implemented by the POPT software(http://www.winpopt.com). Plasma was prepared by cen-trifugation at 1200 g for 10 min at 4°C (Beckman CS-15R,Beckman Instruments, CA, USA). Samples were stored at-40°C until analysis.
Melphalan assayTotal and unbound melphalan concentrations were mea-sured in plasma samples using our previously publishedhigh performance liquid chromatography assay [18].Samples were prepared using methanol precipitation(total melphalan) and ultrafiltration (unbound melphalan)[18]. Total melphalan concentrations were measured in allsamples, while unbound melphalan concentrations weremeasured in five or six samples per patient (timed accord-
ing to the optimal design schedule, Table 1). The total mel-phalan assay was linear to at least 40 mg ml-1 and hadexcellent inter-day precision (<9% for 2.5–40 mg ml-1 mel-phalan), accuracy (<3% deviation from nominal concentra-tion) and recovery (91–110% for 0.5–40 mg ml-1). Theunbound melphalan assay was linear to at least 2.5 mg ml-1
and also had excellent inter-day precision (<11% for 0.7–2.5 mg ml-1 melphalan) and recovery (89–93% for 0.25–2.5 mg ml-1 melphalan). Detection limits were 0.1 mg ml-1
and 0.05 mg ml-1 for the total and unbound melphalanassays, respectively. No compounds interfered with themelphalan assay.
Population pharmacokinetic analysisPopulation pharmacokinetic modelling of both total (n =1057) and unbound (n = 691) melphalan concentrationswas performed with NONMEM 6, version 2 (Globomax LL,Hanover, MD, USA) that had been installed on a Pentium Dpersonal computer running Windows XP and CompaqVisual Fortran Compiler (version 6.6, Compaq ComputerCorporation, Houston, Texas, USA). The program Wings forNONMEM version 613 (developed by Dr Nicholas Holford,Auckland University; http://wfn.sorceforge.net) was usedas a front-end processor. Graphical output from theNONMEM analyses were obtained using CrossGraphsversion 2.3 (PPD Development, Cambridge MA, USA) andMicrosoft Excel (Microsoft corporation, Troy NY, USA). Thefirst order conditional estimation method (FOCE) that tookinto account the h-e interaction was used throughout themodel building and evaluation procedures. Populationpharmacokinetic models for total and unbound melphalanwere developed separately in a series of steps: i) basemodel development, ii) covariate model development andiii) covariate model evaluation.
Base model development (Step 1) Base models weredeveloped that did not include covariate effects.The struc-tural and statistical models used to fit the total andunbound melphalan concentration vs. time data werederived from our previous analysis of melphalan inchildren [19]. A two compartment model with first orderelimination from the central compartment was used,parameterized with use of clearance (CL), volume ofdistribution of the central compartment (V1), inter-compartmental clearance (Q) and volume of distribution
Table 1Optimal sampling times and windows to assess melphalan population pharmacokinetics following intravenous infusion
Sample number 1 2 3 4 5
Optimal sampling time (h) 0.083 0.66 0.66 1.19 2.81Optimal sampling window (h) 0.08–0.15 0.46–0.73 0.46–0.73 1.08–1.36 2.41–3.33
Two windows are identical, corresponding to two identical sampling times. Two samples should be taken in this window (at different times).
C. E. Nath et al.
486 / 69:5 / Br J Clin Pharmacol
of the peripheral compartment (V2). Inter-patient variabil-ity was described using an exponential random effectsmodel, defined as:
θ θ ηi iEXP= ⋅ ( )�
where qi represents the pharmacokinetic parameter for theith individual, �θ is the typical value of pharmacokineticparameter in the population (e.g. population mean) andhi quantifies the deviation of qi from �θ with a distribution(0, w2). Intra-patient variability was described by acombined additive and proportional error model, givenby:
Y Y= × +( ) +ˆ 1 1 2ε ε
where Y are the predicted and Y the measured concentra-tions in the ith individual at the jth sampling time and wheree1 (proportional component) and e2 (additive component)are random effects quantifying the residual errors, bothwith a distribution (0, s2). Residual errors (e) represent thedifferences between the model predictions and the dataand include intra-patient variability, assay error and modelmisspecification error.
Covariate model development (Step 2) Covariatesscreened for their possible influence on total and unboundmelphalan pharmacokinetic parameters included TBW(kg), BSA (m2), FFM (kg), age (years), CLcr (ml min-1 70 kg-1),CLcr (ml min-1), sex, albumin concentration (g l-1), totalprotein concentration (g l-1) and haematocrit (HCT, %). Thecovariates were implemented in the model using two dif-ferent approaches:
TVCL Covariate and TVCL CovariateCL COV CL= + × = ×θ θ θ .
In addition, the effects of the size covariates, as well asalbumin and total protein concentrations were evaluatedon both CL and V1 simultaneously. Each of the covariates,except TBW, was centred to the median value in the popu-lation (shown in Table 2). TBW was centred to 70 kg. Theinfluence of TBW and FFM on CL and V1 was assessed withthe use of an allometric scaling function [20], in which theexponent was fixed to 0.75 for CL and 1.0 for V1:
CL TBW V1 TBW 701.0.75
2.= ( ) =θ θ70 ,
The influence of individual covariates on pharmacokineticparameters was first examined by plotting the empiricalBayesian estimates of the pharmacokinetic parametersgenerated from the base model against each covariate.Covariates identified as potentially influential were testedfor inclusion in the population pharmacokinetic models byadding these individually into the base population phar-macokinetic model and noting the changes in the objec-tive function value (OBV). A decrease in the objectivefunction by more than 6.63 corresponds to a significancelevel of P < 0.01 (d.f. = 1) using the likelihood ratio test.
Covariates found to reduce significantly the objectivefunction value when tested in the initial screening proce-dure were cumulatively added to the population pharma-cokinetic model using parameterizations that reflected thephysiology of the processes involved. Since total clearanceis the sum of the independent clearances for all the differ-ent pathways of elimination (including renal clearance,hepatic clearance and other methods of elimination) anadditive model (CL = CLrenal + CLhepatic + CLother) best reflectsthe physiology of the processes. A number of evaluationcriteria were then used to select the most appropriatecovariate model including i) a low value for the objectivefunction (OFV), ii) low estimates for sigma, iii) low estimatesof inter-subject variability in the pharmacokinetic param-eters, iv) good agreement between model-predicted andobserved melphalan concentrations and v) good modelperformance as assessed by a visual predictive check,comparing observed concentration vs. time data and the90% confidence interval generated using 500 simulatedconcentration–time data sets.
Covariate model evaluation: (Step 3) A bootstrap proce-dure was used to assess the accuracy and robustness of thecovariate models. This was performed in an automatedfashion using the bootstrap option in the Wings forNONMEM software. The results from 1000 successful runswere obtained (including minimization successful andminimization terminated due to rounding errors [21]). Themean and 95% confidence intervals were calculated for allpopulation pharmacokinetic parameters, as well as the %difference between the bootstrap mean and the estimatederived from the original dataset.
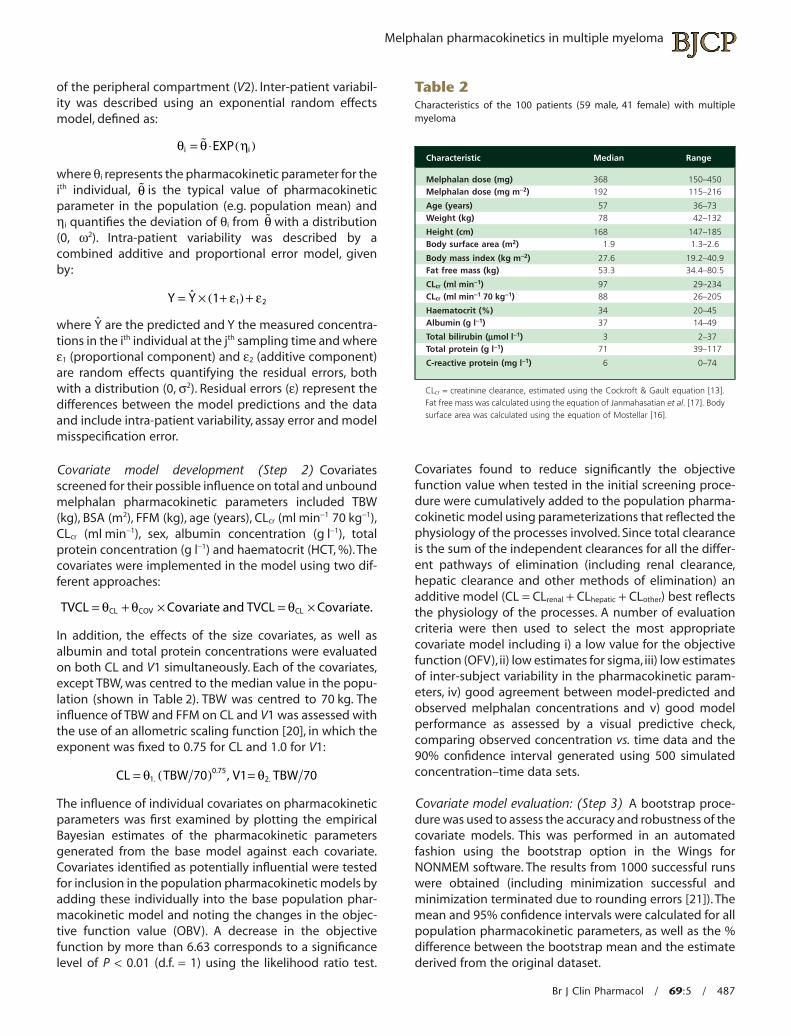
Table 2Characteristics of the 100 patients (59 male, 41 female) with multiplemyeloma
Characteristic Median Range
Melphalan dose (mg) 368 150–450Melphalan dose (mg m-2) 192 115–216
Age (years) 57 36–73Weight (kg) 78 42–132
Height (cm) 168 147–185Body surface area (m2) 1.9 1.3–2.6
Body mass index (kg m-2) 27.6 19.2–40.9Fat free mass (kg) 53.3 34.4–80.5
CLcr (ml min-1) 97 29–234CLcr (ml min-1 70 kg-1) 88 26–205
Haematocrit (%) 34 20–45Albumin (g l-1) 37 14–49
Total bilirubin (mmol l-1) 3 2–37Total protein (g l-1) 71 39–117
C-reactive protein (mg l-1) 6 0–74
CLcr = creatinine clearance, estimated using the Cockroft & Gault equation [13].Fat free mass was calculated using the equation of Janmahasatian et al. [17]. Bodysurface area was calculated using the equation of Mostellar [16].
Melphalan pharmacokinetics in multiple myeloma
Br J Clin Pharmacol / 69:5 / 487
Model-derived pharmacokinetic parametersand other variablesA number of additional pharmacokinetic parameters fortotal and unbound melphalan were derived from theposthoc estimates of the primary pharmacokinetic param-eters including CL and V1 normalized to weight andsurface area, the rate constants (k10, k12, k21), as well as thedistributional half-life ( t1 2 1,λ ) and the elimination half-life( t1 2,λz ).Total and unbound AUC were determined by divid-ing the dose (mg) by the individual posterior Bayesian esti-mates of total and unbound CL, respectively. Fractionunbound (fu) was determined for each of the six samplescollected from each patient by dividing the measuredunbound melphalan concentration by the total melphalanconcentration. Linearity in melphalan protein binding wasthen examined by using one-way ANOVA to test for signifi-cant differences in fu for the six specifically-timed samplescollected from each patient. Overall fraction unbound foreach patient was then determined by dividing theunbound AUC by the total AUC.
Investigating the effects of paraprotein andtransferrin concentrations and myeloma typeon total and unbound melphalan clearanceThe dataset was incomplete with respect to pre-ASCTparaprotein (n = 77) and transferrin concentrations (n = 67),so these covariates could not be considered for inclusion inthe population pharmacokinetic models and were there-fore tested for significant associations with total andunbound melphalan clearance using the correlation coef-ficient of determination. The Mann-Whitney test was usedto compare total and unbound melphalan clearance inpatients with IgA and IgG myeloma.
Investigating the effect of total and unboundmelphalan exposure on toxicity post-transplantand disease responseGastrointestinal toxicity, including clinical oral mucositis,functional oral mucositis, colitis, nausea, vomiting and diar-rhoea, was monitored daily from 2 days prior to stem cellre-infusion (day 0), then up to day 14 and 28 (in the eventof ongoing gastrointestinal toxicity). Grade of toxicity wasassigned on a daily basis using the National Cancer Insti-tute Common Terminology Criteria for Adverse Events(version 3) [22], with the patient’s overall grade being themaximum level achieved during the period of monitoring.Duration of hospital admission was calculated as thenumber of days from date of melphalan administration todate of hospital discharge following admission for man-agement of post transplant complications. In thosepatients who had melphalan and ASCT on an outpatientbasis, this time period included the days between mel-phalan administration and hospital admission. The Mann-Whitney test was then used to test for significantdifferences in total and unbound AUC between patients
who had � grade 3 toxicity or long hospital admissions(�21 days, the 75th percentile) and those who had toxicitygrades of 0–2 or shorter hospital admissions (<21 days).The exception was the toxicity of vomiting: total andunbound melphalan AUCs were compared betweenpatients who had � grade 2 vomiting and those who hadgrade 0–1 vomiting as there were only six patients whohad � grade 3 vomiting.
In patients with multiple myeloma, serum monoclonalparaprotein concentrations were monitored from diagno-sis and throughout treatment to follow response totreatment. Paraprotein concentrations were recorded atdiagnosis, immediately prior to melphalan, then at 6 weekspost melphalan. Data were not available for all patientsdue to i) the test not being performed at the correct time,ii) the presence of overlying bands on electrophoresis pre-venting the accurate quantitation of the patient’s parapro-tein or iii) the data were missing. Disease response criteriaconformed to those previously established for multiplemyeloma [23]. Overall disease response was based on the% change in paraprotein concentrations from diagnosis topost melphalan and was classified as complete response(CR) (100% decrease), very good partial response (VGPR)(�90% decrease), partial response (PR) (50–89% decrease),minimal response (MR) (25–49% decrease), or no change(increase–24% decrease). Melphalan-related disease re-sponse was based on the percentage (%) change in para-protein concentrations from pre- to post-melphalan(classifications were as above for overall disease response)and was assessed in patients whose maximum response toprior treatment was a VGPR or less.The Mann-Whitney testwas then used to test for significant differences in total andunbound AUC between patients who achieved a CR orVGPR and the remainder.
Results
Patient characteristicsThe characteristics of the 100 participants (59 male, 41female) are summarized in Table 2. Myeloma type, as clas-sified by paraprotein type, was IgG (58 patients), IgA (21patients), light chain only (7) and non-secretory (1 patient).Data on paraprotein type were missing for 13 patients.
Population pharmacokineticsThe population pharmacokinetic parameters derived fromthe base models for total and unbound melphalan areshown in Table 3. In the covariate screen, the potentialcovariates that were identified for potential inclusion inthe population pharmacokinetic models for total andunbound melphalan included CLcr (ml min-1 70 kg-1), CLcr
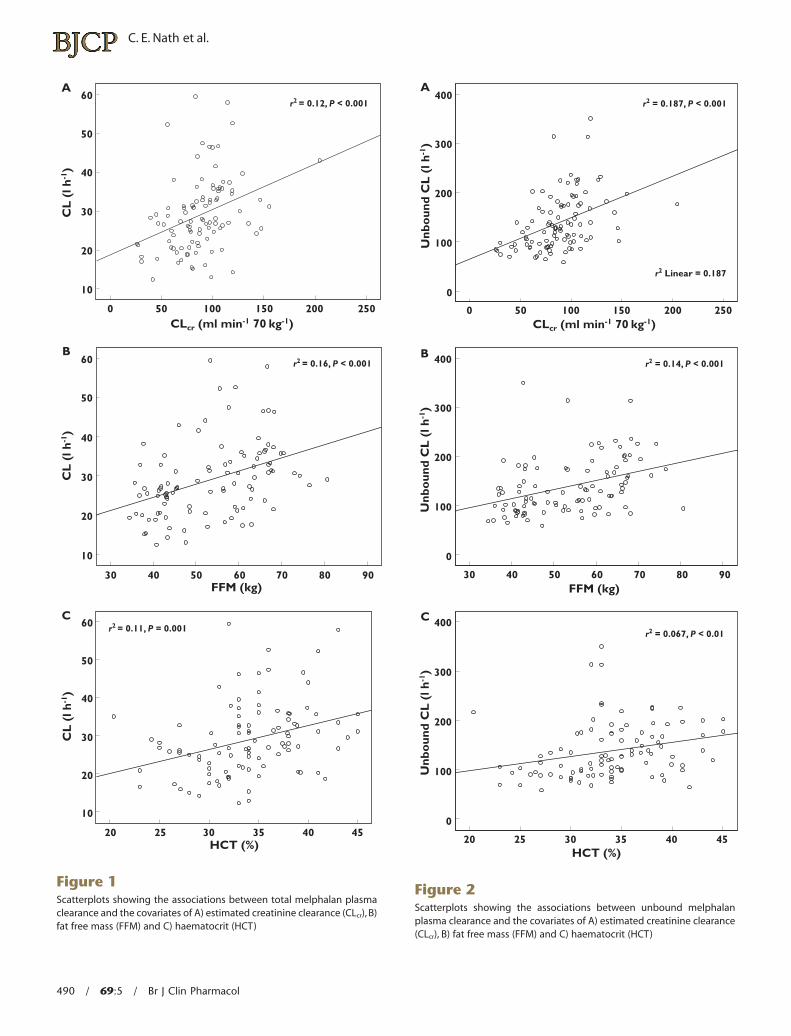
(ml min-1), the body size covariates (TBW, BSA, FFM) andhaematocrit (Table 4). Patients with low values for CLcr, hae-matocrit and FFM tended to have low total and unboundclearance of melphalan (P < 0.01) as shown in Figures 1and 2.
C. E. Nath et al.
488 / 69:5 / Br J Clin Pharmacol
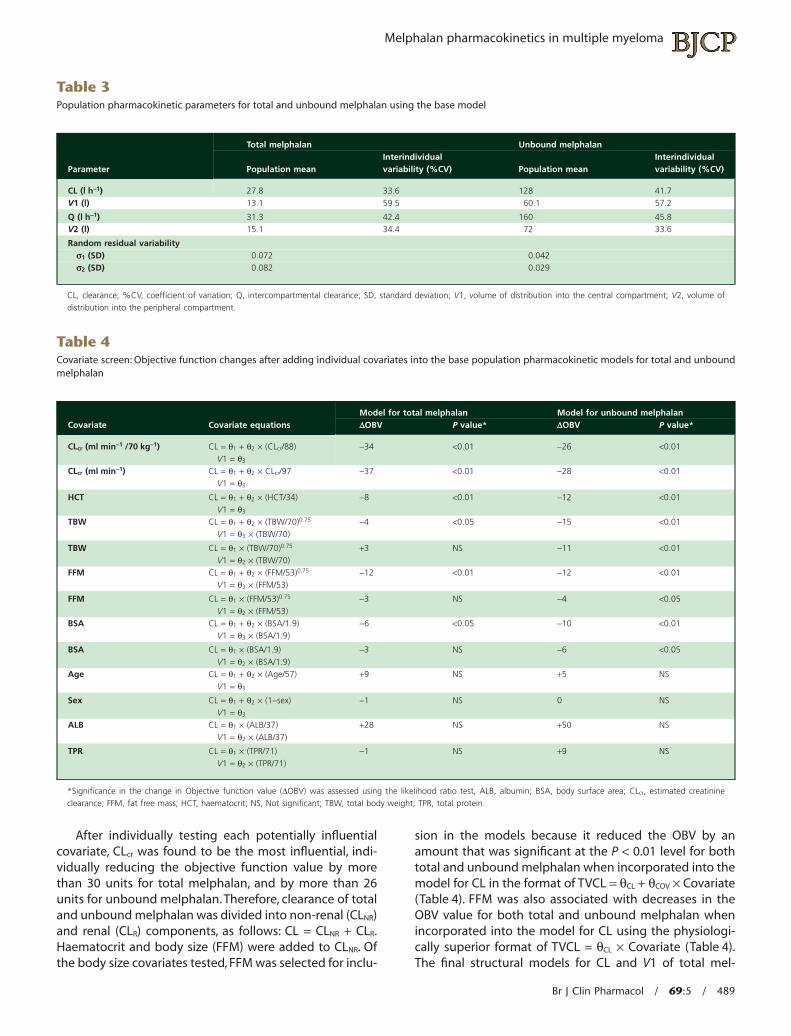
After individually testing each potentially influentialcovariate, CLcr was found to be the most influential, indi-vidually reducing the objective function value by morethan 30 units for total melphalan, and by more than 26units for unbound melphalan. Therefore, clearance of totaland unbound melphalan was divided into non-renal (CLNR)and renal (CLR) components, as follows: CL = CLNR + CLR.Haematocrit and body size (FFM) were added to CLNR. Ofthe body size covariates tested, FFM was selected for inclu-
sion in the models because it reduced the OBV by anamount that was significant at the P < 0.01 level for bothtotal and unbound melphalan when incorporated into themodel for CL in the format of TVCL = qCL + qCOV ¥ Covariate(Table 4). FFM was also associated with decreases in theOBV value for both total and unbound melphalan whenincorporated into the model for CL using the physiologi-cally superior format of TVCL = qCL ¥ Covariate (Table 4).The final structural models for CL and V1 of total mel-
Table 3Population pharmacokinetic parameters for total and unbound melphalan using the base model
Parameter
Total melphalan Unbound melphalan
Population meanInterindividualvariability (%CV) Population mean
Interindividualvariability (%CV)
CL (l h-1) 27.8 33.6 128 41.7V1 (l) 13.1 59.5 60.1 57.2
Q (l h-1) 31.3 42.4 160 45.8V2 (l) 15.1 34.4 72 33.6
Random residual variabilitys1 (SD) 0.072 0.042s2 (SD) 0.082 0.029
CL, clearance; %CV, coefficient of variation; Q, intercompartmental clearance; SD, standard deviation; V1, volume of distribution into the central compartment; V2, volume ofdistribution into the peripheral compartment.
Table 4Covariate screen: Objective function changes after adding individual covariates into the base population pharmacokinetic models for total and unboundmelphalan
Covariate Covariate equationsModel for total melphalan Model for unbound melphalanDOBV P value* DOBV P value*
CLcr (ml min-1 /70 kg-1) CL = q1 + q2 ¥ (CLcr/88)V1 = q3
-34 <0.01 -26 <0.01
CLcr (ml min-1) CL = q1 + q2 ¥ CLcr/97V1 = q3
-37 <0.01 -28 <0.01
HCT CL = q1 + q2 ¥ (HCT/34)V1 = q3
-8 <0.01 -12 <0.01
TBW CL = q1 + q2 ¥ (TBW/70)0.75
V1 = q3 ¥ (TBW/70)-4 <0.05 -15 <0.01
TBW CL = q1 ¥ (TBW/70)0.75
V1 = q2 ¥ (TBW/70)+3 NS -11 <0.01
FFM CL = q1 + q2 ¥ (FFM/53)0.75
V1 = q3 ¥ (FFM/53)-12 <0.01 -12 <0.01
FFM CL = q1 ¥ (FFM/53)0.75
V1 = q2 ¥ (FFM/53)-3 NS -4 <0.05
BSA CL = q1 + q2 ¥ (BSA/1.9)V1 = q3 ¥ (BSA/1.9)
-6 <0.05 -10 <0.01
BSA CL = q1 ¥ (BSA/1.9)V1 = q2 ¥ (BSA/1.9)
-3 NS -6 <0.05
Age CL = q1 + q2 ¥ (Age/57)V1 = q3
+9 NS +5 NS
Sex CL = q1 + q2 ¥ (1-sex)V1 = q3
-1 NS 0 NS
ALB CL = q1 ¥ (ALB/37)V1 = q2 ¥ (ALB/37)
+28 NS +50 NS
TPR CL = q1 ¥ (TPR/71)V1 = q2 ¥ (TPR/71)
-1 NS +9 NS
*Significance in the change in Objective function value (DOBV) was assessed using the likelihood ratio test, ALB, albumin; BSA, body surface area; CLcr, estimated creatinineclearance; FFM, fat free mass; HCT, haematocrit; NS, Not significant; TBW, total body weight; TPR, total protein.
Melphalan pharmacokinetics in multiple myeloma
Br J Clin Pharmacol / 69:5 / 489
A60
50
40
30
20
10
60
50
40
30
20
10
0
30
20 25 30 35 40 45
40 50 60 70 80 90FFM (kg)
HCT (%)
50 100 150CLcr (ml min-1 70 kg-1)
200
r2 = 0.12, P < 0.001
r2 = 0.16, P < 0.001
r2 = 0.11, P = 0.001
250
B
C
CL
(l h
-1)
CL
(l h
-1)
60
50
40
30
20
10
CL
(l h
-1)
Figure 1Scatterplots showing the associations between total melphalan plasmaclearance and the covariates of A) estimated creatinine clearance (CLcr), B)fat free mass (FFM) and C) haematocrit (HCT)
A
B
C
400
300
200
100
0
0
30
20 25 30 35 40 45
40 50 60 70 80 90
50 100 150 200 250
r2 Linear = 0.187
r2 = 0.187, P < 0.001
r2 = 0.14, P < 0.001
r2 = 0.067, P < 0.01
CLcr (ml min-1 70 kg-1)
FFM (kg)
HCT (%)
Unb
oun
d C
L (
l h-1
)
400
300
200
100
0
400
300
200
100
0
Unb
oun
d C
L (
l h-1
)U
nbo
und
CL
(l h
-1)
Figure 2Scatterplots showing the associations between unbound melphalanplasma clearance and the covariates of A) estimated creatinine clearance(CLcr), B) fat free mass (FFM) and C) haematocrit (HCT)
C. E. Nath et al.
490 / 69:5 / Br J Clin Pharmacol
phalan incorporated CLcr (ml min-1 70 kg-1) and had theformat: CL = CLNR + CLR, where
CL HCT FFMCL CL and
NR
R cr
= × ( ) × ( )= × ( ) =
17 34 5011 1 88 1 13
0 462 0 75. . ,. V ..2 50× ( )FFM
The final structural model for CL and V1 of unbound mel-phalan incorporated CLcr (ml min-1 70 kg-1) and had theformat: CL = CLNR + CLR, where
CL HCT FFMCL CL and
NR
R cr
= × ( ) × ( )= × ( ) =
79 7 34 5050 7 88 1
0 679 0 75. ,.
. .
V 663 8 50. × ( )FFM
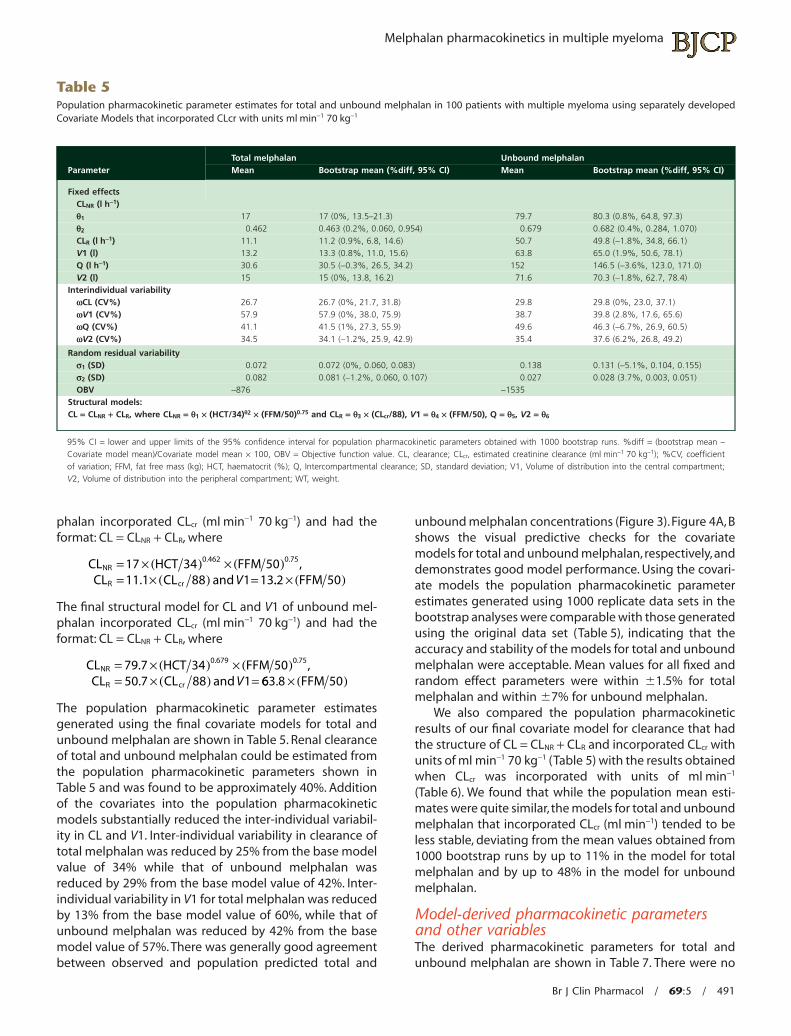
The population pharmacokinetic parameter estimatesgenerated using the final covariate models for total andunbound melphalan are shown in Table 5. Renal clearanceof total and unbound melphalan could be estimated fromthe population pharmacokinetic parameters shown inTable 5 and was found to be approximately 40%. Additionof the covariates into the population pharmacokineticmodels substantially reduced the inter-individual variabil-ity in CL and V1. Inter-individual variability in clearance oftotal melphalan was reduced by 25% from the base modelvalue of 34% while that of unbound melphalan wasreduced by 29% from the base model value of 42%. Inter-individual variability in V1 for total melphalan was reducedby 13% from the base model value of 60%, while that ofunbound melphalan was reduced by 42% from the basemodel value of 57%. There was generally good agreementbetween observed and population predicted total and
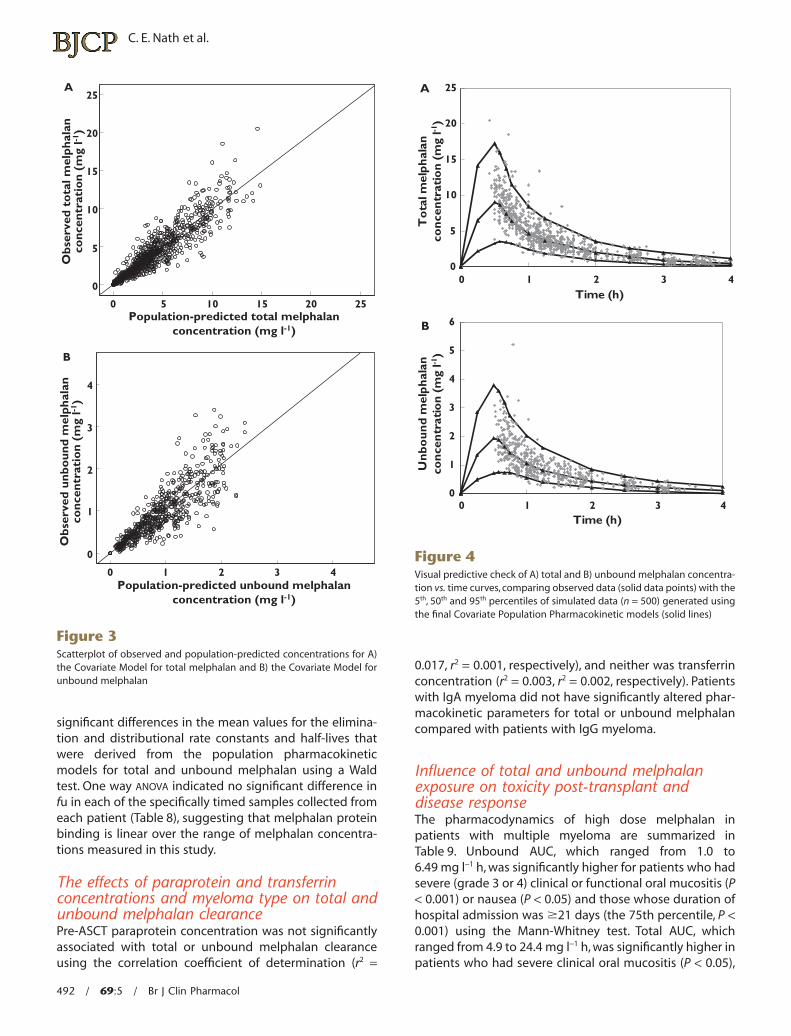
unbound melphalan concentrations (Figure 3).Figure 4A, Bshows the visual predictive checks for the covariatemodels for total and unbound melphalan, respectively, anddemonstrates good model performance. Using the covari-ate models the population pharmacokinetic parameterestimates generated using 1000 replicate data sets in thebootstrap analyses were comparable with those generatedusing the original data set (Table 5), indicating that theaccuracy and stability of the models for total and unboundmelphalan were acceptable. Mean values for all fixed andrandom effect parameters were within �1.5% for totalmelphalan and within �7% for unbound melphalan.
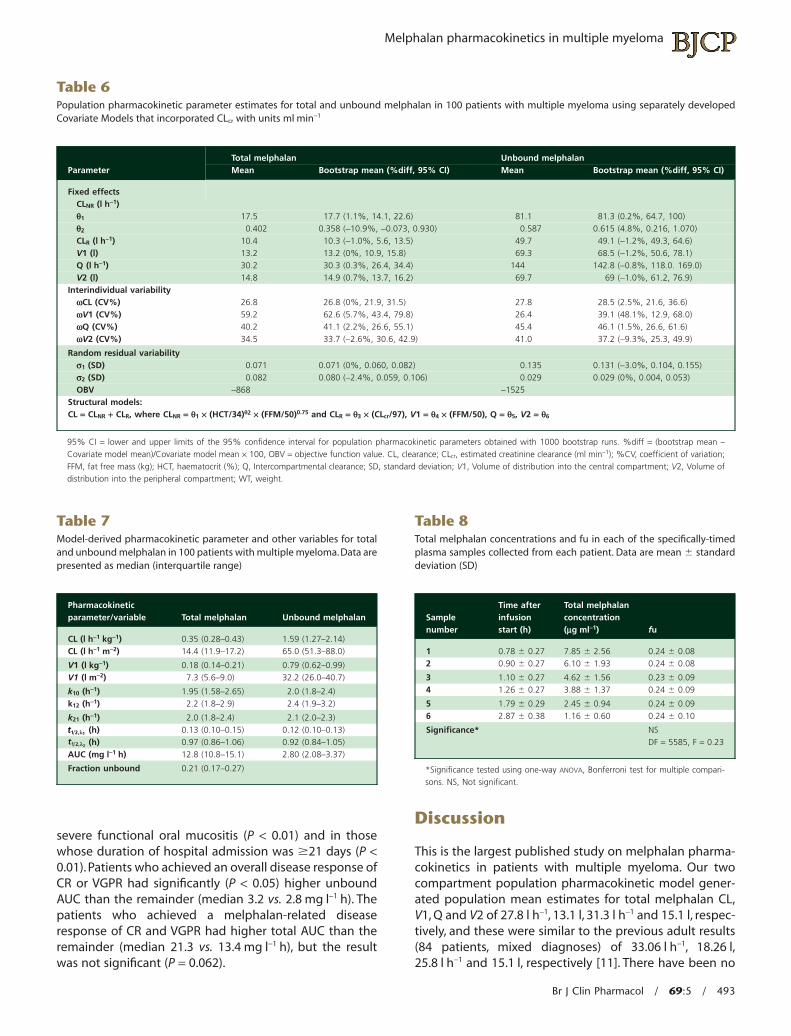
We also compared the population pharmacokineticresults of our final covariate model for clearance that hadthe structure of CL = CLNR + CLR and incorporated CLcr withunits of ml min-1 70 kg-1 (Table 5) with the results obtainedwhen CLcr was incorporated with units of ml min-1
(Table 6). We found that while the population mean esti-mates were quite similar, the models for total and unboundmelphalan that incorporated CLcr (ml min-1) tended to beless stable, deviating from the mean values obtained from1000 bootstrap runs by up to 11% in the model for totalmelphalan and by up to 48% in the model for unboundmelphalan.
Model-derived pharmacokinetic parametersand other variablesThe derived pharmacokinetic parameters for total andunbound melphalan are shown in Table 7. There were no
Table 5Population pharmacokinetic parameter estimates for total and unbound melphalan in 100 patients with multiple myeloma using separately developedCovariate Models that incorporated CLcr with units ml min-1 70 kg-1
ParameterTotal melphalan Unbound melphalanMean Bootstrap mean (%diff, 95% CI) Mean Bootstrap mean (%diff, 95% CI)
Fixed effectsCLNR (l h-1)q1 17 17 (0%, 13.5–21.3) 79.7 80.3 (0.8%, 64.8, 97.3)q2 0.462 0.463 (0.2%, 0.060, 0.954) 0.679 0.682 (0.4%, 0.284, 1.070)CLR (l h-1) 11.1 11.2 (0.9%, 6.8, 14.6) 50.7 49.8 (-1.8%, 34.8, 66.1)V1 (l) 13.2 13.3 (0.8%, 11.0, 15.6) 63.8 65.0 (1.9%, 50.6, 78.1)Q (l h-1) 30.6 30.5 (-0.3%, 26.5, 34.2) 152 146.5 (-3.6%, 123.0, 171.0)V2 (l) 15 15 (0%, 13.8, 16.2) 71.6 70.3 (-1.8%, 62.7, 78.4)
Interindividual variabilitywCL (CV%) 26.7 26.7 (0%, 21.7, 31.8) 29.8 29.8 (0%, 23.0, 37.1)wV1 (CV%) 57.9 57.9 (0%, 38.0, 75.9) 38.7 39.8 (2.8%, 17.6, 65.6)wQ (CV%) 41.1 41.5 (1%, 27.3, 55.9) 49.6 46.3 (-6.7%, 26.9, 60.5)wV2 (CV%) 34.5 34.1 (-1.2%, 25.9, 42.9) 35.4 37.6 (6.2%, 26.8, 49.2)
Random residual variabilitys1 (SD) 0.072 0.072 (0%, 0.060, 0.083) 0.138 0.131 (-5.1%, 0.104, 0.155)s2 (SD) 0.082 0.081 (-1.2%, 0.060, 0.107) 0.027 0.028 (3.7%, 0.003, 0.051)OBV -876 -1535
Structural models:CL = CLNR + CLR, where CLNR = q1 ¥ (HCT/34)q2 ¥ (FFM/50)0.75 and CLR = q3 ¥ (CLcr/88), V1 = q4 ¥ (FFM/50), Q = q5, V2 = q6
95% CI = lower and upper limits of the 95% confidence interval for population pharmacokinetic parameters obtained with 1000 bootstrap runs. %diff = (bootstrap mean –Covariate model mean)/Covariate model mean ¥ 100, OBV = Objective function value. CL, clearance; CLcr, estimated creatinine clearance (ml min-1 70 kg-1); %CV, coefficientof variation; FFM, fat free mass (kg); HCT, haematocrit (%); Q, Intercompartmental clearance; SD, standard deviation; V1, Volume of distribution into the central compartment;V2, Volume of distribution into the peripheral compartment; WT, weight.
Melphalan pharmacokinetics in multiple myeloma
Br J Clin Pharmacol / 69:5 / 491
significant differences in the mean values for the elimina-tion and distributional rate constants and half-lives thatwere derived from the population pharmacokineticmodels for total and unbound melphalan using a Waldtest. One way ANOVA indicated no significant difference infu in each of the specifically timed samples collected fromeach patient (Table 8), suggesting that melphalan proteinbinding is linear over the range of melphalan concentra-tions measured in this study.
The effects of paraprotein and transferrinconcentrations and myeloma type on total andunbound melphalan clearancePre-ASCT paraprotein concentration was not significantlyassociated with total or unbound melphalan clearanceusing the correlation coefficient of determination (r2 =
0.017, r2 = 0.001, respectively), and neither was transferrinconcentration (r2 = 0.003, r2 = 0.002, respectively). Patientswith IgA myeloma did not have significantly altered phar-macokinetic parameters for total or unbound melphalancompared with patients with IgG myeloma.
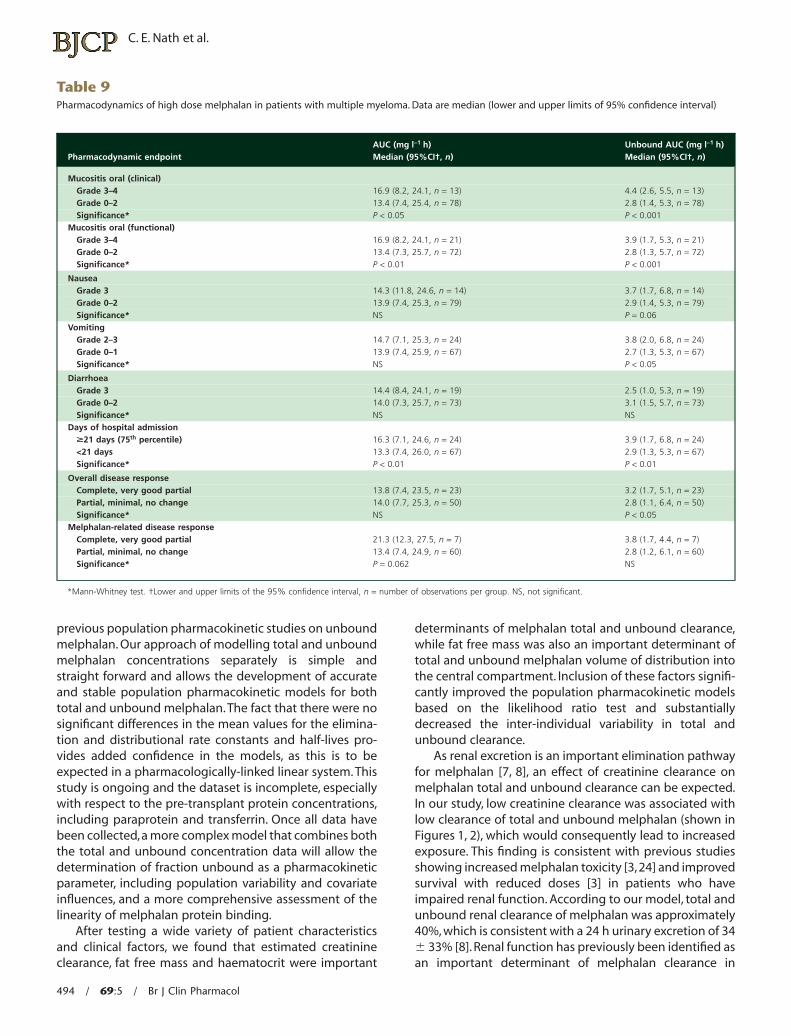
Influence of total and unbound melphalanexposure on toxicity post-transplant anddisease responseThe pharmacodynamics of high dose melphalan inpatients with multiple myeloma are summarized inTable 9. Unbound AUC, which ranged from 1.0 to6.49 mg l-1 h, was significantly higher for patients who hadsevere (grade 3 or 4) clinical or functional oral mucositis (P< 0.001) or nausea (P < 0.05) and those whose duration ofhospital admission was �21 days (the 75th percentile, P <0.001) using the Mann-Whitney test. Total AUC, whichranged from 4.9 to 24.4 mg l-1 h, was significantly higher inpatients who had severe clinical oral mucositis (P < 0.05),
A25
20
15
10
5
0
4
3
2
1
0
0
0 1 2 3 4
5Population-predicted total melphalan
concentration (mg l-1)
Obs
erve
d to
tal m
elph
alan
conc
entr
atio
n (m
g l-1
)O
bser
ved
unbo
und
mel
phal
anco
ncen
trat
ion
(mg
l-1)
Population-predicted unbound melphalanconcentration (mg l-1)
10 15 20 25
B
Figure 3Scatterplot of observed and population-predicted concentrations for A)the Covariate Model for total melphalan and B) the Covariate Model forunbound melphalan
A
0
5
10
15
20
25
0 1 2 3 4Time (h)
To
tal m
elp
hal
anco
nce
ntr
atio
n (
mg
l-1)
B
0
1
2
3
4
5
6
0 1 2 3 4Time (h)
Un
bo
un
d m
elp
hal
anco
nce
ntr
atio
n (
mg
l-1)
Figure 4Visual predictive check of A) total and B) unbound melphalan concentra-tion vs. time curves, comparing observed data (solid data points) with the5th, 50th and 95th percentiles of simulated data (n = 500) generated usingthe final Covariate Population Pharmacokinetic models (solid lines)
C. E. Nath et al.
492 / 69:5 / Br J Clin Pharmacol
severe functional oral mucositis (P < 0.01) and in thosewhose duration of hospital admission was �21 days (P <0.01). Patients who achieved an overall disease response ofCR or VGPR had significantly (P < 0.05) higher unboundAUC than the remainder (median 3.2 vs. 2.8 mg l-1 h). Thepatients who achieved a melphalan-related diseaseresponse of CR and VGPR had higher total AUC than theremainder (median 21.3 vs. 13.4 mg l-1 h), but the resultwas not significant (P = 0.062).
Discussion
This is the largest published study on melphalan pharma-cokinetics in patients with multiple myeloma. Our twocompartment population pharmacokinetic model gener-ated population mean estimates for total melphalan CL,V1, Q and V2 of 27.8 l h-1, 13.1 l, 31.3 l h-1 and 15.1 l, respec-tively, and these were similar to the previous adult results(84 patients, mixed diagnoses) of 33.06 l h-1, 18.26 l,25.8 l h-1 and 15.1 l, respectively [11]. There have been no
Table 6Population pharmacokinetic parameter estimates for total and unbound melphalan in 100 patients with multiple myeloma using separately developedCovariate Models that incorporated CLcr with units ml min-1
ParameterTotal melphalan Unbound melphalanMean Bootstrap mean (%diff, 95% CI) Mean Bootstrap mean (%diff, 95% CI)
Fixed effectsCLNR (l h-1)q1 17.5 17.7 (1.1%, 14.1, 22.6) 81.1 81.3 (0.2%, 64.7, 100)q2 0.402 0.358 (-10.9%, -0.073, 0.930) 0.587 0.615 (4.8%, 0.216, 1.070)CLR (l h-1) 10.4 10.3 (-1.0%, 5.6, 13.5) 49.7 49.1 (-1.2%, 49.3, 64.6)V1 (l) 13.2 13.2 (0%, 10.9, 15.8) 69.3 68.5 (-1.2%, 50.6, 78.1)Q (l h-1) 30.2 30.3 (0.3%, 26.4, 34.4) 144 142.8 (-0.8%, 118.0. 169.0)V2 (l) 14.8 14.9 (0.7%, 13.7, 16.2) 69.7 69 (-1.0%, 61.2, 76.9)
Interindividual variabilitywCL (CV%) 26.8 26.8 (0%, 21.9, 31.5) 27.8 28.5 (2.5%, 21.6, 36.6)wV1 (CV%) 59.2 62.6 (5.7%, 43.4, 79.8) 26.4 39.1 (48.1%, 12.9, 68.0)wQ (CV%) 40.2 41.1 (2.2%, 26.6, 55.1) 45.4 46.1 (1.5%, 26.6, 61.6)wV2 (CV%) 34.5 33.7 (-2.6%, 30.6, 42.9) 41.0 37.2 (-9.3%, 25.3, 49.9)
Random residual variabilitys1 (SD) 0.071 0.071 (0%, 0.060, 0.082) 0.135 0.131 (-3.0%, 0.104, 0.155)s2 (SD) 0.082 0.080 (-2.4%, 0.059, 0.106) 0.029 0.029 (0%, 0.004, 0.053)OBV -868 -1525
Structural models:CL = CLNR + CLR, where CLNR = q1 ¥ (HCT/34)q2 ¥ (FFM/50)0.75 and CLR = q3 ¥ (CLcr/97), V1 = q4 ¥ (FFM/50), Q = q5, V2 = q6
95% CI = lower and upper limits of the 95% confidence interval for population pharmacokinetic parameters obtained with 1000 bootstrap runs. %diff = (bootstrap mean –Covariate model mean)/Covariate model mean ¥ 100, OBV = objective function value. CL, clearance; CLcr, estimated creatinine clearance (ml min-1); %CV, coefficient of variation;FFM, fat free mass (kg); HCT, haematocrit (%); Q, Intercompartmental clearance; SD, standard deviation; V1, Volume of distribution into the central compartment; V2, Volume ofdistribution into the peripheral compartment; WT, weight.
Table 7Model-derived pharmacokinetic parameter and other variables for totaland unbound melphalan in 100 patients with multiple myeloma. Data arepresented as median (interquartile range)
Pharmacokineticparameter/variable Total melphalan Unbound melphalan
CL (l h-1 kg-1) 0.35 (0.28–0.43) 1.59 (1.27–2.14)CL (l h-1 m-2) 14.4 (11.9–17.2) 65.0 (51.3–88.0)
V1 (l kg-1) 0.18 (0.14–0.21) 0.79 (0.62–0.99)V1 (l m-2) 7.3 (5.6–9.0) 32.2 (26.0–40.7)
k10 (h-1) 1.95 (1.58–2.65) 2.0 (1.8–2.4)k12 (h-1) 2.2 (1.8–2.9) 2.4 (1.9–3.2)
k21 (h-1) 2.0 (1.8–2.4) 2.1 (2.0–2.3)t1 2, 1l (h) 0.13 (0.10–0.15) 0.12 (0.10–0.13)t1 2, zl (h) 0.97 (0.86–1.06) 0.92 (0.84–1.05)AUC (mg l-1 h) 12.8 (10.8–15.1) 2.80 (2.08–3.37)
Fraction unbound 0.21 (0.17–0.27)
Table 8Total melphalan concentrations and fu in each of the specifically-timedplasma samples collected from each patient. Data are mean � standarddeviation (SD)
Samplenumber
Time afterinfusionstart (h)
Total melphalanconcentration(mg ml-1) fu
1 0.78 � 0.27 7.85 � 2.56 0.24 � 0.082 0.90 � 0.27 6.10 � 1.93 0.24 � 0.08
3 1.10 � 0.27 4.62 � 1.56 0.23 � 0.094 1.26 � 0.27 3.88 � 1.37 0.24 � 0.09
5 1.79 � 0.29 2.45 � 0.94 0.24 � 0.096 2.87 � 0.38 1.16 � 0.60 0.24 � 0.10
Significance* NSDF = 5585, F = 0.23
*Significance tested using one-way ANOVA, Bonferroni test for multiple compari-sons. NS, Not significant.
Melphalan pharmacokinetics in multiple myeloma
Br J Clin Pharmacol / 69:5 / 493
previous population pharmacokinetic studies on unboundmelphalan. Our approach of modelling total and unboundmelphalan concentrations separately is simple andstraight forward and allows the development of accurateand stable population pharmacokinetic models for bothtotal and unbound melphalan. The fact that there were nosignificant differences in the mean values for the elimina-tion and distributional rate constants and half-lives pro-vides added confidence in the models, as this is to beexpected in a pharmacologically-linked linear system. Thisstudy is ongoing and the dataset is incomplete, especiallywith respect to the pre-transplant protein concentrations,including paraprotein and transferrin. Once all data havebeen collected,a more complex model that combines boththe total and unbound concentration data will allow thedetermination of fraction unbound as a pharmacokineticparameter, including population variability and covariateinfluences, and a more comprehensive assessment of thelinearity of melphalan protein binding.
After testing a wide variety of patient characteristicsand clinical factors, we found that estimated creatinineclearance, fat free mass and haematocrit were important
determinants of melphalan total and unbound clearance,while fat free mass was also an important determinant oftotal and unbound melphalan volume of distribution intothe central compartment. Inclusion of these factors signifi-cantly improved the population pharmacokinetic modelsbased on the likelihood ratio test and substantiallydecreased the inter-individual variability in total andunbound clearance.
As renal excretion is an important elimination pathwayfor melphalan [7, 8], an effect of creatinine clearance onmelphalan total and unbound clearance can be expected.In our study, low creatinine clearance was associated withlow clearance of total and unbound melphalan (shown inFigures 1, 2), which would consequently lead to increasedexposure. This finding is consistent with previous studiesshowing increased melphalan toxicity [3,24] and improvedsurvival with reduced doses [3] in patients who haveimpaired renal function. According to our model, total andunbound renal clearance of melphalan was approximately40%, which is consistent with a 24 h urinary excretion of 34� 33% [8]. Renal function has previously been identified asan important determinant of melphalan clearance in
Table 9Pharmacodynamics of high dose melphalan in patients with multiple myeloma. Data are median (lower and upper limits of 95% confidence interval)
Pharmacodynamic endpointAUC (mg l-1 h)Median (95%CI†, n)
Unbound AUC (mg l-1 h)Median (95%CI†, n)
Mucositis oral (clinical)Grade 3–4 16.9 (8.2, 24.1, n = 13) 4.4 (2.6, 5.5, n = 13)Grade 0–2 13.4 (7.4, 25.4, n = 78) 2.8 (1.4, 5.3, n = 78)Significance* P < 0.05 P < 0.001
Mucositis oral (functional)Grade 3–4 16.9 (8.2, 24.1, n = 21) 3.9 (1.7, 5.3, n = 21)Grade 0–2 13.4 (7.3, 25.7, n = 72) 2.8 (1.3, 5.7, n = 72)Significance* P < 0.01 P < 0.001
NauseaGrade 3 14.3 (11.8, 24.6, n = 14) 3.7 (1.7, 6.8, n = 14)Grade 0–2 13.9 (7.4, 25.3, n = 79) 2.9 (1.4, 5.3, n = 79)Significance* NS P = 0.06
VomitingGrade 2–3 14.7 (7.1, 25.3, n = 24) 3.8 (2.0, 6.8, n = 24)Grade 0–1 13.9 (7.4, 25.9, n = 67) 2.7 (1.3, 5.3, n = 67)Significance* NS P < 0.05
DiarrhoeaGrade 3 14.4 (8.4, 24.1, n = 19) 2.5 (1.0, 5.3, n = 19)Grade 0–2 14.0 (7.3, 25.7, n = 73) 3.1 (1.5, 5.7, n = 73)Significance* NS NS
Days of hospital admission�21 days (75th percentile) 16.3 (7.1, 24.6, n = 24) 3.9 (1.7, 6.8, n = 24)<21 days 13.3 (7.4, 26.0, n = 67) 2.9 (1.3, 5.3, n = 67)Significance* P < 0.01 P < 0.01
Overall disease responseComplete, very good partial 13.8 (7.4, 23.5, n = 23) 3.2 (1.7, 5.1, n = 23)Partial, minimal, no change 14.0 (7.7, 25.3, n = 50) 2.8 (1.1, 6.4, n = 50)Significance* NS P < 0.05
Melphalan-related disease responseComplete, very good partial 21.3 (12.3, 27.5, n = 7) 3.8 (1.7, 4.4, n = 7)Partial, minimal, no change 13.4 (7.4, 24.9, n = 60) 2.8 (1.2, 6.1, n = 60)Significance* P = 0.062 NS
*Mann-Whitney test. †Lower and upper limits of the 95% confidence interval, n = number of observations per group. NS, not significant.
C. E. Nath et al.
494 / 69:5 / Br J Clin Pharmacol
population pharmacokinetic studies [11, 19]. Our finalmodel incorporated CLcr with units of ml min-1 70 kg-1. Wealso tested a model that incorporated CLcr with units ofml min-1 (which is more familiar to clinicians), but thismodel was not as stable when evaluated using bootstrap-ping. It is possible that normalizing to body weight (orbody surface area) improves model stability by having acentring effect.
The increasing prevalence of obesity [25] has drawnattention to the absence of high quality pharmacokineticdata for many chemotherapeutic agents, including mel-phalan, in this population of patients.Our study populationhad a broad weight range (42–132 kg) with 37% havingbody mass index values of greater than 30 mg kg-2 andtherefore defined as obese, by the World Health Organiza-tion [26]. In our population pharmacokinetic modelling wefound that of all the alternative body size descriptors, fatfree mass best described both melphalan total andunbound clearance. Fat free mass has been proposed asthe best size descriptor for use in pharmacokinetic studiesand dose adjustments in the obese [27, 28]. Body size haspreviously been found to be an important predictor oftotal melphalan clearance in adults [11], but total bodyweight was used in that model.
The disease of multiple myeloma can be associatedwith anaemia, reduced haemoglobin and, consequently,low haematocrit. In this population of patients haematocritvalues ranged from 23% to 44% and 35% of patients hadhaematocrit values less than 33%. Melphalan (37%) hasbeen recovered from the red cell fraction of human wholeblood [29], while in rats it has been demonstrated thatbinding (covalent) is primarily to proteins in red cell mem-branes [30]. Low haematocrit means reduced red bloodcell count and, consequently, lower binding of melphalanto red blood cells and a higher non-red blood cell fraction.This could lead to higher plasma and ultrafiltrate concen-trations and lower clearance values, as have been observedin this study (Figures 1, 2). Haematocrit has not been pre-viously identified as a predictor of melphalan pharmacoki-netic parameters in any other studies.
We examined whether the concentrations of specificproteins contributed to the large variability in total orunbound melphalan clearance but did not detect any sig-nificant associations with the pre-transplant levels of para-protein, total protein, albumin or transferrin. A highlyvariable unbound melphalan fraction that was not associ-ated with total protein or albumin concentrations hasbeen previously observed [29], even though in vitro mel-phalan binds to albumin (60%) and a1-glycoprotein (20%)[8]. In multiple myeloma paraprotein concentrations areused to monitor response to therapy. Pre-melphalan para-protein concentrations can vary widely, depending onresponse to previous treatment. Our finding (in a largepopulation) that paraprotein concentrations do not influ-ence total or unbound melphalan pharmacokinetics con-firms results from previous smaller studies [8, 29].
We investigated the association between total andunbound melphalan exposure and toxicity post-melphalan and we found that patients who had severe(grade 3) gastrointestinal toxicity or a long hospital admis-sion had significantly higher exposure to total andunbound melphalan. Unbound AUC was a more sensitivepredictor of toxicity than total AUC since a greater levelof significance was demonstrated for a greater number oftoxicity endpoints. This is to be expected because use ofunbound AUC eliminates the (perhaps substantial) popu-lation variability in protein binding. High total AUC haspreviously been observed to be associated with the occur-rence of grade 1 or 2 gastrointestinal toxicity following100 mg m-2 melphalan in children [31] and the develop-ment of mucositis in adults [11].
We also investigated the association between total andunbound exposure to melphalan and disease response.Weobserved a weak (P < 0.05) association between unboundmelphalan AUC and overall disease response. A significantassociation between total melphalan AUC and melphalan-related disease response could not be demonstrated (P =0.062), but this may reflect the fact that the study wasinsufficiently powered (at this point) to demonstrate aneffect due to the small numbers of patients (n = 7) in thegroup who had achieved a CR or VGPR to melphalan. Addi-tionally, this simple analysis does not take into accountother factors, such as post ASCT therapy, that may alsoimpact on disease response. These preliminary results arevery promising and further longitudinal response datamay enable us to characterize better the associationbetween total and unbound melphalan exposure and effi-cacy in multiple myeloma.
In conclusion, population pharmacokinetic modellingof total and unbound melphalan shows that estimatedcreatinine clearance, fat free mass and haematocrit areimportant determinants of total and unbound melphalanclearance.Preliminary pharmacodynamic analyses demon-strate that higher drug exposure is associated with bothincreased toxicity and efficacy, with unbound exposurebeing a more sensitive predictor of toxicity and efficacythan total exposure.These results provide the promise of amelphalan dosing algorithm in myeloma that maximizestherapeutic efficacy and reduces toxicity.
Competing interests
A.J. McL. has received research funding from GlaxoSmith-Kline to support a postgraduate research scholarship for astudent under his supervision.
Christa E. Nath is supported by the Leukaemia ResearchSupport Fund of The Children’s Hospital Westmead and byNHMRC Project Grant 396702. Lihua Zeng is also supportedby NH MRC Project Grant 396702. We would like to thank thepatients for taking part in the study, the nursing staff in thehaematology units for their care of the patients, including
Melphalan pharmacokinetics in multiple myeloma
Br J Clin Pharmacol / 69:5 / 495
taking blood samples for measurement of melphalanconcentrations and the data managers for recording theclinical data.
REFERENCES
1 Attal M, Harousseau JL, Stoppa AM, Sotto JJ, Fuzibet JG,Rossi JF, Casassus P, Maisonneuve H, Facon T, Ifrah N,Payen C, Bataille R. A prospective, randomized trial ofautologous bone marrow transplantation andchemotherapy in multiple myeloma. IntergroupeFrancais du Myelome. N Engl J Med 1996; 335: 91–7.
2 Lenhoff S, Hjorth M, Holmberg E, Turesson I, Weston J,Nielsen JL, Wisloff F, Brinch L, Carlson K, Carlsson M, Dahl IM,Gimsing P, Hippe E, Johnsen H, Lamvik J, Lofvenberg E,Nesthus I, Rodjer S. Impact on survival of high dose therapywith autologous stem cell support in patients younger than60 years with newly diagnosed multiple myeloma: apopulation-based study. Nordic myeloma Study Group.Blood 2000; 95: 7–11.
3 Cornwell GG III, Pajak TF, McIntyre OR, Kochwa S, Dosik H.Influence of renal failure on myelosuppressive effects ofmelphalan: cancer and leukemia group B experience. CancerTreat Rep 1982; 66: 475–81.
4 Moreau P, Kergueris M-F, Milpied N, Le Tortorec SL, Mahe B,Bulabois C-E, Rapp M-J, Larousse C, Bataille R,Harousseau J-L. A pilot study of 220 mg/m2 melphalanfollowed by autologous stem cell transplantation in patientswith advanced haematological malignancies:pharmacokinetics and toxicity. Br J Haematol 1996; 95:527–30.
5 Sarosy G, Leyland-Jones B, Soochan P, Cheson BD. Thesystemic administration of intravenous melphalan. J ClinOncol 1988; 6: 1768–82.
6 Gertz MA, Lacy MQ, Dispenzieri A, Ansell A, Elliot SM,Gastineau DA, Inwards DJ, Micallef INM, Porrata LF, Tefferi A,Litzow MR. Risk-adjusted manipulation of melphalan dosebefore stem cell transplantation in patients with amyloidosisis associated with a lower response rate. Bone MarrowTransplant 2004; 34: 1025–31.
7 Reece PA, Hill HS, Green RM, Morris RG, Dale BM, Kotasek D,Sage RE. Renal clearance and protein binding of melphalanin patients with cancer. Cancer Chemother Pharmacol 1988;22: 348–52.
8 Gera S, Musch E, Osterheld HK, Loos U. Relevance of thehydrolysis and protein binding of melphalan to thetreatment of multiple myeloma. Cancer ChemotherPharmacol 1989; 23: 76–80.
9 Chang SY, Alberts DS, Farquhar D, Melnick LR, Walson PD,Salmon SE. Hydrolysis and protein binding of melphalan. JPharm Sci 1978; 67: 682–4.
10 Badros A, Barlogie B, Siegel E, Roberts J, Langmaid C,Zangari M, Desikan R, Shaver MJ, Fassas A, McConnell S,Muwalla F, Barri Y, Anaissie E, Munshi N, Tricot G. Results of
autologous stem cell transplant in multiple myelomapatients with renal failure. Br J Haematol 2001; 114: 822–9.
11 Kühne A, Sezer O, Heider U, Meineke I, Muhlke S, Niere W,Overbeck T, Hohloch K, Trümper L, Brockmöller J, Kaiser R.Population pharmacokinetics of melphalan and glutathioneS-transferase polymorphisms in relation to side effects. ClinPharmacol Ther 2008; 83: 749–57.
12 Junge W, Wilke B, Halabi A, Klein G. Determination ofreference intervals for serum creatinine, creatinine excretionand creatinine clearance with an enzymatic and a modifiedJaffe method. Clin Chim Acta 2004; 344: 137–48.
13 Cockcroft DW, Gault MH. Prediction of creatinine clearancefrom serum creatinine. Nephron 1976; 16: 31–41.
14 Jones GRD, Imam SK. Validation of the revised MDRDformula and the original Cockroft and Gault formula forestimation of the glomerular filtration rate using Australiandata. Pathology 2009; 41: 379–82.
15 Keys A, Fidanza F, Karvonen M, Kimura N, Taylor H. Indices ofrelative weight and obesity. J Chronic Dis 1972; 25: 329–43.
16 Mosteller RD. Simplified calculation of body surface area. NEngl J Med 1987; 317: 1098.
17 Janmahasatian S, Duffull S, Ash S, Ward LC, Byrne NM,Green B. Quantification of lean body weight. ClinPharmacokinet 2005; 44: 1051–65.
18 Nath CE, Zeng L, Eslick A, Trotman J, Earl J. An isocratic UVHPLC assay for analysis of total and free melphalanconcentrations in human plasma. Acta Chromatogr 2008; 20:383–98.
19 Nath CE, Shaw PJ, Montgomery K, Earl JW. Populationpharmacokinetics of melphalan in paediatric blood ormarrow transplant recipients. Br J Clin Pharmacol 2007; 64:151–64.
20 Holford NHG. A size standard for pharmacokinetics. ClinPharmacokinet 1996; 30: 329–32.
21 Gastonguay MR, El-Tahtawy A. Effect of NONMEMminimization status and number of replicates on bootstrapparameter distributions for population pharmacokineticmodels: a case study. Clin Pharmacol Ther 2005; 77: 2,doi:10.1016/j.clpt.2004.11.010.
22 National Cancer Institute, USA. Common terminologyCriteria for Adverse Events v 3.0 (CTCAE). Publish date: 12December 2003. Available at http://ctep.cancer.gov (lastaccessed 31 March 2003).
23 Blade J, Samson D, Reece D, Apperley J, Björkstrand B,Gahrton G, Gertz M, Giralt S, Jagannath S, Vesole D. Criteriafor evaluating disease response and progression in patientswith multiple myeloma treated by high dose therapy andhaemopoietic stem cell transplantation. Br J Haematol 1998;102: 1115–23.
24 Carlson K. Melphalan 200 mg/m2 with blood stem cellsupport as first line myeloma therapy: impact of glomerularfiltration rate on engraftment, transplantation-relatedtoxicity and survival. Bone Marrow Transplant 2005; 35:985–90.
C. E. Nath et al.
496 / 69:5 / Br J Clin Pharmacol
25 Bjorntorp P. Obesity. Lancet 1997; 350: 423–6.
26 World Health Organization. Report of a WHO Consultant onObesity: Preventing and managing the global epidemic.Geneva: WHO, 1998.
27 Green B, Duffull SB. What is the best size descriptor to usefor pharmacokinetic studies in the obese? Br J ClinPharmacol 2004; 58: 119–33.
28 Han PY, Duffull SB, Kirkpatrick CMJ, Green B. Dosing inobesity: a simple solution to a big problem. Clin PharmacolTher 2007; 82: 505–8.
29 Grieg NH, Sweeney DJ, Rapoport SI. Melphalanconcentration dependent plasma protein binding in healthyhumans and rats. Eur J Clin Pharmacol 1987; 32: 179–85.
30 Ahmed AE, Hsu TF, El-Azhary RA, Moawad H, Costanzi J.Macromolecular interactions of 14C-ring melphalan in blood.Biochem Pharmacol 1982; 31: 1615–9.
31 Vassal G, Tranchand B, Valteau-Couanet D, Mahe C,Couanet D, Schoeppfer C, Grill J, Kalifa C, Hill C,Ardiet C, Hartmann O. Pharmacodynamics of tandemhigh-dose melphalan with peripheral blood stem celltransplantation in children with neuroblastoma andmedulloblastoma. Bone Marrow Transplant 2001;27: 471–7.
Melphalan pharmacokinetics in multiple myeloma
Br J Clin Pharmacol / 69:5 / 497
Related Documents