Population Dynamics of Reintroduced Elk (Cervus elaphus) in Eastern North America by Jesse N. Popp Thesis submitted in partial fulfillment of the requirements for the degree of Doctor of Philosophy (Ph.D.) in Boreal Ecology Faculty of Graduate Studies Laurentian University Sudbury, Ontario © Jesse N. Popp 2017

Welcome message from author
This document is posted to help you gain knowledge. Please leave a comment to let me know what you think about it! Share it to your friends and learn new things together.
Transcript
Population Dynamics of Reintroduced Elk (Cervus elaphus)
in Eastern North America
by
Jesse N. Popp
Thesis submitted in partial fulfillment of the
requirements for the degree of
Doctor of Philosophy (Ph.D.)
in Boreal Ecology
Faculty of Graduate Studies
Laurentian University
Sudbury, Ontario
© Jesse N. Popp 2017
ii
THESIS DEFENCE COMMITTEE/COMITÉ DE SOUTENANCE DE THÈSE Laurentian Université/Université Laurentienne
Faculty of Graduate Studies/Faculté des études supérieures Title of Thesis Titre de la thèse Population Dynamics of Reintroduced Elk (Cervus elaphus) in Eastern North
America Name of Candidate Nom du candidat Popp, Jesse Degree Diplôme Doctor of Philosophy Department/Program Date of Defence Département/Programme PhD Boreal Ecology Date de la soutenance April 20, 2017
APPROVED/APPROUVÉ Thesis Examiners/Examinateurs de thèse: Dr. Frank F. Mallory (Supervisor/Directeur(trice) de thèse) Dr. Joseph Hamr (Co-supervisor/Co-directeur(trice) de thèse) Dr. Michael Persinger (Committee member/Membre du comité) Dr. Mark Boyce (Committee member/Membre du comité) Approved for the Faculty of Graduate Studies Dr. Jeff Larkin Approuvé pour la Faculté des études supérieures (Committee member/Membre du comité) Dr. David Lesbarrères Monsieur David Lesbarrères Dr. Arthur Rodgers Dean, Faculty of Graduate Studies (External Examiner/Examinateur externe) Doyen, Faculté des études supérieures Dr. Robert Lafrenie (Internal Examiner/Examinateur interne)
ACCESSIBILITY CLAUSE AND PERMISSION TO USE I, Jesse Popp, hereby grant to Laurentian University and/or its agents the non-exclusive license to archive and make accessible my thesis, dissertation, or project report in whole or in part in all forms of media, now or for the duration of my copyright ownership. I retain all other ownership rights to the copyright of the thesis, dissertation or project report. I also reserve the right to use in future works (such as articles or books) all or part of this thesis, dissertation, or project report. I further agree that permission for copying of this thesis in any manner, in whole or in part, for scholarly purposes may be granted by the professor or professors who supervised my thesis work or, in their absence, by the Head of the Department in which my thesis work was done. It is understood that any copying or publication or use of this thesis or parts thereof for financial gain shall not be allowed without my written permission. It is also understood that this copy is being made available in this form by the authority of the copyright owner solely for the purpose of private study and research and may not be copied or reproduced except as permitted by the copyright laws without written authority from the copyright owner.

iii
Abstract
Studies that focus on identifying factors that influence reintroduction success have often taken an
individual population approach; however, investigating multiple populations can provide
additional insight. The overall objective of this research was to emphasize the value of using
within- and among-population approaches to identifying factors that influence the population
dynamics of a reintroduced species. Elk (Cervus elaphus), a species that was extirpated from
eastern North America during the late 1800s, has been reintroduced to portions of its former
range over the past century through several initiatives. Today, there are several established
populations across eastern regions of the USA and Canada, for which extensive monitoring data
are available, creating an opportunity to investigate reintroduction success. I aimed to use these
data to identify factors associated with changes in the survival and population growth rates of 10
reintroduced elk populations across eastern North America. More specifically, I: (1) performed a
literature review detailing the history of elk reintroduction in eastern North America over the
past century, (2) identified factors associated with the variation in population growth rates
(reintroduction success) for 10 reintroduced elk populations using an among-population
approach, (3) identified and assessed how climate affected the population growth rates of 7
reintroduced elk populations, and (4) investigated direct causes of mortality (predation and train
collisions) associated with a single elk population experiencing low population growth.
Although the number of successful elk restoration attempts has increased over the past century,
there has been substantial variation in population growth rates among reintroductions. Major
iv
causes of elk mortality in restored populations differed between the pre- to post-acclimation
phases of reintroduction. Population growth rates were negatively related to the percentage of
coniferous forest within elk population range, suggesting that expansive areas of coniferous
forests in eastern North America may represent sub-optimal elk habitat.
The Burwash elk population in Ontario had low growth rate compared to most other populations
reintroduced into eastern North America. Predation and train collisions were the most important
source of mortality for this population. The number of annual elk-train collisions, as well as their
locations, were monitored and recorded over 14 years. Collision locations were highly site-
specific and were positively correlated to the proximity of bends in the railway. By relating the
number of annual elk-train collisions to various climate factors, I found that collision rates were
positively related to snow depth. By analyzing field camera data, I found that elk used the
railway mostly during the fall and spring, when elk commonly travel to and from wintering
grounds. However, by examining VHF telemetry locations, I determined that elk were closer to
the railway in winter than in any other season. Railways likely are perceived by elk as easy travel
corridors, especially in the winter, and deep snow might prevent escape from oncoming trains.
Black bear (Ursus americanus) and wolves (Canis lupus) were the major predators of elk in the
Burwash population. White-tailed deer (Odocoileus virginianus), elk (Cervus elaphus), and
moose (Alces alces), were the ungulate prey species available to both predators. To determine if
predators prefer one ungulate species over another, and to identify which predator species is
likely to have a greater impact on elk survival, I investigated predator diets. To compare rates of

v
ungulate use by predators in relation to prey availability, I calculated the relative abundance of
each ungulate species. I found that wolves used juvenile and adult elk as their primary ungulate
prey in greater proportions in comparison to their availability. Bears on the other hand, tended to
use all ungulate species in proportion to their availability.
Climate is well known to affect ungulate population dynamics; however, several factors (e.g.:
density, predator presence), can govern the response. Relating the annual growth rates of 7 elk
populations to various climate factors I found that responses were population specific. Increased
annual snow fall was associated with declines in population growth rates for 2 of the 7
populations assessed and only 1 population responded negatively to increased summer
temperatures. Climate likely interacts with other environmental variables to influence
fluctuations in annual population growth rates which warrants further investigation.
The results of this research will contribute to informed planning of future elk reintroductions and
should support development through improved management. In addition, this research highlights
the importance of using within- and among- populations approaches to investigating factors that
influence elk reintroduction success.

vi
Dedication
Nothing has inspired me to pursue my dreams more than my children, Shyla and Hunter Popp.
Their very existence is a constant reminder to me that anything is possible. My children, and my
husband, Michael Popp, have made me smile every single day, supported me relentlessly, and
fueled my desire to make my dreams come true. I dedicate this dissertation to the most amazing
people in my world, Shyla, Hunter, and Mike.

vii
Acknowledgements
Numerous people contributed to the development of this dissertation; however, my supervisors,
Dr. Frank F. Mallory and Dr. Joseph Hamr were critical to its successful completion. Their
guidance and unwavering support have been appreciated deeply throughout the years. Frank has
graciously accepted my ongoing desire to work in his lab throughout several degrees and has
unremittingly contributed to the development of my career. Joe has bestowed a wealth of elk
knowledge upon me and in addition to contributing greatly to my new passion in life (elk!), has
contributed significantly to the direction of my research. I will be forever grateful for their model
supervision surrounding my project and everything they have done above and beyond what is
expected. In addition, my committee members provided ongoing expertise through time spent in
scheduled committee meetings, but also by making themselves available on a regular basis outside
of meetings. Each of these members contributed significantly to the development of my thesis. I
am very grateful for the time and expertise given to me by Dr. Mark S. Boyce, Dr. Jeff L. Larkin,
and Dr. Michael Persinger.
Over the years, two fellow grad students were of particular importance to the development of this
dissertation. Tori Donovan and Dave McGeachy spent many days (and nights) listening to my
statistics and study design rants, and were great friends that provided relentless support. For Tori
and Dave, I am incredibly appreciative. In addition, fellow Ph.D. candidate, now Dr. Darryl
Edwards, was integral to my understanding of statistics and I can’t thank him enough.
Much of this research would not be possible without the data I gathered from regional managers
who participated in questionnaire surveys and provided population estimates, along with other

viii
information. These people included D. Crank, R. Rosatte, W. Wright, B. Mastenbrook, J.
Yarkovich, J. Banfield, L. Stowell, L. McInenly, B. Ranta, L. Hansen, and J. Trottier.
Volunteers and undergraduate thesis students contributed to this project in many ways. J.
Quittenton and M. Brown assisted with prey hair scale pattern slide preparations and Dr. D.
Boreham, A. Zarnke, L. Doyle, J. Bates, C. Thome, M. Hall, and W. Kowbasniuk provided field
assistance with fecal pellet surveys. C. Chan contributed through her undergraduate thesis to the
understanding of the influence of railways on elk spatial distribution.
Financial and logistical support was provided by Natural Sciences and Engineering Research
Council of Canada (NSERC), the Ontario Graduate Scholarship (OGS), Wikwemikong First
Nation Board of Education, Indspire, the Sudbury Elk Restoration Committee, Laurentian
University, Cambrian College of Applied Arts and Technology, and the Rocky Mountain Elk
Foundation.

ix
Table of Contents
Abstract...........................................................................................................................................iii
Dedication.......................................................................................................................................vi
Acknowledgments.........................................................................................................................vii
Table of Contents............................................................................................................................ix
Chapter 1: General Introduction.................................................................................................1
Literature Cited....................................................................................................................5
Chapter 2: A century of elk restoration in eastern North America…………………………..8
Abstract................................................................................................................................8
Introduction.........................................................................................................................9
Methods..............................................................................................................................11
Reintroductions: An Overview…………………………………………………………..12
Pre-Acclimation Mortality……………………………………………………………….18
Post-Acclimation Mortality……………………………………………………………...22
Literature Cited..................................................................................................................26
Chapter 3: Factors influencing population growth of reintroduced elk in eastern North
America…………………………………………………………………………………………33
Abstract.............................................................................................................................33

x
Introduction.......................................................................................................................35
Methods............................................................................................................................37
Results…………………………………………………………………………………..43
Discussion.........................................................................................................................48
Literature Cited.................................................................................................................52
Chapter 4: Railway ecology: underrepresented in science?..................................................60
Abstract…………………………………………………………………………………60
Introduction……………………………………………………………………………..61
Methods…………………………………………………………………………………65
Results…………………………………………………………………………………...67
Discussion………………………………………………………………………………..73
Literature Cited…………………………………………………………………………..78
Chapter 5: Railway mortality of reintroduced elk: an assessment of spatial, temporal, and
environmental influences………………………………………………………………………86
Abstract.............................................................................................................................86
Introduction......................................................................................................................88
Methods............................................................................................................................90
Results…………………………………………………………………………………..94
Discussion.......................................................................................................................101
Literature Cited...............................................................................................................105

xi
Chapter 6: Black bear (Ursus americanus) and wolf (Canis spp.) summer diet composition
and ungulate prey selectivity in Ontario, Canada……………………………….…………111
Abstract...........................................................................................................................111
Introduction.....................................................................................................................113
Methods...........................................................................................................................116
Results………………………………………………………………………………….121
Discussion.......................................................................................................................127
Literature Cited...............................................................................................................132
Chapter 7: Population-specific responses to climate by restored elk in eastern North
America……………………………………………………………………………….……….144
Abstract...........................................................................................................................144
Introduction.....................................................................................................................145
Methods...........................................................................................................................147
Results………………………………………………………………………………….153
Discussion........................................................................................................................156
Literature Cited................................................................................................................159
Chapter 8: Conclusion and Management Recommendations………………………...……164
Appendix (Additional articles published during PhD)………..…………………….………168

1
Chapter 1
General Introduction
The planet is currently experiencing a biodiversity crisis where species are being lost at a rate
about 1000 times faster than the background rate of extinction (Pimm et al. 2014). Conservation
initiatives are key to ensuring the prevention of extinctions and extirpations. Unfortunately,
management actions have not always succeeded in preventing extirpations and in those events,
reintroduction has become a popular conservation tool. Reintroductions are the intended
translocations of a given species to part of its historical range, where it has been extirpated
(International Union for Conservation of Nature/Species Survival Commission 2013). Although
an indispensable conservation tool for at least a century (Kleiman 1989; Popp et al. 2014),
reintroduction biology has only recently become a field of research, developed partly in response
to poor success rates (Armstrong and Seddon 2007; Seddon et al. 2007). Reintroductions can be
costly (Lindburg 1992) and often are a last resort in the recovery of a species. Understanding the
mechanisms influencing the outcome of reintroductions becomes pertinent in preventing the
waste of conservation funds and effort. Because of this, there has been increased interest in
identifying factors that influence reintroduction success by categorizing species into groups (e.g.:
herbivores, game species) (Griffith et al. 1989; Wolf et al. 1996; Wolf et al. 1998). Although this
approach has merit, it may result in a loss of information. For example, Griffith et al. (1989)
determined that overall 86% of native game reintroductions resulted in success, but Popp et al.
(2014) determined that elk (Cervus elaphus), a native game species, only had a 60% success rate.
Studies that focus on species-specific success rates may more explicitly reveal factors associated
with reintroduction success compared to those that use a multi-species approach.

2
Although many species have been reintroduced across the world, game species account for 90%
of translocations (Griffith et al. 1989; Wolf et al. 1996). In North America, elk were extirpated
from the eastern part of the continent and drastically reduced in the western regions after the
arrival of Europeans (Bryant and Maser 1982). Prior to the arrival of the Europeans, it was
estimated that 10 million elk were present in North America (Seton 1927). In eastern North
America, elk were extirpated by the end of the 1800s; a decline that was attributed mainly to
overharvest and habitat loss (O’Gara and Dundas 2002). By the late 1970s, approximately
500,000 elk remained, primarily in the western part of the continent – a 95% reduction in the
overall population size (Bryant and Maser 1982).
Large mammalian herbivores like elk play pivotal ecological roles (Ross 2001). They alter
landscapes and ecosystem dynamics in many ways, such as dispersing seeds (Lieberman et al.
1987), regulating landscape succession (Owen-Smith 1988), influencing plant species
regeneration (Ripple and Larsen 2000; Beschta 2005), and creating trails that serve as movement
corridors for other animals (Naiman and Rogers 1997). In addition to the provision of substantial
ecosystem services, elk are also economically important because they provide hunting and
wildlife viewing opportunities. By restoring species like elk to landscapes in which they once
thrived, I not only improve economic and recreational opportunities for humans, but also
contribute to restoring entire ecosystems to more holistic states (Gogan 1990).
3
Almost immediately after the extirpation of elk from the east, numerous reintroductions began
and have been ongoing since, with varying degrees of success (O’Gara and Dundas 2002; Popp
et al. 2014). The landscapes, predator compositions, and elk population dynamics differ
substantially between eastern and western North America (Keller et al. 2015). For example, there
are less public lands and generally greater road densities in the east (Riitters and Wickham 2003;
Radeloff et al. 2005). Elk movement patterns differ amongst eastern and western regions, where
large-scale migrations are exhibited (Ruhl 1984; Wichrowski et al. 2005). Although Keller et al.
(2015) found that survival rates of established adult and sub-adult elk were similar in the two
regions, annual juvenile survival was higher, but adult female fecundity was lower and more
variable in eastern populations. Predation (including harvest) was a major cause of mortality for
juvenile elk in both eastern and western regions of the continent; however, the rate of predation
was doubled in western populations. Vehicle collisions, nuisance culling, and meningeal worm
(Parelaphostrongylus tenuis), a potentially lethal parasite to elk, were major sources of mortality
in the east but rare in the west. Keller et al. (2015) suggested that documented vital rates,
mortality factors, and population growth rates of western elk may not be applicable to restored
eastern elk. For these reasons, elk research and management in the two regions of North America
have been conducted, for the most part, separately.
Many of the earlier elk restoration attempts in eastern North America could have failed due to
vehicle collision mortalities, inadequate habitat, poor release conditions, hunting or poaching,
disease and parasites, and poor management (Witmer 1990; O’Gara and Dundas 2002).
However, there was very little population monitoring of early restorations, and research in
general was sparse (Larkin et al. 2001), which may have hindered managers from designing

4
strategies to ensure restoration success. Recently translocated and established elk in several
eastern states and Ontario, Canada, are monitored extensively. Variation in success rates
(population growth rates) exist among populations and some of the more recently reintroduced
populations are in decline (Popp et al. 2014). This variation in success makes elk an excellent
study subject for examining how various factors influence reintroduction success using both
within- and among-population research approaches.
The objective of my dissertation was to use within- and among-population approaches to analyze
reintroduction success by assessing factors associated with changes in the survival and
population growth rates of 10 reintroduced elk populations across eastern North America. More
specifically, I aimed to: (1) perform a literature review detailing elk reintroduction in eastern
North America over the past century, (2) identify factors associated with the variation in
population growth rates (reintroduction success) of 10 reintroduced elk populations using an
among-population approach, (3) identify and assess how climate affects the population growth
rates of 7 reintroduced elk populations, and (4) investigate direct causes of mortality (predation
and train collisions) in a population experiencing low annual growth rates. The results of this
study will assist in the development of informed management strategies to help ensure success of
future reintroductions.
5
Literature Cited:
Armstrong, D.P. and Seddon, P.J. 2007. Directions in reintroduction biology. Trends in Ecology
and Evolution 23: 20-25.
Beschta, R.L. 2005. Reduced cottonwood recruitment following extirpation of wolves in
Yellowstone National Park. Ecological Applications 13: 1295-1309.
Bryant, L.D. and Maser, C. 1982. Classification and Distribution. In: Thomas, J.W. and Toweill,
D.E. (eds). Elk of North America. Pp: 1-59 in Stackpole Books.
Gogan, P.J. 1990. Considerations in the reintroduction of native mammalian species to restore
natural ecosystems. Journal of Natural Areas 10: 210-217.
Griffith, B., Scott, J.M., Carpenter, J.W., and Reed, C. 1989. Translocation as a species
conservation tool: status and strategy. Science 245: 477–480.
International Union for Conservation of Nature/Species Survival Commission. 2013. Guidelines
for Reintroductions and Other Conservation Translocations. Version 1.0. Gland,
Switzerland: IUCN Species Survival Commission, viiii + 57 pp.
Keller, B.J., Montgomery, R.A., Campa III, H.R., Beyer Jr, D.E., Winterstein, S.R., Hansen, L.
P., and Millspaugh, L.P. 2015. A review of vital rates and cause-specific mortality of elk
Cervus elaphus populations in eastern North America. Mammal Review 45: 146-159.
Kleiman, D.G. 1989. Reintroduction of captive mammals for conservation. Bioscience 39: 152-
161.
6
Larkin, J.L., Grimes, R.A., Cornicelli, L., Cox, J.J., and Maehr, D.S. 2001. Returning Elk to
Appalachia: Foiling Murphy’s Law. In: Maehr, D.S., Noss, R.F., and Larkin, J.L. (eds).
Large Mammal Restoration. Pp: 107–117. Island Press.
Lindburg, D.G. 1992. Are wildlife reintroductions worth the cost? Zoo Biology 11: 1-2.
Naiman, R.J. and Rogers, K.H. 1997. Large animals and system-level characteristics in river
corridors. BioScience 47: 521-529.
O’Gara, B.W. and Dundas, R.G. 2002. Distribution: Past and Present. In: Toweill, D.E. and
Thomas, J.W. (eds). Pp: 67-119. North American Elk, Ecology and Management.
Smithsonian Institution Press.
Owen-Smith, R. 1988. Megaherbivores: The Influence of Very Large Body Size on Ecology.
Cambridge: Cambridge University Press.
Pimm, S.L., Jenkins, C.N., Abell, R., Brooks, T.M., Gittleman, J.L., Joppa, L.N., Raven, P.H.,
Roberts, C.M., and Sexton, J.O. 2014. The biodiversity of species and their rates of
extinction, distribution, and protection. Science 344: 1246752.
Popp, J.N., Toman, T., Mallory, F.F., and Hamr, J. 2014. A century of elk restoration in eastern
North America. Restoration Ecology 22: 723-730.
Radeloff, V.C., Hammer, R.B., Stewart, S.I., Fried, J.S., Holcomb, S.S., and McKeefry, J.R.
2005. The wildland-urban interface in the United States. Ecological Applications 15: 799–
805.
Riitters, K.H. and Wickham, J.D. 2003. How far to the nearest road? Frontiers in Ecology and
the Environment 1: 125–129.
Ripple, W.J. and Larsen, E.J. 2000. Historic aspen recruitment, elk, and wolves in northern
Yellowstone National Park, USA. Biological Conservation 95: 361-370.

7
Ross, R.F. 2001. Introduction: Why Restore Large Mammals? In: Maehr, D.S., Noss, N.F., and
Larkin, J.L. (eds). Large Mammal Restoration: Ecological and Sociological Challenges in
the 21st Century. Pp: 1-21. Island Press.
Ruhl, J.D. 1984. Elk movements and habitat utilization in Northern Michigan. M.Sc. thesis,
Michigan State University, East Lansing, Michigan, USA.
Seddon, P.J., Armstrong, D.P., and Maloney, R.F. 2007. Developing the science of
reintroduction biology. Conservation Biology 21: 303-312.
Seton, E.T. 1927. Lives of Game Animals. Vol. 3, part 1. Doubleday, Page, and Co.
Wichrowski, M.W., Maehr, D.S., Larkin, J.L., Cox, J.J., and Olsson, M.P.O. 2005. Activity and
movements of reintroduced elk in Southeastern Kentucky. Southeastern Naturalist 4: 365–
374.
Witmer, G.W. 1990. Re-introduction of elk in the United States. Journal of the Pennsylvania
Academy of Science 64: 131–135.
Wolf, C.M., Griffith, B., Reed, C., and Temple, S.A. 1996. Avian and mammalian
translocations: update and reanalysis of 1987 survey data. Conservation Biology 10: 1142-
1154.
Wolf, C.M., Garland, T., and Griffith, B. 1998. Predictors of avian and mammalian translocation
success: reanalysis with phylogenetically independent contrasts. Biological Conservation
86: 243-255.
8
Chapter 2
A century of elk restoration in eastern North America*
Abstract
Over a century has passed since elk were extirpated in eastern North America. During that time,
numerous attempts to reintroduce elk into eastern North America have resulted in varying degrees
of success and failure. An overview of restoration efforts during the last 100 years is presented
here with emphasis on the differences in rates of population change among regions and differences
in major causes of elk mortality during both the pre- and post-acclimation periods. Approximately
40 % of recorded elk reintroduction attempts in eastern North America resulted in failure, with the
majority of these having occurred in the first half of the 20th century. Although rates of population
change in elk were highly variable, they were not related to founding population size. Major causes
of mortality varied among regions and should be considered in future reintroduction attempts.
*Article Published: Popp, J.N., Toman, T., Mallory, F.F. and Hamr, J. 2014. A century of elk
restoration in eastern North America. Restoration Ecology 22: 723-730.

9
Introduction
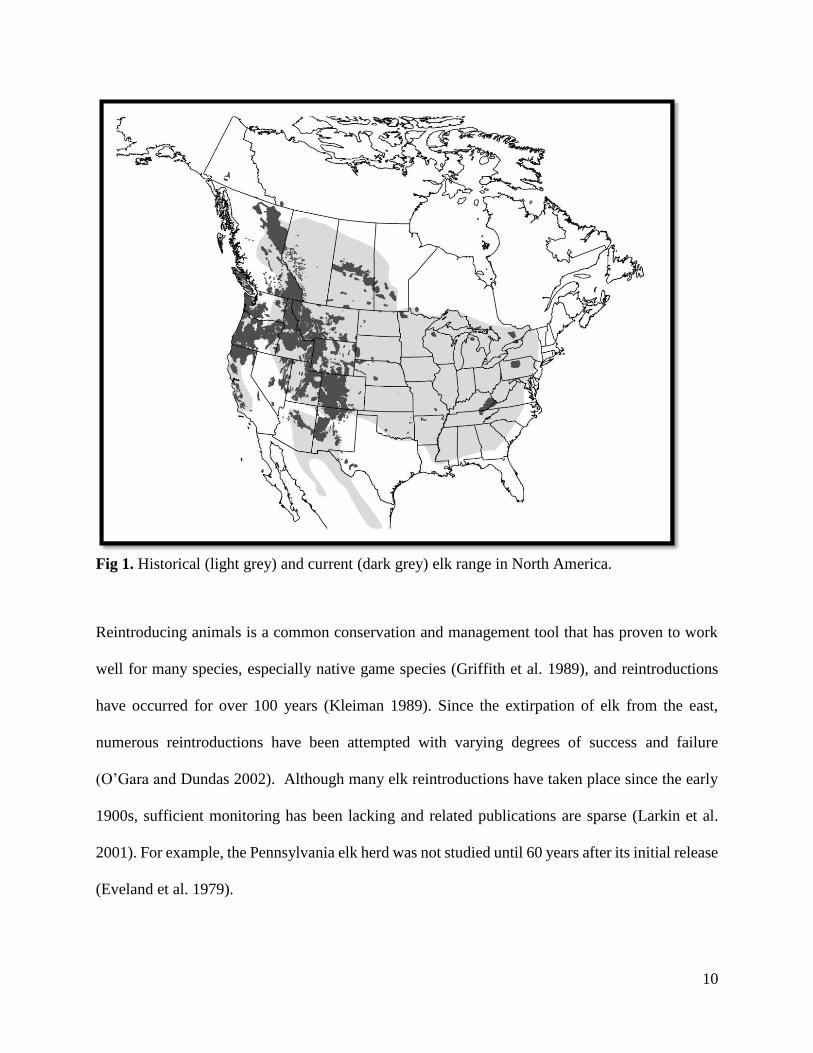
Prior to the arrival of the Europeans, it was estimated that 10 million elk were present in North
America (Seton 1927). Historically the combined ranges had six subspecies (Roosevelt Cervus
elaphus roosevelti); Tule C. e. nannodes; Rocky Mountain C. e. nelsoni; Merriam’s C. e. merriami;
Manitoban C. e. manitobensis; and Eastern C. e. canadensis) that occupied the majority of North
America (O'Gara and Dundas 2002) (Fig. 1). The eastern elk was extinct by 1867 and Merriam’s
elk became extinct by the early 1900s (O’Gara 2002). The reduction in elk populations and range
has been primarily attributed to overexploitation and habitat loss (O’Gara and Dundas 2002). By
the late 1970s, approximately 500,000 elk were primarily found in the western part of the continent
(Bryant and Maser 1982). Today, it is estimated that there are slightly more than 1 million elk
across North America in several scattered populations (Fig. 1).
10
Fig 1. Historical (light grey) and current (dark grey) elk range in North America.
Reintroducing animals is a common conservation and management tool that has proven to work
well for many species, especially native game species (Griffith et al. 1989), and reintroductions
have occurred for over 100 years (Kleiman 1989). Since the extirpation of elk from the east,
numerous reintroductions have been attempted with varying degrees of success and failure
(O’Gara and Dundas 2002). Although many elk reintroductions have taken place since the early
1900s, sufficient monitoring has been lacking and related publications are sparse (Larkin et al.
2001). For example, the Pennsylvania elk herd was not studied until 60 years after its initial release
(Eveland et al. 1979).
11
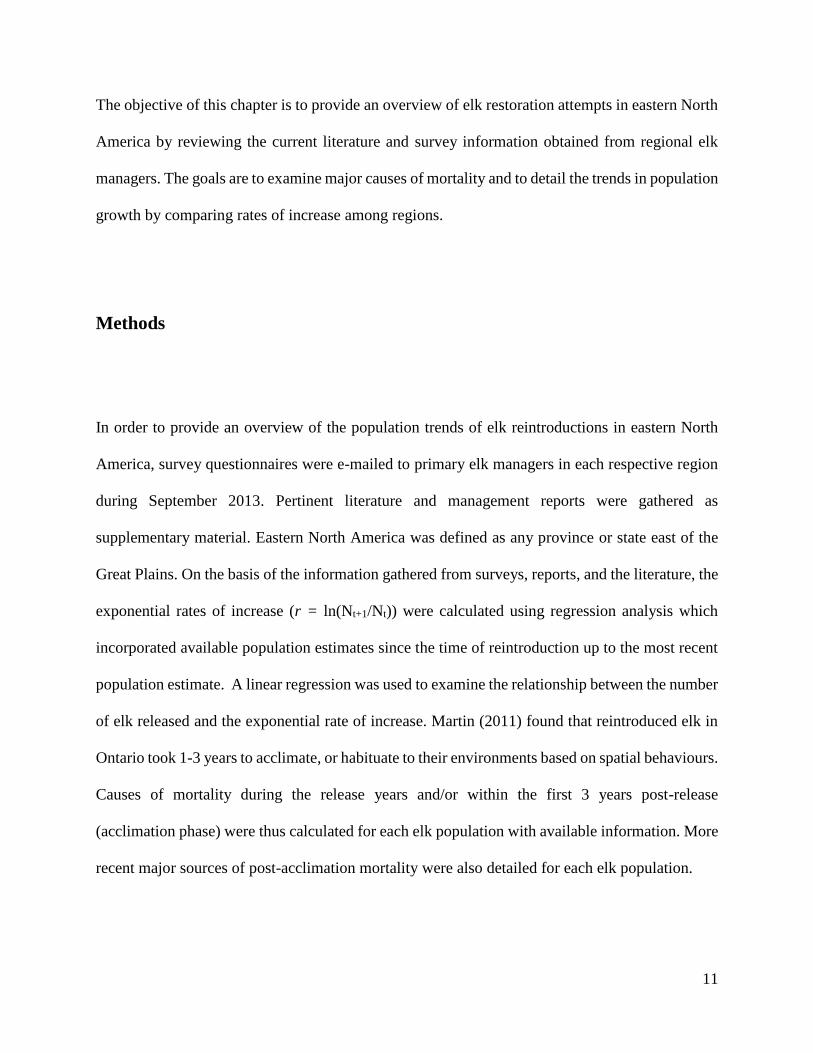
The objective of this chapter is to provide an overview of elk restoration attempts in eastern North
America by reviewing the current literature and survey information obtained from regional elk
managers. The goals are to examine major causes of mortality and to detail the trends in population
growth by comparing rates of increase among regions.
Methods
In order to provide an overview of the population trends of elk reintroductions in eastern North
America, survey questionnaires were e-mailed to primary elk managers in each respective region
during September 2013. Pertinent literature and management reports were gathered as
supplementary material. Eastern North America was defined as any province or state east of the
Great Plains. On the basis of the information gathered from surveys, reports, and the literature, the
exponential rates of increase (r = ln(Nt+1/Nt)) were calculated using regression analysis which
incorporated available population estimates since the time of reintroduction up to the most recent
population estimate. A linear regression was used to examine the relationship between the number
of elk released and the exponential rate of increase. Martin (2011) found that reintroduced elk in
Ontario took 1-3 years to acclimate, or habituate to their environments based on spatial behaviours.
Causes of mortality during the release years and/or within the first 3 years post-release
(acclimation phase) were thus calculated for each elk population with available information. More
recent major sources of post-acclimation mortality were also detailed for each elk population.
12
Reintroductions: An Overview
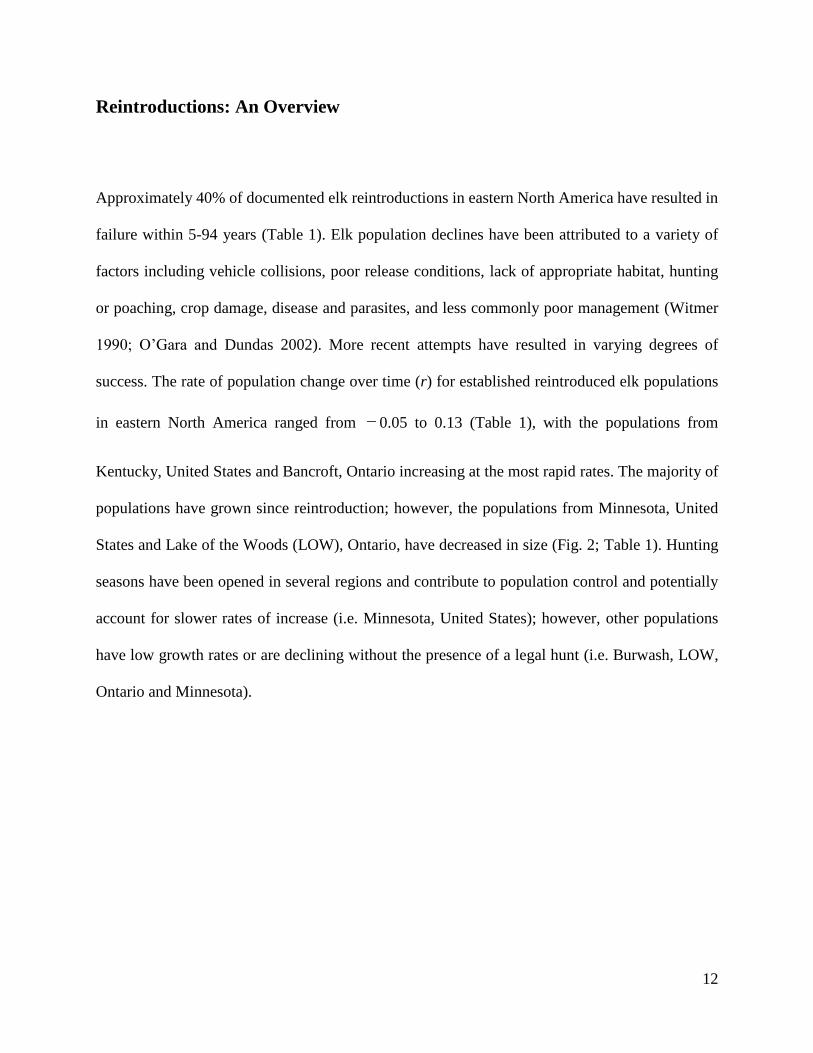
Approximately 40% of documented elk reintroductions in eastern North America have resulted in
failure within 5-94 years (Table 1). Elk population declines have been attributed to a variety of
factors including vehicle collisions, poor release conditions, lack of appropriate habitat, hunting
or poaching, crop damage, disease and parasites, and less commonly poor management (Witmer
1990; O’Gara and Dundas 2002). More recent attempts have resulted in varying degrees of
success. The rate of population change over time (r) for established reintroduced elk populations
in eastern North America ranged from −0.05 to 0.13 (Table 1), with the populations from
Kentucky, United States and Bancroft, Ontario increasing at the most rapid rates. The majority of
populations have grown since reintroduction; however, the populations from Minnesota, United
States and Lake of the Woods (LOW), Ontario, have decreased in size (Fig. 2; Table 1). Hunting
seasons have been opened in several regions and contribute to population control and potentially
account for slower rates of increase (i.e. Minnesota, United States); however, other populations
have low growth rates or are declining without the presence of a legal hunt (i.e. Burwash, LOW,
Ontario and Minnesota).
13
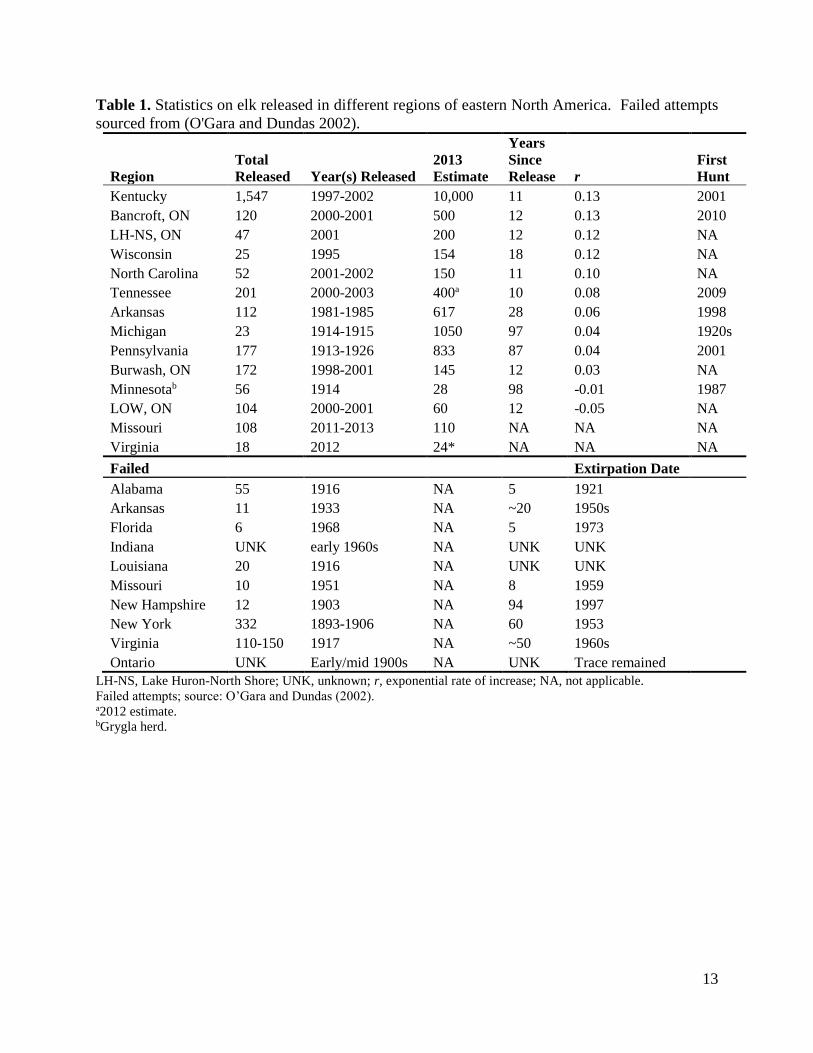
Table 1. Statistics on elk released in different regions of eastern North America. Failed attempts
sourced from (O'Gara and Dundas 2002).
Region
Total
Released Year(s) Released
2013
Estimate
Years
Since
Release r
First
Hunt
Kentucky 1,547 1997-2002 10,000 11 0.13 2001
Bancroft, ON 120 2000-2001 500 12 0.13 2010
LH-NS, ON 47 2001 200 12 0.12 NA
Wisconsin 25 1995 154 18 0.12 NA
North Carolina 52 2001-2002 150 11 0.10 NA
Tennessee 201 2000-2003 400a 10 0.08 2009
Arkansas 112 1981-1985 617 28 0.06 1998
Michigan 23 1914-1915 1050 97 0.04 1920s
Pennsylvania 177 1913-1926 833 87 0.04 2001
Burwash, ON 172 1998-2001 145 12 0.03 NA
Minnesotab 56 1914 28 98 -0.01 1987
LOW, ON 104 2000-2001 60 12 -0.05 NA
Missouri 108 2011-2013 110 NA NA NA
Virginia 18 2012 24* NA NA NA
Failed Extirpation Date
Alabama 55 1916 NA 5 1921 Arkansas 11 1933 NA ~20 1950s Florida 6 1968 NA 5 1973 Indiana UNK early 1960s NA UNK UNK Louisiana 20 1916 NA UNK UNK Missouri 10 1951 NA 8 1959 New Hampshire 12 1903 NA 94 1997 New York 332 1893-1906 NA 60 1953 Virginia 110-150 1917 NA ~50 1960s
Ontario UNK Early/mid 1900s NA UNK Trace remained LH-NS, Lake Huron-North Shore; UNK, unknown; r, exponential rate of increase; NA, not applicable.
Failed attempts; source: O’Gara and Dundas (2002). a2012 estimate. bGrygla herd.
14
Early:
Michigan1 Minnesota2
Pennsylvania3
0
2
4
6
8
10
1900 1920 1940 1960 1980 2000 2020
log e
N
t (years)
0
2
4
6
8
10
1900 1920 1940 1960 1980 2000 2020
log e
N
t (years)
0
2
4
6
8
10
1900 1920 1940 1960 1980 2000 2020
log e
N
t (years)
15
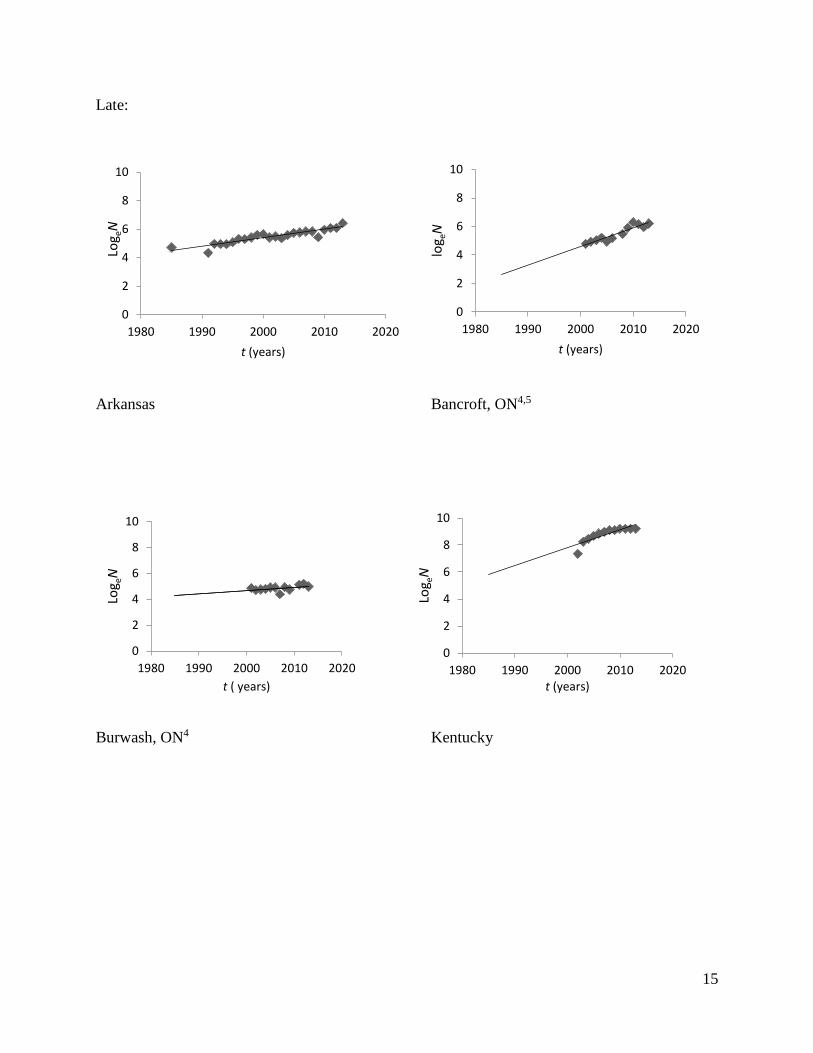
Late:
Arkansas Bancroft, ON4,5
Burwash, ON4 Kentucky
0
2
4
6
8
10
1980 1990 2000 2010 2020
Log e
N
t (years)
0
2
4
6
8
10
1980 1990 2000 2010 2020
log e
N
t (years)
0
2
4
6
8
10
1980 1990 2000 2010 2020
Log e
N
t ( years)
0
2
4
6
8
10
1980 1990 2000 2010 2020
Log e
N
t (years)
16
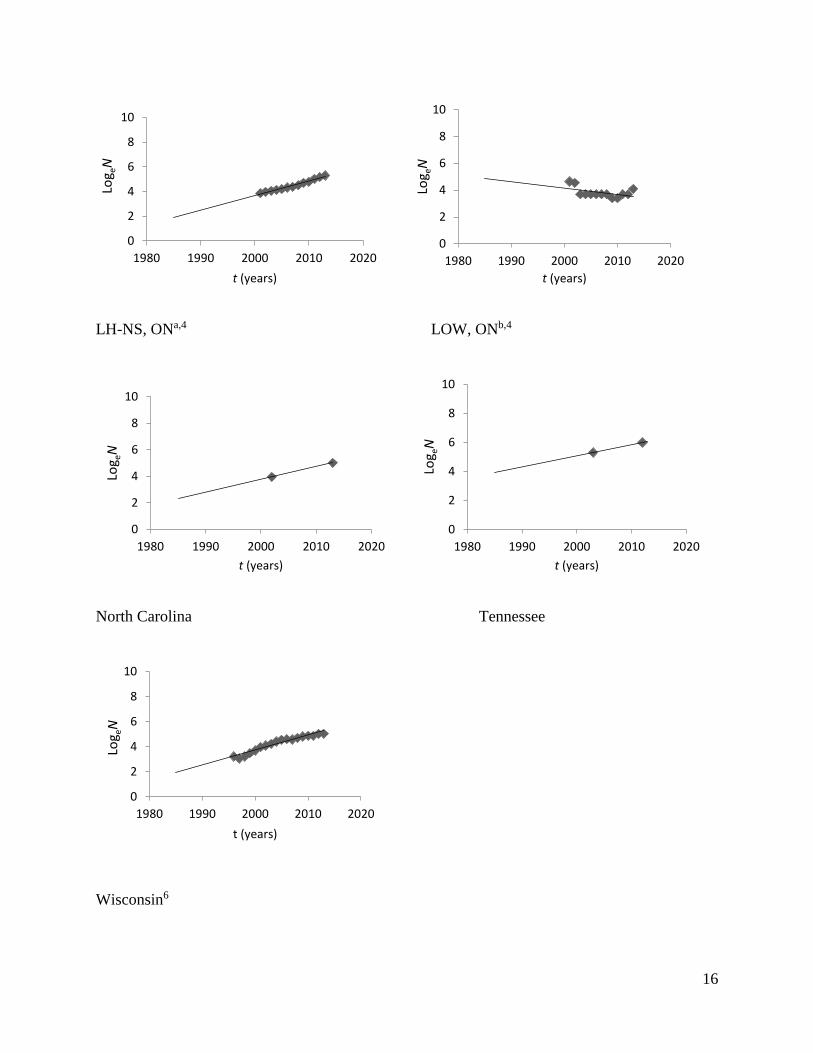
LH-NS, ONa,4 LOW, ONb,4
North Carolina Tennessee
Wisconsin6
0
2
4
6
8
10
1980 1990 2000 2010 2020
Log e
N
t (years)
0
2
4
6
8
10
1980 1990 2000 2010 2020
Log e
N
t (years)
0
2
4
6
8
10
1980 1990 2000 2010 2020
Log e
N
t (years)
0
2
4
6
8
10
1980 1990 2000 2010 2020
Log e
N
t (years)
0
2
4
6
8
10
1980 1990 2000 2010 2020
Log e
N
t (years)
17
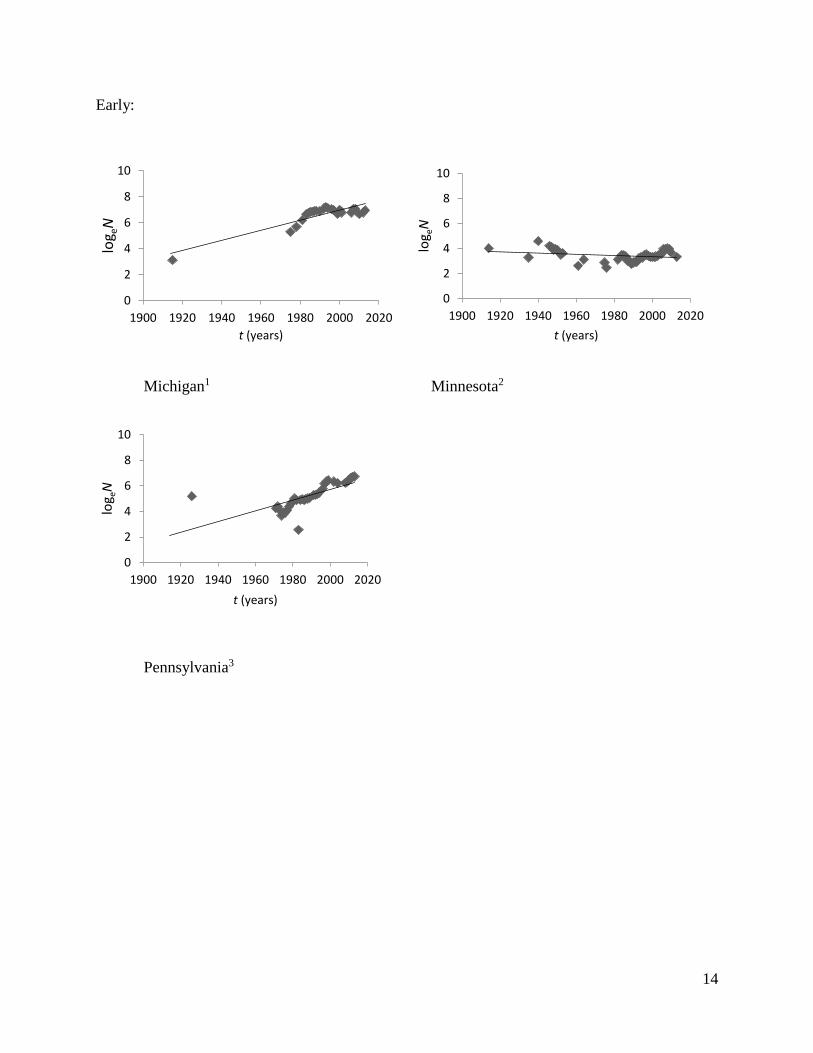
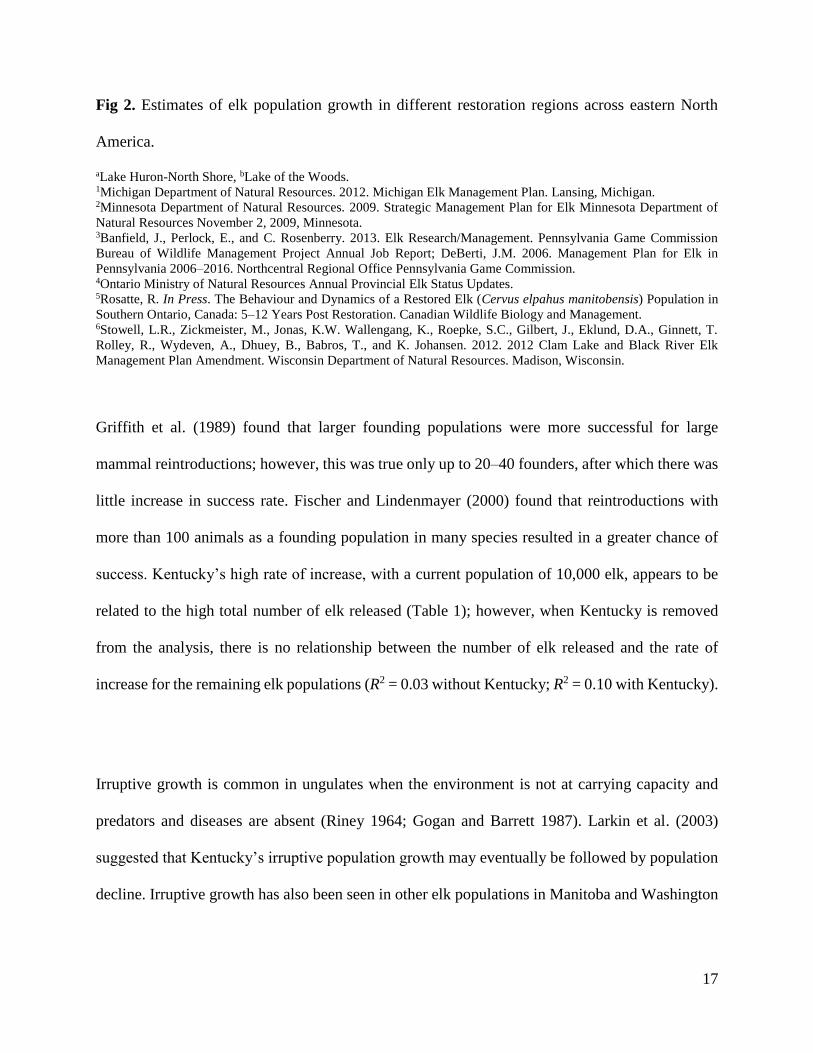
Fig 2. Estimates of elk population growth in different restoration regions across eastern North
America.
aLake Huron-North Shore, bLake of the Woods. 1Michigan Department of Natural Resources. 2012. Michigan Elk Management Plan. Lansing, Michigan. 2Minnesota Department of Natural Resources. 2009. Strategic Management Plan for Elk Minnesota Department of
Natural Resources November 2, 2009, Minnesota. 3Banfield, J., Perlock, E., and C. Rosenberry. 2013. Elk Research/Management. Pennsylvania Game Commission
Bureau of Wildlife Management Project Annual Job Report; DeBerti, J.M. 2006. Management Plan for Elk in
Pennsylvania 2006–2016. Northcentral Regional Office Pennsylvania Game Commission. 4Ontario Ministry of Natural Resources Annual Provincial Elk Status Updates. 5Rosatte, R. In Press. The Behaviour and Dynamics of a Restored Elk (Cervus elpahus manitobensis) Population in
Southern Ontario, Canada: 5–12 Years Post Restoration. Canadian Wildlife Biology and Management. 6Stowell, L.R., Zickmeister, M., Jonas, K.W. Wallengang, K., Roepke, S.C., Gilbert, J., Eklund, D.A., Ginnett, T.
Rolley, R., Wydeven, A., Dhuey, B., Babros, T., and K. Johansen. 2012. 2012 Clam Lake and Black River Elk
Management Plan Amendment. Wisconsin Department of Natural Resources. Madison, Wisconsin.
Griffith et al. (1989) found that larger founding populations were more successful for large
mammal reintroductions; however, this was true only up to 20–40 founders, after which there was
little increase in success rate. Fischer and Lindenmayer (2000) found that reintroductions with
more than 100 animals as a founding population in many species resulted in a greater chance of
success. Kentucky’s high rate of increase, with a current population of 10,000 elk, appears to be
related to the high total number of elk released (Table 1); however, when Kentucky is removed
from the analysis, there is no relationship between the number of elk released and the rate of
increase for the remaining elk populations (R2 = 0.03 without Kentucky; R2 = 0.10 with Kentucky).
Irruptive growth is common in ungulates when the environment is not at carrying capacity and
predators and diseases are absent (Riney 1964; Gogan and Barrett 1987). Larkin et al. (2003)
suggested that Kentucky’s irruptive population growth may eventually be followed by population
decline. Irruptive growth has also been seen in other elk populations in Manitoba and Washington

18
State (Banfield 1949; McCorquodale et al. 1988); however, the Washington elk population
subsequently declined and had reduced cow and calf survival (Eberhardt et al. 1996).
Small founder populations may affect more than population growth rates, as they often result in
reduced genetic variability due to the founder effect and genetic drift (Conard et al. 2010).
However, genetic variability in elk reintroduced across North America was not well explained by
founding population size (Conard et al. 2010). Allee (1938) and Armstrong and Seddon (2008)
suggested that genetic variability could decrease over time in small populations and initial
population growth rates could be negative, as individuals may be too dispersed to find mates (the
Allee effect). The distribution of potential mates may therefore be crucial to population growth. In
Ontario, 50% of released elk dispersed more than 40 km from their release sites (Yott et al. 2011)
and it has been suggested that reducing post-release dispersal of females would enhance calving
rates (Larkin et al. 2002). Post-release dispersal can be reduced by holding elk for longer periods
of time prior to release to acclimate them to release sites. This has been shown to result in greater
post-release site fidelity in Ontario elk (Ryckman et al. 2010).
Pre-Acclimation Mortality
Prior to release, stress-induced mortality of introduced elk can be substantial. Rosatte et al. (2007)
reported that 9% of the mortality in elk reintroduced into Ontario occurred in holding pens prior
to release and most of these were related to transport injury and stress. Hunting and poaching
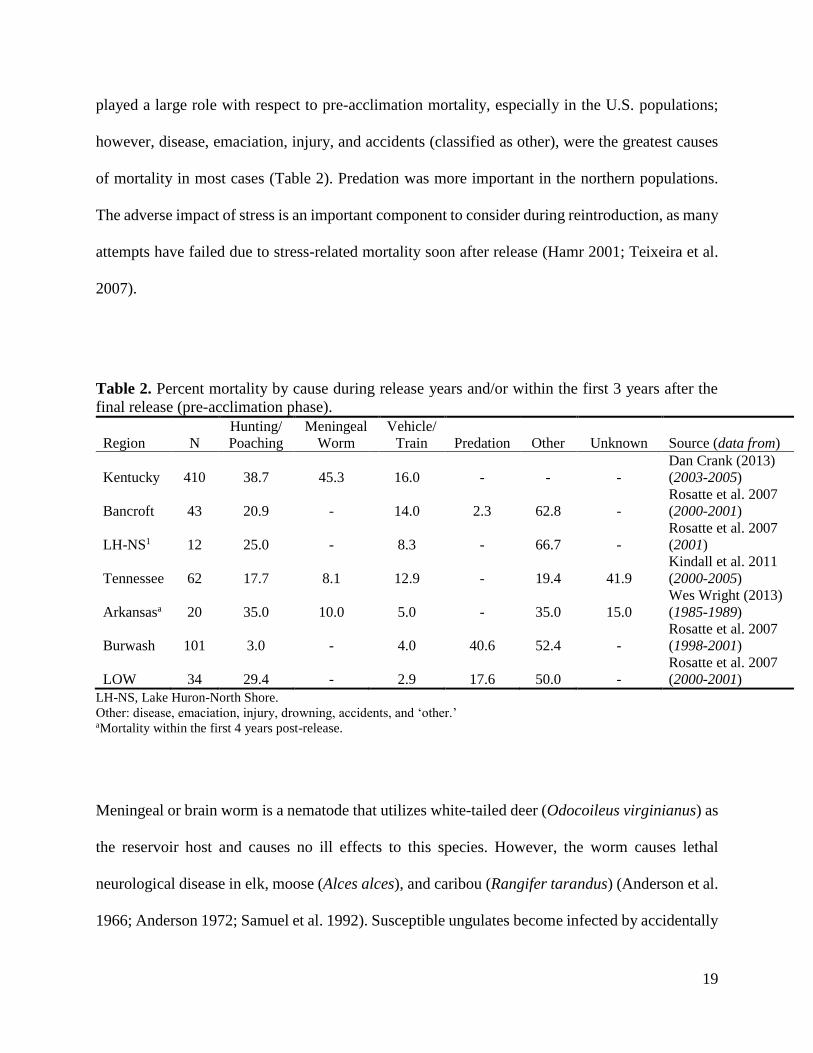
19
played a large role with respect to pre-acclimation mortality, especially in the U.S. populations;
however, disease, emaciation, injury, and accidents (classified as other), were the greatest causes
of mortality in most cases (Table 2). Predation was more important in the northern populations.
The adverse impact of stress is an important component to consider during reintroduction, as many
attempts have failed due to stress-related mortality soon after release (Hamr 2001; Teixeira et al.
2007).
Table 2. Percent mortality by cause during release years and/or within the first 3 years after the
final release (pre-acclimation phase).
Region N
Hunting/
Poaching
Meningeal
Worm
Vehicle/
Train Predation Other Unknown Source (data from)
Kentucky 410 38.7 45.3 16.0 - - -
Dan Crank (2013)
(2003-2005)
Bancroft 43 20.9 - 14.0 2.3 62.8 -
Rosatte et al. 2007
(2000-2001)
LH-NS1 12 25.0 - 8.3 - 66.7 -
Rosatte et al. 2007
(2001)
Tennessee 62 17.7 8.1 12.9 - 19.4 41.9
Kindall et al. 2011
(2000-2005)
Arkansasa 20 35.0 10.0 5.0 - 35.0 15.0
Wes Wright (2013)
(1985-1989)
Burwash 101 3.0 - 4.0 40.6 52.4 -
Rosatte et al. 2007
(1998-2001)
LOW 34 29.4 - 2.9 17.6 50.0 -
Rosatte et al. 2007
(2000-2001)
LH-NS, Lake Huron-North Shore.
Other: disease, emaciation, injury, drowning, accidents, and ‘other.’ aMortality within the first 4 years post-release.
Meningeal or brain worm is a nematode that utilizes white-tailed deer (Odocoileus virginianus) as
the reservoir host and causes no ill effects to this species. However, the worm causes lethal
neurological disease in elk, moose (Alces alces), and caribou (Rangifer tarandus) (Anderson et al.
1966; Anderson 1972; Samuel et al. 1992). Susceptible ungulates become infected by accidentally
20
ingesting gastropods with infective larvae (Anderson 1972). Mortality caused by meningeal worm
(Parelaphostrongylus tenuis) accounted for 45.3% of reported deaths in Kentucky, 8.1% in
Tennessee, and 10% in Arkansas during the pre-acclimation period (Table 2).
It has been suggested that past elk reintroduction efforts have failed because of meningeal worm
(Raskevitz et al. 1991; O’Gara and Dundas 2002), and it has been predicted that future elk
restorations would fail due to mortality caused by this nematode (Carpenter et al. 1973;
Severinghaus and Darrow 1976; Bergerud and Mercer 1989; Raskevitz et al. 1991).
As meningeal worms rely on gastropods as their intermediate host, their prevalence may depend
on habitats where gastropods are abundant, such as low-lying, damp forests (Anderson 1972).
Much of eastern North America has a high density of white-tailed deer and when combined with
wetter habitats, gastropods may thrive, thus increasing the prevalence of the nematode (Van
Deelen et al. 1997). However, Raskevitz et al. (1991) reported that elk were most often found in
habitats with the least number of gastropods. McIntosh et al. (2007) found that within the first few
years after reintroduction in south-central Ontario, 59% of deceased elk were infected with P.
tenius. Larkin et al. (2003) suggested that because of the high rate of meningeal worm related
deaths, the Kentucky elk population would likely decline; however, this has not happened thus far.
Bender et al. (2005) showed that elk populations can persist at high levels of productivity in the
presence of meningeal worms. This may be because elk are known to survive low levels of
meningeal worm infection (Larkin et al. 2003) and do not develop clinical signs in this condition
(Samuel et al. 1992; McIntosh et al. 2007). The rate of infection in elk populations may be related
to many factors associated with the elk range, such as the parasite prevalence in deer, the
21
abundance of deer, the deer-elk range overlap, the age of infected elk, acquired immunity, and the
ability to survive low level infections (McIntosh et al. 2007). Although meningeal worm has
accounted for mortality in some recent elk reintroductions, the negative impact appears lower than
initially suspected, indicating that further research of the meningeal worm–elk dynamics would be
beneficial.
Vehicle and train collisions accounted for 2.9–16% of post-release elk mortality in eastern North
America (Table 2). Although this rate accounts for less mortality than other factors, it deserves
attention. Vehicle and train collisions result in alarming numbers of animal deaths every year
(Jaren et al. 1991; Romin and Bissonette 1996; Bertwistle 2001; Andreassen et al. 2005). Between
1951 and 1999, 3,791 large animals were killed by vehicle and train collisions in Jasper National
Park, of which elk and bighorn sheep made up 53% (Bertwistle 2001). Under these conditions,
small populations have greater chances of getting even smaller in accordance with the extinction
vortex theory (Gilpin and Soulé 1986). Therefore, in small populations such as reintroduced elk
herds where the risk of extirpation is high, every death deserves attention. Developing vehicle and
train collision mitigation strategies is likely an important component of ensuring elk restoration
success.
Black bear, wolves, coyotes, and cougars are well known elk predators (Singer et al. 1997;
Anderson et al. 2005; Barber-Meyer et al. 2008). While wolves tend to focus mainly on adult
ungulates for prey (Arjo et al. 2002), black bear and coyotes primarily focus on calves (Carter
2006; Barber-Meyer et al. 2008; Murrow et al. 2009). Black bear predation was the leading cause
22
of elk calf mortality in Great Smoky Mountains National Park after reintroduction (Murrow et al.
2009). In an environment containing elk, moose, and white-tailed deer, wolves in Riding Mountain
National Park in Manitoba preferred elk over other prey, in proportion to their availability (Carbyn
1983). Predator species composition and abundance varied among release regions and predation
was found to be a limiting factor in the Burwash and LOW populations of Ontario, accounting for
40.6 and 17.6% of the initial mortality, respectively. These populations have low or negative
growth rates, suggesting that predation may be a strong factor influencing population growth. Frair
et al. (2007) found that although wolves had an important negative effect on western elk survival
during the first post-release winter, elk subsequently learned to mediate their mortality risk,
regardless of previous predator experience.
Post-Acclimation Mortality
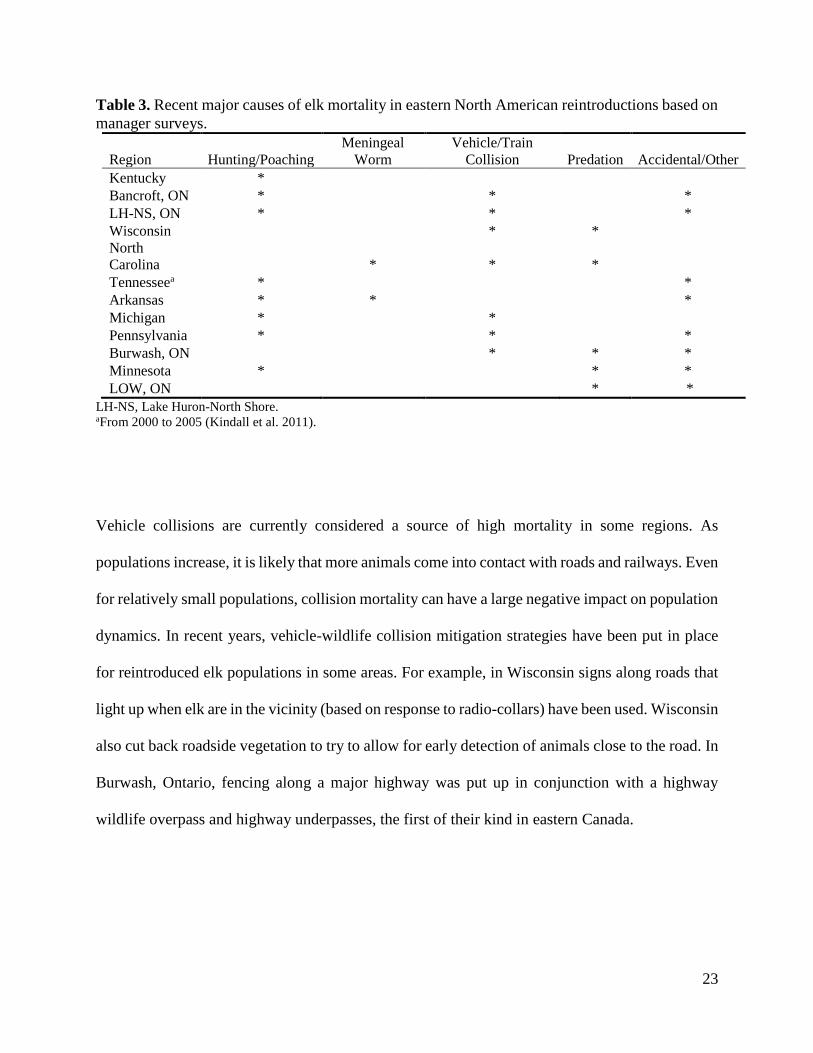
Major sources of post-acclimation mortality varied among populations (Table 3). Meningeal worm
did not account for high mortality, with the exception of the Arkansas and North Carolina
populations, which showed positive growth, regardless. From 1981 to 1994, 67–80 years post-
release, meningeal worm caused only a small proportion of elk deaths (3% of all mortality) in
Michigan (Bender et al. 2005).
23
Table 3. Recent major causes of elk mortality in eastern North American reintroductions based on
manager surveys.
Region Hunting/Poaching
Meningeal
Worm
Vehicle/Train
Collision Predation Accidental/Other
Kentucky * Bancroft, ON * * *
LH-NS, ON * * *
Wisconsin * * North
Carolina * * * Tennesseea * *
Arkansas * * *
Michigan * * Pennsylvania * * *
Burwash, ON * * *
Minnesota * * *
LOW, ON * *
LH-NS, Lake Huron-North Shore. aFrom 2000 to 2005 (Kindall et al. 2011).
Vehicle collisions are currently considered a source of high mortality in some regions. As
populations increase, it is likely that more animals come into contact with roads and railways. Even
for relatively small populations, collision mortality can have a large negative impact on population
dynamics. In recent years, vehicle-wildlife collision mitigation strategies have been put in place
for reintroduced elk populations in some areas. For example, in Wisconsin signs along roads that
light up when elk are in the vicinity (based on response to radio-collars) have been used. Wisconsin
also cut back roadside vegetation to try to allow for early detection of animals close to the road. In
Burwash, Ontario, fencing along a major highway was put up in conjunction with a highway
wildlife overpass and highway underpasses, the first of their kind in eastern Canada.
24
Predation appears to be associated mainly with reintroduced elk populations that have lower rates
of increase (Table 2). However, some populations seem to maintain positive rates of increase in
spite of predator presence. For example, it has been suggested that in Pennsylvania, elk calves
have 80% chance of surviving to 1 year, possibly due to high quality habitat that ensures elk are
in top physical condition (DeVivo et al. 2011). McClafferty and Parkurst (2001) state that elk
restoration must be based on specific information about the species’ historic range, habitat
requirements, interspecific relations, socioeconomics, public relations and management, in order
to be successful. Conard et al. (2010) suggests that maximizing post-restoration population size,
reducing annual variability, and maintaining positive growth rates should assist in promoting the
retention of genetic variability. Calf recruitment, an important driver of large herbivore population
dynamics (Pimlott 1967; Raithel et al. 2007), is likely influenced by many variables including
habitat quality, elk density, predation, and adult male age structure (Gratson and Zager 1998).
Larkin et al. (2004) suggested that reintroduction efforts should be focussed on habitats with high
levels of open forest edge and limited human disturbance. Areas dominated by a single cover type
should be avoided, as they will likely result in lower reintroduction success. Differences among
major habitat types in each release location are apparent. For example, Wisconsin’s elk range is
comprised mainly of unbroken forest (Anderson et al. 2005), while Burwash, Ontario (Popp et al.
2013) and Michigan (Bender et al. 2002) elk ranges consist primarily of forest interspersed with
agricultural land and openings.
Elk reintroductions are often poorly documented (Fischer and Lindenmayer 2000), and many
programs are plagued with low success and researchers have failed to deliver a scientific
framework to managers, which would assist in improving reintroduction success (Deredec and

25
Courchamp 2007). A thorough investigation of factors influencing elk population dynamics in
different parts of the continent is needed in order to obtain a clearer understanding of their
cumulative effects and to identify those most strongly associated with the success and/or failure of
reintroductions (Popp in preparation).
Elk reintroductions have had varying degrees of success in eastern North America; however, more
positive results have been displayed during recent years. As can be seen from the varying rates of
population growth among recent reintroduction populations, research is still needed to improve on
success. In order to address the current lack of knowledge and obtain a better understanding of elk
reintroduction dynamics, managers should collaborate and exchange information, post-release
monitoring should be intensified, failures should be reported and analyzed, and associated research
should continue. Better knowledge should further contribute to the success of elk restoration across
the species’ former range in eastern North America.
26
Literature Cited
Allee, W.C. 1938. The Social Life of Animals. Norton, New York, New York, USA.
Andreassen, H.P., Gundersen, H., and Storaas, T. 2005. The effect of scent-marking, forest
clearing, and supplemental feeding on moose-train collisions. Journal of Wildlife
Management 69: 1125-1132.
Anderson, R.C., Lankester, M.W., and Strelive, U.R. 1966. Further experimental studies of
Pneumostrongylus tenius in cervids. Canadian Journal of Zoology 44: 851-861.
Anderson, R.C. 1972. The ecological relationship of menigneal worm and native cervids in
North America. Journal of Wildlife Diseases 8: 304-310.
Arjo, W. M., Pletscher, D. H., and Ream, R.R. 2002. Dietary overlap between wolves and
coyotes in northwestern Montana. Journal of Mammalogy 83: 754-766.
Armstrong, D.P. and Seddon, P.J. 2008. Directions in reintroduction biology. Trends in Ecology
and Evolution 23: 20-25.
Banfield, A.W.F. 1949. An eruption of elk in Riding Mountain National Park, Manitoba. Journal
of Wildlife Management 13: 127-134.
Barber-Meyer, S.M., Mech, L.D., and White, P.J. 2008. Elk calf survival and mortality following
wolf restoration to Yellowstone National Park. Wildlife Monographs 169: 1-30.
Bender, L. C., Carlson, E., Schmitt, S. M., and Haufler, J.B. 2002. Production and survival of elk
(Cervus elaphus) calves in Michigan. The American Midland Naturalist 148: 163-171.
Bender, L.C., Scmitt, S.M., Carlson, E., Haufler, J.B., and Beyer Jr., D.E. 2005. Mortality of
Rocky Mountain elk in Michigan due to meningeal worm. Journal of Wildlife Diseases 4:
134-140.
27
Bergerud, A.T. and Mercer, W.E. 1989. Caribou introductions in eastern North America.
Wildlife Society Bulletin 17: 111–120.
Bertwistle, J. 2001. Description and Analysis of Vehicle and Train Collisions with Wildlife in
Jasper National Park, Alberta Canada, 1951-1999. In: Irwin, C.L., Garrett, P., and Dermott,
K.P. (eds). Proceedings of the 2001 International Conference on Ecology and
Transportation, Center for Transportation and the Environment. Pp: 433-434. North
Carolina State University.
Bryant, L.D. and Maser, C. 1982. Classification and Distribution. In: Thomas, J.W. and Toweill,
D.E. (eds). Elk of North America. Pp: 1-59. Stackpole Books.
Carter, R.A. 2006. DNA profiles and foraging strategies of large canids in central Ontario. M.Sc.
thesis, Department of Biology, Laurentian University, Sudbury, Ontario.
Carbyn, L.N. 1983. Wolf predation on elk in Riding Mountain National Park, Manitoba. The
Journal of Wildlife Management 47: 963-976.
Carpenter, J.W., Jordan, H.E., and Ward, B.C. 1973. Neurologic disease in wapiti naturally
infected with meningeal worms. Journal of Wildlife Diseases 9: 148–153.
Conard, J.M., Statham, M.J., Gipson, P.S., and Wisely, S.M. 2010. The influence of
translocation strategy and management practices on the genetic variability of a
reestablished elk (Cervus elaphus) population. Restoration Ecology 18: 85-93.
Deredec, A. and Courchamp, F. 2007. Importance of the Allee effect for
reintroductions. Ecoscience 14: 40-451.
DeVivo, M. T., Cottrell, W. O., DeBerti, J. M., Duchamp, J. E., Heffernan, L. M., Kougher, J.
D., and Larkin, L.L. 2011. Survival and cause-specific mortality of elk Cervus canadensis
calves in a predator rich environment. Wildlife Biology 17: 156-165.
28
Eberhardt, J.E., Eberhardt, L.L., Tiller, B.L., and Cadwell, L.L. 1996. Growth of an isolated elk
population. Journal of Wildlife Management 60: 369-373.
Eveldan, J.F., George, J.L., Hunter, N.B., Forney, D.M., and Harrison, R.L. 1979. A Preliminary
Evaluation of the Ecology of the Elk in Pennsylvania. In: Boyce, M.S. and Hayden-Wing,
L.D. (eds). North American Elk: Ecology, Behaviour, and Management. Pp: 145-151.
Laramie: University of Wyoming Press.
Fischer, J. and Lindenmayer, D.B. 2000. An assessment of the published results of animal
relocations. Biological Conservation 96: 1-11.
Frair, J. L., Merrill, E. H., Allen, J. R., and Boyce, M.S. 2007. Know thy enemy: experience
affects elk translocation success in risky landscapes. Journal of Wildlife Management 71:
541-554.
Gilpin, M.E. and Soulé, M.E. 1986. Minimum Viable Populations: Processes of Species
Extinction. In: Conservation Biology: the Science of Scarcity and Diversity. Pp: 19-34.
Sinauer Associates.
Gogan, P.J.P. and Barret, R.H. 1987. Comparative dynamic of introduced Tule elk populations.
Journal of Wildlife Management 51: 20-27.
Gratson, M. W. and Zager, P. 1998. (Lochsa) Elk Ecology. Study IV. Factors influencing elk calf
recruitment. Federal Aid in Wildlife Restoration, Job Progress Report, Job 1 W-160-R-24.
Idaho Department of Fish and Game, Boise, USA.
Griffith, B., Scott, J. M., Carpenter, J. W., and Reed, C. 1989. Translocation as a species
conservation tool: status and strategy. Science 245: 477-480.
Hamr, J. 2001. Trauma and Mortality Associated with Transcontinental Wild Elk Relocations.
In: Renecker, L.A. and Renecker, T.A. (eds.). Game Conservation and Sustainability:

29
Biodiversity, Management, Ecotourism, Traditional Medicine & Health. Pp: 60-67.
Renecker & Assoc. Inc.
Jaren, V., Andersen, R., Ulleberg, M., Pedersen, P.H., and Wiseth, B. 1991. Moose-train
collisions: the effects of vegetation removal with a cost-benefit analysis. Alces 27: 93-99.
Kindall, J.L., Muller, L.I., Clark, J.D., Lupardus, J.L., and Murrow, J.L. 2011. Population
viability analysis to identify management priorities for reintroduced elk in the Cumberland
Mountains, Tennessee. Journal of Wildlife Management 75: 1745-1752.
Kleiman, D.G. 1989 Reintroduction of captive mammals for conservation. Bioscience 39: 152–
161.
Larkin, J.L., Grimes, R.A., Cornicelli, L., Cox, J.J., and Maehr, D.S. 2001. Returning Elk to
Appalachia: Foiling Murphy's Law. In: Maehr, D.S., Noss, R.F. and Larkin, J.L. (eds).
Large Mammal Restoration. Pp: 107-117. Island Press.
Larkin, J.L., Maehr, D.S., Cox, J.J., Wichrowski, M.W., and Crank, R.D. 2002. Factors affecting
reproduction and population growth in a restored elk Cervus elaphus nelsoni population.
Wildlife Biology 8: 49-54.
Larkin, J.L., Maehr, D.S., Cox, J.J., Bolin, D.C., and Wichrowski, M.W. 2003. Demographic
characteristics of a reintroduced elk population in Kentucky. Journal of Wildlife
Management 63: 467-476.
Larkin, J.L., Cox, J.J., Wichrowski, M.W., Dzialak, M.R., and Maehr, D.S. 2004. Influences on
release‐site fidelity of translocated elk. Restoration Ecology 12: 97-105.
Martin, M.M. 2011. Spatial behaviour and habitat use by elk (Cervus elaphus) in response to
highway construction and interprovincial relocation. M.Sc. thesis. Department of Biology,
Laurentian University, Sudbury, Ontario.
30
McCorquodale, S.M., Eberhardt, L.L., and Eberhardt, L.E. 1988. Dynamics of a colonizing elk
population. Journal of Wildlife Management 52: 309-313.
McClafferty, J.A. and Parkurst, J.A. 2001. Using Public Surveys and GIS to Determine the
Feasibility of Restoring Elk to Virginia. Maehr, D.S., Noss, R.F., and Larkin, J.L. (eds).
Large Mammal Restoration. Pp: 83-98. Island Press.
McIntosh, T., Rosatte, R., Campbell, D., Welch, K., Fournier, D., Spinato, M., and. Ogunremi,
O.O. 2007. Evidence of Parelaphostrongylus tenuis infections in free-ranging elk (Cervus
elaphus) in southern Ontario. The Canadian Veterinary Journal 48: 1146-1154.
Morris, P.A. 1986. An introduction to reintroductions. Mammal Review 16: 49-52.
Murrow, J. L., Clark, J. D., and Delozier, E. 2009. Demographics of an experimentally released
population of elk in Great Smoky Mountains National Park. Journal of Wildlife
Management 73: 1261-1268.
O’Gara, B.W. and Dundas, R.G. 2002. Distribution: Past and Present. In: Toweill, D.E. and
Thomas, J.W. (eds). North American Elk, Ecology and Management. Pp: 67-119.
Smithsonian Institution Press.
Pimlott, D.H. 1967. Wolf predation and ungulate populations. American Zoologist 7: 267-278.
Popp, J.N., McGeachy, D.N.C., and Hamr, J. 2013. Elk (Cervus elaphus) seasonal habitat
selection in a heterogeneous forest structure. International Journal of Forestry Research
2013: 1-7.
Polziehn, R.O., Hamr, J., Mallory. F.F., and Strobeck, C. 1998. Phylogenetic status of North
American wapiti (Cervus elaphus) subspecies. Canadian Journal of Zoology 76: 998-1010.
Polziehn, R.O., Hamr, J., Mallory, F.F., and Strobeck, C. 2000. Microsatellite analysis of North
American wapiti (Cervus elaphus) populations. Molecular Ecology 10: 1561-1577.
31
Popp, J.N., Mallory, F.F., and Hamr, J. in progress. Factors influencing reintroduced elk
population dynamics in eastern North America.
Raithel, J.D., Kauffman, M.K., and Pletscher, D.H. 2007. Impact of spatial and temporal
variation in calf survival on the growth of elk populations. Journal of Wildlife
Management 71: 795-803.
Raskevitz, R.F., Kocan, A.A., and Shaw, J.H. 1991. Gastropod availability and habitat utilization
of wapiti and white-tailed deer sympatric on range enzootic for meningeal worm. Journal
of Wildlife Diseases 27: 92-101.
Riney, T. 1964. The impact of introductions of large herbivores on the tropical environment.
International Union for the Conservation of Nature and Natural Resources Publication 4:
261-273.
Romin, L.A. and Bissonette, J.A. 1996. Deer: vehicle collisions: status of state monitoring
activities and mitigation efforts. Wildlife Society Bulletin 24: 276-283.
Rosatte, R., Hamr, J., Young, J., Filion, I., and Smith, H. 2007. The restoration of elk (Cervus
elaphus) in Ontario, Canada: 1998–2005. Restoration Ecology 15: 34-43.
Ryckman, M. J., Rosatte, R. C., McIntosh, T., Hamr, J., and Jenkins, D. 2010. Postrelease
dispersal of reintroduced elk (Cervus elaphus) in Ontario, Canada. Restoration Ecology 18:
173-180.
Samuel, W.M., Pybus, M.J., Welch, D.A., and White, C.J. 1992. Elk as a potential host for
meningeal worm: implications for translocation. Journal of Wildlife Management 56: 629-
639.
Seton, E.T. 1927. Lives of Game Animals. Vol. 3, part 1. Doubleday, Page, and Co.
Severinghaus, C.W. and Darrow, R.W. 1976. Failure of elk to survive in the Adirondacks. New
32
York Fish and Game Journal 23: 98–99.
Singer, F.K., Harting, A.T., and Semonds, K. 1997. Density-dependence, compensation, and
environmental effects on elk calf mortality in Yellowstone National Park. Journal of
Wildlife Management 61: 12-25.
Teixeira, C.P., De Azevedo, C.S., Mendl, M., Cipreste, C.F., and Young, R.J. 2007. Revisiting
translocation and reintroduction programmes: the importance of considering stress. Animal
Behaviour 73: 1-13.
Van Deelen, T. R., McKinney, L. B., Joselyn, M. G., and Buhnerkempe, J.E. 1997. Can we
restore elk to southern Illinois? The use of existing digital land-cover data to evaluate
potential habitat. Wildlife Society Bulletin 25: 886-894.
Witmer, G. 1990. Re-introduction of elk in the United States. Journal of Pennsylvania Academy
of Science 63: 131-135.
Yott, A., Rosatte, R., Schaefer, J.A., Hamr, J., and Fryxell, J. 2011. Movement and spread of a
founding population of reintroduced elk (Cervus elaphus) in Ontario, Canada. Restoration
Ecology 19: 70-77.
33
Chapter 3
Factors influencing population growth of reintroduced elk in eastern North
America
Abstract
Attempts to reintroduce wildlife populations have often resulted in failure. Identification of
factors that influence reintroduction success is fundamental to guiding future attempts. Studies of
reintroduced species often have been limited to the examination of single populations; however,
important additional knowledge can be acquired through across-population investigations. I
aimed to demonstrate the importance of among-population analyses by examining factors that
influence growth rates of reintroduced elk populations in eastern North America. I hypothesized
that land use composition, initial population size, snow depth, disease, the presence of predators,
and the presence of competitors would influence elk population growth rates among ten
reintroduced populations. I used a model-selection approach, incorporating several covariates to
determine which factors best explained variation in rates of increase among populations. The
most prominent factor explaining variation in reintroduced elk population growth rates was an
inverse relation to the percentage of coniferous forest within elk range. Landscapes dominated by
coniferous forests in eastern North America likely represent sub-optimal elk habitat as
reintroduced elk population growth rates decline when ranges are associated with greater
proportions of coniferous forest in the landscape. Future elk reintroductions in eastern North
America should avoid targeting areas dominated by coniferous forest. My study emphasizes the

34
value of using across-population approaches when assessing factors affecting the demographics
of reintroduced wildlife populations.
35
Introduction
Reintroductions are intended translocations of a species to part of their historical range where
they have been extirpated (International Union for Conservation of Nature/Species Survival
Commission 2013). Although a management tool for at least a century (Kleiman 1989; Popp et
al. 2014), reintroduction biology only recently has become a field of research, developed
partially in response to poor success rates (Armstrong and Seddon 2007; Seddon et al. 2007).
Fischer and Lindemayer (2000) reviewed 116 published reintroduction studies and found that of
those with known outcomes only 49% were successful. Pérez et al. (2012) assessed published
and unpublished translocation projects and found that most addressed less than 50% of basic
translocation criteria and were inadequately designed to guarantee success.
Reintroductions can be costly (Lindburg 1992; Converse et al. 2013), and often are a last resort
in the recovery of a species. Understanding the mechanisms that influence the outcome of
previous reintroductions can provide valuable insight to future efforts which may prevent waste
of conservation funding and effort. Because of this, there has been increased interest in
determining factors that influence reintroduction success, with studies often categorizing species
into groups; for example, by different food habits (i.e.: carnivore, herbivore, omnivore), or other
category types (Griffith et al. 1989; Wolf et al. 1996; 1998). Although this approach has merit, it
may fail to identify the causal factors of success or failure, because different species and taxa are
pooled in such analyses and species- or taxon- specific responses may be overlooked. For
example, Griffith et al. (1989) determined that overall 86% of native game reintroductions
resulted in success, but Popp et al. (2014) determined that elk (Cervus elaphus), a native

36
ungulate in eastern North America, only had a 60% reintroduction success rate. Along with the
need for estimates of reintroduction success, managers need to identify specific environmental
factors related to success to assist in decision making and management approaches. Studies that
address species-specific questions may better reveal factors that influence reintroduced
populations compared to those that use a multi-species approach.
Multiple reintroductions of elk in eastern North America provide an opportunity to examine
aspects associated with reintroduction success and failure across multiple populations. The
range of elk has decreased by 74 % over its historic distribution (Laliberte and Ripple 2004)
mainly due to overexploitation and habitat loss (O’Gara and Dundas 2002), especially in eastern
North America (Popp et al. 2014). Many factors are known to influence reintroduction success
including founding population size (Griffith et al. 1989), site fidelity (Larkin et al. 2002), stress
(Hamr 2001; Teixeira et al. 2007), poor-quality habitats, excessive or illegal harvest, as well as
parasites and disease (Witmer 1990; Thorne et al. 2002). Meningeal or brain worm
(Parelaphostrongylus tenuis), a nematode carried by white-tailed deer (Odocoileus virginianus),
causes lethal neurological disease in other ungulates including elk (Anderson et al. 1966;
Anderson 1972). Many early historical elk reintroduction efforts appear to have resulted in
failure because of this parasite (Raskevitz et al. 1991; O’Gara and Dundas 2002). The most
common reason described for early elk reintroduction failure in the eastern United States was a
lack of appropriate habitats resulting from either low habitat quality, quantity or both (Witmer
1990). Regardless of what factors contributed to past reintroduction failures, studies of existing
elk populations can provide important insight into future reintroduction efforts.
37
In this study, I provide an example of the importance of multi-population analyses associated
with reintroduction biology. Elk have been reintroduced throughout eastern North America for
over a century (Popp et al. 2014), and with several reintroductions and associated demographic
data, this species provides an opportunity to identify factors influencing population growth, and
ultimately, reintroduction success. The purpose of this study was to identify factors that most
influence elk population growth rates while demonstrating the importance of among-population
analyses when assessing the potential of success for future elk reintroductions by examining
factors that influence growth rates of extant populations. i used annual population estimates from
10 reintroduced populations of elk in eastern North America to calculate expomemtial rates of
increase. Based on factors known to influence elk population dynamics, I incorporated several
covariates and used a model-selection approach to determine which factors best explained
variation in rates of population increase among populations.
Methods
In 2013, I mailed a survey questionnaire to elk managers across eastern North America
requesting annual population estimates and the extent of population ranges. I also gathered
management reports and pertinent literature that could aid in evaluating population
characteristics. For this study, I defined eastern North America as any state or province east of
the Great Plains. Although there are currently 14 elk populations that have been established
through reintroduction in eastern North America (Popp et al. 2014), sufficient data were only
obtained for 10 (approx. 70% of all populations). Each of these populations were the result of

38
reintroductions that occurred at varying times throughout the past century (Popp et al. 2014;
Table 1). These populations included Arkansas (AR), Kentucky (KY), Michigan (MI),
Minnesota (MN), Pennsylvania (PA), Wisconsin (WI), and 4 populations in Ontario: Bancroft
(BAN), Burwash (BUR), Lake Huron-North Shore (LHNS), and Lake of the Woods (LOW)
(Fig. 1). The majority of the assessed populations occupied the Type I Northern Forest ecoregion
(BAN, BUR, LHNS, LOW, MI, MN, PA, WI), but two populations (AR, KY) occupied the Type
I Eastern Temperate Forest ecoregion (Commission for Environmental Cooperation 2006).
39
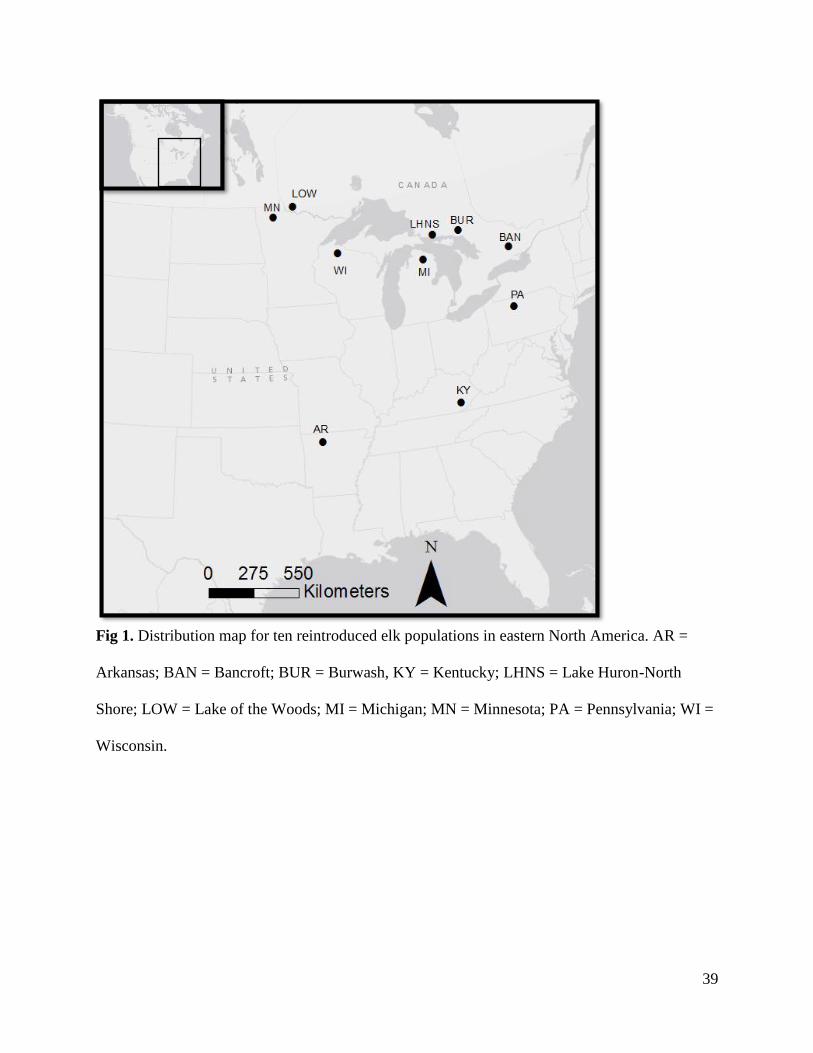
Fig 1. Distribution map for ten reintroduced elk populations in eastern North America. AR =
Arkansas; BAN = Bancroft; BUR = Burwash, KY = Kentucky; LHNS = Lake Huron-North
Shore; LOW = Lake of the Woods; MI = Michigan; MN = Minnesota; PA = Pennsylvania; WI =
Wisconsin.
40
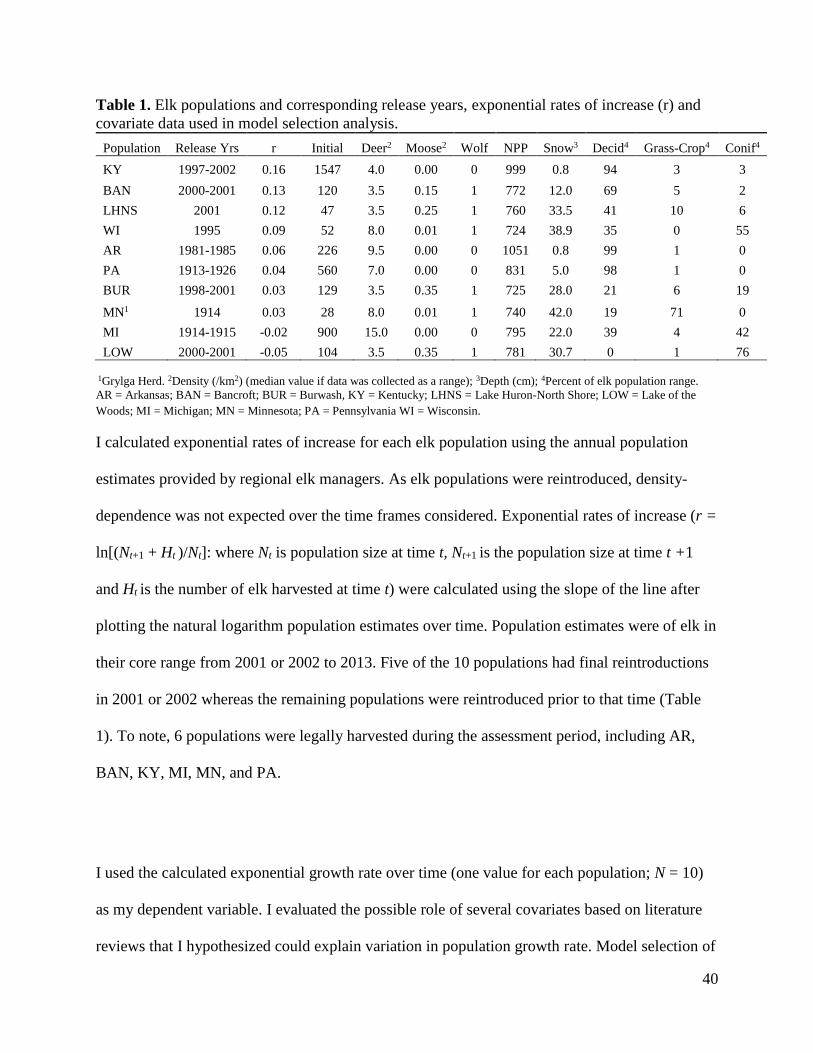
Table 1. Elk populations and corresponding release years, exponential rates of increase (r) and
covariate data used in model selection analysis.
Population Release Yrs r Initial Deer2 Moose2 Wolf NPP Snow3 Decid4 Grass-Crop4 Conif4
KY 1997-2002 0.16 1547 4.0 0.00 0 999 0.8 94 3 3
BAN 2000-2001 0.13 120 3.5 0.15 1 772 12.0 69 5 2
LHNS 2001 0.12 47 3.5 0.25 1 760 33.5 41 10 6
WI 1995 0.09 52 8.0 0.01 1 724 38.9 35 0 55
AR 1981-1985 0.06 226 9.5 0.00 0 1051 0.8 99 1 0
PA 1913-1926 0.04 560 7.0 0.00 0 831 5.0 98 1 0
BUR 1998-2001 0.03 129 3.5 0.35 1 725 28.0 21 6 19
MN1 1914 0.03 28 8.0 0.01 1 740 42.0 19 71 0
MI 1914-1915 -0.02 900 15.0 0.00 0 795 22.0 39 4 42
LOW 2000-2001 -0.05 104 3.5 0.35 1 781 30.7 0 1 76
1Grylga Herd. 2Density (/km2) (median value if data was collected as a range); 3Depth (cm); 4Percent of elk population range.
AR = Arkansas; BAN = Bancroft; BUR = Burwash, KY = Kentucky; LHNS = Lake Huron-North Shore; LOW = Lake of the
Woods; MI = Michigan; MN = Minnesota; PA = Pennsylvania WI = Wisconsin.
I calculated exponential rates of increase for each elk population using the annual population
estimates provided by regional elk managers. As elk populations were reintroduced, density-
dependence was not expected over the time frames considered. Exponential rates of increase (r =
ln[(Nt+1 + Ht )/Nt]: where Nt is population size at time t, Nt+1 is the population size at time t +1
and Ht is the number of elk harvested at time t) were calculated using the slope of the line after
plotting the natural logarithm population estimates over time. Population estimates were of elk in
their core range from 2001 or 2002 to 2013. Five of the 10 populations had final reintroductions
in 2001 or 2002 whereas the remaining populations were reintroduced prior to that time (Table
1). To note, 6 populations were legally harvested during the assessment period, including AR,
BAN, KY, MI, MN, and PA.
I used the calculated exponential growth rate over time (one value for each population; N = 10)
as my dependent variable. I evaluated the possible role of several covariates based on literature
reviews that I hypothesized could explain variation in population growth rate. Model selection of

41
linear models using AICc (Burnham and Anderson 2002) was used to identify the most important
predictor variable(s). Specifically, I hypothesized that land use composition, initial population
size, snow depth, parasitism, the presence of predators, and the presence of competitors would
influence elk population growth rates (Table 1).
I incorporated habitat variables known to be selected for or avoided by elk and overlapped the
range of each elk population onto a Land Cover Map of North America for the year 2000 (GLC
2000-NCA) with 1 km resolution (Latifovic et al. 2002; 2004) to determine the proportions of
cover types in each range. Elk are known to select for deciduous forest habitats (Bobek et al.
1984; McCorquodale 2003; Jenkins et al. 2007; Popp et al. 2013) as well as areas abundant with
forbs and grass (Collins and Urness 1983; McIntosh 2003; Anderson et al. 2005; Creel et al.
2005). Based on this, I hypothesized that these cover types (deciduous forest, grasslands and
croplands) would positively influence elk population growth rates. The land cover covariates
Ianticipated would have a positive effect on elk population growth rate included (1) percent
range in broadleaved deciduous forest (Decid); and (2) percent grassland with or without a sparse
tree layer combined with mosaics of cropland or other natural vegetation which I combined as
one covariate because the grassland cover class alone only comprised 0-2% of each elk herd
range (Grass-Crop). Additionally, because elk in eastern North America use coniferous habitats
significantly less than expected (Popp et al. 2013; McGeachy 2014) as well as forage on
coniferous species significantly less than expected (Jost et al. 1999; Jenkins et al. 2007), I
predicted that (3) percent coniferous forests (Conif) would negatively affect elk population
growth rates. I also predicted that (4) summed annual Net Primary Productivity (NPP) would
have a positive influence on population growth rate. As such, NPP was included as a covariate. I

42
used data from the year 2000 GloPEM (Global Production Efficiency Model) with 8 km
resolution (Prince 2003) to calculate the mean pixel values of the raster file for each elk range.
As predation is a leading cause of mortality in several reintroduced eastern elk populations (Popp
et al. 2014), I incorporated (5) the presence or absence of wolves Canis lupus (Wolf) (density
estimates not available). Additionally, although the degree of competition between moose (Alces
alces) and elk has been suggested to be minimal, there is some habitat selection overlap in winter
(OMNR 2010). Thus I hypothesized that (6) moose density (Moose) would influence elk
population growth rates through direct or indirect competition (Data sources: USA: regional elk
managers; Canada: OMNR 2007 Combined Harvest Data). Where density estimates were given
as a range (ie: ±), the median values were used in my analysis. White-tailed deer, Odocoileus
virginianus, are competitors with elk, especially during mild winters (Jenkins et al. 2007), as
well as reservoir hosts for meningeal worm, a parasite that causes lethal neurological disease in
elk (Anderson et al. 1966; Anderson 1972) which has been suggested as the cause of many early
elk reintroduction failures (Raskevitz et al. 1991; O’Gara and Dundas 2002). I incorporated (7)
white-tailed deer density (Deer) (Data sources: USA: regional elk managers; Canada: OMNR
2009 Cervid Ecological Framework). Because severe winters are well known to influence
ungulate survival (Singer et al. 1997; Smith et al. 2003; Evans et al. 2006), I incorporated (8)
average seasonal (December to February) snow depth (Snow) from 1980 to 2010 (Data sources:
USA: National Weather Service; Canada: Environment Canada). Finally, because founding
population size is known to affect reintroduction success (Griffith et al. 1989), I used (9) the
initial elk population size (Initial) in year 2001 (or 2002 if data for 2001 was not available).
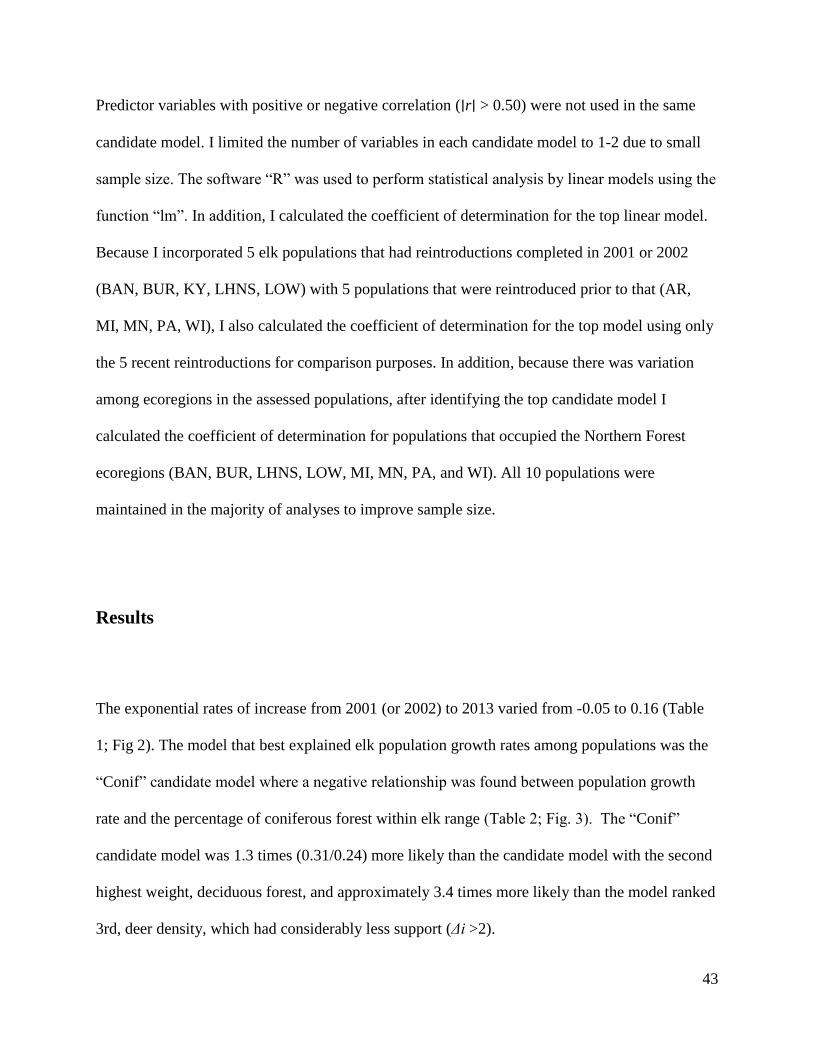
43
Predictor variables with positive or negative correlation (∣r∣ > 0.50) were not used in the same
candidate model. I limited the number of variables in each candidate model to 1-2 due to small
sample size. The software “R” was used to perform statistical analysis by linear models using the
function “lm”. In addition, I calculated the coefficient of determination for the top linear model.
Because I incorporated 5 elk populations that had reintroductions completed in 2001 or 2002
(BAN, BUR, KY, LHNS, LOW) with 5 populations that were reintroduced prior to that (AR,
MI, MN, PA, WI), I also calculated the coefficient of determination for the top model using only
the 5 recent reintroductions for comparison purposes. In addition, because there was variation
among ecoregions in the assessed populations, after identifying the top candidate model I
calculated the coefficient of determination for populations that occupied the Northern Forest
ecoregions (BAN, BUR, LHNS, LOW, MI, MN, PA, and WI). All 10 populations were
maintained in the majority of analyses to improve sample size.
Results
The exponential rates of increase from 2001 (or 2002) to 2013 varied from -0.05 to 0.16 (Table
1; Fig 2). The model that best explained elk population growth rates among populations was the
“Conif” candidate model where a negative relationship was found between population growth
rate and the percentage of coniferous forest within elk range (Table 2; Fig. 3). The “Conif”
candidate model was 1.3 times (0.31/0.24) more likely than the candidate model with the second
highest weight, deciduous forest, and approximately 3.4 times more likely than the model ranked
3rd, deer density, which had considerably less support (Δi >2).
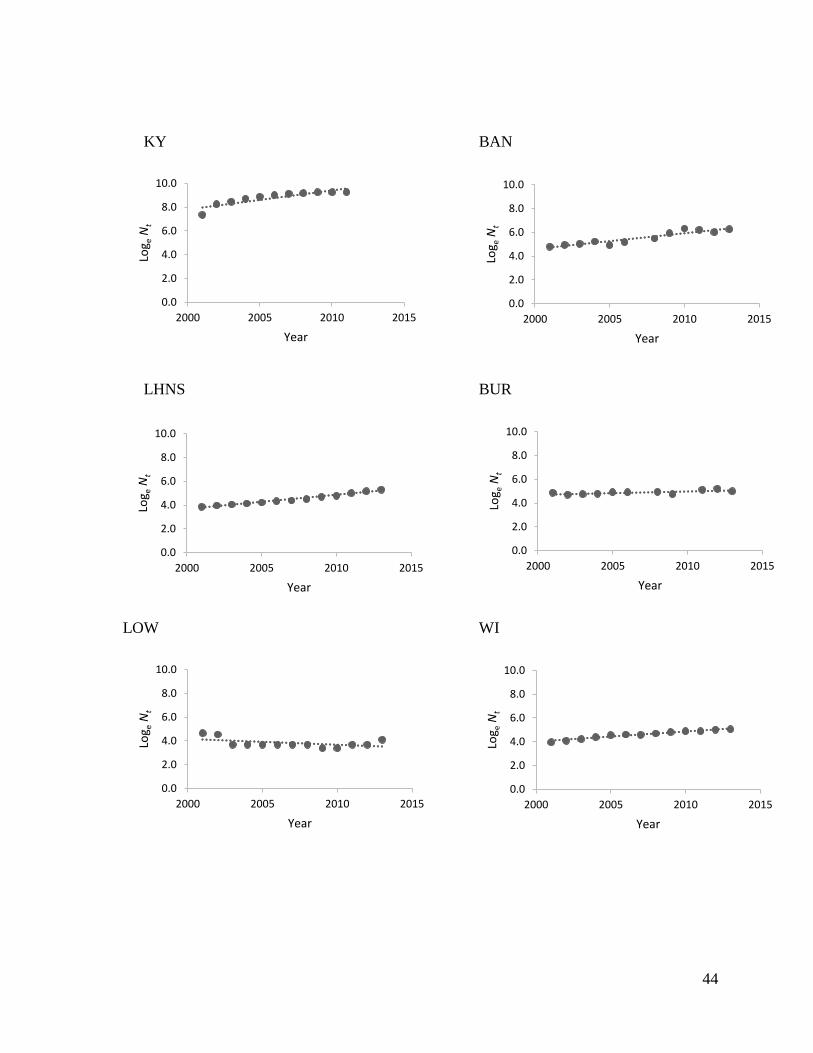
44
KY BAN
LHNS BUR
LOW WI
0.0
2.0
4.0
6.0
8.0
10.0
2000 2005 2010 2015
Log e
Nt
Year
0.0
2.0
4.0
6.0
8.0
10.0
2000 2005 2010 2015
Log e
Nt
Year
0.0
2.0
4.0
6.0
8.0
10.0
2000 2005 2010 2015
Log e
Nt
Year
0.0
2.0
4.0
6.0
8.0
10.0
2000 2005 2010 2015
Log e
Nt
Year
0.0
2.0
4.0
6.0
8.0
10.0
2000 2005 2010 2015
Log e
Nt
Year
0.0
2.0
4.0
6.0
8.0
10.0
2000 2005 2010 2015
Log e
Nt
Year
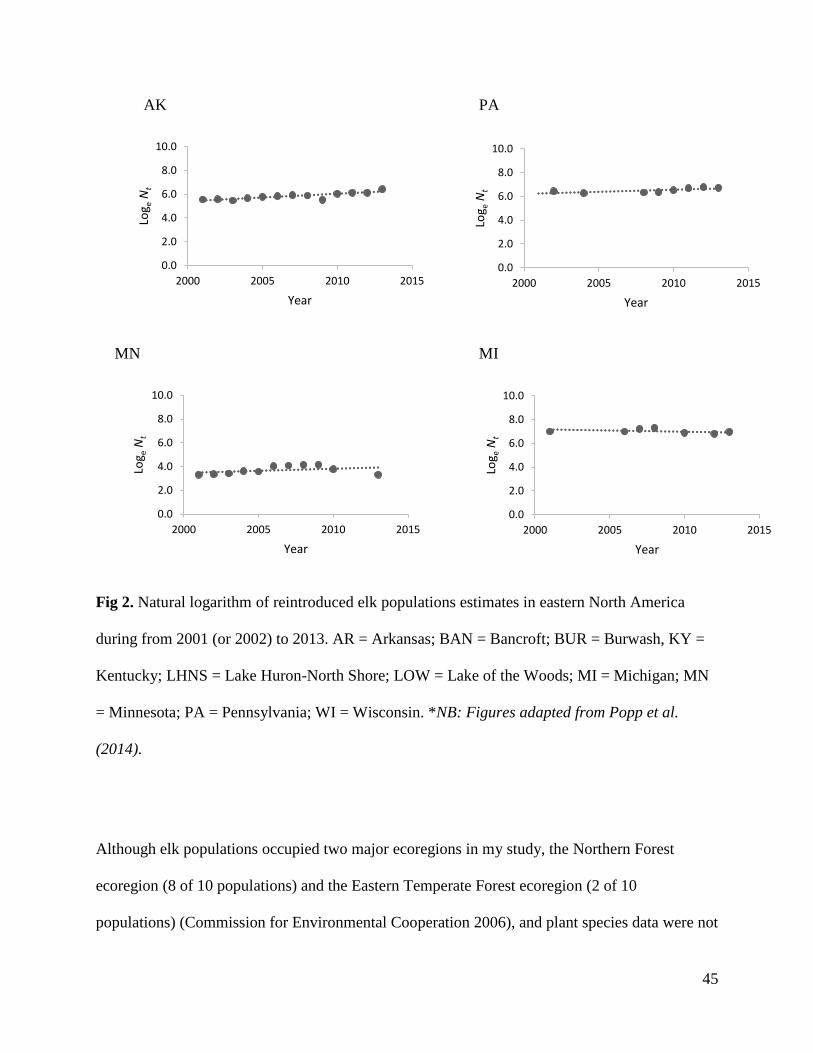
45
AK PA
MN MI
Fig 2. Natural logarithm of reintroduced elk populations estimates in eastern North America
during from 2001 (or 2002) to 2013. AR = Arkansas; BAN = Bancroft; BUR = Burwash, KY =
Kentucky; LHNS = Lake Huron-North Shore; LOW = Lake of the Woods; MI = Michigan; MN
= Minnesota; PA = Pennsylvania; WI = Wisconsin. *NB: Figures adapted from Popp et al.
(2014).
Although elk populations occupied two major ecoregions in my study, the Northern Forest
ecoregion (8 of 10 populations) and the Eastern Temperate Forest ecoregion (2 of 10
populations) (Commission for Environmental Cooperation 2006), and plant species data were not
0.0
2.0
4.0
6.0
8.0
10.0
2000 2005 2010 2015
Log e
Nt
Year
0.0
2.0
4.0
6.0
8.0
10.0
2000 2005 2010 2015
Log e
Nt
Year
0.0
2.0
4.0
6.0
8.0
10.0
2000 2005 2010 2015
Log e
Nt
Year
0.0
2.0
4.0
6.0
8.0
10.0
2000 2005 2010 2015
Log e
Nt
Year
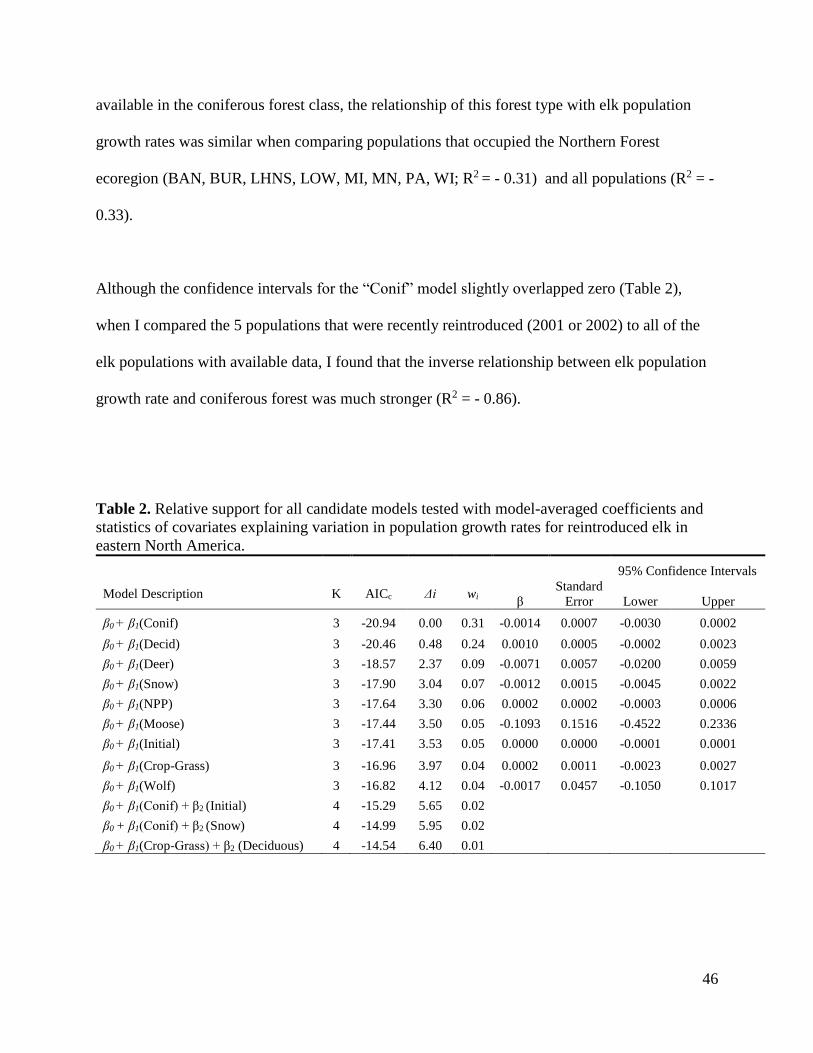
46
available in the coniferous forest class, the relationship of this forest type with elk population
growth rates was similar when comparing populations that occupied the Northern Forest
ecoregion (BAN, BUR, LHNS, LOW, MI, MN, PA, WI; R2 = - 0.31) and all populations (R2 = -
0.33).
Although the confidence intervals for the “Conif” model slightly overlapped zero (Table 2),
when I compared the 5 populations that were recently reintroduced (2001 or 2002) to all of the
elk populations with available data, I found that the inverse relationship between elk population
growth rate and coniferous forest was much stronger (R2 = - 0.86).
Table 2. Relative support for all candidate models tested with model-averaged coefficients and
statistics of covariates explaining variation in population growth rates for reintroduced elk in
eastern North America.
95% Confidence Intervals
Model Description K AICc Δi wi β
Standard
Error Lower Upper
β0 + β1(Conif) 3 -20.94 0.00 0.31 -0.0014 0.0007 -0.0030 0.0002
β0 + β1(Decid) 3 -20.46 0.48 0.24 0.0010 0.0005 -0.0002 0.0023
β0 + β1(Deer) 3 -18.57 2.37 0.09 -0.0071 0.0057 -0.0200 0.0059
β0 + β1(Snow) 3 -17.90 3.04 0.07 -0.0012 0.0015 -0.0045 0.0022
β0 + β1(NPP) 3 -17.64 3.30 0.06 0.0002 0.0002 -0.0003 0.0006
β0 + β1(Moose) 3 -17.44 3.50 0.05 -0.1093 0.1516 -0.4522 0.2336
β0 + β1(Initial) 3 -17.41 3.53 0.05 0.0000 0.0000 -0.0001 0.0001
β0 + β1(Crop-Grass) 3 -16.96 3.97 0.04 0.0002 0.0011 -0.0023 0.0027
β0 + β1(Wolf) 3 -16.82 4.12 0.04 -0.0017 0.0457 -0.1050 0.1017
β0 + β1(Conif) + β2 (Initial) 4 -15.29 5.65 0.02
β0 + β1(Conif) + β2 (Snow) 4 -14.99 5.95 0.02
β0 + β1(Crop-Grass) + β2 (Deciduous) 4 -14.54 6.40 0.01
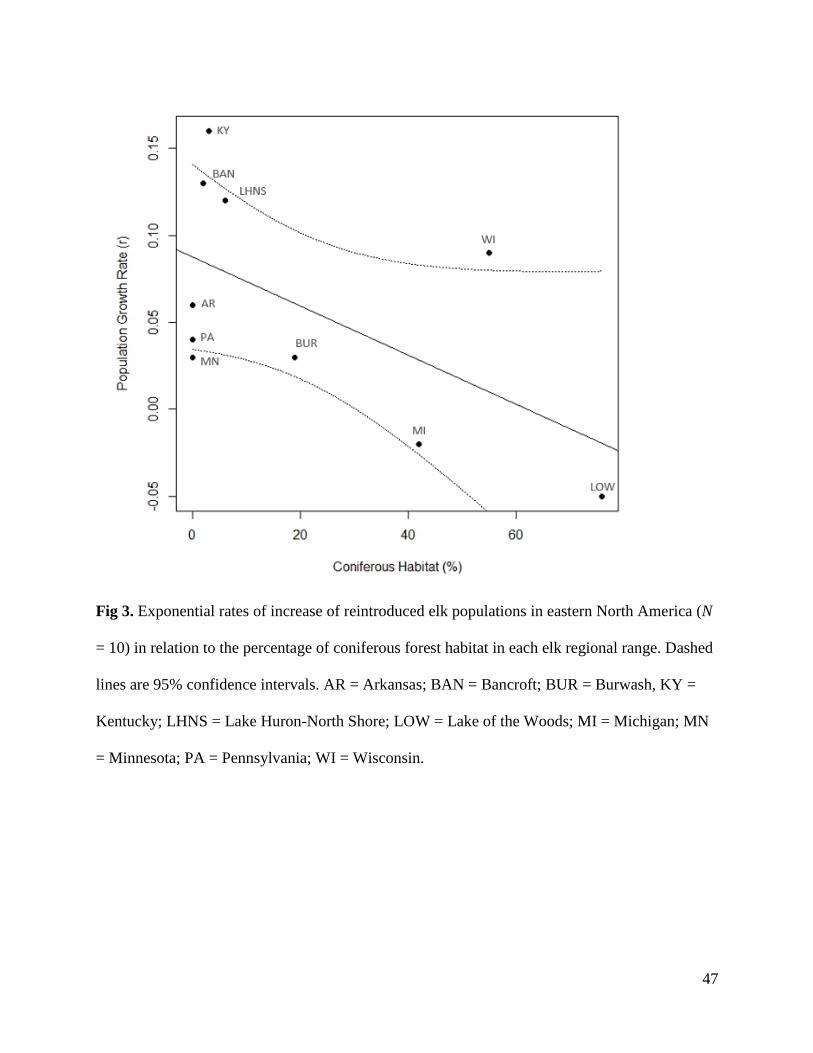
47
Fig 3. Exponential rates of increase of reintroduced elk populations in eastern North America (N
= 10) in relation to the percentage of coniferous forest habitat in each elk regional range. Dashed
lines are 95% confidence intervals. AR = Arkansas; BAN = Bancroft; BUR = Burwash, KY =
Kentucky; LHNS = Lake Huron-North Shore; LOW = Lake of the Woods; MI = Michigan; MN
= Minnesota; PA = Pennsylvania; WI = Wisconsin.
48
Discussion
The importance of maintaining positive population growth rates (r > 0) during animal
restorations has been reported previously (Conard et al. 2010). Small populations are at greater
risk of becoming even smaller because a myriad of stochastic events can significantly reduce
population viability (Boyce 1992). Therefore, increasing small founding population size as
quickly as possible may be a vital component of reintroduction success. My analyses revealed
that coniferous forest had the most important inverse relationship to reintroduced elk population
growth rates in eastern North America. This relationship was even stronger when I examined
only recently reintroduced populations, suggesting that sub-optimal habitat also influences elk
during the first years following reintroduction.
Several past attempts to reintroduce elk to portions of eastern North America resulted in failure
apparently due in part to lack of appropriate habitat (Witmer 1990), however, no empirical
studies have been conducted to support this suggestion. Elk often select deciduous forest
communities (Bobek et al. 1984; Schroer et al. 1993; Jenkins et al. 2007; Popp et al. 2013)
within close proximity of other plant communities such as meadows and grasslands (Collins and
Urness 1983; Peck and Peek 1991; Anderson et al. 2005; McGeachy 2014). Similar to western
populations, elk populations in eastern North America primarily graze on forbs, grasses, and
sedges, but browse from deciduous trees and shrubs are also important dietary components
especially when herbaceous vegetation becomes unpalatable or unavailable due to snow
accumulation or other changes in environmental conditions or seasons (Jost et al. 1999;
Schneider et al. 2006; Jenkins et al. 2007). In winter, Jenkins et al. (2007) found that quaking

49
aspen (Populus tremuloides) was most preferred in south central Ontario, while Jost et al. (1999)
found that big-tooth aspen (Populus grandidenta), white birch (Betula papyrifera), red maple
(Acer rubrum), pin cherry (Prunus pensylvanica), willow (Salix spp.), bush honeysuckle
(Diervilla lonicera), and beaked hazel (Corylus cornuta) were consumed significantly more than
available in north central Ontario. In Kentucky, the most important browse species were
flowering dogwood (Cornus florida), autumn-olive (Elaeagnus umbellate), black locust (Robinia
pseudoacacia) and maple (Acer sp) (Schneider et al. 2006). In Pennsylvania, elk also selected
quaking aspen, autumn-olive, and flowering dogwood as forage in addition to eastern hemlock
(Tsuga canadensis), willow (Salix sp), and oak (Quercus sp) (Heffernan 2009). In contrast to
deciduous forests, reintroduced elk in eastern North America used coniferous forest habitats such
as stands dominated by red (Pinus resinosa) and white pine (Pinus strobus) significantly less
than expected (Popp et al. 2013; McGeachy 2014), and foraged on coniferous plant species less
than expected based on availability (Jost et al. 1999; Jenkins et al. 2007). Jenkins et al. (2007)
found these selective patterns in elk during the two years immediately following reintroduction
illustrating non-random behaviour in a novel environment.
While my analyses revealed an inverse effect of coniferous forest on elk population growth rate,
it is important to recognise that the availability of some forests and shrubland communities are
known to benefit elk. For example, wooded areas are used by elk for protective cover and rest
sites (Creel et al. 2005; Marcum 1975; Irwin and Peek 1983) and it is well known that edge
habitat is important to elk (Skovlin et al. 2002). Elk population dynamics, predator composition,
landscapes and habitats, and causes of elk mortality differ substantially between eastern and
western North America (Keller et al. 2015) and in light of this, the importance of coniferous

50
forests for elk across landscapes may differ. Thus, although coniferous forest may provide some
benefits to elk, large patches comprising large proportions of elk ranges in eastern North
America may reduce foraging opportunities, which is thought to be the most important driver of
elk habitat selection (Beck et al. 2006). Future elk reintroductions in eastern North America
should avoid targeting areas dominated by coniferous forest.
Griffith et al. (1989) found that if animals were reintroduced into areas with good to excellent
habitat, 69-84% of reintroductions succeeded, whereas if released into poor-quality habitats, only
38% succeeded. Although Witmer (1990) suggested that elk reintroductions in the east were less
successful than in the west because there was less high-quality habitat and higher human
densities, Michigan elk calves had the highest recorded survival rates in North America and it
was suggested that habitat, not predators, had greater influence on recruitment (Bender et al.
2002). Good habitat may lead to better physical condition of elk (DeVivo et al. 2011), resulting
in higher survival rates and if elk cannot find adequate forage, the effects on productivity and
survival could be detrimental (Cook et al. 2002; Noyes et al. 2002). Poor-quality habitats have
been shown to negatively affect other ungulate species also. For example, with decreasing forage
quality and/or quantity in sub-optimal habitat, woodland caribou (Rangifer tarandus caribou)
may not sustain the required levels of body fat to be able to conceive, maintain embryos or
sustain adequate lactation (Brown and Mallory 2007).
Although studies of reintroduction success using a single population approach contribute to
viable management strategies, the comparison of factors related to growth rates of multiple
populations can be helpful for understanding factors that influence success rates. In support of

51
past suggestions, I found that habitat was the most important predictor of elk population growth,
where an increase in sub-optimal habitat (coniferous forest) led to decreased elk population
growth rates. Armstrong and Seddon (2007) suggested that meta-analyses should play a
significant role in future restoration ecology research involving assessments of reintroduction
success and my study supports this conclusion. The growing need for species restoration and
presently available results of various reintroduction studies warrant the use of multi-population
studies and meta-analyses to enhance management strategies and future reintroduction efforts.
52
Literature Cited
Anderson, R.C., Lankester, M.W., and Strelive, U.R. 1966. Further experimental studies of
Pneumostrongylus tenius in cervids. Canadian Journal of Zoology 44: 851–861.
Anderson, R.C. 1972. The ecological relationship of menigneal worm and native cervids in
North America. Journal of Wildlife Diseases 8: 304–310.
Anderson, D.P., Turner, M.G., Forester, J.D., Zhu, J., Boyce, M.S., Beyer, H., and Stowell, L.
2005. Scale-dependent summer resource selection by reintroduced elk in Wisconsin, USA.
Journal of Wildlife Management 69: 298-310.
Armstrong, D.P. and Seddon, P.J. 2007. Directions in reintroduction biology. Trends in Ecology
and Evolution 23: 20-25.
Baker, D.L. and Hobbs, N.T. 1982. Composition and quality of elk summer diets in Colorado.
Journal of Wildlife Management 46: 694-703.
Beck, J.L., Peek, J.M., and Strand, E.K. 2006. Estimates of elk summer range nutritional
carrying capacity constrained by probabilities of habitat selection. Jounral of Wildlife
Management 70: 283-294.
Bender, L.C., Carlson, E., Schmitt, S.M., and Haufler, J.B. 2002. Production and survival of elk
(Cervus elaphus) calves in Michigan. The American Midland Naturalist 148: 163-171.
Bobek, B., Boyce, M.S., and Kosobucka, M. 1984. Factors affecting red deer Cervus elaphus
population density in Southeastern Poland. Journal of Applied Ecology 21: 881–890.

53
Boyce, M.S. 1992. Population viability analysis. Annual Review of Ecology, Evolution, and
Systematics 23: 481-506.
Brown, G.S. and Mallory, F.F. 2007. A review of ungulate nutrition and the role of top-down
and bottom-up forces in woodland caribou population dynamics. National Council for Air
and Stream Improvement. Technical Bulletin No. 934.
Burnham, K.P. and Anderson, D.R. 2002. Model Selection and Multimodel Inference: A
Practical Information-Theoretic Approach. Springer Science & Business Media.
Cairns, A.L. and Telfer, E.S. 1980. Habitat use by 4 sympatric ungulates in boreal mixedwood
forest. Journal of Wildlife Management 44: 849-857.
Collins, W.B. and Urness, P.J. 1983. Feeding behavior and habitat selection of mule deer and elk
on Northern Utah summer range. Journal of Wildlife Management 47: 646–663.
Commission for Environmental Cooperation. 2006. Ecological Regions of North America.
Conard, J.M., Statham, M.J., Gipson, P.S., and Wisely, S.M. 2010. The influence of
translocation strategy and management practices on the genetic variability of a re-established
elk (Cervus elaphus) population. Restoration Ecology 18: 85-93.
Converse, S.J., Moore, C.T., and Armstrong, D.P. 2013. Demographics of reintroduced
populations: estimation, modeling, and decision analysis. Journal of Wildlife Mangement 77:
1081-1093.
Cook, J. 2002. Nutrition and Food. In: Toweill, D.E. and Thomas, J.W. (eds). North American
Elk: Ecology and Management. Pp. 229-234. Smithsonian Institution Press.

54
Creel, S., Winnie Jr, J., Maxwell, B., Hamlin, K., and Creel, M. 2005. Elk alter habitat selection
as an antipredator response to wolves. Ecology 86: 3387-3397.
DeVivo, M.T., Cottrell, W.O., DeBerti, J.M., Duchamp, J.E., Heffernan, L.M., Kougher, J.D.,
and Larkin, J.L. 2011. Survival and cause-specific mortality of elk Cervus canadensis calves
in a predator rich environment. Wildlife Biology 17: 156-165.
Evans, S.B., Mech, L.D., White, P.J., and Sergeant, G.A. 2006. Survival of adult female elk in
Yellowstone following wolf restoration. Journal of Wildlife Management 70: 1372-1378.
Fischer, J. and Lindenmayer, D.B. 2000. An assessment of the published results of animal
relocations. Biological Conservation 96: 1-11.
Geist, V. 1982. Adaptive Behavioural Strategies. In: Toweill, D.E. and Thomas, J.W. (eds).
North American Elk: Ecology and Management. Pp. 219-278. Smithsonian Institution Press.
Griffith, B.J, Scott, M., Carpenter, J.W., and Reed, C. 1989. Translocation as a species
conservation tool: status and strategy. Science 245: 477-480.
Hamr, J. 2001. Trauma and Mortality Associated with Transcontinental Wild Elk Relocations.
In: Renecker, L.A. and Renecker, T.A. Game Conservation and Sustainability: Biodiversity,
Management, Ecotourism, Traditional Medicine and Health. Pp. 60-67. Renecker & Assoc.
Inc.
Heffernan. L.M. 2009. Effects of age, sex, and landscape composition on seasonal diets of elk in
Pennsylvania. M.Sc. thesis. Indiana University of Pennsylvania. Indiana County,
Pennsylvania.
55
International Union for Conservation of Nature/Species Survival Commission. 2013. Guidelines
for Reintroductions and Other Conservation Translocations. Version 1.0. Gland, Switzerland:
IUCN Species Survival Commission, viiii + 57 pp.
Irwin, L.L. and Peek, J.M. 1983. Elk habitat use relative to forest succession in Idaho. Journal of
Wildlife Management 47: 664-672.
Jenkins, D.A., Schaefer, J.A., Rosatte, R., Bellhouse, T., Hamr, J., and Mallory, F.F. 2007.
Winter resource selection of reintroduced elk and sympatric white-tailed deer at multiple
spatial scales. Journal of Mammalogy 88: 614-624.
Jost, M.A., Hamr, J., Filion, I., and Mallory, F.F. 1999. Forage selection by elk in habitats
common to the French River-Burwash region of Ontario. Canadian Journal of Zoology 77:
1429-1438.
Keller, B.J., Montgomery, R.A., Campa III, H.R., Beyer Jr, D.E., Winterstein, S.R., Hansen, L.
P., and Millspaugh, L.P. 2015. A review of vital rates and cause-specific mortality of elk
Cervus elaphus populations in eastern North America. Mammal Review 45: 146-159.
Kleiman, D.G. 1989. Reintroduction of captive mammals for conservation. Bioscience 39: 152-
161.
Korphage, R.C., Nelson, J.R., and Skovlin, J.M. 1980. Summer diets of Rocky Mountain elk in
northeastern Oregon. Journal of Wildlife Management 44: 747-750.
Laliberte, A.S. and Ripple, W.J. 2004. Range contractions of North American carnivores and
ungulates. Bioscience 54: 123-138.
Larkin, J.L., Maehr, D.S., Cox, J.J., Wichrowski, M.W., and Crank, R.D. 2002. Factors affecting
reproduction and population growth in a restored elk Cervus elaphus nelsoni population.
Wildlife Biology 8: 49–54.

56
Latifovic, R., Zhu, Z., Cihlar, J., Beaubien, J., and Fraser, R. 2002. Land cover of North America
2000. Natural Resources Canada, Canada Center for Remote Sensing, US Geological Service
EROS Data Center.
Latifovic, R., Zhu, Z., Cihlar, J., Giri, C., and Olthof, I. 2004. Land cover mapping of North and
Central America – Global Land Cover 2000. Remote Sensing of the Environment 86: 116-
127.
Lindburg, D.G. 1992. Are wildlife reintroductions worth the cost? Zoo Biology 11: 1-2.
Marcum, C.L. 1975. Summer-fall habitat selection and use by a western Montana elk herd. Ph.D.
thesis, University of Montana, Missoula.
McGeachy, D.N.C. 2014. Population distribution and seasonal resource selection by elk (Cervus
elaphus) in central Ontario. M.Sc. thesis. Laurentian University, Ontario.
McCorquodale, S.M. 2003. Sex-specific movements and habitat use by elk in the Cascade Range
of Washington. Journal of Wildlife Management 67: 729-741.
McIntosh, T.E. 2003. Movements, survival and habitat use by elk (Cervus elaphus) reintroduced
to northwestern Ontario. M.Sc. thesis. Lakehead University, Thunder Bay, Ontario.
Nelson, J.R. and Leege, T.A. 1982. Nutritional Requirements and Food Habits. In: Elk of North
America: Ecology and Management. Thomas, J.W. and Toweill, D.E. Pp. 323-368. Stack-
pole Books.
Noyes, J.H., Johnson, B.K., Dick, B.L., and Kie, J.G. 2002. Effects of male age and female
nutritional condition on elk reproduction. Journal of Wildlife Management 66: 1301 -1307.
O’Gara, B.W. and Dundas, R.G. 2002. Distribution: Past and Present. In: Toweill, D.E. and
Thomas, J.W. North American Elk: Ecology and Management. Pp. 67-119. Smithsonian
Institution Press.
57
OMNR. 2010. Backgrounder on elk in Ontario. pp. 44.
Peck, V.R. and Peek, J.M. 1991. Elk, Cervus elaphus, habitat use related to prescribed fire,
Tuchodi River, British Columbia. Canadian Field Naturalist 105: 354–362.
Pérez, I., Anadón, J.D., Díaz, M., Nicola, G.G., Tella, J.L., and Giménez, A. 2012. What is
wrong with current translocations? A review and a decision-making proposal. Frontiers in
Ecology and the Environment 10: 494-501.
Popp, J.N., McGeachy, D.N., and Hamr, J. 2013. Elk (Cervus elaphus) seasonal habitat selection
in a heterogeneous forest structure. International Journal of Forestry Research 2013: 1-7.
Popp, J.N., Toman, T., Mallory, F.F., and Hamr, J. 2014, A century of elk restoration in eastern
North America. Restoration Ecology 22: 723-730.
Prince, S.J.S. 2003. Global Production Efficiency Model, 1997_npp_lation, Department of
Geography, University of Maryland, College Park for meningeal worm. Journal of Wildlife
Diseases 27: 92–101.
Schneider, J., Maehr, D.S., Alexy, K.J., Cox, J.J., Larkin, J.L., and Reeder, B.C. 2006. Food
habits of reintroduced elk in southeastern Kentucky. Southeastern Naturalist 5: 535-546.
Raskevitz, R.F., Kocan, A.A., and Shaw, J.H. 1991. Gastropod availability and habitat utilization
of wapiti and white-tailed deer sympatric on range enzootic for meningeal worm. Journal of
Wildlife Diseases 1: 92-101.
Schroer, G.L., Jenkins, K.J., and Moorhead, B.B. 1993. Roosevelt elk selection of temperate rain
forest seral stages in Western Washington. Northwest Science 67: 23-29.

58
Seddon, P.J., Armstrong, D.P., and Maloney, R.F. 2007. Developing the science of
reintroduction biology. Conservation Biology 21: 303-312.
Singer, F.J., Harting, A., Symonds, K.K., and Coughenour, M.B. 1997. Density dependence,
compensation, and environmental effects of elk calf mortality in Yellowstone after wolves.
Journal of Wildlife Management 61: 12-25.
Skovlin, J.M., Zager, P., and Johnson, B.K. 2002. Elk Habitat Selection. In: Toweill, D.E. and
Thomas, J.W. (eds). North American Elk: Ecology and Management. Pp. 531-556.
Smithsonian Institution Press.
Smith, D.W., Peterson, R.O., and Houston, D.B. 2003. Yellowstone after wolves. BioScience 53:
330-340.
Thorne, E.T., Williams, E.S., Samuel, W.M., and Kistner, T.P. 2002. Diseases and Parasites. In:
In: Toweill, D.E. and Thomas, J.W. (eds). North American Elk: Ecology and Management.
Pp. 351-388. Smithsonian Institution Press.
Teixeira, C.P., De Azevedo, C.S., Mendl, M., Cipreste, C.F., and Young, R.J. 2007. Revisiting
translocation and reintroduction programmes: the importance of considering stress. Animal
Behaviour 73: 1–13.
Witmer, G.W. 1990. Re-introduction of elk in the United States. Journal of the Pennsylvania
Academy of Science 64: 131-135.
Wolf, C.M., Griffith, B., Reed, C., and Temple, S.A. 1996. Avian and mammalian
translocations: update and reanalysis of 1987 survey data. Conservation Biology 10: 1142-
1154.

59
Wolf, C.M., Garland, T., and Griffith, B. 1998. Predictors of avian and mammalian translocation
success: reanalysis with phylogenetically independent contrasts. Biological Conservation 86:
243-255.
60
Chapter 4
Railway Ecology: Underrepresented in Science?*
Abstract
Over the past two decades, the effects of roads on wildlife have been extensively studied.
Theoretically, railways cause similar effects as well, yet ecologists do not understand the
magnitude of these effects. Despite the field of road ecology rapidly expanding and the large
footprint created by railways, there is a prominent lack of research related to railways and their
effects on wildlife. To emphasize gaps between road and railway wildlife studies, I performed a
thorough systematic review of 14 peer-reviewed journals in which ecologists and conservation
biologists commonly publish. I found a clear underrepresentation of railway studies despite the
potential negative ecological effects associated with this important anthropogenic feature. I
found 259 road-wildlife articles and only 17 railway-wildlife articles in the journals I assessed
with the majority of road studies focused in North America and the majority of railway studies in
Europe. Although road-wildlife studies have increased through time, railway-wildlife studies
have remained stagnant. In my opinion, the development of research pertaining to ‘Railway
Ecology’ is long overdue.
*Article Published: Popp, J.N. and Boyle, S.P. 2017. Railway Ecology: Underrepresented in
Science? Basic and Applied Ecology. 19: 84-93.
61
Introduction
Over the past two decades the effects of roads on ecological processes have been extensively
studied (Rytwinski and Fahrig 2015). Roads have been identified as a substantial threat to
mammals (Benítez-López et al. 2010; Beyer et al. 2013), birds (Benítez-López et al. 2010;
Kociolek et al 2011), herpetofauna (Beebee 2013; Gibbs and Shriver 2005), pollinators (Baxter-
Gilbert, et al. 2015), non-pollinating insects and other invertebrates (Muñoz et al. 2014), as well
as plants (Lee et al. 2012). Roads affect fauna directly through habitat fragmentation (Jackson
and Fahrig 2011) and road mortality (Beebee 2013; Jackson and Fahrig 2011), as well as
indirectly via noise (McClure et al. 2013; Ware et al 2015), light (Gaston et al. 2013) and
chemical pollution (Dananay et al. 2015), fluctuation in stress response (Owen et al. 2014), and
even as a source of microevolution (Brown and Bomberger Brown 2013). Railways have also
been shown to cause some of these effects (Waller and Servheen 2005; Bartoszek and Greenwald
2009; Dorsey 2011); however, a very limited understanding exists in relation to the magnitude of
such effects.
Habitat loss and degradation are considered leading causes of wildlife population decline
(Brooks et al. 2002; Gibbons et al. 2000). The effects of roads however are far greater than the
habitat loss associated solely with its sizable footprint. When adjacent road-effect zones are
included into models, the ~4 million km linear footprint of roads in the United States is dwarfed
by the approximately 2.1 million km2 of habitat (22% of the contiguous United States) which is
directly affected by roads (Forman 2000). This effect is stronger in rural areas versus developed
62
areas (Forman 2000), suggesting that wildlife would experience disproportionately large effects,
despite lower traffic volume (Laurance et al. 2014). As such, I argue that the construction of
linear features such as roads and railways represent one of the most significant anthropogenic
alterations to the planet’s ecosystems. Worldwide, there are approximately 42 million km of
paved roads (Dulac 2013). Recent research interest in this area has led to the creation of a
relatively new field of biology known as “Road Ecology” (Forman 2003) with focus not only on
the effects of roads on wildlife but the mitigation of those effects. Railways have an
approximately 1 million km footprint worldwide, and although road length is substantially
greater, the railway footprint is estimated to rise 45%, while paved roads are expected to increase
by only 36% by 2050 (Dulac 2013). That being said, the underrepresentation or importance of
railway-wildlife research in science should not be decided based upon differences between the
linear footprints of railways and roads, but based on the apparent lack of railway ecology
research in general, especially since the magnitude of railway effects are not yet understood.
Just as roads have been documented to, railways are likely to influence many species of wildlife.
Many species have been identified as victims of wildlife-train-collisions including birds, reptiles,
and mammals (van der Grift 1999; Dorsey 2011; Heske 2015). Wildlife-train-collisions can
cause substantial declines in populations. For example, in Alaska there was a 35% reduction of a
moose (Alces alces) population due to several factors including poor winter survival, car
collisions and hunting, but train collisions accounted for more than 60% of mortalities during the
winter of 1989 to 1990 (Becker and Grauvogal 1991). In Norway, a rate of 0.36 moose per year
per km were killed on a 240 km stretch of railway totalling 86 moose per year (Gunderson and
Andreassen 1998). Rea et al. (2010) suggested that moose are trapped by deep snow along
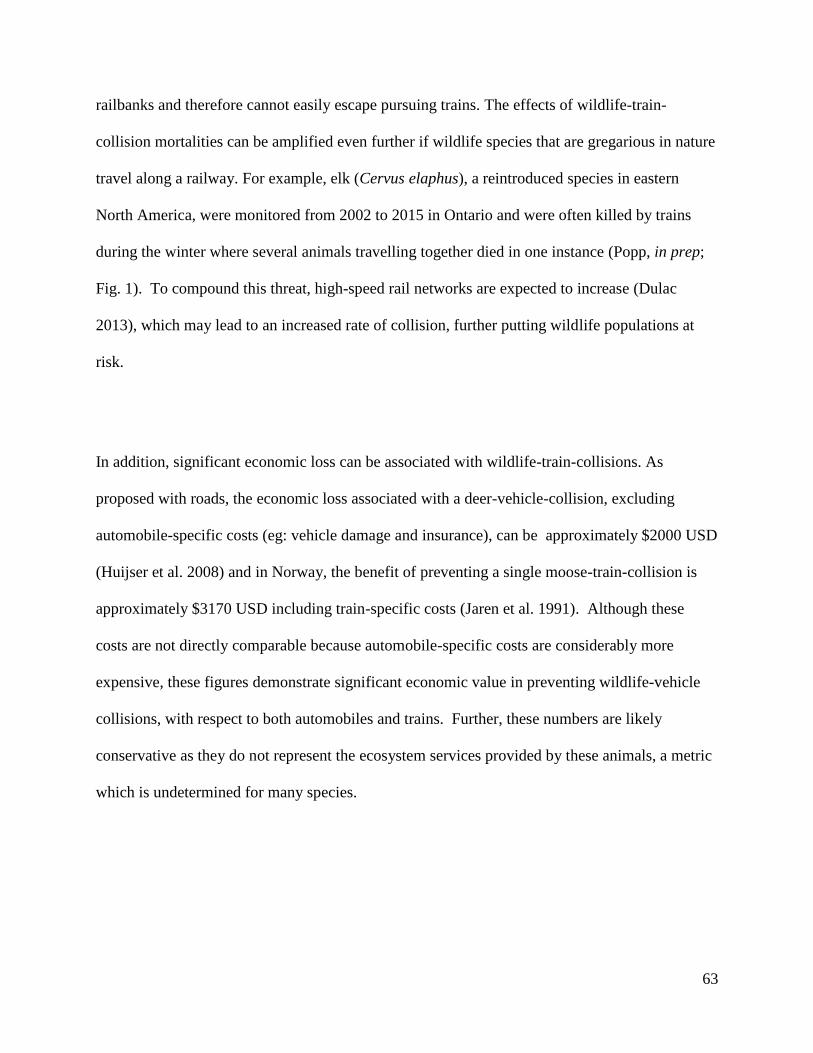
63
railbanks and therefore cannot easily escape pursuing trains. The effects of wildlife-train-
collision mortalities can be amplified even further if wildlife species that are gregarious in nature
travel along a railway. For example, elk (Cervus elaphus), a reintroduced species in eastern
North America, were monitored from 2002 to 2015 in Ontario and were often killed by trains
during the winter where several animals travelling together died in one instance (Popp, in prep;
Fig. 1). To compound this threat, high-speed rail networks are expected to increase (Dulac
2013), which may lead to an increased rate of collision, further putting wildlife populations at
risk.
In addition, significant economic loss can be associated with wildlife-train-collisions. As
proposed with roads, the economic loss associated with a deer-vehicle-collision, excluding
automobile-specific costs (eg: vehicle damage and insurance), can be approximately $2000 USD
(Huijser et al. 2008) and in Norway, the benefit of preventing a single moose-train-collision is
approximately $3170 USD including train-specific costs (Jaren et al. 1991). Although these
costs are not directly comparable because automobile-specific costs are considerably more
expensive, these figures demonstrate significant economic value in preventing wildlife-vehicle
collisions, with respect to both automobiles and trains. Further, these numbers are likely
conservative as they do not represent the ecosystem services provided by these animals, a metric
which is undetermined for many species.
64
Fig. 1. Train collision induced elk mortalities (Photo credit: D.N.C. McGeachy).
65
Despite the field of road ecology being rapidly expanded (van der Ree et al. 2011) the
recognition for the need of rigorous study designs (Lesbarrères and Fahrig 2012), as well as the
development of global road building strategies (Laurance et al. 2014), railways, which affect
wildlife in similar and sometimes more impactful ways, receive limited attention from
researchers (Dorsey et al. 2015). While both roads and railways have the ability to serve as
barriers and sources of mortality to wildlife, the strength of effects on wildlife may differ
between infrastructure types. Road surfaces are very different than railway surfaces. Such
differences may result in species-specific attractions or repulsions. Similarly, the sound and
scent emanating from each form of infrastructure cannot be considered equal. In addition, traffic
volume and speed likely differ among roads and railways. Behavioural differences among
wildlife species in proximity to either roads or railways could account for variation in mortality
rates and landscape connectivity patterns. While it may seem simple to group linear
infrastructure together, especially those that produce similar effects, doing so will not provide an
accurate representation of said effects. The objective of this article is to highlight the lack of
railway-wildlife research in science as well as to identify the gaps between road and railway
wildlife studies. In my opinion, the development of research pertaining to ‘Railway Ecology’ as a
branch of Transportation Ecology, is long overdue.
Methods
To emphasize the lack of research with focus on railways in comparison to roads, as well as to
identify gaps among road and railway studies, I performed a thorough systematic review (using
66
both publisher websites and Google Scholar) of 14 peer-reviewed journals where ecologists and
conservation biologists commonly publish with a wide scope of impact factors (ISI Impact
Factor range (2014): 1.61 – 5.06), and in my opinion, representative samples, namely: Animal
Conservation, Basic and Applied Ecology, Biological Conservation, Conservation Biology,
Ecography, Ecological Applications, Ecological Modelling, Ecology and Society, Journal of
Applied Ecology, Journal of Environmental Management, Journal of Wildlife Management,
Landscape Ecology, PlosONE, and Transportation Research Part D: Transport and Environment.
I used the keyword search terms: “railroad*”, “railway*”, “road*” and “highway*” and I only
included articles published between 1990 and 2014. Prior to 1990, while several important pieces
of research exist (Mader 1984; McLellan and Shackleton 1988), publications rates for both road
and railway ecology were relatively low and thus for the sake of this review were excluded. The
resulting articles were reviewed to ensure relevance as unrelated research articles were often
produced by the search engines. I only included articles in which research was related to the
effect of a road or railway on wildlife or research related to the mitigation of road or railway
effects on wildlife. Taxa included in the search were restricted to herpetofauna, mammals, and
birds, as these were most abundant in a preliminary review of the literature. Geographic location
(continent and/or country) of the study site was also noted. The focus and main finding of each
railway related article was also noted. Reviews as well as studies that focussed on the potential
and unexamined effects of roads or railways were not included.
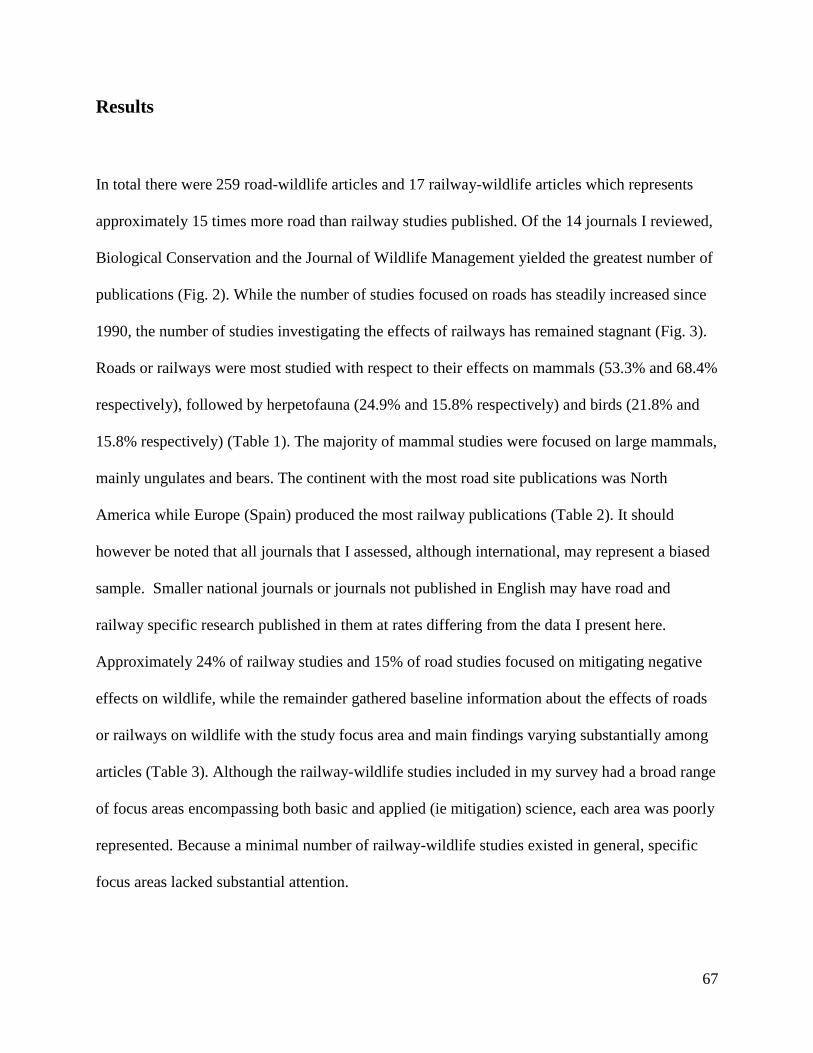
67
Results
In total there were 259 road-wildlife articles and 17 railway-wildlife articles which represents
approximately 15 times more road than railway studies published. Of the 14 journals I reviewed,
Biological Conservation and the Journal of Wildlife Management yielded the greatest number of
publications (Fig. 2). While the number of studies focused on roads has steadily increased since
1990, the number of studies investigating the effects of railways has remained stagnant (Fig. 3).
Roads or railways were most studied with respect to their effects on mammals (53.3% and 68.4%
respectively), followed by herpetofauna (24.9% and 15.8% respectively) and birds (21.8% and
15.8% respectively) (Table 1). The majority of mammal studies were focused on large mammals,
mainly ungulates and bears. The continent with the most road site publications was North
America while Europe (Spain) produced the most railway publications (Table 2). It should
however be noted that all journals that I assessed, although international, may represent a biased
sample. Smaller national journals or journals not published in English may have road and
railway specific research published in them at rates differing from the data I present here.
Approximately 24% of railway studies and 15% of road studies focused on mitigating negative
effects on wildlife, while the remainder gathered baseline information about the effects of roads
or railways on wildlife with the study focus area and main findings varying substantially among
articles (Table 3). Although the railway-wildlife studies included in my survey had a broad range
of focus areas encompassing both basic and applied (ie mitigation) science, each area was poorly
represented. Because a minimal number of railway-wildlife studies existed in general, specific
focus areas lacked substantial attention.
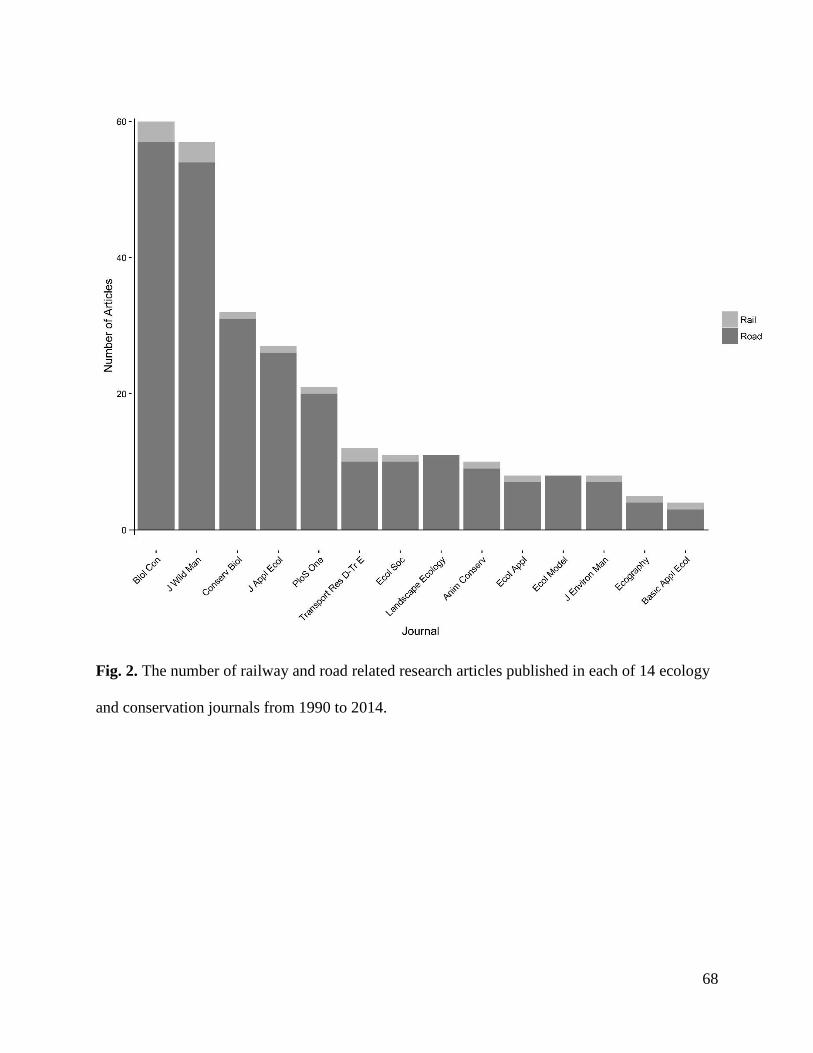
68
Fig. 2. The number of railway and road related research articles published in each of 14 ecology
and conservation journals from 1990 to 2014.
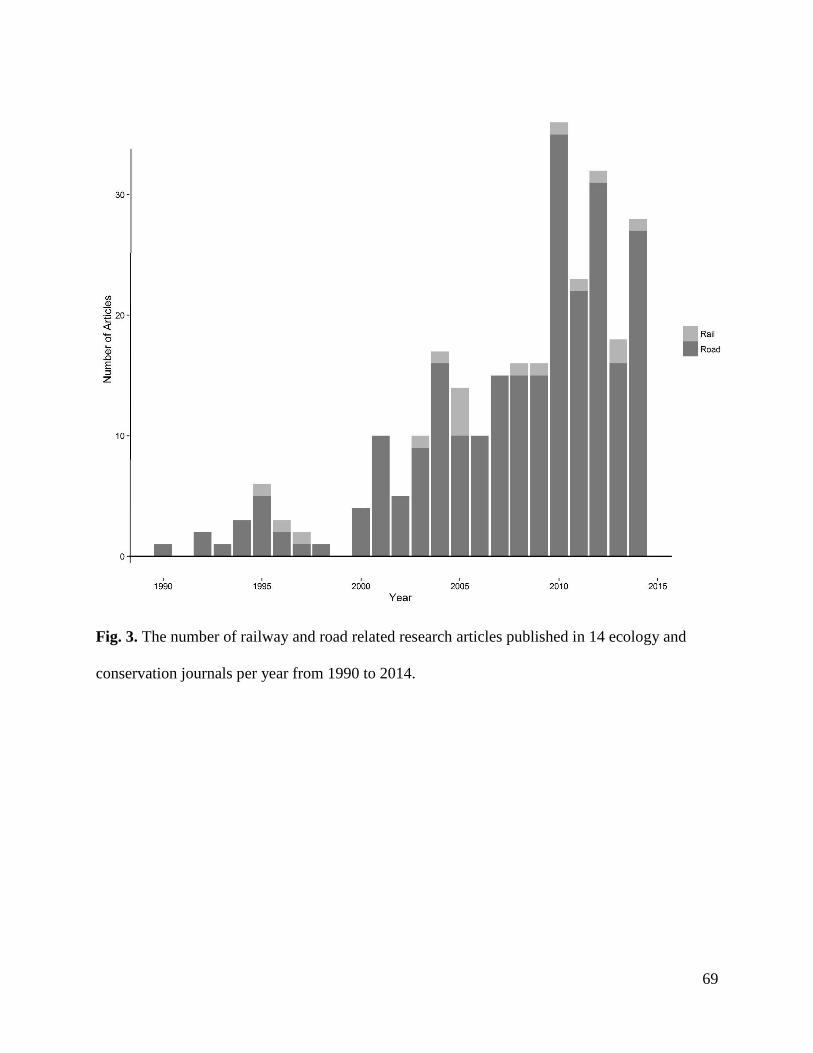
69
Fig. 3. The number of railway and road related research articles published in 14 ecology and
conservation journals per year from 1990 to 2014.
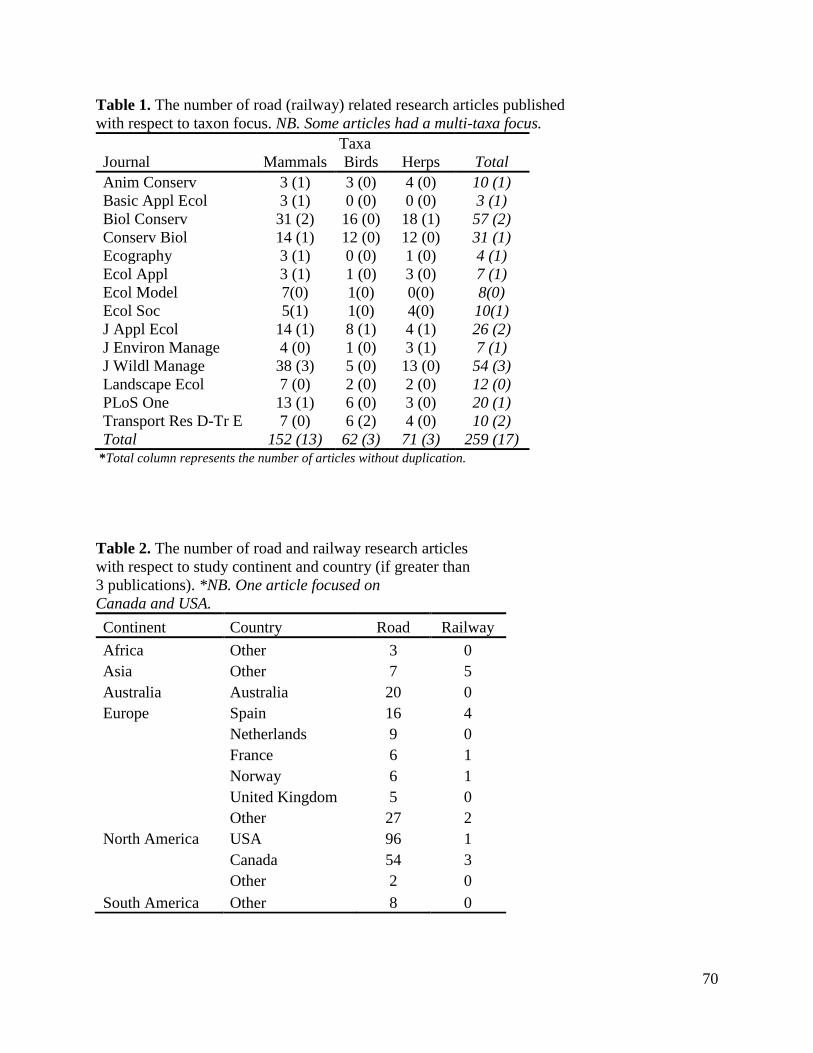
70
Table 1. The number of road (railway) related research articles published
with respect to taxon focus. NB. Some articles had a multi-taxa focus.
Taxa
Journal Mammals Birds Herps Total
Anim Conserv 3 (1) 3 (0) 4 (0) 10 (1)
Basic Appl Ecol 3 (1) 0 (0) 0 (0) 3 (1)
Biol Conserv 31 (2) 16 (0) 18 (1) 57 (2)
Conserv Biol 14 (1) 12 (0) 12 (0) 31 (1)
Ecography 3 (1) 0 (0) 1 (0) 4 (1)
Ecol Appl 3 (1) 1 (0) 3 (0) 7 (1)
Ecol Model 7(0) 1(0) 0(0) 8(0)
Ecol Soc 5(1) 1(0) 4(0) 10(1)
J Appl Ecol 14 (1) 8 (1) 4 (1) 26 (2)
J Environ Manage 4 (0) 1 (0) 3 (1) 7 (1)
J Wildl Manage 38 (3) 5 (0) 13 (0) 54 (3)
Landscape Ecol 7 (0) 2 (0) 2 (0) 12 (0)
PLoS One 13 (1) 6 (0) 3 (0) 20 (1)
Transport Res D-Tr E 7 (0) 6 (2) 4 (0) 10 (2)
Total 152 (13) 62 (3) 71 (3) 259 (17) *Total column represents the number of articles without duplication.
Table 2. The number of road and railway research articles
with respect to study continent and country (if greater than
3 publications). *NB. One article focused on
Canada and USA.
Continent Country Road Railway
Africa Other 3 0
Asia Other 7 5
Australia Australia 20 0
Europe Spain 16 4
Netherlands 9 0
France 6 1
Norway 6 1
United Kingdom 5 0
Other 27 2
North America USA 96 1
Canada 54 3
Other 2 0
South America Other 8 0
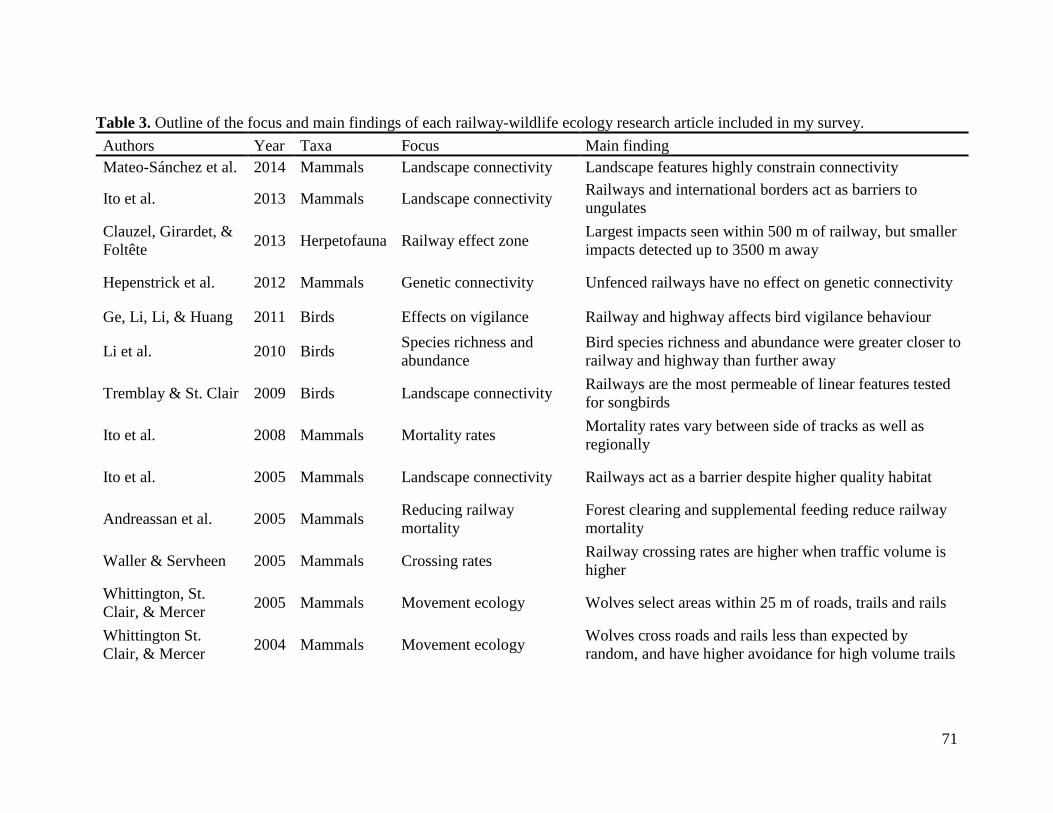
71
Table 3. Outline of the focus and main findings of each railway-wildlife ecology research article included in my survey.
Authors Year Taxa Focus Main finding
Mateo-Sánchez et al. 2014 Mammals Landscape connectivity Landscape features highly constrain connectivity
Ito et al. 2013 Mammals Landscape connectivity Railways and international borders act as barriers to
ungulates
Clauzel, Girardet, &
Foltête 2013 Herpetofauna Railway effect zone
Largest impacts seen within 500 m of railway, but smaller
impacts detected up to 3500 m away
Hepenstrick et al. 2012 Mammals Genetic connectivity Unfenced railways have no effect on genetic connectivity
Ge, Li, Li, & Huang 2011 Birds Effects on vigilance Railway and highway affects bird vigilance behaviour
Li et al. 2010 Birds Species richness and
abundance
Bird species richness and abundance were greater closer to
railway and highway than further away
Tremblay & St. Clair 2009 Birds Landscape connectivity Railways are the most permeable of linear features tested
for songbirds
Ito et al. 2008 Mammals Mortality rates Mortality rates vary between side of tracks as well as
regionally
Ito et al. 2005 Mammals Landscape connectivity Railways act as a barrier despite higher quality habitat
Andreassan et al. 2005 Mammals Reducing railway
mortality
Forest clearing and supplemental feeding reduce railway
mortality
Waller & Servheen 2005 Mammals Crossing rates Railway crossing rates are higher when traffic volume is
higher
Whittington, St.
Clair, & Mercer 2005 Mammals Movement ecology Wolves select areas within 25 m of roads, trails and rails
Whittington St.
Clair, & Mercer 2004 Mammals Movement ecology
Wolves cross roads and rails less than expected by
random, and have higher avoidance for high volume trails
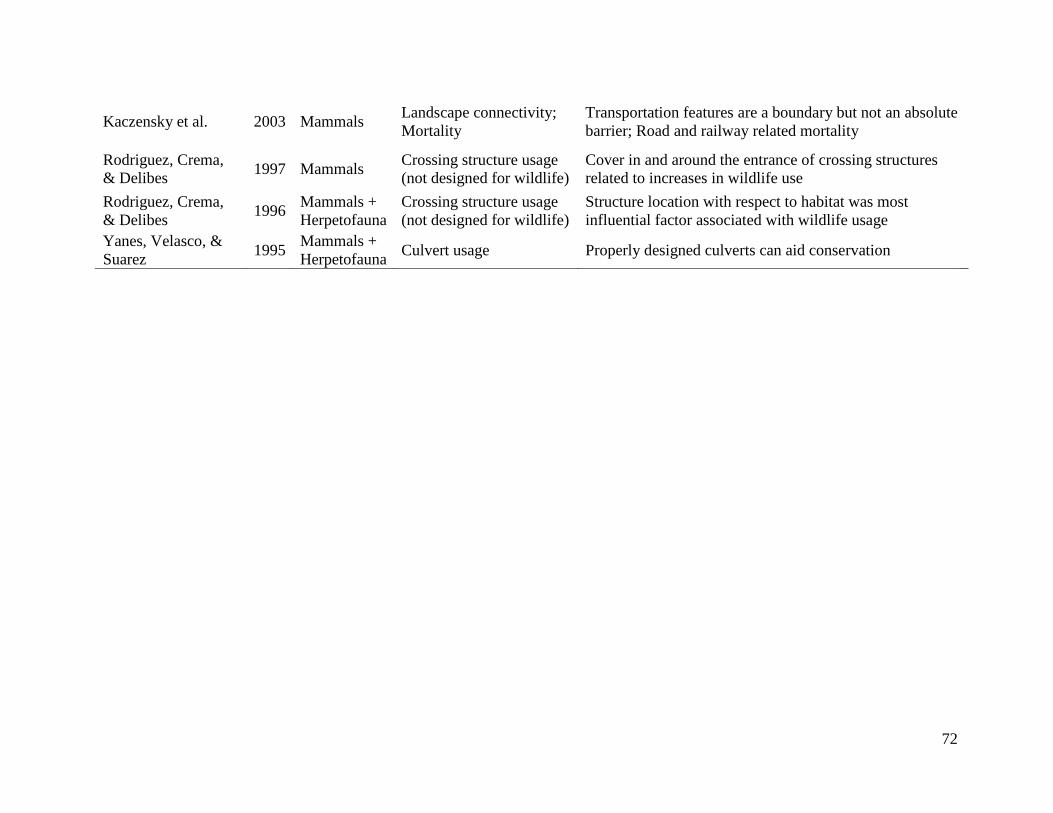
72
Kaczensky et al. 2003 Mammals Landscape connectivity;
Mortality
Transportation features are a boundary but not an absolute
barrier; Road and railway related mortality
Rodriguez, Crema,
& Delibes 1997 Mammals
Crossing structure usage
(not designed for wildlife)
Cover in and around the entrance of crossing structures
related to increases in wildlife use
Rodriguez, Crema,
& Delibes 1996
Mammals +
Herpetofauna
Crossing structure usage
(not designed for wildlife)
Structure location with respect to habitat was most
influential factor associated with wildlife usage
Yanes, Velasco, &
Suarez 1995
Mammals +
Herpetofauna Culvert usage Properly designed culverts can aid conservation
73
Discussion
Railways: an underappreciated threat?
The linear footprint of railways is relatively small in comparison to roads (~1:42; Dulac 2013);
however, situations exist in which roads have been shown to be more ecologically damaging
than railways, and vice versa. For example, wildlife road mortality has been shown to be greater
on both roads (Heske 2015) and railways (Becker and Grauvogal 1991). Further, the size of the
global railway network is expected to increase due to its reduced requirement for carbon based
energy sources (Dulac 2013). While environmentally this may prove to be valuable, we still
know very little about the effects railways have on wildlife. Both basic and applied research
regarding the effects of railways on wildlife exist; however, among the journals assessed, only
6% of road- and railway-wildlife studies were focused on railways. Among the small number of
railway-wildlife articles, study focus areas differed substantially, suggesting that although some
progress is being made in this branch of ecology, abundant information is lacking with respect to
all ecological areas. With respect to railways, applied research has focussed on assessing
mitigation of wildlife-train-collisions with strategies consisting of wildlife crossing structures,
supplemental feeding stations, altered habitat, exclusion systems, and train speed reduction
(Dorsey et al. 2015). While mitigation of wildlife-train-collision is important, other negative
effects may exist and the gap in my knowledge regarding basic ecology hampers my ability to
mitigate these potential threats effectively. Movement ecology and landscape connectivity are
better represented than other fields, but research focussed on mitigation and especially on
74
population level effects are very limited. Due to this limited scope of research, my general
understanding of complex interactions occurring across the landscape is hindered.
In my review, mammals were the most studied taxon with respect to both roads and railways
followed by birds and herpetofauna. Other taxa, although not included in this study, would likely
demonstrate similar trends regarding road and railway wildlife research. The majority of railway
related mammal studies were focussed on ungulates (33%) (Andreassan et al. 2005; Hepenstrick
et al. 2012; Ito et al. 2005, 2008, 2013) and bears (25%) (Kaczensky et al. 2003; Mateo-Sánchez
2014; Waller and Servheen 2005). Many large mammal species have economic importance as
tourist attractions or harvestable resources; however human safety has undoubtedly played a role
in the proliferation of road ecology research on mammals (Huijser et al. 2008). In comparison to
wildlife-vehicle-collisions, human injuries are likely to occur much less frequently in wildlife-
train-collisions which may contribute to the lack of railway ecology research.
In contrast to large mammals, small mammals and other taxa have received relatively little
attention in terms of wildlife-railway research (but see van der Grift 1999). Railways have been
noted to trap and potentially lead to overheating of smaller vertebrates between the tracks
(Kornilev et al. 2006). Railways may also act as an ecological trap if mortality occurs, as for
example, several species of freshwater turtle are attracted to railway beds in order to nest (Ernst
and Lovich 2009). During ecological surveys, small animals are likely less detectable than large
mammals due to their size, the potential for deflection into the adjacent habitat, and because they
are likely more easily removed by scavengers. These potential limitations likely contribute to
75
the relative rarity of railway studies involving small animals. The effects of railways can be
evaluated using techniques other than visual monitoring, which could be especially helpful in
relation to small mammal research. For example, the use of telemetry, genetics, and adjacent
habitat surveys can inform my understanding of the spatial ecology, population diversity and
demographics, as well as sub-lethal effects associated with railways. Studies that focus on
smaller taxa, especially those that are species at risk, or have important ecological roles, may be
critical to conservation initiatives.
Investigating the effects of railways on multiple species or taxa is especially important because
as with roads (Carr and Fahrig 2001; van der Grift et al. 2013), the effects of railways should not
be generalized among species. For example, railways have been shown to act as barriers to some
species of wildlife (i.e.: Marbled salamanders (Bartoszek and Greenwald 2009); Mongolian
gazelles (Ito et al. 2013)), while others utilize railways as corridors, especially during seasonal
migration when snow depths increase (i.e.: moose (Andreassan et al. 2005); moose, elk, deer
(Rea et al. 2010)).
Advancing railway ecology
Due to the theoretical overlap between road and railway ecology, many of the lessons learned by
road ecologists can be applied to railway research. The development of baseline understanding
is critical for mitigation success (Lesbarrères and Fahrig 2012; Rytwinski et al. 2015). Railway
Ecology poses several unique difficulties which need to be overcome in order to advance as a
76
branch of Transportation Ecology. Railway studies are under-developed likely due in part to a
lack of related available funding (Dorsey et al. 2015). As stated previously, the desire to ensure
human safety in the event of wildlife-vehicle collisions likely warrants additional funding for
road related research (Huijser et al. 2008). In addition, due to railway locations often being
uneasily accessed, railway mortalities are rarely viewed by the public, reducing the potential for
public concern, and thus political will. Further, the difficult to access nature of many railways
increases the difficulty of data collection. Many monitoring methods used by road ecologists can
be readily adapted to railway studies. For example, trail cameras (Mann et al. 2015; Rowcliffe
and Carbone 2008; Rowcliffe et al. 2014) or snow-tracking are reliable methods used to observe
mammal distributions in road ecology projects (Alexander et al. 2005; Alexander 2008). To
access more remote regions of railways, collaboration with railway companies may allow for
transportation arrangements (e.g.: hi-rail passenger railway vehicle).
Arguably the most important step in advancing railway ecology is to engage cooperation with
railway companies or owners as permission and safety training is often required to access
railway properties. Access to private lands is not an uncommon consideration when designing
experiments in nature. The difficulty arises when experiments are directly aimed (or are
perceived to aim) at identifying negative effects of private landowner activities, because such
studies could lead to increased environmental regulation and eventual loss of income. Benefit to
public image may be enough in some situations to warrant cooperation with companies,
especially in highly lucrative endeavours (i.e. resource extraction). However, in areas where
public image is not necessarily an important factor (i.e. railways), strategies for conservation
based on incentives for private landowners to set independent conservation practices have been a
77
popular approach (Merenlender et al. 2004). It is critical to the advancement of railway ecology
that as scientists we use the scientific method properly. Vilifying the effects of railways may be
counterproductive to increasing research along railways in situations where landowners want to
avoid additional regulations. Rather, investigating effects, whether good or bad (roads have been
shown to benefit some wildlife – see: Rytwinski and Fahrig 2012, 2013), and developing an
understanding of the complex interactions railways have with wildlife should be the main goal.
Conclusion
Railways facilitate a well-established mode of transportation and will have a substantially
increased world-wide footprint in the near future. The effects of railways on wildlife are poorly
understood. Although lessons learned from road ecology can shed some light on the form these
effects may take, their magnitude remains uncertain. The underrepresentation of railways in both
basic and applied research has given rise to only a limited understanding of the baseline ecology
of wildlife near railways. This vague baseline makes the planning and implementation of
responsible and informed development including mitigation, much more difficult. The inability
to address such effects may have profound repercussion on wildlife populations, especially in
relation to species in need of conservation. Although ecologists may be faced with many
challenges in developing wildlife-railway research programs, it is essential, and possible, that
these issues are overcome. By further developing ‘Railway Ecology’ ecologists can focus on this
immense worldwide footprint and potentially enormous magnitude of impacts on wildlife. In my
opinion, it is time we start addressing this issue.
78
Literature Cited
Alexander, S.M. 2008. Snow-tracking and GIS: using multiple species-environment models to
determine optimal wildlife crossing sites and evaluate highway mitigation plans on the
Trans-Canada Highway. The Canadian Geographer 52: 169–187.
Alexander, S.M., Paquet, P.C., Logan, T.B., and Saher, D.J. 2005. Snow-tracking versus
radiotelemetry for predicting wolf-environment relationships in the Rocky Mountains of
Canada. Wildlife Society Bulletin 33: 1216–1224.
Andreassan, H.P., Gunderson, H., and Storaas, T. 2005. The effect of scent-marking, forest
clearing, and supplemental feeding on moose–train collisions. Journal of Wildlife
Management 69: 1125–1132.
Bartoszek, J. and Greenwald, K.R. 2009. A population divided: Railroad tracks as barriers to
gene flow in an isolated population of marbled salamanders (Ambystoma opacum).
Herpetological Conservation and Biology 4: 191–197.
Baxter-Gilbert, J.H., Riley, J.L., Neufeld, C.J.H., Litzgus, J.D., and Lesbarrères, D. 2015. Road
mortality potentially responsible for billions of pollinating insect deaths annually. Journal of
Insect Conservation 19: 1029–1035.
Becker, E.F. and Grauvogal, C.A. 1991. Relationship of reduced train speed on moose-train
collsions in Alaska. Alces 27: 161–168.
Beebee, T.J.C. 2013. Effects of road mortality and mitigation measures on amphibian
populations. Conservation Biology, 27: 657–668.
Benítez-López, A., Alkemade, R., and Verweij, P.A. 2010. The impacts of roads and other
infrastructure on mammal and bird populations : A meta-analysis. Biological Conservation
79
143: 1307–1316.
Beyer, H.L., Ung, R., Murray, D.L., and Fortin, M.-J. 2013. Functional responses, seasonal
variation and thresholds in behavioural responses of moose to road density. Journal of
Applied Ecology 50: 286–294.
Brooks, T.M., Mittermeier, R.A., Mittermeier, C.G., Gustavo, A.B., Rylands, A.B., Konstant,
W.R., Flick, P., Pilgrim, J., Oldfield, S., Magin, G., and Hilton-Taylor, C. 2002. Habitat loss
and extinction in the hotspots of biodiversity. Conservation Biology 16: 909–923.
Brown, C.R. and Bomberger Brown, M. 2013. Where has all the road kill gone? Current Biology
23: R233–R234.
Carr, L.W. and Fahrig, L. 2001. Effect of road traffic on two amphibian species of differeing
vagility. Conservation Biology 15: 1071–1078.
Clauzel, C., Girardet, X., and Foltête, J.-C. 2013. Impact assessment of a high-speed railway line
on species distribution: application to the European tree frog (Hyla arborea) in Franche-
Comté. Journal of Environmental Management 12: 125–34.
Dananay, K.L., Krynak, K.L., Krynak, T.J., and Benard, M.F. 2015. Legacy of road salt:
Apparent positive larval effects counteracted by negative post-metamorphic effects in wood
frogs. Environmental Toxicology and Chemistry 34: 2417–2424.
Dorsey, B.P. 2011. Factors affecting bear and ungulate mortalities along the Canadian Pacific
Railroad through Banff and Yoho National Parks. M.Sc. thesis. Montana State University.
Dorsey, B.P., Olsson, M., and Rew, L.J. 2015. Ecological effects of railways on wildlife. In: van
der Ree, R., Grilo, C. and Smith, D. (eds.). Handbook of Road Ecology. Pp. 219–227.
Wiley-Blackwell.
Dulac, J. 2013. Global land transport infrastructure requirements: estimating road and railway
80
infrastructure capacity and costs to 2050. International Energy Agency.
Ernst, C.H. and Lovich, J.E. 2009. Turtles of the United States and Canada (2nd ed.). Baltimore,
Maryland: John’s Hopkins University Press.
Forman, R.T.T. 2000. Estimate of the area affected ecologically by the road system in the United
States. Conservation Biology 14: 31–35.
Forman, R.T.T. 2003. Road ecology: science and solutions. Island Press.
Gaston, K.J., Bennie, J., Davies, T.W., and Hopkins, J. 2013. The ecological impacts of
nighttime light pollution: A mechanistic appraisal. Biological Reviews 88: 912–927.
Ge, C., Li, Z., Li, J., and Huang, C. 2011. The effects on birds of human encroachment on the
Qinghai-Tibet Plateau. Transportation Research Part D: Transport and the Environment 16:
604–606.
Gibbons, J.W., Scott, D.E., Ryan, T.J., Buhlmann, K.A., Tuberville, T.D., Metts, B.S., Greene,
J.L., Mills, T., Leiden, Y., Poppy, S., and Winne, C. T. 2000. The global decline of reptiles,
déjà vu amphibians. BioScience 50: 653–666.
Gibbs, J.P. and Shriver, W.G. 2005. Can road mortality limit populations of pool-breeding
amphibians? Wetlands Ecology and Management 13: 281–289.
Gunderson, H. and Andreassen, H.P. 1998. The risk of moose Alces alces collision: A predictive
logistic model for moose-train accidents. Wildlife Biology 4: 103–110.
Hepenstrick, D., Holdregger, R., and Gugerli, F. 2012. Genetic discontinuities in roe deer
(Capreolus capreolus) coincide with fenced trasnportation infrastructure. Basic and Applied
Ecology 13: 631–638.
Heske, E.J. 2015. Blood on the Tracks : Track Mortality and Scavenging Rate in Urban Nature
Preserves. Urban Naturalist 4: 1–13.
81
Huijser, M.P., Mcgowan, P., Fuller, J., Hardy, A., Kociolek, A., Clevenger, A.P., Ament, R.
2008. Wildlife-vehicle collision reduction study. Report to congress. U.S. Department of
Transportation, Federal Highway Administration. Washington.
Ito, T.Y., Lhagvasuren, B., Tsunekawa, A., Shinoda, M., Takatsuki, S., Buuveibaatar, B., and
Chimeddorj, B. 2013. Fragmentation of the habitat of wild ungulates by anthropogenic
barriers in Mongolia. PLoS ONE 8: 1–13.
Ito, T.Y., Miura, N., Lhagvasuren, B., Enkhbileg, D., Takatsuki, S., Tsunekawa, A., and Jiang, Z.
2005. Preliminary evidence of a barrier effect of a railroad on the migration of Mongolian
gazelles. Conservation Biology 19: 945–948.
Ito, T.Y., Okada, A., Buuveibaatar, B., Lhagvasuren, B., Takatsuki, S., and Tsunekawa, A. 2008.
One-sided barrier impact of an international railroad on mongolian gazelles. Journal of
Wildlife Management 72: 940–943.
Jackson, N.D. and Fahrig, L. 2011. Relative effects of road mortality and decreased connectivity
on population genetic diversity. Biological Conservation 144: 3143–3148.
Jaren, V., Anderson, R., Ulleberg, M., Pedersen, P.H., and Wiseth, B. 1991. Moose-train
collisions: the effects of vegetation removal with a cost-benefit analysis. Alces 27: 93–99.
Kaczensky, P., Knauer, F., Krze, B., Jonozovic, M., Adamic, M., and Gossow, H. 2003. The
impact of high speed, high volume traffic axes on brown bears in Slovenia. Biological
Conservation 111: 191–204.
Kociolek, A.V., Clevenger, A.P., St. Clair, C.C., and Proppe, D.S. 2011. Effects of road
networks on bird populations. Conservation Biology 25: 241–249.
Kornilev, Y.V., Price, S.J., and Dorcas, M.E. 2006. Between a rock and a hard place: Responses
of eastern box turtles (Terrapene carolina) when trapped between railroad tracks.

82
Herpetological Review 37: 145–148.
Laurance, W.F., Clements, G.R., Sloan, S., O’Connell, C.S., Mueller, N.D., Goosem, M.,
Edwards, D.P., Phalan, B., Balmford, A., Van der Ree, R., Arrea, I.B. 2014. A global
strategy for road building. Nature 513: 229–232.
Lee, M.A., Davies, L., and Power, S.A. 2012. Effects of roads on adjacent plant community
composition and ecosystem function: An example from three calcareous ecosystems.
Environmental Pollution 163: 273–280.
Lesbarrères, D. and Fahrig, L. 2012. Measures to reduce population fragmentation by roads:
what has worked and how do we know? Trends in Ecology and Evolution 27: 374–380.
Li, Z., Ge, C., Li, J., Li, Y., Xu, A., Zhou, K., and Xue, D. 2010. Ground-dwelling birds near the
Qinghai-Tibet highway and railway. Transportation Research Part D: Transport and the
Environment 15: 525–528.
Mader, H. 1984. Animal habitat isolation by roads and agricultural fields. Biological
Conservation 29: 81–96.
Mann, G.K.H., O’Riain, M.J., and Parker, D.M. 2015. The road less travelled: assessing
variation in mammal detection probabilities with camera traps in a semi-arid biodiversity
hotspot. Biodiversity and Conservation 24: 531–545.
Mateo-Sánchez, M.C., Cushman, S.A., and Saura, S. 2014. Connecting endangered brown bear
subpopulations in the Cantabrian Range (north-western Spain). Animal Conservation 17:
430–440.
McClure, C.J.W., Ware, H.E., Carlisle, J., Kaltenecker, G., and Barber, J.R. 2013. An
experimental investigation into the effects of traffic noise on distributions of birds: avoiding
the phantom road. Proceedings of the Royal Society B 280: 1–9.
83
McLellan, B. and Shackleton, D. 1988. Grizzly bears and resource-extraction industries: effects
of roads on behaviour, habitat use and demography. Journal of Animal Ecology 25: 451–
460.
Merenlender, A.M., Huntsinger, L., Guthey, G., and Fairfax, S.K. 2004. Land trusts and
conservation easements: who is conserving what for whom? Conservation Biology 18: 65–
75.
Muñoz, P.T., Torres, F.P., and Megías, A.G. 2014. Effects of roads on insects: a review.
Biodiversity and Conservation 24: 659–682.
Owen, D.A.S., Carter, E.T., Holding, M.L., Islam, K., and Moore, I.T. 2014. Roads are
associated with a blunted stress response in a North American pit viper. General and
Comparative Endocrinology 202: 87–92.
Rea, R.V, Child, K.N., and Aitken, D.A. 2010. YoutubeTM insights into moose-train
interactions. Alces 46: 183–187.
Rodriguez, A., Crema, G., and Delibes, M. 1996. Use of non-wildlife passages across a high
speed railway by terrestrial vertebrates. The Journal of Applied Ecology 33: 1527–1540.
Rodriguez, A., Crema, G., and Delibes, M. 1997. Factors affecting crossing of red foxes and
wildcats through non-wildlife passages across a high-speed railway. Ecography 20: 287–
294.
Rowcliffe, J.M., and Carbone, C. 2008. Surveys using camera traps : are we looking to a brighter
future ? Animal Conservation 11: 185–186.
Rowcliffe, J.M., Kays, R., Kranstauber, B., Carbone, C., and Jansen, P.A. 2014. Quantifying
levels of animal activity using camera trap data. Methods in Ecology and Evolution 5:
1170–1179.

84
Rytwinski, T. and Fahrig, L. 2015. The impacts of roads and traffic on terrestrial animal
populations. In: van der Ree, R., Grilo, C., and Smith, D. (eds.), Handbook for Road
Ecology. Pp: 237–246. Wiley-Blackwell.
Rytwinski, T., van der Ree, R., Cunnington, G.M., Fahrig, L., Findlay, C.S., Houlahan, J.,
Jaeger, J.A.G., Spanes, K., van der Grift, E.A. 2015. Experimental study designs to improve
the evaluation of road mitigation measures for wildlife. Journal of Environmental
Management 154: 48–64.
Tremblay, M.A. and St. Clair, C.C. 2009. Factors affecting the permeability of transportation and
riparian corridors to the movements of songbirds in an urban landscape. Journal of Applied
Ecology 46: 1314–1322.
van der Grift, E.A. 1999. Mammals and railroads: impacts and management implications. Lutra
42: 77–98.
van der Grift, E.A., van der Ree, R., Fahrig, L., Findlay, S., Houlahan, J., Jaeger, J.A.G., Olson,
L. 2013. Evaluating the effectiveness of road mitigation measures. Biodiversity and
Conservation 22: 425–448.
van der Ree, R., Jaeger, J.A.G., van der Grift, E.A., and Clevenger, A.P. 2011. Effects of roads
and traffic on wildlife populations and landscape function: Road ecology is moving toward
larger scales. Ecology and Society 16: 48.
Waller, J.S. and Servheen, C. 2005. Effects of transportation on grizzly bears in Northwestern
Montana. Journal of Wildlife Management 69: 985–1000.
Ware, H.E., McClure, C.J.W., Carlisle, J.D., and Barber, J.R. 2015. A phantom road experiment
reveals traffic noise is an invisible source of habitat degradation. Proceedings of the
National Academy of Sciences of the United States of America 112: 12105–12109.

85
Whittington, J., St. Clair, C.C., and Mercer, G. 2005. Spatial responses of wolves to roads and
trails in mountain valleys. Ecological 15: 543–553.
Yanes, M., Velasco, J.M., and Suarez, F. 1995. Permeability of roads and railways to vertebrates:
The importance of culverts. Biological Conservation 71: 217–222.
86
Chapter 5
Railway mortality of reintroduced elk: an assessment of spatial, temporal, and
environmental influences
Abstract
Human infrastructure affects wildlife in many ways and has led to world-wide habitat loss and
degradation, which are leading causes of wildlife population decline. Understanding the effects
of railways on wildlife, an aspect of ecology that is highly underrepresented in science, is a
crucial component of the development of management and conservation strategies. Wildlife-train
collisions have resulted in the deaths of many species and gathering baseline information is
imperative to the development of effective mitigation, especially for at-risk or small reintroduced
populations such as elk in eastern North America. Train collisions are the greatest known source
of mortality for a small isolated elk population in Ontario, Canada. I used a combination of
radio-telemetry and remote camera surveys to investigate spatial relationships between railways
and elk. Elk were closer to the railway in winter than in any other season. Cows (with or without
calves) and yearlings of both sexes were found directly on the railway in most seasons, but
utilized the railway most frequently during the spring and fall. Bulls were only found on the
railway during summer. Elk-train collisions were highly site-specific, significantly closer to the
apex of bends in the railway than random locations along the railway, and collision rates were
positively related to snow depth. Railways may be perceived by elk as easy travel corridors, and
deep snow likely prohibits escape from oncoming trains. My study gathered important

87
information about an under-studied aspect of wildlife-human conflicts and provides a basis for
the investigation of other species that may be affected by railways.
88
Introduction
Global areas that harbour significant regions of species diversity are often favoured by humans,
creating land use conflict, one of the most important challenges for conservation biologists today
(Balmford et al. 2001a,b; Luck et al. 2004). Human infrastructure affects wildlife in several ways
and has led to population declines of many species world-wide through habitat loss and
degradation (Gibbons et al. 2000; Brooks et al. 2002). Direct and indirect effects of human
infrastructure can have a variety of influences on many species of wildlife. For example, in
addition to roads directly affecting wildlife through fragmenting habitat (Jackson and Fahrig
2011), vehicle collision mortality is common (Beebee 2013; Jackson and Fahrig 2011). Indirect
effects of roads on wildlife are extensive and include examples such as noise (McClure et al.
2013; Ware et al. 2015), chemical (Dannay et al. 2015), and light pollution (Gaston et al. 2013).
Of the many human infrastructures known to adversely affect wildlife populations, impacts
associated with railways are one of the least studied, especially in comparison to the effects of
roads on wildlife (Popp and Boyle 2017). Railways have a worldwide footprint of
approximately 1 million km which is predicted to rise 45% by 2050 (Dulac 2013). It is important
that ecologists increase their focus on investigating the potential effects of railways on wildlife in
order to ensure adequate management and conservation, especially for species at risk or small
populations.
89
Many species of wildlife have been victims of train collisions while using railways (Gundersen
and Andreassen 1998; van der Grift 1999; Bertwhistle 2001; Andreassen et al. 2005; Iosif 2012;
Kusta et al. 2014; Dasgupta and Ghosh 2015). Such mortalities can have severe impacts on
animal populations. For example, during the winter of 1989-1990 the moose (Alces alces)
population in lower Susitna Valley, Alaska, was reduced by 35% due to a combination of poor
winter survival, car collisions, hunting, and railway mortalities, where train collisions alone
accounted for approximately 60% of investigated mortalities (Becker and Grauvogel 1991).
Railway effects on wildlife can be highly species-specific. For example, railways can be
beneficial to some species such as moose, allowing for easier travel, especially in winters with
great snow depth (Andreassan et al. 2005; Rea et al. 2010), while for other species such as
Marbled salamanders or Mongolian gazelles, railways can act as a barrier to movement
(Baroszek and Greenwald 2009; Ito et al. 2013).
Although not yet investigated, reintroduced species may be particularly vulnerable to the effects
of railways. Translocations are often restricted to a small number of individuals, which may
become at risk if further reduced in size, potentially leading to significant impacts of stochastic
events (Gilpin and Soulé 1986). Monitoring programs that identify and quantify causes of
mortality for small populations are necessary in order to gather baseline information and to
design mitigation strategies for ensuring that population sizes increase to sustainable levels.
Given the impacts railways may have on wildlife, as apparent from the limited number of studies
available, further monitoring the effects of railways on wildlife populations is warranted.
90
Elk are a native species in North America, which were extirpated from most of their range during
the 19th century, and have since been reintroduced in several locations over the past century
(Popp et al. 2014). Although several reintroduced elk populations thrive, others are struggling to
increase growth rates (Popp et al. 2014). The Burwash elk population in Ontario, Canada was
first reintroduced in the 1930’s (Ranta 1979). A remnant population of 40-50 animals was
boosted by 172 elk imported from Elk Island National Park, Alberta between 1998 and 2001
(Popp et al. 2014, Rosatte et al. 2007). The current population estimate is approximately 150
individuals and train collisions are one of the leading causes of mortality (Popp et al. 2014). It is
not well understood under what conditions and how frequently elk use railways throughout the
year. The timing and locations of elk-train collisions are also of interest.
I investigated the effects of railways on elk to better understand how this human-based
infrastructure impacts local populations and to develop science-based recommendation for
mitigating elk-train collisions. I focused on the spatial, temporal, and environmental components
related to the effects of railways on elk by investigating 1) the importance of railways as a source
of mortality for elk; 2) the influence of season on the proximity of elk to the railway; 3) the
existence of elk-train collision spatial hotspots; and 4) the effects of weather and topography on
collision rates.
91
Methods
Study area
The study area consisted of the Burwash elk core population range in Ontario, Canada, which
encompassed approximately 20 km of railway. The area was situated in the Great Lakes-St.
Lawrence Ecotonal Forest Region (Rowe 1972) comprised mainly of mixed conifer-hardwood
forest (Chambers et al. 1996). Topography was characteristic of Precambrian Shield and
included rugged outcrops, valleys, and many water bodies including marshes, swamps, and
bogs/fens (Popp et al. 2013). In addition, open abandoned fields; remnants of a historical
correctional facility/industrial farm were present throughout the study area. Climate in the region
was continental with average winter snow depth of 28 cm (Environment Canada Historical data:
mean of December to February 1981-2010).
Elk mortality
Annual causes of elk mortalities were documented from 2002 to 2015 for elk fitted with VHF
radio-collars (Lotek Engineering LMRT 4 with motion sensitive mortality sensors) and for non-
collared elk, documented opportunistically. In addition, every March or April from 2002 to 2015,
subsequent to snow thaw, winter elk-train collision mortalities were counted and the locations
recorded along a 20 km stretch of railway that bisects the elk core population range. During the
survey, observers walked the railway and recorded new carcasses or body parts found. In
addition, railway workers randomly called in mortalities that had been discovered
92
opportunistically. In total, 189 elk mortalities from all investigated sources were recorded over
14 years.
Elk seasonal proximity to railway
In order to determine if elk proximity to the railway differed among seasons, 12 female elk
previously fitted with VHF radio-collars (Lotek Engineering LMRT 4 with motion sensitive
mortality sensors) were tracked 1 – 3 times per week from 2012 to 2014 from the ground with a
Lotek SRX 400 telemetry receiver. To reduce triangulation error, at least three compass bearings
were obtained for each elk location from various high points within the elk population range
(White and Garrot 1990). Because elk are gregarious in nature, I used the software “Association”
(Weber et al. 2001) to ensure individual movements were independent from each other.
Parameters were set to consider females associated (or non-independent) if they spent more than
60% of their time within 250 m of one another. Seasons were defined based on elk behaviour
where “Winter” included the months of January to March, “Spring” included April to June,
“Summer” included July to September, and “Fall” included October to December (Popp et al.
2013). I calculated the mean distance of each elk during each season to the railway using ArcGIS
v.10.1. I used a repeated measures ANOVA and a post-hoc Tukey HSD test to determine if elk
were significantly closer to the railway in any particular season.
Elk railway usage
From the beginning of July 2015 to the end of June 2016, 10 trail cameras were placed along the
20 km stretch of railway bisecting the elk range, one every 2 km, attached to trees growing

93
alongside the railway and directly facing the railway. Cameras were set to record a burst of 3
images when motion was detected and were set to stop recording images for 5 minutes after the
initial burst to prevent an excess of train photos. Camera batteries and cards were replaced every
1-3 months depending on the season. Because elk are gregarious in nature, regardless of the
number of elk in an image, one photo was considered a single elk capture event and the total
number of bull or cow (with or without calves or yearlings) capture events were documented per
season. To reduce the chance of resampling the same animals, capture events within one hour
from the initial capture were not included.
Elk-train collisions: mortality hotspots, topography, and weather
I used the program SIRIEMA v 1.1.0 (SIREMA 2011) and elk-train collision data from 2002-
2015 to conduct Linear Hotspot Identification analyses using Ripley K-Statistics to identify elk-
train collision hotspots (areas where collisions occurred more often than expected). This
software, has been used for road hotspot identification (Coelho et al. 2012; Teixeira et al. 2013),
but has not yet been applied to railway hotspots to my knowledge. I examined the number of
hotspots using two approaches: 1) Kill Events: all elk mortalities involved in a
specific incident were reported as a single event for analytical purposes (gregarious nature
predisposes elk to multiple kills at one location), and 2) Number of Kills (Kills): the number of
elk mortalities arising from each event at a particular location were used to gain a better
understanding of where single-event losses would most impact the elk population.

94
From personal observations over time, elk kill events appeared to cluster around bends in the
railway, therefore a t-test was performed to determine if elk kill events were significantly closer
to the apex of bends of <135 degrees than an equal number of random points along the railway
(N = 44). Because trains travel only in a north-to-south direction along this section of railway,
the distance to the northernmost bend apex was calculated.
To determine if elk-train mortality was correlated with winter weather conditions, the number of
elk mortality events was related to the mean monthly snow depth and the mean temperature over
the months of December to February (Environment Canada Historical Data) using regression
analyses. All statistical analyses were conducted using the ‘R’ statistical software v.3.0.1 (R
Core Team 2013).
Results
Elk mortality
The greatest source of elk mortality since the most recent reintroduction were train collisions.
Although the proportion of mortality due to train collisions ranged from 0 to 100% of annual
losses, the mean percentage of train collisions was greatest in comparison to all other causes of
mortality (Table 1).
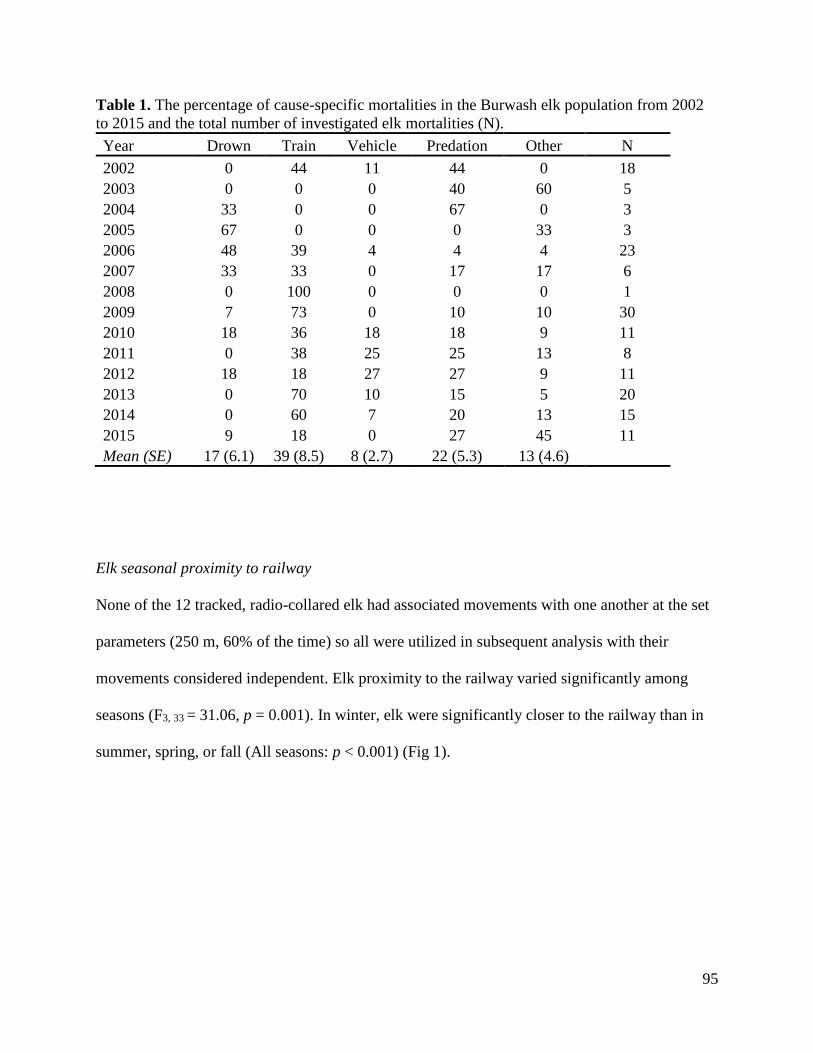
95
Table 1. The percentage of cause-specific mortalities in the Burwash elk population from 2002
to 2015 and the total number of investigated elk mortalities (N).
Year Drown Train Vehicle Predation Other N
2002 0 44 11 44 0 18
2003 0 0 0 40 60 5
2004 33 0 0 67 0 3
2005 67 0 0 0 33 3
2006 48 39 4 4 4 23
2007 33 33 0 17 17 6
2008 0 100 0 0 0 1
2009 7 73 0 10 10 30
2010 18 36 18 18 9 11
2011 0 38 25 25 13 8
2012 18 18 27 27 9 11
2013 0 70 10 15 5 20
2014 0 60 7 20 13 15
2015 9 18 0 27 45 11
Mean (SE) 17 (6.1) 39 (8.5) 8 (2.7) 22 (5.3) 13 (4.6)
Elk seasonal proximity to railway
None of the 12 tracked, radio-collared elk had associated movements with one another at the set
parameters (250 m, 60% of the time) so all were utilized in subsequent analysis with their
movements considered independent. Elk proximity to the railway varied significantly among
seasons (F3, 33 = 31.06, p = 0.001). In winter, elk were significantly closer to the railway than in
summer, spring, or fall (All seasons: p < 0.001) (Fig 1).
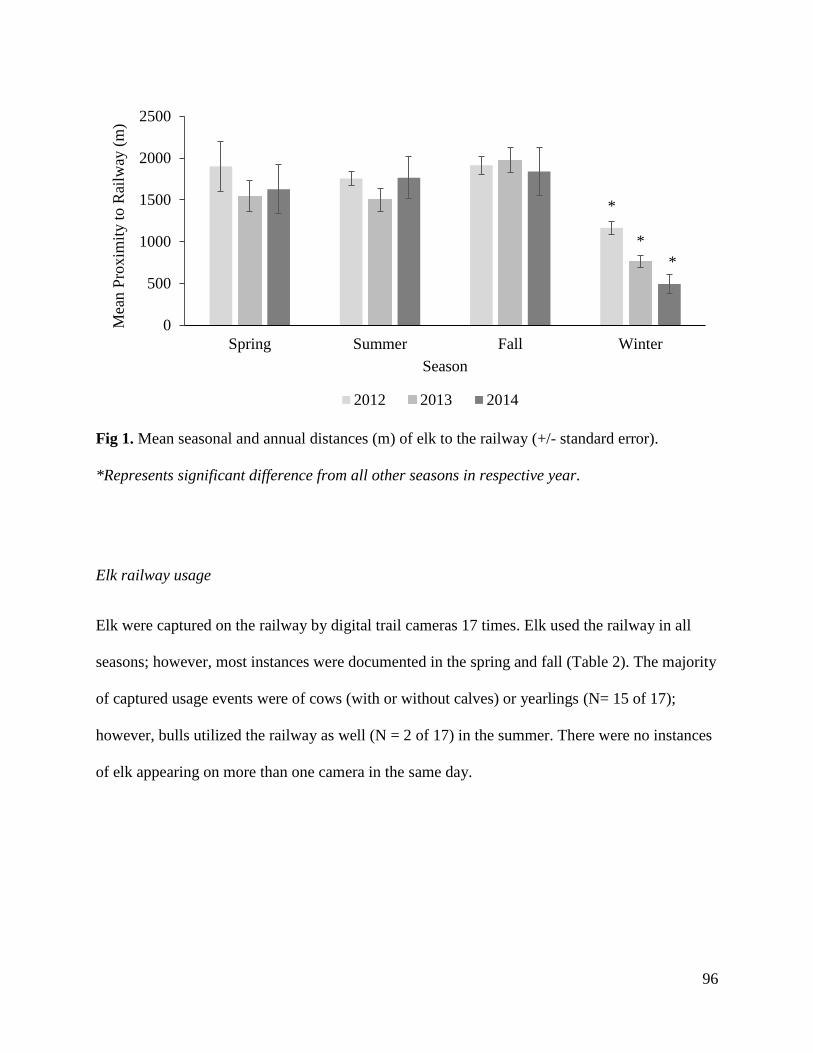
96
Fig 1. Mean seasonal and annual distances (m) of elk to the railway (+/- standard error).
*Represents significant difference from all other seasons in respective year.
Elk railway usage
Elk were captured on the railway by digital trail cameras 17 times. Elk used the railway in all
seasons; however, most instances were documented in the spring and fall (Table 2). The majority
of captured usage events were of cows (with or without calves) or yearlings (N= 15 of 17);
however, bulls utilized the railway as well (N = 2 of 17) in the summer. There were no instances
of elk appearing on more than one camera in the same day.
0
500
1000
1500
2000
2500
Spring Summer Fall Winter
Mea
n P
rox
imit
y t
o R
ailw
ay (
m)
Season
2012 2013 2014
*
*
*

97
Table 2. Total number of cow (with or without calves or yearlings)
and bull trail camera capture events from 10 cameras set up
along a 20 km stretch of railway bisecting the elk range.
Sex Spring Summer Fall Winter
Bull 0 2 0 0
Cow 7 0 7 1
All 7 2 7 1
Elk-train collisions: mortality hotspots, topography, and weather
In total, 67 elk-train collision mortalities (Kills) were recorded over the 14-year survey period,
resulting in 44 mortality event locations (Kill Events) that varied geographically (Fig 2). Upon
examining elk kill events, I found 5 hotspots, most adjacent to each other and within a 2 km span
of one another (Fig 3a). When considering the number of elk that died during each kill event
(Kill Events), I found 7 hotspots spread over approximately 5 km (Fig 3b) with the majority of
“Kills” hotspots overlapping the “Kill Event” hotspots (Fig 2). The majority of hotspots were
located along bends in the railway section that was monitored (Fig 2). “Kill Event” locations
were significantly closer (1358 m +/- 186 m) to the apex of bends (<135 degrees) than were
random locations (3800 m +/- 627 m) along the railway (p < 0.001).
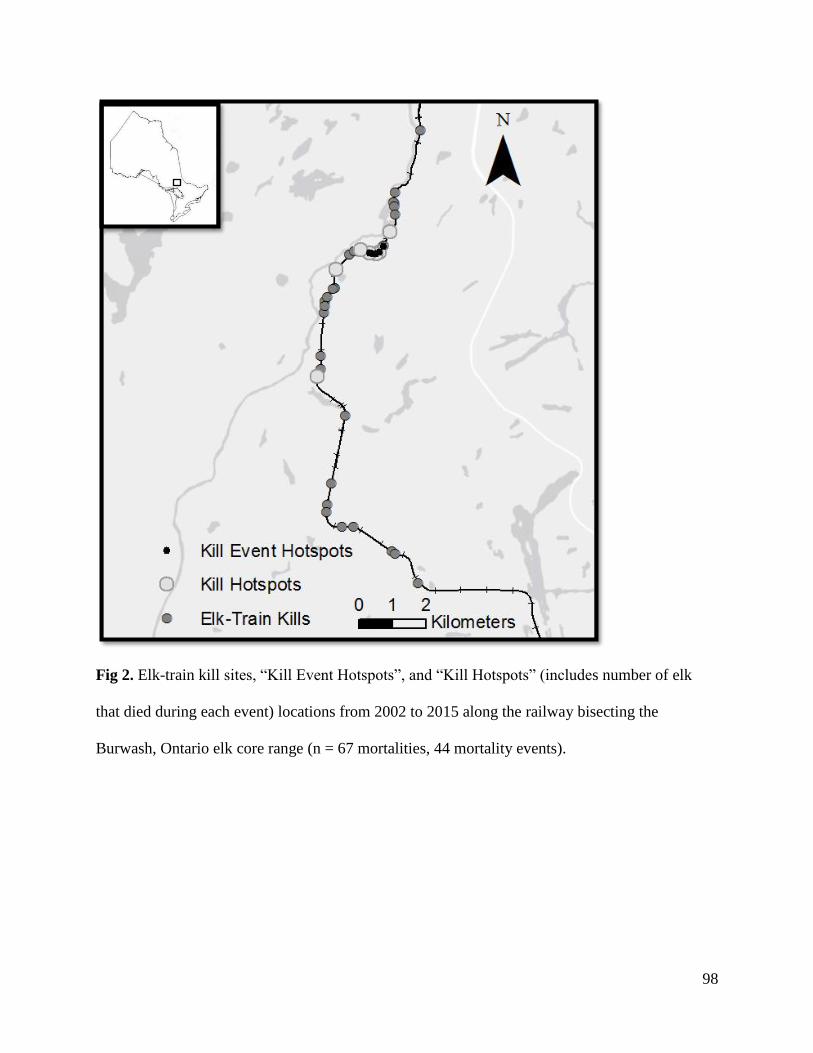
98
Fig 2. Elk-train kill sites, “Kill Event Hotspots”, and “Kill Hotspots” (includes number of elk
that died during each event) locations from 2002 to 2015 along the railway bisecting the
Burwash, Ontario elk core range (n = 67 mortalities, 44 mortality events).
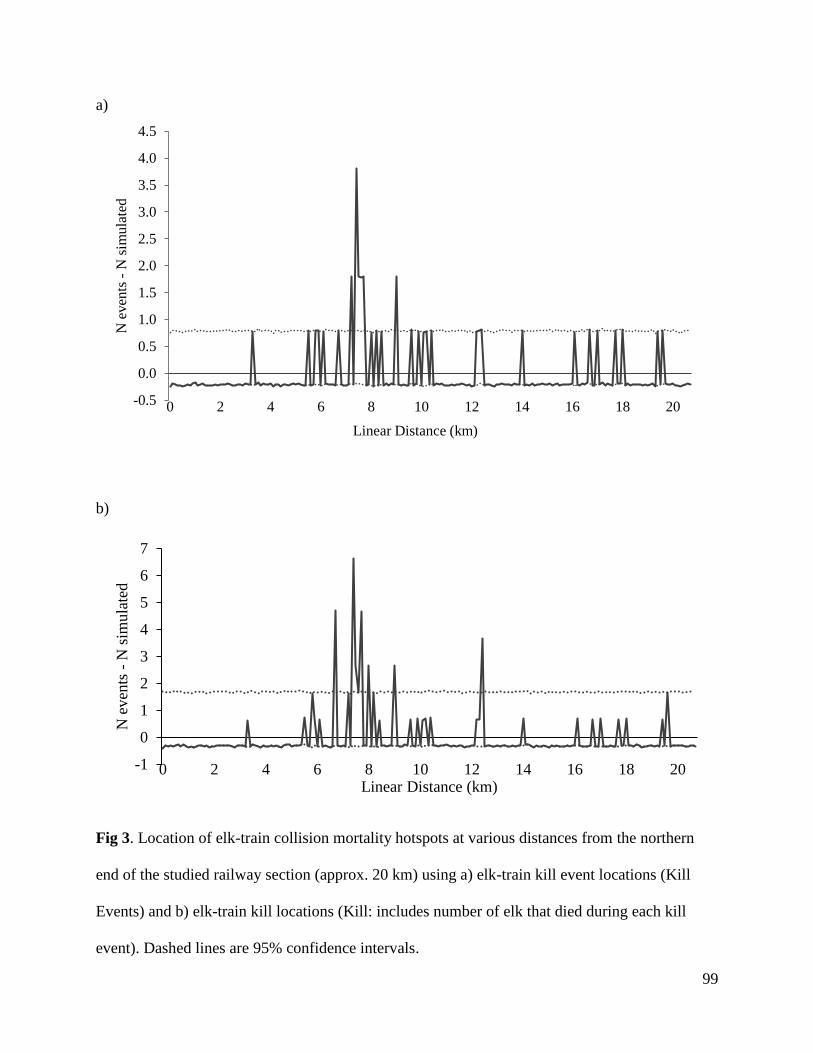
99
a)
b)
Fig 3. Location of elk-train collision mortality hotspots at various distances from the northern
end of the studied railway section (approx. 20 km) using a) elk-train kill event locations (Kill
Events) and b) elk-train kill locations (Kill: includes number of elk that died during each kill
event). Dashed lines are 95% confidence intervals.
-0.5
0.0
0.5
1.0
1.5
2.0
2.5
3.0
3.5
4.0
4.5
0 2 4 6 8 10 12 14 16 18 20
N e
ven
ts -
N s
imu
late
d
Linear Distance (km)
-1
0
1
2
3
4
5
6
7
0 2 4 6 8 10 12 14 16 18 20
N e
ven
ts -
N s
imula
ted
Linear Distance (km)
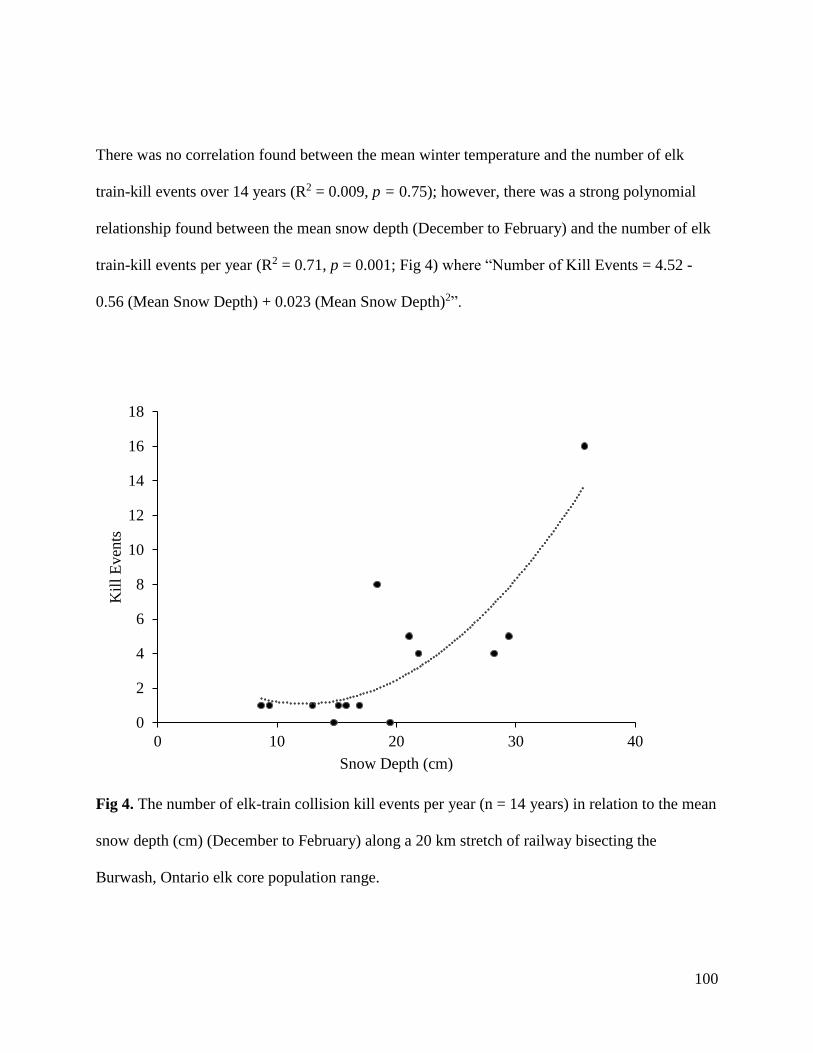
100
There was no correlation found between the mean winter temperature and the number of elk
train-kill events over 14 years (R2 = 0.009, p = 0.75); however, there was a strong polynomial
relationship found between the mean snow depth (December to February) and the number of elk
train-kill events per year (R2 = 0.71, p = 0.001; Fig 4) where “Number of Kill Events = 4.52 -
0.56 (Mean Snow Depth) + 0.023 (Mean Snow Depth)2”.
Fig 4. The number of elk-train collision kill events per year (n = 14 years) in relation to the mean
snow depth (cm) (December to February) along a 20 km stretch of railway bisecting the
Burwash, Ontario elk core population range.
0
2
4
6
8
10
12
14
16
18
0 10 20 30 40
Kil
l E
ven
ts
Snow Depth (cm)
101
Discussion
Train collisions were the greatest source of mortality for the Burwash elk population since the
recent reintroduction 15 years ago. I found prominent trends in temporal, spatial, and
environmental factors in relation to elk-railway usage, proximity, and elk-train collisions rates.
Female elk were significantly closer to the railway in winter than in any other season and were
found utilizing the railway most during the spring and fall. The close proximity to the railway in
winter is likely an artifact of the close location of their wintering grounds to the railway. The
shift in usage rates of the railway coincides with seasonal movements of elk between summer
and winter ranges in the spring and fall. Similarly, in Norway, moose-train collisions occurred
mainly in winter when moose migrated to winter ranges that were close to the railway (Jaren et
al. 1991; Gundersen et al. 1998). Bertwhistle (2001) found that collision rates increased when
other large mammals migrated to winter ranges that were adjacent to transportation corridors
(i.e.: roads and railways). When migration occurs in winter and snow depths may impede
movement, animals may use railways as travel routes with less physical resistance (i.e.: shallow
snow) in accordance with Zipf’s (1949) Law of Least Effort. Although the majority of elk I
found utilizing the railway were cows (with or without calves) or yearlings, bulls were also
found on the railway during the summer. Bull elk in the Burwash population utilize different
regions than cows during seasons outside of the rut. My study focused on cow elk, which may
explain why bulls were seldom captured on the monitored portion of railway.

102
Although I found elk utilizing the railway mostly in the spring and fall, I did not have the
capacity to survey every section of railway and likely did not capture every usage event. In
addition, my camera data were restricted to one year of sampling. Over 14 years of railway
mortality monitoring, I found that the number of elk-train collisions were highly correlated with
snow depth. Increased train collision rates in deeper snow conditions has been a pattern also
found for moose (Gunderson and Andreassen 1998; Gundersen et al. 1998). Because I found elk
utilizing railways during all seasons, I suspect that deep snow along the railway augmented by
railway plowing, may discourage elk from leaving the railway when trains approach. This is a
trend that has also been identified with moose (Child 1983; Muzzi and Bisset 1990). Railway
footage has shown that moose followed by trains appear to be trapped by deep snow banks along
the railway sides (Rea 2010).
It is well documented that elk mortality rates increase and recruitment rates and population
growth decrease when snow depths increase (Garrot et al. 2003; Hebblewhite et al. 2002; Creel
and Creel 2009; Johnson et al. 2013). Greater snow depths allow more opportunity for predators
with light foot-loads when prey movement is restricted (Telefer and Kelsall 1984), especially
when prey animals are in poor nutritional condition due to increased energy expenditure (Gese
and Grothe 1995). Coupled with limited forage opportunities in winter, increased energy
expenditure due to restriction of movement in deep snow is likely to leave elk seeking easy travel
corridors. Increased forage opportunities along railways may also be related to increased winter
train collision rates. When animal movement becomes restricted and energy expenditure
approaches high levels, obtaining adequate calories is essential to survival. Jaren et al. (1991)

103
suggested that forage along railways seemed to attract moose, causing them to stay longer and
closer to the railway.
Train collisions have been site-specific in moose (Gundersen et al. 1998) and in turtles (Iosif
2012). Elk-train collisions were highly site-specific in my study resulting in several
“hotspots” generated by examining kill event locations and by including the number of elk
killed during each event. There were more hotspots identified when the numbers of elk killed in
each event were included. This may suggest that elk travelling in groups are sometimes restricted
from escaping the railway when trains appear in certain areas. I also found that elk-train collision
sites were significantly closer than random locations to the northernmost apex of bends of < 135
degrees in the railway. Because very little information exists with respect to the effects of
railways on wildlife in general, we can only speculate on some of the relationships between the
two. If elk using the railway are close to a bend in the railway, oncoming train detection may be
limited and could potentially be the cause for the increased number of collisions that were found
close to bends. By understanding where animals are likely to be affected most by trains,
researchers can further investigate factors influencing kill rates and develop appropriate
mitigation strategies. Having a focal point with relative predictive certainty of use would
facilitate testing and speed up the development of various mitigation measures.
I highly recommend that train collision mortality be considered in all studies of factors
influencing the population dynamics of wildlife. Because different species are likely to display a
variety of responses to railways, I recommend species-specific studies, especially when

104
considering species at risk or small reintroduced populations. As displayed by my example with
elk, it is important to consider temporal, spatial, and various environmental aspects of railway
relationships to wildlife. By determining how railways influence the dynamics of a wildlife
populations and identifying factors that are related to such effects, appropriate mitigation
strategies can be developed and tested.
105
Literature Cited
Andreassen, H.P., Gundersen, H., and Storaas, T. 2005. The effect of scent-marking, forest
clearing, and supplemental feeding on moose-train collisions. Journal of Wildlife
Management 69: 1125-1132.
Balmford, A., Moore, J.L., Brooks, T., Burgess, N.D., Hansen, L.A., Williams, P., and Rahbek,
C. 2001a. Conservation conflicts across Africa. Science 291: 2616–2619.
Balmford, A., Moore, J.L., Brooks, T., Burgess, N.D., Hansen, L.A., Lovett, J.C., Tokumine, S.,
Williams, P., and Rahbek, C. 2001b. People and biodiversity in Africa. Science 293: 1591–
1592
Bartoszek, J. and Greenwald, K.R. 2009. A population divided: Railroad tracks as barriers to
gene flow in an isolated population of marbled salamanders (Ambystoma opacum).
Herpetological Conservation and Biology 4: 191–197.
Becker, E.F. and Grauvogal, C.A. 1991. Relationship of reduced train speed on moose-train
collisions in Alaska. Alces 27: 161–168.
Beebee, T.J.C. 2013. Effects of road mortality and mitigation measures on amphibian
populations. Conservation Biology 27: 657–668.
Brooks, T.M., Mittermeier, R.A., Mittermeier, C.G., Gustavo, A.B., Rylands, A.B., Konstant, W.
R., Flick, P., Pilgrim, J., Oldfield, S., Magin, G., and Hilton-Taylor, C. 2002. Habitat loss
and extinction in the hotspots of biodiversity. Conservation Biology 16: 909–923.
106
Chambers, B.K., Legasy, K., and Bentley, C.V. 1996. Forest Plants of Central Ontario. Lone
Pine Publishing.
Child, K.N. 1983. Railways and moose in the central interior of British Columbia: a recurrent
management problem. Alces 19: 118-135.
Coelho, I.P., Teixeira, F.Z., Colombo, P., Coelho, A.V.P., and Kindel, A. 2012. Anuran road-
kills neighboring a peri-urban reserve in the Atlantic Forest, Brazil. Journal of
Environmental Management 112: 17-26.
Creel, S. and Creel, M. 2009. Density dependence and climate effects in Rocky Mountain elk:
An application of regression with instrumental variables for population time series with
sampling error. Journal of Animal Ecology 78: 1291-1297.
Dannay, K.L., Krynak, K.L., Krynak, T.J., and Benard, M.F. 2015. Legacy of road salt: apparent
positive larval effects counteracted by negative post-metamorphic effects in wood frogs.
Environmental Toxicology and Chemistry 34: 2417–2424.
Dasgupta, S. and Ghosh, A.K. 2015. Elephant–railway conflict in a biodiversity hotspot:
determinants and perceptions of the conflict in northern west Bengal, India. Human
Dimensions of Wildlife: An International Journal 20: 81-94.
Dulac, J. 2013. Global land transport infrastructure requirements: Estimating road and railway
infrastructure capacity and costs to 2050. International Energy Agency - Report. 1-54.
Garrot, R.A., Eberhardt, L.L., White, P.J., and Rotella, J. 2003. Climate-induced variation in
vital rates of an unharvested large-herbivore population. Canadian Journal of Zoology 81: 33-
45.
107
Gaston, K.J., Bennie, J., Davies, T.W., and Hopkins, J. 2013. The ecological impacts of
nighttime light pollution: a mechanistic appraisal. Biological Reviews 88: 912–927.
Gese, E.M. and Grothe, S. 1995. Analysis of coyote predation on deer and elk during winter in
Yellowstone National Park, Wyoming. American Midland Naturalist 133: 36-43.
Gibbons, J.W., Scott, D.E., Ryan, T.J., Buhlmann, K.A., Tuberville, T.D., Metts, B.S., Greene,
J.L., Mills, T., Leiden, Y., Poppy, S., and Winne, C.T. 2000. The global decline of reptiles,
déjà vu amphibians. BioScience 50: 653–666.
Gilpin, M.E. and Soulé, M.E. 1986. Minimum Viable Populations: Processes of Species
Extinction. In: Soulé, M.E. (ed). Conservation Biology: The Science of Scarcity and Diversity
Pp. 19–34. Sunderland, Massachusetts: Sinauer Associates.
Gundersen, H. and Andreassen, H.P. 1998. The risk of moose Alces alces collision: A predictive
logistic model for moose-train accidents. Wildlife Biology 4: 103-110.
Gundersen, H., Andreassen, H.P., and Storaas, T. 1998. Spatial and temporal correlates to
Norwegian moose-train collisions. Alces 34: 385–394.
Hebblewhite, M., Pletsher, D.H., and Paquet, P.C. 2000. Elk population dynamics in areas with
and without predation by recolonizing wolves in Banff National Park, Alberta. Canadian
Journal of Zoology 80: 789-799.
Iosif, R. 2012. Railroad-associated mortality hot spots for a population of Romanian Hermann's
Tortoise (Testudo Hermanni Boettgeri): a gravity model for railroad-segment
analysis. Procedia Environmental Sciences 14: 123-131.
108
Ito, T. Y., Lhagvasuren, B., Tsunekawa, A., Shinoda, M., Takatsuki, S., Buuveibaatar, B., and
Chimeddorj, B. 2013. Fragmentation of the habitat of wild ungulates by anthropogenic
barriers in Mongolia. PLoS One 8: 1–13.
Jackson, N.D. and Fahrig, L. 2011. Relative effects of road mortality and decreased connectivity
on population genetic diversity. Biological Conservation 144: 3143–3148.
Jaren, V., Andersen, R., Ulleberg, M., Pedersen, P.H., and Bjornar, W. 1991. Moose-train
collisions: the effects of vegetation removal with a cost-benefit analysis. Alces 27: 93-99.
Johnson, B.K., Coe, P.K., and Green, R.L. 2013. Abiotic, bottom-up, and top-down influences
on recruitment of Rocky Mountain elk in Oregon: A retrospective analysis. Journal of
Wildlife Management 77: 102-116.
Kusta, T., Hola, M., Keken, Z., Jezek, M., Zika, T., and Hart, V. 2014. Deer on the railway line:
spatiotemporal trends in mortality patterns of roe deer. Turkish Journal of Zoology 38: 479-
485.
Luck, G., Ricketts, T.H., Daily, G.C., and Imhoff, M. 2004. Alleviating spatial conflict between
people and biodiversity. Proceedings of the National Academy of Sciences 101: 182–186.
McClure, C.J.W., Ware, H.E., Carlisle, J., Kaltenecker, G., and Barber, J.R. 2013. An
experimental investigation into the effects of traffic noise on distributions of birds: avoiding
the phantom road. Proceedings of the Royal Society B 280: 1–9.
Muzzi, P.D. and Bisset, A.R. 1990. Effectiveness of ultrasonic wildlife warning devices to
reduce moose fatalities along railway corridors. Alces 26: 37-43.
109
Popp, J.N., McGeachy, D.N., and Hamr, J. 2013. Elk (Cervus elaphus) seasonal habitat selection
in a heterogeneous forest structure. International Journal of Forestry Research 2013: 1-7.
Popp, J.N., Toman, T., Mallory, F.F., and Hamr, J. 2014. A century of elk restoration in eastern
North America. Restoration Ecology 22: 723-730.
Popp, J.N. and Boyle, S.P. (In Press) Railway Ecology: Underrepresented in Science? Basic and
Applied Ecology.
Ranta, W.B. 1979. Range and habitat relationships of wapiti (Cervus canadensis) in the
Burwash-French River area of Ontario. M.Sc. thesis, Carleton University, Ottawa, Ontario.
Rea, R.V, Child, K.N., and Aitken, D.A. 2010. YoutubeTM insights into moose-train interactions.
Alces 46: 183–187.
R Core Team. 2013. R: A language and environment for statistical computing. R Foundation for
Statistical Computing, Vienna, Austria. URL http://www.R-project.org/.
Rosatte, R., Hamr, J. Young, J. Filion, I., and Smith, H. 2007. The restoration of elk (Cervus
elaphus) in Ontario, Canada: 1998–2005. Restoration Ecology 15: 34–43.
Rowe, J.S. 1972. Forest Regions of Canada. Canadian Forest Service, Ottawa, Canada.
Rytwinski, T. and Fahrig, L. 2015. The Impacts of Roads and Traffic on Terrestrial Animal
Populations. In: van der Ree, R., Smith, D.J. and Grilo, C. (eds). Handbook of Road
Ecology. Pp: 237-246. Wiley-Blackwell.
SIRIEMA. 2011. Spatial Evaluation of Road Mortality Software. v. 1.1.0. Federal University of
Rio Grande do Sul State Porto Alegre, RS, Brazil.

110
Teixeira, F.Z., Coelho, I.P., Esperandio, I.B., Oliveira, N.R., Peter, F.P., Dornelles, S.S.,
Delazeri, N.R., Tavares, M., Martins, M.B., and Kindel, A. 2013. Are road-kill hotspots
coincident among different vertebrate groups? Oecologia Australis 17: 36-47.
Telfer, E.S. and Kelsall, J.P. 1984. Adaptation of some large North American mammals for
survival in snow. Ecology 65: 1828-1834.
van der Grift, E.A. 1999. Mammals and railroads: impacts and management implications. Lutra
42: 77-98.
Ware, H.E., McClure, C.J.W., Carlisle, J.D., and Barber, J.R. 2015. A phantom road experiment
reveals traffic noise is an invisible source of habitat degradation. Proceedings of the National
Academy of Sciences of the United States of America 112: 12105–12109.
Weber, K.T., Burcham, M., and Marcum, C.L. 2001. Assessing independence of animal
locations with association matrices. Journal of Range Management 54: 21–24.
White, G.C. and Garrott, R.A. 1990. Analysis of Wildlife Radio-Tracking Data. San Diego,
California: Academic Press.
Zipf, G.K. 1949. Human Behavior and the Principle of Least Effort. Martino Fine Books.
111
Chapter 6
Black bear (Ursus americanus) and wolf (Canis spp.) summer diet composition
and ungulate prey selectivity in Ontario, Canada
Abstract
Understanding predator-prey dynamics is an important component of management strategy
development for at-risk or declining populations that are directly affected by predation.
Ungulates often serve as a significant source of prey for many large mammals, and patterns of
predation are known to influence ungulate population dynamics. Although black bear and wolf
diets have been investigated extensively, prey selectivity has been less commonly examined,
especially in relation to ungulate juveniles. Understanding predator selectivity for ungulate
species can enhance the ability of managers to develop appropriate conservation strategies for
declining ungulate prey populations, as well as contribute to the general understanding of
predator-prey relationships. I examined black bear (Ursus americanus) and wolf (Canis spp.)
prey selectivity in Ontario based on the availability of 3 ungulate species; elk (Cervus elaphus),
moose (Alces alces), and white-tailed deer (Odocoileus virginianus) within the range of the
declining reintroduced Burwash elk population in Ontario. I analyzed the presence of prey items
in black bear and wolf scats collected over 3 years by examining prey hair cuticular scale
patterns. I related predator diet composition to the availability of ungulates, determined by fecal
pellet transect surveys. In addition, non-ungulate diet items were identified to obtain full diet
composition profiles for wolves and black bear. I found that black bear were opportunistic and
did not select for particular ungulate species. Although moose were the more abundant ungulate

112
prey species in the study area, wolves selected for elk and used moose less than expected. White-
tailed deer were used slightly more or less than expected depending on the predicted presence in
the study area over winter.
113
Introduction
Understanding predator-prey relationships is important for identifying focal points for
management of at-risk or declining prey populations. Although predation is considered one of
the leading causes of mortality in many ungulate populations in North America (Schlegel 1976;
Nelson and Mech 1986; Gasaway et al. 1992; Kunkel and Mech 1994; Murrow et al. 2009),
information regarding key predator species is not always readily available to managers. When
predator-prey relationships are poorly understood, uninformed management strategies may lead
to wasted time and money, and potentially to unnecessary pressures on other species of wildlife.
For example, in Yellowstone National Park, wolves were extirpated in the 1930s; however, in
1995 to 1996, 31 wolves were reintroduced into the park (Weaver 1978). Elk counts declined
80% within a decade of wolf reintroduction (White and Garrot 2005), a correlation with the
potential to lead to negative wolf management. However, with further investigation, Barber-
Meyer et al. (2008) found that bear accounted for the greatest proportion of elk calf deaths and
with the incidental increase in bear numbers since wolf restoration, it was suggested that elk
declines were not the result of wolf restoration alone.
Black bear (Ursus americanus) and wolves (Canis lupus) are well known as major ungulate
predators across North America (Bergerud and Page 1986; Gasaway et al. 1992; Kunkel and
Mech 1994; Barber-Meyer et al. 2008; Yarkovich et al. 2011; Wiwchar and Mallory 2012;
Patterson et al. 2013). Although wolves have been identified as having selective diets (Fuller and
Keith 1980; Carbyn 1983; Potvin et al. 1987; Wiwchar and Mallory 2012), bears in general are
114
most often recognized as opportunistic (Bastille-Rousseau et al 2011). However, grizzly bear
actively sought out elk neonates in Yellowstone National Park (Gunther and Renkin 1990).
Black bear are increasingly recognized as important predators of juvenile elk (Schlegel 1976;
Smith and Anderson 1998; Barber-Meyer et al. 2008; Murrow et al. 2009), moose (Franzmann et
al. 1980; Ballard 1992), caribou (Mahoney et al. 1990) and deer (Conger and Guisti 1992;
Vreeland et al. 2004). Diet composition has been well documented for both wolves (Fuller and
Keith 1980; Potvin et al. 1987; Paquet 1992; Barja 2009; Wiwchar and Mallory 2012) and black
bear (Graber and White 1983; Raine and Kansas 1990; Bull and Torgensen 2001; Mosnier et al.
2008); however, it is apparent that diet composition changes among geographical regions and
with differing prey species abundances (Lamothe and Parker 1989; Wiwchar and Mallory 2012;
Newsome et al. 2016). Although several studies have investigated wolf prey selection, few
studies have investigated ungulate prey selection by black bear, especially in relation to juvenile
ungulates. Ungulate juvenile survival is often limited by predation, with bears having large
impacts during the first few weeks following parturition (Ballard et al. 1981; Adams et al. 1995;
Murrow et al. 2009). Juvenile survival and recruitment are the main drivers of large herbivore
population dynamics due to their inherent variability in relation to adult survival (Pimlott 1967,
Galliard et al. 1998; Gaillard et al. 2000, Raithel et al 2007). Based on the large contribution of
juvenile survival to ungulate population trajectories, it is crucial that wildlife managers acquire
reliable information, especially before the initiation of extreme management strategies such as
predator management (Barber-Meyer et al. 2008).
Elk, a common prey species for both wolves and black bear (Carbyn 1983; Mathews and Porter
1988; Barber-Meyer 2008; Murrow et al. 2009; White et al. 2010), have been reintroduced

115
across eastern North America over the past century after being extirpated in the late 19th century
(Popp et al. 2014; Hamr et al. 2016). Several of these populations have declined since
reintroduction, with predation considered one of the leading causes of mortality (Popp et al.
2014). The consideration of predator-prey relationships among bears, wolves, and their prey
species is an important component for developing conservation strategies for declining ungulate
populations elsewhere (Barber-Meyer et al. 2008). As such, understanding predator-prey
relationships for declining elk populations in eastern North America should help guide
management, and also contribute to the general understanding of predator-prey relationships.
I aimed to gain insight regarding predator-prey relations within a multiple predator prey system
in the Burwash region of Ontario, Canada. This region hosts a reintroduced elk population that
has been in decline for several years (Popp et al. 2014). The goal of this study was to determine
if black bear or wolves displayed prey selectivity based on the availability of 3 ungulate species;
elk (Cervus elaphus), moose (Alces alces), and white-tailed deer (Odocoileus virginanus). I
related the relative availability of the three ungulate prey species within my study area to the
composition of ungulate prey in wolf and black bear diets. Additionally, non-ungulate diet items
were also identified to construct more comprehensive diet composition profiles for black bear
and wolves.
116
Methods
Study area
Elk were reintroduced into the Burwash area approximately 30 km south of Sudbury, Ontario in
the 1930s and again between 1998 and 2001 (Rosatte et al. 2007; Popp et al. 2014; Hamr et al.
2016). My study area was based on the core range of the reintroduced population, which I
determined by creating a minimum convex polygon around all radio telemetry locations of 23
adult females. The locations of each radio-collared female had been recorded approximately
once per week from 2008 to 2011, resulting in an approximately 450 km2 study area.
The study area consisted mainly of mixed conifer-hardwood forest of the Great Lakes-St.
Lawrence Ecotonal Forest Region (Rowe 1972; Chambers et al. 1996). Topography included
rugged rock outcrops, valleys, marshes, swamps, and bogs/fens typical of the Precambrian Shield
(Popp et al. 2013) and maximum elevations of 300 m (Jost et al. 1999). Approximately 4000 ha
of abandoned agricultural fields were present throughout the study area, along with several
tertiary roads used for logging or recreational purposes. Regional climate is continental (Ranta
1979) where July, the warmest month of the year, has a 15°C mean temperature (Vankat 1979)
and in January, the coldest month of the year, has a -12.5°C mean temperature (Chambers et al.
1996). The average seasonal (December to February) snow depth in the area was 28 cm from
1980 to 2010 (Environment Canada). Populations of three ungulate species were known to exist
within the study area including elk, moose, and white-tailed deer. The two most common
117
ungulate predators within my study area were black bear and wolves. Due to the “Canis soup” in
the upper Great Lakes region (Wilson et al. 2009), it was difficult to distinguish between wolves
and their coyote hybrids. In light of this, I used the term “wolves” to describe the large canids
and their hybrids that populated my study area. It was estimated that there were 0.2 to 0.3 wolves
per 10 km2 (Kittle et al. 2008) and 2.4 black bear per 10 km2 (OMNR 2014) in the study area.
Predator scat collection
I collected black bear and wolf scats annually from May 1 to August 31, 2013 to 2015. The
spring/summer season was selected as the collection period because of the high sightability of
scats during this time as it was the core period of black bear activity, but also because ungulate
calves are born during this period. I used an ATV to search for scats along approximately 65 km
of unimproved roads that were used for logging and/or recreation that were distributed
throughout the study area. ATV driving speeds were maintained at 10-15 km/hour to ensure
consistent detectability of predator scats. Each road was sampled following two week intervals
and as fresh scats (< 2 weeks old) were collected, the entire scat was removed to eliminate
resampling. Scats were identified and recorded by the same observer to remove bias (Spaulding
et al. 2000). I placed each scat sample in an individually labeled re-sealable plastic bag, and
stored the in a walk-in freezer until processed to identify dietary contents.

118
Hair scale pattern analysis
Identification of prey hair found in predator scat is a common, non-invasive approach used to
investigate mammal diet composition of bears (Graber and White 1983; Raine and Kansas 1990;
Bull and Torgensen 2001), wolves (Fuller and Keith 1980; Potvin et al. 1987; Lamothe and
Parker 1989; Carter 2006; Barja 2009) and many other species (García Alaniz et al. 2010a,
2010b). I removed each scat sample from the freezer approximately 12 hours prior to processing
to allow thawing. Once thawed, I rinsed each scat with water over fine sieves to allow the
retention of coarse organic material; primarily bone fragments and animal hair. Three randomly
selected clusters of hair were pulled from each scat and dried for approximately 12 – 24 hours.
To reduce observer bias, only one person macroscopically assessed the size and colour of
individual dried hairs as well as microscopically by observing hair cuticular scale patterns. To
examine cuticular scale patterns, I applied a thin layer of clear nail polish on a microscope slide
and then placed 3-10 individual guard hairs onto the slide to create an imprint of the hair scales
(Adorian and Kolenosky 1969). Unknown hair scale slides were compared to reference slides
made from guard hairs of museum mammal species known to occur in Ontario and followed
Adorian and Kolenosky’s (1969) guide to further confirm prey species, as well as to differentiate
between adult and juvenile ungulates.
Prey availability
In order to determine the relative prey availability of elk, moose, and white-tailed deer, a fecal
pellet survey was employed (Smith et al. 1969; Forsyth 2005). Fecal pellet counts are useful
indices for determining the relative abundance of ungulates in concealing habitats (Forsyth et al

119
2007), and yield reliable data under most field conditions (Neff 1968). They are commonly used
in North America to estimate ungulate population sizes (Ripple et al. 2001; Patterson et al. 2002;
Hebblewhite et al. 2005). I conducted four fecal pellet transect surveys in the study area over 3
years including: (1) 30 random transects sampled in the fall of 2013; (2) 30 random transects
sampled in the fall of 2014; (3) 30 random transects sampled in the spring of 2014; and (4) 100
random transects sampled in the spring of 2015. It is generally agreed that long narrow fecal
pellet survey plots provide superior results compared to shorter and wider plots (Neff 1968). As
such, I conducted pellet counts along 150 m long transects that began at pre-determined random
locations which were calculated using a range of geographical coordinates in Excel. At each
random transect location, a pre-determined random compass bearing was selected and walked for
the entire 150 m and every 5 m the area within a 1 m radius was examined for ungulate pellets
(Forsyth 2005). Each of the four fecal survey bouts were completed within a 30-day period. I
estimated the date of leaf-off for each transect year to be November 1. I used mean defecation
rates for each ungulate species to determine relative abundances (Neff 1968). The mean
defecation rates per animal per day for white-tailed deer, moose, and elk were 13.20, 13.00, and
11.76 respectively (Neff 1968). The mean defecation rate for elk was determined by calculating
the mean of the two values given in Neff (1968) ((11+12.52)/2). I calculated mean relative
abundances of each ungulate species for each survey using the methodology outlined in Smith et
al. (1969), and used them for subsequent analysis. In addition, because ungulate abundance
calculations assume animals are present in the study area for the entire duration since leaf-off,
and because white-tailed deer (deer) often migrate to winter ranges outside of my study area and
migration timing is unknown but related to snow depth, I calculated the relative abundance of
deer in my study area using two extremes of occurrence; (1) by predicting that deer were present

120
in the study area during the entire study period, and (2) by predicting that deer were completely
absent from the study area every year between January 1 and April 1 (winter).
Data analysis
Carnivores consume fewer hairs of prey items with larger biomass, which may lead to bias in
scat results related to larger mammalian prey (Weaver 1993). Although the frequency of
occurrence of prey items is the most highly utilized metric in predator diet research, results can
be misleading and are often of low ecological significance (Klare et al. 2011). Biomass
calculations using correction factors are the best approximation of true diets according to Klare
et al. (2011). To reduce bias, I applied the Weaver et al. (1993) correction factor to my
occurrence data using the equation: y = 0.439 + 0.008x, where y is the mass of prey per
collectable scat and x is the average body mass of each prey item, which enabled us to determine
the frequency of relative total weight of each prey species in both black bear and wolf diets.
Average prey mass was calculated using the median of ranges given for each mammal species
(except juveniles) following Eder (2002). To determine mass of juvenile ungulates, I used the
median between the average birth mass and median adult mass (Eder 2002) (White-tailed deer:
Verme 1969; Elk: Johnson 1951; Moose: Keech et al. 1999). I performed Chi-squared tests to
determine if black bear and wolves utilized ungulate adult or juvenile prey species significantly
more or less than expected. Prey selection is commonly calculated using the Jacobs’ Index
(Hayward 2006; 2012; Lyngdoh et al. 2014), which I utilized for both black bear and wolves in
relation to ungulate adult and juvenile prey species using the following equation (Jacobs 1974):

121
where, ri is the proportion of species i found among all scat collected for each predator species
and pi is the proportion of ungulate species i available in the study area. Jacobs’ Index values
range from a maximum preference of +1 to a minimum preference of −1 (Boitani and Powell
2012).
Results
Relative abundances
The relative abundances of deer, elk, and moose varied among survey periods (Table 1). Deer
had the lowest relative abundance when predicted to be present within my study area throughout
the year, followed by elk, then moose. However, when deer were assumed not to be present in
the study area from January 1 to April 1, elk had the lowest relative abundance, followed by
deer, then moose.
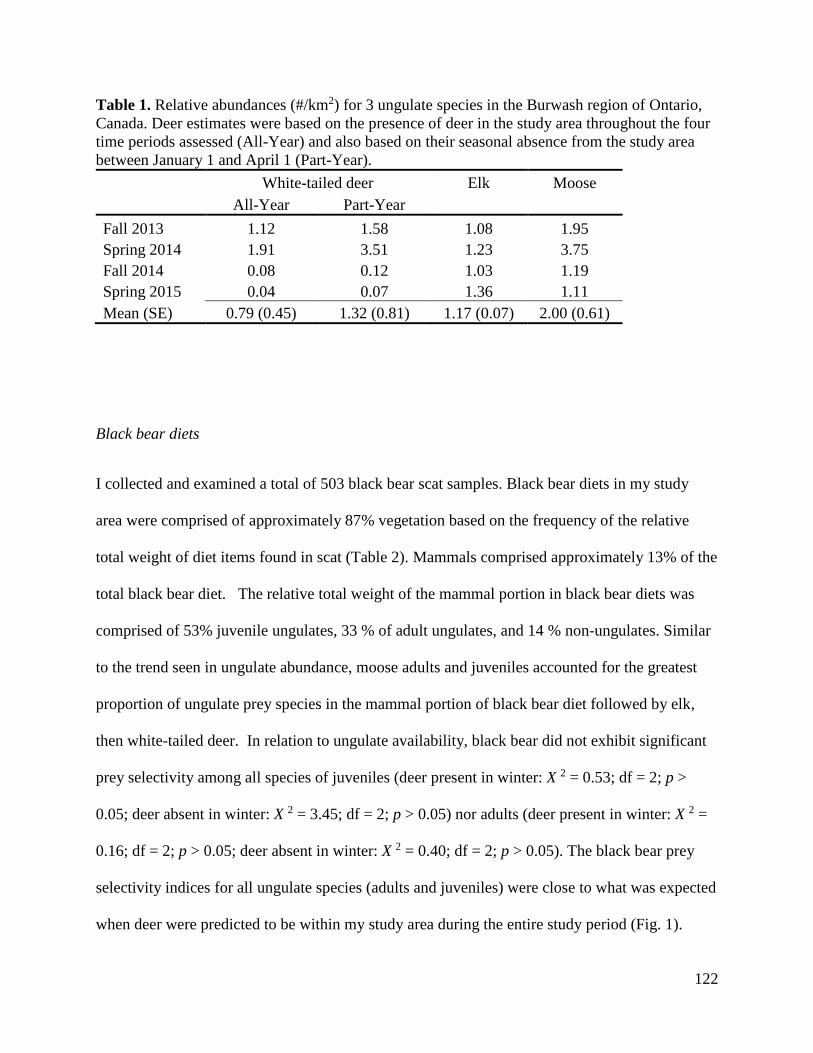
122
Table 1. Relative abundances (#/km2) for 3 ungulate species in the Burwash region of Ontario,
Canada. Deer estimates were based on the presence of deer in the study area throughout the four
time periods assessed (All-Year) and also based on their seasonal absence from the study area
between January 1 and April 1 (Part-Year).
White-tailed deer Elk Moose
All-Year Part-Year
Fall 2013 1.12 1.58 1.08 1.95
Spring 2014 1.91 3.51 1.23 3.75
Fall 2014 0.08 0.12 1.03 1.19
Spring 2015 0.04 0.07 1.36 1.11
Mean (SE) 0.79 (0.45) 1.32 (0.81) 1.17 (0.07) 2.00 (0.61)
Black bear diets
I collected and examined a total of 503 black bear scat samples. Black bear diets in my study
area were comprised of approximately 87% vegetation based on the frequency of the relative
total weight of diet items found in scat (Table 2). Mammals comprised approximately 13% of the
total black bear diet. The relative total weight of the mammal portion in black bear diets was
comprised of 53% juvenile ungulates, 33 % of adult ungulates, and 14 % non-ungulates. Similar
to the trend seen in ungulate abundance, moose adults and juveniles accounted for the greatest
proportion of ungulate prey species in the mammal portion of black bear diet followed by elk,
then white-tailed deer. In relation to ungulate availability, black bear did not exhibit significant
prey selectivity among all species of juveniles (deer present in winter: X 2 = 0.53; df = 2; p >
0.05; deer absent in winter: X 2 = 3.45; df = 2; p > 0.05) nor adults (deer present in winter: X 2 =
0.16; df = 2; p > 0.05; deer absent in winter: X 2 = 0.40; df = 2; p > 0.05). The black bear prey
selectivity indices for all ungulate species (adults and juveniles) were close to what was expected
when deer were predicted to be within my study area during the entire study period (Fig. 1).
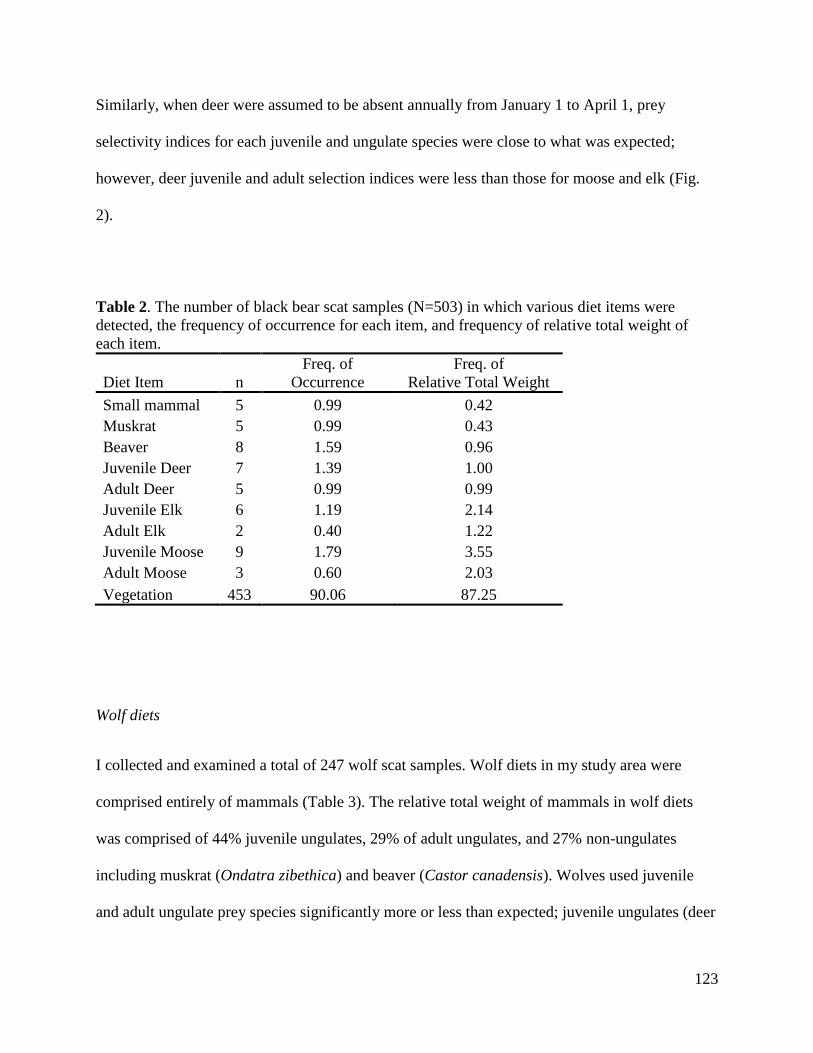
123
Similarly, when deer were assumed to be absent annually from January 1 to April 1, prey
selectivity indices for each juvenile and ungulate species were close to what was expected;
however, deer juvenile and adult selection indices were less than those for moose and elk (Fig.
2).
Table 2. The number of black bear scat samples (N=503) in which various diet items were
detected, the frequency of occurrence for each item, and frequency of relative total weight of
each item.
Diet Item n
Freq. of
Occurrence
Freq. of
Relative Total Weight
Small mammal 5 0.99 0.42
Muskrat 5 0.99 0.43
Beaver 8 1.59 0.96
Juvenile Deer 7 1.39 1.00
Adult Deer 5 0.99 0.99
Juvenile Elk 6 1.19 2.14
Adult Elk 2 0.40 1.22
Juvenile Moose 9 1.79 3.55
Adult Moose 3 0.60 2.03
Vegetation 453 90.06 87.25
Wolf diets
I collected and examined a total of 247 wolf scat samples. Wolf diets in my study area were
comprised entirely of mammals (Table 3). The relative total weight of mammals in wolf diets
was comprised of 44% juvenile ungulates, 29% of adult ungulates, and 27% non-ungulates
including muskrat (Ondatra zibethica) and beaver (Castor canadensis). Wolves used juvenile
and adult ungulate prey species significantly more or less than expected; juvenile ungulates (deer
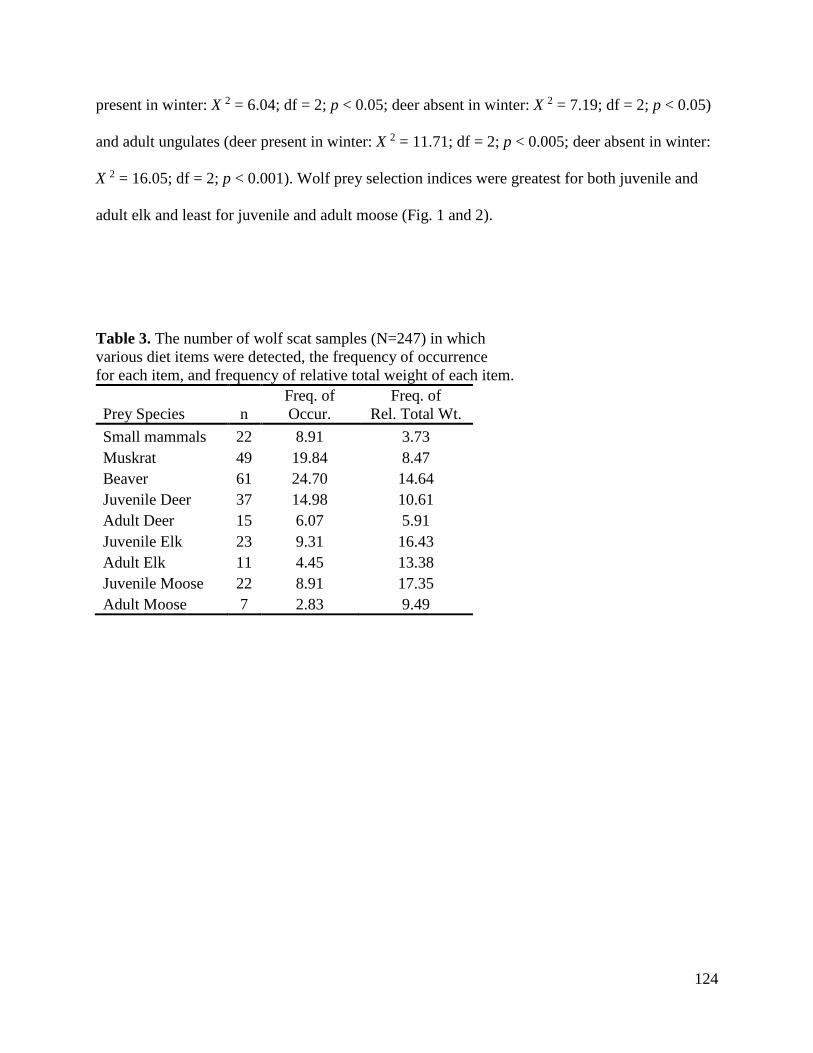
124
present in winter: X 2 = 6.04; df = 2; p < 0.05; deer absent in winter: X 2 = 7.19; df = 2; p < 0.05)
and adult ungulates (deer present in winter: X 2 = 11.71; df = 2; p < 0.005; deer absent in winter:
X 2 = 16.05; df = 2; p < 0.001). Wolf prey selection indices were greatest for both juvenile and
adult elk and least for juvenile and adult moose (Fig. 1 and 2).
Table 3. The number of wolf scat samples (N=247) in which
various diet items were detected, the frequency of occurrence
for each item, and frequency of relative total weight of each item.
Prey Species n
Freq. of
Occur.
Freq. of
Rel. Total Wt.
Small mammals 22 8.91 3.73
Muskrat 49 19.84 8.47
Beaver 61 24.70 14.64
Juvenile Deer 37 14.98 10.61
Adult Deer 15 6.07 5.91
Juvenile Elk 23 9.31 16.43
Adult Elk 11 4.45 13.38
Juvenile Moose 22 8.91 17.35
Adult Moose 7 2.83 9.49
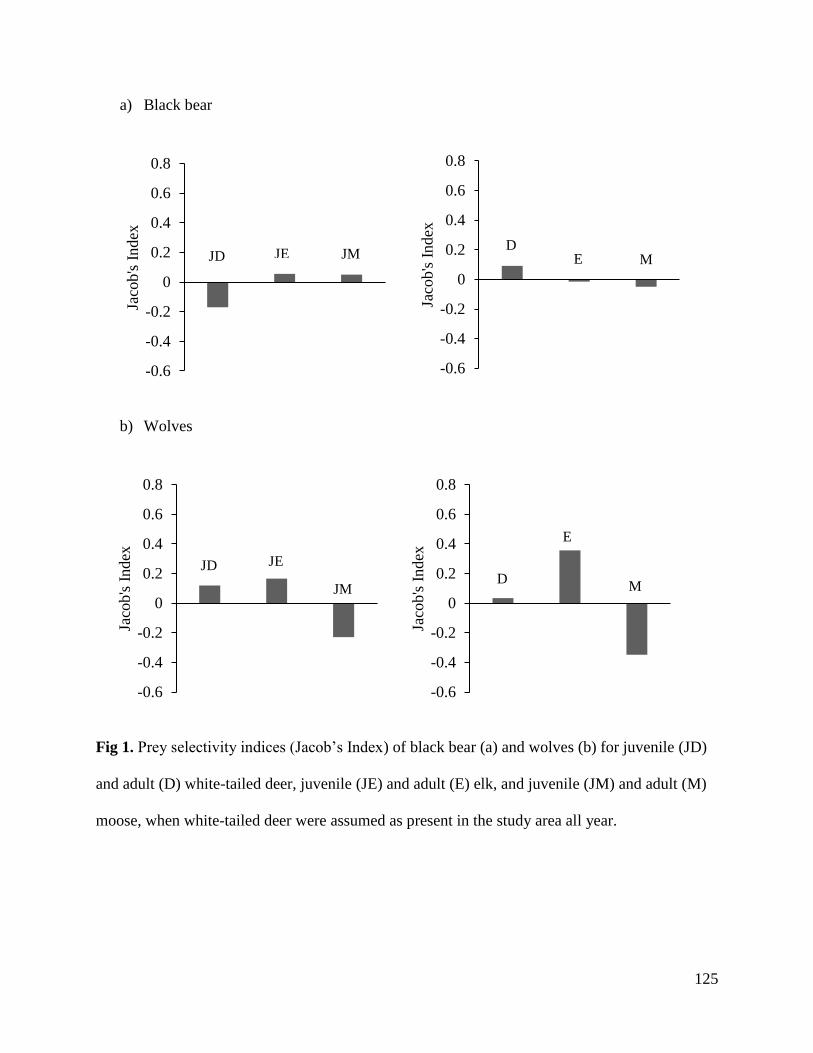
125
a) Black bear
b) Wolves
Fig 1. Prey selectivity indices (Jacob’s Index) of black bear (a) and wolves (b) for juvenile (JD)
and adult (D) white-tailed deer, juvenile (JE) and adult (E) elk, and juvenile (JM) and adult (M)
moose, when white-tailed deer were assumed as present in the study area all year.
-0.6
-0.4
-0.2
0
0.2
0.4
0.6
0.8
Jaco
b's
Index
-0.6
-0.4
-0.2
0
0.2
0.4
0.6
0.8
Jaco
b's
Index
-0.6
-0.4
-0.2
0
0.2
0.4
0.6
0.8
Jaco
b's
Index
-0.6
-0.4
-0.2
0
0.2
0.4
0.6
0.8
Jaco
b's
Index
JD
JD
JE
JE
JM
JM
D
D
E
E
M
M
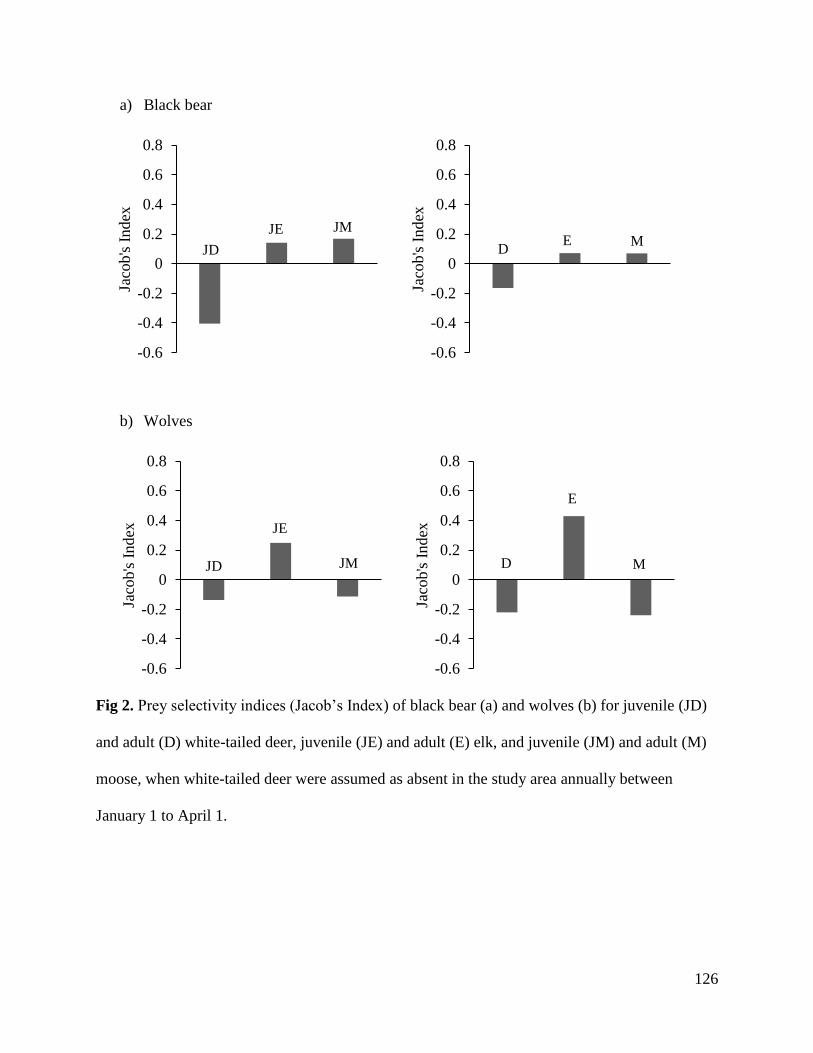
126
a) Black bear
b) Wolves
Fig 2. Prey selectivity indices (Jacob’s Index) of black bear (a) and wolves (b) for juvenile (JD)
and adult (D) white-tailed deer, juvenile (JE) and adult (E) elk, and juvenile (JM) and adult (M)
moose, when white-tailed deer were assumed as absent in the study area annually between
January 1 to April 1.
-0.6
-0.4
-0.2
0
0.2
0.4
0.6
0.8
Jaco
b's
Index
-0.6
-0.4
-0.2
0
0.2
0.4
0.6
0.8
Jaco
b's
In
dex
-0.6
-0.4
-0.2
0
0.2
0.4
0.6
0.8
Jaco
b's
Index
-0.6
-0.4
-0.2
0
0.2
0.4
0.6
0.8
Jaco
b's
Index
JD
JD
JE
JE
D
D
JM
JM
E
E
M
M
127
Discussion
My study revealed differential use of ungulates as prey items by wolves and black bear in the
Burwash region of Ontario. Although black bear in my study area utilized a variety of mammal
species including all 3 of the available ungulate species, their selectivity for ungulates was not
apparent. Vegetation comprised approximately 87 % of the relative total weight of black bear
diet in my study, with the remaining 23 % comprised of mammals, most of which were
ungulates. Similarly, in Quebec, Canada, an area without elk, black bear diet consisted of 90 %
vegetation with moose being the second most important diet item during the spring and summer
(Mosnier et al. 2008). In Yosemite National Park, USA, black bear diet was comprised of 75 %
vegetation, with mule deer (Odocoileus hemionus) being the only common vertebrate food item
(Graeber and White 1983). In Oregon, USA, animal remains accounted for only 10 % of black
bear diet and diet composition varied among seasons, with ungulates being most important
during the spring and fall (Bull and Torgensen 2001). Although it is widely acknowledged that
black bears are opportunistic, black bear predation has been reported to be the primary cause of
juvenile ungulate population decline in some regions (Lewis et al. 2016). I did not find evidence
of ungulate adult or juvenile prey use more than was expected in black bear diet during the
summer months, supporting the theory that black bear consume ungulate prey opportunistically.
The ungulate component of black bear diet in my study did however consist of more juveniles
than adults (~61 % of ungulates). Because wolves rarely use all of elk or moose carcasses
(Paquet 1992) and ungulates die due to non-predator related events such as road-kill, scavenging
opportunities may have been created for black bear, especially later in the summer when
juveniles are more mobile. As such, it is important to recognize that the ungulate items I detected

128
in black bear scats may have been from predation or scavenging behaviour. Regardless, all three
ungulate species collectively made up a rather small component of bear summer diets.
Unlike black bear, summer diets of wolves in my study area were comprised largely of ungulates
(73 % of all items detected). This finding is consistent with other studies that have examined
wolf diets (Mech et al. 2001; Arjo et al. 2002; Barja 2009). Wolves also exhibited selection for
ungulate prey species in my study, whereby juvenile and adult elk were consistently consumed
more than expected and juvenile and adult moose were utilized less than expected. The majority
(63 %) of the ungulate items detected in my wolf scat samples were from juveniles, which is not
surprising given my scat collection coincided with all three ungulate species calving/fawning
seasons. Wolves elsewhere are known to disproportionately kill younger, older, and likely more
debilitated ungulates than prime adults (Fuller and Keith 1980; Huggard 1993b; Christianson and
Creel 2014). Higher rates of predation on juvenile ungulates compared to adults have been
documented in other studies and are suggested to be due to the increased vulnerability of
juveniles in comparison to adults (Ballard et al. 1987, Salvador and Abad 1987, Jedrzejewski et
al. 1992).
North American wolf diets are dominated by large ungulates and medium-sized mammals
(Newsome et al. 2016). Prey use by wolves is thought to be dependent on prey availability
(Paquet and Carbyn 2003; Newsome et al. 2016). Wolves most often consume prey species that
are the most abundant and may change their diet in response to changes in prey availability
129
(Barja 2009; Wiwchar and Mallory 2012). Although moose are larger than elk and were the most
abundant ungulate in my study area, elk were the ungulate prey item of choice for wolves. Deer
were used as or less than expected by wolves and may not have been selected for due to their
relatively low abundance and seasonality. Similar to my results, elk were consumed by wolves
15 times more often that moose despite elk only being 2.4 times more abundant than moose in
Riding Mountain National Park, Canada (Carbyn 1983). Paquet (1992) further confirmed that
wolves in the Riding Mountain National Park preyed primarily on elk and white-tailed deer,
rather than moose. In Yellowstone National Park, elk, the most abundant ungulate in the park,
comprised 91 % of wolf diet; however, mule deer (Odocoileush emionus), bison (Bison bison),
moose (Alces alces), bighorn sheep (Ovis canadensis), and pronghorns (Antilo-capra
americana), were also available (Mech et al. 2001). Interestingly, both elk (Johnson 1951; Geist
2002) and white-tailed deer (Carl and Robbins 1988) use “the hider” anti-predator strategy
during the first weeks of life leaving calves relatively unprotected should a predator discover
them. Conversely, moose do not use “the hider” strategy; rather mothers stay close to their
young as neonates utilize “the follower” anti-predator strategy (Bogomolova et al. 1992). The
difference in anti-predator strategies between moose and elk may in part explain the observed
selection for elk by wolves (an easier, non-protected target). Encounters with protective large
ungulates such as a moose can be very risky for wolves and have been documented to lead to
wolf deaths (Mech and Nelson 1990; Weaver et al. 1992). In addition, in systems with a variety
of large and small bodied ungulate species, wolves tend to prey primarily upon smaller species
(Carbyn 1983; Paquet 1992; Kunkel et al. 1999; Smith et al. 2000)

130
Other factors influence the selection of a prey species including prey density, predator density,
prey size, alternative prey densities, predator characteristics, and prey behavior (Pimlott 1967).
Both juvenile and adult elk were the most selected ungulate by wolves in my study area. Elk live
in both small and large herds which change seasonally, wolves encounter and kill more elk than
expected from larger groups (Hebblewhite and Pletcher 2002). Grouping behaviour is a common
anti-predator strategy of many species (Bertram 1978; Pulliam and Caraco 1984) which may
benefit the prey through the dilution effect (Hamilton 1971; Bertram 1978). With increased
group size, predator detection probability may also increase (Triesman 1975), which may result
in increased encounter and predation rates. In addition, larger groups may be more spatially
predictable (Huggard 1993a) as well as more likely to contain weak individuals (Bertram 1978).
Because elk are such a gregarious species, they may be more predictable in space, providing
easier targets for wolves in my study area. This grouping anti-predator behaviour may be
responsible for wolves selecting more juvenile and adult elk than moose or deer (less gregarious
than elk in summer months) in my study.
As many factors influence predator-prey dynamics, careful consideration should be taken before
applying predator-prey results to the development of management strategies. Factors that vary
among regions may influence predator-prey population dynamics (Ballard et al. 1987; Mech and
Peterson 2003). My study was limited to periods between May and August, but predator diets
have been demonstrated to vary among seasons for both wolves (Pimlott 1967; Potvin et al 1987;
Barja 2009) and black bear (Raine and Kansas 1990; Bull and Torgensen 2001). My results
indicate that for the calving and summer period, black bear had little apparent impact on elk in

131
my study area, whereas wolves heavily utilized ungulates during the summer with, both juvenile
and adult elk preferred over moose and white-tailed deer.
132
Literature Cited
Adams, L.G., Singer, F.J., and Dale, B.W. 1995. Caribou calf mortality in Denali National Park,
Alaska. Journal of Wildlife Management 59: 584-594.
Adorian, A.S. and Kolenosky, G.B. 1969. A manual for the identification of hairs of selected
Ontario mammals. Ministry of Natural Resources.
Arjo, W.M., Pletscher, D.H., and Ream, R.R. 2002. Dietary overlap between wolves and coyotes
in northwestern Montana. Journal of Mammalogy 83: 754-766.
Ballard, W.B., Spraker, T.H., and Taylor, K.P. 1981. Causes of neonatal moose calf mortality in
south central Alaska. Journal of Wildlife Management 45: 335-342.
Ballard, W.B., Whitman, J.S., and Gardner, C.L. 1987. Ecology of an exploited wolf population
in South-Central Alaska. Wildlife Monographs 98: 1-54.
Ballard, W.B. 1992. Bear predation on moose: a review of recent North American studies and
their management implications. Alces (Suppl.) 1: 162-176.
Barber-Meyer, S.M., Mech, D.L., and White, P.J. 2008. Elk calf survival and mortality following
wolf restoration to Yellowstone National Park. Wildlife Monographs 169: 1-30.
Barja, I. 2009. Prey and prey-age preference by the Iberian wolf Canis lupus signatus in a
multiple-prey ecosystem. Wildlife Biology 15: 147-154.

133
Bastille-Rousseau, G., Fortin, D., Dussault, C., Courtois, R., and Oullet, J-P. 2011. Foraging
strategies by omnivores: are black bears actively searching for ungulate neonates or are they
simply opportunistic predators? Ecography 34: 558-596.
Bergerud, T. and Page, R.E. 1987. Displacement and dispersion of parturient caribou at calving
as antipredator tactics. Canadian Journal of Zoology 65: 1597-1606.
Bertram, B.C.R. 1978. Living in Groups: Predators and Prey. In: Krebs, J.R. and Davies, N.B.
(eds). Behavioral Ecology: An Evolutionary Approach. Pp: 64–96. Blackwell Scientific
Publications.
Bogomolova, E.M., Kurochkin, J.A., and Anokhin, P.K. 1992. Observations of moose behaviour
on a moose farm. Alces (Suppl.) 1:216.
Boitani L. and Powell, R.A. 2012. Carnivore Ecology and Conservation: A Handbook of
Techniques. Oxford University Press, USA.
Bubenik, A.B. 2007. Behaviour. In: Franzmann, A.W. and Schwartz, C.C. (eds). Ecology and
Management of the North American Moose. Pp. 173-221. University Press of Colorado.
Bull, E.L., and Torgersen, T.R. 2001. The importance of vegetation, insects, and neonate
ungulates in black bear diet in northeastern Oregon. Northwest Science 75: 244-253.
Carbyn, L.N. 1983. Wolf predation on elk in Riding Mountain National Park, Manitoba. Journal
of Wildlife Management 47: 963-976.
Carl, G. and Robbins, C.T. 1998. The energetic cost of predator avoidance in neonatal ungulates:
hiding versus following. Canadian Journal of Zoology 66: 239-246.
134
Carter, R.A. 2006. DNA profiles and foraging strategies of large canids in central Ontario.
M.Sc. thesis, Laurentian University, Sudbury, Ontario.
Chambers, B.K., Legasy, K., and Bentley, C.V. 1996. Forest Plants of Central Ontario. Lone
Pine Publishing.
Christianson, D. and Creel, S. 2014. Ecosystem scale decline in elk recruitment and population
growth with wolf colonization: a before-after-control-impact approach. PLoS One 9.
Conger, S.L. and Giusti, G.A. 1992. Observations of black bear (Ursus americanus) predation on
Columbian black-tailed deer (Odocoileus hemionus columbicanus). Californian Fish and
Game 78: 131-132.
Eder, T. 2002. Mammals of Ontario. Lone Pine Publishing.
Forsyth, D.M. 2005. Protocol for estimating changes in the relative abundance of deer in New
Zealand forests using the Faecal Pellet Index (FPI). Department of Conservation. Landcare
Research Contract Report: LC0506/027.
Forsyth, D.M., Barker, R.J., Morris, G., and Scroggie, M.P. 2007. Modeling the relationship
between fecal pellet indices and deer density. Journal of Wildlife Management 71: 964-
970.
Franzmann, A.W., Schwartz, C.C., and Peterson, R.O. 1980. Causes of summer moose calf
mortality on the Kenai Peninsula. Journal of Wildlife Management. 44: 764-768.
French, S.P. and French, M.G. 1990. Predatory behavior of grizzly bears feeding on elk calves
in Yellowstone National Park, 1986-88. Bears: Their Biology and Management 8: 335-341.
135
Fuller, T.K. and Keith, L.B. 1980. Wolf population dynamics and prey relationships in
Northeastern Alberta. Journal of Wildlife Management 44:583-602.
Galliard, J.-M., Festa-Bianchet, M., and Yocoz, N.G. 1998. Population dynamics of large
herbivores: variable recruitment with constant adult survival. Trends in Ecology and
Evolution 13: 58-63.
Gaillard, J. M., Festa-Bianchet, M., Yoccoz, N.G. Loison, A., and Toigo, C. 2000. Temporal
variation in fitness components and population dynamics of large herbivores. Annual
Review Ecological Systematics 31: 367-393.
García Alaniz, N., Naranjo, E.J., and Mallory, F.F. 2010a. Human-felid interactions in three
mestizo communities of the Selva Lacandona, Chiapas, Mexico: benefits, conflicts and
traditional uses of felid species. Human Ecology 38: 451-457.
García Alaníz N., Naranjo, E.J., and Mallory, F.F. 2010b. Hair-snares: A non-invasive method
for monitoring felid populations in the Selva Lacandona, Mexico. Tropical Conservation
Science 3: 403-411.
Gasaway, W.C., Boertje, R.D., Grangaard, D.V., Keeleyhouse, D.G., Stephenson, R.O., and
Larsen, D.G. 1992. The role of predation in limiting moose at low densities in Alaska and
Yukon and implications for conservation. Wildlife Monographs 120: 3-59.
Geist, V. 2002. Adaptive Behavioural Strategies. In: Toweill, D.E. and Thomas, J.W. (eds).
North American Elk Ecology and Management. Pp: 389-433. Smithsonian Institution Press.
Graber, D.M. and White, M. 1983. Black bear food habits in Yosemite National Park. Bears:
Their Biology and Management 5: 1-10.

136
Gunther, K.A. and Renkin, R.A. 1990. Grizzly bear predation on elk calves and other fauna of
Yellowstone National Park. Bears: Their Biology and Management 8: 329-334.
Hamilton, W.D. 1971. Geometry for the selfish group. Journal of Theoretical Ecology 31: 295–
311.
Hamr, J., Mallory, F.F., and Filion, I. 2016. The history of elk (Cervus canadensis) restoration in
Ontario. Canadian Field-Naturalist 130: 167–173.
Hayward M.W., Hofmeyr M., O'Brien J., and Kerley G.I.H. 2006. Prey preferences of the
cheetah (Acinonyx jubatus). Journal of Zoology 270: 615–627.
Hayward, M.W., Jedrzejewski, W., and Jedrzejewska, B. 2012. Prey preferences of the
tiger Panthera tigris. Journal of Zoology 286: 221–231.
Hebblewhite, M. and Pletscher, D.H. 2002. Effects of elk group size on predation by wolves.
Canadian Journal of Zoology 80: 800-809.
Hebblewhite, M., White, C.A., Nietvelt, C.G., McKenzie, J.A., Hurd, T.E., Fryxell, J.M., Bayley,
S.E., and Paquet, P.C. 2005. Human activity mediates a trophic cascade caused by wolves.
Ecology 86: 2135–2144.
Huggard, D.J. 1993a. Prey selectivity of wolves in Banff National Park. I. Prey species.
Canadian Journal of Zoology 71: 130–139.
Huggard, D.J. 1993b. Prey selectivity of wolves in Banff National Park. II. Age, sex, and
condition of elk. Canadian Journal of Zoology 71: 140-147.
137
Jacobs J. 1974. Quantitative measurement of food selection - a modification of the forage ratio
and Ivlev's electivity index. Oecologia 14: 413–417.
Jedrzejewski, W., Jedrzejewska, B., Okarma, H., and Ruprecht, L. 1992. Wolf predation and
snow cover as mortality factors in the ungulate community of the Białowieza National
Park, Poland. Oecologia 90: 27-36.
Johnson, D.E. 1951. Biology of the elk calf, Cervus canadensis Nelsoni. Journal of Wildlife
Management 15: 396-410.
Jost, M.A., Hamr, J., Filion, I., and Mallory, F.F. 1999. Forage selection by elk in habitats
common to the French River – Burwash region of Ontario. Canadian Journal of Zoology
77: 1429-1438.
Keech, M.R., Boerthe R.D., Bowyer, R.T., and Dale, B.W. 1999. Effects of birth weight on
growth of young moose: do low-weight neonates compensate? Alces 35: 51-57.
Kittle, A.M., Fryxell, J.M., Desy, G.E., and Hamr, J. 2008. The scale-dependent impact of wolf
predation risk on resource selection by three sympatric ungulates. Oecologia 157: 163-175.
Klare, U., Kamler, J.F., and Macdonald, D.W. 2011. A comparison and critique of different scat-
analysis methods for determining carnivore diet. Mammal Review 41: 294-312.
Kunkel, K.E. and Mech, D.L. 1994. Wolf and bear predation on white-tailed deer fawns in
northeastern Minnesota. Canadian Journal of Zoology 72: 1557-1565.
Kunkel, K.R., Ruth, T.K., Pletscher, D.H., and Hornocker, M.G. 1999. Winter prey selection by
wolves and cougars in and near Glacier National Park Montana. Journal of Wildlife
Management 63: 901-910.

138
Lamothe, A.R. and Parker, G.H. 1989. Winter feeding habits of wolves in the Keewatin
District, Northwest Territories, Canada. Musk-Ox 37: 144-149.
Lewis, K.P., Gullage, S.E., Fifield, D.A., Jennings, D.H., and Mahoney, S.P. 2016.
Manipulations of black bear and coyote affect caribou calf survival. Journal of Wildlife
Management.
Lyngdoh, S., Shrotriya, S., Goyal, S.P., Clements, H., Hayward, M.W., and Habib, B. 2014. Prey
preferences of the snow leopard (Panthera uncia): regional diet specificity holds global
significance for conservation. PLoS One 9: e88349.
Mahoney, S.P., Abbot, H., Russell, L.H., and Porter, B.R. 1990. Woodland caribou calf mortality
in insular Newfoundland. Trans. 19th IUGB Congress, Trondheim, Norway.
Mathews, N.E. and Porter, W.F. 1988. Black bear predation of white-tailed deer neonates in the
central Adirondacks. Canadian Journal of Zoology 66: 1241-1242.
Mech, L.D. and Nelson, M.E. 1990. Evidence of prey-caused mortality in three wolves.
American Midland Naturalist. 129: 266-271.
Mech, L.D., Smith, D.W., Murphy, K.M., and MacNulty, D.R. 2001. Winter severity and wolf
predation on a formerly wolf-free elk herd. Journal of Wildlife Management 65: 998-1003.
Mech, L.D. and Peterson, R. O. 2003. Wolf-Prey Relations. In: Mech, D.L. and Boitani, L. (eds).
Wolves: Behavior, Ecology, and Conservation. Pp: 131-160. University of Chicago Press.
Mosnier, A., Oullet, J-P., and Courtois, R. 2008. Black bear adaptation to low productivity in the
boreal forest. Ecoscience 15: 485-497.

139
Murrow, J.L., Clark, J.D., and Delozier, E.K. 2009. Demographics of an experimentally released
population of elk in Great Smoky Mountains National Park. Journal of Wildlife
Management 73: 1261-168.
Neff, D.J. 1968. The pellet-group count technique for big game trend, census, and distribution: a
review. Journal of Wildlife Management 32: 597-614.
Nelson, M.E. and Mech, D.L. 1986. Relationship between snow depth and gray wolf predation
on white-tailed deer. Journal of Wildlife Management 50: 471-474.
Newsome, T.M., Boitani, L., Chapron, G., Ciucci, P., Dickman, C.R., Dellinger, J.A., and
Lopez-Bao, J.V. 2016. Food habits of the world’s grey wolves. Mammal Review 45: 255-
269.
OMNR. 2014. Black Bear Ecological Zones (BBEZ), Black Bear Density Map. Available at
https://www.ontario.ca/document/bear-density-map.
Paquet, P.C. 1992. Prey use strategies of sympatric wolves and coyotes in Riding Mountain
National Park, Manitoba. Journal of Mammalogy 73: 337-343.
Paquet, P.C. and Carbyn, L.N. 2003. Gray wolf Canis lupus and allies. In: Feldhamer, G.A.,
Thompson, B.S., Champan, J.A. (eds). Wild Mammals of North America: Biology,
Management, and Conservation. Pp: 483-510. JHU Press.
Patterson, B.R., MacDonald, B.A. Lock, B.A., Anderson, D.G., and Benjamin, L.K. 2002.
Proximate factors limiting population growth of white-tailed deer in Nova Scotia. Journal of
Wildlife Management 66: 511–521.
140
Patterson, B.R., Benson, J.F., Middel, K.R., Mills, K.J., Silver, A., and Obbard, M.E. 2013.
Moose calf mortality in central Ontario, Canada. Journal of Wildlife Management 77: 832-
841.
Pimlott, D.H. 1967. Wolf predation and ungulate populations. American Zoologist 7: 267-278.
Popp, J.N., McGeachy, D.N., and Hamr, J. 2013. Elk (Cervus elaphus) seasonal habitat selection
in a heterogeneous forest structure. International Journal of Forestry Research 2013: 1-7.
Popp, J.N., Toman, T., Mallory, F.F., and Hamr, J. 2014. A century of elk restoration in eastern
North America. Restoration Ecology 22: 723-730.
Potvin, F., Jolicoeur, H., and Huot, J. 1987. Wolf diet and prey selectivity during two periods for
deer in Quebec: decline versus expansion. Canadian Journal of Zoology 66: 1274-1279.
Pulliam, H.R. and Caraco, T. 1984. Living in Groups: is there an Optimal Group Size? In: Krebs,
J.R. and Davies, N.B. (eds). Behavioral Ecology: an Evolutionary Approach. 2nd ed. Pp.
122–147. Blackwell Scientific Publications.
Raine, R.M. and Kansas, J.L. 1990. Black bear seasonal food habits and distribution by elevation
in Banff National Park, Alberta. Bears: Their Biology and Management 8: 297-304.
Raithel, J.D., Kauffman, M.K., and Pletscher, D.H. 2007. Impact of spatial and temporal
variation in calf survival on the growth of elk populations. Journal of Wildlife Management
71: 795-803.
Ranta, B. 1979. Range and habitat relationships of wapiti (Cervus canadensis) in the Burwash-
French River area of Ontario. M.Sc. thesis, Carleton University, Ottawa, Ontario.

141
Ripple, W. J., Larsen, E.J., Renkin, R.A., and Smith, D.W. 2001. Trophic cascades among
wolves, elk and aspen on Yellowstone National Parks’ northern range. Biological
Conservation 102: 227–234.
Rosatte, R., J. Hamr, J. Young, I. Filion, and Smith, H. 2007. The restoration of elk (Cervus
elaphus) in Ontario, Canada: 1998–2005. Restoration Ecology 15: 34–43.
Rowe, J.S. 1972. Forest Regions of Canada, Canadian Forest Service, Ottawa, Canada.
Salvador, A. and Abad, P.L. 1987. Food habits of a wolf population (Canis lupus) in Leon
Province, Spain. Mammalia 51: 45-52.
Schlegel, M. 1976. Factors affecting calf elk survival in northcentral Idaho – a progress report.
Proc. 56th Ann. Conf. W. Assoc. State Game Fish Comm. 56: 342-355.
Smith, R.H., Neff, D.J., and McCulloch, C.Y. 1969. A Model for the installation and use of a
deer pellet group survey. Arizona Game and Fish Department. Special Report No. 1.
Smith, B.L. and Anderson, S.H. 1998. Juvenile survival and population regulation of the Jackson
elk herd. Journal of Wildlife Management 62: 1036-1045.
Smith, D.W., Mech, L.D., Meagher, M., Clark, W.E., Jaffe, R., Phillips, M.K., and Mack, J.A.
2000. Wolf-bison interaction in Yellowstone National Park. Journal of Mammalogy 81:
1128-1135.
Spaulding, R., Krausman, P.R., and Ballard, W.B. 2000. Observer bias and analysis of gray wolf
diets from scats. Wildlife Society Bulletin 28: 947-950.
142
Triesman, M. 1975. Predation and the evolution of gregariousness I. Detection of prey. Animal
Behaviour 23: 779–801.
Vankat, J.L. 1979. The Natural Vegetation of North America: an Introduction. John Wiley &
Sons.
Verme, L.J. 1969. Reproductive patterns of white-tailed deer related to nutritional plane. Journal
of Wildlife Management 33: 881-887.
Vreeland, J.K., Diefenbach, D.R., and Wallingford, B.D. 2004. Survival rates, mortality causes,
and habitats of Pennsylvania white-tailed deer fawns. Wildlife Society Bulletin 32: 542-
553.
Weaver, J. 1978. The wolves of Yellowstone. Natural Resources Report no. 14. National Park
Service, Washington, D.C., USA.
Weaver, J.L., Arvidson, C., and Wood, P. 1992. Two wolves, Canis lupus, killed by a moose in
Jasper National Park, Alberta. Canadian Field Naturalist. 106: 126-127.
Weaver, J.L. 1993. Refining the equation for interpreting prey occurrence in gray wolf scats.
Journal of Wildlife Management 57: 534-538.
White, P.J. and Garrott, R.A. 2005. Northern Yellowstone elk after wolf restoration. Wildlife
Society Bulletin 33: 942-955.
White, C.G., Zager, P., and Gratson, M.W. 2010. Influence of predator harvest, biological
factors, and landscape on elk calf survival in Idaho. Journal on Wildlife Management 74:
355-369.
143
Wilson, P.J., Grewal, S.K., Mallory, F.F., and White, B.N. 2009. Genetic characterization of
hybrid wolves across Ontario. Journal of Heredity 100: S80-S89.
Wiwchar, D.M.A. and Mallory, F.F. 2012. Prey specialization and morphological conformation
of wolves associated with woodland caribou and moose. Rangifer 19: 309–328.
Yarkovich, J., Clark, D.D., and Murrow, J.L. 2011. Effects of black bear relocation on elk calf
recruitment at Great Smoky Mountains National Park. Journal of Wildlife Management 75:
1145-1154.
144
Chapter 7
Population-specific responses to climate by restored elk in eastern North
America
Abstract
The effects of climate on wildlife population dynamics have been investigated extensively;
however, relationships can be very complex, often indirect, and in many cases, not well
understood. Wildlife responses to changes in weather are often population-specific, indicating
that generalizations should be carefully considered. The effects of climate on elk in North
America has been studied; however, little is known about population growth rate responses of
restored elk in eastern North America. To determine if restored elk have population-specific
responses to climate, I compared annual population rates of increase using time series for 7
reintroduced elk populations in eastern North America. I used a model selection approach with
five climatic variables and found that population-specific responses existed. Three of the 7
populations displayed significant responses to climate variables. Two populations responded
negatively to increased snow depths, while one population responded negatively to increased
summer temperatures. Our study contributes to the understanding of the complex relationship
among wildlife population dynamics and climate.
145
Introduction
Climate can directly and indirectly influence large herbivore population dynamics through
differences in precipitation, temperature, wind, and winter severity (Coughenour and Singer
1996, Creel and Creel 2009, Hegel et al. 2010; Owen-Smith 2010). Weather can have direct
effects on wildlife such as cold or heat stress (Owen-Smith 2010), as well as indirect effects on
forage production and availability (Bo and Hjeljord 1991; Finstad et al. 2000; Raedeke et al.
2002; Melis et al. 2009; Owen-Smith 2010), energy expenditure due to locomotion restriction
(i.e.: deep snow) (Telfer and Kelsall 1984; Owen-Smith and Marshal 2010), and predator-prey
processes (Post et al. 1999; Hebblewhite et al. 2002; Melis et al. 2009).
Responses to climate may differ among ungulate populations of the same species. For example,
in western North America, Griffin et al. (2011) found that weather conditions affected neonatal
elk survival differently among populations, and response variation was found to be related to
differences in predator species diversity among the elk populations. Hegel et al. (2010) found
variation in herd recruitment response to weather among mountain-dwelling caribou (Rangifer
tarandus) populations. It has been suggested that herd- or population- specific characteristics
such as terrain or predator densities should be incorporated when investigating the complex
relationships between ungulate population dynamics and climate (Hegel et al. 2010).
The effects of climate on wildlife population dynamics are governed by several factors and these
relationships can be very complex and most often indirect (Owen-Smith 2010). Factors that are
well known to govern population response to climate include population density (Clutton-Brock

146
et al. 2004; Owen-Smith and Marshal 2010), age class composition (Clutton-Brock et al. 2004),
sex ratio (Owen-Smith and Marshal 2010), body condition (Raedeke et al. 2002), and the
presence of predators (Griffin et al. 2011). There are likely several other factors that influence
responses of wildlife populations to climate and identifying them would greatly enhance our
understanding of causal agents associated with population-specific responses.
Elk survival has been linked to changes in temperature, precipitation, and more commonly,
snowpack or winter severity (Picton 1984, Coughenour and Singer 1996, Post and Stenseth 1999,
Taper and Gogan 2002, Garrot et al. 2003, Creel and Creel 2009). In western North America,
high summer temperatures are known to negatively influence population growth rates of elk
(Wang et al. 2002), while spring or summer precipitation tends to improve population growth
rates, as well as recruitment (Coughenour and Singer 1996; Taper and Gogan 2002; Wang et al.
2002), but not for all populations. For example, Creel and Creel (2009) found that summer
precipitation was not a strong predictor of elk population growth rate in Rocky Mountain
National Park. Several studied elk populations were shown to respond negatively to increased
snowpack and severe winter weather (Huggard 1993; Raedeke et al. 2002; Garrot et al. 2003;
Smith et al. 2003; Evans et al. 2006; Creel and Creel 2009; Brodie et al. 2013); however, other
populations were not significantly affected (Coughenour and Singer 1996; Singer et al. 1997;
Johnson et al. 2013).
Elk were extirpated in eastern North America in the 19th century; however, over the past century,
reintroductions have become prevalent (O’Gara 2002; Popp et al. 2014). Restoration attempts
have resulted in success, failure and a wide degree of variation among population growth rates
147
(Popp et al. 2014). Factors related to the variation in population dynamics of elk reintroductions
in eastern North America are critical to the success of established and future populations.
Although some research has been done in this area, the effects of climate on reintroduced elk
populations in eastern North America has not yet been investigated in depth.
Reintroductions are often initiated with small populations, which are far below carrying capacity,
providing opportunity to study the effects of climate in the absence of density dependent
influences. Although Picton (1984) identified significant climatic effects on elk populations at
carrying capacity, to my knowledge, investigations of responses to climate in recently
reintroduced ungulate populations have not been documented. I used annual estimates from 10
populations of eastern North American reintroduced elk to examine the effects of several
climatic variables on population growth rates, and anticipated that responses would be
population-specific.
Methods
Annual elk population estimates and harvest data were collected from regional managers of 7
populations in eastern North America including Burwash, Ontario (BUR) Lake Huron-North
Shore, Ontario (LHNS); Bancroft, Ontario; Wisconsin; Minnesota; Michigan; and Pennsylvania
(Fig. 1). Data were available from the time elk were reintroduced to 11 to 17 years post-
introduction in 4 populations: BUR, LHNS, Bancroft, and Wisconsin; and in 3 populations more
than 48 years after they were reintroduced (Minnesota – 72 years; Michigan – 68 years;
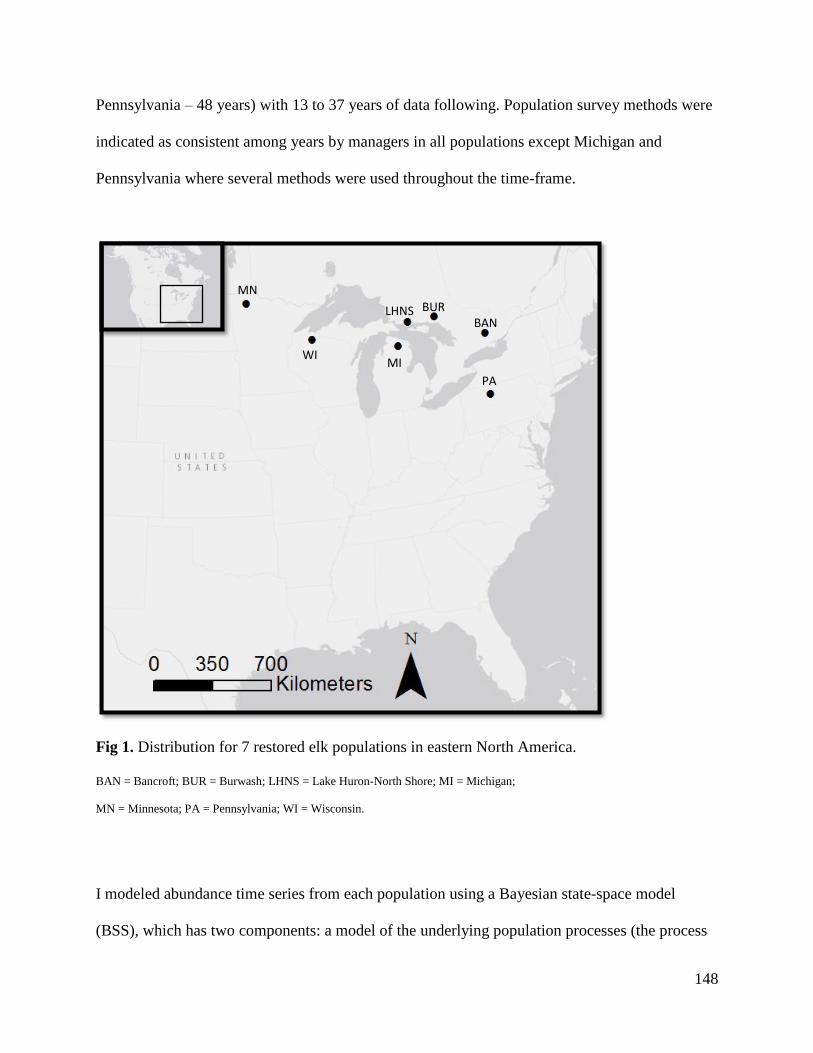
148
Pennsylvania – 48 years) with 13 to 37 years of data following. Population survey methods were
indicated as consistent among years by managers in all populations except Michigan and
Pennsylvania where several methods were used throughout the time-frame.
Fig 1. Distribution for 7 restored elk populations in eastern North America.
BAN = Bancroft; BUR = Burwash; LHNS = Lake Huron-North Shore; MI = Michigan;
MN = Minnesota; PA = Pennsylvania; WI = Wisconsin.
I modeled abundance time series from each population using a Bayesian state-space model
(BSS), which has two components: a model of the underlying population processes (the process
MN
LHNS
PA
BUR
MI
BAN
WI

149
model) producing abundance changes over time, and a model of the observation process (the
observation model) relating abundance estimates to inferred true abundance (de Valpine and
Hastings 2002; Buckland et al. 2004). The state-space model partitions variation within time
series into process variance (𝜎𝑝𝑟𝑜𝑐2 ) and variance caused by observation error (𝜎𝑜𝑏𝑠
2 ). Failure to
account for observation error bias estimates of density dependence and decreases power to detect
effects of environmental covariates (Freckleton et al. 2006). My process model is the discrete
time stochastic Gompertz model (Dennis et al. 2006):
𝑁𝑡 = 𝑁𝑡−1 exp(𝑎 + 𝑏 ln𝑁𝑡−1 + 𝐸𝑡)
where Nt is the imperfectly-observed true abundance at each survey occasion and Et is
unexplained process variation distributed as Et~Ɲ(0, 𝜎𝑝𝑟𝑜𝑐2 ). Parameter a is a constant and
parameter b controls the strength of density dependence. The stochastic Gompertz model is
simple and is well supported for abundance time series across a variety of taxa (Brook and
Bradshaw 2006). It has been employed in previous analyses of ungulate populations, including
elk (Creel and Creel 2009; Ahrestani et al. 2013). I accounted for any harvest that occurred prior
to each population survey by including a harvest term:
𝑁𝑡 + 𝐻𝑡−1 = 𝑁𝑡−1 exp(𝑎 + 𝑏 ln𝑁𝑡−1 + 𝐸𝑡)
The observation model assumes that errors inherent to imperfectly observing abundance are log-
normally distributed about the true abundances (Dennis et al. 2006). On the log scale, where 𝑌𝑡 =
ln(𝐸𝑠𝑡.𝑡 ) and Est.t are the raw estimates of abundance, the observation model is:
𝑌𝑡~Ɲ(ln𝑁𝑡 , 𝜎𝑜𝑏𝑠2 )

150
Models were fitted by Markov Chain Monte Carlo (MCMC) using a Gibbs sampler implemented
in Program JAGS (Plummer 2013) run through the R package R2jags (R Development Core
Team 2014; Su and Yajima 2014). Population annual growth rates rt were estimated from BSS
log abundance estimates, which accounted for observation error. The distribution of each rt was
calculated by MCMC, as a derived parameter of the BSS according to the relationship:
𝑟𝑡 = ln((𝑁𝑡 + 𝐻𝑡−1) 𝑁𝑡−1⁄ )
Mean estimates of 𝑟�̅� were regressed onto 12 combinations of environmental covariates.
Covariate models were compared within each site using AICc for multi-model inference to select
top models (Burnham and Anderson 2002). Based on the potential effects of climate variables on
elk population growth through literature review, several candidate models were formed each
with a maximum of 2 covariates due to the restrictions of small sample size. Climate variables
that were correlated (Pearson’s correlation coefficient > 0.70) were not used together in any
given model. The same candidate models were used for each of the 7 elk populations to
determine which model best explained the variation in population growth rates among years.
Several climate covariates were used (Table 1) and carryover effects were considered as
populations can respond to past weather conditions (Owen-Smith 2010). Covariates included
SummerPrecip(t-1) - summer precipitation (mean precipitation from May to August in the year
prior to the population survey); SummerTemp(t-1) - summer temperature (mean maximum
temperature from May to August in the year prior to the population survey); WinterTemp(t-1) -
winter temperature (mean maximum temperature from January to February in the year prior to
the population survey; WinterTemp(t) – winter temperature during the year of the population
survey; and LengthGrowth(t-1) - length of the growth season in the year prior to the population

151
survey (McKenney et al. 2006; 2011). The mean total snow fall from January to February was
also used from the year of the population survey (Snow(t)): as well as the year prior (Snow(t-1))
(Snow Data Sources: Canada - Environment Canada Historical Weather; USA – National
Oceanic and Atmospheric Administration (NOAA).
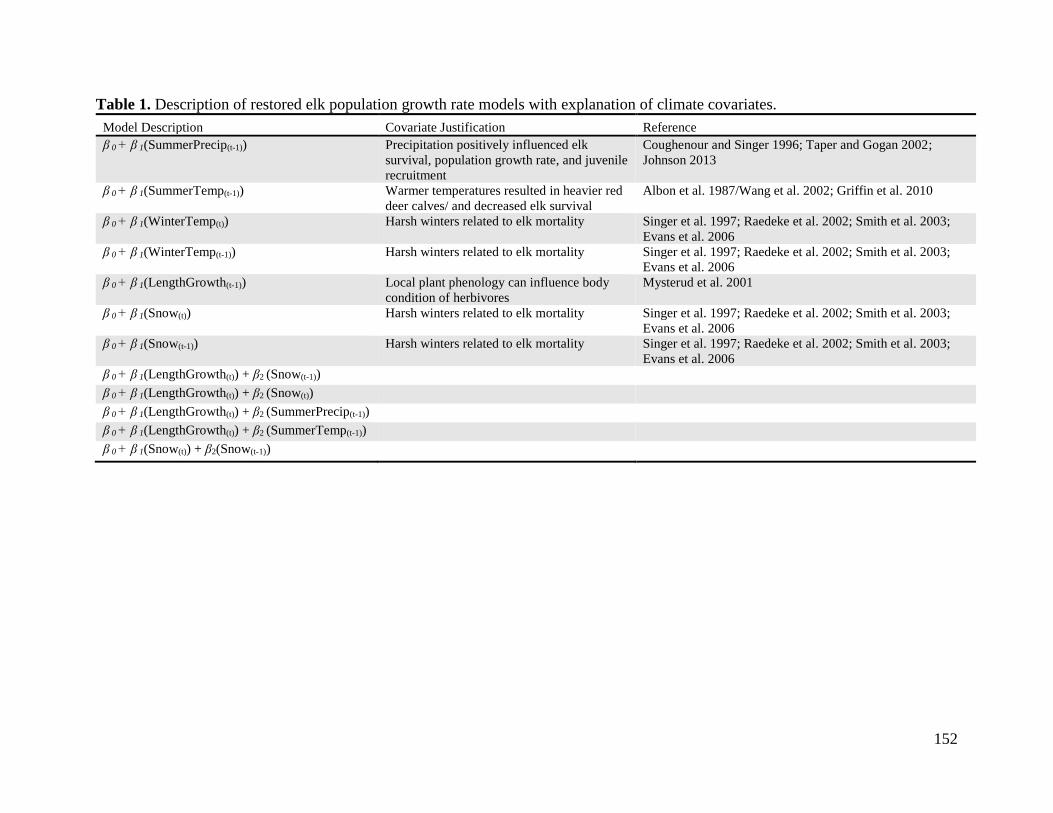
152
Table 1. Description of restored elk population growth rate models with explanation of climate covariates.
Model Description Covariate Justification Reference
β 0 + β 1(SummerPrecip(t-1)) Precipitation positively influenced elk
survival, population growth rate, and juvenile
recruitment
Coughenour and Singer 1996; Taper and Gogan 2002;
Johnson 2013
β 0 + β 1(SummerTemp(t-1)) Warmer temperatures resulted in heavier red
deer calves/ and decreased elk survival
Albon et al. 1987/Wang et al. 2002; Griffin et al. 2010
β 0 + β 1(WinterTemp(t)) Harsh winters related to elk mortality Singer et al. 1997; Raedeke et al. 2002; Smith et al. 2003;
Evans et al. 2006
β 0 + β 1(WinterTemp(t-1)) Harsh winters related to elk mortality Singer et al. 1997; Raedeke et al. 2002; Smith et al. 2003;
Evans et al. 2006
β 0 + β 1(LengthGrowth(t-1)) Local plant phenology can influence body
condition of herbivores
Mysterud et al. 2001
β 0 + β 1(Snow(t)) Harsh winters related to elk mortality Singer et al. 1997; Raedeke et al. 2002; Smith et al. 2003;
Evans et al. 2006
β 0 + β 1(Snow(t-1)) Harsh winters related to elk mortality Singer et al. 1997; Raedeke et al. 2002; Smith et al. 2003;
Evans et al. 2006
β 0 + β 1(LengthGrowth(t)) + β2 (Snow(t-1)) β 0 + β 1(LengthGrowth(t)) + β2 (Snow(t)) β 0 + β 1(LengthGrowth(t)) + β2 (SummerPrecip(t-1)) β 0 + β 1(LengthGrowth(t)) + β2 (SummerTemp(t-1)) β 0 + β 1(Snow(t)) + β2(Snow(t-1))
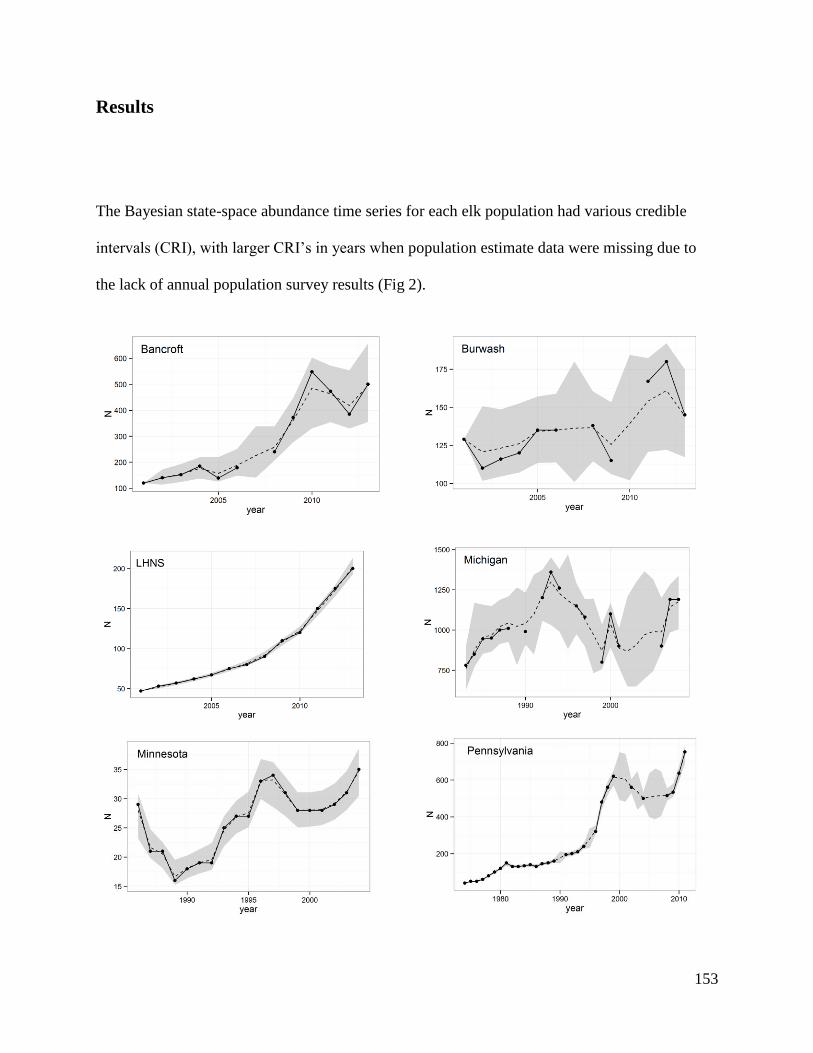
153
Results
The Bayesian state-space abundance time series for each elk population had various credible
intervals (CRI), with larger CRI’s in years when population estimate data were missing due to
the lack of annual population survey results (Fig 2).
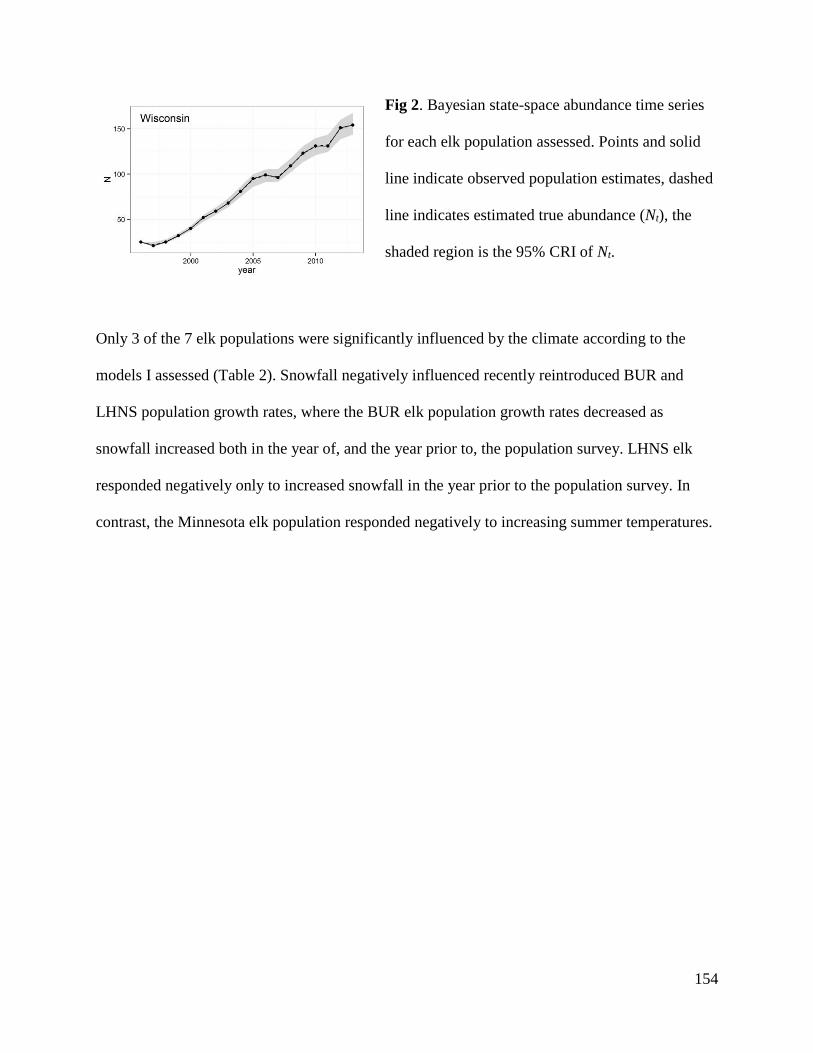
154
Fig 2. Bayesian state-space abundance time series
for each elk population assessed. Points and solid
line indicate observed population estimates, dashed
line indicates estimated true abundance (Nt), the
shaded region is the 95% CRI of Nt.
Only 3 of the 7 elk populations were significantly influenced by the climate according to the
models I assessed (Table 2). Snowfall negatively influenced recently reintroduced BUR and
LHNS population growth rates, where the BUR elk population growth rates decreased as
snowfall increased both in the year of, and the year prior to, the population survey. LHNS elk
responded negatively only to increased snowfall in the year prior to the population survey. In
contrast, the Minnesota elk population responded negatively to increasing summer temperatures.
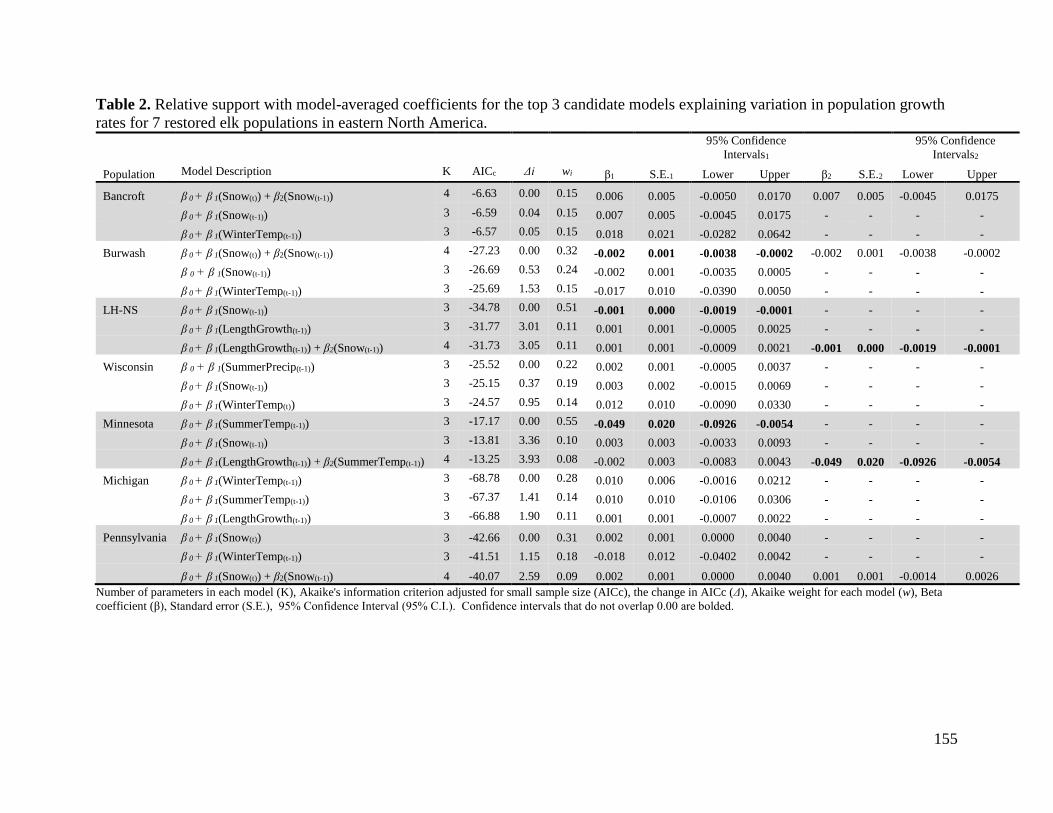
155
Table 2. Relative support with model-averaged coefficients for the top 3 candidate models explaining variation in population growth
rates for 7 restored elk populations in eastern North America.
95% Confidence
Intervals1
95% Confidence
Intervals2
Population Model Description K AICc Δi wi β1 S.E.1 Lower Upper β2 S.E.2 Lower Upper
Bancroft β 0 + β 1(Snow(t)) + β2(Snow(t-1)) 4 -6.63 0.00 0.15 0.006 0.005 -0.0050 0.0170 0.007 0.005 -0.0045 0.0175
β 0 + β 1(Snow(t-1)) 3 -6.59 0.04 0.15 0.007 0.005 -0.0045 0.0175 - - - -
β 0 + β 1(WinterTemp(t-1)) 3 -6.57 0.05 0.15 0.018 0.021 -0.0282 0.0642 - - - -
Burwash β 0 + β 1(Snow(t)) + β2(Snow(t-1)) 4 -27.23 0.00 0.32 -0.002 0.001 -0.0038 -0.0002 -0.002 0.001 -0.0038 -0.0002
β 0 + β 1(Snow(t-1)) 3 -26.69 0.53 0.24 -0.002 0.001 -0.0035 0.0005 - - - -
β 0 + β 1(WinterTemp(t-1)) 3 -25.69 1.53 0.15 -0.017 0.010 -0.0390 0.0050 - - - -
LH-NS β 0 + β 1(Snow(t-1)) 3 -34.78 0.00 0.51 -0.001 0.000 -0.0019 -0.0001 - - - -
β 0 + β 1(LengthGrowth(t-1)) 3 -31.77 3.01 0.11 0.001 0.001 -0.0005 0.0025 - - - -
β 0 + β 1(LengthGrowth(t-1)) + β2(Snow(t-1)) 4 -31.73 3.05 0.11 0.001 0.001 -0.0009 0.0021 -0.001 0.000 -0.0019 -0.0001
Wisconsin β 0 + β 1(SummerPrecip(t-1)) 3 -25.52 0.00 0.22 0.002 0.001 -0.0005 0.0037 - - - -
β 0 + β 1(Snow(t-1)) 3 -25.15 0.37 0.19 0.003 0.002 -0.0015 0.0069 - - - -
β 0 + β 1(WinterTemp(t)) 3 -24.57 0.95 0.14 0.012 0.010 -0.0090 0.0330 - - - -
Minnesota β 0 + β 1(SummerTemp(t-1)) 3 -17.17 0.00 0.55 -0.049 0.020 -0.0926 -0.0054 - - - -
β 0 + β 1(Snow(t-1)) 3 -13.81 3.36 0.10 0.003 0.003 -0.0033 0.0093 - - - -
β 0 + β 1(LengthGrowth(t-1)) + β2(SummerTemp(t-1)) 4 -13.25 3.93 0.08 -0.002 0.003 -0.0083 0.0043 -0.049 0.020 -0.0926 -0.0054
Michigan β 0 + β 1(WinterTemp(t-1)) 3 -68.78 0.00 0.28 0.010 0.006 -0.0016 0.0212 - - - -
β 0 + β 1(SummerTemp(t-1)) 3 -67.37 1.41 0.14 0.010 0.010 -0.0106 0.0306 - - - -
β 0 + β 1(LengthGrowth(t-1)) 3 -66.88 1.90 0.11 0.001 0.001 -0.0007 0.0022 - - - -
Pennsylvania β 0 + β 1(Snow(t)) 3 -42.66 0.00 0.31 0.002 0.001 0.0000 0.0040 - - - -
β 0 + β 1(WinterTemp(t-1)) 3 -41.51 1.15 0.18 -0.018 0.012 -0.0402 0.0042 - - - -
β 0 + β 1(Snow(t)) + β2(Snow(t-1)) 4 -40.07 2.59 0.09 0.002 0.001 0.0000 0.0040 0.001 0.001 -0.0014 0.0026
Number of parameters in each model (K), Akaike's information criterion adjusted for small sample size (AICc), the change in AICc (Δ), Akaike weight for each model (w), Beta
coefficient (β), Standard error (S.E.), 95% Confidence Interval (95% C.I.). Confidence intervals that do not overlap 0.00 are bolded.
156
Discussion
The restored elk populations I assessed in eastern North America displayed population-specific
responses to climate. Severe winter weather is well known to negatively impact ungulate
population dynamics (Mech et al. 1987; Peterson 1999; Forchammer et al. 2001; Solberg et al.
2001; Owen-Smith and Marshal 2010), including elk (Singer et al. 1997; Raedke et al. 2002;
Garrot et al. 2003; Smith et al. 2003; Evans et al. 2006; Creel and Creel 2009; Brodie et al.
2013); however, the effects are not consistent among populations (Hegel et al. 2010; Griffin et al.
2011). Of the populations I examined, 5 of the 7 were not significantly influenced by snowfall or
winter temperatures; whereas the remaining 2 populations had population growth rates that
decreased in response to increased snowfall. Snow can have both direct and indirect effects on
ungulates. Snow accumulation can decrease the accessibility of food (Finstad et al. 2000) and
lead to locomotion restrictions (Telfer and Kelsall 1984) and both factors may restrict dietary
intake and nutrition, ultimately leading to the depletion of body reserves, and thus influencing
survival, reproduction, and recruitment (Garrot et al. 2003). Both the Burwash and LHNS
populations responded negatively to the previous year’s snowfall, while only the Burwash
population responded negatively to both the current and previous year’s snowfall. Snow depths
can have carryover effects, for example, following severe winter conditions, elk calves can be
born later and lighter, ultimately decreasing their chances for survival (Singer et al. 1997).
Winter climate can also influence ungulate population dynamics through predator-prey processes
(Post et al. 1999; Hebblewhite et al. 2002). For example, high snow depth was responsible for
increased wolf predation on white-tailed deer in Minnesota (Nelson and Mech 1986), elk in

157
Banff National Park (Huggard 1993), and moose on Isle Royale (Post et al. 1999). Ungulate kill
rates by wolves can increase substantially in the presence of snow (Nelson and Mech 1986;
Huggard 1993), as deep snow can hinder ungulate movement, while wolves with lighter foot-
loads (Telfer and Kelsall 1984) can travel more easily on top of snow with crusts (Peterson 1977)
making ungulates, especially juveniles and older adults, more accessible to the predator (Mech et
al. 1987; Garrot et al. 2003; Owen-smith 2010). Although I could not obtain wolf density
estimates in each of the elk population ranges, wolves were absent in Minnesota, Michigan and
Pennsylvania, but were present in the Burwash, Bancroft, LHNS, and Wisconsin elk population
ranges. Thus, under certain conditions, interaction of predation and climate can result in lower
population growth and vital rates in ungulate populations (Hebblewhite 2005; Wilmers et al.
2007). However, although elk population growth rates have been found to decline more steeply
in areas with wolf predation, winter severity can reduce elk population growth rate regardless of
predation pressure (Hebblewhite et al. 2005). Although I were unable to test this, wolves as well
as other unidentified factors may be influencing the response of elk to climate in 4 of the
populations examined.
Increased summer temperatures were associated with decreased elk population growth rates in
the Minnesota elk population. Also in Minnesota, high summer temperatures were associated
with decreased moose (Alces alces) population growth rates, suggested to be the result of
thermoregulation disruption (Murray et al. 2006). In Scotland, warmer spring temperatures
resulted in the births of heavier red deer (Cervus elaphus) calves (Albon et al. 1987); however,
elk population growth rates in Rocky Mountain National Park decreased in response to high
summer temperatures (Wang et al. 2002). In the northwestern USA, neonatal elk survival
158
declined in years following high summer temperatures, an effect that was greater than that of
winter severity (Griffin et al. 2010). Warmer summers can reduce forage quality by increasing
the rate of plant maturity (Finstad et al. 2000) and trends like these suggest that summer forage
plays a very important role for ungulate population dynamics (McArt et al. 2009; Parker et al.
2009).
A complex and often indirect relation exists between climatic factors and wildlife population
dynamics (Owen-Smith 2010). Many factors, some likely still unidentified or poorly understood
may govern wildlife responses to climate (Clutton-Brock et al. 2004; Owen-Smith and Marshal
2010, Raedeke et al. 2002; Griffin et al. 2011). Although I did not find any differences in
responses to climate between recently reintroduced elk versus established restored elk
populations, population-specific responses were apparent. If wildlife populations are
geographically separated, managers and conservationists should investigate population-specific
responses to various environmental factors when assessing population growth and dynamics, as
assumptions based on supported “trends” may not be accurate for every population.
159
Literature Cited
Albon, S.D., Clutton-Brock, T.H., and Guinness, F.E. 1987. Early development and population
dynamics in red deer. II. Density-independent effects and cohort variation. Journal of
Animal Ecology 56: 69-81.
Ahrestani, F.S., Hebblewhite, M., and Post, E. 2013. The importance of observation versus
process error in analyses of global ungulate populations. Scientific Reports 3: 16–20.
Bo, S. and Hjeljord, O. 1991. Do continental moose ranges improve during cloudy summers?
Canadian Journal of Zoology 69: 1875-1879.
Brodie, J., Johnson, H., Mitchell, M., Zager, P., Proffitt, K., Hebblewhite, M., Kauffman, M.,
Johnson, B., Bissonette, J., Bishop, C., Gude, J., Herert, J., Hersey, K., Hurley, M., Lukacs,
P.M., McCorquodale, S., McIntire, E., Nowak, J., Sawyer, H., Smith, D., and White, P.J.
2013. Relative influences of human harvest, carnivores, and weather on adult female elk
survival across western North America. Journal of Applied Ecology 50: 298-305.
Brook, B.W. and Bradshaw, C.J.A. 2006. Strength of evidence for density dependence in
abundance time series of 1198 species. Ecology 87: 1445–1451.
Buckland, S.T., Newman, K.B, Thomas, L., and Koesters, N.B. 2004. State-space models for the
dynamics of wild populations. Ecological Modelling 171: 157–175.
Clutton-Brock, T.H., Grenfell, B.T., and Coulson, T. 2004. Population dynamics in Soay sheep.
In: Clutton-Brock, T.H., and Pemberton, J. (eds). Soay Sheep Dynamics and Selection in
an Island Population. Pp 52-88. Cambridge University Press.
160
Coughenour, M.B. and Singer, F.J. 1996. Elk population processes in Yellowstone National Park
under the policy of natural regulation. Ecological Applications 6: 573-593.
Creel, S. and Creel, M. 2009. Density dependence and climate effects in Rocky Mountain elk: an
application of regression with instrumental variables for population time series with
sampling error. Journal of Animal Ecology 78: 1291-1297.
Dennis, B., Ponciano, J.M., Subhash, L.R., Taper, M.L., and Staples, D.F. 2006. Estimating
density dependence, process noise, and observation error. Ecological Monographs 76: 323–
341.
de Valpine, P. and Hastings, A. 2002. Fitting population models incorporating process noise and
observation error. Ecological Monographs 72: 57–76.
Evans, S.B., Mech, L.D., White, P.J., and Sergeant, G.A. 2006. Survival of adult female elk in
Yellowstone following wolf restoration. Journal of Wildlife Management 70: 1372-1378.
Finstad, G.L., Berger, M., Kiellan, K., and Pritchard, A.K. 2000. Climatic influence on forage
quality, growth and reproduction of reindeer on the Seward Peninsula. II. Reindeer growth
and reproduction. Rangifer Special Issue No. 12: 144.
Forchhammer, M.C., Clutton-Brock, T.H., Linstrom, J., and Albon, S.D. 2001.Climate and
population density induce long-term cohort variation in a northern ungulate. Journal of
Animal Ecology 70: 721-798.
Freckleton, R.P., Watkinson, A.R., Green, R.E., and Sutherland, W.J. 2006. Census error and the
detection of density dependence. Journal of Animal Ecology 75: 837–851.
Garrott, R.A., Eberhardt, L.L., White, P.J., and J. Rotella. 2003. Climate induced variation in
vital rates of an unharvested large-herbivore population. Canadian Journal of Zoology 81:
33–45.
161
Griffin, K.A., Hebblewhite, M., Robinson, H.S., Zager, P., Barber‐Meyer, S.M., Christianson,
D., Creel, S., Harris, N.C., Hurley, M.A., Jackson, D.H., Myers, W.L., Raithel, J.D.,
Schlegel, M., Smith, B.L., White, C., and White, P.J. 2011. Neonatal mortality of elk
driven by climate, predator phenology and predator community composition. Journal of
Animal Ecology 80: 1246-1257.
Hebblewhite, M., Pletscher, D.H., and Paquet, P.C. 2002. Elk population dynamics in areas with
and without predation by recolonizing wolves in Banff National Park, Alberta. Canadian
Journal of Zoology 80: 789-799.
Hebblewhite, M. 2005. Predation by wolves interacts with the North Pacific Oscillation (NPO)
on a western North American elk population. Journal of Animal Ecology 74: 226-233.
Hegel, T.M., Mysterud, A., Ergon,T., Loe, L.E., Huettmann, F., and Stenseth, N.S. 2010.
Seasonal effects of Pacific‐based climate on recruitment in a predator‐limited large
herbivore. Journal of Animal Ecology 79: 471-482.
Huggard, D.J. 1993. Effect of snow depth on predation and scavenging by gray wolves. Journal
of Wildlife Management 57: 382-388.
Johnson, B.K., Coe, P.K., and Green, R.L. 2013. Abiotic, bottom-up and top-down influences on
recruitment of Rocky Mountain Elk in Oregon: A retrospective analysis. Journal of
Wildlife Management 77: 102-116.
McArt, S.H., Spalinger, D.E., Collins, W.B., Schoen, E.R., Stevenson, T., and Bucho, M. 2009.
Summer dietary nitrogen availability as a potential bottom-up constraint on moose in
south-central Alaska. Ecology 90: 1400-1411.
Mech, L.D., McRoberts, R.E., Peterson, R.O., and Page, R.E. 1987. Relationship of deer and
moose populations to previous winter’s snow. Journal of Animal Ecology 68: 1101-1122.
162
Melis, C., Jędrzejewska, B., Apollonio, M., Bartoń, K.A., Jędrzejewski, W., Linnell, J.D.,
Kojola, I., Kusak, J., Adamic, M., Ciuti, M., Delehan, I., Dykyy, I., Krapinec, K., Mattioli,
L., Sagaydak, A., Samchuk, M., Schmidt, M., Shkvyrya, M., Sidorovich, V.E., Zawadzka,
B., and Zhyla, S. 2009. Predation has a greater impact in less productive environments:
variation in roe deer, Capreolus capreolus, population density across Europe. Global
Ecology and Biogeography 18: 724-734.
Murray, D.L., Cox, E.W., Ballard, W.B., Whitlaw, H.A., Lenarz, M.S., Custer, T.W., Barnett, T.,
and Fuller, T.K. 2006. Pathogens, nutritional deficiency, and climatic influences on a
declining moose population. Wildlife Monographs 166: 1-29
Mysterud, A., Langvatn, R., Yoccoz, N.G., and Stenseth, N.C. 2001. Plant phenology, migration
and geographic variation in body weight of a large herbivore: the effect of variable
topography. Journal of Animal Ecology 70: 915-923.
Nelson, M.E. and Mech, D.L. 1986. Relationship between snow depth and gray wolf predation
on white-tailed deer. Journal of Wildlife Management 50: 471-474.
O’Gara, B.W. 2002. Taxonomy. In: Toweill, D.E and Thomas, J.W. (eds). North American Elk,
Ecology and Management. Pp 3–65. Smithsonian Institution Press.
Owen-Smith, N. 2010. Climate Influences: Temperate-Tropical Contrasts. In: Owen-Smith, N.
(ed). Dynamics of Large Herbivore Populations in Changing Environments: Towards
Appropriate Models. Pp 1-33. Blackwell Publishing Ltd.
Owen-Smith, N. and Marshal, J.P. 2010. Definitive Case Studies. In: Owen-Smith, N. (ed).
Dynamics of Large Herbivore Populations in Changing Environments: Towards
Appropriate Models. Pp: 1-33. Blackwell Publishing Ltd.
163
Parker, K.L., Barboza, P.S., and Gillingham, M.P. 2009. Nutrition integrates environmental
responses of ungulates. Functional Ecology 23: 57–69.
Peterson, R.0. 1977. Wolf ecology and prey relationships on Isle Royale. U.S. Natl. Park Serv.,
Sci. Monogr. Ser. No. 11.
Peterson, R.O. 1999. Wolf-moose interactions on Isle Royale: the end of natural regulation?
Ecological Applications 9: 10-16.
Picton, H.D. 1984. Climate and the prediction of reproduction of three ungulate species. Journal
of Applied Ecology 21: 869- 879.
Plummer, M. 2013. JAGS 3.4.0 Manual.
Popp, J.N., Toman, T., Mallory, F.F., and Hamr, J. 2014. A century of elk restoration in eastern
North America. Restoration Ecology 22: 723-730.
Post, E. and Stenseth, N.C. 1999. Climatic variability, plant phenology, and northern ungulates.
Ecology 80: 1322-1339.
Post, E., Peterson, R.O., Stenseth, N.C., and McLaren, B.E. 1999. Ecosystem consequences of
wolf behavioral response to climate. Nature 401: 905-907.
R Development Core Team. 2014. R: A language and environment for statistical computing.
Raedeke, K.J., Millspaugh, J.J., and Clark, P.E. 2002. Population Characteristics. In: Toweill,
D.E. and Thomas, J.W. (eds). North American Elk: Ecology and Management.
Smithsonian Institution Press.
Singer, F.J., Harting, A., Symonds, K.K., and Coughenour, M.B. 1997. Density dependence,
compensation, and environmental effects of elk calf mortality in Yellowstone after wolves.
Journal of Wildlife Management 61: 12-25.
164
Smith, D.W., Peterson, R.O., and Houston, D.B. 2003. Yellowstone after wolves. BioScience 53:
330-340.
Solberg, E.J., Jordhoy, J.P., Strand, O., Aanes, R., Loison, A., Saether, B.E., and Linnell, D.C.
2001. Effects of density-dependence and climate on the dynamics of a Svalbard reindeer
population. Ecography 24: 441-451.
Su, Y-S. and Yajima, M. 2014. R2jags: A Package for Running jags from R.
Taper, M. L. and Gogan, P.J. 2002. The northern Yellowstone elk: density dependence and
climatic conditions. The Journal of Wildlife Management 66: 106-122.
Telfer, E.S. and Kelsall, J.P. 1984. Adaptation of some large North American Mammals for
survival in snow. Ecology 65: 1828-1834.
Wang, G.M., Hobbs, N.T., Singer, E.J., Ojina, D.S., and Lubow, B.C. 2002. Impacts of climate
change on elk population dynamics in Rocky Mountain National Park, Colorado, USA.
Climate Change 54: 205-223.
Wilmers, C.C., Post, E., and Hastings, A. 2007. A perfect storm: the combined effects on
population fluctuations of autocorrelated environmental noise, age structure, and density
dependence. American Naturalist 169: 673–683.

165
Chapter 8
Conclusions and Management Recommendations
Although the number of successful elk restoration attempts have increased over the past century,
variation among success rates (population growth rates) exist. There is still a need to enhance
reintroduction strategies to ensure future attempts succeed and introduced populations become
self-sustaining. Major causes of elk mortality in restored populations differed between the pre-
and post-acclimation phases of reintroduction. Disease, emaciation, injury and accidents were
leading causes of pre-acclimation mortality for most populations; however, predation was more
important in northern populations. Although meningeal worm has been suggested as a significant
factor in the failure of early elk restoration attempts, it may not be as significant a factor of elk
mortality as previously thought. The identified major causes of mortality and differences
between pre- and post-acclimation periods of reintroduction should be considered by managers
planning future reintroductions, as well as by managers of established populations where
mitigation strategies can be developed accordingly.
Using an among-populations approach, I found that reintroduced elk population growth rates in
eastern North America were negatively related to the percentage of coniferous forest within elk
population ranges. Coniferous forests in eastern North America likely represent sub-optimal elk
habitat; however, due to the small sample size of populations available for this investigation,
there is potential for confounding or interacting variables that should be investigated further,
166
once more reintroduced populations become established allowing for improvement of sample
size. In the meantime, future elk reintroductions in eastern North America should consider
avoiding areas dominated by coniferous forest.
Although railway ecology is underrepresented in science, railways can impact wildlife negatively
in a number of ways. Vehicle and train collisions were reported as a major cause of post-
acclimation mortality in several reintroduced populations, and train collisions were the most
important cause of mortality of the Burwash population in Ontario. In that population, train
collisions were highly site-specific and positively correlated to the proximity of bends in the
railway. Although elk utilized the railway mostly in the spring and fall; behaviour likely
associated with seasonal range use, most train collisions were positively related to snow depth.
Railways are likely perceived by elk as easy travel corridors, and deep snow off the rails likely
prohibits escape from oncoming trains. Elk managers of populations affected by train-collision
mortality should identify train-collision hotspots in order to geographically focus the
implementation of winter mitigation strategies, when snow depths are greatest.
I found that in a system where black bears and wolves existed as the major predators of elk,
white-tailed deer, and moose, wolves preferred elk as a prey item over the other available
ungulate prey species. Bears on the other hand tended to utilize all ungulate species in proportion
to their availability. Wolves may be more influential to elk survival and wolf presence,
abundance, and the availability of other ungulate prey species should be carefully considered
when future elk reintroductions are being planned.

167
Elk response to climate is clearly population-specific. I found that increased snow fall was
associated with declines in population growth rates for only 2 of the 7 populations that were
assessed and only 1 population responded negatively to increased summer temperatures. Climate
likely interacts with other environmental variables and further investigations at a broad scale are
required. Because the effects of climate on elk population growth rates are not consistent among
populations, managers should be cautious when incorporating climate effects into future
reintroduction planning.
Overall, it is hoped that the research described in this dissertation has provided important
information, useful to elk managers across eastern North America. The results should contribute
to planning future reintroductions and promote continuity of established reintroduced
populations through management recommendations. The information in this dissertation also
highlights the importance of within- and among- populations approaches when investigating
factors that influence reintroduction success.

168
Appendix
(Additional articles published during PhD)
Animal Biology 65 (2015) 151–161 brill.com/ab
Problem behaviour of black bears (Ursus americanus) incentral Ontario: the effects of hunting and natural
food availability
Josef Hamr1, Jesse N. Popp2,∗, Dorthy L. Brown2 and Frank F. Mallory2
1 Applied Research, Cambrian College of Applied Arts and Technology, 1400 Barrydowne Road,Sudbury, Ontario P3A 3V8, Canada
2 Department of Biology, Laurentian University, 935 Ramsey Lake Road, Greater Sudbury,Ontario P3E 2C6, Canada
Submitted: March 23, 2015. Final revision received: June 9, 2015. Accepted: June 11, 2015
AbstractProblem bear behaviour in residential areas often results in human anxiety and potential injury, bearmortality and demographic instability. Identifying and understanding factors related to problem bearactivity and encounters is important for developing successful management strategies. Indices of nat-ural bear forage availability and hunting pressure were related to problem bear activity in centralOntario. Data were collected 5 years before and 5 years after the cancellation of a spring bear hunt,providing a unique opportunity to study the effect of management policy on problem behaviour. Prob-lem bear activity indices increased significantly following the closure of the spring hunt. Natural foodavailability from the previous year was found to be highly correlated with early season problem bearactivity indices; however, natural food availability during the same year was not significantly relatedto early or late season problem activity rates. This demonstrates that multiple potential causal agentsof problem bear behaviour need to be considered when developing management strategies.
KeywordsBlack bear; natural food availability; Ontario; problem behavior; spring hunt cancellation; Ursusamericanus
Introduction
Understanding factors that contribute to nuisance behaviour of wildlife species isvery important. With public pressure on wildlife managers to act, inappropriatestrategies may be developed with inadequate information. Problem bear behaviour
∗) Corresponding author; e-mail: [email protected]
© Koninklijke Brill NV, Leiden, 2015 DOI 10.1163/15707563-00002467
152 J. Hamr et al. / Animal Biology 65 (2015) 151–161
in residential areas can result in human anxiety, human injury, bear mortality anddemographic shifts. Analyses of human-bear interactions, as well as bear popu-lation and habitat quality fluctuations are central to understanding the causes ofproblem bear activity and for the development of effective management strategies.
In 1961, the black bear (Ursus americanus) was classified as a big game speciesin Ontario, Canada, while prior to that, hunting of black bears was unrestricted.Bears were harvested under combined deer-bear hunting and trapper’s licenses un-til 1980, when bear-only licenses were introduced. A new black bear managementprogram was initiated in 1987 which included a Bear Management Area (BMA)system, with two hunting seasons: spring (April 15th to June 15th) and fall (Septem-ber 1st to October 15th) (Poulin et al., 2003).
In Ontario, bears have been traditionally hunted over bait (Lompart, 1996). Mosthunters pre-bait their sites 1-2 months prior to the hunting season in an attempt toensure habituation of foraging bears to these locations. Hunting over bait is consid-ered unethical by many people and it has been blamed for creating problem bearsby association of humans with food. However, some Ontario bear hunters claimthat it reduces problem bear activity by providing supplementary food sources inthe natural environment (Poulin et al., 2003).
At central Ontario latitudes, common natural foods of black bears include; youngferns (Osmundaceae), grasses and sedges (Graminae), clovers (Leguminosae) andother forbs, aspen (Populus spp.) leaves, catkins and buds, a variety of northernberries, especially blueberries (Vaccinium spp.), and hard mast, such as acorns(Quercus spp.), beaked hazelnuts (Corylus cornuta) and American beechnuts (Fa-gus grandifolia). As opportunistic omnivores, bears also consume carrion and liveprey such as bird eggs and nestlings, spawning fish, newborn ungulates, rodents,and insects such as grasshoppers and crickets, but mainly members of the Order Hy-menoptera (ants, wasps and bees) (Jonkel & Cowan, 1971; Rogers, 1976; Boileauet al., 1994; Romain, 1996; DeBruyn, 1999; Pelton, 2000).
In Ontario, bears emerge from dens in April and their physical condition contin-ues to decline until mid-summer, as energy-rich food is scarce during this period(Obbard, 2003). Thus, bears are most likely to access anthropogenic food sourcesduring spring. Natural food varies in availability and abundance from year to year(Usui et al., 2005; Romain et al., 2013), and in central Ontario, blueberry produc-tion can vary from less than 10 kg to more than 100 kg per hectare (Landriault etal., 2000). Berry crop failures may occur as a result of late spring frost or sum-mer drought, causing short growing seasons and inducing bears to seek alternatefood sources (Banfield, 1974; Howe et al., 2010). Cub survival is often low follow-ing berry crop failures and few females produce offspring in the following winter(Rogers, 1976, 1987).
In January 1999, the Ontario Ministry of Natural Resources (OMNR) officiallyended the spring bear hunt. The reason given for ending the hunt was the purportedorphaning of cubs by hunters mistakenly killing lactating females. Ultimately, theend of the spring bear hunt was brought about through effective political lobbying
J. Hamr et al. / Animal Biology 65 (2015) 151–161 153
by animal rights organizations, rather than sound scientific evidence (Poulin et al.,2003).
The spring bear hunt cancellation was expected to have an effect on black beardemography and problem activity. Prior to 1999, about 6000 bears were shot annu-ally by hunters in Ontario, with the estimated spring cull ranging between 3000 and5000 (OMNR unpublished data) and it is widely believed that the lack of springhunting caused a substantial increase in the provincial bear population. Tradition-ally, the spring harvest targeted the male segment of the population, especiallydispersing juveniles (OMNR unpublished data), and it was believed that highernumbers of males would increase competition for food and incidents of problembehaviour. As the standard OMNR management measure for dealing with problembears in residential areas for 40 years (late 1970s to late 2000s) was trapping andrelocation (Landriault et al., 2009), it was expected that the need for this OMNRmanagement strategy would increase after the cancellation of the spring bear hunt.
In an effort to appease public concerns about anticipated increases in human-bear conflicts after the cancellation, the fall bear hunt period was expanded, startingin August 15th rather than September 1st. Subsequently in November 2013, theMinister of Natural Resources and Forestry announced the return of a two-year“pilot spring bear hunt”, limited to 8 Wildlife Management Units (WMUs), whichhad previously reported high levels of “nuisance bear activity”. The main impetusfor reinstating the modified spring bear hunt according to the Ministry of NaturalResources and Forestry was the concern for safety of northern Ontario residents(OMNR, 2013). The reinstatement of the spring bear hunt has caused a considerableregional rift in public opinion. In this context, it is therefore important to examineand bring forward scientific information on the factors influencing the dynamics ofproblem bear behaviour.
Natural food availability and bear numbers are presumed to be the main deter-mining factors affecting problem bear activity (Rogers, 1987, Obbard et al., 2003)and in northern Ontario, there is a general public perception that the 1999 can-cellation of the spring bear hunt has resulted in increased problem bear behavior(Poulin et al., 2003). The primary objective of this investigation was to test the re-lationship between annual natural forage availability and problem bear activity. Itwas expected that problem bear activity would be inversely related to natural for-age availability. The data for this study were collected prior to and after the 1999cancellation of the Ontario spring black bear hunt, allowing for a direct comparisonof the effects brought about by the policy change.
Materials and methods
Study area
Sudbury, Ontario is located at latitude 46°37′N and longitude 80°48′W and hasa regional population of approximately 160 274 people (Statistics Canada, 2011).Mining and smelting operations had caused soil acidification, providing good con-
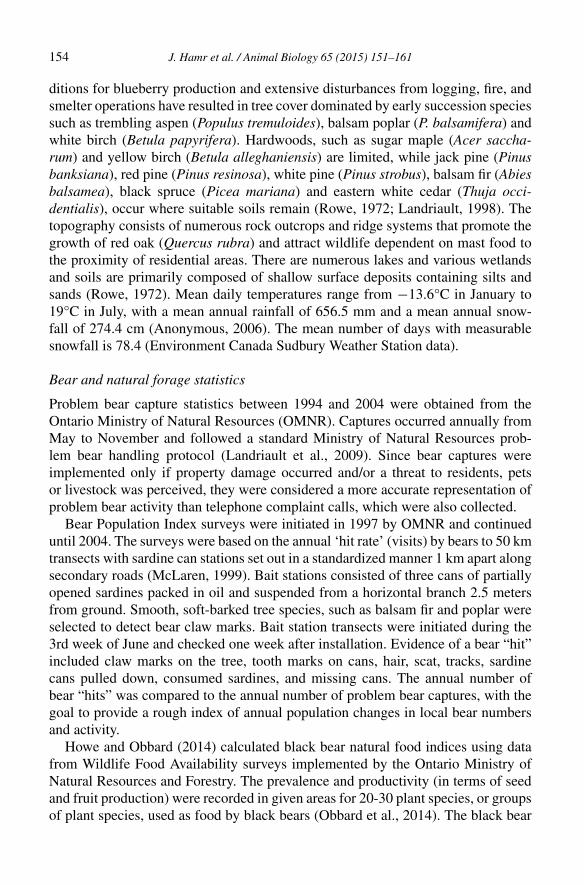
154 J. Hamr et al. / Animal Biology 65 (2015) 151–161
ditions for blueberry production and extensive disturbances from logging, fire, andsmelter operations have resulted in tree cover dominated by early succession speciessuch as trembling aspen (Populus tremuloides), balsam poplar (P. balsamifera) andwhite birch (Betula papyrifera). Hardwoods, such as sugar maple (Acer saccha-rum) and yellow birch (Betula alleghaniensis) are limited, while jack pine (Pinusbanksiana), red pine (Pinus resinosa), white pine (Pinus strobus), balsam fir (Abiesbalsamea), black spruce (Picea mariana) and eastern white cedar (Thuja occi-dentialis), occur where suitable soils remain (Rowe, 1972; Landriault, 1998). Thetopography consists of numerous rock outcrops and ridge systems that promote thegrowth of red oak (Quercus rubra) and attract wildlife dependent on mast food tothe proximity of residential areas. There are numerous lakes and various wetlandsand soils are primarily composed of shallow surface deposits containing silts andsands (Rowe, 1972). Mean daily temperatures range from −13.6°C in January to19°C in July, with a mean annual rainfall of 656.5 mm and a mean annual snow-fall of 274.4 cm (Anonymous, 2006). The mean number of days with measurablesnowfall is 78.4 (Environment Canada Sudbury Weather Station data).
Bear and natural forage statistics
Problem bear capture statistics between 1994 and 2004 were obtained from theOntario Ministry of Natural Resources (OMNR). Captures occurred annually fromMay to November and followed a standard Ministry of Natural Resources prob-lem bear handling protocol (Landriault et al., 2009). Since bear captures wereimplemented only if property damage occurred and/or a threat to residents, petsor livestock was perceived, they were considered a more accurate representation ofproblem bear activity than telephone complaint calls, which were also collected.
Bear Population Index surveys were initiated in 1997 by OMNR and continueduntil 2004. The surveys were based on the annual ‘hit rate’ (visits) by bears to 50 kmtransects with sardine can stations set out in a standardized manner 1 km apart alongsecondary roads (McLaren, 1999). Bait stations consisted of three cans of partiallyopened sardines packed in oil and suspended from a horizontal branch 2.5 metersfrom ground. Smooth, soft-barked tree species, such as balsam fir and poplar wereselected to detect bear claw marks. Bait station transects were initiated during the3rd week of June and checked one week after installation. Evidence of a bear “hit”included claw marks on the tree, tooth marks on cans, hair, scat, tracks, sardinecans pulled down, consumed sardines, and missing cans. The annual number ofbear “hits” was compared to the annual number of problem bear captures, with thegoal to provide a rough index of annual population changes in local bear numbersand activity.
Howe and Obbard (2014) calculated black bear natural food indices using datafrom Wildlife Food Availability surveys implemented by the Ontario Ministry ofNatural Resources and Forestry. The prevalence and productivity (in terms of seedand fruit production) were recorded in given areas for 20-30 plant species, or groupsof plant species, used as food by black bears (Obbard et al., 2014). The black bear
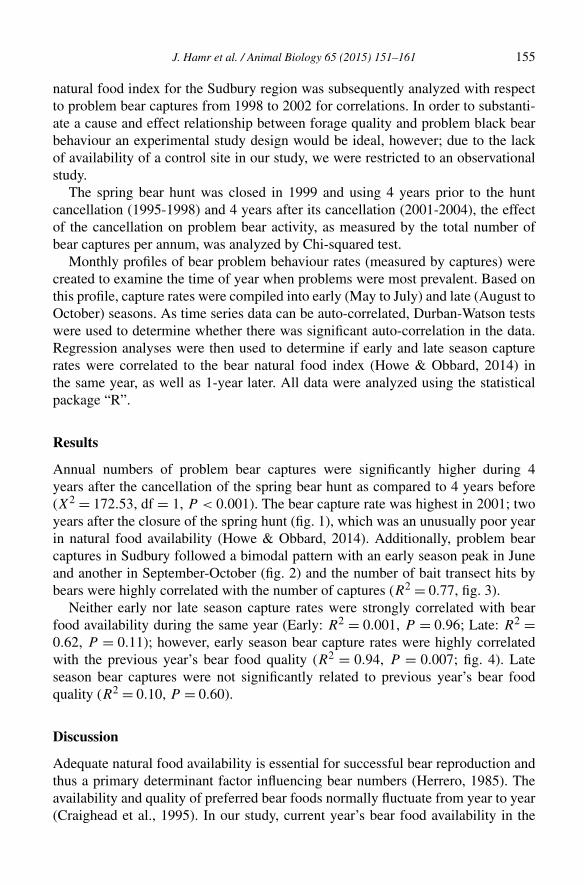
J. Hamr et al. / Animal Biology 65 (2015) 151–161 155
natural food index for the Sudbury region was subsequently analyzed with respectto problem bear captures from 1998 to 2002 for correlations. In order to substanti-ate a cause and effect relationship between forage quality and problem black bearbehaviour an experimental study design would be ideal, however; due to the lackof availability of a control site in our study, we were restricted to an observationalstudy.
The spring bear hunt was closed in 1999 and using 4 years prior to the huntcancellation (1995-1998) and 4 years after its cancellation (2001-2004), the effectof the cancellation on problem bear activity, as measured by the total number ofbear captures per annum, was analyzed by Chi-squared test.
Monthly profiles of bear problem behaviour rates (measured by captures) werecreated to examine the time of year when problems were most prevalent. Based onthis profile, capture rates were compiled into early (May to July) and late (August toOctober) seasons. As time series data can be auto-correlated, Durban-Watson testswere used to determine whether there was significant auto-correlation in the data.Regression analyses were then used to determine if early and late season capturerates were correlated to the bear natural food index (Howe & Obbard, 2014) inthe same year, as well as 1-year later. All data were analyzed using the statisticalpackage “R”.
Results
Annual numbers of problem bear captures were significantly higher during 4years after the cancellation of the spring bear hunt as compared to 4 years before(X2 = 172.53, df = 1, P < 0.001). The bear capture rate was highest in 2001; twoyears after the closure of the spring hunt (fig. 1), which was an unusually poor yearin natural food availability (Howe & Obbard, 2014). Additionally, problem bearcaptures in Sudbury followed a bimodal pattern with an early season peak in Juneand another in September-October (fig. 2) and the number of bait transect hits bybears were highly correlated with the number of captures (R2 = 0.77, fig. 3).
Neither early nor late season capture rates were strongly correlated with bearfood availability during the same year (Early: R2 = 0.001, P = 0.96; Late: R2 =0.62, P = 0.11); however, early season bear capture rates were highly correlatedwith the previous year’s bear food quality (R2 = 0.94, P = 0.007; fig. 4). Lateseason bear captures were not significantly related to previous year’s bear foodquality (R2 = 0.10, P = 0.60).
Discussion
Adequate natural food availability is essential for successful bear reproduction andthus a primary determinant factor influencing bear numbers (Herrero, 1985). Theavailability and quality of preferred bear foods normally fluctuate from year to year(Craighead et al., 1995). In our study, current year’s bear food availability in the
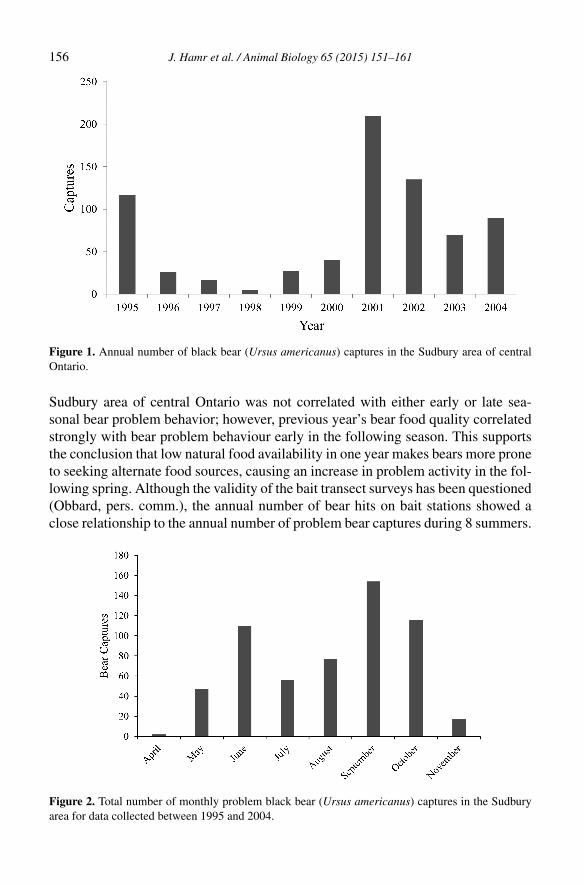
156 J. Hamr et al. / Animal Biology 65 (2015) 151–161
Figure 1. Annual number of black bear (Ursus americanus) captures in the Sudbury area of centralOntario.
Sudbury area of central Ontario was not correlated with either early or late sea-sonal bear problem behavior; however, previous year’s bear food quality correlatedstrongly with bear problem behaviour early in the following season. This supportsthe conclusion that low natural food availability in one year makes bears more proneto seeking alternate food sources, causing an increase in problem activity in the fol-lowing spring. Although the validity of the bait transect surveys has been questioned(Obbard, pers. comm.), the annual number of bear hits on bait stations showed aclose relationship to the annual number of problem bear captures during 8 summers.
Figure 2. Total number of monthly problem black bear (Ursus americanus) captures in the Sudburyarea for data collected between 1995 and 2004.
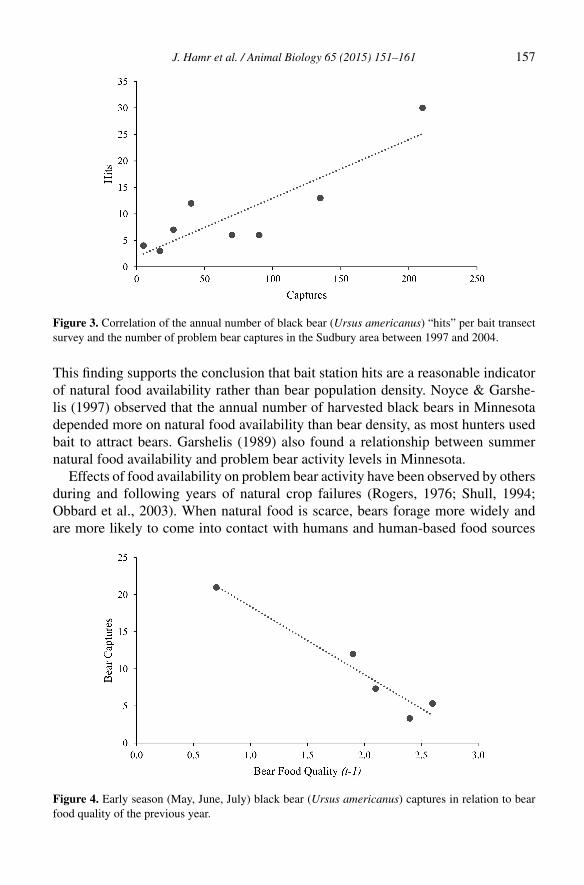
J. Hamr et al. / Animal Biology 65 (2015) 151–161 157
Figure 3. Correlation of the annual number of black bear (Ursus americanus) “hits” per bait transectsurvey and the number of problem bear captures in the Sudbury area between 1997 and 2004.
This finding supports the conclusion that bait station hits are a reasonable indicatorof natural food availability rather than bear population density. Noyce & Garshe-lis (1997) observed that the annual number of harvested black bears in Minnesotadepended more on natural food availability than bear density, as most hunters usedbait to attract bears. Garshelis (1989) also found a relationship between summernatural food availability and problem bear activity levels in Minnesota.
Effects of food availability on problem bear activity have been observed by othersduring and following years of natural crop failures (Rogers, 1976; Shull, 1994;Obbard et al., 2003). When natural food is scarce, bears forage more widely andare more likely to come into contact with humans and human-based food sources
Figure 4. Early season (May, June, July) black bear (Ursus americanus) captures in relation to bearfood quality of the previous year.
158 J. Hamr et al. / Animal Biology 65 (2015) 151–161
(Garshelis & Pelton, 1981; Garner & Vaughan, 1989; Garshelis, 1989; Guntheret al., 2004). Garshelis (1989) suggested that increases in problem bear activityfollowing poor food years may be related to poor body condition at emergence fromdens. It has also been noted that seasonal fruit and nut production can influencereproductive success and body mass the following spring (Rogers, 1976, 1987).
Significant increases in public complaint calls and problem bear captures oc-curred in central Ontario after the 1999 cancellation of the spring bear hunt in bothrich and poor food years (Brown, 2007). Thus, either problem bear activity, or pub-lic sensitivity to bears, or both, likely increased after the cancellation of the springbear hunt, independently of changes in food availability. Intense publicity increasespublic sensitivity to the presence of bears. Ordinary animal sightings often lead tocomplaint calls to the authorities requesting problem bear control (Ontario Provin-cial Police, OMNR, pers. comm.). The apparent 1999 increase in problem bearcomplaints by the public in some central Ontario jurisdictions should be viewed inthis light. Obbard et al. (2003) also suggested that heightened public awareness ofblack bear issues may have led to an increase in reporting rates after the 1999 springhunt cancellation. However, the present study suggests that natural food availability,in the previous year, is likely the chief determinant factor of problem bear activityin any given year.
Since the cancellation of the spring hunt, the annual bear harvest in Ontario hasbeen reduced by approximately 1550 animals, representing about 1.5-2.1% of theestimated provincial population (Poulin et al., 2003). Obbard (2003) noted thatblack bears are long-lived mammals with low reproductive rates, whose femalesdo not begin to breed until 4-5 years of age. He therefore speculated that any im-mediate increase in problem bear activity could not be attributed solely to changesin bear numbers, since bear numbers change slowly. Garshelis (1989) also reportedthat increases in complaint calls were poorly correlated with increases in bear num-bers in Minnesota. A recent study by Obbard et al. (2014) on the relationshipsbetween food availability, human-bear conflicts and bear harvest in Ontario showedthat human-bear conflicts were negatively correlated with food availability acrossthe province. The authors also found no evidence that larger prior bear harvestsreduced subsequent human-bear conflicts (Obbard et al., 2014).
Poor food years result in reproductive synchronization of female black bears,which results in the appearance of a large cohort of cubs two years after the cropfailure (McLaughlin et al., 1994). As these animals later become dispersing juve-niles and attempt to establish home ranges of their own, the chances of encounteringhumans and causing conflicts can increase. Obbard et al. (2003) reported large co-horts of cubs born in Ontario in 1997, 1999 and 2001, which were attributed tosynchronization of the female breeding cycle after the 1995 crop failure. Alongwith increased public sensitivity to bears following the spring hunt cancellation, alarge class of dispersing juveniles may have accounted for the 5-fold increase incaptured problem bears in Sudbury from 1998 to 1999.
J. Hamr et al. / Animal Biology 65 (2015) 151–161 159
In conclusion, results of this study lend support to the notion that natural foodavailability and problem bear activity are linked. Effects of annual and regionalfluctuations in natural food production on problem bear behaviour appear to over-shadow changes in bear harvesting practices, such as the cancellation of the springbear hunt. Therefore, it follows that the recently introduced pilot spring bear huntwill not likely induce significant changes in problem bear activity across centralOntario. Importantly, the one year time lag in the effects of natural food productionon problem bear activity allows for the design of predictive models of problem bearactivity as a function of annual natural food yields. If widely adopted, this approachcould facilitate management and conservation of this important species.
Acknowledgements
The authors thank Area Biologist, M. N. Hall of the Ontario Ministry of Natural Re-sources (OMNR) for assistance with data collection. Thanks also go to CambrianCollege and Laurentian University students, OMNR conservation officers and re-source technicians, who captured/relocated problem bears and answered/recordedcomplaint calls from the public between 1995 and 2004. Financial assistance wasprovided by the Canadian Outdoor Heritage Alliance, Laurentian University and theNorthern Environmental Heritage Institute at Cambrian College, Sudbury, Ontario.
References
Anonymous (2006) Canadian Climate Normals 1971-2000. Environ. Can. (www.climate.weatheroffice.ec.gc.ca/climate_normals)
Banfield, A.W.F. (1974) The Mammals of Canada. University of Toronto Press.Boileau, F., Crete, M. & Huot, J. (1994) Food habits of the black bear, Ursus americanus, and habitat
use in Gaspesie Park, eastern Quebec. Can. Field-Nat., 108, 162-169.Brown, D.L. (2007) Problem black bear (Ursus americanus) dynamics in Central Ontario in relation
to the cancellation of the Spring Bear Hunt (1999). M.Sc. Thesis, Dept. of Biology, LaurentianUniversity, Sudbury, Ontario.
Craighead, L., Paetkau, D., Reynolds, H.V., Vyse, E.R. & StroBeck, C. (1995) Microsatellite analysisof paternity and reproduction in Arctic grizzly bears. J. Hered., 86, 255-261.
DeBruyn, T.D. (1999) Walking with Bears. The Lyons Press.Garner, N.P. & Vaughan, M.R. (1989) Black bear – human interactions in Shenandoah National Park,
Virginia. In: M. Bromley (Ed.) Bear-People Conflicts: Proceedings of a Symposium on Manage-ment Strategies, pp. 155-161. Northwest Territories, Dept. of Renewable Resources, Yellowknife,NWT.
Garshelis, D.L. (1989) Nuisance bear activity and management in Minnesota. In: M. Bromley (Ed.)Bear-People Conflicts: Proceedings of a Symposium on Management Strategies, pp. 160-180.Northwest Territories, Dept. of Renewable Resources, Yellowknife, NWT.
Garshelis, D.L. & Pelton, M.R. (1981) Movements of black bears in the Great Smokey MountainsNational Park. J. Wildl. Manage., 45, 912-925.
Gunther, K.A., Haroldson, M.A., Frey, K., Cain, S.L., Copeland, J. & Schwartz, C.C. (2004) Grizzlybear-human conflicts in the Greater Yellowstone ecosystem, 1992-2000. Ursus, 15, 10-22.

160 J. Hamr et al. / Animal Biology 65 (2015) 151–161
Herrero, S. (1985) Bear Attacks – Their Causes and Avoidance. New Century Publishers, Inc., Piscat-away, New Jersey.
Howe, E.J., Obbard, M.E. & Smith, H. (2003) Literature review of factors affecting nuisance bearactivity. In: Nuisance Bear Review Committee: report and recommendations. Appendix 9, unpubl.rep. Ont. Min. Nat. Res. 38 pp.
Howe, E.J., Obbard, M.E., Black, R. & Wall, L.L. (2010) Do public complaints reflect trends inhuman–bear conflict? Ursus, 21, 13-142.
Howe, E.J. & Obbard, M.E. (2014) Ontario Wildlife Food Survey, 2013. Wildlife Research Series2014-01. Science and Research Branch, Ministry of Natural Resources, Peterborough, Ontario,78 pp.
Jonkel, C.J. & Cowan, I.M.T. (1971) The black bear in the spruce-fir forest. Wildl. Monogr., 27, 1-57.
Landriault, L.J. (1998) Nuisance black bear (Ursus americanus) behaviour in Central Ontario. Un-published M.Sc. Thesis, Dept. of Biology, Laurentian University, Sudbury, Ontario, 95 pp.
Landriault, L.J., Obbard, M.E. & Rettie, W.J. (2000) Nuisance black bears and what to do with them.OMNR, Northeast Science and Technology. TN-042, 20 pp.
Landriault, L.J., Brown, G.S., Hamr, J. & Mallory, F.F. (2009) Age, sex and relocation as predictorsof return for relocated nuisance black bears Ursus americanus in Ontario, Canada. Wildl. Biol., 15,155-164.
Lompart, C. (1996) Black bear in Ontario: status and management. Fed. Ont. Nat. 62 pp.
McLaren, M. (1999) Report on 1997 Bear Population Index Network with a population estimate basedon 1994-1997 results. Ont. Min. of Nat. Res., South-central Sciences Section, Technical Report#110.
McLaughlin, C.R., Matula, G.R. & O’Connor Jr., R.J. (1994) Synchronous reproduction by Maineblack bears. Int. Conf. Bear Res. and Manage., 9, 471-479.
Obbard, M.E. (2003) Black bear ecology. In: Nuisance Bear Review Committee: report and recom-mendations. Appendix 5, unpubl. rep. Ont. Min. Nat. Res. 38 pp.
Obbard, M.E., Pond, B.A. & Howe, E.J. (2003) Analysis of relationships among black bear nuisanceactivity, food availability, and harvest in Ontario. In: Nuisance Bear Review Committee: report andrecommendations. Appendix 5, unpubl. rep. Ont. Min. Nat. Res. 38 pp.
Obbard, M.E., Howe, E.J., Wall, L.L., Allison, B., Black, R., Davis, P., Dix-Gibson, L., Gatt, M.& Hall, M.N. (2014) Relationships among food availability, harvest, and human–bear conflict atlandscape scales in Ontario, Canada. Ursus, 25, 98-110.
OMNR (2013). Ontario proposing a black bear management pilot in north: government committed tosustainable bear management, public safety, news release. http://news.ontario.ca/mnr/en/2013/11/ontario-proposing-a-black-bear-management-pilot-in-north.html.
Pelton, M.R. (2000) Black bear. In: S. Demarais & P.R. Krausman (Eds.) Ecology and Managementof Large Mammals in North America, pp. 389-408. Prentice Hall, Inc., New Jersey, USA.
Poulin, R., Knight, J., Obbard, M.E. & Winterspoon, G. (2003) Nuisance Bear Review Committee:report and recommendations. Unpubl. rep. Ont. Min. Nat. Res. 38 pp.
Rogers, L.L. (1976) Effects of mast and berry crop failures on survival, growth and reproductionsuccess of black bears. Trans. N. Am. Wildl. Conf., 41, 431-438.
Rogers, L.L. (1987) Effects of food supply and kinship on social behaviour, movements, and popula-tion growth of black bears in northeastern Minnesota. Wildl. Monogr., 97, 1-72.
Romain, D.A. (1996) Black bear (Ursus americanus) food habits and nutrition of reproductive femalesin northern Ontario. M.Sc. Thesis, University of Guelph, Guelph, Ontario, 170 pp.

J. Hamr et al. / Animal Biology 65 (2015) 151–161 161
Romain, D.A., Obbard, M.E. & Atkinson, J.L. (2013) Temporal variation in food habits of the Amer-ican black bear (Ursus americanus) in the boreal forest of northern Ontario. Can. Field Nat., 127,118-130.
Rowe, J.S. (1972) Forest regions of Canada. Publ. No. 1300, Can. For. Serv., Ottawa. 172 pp.Shull, S.D. (1994) Management of nuisance black bears (Ursus americanus) in the interior highland
of Arkansas. M.Sc. Thesis, University of Arkansas, 101 pp.Statistics Canada (2011) Statistics Canada Census Profile. http://www12.statcan.gc.ca.Usui, M., Kevan, P.G. & Obbard, M.E. (2005) Pollination and breeding system of lowbush blueberries
(Vaccinium angustifolium Ait. and V. myrtilloides Michx. (Ericacaeae)) in the boreal forest. Can.Field-Nat., 119, 48-57.
Animal Biology (2016) DOI 10.1163/15707563-00002500 brill.com/ab
Fine-scale tertiary-road features influence wildlife use:a case study of two major North American predators
Jesse N. Popp∗ and Victoria M. Donovan
Department of Biology, Laurentian University, 935 Ramsey Lake Road,Sudbury, Ontario, P3E 2C6, Canada
Submitted: November 30, 2015. Final revision received: April 21, 2016. Accepted: April 30, 2016
AbstractRoads have become a major concern for wildlife managers. Determining if fine-scale features in-fluence wildlife road use is crucial information when developing management strategies to protectspecies at risk or to assist in preventing negative trophic interactions. We investigated the effects offine-scale habitat and road-related features on the tertiary-road use of two major predator groups, theAmerican black bear (Ursus americanus) and wolves (Canis lupus, C. lycaon, and hybrids). Scat oc-currence, used as a measure of a species’ intensity of use, along with several road-related features andsurrounding fine-scale habitat variables, were recorded within tertiary-road segments near Sudbury,Ontario, Canada. An information theoretic approach was used to determine which of several differentcandidate models best predicted tertiary-road use by our major predator groups. Road width and dis-tance to primary roads were found to be the strongest predictors of occurrence on tertiary roads forboth predators, with smaller road width and greater distances to primary roads leading to higher levelsof occurrence. Habitat cover and cover type, expected to influence foraging opportunities, were notfound to be strong predictors of tertiary-road use. Our findings highlight the importance of fine-scalestudies for understanding road use.
KeywordsAnthropogenic disturbance; black bear; Canis lupus; road; Ursus americanus; wolf
Introduction
Wildlife habitat studies are a major aspect of ecological research and are often ex-amined over multiple spatial scales. Broad-scale habitat selection studies basedon landscape level classifications are common, as larger scales will inherentlyconstrain decisions made at finer scales (Johnson, 1980); however, research also
∗) Corresponding author; e-mail: [email protected]
© Koninklijke Brill NV, Leiden, 2016 DOI 10.1163/15707563-00002500
2 J.N. Popp and V.M. Donovan / Animal Biology (2016)
highlights the importance of understanding the fine-scale aspects of specific habitatpatches or features, especially when considering anthropogenic disturbance. For in-stance, animals can select for or avoid habitat patches based on fine-scale featuressuch as the level of cover or the abundance of a particular type of forage (Briand etal., 2009; Godbout & Ouellet, 2010). Changes in fine-scale features caused by an-thropogenic disturbance can result in the lowered use or abandonment of previouslyutilised areas (Hodson et al., 2010; Pike et al., 2010). Understanding fine-scale re-lationships between wildlife and their respective habitats can assist managers inmitigating the impacts of anthropogenic disturbance.
Roads have become a common feature in many managed wildlife landscapesand have been linked both directly, and indirectly, to wildlife mortality, reproduc-tive depressions, and population persistence (Hu et al., 2005; Whittington et al.,2011; Heinrichsa et al., 2015; Souza et al., 2015). Multiple broad-scale habitatselection studies have underlined the tendencies of animals to avoid roads, thusbecoming barriers to movement (Dyer et al., 2001; Meisingset et al., 2013; Litvaitiset al., 2015). Decisions to avoid roads by wildlife have been shown to be relatedto the level of traffic, with heavier traffic generally leading to greater levels of dis-turbance for wildlife (Montgomery et al., 2012; Northrup et al., 2012). Althoughsome wildlife has been documented avoiding higher level traffic areas, many preda-tors have been observed utilising low traffic roads which enable easier movementthrough habitats (Dickson et al., 2005; Northrup et al., 2012; Van Manen et al.,2012; Zimmermann et al., 2014). However, roads can facilitate movement for somespecies but can act as barriers to movement for others (Laurance et al., 2004; Huet al., 2005; Bartzke et al., 2015). The presence of roads can therefore lead to dra-matic shifts in trophic interactions (Whittington et al., 2011; Courbin et al., 2014;Graeme et al., 2014), and altered predation pressures on prey species (Kunkel &Pletscher, 2000; Whittington et al., 2011). Understanding the fine-scale habitat androad-related features influencing predator use of low-traffic, tertiary roads, can thusnot only help managers understand predator-road relationships, but can also poten-tially assist in mitigating the impacts of roads on prey species. However, few studieshave identified fine-scale features associated with road use beyond traffic level, suchas road width or road-side vegetation.
We selected two common major large predators with extensive ranges acrossNorth America to determine if fine-scale features are associated with predator roaduse. The American black bear (Ursus americanus) and the grey wolf (Canis lupus)have been shown to avoid high activity roads (Gurarie et al., 2011; Van Manen et al.,2012); however, they have been found to strongly select for tertiary or low-use roads(Gurarie et al., 2011; Latham et al., 2011; Lesmerises et al., 2012). By using scatlocation as a measure of a species’ occurrence, a method that has been introducedas a non-invasive way to identify space use (Wasser et al., 2011), we evaluatedwhether surrounding fine-scale habitat and road-related features influenced the useof tertiary roads by each species.
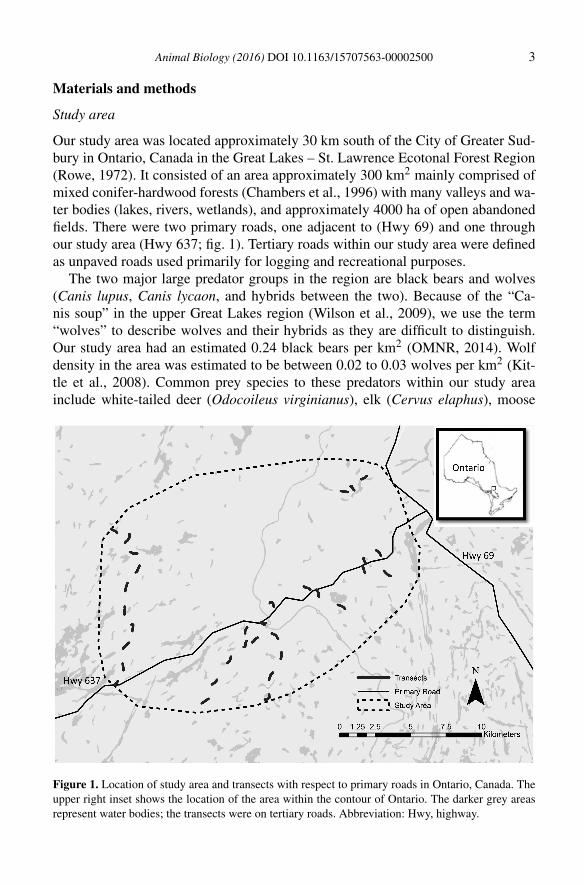
Animal Biology (2016) DOI 10.1163/15707563-00002500 3
Materials and methods
Study area
Our study area was located approximately 30 km south of the City of Greater Sud-bury in Ontario, Canada in the Great Lakes – St. Lawrence Ecotonal Forest Region(Rowe, 1972). It consisted of an area approximately 300 km2 mainly comprised ofmixed conifer-hardwood forests (Chambers et al., 1996) with many valleys and wa-ter bodies (lakes, rivers, wetlands), and approximately 4000 ha of open abandonedfields. There were two primary roads, one adjacent to (Hwy 69) and one throughour study area (Hwy 637; fig. 1). Tertiary roads within our study area were definedas unpaved roads used primarily for logging and recreational purposes.
The two major large predator groups in the region are black bears and wolves(Canis lupus, Canis lycaon, and hybrids between the two). Because of the “Ca-nis soup” in the upper Great Lakes region (Wilson et al., 2009), we use the term“wolves” to describe wolves and their hybrids as they are difficult to distinguish.Our study area had an estimated 0.24 black bears per km2 (OMNR, 2014). Wolfdensity in the area was estimated to be between 0.02 to 0.03 wolves per km2 (Kit-tle et al., 2008). Common prey species to these predators within our study areainclude white-tailed deer (Odocoileus virginianus), elk (Cervus elaphus), moose
Figure 1. Location of study area and transects with respect to primary roads in Ontario, Canada. Theupper right inset shows the location of the area within the contour of Ontario. The darker grey areasrepresent water bodies; the transects were on tertiary roads. Abbreviation: Hwy, highway.
4 J.N. Popp and V.M. Donovan / Animal Biology (2016)
(Alces alces), beaver (Castor canadensis), and muskrat (Ondatra zibethicus) (Popp,unpublished data).
Data collection
We used tertiary-road transects (of 500 m stretches) as our primary sampling unit(N = 32), as this allowed us to relate surrounding habitat and road-related featuresto intensity of use. Wolf and bear scat locations along tertiary roads were recordedover a three-year period from the beginning of May to the end of August from 2013to 2015. We selected the summer season because of the high sightability of scat.Scats were identified and recorded by the same observer to remove bias (Spauldinget al., 2000). An ATV was used to search for scat; we maintained driving speeds of10-15 km/hour to ensure consistent sightability. Roads were sampled every 2 weeksat each location and once scat locations were recorded, scats were removed fromthe road to eliminate resampling. To ensure thorough coverage of the study area,every tertiary road with adequate ATV access was sampled.
Tertiary roads were subdivided into 500 m segments that were �1 km from eachother if on a continuous stretch. We calculated Moran’s I using the R package ‘ape’(Paradis et al., 2004) for wolf and bear scat contained within each road segment todetermine their spatial independence. To characterise fine-scale habitat within each500 m road segment, several habitat features were recorded every 100 m of eachroad segment at the end of our study period in our last study year. Road-relatedfeatures measured included road width, as well as road cover type in a 1-meterspan across the entire road width (% herbaceous cover, % gravel and dirt cover).The percentage of different habitat types within a 10 × 10 m area starting fromthe roadside were recorded (% herbaceous, shrub, wetland, forest) with the roadside examined (left or right) chosen randomly. The percentage of canopy cover wasmeasured using a densitometer held at waist height 5 m from road edge. Becauseboth wolves and bears have been shown to avoid high traffic areas (Gurarie et al.,2011; Van Manen et al., 2012), we used ArcGIS v10 to measure the straight-linedistance of the center of each road segment to the nearest primary road within ourstudy area.
Data analysis
Values for each habitat variable from all sites measured within each transect wereaveraged to create one value per transect (Elzinga et al., 2001). Where strong corre-lation between independent variables was found (Pearson Correlation value > 0.5),only one variable was kept within the analysis.
We created 6 different candidate regression models expected to reflect differenthabitat features that may have been influencing animal road-use based on their re-lation to anthropogenic disturbance and foraging opportunities. Forage availabilitywas assumed to be related to the percentage of vegetation cover. Black bears forageon green vegetation, such as grasses and sedges, as well as fruit during the summer
Animal Biology (2016) DOI 10.1163/15707563-00002500 5
(Raine & Kansas, 1990; Costello, 1992; Romain et al., 2013), and have been foundto select areas with higher abundances of food items, including wetlands and opencanopy areas (Costello & Sage, 1994; Fecske et al., 2002). Wolves have been shownto select for areas where there is a higher abundance of their prey items (Lesmeriseset al., 2012). Wetlands, grasslands and shrub-rich areas are likely to contain moose,white-tailed deer or elk during the summer season (Cairns & Telfer, 1980; Ricca etal., 2003; Nikula et al., 2004; Anderson et al., 2005; Masse & Cote, 2012; Streetet al., 2015). Smaller prey species like beaver and muskrat are generally found inwetland areas. Therefore, the percentage of wetland, shrub, and herbaceous areawas predicted to represent potential foraging opportunity.
All statistical analyses were conducted using the ‘R’ statistical software v.3.0.1(R Core Team, 2013). Interaction terms were only maintained within candidatemodels if found to be significant (Zuur et al., 2009). Akaike’s Information Criterioncorrected for small sample sizes (AICc) was used to determine model fit amongcandidate models using the package ‘MuMIn’ (Barton, 2014). If the top rankingmodel had a model weight below 0.90, then model averaging was applied to allmodels which had a weight above 0.10.
Results
In total, 73 wolf and 97 bear scats fell within transects. Moran’s I was non-significant for both wolves and bears (P > 0.05), and road segments were thereforetreated as independent. Strong correlations were found between the percentage offorest on road sides and the amount of canopy cover (Pearson Correlation value =0.90), as well as between our two road-cover variables (Pearson Correlation value =−0.58). As such, only canopy cover and the percentage of herbaceous road-coverwere included within our statistical analysis.
The information theoretic approach identified the importance of the same twofeatures in determining bear and wolf occurrence on a tertiary-road transect: thedistance of a road transect to highway primary-road, and the width of the road theywere utilising (table 1). Models containing vegetation features, as well as road-surface features were found to be among the lowest ranking models for both species(table 1). The model which did not contain distance to a primary road or road widthwas our lowest-ranking model for both species (table 1).
Both bears and wolves tended to utilise road transects with decreased width (ta-ble 2). There was also a higher level of bear occurrence on road transects fartheraway from primary roads within our study area (table 2). Wolf occurrence was influ-enced by an interaction between road width and distance to a primary road, whichsuggests that as wolves become farther from primary roads, the effects of road widthon wolf occurrence decreased (table 2). Similarly, as wolves become closer to pri-mary roads, road width became more important in predicting their occurrence ontertiary roads.
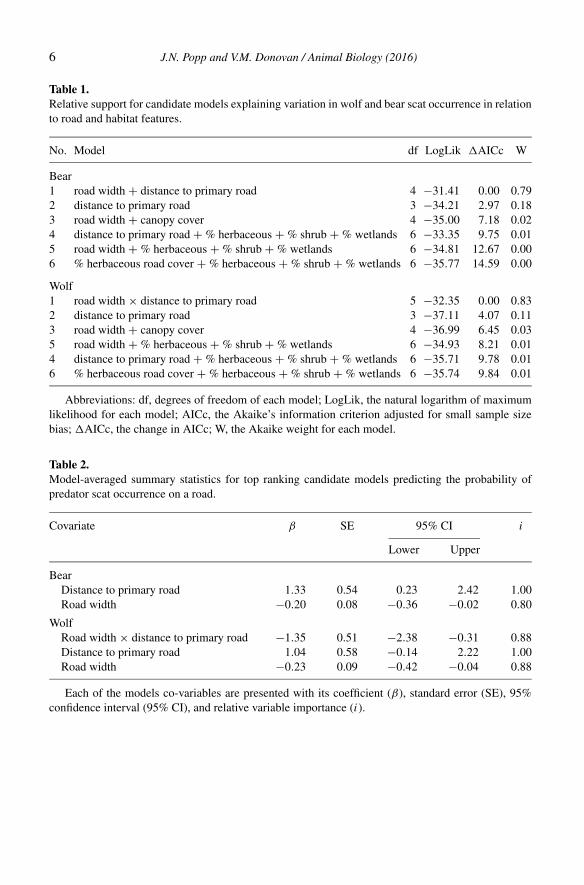
6 J.N. Popp and V.M. Donovan / Animal Biology (2016)
Table 1.Relative support for candidate models explaining variation in wolf and bear scat occurrence in relationto road and habitat features.
No. Model df LogLik �AICc W
Bear1 road width + distance to primary road 4 −31.41 0.00 0.792 distance to primary road 3 −34.21 2.97 0.183 road width + canopy cover 4 −35.00 7.18 0.024 distance to primary road + % herbaceous + % shrub + % wetlands 6 −33.35 9.75 0.015 road width + % herbaceous + % shrub + % wetlands 6 −34.81 12.67 0.006 % herbaceous road cover + % herbaceous + % shrub + % wetlands 6 −35.77 14.59 0.00
Wolf1 road width × distance to primary road 5 −32.35 0.00 0.832 distance to primary road 3 −37.11 4.07 0.113 road width + canopy cover 4 −36.99 6.45 0.035 road width + % herbaceous + % shrub + % wetlands 6 −34.93 8.21 0.014 distance to primary road + % herbaceous + % shrub + % wetlands 6 −35.71 9.78 0.016 % herbaceous road cover + % herbaceous + % shrub + % wetlands 6 −35.74 9.84 0.01
Abbreviations: df, degrees of freedom of each model; LogLik, the natural logarithm of maximumlikelihood for each model; AICc, the Akaike’s information criterion adjusted for small sample sizebias; �AICc, the change in AICc; W, the Akaike weight for each model.
Table 2.Model-averaged summary statistics for top ranking candidate models predicting the probability ofpredator scat occurrence on a road.
Covariate β SE 95% CI i
Lower Upper
BearDistance to primary road 1.33 0.54 0.23 2.42 1.00Road width −0.20 0.08 −0.36 −0.02 0.80
WolfRoad width × distance to primary road −1.35 0.51 −2.38 −0.31 0.88Distance to primary road 1.04 0.58 −0.14 2.22 1.00Road width −0.23 0.09 −0.42 −0.04 0.88
Each of the models co-variables are presented with its coefficient (β), standard error (SE), 95%confidence interval (95% CI), and relative variable importance (i).
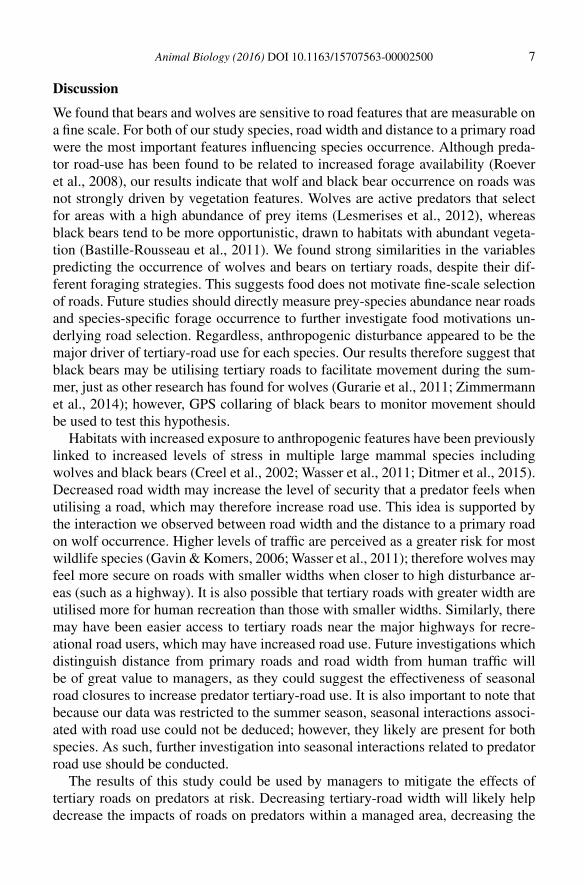
Animal Biology (2016) DOI 10.1163/15707563-00002500 7
Discussion
We found that bears and wolves are sensitive to road features that are measurable ona fine scale. For both of our study species, road width and distance to a primary roadwere the most important features influencing species occurrence. Although preda-tor road-use has been found to be related to increased forage availability (Roeveret al., 2008), our results indicate that wolf and black bear occurrence on roads wasnot strongly driven by vegetation features. Wolves are active predators that selectfor areas with a high abundance of prey items (Lesmerises et al., 2012), whereasblack bears tend to be more opportunistic, drawn to habitats with abundant vegeta-tion (Bastille-Rousseau et al., 2011). We found strong similarities in the variablespredicting the occurrence of wolves and bears on tertiary roads, despite their dif-ferent foraging strategies. This suggests food does not motivate fine-scale selectionof roads. Future studies should directly measure prey-species abundance near roadsand species-specific forage occurrence to further investigate food motivations un-derlying road selection. Regardless, anthropogenic disturbance appeared to be themajor driver of tertiary-road use for each species. Our results therefore suggest thatblack bears may be utilising tertiary roads to facilitate movement during the sum-mer, just as other research has found for wolves (Gurarie et al., 2011; Zimmermannet al., 2014); however, GPS collaring of black bears to monitor movement shouldbe used to test this hypothesis.
Habitats with increased exposure to anthropogenic features have been previouslylinked to increased levels of stress in multiple large mammal species includingwolves and black bears (Creel et al., 2002; Wasser et al., 2011; Ditmer et al., 2015).Decreased road width may increase the level of security that a predator feels whenutilising a road, which may therefore increase road use. This idea is supported bythe interaction we observed between road width and the distance to a primary roadon wolf occurrence. Higher levels of traffic are perceived as a greater risk for mostwildlife species (Gavin & Komers, 2006; Wasser et al., 2011); therefore wolves mayfeel more secure on roads with smaller widths when closer to high disturbance ar-eas (such as a highway). It is also possible that tertiary roads with greater width areutilised more for human recreation than those with smaller widths. Similarly, theremay have been easier access to tertiary roads near the major highways for recre-ational road users, which may have increased road use. Future investigations whichdistinguish distance from primary roads and road width from human traffic willbe of great value to managers, as they could suggest the effectiveness of seasonalroad closures to increase predator tertiary-road use. It is also important to note thatbecause our data was restricted to the summer season, seasonal interactions associ-ated with road use could not be deduced; however, they likely are present for bothspecies. As such, further investigation into seasonal interactions related to predatorroad use should be conducted.
The results of this study could be used by managers to mitigate the effects oftertiary roads on predators at risk. Decreasing tertiary-road width will likely helpdecrease the impacts of roads on predators within a managed area, decreasing the
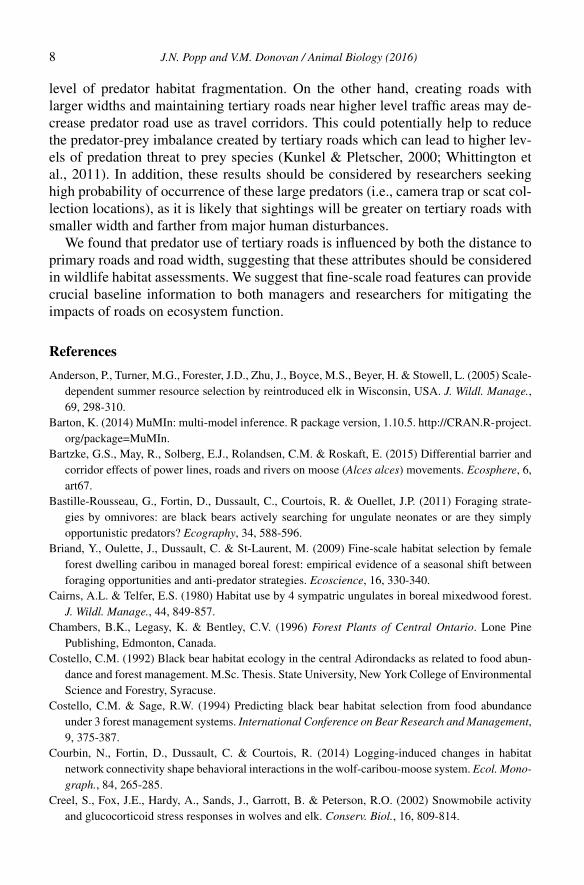
8 J.N. Popp and V.M. Donovan / Animal Biology (2016)
level of predator habitat fragmentation. On the other hand, creating roads withlarger widths and maintaining tertiary roads near higher level traffic areas may de-crease predator road use as travel corridors. This could potentially help to reducethe predator-prey imbalance created by tertiary roads which can lead to higher lev-els of predation threat to prey species (Kunkel & Pletscher, 2000; Whittington etal., 2011). In addition, these results should be considered by researchers seekinghigh probability of occurrence of these large predators (i.e., camera trap or scat col-lection locations), as it is likely that sightings will be greater on tertiary roads withsmaller width and farther from major human disturbances.
We found that predator use of tertiary roads is influenced by both the distance toprimary roads and road width, suggesting that these attributes should be consideredin wildlife habitat assessments. We suggest that fine-scale road features can providecrucial baseline information to both managers and researchers for mitigating theimpacts of roads on ecosystem function.
References
Anderson, P., Turner, M.G., Forester, J.D., Zhu, J., Boyce, M.S., Beyer, H. & Stowell, L. (2005) Scale-dependent summer resource selection by reintroduced elk in Wisconsin, USA. J. Wildl. Manage.,69, 298-310.
Barton, K. (2014) MuMIn: multi-model inference. R package version, 1.10.5. http://CRAN.R-project.org/package=MuMIn.
Bartzke, G.S., May, R., Solberg, E.J., Rolandsen, C.M. & Roskaft, E. (2015) Differential barrier andcorridor effects of power lines, roads and rivers on moose (Alces alces) movements. Ecosphere, 6,art67.
Bastille-Rousseau, G., Fortin, D., Dussault, C., Courtois, R. & Ouellet, J.P. (2011) Foraging strate-gies by omnivores: are black bears actively searching for ungulate neonates or are they simplyopportunistic predators? Ecography, 34, 588-596.
Briand, Y., Oulette, J., Dussault, C. & St-Laurent, M. (2009) Fine-scale habitat selection by femaleforest dwelling caribou in managed boreal forest: empirical evidence of a seasonal shift betweenforaging opportunities and anti-predator strategies. Ecoscience, 16, 330-340.
Cairns, A.L. & Telfer, E.S. (1980) Habitat use by 4 sympatric ungulates in boreal mixedwood forest.J. Wildl. Manage., 44, 849-857.
Chambers, B.K., Legasy, K. & Bentley, C.V. (1996) Forest Plants of Central Ontario. Lone PinePublishing, Edmonton, Canada.
Costello, C.M. (1992) Black bear habitat ecology in the central Adirondacks as related to food abun-dance and forest management. M.Sc. Thesis. State University, New York College of EnvironmentalScience and Forestry, Syracuse.
Costello, C.M. & Sage, R.W. (1994) Predicting black bear habitat selection from food abundanceunder 3 forest management systems. International Conference on Bear Research and Management,9, 375-387.
Courbin, N., Fortin, D., Dussault, C. & Courtois, R. (2014) Logging-induced changes in habitatnetwork connectivity shape behavioral interactions in the wolf-caribou-moose system. Ecol. Mono-graph., 84, 265-285.
Creel, S., Fox, J.E., Hardy, A., Sands, J., Garrott, B. & Peterson, R.O. (2002) Snowmobile activityand glucocorticoid stress responses in wolves and elk. Conserv. Biol., 16, 809-814.
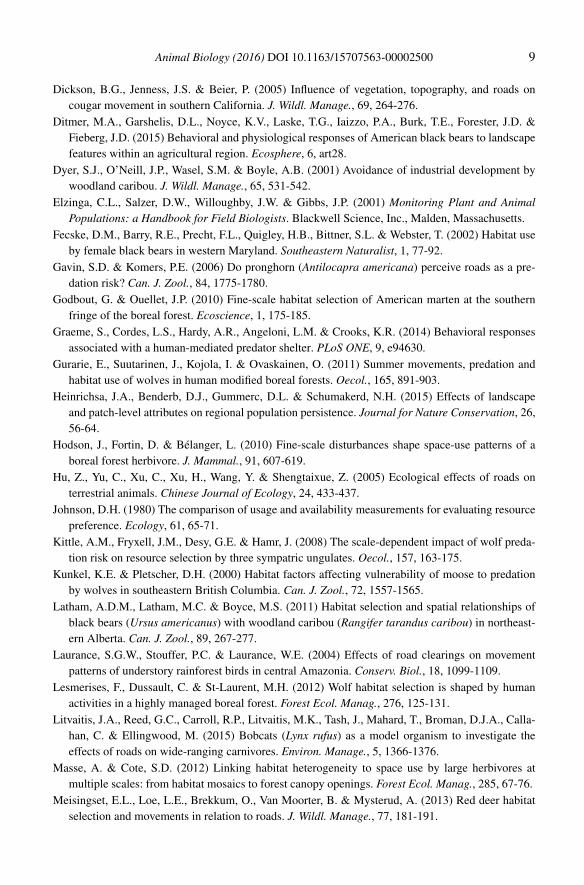
Animal Biology (2016) DOI 10.1163/15707563-00002500 9
Dickson, B.G., Jenness, J.S. & Beier, P. (2005) Influence of vegetation, topography, and roads oncougar movement in southern California. J. Wildl. Manage., 69, 264-276.
Ditmer, M.A., Garshelis, D.L., Noyce, K.V., Laske, T.G., Iaizzo, P.A., Burk, T.E., Forester, J.D. &Fieberg, J.D. (2015) Behavioral and physiological responses of American black bears to landscapefeatures within an agricultural region. Ecosphere, 6, art28.
Dyer, S.J., O’Neill, J.P., Wasel, S.M. & Boyle, A.B. (2001) Avoidance of industrial development bywoodland caribou. J. Wildl. Manage., 65, 531-542.
Elzinga, C.L., Salzer, D.W., Willoughby, J.W. & Gibbs, J.P. (2001) Monitoring Plant and AnimalPopulations: a Handbook for Field Biologists. Blackwell Science, Inc., Malden, Massachusetts.
Fecske, D.M., Barry, R.E., Precht, F.L., Quigley, H.B., Bittner, S.L. & Webster, T. (2002) Habitat useby female black bears in western Maryland. Southeastern Naturalist, 1, 77-92.
Gavin, S.D. & Komers, P.E. (2006) Do pronghorn (Antilocapra americana) perceive roads as a pre-dation risk? Can. J. Zool., 84, 1775-1780.
Godbout, G. & Ouellet, J.P. (2010) Fine-scale habitat selection of American marten at the southernfringe of the boreal forest. Ecoscience, 1, 175-185.
Graeme, S., Cordes, L.S., Hardy, A.R., Angeloni, L.M. & Crooks, K.R. (2014) Behavioral responsesassociated with a human-mediated predator shelter. PLoS ONE, 9, e94630.
Gurarie, E., Suutarinen, J., Kojola, I. & Ovaskainen, O. (2011) Summer movements, predation andhabitat use of wolves in human modified boreal forests. Oecol., 165, 891-903.
Heinrichsa, J.A., Benderb, D.J., Gummerc, D.L. & Schumakerd, N.H. (2015) Effects of landscapeand patch-level attributes on regional population persistence. Journal for Nature Conservation, 26,56-64.
Hodson, J., Fortin, D. & Bélanger, L. (2010) Fine-scale disturbances shape space-use patterns of aboreal forest herbivore. J. Mammal., 91, 607-619.
Hu, Z., Yu, C., Xu, C., Xu, H., Wang, Y. & Shengtaixue, Z. (2005) Ecological effects of roads onterrestrial animals. Chinese Journal of Ecology, 24, 433-437.
Johnson, D.H. (1980) The comparison of usage and availability measurements for evaluating resourcepreference. Ecology, 61, 65-71.
Kittle, A.M., Fryxell, J.M., Desy, G.E. & Hamr, J. (2008) The scale-dependent impact of wolf preda-tion risk on resource selection by three sympatric ungulates. Oecol., 157, 163-175.
Kunkel, K.E. & Pletscher, D.H. (2000) Habitat factors affecting vulnerability of moose to predationby wolves in southeastern British Columbia. Can. J. Zool., 72, 1557-1565.
Latham, A.D.M., Latham, M.C. & Boyce, M.S. (2011) Habitat selection and spatial relationships ofblack bears (Ursus americanus) with woodland caribou (Rangifer tarandus caribou) in northeast-ern Alberta. Can. J. Zool., 89, 267-277.
Laurance, S.G.W., Stouffer, P.C. & Laurance, W.E. (2004) Effects of road clearings on movementpatterns of understory rainforest birds in central Amazonia. Conserv. Biol., 18, 1099-1109.
Lesmerises, F., Dussault, C. & St-Laurent, M.H. (2012) Wolf habitat selection is shaped by humanactivities in a highly managed boreal forest. Forest Ecol. Manag., 276, 125-131.
Litvaitis, J.A., Reed, G.C., Carroll, R.P., Litvaitis, M.K., Tash, J., Mahard, T., Broman, D.J.A., Calla-han, C. & Ellingwood, M. (2015) Bobcats (Lynx rufus) as a model organism to investigate theeffects of roads on wide-ranging carnivores. Environ. Manage., 5, 1366-1376.
Masse, A. & Cote, S.D. (2012) Linking habitat heterogeneity to space use by large herbivores atmultiple scales: from habitat mosaics to forest canopy openings. Forest Ecol. Manag., 285, 67-76.
Meisingset, E.L., Loe, L.E., Brekkum, O., Van Moorter, B. & Mysterud, A. (2013) Red deer habitatselection and movements in relation to roads. J. Wildl. Manage., 77, 181-191.
10 J.N. Popp and V.M. Donovan / Animal Biology (2016)
Montgomery, R.A., Roloff, G.J. & Millspaugh, J.J. (2012) Importance of visibility when evaluatinganimal response to roads. Wildlife Biol., 18, 393-405.
Nikula, A., Heikkinen, S. & Helle, E. (2004) Habitat selection of adult moose Alces alces at twospatial scales in central Finland. Wildlife Biol., 10, 121-135.
Northrup, J.M., Pitt, J., Muhly, T.B., Stenhouse, G.B., Musiani, M. & Boyce, M.S. (2012) Vehicletraffic shapes grizzly bear behaviour on a multiple-use landscape. J. Appl. Ecol., 49, 1159-1167.
OMNR (2014) Black Bear Ecological Zones (BBEZ), Black Bear Density Map. Available at https://www.ontario.ca/document/bear-density-map.
Paradis, E., Claude, J. & Strimmer, K. (2004) APE: analyses of phylogenetics and evolution in Rlanguage. Bioinformatics, 20, 289-290.
Pike, D.A., Croak, B.M., Webb, J.K. & Shine, R. (2010) Subtle – but easily reversible – anthropogenicdisturbance seriously degrades habitat quality for rock-dwelling reptiles. Anim. Conserv., 13, 411-418.
R Core Team (2013) R: a Language and Environment for Statistical Computing. R Foundation forStatistical Computing, Vienna, Austria. Available at http://www.R-project.org/.
Raine, R.M. & Kansas, J.L. (1990) Black bear seasonal food habits and distribution by elevation inBanff National Park, Alberta. Bears: Their Biology and Management, 8, 297-304.
Ricca, M.A., Anthony, R.G., Jackson, D.H. & Wolfe, S.A. (2003) Spatial use and habitat associationsof Columbian white-tailed deer fawns in southwestern Oregon. Northwest Science, 77, 72-80.
Roever, C.L., Boyce, M.S. & Stenhouse, G.B. (2008) Grizzly bears and forestry I: road vegetation andplacement as an attractant to grizzly bears. Forest Ecol. Manag., 256, 1253-1261.
Romain, D.A., Obbard, M.E. & Atkinson, J.L. (2013) Temporal variation in food habits of the Amer-ican black bear (Ursus americanus) in the boreal forest of northern Ontario. Can. Field. Nat., 127,118-130.
Rowe, J.S. (1972) Forest Regions of Canada. Canadian Forest Service, Ottawa, Canada.Souza, A.M., Pires, R.C., Borges, V.S. & Eterovick, P.C. (2015) Road mortality of the herpetofauna
in a Cerrado ecosystem, central Brazil. Herpetol. J., 25, 141-148.Spaulding, R., Krausman, P.R. & Ballard, W.B. (2000) Observer bias and analysis of gray wolf diets
from scats. Wildlife Soc. B., 28, 947-950.Street, G.M., Rodgers, A.R. & Fryxell, J.M. (2015) Mid-day temperature variation influences seasonal
habitat selection by moose. J. Wildl. Manage., 79, 505-512.Van Manen, F.T., Mccollister, M.F., Nicholson, J.M., Thompson, L.M., Kindall, J.L. & Jones, M.D.
(2012) Short-term impacts of a 4-lane highway on American black bears in eastern North Carolina.Wildlife Monogr., 181, 1-35.
Wasser, S.K., Keim, J.L., Taper, M.L. & Lele, S.R. (2011) The influences of wolf predation, habitatloss, and human activity on caribou and moose in the Alberta oil sands. Front. Ecol. Environ., 9,546-551.
Whittington, J., Hebblewhite, M., DeCesare, N.J., Neufeld, L., Bradley, M., Wilmshurst, J. & Musiani,M. (2011) Caribou encounters with wolves increase near roads and trails: a time-to-event approach.J. Appl. Ecol., 48, 1535-1542.
Wilson, P.J., Grewal, S.K., Mallory, F.F. & White, B.N. (2009) Genetic characterization of hybridwolves across Ontario. J. Hered., 100, S80-S89.
Zimmermann, B., Nelson, L., Wabakken, P., Sand, H. & Liberg, O. (2014) Behavioral responses ofwolves to roads: scale-dependent ambivalence. Behav. Ecol., 25, 1353-1364.
Zuur, A., Ieno, E.N., Walker, N., Saveliev, A.A. & Smith, G.M. (2009) Mixed Effects Models andExtensions in Ecology With R. Springer-Verlag, New York, New York.
Related Documents