Population Distribution and Density

Population Distribution and Density. Population Concentrations Two-thirds of the world in the following regions: East Asia (one-fifth of world) China.
Dec 22, 2015
Welcome message from author
This document is posted to help you gain knowledge. Please leave a comment to let me know what you think about it! Share it to your friends and learn new things together.
Transcript

Population Distribution and Density


Population Concentrations
Two-thirds of the world in the following regions:East Asia (one-fifth of world)
China most populous nation
South Asia (one-fifth of world)India second most populous
Southeast Asia (4th largest concentration)Europe (3rd largest concentration)Northeastern U.S. and West Africa

How did these regions get this way?
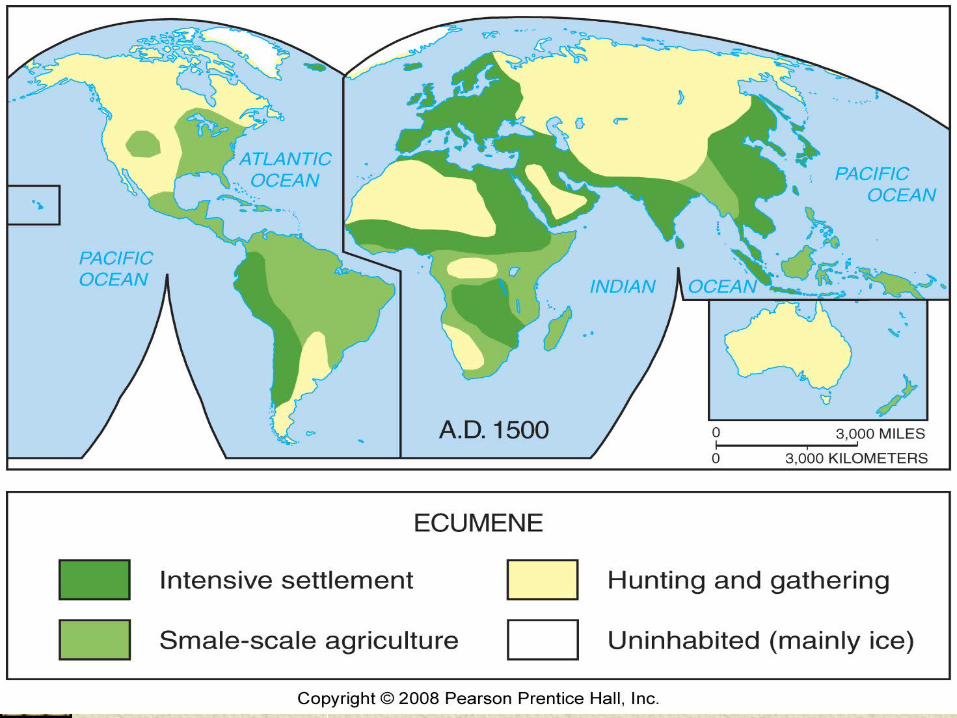
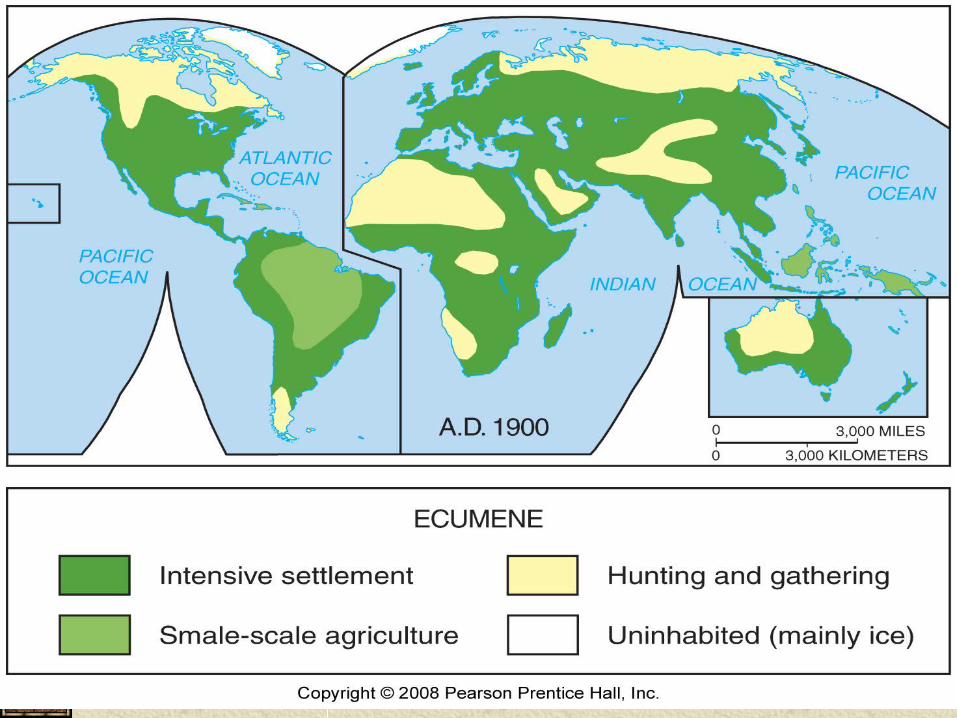
Ecumene – portion of Earth’s surface occupied by permanent human settlement
Examine the spread of the ecumene.
What might be its physical characteristics?
What might be the physical characteristics of the areas outside the ecumene?
Amend your original hypothesis.


Sparsely Populated Regions
Dry Lands
Wet Lands
Cold Lands
High Lands

Arithmetic Density
Also called- population density
Population divided by total land area
High arithmetic density can mean two things:1. Many people
2. little land

Example: Malawi and EcuadorPopulation very close (both 13.9 million)Total area different (Malawi 118,480 sq. mi., Ecuador 283,560 sq. mi.)
Malawi: 13,900,000 /118,480= 117 Ecuador: 13,900,000/ 283,560= 49
Malawi’s density: 117 people per sq. mi. VS. Ecuador’s density: 49 people per sq. mi.)What does arithmetic density tell us that crude population cannot?

Practice with Arithmetic Density
1. Country A: crude population: 800,000Total land area: 200,000 sq. mi.; Density? Is Country A relatively “crowded”?
4 per sq. mile
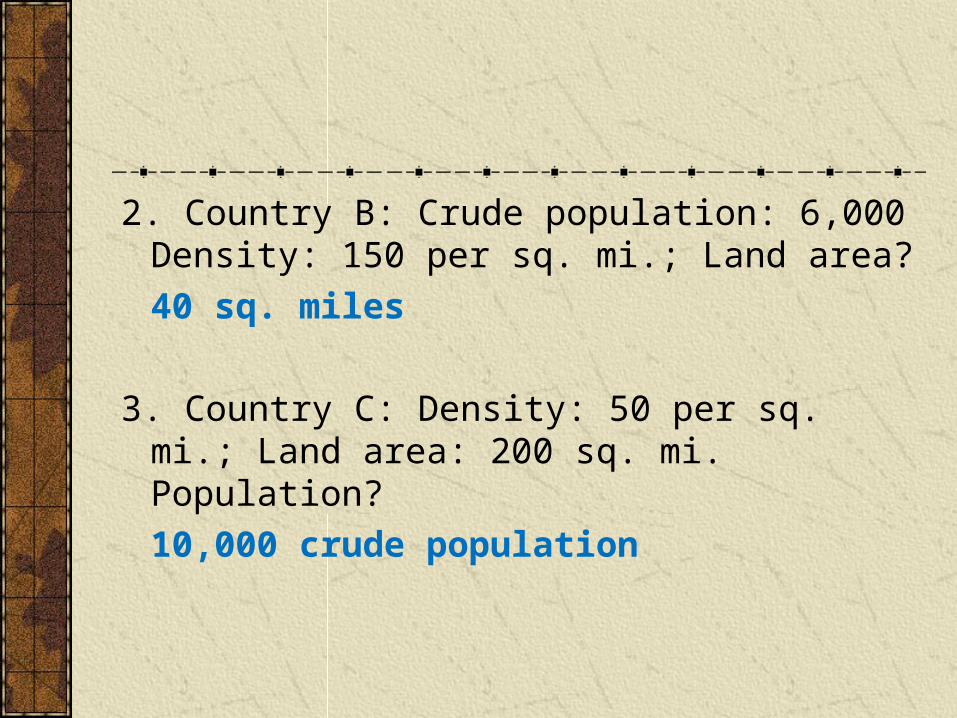
2. Country B: Crude population: 6,000 Density: 150 per sq. mi.; Land area?
40 sq. miles
3. Country C: Density: 50 per sq. mi.; Land area: 200 sq. mi. Population?
10,000 crude population

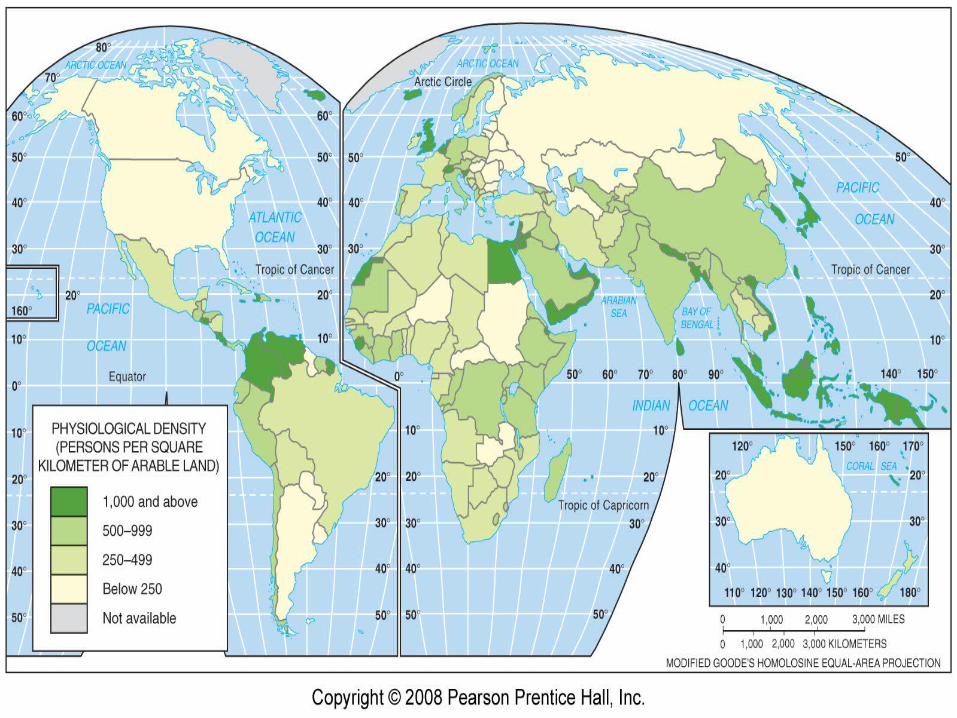
Physiological Density
What doesn’t arithmetic density tell us about the land a population occupies? Population divided by total arable land
Example: United States vs. Egypt
172 persons per sq. km vs. 2,580 persons per sq. kmWhat does this mean?
Demonstrates that crops grown on a hectare of land in Egypt must feed far more people than a hectare in the U.S.Bigger the physiological density, bigger the pressure people place on the land to produce food.

Agricultural Density
If two countries have similar physiological densities, but produce different amounts of food, what could account for this?
Ratio of farmers to arable landExample: U.S. has 1 farmer per sq. km, Egypt has 826 farmers per sq. km
What can we conclude about technology and/or economic conditions if agricultural density is low? If it’s high?

Practice Quiz
Arithmetic DensityU.S. (31 per sq. km) vs. Canada (3 per sq. km)
Which has either more people or less land?
Physiological DensityIndia (699 per sq. km) vs. Japan (2,907 per sq. km)
Which puts more pressure on the land to produce enough food?

Practice Quiz cont.
Agricultural DensityNetherlands (72 per sq. km) vs. Bangladesh (1,158 per sq. km)
Which country has a more efficient agricultural system? How can you tell?

Essential Questions
Where is the world’s population distributed?
Why is the world’s population distributed where it is?
What are the consequences of this uneven distribution?

Further Discussion…
Which of the essential questions does arithmetic density help us to answer?
Which measure of density can help us to understand why people live where they do?
What can physiological and agricultural density together tell us about a country’s capacity to feed its people?

Application Task
Consider what possible correlations could exist between these measures of density and other population statistics.
In groups of 2-3, use the population statistics packets and the maps on my teacher page and on the board to formulate at least two new hypotheses regarding the possible correlation between a measure of density and another population statistic.

Application Task cont.
For example, is there a correlation between a country’s physiological density and its infant mortality rate?Record your hypotheses, along with your explanation as to why these might be correlated on your hypothesis worksheet.Determine your strongest hypothesis and be ready to share with the class.

Begin your culminating assessment…
Conduct research to test your hypotheses and consider how all three connect.Use the provided map outlines to create two maps of an imaginary country or region: either environmental and measure of density, or density and another population statistic.Compose a one-page response explaining what correlations, if any, did you discover between the three factors.
Resources
www.prb.org (Population Reference Bureau)
https://www.cia.gov/library/publications/the-world-factbook/index.html (CIA World Factbook)
http://www.census.gov/ (Census Bureau)
Related Documents