POPULATION CONCENTRATION IN LESS DEVELOPED COUNTRIES: NEW EVIDENCE F. Landis MacKellar International Institute for Applied Systems Analysis Laxenburg, Austria Daniel R. Vining, Jr. Population Studies Center, University of Pennsylvania Philadelphia, PA, USA RR-96-1 January 1996 Reprinted from Papers in Regional Science: The Journal of the RSA!, 74(3):259-293 (1995). INTERNATIONAL INSTITUTE FOR APPLIED SYSTEMS ANALYSIS Laxenburg, Austria

Welcome message from author
This document is posted to help you gain knowledge. Please leave a comment to let me know what you think about it! Share it to your friends and learn new things together.
Transcript

POPULATION CONCENTRATION IN LESS DEVELOPED COUNTRIES: NEW EVIDENCE
F. Landis MacKellar International Institute for Applied Systems Analysis Laxenburg, Austria
Daniel R. Vining, Jr. Population Studies Center, University of Pennsylvania Philadelphia, PA, USA
RR-96-1 January 1996
Reprinted from Papers in Regional Science: The Journal of the RSA!, 74(3):259-293 (1995).
INTERNATIONAL INSTITUTE FOR APPLIED SYSTEMS ANALYSIS Laxenburg, Austria

Research Reports, which record research conducted at IIASA, are independently reviewed before publication. Views or opinions expressed herein do not necessarily represent those of the Institute, its National Member Organizations , or other organizations supporting the work.
Reproduced with permission from Papers in Regional Science: The Journal of the RSAI, 74(3) :259- 293, 1995. Copyright @1995 Regional Science Association International
All rights reserved . No part of this publication may be reproduced or transmitted in any form or by any means, electronic or mechanical, including photocopy, recording, or any information storage or retrieval system, without permission in writing from the copyright holder .
Printed by Novographic, Vienna, Austria.

Preface
The growth of "mega-cities" in developing countries is a source of concern. This paper treats a closely related topic, the increasing concentration, through rural-urban migration, of population in "core regions,'' which accounts for disproportionate shares of population and economic activity. In the industrialized countries a trend toward deconcentration, i.e., net outmigration from core regions, has been evident since the censuses of the 1970s. This reversal of national migration patterns often first asserted itself at a level of development corresponding to per capita GDP of 5,000 US dollars (1985 terms).
In this paper, Landis MacKellar of the Population Project and D.R. Vining, Jr. of the Population Studies Center of the University of Pennsylvania review evidence from the 1990 round of censuses in less developed countries. While there have been some notable reversals during the last intercensal interval (most notably, net out-migration from the regions surrounding Mexico City and Bangkok), they find that there is nothing inevitable about the commencement of population deconcentration at any given level of development. The share of the core region can continue to grow long after per . capita GDP exceeds US $5,000. This suggests that some LDC urban agglomerations may reach sizes that are astonishing by current standards.
In combining demographic, geographic, and economic reasoning, the paper is typical of IIASA's multidisciplinary research focus. In making available, in summary form, data on population distribution in LDCs during the postwar period, it also reflects the Population Project's continuing emphasis on dissemination and analysis of basic demographic data.
lll
Wolfgang Lutz Leader
Population Program


PAPERS IN REGIONAL SCIENCE: The Journal of the RSA/ 74, 3: 259-293 © 1995 by Regional Science Association International
POPULATION CONCENTRATION IN LESS DEVELOPED COUNTRIES: NEW EVIDENCE
F. Landis MacKellar International Institute for Applied Systems Analysis (IIASA) A-2361 Laxenburg Austria
Daniel R. Vining, Jr. Population Studies Center University of Pennsylvania Philadelphia, PA 19104 USA
ABSTRACT Economic theory associates the increase in population concentration, i.e., the proportion of national population residing in the core economic region, with scale and agglomeration economies. Wheaton and Shishido (1981) estimated that these persist until real per capita national income reaches 5,000 1985 U.S. dollars (USO). After this point in a country's economic development, they predicted, population redistribution towards the core region will cease and the proportion of national population residing in the core region will commence to decline. The experience of developed countries (DCs) in the 1970s and 1980s broadly conformed to this pattern, albeit with exceptions. Evidence from less de\'eloped countries (LDCs) through the 1980 round of censuses led Vining (1986) to propose a weakened version of the USO 5,000 rule in which this point is characterized only by a slowing of rate of population re-distribution towards the core, not by an outright re1·ersal. This paper updates previously reported trends in population redistribution in LDCs and reports on many new countries. Taken as a whole, post-war data reinforce the need for caution of the sort expressed by Vining. While there is a weak negative correlation between the rate of net migration into the core region and per capita income, the share of population residing in the core region may continue to rise even when per capita income has grown to well beyond USO 5,000 .
. Men, thinly scattered, make a shift, but a bad shift, without many things. A smith is ten miles off: they do without a nail or a staple. A taylor is far from them: they'll botch their clothes. It is being concentrated which produces high convenience. (Boswell 1786, p. 169)
1. INTRODUCTION Concern over Third World city growth arises not from urbanization per
se, but rather from the spatially unbalanced character of the present urbanization process. As the United Nations Population Division (1993) and others have noted, current demographic trends are rapidly giving rise to "mega-cities" whose absoiute size, rate of growth and exaggerated primacy are sources
Received 1 /91; revised 2/93; final version received 2/95.

260 PAPERS IN REGIONAL SCIENCE, VOL. 74, NO. 3, 1995
of concern from the standpoint of economic and environmental sustainability. While policy makers in less developed countries (LDCs) disagree on the consequences of the size and increase of their national populations, they are almost unanimous in condemning its spatial distribution. Thus, most of the LDCs on which information is available in the Population Policy Data Bank maintained by the United Nations Population Division are, or at least claim to be, implementing policies to slow the rate of primate city growth.
This paper does not treat directly the "mega-city" phenomenon, but concerns itself with a closely related subject: the continuing redistribution of populations towards "core regions" of LDCs, that is, regions (usually but not always containing the capital city) accounting for a disproportionate share of population and economic activity. Due to urban sprawl and the resulting under-bounding of city administrative boundaries, the population of the core region is frequently a more accurate measure of the size of the primate urban agglomeration than is city size itself.
The standard economic model of population redistribution and development (Alperovitch 1992; Petrakos 1992; Parr 1985; Alonso 1971; Mera 1973) starts with the location decision of the firm in the face of scale and agglomeration (localization and urbanization) economies (Soroka 1994). As resources, including human resources, are increasingly concentrated in ' the core region, the rate of return to such resources is boosted further, promoting yet further redistribution towards the core. Eventually, scale and agglomeration economies will be exhausted, perhaps in conjunction with diseconomies of congestion and the ecological ill-effects of over-urbanization in the primate city (Richardson 1989; Bartone 1991), at which point the proportion of the national population residing in the core region will begin to decline. The role of social, cultural and political factors such as ethnic diversity and the distribution of power between core and peripheral regions has also been cited by some researchers (Mutlu 1989; Petrakos and Brada 1989).
2. THE 5,000 DOLLAR RULE(S) Wheaton and Shishido (1981) estimated a model which suggested rising
concentration of urban population into a few primate metropolitan areas, up to a level of national development corresponding to a per capita income level of roughly 5,000 1985 U.S. dollars (USD; as a benchmark, this was approximately the level of income in Korea in the second half of the 1980s - Wheaton and Shishido cited a cutoff of 2,000 1970 USD, which corresponds to approximately 5,200 1985 USD). Citing "a consistent and plausible relationship between economic development and urban concentration," Wheaton and Shishido concluded that the course of population redistribution is entirely predictable: "Urban concentration must increase with the level of development, until the latter approaches USD 2,000 [USD 5,000 in 1985 terms]. After that, spatial decentralization sets in" (Wheaton and Shishido 1981, p. 29).
Vining and his associates examined, in a series of articles, trends in the distribution of total, not just urban, populations in DCs. They found that in the 1970s, virtually all DCs experienced, for the first time in the historical record, either radically lower rates of net migration towards or actual net migration away from core regions (Vining and Kontuly 1978; Vining and Pal-

MACKELLAR AND VINING: POPULATION CONCENTRATION IN LDCS 261
lone 1982). Consistent with the rule proposed for urban populations by Wheaton and Shishido, this tended to occur at a per capita GDP level of approximately USO 5,000, albeit with exceptions, such as Japan, in which concentration continued to rise long after national income had reached USO 5,000. Population redistribution trends in the LDCs through the 1980 round of censuses were then examined by Vining (1986), who concluded as follows:
The basic pattern first observed in Western countries, i.e., of a close association between economic development and population concentration, appears to be being followed in an entirely predictable fashion by non-Western countries.
He added, however, a caveat:
Indeed, the preponderance of the evidence from those countries studied here . . . suggests that only a slackening of the pace of population redistribution pace towards the core can be expected when this level of development [i.e., the inflection point found by Wheaton and Shishido] is reached, not an actual de-concentration. (Vining 1986, p. 18)
Nor has the course of population concentration in DCs since 1980 been straightforward (Cochrane and Vining 1986; Champion 1994): Japan, for example, having experienced population deconcentration during the 1970s, experienced "reconcentration," especially in the Tokyo metropolitan region, during the early 1980s (Tsuyo and Kuroda 1989). However, Champion (1989, p. 241) concluded frorn nine DC case studies that the "the main weight of the evidence" favored the interpretation that the stalling of deconcentration in some DCs in the 1980s was an anomaly, not the reversal of a trend.
Thus, we have three USO 5,000 rules:
(a) the original Wheaton-Shishido rule, that urban population concentration rises until national GDP reaches USO 5,000, at which point it begins to fall;
(b) ditto for total population; and
(c) ditto except that net migration into the core region does not actually turn negative at USO 5,000; it merely declines dramatically.
Of these, it is the second, which is most comprehensive and least equivocal, to which we will refer as "the" USO 5,000 rule.
Even in weakened form, the USO 5,000 rule is by no means universally accepted. A plausible optimistic view (e.g., Critchfield 1979, 1981), holds that the DC-paradigm, in which redistribution trends are driven by agglomeration and scale economies in industry, is inappropriate to those developing countries (such as Bangladesh, China and others) where a dominant rural sector is characterized by rapid technical progress, a good supply of skilled workers and the potfi·hal for reaping agriculture-based :..:conomies of ~;cale in transport, communication, storage, research and development, service extension and the like. The combination of lower rural fertility and higher rural incomes in consequence of improved agricultural productivity is, in this interpretation, giving rise to unprecedented rural welfare gains, which will be reflected in diminished rates of rural-urban migration and augmented rates of return migration at per capita income levels far below USO 5,000.

262 PAPERS IN REGIONAL SCIENCE, VOL. 74, NO. 3, 1995
Another view, often expressed by researchers at the World Bank (e.g., World Bank 1986), is based on the familiar neoclassical push-pull model of migration and emphasizes the role of price distortions and superior access to amenities, both often grouped together under the rubric "urban bias," privileging the urban population. Thus, many aspects of structural adjustment - devaluation of over-valued exchange rates that favor urban consumers at the expense of rural producers, dismantlement of state agricultural marketing boards with their artificially low purchasing prices, elimination of subsidies in the pricing of urban services and infrastructure and so on - should slow rural-urban migration. Gilbert (1993) attributes the reduction in Third World urban growth rates observed during the 1980s to three factors:
(a) changes in the terms of trade that favored tradeable goods at the expense of non-tradeables, and the switch from import-substituting to export-promoting industrial strategy - this is the bright side of the World Bank model;
(b) recession, the collapse of urban employment and immiseration of substantial portions of the urban population; this is the dark side (c.f., Gilbert 1994); and
(c) the transformation of primate cities into more dispersed, polycentric urban forms.
3. NEW EVIDENCE In Table 1 of Appendix A, the LDC census data presented by Vining (1986)
are updated through the 1990 round of censuses, and data for many new countries 1re presented. The chosen index of population redistribution is the difference (x 103
) between the core region's exponential population growth rate and that of the country as a whole. On the assumption that core region and national rates of natural increase are equal, this difference is equal to the rate of net migration into the core region. In most LDCs, rates of natural increase are lower in core regions because of rural-urban fertility differentials; the difference between core and peripheral region population growth rates is, however, dominated by the net migration rate.
The net migration rate is a place-specific characteristic; it does not refer to a particular individual behavior and thus does not have the same neat probabilistic interpretation of a mortality rate or a fertility rate. Nonetheless, at the risk of some looseness of usage, we employ the term "net migration rate into the core region" as opposed to more cumbersome alternatives such as "rate of net migration experienced by the core region." Estimates of out-migration rates in LDC peripheral regions, whether obtained indirectly from origin and duration of residence questions on census questionnaires, or directly through population registers or sample surveys, would have the desired probabilistic interpretation; however, these are not available broadly enough to make possible a comprehensive international survey of the sort presented here.
The data source for estimates of per capita income is the 1993 update of the Penn World Table (Mark 5.1) discussed by Summers and Heston (1993) and available from the National Bureau for Economic Research. The statistic

MACKELLAR AND VINING: !'OPULA TION CONCENTRATION IN LOCS 263
reported is inter-censal average income, estimated as the mean of the two endpoints.
Countries previously covered Countries in which previously observed population redistribution trends con
tinued. New censuses in those countries that were previously covered indicate that significant population concentration continues to occur in Bangladesh (1981-91, per capita income of USD 1,122 during the inter-censal interval), Colombia (1973-85, USD 2,639), Ecuador (1982-90, USD 2,968), India (1981-91, USD 929), Egypt (1976-86, USD 1,568), Philippines (1980-90, USD 1,810) and Turkey (1980-85, USD 2,956 and 1985-90, USD 3,385).
Net migration into the core region continues to be almost nil in Ireland (1981-86, USD 7,054 and 1986-91, USD 8,112) and Uruguay (1975-85, USD 3,898); and to be modest at a surprisingly low level of per capita income in Tunisia (1975-84, USD 2,334). International out-migration, which ff,igi1t invalidate the standard economic model of population concentration, is a major demographic factor in Ireland and at least a significant one in Tunisia. The previously observed deceleration in the rate of net migration into the Santiago region continued in Chile (1982-92, USD 3,653), and Peru (1981-93, USD 2,503) appears to be undergoing a similar process.
The population deconcentration that first manifested itself in Argentina at a per capita income level fairly close to USD 5,000 continued (1980-91, USD 4,129). The long established deconcentration trends in Israel and Sri Lanka, unusual cases whose peculiarities were discussed by Vining (1986), continued during the 1970s (1972-83, USD 7,358) and 1980s (1981-91, USD 2,018), respectively.
The model according to which improvements in rural living standards alleviate migratory pressures early in the development process would seem to be particularly relevant to Southeast Asia, but the evidence is mixed. In South Korea, where the region around Seoul has traditionally exerted an extraordinarily strong attraction, concentration continued in the last two intercensal intervals (1980-85, USD 3,695 and 1985-90, USD 5,238). In Malaysia (1980-90, USD 4,338), there is no evidence of a deceleration of net migration into the core region. We were unable to obtain sufficiently detailed census data to present an update for Indonesia (1981-90, USD 1,700). It appears, however, that while the growth rate of Jakarta itself decelerated (from 3.4% per year in 1971-81 to 2.4% in 1981-90), population growth in the surrounding areas of Bogor, Bekasi and Tamnggerang was on the order of 5% per year (Hull 1994). In view of the deceleration of population growth observed in Yogyakarta, and in East and Central Java, due in part to rapid fertility decline and in part to out-migration, it appears safe to conclude that population concentration continued.
Countries in which there has occurred a reversal of previously observed population redistribution trends. In Thailand (1980-92, USD 2,839), the latest census reveals modest net out-}11igration from Bangkok and its environs. This would appear to be a clear exception to the USD 5,000 rule, and it seems plausible that rising environmental costs and disamenities are playing a role.

264 PAPERS IN REGIONAL SCIENCE, VOL. 74, NO. 3, 1995
The USD 5,000 rule in its naive form - a decisive reversal of net migration trends occurring at almost precisely the moment GDP passes USD 5,000 -is illustrated by the cases of Greece (1981-91, USD 6,278), Mexico (1980-90, USD 5,543) and, less dramatically, Portugal (1981-90, USD 5,809). In the case of Mexico City, research suggests that deterioration of the urban environment is a contributing factor (Izazola and Marquette 1994).
Spain (1981-90, USD 8,492) exemplifies Vining's weakened interpretation of the rule: the net migration rate dropped dramatically when per capita GDP passed the USD 5,000 mark, but did not actually tum negative (and then only slightly so) until it was on the order of USD 7,500. Taiwan, (1986-92, USD 7,377) may be following a similar path. Panama (1980-90, USD 3,162) and Cuba (1970-81, per capita income not available), where reversals of net migration into core regions occurred at surprisingly low levels of development, may be exceptions to the USD 5,000 rule, but neither is a strong counter-example. In Brazil (1980-91, USD 4,080), the rate of net migration into Sao Paolo state has fallen into the low single digits, but it was never particularly high. The dominant role of the oil sector makes it difficult to comment on the cases of Algeria (1977-87, USD 2,669) and Venezuela (1981-91, USD 6,389).
Countries lzere covered for the first time Countries experiencing population concentration. Leaving aside for the
moment.countries in sub-Saharan Africa, very few of which were covered previously, and the small island nations, most recent observations reveal population concentration in El Salvador (1971-921, per capita income of USD 1,741), Nepal (1971-81, USD 747), Nicaragua (1963-70, USD 1,955), Paraguay (1982-92, USD 2,381), Mongolia (1969-79, per capita income not available), Papua New Guinea (1980-90, USD 1,513) and Morocco (1971-82,. USO 1,599). All of these cases conform to the USO 5,000 rule.
Countries experiencing deconcentration. The rate of net migration into the core region is extremely low or negative at levels of per capita income far below USO 5,000 in the following new countries: Costa Rica (1973-84, USO 3,193), Guatemala (1973-81, USD 2,336), Honduras (1974-88, USO 1,303), Jamaica (1982-91, USO 2,358), Myanmar (1973-83, USD 455), Vietnam (1979-89, per capita income not available) and Iraq (1977-87, USD 4,615). Bolivia presents an odd case, having undergone a significant deconcentration during the most recent inter-censal interval (1976-92, USD 1,741) without ever apparently having passed through the concentration phase.
Bolivia, Costa Rica, Guatemala, Honduras and Jamaica are all small, densely populated countries .. Guatemala and Jamaica also have elevated high rates of international out-migration. Vietnam has a rigorous national population redistribution policy aimed at reducing urban population concentration and developing sparsely populated areas. Moreover, constant definitional changes make data interpretation difficult (Banister 1993). The case of Iraq is similarly jejune: both military recruitment and attempts to avoid it may have artificially .reduced the population of Baghdad in the 1987 census. This leaves only Myanmar as a new exception to the USO 5,000 rule, and it is not a very compelling one.

MACKELLAR AND VINING: POPULATION CONCENTRATION IN LDCS 265
Sub-Saharan Africa and the small island states. Sub-Saharan Africa is of special interest: not only is this region experiencing the most rapid expansion of primate cities, but also it is the focus of the "urban bias" model of concentration. Data problems are acute (so severe, in fact, in the notorious case of Nigeria that we chose not to present data for this country), but, since improvements in census accuracy in Africa are greater for peripheral than for core regions, all of the data presented here tend to underestimate actual concentration trends.
Citing only the most recent observation, the data reveal acutely elevated rates of net migration (in excess of roughly 20 per 1,000) info core regions practically across the continent: in Botswana (1981-91, per capita income of USD 2,553), Burkina Faso (1975-85, USD 477), Congo (1974-84, USD 2,099), Ethiopia (1962-70, USD 271), Gambia (1973-83, USD 671), Liberia (1974-84, USD 925), Mauritania (1977-88, USD 987), Sierra Leone (1974-85, USD 974), Tanzania (1978-88, USD 523) and Zimbabwe (1982-92, USD 1,280). "Hypermigration" cannot, by definition, continue for very long. As the cases of Zambia (1980-90, USD 816) and Niger (1977-88, USD 560) illustrate, rates of net migration into the core region can decline not only precipitously, but more importantly, to relatively moderate levels.
In most countries in the African region, the structural adjustment process has led to the collapse of formal urban employment and wages, with consequent disappearance of the much vaunted rural-urban welfare gap Gama! and Weeks 1988; Robinson 1990). The data presented here, scattered though they are, indicate that migration into African primate cities continues apace despite staggering declines in urban real wages, increases in unemployment, public sector retrenchment and so on. To cite only two examples, Jamal and Weeks report that real urban wages in Sierra Leone dropped by over 80% between 1970 and 1986, yet, the already elevated rate of net migration into the Western area actually increased between 1963-74 and 1974-85, from 23.3 to 28.2 per 1,000. In Tanzania, net migration into the Dar es Salaam region proceeded at the brisk rate of 47.2 per 1,000 in 1967-78, a period during which the real minimum wage is estimated to have declined by something like 40%. There has been a further, subsequent drop of over 60% in the 1980s, yet the net migration rate was still 18.9 per 1,000 in 1978-88. In Ghana (1970-84, USD 822) and Cote d'Ivoire (1975-88, USD 1,440), population concentration trends were not particularly extreme even during periods characterized by extreme distortions of the "urban bias" variety. On the face of the matter, then, it appears that "urban bias" is only a contributing factor, not the driving factor behind rapid African urbanization.
Population movements in Sudan (1983-93, USD 1,039) and Uganda (1980-91, USD 707) are dominated by refugee movements. The apparent deconcentration in Mozambique (1970-80, USD 1,177) is an illusion caused by the combimtion of improving census accuracy and the civil war. Deconcentration is also observed in Burundi (1979-90, USD 495), Guinea (1977-83, USD 391), and Malawi (1977-87, USD 480). The last of these is a possibly interesting case - it may not be coincidental that Malawi has one of the strongest economic and political decentralization policies in sub-Saharan Africa.

266 PAPERS IN REGIONAL SCIENCE, VOL. 74, NO. 3, 1995
100
80 0
§ 0
0
60 0
~ 0 co 0 .9: 0
Cl> 40 0 0
~ 8 20 ~ Ci ·e
0 a; 0
z
-20 0
-40 2 3 4 5 6 7 8
GDP per capita (OOOs 1985 USO)
FIGURE 1. Relation Between Net Migration Rate and Per Capita GDP
The small island states present a mixed and not particularly interesting picture. If there is one conclusion that can be elicited, it is that these countries seem to follow no distinctive pattern. Mauritius (1983-90, USD 4,737) is an unusual case, but this is not surprising; it, like Sri Lanka, is a perpetual demographic outlier.
4. GRAPHICAL SUMMARY In Figure 1, we plot the net migration rate into the core region (NMR)
against per capita income (Y) and draw the least squares line. The NMR is estimated, as described above, by the difference between the core region and national population growth rates. Income data are the Summers-Heston data referred to previously.
The least squares line is given by:
NMR;, = 17.43941 -0.00238 Y;,
( 11 .034) (-4.399)
with R2 = 0.089, N = 199, and i as the index for the country and t for the inter-censal interval. The pronounced outliers in the plot more or less offset each other, so there is little purpose in deleting them. The calculated x-intercept of USD 7,327 should not be subjected to too much solemn interpretation in view of the mediocre fit On the other hand, nothing in the scatterplot bodes well for the USD 5,000 rule in its naive form. If anything, Figure 1 reinforces a nee~ for caution. The NMR is negatively (albeit weakly) correlated with per capita income; however, it may remain positive after per capita income is well past the USD 5,000 point.
MACKELLAR AND VINING: POPULATION CONCENTRATION IN LOCS 267
5. CONCLUSION The experience of DCs in the 1970s and 1980s conformed roughly to pre
dictions of a model that suggested that population redistribution towards core regions would cease at a level of national per capita income of about USD 5,000. Evidence from LDCs through the 1980 round of censuses suggested that the USD 5,000 point was marked only by a slowing of net migration into the core, not by an outright reversal of trend. The body of evidence through the 1990 round of censuses reinforces the need for caution. While there is a weak negative correlation between the rate of net .pligration into the core region and per capita income, the share of population residing in the core region may continue to rise when per capita income is well beyond USD 5,000.
ACKNOWLEDGMENT _,. - ·
Our principal debt is to the librarians of the Center for International Research of the U.S. Bureau of the Census, of the International Labour Office (!LO) in Geneva, of the United Nations Statistical Office in New York and of the African Development Bank in Abidjan, as well as to Zuali Malsawrna, Carl Haub and Machiko Yanagishita of the Population Reference Bureau (PRB) in Washington, all for their patience in the face of repeated incursions into their collections. MacKellar's research at the PRB was made possible by the Andrew W. Mellon Foundation through its Mellon Visiting Scholar program. We also thank Andrew Harner of the World Bank, Richard Anker and Ghazi Farooq of the !LO anrl three anonymous referees, for their comments on an earlier draft; Samir Radwan of the !LO, for translations from the Arabic; !LO Experts William House and John Herzog, for data and comments from Sudan, Malawi and Zimbabwe; Hassan Yousif of IIASA for comments on Iraq and Judith Banister of the International Research Center of the U.S. Bureau of the Census, for information on Vietnam.
REFERENCES
Alonso, W. 1971. The economics of urban size. Papers of tlze Regional Science Association 26: 67-83. Alperovitch, G. 1992. Economic development and population concentration. Economic Development
and Cultural Change 41: 63-74. Banister, J. 1993. Vietnam population dynamics and prospects. Indochina Research Monograph.
Institute of East Asian Studies, University of California at Berkeley. Bartone, C. 1991. Environmental challenge in Third World cities. Journal of tlze American Planning
Association 57: 411-15. Boswell, J. 1786. Journal of a journey to tlze Hebrides with Samuel Johnson, L.L.D. Reprinted 1993.
Harmondsworth: Penguin Books. Champion, A. 1989. Counterurbanization: The changing pace and nature of population concentration.
London: Edward Arnold. Champion, A. 1994. Population change and migration in Britain since 1981: Evidence for
continuing deconcentration. Environment and Planning A 26: 1501-20. Cochrane, S., and Vining, D. 1986. Recent trends in migration between core and peripheral regions
in developed and advanced developing countries. Working Papers in Regional Science and Transportation No. 108. Philadelphia: University of Pennsylvania.
Critchfield, R. 1979. Revolution of the village. Human Beliaiiior 8: 18-27. Critchfield, R. 1981. Villages . New York: Doubleday. Gilbert, A. 1993. Third World cities: TI1e changing national settlement system. Urban Studies 30:
721-40. Gilbert, A. 1994. Third World cities: Poverty, employment, gender roles and the environment
during a time ofrestructuring. Urban Studies 31: 605-33. Hull, T. 1994. Personal communication regarding the 1990 Indonesian Census. Izazola, H., and Marquette, C. 1994. Migration in response to urban environmental deterioration:
Out-migration by middle-class women and their families from Mexico City since 1985.

268 PAPERS IN REGIONAL SCIENCE, VOL. 74, NO. 3, 1995
Paper presented to the annual meeting of the Population Association of America, Miami, Florida, 5-7 May, 1994.
Jamal, W., and Weeks, J. 1988. The vanishing rural-urban gap in sub-Saharan Africa. International Labour Review 127: 271-92.
Mera, K. 1973. On the urban agglomeration and economic efficiency. Economic Development and Cultural Change 21: 309-24.
Mutlu, S. 1989. Urban concentration and primacy revisited: An analysis and some policy considerations. Economic Development and Cultural Change 37: 611-39.
Parr, J. 1985. A note on the size distribution of cities over time. Journal of Urban Economics 18: 199-212.
Petrakos, G. 1992. Urban concentration and agglomeration economies: Re-examining the relationship. Urban Studies 29: 1219-29.
Petrakos, G., and Brada, J. 1989. Metropolitan concentration in developing countries. Kyklos 42: 557-78.
Richardson, H. 1989. The big, bad city: Mega-city myth? Third World Planning Review 11: 355-72. Robinson, D. 1990. Changing civil service remuneration in Africa. International Labour Review 129:
371-86. Soroka, L. 1994. Manufacturing productivity and city size in Canada, 1975 and 1985: Does
population matter? Urban Studies 31: 895-911. Summers, R., and Heston, A. 1993. The Penn World Table (Mark 5): An expanded set of
international comparisons, 1950-1988. Quarterly Journal of Economics 106: 327~. Tsuyo, N., and Kuroda, T. 1989. Japan: The slowing of urbanization and metropolitan
concentration. NUPRl Reprint Series No, 33. Tokyo: l\lihon University Population Research Institute.
United Nations Population Division. 1993. World urbanization prospects: Tire 1992 revision. New York: United Nations.
Vining, D. 1986. Population redistribution towards core areas of less developed countries, 1950-1980. International Regional Science Review 10: 1-45.
Vining, D., and Kontuly, T. 1978. Population dispersal from major metropolitan regions: An international comparison. International Regional Science Review 3: 49-73.
Vining, D., and Pallone, R. 1982. Migration between core and peripheral regions: A description and tentative explanation of the patterns in 22 countries. Geoforum 13: 339-410.
Wheaton, W., and Shishido, H. 1981. Urban concentration, agglomeration economies, and the level of ecor<omic development. Economic Development and Cultural Change 30: 17-30.
World Bank 1986. World development report. Baltimore: Johns Hopkins University Press.
APPENDIX A: POSTWAR POPULATION REDISTRIBUTION
In Table 1 on the following pages, a highlighted table cell is used to denote new census observations, in the case of countries covered previously by Vining (1986) and to denote countries not covered previously. Unavailable per capita GDP data are indicated by "na" for "not available." A handful of pre-War census observations in Vining (1986) has been dropped.
Every attempl has been made to track down and control for administrative boundary changes; the authors would be grateful to hear from readers who are aware of any changes which they appear to have missed or which have just taken place; ditto new census results as they become available.

TABLE 1. Postwar Population Redistribution by Country I~ n
Population (thousands) Core - National GDP per capita (1985 ?;i Country and Core Region Share of r
Year Growth Rate USO; inter-<:ensal ~ Constituent Subdivisions National Core Core (0/..)
(xlO') average)
~ Latin America and Caribbean
I Argentina 1947 15,894 7,255 45.6
Federal Capital; Buenos Aires province 1960 20,014 9,733 48.6 4.9 3,164
1970 23,264 11,747 50.3 3.3 3,729 a .,, 1980 27,948 13,788 49.3 -1.9 4,455
~ 1991 32,609 15,543 47.7 -3.5 4,129 (80-90)
Bolivia 1950 3,018 948 31.4 z La Paz department 1976 4,613 1,465 31.8 0.4 1,563 n
0 z 1992 6,421 1,901 29.6 -4.2 1,741 (76-90) n m
Brazil 1950 51,942 9,128 17.6 ~ Sao Paolo state 1960 70,070 12,809 18.3 3.9 1,502 ::::l 1970 93,139 17,772 19.1 4.3 2,080 0 z 1980 119,099 25,041 21.0 9.7 1,413 2 1991 146,918 31,547 21.5 1.9 4,080 (80-90) r
Chile 1952 5,933 1,755 29.6 ~ Santiago province (1952-70); Metropoli- 1960 7,374 2,437 33.0 13.9 2,752
tan Santiago (1982-90) 1970 8,885 3,231 36.4 9.6 3,290
1982 11,275 4,295 38.1 5.9 3,501
1992 13,232 5,170 39.1 2.5 3,653 (82-90) 'N
"' "'

TABLE 1. Postwar Population Redistribution by Country (Continued) Cl IN Population (thousands) Core - National GDP per capita (1985
Country and Core Region Share of Growth Rate Year USO; inter-censal Constituent Subdivisions National Core Core(%)
(x 103
) average)
Colombia 1951 11,548 1,624 14.l
Cundinamarca department; Bogota spe- 1964 17,632 2,820 16.0 9.9 1,639
cial district 1973 22,572 4,072 18.0 13.4 2,105
1985 27,838 5,366 19.3 5.5 2,639
1993 35,886 8,175 22.8 9.0 3,042 (85--90) "O >
Costa Rica 1973 1,872 695 37.l "O tT'I :;:l
San Juan provi nee 1984 2,419 890 36.8 -0.8 3,193 IJl
Cuba 1953 .5,829 1,539 26.4 z :;:l
Habana province (1953-70); Habana 1970 8,569 2,311 27.0 1.7 na tT'I C)
and Ciudad de Habana provinces (1981) 1981 9,724 2,515 25.9 -3.8 na 0 z Dominican Republic 1950 2,136 239 11.l > r
National district 1960 3,047 465 IJl
15.3 31.0 1,041 (') r;;
1970 4,009 813 20.3 28.4 1,329 z (')
1981 5,648 1,551 27.5 27.6 1,224 pl
< Ecuador 1950 3,203 969 30.3 0
r Pinchincha and Guayas provinces 1962 4,476 1,567 35.0 12.2 1,301
~ 1974 6,501 2,494 38.4 7.6 1,944 z 1982 8,051 3,424 42.5 12.9 2,802 9
~ 1990 9,648 4,271 44.3 5.0 2,968 ......
"' "' U1

TABLE l. Postwar Population Redistribu.tion by Country (Continued) I~ ()
Population (thousands) Core - National GDP per capita (1985 ~ Country and Cor" Region Share of r'
Year Growth Rate USO; inter-censal ~ Constituent Subdivisions National Core Core(%) (x IOJ) average)
~ El Salvador 1950 1,856 296 16.0
~ San Salvador department 1961 2,511 463 18.4 13.2 977
1971 3,541 731 20.6 11 .3 1,206
1992 5,048 1,478 29.3 16.6 1,741 (71-90) a "" Guatemala 1973 5,160 1,108 21.4 ~ Guatemala department 1981 6,054 1,311 21.7 0.5 2,336 ::l
Haiti 1950 3,097 654 21.1 0 z
West department 1971 4,330 1,206 27.9 13.2 ()
na 0 z 1982 5,054 1,552 30.7 8.9 863 ()
tT1
Honduras 1945 1,200 174 14.5 ~ Fran~isco Morazon and Cortes depart- 1950 1,369 316 23.1 100.0 na ::l men ts 1961 1,885 484 25.7 9.7 974 0 z
1974 2,657 823 31.0 14.4 1,122 ~ 1988 4,449 1,412 31.7 1.7 1,303 r'
8 Jamaica 1960 1,610 666 41.4 CJ)
Kingston, St. Andrews, St. Mary and 1970 1,848 828 44.8 8.0 2,229
St. Catherine provinces 1982 2,190 1,023 46.7 3.5 2,487
1991 2,366 1,113 47.0 0.8 2,358 (82-90) --- I N 'I .....

TABLE 1. Postwar Population Redistribution by Country (Continued) 1~ Population (thousands) Core - National GDP per capita (1985
Country and Core Region Share of Growth Rate Year USO; inter-censal Constituent Subdivisions National Core Core ('Yo)
(xJO') average)
Mexico 1950 25,791 4,716 18.3
Mexico and Morales states; Federal Dis- 1960 34,923 7,155 20.S 11.4 2,494
trict 1970 48,225 11,323 23.S 13.6 3,380
1980 66,847 17,395 26.0 10.2 4,829
1990 81,141 19,248 23.7 -9.3 5,543 '-;:l
> Nicaragua 1950 1,050 586 56.1 '-;:l
l:T1
Pacific region 1963 1,536 870 56.6 1.1 1,405 Gl 1970 1,878 1,116 59.S 6.8 1,955 z
:;<l
Panama 1950 805 248 30.8 tT1 Cl
Panama province (excl. Canal Zone) 1960 1,076 372 34.6 11.5 1,394 5 z 1970 1,428 577 40.4 15.6 2,009 >
r'
1980 1,789 829 46.3 13.7 2,894 ~ tTi
1990 2,329 1,074 46.0 --0.6 3,162 z ()
Paraguay 1972 2,358 699 29.6 pl
< Asuncion and Central departments 1982 3,030 952 31.4 5.8 2,012 0
r 1992 4,123 1,367 33.2 5.4 2,381 (82-90)
-~ z 9 !-" ..... -c -c 01

TABLE 1. Postwar Population Redistribution by Country (Continued) I~ (')
Population (thousands) Core - National GDP per capita (1985 ~ Country and Core Region Share of r-
Year Growth Rate USO; inter-censal ~ Constituent Subdivisions National Core Core(%) (xl03
) average)
~ Peru 1961 9,907 2,245 22.7 20.7
~ Lima department; Callao constitutional 1972 13,538 3,794 28.0 19.3 2,355
province 1981 17,005 5,189 30.5 9.5 2,824
1993 22,128 7,125 32.2 4.5 2,503 (81-90) a °tl
Uruguay 1963 2,596 1,461 56.3 7.1 ~ Montevideo and Canelones provinces 1975 2,788 1,563 56.0 --0.4 3,857 ::j
1985 2,931 1,663 56.7 1.2 3,898 0 z
Venezuela 1950 5,035 1,419 28.2 8 Miranda, Aragua and Carabobo states; 1961 7,524 2,445 32.5
z 12.9 5,436 (')
tT1
Federal District 1971 10,722 3,919 36.6 11 .9 6,843 ~ 1981 14,570 5,446 37.4 2.2 7,228
1990 19,325 7,007 36.3 -3.4 6,389 8 z East Asia and Pacific ~ Indonesia 1961 63,060 6,705 10.6 r-a (Java only) Bogor, Bekasi, Tanggerang 1971 76,086 9,200 21.1 12.9 687
and Seraog Kabupaten; Bogor Kola- 1981 91,270 13,027 14.3 16.6 1,091
madya; OKI Jakarta
I ..... (j

TABLE 1. Postwar Populi1tion Redis tribution by Country (Continued) ~ IN rnpulntion (thousaw-is) Core - National GDP per capita (1985
Country and Core Region Share of Growth Rate Year USD; inter-censal
Constituent Subdivisions National Core Core (%) (x IOJ) average)
-- ---- ----- - ---Republic of Korea 1955 21 ,502 3,928 18.3
Seoul city; Gyeongi province (1955-80); 1960 24,989 5,194 20.8 25.8 894
Seoul and Inchon cities, Gyeongi prov- 1966 29,193 6,911 23.7 21.7 1,037
ince (1985-90) 1970 31,435 8,879 28.2 44.1 1,427
1975 34,707 10,929 31.5 21.7 2,013 ..., )>
1980 37,449 13,202 35.5 24.1 2,371 ..., tT1 ::0
1985 40,448 15,828 39.1 20.9 3,695 CJ)
1990 43,520 18,586 42.7 17.5 5,238 (85-90) z ::0
Malaysia 1947 4,908 711 14.5 tT1 Cl
Selangor state; Federal territory (excl. 1957 6,279 1,013 16.1 10.8 na 5 z Sarawak) 1970 8,810 1,630 18.5 10.5 1,695
)> r
1980 10,945 2,346 21.4 14.7 2,945 ~ m 1990 14,182 3,489 24.6 12.5 4,338 (80-90) z
n Mongolia 1963 10,171 2,237 22.0 pl
< Ulan Bator ai"mak 1969 11,976 2,674 22.3 2.5 na 0
r 1979 15,950 4,023 25.2 12.2 na
~ Myanmar 1973 28,085 6,856 24.4 z
Yangon and Mandalay divisions 1983 34,125 8,544 25.0 2.5 455 9 .!.ol .... ~ ~
"'

TABLE l. Postwar Population Redistribution by Country (Continued) I~ (')
Population (thousands) Core - National GDP per capita (1985 i;i Country and Core Region Share of r
Year Growth Rate USO; inter-censal ~ Constituent Subdivisions National Core Core(%) (x lO') average)
~ 'Papua New Guinea 1966 2,150 135 6.3
I Central pruvince; National Capital District 1971 2,342 169 7.2 27.8 1,703
1980 2,978 229 7.7 7.1 1,697 0
1990 3,689 334 9.0 16.3 1,513 a "' Philippines 1948 19,234 2,745 14.3 ~ Bataan, Bulacan, Cavite, Laguna and 1960 27,088 4,147 15.3 5.8 942 (50-60) ::l
Rizal provinces; Metropolitan Manila 1970 36,684 6,449 17.6 13.8 1,244 0 z
1975 42,071 7,981 19.0 15.2 1,496 (') 0 z
1980 47,914 9,639 20.1 11.7 1,746 (') tr1
1990 60,477 13,263 21.9 9.0 1,810 ~ Taiwan 1956 9,311 1,818 19.5
Taipei and Taoyuan hsien; Taiwan 1966 13,348 3,007 22.5 14.3 1,560 § municipality; Keelung city 1970 14,693 3,736 25.4 30.3 2,132 2
1975 16,206 4,554 28.1 20.0 2,829 r
~ 1980 17,969 5,700 31.7 24.2 4,049
1986 19,454 6,884 35.4 13.2 5,535
1992 20,656 7,599 36.9 6.5 7,377 (86-90) ---
I N <:;l

TABLE 1. Postwar Popdation Redistribution by Country (Continued) ,~
Population (thousands) Core - National GDP per capita (1985 Country and Core Region Share of Growth Rate Year USD; inter-censal Constituent Subdivisions National Core Core(%)
(xl03) average)
'Thailand 1947 17,433 1,476 8.5
Phra Nakhon, Thon Buri, Nonthanburi 1960 26,258 2,567 9.8 11 .1 888 (50-60)
and Prakan changwats (1947-70); 1970 34,397 3,67~ 10.7 8.9 1,219
Bangkok and Sama! Prakan c/1angwats 1980 44,278 5,547 12.5 15.9 1,827
(1980-90) 1992 57,789 7,133 12.3 -1.2 2,839 (80-90) "' > Vietnam 1979 52,742 7,270 13.8 "' m
Ho Chi Minh, Haiphong and Hanoi cities 1989 64,376 8,428 13.1 -5.2 na al Soutli Asia z Bangladesh 1951 41.,932 4,073 9.7
gi C)
Dhaka district 1961 50,840 5,096 10.0 3.1 na Ci z 1974 71,479 7,612 10.6 4.7 853 > r
1981 87,120 10,014 11.5 10.9 966 ~ iTl
1991 104,766 13,151 12.5 8.8 1,122 (81-90) z ()
India 1961 424,836 12,246 2.9 !"1 <
Calcutta, Greater Bombay 1971 528,918 16,647 3.1 8.8 671 0 r 1981 658,141 23,107 3.5 10.9 747
~ 1991 843,931 31,805 3.8 7.1 929 (81-90) z
Nepal 1981 15,023 422 2.8 9 !-"
Kathmandu district 1991 18,491 675 3.6 38.0 868 (81-86) ..... ~ V1
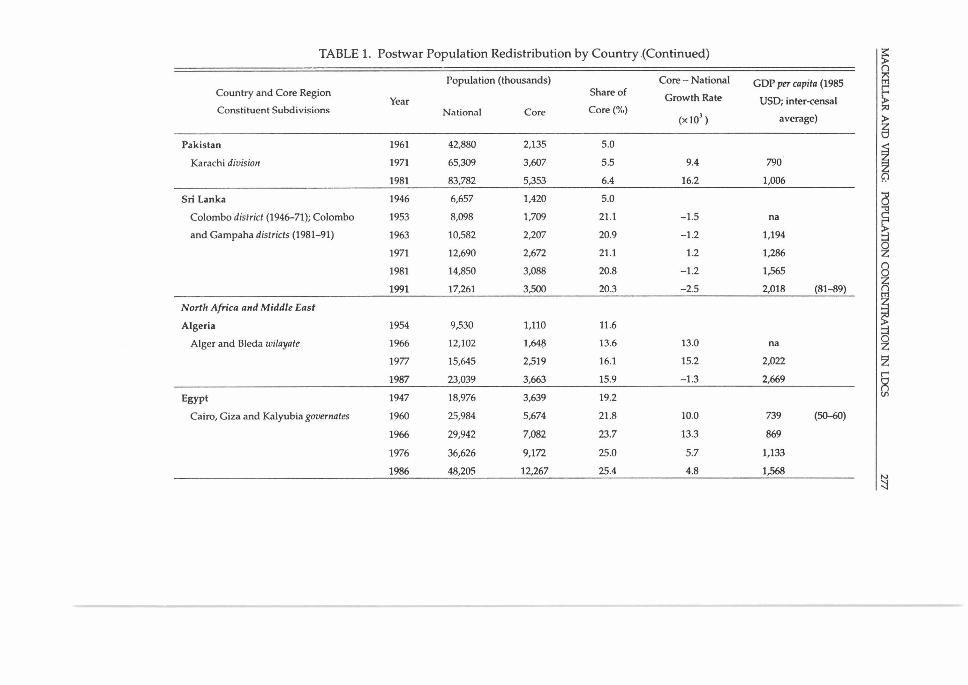
TABLE 1. Postwar Population Redistribution by Country .(Continued) I~ ()
Population (thousands) Core - National GDP per capita (1985 f';i Country and Core Region Share of r
Year Growth Rate USD; inter-censal ~ Constituent Subdivisions National Core Core(%) (x 103
) average)
~ Pakistan 1961 42,880 2,135 5.0
~ Karachi division 1971 65,309 3,607 5.5 9.4 790
1981 83,782 5,353 6.4 16.2 1,006
Sri Lanka 1946 6,657 1,420 5.0 a 'U
Colombo 'district (1946-71); Colombo 1953 8,098 1,709 21.1 -1.5 na
~ and Gampaha districts (1981-91) 1963 10,582 2,207 20.9 -1.2 1,194
1971 12,690 2,672 21.1 1.2 1,286 z 1981 14,850 3,088 20.8 -1.2 1,565
() 0
1991 17,261 3,500 20.3 -2.5 2,018 (81--89) I North Africa and Middle East
Algeria 1954 9,530 1,110 11.6
Alger and Bleda wilayate 1966 12,102 1,64~ 13.6 13.0 na z 1977 15,645 2,519 16.1 15.2 2,022 2 1987 23,039 3,663 15.9 -1.3 2,669 r
Egypt 1947 18,976 3,639 19.2 a Cairo, Giza and Kalyubia governates 1960 25,984 5,674 21.8 10.0 739 (50--60)
1966 29,942 7,082 23.7 13.3 869
1976 36,626 9,172 25.0 5.7 1,133
1986 48,205 12,267 25.4 4.8 1,568 'N :::J

TABLE 1. Postwar Population Redistribution by Country (Continued) 1~ Population (thousands) Core - National GDP per capita (1985
Country and Core Region Share of Year Growth Rate USO; inter-censal
Constituent Subdivisions National Core Core (0,{.)
(x 10') average)
Iraq 1965 8,047 1,597 19.8
Baghdad City governate 1977 12,000 3,l'll. 26.6 24.4 5,256
1987 16,335 3,841 23.5 -12.3 4,615
Israel 1948 717 556 77.5
Haifa, Central and Tel Aviv districts 1961 1,932 1,395 72.2 -5.5 na '"" :>
(excl. Arab population) 1972 2,687 1,844 68.6 -4.6 5,218 '"" m 1983 3,350 2,219 66.2 -3.2 7,358 Gl
Jordan 1961 901 434 48.2 z :>:l
Ammangovernate (excl. West Bank) 1979 2,152 1,188 55.2 7.6 1,861 m ()
Morocco 1960 11,626 1,562 13.0 0 z Casablanca and Rabat-Sale prefectures; 1971 15,379 2,704 17.6 24.5 1,056 :>
r
Ben Slimane province; Kenitra district 1982 20,265 3,982 19.7 10.1 1,599 Vl n r;;
Syria 1960 4,565 1,003 22.0 z n Damascus city; Damascus mohafazat 1970 6,305 1,458 23.1 5.1 1,860 ,tT1
< 1981 9,172 2,170 23.7 2.1 3,338 0
r Tunisia 1966 4,533 1,443 31.8
~ Tunis district; Nabeul, Zaghoun and 1975 5,588 1,861 33.3 5.0 1,616 z Birzete governates 1984 6,966 2,370 34.0 2.4 2,334 9
!'> ..... :8 VI

TABLE l. Postwar Population Redistribution by Country (Continued) I~ ()
Population (thousands) Core - National GDP per capita (1985 ?:i Country and Core Region Share of r
Year Growth Rate USO; inter-censal ~ Constituent Subdivisions National Core Core(%) (xlO') average)
~ S11b-Saharan Africa
~ Botswana 1971 574 18 3.1
Gaborene district 1981 941 60 6.4 71.0 1,406
1991 1,327 13". 10.1 46.1 2,553 (81-89) a -
~ Burkina Faso 1975 5,638 503 8.9
Kadiogo and Horiet provinces 1985 7,965 1,041 13.l 38.2 477 ::J Burundi 1979 4,029 460 11 .4
0 z Bujumbura-ville and Bujumbura-rural 1990 5,365 596 11.1 -2.5 495
()
~ provinces tTl
Congo 1974 1,320 302 22.9 ~ Brazaville commune 1984 1,909 585 30.6 29.4 2,099 ::J Cote d'Ivoire 1975 6,703 1,389 20.6 0 z
Abidjan department 1988 10,813 2,492 23.1 8.2 1,440 (78-90) !Z Ethiopia 1962 20,380 4,060 19.9 r
8 Shoa regionve 1970 20,487 4,993 24.4 25.2 271 Vl
Gambia 1973 493 79 16.0
Banjul and Kombo St. Mary administra- 1983 696 147 21.1 27.6 671
live divisions
I N
:cl

TABLE 1. Postwar Population Redistribution by Country (Continued) ,~ Population (thousands) Core - National GDP per capita (1985
Country and Core Region Share of Growth Rate Year USO; inter-censal Constituent Subdivisions National Core Core(%)
(xlO') average)
Ghana 1970 8,559 903 10.5
Greater Accra region 1984 12,296 1,431 11.6 7.0 882
Guinea 1977 4,527 578 12.8
Conakry region 1983 5,781 705 12.2 -8.5 391
Guinea-Bissau 1950 517 18 3.5 "' > Bissau autonomous region 1979 777 109 14.0 48.1 na "' tT1
Kenya 1962 8,634 344 4.0 al Nairobi area 1969 10,957 509 4.6 21.9 638 z
:>:l 1979 15,327 828 5.4 15.1 802 tT1
Cl
Lesotho 1966 969 202 20.8 0 z Maseru district (incl. migrant workers 1976 1,217 222 18.3 -13.3 614 > r
temporarily residing in South Africa) 1986 1,578 311 19.7 7.7 818 ~ r;; Liberia 1962 1,016 169 16.6 z n
Montserrado county 1974 1,503 322 21.4 21.1 855 .!"'1 <
1984 2,102 549 25.9 19.8 925 0 r
Madagascar 1966 6,200 1,580 25.5 ~
Tananarive province 1975 7,604 2,168 28.5 12.5 1,035 z 9 ~ .... '° '° "'

TABLE 1. Postwar Population Redistribution by Country (Continued) I~ (')
Population (thousands) Core - National GDP per capita (1985 gj Country and Core Region Share of
['""
Year Growth Rate USO; inter-censal ~ Constituent Subdivisions National Core Core(%) (xlOJ) average)
~ 'Malawi 1966 4,040 498 12.3
~ Lilongwe district 1977 5,547 704 12.7 2.7 460
19.87 7,988 976 12.2 -3.8 480
Mali 1976 6,395 1,351 21.1 ~ Bamako district; Koulikoro region 1985 7,838 1,745 22.3 5.8 487
~ Mauritania 1965 1,098 78 7.1
Nouakchott district 1977 1,339 135 10.1 29.2 1,048 z 1988 1,864 393 21.1 67.1 987
(') 0
Mozambique 1960 6,604 3,528 53.4 i Maputo city; Maputo, Nampula and 1970 8,169 4,264 52.2 -2.3 1,294
Zambezi provinces 1980 11,674 5,901 50.5 -2.9 1,177 ::l Namibia 1970 737 436 59.2 0 z
Owambo, Kavango and Windhoek dis- 1981 1,033 668 64.6 8.1 2,975 2 tricts 1991 1,402 910 64.9 0.3 2,323 (81-90) s Niger 1960 2,980 34 1.1
Niger city 1977 5,104 233 4.6 81.6
1988 7,222 392 5.4 10.2 560
I "' 00 .....

TABLE 1. Postwar Population Redistribution by Country (Continued) I ?J Population (thousands~ Core - National GDP per capita (1985
Country and Core Region Share of Growth Rate Year USO; inter-censal Constituent Subdivisions National Core Core(%)
(xlOJ ) average)
Rwanda 1978 4,832 698 14.4
Kigali prefect11re (1978); Kigali prefect11re 1991 7,149 1,151 16.1 8.3 663 (78-90)
and Kigali city (1991)
Sierra Leone 1948 1,858 125 6.7
Western area 1963 2.180 195 8.9 19.0 na "' > 1974 2,735 316 11 .6 23.3 981 "' tr1
1985 3,516 554 15.8 28.2 974 al Sudan 1955/ 56 10,263 246 2.4 z
::ti Khartoum state 1973 14,819 738 5.0 40.6 na tr1
CJ
1983 21,593 1,344 6.2 56.4 1,030 5 z 1993 24,941 3,413 13.7 44.7 1,039 (83-90) > r
Tanzania 1967 12,313 356 2.9 ~ r;;
Dar es Salaam region 1978 17,528 852 4.9 47.2 471 z ()
1988 23,174 1,361 5.9 18.9 523 ,trl
<: Uganda 1969 9,535 331 3.5 0
r' Kampala district 1980 12,636 459 3.6 4.1 651 _:;!
1991 16,672 774 4.6 22.3 707 (80-90) z 9 ~ ..... >D >D 01
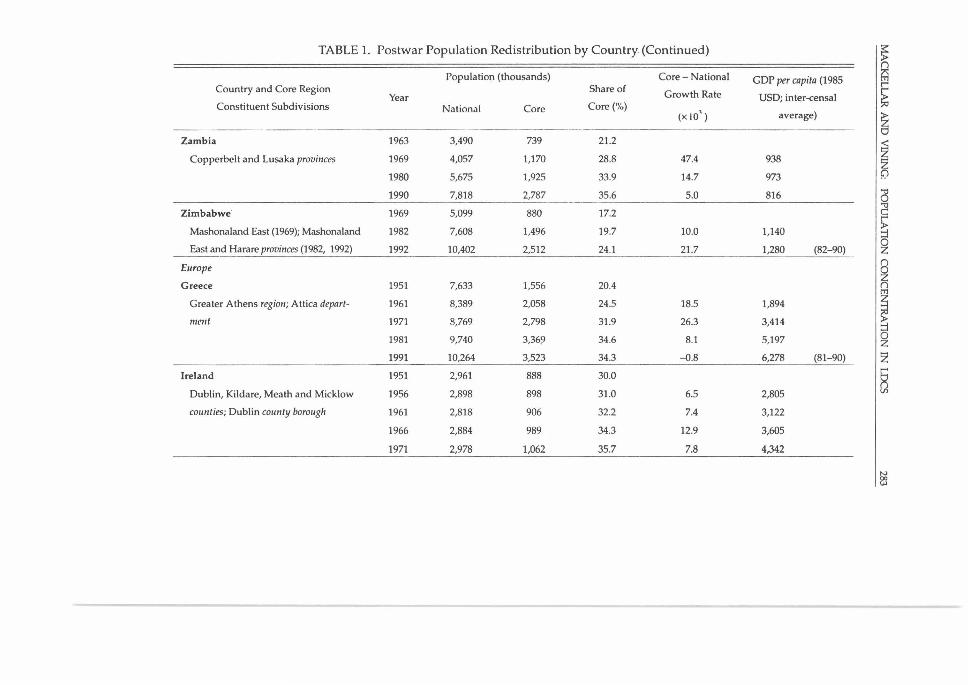
TABLE 1. Postwar Population Redistribution by Country. (Continued) I~ n
Population (thousands) Core - National GDP per capita (1985 ~ Country and Core Region Share of r
Year Growth Rate USO; inter-censal ~ Constituent Subdivisions National Core Core(%) (xl03
) average)
~ Zambia 1963 3,490 739 21.2
~ Copperbelt and Lusaka provinces 1969 4,057 1,170 28.8 47.4 938
1980 5,675 1,925 33.9 14.7 973 0
1990 7,818 2,787 35.6 5.0 816 a "' Zimbabwe· 1969 5,099 880 17.2
~ Mashonaland East (1969); Mashonaland 1982 7,608 1,496 19.7 10.0 1,140
East and Harare provinces (1982, 1992) 1992 10,402 2,512 24.1 21.7 1,280 (82-90) 0 z
Europe n 0 z
Greece 1951 7,633 1,556 20.4 n m
Greater Athens region; Attica depart- 1961 8,389 2,058 24.5 18.5 1,894
~ ment 1971 8,769 2,798 31.9 26.3 3,414
1981 9,740 3,369 34.6 8.1 5,197 0 z 1991 10,264 3,523 34.3 -0.8 6,278 (81-90) ~
Ireland 1951 2,961 888 30.0 r
8 Dublin, Kildare, Meath and Micklow 1956 2,898 898 31.0 6.5 2,805 (fl
counties; Dublin county borough 1961 2,818 906 32.2 7.4 3,122
1966 2,884 989 34.3 12.9 3,605
1971 2,978 1,062 35.7 7.8 4,342
I N 00 <»

TABLE 1. Postwar Population Redistribution by Country (Continued) 1~ Population (thousands) Core - National GDP per capita (1985
Country and Core Region Share of Growth Rate Year USO; inter-censal Constituent Subdivisions National Core Core(%)
(xl01) average)
Ireland (Continued) 1979 3,368 1,256 37.3 5.6 5,814
1981 3,440 1,289 37.5 2.4 6,885
1986 3,541 1,336 37.7 1.4 7,054
1991 3,523 1,350 38.3 3.1 8,112 (86--90)
Portugal 1950 8,441 1,551 18.4 ...., >
Lisboa, Setubal districts 1960 8,889 1,760 19.8 7.5 1,540 ...., tr1 :>:l
1970 8,668 2,076 24.0 19.1 2,596 (./")
1981 9,803 2,711 27.7 13.1 4,208 z 1990 9,853 2,778 28.2 1.9 5,809 (81-90) ~
C)
Spain 1950 27,977 4,158 14.9 5 z Barcelona, Madrid provinces 1960 30,431 5,484 18.0 19.3 2,535 >
r'
1970 34,003 7,722 22.7 23.0 4,607 )ll Fri
1981 37,746 9,346 24.8 7.9 6,668 z (")
1990 38,999 9,541 24.4 -1.3 8,492 !" <
Turkey 1950 20,947 2,755 13.2 0 r Istanbul, Ankara and Izmir provinces 1955 24,065 3,565 14.8 23.8 1,242
~ 1960 27,755 4,267 15.4 7.4 1,517 z
9 ~
~ "'
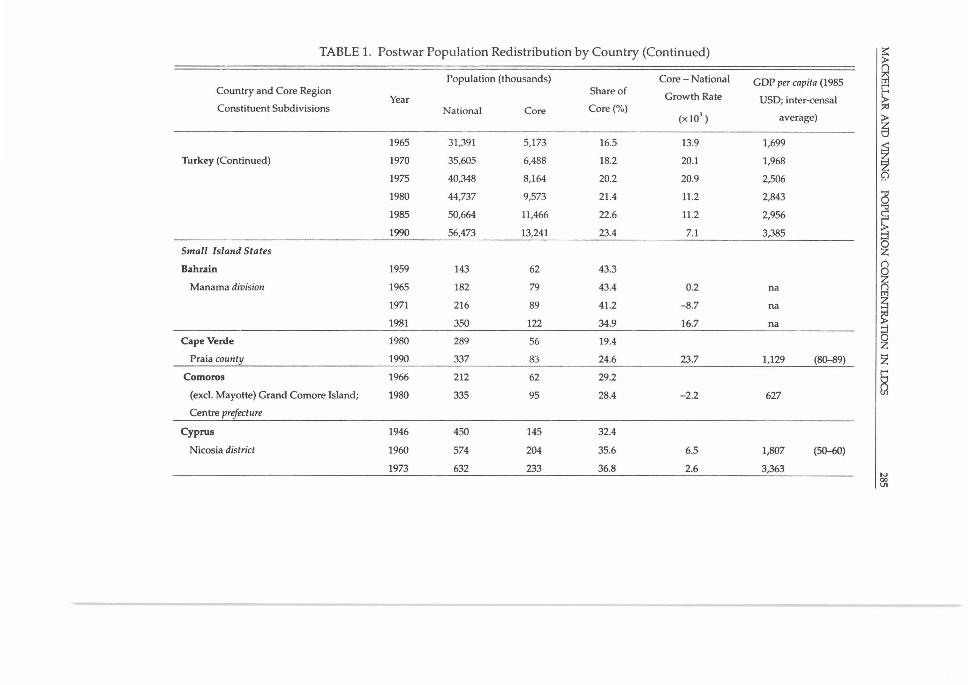
TABLE l. Postwar Population Redistribution by Country (Continued) I ~ (')
Population (thousands) Core - National GDP per capita (1985 1:l Country and Core Region Share of r-'
Year Growth Rate USD; inter-censal ~ Constituent Subdivisions National Core Core (%) (x JO') average)
~ 1965 31,391 5,173 16.5 13.9 1,699
~ Turkey (Continued) 1970 35,605 6,488 18.2 20.1 1,968
1975 40,348 8,164 20.2 20.9 2,506
1980 44,737 9,573 21.4 11.2 2,843 a ';:J
1985 50,664 11,466 22.6 11 .2 2,956
~ 1990 56,473 13,241 23.4 7.1 3,385
Small Island States z Bahrain 1959 143 62 43.3
(') 0
Manama division 1965 182 79 43.4 z
0.2 na (') lT1
1971 216 89 41.2 -8.7 na ~ 1981 350 122 34.9 16.7 na
Cape Verde 1980 289 56 19.4 g z
Praia county 1990 337 83 24.6 23.7 1,129 (80-89) z Comoros 1966 212 62 29.2 r-'
~ (excl. Mayotte) Grand Comore Island; 1980 335 95 28.4 -2.2 627
Centre prefecture
Cyprus 1946 450 145 32.4
Nicosia district 1960 574 204 35.6 6.5 1,807 (50-60)
1973 632 233 36.8 2.6 3,363 '"' 00
U1

TABLE 1. Postwar Population Redistribution by Country (Continued) 1~ Population (thousands) Core - National GDP per capita (1985
Country and Core Region Share of Growth Rate Year USO; inter-censal Constituent Subdivisions National Core Core(%)
(xl03) average)
·--- --·
Fiji 1966 476 154 32.3
Central division 1976 588 207 35.2 8.4 2,645
1986 715 260 36.4 3.2 3,263
Kiribati 1947 28 4 12.9
Tarawa Island 1963 38 8 20.8 24.4 "' > 1968 44 13 28.6 67.8 na "' m 1973 48 17 35.9 36.2 na ~
1978 52 20 39.0 16.5 na z ::<:!
1990 72 29 40.3 3.8 na m C"l
Maldives 1977 143 34 23.6 0 z Male', Male' Atoll 1985 180 55 30.3 31.3 > na r
1990 214 66 30.7 1.9 V">
na (j
Fi1 Marshall Islands 1980 31 12 38.2 z
(j
Majur Atoll (excL U.S. military forces) 1988 43 20 45.3 22.9 na !'1 <
Mauritius 1976 851 134 15.7 0 r
Port Louis district 1983 1,000 134 13.4 -23.0 3,838 _:!>!
1990 1,057 133 12.6 -9.0 4,737 z 9 ~ ..... '° '° U1

TABLE 1. Postwar Population Redistribution by Country (Continued) I~ (")
Population (thousands) Core - National ::-:: GDP per capita (1985 m
Country and Core Region Share of r Year Growth Rate USO; inter-censal ~ Constituent Subdivisions National Core Core(%)
(x 10') average)
~ 'Seychelles 1960 41 16 39.5
i Metropolitan Victoria; Anse aux Pins 1971 53 21 40.1 1.4 1,508
and Bel Ambre parishes 1977 62 26 41.6 9.5 2,006 0
Solomon Islands 1970 161 35 21.9 a "::l
Honiara and Guadacanal provinces 1976 197 47 23.7 15.5 na
~ 1986 285 80 28.1 16.3 na
Tonga 1956 57 31 55.0 0 z
Tongatpu division 1966 77 48 61.9 13.6 (")
na 0 z 1976 90 57 63.7 1.6 na (")
m 1986 95 63 67.3 4.6 na ~ Western Samoa 1961 114 49 43.4 ::l
Apia urban area; Northwest Upolu 1966 131 58 44.2 5.9 na ~ 1971 147 66 44.9 2.8 na z 1976 152 69 45.3 2.2
r na R
Vl
~

288 PAPERS IN REGIONAL SCIENCE, VOL. 74, NO. 3, 1995
APPENDIX B: SOURCES
Source citations for all countries and years not highlighted in Table 1 of Appendix A are in Appendix 1 of Vining (1986). The citatio11s which follow are for new data only. For obvious reasons, original census sources were favored, but recourse was often made to national statistical yearbooks which report census results. What are delicately termed "Estimates" in the statistical sources are not reported. In two cases, however - Thailand and Taiwan - 1992 population registers based on the 1990 censuses were used because available census volumes did not report at the required level of spatial disaggregation.
Algeria:
Argentina:
Bahrain:
Bangladesh·
Bolivia:
Botswana:
Brazil:
Burkina Faso:
Burundi:
Cape Verde:
Chile:
Colombia:
Comoros:
1987: Evolution des populations et des limites communales, 1977-87. Collections statistiques, No. 22. Algiers: Direction des statistiques regionales et de la cartographie (1991).
1991: Censo nacional de poblaci6n y vivienda 1991, p. 19. Buenos Aires: Instituto nacional de estadistica y censo.
1959 and 1965: 4th Census of Population 1965, Table 3, p . 58. Manama: Finance Department. 1971: Statistics of the Population Census 1971, Form 28, p. 161. Manama: Statistical Bureau. 1981: Bahrai11 Census of Population and Housing 1981, Table 3, p. 2. Manama: Directorate of Statistics.
1991: Preliminary Report of the Population Census of 1991, Appendix B, p. 17. Dacca: Bangladesh Bureau of Statistics.
1950: Ce11so de la poblaci6n 1950, p. 31. La Paz: Direcci6n general de estadistica y censos. 1976: Bolivia en cifras 1980, Table 14, p. 35. La Paz: Instituto nacional de estadistica. 1992: Censo nacional de poblaci6n y vivienda 1992, resultados finales, p. 8. La Paz: Ministerio de planeamiento y coordinaci6n.
1991: Populatio11 of Tow11s, Villages and Associated Localities, p.l. Gaborene: Central Statistical Office, Ministry of Finance and Development Planning (1992).
1991: Ce11so demogrdfico de 1991: analisos preliminares, Vol. 1, Table 3. Diretoria de pesquisas, fundac;ao instituto Brasiliero de geografia e estatistica.
1975 and 1985: An11uaire statistique du Burkina Faso 1988, Table 2.1.1.1, p. 25. Ouagadougou: lnstitut national de la statistique et de la demographie.
1979 and 1990: A11nuaire statistique 1990, Table 1.2 and 1.3, p. 5. Bujumbura: Institut de statistique et d'etudes economiques du Burundi (1991).
1980: Britan11ica Book of the Year, 1986. 1990: Britannica Bookoftl1eYear, 1994.
1992: Compendia estadistica 1993, Table 121-06, p. 12. Santiago: Instituto nacional de estadisticas.
1985: XV Censo nacional de poblaci6n, Vol. 1, Table 2, pp. 88, 109 and 157. 1993: Eduardo Bos, personal communication regarding XVI Censo de poblaci611 y vivienda.
1966 and 1980: Recensement general de la population et de /'habitat, 1980, p. 16. Moroni: Direction de la statistique (1984).

MACKELLAR AND VINING: POPULATION CONCENTRATION IN LIX:S 289
Congo:
Costa Rica:
Cote d'Ivoire:
Cuba:
Cyprus:
Ecuador:
Egypt:
El Salvador:
Fiji:
Ghana:
Greece:
Guatemala:
G.uinea:
Honduras:
India:
1974: Recensement general de la population 1974, Tome IV, Table l, p. 7. Brazzaville: Bureau central du recenscement. 1984: Recenscement gem!rale de la population et de !'habitat 1984, Vol. 3, Tome l, p. 3, Table 200. Brazzaville: Direction des statistiques demographiques et sociales.
1973: Censos nacionales de 1973, poblaci6n, Vol. 1, Table 1, p. 1. San Jose: Direcci6n general de estadistica y censos (1974). 1984: Censo de poblaci6n 1984, Table l, p. 1. San Jose: Ministerio de gobernaci6n y policia (1986).
1975: Britannica Book of the Year, 1986. 1988: Britannica Book of the Year, 1994.
1981: Annuario demogtifico 1984, Table 2, p. 2. Havana: Instituto de investigaciones estadisticas.
1946-73: Demographic Report 1991, p. 30, Table 2. Population Statistics, Series 2, Report No, 29. Nicosia: Department of Statistics and Research, Ministry of Finance.
1990: V Censo de poblaci611 1990, resu/tados defi11itivos, resume11 nacional, Table 2, p. 13. Quito: Ins ti tu to nacional de estadistica y censos (1991 ).
1986: Statistical Yearbook 1987, Tables 1, 2 and 3, p. 10. Cairo: Central Agency for Public Mobilisation and Statistics.
1950: Avance tercer censo de poblaci611 1961, Table l , p. IV. San Salvador: Direcci6n general de estadistica y censos. 1961 and 1971: Cuatro censo 11acional de poblaci6n, cifras preliminarios, Table 2, p. 2. San Salvador: Direcci6n General de Estadistico y Censos. 1992: Britannica Book of tile Year, 1994.
1966 and 1976: South Pacific Commission, Population of Fiji, Table 11, p. 28. Noumea: South Pacific Commission (1989). 1986: Report of Fiji Population Census, Table 2.7, p . 16. Suva: Bureau of Statistics (1989).
1970 and 1984: Quarterly Digest of Statistics December 1991, Vol. XI, Number 4, Table 94, p. 112. Accra: Statistical Service.
1991: Pragmatikos plethusnmos tes Ellados, Table B, p. 7. Athens, 1991
1973: VIII ce11so de poblaci6n 1973, Vol. 1, Series 3, Table 1, p. 5. Guatemala City: Direcci6n general de estadistica. 1981: Ce11so nacional de 1981, Vol. 1, Table l, p. 37. Guatemala City: Instituto nacional de estadistica.
1977: Britannica Book of tile Year, 1986. 1983: Britannica Book of tlze Year, 1991.
1945-74: Anuario estadistica 1983, Table 1, p. 19. Tegucigalpa: Direcci6n de estadistica y censos. 1988: Censo nacional de poblaci6n, Tome 1.
1991: Bose, A., Population of India: 1991 Census Results and Methodologi;, Table 1, p. 56. Delhi: B. R. Publishing Company.

290 PAPERS IN REGIONAL SCIENCE, VOL. 74, NO. 3, 1995
Iraq: 1965: Central Statistical Office, General Population Census of 1965. 1977 and 1987: Annual Abstract of Statistics 1988. Baghdad: Central Statistical Organisation, Ministry of Plan.
Ireland: 1986 and 1991: Statistical Abstract 1991, Table 2.4, p. 24. Dublin: Central Statistical Office.
Israel: 1983: Census of Population and Housing 1983: Selected Results from Complete Enumeration, Table 4, p. 69. Tel Aviv: Central Bureau of Statistics.
Jamaica: 1960-82: Statistical Yearbook of Jamaica 1989, Tables 3.1 and 3.3, pp. 89-90. Kingston: The Statistical Institute of Jamaica (1989); 1991: Demographic Statistics 1991, Table (ii), p . (iii) . Kingston: Statistical Institute of Jamaica.
Kiribati: 1947-78: Report on the 1978 Census of Population and Housing, Vol. II, Table 1.1, p. 26. Bairiki Taraw Kiribati: Ministry of Home Affairs and Decentralisation (1983). 1990: Britannica Book of the Year, 1994.
Korea: 1985-90: Korea Statistical Yearbook 1991, Table 2, p. 36. Seoul: National Statistical Office.
Lesotho: 1966: Populat1011 Census Report, Vol. 1, Table 1, p . 98. Maseru: Bureau of Statistics. 1976 and 1986: Lesot/w Statistical Yearbook 1988, Table B.2, p . 19. Maseru: Bureau of Statistics (1990).
Liberia: 1962-84: 1984 Population and Housing Census Summary Population Results, Table 1, p. 11. Monrovia: Ministry of Planning and Economic Affairs (1987).
Madagascar: 1966 and 1975: Andrianarivelo Rafrezy Vincent and Randretsa Iarivony, Population de Madagascar. Antanarivo: Ministere de l'enseignement superieure et de la recherche scientifique (1984). i9ff, data are from a demographic inquiry; 1975 data from a population census.
Malawi: 1966 and 1977: Malawi Population Census 1977, Final Report, Vol. 1, Table 1.2, p. 1. Zomba: National Statistical Office. 1987: Britannica Book of the Year, 1994.
Malaysia: 1991: Britannica Book of t/ie Year, 1994.
Maldives: 1977-90: Statistical Yearbook of Maldives 1990, Table 11-1, p. 10. Male': Ministry of Planning and Environment.
Mali: 1976: Analyse du recensement de 1976, Vol. III, Table 1, p . 8. Bamako: Ministere du plan (1985). 1985: Annuaire statistique du Mali, Table 1, p . 41. Bamako: Ministere du Plan (1988).
Marshall Islands: 1980 and 1988: Census of Population and Housing 1988 Final Report, Table 3.2, p . 16. Majeru: Office of Planning and Statistics.
Mauritania: 1965 and 1977: Recensement general de la population 1977, Vol. 2, p . 25. Nouakchott: Direction de la statistique.
·1988: Britannica Book of the Year, 1994.
Mauritius: 1976-90: 1990 Housing and Population Census of Mauritius, Vol. II, Table l, p . 1. Port Louis: Ministry of Economic Planning and Development, 1991.

MACKELLAR AND VINING: POPULATION CONCENTRATION IN LDCS 291
Mexico:
Mongolia:
Morocco:
Mozambique:
Myanmar:
Namibia:
Nepal:
Nicaragua:
Niger:
Panama:
1990: Agenda estadistica 1990, Table III.l, p. 49. Mexico City: Instiuto nacional de estadistica, geografia e informatica (1991).
1963-79: National Economy for the Mongolian People's Republic for the Sixty Years 1921-81, pp. 76-79. Ulan Bator: Central Statistical Board.
1960-82: Findlay, A. M., and Findlay, A. F. 1986. Regional economic disparities and population change in Morocco. Scottish Geograhical Magazine 102: 29-41 .
1960 and 1970: Statistical Abstract 1972. 1980: First Population Census of Mozambique, 1980, Table 2. Maputo: Conselho Coordenador de Recenseamente.
1973 and 1983: Statistical Yearbook 1989, p. 10. Yangon: Central Statistical Organisation.
1970-91: Statistical Abstract 1992, Table 2.1. Windhoek: Central Statistics Office, National Planning Commission.
1981 and 1991: Statistical Yearbook of Nepal 1993, Table 1.2, pp. 5-6. Kathmandu: Central Bureau of Statistics.
1950-70: Censos 11acio11ales 1971, Vol. 1, p. III. Managua: Banco central de Nicaragua (1974).
1960-88: Republique du Niger, Direction de la statistique et de la demographie, Am111aire statistique, "5eries Longues," 1991, Table 2.02 and 2.07. Niamy: Ministere du plan.
1990: lndicadores economicos y sociales de Panama 1981-1990 y primer semestre de 1991, Table II, p. 3. Panama City: Direcci6n de estadistica y censo (1991).
Papua New Guinea: 1966-80: A Crosbie Walsh, I11ter-provi11cial migration in Papua New G11inea, Tables la, p . 13 and lb, p . 14.
Paraguay:
Peru:
Philippines:
Portugal:
Rwanda:
Seychelles:
1980 National Pop11latio11 Cens11s Reserc/1 Mo11ograp /1 N11mber 3. Port Moresby: National Statistical Office (1985). 1990: Britannica Book of the Year, 1994.
1972-82: Annuario estadistico de/ Parag11ay 1984, Table 2.1.2, p . 27; 1992: Censo 11acio11al de poblaci6n y vivienda 1992 (cifras provisorias), Table 2, p . 3. Asuncion: Direcci6n general de estadistica, encuestas y censos.
1993: Crecimiento y distribucion de Ia Poblaci6n (analisis de cifras preliminares), Table 5, p . 25. Lima: Instituto Nacional de Estadistica e informatica, Direcci6n tecnica de demografia y estudios sociales.
1990: Philippines Statistical Yearbook 1991 , Table 1.1, pp.1-4. Manila: Republic of Philippines National Statistical Coordination Board.
1990: Port11gal Em N11meros, 1991, p. 7. Lisbon: Instituto Nacional de Estatistica.
1978: Britannica Book of the Year, 1986. 1991: Britannica Book of the Year, 1994.
1960-77: 1977 Ce11s11s Report, Table 13.6, p . 48. Mahe: Republic of Seychelles (1978).

292 PAPERS IN REGIONAL SCIENCE, VOL. 74, NO. 3, 1995
Sierra Leone: 1985: Gleave, M. 1988. Changing population distribution in Sierra Leone, 1974-85. Geography 73: 351-54.
Solomon Islands: 1970-86: Report on the Census of Population 1986, Report 2, A, Basic Information, Basic Table 1, p. 71. Honiara: Statistics Office.
Spain: 1990: Censo de Viviendes 1991, Avance de Resultados, p . 19. Madrid: lnstituto Nacional de Estadistica (1992).
Sri Lanka: 1991: Population Statistics of Sri I.Anica, Table 11, p. 12. Colombo: Population Information Center, Population Division, Ministry of Health and Women's Affairs (1992).
Sudan:
Taiwan:
Tanzania:
Thailand:
Tonga:
Tunisia:
Turkey:
Uganda:
Uruguay:
Venezuela:
Vietnam:
Western Samoa:
1955/56-83: Saghayroun, A., Farah, A., Ahmed, S., and Kheir, M. 1988. Population and development in the Sudan: The quest for a national policy. Khartoum: Sudan National Population Committee (1988). 1993: Population Census of Sudan 1993 Provisional Results, Table 1. Khartoum: Census Office, Central Bureau of Statistics.
1986: 1986 Taiwan-Fukien Demographic Fact Book of Republic of China, pp. 30 and 42. Taipei: Ministry of the Interior. 1992: Monthly Statistics of the Republic of China, 320 (September 1992). Taipei: Directorate-General of Budget, Accounting and Statistics.
1988: 1988 Population Census: Preliminary Report, Table 1, p. 21. Dar es Salaam: Bureau of Statistics, Ministry of Finance, Economics Affairs and Planning.
1992: Key Statistics of Thailand 1993, Table 1.2, p. 4. Bangkok: National Statistics Office, Office of the Prime Minister.
1956-86: Statistical Abstract 1987, Table 6, p. 9. Nuku'alofa: Statistics Department (1988).
1984: Recensement general de In population et de !'habitat 1984, Vol. 1, Table 3, p. 24. Tunis: Institut national de la statistique.
1985: Gene! Naifus Sazimi 1985, Table 6, p. 6. Ankara: Prime Ministry. 1990: 1990 Gene! Nufus Sayimi Idari Bii/Unus, Table 6, p. 6. State Institute of Statistics, Prime Ministry. Ankara, 1991.
1969-91: Final Results of the 1991 Population and Housing Census, Table 2. Entebbe: Ministry of Finance and Economic Planning, 1992.
1985: Recuentos preliminarios VI censo general de poblaci6n, Table Tl, p. 1. Montevideo: Direcci6n General de Estatdistica y Censo.
1990: Anuario estadistica de Venezuela 1990, Table 211-01, p. 185. Caracas: Oficina central de estadistica e informatica.
1979: Population Census 1979, Table 1, p. 23. Hanoi: General Population Census Central Committee (1982). 1989: Completed Census Results, Vietnam Population Census 1989, Vol. 1, Table 1.1, p. 13. Hanoi: Central Census Steering Committee (1991).
1961-76: Census of Population and Housing 1976, Analytical Report, Vol. 2, Tables 2.2 and 2.3, pp. 9-10. Apia: Department of Statistics (1979).

MACKELLAR AND VINING: !'OPULA TION CONCENTRATION IN LDCS 293
Zambia:
Zimbabwe:
1980: 1980 Census of Population and Housing Preliminary Report, Table Al, p. 8. Lusaka: Central Statistical Office. (1981). 1990: Britannica Book of the Year 1994.
1969: Statistical Yearbook 1987, Table 2.12, p. 22. Harare: Central Statistical Office (1987). 1982 and 1992: Census 1992 Preliminary Report, Table 2.2. Harare: Central Statistics Office.

Related Documents