Poly(ethylene oxide) and its blends with sodium alginate Tuncer C ¸ aykara a, * , Serkan Demirci a , Mehmet S. Erog ˘lu b , Olgun Gu ¨ven c a Department of Chemistry, Faculty of Art and Science, Gazi University, 06500 Besevler, Ankara, Turkey b Department of Chemical Engineering, Marmara University, 34722 Go ¨ztepe, Istanbul, Turkey c Department of Chemistry, Hacettepe University, 06532 Beytepe, Ankara, Turkey Received 1 February 2005; received in revised form 18 July 2005; accepted 2 September 2005 Available online 26 September 2005 Abstract A series of blends based on poly(ethylene oxide) (PEO) and sodium alginate (NaAlg) were prepared by solution casting method. The blends thus obtained were characterized by using Fourier transform infrared spectroscopy (FT-IR), thermogravimetric analysis (TGA), differential scanning calorimetry (DSC), tensile strength test, contact angle measurements and atomic force microscopy (AFM). FT-IR studies indicate that there are the hydrogen bonding interactions due to the ether oxygen of PEO and the hydroxyl groups of NaAlg. The thermal stability of the blends was slightly affected with increasing NaAlg content. DSC results showed that both melting point and crystallinity depend on the composition of the blends. Mechanical properties of the blend films were improved compared to those of homopolymers. Surface free energy components of the blend films were calculated from contact angle data of various liquids by using Van Oss–Good methodology. It was found that the surfaces both of the blends are enriched in low surface free energy component, i.e. NaAlg. This conclusion was further confirmed by the AFM images observation of the surface morphology of these blends. q 2005 Elsevier Ltd. All rights reserved. Keywords: Miscibility; Poly(ethylene oxide); Sodium alginate 1. Introduction The importance of polymeric blends has been increased in recent years because of the preparation of the polymeric materials with desired properties, low basic cost, and improved processability. Polymeric blends are physical mixtures of structurally different polymers or copolymers which interact with secondary forces with no covalent bonding such as hydrogen bonding, dipole–dipole forces and charge-transfer complexes for homopolymer mixtures [1–4]. The blend materials from either synthetic or natural polymers alone are not always able to meet all the complex demands of the biomaterials. The success of synthetic polymers as biomaterials relies on their wide range of mechanical properties, transformation processes that allow a variety of different shapes to be easily obtained, and at low production cost. Biological polymers present good biocompat- ibility, but their mechanical properties are often poor. The necessity of preserving biological properties complicates their processability, and their production or recovery cost are very high [5]. Therefore, biologically polymeric important materials based on the blends of synthetic and natural polymers have been prepared, such as poly(N-vinyl-2-pyrrolidone)-kappa- carrageenan (PVP/KC), poly(N-vinyl-2-pyrrolidone)-iota-car- rageenan (PVP/IC) [6], poly(ethylene oxide)-hydroxypropyl methylcellulose (PEO/HPMC) [7], poly(vinyl alcohol)-chit- osan (PVA/C) [8]. Alginates, a naturally occurring polysaccharide obtained from marine brown algae, comprising linear chain of (1,4)-b-D- mannuronic acid and (1,3)-a-L-guluronic acid [9]. Sodium alginate (NaAlg), a polyelectrolyte having rigid molecular chain [10], and good film forming ability, has been extensively exploited and studied in detail on biomedical applications as a drug carrier [11,12]. Generally, the formation of specific intermolecular inter- actions through hydrogen bonding between two or more polymers is responsible for the observed mixing behaviors and properties of the blends prepared from aqueous solutions [13]. The study of the blends properties is of importance to explore further applications of the resulting blends for biomedical and pharmaceutical devices. Poly(ethylene oxide) [PEO] is a unique class of water-soluble, aerobically biodegradable thermoplastic [14,15]. Due to its excellent biocompatibility and very low toxicity, the potential use of PEO in biomedical Polymer 46 (2005) 10750–10757 www.elsevier.com/locate/polymer 0032-3861/$ - see front matter q 2005 Elsevier Ltd. All rights reserved. doi:10.1016/j.polymer.2005.09.041 * Corresponding author. E-mail address: [email protected] (T. C ¸ aykara).

Welcome message from author
This document is posted to help you gain knowledge. Please leave a comment to let me know what you think about it! Share it to your friends and learn new things together.
Transcript
Poly(ethylene oxide) and its blends with sodium alginate
Tuncer Caykaraa,*, Serkan Demircia, Mehmet S. Eroglub, Olgun Guvenc
a Department of Chemistry, Faculty of Art and Science, Gazi University, 06500 Besevler, Ankara, Turkeyb Department of Chemical Engineering, Marmara University, 34722 Goztepe, Istanbul, Turkey
c Department of Chemistry, Hacettepe University, 06532 Beytepe, Ankara, Turkey
Received 1 February 2005; received in revised form 18 July 2005; accepted 2 September 2005
Available online 26 September 2005
Abstract
A series of blends based on poly(ethylene oxide) (PEO) and sodium alginate (NaAlg) were prepared by solution casting method. The blends
thus obtained were characterized by using Fourier transform infrared spectroscopy (FT-IR), thermogravimetric analysis (TGA), differential
scanning calorimetry (DSC), tensile strength test, contact angle measurements and atomic force microscopy (AFM). FT-IR studies indicate that
there are the hydrogen bonding interactions due to the ether oxygen of PEO and the hydroxyl groups of NaAlg. The thermal stability of the blends
was slightly affected with increasing NaAlg content. DSC results showed that both melting point and crystallinity depend on the composition of
the blends. Mechanical properties of the blend films were improved compared to those of homopolymers. Surface free energy components of the
blend films were calculated from contact angle data of various liquids by using Van Oss–Good methodology. It was found that the surfaces both of
the blends are enriched in low surface free energy component, i.e. NaAlg. This conclusion was further confirmed by the AFM images observation
of the surface morphology of these blends.
q 2005 Elsevier Ltd. All rights reserved.
Keywords: Miscibility; Poly(ethylene oxide); Sodium alginate
1. Introduction
The importance of polymeric blends has been increased in
recent years because of the preparation of the polymeric
materials with desired properties, low basic cost, and improved
processability. Polymeric blends are physical mixtures of
structurally different polymers or copolymers which interact
with secondary forces with no covalent bonding such as
hydrogen bonding, dipole–dipole forces and charge-transfer
complexes for homopolymer mixtures [1–4].
The blend materials from either synthetic or natural
polymers alone are not always able to meet all the complex
demands of the biomaterials. The success of synthetic
polymers as biomaterials relies on their wide range of
mechanical properties, transformation processes that allow a
variety of different shapes to be easily obtained, and at low
production cost. Biological polymers present good biocompat-
ibility, but their mechanical properties are often poor. The
necessity of preserving biological properties complicates their
0032-3861/$ - see front matter q 2005 Elsevier Ltd. All rights reserved.
doi:10.1016/j.polymer.2005.09.041
* Corresponding author.
E-mail address: [email protected] (T. Caykara).
processability, and their production or recovery cost are very
high [5]. Therefore, biologically polymeric important materials
based on the blends of synthetic and natural polymers have
been prepared, such as poly(N-vinyl-2-pyrrolidone)-kappa-
carrageenan (PVP/KC), poly(N-vinyl-2-pyrrolidone)-iota-car-
rageenan (PVP/IC) [6], poly(ethylene oxide)-hydroxypropyl
methylcellulose (PEO/HPMC) [7], poly(vinyl alcohol)-chit-
osan (PVA/C) [8].
Alginates, a naturally occurring polysaccharide obtained
from marine brown algae, comprising linear chain of (1,4)-b-D-
mannuronic acid and (1,3)-a-L-guluronic acid [9]. Sodium
alginate (NaAlg), a polyelectrolyte having rigid molecular
chain [10], and good film forming ability, has been extensively
exploited and studied in detail on biomedical applications as a
drug carrier [11,12].
Generally, the formation of specific intermolecular inter-
actions through hydrogen bonding between two or more
polymers is responsible for the observed mixing behaviors and
properties of the blends prepared from aqueous solutions [13].
The study of the blends properties is of importance to explore
further applications of the resulting blends for biomedical and
pharmaceutical devices. Poly(ethylene oxide) [PEO] is a
unique class of water-soluble, aerobically biodegradable
thermoplastic [14,15]. Due to its excellent biocompatibility
and very low toxicity, the potential use of PEO in biomedical
Polymer 46 (2005) 10750–10757
www.elsevier.com/locate/polymer
T. Caykara et al. / Polymer 46 (2005) 10750–10757 10751
applications has attracted a great deal of attention from both the
industrial and scientific points of view [16–18]. Studies by
Kondo et al. have established that the primary hydroxyl group
on cellulose and methylcelluloses can form a hydrogen bond to
ether oxygen in PEO [7]. Similarly, hydroxyl groups on sodium
alginate can also form a hydrogen bond to the ether oxygen in
PEO. So, PEO as a suitable candidate blended with NaAlg was
therefore selected.
Theoretically, the miscibility of polymer blends is mainly
determined by the chemical structure, composition and
molecular mass of each component. In some cases, the
preparation conditions of the blends are also decisive.
Experimentally, various techniques have been used to
characterize the miscibility of polymer blends, such as optical
transparency, Fourier transform infrared spectroscopy (FT-IR),
electron microscopy, differential scanning calorimetry (DSC),
dynamic mechanical thermal analysis (DMTA) and high-
resolution solid state 13C nuclear magnetic resonance (NMR)
[19,20]. Each technique bears intrinsic limitations in terms of
sensitivity of detectable phase domain size. Therefore, the
phase separation observed by one of these techniques cannot
provide a perfect reflection of the thermodynamic definition of
miscibility.
In this study, we focused on the binary blends of PEO and
NaAlg to investigate their miscibility as a function of blend
composition by the techniques of FT-IR, thermogravimetric
analysis (TGA), DSC, mechanical testing, contact angle
measurements and atomic force microscopy (AFM). There-
after, the miscibility, intermolecular interactions and some
fundamental morphological and structure property correlations
in PEO/NaAlg blends are addressed.
2. Experimental
2.1. Materials
Sodium alginate (high viscosity) and poly(ethylene oxide)
(MWZ300,000 g/mol) were obtained from Sigma Chemical
Co. and Aldrich, respectively, and used as received.
2.2. Preparation of the films
Aqueous solutions of the individual polymers (1% w/v)
were mixed to obtain the desired proportions and stirred for
30 min at room temperature. The pure and mixture solutions
both transparent (wt% of NaAlg; 9, 20, 33, 43, 50) were cast on
Petri dishes by water evaporation at 25 8C. The films were
dried under vacuum at 60 8C for 10 days. The dried films of
thickness ranging 40G7 mm were obtained.
2.3. Fourier transform infrared spectroscopy (FT-IR)
FT-IR spectra of the blends were measured on a Nicolet 520
FT-IR spectrophotometer. The samples were prepared by
making KBr (potassium bromide) pellets containing 3 wt% of
materials.
2.4. Thermogravimetric analysis (TGA)
The dynamic weight loss tests were conducted on a TA
instrument 2050 thermogravimetric analyzer (TGA). All tests
were conducted in a N2 purge (25 mL/min) using sample
weights of 5–10 mg over a temperature range 20–600 8C at a
scan rate of 10 8C/min.
2.5. Differential scanning calorimetry (DSC)
The glass transition temperatures of the blends were
determined by use of a TA instrument DSC 2010 thermal
analyzer system. DSC was calibrated with metallic indium
(99.9% purity). All polymers were tested in crimped aluminum
pans at a heating rate of 10 8C/min under dry N2 gas
(25 mL/min) over a temperature range from 20 to 175 8C.
Melting temperature was taken as the peak of the melting
endoterm. The error in each measurement was estimated to be
G0.5 8C.
2.6. Mechanical measurements
The stress–strain measurements of the blends were
performed by a AG-A electron tensiletester (Schimadzu Co.)
in the environment of 22 8C by using a crosshead speed of
5 mm/min. The rectangular samples with dimensions at
25 mm!10 mm!40G7 mm were analyzed at room tempera-
ture. At least three samples were used for all mechanical
measurements.
2.7. Contact angle measurements
The contact angles of water, glycerol, ethylene glycol,
formamide and paraffin drops on the polymer films were
measured with a Model G-III Contact Angle Meter (Kernco
Instrument Co. Inc., El Paso, TX, USA). The one-liquid
method (air–liquid drop-polymer system) was used. All
measured contact angles were the average of three
measurements.
2.8. Atomic force microscopy measurements
The microscopic image of the blends was determined by
an atomic force microscopy (AFM; Nanoscope IIIa, Digital
Instruments, Santa Barbara, CA, USA) with a nanoprobe
200 mm in length and a pyramidal oxide-sharpened silicon
nitride cantilever with a spring constant of 0.12 N/m. The
opening angle of tip was 458. The amplitudes used of
the drive signal applied to the cantilever oscillation were in
the between 0.5 and 2 V. The scan rates ranged from 0.8 to
1 Hz. Tapping mode of operation was used to eliminate
shear forces that may damage the films and reduce the
image resolution. Images (2!2 mm2) were undertaken in air
at 25 8C.
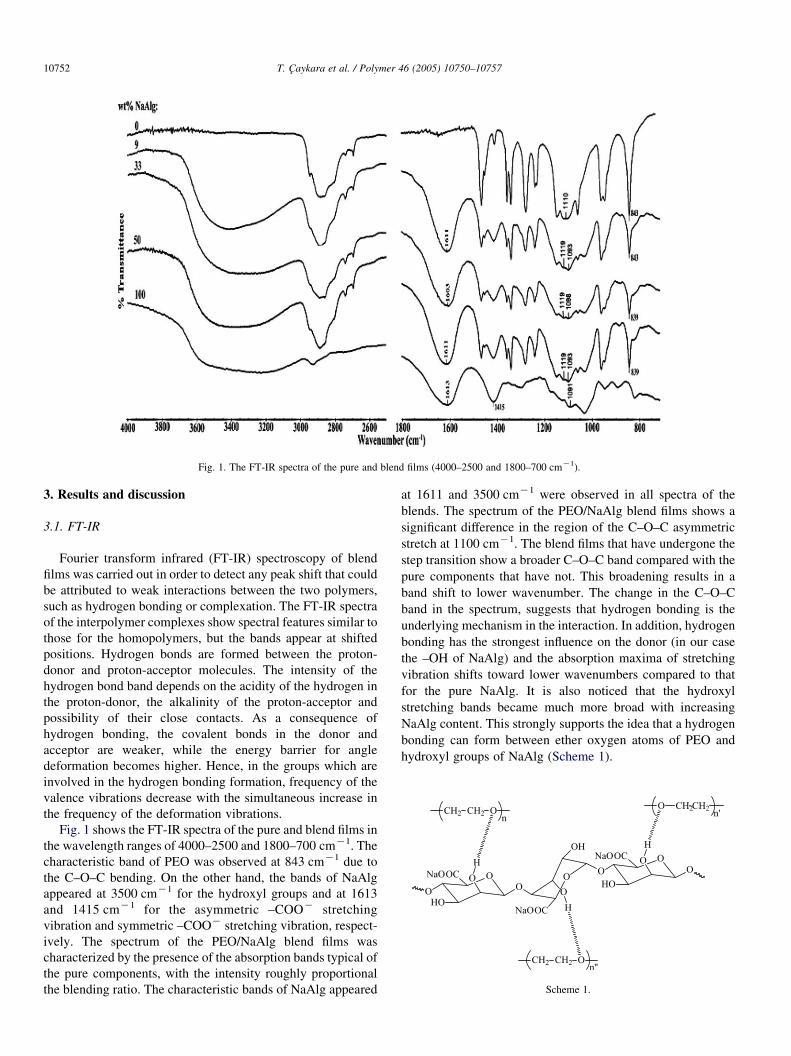
Fig. 1. The FT-IR spectra of the pure and blend films (4000–2500 and 1800–700 cmK1).
Scheme 1.
T. Caykara et al. / Polymer 46 (2005) 10750–1075710752
3. Results and discussion
3.1. FT-IR
Fourier transform infrared (FT-IR) spectroscopy of blend
films was carried out in order to detect any peak shift that could
be attributed to weak interactions between the two polymers,
such as hydrogen bonding or complexation. The FT-IR spectra
of the interpolymer complexes show spectral features similar to
those for the homopolymers, but the bands appear at shifted
positions. Hydrogen bonds are formed between the proton-
donor and proton-acceptor molecules. The intensity of the
hydrogen bond band depends on the acidity of the hydrogen in
the proton-donor, the alkalinity of the proton-acceptor and
possibility of their close contacts. As a consequence of
hydrogen bonding, the covalent bonds in the donor and
acceptor are weaker, while the energy barrier for angle
deformation becomes higher. Hence, in the groups which are
involved in the hydrogen bonding formation, frequency of the
valence vibrations decrease with the simultaneous increase in
the frequency of the deformation vibrations.
Fig. 1 shows the FT-IR spectra of the pure and blend films in
the wavelength ranges of 4000–2500 and 1800–700 cmK1. The
characteristic band of PEO was observed at 843 cmK1 due to
the C–O–C bending. On the other hand, the bands of NaAlg
appeared at 3500 cmK1 for the hydroxyl groups and at 1613
and 1415 cmK1 for the asymmetric –COOK stretching
vibration and symmetric –COOK stretching vibration, respect-
ively. The spectrum of the PEO/NaAlg blend films was
characterized by the presence of the absorption bands typical of
the pure components, with the intensity roughly proportional
the blending ratio. The characteristic bands of NaAlg appeared
at 1611 and 3500 cmK1 were observed in all spectra of the
blends. The spectrum of the PEO/NaAlg blend films shows a
significant difference in the region of the C–O–C asymmetric
stretch at 1100 cmK1. The blend films that have undergone the
step transition show a broader C–O–C band compared with the
pure components that have not. This broadening results in a
band shift to lower wavenumber. The change in the C–O–C
band in the spectrum, suggests that hydrogen bonding is the
underlying mechanism in the interaction. In addition, hydrogen
bonding has the strongest influence on the donor (in our case
the –OH of NaAlg) and the absorption maxima of stretching
vibration shifts toward lower wavenumbers compared to that
for the pure NaAlg. It is also noticed that the hydroxyl
stretching bands became much more broad with increasing
NaAlg content. This strongly supports the idea that a hydrogen
bonding can form between ether oxygen atoms of PEO and
hydroxyl groups of NaAlg (Scheme 1).
T. Caykara et al. / Polymer 46 (2005) 10750–10757 10753
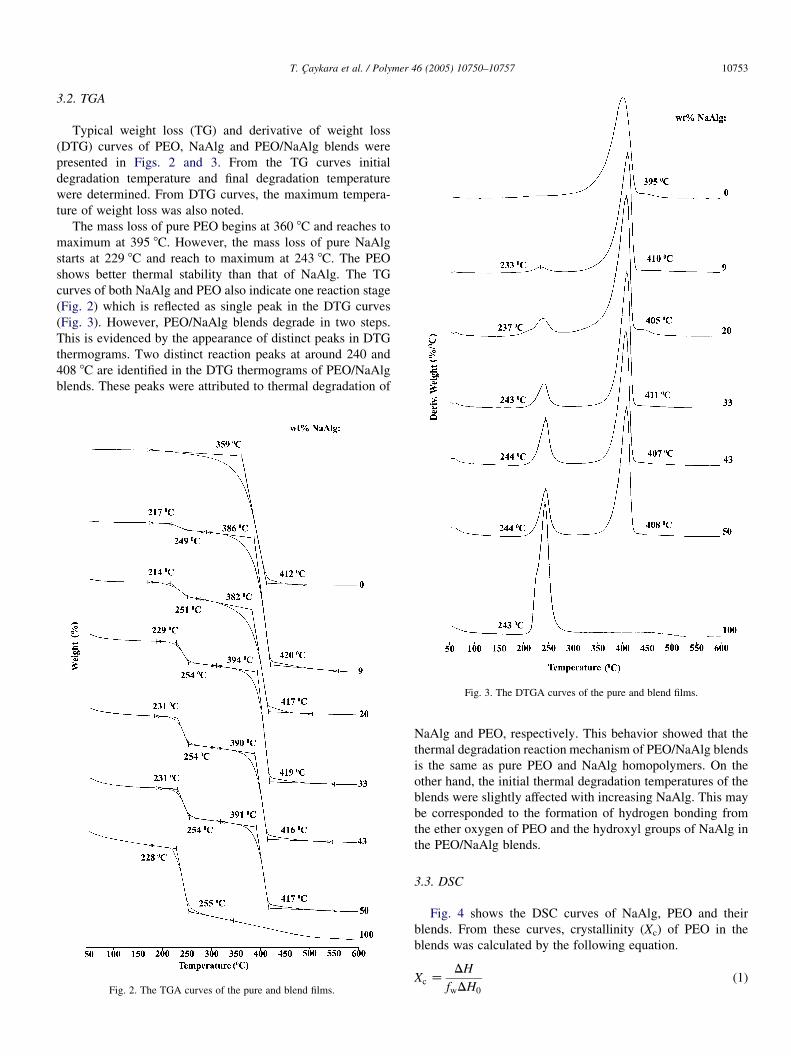
3.2. TGA
Typical weight loss (TG) and derivative of weight loss
(DTG) curves of PEO, NaAlg and PEO/NaAlg blends were
presented in Figs. 2 and 3. From the TG curves initial
degradation temperature and final degradation temperature
were determined. From DTG curves, the maximum tempera-
ture of weight loss was also noted.
The mass loss of pure PEO begins at 360 8C and reaches to
maximum at 395 8C. However, the mass loss of pure NaAlg
starts at 229 8C and reach to maximum at 243 8C. The PEO
shows better thermal stability than that of NaAlg. The TG
curves of both NaAlg and PEO also indicate one reaction stage
(Fig. 2) which is reflected as single peak in the DTG curves
(Fig. 3). However, PEO/NaAlg blends degrade in two steps.
This is evidenced by the appearance of distinct peaks in DTG
thermograms. Two distinct reaction peaks at around 240 and
408 8C are identified in the DTG thermograms of PEO/NaAlg
blends. These peaks were attributed to thermal degradation of
Fig. 3. The DTGA curves of the pure and blend films.
Fig. 2. The TGA curves of the pure and blend films.
NaAlg and PEO, respectively. This behavior showed that the
thermal degradation reaction mechanism of PEO/NaAlg blends
is the same as pure PEO and NaAlg homopolymers. On the
other hand, the initial thermal degradation temperatures of the
blends were slightly affected with increasing NaAlg. This may
be corresponded to the formation of hydrogen bonding from
the ether oxygen of PEO and the hydroxyl groups of NaAlg in
the PEO/NaAlg blends.
3.3. DSC
Fig. 4 shows the DSC curves of NaAlg, PEO and their
blends. From these curves, crystallinity (Xc) of PEO in the
blends was calculated by the following equation.
Xc ZDH
fwDH0
(1)
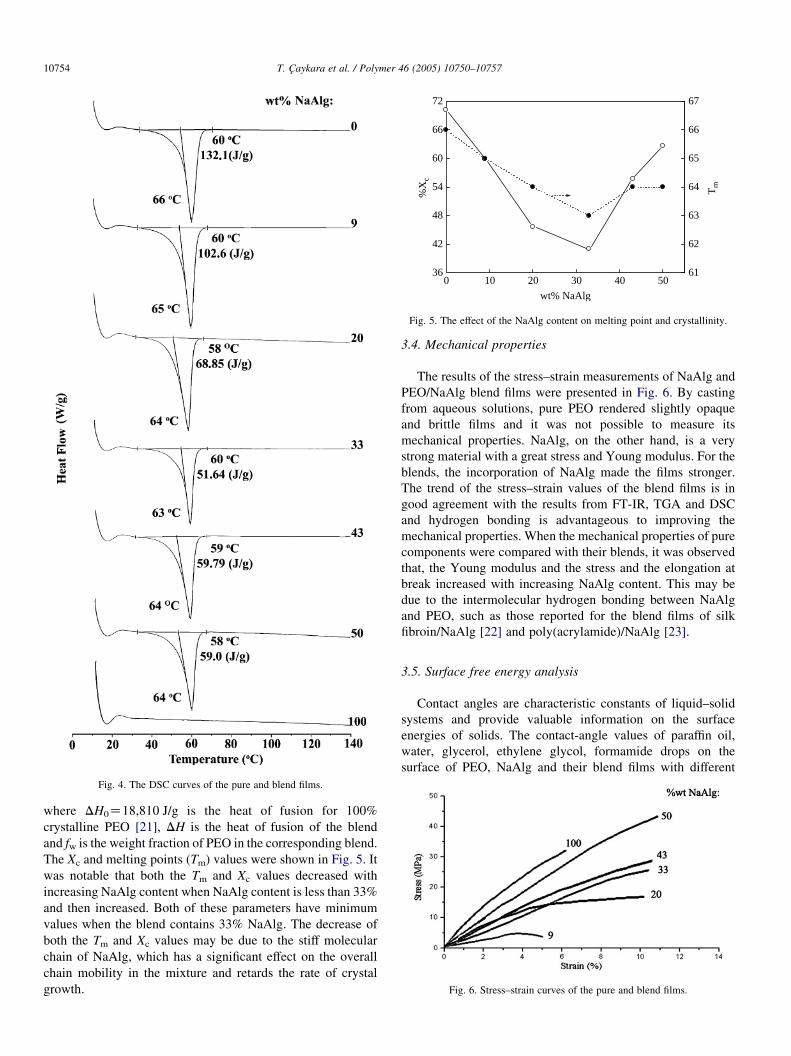
Fig. 4. The DSC curves of the pure and blend films.
0 10 20 30 40 5036
42
48
54
60
66
72
%X
c
wt% NaAlg
61
62
63
64
65
66
67
Tm
Fig. 5. The effect of the NaAlg content on melting point and crystallinity.
Fig. 6. Stress–strain curves of the pure and blend films.
T. Caykara et al. / Polymer 46 (2005) 10750–1075710754
where DH0Z18,810 J/g is the heat of fusion for 100%
crystalline PEO [21], DH is the heat of fusion of the blend
and fw is the weight fraction of PEO in the corresponding blend.
The Xc and melting points (Tm) values were shown in Fig. 5. It
was notable that both the Tm and Xc values decreased with
increasing NaAlg content when NaAlg content is less than 33%
and then increased. Both of these parameters have minimum
values when the blend contains 33% NaAlg. The decrease of
both the Tm and Xc values may be due to the stiff molecular
chain of NaAlg, which has a significant effect on the overall
chain mobility in the mixture and retards the rate of crystal
growth.
3.4. Mechanical properties
The results of the stress–strain measurements of NaAlg and
PEO/NaAlg blend films were presented in Fig. 6. By casting
from aqueous solutions, pure PEO rendered slightly opaque
and brittle films and it was not possible to measure its
mechanical properties. NaAlg, on the other hand, is a very
strong material with a great stress and Young modulus. For the
blends, the incorporation of NaAlg made the films stronger.
The trend of the stress–strain values of the blend films is in
good agreement with the results from FT-IR, TGA and DSC
and hydrogen bonding is advantageous to improving the
mechanical properties. When the mechanical properties of pure
components were compared with their blends, it was observed
that, the Young modulus and the stress and the elongation at
break increased with increasing NaAlg content. This may be
due to the intermolecular hydrogen bonding between NaAlg
and PEO, such as those reported for the blend films of silk
fibroin/NaAlg [22] and poly(acrylamide)/NaAlg [23].
3.5. Surface free energy analysis
Contact angles are characteristic constants of liquid–solid
systems and provide valuable information on the surface
energies of solids. The contact-angle values of paraffin oil,
water, glycerol, ethylene glycol, formamide drops on the
surface of PEO, NaAlg and their blend films with different
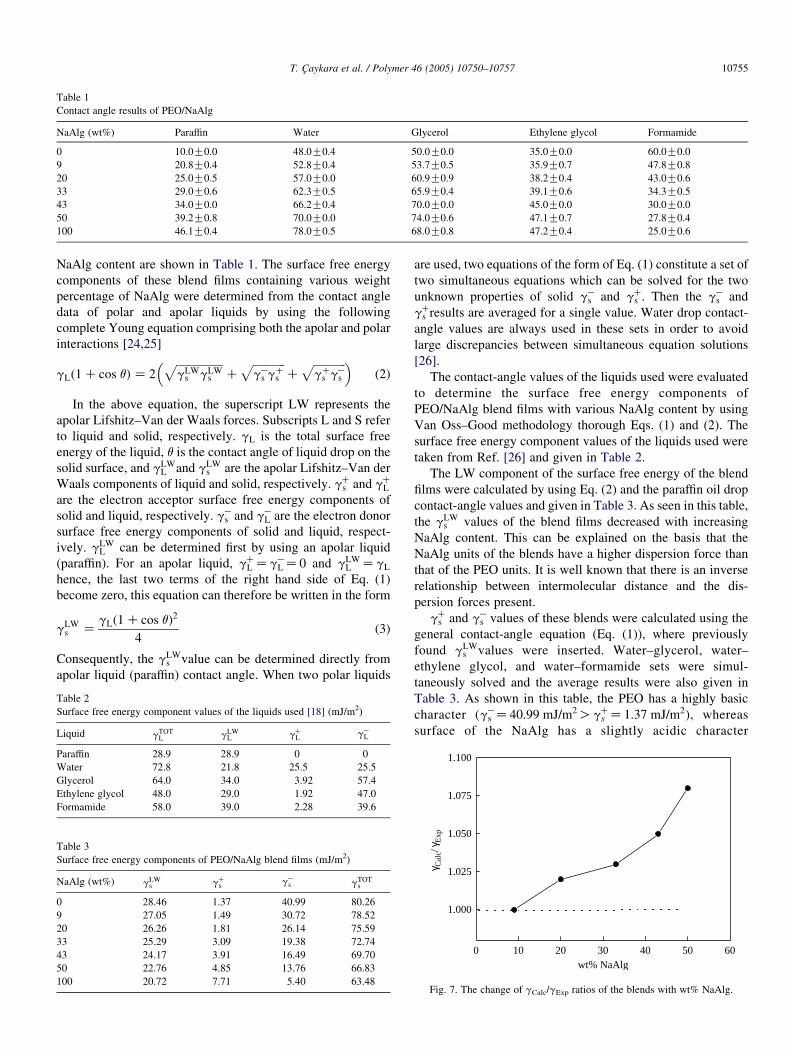
Table 1
Contact angle results of PEO/NaAlg
NaAlg (wt%) Paraffin Water Glycerol Ethylene glycol Formamide
0 10.0G0.0 48.0G0.4 50.0G0.0 35.0G0.0 60.0G0.0
9 20.8G0.4 52.8G0.4 53.7G0.5 35.9G0.7 47.8G0.8
20 25.0G0.5 57.0G0.0 60.9G0.9 38.2G0.4 43.0G0.6
33 29.0G0.6 62.3G0.5 65.9G0.4 39.1G0.6 34.3G0.5
43 34.0G0.0 66.2G0.4 70.0G0.0 45.0G0.0 30.0G0.0
50 39.2G0.8 70.0G0.0 74.0G0.6 47.1G0.7 27.8G0.4
100 46.1G0.4 78.0G0.5 68.0G0.8 47.2G0.4 25.0G0.6
T. Caykara et al. / Polymer 46 (2005) 10750–10757 10755
NaAlg content are shown in Table 1. The surface free energy
components of these blend films containing various weight
percentage of NaAlg were determined from the contact angle
data of polar and apolar liquids by using the following
complete Young equation comprising both the apolar and polar
interactions [24,25]
gLð1 Ccos qÞ Z 2ffiffiffiffiffiffiffiffiffiffiffiffiffiffiffiffiffigLW
s gLWs
pC
ffiffiffiffiffiffiffiffiffiffiffiffigK
s gCs
pC
ffiffiffiffiffiffiffiffiffiffiffiffigC
s gKs
p� �(2)
In the above equation, the superscript LW represents the
apolar Lifshitz–Van der Waals forces. Subscripts L and S refer
to liquid and solid, respectively. gL is the total surface free
energy of the liquid, q is the contact angle of liquid drop on the
solid surface, and gLWL and gLW
s are the apolar Lifshitz–Van der
Waals components of liquid and solid, respectively. gCs and gC
L
are the electron acceptor surface free energy components of
solid and liquid, respectively. gKs and gK
L are the electron donor
surface free energy components of solid and liquid, respect-
ively. gLWL can be determined first by using an apolar liquid
(paraffin). For an apolar liquid, gCL ZgK
LZ0 and gLWL ZgL
hence, the last two terms of the right hand side of Eq. (1)
become zero, this equation can therefore be written in the form
gLWs Z
gL 1 Ccos qð Þ2
4(3)
Consequently, the gLWs value can be determined directly from
apolar liquid (paraffin) contact angle. When two polar liquids
Table 2
Surface free energy component values of the liquids used [18] (mJ/m2)
Liquid gTOTL gLW
L gCL gK
L
Paraffin 28.9 28.9 0 0
Water 72.8 21.8 25.5 25.5
Glycerol 64.0 34.0 3.92 57.4
Ethylene glycol 48.0 29.0 1.92 47.0
Formamide 58.0 39.0 2.28 39.6
Table 3
Surface free energy components of PEO/NaAlg blend films (mJ/m2)
NaAlg (wt%) gLWs gC
s gKs gTOT
s
0 28.46 1.37 40.99 80.26
9 27.05 1.49 30.72 78.52
20 26.26 1.81 26.14 75.59
33 25.29 3.09 19.38 72.74
43 24.17 3.91 16.49 69.70
50 22.76 4.85 13.76 66.83
100 20.72 7.71 5.40 63.48
are used, two equations of the form of Eq. (1) constitute a set of
two simultaneous equations which can be solved for the two
unknown properties of solid gKs and gC
s . Then the gKs and
gCs results are averaged for a single value. Water drop contact-
angle values are always used in these sets in order to avoid
large discrepancies between simultaneous equation solutions
[26].
The contact-angle values of the liquids used were evaluated
to determine the surface free energy components of
PEO/NaAlg blend films with various NaAlg content by using
Van Oss–Good methodology thorough Eqs. (1) and (2). The
surface free energy component values of the liquids used were
taken from Ref. [26] and given in Table 2.
The LW component of the surface free energy of the blend
films were calculated by using Eq. (2) and the paraffin oil drop
contact-angle values and given in Table 3. As seen in this table,
the gLWs values of the blend films decreased with increasing
NaAlg content. This can be explained on the basis that the
NaAlg units of the blends have a higher dispersion force than
that of the PEO units. It is well known that there is an inverse
relationship between intermolecular distance and the dis-
persion forces present.
gCs and gK
s values of these blends were calculated using the
general contact-angle equation (Eq. (1)), where previously
found gLWs values were inserted. Water–glycerol, water–
ethylene glycol, and water–formamide sets were simul-
taneously solved and the average results were also given in
Table 3. As shown in this table, the PEO has a highly basic
character (gKs Z40:99 mJ=m2OgC
s Z1:37 mJ=m2), whereas
surface of the NaAlg has a slightly acidic character
0 10 20 30 40 50 60
1.000
1.025
1.050
1.075
1.100
γ Cal
c/γ E
xp
wt% NaAlg
Fig. 7. The change of gCalc/gExp ratios of the blends with wt% NaAlg.
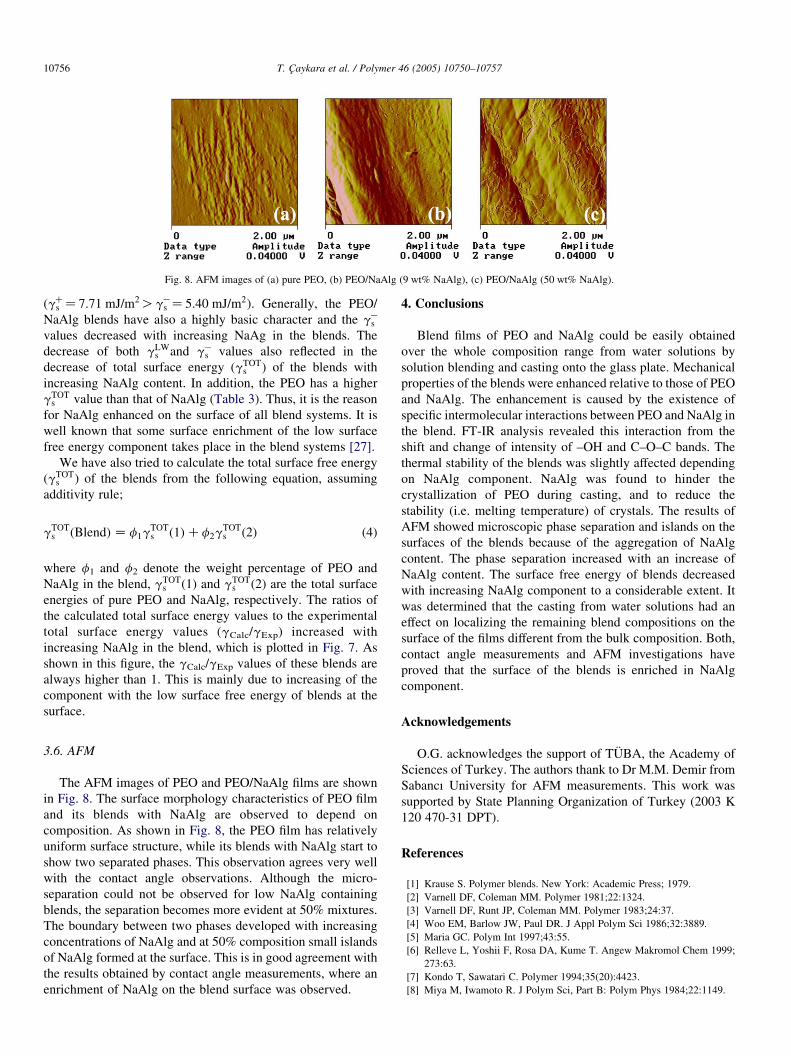
Fig. 8. AFM images of (a) pure PEO, (b) PEO/NaAlg (9 wt% NaAlg), (c) PEO/NaAlg (50 wt% NaAlg).
T. Caykara et al. / Polymer 46 (2005) 10750–1075710756
(gCs Z7:71 mJ=m2OgK
s Z5:40 mJ=m2). Generally, the PEO/
NaAlg blends have also a highly basic character and the gKs
values decreased with increasing NaAg in the blends. The
decrease of both gLWs and gK
s values also reflected in the
decrease of total surface energy (gTOTs ) of the blends with
increasing NaAlg content. In addition, the PEO has a higher
gTOTs value than that of NaAlg (Table 3). Thus, it is the reason
for NaAlg enhanced on the surface of all blend systems. It is
well known that some surface enrichment of the low surface
free energy component takes place in the blend systems [27].
We have also tried to calculate the total surface free energy
(gTOTs ) of the blends from the following equation, assuming
additivity rule;
gTOTs ðBlendÞ Z f1gTOT
s ð1ÞCf2gTOTs ð2Þ (4)
where f1 and f2 denote the weight percentage of PEO and
NaAlg in the blend, gTOTs ð1Þ and gTOT
s ð2Þ are the total surface
energies of pure PEO and NaAlg, respectively. The ratios of
the calculated total surface energy values to the experimental
total surface energy values (gCalc/gExp) increased with
increasing NaAlg in the blend, which is plotted in Fig. 7. As
shown in this figure, the gCalc/gExp values of these blends are
always higher than 1. This is mainly due to increasing of the
component with the low surface free energy of blends at the
surface.
3.6. AFM
The AFM images of PEO and PEO/NaAlg films are shown
in Fig. 8. The surface morphology characteristics of PEO film
and its blends with NaAlg are observed to depend on
composition. As shown in Fig. 8, the PEO film has relatively
uniform surface structure, while its blends with NaAlg start to
show two separated phases. This observation agrees very well
with the contact angle observations. Although the micro-
separation could not be observed for low NaAlg containing
blends, the separation becomes more evident at 50% mixtures.
The boundary between two phases developed with increasing
concentrations of NaAlg and at 50% composition small islands
of NaAlg formed at the surface. This is in good agreement with
the results obtained by contact angle measurements, where an
enrichment of NaAlg on the blend surface was observed.
4. Conclusions
Blend films of PEO and NaAlg could be easily obtained
over the whole composition range from water solutions by
solution blending and casting onto the glass plate. Mechanical
properties of the blends were enhanced relative to those of PEO
and NaAlg. The enhancement is caused by the existence of
specific intermolecular interactions between PEO and NaAlg in
the blend. FT-IR analysis revealed this interaction from the
shift and change of intensity of –OH and C–O–C bands. The
thermal stability of the blends was slightly affected depending
on NaAlg component. NaAlg was found to hinder the
crystallization of PEO during casting, and to reduce the
stability (i.e. melting temperature) of crystals. The results of
AFM showed microscopic phase separation and islands on the
surfaces of the blends because of the aggregation of NaAlg
content. The phase separation increased with an increase of
NaAlg content. The surface free energy of blends decreased
with increasing NaAlg component to a considerable extent. It
was determined that the casting from water solutions had an
effect on localizing the remaining blend compositions on the
surface of the films different from the bulk composition. Both,
contact angle measurements and AFM investigations have
proved that the surface of the blends is enriched in NaAlg
component.
Acknowledgements
O.G. acknowledges the support of TUBA, the Academy of
Sciences of Turkey. The authors thank to Dr M.M. Demir from
Sabancı University for AFM measurements. This work was
supported by State Planning Organization of Turkey (2003 K
120 470-31 DPT).
References
[1] Krause S. Polymer blends. New York: Academic Press; 1979.
[2] Varnell DF, Coleman MM. Polymer 1981;22:1324.
[3] Varnell DF, Runt JP, Coleman MM. Polymer 1983;24:37.
[4] Woo EM, Barlow JW, Paul DR. J Appl Polym Sci 1986;32:3889.
[5] Maria GC. Polym Int 1997;43:55.
[6] Relleve L, Yoshii F, Rosa DA, Kume T. Angew Makromol Chem 1999;
273:63.
[7] Kondo T, Sawatari C. Polymer 1994;35(20):4423.
[8] Miya M, Iwamoto R. J Polym Sci, Part B: Polym Phys 1984;22:1149.

T. Caykara et al. / Polymer 46 (2005) 10750–10757 10757
[9] Moe ST, Skjak-brek G, Ichijo H. J Appl Polym Sci 1994;51:1773.
[10] Hirano S, Mizutani C, Yamaguchi K, Miura O. Biopolymers 1978;17:
805.
[11] Yuk SH, Cho SH, Lee HB. J Controlled Release 1995;7:69.
[12] Hari PR, Chandy T, Sharma CP. J Appl Polym Sci 1996;59:1795.
[13] Sun Y, Shao Z, Hu P, Liu Y, Yu T. J Polym Sci, Part B: Polym Phys 1997;
35:1405.
[14] Bailey FE, Koleske JV. Poly(ethylene oxide). New York: Academic
Press; 1976.
[15] Ramachandran R. Plast Eng 1996;52:31.
[16] Desai NP, Hubbell JA. Biomaterials 1991;12:144.
[17] Desai NP, Hubbell JA. Macromolecules 1992;25:226.
[18] Lee JH, Kopecek J, Andrade JD. J Biomed Mater Res 1989;23:351.
[19] Cowie JMG. Encylopedia of polymer science and engineering. New
York: Wiley; 1989.
[20] Walsh DJ. Comprehensive polymer science. New York: Pergamon Press;
1989.
[21] Kim KM, Chiou JS, Barlow JW, Paul DR. Polymer 1987;28:1721.
[22] Liang CX, Hirabayashi K. J Appl Polym Sci 1992;45:1937.
[23] Xiao C, Lu Y, Liu H, Zhang L. J Macromol Sci Pure Appl Chem 2000;37:
1663.
[24] Van Oss CJ, Good RJ. Langmuir 1992;8:2877.
[25] Erbil HY. Langmuir 1994;10:276.
[26] Van Oss CJ. Interfacial forces in aqueous media. New York: Marcel
Dekker; 1994.
[27] Caykara T, Eroglu MS, Guven O. J Appl Polym Sci 1998;69:1551.
Related Documents