Vol. 18(3) 2019 Vol. 18(3) 2019 Politechnika Lubelska Politechnika Lubelska Wydział Budownictwa i Architektury Wydział Budownictwa i Architektury Politechnika Lubelska Lublin, 2019

Welcome message from author
This document is posted to help you gain knowledge. Please leave a comment to let me know what you think about it! Share it to your friends and learn new things together.
Transcript

Vol. 18(3) 2019Vol. 18(3) 2019
Politechnika LubelskaPolitechnika LubelskaWydział Budownictwa i ArchitekturyWydział Budownictwa i Architektury
Politechnika LubelskaLublin, 2019
ISSN 1899-0665

Politechnika LubelskaPolitechnika LubelskaWydział Budownictwa i ArchitekturyWydział Budownictwa i Architektury
Vol. 18(3) 2019
Politechnika LubelskaLublin, 2019

Rada Naukowa/Scientific CouncilTomasz Bajda (AGH Kraków)
Ivan Baláž (University of Economics in Bratislava)Mykola Bevz (National University Lviv Polytechnic)
Eduard-Marius Craciun, Ovidius (University of Constanta)Grażyna Dąbrowska-Milewska (Politechnika Białostocka)
Wiesława Głodkowska (Politechnika Koszalińska)Adam Goliger (The Council for Scientific and Industrial Research - CSIR)
Zbyněk Keršner (Brno University of Technology)Halit Cenan Mertol (Atilim University)
Carlos M. Mozos (University of Castilla - La Mancha)Adam Nadolny (Politechnika Poznańska)
Sandro Parrinello (Pavia University)Stanislav Pospíšil (Institute of Theoretical and Applied Mechanics)
Wojciech Radomski (Politechnika Łódzka i Politechnika Warszawska)Elżbieta Radziszewska-Zielina (Politechnika Krakowska)
Petro Rychkov (National University of Water Management and Nature Resources Use)Shamsher Bahadur Singh (Birla Institute of Technology and Science)
Anna Sobotka (AGH Kraków)Bogusław Szmygin, Lublin University of Technology, Poland
Thomas Thiis (Norwegian University of Life Sciences)Viktor Tur (Technical University of Brest)
Tim K.T. Tse (The Hong Kong University of Science and Technology)
Kolegium Redakcyjne/Editorial BoardRedaktor naczelny/Editor-in-Chief: Wojciech Franus
Zastępca redaktora naczelnego/Deputy Editor: Tomasz LipeckiZastępca redaktora naczelnego/Deputy Editor: Łukasz Borowski
Sekretariat/Secretary: Aleksandra Szczypa
Adres redakcji/Address:Politechnika Lubelska, Wydział Budownictwa i Architektury
ul. Nadbystrzycka 40, 20-618 Lublin, e-mail: [email protected]
Strona czasopisma/Journal website:ph.pollub.pl
Indeksacja/Indexed in:Arianta, BASE, BazTech, CEEOL, Dimensions, DOAJ, EBSCO, ERIH Plus, Google Scholar, Index
Copernicus, Infona, PBN/POL-Index,TIB, WorldWideScienc
Publikacja wydana za zgodą Rektora Politechniki Lubelskiej. Published with the consent of the Rector of Lublin University of Technology.
Finansowana w ramach środków Ministra Nauki i Szkolnictwa Wyższego. Financing by the Polish Ministry of Science and Higher Education.
© Copyright by Politechnika Lubelska 2019
ISSN 1899-0665
Realizacja/Published by: Biblioteka Politechniki LubelskiejOśrodek ds. Wydawnictw i Biblioteki Cyfrowej
ul. Nadbystrzycka 36A, 20-618 Lublin, email: [email protected]

SPIS TREŚCICONTENTS
Krzysztof Pawłowski:The analysis of energy-saving technologies used in buildings with low energy consumption .................................................................................. 5
Szymon Ślósarz:Strengthening of the wooden structures ...................................................................................... 17
Monika Górka:Use of aluminium and glass facades in the public space of the city of Krakow ......................... 29
Jacek Karpiesiuk:Selection of floor heating systems with use of multi-criteria decision analysis method ............. 41
Bogdan Skorupa:The problem of GNSS positioning with measurements recorded using Android mobile devices ...................................................... 51
Krzysztof Nepelski:Interpretation of CPT and SDMT tests for Lublin loess soils exemplified by Cyprysowa research site ..................................................................................... 63
Ewa Dębińska, Joanna Pałubska:Property price dependence from noise level on example of local real estate market ................. 73
Dariusz Gaweł:New urban spaces – their heritage and creation ........................................................................ 83


The analysis of energy-saving technologies used in buildings with low energy consumption
Krzysztof Pawłowski
The Department of Building Engineering and Building Physics, Faculty of Civil Engineering, Archi-tecture and Environmental Engineering, UTP University of Sciences and Technology in Bydgoszcz,
e–mail: [email protected], ORCID: 0000-0002-6738-5764
Abstract: Designing, constructing and using of buildings with low energy consumption are a complex process requiring knowledge of architectural design, construction physics and building systems with the use of renewable energy sources (RES). The article presents the legal bases and characteristics of low-energy buildings. Implementation of the binding technical requirements in the field of hygrothermal characteristics consists of monitoring numerous parameters of an entire building, and in particular of its partitions and their joints and buil-ding systems. Therefore, the paper presents calculations regarding determining the material systems of building partitions and building joints with the use of professional software. The main part of the article is to establish the impact of energy-saving technologies on the energy consumption of the newly designed buildings, but also of the buildings that are undergoing modernisation processes.
Keywords: energy-saving technologies, low-energy building, external partitions, ther-momodernization of the building
1. IntroductionAccording to the Regulation of the Council of Ministers of 22 June 2015 on the adop-
tion of the National Plan to increase the number of low energy buildings [1] a low-energy building is one which meets the requirements for energy saving and insulation included in the technical and functional guidelines referred to in Article 7 paragraph 1 point 1 of the Act – Construction Law [2], i.e. in particular Section X and Annex 2 to the Regulation [3] in force from 31 December 2020 (in the case of buildings occupied and owned by public authorities – from 1 January 2019).
On the basis of analyses of legal regulations [3], criteria for the assessment of external partitions and buildings in terms of hygrothermal requirements have been formulated:
• the criterion of thermal protection and energy savings:– designing of building partitions so that the values of heat transfer coefficients UC [W/
(m2·K)] of external partitions, windows, doors and installation technique comply with the requirements of the regulation [3],
– designing of thermal insulation (perimeter) for a partition in contact with ground with thermal resistance greater than Rmin. [(m2·K)/W],
– requirement for protection against rooms overheating during summer g [-],– designing of a building with the primary energy demand EP [kWh/(m2·year)] with
Budownictwo i Architektura 18(3) 2019, 5-16 DOI: 10.35784/bud-arch.563

Krzysztof Pawłowski6
the value meeting the requirements of the regulation [3], including the use of highly efficient installations and renewable energy sources (RES) in the building,
• the criterion of humidity:– risk of development of surface condensation – calculation of the temperature factor
fRsi [-],– risk of development of interstitial condensation.The fundamental change of the regulation [3] in the field of thermal protection of buildings
is the change of maximum values of heat transfer coefficients Uc(max). Partial requirements for thermal insulation of external walls, roofs, floors, windows and doors have been tightened. Moreover, the type of partition (multi-layer or single-layer) and the purpose of the building (residential, public utility, storage, farming, etc.) are no longer relevant.
According to the changes introduced in the regulation of the Minister of Infrastruc-ture and Construction of 14 November 2017 amending the regulation concerning building technical requirements and building localisation [3], the thermal requirements pertain to simultaneous fulfilment of two requirements for the heat transfer coefficient U [W/(m2·K)] for individual building partitions and the non-renewable primary energy demand indicator EP [kWh/(m2·year)] for the entire building.
The minimum requirements referred to paragraph 1 of the regulation [3] shall be deemed to be fulfilled for a building undergoing renovation where the building partitions and renovated technical equipment at least comply with the thermal insulation requirements set out in annex 2 to the regulation [3].
The paper presents an analysis of selected energy-saving solutions in buildings with low energy consumption in terms of hygrothermal requirements according to the regulation [3].
2. The characteristics of the buildings with low energy consumption
On the basis of analyses and calculations, basic groups of factors regarding the classi-fication of low-energy buildings were determined:
• architecture of a building: location of a building with respect to the directions of the world, compact structure of a building (minimum A/V shape coefficient), size and location of transparent partitions, rooms arrangement, roof geometry,
• structural and material solutions of building partitions and their joints: use of high quality materials; use of modern insulation materials, e.g. polyurethane foam dusts, aerogels, vacuum boards, transparent insulations; the way of designing of building joints in terms of hygrothermal characteristics with the use of numerical tools,
• thermal insulation of building partitions: thickness of thermal insulation sometimes exceeding 25÷30 cm, obtaining the value of heat transfer coefficient U ≤ 0,10 W/(m2·K) for non-transparent partitions and U ≤ 0,90 W/(m2·K) for transparent partitions, taking into account the requirements for room overheating in summer,
• type and efficiency of the ventilation system: hybrid or mechanical ventilation with heat recovery, mechanical ventilation with heat recovery and ground heat exchanger, high efficiency of the system (above 70%),
• type and efficiency of the central heating and hot water system,

The analysis of energy-saving technologies used in buildings with low energy consumption 7
• use of renewable energy sources (RES): solar energy, wind energy, geothermal energy,
• building management system, which also allows to control energy production.For over a decade, legal regulations related to the design, construction and use of buil-
dings with low energy consumption have been enforcing such technological and organisational solutions, as a result of which newly erected buildings consume less and less energy during their use for heating, ventilation and hot water. Changes of the maximum value of the heat transfer coefficient Umax. (formerly kmax) impact the amount of energy consumption during the use of buildings. Unfortunately, legal regulations in this field do not regulate the requirements for limiting heat losses through building joints – thermal bridges, because no limit values have been set, e.g. for maximum values of linear heat transfer coefficient Ψmax. [W/(m·K)]. It should be emphasized, however, that a building is a structure of building partitions and their joints of individual physical character and is subject to external and internal environmental influences. In many cases, the structural and material analysis of building partitions and joints and the execution technology is generally not a problem at the time of designing. However, the knowledge of physical parameters related to heat and humidity exchange allows to avoid many design and manufacturing defects.
The application of a suitable thermal insulation material allows to achieve low values of heat transfer coefficient U [W/(m2·K)] of a full partition and linear heat transfer coefficient Ψ
[W/(m·K)] and to minimize the risk of surface and interstitial condensation. Before choosing the right material for thermal insulation, when designing new buildings or renovating existing buildings, the following properties should be taken into account: heat conductivity coefficient λ [W/(m·K)], bulk density, acoustic insulation, water vapour permeability, diffusion resistance coefficient μ [-], sensitivity to biological and chemical factors and fire protection. On the basis of calculations and analyses carried out in this field, an exemplary selection of thermal insulation materials was compiled (Fig. 1).
Example of selection of thermal insulation materials
External wall insulation (from the outside): polystyrene (EPS), grey (graphite) polystyrene (EPS), pheno-lic foam boards, mineral wool, other innovative materials: airgel mats, parogel, vacuum insolation panels (VIP)
Thermal insulation of pitched flat roofs and roofs above unused attics: cellulose wool, mineral wool
Wooden roof insulation: wood panels, sheep wool panels, mineral wool panels, polyurethane foam (PUR/PIR), cork panels
Insulation of partitions coming into contact with the ground (perimeter insulation), plinths and floors: extruded polystyrene (XPS), foam glass
Indoor insulation: cellular concrete blocks (Multipor), climate panels, thermal insulation plasters (reno-vation)
Insulation with the use of “new generation” thermal insulation materials: airogel, parogel, reflective insulation, vacuum insulation VIP, transparent insulation, silicate foams
Fig. 1. Example of selection of thermal insulation materials – author’s own elaboration
The energy-saving measures used in low energy buildings can be divided into three main groups. The first group includes technologies related to the reduction of heat losses by partitions, and in particular: insulation of external partitions (floors on the ground, ceilings, roof, walls), selection of window and door frames taking into account thermal requirements according to the regulation [3]. The second group concerns the reduction of losses and improvement of

Krzysztof Pawłowski8
installation system efficiency: replacement or modernisation of radiators, replacement or moder-nisation of heating system (insertion of floor or air heating, etc.), installation of thermostats, installation of modern weather compensators or room controllers, insulation of hot water and central heating ducts, replacement or modernisation of hot water production system, replace-ment or modernisation of ventilation system (application of mechanical ventilation with heat recovery – recuperator). The last or third group consists of design, execution or modernisation works focusing on a heat source, which may include: design and installation or replacement of a heat source (replacement of a boiler with a new one with better efficiency or replacement of a local source with a district heating system), replacement of an energy carrier (replacement of a boiler with another one that produces energy by burning another type of fuel; the excep-tion is replacement of a fuel in the same boiler, which is adapted to burn several types of raw materials), use of technology that uses renewable energy sources for heating purposes (e.g.: heat pumps, biofuels, solar thermal collectors), use of cogeneration (simultaneous production of electricity and heat – this applies to shared houses), use of automatic source control. The groups of energy-saving measures described above are especially related to the buildings undergoing thermal modernisation.
Detailed analyses, calculations and examples of structural, material and technical solu-tions for buildings with low energy consumption are presented in the following papers [4 – 8].
3. The influence of energy-saving technologies on the energy consumption of a building
The basic technical measure in the field of thermal quality of building envelope elements is the selection of thermal insulation material to insulate external partitions in newly designed and modernised buildings. The heat transfer coefficient Uc [W/(m2·K)] is the basic parameter used to test the thermal criterion (Uc ≤ Uc(max)). Along with the changing values of Uc(max) (from 31.12.2020 for external walls, at ti ≥16ºC; Uc(max)=0,20 W/(m2·K)), some of their structural and material solutions do not meet the basic criterion (Uc ≤ Uc(max)). Therefore, it is justified to make detailed calculations in this respect.
To calculate the heat transfer coefficient of the double-layer external wall Uc [W/(m2·K)], with the use of various materials, the following assumptions were made:
• heat transfer resistance for the wall; heat transfer resistance values were adopted according to PN-EN ISO 6946:2008 [9] for the horizontal direction of the heat flux: heat transfer resistance on the external surface of the partition: Rse = 0,04 [(m2·K)/W], heat transfer resistance on the internal surface of the building envelope: Rsi = 0,13 [(m2·K)/W],
• values of heat conductivity coefficient λ [W/(m·K)] have been assumed on the basis of tables in the paper [10].
The results of calculations are presented in Table 1 depending on the value of the heat conductivity coefficient λ [W/(m·K)] and the thickness of the thermal insulation material.

The analysis of energy-saving technologies used in buildings with low energy consumption 9
Table 1. Results of the calculations of the Uc heat transfer coefficient according to PN-EN ISO 6946:2008 [9] in reference to the double-layer external wall – author’s own elaboration.
No. Material layers d[m]
λ[W/(m·K)]
x[m]
Variants of thermal insulation I II III IV V VIheat conductivity coefficient of thermal insulation materials λ [W/(m·K)]0.040 0.038 0.035 0.031 0.021 0.015
1.
Plasterboard B. made of cellular concrete Thermal insulation Thin layer plaster
0.010.24x0.005
0.400.21y0.76
0.100.120.150.20
0.26 0.25 0.24 0.22 0.16 0.120.23 0.22 0.21 0.19 0.14 0.110.20 0.19 0.18 0.16 0.12 0.09
0.16 0.15 0.14 0.13 0.09 0.07
2.
Plasterboard Limestone sandstone blocThermal insulation Thin layer plaster
0.010.24x0.005
0.400.56y0.76
0.100.120.150.20
0.32 0.31 0.29 0.26 0.19 0.140.28 0.26 0.25 0.22 0.16 0.120.23 0.22 0.20 0.18 0.13 0.09
0.18 0.17 0.16 0.14 0.10 0.07
3. Plasterboard Full brick Thermal insulation Thin layer plaster
0.010.25x0.005
0.400.77y0.76
0.100.120.150.20
0.33 0.32 0.30 0.27 0.19 0.140.28 0.27 0.25 0.23 0.16 0.120.23 0.22 0.21 0.19 0.13 0.10
0.18 0.17 0.16 0.14 0.10 0.07
Variants of thermal insulation: I – plasterboard λ = 0.040 W/(m·K), II – mineral wool boards λ = 0.038 W/(m·K), III – extruded boards λ = 0.035 W/(m·K), IV – graphite polystyrene boards λ = 0.031 W/(m·K), V – resol boards λ = 0.021 W/(m·K), VI – airgel boards λ = 0.015 W/(m·K); to calculations of Uc it was assumed ΔU=0The values of heat transfer coefficient Uc of external walls fulfilling the requirement: Uc≤ Uc(max) =0.20 W/(m2·K) were marked in green in the table.
Significant influence on the value of heat transfer coefficient of a building partition Uc [W/(m2·K)] has the value of heat conductivity coefficient λ [W/(m·K)] of an insulating material, but also of a construction layer. With regard to one type of insulation, it may vary significantly depending on the product, which is due to the rapid development of the market of thermal insulation materials and increasingly advanced production technologies. In the case of airgel insulation (produced in mats of 1cm thickness), calculations for the thickness of 10, 12, 15 and 20 cm were presented only for the purposes of comparison with other thermal insulation materials.
It is worth noting that the issues of thermal physics of buildings often amount to the thermal analysis of the external partitions of buildings subjected to the effects of external and internal temperatures changing in time. In many cases, the solution of heat flow amounts to the determination of heat transfer through a flat building envelope in a one-dimensional field (1D), without considering heat flow in a two-dimensional field (2D) and a three-dimensional field (3D). However, the real (actual) field of heat exchange is usually the building envelope as part of the building, i.e. connected by a system of joints to the existing envelope (ceiling, external or internal wall or floor on the ground). There may be places within the partition that interfere with its continuous character – material inserts, window and door frames, variable thickness of thermal insulation. In all these cases the following temperature field appears: flat (2D) or spatial (3D), which significantly changes the procedure of thermal-humidity calculations of a partition.
Below is presented the calculations of physical parameters of the joint: connection of the external wall with the window in cross-section through the frame with the use of jamb

Krzysztof Pawłowski10
(insulation extended to the frame), with the use of the software TRISCO-KOBRU 86 [11], adopting the following assumptions:
• joint modelling was performed in accordance with the regulations presented in PN-EN ISO 10211:2008 [12],
• heat transfer resistance (Rsi, Rse) was adopted in accordance with PN-EN ISO 6946:2008 [9] for the calculation of heat fluxes and PN-EN ISO 13788:2003 [13] for the calcu-lation of temperature distribution and temperature factor fRsi(2D),
• indoor air temperature ti = 20 ºC (dayroom), outdoor air temperature te = -20 ºC (zone III),• values of heat conductivity coefficient of construction materials λ [W/(m·K)] have
been adopted on the basis of tables included in the paper [10],• two-layer external wall: cellular concrete block (ρ=600 kg/m3) 24 cm thick – λ=0,21 W/
(m·K), case A: EPS polystyrene (ρ=30 kg/m3) – λ=0,036 W/(m·K), case B: graphite polystyrene (ρ=30 kg/m3) – λ=0,031 W/(m·K), case C: phenolic (resol) panels (ρ=16 kg/m3) – λ=0,022 W/(m·K),
• window frames with heat transfer coefficient Uw=0,81 [W/(m2·K)]. Figure 2 shows the connector calculation model and results of computer simulation: heat
flux lines (adiabates) and temperature distribution (isotherms).
– cellular concrete block 24 cm thick – λ=0,21 W/(m·K)– 10 cm thick thermal insulation material, – variant solutions (Table 1) – fitting foam 1 cm thick – λ=0,035 W/(m·K)– window frames – U
w =0,81 W/(m2·K); (for the
purpose of numerical calculations the window heat conductivity coefficient λ=0,075 W/(m·K)) was determined from the basic dependencies concerning the heat flow in a one-dimensional field)
a) calculation model b) material characteristics of the joint
c) heat flux lines – adiabates d) temperature distribution – isotherms
Fig. 2. Calculation model and results of computer simulation of the analysed connector – author’s own elaboration
Table 2 presents the results of calculations of physical parameters of the analysed joint with the use of various thermal insulation materials (10 cm thick).
On the basis of the calculations (Table 2) it can be concluded that the analysed joints generate additional heat losses determined, among others, in the form of linear heat transfer coefficient Ψi [W/(m·K)] and temperature reduction on the internal surface of the wall tmin. [ºC].
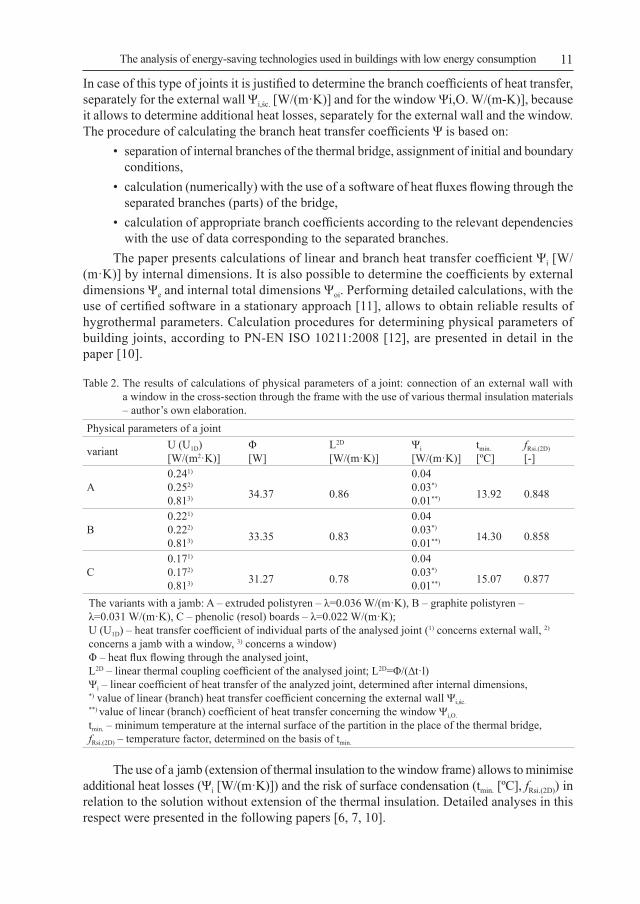
The analysis of energy-saving technologies used in buildings with low energy consumption 11
In case of this type of joints it is justified to determine the branch coefficients of heat transfer, separately for the external wall Ψi,śc. [W/(m·K)] and for the window Ψi,O. W/(m-K)], because it allows to determine additional heat losses, separately for the external wall and the window. The procedure of calculating the branch heat transfer coefficients Ψ is based on:
• separation of internal branches of the thermal bridge, assignment of initial and boundary conditions,
• calculation (numerically) with the use of a software of heat fluxes flowing through the separated branches (parts) of the bridge,
• calculation of appropriate branch coefficients according to the relevant dependencies with the use of data corresponding to the separated branches.
The paper presents calculations of linear and branch heat transfer coefficient Ψi [W/(m·K)] by internal dimensions. It is also possible to determine the coefficients by external dimensions Ψe and internal total dimensions Ψoi. Performing detailed calculations, with the use of certified software in a stationary approach [11], allows to obtain reliable results of hygrothermal parameters. Calculation procedures for determining physical parameters of building joints, according to PN-EN ISO 10211:2008 [12], are presented in detail in the paper [10].
Table 2. The results of calculations of physical parameters of a joint: connection of an external wall with a window in the cross-section through the frame with the use of various thermal insulation materials – author’s own elaboration.
Physical parameters of a joint
variant U (U1D)[W/(m2·K)]
Φ[W]
L2D
[W/(m·K)]Ψi
[W/(m·K)]tmin.
[ºC]fRsi.(2D)
[-]
A0.241)
0.252)
0.813) 34.37 0.86
0.040.03*)
0.01**) 13.92 0.848
B0.221)
0.222)
0.813) 33.35 0.83
0.040.03*)
0.01**) 14.30 0.858
C0.171)
0.172)
0.813) 31.27 0.78
0.040.03*)
0.01**) 15.07 0.877
The variants with a jamb: A – extruded polistyren – λ=0.036 W/(m·K), B – graphite polistyren – λ=0.031 W/(m·K), C – phenolic (resol) boards – λ=0.022 W/(m·K);U (U1D) – heat transfer coefficient of individual parts of the analysed joint (1) concerns external wall, 2) concerns a jamb with a window, 3) concerns a window)Φ – heat flux flowing through the analysed joint, L2D – linear thermal coupling coefficient of the analysed joint; L2D=Φ/(∆t·l)Ψi – linear coefficient of heat transfer of the analyzed joint, determined after internal dimensions, *) value of linear (branch) heat transfer coefficient concerning the external wall Ψi,śc.**) value of linear (branch) coefficient of heat transfer concerning the window Ψi,O.
tmin. – minimum temperature at the internal surface of the partition in the place of the thermal bridge, fRsi.(2D) – temperature factor, determined on the basis of tmin.
The use of a jamb (extension of thermal insulation to the window frame) allows to minimise additional heat losses (Ψi [W/(m·K)]) and the risk of surface condensation (tmin. [ºC], fRsi.(2D)) in relation to the solution without extension of the thermal insulation. Detailed analyses in this respect were presented in the following papers [6, 7, 10].

Krzysztof Pawłowski12
When determining the energy consumption of a building, it is also necessary to take into account the efficiency of installation systems resulting from regulation and use of heat in the heated space (ηH,e), transfer of heat from the heat source to the heated space (ηH,d), heat accu-mulation in the volume elements of the heating system (ηH,s), production of heat from an energy carrier or energy input to a heat source (ηH,g). The heating system in a building shall comply with the requirements of the technical building regulations and shall take into account technical knowledge of energy efficient solutions. The system should be designed as a high-performance system. High efficiency heat sources should be planned, all possible efforts should be made to reduce heat transfer losses and if there is an accumulation tank, accumulation losses should be minimal and the elements responsible for the control and use of heat should be optimally selected. The best possible performance can be achieved according to [14] by, among other things: the use of condensing boilers, heat pumps with a high coefficient of efficiency (COP), appropriate routing of heating medium distribution lines (compact system) and their proper thermal insulation, appropriate insulation of buffer tanks and load and discharge control systems, low-temperature surface, radiator or mixed heating systems, use of high-performance auxiliary pumps with low power consumption (resulting in low consumption of auxiliary energy).
The value of the annual indicator of non-renewable primary energy demand (EP) deter-mines the total efficiency of a building. It refers to the energy contained in sources, including fuels and carriers, necessary to meet the final energy demand, taking into account the additional expenditures for delivering this energy to the building perimeter. The value of the indicator of input of non-renewable primary energy to the production and supply of an energy carrier or energy for technical systems wi is taken from data disclosed by the supplier of that energy carrier or energy. Low values indicate low demand and therefore high energy efficiency of the building. On websites, some heat suppliers include values of the input ratio of non-renewable primary energy, for example:
• the ratio of input of non-renewable primary energy in 2016 for the heating network in the Warsaw District Heating System of Veolia Energia Warszawa S.A. supplied by the Combined Heat and Power Plants (CHP plants) Żerań and Siekierki, Heat Plants Kawęczyn and Wola and Waste Disposal Plant “Gwarków” OUZ-2 , regardless of the quantity and type of heat sources and technologies used to generate and deliver heat to the final customer is WPc = 0,69 [15],
• Gdańsk District Heating Company (GPEC sp. z o.o.) reports that the indicator of non-renewable primary energy input in 2015 for the district heating network is WPc = 0,658 [16],
• non-renewable primary energy input indicator for the Bielsko-Biała district heating network for 2016: WPc = 0,71 [17].
In case of lack of such data, the values of Wi coefficient specified in the Regulation [18] shall be used.
Improvement of the energy standard (reducing the embodied energy ratio) of an existing building can be achieved both with and without financial investment. The first way requires investments in the future that will be paid for over time. The estimated payback time can be presented using the SPBT coefficient. The second group includes measures related to the susta-inable use of thermostatic valves, well thought-out ventilation of rooms, proper arrangement of radiators and saving of domestic hot water.
A single-family building with a basement and a usable attic erected in 1990 was chosen for the analysis. During the assessment of its technical and thermal condition it was found that

The analysis of energy-saving technologies used in buildings with low energy consumption 13
the values of heat transfer coefficients of external partitions do not meet the basic criterion according to the regulation [3]: (Uc ≤ Uc(max)). During the use of the building, a renovation was carried out, during which a leaky roof and window frames were replaced. On the basis of calculations carried out according to the regulation [18], it can be concluded that the analysed building is highly energy-intensive (utility energy demand index – EU=152,06 kWh/(m2·year), final energy demand index – EK=410,90 kWh/(m2·year), while non-renewable primary energy demand index – EP=455,41 kWh/(m2·year)). In order to adapt the analysed building to the binding legal regulations according to the regulation [3], it is necessary to perform thermal modernisation of individual elements: insulation of the ceiling above the unheated basement, insulation of external walls, replacement of the central heating system, replacement of the water heating system, installation of thermostats, insulation of heating cables.
The main division of variants is based on the differentiation of heat sources needed to heat the building and the preparation of hot water. – Table 3.
Table 3. Considered thermal modernisation variants of the analysed building considered – author’s own elaboration based on [19].
Variant I Variant II Variant III
The source of heat to central heating boiler – biomass boiler – coal, heat pump condensing boiler
The source of heat to heating of water boiler – biomass boiler – coal,
heat pumpcondensing boiler /collectors
Insulation of external walls polystyrene polystyrene polystyreneThermal insulation of the ceiling above the basement polystyrene polystyrene polystyrene
Insulation of heating cables PUR lagging PUR lagging PUR laggingInstallation of thermostats + + +
On the basis of assumptions presented in Table 3 (variants I, II, III), calculations of energy performance indicators of the analysed building were carried out according to the procedures presented in the regulation [18] with the use of professional software. All external partitions after thermal modernisation met the basic thermal criterion: Uc ≤ Uc(max), and from 31.12.2020 Uc(max) values were adopted as final values valid. However, additional heat losses resulting from the occurrence of linear thermal bridges were taken into account when using the value Ψe according to PN-EN ISO 14683 [20], in accordance with the used software to determine the energy performance of the building. The results of calculations of basic EU, EK, EP indicators for the analysed building are presented in Table 4.
Table 4. Results of calculations of energy performance parameters of a single-family building before and after thermal modernisation in different variants – author’s own elaboration based on [19].
Parameters Before thermal modernisation
After thermal modernisation Variant I Variant II Variant III
EU [kWh/(m2·year)] 152.06 88.44 88.44 88.44EK [kWh/(m2·year)] 410.90 181.34 130.22 136.52EP [kWh/(m2·year)] 455.41 35.81 141.65 116.30
Therefore, the only option that can be used to adapt the analysed building to the ‘low energy building’ standard (EP≤EPmax=70 kWh/(m2·year) and Uc≤Ucmax) is Variant I (Tables 3 and 4). Meeting the requirements of the regulation [3] without the use of renewable energy

Krzysztof Pawłowski14
sources (RES) is very difficult and sometimes impossible. That is why, the higher the percentage of their use, the lower the demand for non-renewable primary energy EP [kWh/(m2·year)]. It is possible to reduce the indicators (EU, EK and EP) by improving the insulation quality of external walls (Uc much lower than Uc(max) in force after 31.12.2020) by using innovative thermal insulation materials with a low value of heat conductivity coefficient λ [W/(m·K)].
4. Summary and conclusionsThe selection of energy-saving technologies in low energy buildings is a complex process,
which includes the issues of architectural design, building physics and building systems.The thermal quality of the building envelope is assessed by determining the Uc, coeffi-
cients, which are used for further calculations of the hygrothermal analysis of partitions and the whole building (e.g. the coefficient of heat loss through penetration Htr [W/K], the demand for usable EU energy, final energy EK and primary energy EP [kWh/(m2·year)]). It should also be emphasised that while shaping the arrangement of material layers of external partitions and their joints, the following criteria must be taken into account: thermoinsulating power, surface and interstitial condensation, acoustic resistance, fire protection, as well as load capacity and durability of the structure. Some arrangements of material layers meet the requirements for thermal insulation (Uc ≤ Uc(max)), but it is not permitted to place the thermal insulation layer in any position of the partition after the analysis of humidity, acoustics or fire requirements.
It is also important to determine the reliable physical parameters (hygrothermal para-meters) of building joints, which values depend on the location and thickness of thermal insulation material and the position of window frames in the external wall – Table 2. The use of approximate and indicative values, e.g. based on PN-EN ISO 14683:2008 [20], is not justified because they do not take into account changes in material systems and the type and thickness of thermal insulation.
Stricter requirements for thermoinsulating power and energy consumption of buildings require the introduction of energy saving measures, which have a significant impact on the energy efficiency of buildings. Detailed analyses of the influence of thermal quality of building partitions on their energy demand (EU, EK, EP) have been described in detail, among others, in the paper [21]. Thermal modernisation works undertaken in existing buildings should be carried out on the basis of a detailed analysis of their technical and thermal condition. On the other hand, the evalu-ation of the quality of works related to insulation of external partitions should be carried out on the basis of thermovision tests. The results and analyses in this respect are presented in the paper [22] for the housing estate in Upper Silesia. It is necessary to perform calculations and analyses concerning the undertaken energy-saving measures at the stage of their design, execution and use.
To comply with the requirements to achieve the standard for a low energy building with the EP ratio (e.g. for a single-family building, below 70 kwh/(m2·year)) it is necessary to: design or modernise building partitions and joints ensuring minimum heat loss through penetration (Uc≤Ucmax), selection of appropriate heating components of central heating, hot water and cooling system (with particular emphasis on the efficiency) and the use of renewable energy sources (RES).
5. Literature[1] Resolution of the Council of Ministers, adopted on 22 June 2015 for the adoption of the National
Plan to increase the number of low energy buildings[2] Act of 7 July 1994 – Construction Law (Journal of Laws of 2013, item 1409, with later amendments).

The analysis of energy-saving technologies used in buildings with low energy consumption 15
[3] Regulation of the Minister of Infrastructure and Construction of 14 November 2017 amending the regulation concerning building technical requirements and building localisation (Journal of Laws of 2017, item 2285).
[4] Grudzińska M., Ostańska A., Życzyńska A. Low energy and passive buildings. Grupa Wydawnicza Medium, Warszawa 2017.
[5] Kaliszuk-Wietecka A., Węglarz A. Nowoczesne budynki energoefektywne. Znowelizowane warunki techniczne. Wydawnictwo POLCEN sp. z o.o., Warszawa 2019.
[6] Pawłowski K. Zasady projektowania budynków energooszczędnych. Grupa Wydawnicza Medium Warszawa 2017.
[7] Pawłowski K. Projektowanie ścian w budownictwie energooszczędnym. Obliczenia cieplno-wilgot-nościowe ścian zewnętrznych i ich złączy w świetle obowiązujących przepisów prawnych. Grupa Wydawnicza Medium Warszawa 2017.
[8] Pawłowski K. Projektowanie przegród poziomych w budownictwie energooszczędnym. Obliczenia cieplno-wilgotnościowe przegród stykających się z gruntem, stropów oraz dachów i stropodachów w świetle obowiązujących przepisów prawnych. Grupa Wydawnicza Medium, Warszawa 2018.
[9] PN-EN ISO 6946:2008 Building components and building elements -Thermal resistance and thermal transmittance – Calculation method.
[10] Pawłowski K. Projektowanie przegród zewnętrznych w świetle aktualnych warunków technicznych dotyczących budynków. Obliczenia cieplno-wilgotnościowe przegród zewnętrznych i ich złączy. Grupa Medium, Warszawa 2016.
[11] Software TRISCO-KOBRU 86, PHYSIBEL c.V, Belgium. Workstation licence for research and didactic purposes.
[12] PN-EN ISO 10211:2008 Thermal Bridges In Building Construction ‒ Heat Flows and Surface Temperatures – Detailed Calculations.
[13] PN-EN ISO 13788:2003 Hygrothermal performance of building components and building elements -- Internal surface temperature to avoid critical surface humidity and interstitial condensation. Calculation methods.
[14] Poradnik w zakresie poprawy charakterystyki energetycznej budynków. Ministerstwo Infrastruktury i Budownictwa, Warszawa, 2016.
[15] www.energiadlawarszawy.pl/cieplo-systemowe/dla-audytorow (2.08.2017).[16] www.gpec.pl/partnerzy-biznesowi/efektywnosc-energetyczna-gpec (2.08.2017).[17] www.therma.bielsko.pl/wskaznik-nakladu-wpc (accessed: 2.08.2017).[18] Regulation of the Minister of Infrastructure and Development on the methodology of calcu-
lating the energy performance of a building and apartment or a part of a building that can be considered as entirely separate entity from the technical and functional point of view and the procedure for preparing and modeling energy performance certificates. (Journal of Laws of 2015, item 376).
[19] Andruszkiewicz K. Studium projektowe dostosowania budynku jednorodzinnego do standardu budynku o niskim zużyciu energii. Praca dyplomowa magisterska napisana pod kierunkiem dr. inż. K. Pawłowskiego, Uniwersytet Technologiczno-Przyrodniczy w Bydgoszczy, Bydgoszcz 2018.
[20] PN-EN ISO 14683:2008 Thermal bridges in buildings. Linear heat transfer coefficient. Simplified methods and approximate values.
[21] Życzyńska A., Cholewa T. The modifications to the requirements on energy savings and thermal insulation of buildings in Poland in the years 1974-2021. Budownictwo i Architektura 14(1) (2015) pp. 145-154.
[22] Ostańska A. Increasing The Energy Efficiency of Dwelling Houses: Case Study of Residentia; Quarter in Upper Silesia, Poland. Budownictwo i Architektura 18(1) (2019), pp. 23–32, DOI: 10.24358/Bud-Arch_19_181_03


Strengthening of the wooden structures
Szymon Ślósarz
Department of Structural Engineering, Faculty of Civil Engineering and Architecture, Lublin University of Technology, e–mail: [email protected] ORCID ID: 0000-0001-7786-7436
Abstract: The paper is a review of the literature on the strengthening of wooden struc-tures. The strengthening methods are classified according to their purpose and specifics. The article deals with both traditional methods commonly used and modern methods involving the use of composite materials. The paper also includes description of studies on various strengthening methods as well as the presentation of their results. The author also refers to the causes of the loss of load bearing capacity, causes of wood degradation and wooden structures durability in relation to operating conditions.
Keywords: strengthening, wooden structures, degradation, durability, carbon fiber tapes, glued wood
1. IntroductionWood as a cheap and widely available material, has been used for ages for almost all
types of buildings, varied from small farm buildings to large churches, in which wood is the building material for the whole structure or only its cover. The glue laminated wood introduced nowadays has become a material for the large span roof structures in halls, e.g., sport complex. The main advantage of wood is its low weight, which reduces transport and construction costs, significantly reducing or even eliminating the use of heavy machinery.
Wooden structures are resistant to temperature variability and operation in constantly wet environments. The most of their damage come from destructive biological interactions in unfavorable, cyclically changing, moisture conditions. Safe use of wooden structures, in which destructive processes have already begun, requires repair or strengthening. A multitude of wooden structures types (i.e., ceilings, trusses, walls of wooden buildings, roof structures, and various complex engineering structures) leads to many strengthening methods including classic carpenter solutions as well as methods based on the use of modern composite materials. This paper describes the mechanism of wooden structures damage, and the most popular methods used for strengthening of such structures. Then the results of laboratory tests of strengthened wooden structures are described.
2. Durability of wood and a damage mechanism of wooden structures
It is well known that the wood structure under optimal conditions has a very high durabi-lity of up to several hundred years, as shown in Table 1. The table shows that wood can operate for a very long period of time only in stable moisture conditions, i.e., in a dry or wet state. The problem arises when the wood structure works under cyclically changing humidity conditions, and these are the most common for wooden elements exposed to environmental agents.
Budownictwo i Architektura 18(3) 2019, 17-28 DOI: 10.35784/bud-arch.561

Szymon Ślósarz18
Table 1. Durability of some species of wood according to [1]
Type of woodDurability [years]outdoor in consistently dry conditions underwater
common pine 20-85 120-1000 80-500spruce 10-70 100-900 50-100larch 20-90 300-1800 80-700
Kozakiewicz [1] stated that the natural durability of wood depends on the environmental conditions, the type of wood (species), its structure and chemical composition. Regarding the durability, wood is classified into three groups [1]:
• very durable wood (e.g., oak, yew, larch, robinia, ebony, eucalyptus),• wood of moderate durability (e.g., spruce, pine, ash, fir, beech),• wood of low durability (e.g., maple, birch, linden, willow, poplar).Usually conifer (spruce, pine, fir) is used to make structural elements. Therefore structural
elements are made of the wood of moderate durability and they are subjected to degradation. The main factors causing the degradation of wood are:• biological agents: bacteria, fungi, algae, lichens, insects, and others,• physico-mechanical agents: low temperature, variable humidity, mechanical forces,• physico-chemical agents: light, radiation, high temperature, fire, • chemical agents: acids, bases, salts, aerosols.The most dangerous factors causing the degradation of wood are fungi and insects, especially
if the wood operates under cyclic environmental humidity changes. Due to these changes, micro-cracks appear in the surface of the wood, in which fungal spores are deposited. Fungi cause the decomposition of wood tissue which in a direct way leads to a reduction in strength parameters. Insects, however, degrade wood in a mechanical way. The insects’ larvae that create corridors under the surface of the element noticeably reduce the cross-section of the element [2].
Fig. 1. Damage to wooden elements: a) structural elements affected by fungi (photo. Sz. Ślósarz); b), c) structural elements destroyed by insects, (photo. Sz. Ślósarz, A. Halicka)
Considering that humidity is the factor favoring fungal and insect attack, the PN-EN 335:2013-07 standard [3] distinguishes five classes of use:
• 1st class – wood or wood-like material is under a roof, it is completely protected from weather conditions and is not exposed to humidification; the beetles destroying the wood are the biological hazard;
a) b) c)

Strengthening of the wooden structures 19
• 2nd class – wood or wood-like material is under a roof, it is completely protected from weather conditions, however, high humidity of the environment may lead to periodic, but not constant humidification; the beetles destroying the wood and fungi worsening the wood surface appearance are the biological hazards ;
• 3rd class – wood or wood-like material is not under a roof and is not in contact with the ground, although it is constantly exposed to weather conditions, or it is protected from weather conditions, but it is under frequent humidified; the beetles that destroy the wood, fungi that worsen the wood appearance and fungi that decompose the wood are the biological hazards;
• 4th class – wood or wood-like material is in contact with ground or fresh water and thus it is constantly exposed to humidification; the beetles that destroy the wood, fungi that decompose the wood and gray decay fungi are the biological hazards;
• 5th class – wood or wood-like material is constantly exposed to seawater; fungi that decompose the wood and gray decay fungi are the biological hazard.
Insects and fungi action (biological corrosion) leads to reduction of the load bearing capacity of structural elements by reducing the wood’s strength. In addition, the degraded fragments diminish the cross-section area, which together with the decrease of the modu-lus of elasticity leads to the reduction in the stiffness of structural elements. As a result, the deflections of bending elements grow and the stability of the whole structure decreases. Thus, in a relatively short time, the biological corrosion can lead to make the use of the structure unsafe due to the reduction of the load bearing capacity or loss of structural stability.
3. Traditional methods of wooden elements repair and strengthening
3.1. The essence of repair and strengtheningDepending on the technical condition of the wooden element and its destination, the
repair or strengthening may be chosen. Repair is made when the original load bearing capa-city of the element should be restored, which has been lost due to destructive environmental impact (fungi, insects, moisture) or mechanical damage. If there is a need to increase the load bearing capacity or stiffness in order to reduce the deflection, the strengthening should be performed. Elements are usually strengthened, when it is planned to increase the loads (e.g., loads on ceilings or roofs).
Every repair and strengthening of a wooden element should be preceded by assessment of the range of the zone, which was degraded by insects or fungi. The whole degraded parts should be removed and hewed, and the “healthy” wood should be left. This is the necessary condition for the effective repair and strengthening. The abandon of removing infected parts results in further degradation progress, including new wood fragments.
Thus, the elements destined for repair or strengthening are of reduced area in relation to the original cross-section because of removing corroded parts. The repair restores the para-meters of the primary cross-section, and the strengthening is focused on the increase of the load bearing capacity of the primary element.
Repair and strengthening of wooden elements usually concern the flexure zone (in the span) or shear zone (near the support). The purpose of strengthening of a wooden element in flexure zone is most often not only to increase the load bearing capacity of cross-sections, but

Szymon Ślósarz20
also to reduce existing or designed deflection. One of the most common damage to wooden ceiling is its excessive deflection. It may be caused by the loss of the cross-section area due to corrosion, but also creep of the wood under a long-lasting high-value load. In this case, besides strengthening by the increase of cross-section, there is a need to “straighten out” and thus to lift up the floor beams in the middle of their span. Usually this is done by use of actuators, previously basing them on the masonry or special steel frames or beams, e.g., when there is a vault underneath the ceiling.
3.2. Replacement of fragments or entire element In the case of strong corrosion of wooden element, it may be necessary to replace its
fragments, especially in the support zones. Ends of a beam are subjected to infestation with molds and fungi, due to the lack or faulty insulation between the wall and the wood and as a consequence of moisture in the wood.
The replaced part of the element can remain wooden – then the old and the new part are connected by screws (Fig. 2).
Fig. 2. Replacement of the rafter support zone with a new wooden part (photo. A. Halicka)
The replacement with steel elements can also be made. For this purpose, small steel trusses are used (Fig. 3a). The one side of truss rests in the wall in the socket, while the other side is attached to the “healthy” wooden beam. Another way of replacing the support zone is to replace the support piece with a steel beam, e.g., a C-profile fixed to a wooden beam on a set of screws on one side and supported on a wall on the other side (Fig. 3b).

Strengthening of the wooden structures 21
Fig. 3. Replacement of support zones of wooden beams for steel elements: a) truss, b) profiles [4]
In extreme cases, when repair or strengthening to achieve the required load bearing capacity is not possible, additional load bearing elements are introduced, wooden or steel, carrying all loads or loads that exceed the load bearing capacity of left wooden elements (Fig. 4). Another way is to introduce an additional support by undersling the beams in the middle of the span to a wooden beam located perpendicular to the beams (if it is possible to use such a beam).
a)
b)

Szymon Ślósarz22
Fig. 4. Steel load bearing elements taking over the bearing role of original wooden elements (photo. A. Halicka)
3.3. The use of additional wooden elementsThe basic and most common way to strengthen and repair existing wooden elements
is to increase the area of cross-section by additional wooden elements, which are fixed with mechanical fasteners, usually nails or screws. As a result, the sectional modulus and the moment of inertia of the cross-section increase. The pads can be fixed on the element sides (in the case of strengthening of ceiling beams or beam ends) or on the upper surface as overlays (in the case of rafters and purlins, in which it is allowable to change the height of the beam). In strengthening with wooden pads it is necessary to remember to create the reverse deflection of the beam ceiling made by undercut on the top of the beam and pads.
Fig. 5. Strengthening of wooden beams using wooden pads [4]

Strengthening of the wooden structures 23
3.4. The use of additional steel elements
3.4.1. Strengthening the cross-section with steel profiles
Strengthening steel elements are most often used on the side surfaces of the structural member. They can be fastened over the entire length of the element, in order to increase its load bearing capacity, or only on a fragment to replace the damaged part of the cross-section. Linear strengthening is performed by fastening steel elements to the surface of a wooden beam (most often steel elements are placed on both sides and they are twisted together). Connection can be made of screws with nuts in the spacing about 15% of the beam range.
To increase the load bearing capacity, rolled sections are used: angles, C-profiles, and flat bars. Typically, the additional steel element carries the bending moment and the wooden element is treated as not working. The method of linear reinforcement is illustrated in Fig. 6.
Fig. 6. Strengthening of wooden beams using steel profiles [4]
3.4.2. Strengthening with steel sheets and steel bars
Strengthening of wooden beams using steel sheets and bars consists in making a cutter along the beam into which the epoxy resin is introduced, and the steel bar or metal sheet is embedded into it. This solution does not increase the cross-section, it can be carried out without distraction of this beam surface, which is considered valuable, e.g., for conservation reasons. By the method of gluing steel elements inside beam , both the tensile and shear part in the support zones can be strengthened. The principle is shown in Fig. 7.
Fig. 7. Strengthening of wooden beams using steel sheets and steel rods [5]; 1-wooden beam reinforced, 2- epoxy composition, 3- metal sheet, 4 –steel rod
In the paper [5], the results of tests were reported, in which the method discussed was applied in different variants (Fig. 7). It was found that the most favorable concerning the increase of the load bearing capacity is the gluing of steel sheets to the side surfaces of wooden beams.
Jasieńko in works [5,6] widely dealt with strengthening of existing beams by steel reinforcement. Similarly to the theory of reinforced concrete, he introduced the steel bars to the tensile zone of a wooden beam. In tests, the deflection of reinforced beams was lesser than the deflection of non-reinforced beams: of about 40% when using single reinforcement (i.e., introduced in a one row) of reinforcement ratio of 1.5% in relation to the cross-section of wood, and 60% when 3% for double reinforcement. The method of steel reinforcement presented in the research [5,6] is shown in Fig. 8.

Szymon Ślósarz24
Fig. 8. Strengthening of wooden beams using the reinforcing bars; 1-wooden beam reinforced, 2- adhesive composition with a reinforcing rod, [5]
3.4.3. Prestressing
In the mid-1970s, an attempt was made to transfer the prestressing technology used for concrete elements to wooden structures – prestressing withstands the tensile stress caused by the external load. The steel used for prestressing was a high strength steel. The prestressing was performed by means of wires as well as prestressing steel strips glued to the down surface in the tensile zone. Such a prestressing applied by Peterson [7] resulted in an increase of the load bearing capacity (by approx. 26%), an increase in stiffness and reduction of deflections (by approx. 76%) in relation to non-prestressed beams.
The attempts to introduce preliminary stresses were made by Cyruliński on structures made of the glued laminated wood [8]. It was a structure not only compressed in the tensile zone, but also expanded in the compression zone. The author introduced a special channel routing on the beam sides, ensuring the adjustment of the eccentricity of the compression and tensile forces to the value of the expected operational stresses. The largest increase in ultimate loads of the prestressed-expanded beam in relation to the non-tensioned beam was 48%. The route of the prestressing-expanding bars is shown in Fig. 9.
Fig. 9. The course of the routes of prestressed and expanded bars in beams, which were examined by Cyru-liński; a) prestressed beam, b) expanded beam, c) prestressed-expanded beam, [8]

Strengthening of the wooden structures 25
The basic problem during the prestressing of wooden beams are the prestress losses. In the wood, with the passage of time, rheological changes occur due to shrinkage and relaxa-tion of wood, which significantly reduce the effectiveness of prestressing. Various studies [9] give a different value of force loss, but they oscillate in the range of 20-25%, which means relatively high losses.
4. Strengthening of wood members using composite materialsThe composites (FRP) are used more and more often to strengthen wooden elements. They
are materials, in which a matrix consisting of an epoxy resin is reinforced with a fibrous mate-rial. Depending on the fibers used, a composite with different parameters is obtained (Tab. 2).
Table 2. Technical parameters of fibers used in composites [10]
Type of fiber Density [g/cm3] Tensile strength [MPa] Module of longitudinal
elasticity [GPa]E-glass 2.5 2000 – 3500 70S-glass 2.5 4570 86Aramid 1.4 3000 – 3150 63 – 67Carbon 1.4 4000 230 – 240
Research on the strengthening of wooden structures using composite materials has been carried out effectively for both solid wood and glued laminated wood [11-14].
Extensive research in this field was carried out by Nowak [15]. He investigated the influence of the location the composite on the increase of the load bearing capacity of the beam. An important assumption was the insertion of composite to the inside of the beam, which was used to simulate the strengthening of old, antique beams. The tests were carried out on the beams of the 12x22 cm cross-section, using the CFRP tapes, which were glued before loading, both from the top and side of the beam. For comparison, two non-streng-thened beams were tested – the A series made of an “old” wood and the G series made of a “new” wood. The scheme of the test is shown in Fig. 10. The beams were loaded to simulate pure bending.
The graph on the Fig. 11 shows the ultimate loads of the tested beams. The largest increase in the load bearing capacity in comparison to series A was recorded for the D series with the tapes on the top and side surfaces (about 79%), while the smallest was for the F series, with tapes based only into the both sides of the beam (approx. 21%).
Fig. 10. Scheme of the test stand [15].

Szymon Ślósarz26
Fig. 11. The results of tests carried out on solid beams by Nowak, [15]
Strengthening of the glued laminated wood using the fiber strips consists of gluing them at the production stage between the last lamellas or on the bottom of the beam. Brol [16] performed tests on beams as shown in Figure 12, and obtained an increase in load bearing capacity for GARP strips fastened to the bottom of the beam by 54%, and for reinforcement glued between lamellas by as much as 68% in comparison with non-strengthened beams. He stated that strengthening of the glued laminated wood beams with composite tapes saves even 25% of wood, but the proposed methods are only possible to apply at the production stage.
Fig. 12. Types of beams reinforced by Brol during the glued wood tests [16]
5. Conclusions1. The paper presents methods of repair and strengthening of wooden beams in a traditio-
nal way and using composite tapes. The main purpose of these methods is to improve the cross-section parameters (depending on the method – increasing the cross-section area, increasing stiffness). In the literature there are studies, which report attempts to introduce initial stresses by prestressing.

Strengthening of the wooden structures 27
2. A common need occurring during the strengthening of wooden beams is the reduction of their existing deflection. It seems that this is possible with use of the prestressing composite tapes. In literature, there is a few case of prestressing wooden beams and typically apply glue laminated wood. There is no case about prestressing traditional wood in current articles so it is a field for further research and analysis.
References[1] Kozakiewicz P., Matejak M. „Klimat a drewno zabytkowe. Dawna i współczesna wiedza o drew-
nie”, 4th ed., Wydawnictwo SGGW, Warszawa 2013.[2] Brol J., „Zasady wykonywania ekspertyz konstrukcji drewnianych”, in Proceedings – XV Konfe-
rencja naukowo techniczna „Warsztat pracy rzeczoznawcy budowlanego”, Kielce – Cedzyna, 2018, pp. 179-199,
[3] PN-EN 335:2013-07 Trwałość drewna i materiałów drewnopochodnych – Klasy użytkowania: definicje, zastosowanie do drewna litego i materiałów drewnopochodnych.
[4] Masłowski E., Spirzewska D., „Wzmacnianie konstrukcji budowlanych”. Arkady, Warszawa 2000.[5] Jasieńko J., „Połączenia klejowe w rehabilitacji i wzmacnianiu zginanych belek drewnianych”.
Oficyna Wydawnicza Politechniki Wrocławskiej, Wrocław 2002.[6] Jasieńko J., „Opracowanie metod wzmacniania konstrukcji drewnianych przy zastosowaniu żywic
syntetycznych. Etap I i II”, Raport Instytutu Budownictwa Politechniki Wrocławskiej, Wrocław 1988.
[7] Peterson J., „Wood beams prestressed with bonded tension elements”, Journal of the Structural Division, Procedings of the American Society of Civil Engineers, 1965.
[8] Cyruliński Z., „Ocena celowości wstepnego naprężania cięgnami belek z drewna klejonego”, PhD desideration, Czestochowa Uniwersity of Technology, 2006.
[9] Dziuba T., „Przegląd Pełzanie belki drewnianej sprężonej stalą”, in Proceedings – I Sympozjum Naukowe Reologia drewna i konstrukcji drewnianych, Poznań-Zielonka 1982, pp. 151-162.
[10] Hajnalka H., Racz I., Anandjiwala R.D., „Development of HEMP fibre reinforced polypropylene composites”, Thermoplastic Composite Materials, vol. 21, 2008, pp. 165-174.
[11] Rajczyk M., Jończyk D. „Przegląd metod wzmacniania konstrukcji budowlanych”, Zeszyty Naukowe Politechniki Częstochowskiej. Budownictwo, 2011, pp. 146-160.
[12] Nowak T., Patalas F., Hryniewiecki M., „Konstrukcje drewniano kompozytowe”, in Proceedings – XXXIV Ogólnopolskie warsztaty projektanta konstrukcji, Szczyrk 2019, pp. 411-452.
[13] Nowak T., Patalas F., „Zastosowanie materiałów kompozytowych do wzmacniania konstrukcyj-nych elementów drewnianych”, Materiały budowlane, vol. 3/2019, pp.20-24. https://www.doi.org/10.15199/33.2019.03.06
[14] Triantafilou T., Deskovic N., „Prestressed FRP sheets as external reinforcement of wood members”, Journal of Structural Engineering, vol. 118, 1992, pp. 1270-1284.
[15] Nowak T., „Analiza pracy statycznej zginanych belek drewnianych wzmacnianych przy użyciu CFRP”. PhD desideration, Wrocław University of Science and Technology, 2007.
[16] Brol J., „Wzmacnianie zginanych belek z drewna klejonego taśmami GARP na etapie produkcji”, Wiadomości Konserwatorskie, vol. 26, 2009, pp. 345-353.


Budownictwo i Architektura 18(3) 2019, 29-40 DOI: 10.35784/bud-arch.586
Use of aluminium and glass facades in the public space of the city of Krakow
Monika Górka
Faculty of Civil Engineering; Cracow University of Technology e–mail: [email protected], ORCID: 0000-0002-5985-2078
Abstract: As an element of structural and material solutions, aluminium and glass faça-des are the mainstay of urban architecture; they are especially used in public utility buildings. The article provides a review of architectural styles and trends of the 20th century, when exte-rior elevations began to take the form of aluminium and glass façades. It illustrates the main architectural trends of urban architecture in the 20th century and their evolution throughout the years. Furthermore, it specifies and refers to the architecture of the 20th and 21st centuries in Krakow and presents selected public utility buildings which have become an integral part of architecture in this city.
Keywords: aluminium and glass façades, urban architecture, public utility buildings
1. IntroductionFaçades, especially aluminium and glass ones, as exterior walls of buildings and civil
structures, are an element of modern urban architecture. The form, shape and material of which front elevations are made shape public space and, above all else, keep the layout and internal harmony of the town or city in check. Each and every elevation is a showcase of a building and, simultaneously, a distinguishing feature and symbol of a specific town or city.
Elevations are not only part of the image of a building, its aesthetics, form and architectu-ral solid but also testify to the quality of solutions and functionality. All of the above elements include the shape and inclination angle of the façade plane, type of the system used and type of glass, which affects the indoor illumination, acoustics or thermal comfort of the user. The listed components are only several factors affecting the quality of use, but also finances and savings of the building [1].
The history of architecture and its trends is basis for the art of creating the modern image of urban space. The combination of architectural aesthetics, form, solid and the functionality mentioned above can be observed especially in the case of public utility buildings, such as office buildings, cinemas, theatres, shopping malls, airports, etc. [2]. This mainly stems from the status of such structures; therefore, the investor seeks a unique and original look of the elevation. The development of said solutions raise the architect’s awareness and sets new trends in construction and architecture.
The imagination of the architect, as to the shape of the building body and the appearance of external walls is limited by the spatial development plan [3] [4]. It specifies the exact form and shape of the building facade so that they fit into the principles of shaping the municipal spatial policy and the building alignment. However, it often happens that newly designed objects, their facade, colour material used, raises a lot of controversy among the residents

Monika Górka30
and users. That is why social spatial planning process consultations are organized to create an urban area friendly for both the user and the environment [5].
Modern-day aluminium and glass façades are not only the solid and its form. State-of-the-art options, solutions and technologies for the preparation of designs and their implementation allow the creation of exterior fences of buildings and civil structures as parti-tions increasing energy efficiency and eco-friendliness. Newly designed and constructed facilities based on the principles of sustainable development [6], care for both the external environment and user comfort [7]. Solutions for using natural plants and natural solar energy are sought to create zero energy buildings [8], [9]. Designing new objects based on green facades [1], [10] and photovoltaics [11] reduces overheating of cities through natural shading and transpiration cooling [12], [13].
The article presents the current notions in contemporary architecture that shape shaping the public urban space, based on aluminium-glass facades. Individual solutions of architectu-ral solid, characteristic of the corresponding period of the twentieth century, were presented. Additionally, on the example of the city of Krakow architectural solutions and objects being the showcase of the city of Krakow, are demonstrated confirming the thesis that the modern city and its public facilities are the solutions based on aluminium-glass facades, both in the form of all-glass buildings, or in combination with other facade materials such as ceramic tiles or architectural concrete.
2. History of contemporary urban architectureUrban architecture has been developed since antiquity, when the civilization of the Roman
Empire was built. Ancient buildings went down in history as a legacy of world culture and mankind. Throughout the ages to come, architecture evolved and changed thanks to techno-logical development. The Middle Ages introduced the systematisation and precursory design of the town/city [14]. One characteristic element was the stronghold surrounded with a wall as a means the defence of residents who lived on such premises. The pursuit of functionality caused European settlements to be designed around the cathedral, together with the accompa-nying hall and market [14]. The era that followed, the Renaissance, created the basic principles of urban planning, of which the main one was the perpendicular layout of the streets. To this day, many towns and cities in Europe have maintained their spatial plans dated back to the Renaissance. However, it was only in the 20th century that the new architectural trends of the modern town or city were conceived. During this period, new styles and disciplines of the art of urban planning were created. The individuality of form caught people’s attention; designers would come up with new and original architectural shapes and details and used materials which gave civil structures a new dimension of aesthetics and originality [15].
This work presents and specifies selected trends in urban architecture, which art and disci-pline involves spatial planning in the 20th and 21st centuries, when glass was used as an exterior element of buildings and civil structures.
The first architectural style in XX century was modernism. Its motto was functionality, in other words “form follows function” [16]. During the modernist period, highly functional buildings were designed and erected, characterised by cubic forms and light-coloured eleva-tions. The building façade was stripped off ornaments, as they were deemed impractical and non-functional from the perspective of users. The building solid was characterised by simple and geometric shapes, usually in the form of cuboid with a flat roof and large ribbon windows. Buildings designed in the modernist style were perceived by critics as “boxes”. The simplicity

Use of aluminium and glass facades in the public space of the city of Krakow 31
of shaping modernist structures was complemented by the careful selection of materials and implementation of new technologies used in the construction of front elevations, which made such civil structures extraordinary and unique at the beginning of the 20th century. One of the many examples illustrating the characteristics of modernism is the Museum of the 20th century in Berlin, nowadays Neue Nationalgalerie (Fig. 1). This building was designed by the German modernist architect Ludwig Mies van der Rohe, who refi ned his vision of monumental architecture incorporating minimalism in its form; he contended that the building elevation should rely only on “skin and bones”, which is basis for the current design of aluminium and glass façades [14].
Fig. 1. Museum of the 20th century in Berlin [17]
Yet another contribution to urban planning was postmodernism. It began in the second half of the 1960s [17]. This architectural style caused much controversy among people who valued delicacy and minimalism. It combined all styles and trends in architecture, from ancient arches, to modern technological solutions of the 20th century. Postmoder-nism was a backlash against the simplicity of modernism. It broke with all conventions, it defi ed against the order and concept of modernism, where the solid of the building is to follow its function. Postmodernism is the lack of order and, above all else, freedom of creation and originality of form. The leading architect of postmodernism Robert Venturi paraphrased the words of Ludwig Mies van der Rohe “less is more” as “less is a bore” [17]. Postmodernism came to Poland much later, at the turn of the 1970s and 1980s [18]. One of the examples of postmodernism in Poland is the Polish Television Headquarters, designed by Czesław Bielecki (2001-2007) (Fig. 2). It is considered one of Poland’s greatest eyesores. The structure illustrates the essence of postmodernism, combining a variety of forms and meanings. Architects and onlookers refer to it as the “Tower of Babel” as its form incorporates steel arched tubes and volutes, using both stone plinths and glass façades of the rotunda [18].

Monika Górka32
Fig. 2. Polish Television Headquarters, designed by Czesław Bielecki [19]
De-constructivism is yet another trend to continue the tradition of postmodernism. It origi-nated in the 1980s [20]. Its basic feature is the fragmentation of a civil structure, creation of curvilinear shapes and surfaces of the elevation and distortion of the cuboid frame. The creators of de-constructivism defi ed the ideas of modernism, insofar as the elevation is the skin and bones and the form should be pure and follow function. This inspired experiments with the solid and its geometricity. Civil structures were designed with unique and original shapes and planes. However, ornaments were rejected as redundant (Fig. 3).
Fig. 3. UFA- Palast Dresden [21]

Use of aluminium and glass facades in the public space of the city of Krakow 33
The analysis of modern urban architecture would not be complete without Hi-Tech architecture. This is another trend to continue the tradition of postmodernism and its concepts. Technological achievements and solutions also determined the shape and image of a contempo-rary building [22]. When creating the solid and form of a civil structure, architects decided to conjure their vision of present day by designing elevations as installations or electronic systems. The installation till now concealed under the plane of glass or other materials becomes visible to the observer. Ornaments left out of the architecture of the 20th century, deemed redundant both in modernism and in postmodernism, made a comeback in Hi-Tech architecture. In place of former rosettes, cornices or columns, technologies were built in, such as light shelves, façade screens, acoustic blinds, whereas the entirety is enriched with such technologies as elevations producing living organisms or ones incorporating photovoltaic panels. One of the buildings symbolising Hi-Tech is Hearst Tower, designed by Norman Foster (Fig. 4) [23].
Fig. 4. Hearst Tower [23]
The urban architecture of the 21st century combines art, science and new technologies. Architects and visionaries challenge stereotypes and traditional construction. This inspires the design of original towns and cities with a unique approach to urban planning dominated by globalisation. The town or city of the 21st century is a landscape of high-rise buildings, catching one’s eye with their lightness or even pretentiousness. These are symbols depicting the town or city of the 21st century, where ancient and colonial styles mix with modern skyscrapers as well as high-rise and apartment buildings.

Monika Górka34
3. Aluminium and glass façades of public utility buildings in Krakow
Aluminium and glass façades are an indispensable image element of each and every town or city, both in larger agglomerations and in smaller locations. The advantages of using aluminium-glass facades in public facilities located in urban space is to give objects a light form and high aesthetics, along with shaping remarkable architectural details. In addition, the use of large glazing in aluminium facades, opens the space and office space to the surro-unding outside world, enabling the user to contact natural light. The negative effect of using large glazing is excessive overheating of office rooms, which reduces the comfort of their use. Therefore, especially in such buildings, glass with special properties- photo-chromatic, thermotropic, etc. or solar protection system, which prevents excessive exposure and shining effect is applied. Solar protection systems consist of panels, shutters, shaders or blinds, often made of atypical materials or as technological devices.
The architecture of Krakow includes not only sites of cultural heritage on the UNESCO list, but also a cluster of the modern architecture of the 20th century, originated by modernism and subsequent trends, such as postmodernism, de-constructivism, brutalism, etc. [14]. Modern--day Krakow of the 21st century retains its individuality and extraordinary aesthetic appeal. Architects try to combine the uniqueness of cultural heritage sites in Krakow with contemporary civil structures, where glass and state-of-the-art technologies are predominant.
The authors present selected public facilities in the city of Krakow where aluminium-glass facades are used. The selected objects have become the symbols and the landmarks of Krakow and have been completed over the past 15 years, creating the contemporary city space. The first public facility where architects displayed the modernity and originality of form by designing curvilinear planes of aluminium and glass façades is the Congress Centre (Fig. 5). Its charac-teristic large glazings lend a unique image to the solid of the building. The front elevation of the Congress Centre is not only the aluminium and glass façade but also a ventilated façade made of colourful ceramic tiles. The entirety reflects the vision of the author who designed the form and solid of the building as a melting ice cube, unambiguously distancing himself from the principles of modernism, which provide for the construction of simple cuboid public utility buildings.

Use of aluminium and glass facades in the public space of the city of Krakow 35
Fig. 5. Krakow Congress Centre [photo: Alsal Sp. z o.o. S.K.]
Yet another example of a public utility building with aluminium and glass façades is the International Airport in Krakow-Balice (Fig. 6). Its design reflects the modernity and functionality of glass in combination with the aluminium structure of the external frame. The construction of the International Airport testifies to the possibilities offered by architecture and thus related structural solutions which allow the creation of planes with any inclination angle. Additionally, to maintain sufficient solar irradiation and comfort of use, low-emission glass was used as protection against the excessive heating of the structure.

Monika Górka36
Fig. 6. Krakow-Balice International Airport [photo: Alsal Sp. z o.o. S.K.]
Public utility buildings are mainly office buildings, where their glass front elevations underline the prestige and net worth of the company. The use of glass façades as an exterior enclosure of the office building improves the comfort of work for each user by providing dayli-ght and sufficient solar irradiation of the usable area. Furthermore, properly designed aluminium and glass façades result in decreased energy consumption by civil structures; they ensure proper acoustics and, as a fully recyclable material, have influence on the environment and ecology of the city. All of these features earn glass office buildings additional points in the international certification systems such as LEED and BREEAM [24], which specify the basic principles of sustainable construction. One example of an office building where the elevation is in the form of an aluminium and glass façade is the BIG building in Krakow (Fig. 7).
Fig. 7. BIG office building in Krakow [photo: Alsal Sp. z o.o. S.K.]
Example of an office building with an aluminium-glass facade is a building located at 33 Kalwaryjska street in Krakow (Fig. 8). The outer wall was implemented in the semi-struc-tured system, which presents the building as an all-glass block, without visible, external aluminium profiles. Above the communication part of the office building an aluminium-glass skylight, made in the facade system was designed.
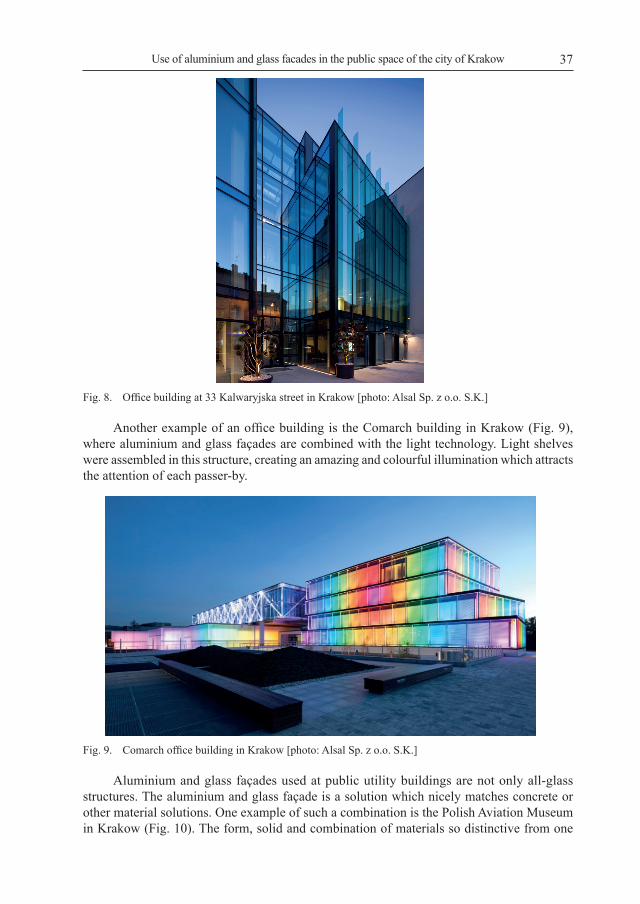
Use of aluminium and glass facades in the public space of the city of Krakow 37
Fig. 8. Office building at 33 Kalwaryjska street in Krakow [photo: Alsal Sp. z o.o. S.K.]
Another example of an office building is the Comarch building in Krakow (Fig. 9), where aluminium and glass façades are combined with the light technology. Light shelves were assembled in this structure, creating an amazing and colourful illumination which attracts the attention of each passer-by.
Fig. 9. Comarch office building in Krakow [photo: Alsal Sp. z o.o. S.K.]
Aluminium and glass façades used at public utility buildings are not only all-glass structures. The aluminium and glass façade is a solution which nicely matches concrete or other material solutions. One example of such a combination is the Polish Aviation Museum in Krakow (Fig. 10). The form, solid and combination of materials so distinctive from one

Monika Górka38
another, namely glass, aluminium and concrete, is amazing not only due to its visual aspect but also aesthetic values and unconventional character. The design of the building which houses the Polish Aviation Museum is based on the architect’s vision as an aircraft propeller, where the paddles are a massive concrete structure and the glass façades fill in and enclose the building space.
Fig. 10. Polish Aviation Museum in Krakow [photo: Alsal Sp. z o.o. S.K.]
4. ConclusionAluminium and glass façades are a type of elevation which are inseparable from public
utility buildings and constitute the mainstay of urban architecture. The history of 20th century architecture many a time referred to solutions based on glass combined with the aluminium frame. From modernism and its minimalism to Hi-Tech civil structures. Glass, as well as its compilations in the form of façades, is the future of 21st century towns and cities. The construction of skyscrapers and high-rise buildings will be a symbol of all larger metropolises or agglomerations. Using the example of the city of Krakow, technological and structural possibilities were illustrated, showing where aluminium-glass facades were and can be used, proving the initial thesis that for a modern city, a solid made in the form of aluminium-glass facades is an indispensable element of architecture. Such design solutions in particular form the basis for public facilities. Thanks to such solutions, architects can design all-glass buildings, which can additionally be combined with other material solutions, such as ventilated façades, made of composite panels, ceramic tiles or fibre-cement boards. The lightness of aluminium and glass façades allows them to be easily matched with heavyweight concrete buildings, lending the concrete jungle a new lease of life.
The article contains pictures taken by Alsal Sp. z o.o. S.K. I would like to kindly thank Alsal for sharing the collection of private pictures.
References[1] Besir, A.B. Cuce, E., “Green roofs and facades: A comprehensive review”, Renewable and Susta-
inable Energy Reviews, 82 (2018), pp. 915-939. https://doi.org/10.1016/j.rser.2017.09.106[2] Tymkiewicz, J. Facades and problems in correct recognition of the functions that buildings perform,
Architecture Civil Engineering Environment, vol. 5 (2012), pp. 15-21.

Use of aluminium and glass facades in the public space of the city of Krakow 39
[3] Rogatka, K. Chodkowska-Miszczuk, J. Biegańska, J. Środa-Murawska, S. Grzelak-Kostulska, E. “The role of public administration in shaping urban space in Poland”, in conference: XIX. Mezi-narodni kolokvium o regionalnich vedach, Sbornik, 2016, pp. 605-612. https://doi.org/105817/CZ.MUNI.P210-8273-2016-77
[4] Caparros-Midwood, D. Barr, S. Dawson, R. “Optimised spatial planning to meet long term urban sustainability objectives”, Computers, Environment and Urban Systems, vol. 54 (2015), pp. 154-164. https://doi.org/10.1016/j.compenvurbsys.2015.08.003
[5] Kaczmarek, T. Wójcicki, M. “Uspołecznienie procesu planowania przestrzennego na przykładzie miasta Poznania”, Ruch Prawniczy, Ekonomiczny i Socjologiczny, vol. 77 (2015), pp. 221-236. https://doi.org/10.14746/rpeis.2015.77.1.12
[6] Pérez, G. Coma, J. Sol, S. Cabeza, L.F., “Green façade for energy savings in buildings: The influence of leaf area index and façade orientation on the shadow effect”, Applied Energy, vol. 187 (2017), pp. 424-437. https://doi.org/10.1016/j.apenergy.2016.11.055
[7] Ihara, T. Gustavsen, A. Jelle, B.P. “Effect of facade components on Energy efficiency in office buildings”, Applied Energy, vol. 158 (2015), pp. 422-432. https://doi.org/10.1016/j.apenergy.2015.08.074
[8] Ibañez-Puy, M. Vidaurre-Arbizu, M. Sacristán-Fernández, J. A. Martín-Gómez, C., “Opaque Ventilated Façades: Thermal and energy performance review”, Renewable and Sustainable Energy Reviews 79 (2017) 180-191. https://doi.org/10.1016/j.rser.2017.05.059
[9] Theodosiou, T. Tsikaloudaki, K. Bikas, D., “Analysis of the thermal bridging effect on venti-lated facades”, Procedia Environmental Sciences 38 (2017) 397-404. https://doi.org/10.1016/j.proenv.2017.03.121
[10] Coma, J. Pérez, G. de Gracia, A. Burés, S. Urrestarazu, M. Cabeza, L. F., “Vertical greenery systems for energy savings in buildings: A comparative study between green walls and green facades”, Buil-ding and environment 111 (2017) 228-237. https://doi.org/10.1016/j.buildenv.2016.11.014
[11] Agathokleous, R. A. Kalogirou, S. A., “Double skin facades (DSF) and building integrated photovoltaics (BIPV): A review of configurations and heat transfer characteristics”, Renewable Energy 89 (2016) 743-756. https://doi.org/10.1016/j.renene.2015.12.043
[12] Hoelscher, M-T. Nehls, T. Jänicke, B. Wessolek, G., “Quantifying cooling effects of façade greening: Shading, transpiration and insulation”, Energy and Buildings, vol. 114 (2016), pp. 283-290. https://doi.org/10.1016/j.enbuild.2015.06.047
[13] Gallo, P. Romano, R., “Adaptive facades, developed with innovative nanomaterials, for a sustainable architecture in the Mediterranean area”, Procedia Engineering, vol. 180 (2017), pp. 1274-1283. https://doi.org/ 10.1016/j.proeng.2017.04.289
[14] Kostrzewska, M. Miasto europejskie na przestrzeni dziejów. Wybrane przykłady. Akapit-DTP, Gdansk University of Technology, Gdanska 2013.
[15] Misiagiewicz, M., “Podróż w czasie i przestrzeni”, Czasopismo Techniczne, vol. 106 (2009), pp. 93-98.[16] Peter, B., From Follows Fun: Modernism and Modernity in British Pleasure Architecture 1925-
1940. Routlege, Oxon 2013.[17] Kerr, R. Robinson, S.K. Elliott, C., “Modernism, Postmodernism, and corporate power: historicizing
the architectural typology of the corporate campus”, Management & Organizational History, vol. 11 (2016), pp. 123-146. https://doi.org/ 10.1080/17449359.2016.1141690
[18] Urban, F., “Postmodernism and socialist mass housing in Poland”, Planning Perspectives, 2019. https://doi.org/10.1080/02665433.2019.1672208
[19] Wojtczuk, M. Budynek, “TVP, czyli Wieża Babel”, 2009. Available: http://www.bryla.pl/bryla/1,85301,6215963,Budynek_TVP__czyli_Wieza_Babel.html [Access: 15 Oct 2019]
[20] Kozłowski, T., “Rozbicie formy w abstrakcyjnej architekturze (mieszkaniowej)”, Przestrzeń Urbanistyka Architektura, vol. 1 (2016), pp. 57-70.

Monika Górka40
[21] Flickr -UFA – Palast Dresden. Available: https://www.flickr.com/photos/migebert/6257924409 [Access: 25 Nov 2019]
[22] Eslamirad, N. Sanei, A., “Double Skin Facades in Use, A Study of Configuration and Performance of Double Skin Facade, Case Studies some Office Buildings”, in 2nd International Conference on Research in Science and Technology, Istanbul-Turkey 2016.
[23] Buma, “Hearst Tower – najlepszy wśród najwyższych”, 2008, Available: http://www.bryla.pl/bryla/1,85298,5958719,Hearst_Tower___najlepszy_wsrod_najwyzszych.html [Access: 15 Oct 2019]
[24] Altomonte, S. Saadouni, S. Schiavon, S., “Occupant Satisfaction in LEED and BREEAM – Certi-fied Office Buildings”, in Proceedings of PLEA 2016 – 36th International Conference on Passive and Low Energy Architecture: Cities, Buildings, People: towards Regenerative Environments. Los Angeles 2016.

Budownictwo i Architektura 18(3) 2019, 41-50 DOI: 10.35784/bud-arch.719
Selection of floor heating systems with use of multi-criteria decision analysis method
Jacek Karpiesiuk
Faculty of Civil and Environmental Engineering; Bialystok University of Technology e-mail: [email protected], ORCID: 0000-0002-6558-5930
Abstract: Using Multiple-criteria Decision Analysis (MCDA), the most favourable floor heating system of a detached house has been selected. The analysis also includes an assessment of the performance of this type of heating on small surfaces (up to 20 m2). The choice was made among eight heating variants, adopting various systems available on the construction market powered by water or electricity, including traditional with „wet” screeds, „dry” screeds and lightweight floor heating systems without floor screeds. From the set of 14 evaluation criteria, the eight most important ones were identified. Using the summed corrected indicator of mathematical analysis, it was assessed that the best variant is a lightweight floor water heating system on a reactive adhesive without screeds with aluminium foil.
Keywords: MCDA, lightweight underfloor heating, set of criteria, radiant floor heating
1. IntroductionEvery day, people face choices with regards to more or less significant matters. This
also applies to topics that arise during the construction of a house. One of them is the choice of a heating system. In recent years, underfloor heating has become increasingly popular, and therefore the purpose of the article is to choose the best of the eight variants selected. The basis for this was the important criteria described here that characterize this surface heating system. The reason for this is that it has many advantages, including the most important one, a high thermal efficiency at a low supply temperature, good cooperation with devices using renewa-ble energy sources and the provision of thermal comfort, especially the so-called „comfort of warm feet”, where the temperature distribution is close to the ideal one for a human being. To make the right decision, it is necessary to choose the possible options for solutions to the topic we are interested in and define the evaluation criteria. Based on many criteria, we determine the final set and analytically choose the best variant. MCDA according to [1] allows you to determine which variant satisfies the investor’s requirements to the highest degree and this decision is determined as optimal. An optimisation is particularly important when the effects of decisions have a long-term impact not only on the future life of the person choosing but for future generations. In this article, Multiple-criteria Decision Analysis was carried out based on the work [1-3]. It is worth noting that there are other current positions in the literature that deals with the development of MCDA methods towards application as multi-attribute utility theory (e.g. AHP- example in [4], ANP, MUZ and the DEMATEL methods); relational meth-ods (e.g. ELECTRE, DELPHI and PROMETHEE methods); and many others (e.g. geometric methods), widely described in book [5].

Jacek Karpiesiuk42
For calculation and analysis, a house with a usable area of 100 m2, where a floor heat-ing system is to be installed, has been selected. The individual demand for cooking power is 47 W/m2, with a seasonal heat demand indicator for heating EA = 64.20 kWh/year‧m2, which according to Austrian guidelines [6] classifies the building as energy-efficient, C class. Also, it was decided to evaluate the execution of this type of heating only on small surfaces up to 20 m2 (e.g. kitchen + bathroom). Eight variants of underfloor heating covered with cement coats or structural layers described below were adopted for multi-criteria evaluation (more information can be found in the literature related to each system - in squared brackets). These are listed as follows:
1. Traditional radiant floor heating with a heating coil laid in concrete, widely described, e.g. in the catalogue [7, 8].
2. Radiant floor heating with a heating coil laid in thermal insulation grooves, covered with dry screed without heat-dissipating lamellas, described by Zukowski and Karpie-siuk [9].
3. Radiant floor heating with a heating coil laid in thermal insulation grooves, covered with dry screed with heat-dissipating aluminium foil, so-called type B according to standard [10].
4. Radiant floor heating with a heating coil laid in thermal insulation grooves, covered with dry cement screed with heat-dissipating steel lamellas, so-called type B according to standard [10].
5. Lightweight radiant floor heating with a heating coil laid in thermal insulation grooves, covered with an adhesive reinforced with fibreglass mesh layer (without screed) and without heat-dissipating lamellas, as in catalogue [11].
6. Lightweight radiant floor heating with a heating coil laid in thermal insulation grooves, covered with a layer of reactive adhesive (without screed), with heat-dissipating aluminium foil, according to the norm [12].
7. Underfloor electric heating with heating cables laid in the concrete screed, designed as an accumulating system using the second, cheaper night tariff, according to the Vademecum [13].
8. Underfloor electric heating with heating mats laid in the adhesive layer, on the concrete screed with the use of first and second of the electricity tariff, as shown in the Vademecum [13].
2. Criteria for choosing selected variants of underfloor heating When proceeding to the assessment of the adopted variants we should first select the
criteria we are interested in. It is possible to apply both criteria - measurable, expressed in numerical quantities and not measurable for which, either alone or together with experts in the field, we set numerical values to make comparisons and assessments. A criterion is a stimulant if a higher value is positively influenced by the assessment or destimulant when the higher value contributes to the deterioration of the criterion adopted.
2.1. The preliminary set of criteriaBearing in mind the properties of the underfloor heating system that have an impact on
both the investment and the building operation, the so-called preliminary set of criteria (PSC), relevant for the assessment of underfloor heating systems, has been adopted:

Selection of floor heating systems with use of multi-criteria decision analysis method 43
• K1 – The cost of the investment for 1 m2 of the underfloor heating system as a measurable criterion - destimulant;
• K2 – The cost of investment on small surfaces as a measurable criterion - destimulant;• K3 – The cost of operating the underfloor heating system over a period of 15 years of
use as a measurable criterion - destimulant;• K4 – The total cost of the investment at 100 m2 and operation over a period of
15 years as a measurable criterion - destimulant;• K5 – Execution time 100 m2 of the heating system including the terracotta floor taking
into account technological gaps as a measurable criterion- destimulant;• K6 - The pace of implementation of the heating system as a measurable criterion
counted according to 100 m2/execution time - stimulant;• K7 – Weight of the heating system at 1 m2 as a measurable criterion- destimulant;• K8 – Thermal inertia of the heating system, which translates into the quality of control
(less inertia improves control) as a measurable criterion - destimulant;• K9 – Heat output (thermal efficiency) at a low supply temperature of 35℃ as a meas-
urable criterion - stimulant;• K10 – The comfort of use depends on the average temperature on the surface of the
floor at a temperature of power supply of 35℃ (higher floor temperature relative to the power supply temperature improves comfort) as a measurable criterion - stimulant;
• K11 – The versatility of the workmanship during renovation or retrofitting without removing the concrete primer, which facilitates the construction of new and upgraded facilities as an unmeasurable criterion (a 3-point evaluation scale was adopted) - stim-ulant;
• K12 – Functional qualities consisting of among others ease of control depending on the thermal inertia of the floor as an unmeasurable criterion (3-point evaluation scale) - stimulant;
• K13 – Ease of installation which affects the speed of implementation of the investment as an unmeasurable criterion (3-point scale of evaluations adopted) - stimulant;
• K14 – Manufacturer’s warranty, proving the quality of the materials used as a meas-urable criterion - stimulant.
The parameters and data needed for the assessment of individual floor heating systems were adopted from the literature mentioned in this article or based on average market values. Average retail and wholesale prices of materials and labour, assuming the use of the same materials and mounting technology, were adopted in the article [14]. The cost of connecting the gas boiler to the water heater was assessed at eight thousand PLN without VAT. When assessing small areas of the rooms, the price of the boiler is not included, assuming its existence during renovation or modernization of the heating. The cost of electric heating systems based on the calculations of the manufacturer of cables and heating mats according to the technol-ogy, which is included in the article [14]. The cost of operation, including heating and service costs for 15 years was determined based on the Vademecum [13]. It is assumed that the drying time of concrete is 28 days, and the process of laying heating and terracotta at 100 m2 lasts 21 days. When deciding on variant 6 with the use of light underfloor heating on the reactive adhesive, this stacking is shorter and is 14 days. In this system, the tiles are immediately laid on the prepared insulating substrate. Thermal inertia was assessed based on the article [15]

Jacek Karpiesiuk44
and thermal performance at a supply temperature of 35℃ was determined based on the tables of Kan-therm system [16]. The thermal resistance of the floor cladding was assumed to be R = 0.15 [m²‧K/W] with high inertia of concrete, and the distance between the coil equal 10 cm.
The uniformity of the temperature distribution on the floor was assessed based on the engineering work [17], articles [9, 18] and catalogue [11]. The non-measurable criteria were assessed based on the numerical values adopted from 1 to 5, assuming the following values for the versatility of workmanship: 1 – impossible, 3 – sometimes, 5 – possible. Numerical assessment of ease of control and installation was made using the following scale: 1 – difficult, 3 – medium, 5 – easy. The non-measurable criteria that were assessed, were guided by the principle that the greater inertia of the floor, makes it difficult to control the floor heating. The results of the assessment show that the assembly of heating systems are better when they do not require heavy construction equipment and when they have a simple installation process because this reduces labour intensity, which in turn lowers time and cost.
The criteria selected above and their analysis are taken from the monograph [19].
2.2. Criteria analysisTo facilitate a pre-accepted analysis of criteria, the quantity of which can be more than
a dozen and more is recommended to apply the criteria matrix. Its construction is carried out by analysing individual pairs of criteria. If the criterion contains information about another comparable criterion, then it is given a value of 1 as more significant one and vice versa, the weaker one is assigned a value of 0. Independent criteria that do not have a relationship are equal to 0. As an example, the criterion K4 is the total cost of the building investment and operation, which includes the information on criterion K1 - investment cost and K3 - cost of operation, then the matrix element g (4,1) = 1, element g (1,4) = 0, and g (4,3) = 1, g (3,4) = 0. Another example would be the K12 criterion – ease of control, which informs about the K10 - the comfort of use. Ease of control affects the higher comfort of use so then the element g (12,10) = 1, element g (10,12) = 0.
The global criterion K15 was additionally added to the set of criteria at the end of the matrix in rows and columns. The value 1 is assigned here to the elements of the rows and the value 0 to the elements of the columns. The dependencies between the criteria coded in this way are presented in the form of the matrix G{15,15}, table 1.
Table 1. Matrix G{15,15} - relationship between criteria K1, K2,... K14
Nr 1 2 3 4 5 6 7 8 9 10 11 12 13 14 15 bi
1 X 0 0 0 0 0 0 0 0 0 0 0 0 0 0 0
2 0 X 0 0 0 0 0 0 0 0 0 0 0 0 0 0
3 0 0 X 0 0 0 0 0 0 0 0 0 0 0 0 0
4 1 0 1 X 0 0 0 0 0 0 0 0 0 0 0 2
5 0 0 0 0 X 1 0 0 0 0 0 0 0 0 0 1
6 0 0 0 0 0 X 0 0 0 0 0 0 0 0 0 0
7 0 0 0 0 0 0 X 1 0 0 0 0 0 0 0 1
8 0 0 0 0 0 0 0 X 0 0 0 1 0 0 0 1
9 0 0 0 0 0 0 0 0 X 0 0 0 0 0 0 0

Selection of floor heating systems with use of multi-criteria decision analysis method 45
Nr 1 2 3 4 5 6 7 8 9 10 11 12 13 14 15 bi
10 0 0 0 0 0 0 0 0 0 X 0 0 0 0 0 0
11 0 0 0 0 0 0 0 0 0 0 X 0 0 0 0 0
12 0 0 0 0 0 0 0 0 0 1 0 X 0 0 0 1
13 0 0 0 0 1 0 0 0 0 0 0 0 X 0 0 1
14 0 0 0 0 0 0 0 0 0 0 0 0 0 X 0 0
15 1 1 1 1 1 1 1 1 1 1 1 1 1 1 X 15
bj 2 1 2 1 2 2 1 2 1 2 1 2 1 1 0 X
Based on the developed matrix, the criteria graph was built. The number of arcs entering and exiting each criterion (vertex) of the graph has been calculated. These values are calculated according to the formulas:
bj = (1)
bi = (2)
where:bi – number of arcs departing from i-vertex,bj – number of arcs entering the j-vertex, gij – elements in G matrix.Values bj and bj are given in matrix G{15,15} as 16 rows and 16 columns, respectively.
Then, ordering layers was performed by using the global criterion KG (Fig. 1) as a layer 0 of the graph. It connects to the layer 1 criteria, having one entering arc, i.e. the criteria for which bj=1 in matrix G (Table 1). The following criteria were found there: K2, K4, K7, K9, K11, K13, K14. Arranging the next layers, we select the criteria in order, related only to the criteria above them. Hence, layer 2 graph form K1, K3, K5 and K8, and 3 criteria K6 and K12. The last 4 layer of the graph is the K10 criterion, from which no arches are departing.
Fig. 1. Criteria graph of G{15,15} matrix
7 0 0 0 0 0 0 X 1 0 0 0 0 0 0 0 1
8 0 0 0 0 0 0 0 X 0 0 0 1 0 0 0 1
9 0 0 0 0 0 0 0 0 X 0 0 0 0 0 0 0
1
00 0 0 0 0 0 0 0 0 X 0 0 0 0
00
1
10 0 0 0 0 0 0 0 0 0 X 0 0 0
00
1
20 0 0 0 0 0 0 0 0 1 0 X 0 0
01
1
30 0 0 0 1 0 0 0 0 0 0 0 X 0
01
1
40 0 0 0 0 0 0 0 0 0 0 0 0 X
00
1
51 1 1 1 1 1 1 1 1 1 1 1 1 1
X 1
5
b
j
2 1 2 1 2 2 1 2 1 2 1 2 1 1
0
X
Based on the developed matrix, the criteria graph was built. The number of arcs entering
and exiting each criterion (vertex) of the graph has been calculated. These values are
calculated according to the formulas:
bj = ∑i=1
n+1
gij (3.1)
bi = ∑j=1
n+1
gij (3.2)
where:
bi - number of arcs departing from i-vertex,
bj – number of arcs entering the j-vertex,
gij – elements in G matrix.
Values bj and bj are given in matrix G{15,15} as 16 rows and 16 columns, respectively.
Then, ordering layers was performed by using the global criterion KG (Fig. 1) as a layer 0 of
the graph. It connects to the layer 1 criteria, having one entering arc, i.e. the criteria for which
bj=1 in matrix G (Table 1). The following criteria were found there: K2, K4, K7, K9, K11,
K13, K14. Arranging the next layers, we select the criteria in order, related only to the criteria
above them. Hence, layer 2 graph form K1, K3, K5 and K8, and 3 criteria K6 and K12. The
last 4 layer of the graph is the K10 criterion, from which no arches are departing.
6

Jacek Karpiesiuk46
2.3. Designation of the final set of criteria and their valuesThe elaboration of the criteria graph leads to the designation of the final set, which
contributes to the selection of the most important criteria from all the analyses adopted. To the final set of criteria (FSC) only the ones which are related to the global KG criterion are accepted (underlined in the graph in layer 1), and those whose number of connections in the layer is the largest (layer 2) and these are:
• K1 – Cost of investment for 1 m2 [PLN]• K2 – Cost of investment on small surfaces [PLN]• K3 – Cost of operating the system over a period of 15 years• K5 – Execution time 100 m2 of heating system• K8 – Thermal inertia of the heating system• K9 – Thermal efficiency• K11 – Versatility of installation during renovation or modernization• K14 – Manufacturer’s warrantyThe FSC values for each of the eight heating variants are set out in table 2 based on the
literature data described in section 2 of this article.
Table 2. FSC values of all underfloor heating variants
Criterion*
VariantsK1, d K2, d K3, d K5, d K8, d K9, s K11, s K14, s
Variant 1 215 240 30150 49 5 53.76 1 10
Variant 2 255 215 30150 21 2.5 51.81 3 10
Variant 3 290 260 30150 21 2 71 3 10
Variant 4 370 390 30150 22 2 87 3 10
Variant 5 230 185 30150 21 1 89 5 10
Variant 6 275 245 30150 14 1 130.1 5 10
Variant 7 120 150 38900 49 5 53.76 1 20
Variant 8 190 240 48725 21 1.5 71.38 5 20
*indications for K: d – destimulant, s – stimulant
2.4. Determining the weightings of criteriaCriteria values do not always have the same validity. The decisive indicator of the selec-
tion of the most important and less relevant criteria is the investor’s preference and the expert’s assessment of the field. Such a choice shall be made by establishing the weighting of the criteria, correcting their measurements. The selection process of the scales can be assisted by e.g. pair analysis. It involves the construction of a square matrix consisting of the FSC, which gives the values according to the investor’s preference and the findings of the experts. By summing the rows of the matrix, we get the weight ratio of the criterion in a range from 0-1. The sum of the weights of the criterion always equals 1. Eventually, five sets of weights were adopted so that the most important features of underfloor heating systems can be extracted and these are:

Selection of floor heating systems with use of multi-criteria decision analysis method 47
• Set I – validity of the execution time and universality mounting of the systems;• Set II – validity of the investment cost and thermal efficiency;• Set III – validity of the investment and operation cost;• Set IV – installation of heating on a small area (planned renovation); • Set V – validity of only the investment and operating cost like in III set, omitting
other criteria.In the sets of weights I, II and IV, an analysis of the validity of the vapour was applied. The
values of weights in III and V are highest for investment and operation, with the difference that the other criteria are considered less important in the III set, and in V all others are omitted. This was the reason that I-IV was accepted for the general analysis of all weights sets, and V set was treated as confirming the accuracy of the MCDA calculations. Criteria K1 and K2 relate to the same investment costs. The difference is that K1 weights apply to the whole building and K2 to small surfaces. For this reason, when analysing the whole building, the K2 weights are equal to 0 and, for a small investment (e.g. modernisation), the weight K1 = 0. Finally, the following priorities were identified in line with the number of weights and recorded in table 3.
Table 3. Sets of criteria weights
Variants Set I Set II Set III Set IV Set V
ν1 – weight of criterion K1 0.091 0.3 0.25 0 0.5
ν2 – weight of criterion K2 0 0 0 0.222 0
ν3 – weight of criterion K3 0.091 0.05 0.25 0.056 0.5
ν4 – weight of criterion K5 0.319 0.05 0.1 0.277 0
ν5 – weight of criterion K8 0.091 0.15 0.1 0.056 0
ν6 – weight of criterion K9 0.091 0.25 0.1 0.056 0
ν7 – weight of criterion K11 0.273 0.1 0.1 0.277 0
ν8 – weight of criterion K14 0.044 0.1 0.1 0.056 0
2.5. MCDA selection and encoding of criteria valuesOf the many multiple-criteria analysis algorithms, a corrected summation indicator
was selected to include the weightings of the criteria and not requiring that the coded criteria measures have values greater than zero. It shall be determined from the formula:
Ji = Zij ‧ νj (3)
where:J i – summation corrected (synthetic) indicatorZij – coded measure of the j-criterion for the i-variantνj – weighting of the j-criterionm – number of criteriaThe criteria are sizes with different units of measurement. Therefore, they should be
harmonised by coding these values in order to carry out further calculations. The coding process involves the conversion of values to dimensionless, provided a separate action on the
In the sets of weights I, II and IV, an analysis of the validity of the vapour was applied.
The values of weights in III and V are highest for investment and operation, with the
difference that the other criteria are considered less important in the III set, and in V all others
are omitted. This was the reason that I-IV was accepted for the general analysis of all weights
sets, and V set was treated as confirming the accuracy of the MCDA calculations. Criteria K1
and K2 relate to the same investment costs. The difference is that K1 weights apply to the
whole building and K2 to small surfaces. For this reason, when analysing the whole building,
the K2 weights are equal to 0 and, for a small investment (e.g. modernisation), the weight K1
= 0. Finally, the following priorities were identified in line with the number of weights and
recorded in table 3.
Table 3. Sets of criteria weights
Variants Set I Set II Set III Set IV Set V
ν1 – weight of criterion K1 0.091 0.3 0.25 0 0.5
ν2 – weight of criterion K2 0 0 0 0.222 0
ν3 – weight of criterion K3 0.091 0.05 0.25 0.056 0.5
ν4 – weight of criterion K5 0.319 0.05 0.1 0.277 0
ν5 – weight of criterion K8 0.091 0.15 0.1 0.056 0
ν6 – weight of criterion K9 0.091 0.25 0.1 0.056 0
ν7 – weight of criterion
K110.273 0.1 0.1
0.277 0
ν8 – weight of criterion
K140.044 0.1 0.1
0.056 0
2.5. MCDA selection and encoding of criteria values
Of the many multiple-criteria analysis algorithms, a corrected summation indicator
was selected to include the weightings of the criteria and not requiring that the coded criteria
measures have values greater than zero. It shall be determined from the formula:
Ji = ∑j=1
m
❑ ν‧ j) (6.1)
where:
J i – summation corrected (synthetic) indicator
Zij – coded measure of the j-criterion for the i-variant
νj – weighting of the j-criterion
m – number of criteria
9

Jacek Karpiesiuk48
criteria of stimulants and destimulants. In this article, you have chosen to normalize with the assumption of maximization. It consists of setting the values of the criteria from decreasing to increasing in the range 0 to 1. For this purpose, the following formulas were used:
• for stimulant
zij =
The criteria are sizes with different units of measurement. Therefore, they should be
harmonised by coding these values in order to carry out further calculations. The coding
process involves the conversion of values to dimensionless, provided a separate action on the
criteria of stimulants and destimulants. In this article, you have chosen to normalize with the
assumption of maximization. It consists of setting the values of the criteria from decreasing to
increasing in the range 0 to 1. For this purpose, the following formulas were used:
● for stimulant
zij = xij
x jmax
(6.2)
● for destimulant
zij = xij
'
x jmax
' (6.3)
where
xij
' =
1xij
(6.4)
zij - measure of the i-variant according to the j-criterion
xij – partial measure of criteria from Table 2
x’j max – maximum value of measure j-criterion after maximizing
Using the formulas (6.2) and (6.3), the coded values of all the criteria were calculated and
included in table 4.
Table 4. Coded values of criteria measure for eight heating variants
Criteria
Variants
K1 K2 K3 K5 K8 K9 K11 K14
Destimulant Stimulant
Variant 1 0.558 0.625 1 0.286 0.2 0.413 0.2 0.5
Variant 2 0.471 0.698 1 0.667 0.4 0.398 0.6 0.5
Variant 3 0.414 0.577 1 0.667 0.5 0.546 0.6 0.5
Variant 4 0.324 0.385 1 0.636 0.5 0.615 0.6 0.5
Variant 5 0.522 0.811 1 0.667 1 0.684 1 0.5
Variant 6 0.436 0.612 1 1 1 1 1 0.5
Variant 7 1 1 0.774 0.286 0.2 0.413 0.2 1
Variant 8 0.632 0.625 0.617 0.667 0.67 0.549 1 1
10
(4)
• for destimulant
zij =
The criteria are sizes with different units of measurement. Therefore, they should be
harmonised by coding these values in order to carry out further calculations. The coding
process involves the conversion of values to dimensionless, provided a separate action on the
criteria of stimulants and destimulants. In this article, you have chosen to normalize with the
assumption of maximization. It consists of setting the values of the criteria from decreasing to
increasing in the range 0 to 1. For this purpose, the following formulas were used:
● for stimulant
zij = xij
x jmax
(6.2)
● for destimulant
zij = xij
'
x jmax
' (6.3)
where
xij
' =
1xij
(6.4)
zij - measure of the i-variant according to the j-criterion
xij – partial measure of criteria from Table 2
x’j max – maximum value of measure j-criterion after maximizing
Using the formulas (6.2) and (6.3), the coded values of all the criteria were calculated and
included in table 4.
Table 4. Coded values of criteria measure for eight heating variants
Criteria
Variants
K1 K2 K3 K5 K8 K9 K11 K14
Destimulant Stimulant
Variant 1 0.558 0.625 1 0.286 0.2 0.413 0.2 0.5
Variant 2 0.471 0.698 1 0.667 0.4 0.398 0.6 0.5
Variant 3 0.414 0.577 1 0.667 0.5 0.546 0.6 0.5
Variant 4 0.324 0.385 1 0.636 0.5 0.615 0.6 0.5
Variant 5 0.522 0.811 1 0.667 1 0.684 1 0.5
Variant 6 0.436 0.612 1 1 1 1 1 0.5
Variant 7 1 1 0.774 0.286 0.2 0.413 0.2 1
Variant 8 0.632 0.625 0.617 0.667 0.67 0.549 1 1
10
(5)
where
The criteria are sizes with different units of measurement. Therefore, they should be
harmonised by coding these values in order to carry out further calculations. The coding
process involves the conversion of values to dimensionless, provided a separate action on the
criteria of stimulants and destimulants. In this article, you have chosen to normalize with the
assumption of maximization. It consists of setting the values of the criteria from decreasing to
increasing in the range 0 to 1. For this purpose, the following formulas were used:
● for stimulant
zij = xij
x jmax
(6.2)
● for destimulant
zij = xij
'
x jmax
' (6.3)
where
xij
' =
1xij
(6.4)
zij - measure of the i-variant according to the j-criterion
xij – partial measure of criteria from Table 2
x’j max – maximum value of measure j-criterion after maximizing
Using the formulas (6.2) and (6.3), the coded values of all the criteria were calculated and
included in table 4.
Table 4. Coded values of criteria measure for eight heating variants
Criteria
Variants
K1 K2 K3 K5 K8 K9 K11 K14
Destimulant Stimulant
Variant 1 0.558 0.625 1 0.286 0.2 0.413 0.2 0.5
Variant 2 0.471 0.698 1 0.667 0.4 0.398 0.6 0.5
Variant 3 0.414 0.577 1 0.667 0.5 0.546 0.6 0.5
Variant 4 0.324 0.385 1 0.636 0.5 0.615 0.6 0.5
Variant 5 0.522 0.811 1 0.667 1 0.684 1 0.5
Variant 6 0.436 0.612 1 1 1 1 1 0.5
Variant 7 1 1 0.774 0.286 0.2 0.413 0.2 1
Variant 8 0.632 0.625 0.617 0.667 0.67 0.549 1 1
10
=
The criteria are sizes with different units of measurement. Therefore, they should be
harmonised by coding these values in order to carry out further calculations. The coding
process involves the conversion of values to dimensionless, provided a separate action on the
criteria of stimulants and destimulants. In this article, you have chosen to normalize with the
assumption of maximization. It consists of setting the values of the criteria from decreasing to
increasing in the range 0 to 1. For this purpose, the following formulas were used:
● for stimulant
zij = xij
x jmax
(6.2)
● for destimulant
zij = xij
'
x jmax
' (6.3)
where
xij
' =
1xij
(6.4)
zij - measure of the i-variant according to the j-criterion
xij – partial measure of criteria from Table 2
x’j max – maximum value of measure j-criterion after maximizing
Using the formulas (6.2) and (6.3), the coded values of all the criteria were calculated and
included in table 4.
Table 4. Coded values of criteria measure for eight heating variants
Criteria
Variants
K1 K2 K3 K5 K8 K9 K11 K14
Destimulant Stimulant
Variant 1 0.558 0.625 1 0.286 0.2 0.413 0.2 0.5
Variant 2 0.471 0.698 1 0.667 0.4 0.398 0.6 0.5
Variant 3 0.414 0.577 1 0.667 0.5 0.546 0.6 0.5
Variant 4 0.324 0.385 1 0.636 0.5 0.615 0.6 0.5
Variant 5 0.522 0.811 1 0.667 1 0.684 1 0.5
Variant 6 0.436 0.612 1 1 1 1 1 0.5
Variant 7 1 1 0.774 0.286 0.2 0.413 0.2 1
Variant 8 0.632 0.625 0.617 0.667 0.67 0.549 1 1
10
(6)
zij – measure of the i-variant according to the j-criterionxij – partial measure of criteria from Table 2x’j max – maximum value of measure j-criterion after maximizingUsing the formulas (6.2) and (6.3), the coded values of all the criteria were calculated
and included in table 4.
Table 4. Coded values of criteria measure for eight heating variants
CriteriaVariants
K1 K2 K3 K5 K8 K9 K11 K14Destimulant Stimulant
Variant 1 0.558 0.625 1 0.286 0.2 0.413 0.2 0.5
Variant 2 0.471 0.698 1 0.667 0.4 0.398 0.6 0.5
Variant 3 0.414 0.577 1 0.667 0.5 0.546 0.6 0.5
Variant 4 0.324 0.385 1 0.636 0.5 0.615 0.6 0.5
Variant 5 0.522 0.811 1 0.667 1 0.684 1 0.5
Variant 6 0.436 0.612 1 1 1 1 1 0.5
Variant 7 1 1 0.774 0.286 0.2 0.413 0.2 1
Variant 8 0.632 0.625 0.617 0.667 0.67 0.549 1 1
3. ResultsOn the basis of the data calculated in table 4, taking into account the weightings of the
individual criteria from table 3, the synthetic indicators according to formula (6.1) for the eight underfloor heating variants were calculated and included in table 5.
Table 5. MCDA results of various types of floor heating
Variants Set I Set II Set III Set IV Set VW 1 0.365 0.435 0.549 0.392 0.779W 2 0.605 0.494 0.624 0.634 0.735W 3 0.622 0.529 0.635 0.621 0.707

Selection of floor heating systems with use of multi-criteria decision analysis method 49
Variants Set I Set II Set III Set IV Set VW 4 0.616 0.531 0.622 0.577 0.662
W 5 0.799 0.711 0.766 0.820 0.761
W 6 0.927 0.781 0.809 0.886 0.718
W 7 0.407 0.606 0.653 0.490 0.887
W 8 0.754 0.691 0.701 0.759 0.625
I place W 6 W 6 W 6 W 6 W 7
II place W 5 W 5 W 5 W 5 W 1
III place W 8 W 8 W 8 W 8 W 5
IV place W 3 W 7 W 7 W 2 W 2
4. SummaryThe following conclusions are drawn from the data in table 5:1. The MCDA method has allowed the choice of the most advantageous offer of floor
heating systems in residential buildings and on small surfaces (up to 20 m2) for the renovation or modernization of the premises.
2. After the calculation of the summation corrected indicator Ji, the best variant for all the criteria with accepted weights and the second and third place has been selected. The best underfloor heating system proved to be a lightweight heating system on reactive adhesive without screed with aluminium foil. Second place was taken by the lightweight heating covered with fiberglass mesh-reinforced glue without screed and without lamellas, and in third place was the electric heating system with heating mats placed in the adhesive layer.
3. Traditional water floor heating system, when we take into account the many criteria of its assessment is not a favourable solution. Only after adopting a set of weights that included only the investment and operating costs (V set of weights in Table 5) was this type of heating beneficial, taking second place. The first place was taken by an electric accumulative heating system using cheaper II electricity tariffs. This only confirms the correctness of the MCDA calculations, as both of these systems, are the cheapest in operation and investment when we omit other criteria for evaluating the heating system.
4. Finally, based on the analysis adopted, it was considered that the best variant of under-floor heating, both when laid down in the entire residential house and on small surfaces, is a variant 6 – lightweight heating system on the reactive adhesive without screeds with aluminium lamellas. Also favourable is the lightweight radiant underfloor heat-ing system on the adhesive, reinforced by the fibre mesh layer without screed, taking second MDCA position.
AcknowledgementThe author of the article would like to thank Prof. Walery Jezierski from the Bialystok
University of Technology for his suggestions. The research was carried out as part of my own work from the Bialystok University of Technology No. W/WBIIŚ/15/2019, financed from the subsidy provided by the Ministry of Science and Higher Education.

Jacek Karpiesiuk50
Bibliography[1] Roy B., Wielokryterialne wspomaganie decyzji. WNT, Warszawa 1990.[2] Szwabowski J., Deszcz J., Metody wielokryterialnej analizy porównawczej. Politechnika Śląska,
Gliwice 2001.[3] Yezersky V. A., Monastyrev P. V., Merkusheva N. P., “An instrumental approach to assessing the
consumer qualities of apartments in the real estate market”. Scientific works of RAASN, vol. 2. 2017.C, pp. 169-180.
[4] Nieto-Morote A., Ruz-Vilaa F., “Fuzzy AHP multi-criteria decision-making approach applied to combined cooling, heating, and power production systems”. International Journal of Informa-tion Technology & Decision Making. Vol. 10, No. 03, pp. 497-517, 2011. https://doi.org/10.1142/S0219622011004427
[5] Greco S., Figueira J., EhrgottMultiple M., Criteria Decision Analysis. State of the Art Surveys. Springer, New York, NY, 2016. https://doi.org/10.1007/978-1-4939-3094-4
[6] Thullner K., Low-energy buildings in Europe – standards, criteria and consequences - A study of nine European countries. Avdelningen för installationsteknik. Institutionen för bygg- och miljöteknologi. Lunds tekniska högskola. Lunds Universitet, 2010.
[7] SYSTEM KAN-therm. Floor heating manual. 06/2015-1.2. Available: http://en.kan-therm.com/download/files/en/6-guidebooks/guidebook-surface-heating&cooling-en.pdf [Accessed: 03 Oct 2019]
[8] Technical catalog with prices. Radiant heating and pipes systems Purmo, 08/2019. Available: https://www.purmo.com/docs/katalog-techniczny-z-cenami-ogrzewanie-plaszczyznowe-i-syste-my-rurowe-purmo-08-2019.pdf [Accessed: 03 Oct 2019]
[9] Żukowski M., Karpiesiuk P., “Wyniki badań ogrzewania płaszczyznowego typu B wykonanego w technologii suchej”, Instal, vol. 7/8 (2015), pp. 33-37.
[10] PN-EN 1264-2: 2008+A1:2012, IDT. Water based surface embedded heating and cooling systems - Part 2: Floor heating: Prove methods for the determination of the thermal output using calculation and test methods.
[11] Product catalogue. Insulation systems without screeds. Elektra Kardo, ed 2018. [12] NORDTEST Method NT VVS127: UDC 697.1: Approved 2001-11. Floor heating systems. Design
and type testing of waterborne heat systems for lightweight structures.[13] Elektra, Vademecum. Ed 02/2017.[14] Karpiesiuk J., “Lekki grzejnik powierzchniowy - podsumowanie badań w zakresie inżynierii sani-
tarnej. Strumień ciepła”. Magazyn Instalatora, Dec 2018, no 12(244), pp. 51-53.[15] Rosiński M, Spik Z., “Jak szybko stygnie i nagrzewa się grzejnik podłogowy?”, Polski Instalator,
vol. 03.2006.[16] Designer’s and contractor’s guidebook. Pressure loss tables. SYSTEM KAN – therm, 01. 2015.
Available:http://en.kan-therm.com/download/files/en/6-guidebooks/guidebook-designer&contrac-tor-tables-en.pdf [Accessed: 05 Sep 2019]
[17] Karpiesiuk P., Badania pola temperatury przy ogrzewaniu płaszczyznowym. Graduate engineering work. Faculty of Civil Engineering and Environmental Sciences, Bialystok University of Tech-nology, 2015.
[18] Żukowski M., Karpiesiuk P., “Wyniki badań grzejnika płaszczyznowego o bardzo małej wysokości”, Instal, vol. 10 (2015), pp. 38-41.
[19] Karpiesiuk J., Wydajność cieplna Lekkiego systemu Ogrzewania Płaszczyznowego. GlobeEdit 2019.

Budownictwo i Architektura 18(3) 2019, 51-62 DOI: 10.35784/bud-arch.738
The problem of GNSS positioning with measurements recorded using Android mobile devices
Bogdan Skorupa
Department of Integrated Geodesy and Cartography; Faculty of Mining Surveying and Environmental Engineering;
AGH University of Science and Technology e–mail: [email protected]; ORCID: 0000-0002-2073-1957
Abstract: The current work presents the issue of determining the position of the observer using measurements registered with GNSS (Global Navigation Satellite System) receivers that Android mobile devices are equipped with. The discussed questions concern using GNSS measurement data, which have been made available in the Android system since version 7.0. The present paper has the character of a review. It demonstrates how measurement data can be obtained via Application Programming Interface. Moreover, it discusses the available software that can be for registering measurements and their initial analysis. Subsequently, it reviews scientific works concerning the problem of positioning with the use of smartphones. Special emphasis was placed on tests consisting in an analysis of phase observations registered using dual-frequency receivers. The summary of the article presents the prospects for using mobile devices in precise point positioning. It also points out the limitations to achieving high accuracy and reliability of such measurements.
Keywords: GNSS, Android, positioning
1. IntroductionIn August 2016, Google launched Android version 7.0 Nougat. Beginning with this
version of the system, users of mobile devices equipped with a satellite navigation module gained access to GNSS (Global Navigation Satellite System) observations. Until then, posi-tioning using mobile devices was based on the location calculated by the internal software of the GNSS chipset. The release of GNSS measurements makes it possible to use proprietary calculation algorithms adapted to the limitations of the equipment and to field conditions of positioning. It also provides an opportunity to analyse the acquired GNSS observations outside the recording device, using external software [1], [2].
In 2018, smartphones equipped with dual-frequency GNSS receivers appeared on the mobile devices market. They enable recording of code and phase measurements as well as ephemeris data transmitted by satellites. The availability of two frequencies allows for increasing the accuracy and reliability of positioning by reducing multipath signal error and eliminating the influence of ionospheric refraction [3]. This opens the way to the application of measurement and calculation methods previously reserved for high-precision geodetic methods.
It is anticipated that devices equipped with dual-frequency GNSS chipsets will be used for positioning with an accuracy of single decimetres or even centimetres. This will make it possible to use them in various types of services related to the functioning of the smart city: precise navigation, autonomous vehicles [4] or support for emergency services operations [5].

Bogdan Skorupa52
2. Access to GNSS observations from the programming interfaceIn Android, access to data recorded by the built-in sensors is via the Application Programming
Interface. Launching a new version of the operating system entails the publication of the appropriate version of the API. Until the release of Android version 7.0 Nougat, access to navigation data was via the android.location module containing the GpsSatellite, GPSStatus and Location classes. These classes were used to obtain information about the satellites used in the navigation solution, such as azimuth or horizontal height, as well as calculated values of the location and speed of the GNSS receiver. Starting from API 24, the following classes were added to the android.location module: GNSSClock, GNSSNavigationMessage and GNSSMeasurements [6] (Fig. 1).
Fig. 1. Android API 24 online documentation (Source: https://developer.android.com/guide/topics/sensors/gnss)
Carrier phase measurements and Doppler measurements are available directly by calling the getAccumulatedDeltaRangeMeters() and getPseudorangeRateMetersPerSecond() methods, which belong to the GNSSMeasurements class. For pseudorange, its value should be calculated using intermediate data. The pseudorange equation shall be as follows [8]:
( )r st t cρ = − ⋅ (1)
where c is the speed of light in vacuum, ts is the time the satellite generated the signal, while tr is the time the signal was received by the receiver. The getReceivedSvTimeNa-nos() method of the GNSSMeasurements class gets the epoch of signal generation ts in the form of the total number of nanoseconds [6]. This number is expressed in the time system appropriate for a given satellite constellation. The ts value is calculated from the beginning of the current week for all systems except GLONASS (Globalnaya Navigatsionnaya Sput-nikovaya Sistema), which refers to the beginning of the day. To calculate the measurement time tr, the getTimeNanos() and getFullBiasNanos() methods of the GNSSClock class should be used. The first one gets the clock value t0, expressing the time interval that has passed since the GNSS receiver has started working. The second one, in turn, gets the value of the difference Δt0 between t0 and the GPS (Global Positioning System) time calculated since the first GPS epoch (6.01.1980). The values of t0 i Δt0 are expressed in whole nanose-conds. To include fractional nanoseconds, dt0 and δt0 corrections must be included, returned

The problem of GNSS positioning with measurements recorded using Android mobile devices 53
by GNSSMeasurements.getTimeffsetNanos() and GNSSClock.getBiasNanos() methods respectively. Assuming that the reference time for the GNSS receiver is the time of the GPS system, the equation is as follows:
0 0 0 0( ) ( )GPSt t dt t tδ= + − ∆ + (2)
The equation (2) expresses the measurement epoch as the number of nanoseconds that have elapsed since the first epoch of the GNSS receiver reference time. Subsequently, the measurement epoch is related to the beginning of the week or the beginning of the day, taking into account the differences between the time system in which the GNSS receiver works and the time system of the observed satellite. Thus, the measurement epoch expressed in seconds, related to the beginning of the week of GPS or Galileo time will be calculated with the following formula:
9 mod 604800
10GPS
rt
t =
(3)
for the Beidou system
9 mod 604800 14
10sGPS
rt
t = +
(4)
while for the GLONASS system
9 mod 86400 10800
10sGPS
r st
t l = + + .
(5)
In equation (5), ls denotes a leap second. Since 2018 ls = 16s.An important limitation in the use of observations obtained using mobile devices is the
problem of the so-called “duty cycle.” It is a way to save energy. It involves turning satellite tracking by the GNSS chipset on and off for 0.2s and 0.8s, respectively. This leads to the so-called “cycle slips”, making it difficult or impossible to resolve cycle ambiguity in GNSS phase measurements [5]. Starting from Android version 9.0, it is possible to disable the “duty cycle” from the API level [7].
3. Software for obtaining measurement dataCurrently, there are a number of applications that enable the acquisition of observational
data from mobile devices. However, not all devices equipped with the appropriate Android version make it possible to obtain GNSS measurement data. The type of data also varies depending on the device model (Table 1).
Table 1 Availability of GNSS measurement data for selected smartphone models. (Source: https://developer.android.com/guide/topics/sensors/gnss)
Device model
Android system version
Navigation message
Receiver clock
reading
Phase measurement
Availability of L5
Supported satellite systems
Xiaomi Mi8 8.1 yes yes yes yesGPS GLONASS Galileo Beidou
QZSS

Bogdan Skorupa54
Device model
Android system version
Navigation message
Receiver clock
reading
Phase measurement
Availability of L5
Supported satellite systems
Huawei P10 7.0 yes yes yes noGPS GLONASS Galileo Beidou
QZSSSamsung
Galaxy S10 9.0 no yes no no GPS GLONASS Galileo
LG G7 ThinQ 8.0 no yes no no GPS GLONASS
Google provides the GNSSLogger application for recording observational data and software for analysing the acquired data called GNSS Analysis app. These tools are available with the source code via the GitHub repository, as part of the GPS Measurement Tools [9] project. GNSSLogger application (Fig. 2) saves code and phase observations to a text file in the format specified in the project documentation [9]. Currently, the application does not provide navigation data. The software also allows user to make basic analyses directly on the smartphone screen, such as:
– calculation of the location in real time using the method of least squares,– visualisation of the difference between the location calculated by the application and
that determined directly by the internal software of the GNSS chipset, along with its presentation on Google maps,
– GNSS signal strength chart,– residual plots, related to the location indicated by the user, or the average location
determined by the GNSS chipset.
Fig. 2. Screenshots of the GNSSLogger software (Source: own study)

The problem of GNSS positioning with measurements recorded using Android mobile devices 55
Observation data collected using the GNSSLogger application can be further analysed using the GNSS Analysis Tools set run on a desktop computer equipped with the Windows, Linux or Mac OS operating system. They are a set of MATLAB scripts, which can be executed in the MATLAB Runtime environment, available free of charge from MathWorks. GNSS Analysis Tools allows for interactive control of software operation parameters. The settings are: selection of the analysed satellites, setting the start and end time of the analysis, enabling/disabling modelling of ionospheric and tropospheric refraction, and choosing the method of determining the reference position used to calculate clock errors and the residu-als for individual satellites. The software creates a number of plots for selected parameters (Fig. 3), including i.e.:
– the time plot of C/N0 (Carrier to Noise ratio) of all available satellites,– zenithal projection showing the distribution of satellites above the horizon of the test
point,– pseudorange values as a function of time,– graph of location components calculated with the method of least squares, related to
the average location or the location defined by the user,– pseudorange residual plot.
Fig. 3. Screenshots of GNSS Analysis Tools (Source: [10])
An interesting option offered by the application is a comparative analysis based on log files registered by GNSSLogger. Details on the installation and use of GNSS Analysis Tools software can be found in the manual [10]. A certain deficiency of GNSS Analysis Tools is the inability to save measurement data in the commonly used RINEX (Receiver Independent Exchange Format) data format [11]. This conversion is possible with Python scripts, provided by Rokubun in the GitHub repository [12]. These tools enable the conversion of GNSSLogger logs to the RINEX v. 3.0 format. Saving data in the RINEX format allows users to analyse observations with commonly used, free programmes such as RTKLib [13] and GLab [14], or commercial software [15].

Bogdan Skorupa56
Direct recording of measurement data in RINEX format is enabled by Geo++ RINEX Logger [16] and RinexOn applications from NSL (Nottingham Scientific Limited) [17]. Both programmes are available free of charge on Google Play. The application offered by Geo++ (Fig. 4a) enables recording of measurement data of GPS, GLONASS, Galileo, Beidou and QZSS (Quasi-Zenith Satellite System) systems. Supported frequencies are L1, L5, E1B, E1C, E5A. Users can choose to save data in RINEX 2.1 or 3.03 format. The data is saved in the device’s internal memory in the Geopp_Rinex_logger folder, according to the RINEX file naming convention. The user has the option of setting information entries in the heading of the observation set. This includes, but is not limited to, the name of the test point, receiver and antenna type, and their numbers. One-hour sessions can be saved in individual files or appended to the recently created RINEX file. The programme does not output files with navigation data. This option is provided by RinexOn (Fig. 4b). This software creates navigation and observation files (GPS, GLONASS and Galileo) in the RINEX 3.03 format. RinexOn also has many more additional functions, such as: visualisation of the position of satellites, signal strength graphic, visualisation of the current position on Google Maps.
Fig. 4. Screenshots of a) Geo++ RINEX Logger, b) RinexOn application (Source: own study)
Manufacturers of Geo++ RINEX Logger and RinexOn do not provide source codes. An interesting programme which is available together with the source code and detailed docu-mentation is GNSS Compare (Fig. 5). It was created by young programmers cooperating as Galfins Team [18]. The application won the Galileo Smartphone App Challenge, organised by ESA (European Space Agency) in 2017.
a) b)
a) b)

The problem of GNSS positioning with measurements recorded using Android mobile devices 57
Fig. 5. Screenshots of the GNSS Compare application (Source: [18])
GNSS Compare was created for engineers and developers of navigation software as a tool for testing algorithms and hardware solutions. The position of the receiver can be calculated based on GPS, Galileo or GPS + Galileo code observations. The least squares or extended Kalman filter algorithms are available for calculating location. The programme does not support RINEX format, but outputs observation data in its own text format. The graphical interface provides visualisation of GNSS signal strength and location of the device on Google Maps. In addition, the programme presents the differences between the location determined by the GNSS chipset and that calculated on the basis of GNSS measurement data. External libraries, GoGPS [19], EJML (Efficient Java Matrix Library) [20] and GNSS Logger [9], were used in developing the software.
4. Review of published experimental worksSince the release of API 24, numerous works have been published containing descriptions
of measurement tests and calculation experiments. They are intended to determine the degree of usability of the available GNSS measurement data. The use of phase methods, which were previously reserved for professional satellite receivers, is particularly interesting.
The work [5] describes a measurement experiment carried out using a Xiaomi Mi8 smart-phone equipped with a Broadcom BCM47755 chipset that enables measurement on two frequencies: L1 and L5 for GPS and E1 and E5a for Galileo. The measurements were carried out at two points, one of which provided good measurement conditions, while the other was surrounded by tall buildings. The observations were recorded in a one-hour session, with a one-second recording interval, using RinexOn. Measurements were analysed using RTKLib software, in relation to the nearest permanent station. Static sessions were analysed only for the L1 frequency of the GPS system because the reference station did not record L5 and E5a
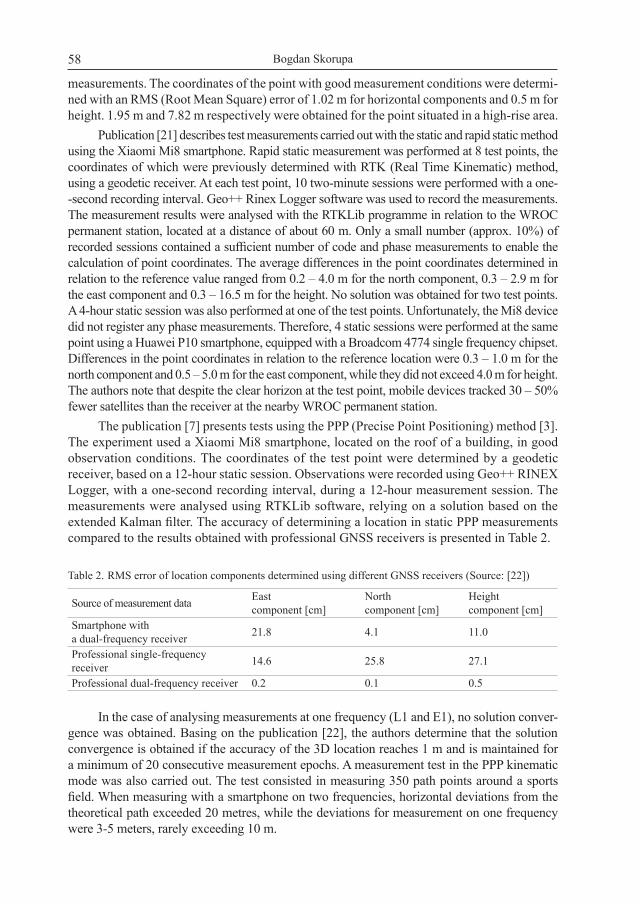
Bogdan Skorupa58
measurements. The coordinates of the point with good measurement conditions were determi-ned with an RMS (Root Mean Square) error of 1.02 m for horizontal components and 0.5 m for height. 1.95 m and 7.82 m respectively were obtained for the point situated in a high-rise area.
Publication [21] describes test measurements carried out with the static and rapid static method using the Xiaomi Mi8 smartphone. Rapid static measurement was performed at 8 test points, the coordinates of which were previously determined with RTK (Real Time Kinematic) method, using a geodetic receiver. At each test point, 10 two-minute sessions were performed with a one--second recording interval. Geo++ Rinex Logger software was used to record the measurements. The measurement results were analysed with the RTKLib programme in relation to the WROC permanent station, located at a distance of about 60 m. Only a small number (approx. 10%) of recorded sessions contained a sufficient number of code and phase measurements to enable the calculation of point coordinates. The average differences in the point coordinates determined in relation to the reference value ranged from 0.2 – 4.0 m for the north component, 0.3 – 2.9 m for the east component and 0.3 – 16.5 m for the height. No solution was obtained for two test points. A 4-hour static session was also performed at one of the test points. Unfortunately, the Mi8 device did not register any phase measurements. Therefore, 4 static sessions were performed at the same point using a Huawei P10 smartphone, equipped with a Broadcom 4774 single frequency chipset. Differences in the point coordinates in relation to the reference location were 0.3 – 1.0 m for the north component and 0.5 – 5.0 m for the east component, while they did not exceed 4.0 m for height. The authors note that despite the clear horizon at the test point, mobile devices tracked 30 – 50% fewer satellites than the receiver at the nearby WROC permanent station.
The publication [7] presents tests using the PPP (Precise Point Positioning) method [3].The experiment used a Xiaomi Mi8 smartphone, located on the roof of a building, in good observation conditions. The coordinates of the test point were determined by a geodetic receiver, based on a 12-hour static session. Observations were recorded using Geo++ RINEX Logger, with a one-second recording interval, during a 12-hour measurement session. The measurements were analysed using RTKLib software, relying on a solution based on the extended Kalman filter. The accuracy of determining a location in static PPP measurements compared to the results obtained with professional GNSS receivers is presented in Table 2.
Table 2. RMS error of location components determined using different GNSS receivers (Source: [22])
Source of measurement data East component [cm]
North component [cm]
Height component [cm]
Smartphone with a dual-frequency receiver 21.8 4.1 11.0
Professional single-frequency receiver 14.6 25.8 27.1
Professional dual-frequency receiver 0.2 0.1 0.5
In the case of analysing measurements at one frequency (L1 and E1), no solution conver-gence was obtained. Basing on the publication [22], the authors determine that the solution convergence is obtained if the accuracy of the 3D location reaches 1 m and is maintained for a minimum of 20 consecutive measurement epochs. A measurement test in the PPP kinematic mode was also carried out. The test consisted in measuring 350 path points around a sports field. When measuring with a smartphone on two frequencies, horizontal deviations from the theoretical path exceeded 20 metres, while the deviations for measurement on one frequency were 3-5 meters, rarely exceeding 10 m.

The problem of GNSS positioning with measurements recorded using Android mobile devices 59
5. SummaryAccess to code and phase observations offers new perspectives for the use of mobile
devices in precise positioning. The possibility of using phase measurements on two frequencies is particularly important. However, the currently obtained accuracy differs significantly from what professional geodetic-class receivers offer. In addition, the reliability of measurements leaves much to be desired, especially when they are taken at a point surrounded by field obstac-les. Smartphone GNSS antennas use linear polarisation, showing susceptibility to multipath effects [5], [7]. In addition, the characteristics of phase centre variation of antennas used in mobile devices have not yet been determined. This is important when analysing differential measurements taken using different types of GNSS antennas. For this reason, it would be interesting to conduct differential phase measurements, recording them with identical devices. In this case, the effect of phase centre variation should be significantly reduced. As the authors of the quoted papers [7] [23] observe, measurements using smartphones are characterised by frequent occurrence of the so called “cycle slips.” This problem has been the subject of nume-rous publications describing effective methods of detection and repair of “cycle slips” [24], [25] [26]. It should be borne in mind, however, that the use of advanced methods of detection and repair of cycle slips can lead to a significant increase in calculation time. Therefore, there is a need to create new algorithms to capture this problem, especially at the stage of an initial analysis of GNSS data. Intensive research work carried out in many scientific centres will probably lead to a significant improvement in the methods of positioning with smartphones. This will allow for a certain range of measurement tasks that previously required the use of expensive professional GNSS receivers to be taken over by smartphones. In addition, it is worth paying attention to the alternative possibilities of using smartphones, partly resulting from their additional equipment, enabling communication via Internet connections. The paper [27] indicates the possibility of using two-frequency phase measurements recorded by smart-phones to monitor the phenomenon of ionospheric refraction. This is one of the basic tasks of the GNSS permanent station network. Determination of refractive corrections is the core of algorithms for calculating differential corrections in RTN (Real Time Network) measurement systems made available to users [28].
In the coming years, we can expect rapid development of algorithms and measuring techniques adapted to the specifics of mobile devices. This will probably be due to the wide-spread availability of smartphones and great interest from scientific and research centres as well as potential users of such solutions.
6. Acknowledgements
This publication was prepared under the research subsidy no. 16.16.150.545.
References [1] Realini E. et al., “Precise GNSS Positioning Using Smart Devices”, Sensors, vol. 17 (2017), .
https://doi.org/10.3390/s17102434[2] Lachapelle G. et al., “Evaluation of a Low Cost Hand Held Unit with GNSS Raw Data Capability
and Comparison with an Android Smartphone”, Sensors, vol. 18 (2018). https://doi.org/10.3390/s18124185
[3] Hofmann-Wellenhof B. et al., GNSS – Global Navigation Satellite Systems: GPS, GLONASS, Galileo & more, Vienna: Springer-Verlag, 2008.

Bogdan Skorupa60
[4] Maciuk K., “The application of GNSS system in logistics”, Budownictwo i Architektura, vol. 17 (2018), pp. 181-188. https://doi.org/10.24358/Bud-Arch_18_173_13
[5] Robustelli U., Baiocchi V., Pugliano G., “Assessment of Dual Frequency GNSS Observations from a Xiaomi Mi 8 Android Smartphone and Positioning Performance Analysis”, Electronics, vol. 8 (2019). https://doi.org/10.3390/electronics8010091
[6] White Paper on using GNSS Raw Measurements on Android devices. Prague, Czech Republic: European GNSS Agency, 2017. https://doi.org/10.2878/449581
[7] Wu Q. et al., “Precise Point Positioning Using Dual-Frequency GNSS Observations on Smart-phone”, Sensors, vol. 19 (2019). https://doi.org/10.3390/s19092189
[8] Seeber G. Satellite Geodesy. Berlin, New York: Walter De Gruyter, 2003.[9] “GPS Measurement Tools”. Available: https://github.com/google/gps-measurement-tools [Acces-
sed: 11 September 2019][10] GNSS Analysis Tools Installation Instructions and User Manual v. 2.6.3.0, 18.09.2018. Availa-
ble: https://github.com/google/gps-measurement-tools/releases/download/V2.6.3.0 [Accessed: 11 September 2019]
[11] “The Receiver Independent Exchange Format”. Available: ftp://igs.org/pub/data/format/rinex303.pdf [Accessed: 11 September 2019]
[12] “Rokubun”. Available: https://github.com/rokubun/android_rinex. [Accessed: 13 September 2019][13] Wiśniewski B., Bruniecki K., Moszyński M., “Evaluation of RTKLIB’s Positioning Accuracy Using
low-cost GNSS Receiver and ASG-EUPOS”, International Journal of Marine Navigation and Safety of Sea Transportation, vol. 7 (2013), pp. 79-85. http://dx.doi.org/10.12716/1001.07.01.10
[14] Hernandez-Pajeras M. et al., “The ESA/UPC GNSS-Lab Tool (gLAB): An advanced multipurpose package for GNSS data processing”, in 5th ESA Workshop on Satellite Navigation Technologies and European Workshop on GNSS Signals and Signal Processing, Noordwijk 2010, 2010. http://dx.doi.org/10.1109/NAVITEC.2010.5708032
[15] Khaled M., Abdel M., “Comparison of GPS Commercial Software Packages to Processing Static Baseline up to 30 km”, ARPN Journal of Engineering and Applied Sciences, vol. 10 (2015), pp. 10640-10650.
[16] “Geo++ RINEX Logger”. Available: http://www.geopp.de/logging-of-gnss-raw-data-on-android. [Accessed: 11 September 2019]
[17] “Nottingham Scientific Limited”. Available: https://www.flamingognss.com/rinexon [Accessed: 17 September 2019]
[18] “Galfins Team”. Available: https://gnss-compare.readthedocs.io/en/latest/team.html [Accessed: 17 September 2019]
[19] “GoGPS Project”. Available: http://www.gogps-project.org [Accessed: 11 September 2019][20] “Efficient Java Matrix Library”. Available: https://ejml.org [Accessed: 11 September 2019][21] Wielgocka N., Hadaś T., „Czy to już możliwe?” Geodeta , vol. 4 (2019), pp. 8-12.[22] Li P., Zhang X., “Integrating GPS and GLONASS to accelerate convergence and initialization times
of precise point positioning”, GPS Solution, vol. 18 (2014), pp. 461-471. https://doi.org/10.1007/s10291-013-0345-5
[23] Gogoi N. et al., “A Controlled-Environment Quality Assessment of Android GNSS Raw Measu-rements”, Electronics, vol. 8 (2019). https://doi.org/10.3390/electronics8010005
[24] Xu G., GPS Theory, Algorithms and Applications. Berlin Heidelberg New York: Springer, 2007.[25] Liu Z., “A new automated cycle slip detection and repair method for a single dual-frequency GPS
receiver”, Journal of Geodesy, vol. 85 (2011), pp. 171-183. https://doi.org/10.1007/s00190-010-0426-y[26] De Lacy M. C. et al., “The Bayesian detection of discontinuities in a polynomial regression and
its application to the cycle-slip problem”, Journal of Geodesy vol. 82 (2008), pp. 527–542. https://doi.org/10.1007/s00190-007-0203-8

The problem of GNSS positioning with measurements recorded using Android mobile devices 61
[27] Pankratius V. et al., “Mobile crowd sensing in space weather monitoring: the mahali project”, IEEE Communications Magazine, vol. 52 (2014), pp. 22-28. https://doi.org/10.1109/MCOM.2014.6871665
[28] Wei E. et al., “VRS Virtual Observations Generation Algorithm”, Journal of Global Positioning System, vol. 5 (2006), pp. 76-81. https://doi.org/10.5081/jgps.5.1.76


Budownictwo i Architektura 18(3) 2019, 63-72 DOI: 10.35784/bud-arch.890
Interpretation of CPT and SDMT tests for Lublin loess soils exemplified by Cyprysowa research site
Krzysztof Nepelski
Department of Geotechnical Engineering, Faculty of Civil Engineering and Architecture, Lublin University of Technology, e–mail: [email protected], ORCID: 0000-0001-9495-6457
Abstract: This paper presents an example of interpretation of in situ tests, CPT static sounding and seismic Marchetti dilatometer tests (SDMT). The studies were carried out on loess soils in Lublin. Four CPT tests and four SDMT seismic tests were performed. The article describes the method of deriving geotechnical parameters from in situ testing. In particular, the formulas for calculating the constrained modulus based on the cone resistance qc were analysed. Some of the parameters were interpreted using the proposed formulas. Values of deformation parameters determined with various methods for different strain ranges were compared.
Keywords: CPT, SDMT, loess, constrained modulus
1. IntroductionTo analyse the building-subsoil interaction, soil conditions as well as their variability and
parameters must be identified. Boreholes are the basic and most widely used research method in the world, since they provide information about the type of soil found in the ground and its main characteristics. It allows for identifying stratigraphic and lithological divisions, which is the basis for developing a sampling plan for laboratory tests. Soil behaviour is complex and depends on numerous factors; therefore, different types of tests should be used when evaluating a geotechnical model and determining strength and deformation characteristics. A geotechnical profile should show separate layers with similar mechanical properties. For this reason, in-situ sounding has an important role in the identification process.
Fig. 1. Location of test points

Krzysztof Nepelski64
This paper presents an example of interpretation of in situ tests, CPT static sounding and seismic Marchetti dilatometer tests (SDMT). The research was carried out on loess soils in the area of Cyprysowa Street in Lublin. The location of test points is shown in Fig. 1. The study involved four CPT tests and four SDMT dilatometer tests with seismic shear wave velocity measurements.
2. Cone Penetration Tests (CPT)CPT tests were performed using the Pagani T63-150 with a maximum pull-down force
of 150 kN. A Begemann mechanical cone was used during the tests. It was pressed at a speed of 2 cm/s, with penetration characteristics recorded every 20 cm. Although a mechanical cone provides less information than a cone with electrical sensors, studies [1] have shown that in the case of typical loess soils, the differences in cone resistance qc are low. The values taken during the test are cone resistance and friction on the friction sleeve. The cone that was used had standard geometry: base surface of 10 cm2, friction sleeve surface of 150 cm2, and cone tip angle of 60°. All test parameters were in accordance with the standards defining the conditions of static sounding [2]–[4].
The readings recorded during the tests provided the basis for their subsequent interpreta-tion. In order to interpret the data and determine the geotechnical parameters of the soil layers distinguished in the subsoil, the data was presented with the use of standard parameters: qc – cone resistance, fs – friction on the friction sleeve, and Rf – friction ratio, used for classifying soil by soil behaviour type.
To identify the subsoil structure, the Robertson nomogram was used, modified and adapted to the Polish conditions by Młynarek et al. [5], as well as information obtained from the test boreholes. The data from drilled boreholes were used as the leading data for the identification of soil type. The interpretation and analysis of soundings is widely described in the literature and has been compiled by Sikora [6]. The results of the sounding were used to determine soil parameters. The liquidity index IL was derived using the formula by Nepelski et al. [7]:
0.76 0.17= −L cI q (1)Undrained shear strength cu was determined in accordance with Eurocode 7 standards
[3] and PN-B-04452 [4], using the following formula:
0( )σ−= c v
ukt
qc
N (2)where σv0 is the geostatic stress at the measurement level qc, and Nkt is the empirical
coefficient taken depending on the type of soil. A coefficient of Nkt=40 was adopted for loess soils based on Frankowski’s research [8].
The constrained modulus M was determined in accordance with the Eurocode 7 [3]. According to the aforesaid standard, the constrained modulus is determined by Sanglerat’s relationship [9] using the following formula:
α= m cM q (3)The essence of the correct estimation of constrained modulus is the adoption of an appro-
priate empirical coefficient αm. Sanglerat [9] proposes using the αm coefficient in the range of 1÷8, depending on the type of soil and cone resistance. For stiffer soils, lower values are assumed. A similar formula is put forward by Ciloglu [10], according to whom αm should be

Interpretation of CPT and SDMT tests for Lublin loess soils exemplifi ed by Cyprysowa research site 65
within the range of 3.1÷13.5, depending on the plasticity index and the content of fi ne-grained fractions. A slightly adjusted dependency in the following form:
0( )α σ= −m t vM q (4)is put forward by Senneset [11], where αm is assumed within the range of 5÷15 for
overconsolidated soils and 4÷8 for normally consolidated soils. A different correlation that assumes a constant αm coeffi cient is put forward by Kulhawy and Mayne [12]:
08.25( )σ= −t vM q (5)Młynarek and Wierzbicki used this relationship for loess soils from the Łańcut area
([13], [14]). Frankowski [15] determined a coeffi cient of αm=2.5 for formula (3) for loess soils from the Kazimierz Dolny area. This result was obtained from calculations in which the constrained modulus was determined from oedometer tests. According to the stiffness degra-dation curve [16], oedometer tests correspond to high plastic deformations, i.e. conditions that differ signifi cantly from those found under typical foundations. The work of subsoil under typical foundations is far from the critical state, therefore oedometric constrained moduli are not suitable for the calculation of building settlements. Taking into account the aforesaid data taken from the literature and the results of the performed analyses, it was decided to adopt the formula (3) with the αm=6 coeffi cient for loess soils. In [17] it was proved with numerical analyses and geodetic measurements that it is a correct value.
The original substrate deformation modulus E0.CPT was determined according to Pisarczyk’s recommendations [18] using the following formula:
0. 3.8 2.5= +CPT cE q MPa (6)A short comparative analysis of the deformation parameters interpreted from static
soundings was carried out. The constrained modulus calculated using Sanglerat’s formula (3) with the coeffi cient αm=6, denoted as MCPT[1], was compared with the deformation modulus E0.CPT found using formula (6) and recalculated to constrained modulus marked as MCPT[2] using the following formula:
( ) ( )( )
1 1 21
+ −=
−
v vE M
v (7)where M is the constrained modulus, and ν is the Poisson ratio. The comparison is illustrated in Fig. 2.
Fig. 2. Comparison of constrained moduli interpreted from CPT static tests using different formulas

Krzysztof Nepelski66
It shows that the constrained moduli found with both formulas obtain very similar results for the cone resistance range of qc, which is typical for Lublin loess soils. For the mean cone resistance value for loess soils, i.e. qc of approx. 6.5 MPa [19], the constrained modulus MCPT
found with both formulas is about 39 MPa. For qc<6.5 MPa, the modulus determined using Sanglerat’s relationship has lower values than the one determined on the basis of the E0.CPT
modulus, whereas for qc>6.5 MPa it is the other way around. For a typical range of cone resistance for loess soils of qc=3÷9 MPa, the MCPT[1]/MCPT[2] ratio is from 0.9 for qc=3 MPa to 1.03 for qc=9 MPa, which means that in the case of stiffer loess soils the differences are so low that the choice of formula used is insignifi cant. For softer loess soils, however, the difference is greater and increases as the qc value decreases. More unfavourable parameters will be obtained with the use of Sanglerat’s formula (3).
The basic parameters of the selected CPT-1 test are shown in the diagrams in Fig. 3. The division into subsoil layers was made on the basis of soil classifi cation and sounding characteristics. In a continuous profi le, with characteristics described every 20 cm, layers with representative parameters determined on the basis of cone resistance were distinguished. The mean value of cone resistance for a given layer was taken as the representative value. Extremely high values were rejected. The division into layers is shown only in the basic parameter charts.
Fig. 3. CPT-1 test parameters
To summarise the CPT profi les, it was found that for the investigated area, loess soils under building foundations are characterised by cone resistances qc in the range of 4.6÷8.1 MPa, with a mean value of 5.3 MPa. The obtained values show that loess soils in this area can be considered solid load-bearing subsoil that is representative for the Lublin area. Furthermore, for the obtained qc range, the differences in the constrained moduli determined using the adopted formulas as presented in Fig. 2. are negligible.
3. Seismic Marchetti Dilatometer Tests (SDMT)Seismic Marchetti dilatometer tests SDMT were carried out in cooperation with the
Department of Geotechnical Engineering of the Warsaw University of Life Sciences and using the equipment provided by that unit. The tests were carried out using a Van der Berg Hyson 200 kN probe. A standard Marchetti dilatometer consists of a fl at, steel blade with a circular, fl exible membrane, and a measuring/control unit with pressure readout. During the test, the blade is pressed vertically into the ground, and then measurements are taken at intervals of

Interpretation of CPT and SDMT tests for Lublin loess soils exemplified by Cyprysowa research site 67
0.2 m (sometimes 0.1 or 0.5 m). During the measurements, gas pressure is applied to the membrane from the ground level by means of a pneumatic line. During this operation, the membrane deforms towards the ground and readings A and B are taken. Reading A is the gas pressure value obtained during the initial phase of membrane movement (displacement of the membrane centre by 0.05 mm), which causes it to come into contact with the surrounding soil. Reading B is the pressure value obtained with an additional displacement of the membrane centre towards the ground by approx. 1.05 mm, for a total of 1.1 mm. A third reading C is sometimes taken, corresponding to the gas pressure after the return of the membrane to its initial position. The readings are adjusted by corrections ΔA and ΔB, which result from the rigidity of the membrane. The dilatometer used in the study was additionally equipped with a seismic module to measure the shear wave velocity. The seismic module is placed on a rod directly behind the DMT measuring blade and consists of two geophones positioned 0.5 m apart, which are used as receivers for measuring the shear wave generated during the test. Shear wave velocity is usually measured at depth intervals of 0.5 m. The wave, generated by a hammer hitting an anvil pressed against the ground, first reaches the upper receiver and then the lower one. The movement of ground particles which occurs with shear wave propagation corresponds to very small deformations of the subsoil. The shear wave propagation velocity is the basis for determining the initial shear modulus [20]–[22].
The interpretation of dilatometer tests is based on three basic indexes: material index ID, horizontal stress index KD and dilatometer modulus ED. These indexes are determined as follows:
1 0
1 0
( )( )
−=
−D
p pI
p u (7)0 0
0
( )'σ−
=DV
p uK
(9)1 034.7( )= −DE p p (10)
where:p0 – the pressure of membrane’s contact with the ground,p1 – the pressure of membrane displacement by 1.1 mm,u0 – hydrostatic pore water pressure,σ’v0 – effective vertical stress in situ.The material index is primarily used to determine the type of soil. Generally speaking,
ID=1.8 is the boundary between cohesive and non-cohesive soils. Fine-grained (cohesive) soils have a lower ID, while coarse-grained (non-cohesive) soils have a higher ID. Just like the Rf index in the case of CPT tests interpretation, the material index ID from DMT tests determines the behaviour of the soil and does not classify it on the basis of grain size as assumed in the standards. For the studied loess soils, the ID index showed the same behaviour as in the case of sandy soil.
The horizontal stress coefficient KD is used to determine undrained shear strength cu and to determine the lateral earth pressure coefficient K0. In accordance with the Marchetti’s rela-tionship, the undrained shear strength cu.DMT and the lateral earth pressure coefficient K0 were determined from the following formulas:
( )1.25. 00.22 ’ 0, 5 σ=u DMT V Dc K (11)

Krzysztof Nepelski68
0.470. ( /1.5) - 0.6=DMT DK K (12)
The dilatometer modulus ED determines the relationship between the stress acting on the membrane and its displacement. This module, however, cannot be used for direct calculations of settlements, but only reflects the stiffness of the ground and can be used for calculations after taking into account the history of lateral stress, denoted by the KD index. For determin-ing the settlement, the dilatometer constrained modulus MDMT calculated using the Marchetti formula [21] is used:
=DMT M DM R E (13)Another important parameter is the overconsolidation ratio OCR, which was determined
using the Marchetti [21] formula, later expanded by Mayne and Martin [23] into the following form:
1.56(0, 5 )=DMT DOCR K for soils with a material index of ID<1.2, (14)( )= n
DMT DOCR mK for soils with a material index of 1.2<ID<2.0, (15)where:
0.5 0.17 ,1.56 0.35 ,( 1.2) / 0.8,
= += += −D
m pn pp I
1.91(0.67 )=DMT DOCR K for soils with a material index of ID>2.0. (16)Currently, for clay soils, i.e. those with a material index of ID<1.2, there are also numerous
other expanded versions of the original Marchetti formula, which primarily take into account the type of soil and regional conditions. On the other hand, for silty and, in particular, sandy soils, i.e. soils with ID>1.2, the determination of OCR is much more complicated and most often it is connected with cone resistance qc [24], therefore it additionally requires CPT static sounding.
The friction angle for non-cohesive soils with a material index of ID>1.8 was determined using the following formula:
228 14.6 log 2.1logϕ = + −DMT D DK K (17)The initial shear modulus G0, derived from the formula, was also determined from
seismic tests:2
0 ρ= sG V (18)where:ρ – density of the soil,Vs – shear wave velocity measured during the SDMT test.These interpretations are mainly based on formulas originally developed and recom-
mended by Marchetti, first published in 1980 and updated from time to time [21], [24], [25]. Currently, in addition to the basic interpretations, there are a number of relationships derived by other researchers for soils from various parts of the globe. In Poland, Lechowicz et al. [20], [26] Rabarijoely [27], and Młynarek and Wierzbicki [14], [28] conducted large-scale analyses of the interpretation of dilatometer test results.
The basic parameters for the selected SDMT-2 tests are shown in Fig. 4, while Fig. 5 shows a representative diagram of the shear wave velocity recorded at a depth of 4.5 m during the

Interpretation of CPT and SDMT tests for Lublin loess soils exemplified by Cyprysowa research site 69
SDMT-2 test. The signal reaching the upper receiver is marked in blue and the signal reaching the lower receiver is marked in red. The graphs on the left show the signals recorded directly, while the re-phased signals are shown on the right.
Fig. 4. Results of SDMT-2 tests at the Cyprysowa site
Fig. 5. Shear wave seismogram during SDMT-2 tests at a depth of 4.5 m
Dilatometer tests, like the results of static soundings, are the basis for distinguishing geotechnical layers and describing their parameters. The main parameter used in the analyses is the dilatometer modulus MDMT. For the area in question, this parameter varies in the most of the profile within the limits of 30÷70 MPa, which should be considered a relatively high value. The constrained moduli determined in DMT tests were slightly higher than those determined during CPT static probing. The initial shear modulus G0 determined in SDMT seismic tests ranged from 150 to 200 MPa.
4. ConclusionsIn-situ tests provide a lot of information with regard to subsoil parameters and the distribu-
tion of soil stiffness at depth. In field tests, several selected parameters are usually measured and then converted into geotechnical parameters, e.g. internal friction angle, constrained modulus, undrained shear strength, etc., using empirical formulas. Since the most important parameters are not determined directly, it is extremely important to properly interpret the results measured directly on-site. The paper presents selected results and methods of interpretation of a CPT static test and SDMT tests performed on Lublin loess soils. The determined parameters can be used to analyse the building-subsoil interaction and to construct a computational model, e.g. in the form of geotechnical cross-sections or computational regions. The analysed loess silts are intermediate soils with features of both cohesive and non-cohesive soils. They have low cohesiveness and the appearance of cohesive soils in macroscopic terms, but both the Rf index from CPT static probing and the ID index from DMT tests indicate behaviour that is characteristic of non-cohesive soils.
References[1] Nepelski K. et al., “Comparative analysis of the CPT results obtained with the use of electric and
mechanical penetrometer cone”, Proceedings of the XVII ECSMGE-2019, (2019). https://doi.org/10.32075/17ECSMGE-2019-0877

Krzysztof Nepelski70
[2] PN-EN ISO 22476-12, Geotechnical investigation and testing - Field testing - Part 12: mechanical cone penetration test (CPTM), 2013.
[3] PN-EN 1997-2, Eurocode 7: Geotechnical design. Part 2: Ground investigation and testing, 2009.[4] PN-B 04452, Geotechnica. Field Testing, 2002.[5] Młynarek Z. et al., “Soil classification by means of CPTU” in Proceedings of XI Polish Conference
on Soils Mechanics and Foundation Engineering, Gdańsk, 1997, pp.119-126[6] Sikora Z., Sondowanie statyczne: metody i zastosowanie w geoinżynierii. Warsaw: WNT, 2005.[7] Nepelski K. et al., “The analysis of consistency evaluation of the loess in Lublin based on CPT
tests ”, Budownictwo i Architektura, vol. 15, no. 4, (2016), pp. 183–194. https://doi.org/10.24358/Bud-Arch_16_154_18
[8] Frankowski Z. et al., “Geological and geotechnical problems of loess deposits from south-east-ern Poland”, in Proc. of the International Geotechnical Conference “Geotechnical challenges in megacities”, 2010, vol. 2, pp. 546–553.
[9] Sanglerat G., The penetrometer and soil exploration. Amsterdam: Elsevier, 1972.[10] Ciloglu F. et al., “CPT-based compressibility assessment of soils”, International Symposium on
Cone Penetration Testing, no. 2009, (2014), pp. 629–636.[11] Senneset K. et al., “Strength and deformation parameters from cone penetration tests”, in Proceed-
ings of the 2nd Europen Symposium on Penetration Testing, 1982, pp. 863-870.[12] Kulhawy F. H. and Mayne P. H., “Manual on estimating soil properties for foundation design”,
New York, 1990.[13] Wierzbicki J. and Mańka M., “Constrained and Shear modulus of loess from CPTU i SDMT”,
Inżynieria Morska i Geotechnika, vol. 36, no. 3, (2015), pp. 193–199.[14] Młynarek Z. et al., “Geotechnical parameters of loess soils from CPTU and SDMT”, in International
Conference on the Flat Dilatometer DMT’15, 2015, pp. 481–489.[15] Frankowski Z. and Pietrzykowski P., “Displacement parameters of loesslike soils from southeastern
Poland”, Przegląd Geologiczny, vol. 65, no. 10, (2017), pp. 832–839.[16] Atkinson J. and Sallfors G., “Experimental determination of soil properties”, in Proc. 10th ECSMFE,
vol. 3, no. Florence, 1991, pp. 915-956.[17] Nepelski K., “Numerical modelling of the behaviour of a structure situated on a loess subsoil”,
doctoral thesis, 2019.[18] Pisarczyk S., Gruntoznawstwo inżynierskie. Warsaw: PWN, 2015.[19] Nepelski K. and Rudko M., “Identification of geotechnical parameters of Lublin loess subsoil
based on CPT tests ”, Scientific Review. Engineering and Environmental Sciences, vol. 27, no. 2, (2018), pp. 186–198. https://doi.org/10.22630/PNIKS.2018.27.2.18
[20] Lechowicz Z. and Szymański A., Deformations and stability of embankments on organic soils part I. Research methodology. Warsaw: SGGW, 2002.
[21] Marchetti S., “In situ tests by flat dilatometer”, Journal of the geotechnical engineering division, vol. 105, no. III, (1980), pp. 299–321.
[22] Galas P., “Determination of undrained shear strength based on seismic dilatometer test SDMT ”, doctoral thesis, 2013.
[23] Mayne P. and Martin G., “Commentary on Marchetti flat dilatometer correlations in soils”, ASTM Geotechnical Testing Journal, vol. 21, (1998), pp. 222–239.
[24] Marchetti S., “Some 2015 Updates to the TC16 DMT Report 2001”, in The 3rd International Conference on the Flat Dilatometer, 2015, pp. 43–65.
[25] Marchetti S. et al., “The flat dilatometer test (DMT) in soil investigations”, in International Confer-ence On In situ measurement of Soil Properties, 2001, pp. 95–131.

Interpretation of CPT and SDMT tests for Lublin loess soils exemplified by Cyprysowa research site 71
[26] Lechowicz Z. et al., “Use of SDMT for evaluating geotechnical parameters of organic soils”, in 5 th International Workshop of CPT and DMT in soft clays and organic soils, 2014, pp. 07 – 118.
[27] Rabarijoely S., “Evaluation of shear modulus using dilatometer test (DMT) of Pliocene clays at Stegny research site”, Scientific Review. Engineering and Environmental Sciences, vol. 86, no. 63, (2014), pp. 77–86.
[28] Młynarek Z., “Site investigation and mapping in urban area”, in Proc. XIV European Conference on Soil Mechanics and Geotechnical Engg. vol. 1, 2007.


Budownictwo i Architektura 18(3) 2019, 73-82 DOI: 10.35784/bud-arch.815
Property price dependence from noise level on example of local real estate market
Ewa Dębińska1, Joanna Pałubska2
1Department of Integrated Geodesy and Cartography; Faculty of Mining Surveying and Environmental Engineering; AGH University of Science and Technology in Krakow;
e-mail: [email protected] ORCID: 0000-0002-5152-86282Department of Integrated Geodesy and Cartography; Faculty of Mining Surveying
and Environmental Engineering; AGH University of Science and Technology in Krakow; e-mail: [email protected], ORCID: 0000-0001-8174-4156
Abstract: The research issues discussed concern the impact of the environmental factor on the level of real estate transaction prices. In the face of the dynamically developing road infrastructure but also the increase in the volume of car traffic, it is necessary to take into account the effects of these changes in the area of property appraisal. The noise level as part of the group of price-generating attributes should be taken into account as in many cases, and from the perspective of real estate buyers, it may prove to be the most important factor. The research was carried out on the example of housing properties located at the main communication artery of Krakow.
Keywords: road noise, prices of residential premises, environmental factors
1. IntroductionSocio-economic progress, especially in developed countries [1] is strongly corre-
lated with infrastructure and innovation, where the road infrastructure has a positive impact on development, because effective investment activities in a given area require taking into account the existing and planned transport network. This interdependence, however, does not distinguish between the independent variable [2], because the processes of growth and development may occur with the existence of appropriate infrastructure, but also emerging investments in a given area force the creation of appropriate facilities and devices.
While the necessity of the existence and extension of the road network is an indis-putable issue, the effects of these actions are the source of many consequences that each of us experiences to a greater or lesser extent. These consequences [1] may include: short-ening travel time, reducing transport costs, improving its conditions and safety as well as socio-economic effects such as availability, employment, productivity, social exclusion and the natural environment.
In opposition to many positive aspects of the functioning of communication networks there are unfavourable factors, including environmental ones. The main ones are air pollution associated with the emission of harmful car exhausts and traffic noise, which is currently one of the most important civilization problems. Noise is classified as pollution of the natural envi-

Ewa Dębińska, Joanna Pałubska74
ronment and is defined as [3] sounds from 16 to 16,000 Hz, which are undesirable and harmful [4], caused by human activity in the open air, including noise emitted by means of transport, road, rail, airplane traffic and noise originating from industrial areas. The term “unwanted sound” includes many factors: physiological, health and psychological, the scope of which will depend not only on the volume of noise pollution, but also on its intensity, frequency, duration, variability and time of occurrence during the day. The 19th century [5] doctor Robert Koch already pointed out the danger of this phenomenon, warning that a day will come when man will have to fight a very dangerous enemy of his health – noise – the same way he once fought cholera and plague.
Society in Poland does not yet have a sufficiently high awareness of the scale of threats resulting from the impact of noise on their health and quality of life, as well as state agencies do not take sufficiently effective steps to counteract this phenomenon. The most susceptible to traffic noise are residents of large urban agglomerations, especially those living along the main thoroughfares, which are exposed to sleep, rest and work disturbances, neurosis, hearing impairment or cardiovascular disease risk.
The concept of noise correlates with other factors [6] such as the unpleasant smell of fumes, vibrations or air pollution. If the subject of the analysis is real estate, one should also take into account an unfavourable view or presence of artificial lighting on buildings along the most frequented roads. The tests carried out most often take into account the above elements in the form of one factor - traffic noise.
One of the parameters describing the noise level is the relative sound pressure level expressed in the logarithmic decibel scale (dB). A summary of reactions to exemplary sound levels is depicted in Table 1 [7].
Table 1. An example of a reaction to sound at different frequency levels
dB Rating The source being the sound source Effects140 gunshots, explosions audio trauma130 starting jet120 pain above this threshold110 pneumatic drill100 disco90 truck noise80 busy street, horn interference in work75 very bad70 bad car interior interference in speech65 moderately bad60 moderate window by busy street55 tolerable50 average silent street normal45 good
40 perfect quiet office, tearing a sheet of paper, the sound of waves sleep disturbance
30 library20 whisper a sense of silence10 desert0 hearing threshold

Property price dependence from noise level on example of local real estate market 75
In addition to the above-mentioned effects of traffic noise impact on our health, one should also pay attention to its significant impact on the level of obtained prices when selling residential properties located in large cities. The analysis of real estate considered in terms of a legal, technical object, a commodity which is the subject of market turnover and, above all, the investment objective [8] requires the adoption of an appropriate catalogue of features having the greatest impact on its value. In addition to economic, legal, demographic and political factors that particularly affect real estate, physical and environmental conditions also stand out. They are closely related to the location of the property and its liquidity. The permanence of the property in place means that it is susceptible to the environment, including its adverse influence of sources generating a high level of sound, in the case of a location near a busy road. The noise level associated with a given location of the real estate is more and more often considered as one of the attributes that significantly affects the value of the property and the negotiated transaction price in the event of its sale. In the face of the development of the communication network, but above all the increase in the number of road users, this feature may sometimes be as high as the location of the property.
2. Review of the literatureThere are many studies on the impact of noise on the value and prices of real estate,
including different sources of sound emissions and the adoption of various research methods [9] [10]. Most of this type of publication concerns foreign markets, and the submitted conclusions confirm the need to include this environmental factor in real estate market analysis.
It should be taken into account that the preferences of real estate buyers are very diverse and although the majority value peace and quiet, a large group chooses a flat near a busy and loud road but with better access to social infrastructure. In the case of large cities, such a choice is not always applicable, because the noise level for two units located in the same building but from different sides implies different levels of the incoming traffic noise.
The studies often use the NSDI (noise sensitivity depreciation index) [11], [12] express-ing the percentage decrease in the value of real estate per 1 dB increase in noise, enabling comparison of the results obtained for specific real estate markets. At the same time, it should be noted that only sounds of appropriate frequency are taken into account in the research as a negative environmental factor. One of the tasks is to adopt an appropriate threshold value, beyond which the sound is perceived as unpleasant and undesirable. In the literature on the subject [13] it is indicated that the threshold value is 50 dB - 55 dB [14] during the day, i.e. the level of sounds below which they are ignored by us and do not disturb our work,rest or performing various duties. Above this value, the sound becomes an element that negatively affects our perception of a given place.
Noise in Europe is characterized by an upward trend and the main factors of exposure to noise in the environment are: urbanization, growing demand for motorized transport and ineffective urban planning [15]. The increasing noise is affected by the poor quality of the surface and the lack of bypasses around cities where the roads are not adapted to accept heavy traffic. Both on the basis of Polish and European law, there are legal norms addressing the problem of traffic noise, where in Poland the existing regulations indicate acceptable levels of noise, depending on the type of terrain, sources of noise and time of day. The permissible noise level [16] resulting from road transport for residential areas of multifamily housing is Ldwn = 60dB, where Ldwn is the long-term average sound level A expressed in decibels (dB), determined over all days of the year.

Ewa Dębińska, Joanna Pałubska76
The results of the conducted surveys indicate a drop in property prices by 0.08-2.22% with an average of 0.64% (Bateman et al., 2001), 0.21-0.61% [14], 0.3-0.5% [7] per 1 dB increase in sound. With regard to the average level of decline in property prices in the USA and Canada [10], the NSDI ratio is at 0.4%. In the case of residential premises in Szczecin, the results indicate a decrease of 4% with an increase in the noise level by 5 dB [17]. The type of the analysed market is also significant, where the values of NSDI indices in the case of homes are at the level of 0.54% and residential premises of 0.47% [13]. At the same time [18], the problem of the lack of knowledge by buyers about the unfavourable attributes of a given real estate is pointed out, where sellers intentionally do not inform potential buyers about the nuisance noise associated with a given property, often placing the buyer in their own former position of being deprived of such information. Research conducted in Sweden on a single-family housing area indicates that noise increase by 1 dB level causes a 0.6% drop in the price of real estate. In general, sales prices of this type of real estate are about 30% higher in quiet areas compared to areas exposed to environmental factors, including the effects of the road impact such as accessibility, noise pollution and visual and aesthetic effects. Other studies [7] indicate that real estate prices in areas where noise level exceeds 65 dB are lower by up to 12%, yet noise in the range of 41 to 65 dB has no significant impact on prices, while quiet areas (below 40 dB) are characterized by a price premium of 6%.
3. Subject of studyThe scope of the research covered separate apartments located in the centre of Kraków:– along one of the main communication arteries of the city, characterized by very large
car traffic and noise level of 75 dB - Al. Three Tents,– on side roads from Aleja Trzech Wieszczy, with varying degrees of traffic, in areas
with noise levels of 50 to 70 dB.The gathered database includes transactions executed from the beginning of 2017 in
the Krowodrza and Śródmieście districts, in the registration areas directly adjacent to Aleja Trzech Wieszczy, which also constitutes a border between the two described districts. The set created includes information about 200 residential premises, under the influence of noise at various levels of frequency (Table 2).
Table 2. Table for the number of residential premises in individual noise classes
Noise level Krowodrza Śródmieście50-55 8 1355-60 17 2160-65 13 3965-70 14 2770-75 11 13
The acquired real estate is located in an area with a radius of about 1 km and should be considered in the first place in terms of the attractiveness of its location. In addition to the factor which is the location, the premises vary in the level of technical condition, the size of the usable area, the location on the floor and the noise level. Data analysis indicates a signif-icant share of the technical condition of the building and the standard of the premises on the level of transaction prices, amounting to approximately 35%. Most premises are located in tenement houses of medium technical condition, which is why the selection was made first,

Property price dependence from noise level on example of local real estate market 77
eliminating cases concerning real estate located in buildings after general renovations and in buildings with poor technical condition. There is no possibility of a reliable assessment of the standard of the flat, apart from the little data contained in the notarial deeds, hence one criterion has been adopted which is the technical condition of the building. At a later stage, premises located in close proximity to Aleja Trzech Wieszczy were separated from the base, so that the location criterion did not have a significant impact on the volatility of transaction prices. There was no significant share of the attribute which is the location on the story.
4. Analysis of the significance of noise impact on the prices of residential properties
The aim of the conducted research is to analyse the prices of separate apartments in terms of the impact of the environmental factor which is road noise. Property identification data and sales prices used in the analysis come exclusively from purchase contracts - sale of real estate. The property price and value register was not used, due to the incomplete range of information about the premises.
The work also uses the acoustic map of Krakow, which is one of the instruments for managing the acoustic climate. The distribution of noise level in the analysed area - the Ldwn indicator (day - evening - night) is presented in the form of Fig.1.
Fig. 1. The map of noise in the analysed area
The data collected concern dwellings located on the eastern and western side of Aleja Trzech Wieszczy, in the area including the cadastral districts of Krowodrza and Śródmieście, located closest to the main road route of the city with a noise level exceeding 75 dB during the day.
First of all, the entire base of residential premises, characterized by such attributes as:– location - for which the scale was assigned in terms of distance from the Main Market
Square in Kraków and perception of the attractiveness of the location of potential buyers in a given place,
– noise level - determined based on data from the acoustic map of Krakow,

Ewa Dębińska, Joanna Pałubska78
– usable floor space, – technical condition of the building - determined based on data from notarial deeds and
information obtained in the field.Considering that the technical condition differentiates transaction prices at the level of
about 35%, first the selection of premises was made, leaving in the database those that are located in tenement houses of medium technical condition. Such a choice results from a much smaller number of buildings in poor and very poor technical condition as well as tenement houses that are renovated.
In this way, a collection of 76 premises was obtained, for which a histogram of unit transaction prices was presented below (Fig. 2).
Fig. 2. Histogram of unit proces of residential premises
The basic characteristics of the dependent variable, i.e. the unit price in individual classes of noise level read from the acoustic map, are as follows:
Table 3. Table of number of residential premises in each noise classes
Noise compartment Number of observation Average unit price[zł/m2]
Standard deviation of the unit price[zł/m2]
50-55 6 7694,876 1309,96255-60 10 8068,003 2587,98160-65 25 8296,768 1665,20665-70 21 7820,171 2536,70470-75 14 7652,479 2191,174
Histogram: Cena jednostkowaK-S d=,05324, p> .20; Lilliefors p> .20
Oczekiwana normalna
0 2000 4000 6000 8000 10000 12000 14000
Cena jednostkowa [zł/m2]
0
5
10
15
20
25
30
35
Licz
ba o
bser
wac
ji

Property price dependence from noise level on example of local real estate market 79
Considering the large price differentiation, which results from the impact of not only the noise level, but also other attributes of the property, in the next stage, properties were selected that are similar in terms of location and usable space. In this way, a database of 26 properties exposed to noise at a level of 55 to 75 dB was obtained. The significance of the noise impact on the unit price of residential premises was examined using a one-way analysis of ANOVA, where the grouping factors are 4 noise intervals.
The significance of differences between expected unit price values from individual noise groups is tested by comparing variance. The calculations indicate significant differences in average real estate prices caused by the impact of road traffic noise and the basis for rejecting the hypothesis about the equality of means at the level equal to p = 0.0121, with the assumed level of significance p = 0.05. It illustrates in a clear graphical illustration of the results of the analysis of variance.
Fig. 3. Box chart for average procesprices in each proceprice classes
5. ConclusionPerformed real estate market analyses or estimation activities include the stage of testing
the significance of individual market attributes in explaining price volatility. It is a complicated task, which results from the basic features of real estate, including its complexity and diversity. In Poland, too little attention is paid to the importance of environmental factors in real estate valuations, and a small percentage of the appraisal reports prepared includes such analyses.
The aim of the conducted research was to check whether the noise level significantly influ-ences the obtained prices when selling residential premises. Separation of a group of premises comparable in terms of location, technical condition and usable area enabled to check the signif-icance of differences in average unit prices of properties depending on the noise levels adopted.
Hałas; Oczekiwane średnie brzegoweBieżący efekt: F(3, 22)=4,5926, p=,01213
Dekompozycja efektywnych hipotezPionowe słupki oznaczają 0,95 przedziały ufności
55-60 60-65 65-70 70-75
Poziom hałasu [dB]
4000
5000
6000
7000
8000
9000
10000
11000
12000
Cen
a je
dnos
tkow
a [
zł/m
2 ]

Ewa Dębińska, Joanna Pałubska80
The results obtained using the one-way analysis of ANOVA variance indicate signifi-cant differences in the level of average real estate prices, depending on which group of noise levels they belong to. As a result, in relation to the local real estate market being researched, noise is a market feature that should be taken into account in research or in the preparation of appraisal reports, along with other most frequently considered market features of real estate.
AcknowledgementsThis work was carried out within the statutory studies of the AGH University of Science
and Technology, Faculty of Mining Surveying and Environmental Engineering, Department of Integrated Geodesy and Cartography
6. References[1] Wacek, P., ”Modeling the relationship between transport infrastructure and innovation in the context
of economic development”, Issues of science studies, no. 3 (2013), pp. 187-209.[2] Ratajczak, M., ”Infrastructure and economic growth and development”, Journal of Law, Economics
and Sociology, 3rd ed., Vol. 4 (2000) pp. 83-102.[3] Ustawa z dnia 27 kwietnia 2001 r. Prawo ochrony środowiska, Warszawa, Poland, Dz.U. 2017,
no. 519.[4] Directive no. 2002/49/EC of 25 June 2002 of the European Parliament and of the Council relat-
ing to the assessment and management of environmental noise, Official Journal of the European Communities.
[5] Leśnikowska – Matusiak I., & Wnuk, A., “Impact of traffic noise on the state of human acoustic envi-ronment”, Car Transport: scientific quarterly of the Motor Transport Institute, vol.3, 2014, pp. 37-63.
[6] Bateman, I. J., Day, B.H., Lake, I., Lovett, A.,”The effect of road traffic on residential property values: a literature review and hedonic pricing study”, Report for Scottish Executive, University of East Anglia, Economic & Social Research Council, 2001.
[7] Theebe, M. A. J., “Planes, trains and automobiles. The impact of traffic noise on house prices”, Car Transport: scientific quarterly of the Motor Transport Institute, vol.3, 2002, pp. 37-63.
[8] Kucharska - Stasiak, E., Real estate in a market economy. Warszawa: Wydawnictwo Naukowe PWN, 2006
[9] Szopińska, K. and Krajewska, M., “Methods of Assessing Noise Nuisance of Real Estate Surroundings”, Real Estate Management and Valuation, vol. 24, no. 1, 2016, pp. 19-30. https://doi.org/10.1515/remav-2016-0002.
[10] Nelson, J. P., “Hedonic Property Value Studies of Transportation Noise: aircraft and road traffic” in Hedonic Methods in Housing Markets. Pricing Environmental Amenities and Segregation, (ed. Baranzini A. et al.), Springer, 2008, pp. 57-82.
[11] Cellmer, R. and Źróbek, S., “Applying GIS tools to studies over the impact of noise pollution on house prices”, in The Future with GIS, Hrvatski Informatički Zbor – GIS Forum, Zagreb, 2011, pp. 245-256. https://doi.org/10.13140/RG.2.1.4887.0884
[12] Nelson, J. P., “Highway noise and property values. A survey of recent evidence”, Journal of Transport Economics and Policy, vol. 16 (2), 1982, pp. 117-138.
[13] Rich, J. and Nielsen, O., “Assesment of Traffic Noise Impacts”, International Journal of Envi-ronmental Studies, Vol. 61, (2004).
[14] Bateman, I. J., Day, B.H. and Lake, I., “The valuation of transport – related noise in Birmingham”, Technical Report to the DfT, Centre for social and economic research on the global environment and Centre of environmental risk, School of environmental Sciences, University of East Anglia, UK, 2004.

Property price dependence from noise level on example of local real estate market 81
[15] Thematic studies. Noise hazard. Selected Issues. Warszawa, Poland, Chancellery of the Senate. Analysis and Documentation Office, 2012.
[16] Rozporządzenie Ministra Środowiska z dnia 14 czerwca 2007 r. w sprawie dopuszczalnych pozi-omów hałasu w środowisku, Dz.U. 2014 no. 112.
[17] Gnat, S. and Bas, M., “Badanie wpływu imisji hałasu komunikacyjnego na ceny lokali mieszkalnych” in Scientific Monograph Market analysis and property management. Towarzystwo Naukowe Nieruch-omości, 2014, pp. 73-86.
[18] Wilhelmsson, M. “The impact of traffic noise on the values of the single-family houses”, Journal of Environmental Planning and Management, vol. 43, 2000, pp. 799-815.


Budownictwo i Architektura 18(3) 2019, 83-92 DOI: 10.35784/bud-arch.902
New urban spaces – their heritage and creation
Dariusz Gaweł
Department of Contemporary Architecture, Faculty of Civil Engineering and Architecture, Lublin University of Technology, email: [email protected], ORCID: 0000-0001-5759-1962
Abstract: The paper presents the subject of creating and shaping new urban spaces in the era of globalisation. The analysis of these spatial phenomena covers the biggest cities in the world, i.e. places where the problems of urban development occurs most often. The term ‘urban space’ is understood as a broad concept that goes beyond the defined public space. New places created in the cities are the human creations resulting from the life necessities and the cultural needs of people. The fast-changing living environment forces users to engage in the process of searching (sometimes even creating) of new, adequate places. Spatial activities transforming the urban environment more and more often reflect the local social initiatives’ activity. New relations between a user and the surrounding space are the basis for reviewing the existing division and definition of private, group and public space.
Keywords: new urban space, city, heritage, creation (creating)
1. IntroductionNowadays we are witnessing the dominance of metropolises and big cities. It is confirmed
by the high urbanisation rate, which according to reports is likely to reach 63% in 2025 [1]. This paper is an attempt to define the place of a man in urban space affected by fast processes of transformation.
Rapid technical progress and the digitalisation of all processes are clearly starting to appear in the daily activities of the people. Basic life activities and work nowadays in the conditions of fast pace of life acquire other meanings. We spend less time in open spaces; we work more. Distances between the house and the place of work, study or leisure are ever increasing. This results in the need for frequent and fast movement from one place to another, mainly with the use of cars.
We are also looking for new, very individual and sophisticated forms of recreation in our neighbourhood. We are paying more and more for it. Our reward is health, free time, family and, in the end, money. The organisation of the basic living environment is becoming increasingly complicated [2]. In search for suitable solutions, we decide to move to a house with a garden on the outskirts of a city.
The current population of the suburbs of metropolises is much larger than that of the centres themselves. A city is becoming more scattered losing its naturally defined structure. Traditional divisions of space into private, semi-private (group) and public seem to be insuf-ficient in these conditions to define the phenomena taking place in the relations between a contemporary city and a human being. We are increasingly emphasising the importance of space in relation to its use and development, with a view to the future generations [3].

Dariusz Gaweł84
The challenges that modern society faces entitle us to perform courageous, yet precise actions in difficult times of globalisation.
2. Preserved and forgotten heritageUntil now we were persuaded that shaping of urban space was based on the principles
of its organisation. They consisted in mechanisms of ordering forms, such as: differentiation, hierarchy, concentration, orientation or rhythm of its elements.
Today, we increasingly focus on the form itself. We usually concentrate on its distinc-tiveness and individual features, such as the shape, colour or texture. Observing the accumu-lation of numerous, sometimes very numerous elements leading to chaos, we begin to less and less understand space through its reference points. This is probably due to the excessive density of objects, especially in the inner city. Buildings covered with billboards, free-standing advertisements that encourage people to shop, and light that emphasises the meaning of the message make us feel lost and confused. Commercial space is pushing its way into the vicinity of monumental buildings, office buildings, schools and even churches1 [4].
However, the more modern objects are built, the more often we see the value of historical buildings created in a traditional, natural way with reliable means of composition expression.
What indirectly organises the features of a place is a clearly assigned function of the objects, the scale of the development and attention to detail. The unique significance of a place in space is determined by its special features. A place is an organised world of meanings [5]. Legible architecture, often created in a densely built space, is based on a thoughtful location, composition order that is created with other buildings, and carefully selected urban detail.
Fig. 1.2. The hutongs in Pekin.The unique atmosphere of an authentic, historic residential area. (Source: Photo author 2013)
Many urban areas have resisted the time constraints despite the modest scale of development and neighbourhood conditions. Their uniqueness lies in the authenticity of their expression, the harmony they create with their surroundings and the respect for the local traditions and people living in the area. This phenomenon can be seen in the centres of Asian cities such as Beijing,
1 „The urban structure of the Polish market over the last 25 years under the free influence of new commercial functions has undergone many deformations. Attractive functions located inside city malls and shopping centres contribute to the degradation of the external, surrounding streets. Shopping centres scattered throughout the city, isolated from the pedestrian network by car parks, deepen the internal peripheries”.

New urban spaces – their heritage and creation 85
Nanjing or Bangkok. Old residential colonies located in the vicinity of central historical city squares began to transform into public areas, creating friendly micro-commercial, gastronomic and meeting places. These are primarily Chinese hutongs, which have been the historical living environment for people for centuries [6]. A similar district in the immediate vicinity of the water channels is Pom Mahakan in Bangkok. Here, low wooden residential buildings were built on stilts, creating water housing for a complex of palace and temple buildings.
The transformations of these areas were not originally the decision of the authorities, because as one may expect, the economic attractiveness of the location spoke in favour of using them for other purposes. The determination of local social communities made it possible to maintain and equip forgotten districts with essential technical infrastructure. The statement that places are defined by people who make up the local community is hereby confirmed. Unique persons and magical places have a special role to play [7]. Today, these culturally magical central districts reflect the former life of the inhabitants, thus being a popular tourist destination. The blurred borders between public and semi-private spaces within a residential area are becoming more and more common.
The particular urban spaces known as “non-places”2 give completely different impression (fr. non-lieu) characterised by a lack of changeability, where we stay out of necessity and not of our own free will, and with a large flow of people [8]. These are usually airports, shopping malls, gas stations, but also refugee camps. These spaces are in no way emotionally speaking to their users, but become only a means to achieve a goal by them.
When analysing modern cities, we come to the conclusion that such places are becoming increasingly similar due to the standard of construction and applied elements of equipment. We are not able to recall their individual characteristics, hence the term as if they belonged to nobody [9].
Fig. 3. Not a place of memory in Kigali, after the genocide in Rwanda. (Source: Photo author 2012)
Fig. 4. Not a place of memory, zone of the Korean borderland, commemoration of people deprived of their homeland. (Source: Photo author 2017)
There is another crucial area connected with this term, namely the term “non-place of memory” (fr. non-lieu de memoire). The emerging areas that were tainted with violence, crime and genocide could certainly become historical memorial sites with monuments or other forms
2 ,, Non – place’’ – a term created by the French ethnologist, culture anthropologist, Marc Auge, described in [11] who noted that there are areas that are not personalised, that are quickly passable without attention, that are devoid of any features’’.
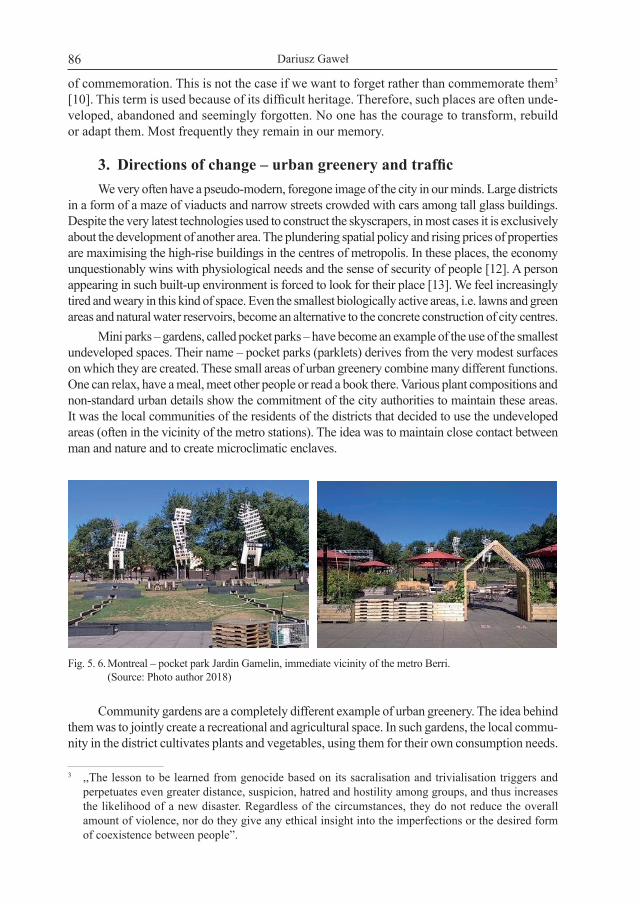
Dariusz Gaweł86
of commemoration. This is not the case if we want to forget rather than commemorate them3 [10]. This term is used because of its difficult heritage. Therefore, such places are often unde-veloped, abandoned and seemingly forgotten. No one has the courage to transform, rebuild or adapt them. Most frequently they remain in our memory.
3. Directions of change – urban greenery and trafficWe very often have a pseudo-modern, foregone image of the city in our minds. Large districts
in a form of a maze of viaducts and narrow streets crowded with cars among tall glass buildings. Despite the very latest technologies used to construct the skyscrapers, in most cases it is exclusively about the development of another area. The plundering spatial policy and rising prices of properties are maximising the high-rise buildings in the centres of metropolis. In these places, the economy unquestionably wins with physiological needs and the sense of security of people [12]. A person appearing in such built-up environment is forced to look for their place [13]. We feel increasingly tired and weary in this kind of space. Even the smallest biologically active areas, i.e. lawns and green areas and natural water reservoirs, become an alternative to the concrete construction of city centres.
Mini parks – gardens, called pocket parks – have become an example of the use of the smallest undeveloped spaces. Their name – pocket parks (parklets) derives from the very modest surfaces on which they are created. These small areas of urban greenery combine many different functions. One can relax, have a meal, meet other people or read a book there. Various plant compositions and non-standard urban details show the commitment of the city authorities to maintain these areas. It was the local communities of the residents of the districts that decided to use the undeveloped areas (often in the vicinity of the metro stations). The idea was to maintain close contact between man and nature and to create microclimatic enclaves.
Fig. 5. 6. Montreal – pocket park Jardin Gamelin, immediate vicinity of the metro Berri. (Source: Photo author 2018)
Community gardens are a completely different example of urban greenery. The idea behind them was to jointly create a recreational and agricultural space. In such gardens, the local commu-nity in the district cultivates plants and vegetables, using them for their own consumption needs.
3 ,,The lesson to be learned from genocide based on its sacralisation and trivialisation triggers and perpetuates even greater distance, suspicion, hatred and hostility among groups, and thus increases the likelihood of a new disaster. Regardless of the circumstances, they do not reduce the overall amount of violence, nor do they give any ethical insight into the imperfections or the desired form of coexistence between people”.

New urban spaces – their heritage and creation 87
Initially, they were created in Havana and other Cuban cities. They were to supply the inhabitants with the vegetables that were missing in the shops. Unattractive greenery composed of single trees was used for this purpose. With time, community gardens became accepted in other North American countries, as an alternative to the existing forms of urban greenery. Their additional value is not only joint ownership, but also cooperative cultivation of these areas. Currently, they are most often created in the vicinity of buildings in residential districts, the peripheral zone of big cities, in areas where multi-family block of flats are concentrated.
When observing the directions of changes in the modern urban space, we can conclude that there is a great demand for areas of multifunctional character and diverse use. The problem of many cities is space for public transport. It concerns finding space for both car traffic in the city centre and organised parking spaces. One solution to this turbulent situation is to blur the boundary between pedestrian traffic on the pavement and car traffic on the road. Multifunctio-nal urban spaces, called “woonerfs”, are to combine traffic with parking spaces and a leisure area on the promenade diversified by urban detail. They are usually located in the vicinity of the main city centre structures, where there is not enough space for traffic segregation. The characteristic of this space cannot overestimate the important role of the urban detail, which should be developed in order to eliminate the possibility of transit traffic.
Many examples of new spatial phenomena described in this paper should also be assessed on the basis of the social activity of the residents resulting from the care for the transforming urban districts. However, for people to feel a sense of community in action, borders, barriers and fences separating different forms, functions and properties should collapse [14].
4. Street art4 and aestheticisation of placesCreative zones increase the value of space in cities. Influencing the users of public
space is done in many ways. Designating places for art in multiple neighbourhoods provides additional educational value and diversifies their functionality. Until now, for many people, space for art has been associated with a tall, flat gable wall of a building, and this is not just about street art in the form of colourful murals. In fact, the transformation of cities took place along with the search for new ideas for post-industrial centres. After the shutdown of large production halls, people started to think about their future use. At the same time, the potential of revitalisation activities to restore old, often historic buildings from the turn of the 19th and 20th century has been noticed. Exhibition complexes, galleries, cinemas and shopping centres were perfectly suited for this type of cubature [15]. However, all these buildings had to be heated, equipped, and people encouraged to visit them (for a fee).
4 ,,Street Art – a field of art created in a public place, usually “on the street” in the form of illegal intervention. The term includes traditional graffiti, but is often used to distinguish between artistic activity in urban space and vandalism” [16].

Dariusz Gaweł88
Fig. 7. 8. Montreal – street gallery at Rue Catherine (Rue Panet), in the Le Village district. (Source: Photo author 2018)
Nowadays, street galleries have been an increasingly appreciated idea. Such facilities started to be more often created in Canada, the United States or Europe. Street micro-spaces and squares have started to be perceived as a perfect place to present art in the form of sculp-tures, paintings and various compositional forms. The element that distinguishes these objects in the public space is most often their vivid, bold colour scheme. A measurable effect of the opening of the district to the community of residents and tourists was a decrease in the number of graffiti on the facades of nearby buildings.
Building the interior of urban street galleries consisted in finding a suitable formula for the presentation of works of considerable size. Street galleries turned out to be such a good idea that groups of quasi-artists began to paint the fences separating the newly built structures within the district in a thoughtful and organised way.
5. A new perspective or the consolidation of legal divisions?The hitherto divisions defining the public space took into account its two basic forms: [17]:– traffic route – in the form of a street (often expanded with commercial functions),– city square – as a place of inhabitants’ assembly (expanded with various complemen-
tary functions),Other sources supplement this division with all kinds of urban green areas, such as parks,
cemeteries and lawns. Concern for the future and the need to ensure access to them raises the question of the legal framework that regulates the functioning of such areas within cities.
In Poland, the notion of public space was used to refer to the common space belonging to the inhabitants. Its organisation and management is the responsibility of the central and local governments. The special significance of public space is guaranteed by the Spatial Planning and Land Development Act. With the increasing competence of local governments, the space started to be treated as a common good of a special importance5.
The term appearing in the United States – privately owned public space (POPS), or according to other sources – privately owned public open spaces (POPOS), are used to define a public space accessible to all, but privately owned [18]. Such areas must be made available to all users, as regulated by the provisions in the US Land Use Regulation. Places of common
5 “the area of public space” should be understood as an area of particular importance for satisfying the needs of inhabitants, improving their quality of life and fostering social contacts due to its location and functional and spatial features defined in the study of conditions and directions of spatial development of the commune” [20].

New urban spaces – their heritage and creation 89
character created from private funds usually include squares, arcades, terraces or patios. They are mainly connected with private buildings constructed by developers.
6. SummaryIn the light of the ongoing discussion about the quality of public space, we recognize it
as generally accessible area, which favours human contacts and fulfils their aspirations. Care for the appropriate standard of such areas in the urban structure should be the main goal of the next generations as the protection of the common good [19].
1. The presented cases of creating urban space often result from different mental charac-teristics of Western (Europe and North America) and Eastern societies (Asia). The perception of public space by these societies is completely different. In Europe, public space is most often associated with monuments, transport and recreational greenery, while in Asia it is place where you can sell, eat or live.
2. The new quality of the social initiative in the transformation of districts should become an important element of citizens’ participation in planning processes. Top-down management should be replaced by bottom-up cooperation.
3. Rapid urbanisation leads to the concreting of cities. In search for improvement of this condition, the architectural structures are built that highlight the values of the place and its social and cultural characteristics. Such architecture has a chance to resist the times constraints.
4. Places for the presentation of street art are often created in order to integrate residents into society, allow them to communicate their problems and environmental needs. At the same time, they encourage to take care of the aesthetics of the neighbourhoods.
5. The diversity of created urban spaces shows the fulfilment of very narrow and sublime needs of the inhabitants in the conditions of universal globalisation of cities. They are a complement to the traditional division of space.
6. In the future, consideration should be given to extending the classification of space in order to take into account the current living conditions of the inhabitants. It is particularly important to take into account the conditions of heritage, tradition, culture and art, otherwise they will take the form of “non place”.
Table 1. New urban spaces – systematics of research examples. (Source: author)
Place Location Function Examples
1 Historic residentialdistrict
urban & historicalareas tourist and leisure Hutongs – Pekin
Pom Mahakam-Bangkok
2 Non-place urban and suburban areas
accidental large groupings of peopleconnected with buildings
airports, shopping malls,gas stations,refugee camps
3 Non-place of memorydifferent places tainted with violence, crime and genocide
forgotten places of negative events
the Korean borderplace of genocide in Rwanda or Cambodia
4 Pocket park mini park (parkette)
urban and suburban areas
urban greeneryrecreation and leisure(max areas 5000 m²)
Jardins Gamelinin Montreal

Dariusz Gaweł90
Place Location Function Examples
5 Social garden community garden
urban and suburban areas
areas of greenand vegetable crops
Warszawa, London,Montreal, Kraków
6 Woonerf downtownurban areas
pedestrian and trafficzone, recreation
Łódz, Warszawa, GliwiceGdynia
7 Street gallery service and residential areas
exhibition groundsstreet art.
street gallery Le Villagein Montreal
8POPSPrivately Owned Public Space
spaces connectedwith buildings recreation zone squares, arcades, terraces
or patios
References[1] Węcławowicz G., Geografia społeczna miast. PWN. Warszawa 2003, p. 61.[2] Majer A., Socjologia i przestrzeń miejska. PWN, Warszawa 2010.[3] Gzell S., „Miasto jako wytwór „kultur gustu””, Kwartalnik Architektury i Urbanistyki, vol. 3,
2013, p.119.[4] Racoń-Leja K. „Formy przestrzeni komercyjnej w krajobrazie polskich miast”, Teka Komisji
Urbanistyki i Architektury Oddziału PAN w Krakowie, vol. 42, 2014, p.151.[5] Chmielewski J. M., Teoria urbanistyki w projektowaniu i planowaniu miast. Oficyna Wydawnicza
Politechniki Warszawskiej, Warszawa 2001, p. 22.[6] Lotysz S. Matkowska E., Hutongi trzymają się mocno? Problemy autentyczności w architekturze
współczesnych Chin. Biblioteka Cyfrowa Politechniki Krakowskiej. Available: https://suw.biblos.pk.edu.pl/mid18827 [Accessed: 20 Nov 2019]
[7] Jałowiecki B., Globalny świat metropolii. Wydawnictwo Naukowe Scholar, Warszawa 2007, p.35.[8] ,,Nie-miejsce”, Wikipedia.org. Available: // https://pl.wikipedia.org/wiki/ [Accessed: 20 Nov 2019][9] Paprzyca K., „Miejsca – nie-miejsca w przestrzeni małych miasteczek”, Przestrzeń i Forma, vol.
23 (2), 2015, pp. 09-18.[10] Bauman Z., Szanse etyki w zglobalizowanym świecie. Wydawnictwo Znak, Kraków 2007, p. 102[11] Augé M., Non-Places: An Introduction to Anthropology of Supermodernity. Verso, London 1992[12] Czarnecki B., Przestrzenne aspekty przestępczości. Rozprawy Naukowe 216, Oficyna Wydawnicza
Politechniki Białostockiej, Białystok 2011.[13] Gaweł D., Szafranek A., „Place publiczne, jako przestrzeń stymulująca potrzeby człowieka”,
Budownictwo i Architektura, vol. 17(3), 2018, pp. 67- 80. https://www.doi.org/10.24358/Bud--Arch_18_173_05
[14] Polèse M., Stren R., The Social Sustainability of Cities: Diversity and the Management of Change. University of Toronto Press, Toronto 2000.
[15] Gaweł D., “Rebirth of postindustrial architecture in polish towns”, Civil and Environmental Engi-neering Reports, 2012, 1 (9), p.31- 39.
[16] ,,Street Art”, Wikipedia.org. Available: https://pl.wikipedia.org/wiki/Street_art [Accessed: 20 Nov 2019].[17] Lorens P., Martyniuk-Pęczek J. (ed.), Problemy kształtowania przestrzeni miejskich. Wydawnictwo
„Urbanista”, Gdańsk 2010. p. 21.[18] ,,POPS”, Wikipedia.org. Available: https://en.wikipedia.org/wiki/Privately_owned_public_space
[Accessed: 20 Nov 2019][19] Doorley S., Witthoft S., Make space: How to set the stage for create collaboration. Wiley Publisher,
New York 2012.[20] Ustawa o planowaniu i zagospodarowaniu przestrzennym z dnia 27 marca 2003r., Dz. U. 2003 Nr
80 poz. 717 z późniejszymi zmianami.

New urban spaces – their heritage and creation 91
Nowe przestrzenie miejskie – ich dziedzictwo i kreacja
Dariusz Gaweł
Katedra Architektury Współczesnej, Wydział Budownictwa i Architektury, Politechnika Lubelska, email: [email protected], ORCID: 0000-0001-5759-1962
Streszczenie: Praca odnosi sie do problematyki tworzenia i kształtowania nowych prze-strzeni miejskich w czasach globalizacji. Dokonana analiza zjawisk przestrzennych obejmuje metropolie światowe, czyli miejsca, gdzie problemy rozwoju miast koncentrują się najbardziej. Termin przestrzeń miejska jest traktowany jako szerokie pojęcie, wykraczające poza ramy zdefiniowanej przestrzeni publicznej. Nowe miejsca tworzone w obrębie miast są wytworem człowieka wynikającym z jego potrzeb życiowych i kulturowych. Zmieniające się w szybkim tempie warunki funkcjonowania środowiska zamieszkania, wymuszają na użytkownikach włączenie się w proces poszukiwania (czasem kreacji), nowych adekwatnych miejsc. Działania przestrzenne przeobrażające środowisko miejskie, coraz częściej są wyrazem aktywności lokal-nych inicjatyw społecznych. Tworzone nowe relacje pomiędzy użytkownikiem a otaczającą go przestrzenią, stanowią podstawę do zrewidowania dotychczasowego podziału i definicji przestrzeni prywatnej, grupowej i publicznej.
Słowa kluczowe: nowa przestrzeń miejska, miasto, dziedzictwo, kreacja (tworzenie)

Related Documents